MATHEMATICAL MODEL OF RCC DAM BREAK, BASTORA RCC DAM AS A CASE STUDY

NON-LINEAR TIME HISTORY ANALYSIS OF LARGE CONCRETE DAM CONSIDERING NEAR FIELD EFFECT
Supervisor: Dr. Hari Ram Parajuli
Presented By: Ravi Sharma Bhandari
1
INSTITUTE OF ENGINEERING PULCHOWK CAMPUS
M. Sc. Structural Engineering Thesis Defense November 12, 2013

PRESENTATION OUTLINE Introduction Research Objective Research Methodology Near-Fault Earthquake Characteristics Ground Motion and Their Characteristics Finite Element Modeling of Gravity Dam Structural Performance and Damage Criteria Linear Time History Analysis Technique Nonlinear Time History Analysis Techniques Conclusion and Recommendation
2
INSTITUTE OF ENGINEERING PULCHOWK CAMPUS

INTRODUCTION Several numbers of large hydropower projects are
planned in Nepal for near future. Proper Analysis of Seismic forces is a matter of concern
before the construction of these dam. Since the Northridge and Kobe earthquakes, there has
been much discussion about the adequacy of design practice of concrete dams. Two significant damage to concrete dam occurred in the
1960s: Hsinfengkiang in China and Koyna in India. The damage was severe enough but no complete
collapse, required major repairs and strengthening. 3
INSTITUTE OF ENGINEERING PULCHOWK CAMPUS

RESEARCH OBJECTIVES Performance Study of concrete gravity dams under near
field earthquake pulse and comparison to the far field earthquake effects. To illustrate the application of linear and nonlinear time
history methods to earthquake response analysis of gravity dams. To assess stability condition of the dam. Locations of occurrence of probable cracks on dam
during Earthquake.
4
INSTITUTE OF ENGINEERING PULCHOWK CAMPUS

RESEARCH METHODOLOGY Data collection and review of literatures Preparation of Finite Element model of dam
(SAP2000 V14) Perform Linear time history analysis of Dam Perform non linear time history analysis of Dam Interpretation of results Evaluation, conclusion and recommendation
5
INSTITUTE OF ENGINEERING PULCHOWK CAMPUS

NEAR-FAULT EARTHQUAKE CHARACTERISTICS
The near-field of an earthquake is the region within which distinct pulse-like particle motion are observed due to a coherent release and propagation of energy from the fault rupture process. The near-field ground motions are characterized by
high peak acceleration (PGA), high peak velocity (PVG), high peak displacement (PGD), pulse-like time history and unique spectral content.
Source of Ground Motion Data: (peer.berkeley.edu/peer_ground_motion_database)
6
INSTITUTE OF ENGINEERING PULCHOWK CAMPUS
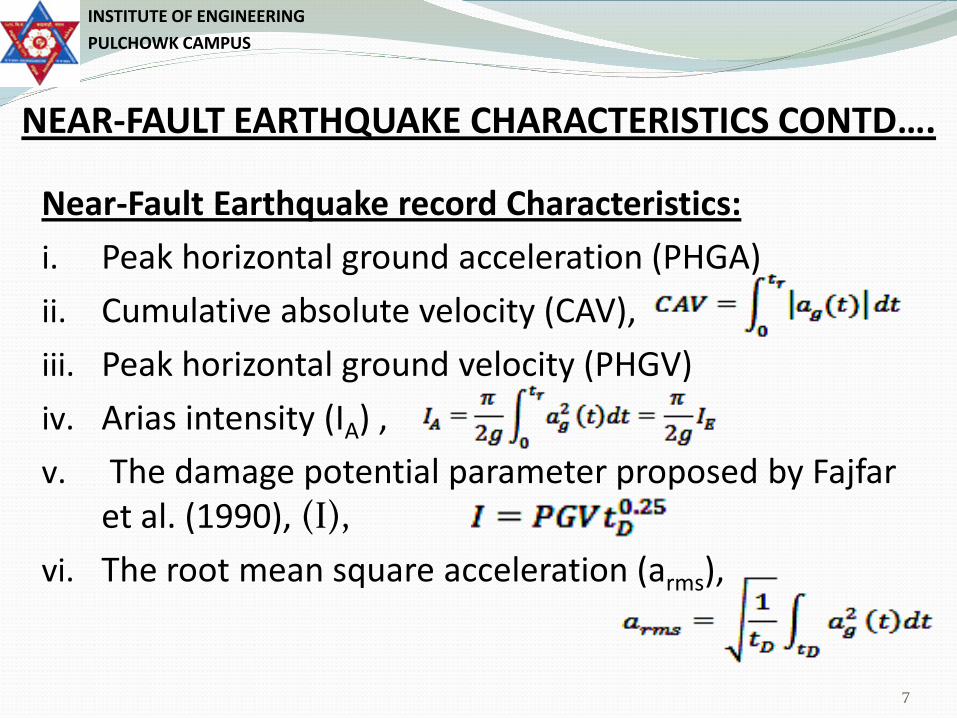
NEAR-FAULT EARTHQUAKE CHARACTERISTICS CONTD….
Near-Fault Earthquake record Characteristics: i. Peak horizontal ground acceleration (PHGA) ii. Cumulative absolute velocity (CAV), iii. Peak horizontal ground velocity (PHGV) iv. Arias intensity (IA) , v. The damage potential parameter proposed by Fajfar
et al. (1990), (I), vi. The root mean square acceleration (arms),
7
INSTITUTE OF ENGINEERING PULCHOWK CAMPUS

NEAR-FAULT EARTHQUAKE CHARACTERISTICS CONTD… Table :Ground motion parameters, measured characteristics and lower-bound values
Source: The 14th World Conference on Earthquake Engineering, October 12-17, 2008, Beijing, China “Identification of Near-Fault Earthquake Record Characteristics” Ch.A. Maniatakis, I.M. Taflampas and C.C. Spyrakos 8
INSTITUTE OF ENGINEERING PULCHOWK CAMPUS

NEAR-FAULT EARTHQUAKE CHARACTERISTICS CONTD… SN NGA# Event Year Station Mag. Mechanism
Epc. Dist. (km)
Low. freq (Hz)
1 181 Imperial Valley-06 1979 El Centro Array #6 6.53 Strike-Slip 0 0.12
2 182 Imperial Valley-06 1979 El Centro Array #7 6.53 Strike-Slip 0.6 0.12
3 779 Loma Prieta 1989 LGPC 6.93 Reverse-Oblique 0 0.12
4 821 Erzican- Turkey 1992 Erzincan 6.69 Strike-Slip 0 0.12
5 825 Cape Mendocino 1992 Cape Mendocino 7.01 Reverse 0 0.07
6 828 Cape Mendocino 1992 Petrolia 7.01 Reverse 0 0.07
7 879 Landers 1992 Lucerne 7.28 Strike-Slip 2.2 0.1
8 1044 Northridge-01 1994 Newhall - Fire Sta 6.69 Reverse 3.2 0.12
9 1063 Northridge-01 1994 Rinaldi Receiving Sta 6.69 Reverse 0 0.11
10 1084 Northridge-01 1994 Sylmar - Converter Sta 6.69 Reverse 0 0.41
11 1085 Northridge-01 1994 Sylmar - Converter Sta East 6.69 Reverse 0 0.41
12 1086 Northridge-01 1994 Sylmar - Olive View Med FF 6.69 Reverse 1.7 0.12
13 1106 Kobe- Japan 1995 KJMA 6.9 Strike-Slip 0.9 0.06
14 1119 Kobe- Japan 1995 Takarazuka 6.9 Strike-Slip 0 0.36
15 1120 Kobe- Japan 1995 Takatori 6.9 Strike-Slip 1.5 0.36 9
INSTITUTE OF ENGINEERING PULCHOWK CAMPUS

GROUND MOTION AND THEIR CHARACTERISTICS
15 Near Field and 5 Far Field Ground Motions data are selected for this study. Ground Motion Data recorded within about 10 m from
the fault is assumed as near-field data. Ground Motion Characteristics: 1. Amplitude 2. Frequency Content 3. Duration of Motion These Characteristics differ dramatically between near-
field and Far-field ground Motions.
Selection of Ground Motion:
10
INSTITUTE OF ENGINEERING PULCHOWK CAMPUS

GROUND MOTION AND THEIR CHARACTERISTICS CONTD.
Fault Normal acceleration time history
Fault normal velocity time history
Fault Normal Fourier amplitude Spectrum
Fault Parallel acceleration time history
Fault parallel velocity time history
Fault parallel Fourier amplitude Spectrum
PGA = 0.44 g PGA = 0.40 g
Near-Field Ground Motion Time History: Imperial Valley-06
Pulse Like Ground Motion
11
INSTITUTE OF ENGINEERING PULCHOWK CAMPUS

FINITE ELEMENT MODELING OF GRAVITY DAM
Figure : Standard Finite Element Model of Gravity Dam
Properties of Concrete: Young’s Modulus = 22360 N/mm2 Poisson's Ration = 0.19 Density = 2400 kg/m3 Number of Elements = 9900 Height = 140 m Base = 150 m Concrete Grade: M20
Properties of Foundation Rock: Rock Type: Dolomite Young’s Modulus = 38000 N/mm2 Poisson's Ration = 0.15 Density = Massless for modeling purpose Number of Elements = 7500 Size: 450 m X 150 m
12
INSTITUTE OF ENGINEERING PULCHOWK CAMPUS

FINITE ELEMENT MODELING OF GRAVITY DAM CONTD… Equation Of Motion:
Forces acting on the Dam: Self Weight of Dam Hydrostatic Force Uplift Force Hydro-Dynamic Force Horizontal and Vertical Ground Motions Hydro-Dynamic Force: Westergaard Added Mass
Model
13
INSTITUTE OF ENGINEERING PULCHOWK CAMPUS

STRUCTURAL PERFORMANCE AND DAMAGE CRITERIA
1. Demand-Capacity Ratio: of plain concrete is defined as the ratio of computed tensile stress to tensile strength of the concrete.
Tensile Strength of Concrete: Dynamic Tensile Strength of Concrete = Where, fc’ is the compressive strength of concrete in psi.
14
INSTITUTE OF ENGINEERING PULCHOWK CAMPUS

Structural Performance and Damage Criteria Contd..
Figure : Basis for upper limit demand-capacity ratio and cumulative inelastic duration
STRUCTURAL PERFORMANCE AND DAMAGE CRITERIA
15
INSTITUTE OF ENGINEERING PULCHOWK CAMPUS

STRUCTURAL PERFORMANCE AND DAMAGE CRITERIA CONTD. 2. Cumulative Inelastic Duration
3. Extent of Damage or Nonlinear Behavior
Load Combinations:
Case Seismic Loads Static Loads
(Stress) Vertical (V) Horizontal (H)
1 + + + 2 + - + 3 - + + 4 - - + 16
INSTITUTE OF ENGINEERING PULCHOWK CAMPUS
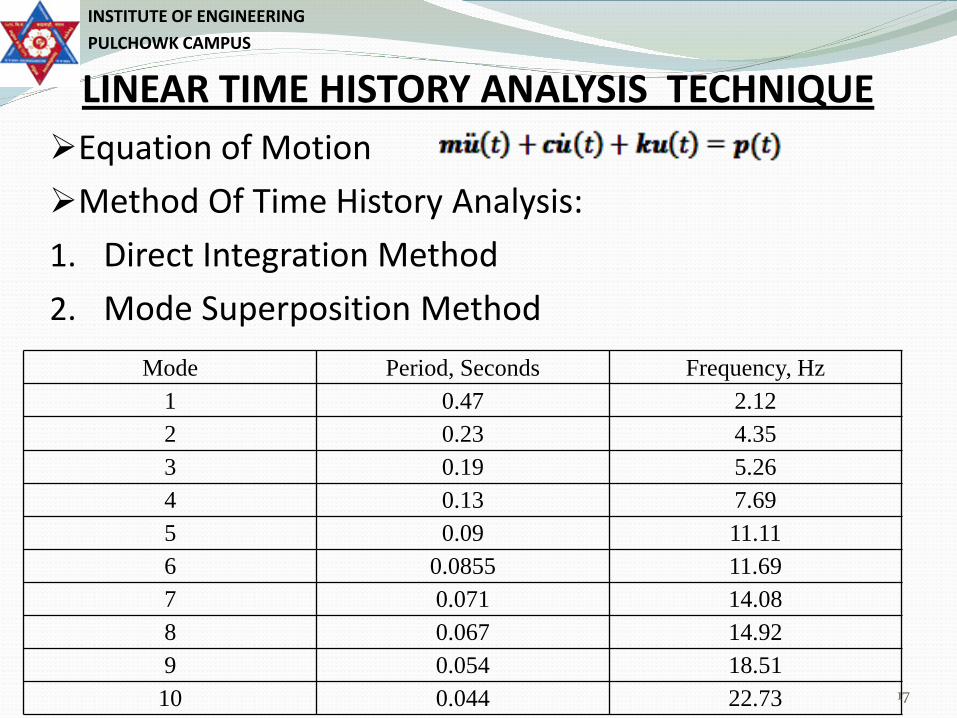
LINEAR TIME HISTORY ANALYSIS TECHNIQUE Equation of Motion Method Of Time History Analysis: 1. Direct Integration Method 2. Mode Superposition Method
Mode Period, Seconds Frequency, Hz 1 0.47 2.12 2 0.23 4.35 3 0.19 5.26 4 0.13 7.69 5 0.09 11.11 6 0.0855 11.69 7 0.071 14.08 8 0.067 14.92 9 0.054 18.51
10 0.044 22.73 17
INSTITUTE OF ENGINEERING PULCHOWK CAMPUS

LINEAR TIME HISTORY ANALYSIS TECHNIQUE COND…
Figure: Horizontal Stress Contours
Load Case: V + H (FN) + Static Load
Figure: Vertical Stress Contours
Load Case: V + H (FP) + Static Load
Load Case: V + H (FN) + Static Load
Figure: Horizontal Stress Contours Figure: Vertical Stress Contours
Near-Fault Response (Proposed Section) Far-Fault Response (Modified Section)
Load Case: V + H (FP) + Static Load
S11,heel = 13.2 MPa S22,heel = 7.4 MPa
S11,heel = 11.37 MPa S22,heel = 6.35 MPa
18
INSTITUTE OF ENGINEERING PULCHOWK CAMPUS

LINEAR TIME HISTORY ANALYSIS TECHNIQUE COND… Effect of Upstream profile change: By changing sharp change of u/s profile to smooth
curved profile, stress at u/s face reduced drastically and stress concentration problem is reduced.
Fig. Modified Section
19
INSTITUTE OF ENGINEERING PULCHOWK CAMPUS

LINEAR TIME HISTORY ANALYSIS TECHNIQUE COND…
-2
0
2
4
6
8
0 5 10 15 20 25 30 35
Prin
cipa
l Str
ess,
N/m
m2
Time, Seconds
Stress 2.4 MPa 4.8 MPa
Figure: Time history of major principal stress at the heel of dam for Imperial Valley-06 (Recording station: El Centro Array #6) Earthquake (FN + V)
20
INSTITUTE OF ENGINEERING PULCHOWK CAMPUS

LINEAR TIME HISTORY ANALYSIS TECHNIQUE COND…
-2
0
2
4
6
8
0 5 10 15 20 25 30 35 Prin
cipa
l Str
ess,
N/m
m2
Time, Seconds
Stress 2.4 MPa 4.8 MPa
Figure: Time history of major principal stress at the heel of dam for Imperial Valley-06 (Recording station: El Centro Array #6) Earthquake (FP + V)
21
INSTITUTE OF ENGINEERING PULCHOWK CAMPUS

LINEAR TIME HISTORY ANALYSIS TECHNIQUE COND…
Figure: Time History of horizontal displacement at top of the dam due to Imperial Valley-06 (Recording station: El Centro Array #6) Earthquake, Left: FN-Component, Right: FP Component
22
INSTITUTE OF ENGINEERING PULCHOWK CAMPUS

Performance of Dam Section For Near-field Earthquake LINEAR TIME HISTORY ANALYSIS TECHNIQUE COND…
15
0 0 10 20 30 40 50 60 70 80 90
100
1 1.2 1.4 1.6 1.8 2
Area
[%]
Demand-Capacity Ratio
Imperial Valley-06 (Recording Station:El Centro Array #6) FN Limit
Figure: Comparison of percentage of overstressed areas with acceptance limits
23
INSTITUTE OF ENGINEERING PULCHOWK CAMPUS

LINEAR TIME HISTORY ANALYSIS TECHNIQUE COND…
Figure : Comparison of cumulative inelastic duration of stress cycles with acceptance stresses at the heel of the dam
Performance of Dam Section For Near-field Earthquake Contd…..
24
0
1
2
3
4
5
6
1 1.2 1.4 1.6 1.8 2
Cum
ulat
ive
Inel
stic
Dur
atio
n [S
ec]
Demand-Capacity Ratio
Limit NGA#181, PGA= 0.44g, PGV=111.87 cm/s NGA#182, PGA = 0.46g, PGV = 108.97 cm/s NGA#779, PGA = 0.94g, PGV = 97.02 cm/s NGA#821, PGA = 0.49g, PGV = 95.42 cm/s NGA#825, PGA = 1.27g, PGV = 59.55 cm/s NGA#828, PGA = 0.61g, PGV = 82.10 cm/s NGA#879, PGA = 0.71g, PGV = 141.02 cm/s NGA#1044, PGA = 0.72g, PGV = 120.27 cm/s NGA#1063, PGA = 0.87g, PGV = 167.20 cm/s NGA#1084, PGA = 0.59g, PGV = 130.27 cm/s NGA#1085, PGA = 0.84g, PGV = 116.56 cm/s NGA#1086, PGA = 0.73g, PGV = 122.72 cm/s NGA#1106, PGA = 0.85g, PGV = 96.27 cm/s NGA#1119, PGA = 0.65g, PGV = 72.65 cm/s NGA#1120, PGA = 0.68g, PGV = 169.58 cm/s NGA#166 NGA#826 NGA#832 NGA#948 NGA#1105
INSTITUTE OF ENGINEERING PULCHOWK CAMPUS

LINEAR TIME HISTORY ANALYSIS TECHNIQUE COND… Performance of Dam Section For Near-field Earthquake Contd…..
Crest Displacement and Stresses due to Near Field Earthquake (Envelop FN)
NGA# Crest Displacement (mm) Horizontal Stress (S11) Vertical Stress (S22) x y Heel Toe Heel Toe
181 115.56 54.67 13.2 6 7.4 3 182 103.16 37.07 10.5 9.68 7.34 5.91 779 -72.96 13.2 11.78 6.28 821 99.09 -30.88 10.42 3.9 5.48 1.77 825 -50.93 3.01 5.12 1.5 828 153.82 -43.15 14.52 7.47 7.78 3.42 879 94.62 -36 11.34 5.11 5.95 2.24
1044 170.62 -57.01 18.28 10.61 9.93 4.95 1063 231.83 -76.39 20.65 12.54 11.64 6.04 1084 125.54 -44.28 13.62 6.03 7.32 2.77 1085 176.05 -57.98 14.24 7.43 7.67 3.49 1086 188.63 -51.6 16.02 8.8 8.66 4.1 1106 -70.9 15.25 13.02 7.13 1119 132.6 -48.34 12.94 6.1 6.65 2.7 1120 139.41 -40.96 14.8 7.36 7.92 3.38 25
INSTITUTE OF ENGINEERING PULCHOWK CAMPUS

LINEAR TIME HISTORY ANALYSIS TECHNIQUE COND… Performance of Dam Section For Near-field Earthquake Contd…..
Crest Displacement and Stresses due to Near Field Earthquake (Envelop FP)
NGA# Crest Displacement (mm) Horizontal Stress (S11) Vertical Stress (S22) x y Heel Toe Heel Toe
181 92.68 49.93 11.37 4.5 6.35 2.3 182 68.23 -25.98 7.62 1.61 3.98 0.84 779 123.54 -41.78 13.7 6.77 7.38 3.19 821 98.04 -33.87 8.65 2.49 4.39 1.08 825 206.73 -72.82 17.53 9.6 9.37 4.47 828 115.21 -35.78 11.08 4.56 5.76 2.03 879 86.86 -35.29 8.37 2.76 4.31 1.2
1044 131.98 -49.49 11.48 5.05 6.2 2.44 1063 148.65 -60.69 14.3 7.39 7.94 3.6 1084 137.59 -45.12 14.51 6.86 7.83 3.16 1085 116.26 -40.2 12.03 5.37 6.33 2.46 1086 89.9 -32.52 7.7 1.85 3.84 0.79 1106 212.44 -64.24 16.3 9.13 8.76 4.26 1119 292.93 -80.81 22.64 14.6 12.43 6.89 1120 191.27 -61.9 17.62 10.08 9.44 4.67 26
INSTITUTE OF ENGINEERING PULCHOWK CAMPUS

LINEAR TIME HISTORY ANALYSIS TECHNIQUE COND… Performance of Dam Section For Near-field Earthquake Contd…..
0
1
2
3
4
5
6
7
8
9
10
0 5 10 15 20 25 30 35 40
Fact
or o
f Saf
ety
Time [Sec]
Figure: Time history of instantaneous factor of safety for near field earthquake [NGA#1084]
27
INSTITUTE OF ENGINEERING PULCHOWK CAMPUS

LINEAR TIME HISTORY ANALYSIS TECHNIQUE COND… Performance of Dam Section For Far-field Earthquake Contd…..
Figure 7. 95 Envelops of maximum stresses (N/mm2), Left: Horizontal Stress, Right: Vertical Stress
Maximum horizontal stress at heel = 5.24 N/mm2 and at toe = -0.25 N/mm2 Maximum vertical stress at heel = 2.47 N/mm2, and at toe = -0.21 N/mm2 Maximum top displacement = 49.9 mm to right and -17.69 mm to down.
28
INSTITUTE OF ENGINEERING PULCHOWK CAMPUS

LINEAR TIME HISTORY ANALYSIS TECHNIQUE COND… Performance of Dam Section For Far-field Earthquake Contd…..
-2
0
2
4
6
0 5 10 15 20 25 30 35 Prin
cipa
l Str
ess,
N
/mm
2
Time, Seconds
Stress 2.4 MPa 4.8 MPa
Figure: Time history of major principal stress at the heel of dam for Imperial Valley-06 (Recording station: Coachella Canal #4) Earthquake
Crest Displacement and Stresses due to Far Field Earthquake
NGA# Case Crest Displacement (mm) Horizontal Stress, N/mm2 (S11) Vertical Stress, N/mm2 (S22)
x y Heel Toe Heel Toe 166 Envelop 49.9 -17.69 5.24 -0.25 2.47 -0.21 826 Envelop 47.43 -17.45 4.97 -0.46 2.35 -0.28 832 Envelop 42.64 -17.4 4.81 -0.73 2.28 -0.42 948 Envelop 42.55 -17.3 4.76 -0.71 2.37 -0.32 1105 Envelop 49.4 -17.22 5.6 0.04 2.69 -0.71 29
INSTITUTE OF ENGINEERING PULCHOWK CAMPUS

Tensile strength of the dam-rock contact is expected to be lower than that of the concrete.
The nonlinear response in the form of tensile cracking is likely to start at the base.
Gap-friction elements are introduced at the base of the dam to simulate cracking and sliding response of the dam.
For nonlinear model time-history analysis (FNA), only the nonlinear behavior of the Link/Support elements is included.
Where is the stiffness matrix for the linear elastic elements (all
elements except the Links/Supports); C is the proportional damping matrix; M is the diagonal mass matrix; is the vector of forces from the nonlinear degrees of freedom in the Link/Support elements; u, , and are the relative displacements, velocities, and accelerations with respect to the ground; and r is the vector of applied loads.
NON LINEAR TIME HISTORY ANALYSIS TECHNIQUE
30
INSTITUTE OF ENGINEERING PULCHOWK CAMPUS

NON LINEAR TIME HISTORY ANALYSIS TECHNIQUE
Figure: Dam finite-element model with gap-friction elements Figure: Constitutive relations of gap-friction element
31
INSTITUTE OF ENGINEERING PULCHOWK CAMPUS

NON LINEAR TIME HISTORY ANALYSIS TECHNIQUE
Figure: Deflected shape at the time of maximum displacement. 31 gap elements out of 51 experienced opening and sliding (NGA#1120)
0
20
40
60
0 10 20 30 40 50 Dis
plac
emen
t [m
m]
Time [Sec]
Heel Toe
Figure: Time history of sliding displacements of nodal points (heel and toe) at the base of the dam (NGA#1120)
Figure 8. 5 Time history of horizontal displacement at the top of dam (NGA#1120) 32
INSTITUTE OF ENGINEERING PULCHOWK CAMPUS

Smooth curved profile perform better than sharp profile changed section.
This study conclude that acceleration only may not be sufficient to cause damage to the structures, pulse type velocity time history is also may be the major factor for destruction. Thus cannot be ignored in design of large structures.
This research conclude that while performing analysis of large concrete dam in tectonically active country like Nepal, it would be better to use near-fault earthquake records rather than code based or far-field records.
In general Fault-normal component cause more damage than Fault-parallel component.
Result shows that, entire base will undergo sliding with a permanent displacement offset of about 40 mm in the downstream direction.
CONCLUSION
33
INSTITUTE OF ENGINEERING PULCHOWK CAMPUS

RECOMMENDATION FOR FURTHER STUDY
Response of dam may be checked for increasing numbers of nodes and also for shell elements. Soil-Structure interaction can be modeled in different ways and
compared to present study. Fluid-structure interaction can be modeled in different ways and
compared to the present study by Westergaard Added Mass method. Cracked at other places than base also can be checked by
Discrete crack modeling or smeared crack modeling.
34
INSTITUTE OF ENGINEERING PULCHOWK CAMPUS

Dr. Hari Ram Parajuli Prof. Dr. Prem Nath Maskey and All Faculty Members
of M.Sc. Structural Engineering and Civil Engineering Department Dr. Roshan Tuladhar Dr. Krisnna Prasad Dulal and Er. Sandip Upreti Er. Mahesh Acharya, NEA Er. Soyuz Gautam
35
ACKNOLODGEMENTS
INSTITUTE OF ENGINEERING PULCHOWK CAMPUS

THANK YOU FOR YOUR ATTENTION!
ARE THERE ANY QUESTIONS?
36
INSTITUTE OF ENGINEERING PULCHOWK CAMPUS
Copyright © 2022 FDOKUMEN