Preferential site substitution of Eu 3+ ions in Ca 10 (PO 4) 6 Cl 2 nanoparticles obtained using a...
11
CrystEngComm PAPER Cite this: CrystEngComm, 2014, 16, 5308 Received 25th January 2014, Accepted 17th March 2014 DOI: 10.1039/c4ce00197d www.rsc.org/crystengcomm Preferential site substitution of Eu 3+ ions in Ca 10 (PO 4 ) 6 Cl 2 nanoparticles obtained using a microwave stimulated wet chemistry technique Robert Pazik, * a Jean-Marie Nedelec bc and Rafal J. Wiglusz * a The Eu 3+ doped Ca 10 (PO 4 ) 6 Cl 2 nanocrystalline powders were synthesized using a microwave stimulated technique. Additional post heat treatment in the temperature range 800–1100 °C was applied in order to improve the crystallinity of the final product and eliminate the residual amorphous phase. Detailed structural characterization was performed by X-ray diffraction (XRD), Raman and infrared (IR) spectroscopy, transmission electron microscopy (TEM) and X-ray fluorescence (EDX). The optical properties of the Ca 10 (PO 4 ) 6 Cl 2 samples doped with different Eu 3+ concentrations (0.5–5 mol%) were determined by measuring excitation, emission spectra and luminescence. TEM images confirmed the nanoscale nature of the final product with a primary particle size of about 60 nm and a hydrodynamic size of 200 nm when the product was dispersed in Milli-Q purified water (MQ) without further stabilization. The analysis of the 5 D 0 → 7 F 0 transition points out that for low concentration Ca(II)(A) site is preferentially substituted whereas increase of Eu 3+ above 2 mol% results in domination of the Eu 3+ cations located at Ca(I)(B) site. Increase of annealing temperature leads to an increase of the 5 D 0 → 7 F 0 intensity associated with the Eu 3+ at A site. Preferential site substitution can be solved by analysis of the optical properties of the Eu 3+ ion. The Judd–Ofelt parameters were calculated using simplified formalisms. The mechanism of concentration quenching process was identified as a dipole–dipole interaction. 1. Introduction Constantly growing interest in the development of nano- materials for advanced bio-applications, such as bio-sensors, involves utilization of highly bio-compatible and photo-stable compounds. 1 Materials belonging to the large apatite family described by the general chemical formula M 10 (PO 4 ) 6 X 2 (M – alkaline cations, X–OH − , Cl − or F − anions) are attractive because of their potential application in medicine. Calcium hydroxyapatite Ca 10 (PO 4 ) 6 (OH) 2 is the most representative material of the apatite family widely used as a biologically safe material being the main constituent of bones. 2 The use of apatite as bio-marker involves structural modification based on substitution of Ca 2+ cations with luminescent triva- lent rare earth ions (RE 3+ ) delivering excellent photo-stability upon exposure to long-term excitation with UV or NIR irradia- tion. 3 The structure of the synthetic apatite compounds is hexagonal, depicted by P6 3 /m space group, and offers mainly two cationic sites Ca(I) and Ca(II) for possible substitution with RE 3+ involving a charge compensation mechanism. 4,5 Recently, our group has conducted a detailed study of the luminescence behaviour of the Eu 3+ ions in the synthetic Ca 10 (PO 4 ) 6 (OH) 2 obtained by a wet chemistry technique covering the concentration of optically active ions from 1 to 5 mol%. 6,7 It has been shown that depending on the concen- tration of dopant and annealing temperature, preferential site substitution occurs either at nine-fold coordinated Ca(I) with C 3 symmetry or Ca(II) site with C s coordinated by seven oxygen anions. In terms of luminescence behaviour Eu 3+ hydroxyapatite has relatively low quantum efficiency mostly due to the presence of structural OH − groups causing strong non-radiative energy migration. In this view, chloroapatite seems to be a more reasonable choice since the absence of OH − structural units should result in no coupling of the Eu 3+ ions with OH − vibrations and therefore enhanced efficiency. It has already been shown that another advantage of chloro- apatite application in the bone replacement materials is directly connected with the significant role of chloride ions. The main outcome relies on osteoclasts activation due to the ability of developing local surface acidic environment facilitating the bone resorption process. 8 However strict control of content of the chloroapatite in a hydroxyapatite mixture is mandatory to avoid too fast solubilisation of alka- line salts. 9 The calcium chloroapatite Ca 10 (PO 4 ) 6 Cl 2 exists as two polymorphs: at low temperature the apatite crystallizes in 5308 | CrystEngComm, 2014, 16, 5308–5318 This journal is © The Royal Society of Chemistry 2014 a Institute of Low Temperature and Structure Research, PAS, Okólna 2, 50–422 Wroclaw, Poland. E-mail: [email protected], [email protected]; Web: www.int.pan.wroc.pl; Fax: +48 71 344 10 29; Tel: +48 71 395 41 59 b Clermont Université, ENSCCF, ICCF, BP10448, 63000 Clermont-Ferrand, France c CNRS, UMR 6296, ICCF, 63171 Aubière, France
Transcript of Preferential site substitution of Eu 3+ ions in Ca 10 (PO 4) 6 Cl 2 nanoparticles obtained using a...

CrystEngComm
PAPER
5308 | CrystEngComm, 2014, 16, 5308–5318 This journal is © The R
a Institute of Low Temperature and Structure Research, PAS, Okólna 2, 50–422
Wrocław, Poland. E-mail: [email protected], [email protected];
Web: www.int.pan.wroc.pl; Fax: +48 71 344 10 29; Tel: +48 71 395 41 59bClermont Université, ENSCCF, ICCF, BP10448, 63000 Clermont-Ferrand, Francec CNRS, UMR 6296, ICCF, 63171 Aubière, France
Cite this: CrystEngComm, 2014, 16,
5308
Received 25th January 2014,Accepted 17th March 2014
DOI: 10.1039/c4ce00197d
www.rsc.org/crystengcomm
Preferential site substitution of Eu3+ ions inCa10(PO4)6Cl2 nanoparticles obtained using amicrowave stimulated wet chemistry technique
Robert Pazik,*a Jean-Marie Nedelecbc and Rafal J. Wiglusz*a
The Eu3+ doped Ca10(PO4)6Cl2 nanocrystalline powders were synthesized using a microwave stimulated
technique. Additional post heat treatment in the temperature range 800–1100 °C was applied in order to
improve the crystallinity of the final product and eliminate the residual amorphous phase. Detailed
structural characterization was performed by X-ray diffraction (XRD), Raman and infrared (IR) spectroscopy,
transmission electron microscopy (TEM) and X-ray fluorescence (EDX). The optical properties of the
Ca10(PO4)6Cl2 samples doped with different Eu3+ concentrations (0.5–5 mol%) were determined by
measuring excitation, emission spectra and luminescence. TEM images confirmed the nanoscale nature
of the final product with a primary particle size of about 60 nm and a hydrodynamic size of 200 nm when
the product was dispersed in Milli-Q purified water (MQ) without further stabilization. The analysis of the5D0 → 7F0 transition points out that for low concentration Ca(II) (A) site is preferentially substituted
whereas increase of Eu3+ above 2 mol% results in domination of the Eu3+ cations located at Ca(I) (B) site.
Increase of annealing temperature leads to an increase of the 5D0 → 7F0 intensity associated with the Eu3+
at A site. Preferential site substitution can be solved by analysis of the optical properties of the Eu3+ ion.
The Judd–Ofelt parameters were calculated using simplified formalisms. The mechanism of concentration
quenching process was identified as a dipole–dipole interaction.
1. Introduction
Constantly growing interest in the development of nano-materials for advanced bio-applications, such as bio-sensors,involves utilization of highly bio-compatible and photo-stablecompounds.1 Materials belonging to the large apatite familydescribed by the general chemical formula M10(PO4)6X2
(M – alkaline cations, X–OH−, Cl− or F− anions) are attractivebecause of their potential application in medicine. Calciumhydroxyapatite Ca10(PO4)6(OH)2 is the most representativematerial of the apatite family widely used as a biologicallysafe material being the main constituent of bones.2 The useof apatite as bio-marker involves structural modificationbased on substitution of Ca2+ cations with luminescent triva-lent rare earth ions (RE3+) delivering excellent photo-stabilityupon exposure to long-term excitation with UV or NIR irradia-tion.3 The structure of the synthetic apatite compounds ishexagonal, depicted by P63/m space group, and offers mainlytwo cationic sites Ca(I) and Ca(II) for possible substitutionwith RE3+ involving a charge compensation mechanism.4,5
Recently, our group has conducted a detailed study of theluminescence behaviour of the Eu3+ ions in the syntheticCa10(PO4)6(OH)2 obtained by a wet chemistry techniquecovering the concentration of optically active ions from 1 to5 mol%.6,7 It has been shown that depending on the concen-tration of dopant and annealing temperature, preferentialsite substitution occurs either at nine-fold coordinated Ca(I)with C3 symmetry or Ca(II) site with Cs coordinated by sevenoxygen anions. In terms of luminescence behaviour Eu3+
hydroxyapatite has relatively low quantum efficiency mostlydue to the presence of structural OH− groups causing strongnon-radiative energy migration. In this view, chloroapatiteseems to be a more reasonable choice since the absence ofOH− structural units should result in no coupling of the Eu3+
ions with OH− vibrations and therefore enhanced efficiency.It has already been shown that another advantage of chloro-apatite application in the bone replacement materials isdirectly connected with the significant role of chloride ions.The main outcome relies on osteoclasts activation due tothe ability of developing local surface acidic environmentfacilitating the bone resorption process.8 However strictcontrol of content of the chloroapatite in a hydroxyapatitemixture is mandatory to avoid too fast solubilisation of alka-line salts.9 The calcium chloroapatite Ca10(PO4)6Cl2 exists astwo polymorphs: at low temperature the apatite crystallizes in
oyal Society of Chemistry 2014

CrystEngComm Paper
a monoclinic phase with space group P21/b and after thermaltreatment above 350 °C10 in the typical hexagonal one.Several strategies were developed for the synthesis of apatiteparticles involving techniques such as microemulsion,11
precipitation,12 sol–gel,13 wet chemistry5 and others.Therefore the aim of the present work is focused on
microwave assisted hydrothermal synthesis of nanocrystallinepowders of Ca10(PO4)6Cl2 doped with Eu3+ ions acting bothas an optical probe for investigation of structural changesand as luminescent centre adding extra functional propertiesto the final material which could be further used as a bio-markerin bone replacement materials.
2. Experimental
The X-ray diffraction (XRD) patterns were measured in a 2θrange of 5–100° with a X'Pert Pro PANalytical X-ray diffrac-tometer (Cu, Kα1: 1.54060 Å). The IR measurements wereperformed using FT-IR Biorad 575C spectrophotometer. Asmall amount of chloroapatite powder was dispersed in nujolmull and placed between two highly transparent siliconglasses prior to measurement. Raman measurements werecarried out with a Micro-Raman system Renishaw inViaequipped with a confocal Leica DM 2500 M microscope withCCD camera as a detector and a diode laser operating at830 nm. The spectral resolution was set to 2 cm−1. BET Thespecific surface area (SBET) was measured by nitrogen gassorption at 77 K on a Quantachrome Autosorb 1 apparatus.The samples were degassed for 18 h at 100 °C before starting.The particle size was calculated from BET measurementsusing the following equation:
DS d
6
BET
(1)
where D denotes the average particle size (μm), SBET is thespecific surface area (m2 g−1) and d the density of investi-gated material (g cm−3). Hydrodynamic size was measuredusing a dynamic light scattering technique on MalvernInstruments Zetasizer Nano-ZS instrument operating underHe-Ne 633 nm laser and equipped with the Dispersion Tech-nology Software for data collection and analysis. Dilutedwater dispersions containing chloroapatite were each timeequilibrated for 2 min before starting the actual measure-ment. The values of the refractive index and absorbance forthe Ca10(PO4)6Cl2 were taken from literature. Additionally,the hydrodynamic size was measured using Nanosight NS500 automated instrument using 405 nm line of laser diodeas a light source backscattered further on measured objects.The samples for hydrodynamic size measurements wereprepared by taking 1 ml of water suspension containingnanoparticles and further on diluted with 19 ml of de-ionizedwater and transferred by peristaltic pumps to the sample cham-ber. Typically the starting concentration of nanoparticles in allprepared suspensions was around 500 μg ml−1. Each measure-ment was repeated at least three times and conducted with
This journal is © The Royal Society of Chemistry 2014
different dilution of particles to achieve satisfactory statisticsand exclude errors connected with too high or too low amountof analyzed objects. From a simultaneous measurement of themean squared displacement of each particle tracked, the parti-cle diffusion coefficient (Dt) and hence the sphere-equivalent,hydrodynamic radius (rh) can be determined using theStokes–Einstein equation:
r K TDh
B
t
6
(2)
where KB is Boltzmann's constant, T is temperature and η issolvent viscosity (H2O). The analysis was done usingNanosight NTA 2.3 software allowing for determination of theparticle/object concentration represented as a number of theparticles/objects per mL. The Ca10(PO4)6Cl2:Eu
3+ powderswere investigated by transmission electron microscopy (TEM)using Philips CM-20 SuperTwin microscope, operating at200 kV. Specimens for HRTEM were prepared by dispersing asmall amount of sample in methanol and putting a droplet ofthe suspension on a copper microscope grid covered withperforated carbon. Elemental analyses were carried out usinga scanning electron microscope FEI Nova NanoSEM 230equipped with EDS spectrometer (EDAX PegasusXM4). Up to10 measurements were made from different random areas foreach sample to assure satisfactory statistics. The luminescencespectra were recorded using Jobin Yvon THR1000 monochro-mator equipped with Hamamatsu R928 photomultiplier and1200 lines mm−1 grating blazed at 500 nm. As an excitationsource continuous 266 nm line of YAG:Nd laser (thirdharmonics) was used. The excitation spectra were measuredusing Spectra Pro 750 monochromator, equipped withHamamatsu R928 photomultiplier and 1200 l mm−1 gratingblazed at 500 nm. The 450 W xenon arc lamp was used as anexcitation source. It was coupled with 275 mm excitationmonochromator, which used a 1800 l mm−1 grating blazed at250 nm. The lifetimes were measured utilizing LeCroy oscillo-scope after 266 nm excitation with pulse YAG:Nd laser. Allrecorded spectra were corrected accordingly to the apparatuscharacteristics.
Synthesis of Ca10(PO4)6Cl2:Eu3+ nanoparticles
The main substrates used for the fabrication of the Ca10(PO4)6Cl2nanoparticles doped with different concentrations of Eu3+ ions(0.5–5 mol%) using a microwave stimulated hydrothermaltechnique were CaCl2 (99.9% Alfa Aesar), (NH4)2HPO4
(99.99% Sigma Aldrich), Eu2O3 (99.99% Alfa Aesar) as well asNH4OH (99% Avantor Poland) for pH control. In a typicalpreparation procedure i.e. for the final product containing1 mol% of the Eu3+, a stoichiometric amount of the Eu2O3
0.01583 g (0.045 mmol) was first digested in an excess of theHNO3 (ultrapure Avantor Poland) in order to transformeuropium oxide into the water soluble europium nitrate. TheEu(NO3)3·6H2O was further on re-crystallized three times toget rid of the HNO3 excess. Afterwards 0.9889 g (8.91 mmol)of CaCl2 was dissolved in MQ-water together with Eu(NO3)3.
CrystEngComm, 2014, 16, 5308–5318 | 5309
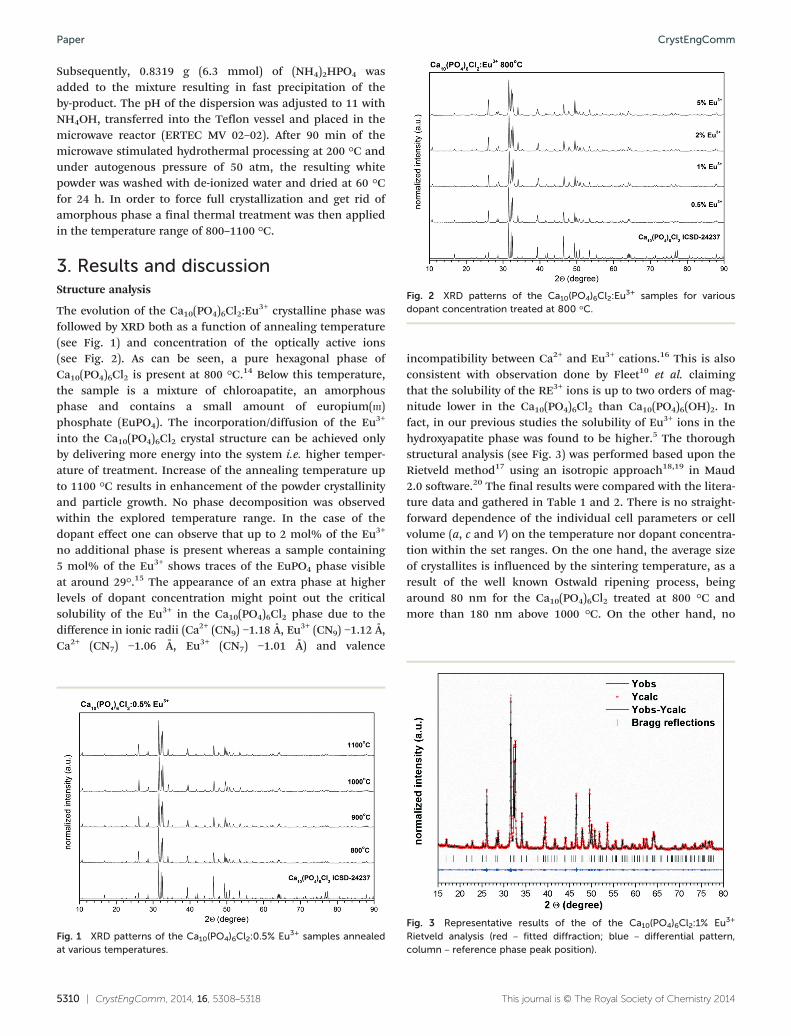
Fig. 2 XRD patterns of the Ca10(PO4)6Cl2:Eu3+ samples for various
dopant concentration treated at 800 °C.
CrystEngCommPaper
Subsequently, 0.8319 g (6.3 mmol) of (NH4)2HPO4 wasadded to the mixture resulting in fast precipitation of theby-product. The pH of the dispersion was adjusted to 11 withNH4OH, transferred into the Teflon vessel and placed in themicrowave reactor (ERTEC MV 02–02). After 90 min of themicrowave stimulated hydrothermal processing at 200 °C andunder autogenous pressure of 50 atm, the resulting whitepowder was washed with de-ionized water and dried at 60 °Cfor 24 h. In order to force full crystallization and get rid ofamorphous phase a final thermal treatment was then appliedin the temperature range of 800–1100 °C.
3. Results and discussionStructure analysis
The evolution of the Ca10(PO4)6Cl2:Eu3+ crystalline phase was
followed by XRD both as a function of annealing temperature(see Fig. 1) and concentration of the optically active ions(see Fig. 2). As can be seen, a pure hexagonal phase ofCa10(PO4)6Cl2 is present at 800 °C.14 Below this temperature,the sample is a mixture of chloroapatite, an amorphousphase and contains a small amount of europium(III)phosphate (EuPO4). The incorporation/diffusion of the Eu3+
into the Ca10(PO4)6Cl2 crystal structure can be achieved onlyby delivering more energy into the system i.e. higher temper-ature of treatment. Increase of the annealing temperature upto 1100 °C results in enhancement of the powder crystallinityand particle growth. No phase decomposition was observedwithin the explored temperature range. In the case of thedopant effect one can observe that up to 2 mol% of the Eu3+
no additional phase is present whereas a sample containing5 mol% of the Eu3+ shows traces of the EuPO4 phase visibleat around 29°.15 The appearance of an extra phase at higherlevels of dopant concentration might point out the criticalsolubility of the Eu3+ in the Ca10(PO4)6Cl2 phase due to thedifference in ionic radii (Ca2+ (CN9) −1.18 Å, Eu3+ (CN9) −1.12 Å,Ca2+ (CN7) −1.06 Å, Eu3+ (CN7) −1.01 Å) and valence
5310 | CrystEngComm, 2014, 16, 5308–5318
Fig. 1 XRD patterns of the Ca10(PO4)6Cl2:0.5% Eu3+ samples annealedat various temperatures.
incompatibility between Ca2+ and Eu3+ cations.16 This is alsoconsistent with observation done by Fleet10 et al. claimingthat the solubility of the RE3+ ions is up to two orders of mag-nitude lower in the Ca10(PO4)6Cl2 than Ca10(PO4)6(OH)2. Infact, in our previous studies the solubility of Eu3+ ions in thehydroxyapatite phase was found to be higher.5 The thoroughstructural analysis (see Fig. 3) was performed based upon theRietveld method17 using an isotropic approach18,19 in Maud2.0 software.20 The final results were compared with the litera-ture data and gathered in Table 1 and 2. There is no straight-forward dependence of the individual cell parameters or cellvolume (a, c and V) on the temperature nor dopant concentra-tion within the set ranges. On the one hand, the average sizeof crystallites is influenced by the sintering temperature, as aresult of the well known Ostwald ripening process, beingaround 80 nm for the Ca10(PO4)6Cl2 treated at 800 °C andmore than 180 nm above 1000 °C. On the other hand, no
This journal is © The Royal Society of Chemistry 2014
Fig. 3 Representative results of the of the Ca10(PO4)6Cl2:1% Eu3+
Rietveld analysis (red – fitted diffraction; blue – differential pattern,column – reference phase peak position).

Table 1 Unit cell parameters (a, c), cell volume (V), grain size as wellas refine factor (RW) for the Ca10(PO4)6Cl2: 0.5% Eu3+ powder asfunction of the temperature treatment
Sample a (Å) c (Å) V (Å3) Size (nm) Rw (%)
Single crystal 9.52(3) 6.85(3) 537.64(3) — —800 °C 9.54(6) 6.85(4) 539.90(6) 81 4.5900 °C 9.61(1) 6.80(3) 543.85(9) 101 4.71000 °C 9.59(6) 6.81(1) 542.39(4) 172 4.21100 °C 9.55(9) 6.82(6) 538.66(9) 190 4.6
Table 2 Unit cell parameters (a, c), cell volume (V), grain size as wellas refine factor (RW) for the Ca10(PO4)6Cl2:Eu
3+ nanoparticles treatedat 800 °C
Sample a (Å) c (Å) V (Å3) Size (nm) Rw (%)
0.5% Eu3+ 9.54(6) 6.85(4) 539.90(6) 81 4.51% Eu3+ 9.51(0) 6.86(7) 537.29(9) 90 5.92% Eu3+ 9.57(1) 6.83(7) 541.72(0) 70 4.35% Eu3+ 9.52(1) 6.85(5) 537.64(4) 86 4.5
Fig. 5 Representative Raman spectrum of the Ca10(PO4)6Cl2:1% Eu3+
heat treated at 800 °C.
CrystEngComm Paper
concentration effect connected with Eu3+ cations substitutionon the growth of the particles was found, resulting in an aver-age size close to 80 nm whatever the doping level. Based onthe XRD analysis the samples heat treated at 800 °C wereselected for further studies as their particle size lies withinthe range of nanotechnology interest. The particle size estima-tion using BET surface area measurement gave comparableresults with the Rietveld calculations leading to a value of 110 nm(SBET = 16m
2 g−1, dCaPCl = 3.20 g cm−3).
The infrared absorption (IR) and Raman spectra (seeFig. 4 and 5) were recorded in order to get a more detailedinsight into the structural peculiarities of Ca10(PO4)6Cl2:Eu
3+.Actually the IR spectra consist of typical active vibrationalbands related to the phosphate PO4
3− species at 469, 564,607, 962, 1043, 1087 cm−1 as well as vibrations of the Eu–O at173 cm−1 and Ca–O at 230 and 308 cm−1, clearly indicatingthe presence of a pure apatite structure.21 Additionally, lack
This journal is © The Royal Society of Chemistry 2014
Fig. 4 Representative IR spectrum of the Ca10(PO4)6Cl2:0.5% Eu3+
heat treated at 800 °C.
of the characteristic vibrations at 3560 and 630 cm−1 due tothe hydroxyl stretch and libration of OH− groups was found,confirming formation of the pure chloroapatite structure.22
The additional peaks located at around 1377, 1461, 2848,2919 and 2954 cm−1 are due to the nujol mull. In the case ofRaman spectra four typical vibrational modes of the PO4
3−
unit are observed easily at 961 cm−1 attributed to the υ1mode, three overlapping bands at 1019, 1040 and 1076 cm−1
associated with the υ3, group of peaks at 575, 588 and615 cm−1 ascribed to the υ4 as well as asymmetric band withmaximum at 426 cm−1 due to the υ2 mode, respectively. All ofthe mode position are essentially the same as those reportedby Feki et al.21 confirming the structural purity of the finalproduct.
EDS analysis (see Fig. 6c) provides a direct evidence of thepresence of Cl− anions in the studied samples, confirmingtheir expected elemental compositions. The resulting con-tents of the respective elements were in good correspondencewith theoretical values with small 2–5% deviation arisingfrom the typical error sources of the EDS technique.23 In thecase of the Eu3+ cations the end value for low concentratedsamples is associated with higher error and is not reliabledue to the detection limits.
Morphology and particle sizing techniques
The size of Ca10(PO4)6Cl2:Eu3+ particles was analyzed using
two different approaches in order to compare them and toaim better the final product for applications. On the onehand, the so-called primary size of particles, broadlydiscussed previously,24,25 was estimated on dry powdersusing TEM microscopy (Fig. 7). On the other hand, waterbased colloidal suspensions containing re-dispersedCa10(PO4)6Cl2:Eu
3+ particles where characterized by the DLStechnique (see Fig. 8). The former approach would give infor-mation regarding the overall outlook on the form of the finalpowder, its shape and primary size, whereas the latter onecould give a straight answer regarding the usefulness of thedesired material for bio-related applications delivering a
CrystEngComm, 2014, 16, 5308–5318 | 5311

Fig. 6 SEM-EDS characterization of the Ca10(PO4)6Cl2:0.5% Eu3+ heat treated at 800 °C.
Fig. 7 TEM images of the (a) Ca10(PO4)6Cl2:0.5% Eu3+, (b) Ca10(PO4)6Cl2:5% Eu3+ and SAED picture of the Ca10(PO4)6Cl2:0.5% Eu3+ sintered at 800 °C.
Fig. 8 Comparison of the particle size and distribution of theCa10(PO4)6Cl2:0.5% Eu3+ DLS techniques with Nanosight NS 500 andMalvern Zetasizer (inset). Right-bottom image shows the first frame of60 s video recorder for image analysis.
CrystEngCommPaper
particle hydrodynamic size. Hence, in accordance with TEManalysis (see Fig. 7a) and b the Ca10(PO4)6Cl2:Eu
3+ powdersample contains loosely agglomerated particles with regular
5312 | CrystEngComm, 2014, 16, 5308–5318
and often elongated shapes. The primary size is 60 nm withrather broad distribution characteristics of all materials werehigh temperature thermal treatment is involved.26 Analysis ofthe SAED image (see Fig. 7c) points out the presence of welldeveloped spotty rings confirming a high level of materialcrystallization at positions expected for the pure hexagonalCa10(PO4)6Cl2 phase.
As has been mentioned earlier, in order to recognize thestate of the particle in water suspensions it is necessary tofollow the hydrodynamic size which could be critical forcertain bio-related applications. Therefore colloids containingCa10(PO4)6Cl2 nanoparticles with 2 mol% of Eu3+ ions wereprepared and measured using two different instrumentsMalvern Zetasizer and Nanosight NS 500. As can be seen inFig. 8 obviously the Ca10(PO4)6Cl2 nanoparticles are presentin the dispersion as agglomerates containing at least fourparticles with an average size of 200 nm. The inset in Fig. 8presents the results of measurement on Zetasizer instrument(upper inset) as well. Both results are actually comparable.However, the result of the measurement on Malvern instru-ment points out the existence of a higher particles fractionwith size below 100 nm whereas the size distribution remains
This journal is © The Royal Society of Chemistry 2014

CrystEngComm Paper
the same. The bottom inset in Fig. 8 shows a first frame ofthe 30 s video made for image analysis using NTA software.
Optical properties
The Ca10(PO4)6Cl2:Eu3+ excitation spectra were measured at
300 K monitoring emission wavelength at 617 nm as a func-tion of dopant concentration, corresponding accurately to themaximum intensity of 5D0 → 7F2 electric dipole transition(see Fig. 9). In general, the excitation emission spectra con-sist of typical absorption bands of the Eu3+ ion with broadband emission in the UV spectral region ascribed to theO2− → Eu3+ charge transfer band (CT) as well as sharp intra-configurational f–f lines. Therefore, the narrow band locatedat 27 694 cm−1 (361 nm) was attributed to the 7F0 → 5L10,9,8,5D4 transitions, at 26 672 cm−1 (375 nm) 7F0 → 5G2,3,
5L7, at25 437 cm−1 (394 nm) 7F0 →
5L6 and at 21 606 cm−1 (462 nm)7F0 →
5D2, respectively. Since the f orbitals of lanthanide ionsare well isolated the electron transitions occurring withinf shell are weakly influenced by the ligand field. In conse-quence, the positions of the peaks remain almost constantregardless of the compound type. As could be seen in Fig. 9the positions of the f–f transitions do not change at all withincrease of the Eu3+ concentration (please see the dashedblack line). However, quite a different situation occurs whenanalyzing the CT band location. Taking into account thecrystallographic data of Ca10(PO4)6Cl2 doped with Eu3+ ioncan theoretically be incorporated at both Ca2+ sites. Firstly,9-fold coordinated Ca(II), depicted for clarity as A crystallo-graphic position, secondly 7-fold coordinated Ca(I), B site inthis paper, where seven O2− anions form a coordinationpolyhedron. As can be seen for the most diluted sample(0.5 mol% Eu3+ ions) the barycenter of the CT band is locatedat 43 488 cm−1 (230 nm) whereas increase of the Eu3+ ionsconcentration up to 5 mol% shifts the CT band towardslower energies 42 322 cm−1 (236 nm). Another characteristicfeature is that the CT band observed in all spectra is asym-metric. According to the literature, the energy of O2− → Eu3+
This journal is © The Royal Society of Chemistry 2014
Fig. 9 Excitation emission spectrum of the Ca10(PO4)6Cl2:Eu3+ as
function of dopant concentration measured at 300 K, λmon = 617 nm.
CT is driven by the stabilization of O2− ions by the surroundingcations. The smaller the cation radius and the higher thecharge as well as higher coordination number, the larger thestabilization is and hence blue-shifted CT energy.27 Therefore,lower nepheleauxetic effect is anticipated for the A site with9 fold coordination in comparison with B site with 7 foldcoordination. Eventually the position of the CT band for lessconcentrated Ca10(PO4)6Cl2: 0.5% Eu3+ would be definitelylocated at higher energies since preferential substitutionoccurs at A crystallographic site. The red shift and asymmetricshape of the CT band upon increase of the Eu3+ ions concen-tration would be caused by incorporation of the Eu3+ ionsat B site. The Eu3+ cations excitation behavior is stronglysupported by the analysis of emission spectra deliveringfurther evidence to the discussed issues.
Fig. 10 and 11 present the emission spectra ofCa10(PO4)6Cl2:Eu
3+ samples collected at 300 K and 77 K uponexcitation at 266 nm as a function of Eu3+ ions concentration(1–5% mol) corrected accordingly to the apparatus response.The discussion of Eu3+ ions luminescent behavior alreadyfound a special place in the scientific literature since it canbe indicative of structural disorders,28,29 phase transtions30
and of course finds application as a phosphor material,31
Typically emission spectra of the Eu3+ consist of characteristicbands in the visible region ascribed to the specific electrontransitions occurring within the f–f shell of Eu3+ ions. In mostcases, the 5D0 → 7F0−4 transitions are observed as a result ofthe depopulation of the lowest lying meta-stable excited5D0 level to the respective crystal field components of the7F0−4 levels of the 7F ground term. Electron transitions like5D0 → 7F5,6 usually have low intensity and are difficult todetect. Nevertheless, the emission from 5D1 or 5D2 excitedstates could also be recorded, especially in the case of lowphonon crystal matrices i.e. fluorides32 In the case ofCa10(PO4)6Cl2:Eu
3+ emission spectra one can observe twoevidently separated lines with maxima at 17 442 cm−1
(573.3 nm), 17 329 cm−1 (577 nm) both corresponding to the5D0 → 7F0 transitions, at 17 011 cm−1 (587.8 nm) to the5D0 → 7F1, at 16 195 cm−1 (617.4 nm) to the 5D0 → 7F2, at
CrystEngComm, 2014, 16, 5308–5318 | 5313
Fig. 10 Emission spectrum of the Ca10(PO4)6Cl2:Eu3+ samples as a
function of dopant concentration measured at 300 K, λexc = 266 nm.

Fig. 11 Emission spectrum of the Ca10(PO4)6Cl2:Eu3+ samples as a
function of dopant concentration measured at 77 K, λexc = 266 nm.
CrystEngCommPaper
15249 cm−1 (655.7 nm) to the 5D0 →7F3 as well as at 14297 cm−1
(699.7 nm) to the 5D0 →7F4 transition, respectively. From the
nature of the 7F0 ground state and the excited 5D0 level beingnon-degenerated under any symmetry, analysis of this transi-tion gives information regarding the number of crystallo-graphically independent Eu3+ ions existing in the given hostlattice. Taking into account structural data and possibility ofincorporation of the Eu3+ ions into both Ca2+ cations sites Aand B presence of the two 5D0 → 7F0 transitions stronglysupports this fact and is consistent with excitation spectraobservation. In accordance with the rule of 2J + 1 at Cs
symmetry, a maximum of five sublevels should be present forthe 5D0 → 7F1 and eight in the case of the 5D0 → 7F2 transi-tions whereas at C3 symmetry 5D0 → 7F1 splits into two and5D0 → 7F2 into three Stark components. Since the excitationline is well matched with overlapping CT transitions bothEu3+ sites are excited mutually and all Stark components ofthe two different emitting centers should be observed.Accordingly with the spectra in Fig. 10 and 11 more compo-nents are visible 5D0 →
7FJ than expected from the theoreticaldata. It most probably means that due to the charge compen-sation effects the symmetry of the C3 site is lowered and/orthere is a presence of some Eu3+ ions, with low symmetry,located at the nanoparticle surface or close-to-the-surfacearea quite common in nanoparticles. The latter explanationmight also be supported by visible shoulders for the 5D0 →
7F0transition connected with surface optical centers.
It is well known that the electric dipole 5D0 → 7F2 transi-tion is highly prone to even slight changes of the localsurrounding whereas the 5D0 → 7F1 magnetic dipole transi-tion should remain practically independent on the hostlattice. Therefore, the magnetic dipole transition is usuallytreated as an internal reference. In general, when Eu3+ ionssubstitute position with the centre of symmetry the only oneallowed transition is the magnetic one 5D0 → 7F1. In theopposite case, the electric dipole 5D0 → 7F2 becomes domi-nant,33 as is exactly the case in our studies. Furthermore, ithas been proposed that the ratio between the integral intensi-ties of the both transitions 5D0 →
7F2 and5D0 →
7F1 could be
5314 | CrystEngComm, 2014, 16, 5308–5318
used for evaluation of the Eu3+ polyhedron coordinationasymmetry R defined as follows:
R
50
72
50
71
D F
D F(3)
The consequence of that is as follows: the higher theI0−2/I0−1 ratio, the more apart from a centrosymmetric geometryEu3+ is.34 In fact the asymmetry parameter R changes progres-sively with Eu3+ concentration increase from 8 to almost 12(Table 3). Hence, a conclusion might be drawn that the localenvironment of Eu3+ becomes more distorted upon doping.This would also be logical since incorporation of more +3 ionsinto +2 site would actually induce more network defects.
It is worth noting the dependence of Eu3+ ions concentra-tion on the sites occupation preference as shown in Fig. 12.The problems of the site preference of several rare earthelements in a calcium chloroapatite structure have beendiscussed by Fleet et al.10 using a crystallographic approachbut not exploiting indirect optical techniques. In our earlierarticle devoted to calcium hydroxyapatite, site preferencestudies were conducted using analysis of the Eu3+ ions lumi-nescence behavior.5 In comparison to both approaches itcould be concluded that indeed for a low concentration rangeof RE3+ ions would preferentially substitute the A site whereasincrease of dopant amount would lead to reverse dependence.As can be seen, up to 0.5 mol% of the Eu3+ the 5D0 → 7F0ascribed to the A site dominates and further increase of theEu3+ concentration above 2 mol% results in domination ofthe Eu3+ cations at B site (see Fig. 9 and compare with emis-sion spectra). At last according with structural data domina-tion of B site is not a surprise upon exceeding critical Eu3+
concentration since the ratio between A and B site is 2 : 3(A – 4f, B – 6h). Therefore utilization of the Eu3+ ions as anoptical probe is a straightforward method for solving struc-tural features of the given host lattice and does not needsophisticated calculation methods to be used. Moreover, itwas also interesting to test not only the concentration effectbut also how the sintering temperature would influence thesite preference of the Eu3+ cations in the Ca10(PO4)6Cl2 matrix(Fig. 13 and 14). A brief comparison draws a conclusion thatthe higher the annealing temperature, the more Eu3+ ions areincorporated at A crystallographic site.
In order to get a deeper insight into the nature of theluminescence behaviour of the Eu3+ in the Ca10(PO4)6Cl2, theintensity parameters Ω2 and Ω4 can be determined using anapproach described previously by Kodaira,35 Werts36 andHreniak.37 The relation between the 5D0 → 7FJ transitionswas used to determine the Ωλ parameters assuming that thematrix element U(6) is close to zero for the 5D0 → 7F6 transi-tion (U(6) = 0.0005). Therefore the matrix elements for transi-tions from the 5DJ ( J = 0, 1, 2, and 3) are zero.38 The Einsteincoefficients A0−λ for spontaneous emission is defined asfollows:
This journal is © The Royal Society of Chemistry 2014

Table 3 Decay rates of radiative (Arad), non-radiative (Anrad) and total (Atot) processes of 5D0 → 7FJ transitions, luminescence lifetimes (τ), intensityparameters (Ω2, Ω4),quantum efficiency (η) and asymmetry ratio (R) determined from photoluminescence spectra of the Ca10(PO4)6Cl2:Eu
3+ treatedat 800 °C
Sample Arad (s−1) Anrad (s−1) Atot (s−1) τ (ms) Ω2 (10
−20 cm2) Ω4 (10−20 cm2) η (%) R
0.5 421.65 219.37 641.02 1.56 0.113 6.134 65.78 8.141 405.01 231.93 636.94 1.57 0.106 6.198 63.58 7.672 502.94 389.91 892.85 1.12 0.138 7.144 56.33 9.965 585.12 255.22 840.34 1.19 0.164 7.954 69.63 11.87
Fig. 12 Eu3+ site occupancy changes represented as a fraction of the5D0 → 7F0 integral intensities vs. Eu3+ concentration.
Fig. 13 Emission spectrum of the Ca10(PO4)6Cl2:2% Eu3+ as functionsintering temperature measured at 300 K, λexc = 266 nm.
Fig. 14 Eu3+ site occupancy changes represented as a fraction of the5D0 → 7F0 integral intensities vs. sintering temperature.
CrystEngComm Paper
A ehc
U J0
4 3 2
30
50
7 2
2 4
643
14
D F( )
,(4)
Due to the “clearing” matrix elements U(4), U(6) and U(2),U(6) for the 5D0 →
7F2 and5D0 →
7F4 transitions, respectively,the values of Ω2 and Ω4 can be extracted by determining A0−λdirectly from the emission spectra taking <5D0||U
(2)||7F2> =0.0035 and <5D0||U
(4)|| 7F4> = 0.0030, respectively. This canbe done by taking the relation between integral intensity Iand the transition energy hυ given as I = hυAN, where A is the
This journal is © The Royal Society of Chemistry 2014
Einstein coefficient for spontaneous emission and N is thepopulation of the emitting 5D0 level. By comparison of bothsides of the equations describing the 5D0 →
7F2 and5D0 →
7F4transitions to N, the expression for A0−λ has now the followingform:
A A A II
hhJ
J
J0 0 0 1
0
0 1
0 1
0
(5)
where I0−J, hυ0−J and I0−1, hυ0−1 are the integral intensities andenergies of the 5D0 → 7FJ and
5D0 → 7F1 transitions, respec-tively. In the simplified Judd–Ofelt theory (J–O) the A0−1 coeffi-cient corresponding to the 5D0 → 7F1 transition has to befixed at some reasonable value. Therefore 36.5 s−1 wasassumed due to the magnetic character of the 5D0 →
7F1 tran-sition and its weak dependence on the crystal field effects.5,27
Following the magnitudes of decay rates (AJ−J′) determinedfrom the excited 5D0 level it is now possible to estimate theradiative decay rate (Arad):
A AJ J
Jrad ’
’(6)
Additionally, by taking the measured luminescence life-times the non-radiative (Anrad) and total decay rate (Atot) areexpressed as:
A A Atot rad nrad 1
(7)
CrystEngComm, 2014, 16, 5308–5318 | 5315

CrystEngCommPaper
Eventually having radiative and non-radiative decay ratesthe quantum efficiency of overall luminescence can be easilycalculated:
A A Atot rad nrad 1
(8)
All results of the calculation using simplified J–O theoryhave been gathered in Table 3.
It is worth noting that the magnitude of Ω2 and Ω4 param-eters increases with the Eu3+ ions concentration. The mutualchange of the asymmetry parameter R follows the same trendas Ω2, pointing out the increased distortion of the Eu3+
cations polyhedra as well as could be related to the slightchange in the Eu3+–O2− bond covalence increasing withdoping. On the other hand, the value of Ω4 cannot be directlyassociated with the symmetry changes of the Eu3+ ions butcould give some information about changes of the electrondensity on the surrounding O2− anions.39 The quantum effi-ciency (η) was estimated theoretically from J–O calculationsgiving rather close to each other values of around 65%. Thereis a small irregularity for quantum efficiency with theincrease of dopant concentration that is connected with afraction of atoms located on the nanomaterial surface orclose-to-surface regions that are more prone to quenchingdue to the easier contact with impurities (such as H2O, –OHgroups and etc.). Therefore increase of the Eu3+ ions concen-tration with keeping the size of the particle would increasethe number of optical centres in such regions contributing todecrease of QE due to the increase of non-radiativeprocesses.
The luminescence kinetics studies of Ca10(PO4)6Cl2:Eu3+
as a function of dopant concentration related to the 5D0 →7F2
emission were performed at room temperature (see Fig. 15)upon excitation at 266 nm. As can be seen, the decay profilesare not a single exponential for all studied cases. Since thephysical sense of the fitting with multi-exponential depen-dence is difficult to interpret, the values of the lifetimes werecalculated as the effective emission decay time using the
5316 | CrystEngComm, 2014, 16, 5308–5318
Fig. 15 Decay profiles of the Ca10(PO4)6Cl2:Eu3+ as a function of the
dopant concentration.
following expression:
m
d
d
d
d
tI t t
I t t
tI t tt
I t tt
( )
( )
( )
( )
max
max0
0
0
0
(9)
where I(t) represents the luminescence intensity at time tcorrected for the background and the integrals are evaluatedon a range 0 < t < tmax where tmax ≫ τm.
40 It was found thatthe effective decay time decreases (from 1.57 to 1.19 ms)significantly with increase of the amount of Eu3+ ions(see Table 3). Thus, this behavior can be attributed to theconcentration quenching phenomena relying on the energytransfer between the interacting activator ions.41 For theeffective energy transfer distance between activators has to bebelow a certain value called a critical distance Rc which canbe calculated from:
R VNcc
2 3
4
1 3
/
(10)
where V is the volume of the unit cell, N is the number ofcations which can be substituted by the dopant per unit celland χc is the critical concentration of the dopant at which theconcentration quenching occurs. In the case of theCa10(PO4)6Cl2:Eu
3+ the V is 537.64 Å3, Z equals 10 and χc is0.02 (2%), respectively. The critical transfer distance of theEu3+ in Ca10(PO4)6Cl2 is calculated to be about 17 Å. For theresonant energy transfer two mechanism are involved:exchange and multipolar interactions. The former one is validwhen the critical distance is less than 4 Å, thus in this particu-lar case the energy transfer in Ca10(PO4)6Cl2 will be caused bymultipole interactions only. Thus the emission intensity (I)per activator follows the equation:
I K Q
1 3 1
( ) / (11)
where I is the emission intensity per activator ion, χ is theactivator concentration, K and β are constants under thesame excitation condition for the given host crystal and Q isa constant of multipolar interactions and equals 6, 8 or10 for dipole–dipole, dipole–quadrupole or quadrupole–quadrupole interaction, respectively. If βχQ/3 ≫ 1, then eqn (5)is reduced to:
lg lg13
A Q
(12)
where A = lgK − lg β.42 Out of this relation, the slope value of−1.28 was extracted meaning that the Q value is close to 6.Hence the major mechanism responsible for concentrationquenching will be a dipole–dipole one.
This journal is © The Royal Society of Chemistry 2014

CrystEngComm Paper
4. Conclusions
The Eu3+ doped Ca10(PO4)6Cl2 nanocrystalline powders weresuccessfully synthesized using a microwave stimulated tech-nique. Additional post heat treatment in the range of temper-ature 800–1100 °C was applied in order to improve thecrystallinity of the final product and eliminate any residualamorphous phase. The concentration range of optically activeions was set to be 0.5–5 mol% to investigate the solubilitylevels and site occupancy preference. The calculated size ofparticles is strongly dependent on the sintering temperaturebeing 80 nm for Ca10(PO4)6Cl2 treated at 800 °C andincreases progressively with a temperature up to 180 nm.TEM images confirmed the nano nature of the final product,giving the value of the primary size of around 60 nm in drypowders and the value of the hydrodynamic size of 200 nmwhen dispersed in MQ-water without further stabilization. Infact, on one hand the influence of the dopant concentrationrelies on the observed formation of traces of the secondaryEuPO4 phase once the amount of Eu3+ exceeds 2 mol%achieving the critical solubility. On the other hand, based onthe luminescence properties of Eu3+ it has been found thatfor low concentration A site is preferentially substitutedwhereas increase of Eu3+ above 2 mol% results in dominationof the Eu3+ cations located at B site. A consecutive red shiftof the CT band with dopant concentration increase wasobserved, strongly evidencing an incorporation of Eu3+ ionsat B site. The analysis of the behavior of both 5D0 →
7F0 tran-sitions points out the domination of Eu3+ positioned at A sitefor low concentrated samples and B site at high amounts ofEu3+. It was also interesting to note that increase of thesintering temperature leads to increase of the intensity of5D0 → 7F0 line associated with Eu3+ at A site. Therefore aconclusion can be drawn that the site preference problem inmany types of materials might be solved using a relativelysimple analysis of luminescent properties of the Eu3+ cation.Based on the simplified J–O theory it was found that the mag-nitude of Ω2 and Ω4 parameters increases with the Eu3+ ionsconcentration. The mutual change of the asymmetry parame-ter R and Ω2 points out the increased distortion of the Eu3+
polyhedra as well as could be related to the change in theEu3+–O2− bond covalence increasing upon doping. The depen-dence of the Ω4 cannot be directly associated with thesymmetry changes of the Eu3+ ions but could give some infor-mation about changes of the electron density on the sur-rounding O2− anions influencing the position of the CT bandeventually. The mechanism of the concentration quenchingprocess was identified as a dipole–dipole interaction occur-ring within pairs of the Eu3+ ions above a certain criticalconcentration.
Acknowledgements
The authors would like to thank Ewa Bukowska for performingXRD measurements, Malgorzata Malecka for access to TEMinstrumentation as well Karolina Mokrzycka for help with
This journal is © The Royal Society of Chemistry 2014
sample synthesis. Financial support from the NationalScience Centre in course of realization of the Project ‘Nano-materials for fluorescence lifetimes bio-imaging (NFLBio)’(no. UMO-2012/06/M/ST5/00048) is gratefully acknowledged.
References
1 S. Santra, P. Zhang, K. Wang, R. Tapec and W. Tan, Anal.
Chem., 2001, 73, 4988.2 H. Zhang, X. J. Ye and J. S. Li, Biomed. Mater., 2009, 4, 45007.
3 A. Doat, F. Pelle, N. Gardant and A. Lebugle, J. Solid StateChem., 2004, 177, 1179.4 P. Martin, G. Carlot, A. Chevarier, C. Den-Auwer and
G. Panczer, J. Nucl. Mater., 1999, 275, 268–276.5 R. Sahoo, S. K. Bhattachary and R. Debnath, J. Solid State
Chem., 2003, 175, 218–225; and references therein.6 R. J. Wiglusz, A. Bednarkiewicz, A. Łukowiak and W. Stręk,
Spectrosc. Lett., 2010, 43, 333.7 R. J. Wiglusz, A. Kedziora, A. Lukowiak, W. Doroszkiewicz,
W. Strek and J. Biomedical, Nanotechnology, 2012, 8, 1.8 P. H. Schlesinger, H. C. Blair, S. L. Teitalbaum and
J. C. Edwards, J. Biol. Chem., 1997, 272, 18636.9 S. Kannan, A. Rebelo and J. M. F. Ferreira, J. Inorg. Biochem.,
2006, 100, 1692.10 M. Fleet, X. Liu and Y. Pan, Am. Mineral., 2000, 85, 1437.
11 G. K. Lim, J. Wang, S. C. Ng and L. M. Gan, J. Mater. Chem.,1999, 9, 1635.12 E. Jallot, H. Benhayoune, L. Kilian, J. L. Irigaray, G. Balossier
and P. Bonhomme, J. Phys. D: Appl. Phys., 2000, 33, 2775.13 J. Andersson, S. Areva, B. Spliethoff and M. Lindén,
Biomaterials, 2005, 26, 6827.14 Card No. 24237 ICDS, Fachinformationszentrum Karlsruhe, 2012.
15 Card No. 79752 ICDS, Fachinformationszentrum Karlsruhe, 2012. 16 R. D. Shannon, Acta Crystallogr., Sect. A: Cryst. Phys., Diffr.,Theor. Gen. Crystallogr., 1976, 32, 751.17 H. M. Rietveld, J. Appl. Crystallogr., 1969, 2, 65.
18 R. Delhez, T. H. de Keijser, J. I. Langford, D. Louër,E. J. Mittemeijer and E. J. Sonneveld, Crystal ImperfectionBroadening and Peak Shape in the Rietveld Method, in TheRietveld Method, ed. R. A. Young, Oxford Science, Oxford,United Kingdom, 1993, p. 132.
19 L. Luterotti and P. Scardi, J. Appl. Crystallogr., 1990, 23, 246.
20 L. Lutterotti, S. Matthies and H.-R. Wenk, IUCr: Newsletter ofthe CPD, 1999, vol. 21, p. 4.21 H. El Feki, M. Amami, A. Ben Salah and M. Jemal, Phys.
Status Solidi C, 2004, 1, 1985–1988.22 G. Montel, G. Bonel, J. C. Heughebaert, J. C. Trombe and
C. Rey, J. Cryst. Growth, 1981, 53, 74.23 J. Goldstein, D. Newbury, D. Joy, C. Lyman, P. Echlin,
E. Lifshin, L. Sawyer and J. Michel, Scanning electronmicroscopy and X-ray microanalysis, Springer, New York, 2007.
24 K. W. Powers, S. C. Brown, V. B. Krishna, S. C. Wasdo,
B. M. Moudgil and S. M. Robert, Toxicol. Sci., 2006, 90, 296.25 R. Pazik, E. Piasecka, M. Małecka, V. G. Kessler,
B. Idzikowski, Z. Śniadeckie and R. J. Wiglusz, RSC Adv.,2013, 3, 12230.CrystEngComm, 2014, 16, 5308–5318 | 5317

CrystEngCommPaper
26 R. J. Wiglusz, A. Watras, M. Malecka, P. J. Deren and
R. Pazik, Eur. J. Inorg. Chem., 2014, 6, 1090.27 G. Blasse, Structure and Bonding, Berlin, 1976, vol. 26, p. 43.
28 R. J. Wiglusz, R. Pazik, A. Łukowiak and W. Stręk, Inorg.Chem., 2011, 50, 1321.29 R. J. Wiglusz, T. Grzyb, A. Bednarkiewicz, S. Lis and
W. Strek, Eur. J. Inorg. Chem., 2012, 21, 3418.30 D. Hreniak, W. Strek, J. Amami, Y. Guyot, G. Boulon,
C. Goutadier and R. Pazik, J. Alloys Compd., 2004, 380, 348.31 R. Pazik, A. Watras, L. Macalik and P. J. Deren, New J.
Chem., 2014, 38, 1129.32 X. Wei, G. C. Jiang, Y. G. Qin, Y. H. Chen, C. K. Duan and
M. Yin, J. Lumin., 2014, 146, 371–375.33 J. C. G. Bünzli and G. R. Choppin, Lanthanide Probes in Life
Chemical and Earth Sciences. Theory and Practice, Elsevier,Amsterdam, 1979, ch. 35.
5318 | CrystEngComm, 2014, 16, 5308–5318
34 E. W. J. L. Oomen and A. M. A. van Dongen, J. Non-Cryst.
Solids, 1989, 111, 205.35 C. A. Kodaira, H. F. Brito, O. L. Malta and O. A. Serra,
J. Lumin., 2003, 101, 11.36 M. H. V. Werts, R. T. F. Jukers and J. W. Verhoeven, Phys.
Chem. Chem. Phys., 2002, 4, 1542.37 D. Hreniak, W. Strek, J. Amami, Y. Guyot, G. Boulon,
C. Goutaudier and R. Pazik, J. Alloys Compd., 2004, 380, 348.38 H. S. Kiliaan, J. F. A. K. Kotte and G. Blasse, Chem. Phys.
Lett., 1987, 133, 425.39 Y. Nageno, H. Takebe and K. Morinaga, J. Am. Ceram. Soc.,
1993, 76, 3081.40 R. Pazik, D. Hreniak, W. Strek, A. Speghinin and
M. Bettinelli, Opt. Mater., 2006, 28, 1284–1288.41 G. Blasse, Philips Res. Rep., 1969, 24, 131–144.
42 L. G. V. Uitert, J. Electrochem. Soc., 1967, 114, 1048–1053.This journal is © The Royal Society of Chemistry 2014