Preferences for Ethno-Cultural Foods in the Greater Toronto Area: A Market Research
77
Electronic copy available at: http://ssrn.com/abstract=1738475 1 PREFERENCES FOR ETHNO-CULTURAL FOODS IN THE GREATER TORONTO AREA: A MARKET RESEARCH Bamidele Adekunle 1 , Glen Filson 1* , & Sridharan Sethuratnam 2 1 School of Environmental Design and Rural Development, University of Guelph 2 Farm Start, Guelph * Corresponding Author: Tel: 519-824-4120 x56231 Email address: [email protected] May 2010
-
Upload
independent -
Category
Documents
-
view
2 -
download
0
Transcript of Preferences for Ethno-Cultural Foods in the Greater Toronto Area: A Market Research

Electronic copy available at: http://ssrn.com/abstract=1738475
1
PREFERENCES FOR ETHNO-CULTURAL FOODS IN THE GREATER TORONTO AREA:
A MARKET RESEARCH
Bamidele Adekunle1, Glen Filson
1*, & Sridharan Sethuratnam
2
1School of Environmental Design and Rural Development, University of Guelph
2Farm Start, Guelph
*Corresponding Author:
Tel: 519-824-4120 x56231
Email address: [email protected]
May 2010

Electronic copy available at: http://ssrn.com/abstract=1738475
2
Acknowledgements
The authors are grateful to the Ontario government for sponsoring this project through the
Ontario Market Investment Fund (OMIF). We appreciate the support of the Centre for Land and Water
Stewardship (CLAWS), Greater Toronto Area Agriculture Action Committee (GTAAAC), Toronto
Food Policy Council (TFPC) and FarmStart. We thank our research assistants; Joy Sammy , Pradip
Dey, Helena Kifle, Jason Tran, Asumani Serugendo, Dario Cidro, Keteh Amba, Nana Amponsem,
Kangethe Gitu, Nichele Palen and Jeremiah Saringe. We also thank Dr. Hakeem Olalekan Shittu for
his comments on both scientific and ethnic issues. Also deserving special commendation are the
cultural associations and respondents from the three ethnic groups that participated in this study. The
views expressed in this manuscript are the views of the authors and do not necessarily reflect those of
the funding organizations.

3
Table of Contents
Acknowledgements ................................................................................................................................... 2
Table of Contents ...................................................................................................................................... 3
List of Tables .......................................................................................... Error! Bookmark not defined.
Executive Summary .................................................................................................................................. 7
Chapter One: Introduction and Project Overview .................................................................................. 10
1.1 Introduction .............................................................................................................................. 10
1.2 Project Objectives and Benefits ............................................................................................... 10
1.2.1 Our project objectives were .............................................................................................. 10
1.2.2 Benefits of the Project ....................................................................................................... 11
1.3 Project Deliverables ................................................................................................................. 11
1.4 Overview of this Technical Report .......................................................................................... 12
1.5 Outreach ................................................................................................................................... 14
Chapter Two: Methods ........................................................................................................................... 16
2.1 Study design ............................................................................................................................. 16
2.2 Instrument................................................................................................................................. 16
2.3 Survey....................................................................................................................................... 17

4
2.4 Analysis .................................................................................................................................... 19
Chapter Three: Results ............................................................................................................................ 22
3.1 Description of the Respondents................................................................................................ 22
3.2 Consumption of Ethno cultural Vegetables ............................................................................. 33
3.3 Summary, Discussion and Conclusion ..................................................................................... 35
Chapter Four: Market Demand for Ethno-Cultural Vegetables .............................................................. 38
4.1 Preference for Ethnic Vegetables ............................................................................................. 38
4.2 Amounts Spent on Vegetables ................................................................................................. 42
4.3 Demands for Ethnic Vegetables ............................................................................................... 47
4.3.1 Demand Estimation: Chinese ............................................................................................ 47
4.3.2 Demand Estimation: Afro-Caribbean ............................................................................... 49
4.3.3 Demand Estimation: South Asian ..................................................................................... 50
Chapter Five: Conclusions, Recommendation and Future Directions .................................................... 52
5.1 Conclusions and Recommendations......................................................................................... 52
5.2 Future Directions ...................................................................................................................... 54
Documents Reviewed ............................................................................................................................. 55

5
Appendix I .............................................................................................................................................. 56
Appendix II ............................................................................................................................................. 66
Appendix III: List of Stores .................................................................................................................... 74
Appendix IV: List of Associations ......................................................................................................... 77

6
List of Tables
Table 1: Personal Characteristics of Respondents (2009)............................................................... 23
Table 2: Reasons for consumption of a significant amount of vegetables ...................................... 24
Table 3: Source of vegetables consumed by respondents ............................................................... 24
Table 4: Percentage of income spent on food ................................................................................. 25
Table 5: Percentage spent on vegetables out of food expenditure .................................................. 25
Table 6: Perception about health implication.................................................................................. 26
Table 7: Health implications mentioned by respondents ................................................................ 26
Table 8: Respondents place of purchase ......................................................................................... 27
Table 9: Reasons why consumers purchase in specific outlet ........................................................ 27
Table 10: Attributes that affect consumer‟s decision to purchase ethnic vegetables: Chinese ........ 28
Table 11: Attributes that affect consumer's decision to purchase ethnic vegetables: South Asia 28
Table 12: Attributes that affect consumer‟s decision to purchase ethnic vegetables: Afro-
Caribbean. ......................................................................................................................... 29
Table 13: Factors that can make respondents pay for more for ethnic vegetables ............................ 30
Table 14: Types of advertisement that can promote the sale of ethno-cultural vegetables .............. 31
Table 15: Acculturation: Analysis of each question...................................................................... 32
Table 16: Acculturation- Raw score………………………………………………………………33
Table 0-17: Ordinary Least Regression – Impact of Socio-economic variables on expenditure on
vegetables ........................................................................................................................ 34
Table 18: Average Amount Spent by Chinese Households (per month)......................................... 43
Table 19: Average Amount Spent by Afro-Caribbean Households (per month)…………………44
Table 20: Average Amount Spent by South Asian Households (per month) ................................... 46
7
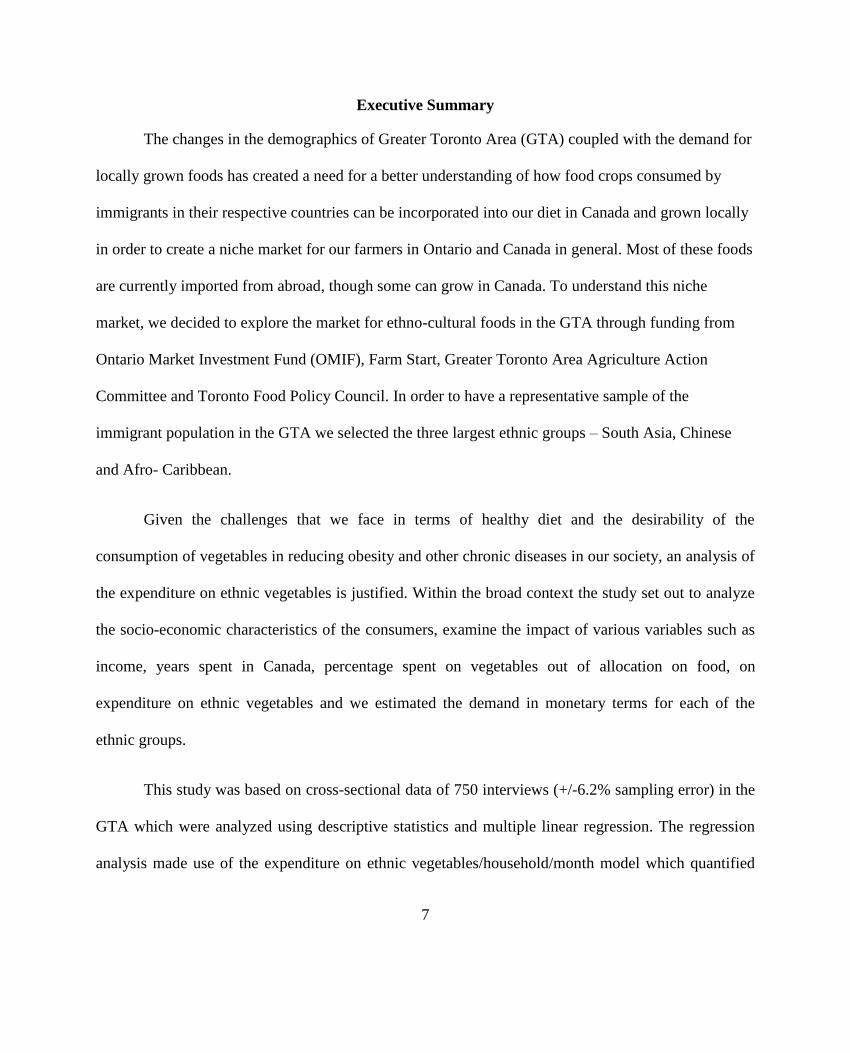
Executive Summary
The changes in the demographics of Greater Toronto Area (GTA) coupled with the demand for
locally grown foods has created a need for a better understanding of how food crops consumed by
immigrants in their respective countries can be incorporated into our diet in Canada and grown locally
in order to create a niche market for our farmers in Ontario and Canada in general. Most of these foods
are currently imported from abroad, though some can grow in Canada. To understand this niche
market, we decided to explore the market for ethno-cultural foods in the GTA through funding from
Ontario Market Investment Fund (OMIF), Farm Start, Greater Toronto Area Agriculture Action
Committee and Toronto Food Policy Council. In order to have a representative sample of the
immigrant population in the GTA we selected the three largest ethnic groups – South Asia, Chinese
and Afro- Caribbean.
Given the challenges that we face in terms of healthy diet and the desirability of the
consumption of vegetables in reducing obesity and other chronic diseases in our society, an analysis of
the expenditure on ethnic vegetables is justified. Within the broad context the study set out to analyze
the socio-economic characteristics of the consumers, examine the impact of various variables such as
income, years spent in Canada, percentage spent on vegetables out of allocation on food, on
expenditure on ethnic vegetables and we estimated the demand in monetary terms for each of the
ethnic groups.
This study was based on cross-sectional data of 750 interviews (+/-6.2% sampling error) in the
GTA which were analyzed using descriptive statistics and multiple linear regression. The regression
analysis made use of the expenditure on ethnic vegetables/household/month model which quantified

8
the relationships among variables that change across households. The results of the analysis showed
that there is high demand for fresh, locally grown ethno-cultural foods in the GTA. Most respondents
felt that the consumption of these vegetables is healthy and are willing to pay more if vegetables are
fresher and of better quality.
The average ages were Chinese (40.2 years), South Asia (42.8 years) and Afro Caribbean (39.1
years). Average household sizes were 3.5, 4.0, and 3.4 for Chinese, South Asia and Afro Caribbean
respectively. The total monthly incomes of our respondents were Chinese ($3723.12); South Asia
($2852.9); Afro-Caribbean ($3438.9). Most of the time, they purchase their ethnic vegetables at
supermarkets or ethnic grocery stores. Of these three main ethnic groups the Afro-Caribbeans spent the
least percentage of their total food expenditure on vegetables. The most important reasons for the place
of purchase were availability, proximity/location and price. The respondents also indicated that
advertisement, especially the print media, has a big impact on their expenditures.
The regression analysis indicated that income was significant in the Chinese and South Asian
model and not the Afro-Caribbean. For the Afro-Caribbeans it was the percentage spent on vegetables
that was significant. For the Chinese and South Asia model, income bears a positive relationship with
ethnic vegetable consumption indicating that households will increase their consumption as their
income increases. The reported income elasticities (0.95 for Chinese and 0.37 for South Asia) are
consistent with the theory that food is a necessity (normal good). Since income and percentage spent
on ethnic vegetables out of budget allocation for food affect household expenditure on ethnic
vegetables in the GTA, income enhancing policies will help to increase expenditure on and
consumption of ethnic vegetables.
9
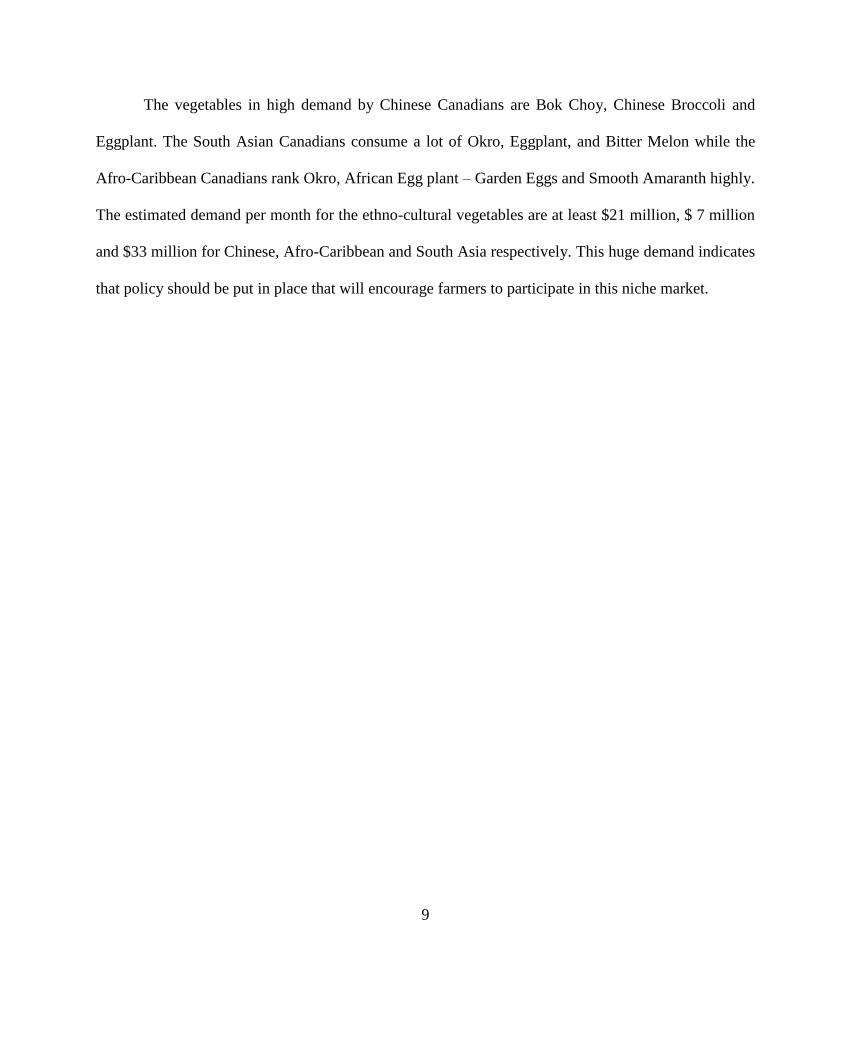
The vegetables in high demand by Chinese Canadians are Bok Choy, Chinese Broccoli and
Eggplant. The South Asian Canadians consume a lot of Okro, Eggplant, and Bitter Melon while the
Afro-Caribbean Canadians rank Okro, African Egg plant – Garden Eggs and Smooth Amaranth highly.
The estimated demand per month for the ethno-cultural vegetables are at least $21 million, $ 7 million
and $33 million for Chinese, Afro-Caribbean and South Asia respectively. This huge demand indicates
that policy should be put in place that will encourage farmers to participate in this niche market.

10
Chapter One: Introduction and Project Overview
1.1 Introduction
On May 4th
, 2009 the Director of the Centre for Land and Water Stewardship (CLAWS), Dr.
Stew Hilts, at the University of Guelph, received a letter from the then Minister of Agriculture, Food
and Rural Affairs indicating that our project entitled “Preferences for Ethno-Cultural Foods in the
Greater Toronto Area (GTA): A Market Research Project” was approved for funding under the
Ontario Market Investment Fund (OMIF). In fact, the administrative director of the project, Dr. Glen
Filson of the School of Environmental Design and Rural Development was the other lead applicant.
The Manager of the project was Dr. Bamidele Adekunle and we worked most closely with FarmStart‟s
representative, Mr. Sridharan Sethuratnum. Additional contributing partners in the research were the
Toronto Food Policy Council (TFPC) and the Greater Toronto Area‟s Agricultural Action Committee
(GTAAC) and our research assistants are listed in the Acknowledgements.
1.2 Project Objectives and Benefits
1.2.1 Our project objectives were:
1. To assess the preferences (purchasing behavior and product demand) of ethnic Canadians for their
indigenous food products.
2. To estimate the demand for ethno-cultural foods in the GTA.
3. Creation of awareness and access to market data on the market potential of ethno-cultural crops.
4. To prescribe appropriate policies that will lead to the production of ethno-cultural foods in the GTA
and environs.

11
1.2.2 Benefits of the Project
In our application we explained that this project was needed because the outputs will aid policy
makers in developing appropriate policy instruments that will encourage the production of ethno-
cultural foods in the GTA and other similar urban areas. The project was designed to conduct research
which will help produce valuable data on the market potential of ethno-cultural foods in terms of
dollars/quantity. We also reasoned that this research will provide the information which will help
farmers in Ontario to tap into the niche and lucrative ethno-cultural food market in the GTA region and
similar urban area and increase their income potential.
1.3 Project Deliverables
The project deliverables are:
1. Increased consumer awareness of local Ontario grown ethno-cultural (EC) foods;
2. Increased consumer propensity to purchase local Ontario foods once the results are known;
3. Increased consumer access to local Ontario foods once farmers are able to produce for this niche
market;
4. Thereby providing increased opportunities for Ontario food producers;
5. Which will generate increased number of business relationships between agricultural and food
industry sectors;
6. And this will lead to increased sales values and associated economic activity;
7. Based on increased identification of Ontario ethno-cultural crops.
Thus the project was conceived of as a win-win situation both for consumers who would be able to
access fresher vegetables of the kind that they prefer and for farmers who would be able to learn about

12
this market demand and begin producing vegetables of the kind demanded by these relatively more
recent immigrant groups.
1.4 Overview of this Technical Report
This report summarizes the major findings of this market research study and describes some of
the outreach activities that have begun to happen which are propagating the results to farmers and
consumers. Beyond what is stated above, one might ask why such a study is needed.
Canada had an overtly racist immigration policy until the point system was established in 1967.
Since this change, the demographic character of the country has changed significantly with increasing
numbers of immigrants coming from South Asia, China, Africa and the Caribbean among other
sources (see Hughes and Kallen, 1974). Approximately half of Torontonians were not born in Canada
and the demographic makeup of the GTA continues to evolve. This means that the demand for the
types of ethno-cultural foods hitherto largely unknown in Canada will continue to grow. This is
especially true of GTA which is the home of the largest percentage of immigrants to Canada, but it is
also increasingly true of Vancouver, Montreal and even areas like Saskatchewan that now experience
increased immigration from areas of the world previously excluded.
At present, despite importation, backyard gardening, and small scale ventures here and there
the newer ethnic groups to Canada find it difficult to obtain fresh fruits and vegetables of the type that
they were accustomed to eating. In order to find out more about what their consumer preferences for
vegetables are, we canvassed consumers who were members of ethnic associations and were
purchasing vegetables at ethnic stores by conducting face-to-face interviews with 250 South Asians,
250 Chinese and 250 Afro-Caribbean people. Our study design is elaborated in detail in Chapter
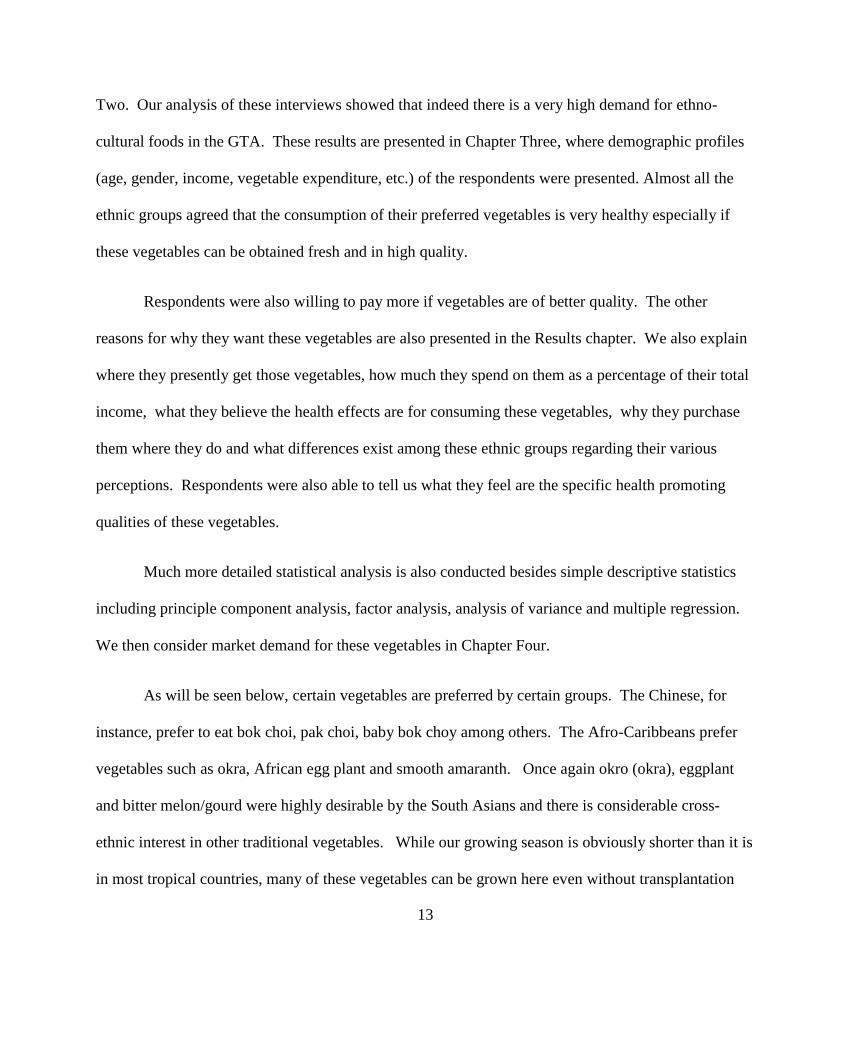
13
Two. Our analysis of these interviews showed that indeed there is a very high demand for ethno-
cultural foods in the GTA. These results are presented in Chapter Three, where demographic profiles
(age, gender, income, vegetable expenditure, etc.) of the respondents were presented. Almost all the
ethnic groups agreed that the consumption of their preferred vegetables is very healthy especially if
these vegetables can be obtained fresh and in high quality.
Respondents were also willing to pay more if vegetables are of better quality. The other
reasons for why they want these vegetables are also presented in the Results chapter. We also explain
where they presently get those vegetables, how much they spend on them as a percentage of their total
income, what they believe the health effects are for consuming these vegetables, why they purchase
them where they do and what differences exist among these ethnic groups regarding their various
perceptions. Respondents were also able to tell us what they feel are the specific health promoting
qualities of these vegetables.
Much more detailed statistical analysis is also conducted besides simple descriptive statistics
including principle component analysis, factor analysis, analysis of variance and multiple regression.
We then consider market demand for these vegetables in Chapter Four.
As will be seen below, certain vegetables are preferred by certain groups. The Chinese, for
instance, prefer to eat bok choi, pak choi, baby bok choy among others. The Afro-Caribbeans prefer
vegetables such as okra, African egg plant and smooth amaranth. Once again okro (okra), eggplant
and bitter melon/gourd were highly desirable by the South Asians and there is considerable cross-
ethnic interest in other traditional vegetables. While our growing season is obviously shorter than it is
in most tropical countries, many of these vegetables can be grown here even without transplantation

14
from a nursery or the use of greenhouses but of course both of the latter are possible as well. With a
greenhouse these vegetables can be grown throughout the year.
In the final chapter we summarize the main findings, discuss their significance for both
consumers and producers and then present some important policy recommendations to enhance the
local production and consumption of these health promoting vegetables. We then speculate about
what the future might hold for this market.
1.5 Outreach
We have maintained contact with CLAWS, FarmStart, the Toronto Food Policy Council
(TFPC) and the Greater Toronto Area Agricultural Action Committee (TFPC). We have visited
private farms and the Simcoe Research Centre (University of Guelph/OMAFRA) that are
experimenting with the growth of vegetables like bitter melon, Indian kaddu, okra and other ethno-
cultural vegetables. In August, we met with the TFPC and explained our research project to them. In
late November, 2009 we met with the GTAAAC and discussed our results with the farmers, planners,
AAFC and other municipal representatives on that committee. In March, Dr. Adekunle presented the
findings, Assessment of the Ethno-Cultural Foods Market, to the Bring Food Home conference in
Kitchener. Consumption of Ethno-Cultural foods by Chinese Canadians: A Socioeconomic Analysis
has been submitted to the Dutch journal Appetite for review and possible publication. A similar article
on Afro-Caribbeans‟ vegetable preferences is being written for publication in another journal. Then
we will write a third journal on South Asians‟ vegetable preferences for publication in still another
journal. We are hoping to produce a book with these articles as chapters and another chapter putting
them all together as below in this technical report for publication by a Canadian publisher. We have

15
met a number of University of Guelph and OMAFRA researchers as well as Dr. John Kelly of Erie
Innovation and Commercialization (Ontario Fruit and Vegetable Growers Association), Prof.
Gopinadhan Paliyath and Prof. Alan McKeown of Plant Agriculture, Dr. Rong Cao of AAFC, Dr.
Melanie Filotas, Dr. Sean Westerveld and Mr. Evan Elford of Simcoe Research Station‟s OMAFRA
Agricultural Development Branch among others who have joined with us in producing two proposals
for promoting the “Production of Alternative Vegetable Crops with Health Promoting Qualities:
Perception and Marketing, Product Development and Enhancement‟. We have also worked closely
with Mr. Ahmad Bilal, of OMAFRA at Vineland who, among others at the OMAFRA‟s Simcoe
Research Station have been assessing how plausible it is to grow some of these ethno-cultural
vegetables including Indian Kaddu, bitter melon, okro, etc. We will continue to try to fund and
promote the development of health promoting vegetables and improved market linkages between
consumers and producers. FarmStart has been using the data in its outreach work with farmers
including new Canadians throughout the GTA.

16
Chapter Two: Methods
2.1 Study design
This study is a market research project on the demand for ethno-cultural foods in the Greater
Toronto Area (GTA).The GTA is the most populous metropolitan area in Canada with a population of
close to six million. The regional municipalities in the GTA include Durham, Halton, Peel and York.
As a result of change in demographics a lot of people in the GTA were not born in Canada. The three
largest ethnic groups (South Asia, Chinese and South Asia) based on 2006 Census were selected for
this study. A total of 750 respondents with 250 from each ethnic group were interviewed using a semi-
structured questionnaire, developed after pre-testing and expert evaluation. The questionnaires were
administered through ethnic societies and ethnic stores in the GTA (see list in appendix). The stores
and societies selected for the survey were randomly selected from a list developed after several
consultations with stakeholders in the GTA and preliminary survey. Questionnaires were only
administered to respondents who were willing to participate and societies that wanted their members to
participate. The design was developed in a way that we were able to make inferences about the
population from the sample. The respondents were the main grocery buyers from their respective
households.
2.2 Instrument
The instrument used for the study was a semi-structured questionnaire. The questionnaire had
five sections: vegetable expenditure, consumption of ethnic vegetables, acculturation, background
information and personal characteristics of respondents. Some of the questions were Likert-type
questions ( 5=very important, 4=important, 3=neither important nor unimportant, 2=unimportant,

17
1=very unimportant) and for our scale on acculturation – Ethnic Canadian Dietary Acculturation Scale
(ECDAS). ECDAS is a seven-item scale with Likert type scale of 1-5, where 5=strongly agree,
4=agree, 3=neither agree nor disagree, 2=disagree and 1=strongly disagree. The ECDAS was used to
measure the level of acculturation of ethnic-Canadians. We tested for the reliability of the scale using
alpha-cronbach value. The other questions are either structured with minimum of two options (e.g
Yes/No) or open ended where the respondents provided the answers. The questionnaire and consent
process was approved by the Research and Ethics Board, University of Guelph.
2.3 Survey
Examining the behaviour of consumer requires a detailed understanding of the unit of analysis
and the phenomenon under study. As a result of this, we did an exploratory study (using a draft
questionnaire) to understand the behaviour of ethnic Canadians. The semi-structured questionnaire was
administered to respondents in Guelph. The five respondents used for the exploratory survey were
from India, Nigeria, China, Kenya and Ghana. Apart from pre-testing the questionnaire on these
individuals, in-depth interviews were also done with people with broad knowledge on ethnicity, food
consumption and types of ethnic vegetables. For clarity, we went a bit further to look at past studies on
ethnic consumption, acculturation, demand for local foods, medicine, pharmacy and botany.
Our exploratory survey gave us insight to the appropriate way that a survey on ethnic
Canadians can be done, a better understanding of what is a vegetable, sampling procedures, analytical
techniques, vegetables consumed by ethnic Canadians and the health implication of consuming ethnic
vegetables. In our exploratory survey, we discovered that to be able to make inferences about the
population from the sample, a probability sampling technique should be used to survey respondents.

18
Based on this premise, we used systematic sampling. Systematic sampling in this context is defined as
the situation where every nth person in a particular situation is interviewed even when there is no
sampling frame. Ethnic Canadians were selected through their ethnic associations (we discovered that
many, if not most non-English, non-French ethnic Canadians belong to one ethnic association or the
other) or interviewed when they come to shop at their ethnic grocery store (ethnic stores were selected
based on systematic purposive sampling). We had a comprehensive list of most of the ethnic stores in
the GTA, out of which we selected every third on the list for the survey. After pre-testing the
questionnaire in Guelph, an expert review (food, ethnicity and botany experts, ethnic individuals,
farmers, and public/private organizations) was done on the instrument. The final pre-testing we did
before the main survey was field pretesting – all our research assistants went to different stores in the
GTA to have the field experience. The research assistants were adequately trained on the ethical and
administrative issues involved with face-to-face administration of questionnaires. A total of 12
research assistants selected from the University of Guelph and from the different ethnic communities
were involved with the field survey and data entry.
The sample consisted of South Asians, Chinese and Afro-Caribbean living in the GTA. They
were selected randomly through the two approaches mentioned above. The survey was a cross-
sectional survey done in the summer/fall of 2009 through face-to-face interviews at the different ethnic
stores in the GTA and self-administration for members of ethnic associations. We did the survey with
the help of research assistants who have experience with the administration of questionnaire and some
familiarity with indigenous languages of most of the respondents. A total of 750 respondents were
used in this analysis out of a population of 834,880; 624,905; 372,985 for South Asia, Chinese and
Afro-Caribbean respectively. We had a sampling error of about +/– 6.2% for each of the groups, which

19
is reasonable because each respondent represented a household of average of four people and they
answered questions on behalf of their different households.
The cross-sectional survey posed some problems because the respondents had to rely on
memory to give information on their income and expenditure patterns. This is expected because most
of the respondents do not keep records. Some of the respondents were also reluctant to disclose their
monthly income. The research assistants had to ask a series of logically related questions to arrive at
estimates used in this study. Due to suspicion and non-chalant attitude of some respondents, questions
relating to demographics factors such as age, educational attainment, marital status and income were
also viewed as probing. As a result of all these challenges, some of the variables used in the model
were either underestimated or over estimated. This does not invalidate the conclusions of the study
because of the fact that there is a compensatory effect across respondents and households.
2.4 Analysis
Descriptive statistics, principal component analysis, Ordinary Least Square (OLS) regression
were used to examine the relationship between the socio-economic characteristics of respondents and
consumption. The ECDAS was tested for reliability and uni-dimesionality by the use of Cronbach‟s
alpha. Principal component analysis was used to assess the factors that underlie consumers‟ decision to
purchase ethnic vegetables at a particular location based on commonalities. Since the study was done
through a probability sampling technique, inference about the population can be made from the
sample. Descriptive statistics such as frequencies and means was used to describe the characteristics of
respondents and their consumption of and expenditure on ethnic vegetables. Analysis of Variance was
used to compare the means of the ethnic groups covered by the study. A model of consumption

20
expenditure was developed to identify the factors that determine the consumption of / expenditure on
ethnic vegetables. The elasticity of income was estimated when significant and used in the further
explanation. Three functional forms (Linear, Semi-Log, and Double Log) were estimated and the best
fit was the linear functional form based on R2, t-values/standard error and „reasonableness‟ of the
parameter estimates (Adekunle, 1998). The model used for the study was specified as seen in equation
1.
Cd = (Χ1, Χ2, Χ3, Χ4, Χ5, Χ6, Χ7, Χ8, µ) (1)
The estimated demand function for the ethnic vegetables in the GTA as specified for this study is of
the form in (1). This can be written in linear form as:
Cd = 0 + 1Χ1 + 2 Χ2 + 3 Χ3 + 4 Χ4 + 5 Χ5 + 6 Χ6 + 7 Χ7 + 8Χ8 + µ (2) Where
Cd = Expenditure on ethnic vegetables per month
Χ1 = Total monthly income
Χ2= Number of people in the household
Χ3 = Age of respondents
Χ4 = Years spent in Canada
Χ5= Percentage spent on vegetables out of amount spent on food
Χ6 = Acculturation
Χ7 = Gender
Χ8 = Education
i = Parameter estimates (i = 0, 1, 2, 3, 4, 5, 6, 7, 8)
µ = Error term (disturbance term)

21
The main property of the linear function which had the best fit out of the three functional forms is that
it is obviously very simple. The marginal propensity to consume is the 1 and the income elasticity of
demand is .
Another important part of the analysis is the estimation of market demand for the preferred vegetables
discovered from the descriptive analysis of the dataset. To estimate the demand for a particular
vegetable, the authors used the approach below:
Assume vegetable y is preferred by the respondents and the monthly expenditure per household
on y is Xy. In this case, the average monthly expenditure per household (Xa) will be (Σ Xy) ⁄ N. In the
equation above, (Σ Xy) is the summation of the monthly expenditure for the whole sample and N is the
sample size. Once the average monthly expenditure (Xa) is estimated, the yearly expenditure can be
calculated by multiplying by the number of months in a year. In other words:
Xay (average annual expenditure) = Xa * 12 (This equation assumes that there are 12 months in a year
and respondents purchase vegetables throughout the year).
Once Xay is estimated, the market demand in terms of monetary values can be calculated. Let
us assume that the population of Chinese in the GTA at a given year (i) is Ci, and the average
household size from the survey (s) is Hs, then the number of Chinese households for the period (i) and
as a result of survey (s) will be Ci ⁄ Hs. Finally, the demand for a vegetable (y) by the Chinese ethnic
group in monetary terms will be Xay * (Ci ⁄ Hs).

22
Chapter Three: Results
This chapter presents the result of analysis of the 750 dataset collected from different ethno-
cultural groups in the summer / fall of 2009. We have three sections in this chapter. Section 1 is the
description of the responses of the respondents, section 2 presents factors that affect consumption of
ethno-cultural vegetables and estimation of elasticities and the final section (section 3) discusses the
implication of results on decision making in the food market as it relates to the GTA, Ontario and
Canada in general.
3.1 Description of the Respondents
This section describes the socio-economic characteristics of the respondents and their
interaction with other variables that are relevant when it comes to their consumption of ethno cultural
foods. Table 1 describes the general characteristics of the respondents based on their ethnicity.

23
Table 01: Personal Characteristics of Respondents (2009)
Characteristics of the study
population
Chinese South Asia Afro-Caribbean
Gender
Male 97 (38.8%) 145 (58.7%) 140 (56.7%)
Female 153 (61.2%) 102 (41.3%) 107 (43.3%)
Marital status
Married 171 (69.0%) 215 (87.4%) 136 (56.4%)
Single 65 (26.2%) 24 (9.8%) 86 (35.7%)
Divorced 9 (3.6%) 5 (2.0%) 15 (6.2%)
Widowed 3 (1.2%) 2 (0.8%) 4 (1.7%)
Highest educational attainment
No formal education 2 (0.8%) 4 (1.6%) Not Applicable
Primary education 4 (1.6%) 3 (1.2%) 3 (1.3%)
High school 55 (22.0%) 49 (19.8%) 53 (22.2%)
College diploma 62 (25.0%) 48 (19.4%) 91 (38.1%)
University degree 125 (50.4%) 143 (57.4%) 92 (38.5%)
Average age of the
respondents
40.2 years
(16-70)
42.8 years (14-81)
39.1 years (18-75)
Average household size
3.5 (1-8)
4.0 (1-8)
3.4 (1-8)
Average total monthly income
$3723.12
$2852.9
$3438.9

24
Most of the respondents 647 (86.3%) consume a significant amount of vegetables. The reasons for
consumption are in Table 2.
Table 2: Reasons for consumption of a significant amount of vegetables
Chinese South Asia Afro-Caribbean Total
It is healthy 99 (48.3%) 101 (48.1%) 124 (66.0%) 324(53.7%)
Nutritious 21(10.2%) 12 (5.7%) 19 (10.1%) 52 (8.6%)
Likes Vegetables
(Preference)
28 (13.7%) 26 (12.4%) 27 (14.4%) 81 (13.4%)
Tradition/Culture 31(15.1%) 22 (10.5%) 8 (4.3%) 61 (10.1%)
Medicinal 14 (6.8%) 2 (1.0%) - 16 (2.6%)
Vegetarian 2 (1.0%) 45 (21.4%) 5 (2.7%) 52 (8.6%)
Taste 10 (4.9%) 2 (1.0%) 5 (2.7%) 17 (2.8%)
Total 205 (100.0%) 210 (100.0%) 188 (100.0%) 603 (100.0%)
The respondents purchase the vegetables they consume from various places presented in Table 3
below.
Table 03: Source of vegetables consumed by respondents
Chinese South Asia Afro-Caribbean
My farm or garden 18 (7.2%) 14 (5.6%) 18 (7.2%)
Farmers' market 29 (11.6%) 27 (10.9%) 43 (17.2%)
Supermarket 194 (77.6%) 190 (76.6%) 190 (76.0%)
Ethnic grocery store 203 (81.5%) 187 (75.4%) 120 (48.0%)
The major quality that respondents like about vegetables is freshness 574 (81.7%). And 554 (74.6%)
are satisfied with the quality of vegetables currently available. Nevertheless, some were still
dissatisfied with the current quality standards; 75 (10%) were not satisfied. The type of quality
improvement that consumers want to see is in freshness 250 (33.3%).
The percentage of household income spent on food in general is presented in Table 4.

25
Table 4: Percentage of income spent on food
Chinese South Asia Afro-Caribbean Total
Less than 14% 76 (30.5%) 40 (16.1%) 51 (20.6%) 167 (22.4%)
15%-24% 113 (45.4%) 124 (49.8%) 98 (39.5%) 335 (44.9%)
more than 25% 60 (24.1%) 85 (34.1%) 99 (39.9%) 244 (32.7%)
Total 249 (100.0%) 249 (100.0%) 248 (100.0%) 746 (100.0%)
The proportion of expenditure on vegetables out of the amount each household allocate for food is in
Table 5. The result indicates that Chinese spend a higher percentage on vegetables as compared to
other groups.
Table 5: Percentage spent on vegetables out of food expenditure
Ethnicity Mean Standard deviation
Chinese 38.95 20.42
South Asia 30.30 19.02
Afro-Caribbean 18.44 16.47
Respondents indicated that some vegetables are not available in their area. These include Bamboo
shoots, Fuzzy melon, Okra, Eggplant and Snow pea for the Chinese group. In the case of the South
Asians, the scarce vegetables are Cocoyam, Drumstick, Indian Squash, Okro, Pumpkin and Pointed
gourd. African egg plant, Bitter leaf, Cassava, Cocoyam, Okro, and Smooth Amaranth are the crops
that the Afro-Caribbeans want and are most of the time difficult to procure.
There is a general perception that the consumption of vegetables has health implications (Table 6)

26
Table 6: Perception about health implication
Ethnicity Positive about the health implication
Chinese 232 (92.8%)
South Asia 197 (81.7%)
Afro-Caribbean 201 (84.1%)
The benefits of consuming ethnic vegetables as perceived by the three main ethno-cultural groups in
the GTA are in Table 7.
Table 7: Health implications mentioned by respondents
Health Implication Chinese South Asia Afro-Caribbean
Reduces constipation and is a source of good fibre 49 (22.6%) 15 (9.7%) 36 (19.9%)
Prevent chronic diseases (e.g Cancer, Heart
Problems, Blood Pressure, Diabetes)
49 (22.6%)
47 (30.3%)
32 (17.7%)
Contain anti-oxidants 16 (7.4%) 3 (1.9%) 8 (4.4%)
Increases lifespan 28 (12.9%) 2 (1.3%) 7 (3.9%)
Prevents obesity 17 (7.8%) 8 (5.2%) 11 (6.1%)
Contains vitamins, minerals and proteins 80 (36.9%) 28 (18.1%) 43 (23.8%)
Lesser medical expenses / good immune system 77 (35.5%) 1 (0.6%) 45 (24.9%)
Good eyesight 6 (2.8%) 14 (9.1%) 5 (2.8%)
Healthy diet 72 (33.2%) 73 (47.4%) 52 (28.7%)
Healthy skin 5 (2.3%) 9 (5.8%) 9 (5.0%)
A critical look at the place of purchase indicates that the Chinese-Canadians purchase most of their
vegetables from ethnic supermarkets while the South Asians and Afro-Caribbean purchase a
substantial amount of their vegetables from small ethnic stores (Table 8).
27
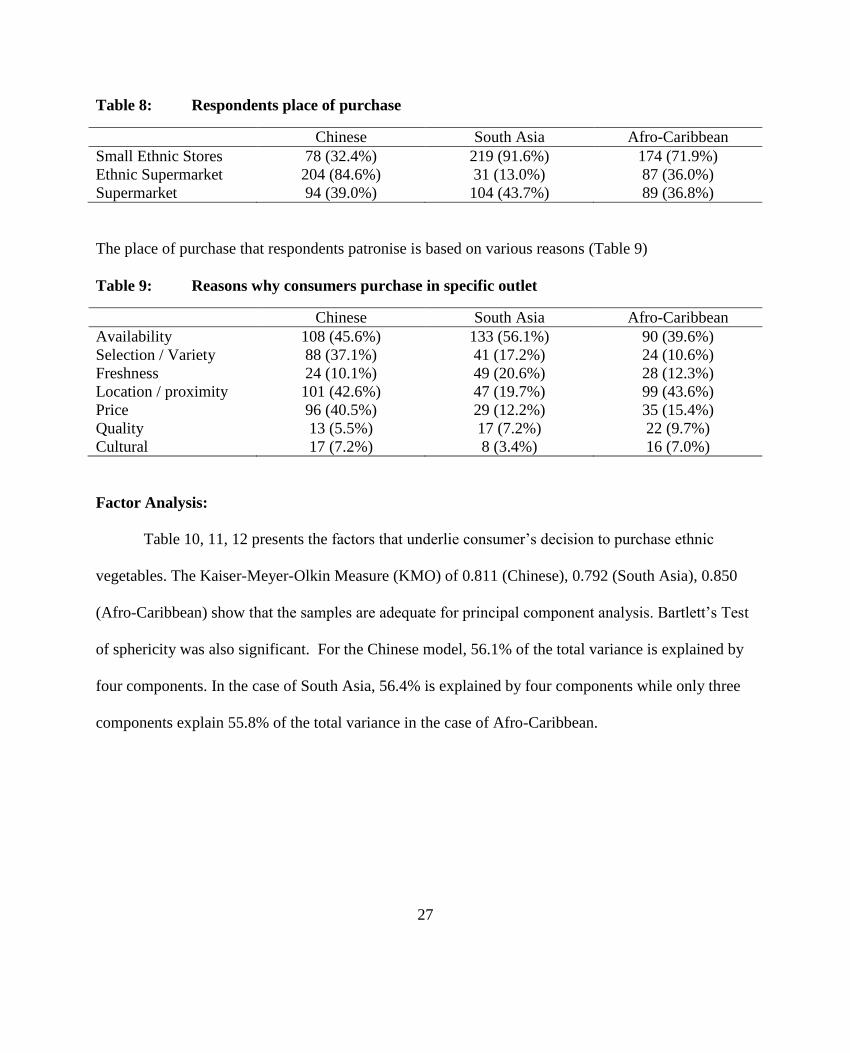
Table 8: Respondents place of purchase
Chinese South Asia Afro-Caribbean
Small Ethnic Stores 78 (32.4%) 219 (91.6%) 174 (71.9%)
Ethnic Supermarket 204 (84.6%) 31 (13.0%) 87 (36.0%)
Supermarket 94 (39.0%) 104 (43.7%) 89 (36.8%)
The place of purchase that respondents patronise is based on various reasons (Table 9)
Table 9: Reasons why consumers purchase in specific outlet
Chinese South Asia Afro-Caribbean
Availability 108 (45.6%) 133 (56.1%) 90 (39.6%)
Selection / Variety 88 (37.1%) 41 (17.2%) 24 (10.6%)
Freshness 24 (10.1%) 49 (20.6%) 28 (12.3%)
Location / proximity 101 (42.6%) 47 (19.7%) 99 (43.6%)
Price 96 (40.5%) 29 (12.2%) 35 (15.4%)
Quality 13 (5.5%) 17 (7.2%) 22 (9.7%)
Cultural 17 (7.2%) 8 (3.4%) 16 (7.0%)
Factor Analysis:
Table 10, 11, 12 presents the factors that underlie consumer‟s decision to purchase ethnic
vegetables. The Kaiser-Meyer-Olkin Measure (KMO) of 0.811 (Chinese), 0.792 (South Asia), 0.850
(Afro-Caribbean) show that the samples are adequate for principal component analysis. Bartlett‟s Test
of sphericity was also significant. For the Chinese model, 56.1% of the total variance is explained by
four components. In the case of South Asia, 56.4% is explained by four components while only three
components explain 55.8% of the total variance in the case of Afro-Caribbean.

28
Table 10: Attributes that affect consumer’s decision to purchase ethnic vegetables: Chinese
Factor Quality/freshness Traceable
production
Versatility Language
Quality 0.816 0.068 0.109 0.028
Freshness 0.808 0.130 0.093 -0.013
Method of
production
0.126 0.770 0.030 0.218
Origin of food 0.115 0.721 -0.057 0.223
Grown in
Ontario
-0.096 0.697 0.346 -0.080
Preservation
method
0.278 0.678 0.107 0.051
Easy to cook 0.241 0.156 0.789 0.192
Versatility 0.135 0.107 0.771 0.222
Language -0.049 0.170 0.051 0.724
Extraction Method: Principal Component Analysis.
Rotation Method: Varimax with Kaiser Normalization.
Table 11: Attributes that affect consumer’s decision to purchase ethnic vegetables: South
Asia
Factor 1 2 3 4
Method of
production 0.771 0.117 0.150 0.181
Origin of food 0.729 0.206 -0.002 0.043
Easy to cook 0.040 0.804 -0.039 0.135
Versatility 0.178 0.751 0.114 0.075
Quality 0.015 -0.036 0.887 0.112
Freshness 0.073 0.031 0.871 0.057
Price 0.074 0.066 0.113 0.689
Extraction Method: Principal Component Analysis.
Rotation Method: Varimax with Kaiser Normalization.
29
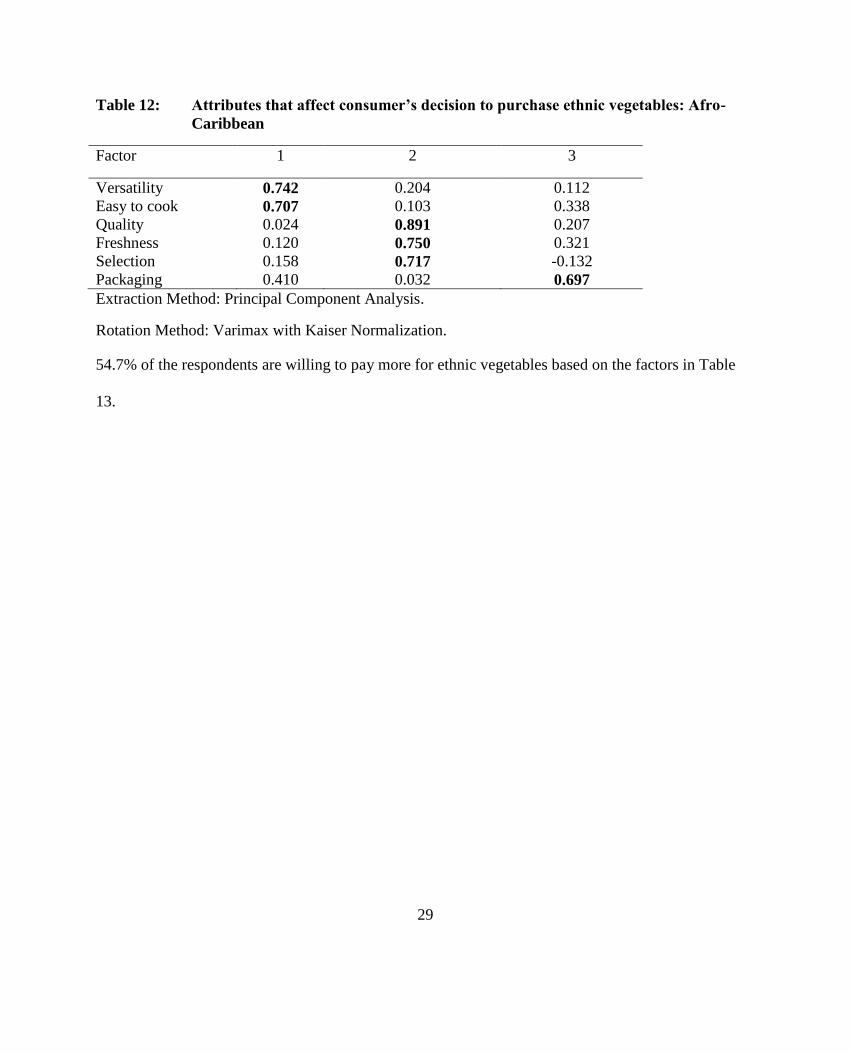
Table 12: Attributes that affect consumer’s decision to purchase ethnic vegetables: Afro-
Caribbean
Factor 1 2 3
Versatility 0.742 0.204 0.112
Easy to cook 0.707 0.103 0.338
Quality 0.024 0.891 0.207
Freshness 0.120 0.750 0.321
Selection 0.158 0.717 -0.132
Packaging 0.410 0.032 0.697
Extraction Method: Principal Component Analysis.
Rotation Method: Varimax with Kaiser Normalization.
54.7% of the respondents are willing to pay more for ethnic vegetables based on the factors in Table
13.

30
Table 13: Factors that can make respondents pay for more for ethnic vegetables
Factor Chinese South Asia Afro-Caribbean
Freshness 31 (25.2%) 18 (13.4%) 18 (11.7%)
Organic 8 (6.5%) 4 (3.0%) 6 (3.9%)
Locally grown 9 (7.3%) 4 (3.0%) 3 (1.9%)
Availability 11 (8.9%) 15 (11.2%) 22 (14.3%)
Better quality / Taste 51 (41.5%) 42 (31.3%) 33 (21.4%)
Health benefits 26 (21.1%) 19 (14.3%) 16 (10.3%)
Staple / Regular diet 38 (30.9%) 16 (12.0%) 33 (21.4%)
Cultural 25 (20.3%) 29 (21.8%) 11 (7.1%)
Scarcity 3 (2.4%) 1 (0.8%) 7 (4.5%)
Imported from country
of origin
3 (2.4%) 18 (13.5%) 10 (6.5%)
The role of advertisement in the marketing of ethno-cultural foods was deemed relevant by 52% of our
respondents. The type of advertisements recognised by the consumers is in Table 14.
31
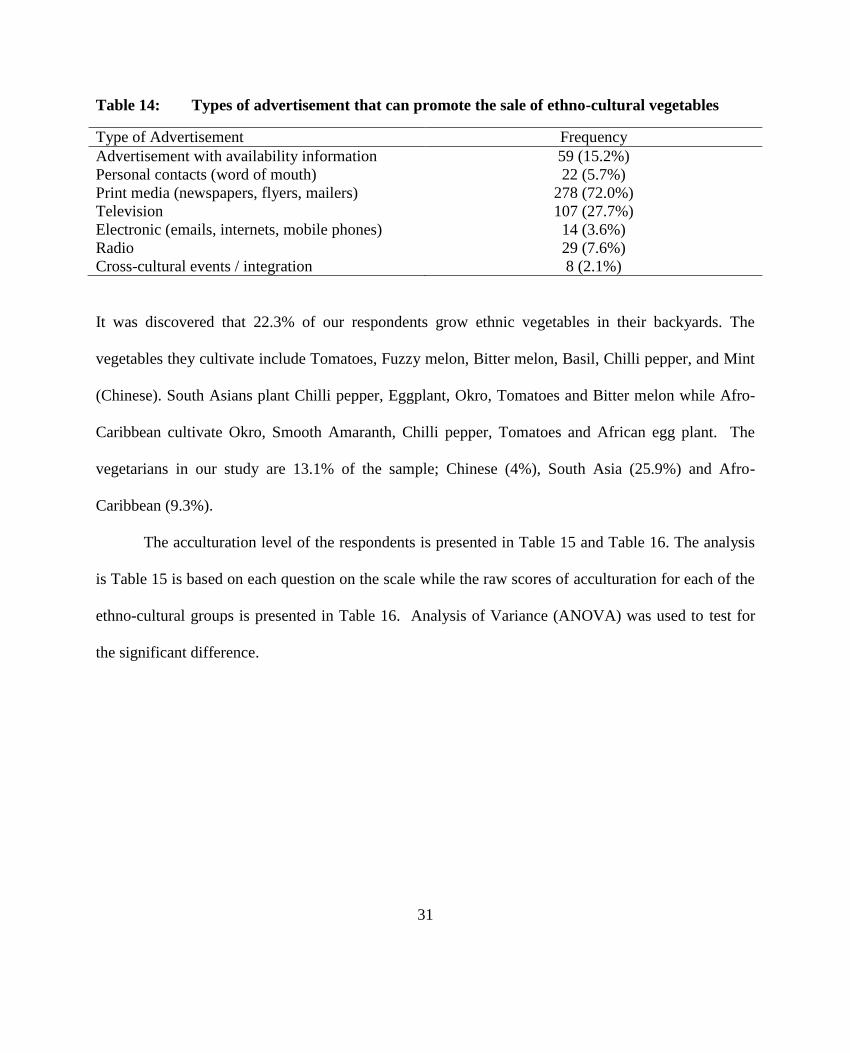
Table 14: Types of advertisement that can promote the sale of ethno-cultural vegetables
Type of Advertisement Frequency
Advertisement with availability information 59 (15.2%)
Personal contacts (word of mouth) 22 (5.7%)
Print media (newspapers, flyers, mailers) 278 (72.0%)
Television 107 (27.7%)
Electronic (emails, internets, mobile phones) 14 (3.6%)
Radio 29 (7.6%)
Cross-cultural events / integration 8 (2.1%)
It was discovered that 22.3% of our respondents grow ethnic vegetables in their backyards. The
vegetables they cultivate include Tomatoes, Fuzzy melon, Bitter melon, Basil, Chilli pepper, and Mint
(Chinese). South Asians plant Chilli pepper, Eggplant, Okro, Tomatoes and Bitter melon while Afro-
Caribbean cultivate Okro, Smooth Amaranth, Chilli pepper, Tomatoes and African egg plant. The
vegetarians in our study are 13.1% of the sample; Chinese (4%), South Asia (25.9%) and Afro-
Caribbean (9.3%).
The acculturation level of the respondents is presented in Table 15 and Table 16. The analysis
is Table 15 is based on each question on the scale while the raw scores of acculturation for each of the
ethno-cultural groups is presented in Table 16. Analysis of Variance (ANOVA) was used to test for
the significant difference.

32
Table 15: Acculturation: Analysis of each question
Statement Ethnicity Mean (S.D) F Sig
I enjoy speaking
English
Chinese 4.08 (0.77) 13.58 .000
South Asia 4.21 (0.74)
Afro-Caribbean 4.42 (0.73)
Total 4.24 (0.76)
Most of my
friends are outside
my ethnic group
Chinese 2.99 (1.07) 6.01 .003
South Asia 3.27 (0.93)
Afro-Caribbean 3.28 (1.17)
Total 3.18 (1.07)
I enjoy English
language movies
and TV
programmes
Chinese 3.98 (0.82) 9.26 .000
South Asia 3.88 (0.85)
Afro-Caribbean 4.20 (0.88)
Total 4.02 (0.86)
I learn a lot from
people outside my
ethnic group
Chinese 3.91 (0.80) 10.45 .000
South Asia 4.05 (0.71)
Afro-Caribbean 4.22 (0.77)
Total 4.06 (0.77)
I welcome most of
the values held by
people outside my
ethnic group
Chinese 4.00 (0.73) 2.23 .109
South Asia 3.93 (0.76)
Afro-Caribbean 4.08 (0.83)
Total 4.00 (0.78)
I have difficulty
accepting most of
the values held by
my ethnic group
Chinese 2.33 (0.94) 1.31 .271
South Asia 2.35 (0.85)
Afro-Caribbean 2.22 (0.97)
Total 2.30 (0.92)
I prefer food that
are not my ethnic
food
Chinese 2.66 (0.95) 4.39 .013

33
South Asia 2.64 (0.88)
Afro-Caribbean 2.44 (0.97)
Total 2.58 (0.94)
Using ANOVA, we discovered that there is no significant difference in the acculturation level of the
different ethno-cultural groups (Table 16). The Acculturation scale has an Alpha Cronbach value of
0.56, an indication that the scale is reliable.
Table 16: Acculturation – Raw score
Ethnicity Mean F Sig
Chinese 23.95 0.64 0.53
South Africa 23.93
Afro-Caribbean 24.30
Total 24.06
Finally, only 52 (6.9%) of our respondents were born in Canada.
3.2 Consumption of Ethno cultural Vegetables
The estimation of the model stipulated in chapter 2 was analyzed using three functional forms.
The functional forms used were simple linear, semilog and double log. Out of the three functional
forms tried, the linear functional form was selected based on R2, the F statistics, t-values and the
reasonableness of the estimated parameters. The regression results are presented below:

34
Table 0-17: Ordinary Least Regression – Impact of Socio-economic variables on expenditure
on vegetables
Variable Chinese
N= 250
South Asia
N= 250
Afro-Caribbean
N=250
Intercept 14.27 (103.88) 68.40 (102.24) 44.37 (46.51)
Total monthly income 0.03**
(0.01) 0.02**
(0.005) 0.004 (0.003)
Number of people in
the household
7.60 (8.79) 6.29 (7.09) 2.77 (3.77)
Age of respondents 0.94 (1.14) 0.23 (0.95) -0.01 (0.51)
Years spent in Canada -2.83**
(1.13) 0.66 (1.28) -0.38 (0.62)
Percentage spent on
vegetables out of
amount spent on food
2.30**
(0.58) 0.78 (0.52) 0.99**
(0.36)
Acculturation -3.79 (3.50) -1.63 (3.53) -0.31 (1.35)
Gender -0.27 (23.44) 15.58 (22.23) 0.24 (11.96)
Education -35.05 (25.64) 20.67 (21.18) -5.75 (12.43)
R2 0.29 0.18 0.11
** Significant at 5%
The regression results showed that the sign on the coefficients are all consistent with apriori
postulations. In the Chinese model, monthly income, years spent in Canada and the percentage spent
on vegetables out of amount spent on food were all significant at 5%. Only income was significant in
the case of South Asia while percentage spent on vegetables out of amount spent on food was the only
variable that affects the expenditure of Afro-Caribbean on ethnic vegetables. The low R2
in the three

35
models (0.29, 0.18, and 0.11) is a general problem with cross-sectional studies. The regression result
indicates that an increase in monthly income will lead to an increase in the expenditure on ethnic
vegetables for both Chinese and South Asia ethnic groups. The income elasticity of demand was 0.95
for Chinese and 0.37 for South Asia (formula presented in chapter 2). The implication of this is that
vegetables are normal goods and a necessity for these groups. In other words, they will always
continue to buy these food crops. An income elasticity of 0.95 for the Chinese indicates that a 10%
increase in respondent‟s monthly income will lead to a 9.5% increase in expenditure on their ethnic
vegetables. In the case of South Asia, an elasticity of 0.37 indicates that a 10% increase in income will
lead to a 3.7% increase in expenditure on South Asian vegetables. These results imply that expenditure
on both Chinese and South Asian vegetables is income inelastic.
Years spent in Canada was also significant explanatory variables in the Chinese model. A value
of -2.83 indicates that an increase in the number of years by a year will lead to a decrease in
expenditure on Chinese ethnic vegetables by 2.83 units. Percentage spent on vegetables out of the
amount spent on food was also a significant variable in the Chinese and Afro-Caribbean model. A one
percentage increase will lead to an increase in expenditure of 2.30 units in the case of Chinese and
0.99 in the case of Afro-Caribbean. This shows that what decides expenditure on ethnic vegetables in
the case of Afro-Caribbean is not income but the amount they allocate to vegetables out of their
expenditure on food.
3.3 Summary, Discussion and Conclusion
Given the challenges that we face in terms of healthy diet and the desirability of the
consumption of vegetables in reducing obesity and other chronic diseases in our society, an analysis of

36
the expenditure on ethnic vegetables is justified. This is so because it provides facts and figures which
will improve our present understanding of the socio-economic factors affecting the preferences of
ethnic Canadians for ethno-cultural foods in the GTA. Evidence provided from this study will be
useful to programme planners and policy formulators in their efforts to correctly steer the direction of
development and improve the welfare of people (consumers and producers) in the GTA, Ontario and
Canada in general. Within the broad context, the study set out to analyse the socio- economic
characteristics of consumers, examine the impact of various variable such as income, years spent in
Canada and percentage spent on vegetables out of allocation on food on expenditure on ethnic
vegetables. Later in Chapter Four, we estimated the demand in monetary terms for each of the ethnic
groups.
This study was based on a cross-sectional data which was subjected to rigorous analysis using
descriptive statistics and multiple regression (linear was the best out of the three functional forms –
linear, double and semi-log). The regression analysis made use of the expenditure on ethnic
vegetables/household/month model which quantified the relationships among variables which change
across households. The results of the analysis showed that there is high demand for fresh, locally
grown ethno-cultural foods in the GTA. Most respondents feel that the consumption of these
vegetables is healthy and are willing to pay more if vegetables are of better quality.
The average ages were Chinese (40.2 years), South Asia (42.8 years) and Afro Caribbean (39.1
years). Average household sizes were 3.5, 4.0, and 3.4 for Chinese, South Asia and Afro Caribbean
respectively. The total monthly incomes of our respondents were Chinese ($3723.12); South Asia
($2852.9); Afro Caribbean ($3438.9). Most of the time, they purchase their ethnic vegetables at

37
supermarkets or ethnic grocery stores. Out of the three ethnic groups the Afro-Caribbean spent the
least percentage out of their expenditure on food on vegetables. The most important reasons for the
place of purchase were availability, proximity/location and price. The respondents also indicated that
advertisement especially the print media has a lot of effect on their expenditure decisions.
The regression analysis indicated that income was significant in the Chinese and South Asian
model and not the Afro-Caribbean. For the latter, it was rather the percentage spent on vegetables that
was significant. For the Chinese and South Asia model, income bears a positive relationship with
ethnic vegetables consumption indicating that household will increase their consumption as their
income increases. The reported income elasticities (0.95 for Chinese and 0.37 for South Asia) are
consistent with the theory that food is a necessity (normal good).
Since income and percentage spent on ethnic vegetables out of budget allocation for food affect
household expenditure on ethnic vegetables in the GTA, income enhancing policies will help to
increase expenditure on and consumption of ethnic vegetables.

38
Chapter Four: Market Demand for Ethno-Cultural Vegetables
This chapter lists the highly preferred vegetables by the three ethnic groups, the amount spent
per month and an estimation of the total monthly demand for these vegetables.
4.1 Preference for Ethnic Vegetables
After a thorough analysis using both ranking by respondents and number of times a particular
vegetable is mentioned in the question „List 10 ethnic vegetables that you usually purchase and the
amount you pay per week/month‟. We were able to identify 13 highly preferred vegetables for each of
the ethnic groups.
The thirteen top ranked vegetables for Chinese Canadians were:
A. Highly Preferred Vegetables by Chinese Canadians
1. Bok Choy / Pak Choy/Baby Bok choy ( Brassica rapa sub-specie : chinensis): Chinese
Cabbage –Bok choy (Cantonese), Xiao bai cai/ Bai cai (Mandarin), Taiwan Bok Choy
2. Chinese Broccoli (Brassica oleracea : Alboglabra Group) – Gai lan/Kai lan/Gai lon , Chinese
Kale
3. Eggplant (Solanum melongena) – Aubergine, Brinjal – Various varieties based on colour and
shape identified.
4. Chinese Greens (Choy Sum) ( Brassica rapa sub-specie : chinensis): Chinese Cabbage – Yu
choy [ You cai, Cai hua(Mandarin), Yai tsoi (Cantonese)] , Cai xin, Hokkien chai sim,
Flowering Chinese Cabbage
5. Tomatoes (Solanum lycopersicum, syn. Lycopersicon lycopersicum & Lycopersicon
esculentum)

39
6. Napa Cabbage ( Brassica rapa subsp. pekinensis) : Chinese Cabbage – Wong nga pak
(Cantonese), Da bai cai (Mandarin)
7. Green Beans (Phaseolus vulgaris) – Phalli (India), Chinese green beans
8. Celery ( Apium graveolens var. dulce / rapaceum) – Chinese variety
9. Spinach (Spinacia oleracea) – Palongshak (Bengali)
10. Carrots (Daucus carota ) – Gajja ( India)
11. Bitter Melon / Bitter Gourd (Momordica charantia) - Karela (India), Kugua (China), Carilla,
Balsamino, Saraseed (Caribbean)
12. Broccoli (Brassica oleracea : Italica Group)
13. Lettuce (Lactuca sativa) – Romaine Lettuce, Red Lettuce
The thirteen top ranked vegetables for Afro- Carribean Canadians were:
B. Highly Preferred Vegetables by Afro-Caribbean Canadians
1. Okro (Abelmoschus esculentus) – Lady finger, Bhindi (India), Ila (SW Nigeria), Huang Sukui
(China), Gumbo(Swahili)
2. African Egg plant – Garden Eggs ( Solanum melongena – Solanum aethiopicum, Solanum gilo,
Solanum olivaire, Solanum pierreanum) – Ngilo (Swahili), Nakasuga/Nakati (Uganda), Njilu
(DRC), Gboma (Togo), Ikan/Igba/Igbo (SW Nigeria), Ntorowa/Ntrobu/Yaduwa (Ghana).
3. Smooth Amaranth (Amaranthus sp.) – Efo tete (SW, Nigeria), Bitekuteku (DRC),
Callalou/Kallaloo (Jamaica), Yin choi, Chinese spinach (China), Thotakura, Cheera (India),
Mchicha (East Africa), African spinach, Indian spinach, Bonongwe (Malawi), Thepe
(Botswana), Grins/Hondi(Sierra Leone), Alayyafu/Alefu (Hausa – West Africa),
Madze/Efan/Muotsu, Swie (Ghana), Lalshak (Bengali)

40
4. Tomatoes (Solanum lycopersicum, syn. Lycopersicon lycopersicum & Lycopersicon
esculentum)
5. Yams ( Dioscorea batatas) – Yellow Yam, White Yam
6. Pumpkin / Squash (Cucurbita sp.) – Kaddu (South Asia) , Chinese Squash
7. Plantain (Musa paradisiaca )
8. Cocoyam leaves/corm (Colocasia esculenta / Xanthosoma sagittifolium) – Taro, Dalo (Fiji),
seppankizhangu (Tamil), Gabi (The Philippines), Pindalu, Karkalo (Nepal), Nduma (Kikuyu –
Kenya), Ala (Maldives), AmaDumbe/Madumbi (Zulu – South Africa), Dasheen, Eddoes (West
Indies/Caribbean), Coco (Nigeria), Kontomire (Ghana), Kachu/Kochu (Bengali), Ghuiyan
(Hindi), Arvi (Hindi), Macabo (Cameroun), Yu tou/ Yu nai (China), Wuh tau (Hong Kong),
Arrow roots.
9. Yardlong Bean (Vigna unguiculata subsp. sesquipedalis) :Cowpea – Long-podded cowpea,
Asparagus bean, Snake bean, Chinese long bean, Dau gok (Cantonese), Jiang dou (Mandarin),
Bora (West Indies), Borboti (Bengali). And Black-eyed pea{beans} (Vigna unguiculata subsp.
unguiculuta): Cowpea – Ewa (Nigeria), Kunde (Swahili), Thattapayru (Tamil), Me-karak (Sri
Lanka).
10. Cassava (Manihot esculenta ) – Yucca, Sombe- leaves (Central Africa), Ege, Akpu (Nigeria),
Mhogo (Swahili), Mushu (China).
11. Sweet Potato (Ipomoea batatas) – Leaves and roots
12. Cabbage (Brassica oleracea : Capitata Group)
13. Spinach (Spinacia oleracea) – Palongshak (Bengali)
The thirteen top ranked vegetables for South-Asian Canadians were:

41
C. Highly Preferred Vegetables by South-Asian Canadians
1. Okro (Abelmoschus esculentus) – Lady finger, Bhindi (India), Ila (SW Nigeria), Huang Sukui
(China), Gumbo(Swahili)
2. Eggplant (Solanum melongena) – Aubergine, Brinjal – Various varieties based on colour and
shape identified.
3. Bitter Melon / Bitter Gourd (Momordica charantia) - Karela (India), Kugua (China), Carilla,
Balsamino, Saraseed (Caribbean)
4. Spinach (Spinacia oleracea) – Palongshak (Bengali)
5. Tomatoes (Solanum lycopersicum, syn. Lycopersicon lycopersicum & Lycopersicon
esculentum)
6. Cauliflower (Brassica oleracea : Bortrytis Group) – Gobi ( India)
7. Potato (Solanum tuberosum )
8. Cabbage (Brassica oleracea : Capitata Group)
9. Cilantro - Coriander (Coriandrum sativum) – Yun tsai (China), Chinese parsley
10. Onions ( Allium cepa) – Baby/Small
11. Carrots (Daucus carota ) – Gajja ( India)
12. Green Beans (Phaseolus vulgaris) – Phalli (India), Chinese green beans
13. Chilli (green or red) (Capsicum sp.)
The list above indicates that some of the vegetables have a cross ethnic demand e.g. Eggplant,
Okra. In fact, okra is the most preferred for the South Asians and the Afro-Caribbeans. There are also
some vegetables on the list that are already grown in Canada - though there are some subtle variations
in the taste and texture e.g. spinach - but the respondents are interested in specific varieties (e.g.

42
Chinese variety or African variety). In other cases like okra and eggplant there are instances of small
scale production in the province which proves that it can be grown in our climatic conditions even
though they are traditionally from the tropics. Some of the crops like Cassava, plantain and cocoyam
may be difficult to cultivate in Canada.
4.2 Amounts Spent on Vegetables
In this section we analyse the average amount spent (in Canadian Dollars) per month on each
of the thirteen vegetables by our respondents. The figures reported are the averages. In other words,
some respondents spend more than the given amount based on their household size, income and level
of consumption of vegetables. Table 18-20 below show the average amount spent by households on
the 13 most preferred vegetables.

43
Table 18: Average Amount Spent by Chinese Households (per month)
Vegetable Amount Spent ($ CAD)
Bok Choy / Pak Choy/Baby Bok choy (
Brassica rapa sub-specie : chinensis):
21
Chinese Broccoli (Brassica oleracea :
Alboglabra Group)
18
Eggplant (Solanum melongena) 14
Chinese Greens (Choy Sum/Yu Choy) (
Brassica rapa sub-specie : chinensis)
31
Tomatoes (Solanum lycopersicum, syn.
Lycopersicon lycopersicum & Lycopersicon
esculentum)
14
Napa Cabbage ( Brassica rapa subsp.
pekinensis)
15
Green Beans (Phaseolus vulgaris) 18
Celery ( Apium graveolens var. dulce /
rapaceum)
13
Spinach (Spinacia oleracea) 14
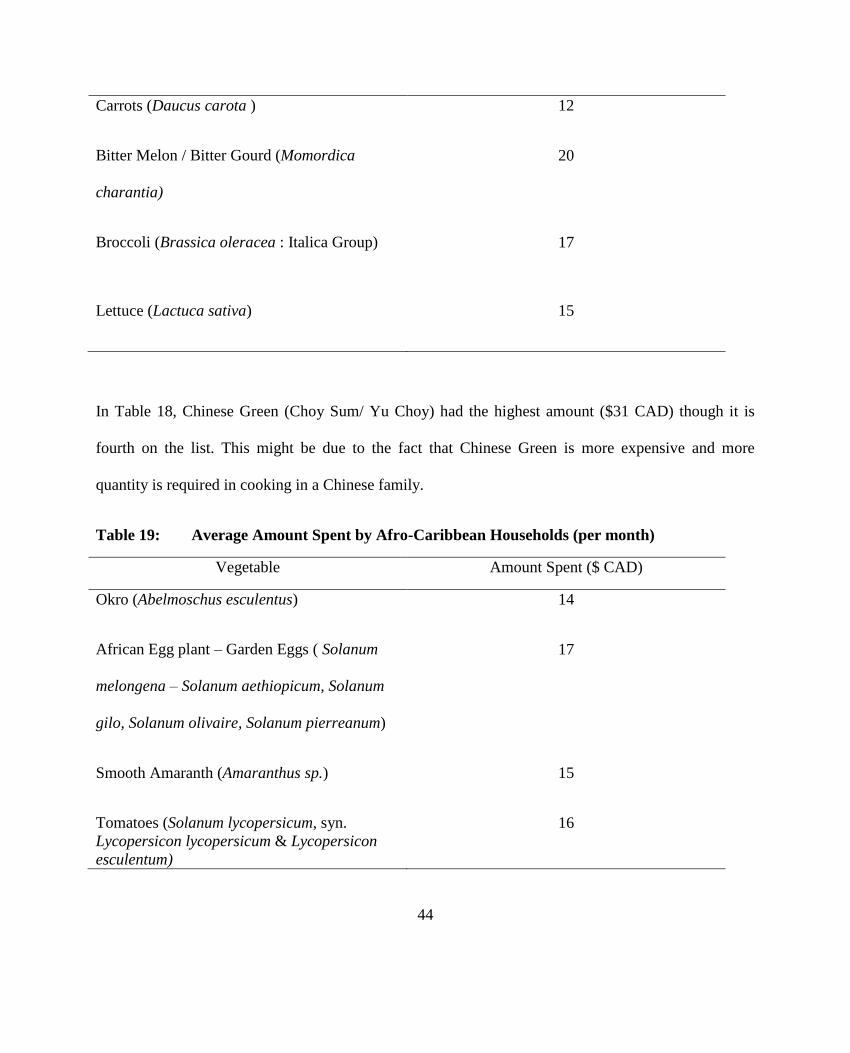
44
Carrots (Daucus carota ) 12
Bitter Melon / Bitter Gourd (Momordica
charantia)
20
Broccoli (Brassica oleracea : Italica Group)
17
Lettuce (Lactuca sativa) 15
In Table 18, Chinese Green (Choy Sum/ Yu Choy) had the highest amount ($31 CAD) though it is
fourth on the list. This might be due to the fact that Chinese Green is more expensive and more
quantity is required in cooking in a Chinese family.
Table 19: Average Amount Spent by Afro-Caribbean Households (per month)
Vegetable Amount Spent ($ CAD)
Okro (Abelmoschus esculentus) 14
African Egg plant – Garden Eggs ( Solanum
melongena – Solanum aethiopicum, Solanum
gilo, Solanum olivaire, Solanum pierreanum)
17
Smooth Amaranth (Amaranthus sp.) 15
Tomatoes (Solanum lycopersicum, syn.
Lycopersicon lycopersicum & Lycopersicon
esculentum)
16

45
Yams ( Dioscorea batatas) 37
Pumpkin / Squash (Cucurbita sp.) 13
Plantain (Musa paradisiaca )
14
Cocoyam leaves/corm (Colocasia esculenta /
Xanthosoma sagittifolium)
19
Yardlong Bean (Vigna unguiculata subsp.
sesquipedalis) And Black-eyed pea{beans}
(Vigna unguiculata subsp. unguiculuta)
18
Cassava (Manihot esculenta ) 21
Sweet Potato (Ipomoea batatas) 13
Cabbage (Brassica oleracea : Capitata Group)
11
Spinach (Spinacia oleracea) 16
As seen in Table 19, expenditure on Yam had highest expenditure because it is expensive and
presently imported from the Caribbean or West Africa. Its bulkiness makes it difficult to import easily

46
to the country. The vegetable with the least expenditure is Cabbage and is because is readily available
and consumed by the other ethnic groups.
Table 20: Average Amount Spent by South Asian Households (per month)
Vegetable Amount Spent ($ CAD)
Okro (Abelmoschus esculentus) 16
Eggplant (Solanum melongena) 16
Bitter Melon / Bitter Gourd (Momordica
charantia)
13
Spinach (Spinacia oleracea) 12
Tomatoes (Solanum lycopersicum, syn.
Lycopersicon lycopersicum & Lycopersicon
esculentum)
15
Cauliflower (Brassica oleracea : Bortrytis
Group)
10
Potato (Solanum tuberosum )
13
Cabbage (Brassica oleracea : Capitata Group)
9
Cilantro - Coriander (Coriandrum sativum) 7

47
Onion ( Allium cepa) 16
Carrots (Daucus carota ) 12
Green Beans (Phaseolus vulgaris) 12
Chilli (green or red) (Capsicum sp.)
9
Finally, all the tables generally indicate that some of the vegetables that are ranked lower in preference
have higher amounts spent on them. This can be explained by the fact that some of these vegetables
have a higher per unit cost e.g. Yams, Cassava, Bitter melon, Onion etc.
4.3 Demands for Ethnic Vegetables1
One of the objectives of this study is to estimate the demand for ethnic vegetables in the GTA
region. Based on this premise, we calculated the demand for ethnic vegetables of the largest ethnic
groups in the GTA. The section presents the demand for these ethnic groups using inferential statistics.
The demand for the Chinese category is presented below
4.3.1 Demand Estimation: Chinese
Amount spent on vegetables/month = $116.99 CAD
Amount spent on 10 most consumed vegetables/month = $106.82 CAD
1 All the figures presented are based on averages
48
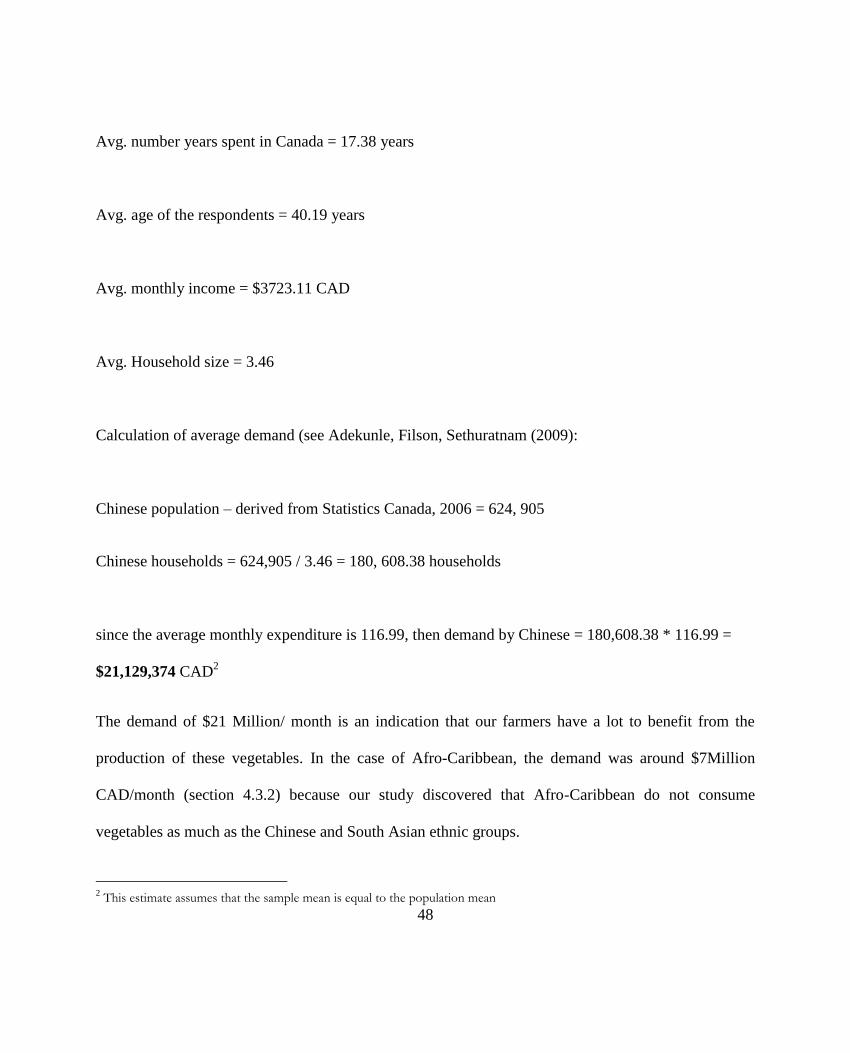
Avg. number years spent in Canada = 17.38 years
Avg. age of the respondents = 40.19 years
Avg. monthly income = $3723.11 CAD
Avg. Household size = 3.46
Calculation of average demand (see Adekunle, Filson, Sethuratnam (2009):
Chinese population – derived from Statistics Canada, 2006 = 624, 905
Chinese households = 624,905 / 3.46 = 180, 608.38 households
since the average monthly expenditure is 116.99, then demand by Chinese = 180,608.38 * 116.99 =
$21,129,374 CAD2
The demand of $21 Million/ month is an indication that our farmers have a lot to benefit from the
production of these vegetables. In the case of Afro-Caribbean, the demand was around $7Million
CAD/month (section 4.3.2) because our study discovered that Afro-Caribbean do not consume
vegetables as much as the Chinese and South Asian ethnic groups.
2 This estimate assumes that the sample mean is equal to the population mean

49
4.3.2 Demand Estimation: Afro-Caribbean
Amount spent on vegetables/month = $67.48 CAD
Amount spent on 10 most consumed vegetables/month = $77.59 CAD
Avg. number years spent in Canada = 16.71 years
Avg. age of the respondents = 39.14 years
Avg. monthly income = $3438.87CAD
Avg. Household size = 3.44
Calculation of average demand:
Afro-Caribbean population – derived from Statistics Canada, 2006 = 372,985
Afro-Caribbean households =372,985 /3.44 = 108,426 households
since average monthly expenditure is $ 67.48, then demand by Afro-Caribbean = $7,316,578 CAD
Although the Afro-Caribbean do not consume a lot of vegetables, they have a lot of vegetables that can
be beneficial to the development of healthy diet in Canada.

50
4.3.3 Demand Estimation: South Asian
The South Asian ethnic group has the largest demand due to their large family size and high
consumption of ethnic vegetables. They also have the largest number of vegetarians. The demand
calculation is presented below.
Amount spent on ethnic vegetables/month = $156.14 CAD
Amount spent on 10 most consumed vegetables/month = $ 103.84CAD
Avg. number years spent in Canada = 12.36 years
Avg. age of the respondents = 42.79 years
Avg. monthly income = $2852.90 CAD
Avg. Household size = 3.96
Calculation of average demand:
South Asian population – derived from Statistics Canada, 2006 = 834,880
South Asian households = 834,880/3.96 = 210,828 households
since average monthly expenditure is $156.14, then demand by South Asians = $32,918,728
The demand estimates indicate that the South Asians have the highest demand at approximately 33
million dollar per month, followed by the Chinese at 21 million dollars and the Afro-Caribbean group
(with 7 million). This is explained by the fact that there are more vegetarians among the South Asians
than the other two. All together there is demand of 61 million dollars for ethnic vegetables in the GTA.
The demand figures also indicate that there is substantial market for vegetables in the GTA and if we
take the cross-ethnic impact of some vegetables into consideration the demand grows even higher.

51
What might be considered ethnic food to some may not be to others and some of these vegetables are
already grown here. Nevertheless there is still a huge demand for these vegetables. Even if we take
into consideration that some vegetables cannot be grown because of Ontario‟s climatic conditions the
demand is still substantial and one which farmers can take advantage of and economically benefit
from.
52
Chapter Five: Conclusions, Recommendation and Future Directions
5.1 Conclusions and Recommendations
This study did an extensive examination of the vegetable preferences of the three largest ethnic
groups in the GTA. We analyzed questionnaires administered to the main grocery buyer within each
household from the South Asian, Chinese and Afro-Caribbean groups in the study area. This study is
important because the demographics of the GTA are changing – half of the Torontonians were not
born in Canada. Based on this development, the demand for ethno-cultural foods will continue to
grow. But even though some of these vegetables can grow in Ontario, it is unfortunate that most of
these foods are currently imported from abroad. We need to provide scientific evidence that will allow
farmers in the GTA to benefit from this niche market by producing these products locally, rather than
continuing with the present situation of the large carbon footprints that result from the importation of
low quality vegetables.
The study started with an exploratory survey to pre-test the survey instrument and seek expert
opinion. The survey was done through ethnic stores and associations selected through systematic and
purposeful sampling. Research assistants were recruited from the University of Guelph and the
different ethnic groups. Overall, 750 questionnaires were administered (250 per ethnic group) and 12
research assistants participated in the survey. The data was analyzed using descriptive statistics,
principal component analysis and OLS regression to have a better understanding of the selected
respondents‟ consumption of their ethnic vegetables.

53
The results indicate that there is a high demand for ethno-cultural foods in the GTA. Most
respondents feel that the consumption of these vegetables is healthy and are willing to pay more if
vegetables are of better quality. Most of the Chinese respondents were female (61.2%). This was
different for the South Asian and Afro-Caribbean group. For the South Asia group, 58.7% were male
while 41.3% were female while it was male (56.7%) and female (43.3%) for the Afro Caribbean. The
higher percentage of male for these two groups might be due to economic and cultural reasons. Most
of the respondents were married and have at least high school education. The average age was 40.7
years, average household size was 3.6 and the average total monthly income of our respondents was
$3338.32 across the three ethnic groups. Afro-Caribbean spent the least percentage out of their
expenditure on food on vegetables. The most important reasons for the place of purchase were
availability, proximity/location and price.
The respondents also believe that consumption of vegetables will reduce constipation and is a
source of good fibre, prevents chronic diseases (e.g Cancer, Heart Problems, Blood Pressure,
Diabetes), contains vitamins, minerals and proteins, lesser medical expenses / good immune system
and is an healthy diet. There was no significant difference in the level of acculturation of the three
ethnic groups. The highly preferred vegetables by the Chinese were Bok Choy / Pak Choy/Baby Bok
choy : Chinese Cabbage –Bok choy (Cantonese), Xiao bai cai/ Bai cai (Mandarin), Taiwan Bok Choy,
Chinese Broccoli – Gai lan/Kai lan/Gai lon , Chinese Kale and Eggplant. In the case of Afro-
Caribbeans, the preferred crops were Okro – Lady finger, African Egg plant – Garden Eggs and
Smooth Amaranth while they were Okro, Eggplant – Aubergine, Brinjal – Various varieties based
on colour and shape identified and Bitter Melon / Bitter Gourd for the South Asia. As indicated in
our result, Okra is most preferred vegetables among the South Asian and Afro-Caribbean.

54
Our estimated demand for each of the ethnic groups confirms there is a huge demand for ethnic
vegetables in the GTA. The demand estimates indicate that the South Asians have the highest demand
at approximately 33 million dollar per month, followed by the Chinese at 21 million dollars and the
Afro-Caribbean group (with 7 million). Based on our discovery we can conclude that there is
substantial demand for ethno-cultural foods. This opportunity can be explored because there is
potential to grow some of these vegetables during the Spring/Summer season. Another interesting
issue, which can be explored is the cross-cultural impact of these ethnic vegetables. This is important
because cross-cultural impact can increase the demand of some of these vegetables. Finally, although
the markets for ethno-cultural foods exist there is a need for better market linkages.
5.2 Future Directions
This study established an evidence based result which indicates that the demand for ethnic
vegetables in the GTA is substantial. We also discover that ethnic Canadians consume about 120
vegetables (see appendix), some of which can be grown in Ontario. There is a need for production
research on the highly ranked vegetables consumed by the different ethnic groups examined in this
study. Plots should be developed in both government based research institutes and on private farms to
evaluate the viability of these crops in Ontario. There is also a need for a research on the development
of the market linkages between the farmers and the retailers of these ethnic vegetables. All these
further areas of research will make the output of this study relevant for this niche market for the
farmers in Ontario. This study helps to create awareness about this niche market.

55
Documents Reviewed
Adekunle, B. 1998. Socio Economic Study of Consumer Expenditure on Cassava Products in Osun
State, Nigeria. B.Agric Thesis. Ife: Obafemi Awolowo University.
Adekunle, B., G. Filson, S. Sethuratnam. 2009. Consumption of Ethno-cultural Foods: A
Research Guide. University of Guelph. Canada.
Bojanic,D. and Xu,Y. 2006. An Investigation of Acculturation and the Dining-out Behaviour of
Chinese Living in the United States. Hospitality Management 25: 211–26.
Govindasamy R, R. VanVranken, W. Sciarappa, A. Ayeni, V. Puduri, K. Pappas, J. E. Simon, F .
Mangan, M. Lamberts, G. McAvoy, 2007. Demographics and the Marketing of Asian and Hispanic
producein the Eastern Coastal U.S.A. The State University of New Jersey, Rutgers, Report # P-02903-
2-07.
Hughes, D. R. and Kallen, E. 1974 The Anatomy of Racism: Canadian Dimensions. Montreal:
Harvest House Ltd.
WCM Consulting Inc. 2008. SWOT Analysis of the Ethnic Food Sector of Ontario. Agriculture and
Agri-Food Canada.

56
Appendix I
School of Environmental Design and Rural Development
Ontario Agricultural College, University of Guelph
Questionnaire Schedule on Preferences for Ethno-Cultural Foods in the Greater Toronto Area
(GTA)
A. Vegetable Expenditure
1. Do you consume a significant amount of vegetables3 in your household (please check one)?
Yes
No
2. If Yes, why?
__________________________________________________________________________________
__________________________________________________________________________
3. What is the source of vegetable consumed in your household? Please check any box that applies below.
My farm or garden
Farmers‟ market
Supermarket
Ethnic grocery store
3 A vegetable is the edible root, stem, leaves, flowers, fruits and seeds of a plant. It is usually a grocery store term and not a
botanist (scientific) classification.

57
4. Out of the household monthly income, what approximate percentage do you devote to
purchasing food in general? Please check one box below.
more than 25%
15% -24%
Less than 14%
5. Out of the total amount spent on food what approximate percentage do your spend on
vegetables?
____________________________________________________________________________
____________________________________________________________________
6. List the qualities that you like in vegetables, if any?
_______________________________________________________________________
_______________________________________________________________________
7. Are you satisfied with the quality of vegetables supplied in your area (check one)?
Yes
No
Don‟t Know
8. If No, why are you not satisfied?

58
____________________________________________________________________________
____________________________________________________________________
9. What quality improvements would you like to see in the various vegetables supplied to your
area?
____________________________________________________________________________
____________________________________________________________________
10. In your preferred order of priority list the vegetables that you purchased often (please circle
1= most preferred, 4 = least preferred): 1. 2. 3. 4.
11. Name a few vegetables that you like but are very difficult to get in the area where you live?
_______________________________________________________________________
12. Do you think eating vegetables has health implications (please check one)?
Yes
No
13. If Yes, what are the implications?
____________________________________________________________________________
____________________________________________________________________

59
B. Consumption of Ethnic Vegetables4
1. Have you purchased any of your ethnic vegetable in the last 12 months (please check one)?
Yes
No
2. If No, why didn‟t you purchase your preferred ethnic vegetables?
____________________________________________________________________________
____________________________________________________________________
3. How much do you spend on your ethnic vegetables in a month?
________________________________________________________________________
4. List 10 ethnic vegetables that you usually purchase and the amount you pay per week and /or
per month:
Number Name Amount
(CAD)/Week
Amount
(CAD)/Month
1
2
3
4
5
6
7
8
9
10
4 Ethnic vegetables are vegetables that are normally consumed by a particular ethno-cultural group.

60
5. Where do you purchase your ethnic vegetables?
____________________________________________________________________________
____________________________________________________________________
6. Why do you purchase your ethnic vegetables from the place(s) indicated above?
____________________________________________________________________________
____________________________________________________________________
7. What portion of your ethnic vegetables are purchased in a typical Canadian grocery store?
Please check one box below.
more than 50%
25% -49%
Less than 24%
8. How important are the following attributes for you when you decide to purchase ethnic
vegetables:
(Circle one option for each attribute)
Attributes Very important Important Neither
important
nor
unimportant
Unimportant Very
unimportant
Store
Availability
5 4 3 2 1
Language 5 4 3 2 1
Selection 5 4 3 2 1
Freshness 5 4 3 2 1
Quality 5 4 3 2 1

61
Price 5 4 3 2 1
Packaging 5 4 3 2 1
Origin of
food
5 4 3 2 1
Method of
production
5 4 3 2 1
Taste 5 4 3 2 1
Preservation
method
5 4 3 2 1
Grown in
Ontario
5 4 3 2 1
Easy to cook 5 4 3 2 1
Versatility 5 4 3 2 1
Medicinal
ability
5 4 3 2 1
9. Are you willing to pay more for ethnic vegetables?
Yes
No
10. If yes, why are you willing to pay more for ethnic vegetables?
_________________________________________________________________________
_________________________________________________________________
11. How much extra are you willing to pay for a kilogram of ethnic vegetable? (Please check
one box below)
more than 20%
10% -19%
Less than 9%
12. How important is the place of purchase of ethnic vegetable in your expenditure decisions?
(circle one option for each location)
Location Very important Important Neither
important
nor
Unimportant Very
unimportant

62
unimportant
Ethnic
grocery
stores
5 4 3 2 1
Farmers
market
5 4 3 2 1
Community
shared
agriculture
(CSA)
5 4 3 2 1
Supermarkets 5 4 3 2 1
Brought from
home
country
5 4 3 2 1
13. Do you think advertisement can play a role in your decision to purchase ethnic vegetables?
Yes
No
14. If Yes, which type of advertisement will affect your decision to purchase an ethno cultural
vegetable?
_________________________________________________________________________
_________________________________________________________________
15. Do you grow ethnic vegetables for your consumption?
Yes
No
16. If Yes, which vegetables do you grow?
_________________________________________________________________________
_________________________________________________________________
17. Are you a vegetarian?
Yes
No
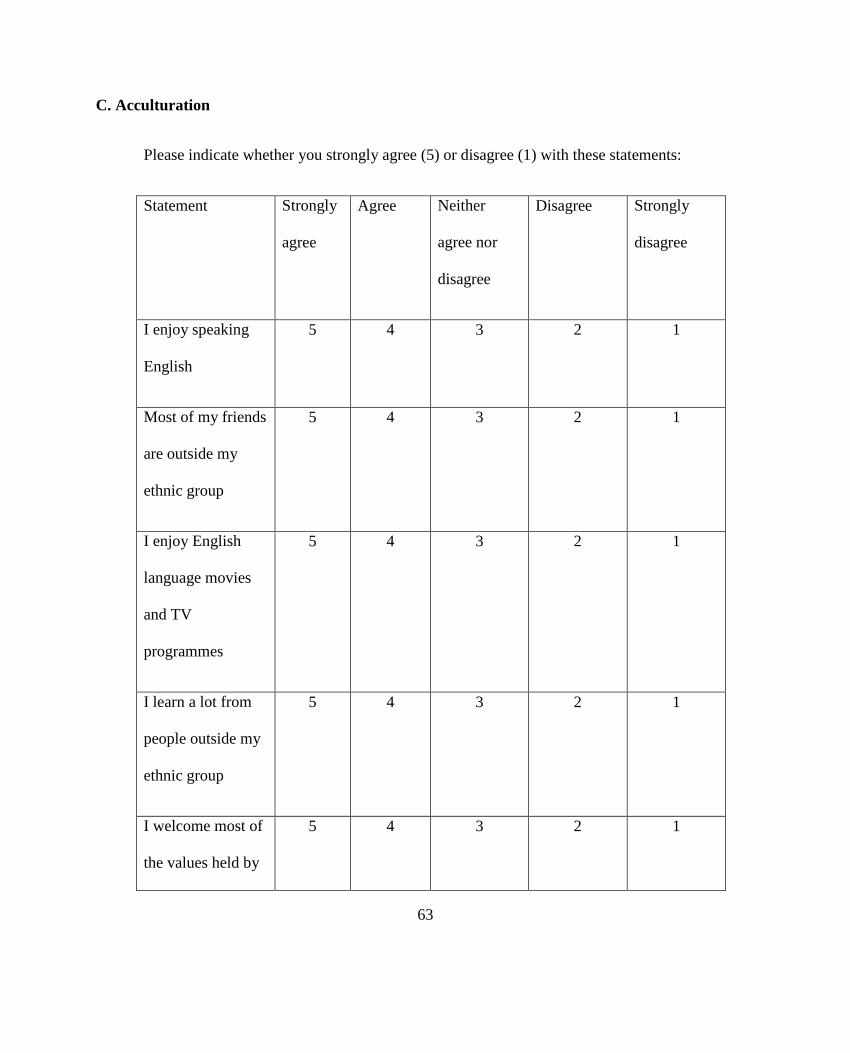
63
C. Acculturation
Please indicate whether you strongly agree (5) or disagree (1) with these statements:
Statement Strongly
agree
Agree Neither
agree nor
disagree
Disagree Strongly
disagree
I enjoy speaking
English
5 4 3 2 1
Most of my friends
are outside my
ethnic group
5 4 3 2 1
I enjoy English
language movies
and TV
programmes
5 4 3 2 1
I learn a lot from
people outside my
ethnic group
5 4 3 2 1
I welcome most of
the values held by
5 4 3 2 1

64
people outside my
ethnic group
I have difficulty
accepting most of
the values held by
my ethnic group
5 4 3 2 1
I prefer food that
are not my ethnic
food
5 4 3 2 1

65
D. Background Information
1. Residential Area:
2. Postal Code:
3. Ethnicity (e.g. Indian Canadian, Nigerian Canadian, Chinese Canadian):
4. Years spent in Canada:
5. Country of Birth:
E. Personal Characteristics of Respondent
1. Age of respondent:
2. Sex (Please check one box below) :
Male
Female
3. Marital Status (Please check one box below) :
Married
Single
Divorced
Widowed
4. Highest Educational Attainment(Please check one box below) :
No formal Education
Primary School
High School
College Diploma
University Degree
5. Occupation (Please indicate your occupation and income):
(a) Full-time: Monthly Income:
(b) Part-time: Monthly Income:
6. Number of People in the Household:

66
Appendix II
List of Vegetables Consumed by the Three (South – Asian, Chinese and Afro-Caribbean) Major
Ethno-cultural Groups in the GTA
1. Ackee (Blighia sapida)
2. Afang leaves (Gnetum africanum) – Eru/Kok (Cameroon), Koko (Central African Republic),
Ntoumou (Gabon), Afang/Ukazi/Okazi (Nigeria), Fumbwa (Democratic Republic of Congo –
DRC, Republic of Congo, Angola, Mozambique).
3. African Egg plant – Garden Eggs ( Solanum melongena – Solanum aethiopicum, Solanum gilo,
Solanum olivaire, Solanum pierreanum) – Ngilo (Swahili), Nakasuga/Nakati (Uganda), Njilu
(DRC), Gboma (Togo), Ikan/Igba/Igbo (SW Nigeria), Ntorowa/Ntrobu/Yaduwa (Ghana).
4. Asparagus (Asparagus officinalis)
5. Bamboo Shoots ( Bambusa vulgaris or Phyllostachys edulis) – Zhu sun jian / Sun jian
(Chinese), Tama (Nepal), Mautuai/Kill (India)
6. Banana ((Musa sapienta, Musa nana)
7. Basil (Ocimum basilicum)
8. Bay leaf (Laurus nobilis)
9. Bean Sprouts (Vigna unguiculata)
10. Beet Roots (Beta vulgaris) – Belterave (French)
11. Bell Pepper (Capsicum annuum)
12. Bitter leaf (Vernonia amygdalina) – Ewuro/Orugbo (Nigeria), Mojunso (Tanzania/East Africa),
Ndole (Cameroun).
13. Bitter Melon / Bitter Gourd (Momordica charantia) - Karela (India), Kugua (China), Carilla,
Balsamino, Saraseed (Caribbean)
14. Black-eyed pea{beans} (Vigna unguiculata subsp. unguiculuta): Cowpea – Ewa (Nigeria),
Kunde (Swahili), Thattapayru (Tamil), Me-karak (Sri Lanka).

67
15. Bok Choy / Pak Choy/Baby Bok choy ( Brassica rapa sub-specie : chinensis): Chinese
Cabbage –Bok choy (Cantonese), Xiao bai cai/ Bai cai (Mandarin), Taiwan Bok Choy
16. Broad Bean (Vicia faba) – Fava bean, Faba bean, Field bean, Bell Bean, Tic bean.
17. Broccoli (Brassica oleracea : Italica Group)
18. Brussels Sprout (Brassica oleracea Gemmifera Group)
19. Butternut squash (Cucurbita moschata)
20. Cabbage (Brassica oleracea : Capitata Group)
21. Calabash or Bottle Gourd (Lagenaria siceraria) – Hulu / Huzi (Chinese), Buyu / Mabuyu
(Tanzania), Lauki (Pakistan), Ghiya (Hindi), Lau (Bengali), Suraikkaai (Tamil), Lauka
(Nepal), Lauki/Locky (Hindi).
22. Carrots (Daucus carota ) – Gajja ( India)
23. Cassava (Manihot esculenta ) – Yucca, Sombe- leaves (Central Africa), Ege, Akpu (Nigeria),
Mhogo (Swahili), Mushu (China).
24. Catjang (Vigna unguiculata subsp. cylindrical): Cowpea
25. Cauliflower (Brassica oleracea : Bortrytis Group) – Gobi ( India)
26. Celery ( Apium graveolens var. dulce / rapaceum)
27. Chayote (Sechium edule) – Sayote, Tayotu, Choko, Chocho, Chow-chow, Christophene,
Mirliton, Alligator pear, Vegetable pear, Shushu (Malawi), Sousout (Seychelles), Fut sao gwa
(Cantonese), Fo shou gua (Mandarin), Seemae Badhnekayi, DasGoos (India).
28. Chick peas (Cicer arietinum) – Garbanzo bean, Kabuli chana, Indian pea, Ceci bean, Chana
(Hindi), Kadale kaalu (Kannada), Shanaga (Telugu), Chhola (Bengali), Konda kadalai (Tamil)
29. Chinese Arrow Root (Sagittaria trifolia )
30. Chilli pepper (green or red) (Capsicum sp.)
31. Chinese Broccoli (Brassica oleracea : Alboglabra Group) – Gai lan/Kai lan/Gai lon , Chinese
Kale

68
32. Chinese Greens (Choy Sum) ( Brassica rapa sub-specie : chinensis): Chinese Cabbage – Yu
choy [ You cai, Cai hua(Mandarin), Yai tsoi (Cantonese)] , Cai xin, Hokkien chai sim,
Flowering Chinese Cabbage
33. Chinese water chestnut (Eleocharis dulcis) – Water chestnut, Biqi, Mati (China)
34. Chives (Allium schoenoprasum)
35. Cilantro - Coriander (Coriandrum sativum) – Yun tsai (China), Chinese parsley
36. Cluster Bean (Cyamopsis tetragonolobus) – Guar/ Guvar bean, Kotthavarai (Tamil)
37. Cocoyam leaves/corm (Colocasia esculenta / Xanthosoma sagittifolium) – Taro, Dalo (Fiji),
seppankizhangu (Tamil), Gabi (The Philippines), Pindalu, Karkalo (Nepal), Nduma (Kikuyu –
Kenya), Ala (Maldives), AmaDumbe/Madumbi (Zulu – South Africa), Dasheen, Eddoes (West
Indies/Caribbean), Coco (Nigeria), Kontomire (Ghana), Kachu/Kochu (Bengali), Ghuiyan
(Hindi), Arvi (Hindi), Macabo (Cameroun), Yu tou/ Yu nai (China), Wuh tau (Hong Kong),
Arrow roots.
38. Collard Greens (Brassica oleracea : Acephala Group) - Kaanul haak (Kashmir – South Asia),
Sukuma wiki (Kenya).
39. Cucumber (Cucumis sativus)
40. Cumin (Cuminum cyminum)
41. Curry leaves (Murraya koenigii) – Karipatta (Hindi), Karivepaku, Karuveppilai, Noroxingha
(Assamese), Kadhi Patta (Marathi), Mithho Limdo(Gujarati), Karapincha (Sinhalese).
42. Daikon (Raphanus sativus subsp. Longipinnatus) – White radish, Chinese radish, Japanese
radish, Oriental radish, Winter radish, Mooli/Muli (Hindi), Moollangi (Tamil), Bai lu obo
(Mandarin), Lobak (Cantonese)
43. Drumstick (Moringa oleifera / Moringa teringosperma)
44. Eggplant (Solanum melongena) – Aubergine, Brinjal – Various varieties based on colour and
shape identified.
45. Enokitake (Flammulina velutipes) – Enokidake, Enoki Mushrooms.
46. Fenugreek greens (Trigonella foenum-graecum) – Methi, Vendayam, Menthya (India)
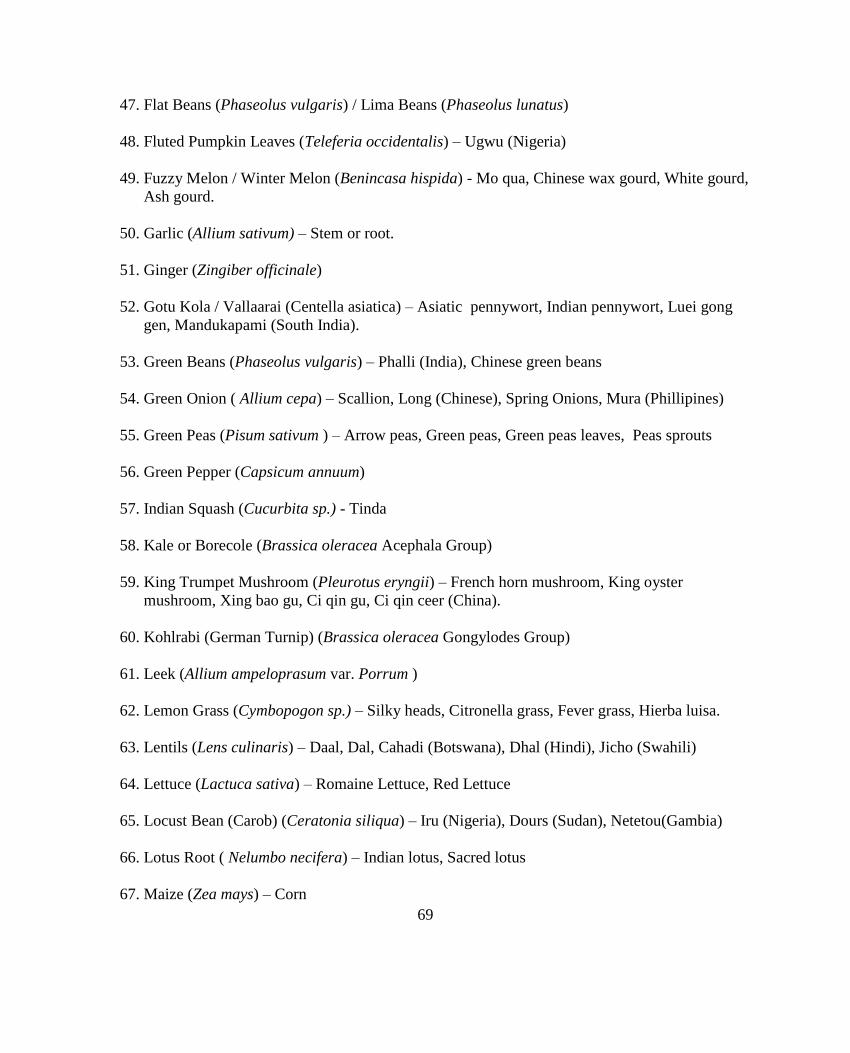
69
47. Flat Beans (Phaseolus vulgaris) / Lima Beans (Phaseolus lunatus)
48. Fluted Pumpkin Leaves (Teleferia occidentalis) – Ugwu (Nigeria)
49. Fuzzy Melon / Winter Melon (Benincasa hispida) - Mo qua, Chinese wax gourd, White gourd,
Ash gourd.
50. Garlic (Allium sativum) – Stem or root.
51. Ginger (Zingiber officinale)
52. Gotu Kola / Vallaarai (Centella asiatica) – Asiatic pennywort, Indian pennywort, Luei gong
gen, Mandukapami (South India).
53. Green Beans (Phaseolus vulgaris) – Phalli (India), Chinese green beans
54. Green Onion ( Allium cepa) – Scallion, Long (Chinese), Spring Onions, Mura (Phillipines)
55. Green Peas (Pisum sativum ) – Arrow peas, Green peas, Green peas leaves, Peas sprouts
56. Green Pepper (Capsicum annuum)
57. Indian Squash (Cucurbita sp.) - Tinda
58. Kale or Borecole (Brassica oleracea Acephala Group)
59. King Trumpet Mushroom (Pleurotus eryngii) – French horn mushroom, King oyster
mushroom, Xing bao gu, Ci qin gu, Ci qin ceer (China).
60. Kohlrabi (German Turnip) (Brassica oleracea Gongylodes Group)
61. Leek (Allium ampeloprasum var. Porrum )
62. Lemon Grass (Cymbopogon sp.) – Silky heads, Citronella grass, Fever grass, Hierba luisa.
63. Lentils (Lens culinaris) – Daal, Dal, Cahadi (Botswana), Dhal (Hindi), Jicho (Swahili)
64. Lettuce (Lactuca sativa) – Romaine Lettuce, Red Lettuce
65. Locust Bean (Carob) (Ceratonia siliqua) – Iru (Nigeria), Dours (Sudan), Netetou(Gambia)
66. Lotus Root ( Nelumbo necifera) – Indian lotus, Sacred lotus
67. Maize (Zea mays) – Corn

70
68. Mung Beans (Vigna radiata) [Bean sprouts] – Ludou (China), sprout – Dou ya, Ya cai, Yin ya
(China)
69. Mustard Greens (Brassica juncea) – Indian mustard, Leaf mustard, Gai choy, Chinese Mustard,
Tsunga
70. Mukunuwenna (Alternanthera sissilis)
71. Mushroom ( Agaricus bisporus / Agaricus augustus )
72. Napa Cabbage ( Brassica rapa subsp. pekinensis) : Chinese Cabbage – Wong nga pak
(Cantonese), Da bai cai (Mandarin)
73. Okro (Abelmoschus esculentus) – Lady finger, Bhindi (India), Ila (SW Nigeria), Huang Sukui
(China), Gumbo(Swahili)
74. Onion ( Allium cepa) – Baby/Small
75. Oyster Mushroom (Pleurotus ostreatus) – Ping gu (China)
76. Parsley (Petroselinum crispum)
77. Peanut (Groundnut) (Arachis hypogaea)
78. Pigeon Pea (Cajanus cajan syn. Cajanus indicus) – Arhar (Hindi), Tuva ram paruppu (Tamil),
Congo pea, Gungo pea, No-eye pea.
79. Plantain (Musa paradisiaca )
80. Plumed Cockscomb (Celosia argentea) – Prince of Wales Feathers, Sokoyokoto (Nigeria).
81. Potato (Solanum tuberosum )
82. Pumpkin (Cucurbita sp.) – Kaddu (South Asia) , Chinese Squash
83. Rapini (Brassica rapa subspecies rapa ) – Brocolli rape, Raab
84. Red Pepper (Capsicum sp.)
85. Ridged Gourd (Luffa acutangula) / Smooth Luffa, Towel Gourd (Luffa aegyptiaca) – Luffa,
Loofah, Lufah, Chinese squash, Chinese okro, Turai (Hindi), Parteek (Nepali), Jhinga
(Bengali), Janhi (Oriya), Turiya(Gujarati), Beera kaya (Telugu), Peerkankaai (Tamil),
Wetakolu (Sinhala), Nenwah.

71
86. Rocotillo Pepper (Capsicum baccatum)
87. Sesame (Sesamum indicum) – Til (Hindi)
88. Shanghai Bok Choy/ Shanghai Pak choi (Brassica rapa sub-specie: chinensis): Chinese
Cabbage – Shanghai bai cai, Chingen sai, qingcai
89. Shiitake Mushrooms (Lentinula edodes)
90. Smooth Amaranth (Amaranthus sp.) – Efo tete (SW, Nigeria), Bitekuteku (DRC),
Callalou/Kallaloo (Jamaica), Yin choi, Chinese spinach (China), Thotakura, Cheera (India),
Mchicha (East Africa), African spinach, Indian spinach, Bonongwe (Malawi), Thepe
(Botswana), Grins/Hondi(Sierra Leone), Alayyafu/Alefu (Hausa – West Africa),
Madze/Efan/Muotsu, Swie (Ghana), Lalshak (Bengali), Datha (Bangladesh)
91. Snow pea (Pisum sativum var. macrocarpon) – Leaves and fruits
92. Soya bean (Glycine max) – Greater bean (China), Edamame (Japan)
93. Spinach (Spinacia oleracea) – Palongshak (Bengali)
94. Suran (Amorphophallus paeoniifolius)
95. Sweet Potato (Ipomoea batatas) – Leaves and roots
96. Sweet Yams ( Dioscorea batatas)
97. Thickhead (Crassocephalum rubens) – Fireweed, Regleaf, Ebolo/Ebire (Nigeria), Worow
(Sierra Leone)
98. Thyme (Thymus vulgaris)
99. Tomatoes (Solanum lycopersicum, syn. Lycopersicon lycopersicum & Lycopersicon
esculentum)
100. Tong Ho (Chrysanthemum coronarium) – Edible Chrysanthemum, Crown daisy,
Shingiku.
101. Tossa Jute Leaves ( Corchorus olitorius) – Ewedu (Nigeria), Moroheiya (Japan),
Melokheya/Malukhia (Egypt), Jew‟s mallow, Fakohoy (Songhay – Mali), Saluyot
(Philippines), Mrenda/ Murere (Luya – Kenya)

72
102. Turnip (Brassica rapa var. Rapa) – Turnip green (leaves), Salgam (Bengali/Hindi)
103. Vine of Sodom (Colocynth – Colocynth citrullus ) (Citrullus colocynthis, Citrullus
lanatus) / Melon seeds, Bitter apple, Bitter cucumber – Egusi (West Africa), Agusi (Niger).
104. Water Cress (Nasturtium officinale )
105. Water Leaf ( Talinum triangulare)
106. Water Mint (Mentha aquatica) / Asian Mint (Mentha asiatica)/ Wrinkled leaf Mint
(Mentha crispata) / Corn mint, Wind mint, Pudina (Mentha arvensis)
107. Water Spinach (Ipomoea aquatic) – Ong Choy/ On Choy (Chinese), Puishak (Bengali),
Kankun (Sri Lanka), Tong Choi/ Kong Xin Cai.
108. Winged Beans (Psophocarpus tetragonobolus) – Kacangbotol (Malaysia), Asparagus
pea, Dumbula (Sri Lanka).
109. Yams ( Dioscorea batatas) – Yellow Yam, White Yam
110. Yardlong Bean (Vigna unguiculata subsp. sesquipedalis) :Cowpea – Long-podded
cowpea, Asparagus bean, Snake bean, Chinese long bean, Dau gok (Cantonese), Jiang dou
(Mandarin), Bora (West Indies), Borboti (Bengali).
111. Zucchini / Courgette (Cucurbita pepo) – Water gourd
112. Pointed Gourd (Trichosanthes dioica ) – Potol (Bengali), Parwal (Hindi)
113. Teasle Gourd ( Momordica dioica) – Kakrol
114. Artichokes (Cynara cardunculus)
115. Sorrel (Rumex acetosa) – Spinach Dock, Narrow leaved dock, Sure/ Yakuwa (Hausa),
Ngai Ngai (DRC)
116. Fiddlehead (Athyrium esculentum) – Bracken (Pteridium aquilinum)
117. Chinese Wild Yam (Dioscoreae oppositae) – Waisan, Mountain yam, Huai shan
118. Rock Hibiscus (Hibiscus callyphyllus)

73
119. Irvingia (Irvingia sp.) - Apon , Ogbonna (Nigeria)
120. Tindora (Coccinia grandis)

74
Appendix III: List of Stores
1. Afro-Carribbean Stores
African Carrabean Groceris, 2515 Hurontario St, Mississauga, ON, L5A4C8
African Canadian groceries and beauty supply; Hasty Market, 3192 Eglinton ave east, Scarborough,
ON, M1J 2H5;
A-Z African and West Indian Market, 1054 Albion Road, Etobikoke, M9V 1A7;
Baksh Halal meat, 3160 Eglinton ave east, scarborough, ON;
Charlies west indian food store,
FH Multi Foods: East and West Indian Groceries, 3061 Huronatio st, Mississauga, Ontario, L5A 2G9;
Homeland west indian Supermarket, 1642 Jane Street
India Africa Grocers LTd, 2121 Jane St, Toronto, ON
Laura Meat market, Ltd. 1696 Jane Street , York , ON M9N 2S4 and
New Era Mart, 1148 Albion Rd, Etobikoke, M9V 1A8;
Oxymbo African Market, 1550 Jane Street, Toronto, ON, M9N 2R5
Tropical Grocery, 351 Albion Road, Etobikoke;
Uncle Seth Topical Foods, 2069 Lawrence Ave, Scarborough, ON.
2. Chinese Stores
Btrust Supermarket, 1177 Central Parkway West, Mississauga, ON
B & T Food Centre (Sieu Thi Ben Thanh), 3255 Rutherford Rd, Vaughn, ON
ChinaCity Supermarket, 247 Spadina Ave, Toronto, ON, M5T 3A8
Ho Long Supermarket, 253 Spadina Ave, Toronto, ON, M5T 2E3

75
Jian Hing Supermarket (Sieu Thi Kien Hung), 1989 Finch Ave, West, Toronto, ON
Lonetai, Scarborough
New Asian Food Center, 26 Kennedy Rd N, Brampton
Oceans Fresh Market, 150 West Drive, Brampton
Oceans Fresh Market, 499 Main St. S, Brampton
Oriental Food Centre, 888 Dundas St, Mississauga, ON
Oriental Harvest, 310 Spadina Ave, Toronto, ON
Sheung thai Top Foods
Yuan Ming Supermarket, 3085 Hurontario Street, Mississauga, ON
Yuan Ming Supermarket, 3085 Hurontario Street, Mississauga, ON
3. South Asian Stores
Al-Quresh Food, 1879 Lawrence Avenue East, Toronto
Bomby Bazzar, 3601 Lawrence Avenue East, Toronto
Eraa Supermarket, 2607 Eglinton Avenue East, Toronto
Nasr Foods, 1996 Lawrence Avenue East, Toronto
Samah Supermarket, 4470 Kingston road, Toronto
Dhanshiri Super Market, 2978 Danforth Avenue, Toronto
Marhaba Supermarket, 639-643 Gerrard Street East, Toronto
Sarker foods, 3000 Danforth road, Toronto
Bangla town super market, Danforth road, Toronto
Marhaba super market , Parliament street, Toronto
Iqbal foods, Gerrard street, Toronto

76
Thiara Supermarket, 1965 Britannia Rd. West, Unit 4, Mississauga
Asian Food Center, 1075 Ceremonial Drive, Mississauga
Bombay Bazzar , 2875 Lawrence Avenue East, Toronto
Lone Tai Supermarket, 2300 Lawrence Avenue East, Toronto
Sheung Thai Supermarket, 2684 Eglinton Ave. East, Toronto
The Natural Food Depot, 2075 Lawrence Avenue East, Toronto
Top Food Supermarket , 2715 Lawrence Avenue East, Toronto
Yal Market, 2499 Eglinton Avenue East, Toronto

77
Appendix IV: List of Associations
Organization Contact persons
Abu Huraira Masjid Mahad
African Community Services Nicky Jahazi
African Food Basket Shabaka
Brampton Chinese Association Paul Ma
Canadian African Centre Sebastian Wanzama-Piro
Chinese Canadian national Council Karen Sun
Community MicroSkills development Centre Aubrey Carrega
Dixie Bloor nneighbourhood Centre François Sabit
Ewe Cultural Organization Kwesi/Anthony Dogbe
Ethiopian Association in Toronto Lula Seid /Helena Kifle
Isoko Cultural Association Ezuzu
Kenyan Community in Ontario Jeremiah Saringe/Steve Kangethe Gitu
Malton neighbourhood Services Zarina Baghani
Mississuaga Chinese group Lian Jian
Palestine House Pardeep Sandhu and Yuxin Li
Peel Multicultural Council ( PMC) Rasha Shaath
Polycultural immigrant and Community Services Bozena Greszta
Punjabi Connection Brampton Jasjin DerSingh
The Cross- Cultural Services Association William Wang
Thorncliffe Neigbourhood Office ( TNO) Ahmed Hussein
Toronto Public Health Yvonne Raeburn-london
South Riverdale CHC Julie Wong
Sri Lankan Community (Mississauga) Rev. Saranapala
Yorubas in Richmond Mariam Ore
Ajax Ghanaians Kofi Asem