Predictors of Subjective Well Being among Community ...
29
IJISET - International Journal of Innovative Science, Engineering & Technology, Vol. 8 Issue 7, July 2021 ISSN (Online) 2348 – 7968 | Impact Factor (2020) – 6.72 www.ijiset.com 435 Predictors of Subjective Well Being among Community Residing Elders in Ethiopian Sample Girum Tareke Zewude, Derib Gosim Bereded Institute of Behavioural Sciences, Department of Psychology, Wollo University, Ethiopia Email: [email protected]Derib Gosim Bereded Institute of Behavioural Sciences, Department of Psychology, Wollo University, Ethiopia E-mail: [email protected]Abstract This study aimed to assess the subjective well-being and perceived adequacy of social support of the elderly. It is a cross-sectional survey that was conducted with a total of 1789 randomly selected elderly (aged 60 and over). Data were collected by interview rating questionnaire system. Concerning levels of components of subjective well-being, the study revealed that more than half the participants' elders scored low levels of life satisfaction, positive, and high level of negative affect. Then, it is concluded that the level of SWB of the elderly low. The independent t-test results indicated no significant difference between male and female elders concerning life satisfaction, positive affect, support from friends, and significant others' support. However, there was a gender difference in the elderly's perceived adequacy of social support, negative affect, total Subjective well-being, and support from families. Above all, friends' support had the highest predictive power of subjective well-being than other predictive factors. To promote the healthy subjective well-being of the elderly, responsible organizations should establish different programs and activities that enhance the elderly quality of life and promote good social support. Finally, this research's findings only paint part of the picture, so in the future, an in-depth research inquiry should be conducted on this very primary issue that may influence the subjective well-being of the elderly by incorporating other variables. Keywords: Subjective Well-Being, Life Satisfaction, Positive Affect, Negative Affect, Social Support, Elderly 1. Introduction Perhaps one of the most notable demographic developments in the modern era is the older population's progressive demographic aging. In virtually all countries, the most elderly of the older generation is growing faster than its younger segment. According to Help age Internationalm (2004), the proportion of one to ten persons is 60 years old and above, while in 2050 this rate will be one to five, and finally, in 2150, it will be one to three individuals (Kibret & Tareke, 2017a).
-
Upload
khangminh22 -
Category
Documents
-
view
1 -
download
0
Transcript of Predictors of Subjective Well Being among Community ...
IJISET - International Journal of Innovative Science, Engineering & Technology, Vol. 8 Issue 7, July 2021
ISSN (Online) 2348 – 7968 | Impact Factor (2020) – 6.72
www.ijiset.com
435
Predictors of Subjective Well Being among Community Residing Elders in Ethiopian
Sample
Girum Tareke Zewude, Derib Gosim Bereded Institute of Behavioural Sciences, Department of Psychology, Wollo University, Ethiopia
Email: [email protected]
Derib Gosim Bereded Institute of Behavioural Sciences, Department of Psychology, Wollo University, Ethiopia
E-mail: [email protected]
Abstract
This study aimed to assess the subjective well-being and perceived adequacy of social support of the elderly. It is a cross-sectional survey that was conducted with a total of 1789 randomly selected elderly (aged 60 and over). Data were collected by interview rating questionnaire system. Concerning levels of components of subjective well-being, the study revealed that more than half the participants' elders scored low levels of life satisfaction, positive, and high level of negative affect. Then, it is concluded that the level of SWB of the elderly low. The independent t-test results indicated no significant difference between male and female elders concerning life satisfaction, positive affect, support from friends, and significant others' support. However, there was a gender difference in the elderly's perceived adequacy of social support, negative affect, total Subjective well-being, and support from families. Above all, friends' support had the highest predictive power of subjective well-being than other predictive factors. To promote the healthy subjective well-being of the elderly, responsible organizations should establish different programs and activities that enhance the elderly quality of life and promote good social support. Finally, this research's findings only paint part of the picture, so in the future, an in-depth research inquiry should be conducted on this very primary issue that may influence the subjective well-being of the elderly by incorporating other variables.
Keywords: Subjective Well-Being, Life Satisfaction, Positive Affect, Negative Affect, Social Support, Elderly
1. Introduction Perhaps one of the most notable demographic developments in the modern era is the older
population's progressive demographic aging. In virtually all countries, the most elderly of the
older generation is growing faster than its younger segment. According to Help age
Internationalm (2004), the proportion of one to ten persons is 60 years old and above, while
in 2050 this rate will be one to five, and finally, in 2150, it will be one to three individuals
(Kibret & Tareke, 2017a).
IJISET - International Journal of Innovative Science, Engineering & Technology, Vol. 8 Issue 7, July 2021
ISSN (Online) 2348 – 7968 | Impact Factor (2020) – 6.72
www.ijiset.com
436
The later years in the human life cycle are usually characterized by important life
satisfaction and physical changes that may reshape a person's way of living (Kibret &
Tareke, 2017a). With increasing age, the relative significance of psychological health and life
satisfaction will change so that elders will have significantly different relationships among
subjective well-being components more than the younger participants (Ed Diener &
Chan, 2011). This effect will be more pronounced for those elderly in each of the cohorts
as they use these resources to maintain optimal levels of functioning.
For a century, many scientists have been studied what contributes to the elderly subjective
well-being? Some have suggested that subjective well-being/ life satisfaction stems from
good food and fine wine, while others have postulated that it is a function of youth (Ryff &
Keyes, 1995; Ryff & Singer, 2008; Kibret & Tareke, 2017b). Moreover, other previous
studies have postulated subjective well-being due to socio-demographic characteristics,
significant income, physical health status (Ed Diener, 2000; DE SOUZA et al., 2018),
and level of social support and social resources (Wang, 2016).
Hedonic well-being is often conceptualized as three critical aspects of subjective well-being:
life satisfaction, positive and negative affect; these three are known collectively as hedonic
wellbeing (Ed Diener et al., 1999). Research on subjective well-being has a long tradition, but
one rooted in ideas of the satisfaction, happiness, and pleasure of human appetites(Ryff &
Singer, 2008). The ancient Greeks (e.g., Epicurus) and subsequent philosophies of Hobbes
and Bentham explained hedonism's essentials (Ryan & Deci, 2001). Nowadays, hedonic
psychology is defined as the scientific study of what makes experiences and life pleasant and
unpleasant(Newman et al., 2014). Subjective well-being concerns whether people like their
lives or not (Kashdan & Steger, 2007). Satisfaction with one's life implies the fulfillment of
one's wants and needs for one's life or acceptance of one's life circumstances as a whole
(Keng et al., 2004). Because it is inherently an evaluation, life satisfaction judgments have a
large cognitive component(E. Diener, 2009).
A numerous psychological study has explored the sources of people's satisfaction in life,
include one's overall wealth, health, whether one is single or married, male or female, or
young or old(Keng et al., 2004). Regarding socioeconomic standing and life satisfaction,
wealthy people are consistently found to be happier than more impoverished people, but the
effects are small (Ed Diener, 2009a).
IJISET - International Journal of Innovative Science, Engineering & Technology, Vol. 8 Issue 7, July 2021
ISSN (Online) 2348 – 7968 | Impact Factor (2020) – 6.72
www.ijiset.com
437
Besides, the relation between a nation's wealth and average life satisfaction levels is positive
and healthy (Deiner, 2009). Nonetheless, research both within and between countries has
clarified that income increases are not associated with increases in well-being (Ed Diener,
2009a), suggesting that expectations, goals, and comparison processes influence subjective
well-being.
In the last decades, extensive empirical research efforts have been directed at clarifying the
degree of stability and identifying relevant predictors of level and change in life satisfaction
across the lifespan (Steger & Kashdan, 2007; Berg, 2008). Early theories about life
satisfaction in the elderly are divided along two major lines.
One approach is activity theory, which holds that older people have the same needs as middle-
aged people except for the inevitable biological and health changes that accompany the aging
process. Successfully aging persons do not want decreased interaction. They stay active and
substitute less strenuous activities for others that are lost (Bollain, 2017).
In contrast to activity theory, the disengagement theory, which postulates that older people
desire decreased interactions. More older people become increasingly preoccupied with the
self and decreasingly invested in the environment's persons and objects. Within this
framework, successfully aging older persons reach a new equilibrium with greater
psychological distance, altered types of relationships, and decreased social interactions
(Havighurst, 1968 as cited in Bollain, 2017)). In a review of activity and disengagement
theories, Havighurst (1968) concluded that research data had failed to support either of these
approaches. Most have shown that neither view altogether accounts for many known facts
about the elderly. Data from the Kansas City Studies of Adult life (1961-1965) indicated an
overall decrease in engagement in common social roles related to increasing age. But on the
whole, those who were most active at older generations were happier (Bollain, 2017). These
results are supported by (Ed Diener & Chan, 2011); DE SOUZA et al., 2018), who concluded
from an extensive empirical work that older persons who are the most active seem to be the
happiest (When happiness is measured in terms of life satisfaction, morale, self-esteem, etc.).
Based on the literature surveyed, it seemed that much research about subjective well-being in
old age in general and life satisfaction, in particular, was done from a positivistic and
IJISET - International Journal of Innovative Science, Engineering & Technology, Vol. 8 Issue 7, July 2021
ISSN (Online) 2348 – 7968 | Impact Factor (2020) – 6.72
www.ijiset.com
438
empirical point of view. In the present study, participants are viewed as individuals with their
unique perceptions of aging. Individual differences in the judgments of life satisfaction in
individual differences to adapt to the developmental and environmental changes resulting
from aging, focus on the present study. The two critical concepts, social support, and
subjective well-being, have been selected for investigation for several reasons.
Firstly, the definition and measurement of each of these concepts are sound.
Subjective wellbeing incorporates the essential concepts and measures of life satisfaction,
positive and negative affect. Furthermore, the definition and measurement of subjective well-
being has been soundly developed by E. Diener (2009) and incorporates the notion that
judgments of satisfaction with life domains are weighted by the importance of that particular
life domain to the individual. On the other hand, the social network received and perceived
support is a well-known social support dimension that has long been upheld in the literature in
both theory and measurement.
Secondly, the definition and measurement of these three constructs allow their
relationships to be explored without running the risk of including constructs that are, in
essence, identifying the same phenomena. Hence, subjective well-being and the Perceived
adequacy of social support processes associated with it are ideal variables for the current
investigation, as they are likely to be relatively free from confounding overlapping variance.
Finally, there is concrete empirical evidence to suggest that the relationships between
these two concepts are meaningful to the maintenance of a good and meaningful life.
Perceived adequacy of social support has long been established to predict constructs of
subjective well-being. Given the strength of the relationship between demographic variables,
social support, and subjective well-being, the researcher proposes the later framework to be
more accurate.
2. Objective
This study intended to assess the status of the subjective well-being, demographic factors,
and perceived adequacy of social support of the elderly. Specifically, the research was
attempted:
1. To assess the status of the subjective well-being of the elderly population;
IJISET - International Journal of Innovative Science, Engineering & Technology, Vol. 8 Issue 7, July 2021
ISSN (Online) 2348 – 7968 | Impact Factor (2020) – 6.72
www.ijiset.com
439
2. To examine the Correlation of social Support (social network, received support, and
perceived support) and the subjective well-being (total and component) of the elderly
3. To examine the independent contribution of demographic variables (income, marital
status, sex, educational status) and social support (social network, received support, and
perceived support) in predicting the subjective well-being of the elderly;
3. Theoretical and conceptual framework
3.1. Theoretical and conceptual framework of the study
Subjective well-being is not something superficial or imaginary thing. Subjective well-being
is defined as a person's cognitive and affective evaluations of his or her life, including
emotional reactions to events and cognitive judgments of satisfaction and fulfillment (Snyder
& Lopez, 2002). People's SWB can be measured through different assessment devices. The
standard method of measuring subjective well-being is through self-reported questionnaires,
memory measures, behavioral observation, and interviews (Ed Diener, 2009b). Moreover,
there are biological measures of SWB in a laboratory. Some of them are 1. frontal brain
asymmetry; 2. facial electromyography; 3. saliva cortisol level; 4.eye blink startle
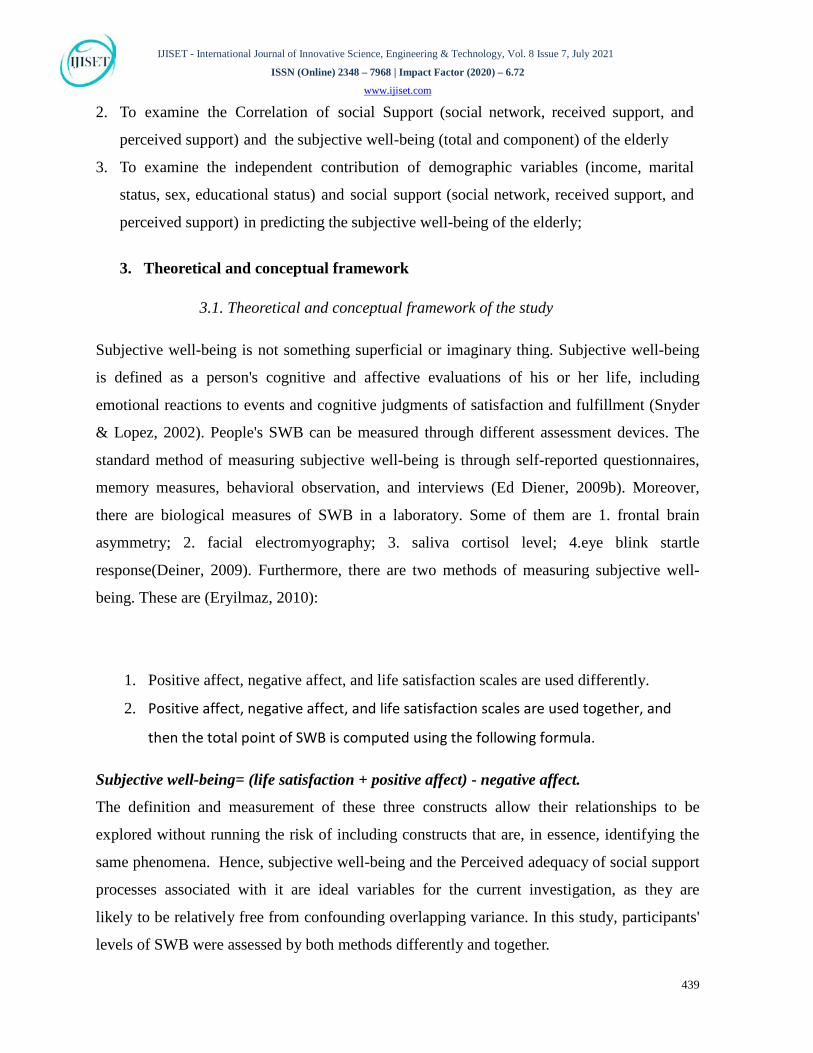
response(Deiner, 2009). Furthermore, there are two methods of measuring subjective well-
being. These are (Eryilmaz, 2010):
1. Positive affect, negative affect, and life satisfaction scales are used differently.
2. Positive affect, negative affect, and life satisfaction scales are used together, and
then the total point of SWB is computed using the following formula.
Subjective well-being= (life satisfaction + positive affect) - negative affect.
The definition and measurement of these three constructs allow their relationships to be
explored without running the risk of including constructs that are, in essence, identifying the
same phenomena. Hence, subjective well-being and the Perceived adequacy of social support
processes associated with it are ideal variables for the current investigation, as they are
likely to be relatively free from confounding overlapping variance. In this study, participants'
levels of SWB were assessed by both methods differently and together.

IJISET - International Journal of Innovative Science, Engineering & Technology, Vol. 8 Issue 7, July 2021
ISSN (Online) 2348 – 7968 | Impact Factor (2020) – 6.72
www.ijiset.com
440
3.2.Components of subjective well-being
Subjective well-being is composed of two components: the affective and cognitive
components. Much of the aging literature shows that older adults illustrate better emotion
regulation than younger adults(Lawton et al., 1992; Fischer, 2009) and report less negative
affect than younger adults and similar positive affect levels (e.g., Mather & Carstensen, 2005).
Furthermore, a consistent finding in cross-cultural research on SWB is that people from Asian
cultures tend to report lower life satisfaction levels and positive affect than North Americans
(Ed Diener, 2009a). To better understand how age and culture differentially influence
subjective well-being, the current study examined the subjective well-being of younger and
older adults in Chinese culture and compared it to younger and older adults in North
American culture(Ed Diener, 2009a).
Perhaps one of the most remarkable demographic developments in modern times is the older
population's progressive demographic aging. In virtually all countries, the most elderly of the
older generation is growing faster than its younger segment. According to Hel page
Internationalm(2004), the proportion of one to ten persons is 60 years old and above, while
in 2050 this rate will be one to five and finally in 2150, it will be one to three individuals
(Kibret & Tareke, 2017a). Ed Diener's model of SWB captures a broad array of conceptions of
self-evaluation. Several of the dimensions associated with SWB closely align with established
developmental outcomes with the elderly population. Thus, subjective well-being is a broad
concept that includes experiencing pleasant emotions, low levels of negative moods, and high
life satisfaction(Snyder & Lopez, 2002). Figure 1 (below) serves to place the concept of SWB
within the broader framework of various well-being concepts. Notably, the well-being
construct has been used in varying settings in which the sub-categories may differ. Thus, the
proposed figure represents by no means a complete definition of the construct.

IJISET - International Journal of Innovative Science, Engineering & Technology, Vol. 8 Issue 7, July 2021
ISSN (Online) 2348 – 7968 | Impact Factor (2020) – 6.72
www.ijiset.com
441
Figure 1: The Concept of SWB in a Heuristic Well- Being Framework: source: the author(s)
3.3.Current Positive Psychological thinking and Subjective Well-Being
According to (M. Seligman, 2010; M. E. P. Seligman et al., 2014), Positive psychology is the
scientific interest in psychological phenomena ranging from the most negative to the most
Well-Being
Hedonism
Eudemonism
Psychological Well-Being
(Ryff and Keyes, 1995)
• Autonomy • Personal Growth • Self-acceptance • Life purpose • Environmental
mastery • Positive relations
Affective Component
Cognitive component
Life Satisfaction
Positive Affect
Subjective Well-Being (E. Diener, 2009)
Negative Affect

IJISET - International Journal of Innovative Science, Engineering & Technology, Vol. 8 Issue 7, July 2021
ISSN (Online) 2348 – 7968 | Impact Factor (2020) – 6.72
www.ijiset.com
442
positive. It is a timely response to what has been described as a fascination with pathology
and negative phenomena. Social psychologists in general and psychologists, in particular,
have primarily focused on individual deficiencies and human pathology. In contrast, positive
psychologists state that it is due time to include positive phenomena. While the study of
pathology has facilitated considerable progress in finding treatment strategies and helping
people with psychological illness, it has also produced a deficit bias to improve their health.
Positive psychology is vital to enhance adolescents' and elders' SWB because of
positive psychology (Deiner, 2009; Ed Diener, 2009a; Ed Diener, 2009b).
• Help young people to cope with the challenges of the elderly successfully.
• Preventing mental health problems and promote good mental health at old age.
• Help older adults improve social skills and living that can have a lasting positive effect
on their lives.
3.4.Social Support and Subjective Well Being of the Elderly
Social Support can be considered as the type and frequency of social contacts. It is also the
degree to which a person perceives that certain support types (e.g., emotional, tangible
assistance) are available. Both social support types have been directly linked to life
satisfaction and quality of life (Haller & Hadler, 2006). It is expected that the more social
support, the easier adjustment to the environmental situation will be. Therefore, it was
hypothesized that: Social Support will predict the subjective well-being of the elderly. The
higher the social support available to older people, the better their quality of life (Dykstra,
2015). Social Support is hardly a uniform or the finished concept itself (McNicholas, 2002).
Social Support is a multidimensional construct that has been conceptualized and measured in
a variety of ways. Most measures of support are three categories:
3.4.1. Social Network
Social network characterized that assess the degree to which a person is socially integrated.
Social integration is understood as being embedded in a social network, for which we can
draw upon various indicators, such as marital status, number of relatives and friends, as well
as frequency and form of contact to them. The social network is characterized by
morphological features (size, density, accessibility, centrality, cluster, sectors) and relational
IJISET - International Journal of Innovative Science, Engineering & Technology, Vol. 8 Issue 7, July 2021
ISSN (Online) 2348 – 7968 | Impact Factor (2020) – 6.72
www.ijiset.com
443
features (strength of the bond, frequency of contact, latent vs. current relationships, duration,
reciprocity, egocentricity vs. altruism, accessibility (Dykstra, 2015).
3.4.2. Received Support
It measures that indicate what a person has received or reported to have received (Dykstra,
2015). In the case of received support, we are concerned with how often and how effectively
helpful actions are performed, taking into account both the observed events and the subjective
assessment (Ermis-Demirtas et al., 2018)
3.4.3. Perceived Support
The perceived support measures capture an individual's beliefs about support availability
(Dykstra, 2015). Measures of perceived Support are the focus of this study. When we examine
social support in the narrow sense, the qualitative and functional aspects of relationships are
core.
3.4.4. Perceived Adequacy of Social Support
Perceived social support is the individual's belief that one or more persons give them
information that they are loved, cared for, esteemed, and valued (McNicholas, 2002). It is
believed that social support enhances subjective wellbeing through a variety of positive
influences that include fostering a sense of meaning in life and the promotion of health.
Conversely, a lack of social support has been linked to a loss of well-being and even
psychopathology(Turner & Marino, 2016).
4. Methods
This part presents the study's location, target population, sampling techniques employed, and
instruments used for data collection, and procedures followed (construction, validation,
administration, scoring, and analysis).
4.1.Design of the study
This study aimed to examine the relative influence of social support on the elderly's subjective
well-being: life satisfaction, positive affect, negative affect, and total subjective well-being.
Total subjective well-being, life satisfaction, positive and negative affect served as the
criterion variables/dependent variables, and social support served as the predictor variables
/independent variables. Thus to achieve the stated objectives, quantitative approaches to data
IJISET - International Journal of Innovative Science, Engineering & Technology, Vol. 8 Issue 7, July 2021
ISSN (Online) 2348 – 7968 | Impact Factor (2020) – 6.72
www.ijiset.com
444
collection have been used.
4.2.Study Site
Data for the study was gathered from Dessie Town, south Wollo zone, and Oromia Zone. The
towns are located in Amhara Regional State, in the North East of Addis Ababa, Ethiopia.
4.3.Population and Sampling
This study's target population is community-residing elders in Dessie administration city,
south wollo zone, and Oromia zone aged 60 years and older. Dessie Town has sixteen (16)
Kebeles, south wollo has 21 woredas, and Oromia Zone has seven woredas with a total
population of 12,497 (6,080 males and 6,417 females),18965 (9978 males and 8987 females),
13648 (6,636 males and 7,012 females) elders respectively(Central Statistical Agency
[Ethiopia] & ICF International, 2011). Descriptive statistics (i.e., frequencies, means, &
standard deviations) were used to summarize the participants' demographic characteristics.
The economic activities of the Towns are highly dependent on trade and agriculture. There
are Orthodox Christians, Muslims, Catholics, and Protestants in the Towns.
Proportionate stratified random sampling was utilized to select woredas and sub-cities of
sample subjects in the study. Initially, the Dessie administration city has 16 kebeles with ten
sub-cities. Three sub-cities were taken randomly. In addition to this South wollo zone has 21
woredas; of these, seven woredas should be taken as a sample, and the Oromia zone has seven
woredas, and of these, three woredas are taken as a sample of the study. A random sample of
three sub-cities and ten woredas were considered in the study using a lottery method from each
of these three strata. Accordingly, the sampled sub-cities from Dessie Town (menafesha,
Banibuha, and Arada sub-cities) were taken. From South Wollo Zone, Ambsel Woreda,
Woreielu, Saint, Werebabo, Kelala, Mekidela, Kalu, and Delanta ), and Oromia Zone
(Senbetie Woreda, Bati Woreda, and Kemisie Town) were taken. Then the researcher visited
each of the Sub-cities and woredas offices to secure information about the elderly. The
researcher was provided with documents to help him in this regard. The total numbers of
elders registered in the three study areas found are 17898 ( 8969 males and 8929 females).
From this complete list of elders, 1789 (897 males and 892 females) were drawn using the
IJISET - International Journal of Innovative Science, Engineering & Technology, Vol. 8 Issue 7, July 2021
ISSN (Online) 2348 – 7968 | Impact Factor (2020) – 6.72
www.ijiset.com
445
proportionate stratified sampling. All 1789 respondents completed the data and were analyzed
for this study giving a response rate of 100%. This sample size is almost 10% of the
population. According to Strang (2015), it is advisable to take 10-30% of the survey design
population.
4.4.Instruments
4.4.1. Measures on Social Support 0T(MSPSS
0TThe Multidimensional Scale of Perceived Social Support (Zimet et al., 1988) is a twelve-item
scale, rated on a 7-point Likert scale, ranging from very strongly disagree (1) to Strongly
agree (7). It measures social support from three sources: family, friends, and a particular
person, measured on three subscales: 0TSignificant Others (SO) (Items 9, 10, 11, and 12),
Family (FA) (Items 1, 2, 3, and 4) and Friends (FR) (Items 5, 6, 7, and 8).0T The total social
support is the sum of the scores from twelve items. The higher the sum of the twelve items
indicates, the higher the level of social support. The MSPSS does not take long to complete,
and since it does not require advanced level reading skills, it is suitable for many populations
of different ages and different education levels (Zimet et al., 1988).In their initial study with
university students, Zimet and his colleagues reported a Cronbach alpha level of .88 for the
scale. They also checked the scale's test-retest reliability and reported this as .85 (Zimet et al.,
1988). 0TFor this study, the multidimensional perceived adequacy of social support-revised
(MSPASS-R) was adapted and used. In the present study, each subscale's reliability was also
high, i.e., α = 0.87 for the family subscale, α = 0.84 for the friend subscale, and α = 0.79 for
the significant others subscale.
4.4.2. Global Life Satisfaction Scale
The global life Satisfaction Scale is a five-item scale developed by (Ed Diener et al., 1985).
The global life satisfaction scores were calculated by summing all the items. The elders' life
satisfaction scores ranged from 7 to 35. Thus, it means a minimum score of 7 and a maximum
score of 35. The following cuts off points were used to classify the elderly population under
each level: then the cutoffs below instead should be: 6-7, 5-6, 4-5, 3-4, 2-3, 1-2. Thus, 31 - 35
extremely satisfied 26 - 30 Satisfied, 21 - 25 slightly satisfied, 20 Neutral, 15 - 19 slightly dissatisfied, 10 -
14 Dissatisfied, and 5 - 9 extremely dissatisfied. Then, the total scores of the items are categorized
into three levels –low (19-5 score), moderate (20) score) and high (35-21) to identify the
levels of elders' life satisfaction.
IJISET - International Journal of Innovative Science, Engineering & Technology, Vol. 8 Issue 7, July 2021
ISSN (Online) 2348 – 7968 | Impact Factor (2020) – 6.72
www.ijiset.com
446
4.4.3. Positive and negative affect scale
The affective dimension was also measured with two factors: (1) positive affect and (2)
negative affect by the Watson et al. (1988) Positive and Negative Affect scale. The positive
and negative affect scale is a 20-item questionnaire; ten Positive affect and negative affect
items were used to assess elderly level of positive and negative feelings (Watson & Tellegen,
1985). Participants rated themselves on a five-point Likert scale ranging from 1= none of the
time to 5=all of the time. Research also has shown that the PANAS scales are a viable
measure for both younger and older adults (Watson et al., 1988).
The positive and negative affect scale is a 10-item scale, each with a minimum score of 10
and a maximum score of 50. Based on the scales of scoring, the next cuts off points were used
to classify the elders under each level: 4-5, 3-4, 2-3, and 1-2. Therefore 40-50-high score, 30-
40-average score, 20-30-slightly below average, 10-20-low score. Then, the total scores of the
items are categorized into three levels –low (10-29score), moderate (30-39 score), and high
(40-50) to identify the levels of elders' PA and NA(Watson et al., 1988).
4.5.Procedures
Initially, the questionnaires' format was reviewed by experienced senior researchers who had
long experience in research. The next step of the study was contacting the sub-cities and
woreda's social-security affairs offices. A discussion was then held about the research
objective and how to get respondents and supplementary information for the study by creating
a good collaboration with them.
4.6.Validation
4.6.1. Expert Judgments
The questionnaire format was reviewed by two elders who had long experience in research
and Dessie Teachers Education College instant through their professional researcher to clarify
and usability of the forms to older adults. Moreover, the face validity of all scales, i.e., the
format, content, and coverage, were comments by two instructors from our University
(currently in the Institute of Teachers Education & Behavioral Sciences). Based on the
feedback given by the judges, the researcher improved the items.
IJISET - International Journal of Innovative Science, Engineering & Technology, Vol. 8 Issue 7, July 2021
ISSN (Online) 2348 – 7968 | Impact Factor (2020) – 6.72
www.ijiset.com
447
4.6.2. Language Translation
The adapted instruments were translated from English into Amharic by one language expert in
Amharic who is believed by the researcher that he has long years of experience in translation,
then back-translated into English by one linguistic Ph.D. instructor in Wollo University. There
was no discrepancy found.
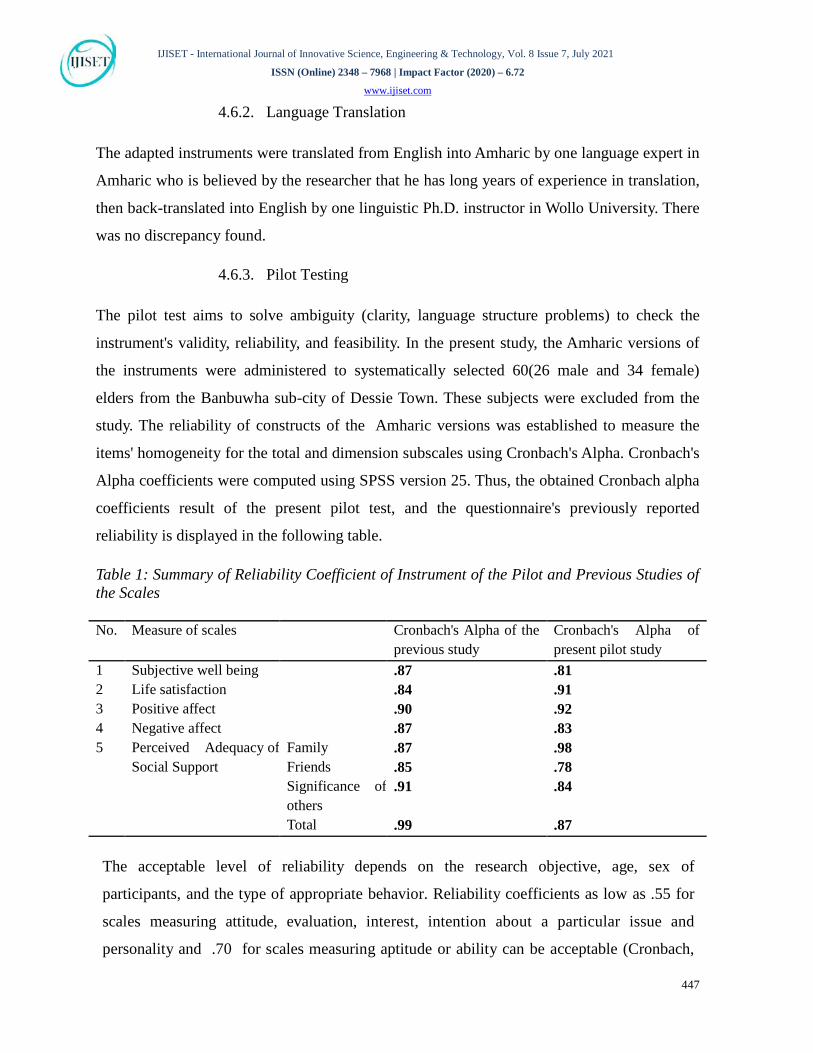
4.6.3. Pilot Testing
The pilot test aims to solve ambiguity (clarity, language structure problems) to check the
instrument's validity, reliability, and feasibility. In the present study, the Amharic versions of
the instruments were administered to systematically selected 60(26 male and 34 female)
elders from the Banbuwha sub-city of Dessie Town. These subjects were excluded from the
study. The reliability of constructs of the Amharic versions was established to measure the
items' homogeneity for the total and dimension subscales using Cronbach's Alpha. Cronbach's
Alpha coefficients were computed using SPSS version 25. Thus, the obtained Cronbach alpha
coefficients result of the present pilot test, and the questionnaire's previously reported
reliability is displayed in the following table.
Table 1: Summary of Reliability Coefficient of Instrument of the Pilot and Previous Studies of the Scales No. Measure of scales Cronbach's Alpha of the
previous study Cronbach's Alpha of present pilot study
1 Subjective well being .87 .81 2 Life satisfaction .84 .91 3 Positive affect .90 .92 4 Negative affect .87 .83 5 Perceived Adequacy of
Social Support Family .87 .98 Friends .85 .78 Significance of others
.91 .84
Total .99 .87 The acceptable level of reliability depends on the research objective, age, sex of
participants, and the type of appropriate behavior. Reliability coefficients as low as .55 for
scales measuring attitude, evaluation, interest, intention about a particular issue and
personality and .70 for scales measuring aptitude or ability can be acceptable (Cronbach,
IJISET - International Journal of Innovative Science, Engineering & Technology, Vol. 8 Issue 7, July 2021
ISSN (Online) 2348 – 7968 | Impact Factor (2020) – 6.72
www.ijiset.com
448
2004). Therefore, the pilot test results in the above indicate that all scales are acceptable
to research participants' evaluation, emotions, attitude, and perception of the concerned
issues. Therefore, the researcher planned to use all the scales to collect data for the main
study.
5. Research Results
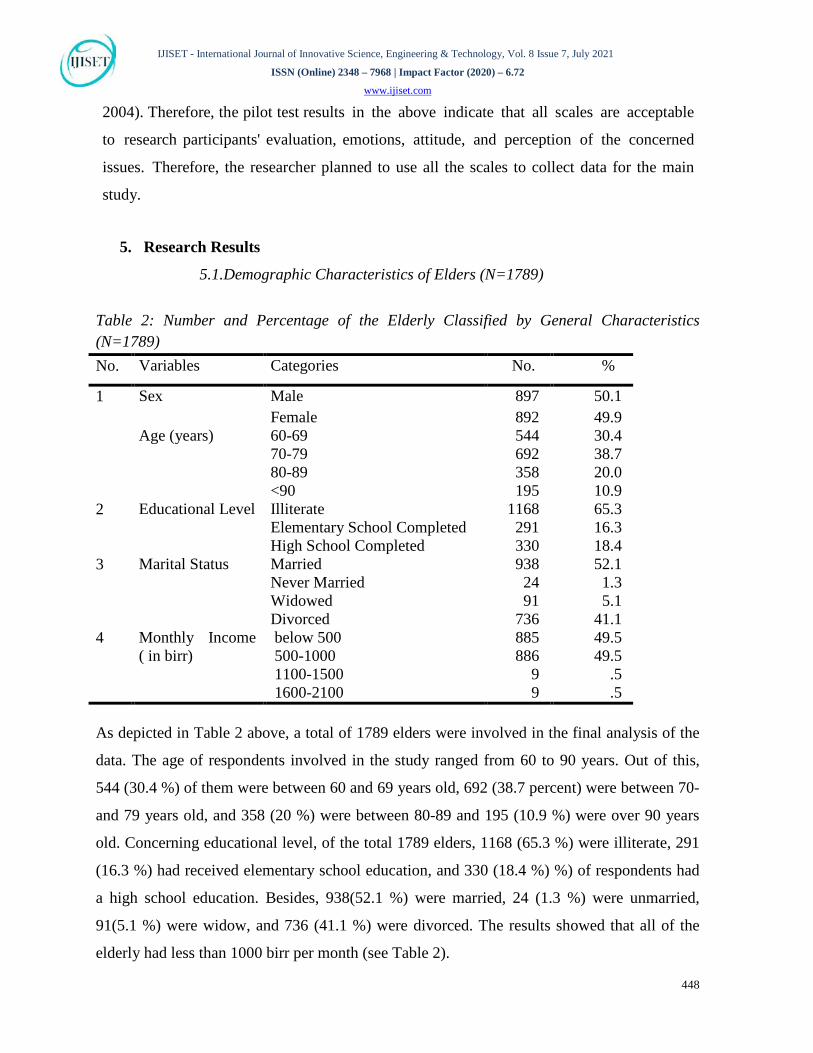
5.1.Demographic Characteristics of Elders (N=1789)
Table 2: Number and Percentage of the Elderly Classified by General Characteristics (N=1789) No. Variables Categories No. %
1 Sex Male 897 50.1 Female 892 49.9
Age (years) 60-69 544 30.4 70-79 692 38.7 80-89 358 20.0 <90 195 10.9
2 Educational Level Illiterate 1168 65.3 Elementary School Completed 291 16.3 High School Completed 330 18.4
3 Marital Status Married 938 52.1 Never Married 24 1.3 Widowed 91 5.1 Divorced 736 41.1
4 Monthly Income ( in birr)
below 500 885 49.5 500-1000 886 49.5 1100-1500 9 .5 1600-2100 9 .5
As depicted in Table 2 above, a total of 1789 elders were involved in the final analysis of the
data. The age of respondents involved in the study ranged from 60 to 90 years. Out of this,
544 (30.4 %) of them were between 60 and 69 years old, 692 (38.7 percent) were between 70-
and 79 years old, and 358 (20 %) were between 80-89 and 195 (10.9 %) were over 90 years
old. Concerning educational level, of the total 1789 elders, 1168 (65.3 %) were illiterate, 291
(16.3 %) had received elementary school education, and 330 (18.4 %) %) of respondents had
a high school education. Besides, 938(52.1 %) were married, 24 (1.3 %) were unmarried,
91(5.1 %) were widow, and 736 (41.1 %) were divorced. The results showed that all of the
elderly had less than 1000 birr per month (see Table 2).

IJISET - International Journal of Innovative Science, Engineering & Technology, Vol. 8 Issue 7, July 2021
ISSN (Online) 2348 – 7968 | Impact Factor (2020) – 6.72
www.ijiset.com
449
5.2.The Elderly Status of Subjective Well-Being
There are two methods of measuring subjective well-being. These are (Eryilmaz, 2010):
1. Positive affect, negative affect, and Life satisfaction scales are used differently.
2. Positive affect, negative affect, and Life satisfaction scales are used together, and then
the total point of SWB is computed using the following formula.
Subjective well-being= (life satisfaction + positive affect) - negative affect.
In this study, both methods were used to assess participants' status of SWB (positive affect,
negative affect, and life satisfaction scales) differently and together.
To determine the SWB (components & total) level of the elderly population, percentage
values, and frequent counts are computed. The results are presented in Table 3 below.
Table 3: Summary results of life satisfaction level, Positive Affect, and Negative Affect of the
Elderly participants (N=1789)
Variables Sex Low Moderate High Life satisfaction Positive Affect Negative Affect
Frequencies % Frequencies % Frequencies % Male Female Total
618 598 1, 216
34.54 33.42 67.96
248 244 492
13.86 13.64 27.50
31 50 81
1.71 2.79 4.52
Male Female Total
884 876 1760
49.41 49.07 98.34
10 11 21
0.56 0.615 1.174
3 3 6
0.17 0.17 0.34
Male Female Total
2 8 10
0.12 0.44 0.56
7 13 20
0.40 0.72 1.12
888 871 1759
49.63 48.68 98.32
Based on the results indicated in Table 3 above, about 81 (4.52%) of the participants scored
high, 492 (27.50%) moderate, and 1216 (68.00%) low levels of life satisfaction. More than
half the participants (68%) of elders scored low levels of life satisfaction. This means most
elderly experienced low life satisfaction. Around 31 (1.71%) of male elders and 50 (2.79%) of
female scored high, 248 (13.86%) of male elderly and 244 (13.64%) of female elders
moderate and 618 (34.54%) of male elders, and 598 (33.42%) of the female elders scored the
low level of life satisfaction. Male elderly achieved relatively higher levels of life satisfaction
IJISET - International Journal of Innovative Science, Engineering & Technology, Vol. 8 Issue 7, July 2021
ISSN (Online) 2348 – 7968 | Impact Factor (2020) – 6.72
www.ijiset.com
450
than females. This result conforms with Qudsyi et al.'s (2020) 's research, which found that
life satisfaction gradually decreased when age increased ( See Table 3).
Regarding the Positive Affect, about 6(0.34%) of the elders scored high, 23(1.174%)
moderate, and 1760(98.34%) low level of positive affect. This implied that 98.34% of the
participants' loss of such significant life-like characteristics feels recurrent happiness,
cheerful, full of life, in good spirits, calm and peaceful. Around 3(0.17%) of males and 3
(0.17%) of the female elderly scored high positive affect, 10 (0.56%) of the males and 11
(0.615%) of the females scored the moderate level of PA and 884 (49.41%) of the males, and
878 (49.07%) of the female elders scored the low level of PA (See Table 3). Finally, 10 (0.56%) of the elders scored low, 20 (1.12%) moderate, and 1759 (98.32%) high
level of negative affect. This implied that 98.32% of the participant's loss of such significant
life characteristics feels recurrent happiness, cheerful, full of life, good spirits, calm, and
peace. Around 888 (49.63%) of males and 871 (48.68%) of the female elderly scored high
negative affect, 7 (0.40%) of the males and 13 (0.726%) of the females scored the moderate
level of NA and 2 (0.112%) of the males, and 8 (0.447%) of the female elders scored the low
level of NA. Since subjective well-being results from life satisfaction plus positive affect
minus negative affect, it can be said that the sampled elders had low levels of subjective well-
being.
5.3.Gender Differences in Variables
There was a statistical significant difference between men and women elders in support from
families, friends, and significant others life satisfaction, positive affect, and TSWB
independent sample t-test was used to check whether there was a substantial difference
between men and women elders. According to the results (see Table 4):
Male and female elderly participants did not differ significantly in regard to life satisfaction,
positive affect, friend ssupport, and support from significant others (t=-1.550, p>0.05; t=-.182,
p>0.05; t=.887, p>0.05; t=1.163, p>0.05 respectively). That is, received support from
friends, significant others, life satisfaction, and positive affect were similar for males and
females. There were contradictory findings regarding students' life satisfaction. For instance,
IJISET - International Journal of Innovative Science, Engineering & Technology, Vol. 8 Issue 7, July 2021
ISSN (Online) 2348 – 7968 | Impact Factor (2020) – 6.72
www.ijiset.com
451
(Efklides & Moraitou, 2013) found females were found to report slightly increased awareness
of life uncertainty, as well as slightly decreased positive and increased negative affect
compared to males, (Valois et al., 2004), found that global life satisfaction reports were not
related to gender. One reason may be the difference in the measure of life satisfaction used in
this study and earlier studies. The majority of earlier studies discussed in this research were
used as a five-item life satisfaction scale. However, in this study, a seven-item measure of life
satisfaction scale was administered.
The other possibility for the difference could be gender equality and the empowerment of
females. In the past, societies fail to recognize females' social values, reducing their life
satisfaction. Now a day's the family, community, and the different government bodies
recognize females' importance. This may be reinforcing an improvement in girls' life
satisfaction. On the other hand, difference was no found in support gained from friends in this
study. This result was consistent with (Wilburn & Smith, 2009), who found that parents'
received support was similar for both sexes.
Male and female elders differed significantly regarding perceived adequacy of social support,
negative affect, total Subjective well-being and received support from families (t=-2.370,
p<0.05, t=-2.636, p>0.05; t=-1.984, p>0.05; t=2.370, p>0.05;). That is male elders in
perceived total adequate support than female elderly participants (M=17.482, SD=11.626)and
support from families M=17.48, SD=4.36; & M=16.98, SD=4.453; But females elders better
than males in Total Subjective well Being (M=45.864, SD=12.375& M=44.74,
SD=11.626),and in negative affect( M=17.45, SD=5.028 & M=16.8584, SD=4.515)
respectively).This finding contradicts that (Bokhorst et al., 2010) reported that families'
received support was similar for boys and girls. However, this finding was similar to the
results reported by (Haller & Hadler, 2006), who found that family support plays a greater
role in protecting and guarding females against depression than males.
There was inconsistent research finding regarding gender differences in elderly research
participants in subjective well-being. For instance, Deiner (2009) found that males reported
higher levels of SWB than females, whereas Eryilmaz (2010b) found no gender difference in
total subjective well-being. The reason for female elderly had significantly higher levels of

IJISET - International Journal of Innovative Science, Engineering & Technology, Vol. 8 Issue 7, July 2021
ISSN (Online) 2348 – 7968 | Impact Factor (2020) – 6.72
www.ijiset.com
452
total point of SWB than male may be the global and national attention for females by different
governmental and non-governmental bodies may cause high levels of SWB than the male
elders.
Table 4: Summary of t- test results for gender comparisons on variables (N=1789; df= 1787)
Note: LS=life satisfaction, PASS=Perceived Adequacy of Social Support, PA=Positive Affect, NA=Negative
Affect, FSS=Friend Social Support, SO=Support from Others, FAM=Family Support, SWB=Subjective Well-
Being
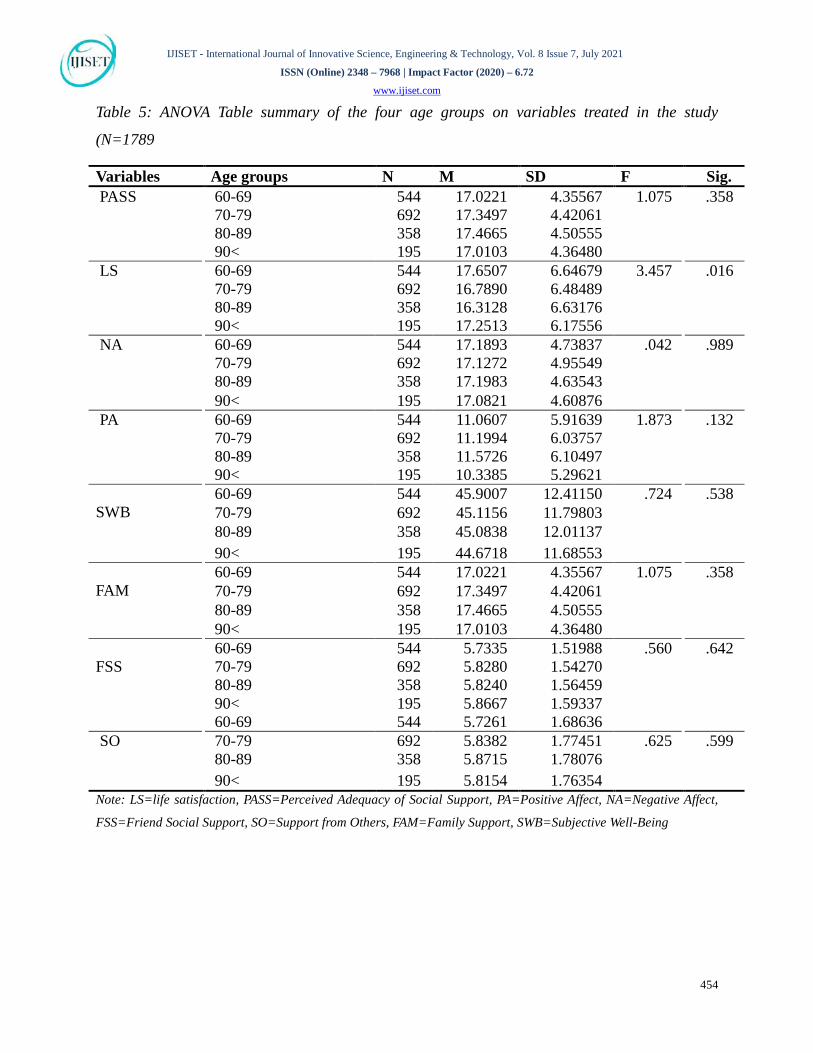
5.4.Age differences in variables
To compare the four age groups (60-69, 70-79, 80-89, and 90+) on Perceived Adequacy of
social Support, life satisfaction, positive affect, negative affect, Support from others, Support
from families, Support from friends, and total subjective well -being one-way analysis of
variance (ANOVA) was carried out. Regarding age , 60-69, 70-79,80-89 and 90 years and
above did not differ significantly in perceived Adequacy of social Support, negative affect,
positive affect, support from others, support from families, support from friends, and total
subjective well -being (F=1.075 P> 0.05, F=0.042 p>0.05, F=1.873 P> 0.05, F=.625 P> 0.05,
F=1.075, F=.560 P> 0.05 and F=.724, P> 0.05respectively). However, the age groups differed
significantly regarding life satisfaction (F=3.457 P> 0.05). This finding, similar to the
Variables Sex Number Mean StD t-test Sign
PASS Male 897 17.4827 4.35941 2.370 .018 Female 892 16.9888 4.45376
LS Male 897 16.7670 6.51495 -1.550 .121 Female 892 17.2466 6.56981
NA Male 897 16.8584 4.51572 -2.636 .008 Female 892 17.4540 5.02799
PA Male 897 11.1126 6.02521 -.182 .856 Female 892 11.1637 5.86149
SWB Male 897 44.7380 11.62651 -1.984 .047 Female 892 45.8643 12.37529
FAM Total Male 897 17.4827 4.35941 2.370 .018 Female 892 16.9888 4.45376
FSS Total Male 897 5.8350 1.55609 .887 .375 Female 892 5.7702 1.53445
SO Total Male 897 5.8562 1.76412 1.163 .245 Female 892 5.7601 1.73064
IJISET - International Journal of Innovative Science, Engineering & Technology, Vol. 8 Issue 7, July 2021
ISSN (Online) 2348 – 7968 | Impact Factor (2020) – 6.72
www.ijiset.com
453
research of (Bokhorst et al., 2010), reported no significant age difference was found for
support gained from families, support from significant others, and support from friends.
Moreover, (Ermis-Demirtas et al., 2018) reported that affective components of SWB seem to
increase with age and life satisfaction remains constant. Differing from the other (Valois et al.
(2004) found that as individuals aged, their levels of SWB and overall life satisfaction
decreased.
Generally, various researchers reported inconsistent results concerning the relationship
between age and subjective well-being. For instance, Eryilmaz (2010) found that SWB and
PWB increase with age. Besides, Kibret & Tareke (2017a) found that age is related to older
adults' well-being. Deiner (2009) reported that SWB decreases with age. One possible
explanation for the difference may be the difference in the use of assessment instruments. The
other reason may be time differences.
After a significant difference was found among 60-69, 70-79,80-89, and 90 years and above
in life Satisfaction, analysis of post hoc multiple comparisons of the four age groups using
Scheffe pairwise comparison test was carried out to identify further the specific pair of means
that produced the observed significant difference.
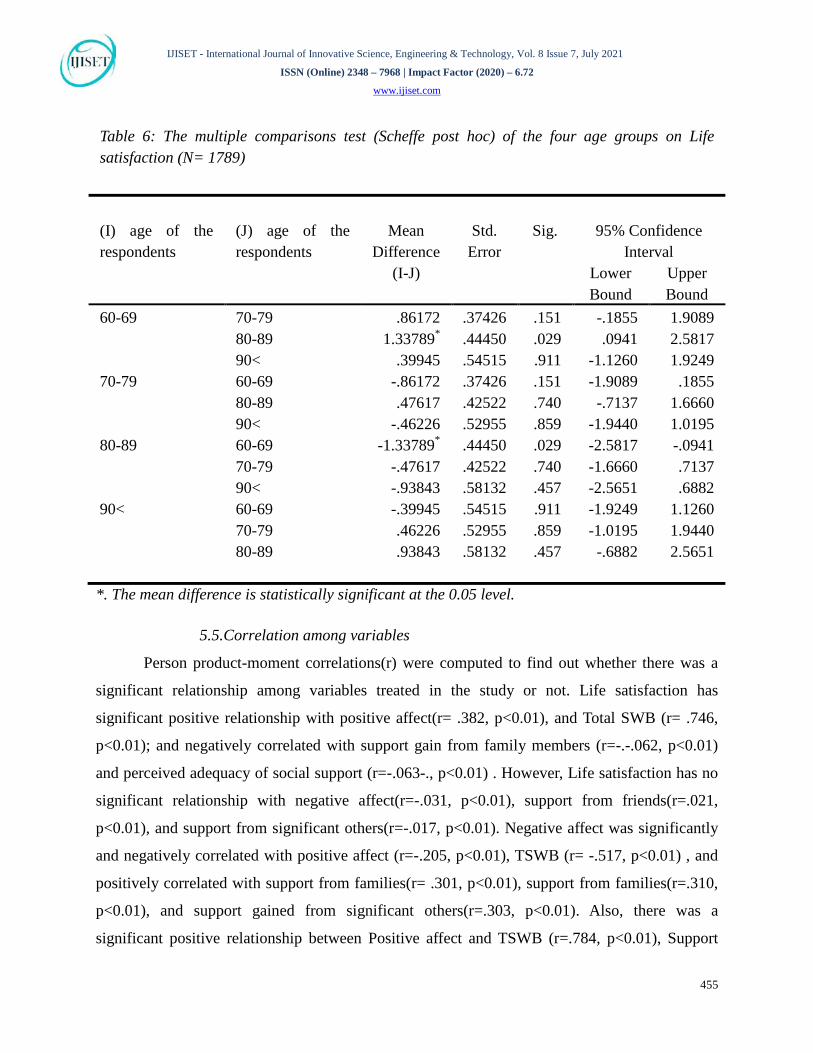
5.4.1. Multiple Comparisons on Life Satisfaction
The Scheffe post hoc tests (see table 6) above showed that:
• There was a significant mean difference (1.3379) between 60-69 and 80-89 elders in
life satisfaction. Elders between 60-69 (M=17.6507, SD=6.6468) had more life
satisfaction than elders aged between 80-89(M=16.3128, SD=6.631). However, no
statistically significant mean difference was found between 60-69 and70-79 and 60-69
and 90 and above in life satisfaction (see Table 6).
IJISET - International Journal of Innovative Science, Engineering & Technology, Vol. 8 Issue 7, July 2021
ISSN (Online) 2348 – 7968 | Impact Factor (2020) – 6.72
www.ijiset.com
454
Table 5: ANOVA Table summary of the four age groups on variables treated in the study
(N=1789
Note: LS=life satisfaction, PASS=Perceived Adequacy of Social Support, PA=Positive Affect, NA=Negative Affect,
FSS=Friend Social Support, SO=Support from Others, FAM=Family Support, SWB=Subjective Well-Being
Variables Age groups N M SD F Sig. PASS 60-69 544 17.0221 4.35567 1.075
.358
70-79 692 17.3497 4.42061 80-89 358 17.4665 4.50555 90< 195 17.0103 4.36480
LS 60-69 544 17.6507 6.64679 3.457 .016 70-79 692 16.7890 6.48489 80-89 358 16.3128 6.63176 90< 195 17.2513 6.17556
NA 60-69 544 17.1893 4.73837 .042 .989 70-79 692 17.1272 4.95549 80-89 358 17.1983 4.63543 90< 195 17.0821 4.60876
PA 60-69 544 11.0607 5.91639 1.873 .132 70-79 692 11.1994 6.03757 80-89 358 11.5726 6.10497 90< 195 10.3385 5.29621
SWB
60-69 544 45.9007 12.41150 .724 .538 70-79 692 45.1156 11.79803 80-89 358 45.0838 12.01137 90< 195 44.6718 11.68553
FAM
60-69 544 17.0221 4.35567 1.075 .358 70-79 692 17.3497 4.42061 80-89 358 17.4665 4.50555 90< 195 17.0103 4.36480
FSS
60-69 544 5.7335 1.51988 .560 .642 70-79 692 5.8280 1.54270 80-89 358 5.8240 1.56459 90< 195 5.8667 1.59337
60-69 544 5.7261 1.68636 SO 70-79 692 5.8382 1.77451 .625 .599
80-89 358 5.8715 1.78076 90< 195 5.8154 1.76354
IJISET - International Journal of Innovative Science, Engineering & Technology, Vol. 8 Issue 7, July 2021
ISSN (Online) 2348 – 7968 | Impact Factor (2020) – 6.72
www.ijiset.com
455
Table 6: The multiple comparisons test (Scheffe post hoc) of the four age groups on Life satisfaction (N= 1789)
(I) age of the respondents
(J) age of the respondents
Mean Difference
(I-J)
Std. Error
Sig. 95% Confidence Interval
Lower Bound
Upper Bound
60-69 70-79 .86172 .37426 .151 -.1855 1.9089 80-89 1.33789P
* .44450 .029 .0941 2.5817 90< .39945 .54515 .911 -1.1260 1.9249
70-79 60-69 -.86172 .37426 .151 -1.9089 .1855 80-89 .47617 .42522 .740 -.7137 1.6660 90< -.46226 .52955 .859 -1.9440 1.0195
80-89 60-69 -1.33789P
* .44450 .029 -2.5817 -.0941 70-79 -.47617 .42522 .740 -1.6660 .7137 90< -.93843 .58132 .457 -2.5651 .6882
90< 60-69 -.39945 .54515 .911 -1.9249 1.1260 70-79 .46226 .52955 .859 -1.0195 1.9440 80-89 .93843 .58132 .457 -.6882 2.5651
*. The mean difference is statistically significant at the 0.05 level.
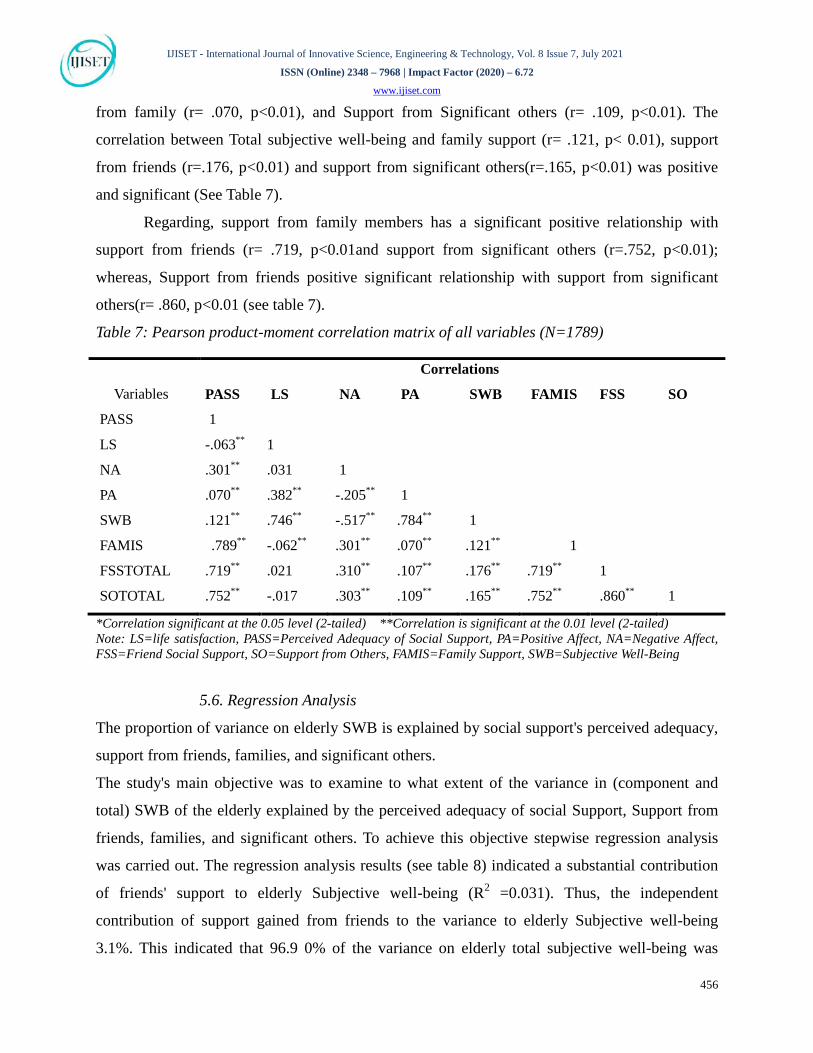
5.5.Correlation among variables
Person product-moment correlations(r) were computed to find out whether there was a
significant relationship among variables treated in the study or not. Life satisfaction has
significant positive relationship with positive affect(r= .382, p<0.01), and Total SWB (r= .746,
p<0.01); and negatively correlated with support gain from family members (r=-.-.062, p<0.01)
and perceived adequacy of social support (r=-.063-., p<0.01) . However, Life satisfaction has no
significant relationship with negative affect(r=-.031, p<0.01), support from friends(r=.021,
p<0.01), and support from significant others(r=-.017, p<0.01). Negative affect was significantly
and negatively correlated with positive affect (r=-.205, p<0.01), TSWB (r= -.517, p<0.01) , and
positively correlated with support from families(r= .301, p<0.01), support from families(r=.310,
p<0.01), and support gained from significant others(r=.303, p<0.01). Also, there was a
significant positive relationship between Positive affect and TSWB (r=.784, p<0.01), Support
IJISET - International Journal of Innovative Science, Engineering & Technology, Vol. 8 Issue 7, July 2021
ISSN (Online) 2348 – 7968 | Impact Factor (2020) – 6.72
www.ijiset.com
456
from family (r= .070, p<0.01), and Support from Significant others (r= .109, p<0.01). The
correlation between Total subjective well-being and family support (r= .121, p< 0.01), support
from friends (r=.176, p<0.01) and support from significant others(r=.165, p<0.01) was positive
and significant (See Table 7).
Regarding, support from family members has a significant positive relationship with
support from friends (r= .719, p<0.01and support from significant others (r=.752, p<0.01);
whereas, Support from friends positive significant relationship with support from significant
others(r= .860, p<0.01 (see table 7).
Table 7: Pearson product-moment correlation matrix of all variables (N=1789)
Variables
Correlations
PASS LS NA PA SWB FAMIS FSS SO
PASS 1
LS -.063P
** 1
NA .301P
** .031 1
PA .070P
** .382P
** -.205P
** 1
SWB .121P
** .746P
** -.517P
** .784P
** 1
FAMIS .789P
** -.062P
** .301P
** .070P
** .121P
** 1
FSSTOTAL .719P
** .021 .310P
** .107P
** .176P
** .719P
** 1
SOTOTAL .752P
** -.017 .303P
** .109P
** .165P
** .752P
** .860P
** 1
*Correlation significant at the 0.05 level (2-tailed) **Correlation is significant at the 0.01 level (2-tailed) Note: LS=life satisfaction, PASS=Perceived Adequacy of Social Support, PA=Positive Affect, NA=Negative Affect, FSS=Friend Social Support, SO=Support from Others, FAMIS=Family Support, SWB=Subjective Well-Being
5.6. Regression Analysis
The proportion of variance on elderly SWB is explained by social support's perceived adequacy,
support from friends, families, and significant others.
The study's main objective was to examine to what extent of the variance in (component and
total) SWB of the elderly explained by the perceived adequacy of social Support, Support from
friends, families, and significant others. To achieve this objective stepwise regression analysis
was carried out. The regression analysis results (see table 8) indicated a substantial contribution
of friends' support to elderly Subjective well-being (R P
2P =0.031). Thus, the independent
contribution of support gained from friends to the variance to elderly Subjective well-being
3.1%. This indicated that 96.9 0% of the variance on elderly total subjective well-being was
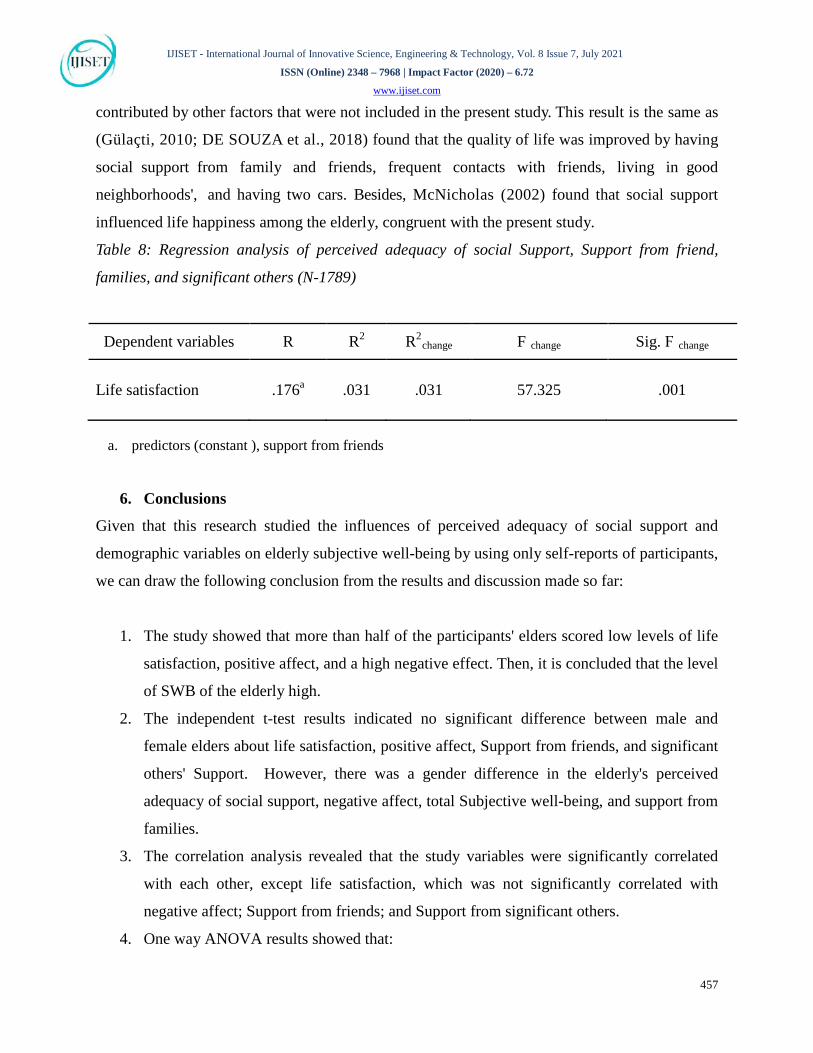
IJISET - International Journal of Innovative Science, Engineering & Technology, Vol. 8 Issue 7, July 2021
ISSN (Online) 2348 – 7968 | Impact Factor (2020) – 6.72
www.ijiset.com
457
contributed by other factors that were not included in the present study. This result is the same as
(Gülaçti, 2010; DE SOUZA et al., 2018) found that the quality of life was improved by having
social support from family and friends, frequent contacts with friends, living in good
neighborhoods', and having two cars. Besides, McNicholas (2002) found that social support
influenced life happiness among the elderly, congruent with the present study.
Table 8: Regression analysis of perceived adequacy of social Support, Support from friend,
families, and significant others (N-1789)
Dependent variables R R P
2 R P
2PRchange
F Rchange Sig. Ϝ Rchange
Life satisfaction .176P
a .031
.031
57.325
.001
a. predictors (constant ), support from friends
6. Conclusions
Given that this research studied the influences of perceived adequacy of social support and
demographic variables on elderly subjective well-being by using only self-reports of participants,
we can draw the following conclusion from the results and discussion made so far:
1. The study showed that more than half of the participants' elders scored low levels of life
satisfaction, positive affect, and a high negative effect. Then, it is concluded that the level
of SWB of the elderly high.
2. The independent t-test results indicated no significant difference between male and
female elders about life satisfaction, positive affect, Support from friends, and significant
others' Support. However, there was a gender difference in the elderly's perceived
adequacy of social support, negative affect, total Subjective well-being, and support from
families.
3. The correlation analysis revealed that the study variables were significantly correlated
with each other, except life satisfaction, which was not significantly correlated with
negative affect; Support from friends; and Support from significant others.
4. One way ANOVA results showed that:
IJISET - International Journal of Innovative Science, Engineering & Technology, Vol. 8 Issue 7, July 2021
ISSN (Online) 2348 – 7968 | Impact Factor (2020) – 6.72
www.ijiset.com
458
• The four age categories of elders did not differ significantly in Perceived
Adequacy of social Support, negative affect, positive affect, Support from others,
Support from families, Support from friends, and total subjective well -being.
However, the age groups differed significantly regarding life satisfaction.
• Analysis by the Scheffe comparisons showed that: The Scheffe comparisons of the
variables for the age groups indicated a significant difference between 60-69 age
and 80-89 elders in life satisfaction.
5. The regression analysis results indicated a significant contribution of support gained from
friends to the variance to elderly Subjective well-being 3.1% and had a significant
positive contribution to the elderly's subjective well-being.
7. Recommendations
Based on the significant findings and conclusions made, the following possible solutions which
can enhance the subjective well-being level of the elderly were recommended:
1. Understanding the status of the elderly regarding their subjective well-being and
perceived adequacy of social support enables different organizations or professionals in
the area to design various programs that help the elderly have a better quality of life.
2. The findings of male and female elders' differences regarding adolescents SWB have
significant social workers, nurses, teachers, and a counselor who may be working with
adolescents of both sexes to foster their well-being.
3. Older people's economic potential needs to be supported through policy action to help
those older people stay economically stable for longer, in both formal and informal
sectors.
4. Community active programs, like the elderly club, effective participation,
rehabilitation center, etc., should be organized for better care and support for the
elderly in their area.
5. Educational institutions like Wollo University, Dessie, and Kemissie college of
Teachers education should encourage and provide life skill training for older persons.
Concerning the educational level, the study revealed that subjective well-being increases
along with an increase in the educational level of the elderly. It is advisable that Life
skill training would also provide them with an awareness of their environment, which, in

IJISET - International Journal of Innovative Science, Engineering & Technology, Vol. 8 Issue 7, July 2021
ISSN (Online) 2348 – 7968 | Impact Factor (2020) – 6.72
www.ijiset.com
459
turn, increases the subjective well-being of the elderly. Regarding this, kinds of
literature have argued that life skill training is vital for older persons for their practical
life.
6. Finally, this study is limited in Dessie Town; South Wollo Zone, and Oromia Zone;
therefore, further research should be conducted in-depth by covering the large town and
including different variables
Declaration of Conflicting Interests
The author(s) declared no potential conflicts of interest concerning the research, authorship, and
publication of this article.
Acknowledgment
We wish to express our sincerest appreciation to the elderly participants and social affairs
officers in all study areas. Their voluntary contribution and their provision of personal data in the
study was invaluable to us.
Funding
The author(s) received financial support for the research, authorship, and publication of this
article from Wollo University, Ethiopia, Research Directorate office.
References
Berg, A. I. (2008). Life Satisfaction in Late Life: Markers and Predictors of Level and Change
Among 80+ Year Olds. UNIVERSITY OF GOTHENBURG.
Bokhorst, C. L., Sumter, S. R., & Westenberg, P. M. (2010). Social support from parents, friends,
classmates, and teachers in children and adolescents aged 9 to 18 years: Who is perceived as
most supportive? Social Development, 19(2), 417–426. https://doi.org/10.1111/j.1467-
9507.2009.00540.x
Bollain, A. D.-T. (2017). Political Economy of Aging in Latin America and the Caribbean:
Economic (In)Security of Older Persons in the Twenty-First Century. Open Journal of
Social Sciences, 05(08), 83–100. https://doi.org/10.4236/jss.2017.58007
Central Statistical Agency [Ethiopia], & ICF International. (2011). Ethiopia Demographic and
Health Survey 2011.
IJISET - International Journal of Innovative Science, Engineering & Technology, Vol. 8 Issue 7, July 2021
ISSN (Online) 2348 – 7968 | Impact Factor (2020) – 6.72
www.ijiset.com
460
Cronbach, L. (2004). My Current Thoughts on Coefficient Alpha and Successor Procedures.
Educational and Psychological Measurement, 64(3), 391–418.
https://doi.org/10.1177/0013164404266386
DE SOUZA, L. N. N., DE CARVALHO, P. H. B., & Ferreira, M. E. C. (2018). Quality of life
and subjective well-being of physically active elderly people: A systematic review. Journal
of Physical Education and Sport, 18(3), 1615–1623.
https://doi.org/10.7752/jpes.2018.03237
Deiner, E. (2009). Assesing Well Being:The Collected Works of Ed Diener (Vol. 39).
https://doi.org/10.1007/978-90-481-2354-4
Diener, E. (2009). The science of well-being: The collected works of Diener (Vol. 37). Social
Indicators Research Series. https://doi.org/10.1093/acprof:oso/9780198567523.001.0001
Diener, Ed. (2000). Subjective well-being: The science of happiness and a proposal for a national
index. American Psychologist, 55(1), 34–43. https://doi.org/10.1037/0003-066X.55.1.34
Diener, Ed. (2009a). Culture and Well-Being:The Collected Works of Ed Diener (Vol. 38).
https://doi.org/10.1007/978-90-481-2352-0
Diener, Ed. (2009b). The Science of Well-Being:The Collected Works of Ed Diener (Vol. 37).
https://doi.org/10.1007/978-90-481-2350-6
Diener, Ed, & Chan, M. Y. (2011). Happy People Live Longer: Subjective Well-Being
Contributes to Health and Longevity. Applied Psychology: Health and Well-Being, 3(1), 1–
43. https://doi.org/10.1111/j.1758-0854.2010.01045.x
Diener, Ed, Emmons, R. A., Larsen, R. J., &, & Griffin, S. (1985). The Satisfaction With Life
Scale. Journal of Personality Assessment, 49(1), 71–75.
https://doi.org/10.1207/s15327752jpa4901
Diener, Ed, Suh, E. M., Lucas, R. E., & Smith, H. L. (1999). Subjective well-being: Three
decades of progress. Psychological Bulletin, 125(2), 276–302. https://doi.org/10.1037/0033-
2909.125.2.276
Dykstra, P. A. (2015). Aging and Social Support. The Blackwell Encyclopedia of Sociology,
January 2007. https://doi.org/10.1002/9781405165518.wbeosa033.pub2
Efklides, A., & Moraitou, D. (2013). A Positive Psychology Perspective on Quality of Life (Vol.
51). Springer Science+Business Media Dordrecht 2013. https://doi.org/10.1007/978-94-
007-4963-4

IJISET - International Journal of Innovative Science, Engineering & Technology, Vol. 8 Issue 7, July 2021
ISSN (Online) 2348 – 7968 | Impact Factor (2020) – 6.72
www.ijiset.com
461
Ermis-Demirtas, H., Watson, J. C., Karaman, M. A., Freeman, P., Kumaran, A., Haktanir, A., &
Streeter, A. M. (2018). Psychometric Properties of the Multidimensional Scale of Perceived
Social Support Within Hispanic College Students. Hispanic Journal of Behavioral Sciences,
40(4), 472–485. https://doi.org/10.1177/0739986318790733
Eryilmaz, A. (2010). Development and application of three-tier heat and temperature test:
Sample of bachelor and students graduate. Egitim Arastirmalari - Eurasian Journal of
Educational Research, 40, 53–76.
Fischer, J. A. (2009). Subjective Well-Being as Welfare Measure: Concepts and Methodology.
16619. https://mpra.ub.uni-muenchen.de/16619/
Gülaçti, F. (2010). The effect of perceived social support on subjective well-being. Procedia -
Social and Behavioral Sciences, 2(2), 3844–3849.
https://doi.org/10.1016/j.sbspro.2010.03.602
Haller, M., & Hadler, M. (2006). How social relations and structures can produce happiness and
unhappiness: An international comparative analysis. Social Indicators Research, 75(2),
169–216. https://doi.org/10.1007/s11205-004-6297-y
Help Age International. (2004). The aging and development report. Poverty, independence,
andthe world’s older people. http://www.ifafiv.org/attachments/
Kashdan, T. B., & Steger, M. F. (2007). Curiosity and pathways to well-being and meaning in
life: Traits, states, and everyday behaviors. Motivation and Emotion, 31(3), 159–173.
https://doi.org/10.1007/s11031-007-9068-7
Keng, K. A., Kuan, T. S., Jiuan, T. S., & Kwon, J. (2004). Life Satisfaction. Understanding
Singaporeans, January 2001, 51–67. https://doi.org/10.1142/9789812794895_0004
Kibret, B. T., & Tareke, G. (2017a). Psychological Wellbeing of Elders as a Function of
Religious Involvement, Spirituality and Personal Meaning in Life. Clinical and
Experimental Psychology, 03(02). https://doi.org/10.4172/2471-2701.1000153
Kibret, B. T., & Tareke, G. (2017b). The Contribution of Instructor, Peer and University Support
for Promoting Psychological Well-Being among Students in the Amhara Regional
Universities. Clinical and Experimental Psychology, 03(02). https://doi.org/10.4172/2471-
2701.1000154
Lawton, M. P., Kleban, M. H., Rajagopal, D., & Dean, J. (1992). Dimensions of affective
experience in three age groups. Psychology and Aging, 7(2), 171–184.
IJISET - International Journal of Innovative Science, Engineering & Technology, Vol. 8 Issue 7, July 2021
ISSN (Online) 2348 – 7968 | Impact Factor (2020) – 6.72
www.ijiset.com
462
https://doi.org/10.1037/0882-7974.7.2.171
Mather, M., & Carstensen, L. L. (2005). Aging and motivated cognition: The positivity effect in
attention and memory. Trends in Cognitive Sciences, 9(10), 496–502.
https://doi.org/10.1016/j.tics.2005.08.005
McNicholas, S. L. (2002). Social Support and Positive Health Practices. Western Journal of
Nursing Research, 24(7), 772–787. https://doi.org/10.1177/019394502237387
Newman, D. B., Tay, L., & Diener, E. (2014). Leisure and Subjective Well-Being: A Model of
Psychological Mechanisms as Mediating Factors. Journal of Happiness Studies, 15(3), 555–
578. https://doi.org/10.1007/s10902-013-9435-x
Ryan, R. M., & Deci, E. L. (2001). On Happiness and Human Potentials: A Review of Research
on Hedonic and Eudaimonic Well-Being. Annual Review of Psychology, 52(1), 141–166.
https://doi.org/10.1146/annurev.psych.52.1.141
Ryff, C. D., & Keyes, C. L. M. (1995). The Structure of Psychological Well-Being Revisited.
Journal of Personality and Social Psychology, 69(4), 719–727.
Ryff, C. D., & Singer, B. H. (2008). Know thyself and become what you are: a eudaimonic
approach to psychological well-being. Journal of Happiness Studies, 9, 13–39.
https://doi.org/10.1007/s10902-006-9019-0
Seligman, M. (2010). Flourish: Positive Psychology and Positive Interventions. The University
of Michigan.
Seligman, M. E. P., &, & Csikszentmihalyi, M. (2014). Positive Psychology: An Introduction.
Flow and the Foundations of Positive Psychology (Vol. 55, Issue 1, pp. 5–14). Springer
Science+Business Media Dordrecht. https://doi.org/10.1007/978-94-017-9088-8_18
Snyder, C. R., & Lopez, S. J. (2002). Handbook Of Positive Psychology. Oxford University
Press. https://doi.org/papers2://publication/uuid/F5886CDC-3CE3-42C1-B894-
1305B97D0745
Steger, M. F., & Kashdan, T. B. (2007). Stability and specificity of meaning in life and life
satisfaction over one year. Journal of Happiness Studies, 8(2), 161–179.
https://doi.org/10.1007/s10902-006-9011-8
Strang, K. D. (2015). The Palgrave Handbook of Research Design in Business and Management.
https://doi.org/10.1057/9781137484956
Turner, R. J., & Marino, F. (2016). Social Support and Social Structure : A Descriptive
IJISET - International Journal of Innovative Science, Engineering & Technology, Vol. 8 Issue 7, July 2021
ISSN (Online) 2348 – 7968 | Impact Factor (2020) – 6.72
www.ijiset.com
463
Epidemiology. Journal of Health and Social Behavior, 35(3), 193–212.
https://doi.org/http://www.jstor.org/stable/2137276
Valois, R. F., Zullig, K. J., Huebner, E. S., & Drane, J. W. (2004). Physical Activity Behaviors
and Perceived Life Satisfaction Among Public High School Adolescents. Acta
Crystallographica Section B, 74(2), 59–65. https://doi.org/https://doi.org/10.1111/j.1552-
3934.2009.00006.x
Wang, X. (2016). Subjective well-being associated with size of social network and social support
of elderly. Journal of Health Psychology, 21(6), 1037–1042.
https://doi.org/10.1177/1359105314544136
Watson, D., Clark, L. A., & Tellegen, A. (1988). Development and Validation of Brief Measures
of Positive and Negative Affect: The PANAS Scales. Journal of Personality and Social
Psychology, 54(6), 1063–1070. https://doi.org/10.1037/0022-3514.54.6.1063
Watson, D., & Tellegen, A. (1985). Toward a Consensual Structure of Mood. Psychological
Bulletin, 98(2), 219–235. https://doi.org/10.1037/0033-2909.98.2.219
Wilburn, V. R., & Smith, D. E. (2009). Relationships Among Selected Demographic Variables
and Adolescent Psychosocial Well-Being. Family & Consumer Sciences Research Journal,
38(1), 63–75. https://doi.org/10.1111/j.1552-3934.2009.00006.x
Zimet, G. D., Dahlem, N. W., Zimet, S. G., & Farley, G. K. (1988). The Multidimensional Scale
of Perceived Social Support. Journal of Personality Assessment, 52(1), 30–41.
https://doi.org/10.1207/s15327752jpa5201_2