Prediction of pKa Values for Neutral and Basic Drugs based ...
13
1 SCIENTIFIC REPORTS | (2018) 8:3991 | DOI:10.1038/s41598-018-22332-7 www.nature.com/scientificreports Prediction of pKa Values for Neutral and Basic Drugs based on Hybrid Artificial Intelligence Methods Mengshan Li , Huaijing Zhang, Bingsheng Chen, Yan Wu & Lixin Guan The pKa value of drugs is an important parameter in drug design and pharmacology. In this paper, an improved particle swarm optimization (PSO) algorithm was proposed based on the population entropy diversity. In the improved algorithm, when the population entropy was higher than the set maximum threshold, the convergence strategy was adopted; when the population entropy was lower than the set minimum threshold the divergence strategy was adopted; when the population entropy was between the maximum and minimum threshold, the self-adaptive adjustment strategy was maintained. The improved PSO algorithm was applied in the training of radial basis function artificial neural network (RBF ANN) model and the selection of molecular descriptors. A quantitative structure-activity relationship model based on RBF ANN trained by the improved PSO algorithm was proposed to predict the pKa values of 74 kinds of neutral and basic drugs and then validated by another database containing 20 molecules. The validation results showed that the model had a good prediction performance. The absolute average relative error, root mean square error, and squared correlation coefficient were 0.3105, 0.0411, and 0.9685, respectively. The model can be used as a reference for exploring other quantitative structure-activity relationships. As an important step in drug design, the quantitative structure-activity relationship (QSAR) study has become one of the most active branches because it can improve the efficiency of drugs by computer simulation and pro- vide ideas for designing new drugs 1 . e QSAR study is also important in computer science, chemistry, pharmacy and life sciences 2 . e efficacy of drugs is mainly achieved by activating the acidity coefficient, which is called pKa constant and denotes the capability of an acid to dissociate hydrogen ions 3,4 . e pKa value is an important parameter in drug design and determines pharmacological activity. e experimental measurement method of pKa value is relatively cumbersome and time-consuming. erefore, it is necessary to establish an accurate and efficient pKa prediction model 5,6 . Model establishment is one of the key steps in QSAR research. e traditional model establishment methods include linear regression and least square method 7,8 . e modern computing methods consist of support vec- tor machines (SVM) 9 , artificial neural networks (ANN) 10–13 , and various intelligent algorithms 14,15 . Polanski 16 proposed a model utilizing ANN and partial least squares (PLS) to study the relationship between molecular surface area and pKa value and predicted the pKa values of aromatic acids and alkyl acids. Luan 17 proposed a pKa prediction model based on the heuristic method (HM) and radial basis function artificial neural network (RBF ANN) and obtained the better prediction performance. Previous studies confirmed that the ANN model had the better performance in QSAR modelling 18,19 , but the performance of ANN depended on its training algorithm. e training algorithm plays a decisive role in RBF ANN model and various evolutionary algorithms have been successfully applied in the training of RBF ANN 20–23 . e selection of molecular descriptors largely determines the quality of QSAR model 24–26 . ere are many selection methods of molecular descriptors, which can be mainly divided into two categories: traditional step- wise selection methods (including the PLS method and its variants) and the modern search algorithm based on optimization strategy 27,28 . e first category is simple, direct, and efficient, but it fails to achieve the global opti- mum, especially in the complex data sets. e second category is a global optimal method and shows significant advantages. It is easy to search the optimal solution and suitable to deal with complex large data sets. erefore, the second category has become one of the hotspots 29 . College of Physics and Electronic Information, Gannan Normal University, Ganzhou, Jiangxi, 341000, China. Correspondence and requests for materials should be addressed to M.L. (email: [email protected]) Received: 4 September 2017 Accepted: 21 February 2018 Published: xx xx xxxx OPEN
-
Upload
khangminh22 -
Category
Documents
-
view
1 -
download
0
Transcript of Prediction of pKa Values for Neutral and Basic Drugs based ...

1Scientific RePoRts | (2018) 8:3991 | DOI:10.1038/s41598-018-22332-7
www.nature.com/scientificreports
Prediction of pKa Values for Neutral and Basic Drugs based on Hybrid Artificial Intelligence MethodsMengshan Li , Huaijing Zhang, Bingsheng Chen, Yan Wu & Lixin Guan
The pKa value of drugs is an important parameter in drug design and pharmacology. In this paper, an improved particle swarm optimization (PSO) algorithm was proposed based on the population entropy diversity. In the improved algorithm, when the population entropy was higher than the set maximum threshold, the convergence strategy was adopted; when the population entropy was lower than the set minimum threshold the divergence strategy was adopted; when the population entropy was between the maximum and minimum threshold, the self-adaptive adjustment strategy was maintained. The improved PSO algorithm was applied in the training of radial basis function artificial neural network (RBF ANN) model and the selection of molecular descriptors. A quantitative structure-activity relationship model based on RBF ANN trained by the improved PSO algorithm was proposed to predict the pKa values of 74 kinds of neutral and basic drugs and then validated by another database containing 20 molecules. The validation results showed that the model had a good prediction performance. The absolute average relative error, root mean square error, and squared correlation coefficient were 0.3105, 0.0411, and 0.9685, respectively. The model can be used as a reference for exploring other quantitative structure-activity relationships.
As an important step in drug design, the quantitative structure-activity relationship (QSAR) study has become one of the most active branches because it can improve the efficiency of drugs by computer simulation and pro-vide ideas for designing new drugs1. The QSAR study is also important in computer science, chemistry, pharmacy and life sciences2. The efficacy of drugs is mainly achieved by activating the acidity coefficient, which is called pKa constant and denotes the capability of an acid to dissociate hydrogen ions3,4. The pKa value is an important parameter in drug design and determines pharmacological activity. The experimental measurement method of pKa value is relatively cumbersome and time-consuming. Therefore, it is necessary to establish an accurate and efficient pKa prediction model5,6.
Model establishment is one of the key steps in QSAR research. The traditional model establishment methods include linear regression and least square method7,8. The modern computing methods consist of support vec-tor machines (SVM)9, artificial neural networks (ANN)10–13, and various intelligent algorithms14,15. Polanski16 proposed a model utilizing ANN and partial least squares (PLS) to study the relationship between molecular surface area and pKa value and predicted the pKa values of aromatic acids and alkyl acids. Luan17 proposed a pKa prediction model based on the heuristic method (HM) and radial basis function artificial neural network (RBF ANN) and obtained the better prediction performance. Previous studies confirmed that the ANN model had the better performance in QSAR modelling18,19, but the performance of ANN depended on its training algorithm. The training algorithm plays a decisive role in RBF ANN model and various evolutionary algorithms have been successfully applied in the training of RBF ANN20–23.
The selection of molecular descriptors largely determines the quality of QSAR model24–26. There are many selection methods of molecular descriptors, which can be mainly divided into two categories: traditional step-wise selection methods (including the PLS method and its variants) and the modern search algorithm based on optimization strategy27,28. The first category is simple, direct, and efficient, but it fails to achieve the global opti-mum, especially in the complex data sets. The second category is a global optimal method and shows significant advantages. It is easy to search the optimal solution and suitable to deal with complex large data sets. Therefore, the second category has become one of the hotspots29.
College of Physics and Electronic Information, Gannan Normal University, Ganzhou, Jiangxi, 341000, China. Correspondence and requests for materials should be addressed to M.L. (email: [email protected])
Received: 4 September 2017
Accepted: 21 February 2018
Published: xx xx xxxx
OPEN

www.nature.com/scientificreports/
2Scientific RePoRts | (2018) 8:3991 | DOI:10.1038/s41598-018-22332-7
Several commonly used evolutionary algorithms, such as genetic algorithm, particle swarm optimization algo-rithm, ant colony algorithm, and firefly algorithm, have been successfully applied in the modeling of QSAR and the selection of molecular descriptors30–32. However, evolutionary algorithms have many shortcomings, such as premature convergence, and slow local search and the developed QSAR models are unsatisfactory. Therefore, an improved PSO algorithm, called CSAPSO-EDCD algorithm, based on population entropy diversity, convergence/divergence strategy and the self-adaptive adjustment strategy of weight factor was proposed. The CSAPSO-EDCD algorithm was applied in RBF ANN training and the selection of molecular descriptors in order to develop an efficient and accurate hybrid intelligent QSAR model for predicting the pKa values of neutral and basic drugs and exploring other QSAR models based on protonation changes upon the binding33–39 and molecular fingerprint similarity search40–43.
Theories and MethodsThe model proposed in this paper involves several theories: RBF ANN, PSO and its improved algorithm.
RBF ANN. Radial basis function artificial neural network (RBF ANN) is one of the most widely used forward neural network models44,45. It has three layers of network structures: input layer, hidden layer, and output layer. The activation function adopted in the paper is the gauss function and defined as:
g x x c( ) exp ,(1)i k
k i
i
2
2σ=
−
−
where x k n(1 )k ≤ ≤ is the kth output vector; ≤ ≤c i c(1 )i is the basis function center; σi is the spreading con-stant; n is the number of samples; c is the number of hidden nodes. The network output is defined as:
O x w g x( ) ( ),(2)k
i
c
i i k1
∑==
where wi is the connection weight of the ith hidden node.However, the artificial neural network has many problems to be solved. For example, the performance is
directly related to the optimization of the network weight. The training process of RBF ANN can be considered as the optimization process of function center, spreading constant and connection weight, namely, ci, σi, wi.
Improved PSO Algorithm. Standard PSO algorithm. PSO is a widely applied population evolutionary algorithm proposed by Eberhart and Kennedy46,47 and characterized by fast convergence, simple parameter adjustment and easy realization. The standard PSO algorithm updates its own speed and position, as expressed in Eqs (1) and (2):
ω= + − + −+ ( )( )v v c p x c p x ; (3)i,dk 1
i,dk
1 i,dk
i,dk
2 g,dk
i,dk
= ++ +x x v ; (4)i,dk 1
i,dk
i,dk 1
where i = 1, …, m; ω is the inertia weight factor, which controls the inertia of the particles and possesses the capa-bility of expanding search space; C1 and C2, which are the learning factors, represent the statistical acceleration weight when each particle arrives at the extreme-value position; v i,d
k and xi,dk respectively denote the velocity and
position of the i-th particle in the d-dimensional space at k-th iteration; pi,dk is the local best position of i-th parti-
cle in the d-dimensional space; pg,dk is the global best position of the population upon arriving at the d-dimensional
space.However, PSO algorithm cannot ensure the optimal solution in each execution. In order to obtain the optimi-
zation network parameters, an improved PSO algorithm, called CSAPSO-EDCD, based on population entropy diversity, convergence/divergence strategy and the self-adaptive strategy, has been developed in this paper and then applied in the optimization of the function center, spreading constant and connection weight of RBF ANN.
Chaotic self-adaptive strategy. Thus, in this study, the chaotic self-adaptive PSO algorithm, or CSAPSO algo-rithm, is deduced by applying Lorenz chaos equations and self-adaptive strategies in the adjustment of the learn-ing factors and inertia weight in the PSO algorithm. The inertia weight factor, ω, is changed to Eq. (5).
k k kPgbest( )/Plbest ( ) / , (5)max ave max min maxω ω ω ω= − − − ×
where ωmax and ωmin respectively denote the maximum and minimum inertia weights; Pgbest(k) denotes the global best fitness in the k-th iteration; Plbestave denotes the average local best fitness; kmax denotes the maximum number of iterations; and k denotes the current iteration.
The learning factors C1 and C2 are obtained with the chaotic sequences generated by the Lorenz equations in Eq. (6).

www.nature.com/scientificreports/
3Scientific RePoRts | (2018) 8:3991 | DOI:10.1038/s41598-018-22332-7
dxdt
a x y
dydt
rx y xz
dzdt
xy bz
( )
,
(6)
= − −
= − −
= −
where a, b, and r are the positive control parameters. When a, b, and r are respectively set to be 10, 8/3, and 28, the learning factors (i.e, c1 and c2) are in a chaotic state and defined as follows:
==
.c x tc y t
( )( ) (7)
1
2
Chaotic variables are characterized by randomness, ergodicity, and regularity. By changing the characteristics of chaotic variables, the algorithm can simultaneously increase population diversity and solve the premature convergence problem.
Population entropy diversity strategy. Entropy is used to describe the state of a system and indicate the uncer-tainty in the system or the degree of confusion. The level of entropy can directly reflect the degree of chaos of a system. The higher the entropy is, the more chaotic the system is. On the basis of the definition of entropy in information theory, the population entropy is used to describe the population diversity in the PSO algorithm.
Definition. Population entropy. Population size is set to be N. Q disjoint subgroups ...s s s{ , , , }t tQt
1 2 exist in the t-th iteration. The number of particles in each subgroup is described as ...{ s , s , , s }1
t2t
Qt . Thus, the population
entropy in the t-th iteration is defined as follows:
∑= − = .=
E k p p psN
log ( ), where(8)t
i
Q
it
it
it i
t
12
The population entropy reflects the distribution situation of the population particles. When the population entropy is higher, the particles are in a more chaotic state. The more uniformly distributed the particles are in space, the better the population diversity is. Conversely, the lower the population entropy is, the less chaotic the population is. In this situation, the population particles may converge in the nearest region with one or few extreme points and the population diversity is poor.
In order to evaluate population diversity with population entropy, maximum threshold and minimum thresh-old are respectively set as Ehigh and Elow. If the population entropy is between Elow and Ehigh, then the population is in the equilibrium state. If the population entropy is higher than Ehigh, the population is in a state of exploration. If the population entropy is lower than Elow, the population is in a local search state.
Convergence/divergence strategy. In the convergence and divergence strategies, the necessary conditions for the convergence and divergence of the particles should be determined. In a previous study, the conditions of convergence depend on the inertia weight and learning factor48,49. When the inertia weight and the sum of two learning factors are less than 1 and 3, respectively, the particles are always convergent. For example, when the inertia weight and the sum of the two learning factors are respectively 0.65 and 0.1, the particles rapidly converge. When the inertia weight is greater than 1, the particles are always divergent. The higher the inertia weight is, the faster the spread rate of the particles is. In the study, Eqs (9) and (10) respectively express the control strategies of convergence and divergence.
E
E
0 65 sin 1
0 1 sin 1;
(9)
t
t
ω
ϕ
= .
= .
ω λϕ= +E
1 1 ;(10)t
where ω indicates the inertia weight; Et indicates the population entropy; ϕ is the sum of c1 and c2; λ is the positive divergence coefficient and set to be 2.
CSAPSO-EDCD algorithm. The CSAPSO-EDCD algorithm is deduced by combining the convergence/diver-gence and chaotic self-adaptive strategies on the basis of the diversity of the population entropy. When the pop-ulation entropy is higher than the set maximum threshold, Ehigh, and the particles are in the exploration state, the CSAPSO-EDCD algorithm uses the convergence strategy to induce the particle to move to group center. When the population entropy is lower than the set minimum threshold, Elow, and the particles enter the state of

www.nature.com/scientificreports/
4Scientific RePoRts | (2018) 8:3991 | DOI:10.1038/s41598-018-22332-7
exploitation, the algorithm uses the divergence strategy to force the particle to move away from group center. If the population entropy is between Elow and Ehigh, the existing search strategy is maintained. The procedure of CSAPSO-EDCD algorithm is shown as follows:
Step 1: Initialization. Initialize the population size, the maximum and minimum numbers of iterations, the maximum and minimum population entropy, etc.Step 2: Fitness evaluation. Calculate the fitness value of each individual.Step 3: Update the extreme value.Step 4: Population entropy evaluation.
if (the population entropy is greater than the max population entropy Ehigh) thenParticles with the convergence strategy
else if (the population entropy is less than the min population entropy Elow) thenParticles with the divergent strategy
elseParticles with the chaotic self-adaptive strategy
end if Step 5: Finished. Confirm whether the iterative conditions are satisfied. If they are satisfied, then the evolution is finished, otherwise jump to Step 2 to continue.
Figure 1 shows the CSAPSO-EDCD algorithm flowchart.
Hybrid Intelligent Model. The relationship between the output and input of the RBF ANN is defined as follow:
y f w B C( , , ), (11)h o h o basis fun, ,= −
where Wh,o and Bh,o h c(1 )≤ ≤ , ≤ ≤o p(1 ) are respectively the weight matrix and deviation matrix of the hid-den node h and the output node o; Cbasis−function is the base function center; is the number of output nodes.
Three parameters of RBF ANN, namely, ci, σi, wi, are optimized through the above CSAPSO-EDCD algorithm. Thus, the structure of the particle is defined as:
= −particle i W B C( ) [ , , ] (12)h o h o basis fun, ,
RBF ANN was trained by the CSAPSO-EDCD algorithm and the pKa prediction model was developed and called CSAPSO-EDCD RBF ANN.
Figure 1. Flowchart of CSAPSO-EDCD algorithm.

www.nature.com/scientificreports/
5Scientific RePoRts | (2018) 8:3991 | DOI:10.1038/s41598-018-22332-7
No. Compounds Experimental pKa
1 ergotamine 6.3
2 nefazodone 6.5
3 nizatidine 6.59
4 trazodone 6.79
5 mirtazapine 7.3
6 clozapine 7.63
7 domperidone 7.9
8 tolamolol 7.9
9 lidocaine 7.94
10 naloxone 7.94
11 quinidine 8.05
12 diltiazem 8.06
13 nicotine 8.1
14 perphenazine 8.11
15 butorphanol 8.19
16 codeine 8.2
17 nebivolol 8.22
18 galanthamine 8.32
19 fentanyl 8.43
20 ranitidine 8.47
21 oxycodone 8.53
22 cocaine 8.7
23 meperidine 8.7
24 timolol 8.8
25 remoxipride 8.9
26 verapamil 8.92
27 rivastigmine 8.99
28 promethazine 9.1
29 mexiletine 9.15
30 levomepromazine 9.19
31 betaxolol 9.21
32 trimipramine 9.24
33 chlorpromazine 9.25
34 chlorpheniramine 9.26
35 propafenone 9.27
36 flecainide 9.3
37 citalopram 9.38
38 clomipramine 9.38
39 labetalol 9.4
40 amitriptyline 9.4
41 propranolol 9.45
42 sumatriptan 9.5
43 venlafaxine 9.5
44 azelastine 9.54
45 pindolol 9.54
46 bisoprolol 9.57
47 alprenolol 9.6
48 acebutolol 9.67
49 nadolol 9.67
50 metoprolol 9.7
51 tacrine 9.8
52 tolterodine 9.8
53 atropine 9.84
54 terbutaline 10
55 atomoxetine 10.1
56 nortriptyline 10.1
57 desipramine 10.23
Continued

www.nature.com/scientificreports/
6Scientific RePoRts | (2018) 8:3991 | DOI:10.1038/s41598-018-22332-7
ExperimentalExperimental Database. The experimental database of neutral and basic drugs from the previous study50 is provided in Table 1. The database, which consists of 74 sets of data, is divided into two subsets by using the random selection method in order to obtain a more reasonable prediction model, and the two subsets denote a training set and a testing set, respectively. The training set is used to establish the model and the testing set is applied to test the performance of the model.
In this study, the 70% of the data in the database (52 sets of data) were used for training; the remaining data (22 sets of data) were applied to test the model.
Molecular Descriptors. To establish the relationship between the pKa value and the molecular structure, the molecular structure was indirectly characterized by molecular descriptors. In this paper, molecular descriptors were generated by the following steps. Firstly, the molecular structure was established with Chemdraw UItra 7.0. Secondly, the established molecular structure was optimized with Hyper Chem 7.5. Then, the molecular descrip-tors were calculated in CODESSA software and 686 molecular descriptors were obtained. In order to reduce the complexity and obtain the most relevant descriptors for the pKa value, the CSAPSO-EDCD algorithm is adopted in the selection of molecular descriptors as follows:
Step 1: Population initialization. Initialize population size, the max and min number of iterations, etc. and set the population individual as molecular descriptors. Table 2 shows the parameters of the CSAPSO-EDCD algorithm.Step 2: Fitness evaluation. Calculate the fitness value of molecular descriptors of each individual. Step 3: Update the molecular descriptors. The velocity and position of the particles are updated with the local and global extreme values and the next population of molecular descriptor will be obtained.Step 4: Update the fitness of molecular descriptor. Step 5: Finished. Confirm whether the iterative conditions are satisfied. If they are satisfied, then the evolution is finished, otherwise jump to Step 2 to continue.
Finally, 5 molecular descriptors are selected by CSAPSO-EDCD algorithm (Table 3).
No. Compounds Experimental pKa
58 maprotiline 10.5
59 amantadine 10.68
60 cimetidine 6.97
61 sufentanil 7.85
62 clonidine 8.05
63 morphine 8.18
64 risperidone 8.3
65 haloperidol 8.65
66 azithromycin 8.74
67 diphenhydramine 9.1
68 procainamide 9.24
69 promazine 9.28
70 imipramine 9.45
71 paroxetine 9.51
72 atenolol 9.6
73 sotalol 9.76
74 quinacrine 10.2
Table 1. Experimental database.
Parameters Descriptions Values
m Number of particles 50
itmax Iteration times 2000
minerror Minimum error 1.00E-07
w Inertia weight Self-adaptive
c1 Cognitive component Generated by Lorenz chaotic operator
c2 Social component Generated by Lorenz chaotic operator
Table 2. Parameters of the CSAPSO-EDCD algorithm.

www.nature.com/scientificreports/
7Scientific RePoRts | (2018) 8:3991 | DOI:10.1038/s41598-018-22332-7
Model Establishment. The CSAPSO-EDCD RBF ANN model was developed according to the molecu-lar descriptors selected by CSAPSO-EDCD algorithm and consisted of 3 layers: the input layer, hidden layer, and output layer. The input layer has 5 input parameters representing the 5 molecular descriptors, the relative number of N atoms, the Randic index (order 3), the RNCG relative negative charged (QMNEG/QTMINUS) [Quantum-Chemical PC], the RNCS relative negative charged SA (SAMNEG*RNCG) [Zefirov’s PC], and the maximum net atomic charge. The output layer has only 1 output parameter representing the pKa value.
Two methods are commonly used to determine the number of nodes in hidden layer: the formula method and the heuristic method. In this study, the two methods were adopted. First, the number of the hidden nodes was calculated through the formula method (2*sqrt (m*n) + 1, where m and n denote the numbers of input nodes and output layer nodes, respectively). Then, the heuristic method was adopted to confirm the optimal number of hidden nodes. There were 5 input nodes and 1 output node in this study. Therefore, 5 hidden nodes were obtained through the formula method. It is assumed that the number of nodes in hidden layer is explored from 3 to 13. Figure 2 shows the relationship between the prediction error and the number of hidden nodes.
As shown in Fig. 2, with the increase in the number of hidden nodes, MSE decreases firstly and then increases. When the number of hidden nodes is 6, the MSE reaches its minimum value and the structure of the model is optimal. Therefore, the CSAPSO-EDCD RBF ANN model structure is 5-6-1.
Model Evaluation. The prediction capabilities of different models are evaluated in terms of absolute average relative deviation (AARD), root mean square error of prediction (RMSEP), and squared correlation coefficient (R2). The three indicators are defined as follows:
∑=−
=AARD
Ny y
y1 ;
(13)i
Ni i
i1
RMSEPN
y y1 ( ) ;(14)i
N
i i1
2∑= −=
Ry y y y
y y y y[ ( )( )]
( ) ( );
(15)iN
i ave i ave
iN
i ave iN
i ave
2 12
12
12=
∑ − −
∑ − ∑ −=
= =
No. Molecular descriptors Descriptor types
1 Relative number of N atoms Constitutional descriptors
2 Randic index (order 3) Topological descriptors
3 RNCG relative negative charged (QMNEG/QTMINUS) [Quantum-Chemical PC] Electrostatic descriptors
4 RNCS Relative negative charged SA (SAMNEG * RNCG) [Zefirov’s PC] Electrostatic descriptors
5 Max net atomic charge Quantum descriptors
Table 3. Molecular descriptors selected by CSAPSO-EDCD algorithm.
Figure 2. Relationship between MSE and the number of hidden nodes.

www.nature.com/scientificreports/
8Scientific RePoRts | (2018) 8:3991 | DOI:10.1038/s41598-018-22332-7
where N is the number of data samples; is the predicted value; yi denotes the experimental value; yave denotes the average of the experimental values; yave denotes the average of the predicted values.
Results and DiscussionResults of the proposed model. Experiments were performed in Windows 7 SP1 64-bit operating system (4.00 GB of memory and 4 Intel (R) Core(TM) i5-4460 CPU @ 3.20 GHz processors). Through Matlab 2010a soft-ware programing, a 5-6-1 CSAPSO-EDCD RBF ANN model was proposed to predict the pKa values of 74 neutral and basic drugs. The model was trained with the 52 data points in the training set and tested with the 22 data points in the testing set. Figure 3 shows the correlogram between the experimental data and the predicted values. The straight line denotes the experimental data, whereas the stars denote the predicted values in this paper. The vertical distance between the star-shaped point and the straight line indicates the absolute error between the predicted value and the experimental value.
As shown in Fig. 3, in the training set, the prediction values of the model are close to the experimental data. The vertical distances between the star-shaped point and the straight line show that the prediction error of the model is small and that the prediction accuracy is high. Training graph indicates that the training effect of model is better. Figure 4 shows the correlogram between the experimental data and the predicted value in the testing set. The predicted values of the model are consistent with the experimental data in the testing set. Table 4 shows the statistical parameters of the proposed model.
In the two subsets, the model shows the better comprehensive performance. According to the statistical data, the prediction effect of the proposed model is good and the prediction error is small. Therefore, the comprehen-sive performance is good. The prediction accuracy and correlation analysis showed that the model had the good
Figure 3. Correlations between predicted values and experimental data in the training set.
Figure 4. Correlation between predicted values and experimental data in the testing set.

www.nature.com/scientificreports/
9Scientific RePoRts | (2018) 8:3991 | DOI:10.1038/s41598-018-22332-7
prediction performance (Table 4) and the above results confirmed that the prediction performance of the model was excellent.
Validation analysis with other test databases. Furthermore, in order to verify the robustness and scalability of the proposed model, another testing database containing 20 data points was additionally established for the performance validation. The database from previous studies51,52 is provided in Table 5.
Figure 5 shows the correlation between the predicted pKa data and experimental pKa data. The predicted pKa data obtained by the proposed model were well consistent with experimental pKa. Table 6 displays the prediction
Sets AARD RMSEP R2
Training 0.2316 0.0263 0.9873
Testing 0.3105 0.0411 0.9685
Average 0.2711 0.0337 0.9779
Table 4. Statistical parameters of the proposed model.
NO. Compounds Experimental pKa
1 Guanidine 13.8
2 Clomipramine 9.42
3 Papaverine 6.4
4 Clotrimazole 5.75
5 Tryptophan 9.1
6 Methylamine 10.62
7 sec-Butylamine 10.56
8 Imipramine 9.6
9 n-Octylamine 10.7
10 Morpholine 8.5
11 Procaine 9.11
12 Guanethidine 11.4
13 Imidazo[2,3-b]thioxazole 8
14 Trimipramine 9.39
15 Dimethyl-iso-propylamine 10.3
16 tert-Butylcyclohexylamine 11.23
17 Sotalol 9.3
18 Alphaprodine 8.7
19 p-Toluidine 5.1
20 Nikethamide 3.5
Table 5. Additional testing database.
Figure 5. Correlation between predicted values and experimental data in testing database.

www.nature.com/scientificreports/
1 0Scientific RePoRts | (2018) 8:3991 | DOI:10.1038/s41598-018-22332-7
performance verified with the testing database. The results indicated the superior prediction performance of the proposed model.
The data in this testing database were not trained by the prediction model. The testing results indicated that the proposed model had the good prediction performance with the better robustness and scalability.
Comparison of the Proposed Model against Other Models. In this paper, to verify the performance of the CSAPSO-EDCD RBF ANN model, we chose two congeneric models (PSO RBF ANN and RBF ANN model) as the comparison models and each model was tested with the testing set. Figure 6 shows the correlation between prediction and experimental values of comparison models.
The vertical distances between the prediction data points and experimental data points showed that the pre-diction performances of the three models were increased according to the order: RBF ANN, PSO RBF ANN, and CSAPSO-EDCD RBF ANN. PSO RBF ANN is slightly better than RBF ANN. Figure 7 shows the residual curve between the experimental and predicted values of each comparison model. Table 7 shows the statistical parame-ters of the comparison models.
AARD RMSEP R2
Max 0.9857 0.1005 0.9992
Min 0.1243 0.06337 0.8786
Average 0.6656 0.0742 0.9212
Table 6. Statistical results of the proposed model in testing database.
Figure 6. Correlation between prediction and experimental values of the comparison models.
Figure 7. Residual curve for each comparison model.
www.nature.com/scientificreports/
1 1Scientific RePoRts | (2018) 8:3991 | DOI:10.1038/s41598-018-22332-7
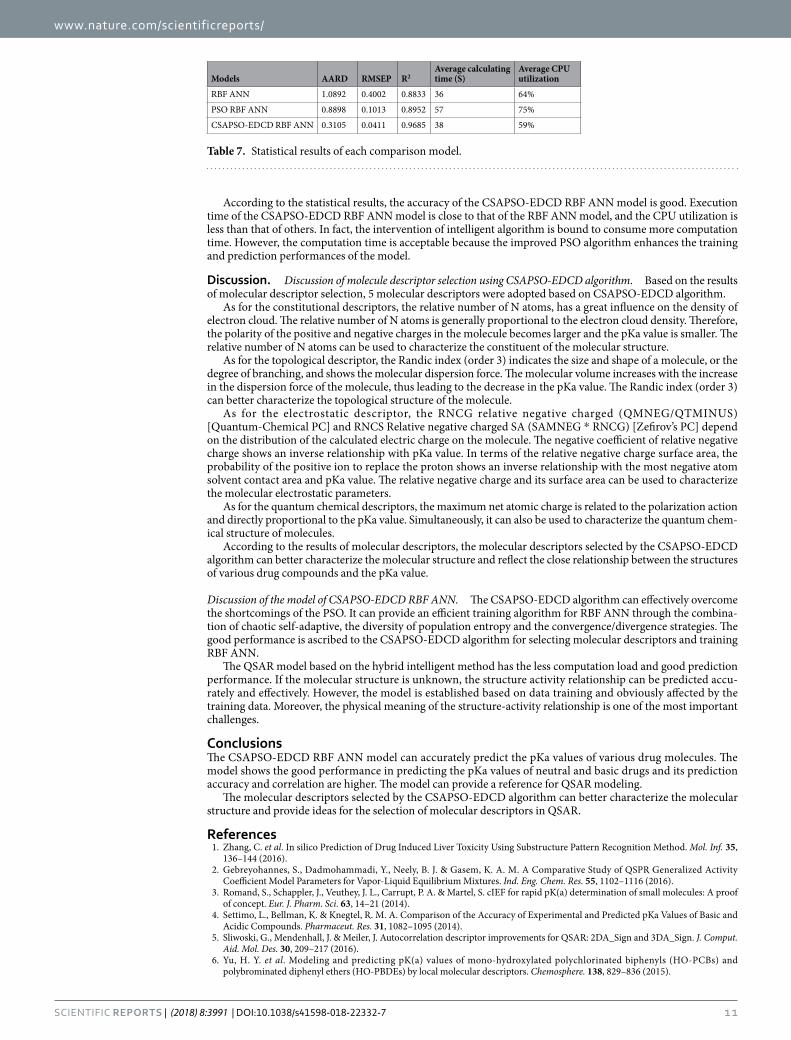
According to the statistical results, the accuracy of the CSAPSO-EDCD RBF ANN model is good. Execution time of the CSAPSO-EDCD RBF ANN model is close to that of the RBF ANN model, and the CPU utilization is less than that of others. In fact, the intervention of intelligent algorithm is bound to consume more computation time. However, the computation time is acceptable because the improved PSO algorithm enhances the training and prediction performances of the model.
Discussion. Discussion of molecule descriptor selection using CSAPSO-EDCD algorithm. Based on the results of molecular descriptor selection, 5 molecular descriptors were adopted based on CSAPSO-EDCD algorithm.
As for the constitutional descriptors, the relative number of N atoms, has a great influence on the density of electron cloud. The relative number of N atoms is generally proportional to the electron cloud density. Therefore, the polarity of the positive and negative charges in the molecule becomes larger and the pKa value is smaller. The relative number of N atoms can be used to characterize the constituent of the molecular structure.
As for the topological descriptor, the Randic index (order 3) indicates the size and shape of a molecule, or the degree of branching, and shows the molecular dispersion force. The molecular volume increases with the increase in the dispersion force of the molecule, thus leading to the decrease in the pKa value. The Randic index (order 3) can better characterize the topological structure of the molecule.
As for the electrostatic descriptor, the RNCG relative negative charged (QMNEG/QTMINUS) [Quantum-Chemical PC] and RNCS Relative negative charged SA (SAMNEG * RNCG) [Zefirov’s PC] depend on the distribution of the calculated electric charge on the molecule. The negative coefficient of relative negative charge shows an inverse relationship with pKa value. In terms of the relative negative charge surface area, the probability of the positive ion to replace the proton shows an inverse relationship with the most negative atom solvent contact area and pKa value. The relative negative charge and its surface area can be used to characterize the molecular electrostatic parameters.
As for the quantum chemical descriptors, the maximum net atomic charge is related to the polarization action and directly proportional to the pKa value. Simultaneously, it can also be used to characterize the quantum chem-ical structure of molecules.
According to the results of molecular descriptors, the molecular descriptors selected by the CSAPSO-EDCD algorithm can better characterize the molecular structure and reflect the close relationship between the structures of various drug compounds and the pKa value.
Discussion of the model of CSAPSO-EDCD RBF ANN. The CSAPSO-EDCD algorithm can effectively overcome the shortcomings of the PSO. It can provide an efficient training algorithm for RBF ANN through the combina-tion of chaotic self-adaptive, the diversity of population entropy and the convergence/divergence strategies. The good performance is ascribed to the CSAPSO-EDCD algorithm for selecting molecular descriptors and training RBF ANN.
The QSAR model based on the hybrid intelligent method has the less computation load and good prediction performance. If the molecular structure is unknown, the structure activity relationship can be predicted accu-rately and effectively. However, the model is established based on data training and obviously affected by the training data. Moreover, the physical meaning of the structure-activity relationship is one of the most important challenges.
ConclusionsThe CSAPSO-EDCD RBF ANN model can accurately predict the pKa values of various drug molecules. The model shows the good performance in predicting the pKa values of neutral and basic drugs and its prediction accuracy and correlation are higher. The model can provide a reference for QSAR modeling.
The molecular descriptors selected by the CSAPSO-EDCD algorithm can better characterize the molecular structure and provide ideas for the selection of molecular descriptors in QSAR.
References 1. Zhang, C. et al. In silico Prediction of Drug Induced Liver Toxicity Using Substructure Pattern Recognition Method. Mol. Inf. 35,
136–144 (2016). 2. Gebreyohannes, S., Dadmohammadi, Y., Neely, B. J. & Gasem, K. A. M. A Comparative Study of QSPR Generalized Activity
Coefficient Model Parameters for Vapor-Liquid Equilibrium Mixtures. Ind. Eng. Chem. Res. 55, 1102–1116 (2016). 3. Romand, S., Schappler, J., Veuthey, J. L., Carrupt, P. A. & Martel, S. cIEF for rapid pK(a) determination of small molecules: A proof
of concept. Eur. J. Pharm. Sci. 63, 14–21 (2014). 4. Settimo, L., Bellman, K. & Knegtel, R. M. A. Comparison of the Accuracy of Experimental and Predicted pKa Values of Basic and
Acidic Compounds. Pharmaceut. Res. 31, 1082–1095 (2014). 5. Sliwoski, G., Mendenhall, J. & Meiler, J. Autocorrelation descriptor improvements for QSAR: 2DA_Sign and 3DA_Sign. J. Comput.
Aid. Mol. Des. 30, 209–217 (2016). 6. Yu, H. Y. et al. Modeling and predicting pK(a) values of mono-hydroxylated polychlorinated biphenyls (HO-PCBs) and
polybrominated diphenyl ethers (HO-PBDEs) by local molecular descriptors. Chemosphere. 138, 829–836 (2015).
Models AARD RMSEP R2Average calculating time (S)
Average CPU utilization
RBF ANN 1.0892 0.4002 0.8833 36 64%
PSO RBF ANN 0.8898 0.1013 0.8952 57 75%
CSAPSO-EDCD RBF ANN 0.3105 0.0411 0.9685 38 59%
Table 7. Statistical results of each comparison model.

www.nature.com/scientificreports/
1 2Scientific RePoRts | (2018) 8:3991 | DOI:10.1038/s41598-018-22332-7
7. Rojas, C. et al. Quantitative structure-activity relationships to predict sweet and non-sweet tastes. Theor. Chem. Acc. 135, 1–13 (2016).
8. Fujita, T. & Winkler, D. A. Understanding the Roles of the “Two QSARs”. J. Chem. Inf. Model. 56, 269–274 (2016). 9. Wang, X., Luo, F., Qian, Y. & Ranzi, G. A Personalized Electronic Movie Recommendation System Based on Support Vector Machine
and Improved Particle Swarm Optimization. Plos One. 11, e0165868 (2016). 10. Pedretti, G. et al. Memristive neural network for on-line learning and tracking with brain-inspired spike timing dependent plasticity.
Sci. Rep. 7 (2017). 11. Barron, L. P. & McEneff, G. L. Gradient liquid chromatographic retention time prediction for suspect screening applications: A
critical assessment of a generalised artificial neural network-based approach across 10 multi-residue reversed-phase analytical methods. Talanta. 147, 261–270 (2016).
12. Zhou, W. et al. High-accuracy QSAR models of narcosis toxicities of phenols based on various data partition, descriptor selection and modelling methods. RSC. Adv. 6, 106847–106855 (2016).
13. Guo, J. et al. Application of artificial neural network to investigate the effects of 5-fluorouracil on ribonucleotides and deoxyribonucleotides in HepG2cells. Sci. Rep. 5 (2015).
14. Liu, S. et al. Differentiating Thamnocalamus Munro from Fargesia Franchet emend. Yi (Bambusoideae, Poaceae): novel evidence from morphological and neural-network analyses. Sci. Rep. 7 (2017).
15. Wang, N. N. et al. ADME Properties Evaluation in Drug Discovery: Prediction of Caco-2 Cell Permeability Using a Combination of NSGA-II and Boosting. J. Chem. Inf. Model. 56, 763–773 (2016).
16. Polanski, J. & Walczak, B. The comparative molecular surface analysis (COMSA): a novel tool for molecular design. Comput. Chem. 24, 615–625 (2000).
17. Luan, F. et al. Prediction of retention time of a variety of volatile organic compounds based on the heuristic method and support vector machine. Anal. Chim. Acta. 537, 101–110 (2005).
18. Bianchi, F. M., Livi, L., Alippi, C. & Jenssen, R. Multiplex visibility graphs to investigate recurrent neural network dynamics. Sci. Rep. 7 (2017).
19. Liu, Z., Gao, J., Yang, G., Zhang, H. & He, Y. Localization and Classification of Paddy Field Pests using a Saliency Map and Deep Convolutional NeuralNetwork. Sci. Rep. 6 (2016).
20. Li, M. et al. Solubility prediction of supercritical carbon dioxide in 10 polymers using radial basis function artificial neural network based on chaotic self-adaptive particle swarm optimization and K-harmonic means. RSC. Adv. 5, 45520–45527 (2015).
21. Li, M. S. et al. Prediction of gas solubility in polymers by back propagation artificial neural network based on self-adaptive particle swarm optimization algorithm and chaos theory. Fluid. Phase. Equilibr. 356, 11–17 (2013).
22. Azad, F. N. et al. Optimization of the process parameters for the adsorption of ternary dyes by Ni doped FeO(OH)-NWs-AC using response surface methodology and an artificial neural network. RSC. Adv. 6, 19768–19779 (2016).
23. Li, M., Wu, W., Chen, B., Wu, Y. & Huang, X. Solubility prediction of gases in polymers based on an artificial neural network: a review. RSC. Adv. 7, 35274–35282 (2017).
24. Cano, G. et al. Automatic selection of molecular descriptors using random forest: Application to drug discovery. Expert. Syst. Appl. 72, 151–159 (2017).
25. Zhou, Y. W., Wu, J. M. & Xu, X. Improving B3LYP Heats of Formation with Three-Dimensional Molecular Descriptors. J. Comput. Chem. 37, 1175–1190 (2016).
26. Sahoo, S., Adhikari, C., Kuanar, M. & Mishra, B. K. A Short Review of the Generation of Molecular Descriptors and Their Applications in Quantitative Structure Property/Activity Relationships. Curr. Comput.-Aided Drug Des. 12, 181–205 (2016).
27. Gao, Y., Du, W. & Yan, G. Selectively-informed particle swarm optimization. Sci. Rep. 5 (2015). 28. Lombardo, F. & Jing, Y. K. In Silico Prediction of Volume of Distribution in Humans. Extensive Data Set and the Exploration of
Linear and Nonlinear Methods Coupled with Molecular Interaction Fields Descriptors. J. Chem. Inf. Model. 56, 2042–2052 (2016). 29. Yousefinejad, S. & Hemmateenejad, B. Chemometrics tools in QSAR/QSPR studies: A historical perspective. Chemometr. Intell. Lab
Syst. 149, 177–204 (2015). 30. Zafar, A. & Reynisson, J. Hydration Free Energy as a Molecular Descriptor in Drug Design: A Feasibility Study. Mol. Inf. 35, 207–214
(2016). 31. Shen, L. et al. A novel local manifold-ranking based K-NN for modeling the regression between bioactivity and molecular
descriptors. Chemometr. Intell. Lab Syst. 151, 71–77 (2016). 32. Shahlaei, M. Descriptor Selection Methods in Quantitative Structure-Activity Relationship Studies: A Review Study. Chem. Rev. 113,
8093–8103 (2013). 33. Charifson, P. S. & Walters, W. P. Acidic and Basic Drugs in Medicinal Chemistry: A Perspective. J. Med. Chem. 57, 9701–9717 (2014). 34. Chakravorty, A., Jia, Z., Li, L. & Alexove, E. A New DelPhi Feature for Modeling Electrostatic Potential around Proteins: Role of
Bound Ions and Implications for Zeta-Potential. Langmuir. 33, 2283–2295 (2017). 35. Petukh, M., Stefl, S. & Alexov, E. The Role of Protonation States in Ligand-Receptor Recognition and Binding. Curr. Pharm. Design.
19, 4182–4190 (2013). 36. Onufriev, A. V. & Alexov, E. Protonation and pK changes in protein-ligand binding. Q. Rev. Biophys. 46, 181–209 (2013). 37. Peng, Y. H. & Alexov, E. Computational investigation of proton transfer, pKa shifts and pH-optimum of protein-DNA and protein-
RNA complexes. Proteins-Structure Function and Bioinformatics. 85, 282–295 (2017). 38. Li, L., Chakravorty, A. & Alexov, E. DelPhiForce, a Tool for Electrostatic Force Calculations: Applications to Macromolecular
Binding. J. Comput. Chem. 38, 584–593 (2017). 39. Li, L., Alper, J. & Alexov, E. Multiscale method for modeling binding phenomena involving large objects: application to kinesin
motor domains motion along microtubules. Sci. Rep. 6 (2016). 40. Riffault-Valois, L. et al. Molecular Fingerprint Comparison of Closely Related Rose Varieties based on UHPLC-HRMS Analysis and
Chemometrics. Phytochem. Anal. 28, 42–49 (2017). 41. Muegge, I. & Mukherjee, P. An overview of molecular fingerprint similarity search in virtual screening. Expert. Opin. Drug.
Discovery. 11, 137–148 (2016). 42. Cereto-Massague, A. et al. Molecular fingerprint similarity search in virtual screening. Methods. 71, 58–63 (2015). 43. Petersen, C. R. et al. Mid-infrared supercontinuum covering the 1.4–13.3 mu m molecular fingerprint region using ultra-high NA
chalcogenide step-index fibre. Nat. Photonics. 8, 830–834 (2014). 44. Zhang, Y. X. An improved QSPR method based on support vector machine applying rational sample data selection and genetic
algorithm-controlled training parameters optimization. Chemometr. Intell. Lab Syst. 134, 34–46 (2014). 45. Tsekouras, G. E. & Tsimikas, J. On training RBF neural networks using input-output fuzzy clustering and particle swarm
optimization. Fuzzy Set. Syst. 221, 65–89 (2013). 46. Kennedy, J. & Eberhart, R., presented at the Proceedings of the 1995 IEEE International Conference on Neural Networks. Part 1 (of
6), Perth, Aust, (unpublished) (1995). 47. Eberhart, R. & Kennedy, J., presented at the Proceedings of the 1995 6th International Symposium on Micro Machine and Human
Science, October 4, 1995 - October 6, 1995, Nagoya, Jpn, (unpublished) (1995). 48. Zhao, X. L., Turk, M., Li, W., Lien, K. C. & Wang, G. Z. A multilevel image thresholding segmentation algorithm based on two-
dimensional K-L divergence and modified particle swarm optimization. Appl. Soft. Comput. 48, 151–159 (2016).

www.nature.com/scientificreports/
13Scientific RePoRts | (2018) 8:3991 | DOI:10.1038/s41598-018-22332-7
49. Taghiyeh, S. & Xu, J. A new particle swarm optimization algorithm for noisy optimization problems. SWARM. INTELL. 10, 161–192 (2016).
50. Luan, F. et al. Prediction of pK(a) for neutral and basic drugs based on radial basis function neural networks and the heuristic method. Pharmaceut. Res. 22, 1454–1460 (2005).
51. Jensen, J. H., Swain, C. J. & Olsen, L. Prediction of pK(a) Values for Druglike Molecules Using Semiempirical Quantum Chemical Methods. J. Phys. Chem. A. 121, 699–707 (2017).
52. Eckert, F. & Klamt, A. Accurate prediction of basicity in aqueous solution with COSMO-RS. J. Comput. Chem. 27, 11–19 (2006).
AcknowledgementsThe authors gratefully acknowledge the support from the National Natural Science Foundation of China (Grant Numbers: 51663001, 51463015, and 51377025) and the Science and Technology Research Projects of the Education Department of Jiangxi Province (Grant Numbers: GJJ151012 and GJJ150983).
Author ContributionsMengshan Li conceived and designed the experiments. Mengshan Li, Bingsheng Chen and Huaijing Zhang wrote the main manuscript text. Yan Wu and Lixin Guan analysed the data. All authors read and approved the final manuscript.
Additional InformationCompeting Interests: The authors declare no competing interests.Publisher's note: Springer Nature remains neutral with regard to jurisdictional claims in published maps and institutional affiliations.
Open Access This article is licensed under a Creative Commons Attribution 4.0 International License, which permits use, sharing, adaptation, distribution and reproduction in any medium or
format, as long as you give appropriate credit to the original author(s) and the source, provide a link to the Cre-ative Commons license, and indicate if changes were made. The images or other third party material in this article are included in the article’s Creative Commons license, unless indicated otherwise in a credit line to the material. If material is not included in the article’s Creative Commons license and your intended use is not per-mitted by statutory regulation or exceeds the permitted use, you will need to obtain permission directly from the copyright holder. To view a copy of this license, visit http://creativecommons.org/licenses/by/4.0/. © The Author(s) 2018