Prediction of malignant transformation in oral epithelial ... - PLOS
14
RESEARCH ARTICLE Prediction of malignant transformation in oral epithelial dysplasia using infrared absorbance spectra Barnaby G. Ellis 1 , Conor A. Whitley 1 , Asterios Triantafyllou 2 , Philip J. Gunning 3 , Caroline I. SmithID 1 , Steve D. Barrett 1 , Peter Gardner 4 , Richard J. Shaw 3,5 *, Peter Weightman 1 , Janet M. Risk 3 1 Department of Physics, University of Liverpool, Liverpool, United Kingdom, 2 Department of Pathology, Liverpool Clinical Laboratories, University of Liverpool, Liverpool, United Kingdom, 3 Department of Molecular and Clinical Cancer Medicine, Institute of Systems, Molecular and Integrative Biology, University of Liverpool, Liverpool, United Kingdom, 4 Manchester Institute of Biotechnology, University of Manchester, Manchester, United Kingdom, 5 Regional Maxillofacial Unit, Liverpool University Hospitals NHS Foundation Trust, Liverpool, United Kingdom * [email protected] Abstract Oral epithelial dysplasia (OED) is a histopathologically-defined, potentially premalignant condition of the oral cavity. The rate of transformation to frank carcinoma is relatively low (12% within 2 years) and prediction based on histopathological grade is unreliable, leading to both over- and under-treatment. Alternative approaches include infrared (IR) spectros- copy, which is able to classify cancerous and non-cancerous tissue in a number of cancers, including oral. The aim of this study was to explore the capability of FTIR (Fourier-transform IR) microscopy and machine learning as a means of predicting malignant transformation of OED. Supervised, retrospective analysis of longitudinally-collected OED biopsy samples from 17 patients with high risk OED lesions: 10 lesions transformed and 7 did not over a fol- low-up period of more than 3 years. FTIR spectra were collected from routine, unstained his- topathological sections and machine learning used to predict malignant transformation, irrespective of OED classification. PCA-LDA (principal component analysis followed by lin- ear discriminant analysis) provided evidence that the subsequent transforming status of these 17 lesions could be predicted from FTIR data with a sensitivity of 79 ± 5% and a speci- ficity of 76 ± 5%. Six key wavenumbers were identified as most important in this classifica- tion. Although this pilot study used a small cohort, the strict inclusion criteria and classification based on known outcome, rather than OED grade, make this a novel study in the field of FTIR in oral cancer and support the clinical potential of this technology in the sur- veillance of OED. Introduction Oral squamous cell carcinoma (OSCC) has a worldwide incidence rate of over 370 000 [1] and a 5-year survival rate that remains less than 60% [2]. It is often preceded by a spectrum of PLOS ONE PLOS ONE | https://doi.org/10.1371/journal.pone.0266043 March 25, 2022 1 / 14 a1111111111 a1111111111 a1111111111 a1111111111 a1111111111 OPEN ACCESS Citation: Ellis BG, Whitley CA, Triantafyllou A, Gunning PJ, Smith CI, Barrett SD, et al. (2022) Prediction of malignant transformation in oral epithelial dysplasia using infrared absorbance spectra. PLoS ONE 17(3): e0266043. https://doi. org/10.1371/journal.pone.0266043 Editor: Patrick Ha, University of California, San Francisco, UNITED STATES Received: December 17, 2021 Accepted: March 14, 2022 Published: March 25, 2022 Peer Review History: PLOS recognizes the benefits of transparency in the peer review process; therefore, we enable the publication of all of the content of peer review and author responses alongside final, published articles. The editorial history of this article is available here: https://doi.org/10.1371/journal.pone.0266043 Copyright: © 2022 Ellis et al. This is an open access article distributed under the terms of the Creative Commons Attribution License, which permits unrestricted use, distribution, and reproduction in any medium, provided the original author and source are credited. Data Availability Statement: All files are available from the University of Liverpool Data Catalogue at https://doi.org/10.17638/datacat.liverpool.ac.uk/ 1622.
-
Upload
khangminh22 -
Category
Documents
-
view
1 -
download
0
Transcript of Prediction of malignant transformation in oral epithelial ... - PLOS
RESEARCH ARTICLE
Prediction of malignant transformation in oral
epithelial dysplasia using infrared absorbance
spectra
Barnaby G. Ellis1, Conor A. Whitley1, Asterios Triantafyllou2, Philip J. Gunning3, Caroline
I. SmithID1, Steve D. Barrett1, Peter Gardner4, Richard J. Shaw3,5*, Peter Weightman1,
Janet M. Risk3
1 Department of Physics, University of Liverpool, Liverpool, United Kingdom, 2 Department of Pathology,
Liverpool Clinical Laboratories, University of Liverpool, Liverpool, United Kingdom, 3 Department of
Molecular and Clinical Cancer Medicine, Institute of Systems, Molecular and Integrative Biology, University of
Liverpool, Liverpool, United Kingdom, 4 Manchester Institute of Biotechnology, University of Manchester,
Manchester, United Kingdom, 5 Regional Maxillofacial Unit, Liverpool University Hospitals NHS Foundation
Trust, Liverpool, United Kingdom
Abstract
Oral epithelial dysplasia (OED) is a histopathologically-defined, potentially premalignant
condition of the oral cavity. The rate of transformation to frank carcinoma is relatively low
(12% within 2 years) and prediction based on histopathological grade is unreliable, leading
to both over- and under-treatment. Alternative approaches include infrared (IR) spectros-
copy, which is able to classify cancerous and non-cancerous tissue in a number of cancers,
including oral. The aim of this study was to explore the capability of FTIR (Fourier-transform
IR) microscopy and machine learning as a means of predicting malignant transformation of
OED. Supervised, retrospective analysis of longitudinally-collected OED biopsy samples
from 17 patients with high risk OED lesions: 10 lesions transformed and 7 did not over a fol-
low-up period of more than 3 years. FTIR spectra were collected from routine, unstained his-
topathological sections and machine learning used to predict malignant transformation,
irrespective of OED classification. PCA-LDA (principal component analysis followed by lin-
ear discriminant analysis) provided evidence that the subsequent transforming status of
these 17 lesions could be predicted from FTIR data with a sensitivity of 79 ± 5% and a speci-
ficity of 76 ± 5%. Six key wavenumbers were identified as most important in this classifica-
tion. Although this pilot study used a small cohort, the strict inclusion criteria and
classification based on known outcome, rather than OED grade, make this a novel study in
the field of FTIR in oral cancer and support the clinical potential of this technology in the sur-
veillance of OED.
Introduction
Oral squamous cell carcinoma (OSCC) has a worldwide incidence rate of over 370 000 [1] and
a 5-year survival rate that remains less than 60% [2]. It is often preceded by a spectrum of
PLOS ONE
PLOS ONE | https://doi.org/10.1371/journal.pone.0266043 March 25, 2022 1 / 14
a1111111111
a1111111111
a1111111111
a1111111111
a1111111111
OPEN ACCESS
Citation: Ellis BG, Whitley CA, Triantafyllou A,
Gunning PJ, Smith CI, Barrett SD, et al. (2022)
Prediction of malignant transformation in oral
epithelial dysplasia using infrared absorbance
spectra. PLoS ONE 17(3): e0266043. https://doi.
org/10.1371/journal.pone.0266043
Editor: Patrick Ha, University of California, San
Francisco, UNITED STATES
Received: December 17, 2021
Accepted: March 14, 2022
Published: March 25, 2022
Peer Review History: PLOS recognizes the
benefits of transparency in the peer review
process; therefore, we enable the publication of
all of the content of peer review and author
responses alongside final, published articles. The
editorial history of this article is available here:
https://doi.org/10.1371/journal.pone.0266043
Copyright: © 2022 Ellis et al. This is an open
access article distributed under the terms of the
Creative Commons Attribution License, which
permits unrestricted use, distribution, and
reproduction in any medium, provided the original
author and source are credited.
Data Availability Statement: All files are available
from the University of Liverpool Data Catalogue at
https://doi.org/10.17638/datacat.liverpool.ac.uk/
1622.
clinical changes, collectively termed potentially pre-malignant oral epithelial lesions or oral
potentially malignant disorders (OPMDs) [3]. OPMDs include white patches (leukoplakia),
red patches (erythroplakia) and mixed color patches (erythroleukoplakia) of the oral mucosa
and are usually investigated by biopsy and histopathological examination. The latter typically
shows morphological changes of the surface squamous epithelium, which are conveniently
described as oral epithelial dysplasia (OED), that include variable cellular atypia, proliferative
activity and loss of normal patterns of differentiation. The World Health Organization
(WHO) defines OED as “altered epithelium with an increased likelihood for progression to
squamous cell carcinoma” [4]. The malignant potential (progression to invasive tumor) of
OPMDs range from as low as 0.13% in some leukoplakias [5] to>50% in some erythroplakias
[6]; a meta-analysis of OED data indicates a malignant transformation rate of 12% within 2
years, increasing to 22% within 5 years [7].
The histopathological grading of OED as mild, moderate or severe is widely popular and
time-honored, based on various architectural and cytological changes, and is endorsed and
formalized by WHO [8]. Other grading systems, including a binary “high/low risk” scheme
[9], have been proposed, but the standard across the field remains the three-tiered scheme.
Numerous studies [10–12] have shown a significant relationship between the histopathological
grade and risk of malignant transformation, however there are a similar number of conflicting
reports which suggest a much less direct relationship, highlighting other risk factors [13–15].
Although biopsy and histopathological assessment of OPMDs forms the basis of clinical man-
agement, the grading of OED is influenced by inter- and intra-observer variations [9], reflect-
ing the subjectivity of the process, and improvements are required.
Given its clinical significance, OED has been investigated by a wide spectrum of predomi-
nantly biology-based methodologies, but none of the proposed biomarkers for predicting risk
are in routine clinical use [16]. Less attention has been paid to the application of alternative
methodologies utilizing the chemical or physical properties of the cells. Among the alternative
methodologies, those based on vibrational spectroscopy have been increasingly introduced to
biomedical research [17, 18]. Fourier transform infrared (FTIR) spectroscopy utilizes infrared
(IR) light over a broad spectral range to assess the overall chemical profile of a sample. Molecules
which vibrate at frequencies corresponding to the wavelengths applied will absorb the radiation
at those wavelengths, resulting in an absorption spectrum characteristic of the chemical moieties
present. FTIR micro-spectroscopy (FTIR-MS) combines IR spectroscopy with precise spatial
information enabling the rapid acquisition of hyperspectral images directly related to the location
and distribution of chemical components, for example in tissue samples. Hyperspectral data
acquired using FTIR-MS is highly dimensional as each raw spectrum, obtained from a region
approximately 5 μm x 5 μm in size, contains at least 103 absorption variables. Subtle differences
between tissue areas are concealed by dominant common features in chemical composition,
necessitating the use of sophisticated numerical approaches to extract useful information [19].
Common modelling methods whose aim is to reduce the complexity of the dataset include prin-
cipal component analysis (PCA) [20] and linear discriminant analysis (LDA) [21, 22].
FTIR-MS has been utilized in biomedical research, with a particular focus on its application
to the investigation of cancerous tissues (reviewed in ref. [23]). Our own recent data suggests
that this methodology is applicable to OSCC [24], and other studies have successfully associ-
ated vibrational spectroscopy data with the contemporaneous histopathological classification
of potentially malignant oral lesions [25, 26]. The present investigation takes a different
approach, using a supervised, retrospective analysis of tissue samples from high risk OED
lesions from patients with prolonged, longitudinal clinical follow-up and known outcome
(transformation or no transformation) to explore the capability of FTIR-MS and machine
learning as a means of predicting malignant transformation of OED.
PLOS ONE Infrared spectra predict oral cancer development
PLOS ONE | https://doi.org/10.1371/journal.pone.0266043 March 25, 2022 2 / 14
Funding: JMR, RJS, PW & SDB: Cancer Research
UK grant number C7738/A26196. https://www.
cancerresearchuk.org/ BGE & CAW were
supported by Engineering and Physical Sciences
Research Council (EPSRC) PhD studentships.
https://epsrc.ukri.org/ The funders had no role in
the study design, data collection and analysis,
decision to publish, or preparation of the
manuscript.
Competing interests: The authors have declared
that no competing interests exist.
Methods
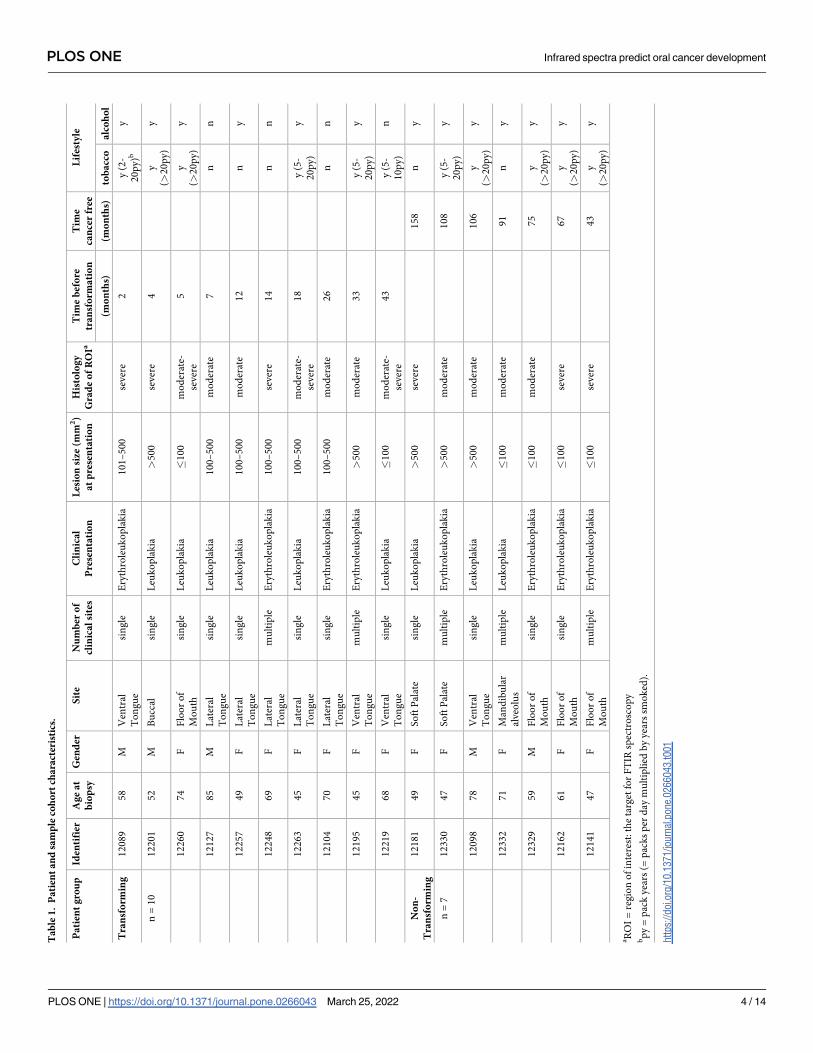
Seventeen patients with biopsy-proven OED were included in this study (Table 1). All patients
were part of a larger cohort for whom the clinical determinants of transformation have been
described [15] and had given written informed consent to a UK NHS Research Ethics Com-
mittee approved study that was run in compliance with the Helsinki Declaration (Liverpool
Central REC ref: EC 47.01). Patient selection was limited by inclusion of only lesions with a
histopathological diagnosis of moderate or severe grade OED, absence of previous OSCC, at
least 42 months follow-up from the time of biopsy, and the availability of relevant archival for-
malin-fixed paraffin-embedded (FFPE) tissue. Although inclusion was partly dependent on a
number of non-clinical factors such as availability of samples, the group of patients used in
this present study remained representative of the total cohort [15]. Thus, there was a higher
female:male ratio in the transforming group, which also had a preponderance of lateral tongue
lesions, and there were proportionally more smokers in the non-transforming group (Table 1).
It should be noted that there was no significant difference between the distribution of severe
and moderate grade OED lesions in the two groups.
A single archival FFPE tissue block containing incisional biopsy material was obtained
from each of 10 patients at the closest timepoint to transformation (range 2–43 months prior
to transformation) (T lesions; Table 1). A single archival FFPE block containing incisional
biopsy material with more than 43 months transformation-free follow-up from the date of
biopsy (range 43–108 months) was obtained from each of 7 patients (NT lesions; Table 1).
None of these NT lesions had been excised during the follow-up period.
From each of the 17 FFPE blocks, four adjacent 5 μm tissue sections were obtained, reserv-
ing the first and last for routine deparaffinization, hematoxylin and eosin (H&E) staining and
histopathological re-examination. The intervening two paraffinized, unstained sections were
mounted on separate 20 mm diameter calcium fluoride (CaF2) disks for IR imaging experi-
ments. An area of dysplasia corresponding to the histopathologically most extreme OED pres-
ent was identified in each H&E-stained section and marked as the target for FTIR
spectroscopy. This area was termed the region of interest (ROI).
FTIR imaging data were acquired using a Varian 620 microscope coupled to an Agilent
Cary 670 spectrometer (Agilent, Stockport, UK) enclosed within a purging chamber to elimi-
nate water vapor and carbon dioxide contributions. The instrument was configured to collect
mid-IR transmission data between 900 and 3800 cm-1 with a spectral resolution of 4 cm-1 and
pixel size of 5.5 μm, allowing the simultaneous acquisition of 128 x 128 spectra over a field of
view of approximately 0.5 mm2. CaF2 disks with mounted sections were loaded onto a 3D-
printed slide holder capable of containing three disks. Disks were imaged two at a time, with
the third position reserved for a clean, blank disk to allow for microscope calibration and spec-
tral background correction. The semiconductor detector (Mercury-Cadmium-Telluride) in
the FTIR microscope was cooled with liquid nitrogen to 78 K in order to reduce thermal noise
in the data. Using the average of 128 scans of the blank disk for background correction, a
hyperspectral IR image was obtained for each ROI by averaging 64 scans of the identified dys-
plastic area. A built-in mosaic function was utilized for cases where the extent of the surface
oral epithelium in the tissue sections could not be visualized in one field of view of the micro-
scope and enabled the acquisition of larger, composite images.
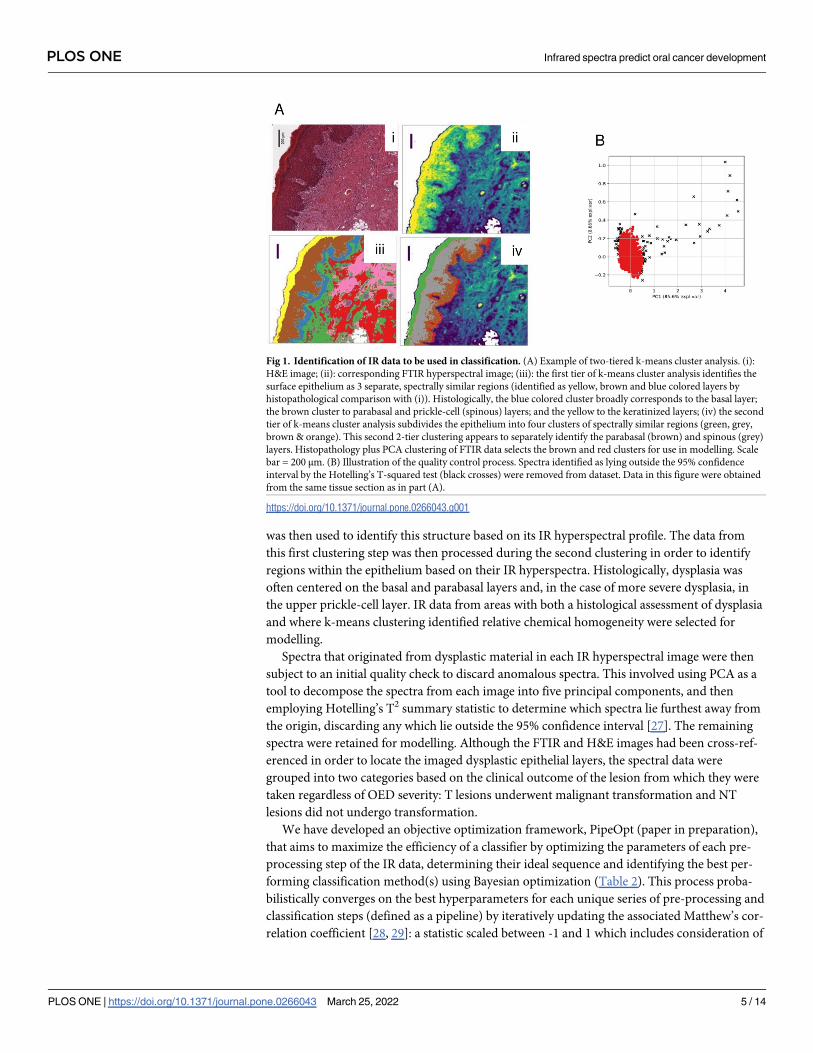
Subsequently, the FTIR images were cross-referenced with scanned images of the corre-
sponding H&E sections to confirm the location and extent of dysplasia within the ROI (Fig
1A). To annotate IR spectral data originating in dysplastic epithelium, each hyperspectral
image was subjected to a two-tiered, k-means cluster analysis (Fig 1A). Initially, the epithelium
was identified by a specialist, head and neck histopathologist (AT). The first clustering step
PLOS ONE Infrared spectra predict oral cancer development
PLOS ONE | https://doi.org/10.1371/journal.pone.0266043 March 25, 2022 3 / 14
Ta
ble
1.
Pa
tien
ta
nd
sam
ple
coh
ort
cha
ract
eris
tics
.
Pa
tien
tg
rou
pId
enti
fier
Ag
ea
t
bio
psy
Gen
der
Sit
eN
um
ber
of
clin
ica
lsi
tes
Cli
nic
al
Pre
sen
tati
on
Les
ion
size
(mm
2)
at
pre
sen
tati
on
His
tolo
gy
Gra
de
of
RO
IaT
ime
bef
ore
tra
nsf
orm
ati
on
Tim
e
can
cer
free
Lif
esty
le
(mo
nth
s)(m
on
ths)
tob
acc
oa
lco
ho
l
Tra
nsf
orm
ing
12
08
95
8M
Ven
tral
To
ng
ue
sin
gle
Ery
thro
leu
ko
pla
kia
10
1–
50
0se
ver
e2
y(2
-
20
py)b
y
n=
10
12
20
15
2M
Bu
ccal
sin
gle
Leu
ko
pla
kia
>5
00
sever
e4
y
(>2
0p
y)
y
12
26
07
4F
Flo
or
of
Mo
uth
sin
gle
Leu
ko
pla
kia
�1
00
mo
der
ate-
sever
e
5y
(>2
0p
y)
y
12
12
78
5M
Lat
eral
To
ng
ue
sin
gle
Leu
ko
pla
kia
10
0–
50
0m
od
erat
e7
nn
12
25
74
9F
Lat
eral
To
ng
ue
sin
gle
Leu
ko
pla
kia
10
0–
50
0m
od
erat
e1
2n
y
12
24
86
9F
Lat
eral
To
ng
ue
mu
ltip
leE
ryth
role
uk
op
lak
ia1
00
–5
00
sever
e1
4n
n
12
26
34
5F
Lat
eral
To
ng
ue
sin
gle
Leu
ko
pla
kia
10
0–
50
0m
od
erat
e-
sever
e
18
y(5
-
20
py)
y
12
10
47
0F
Lat
eral
To
ng
ue
sin
gle
Ery
thro
leu
ko
pla
kia
10
0–
50
0m
od
erat
e2
6n
n
12
19
54
5F
Ven
tral
To
ng
ue
mu
ltip
leE
ryth
role
uk
op
lak
ia>
50
0m
od
erat
e3
3y
(5-
20
py)
y
12
21
96
8F
Ven
tral
To
ng
ue
sin
gle
Leu
ko
pla
kia
�1
00
mo
der
ate-
sever
e
43
y(5
-
10
py)
n
No
n-
Tra
nsf
orm
ing
12
18
14
9F
So
ftP
alat
esi
ng
leL
euk
op
lak
ia>
50
0se
ver
e1
58
ny
n=
71
23
30
47
FS
oft
Pal
ate
mu
ltip
leE
ryth
role
uk
op
lak
ia>
50
0m
od
erat
e1
08
y(5
-
20
py
)
y
12
09
87
8M
Ven
tral
To
ng
ue
sin
gle
Leu
ko
pla
kia
>5
00
mo
der
ate
10
6y
(>2
0p
y)
y
12
33
27
1F
Man
dib
ula
r
alveo
lus
mu
ltip
leL
euk
op
lak
ia�
10
0m
od
erat
e9
1n
y
12
32
95
9M
Flo
or
of
Mo
uth
sin
gle
Ery
thro
leu
ko
pla
kia
�1
00
mo
der
ate
75
y
(>2
0p
y)
y
12
16
26
1F
Flo
or
of
Mo
uth
sin
gle
Ery
thro
leu
ko
pla
kia
�1
00
sever
e6
7y
(>2
0p
y)
y
12
14
14
7F
Flo
or
of
Mo
uth
mu
ltip
leE
ryth
role
uk
op
lak
ia�
10
0se
ver
e4
3y
(>2
0p
y)
y
aR
OI
=re
gio
no
fin
tere
st:th
eta
rget
for
FT
IRsp
ectr
osc
op
ybp
y=
pac
kyea
rs(=
pac
ks
per
day
mu
ltip
lied
by
yea
rssm
ok
ed).
htt
ps:
//doi.o
rg/1
0.1
371/jo
urn
al.p
one.
0266043.t001
PLOS ONE Infrared spectra predict oral cancer development
PLOS ONE | https://doi.org/10.1371/journal.pone.0266043 March 25, 2022 4 / 14
was then used to identify this structure based on its IR hyperspectral profile. The data from
this first clustering step was then processed during the second clustering in order to identify
regions within the epithelium based on their IR hyperspectra. Histologically, dysplasia was
often centered on the basal and parabasal layers and, in the case of more severe dysplasia, in
the upper prickle-cell layer. IR data from areas with both a histological assessment of dysplasia
and where k-means clustering identified relative chemical homogeneity were selected for
modelling.
Spectra that originated from dysplastic material in each IR hyperspectral image were then
subject to an initial quality check to discard anomalous spectra. This involved using PCA as a
tool to decompose the spectra from each image into five principal components, and then
employing Hotelling’s T2 summary statistic to determine which spectra lie furthest away from
the origin, discarding any which lie outside the 95% confidence interval [27]. The remaining
spectra were retained for modelling. Although the FTIR and H&E images had been cross-ref-
erenced in order to locate the imaged dysplastic epithelial layers, the spectral data were
grouped into two categories based on the clinical outcome of the lesion from which they were
taken regardless of OED severity: T lesions underwent malignant transformation and NT
lesions did not undergo transformation.
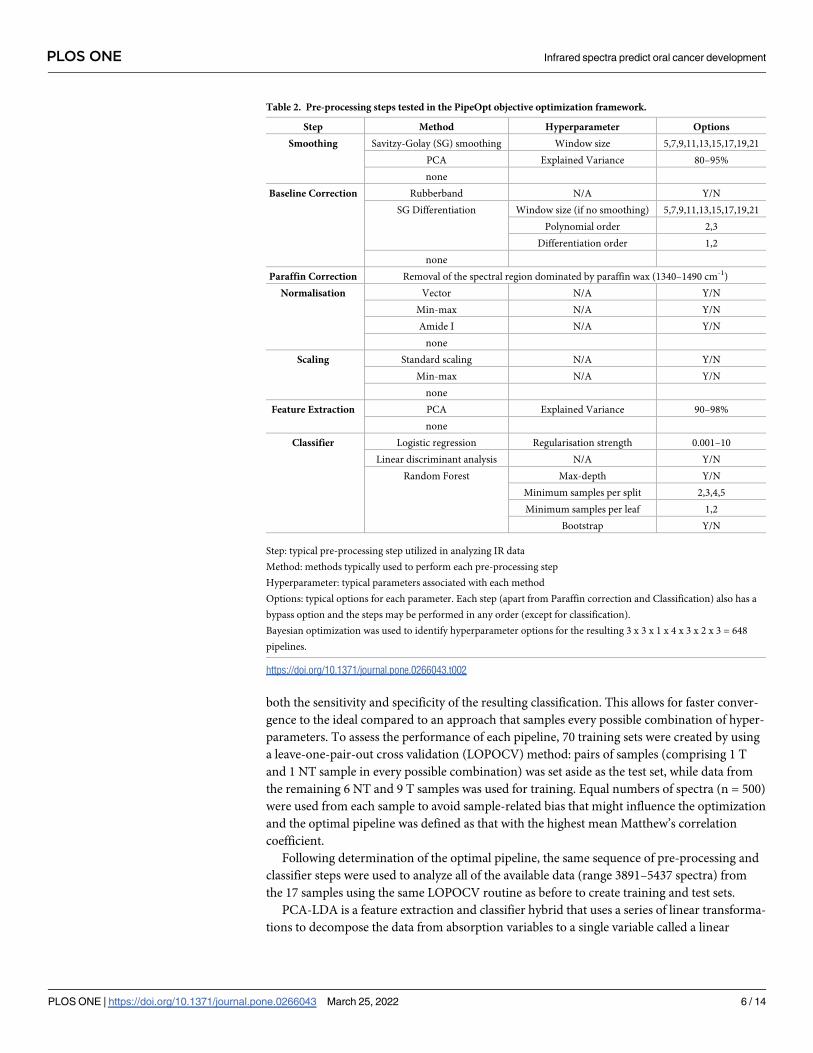
We have developed an objective optimization framework, PipeOpt (paper in preparation),
that aims to maximize the efficiency of a classifier by optimizing the parameters of each pre-
processing step of the IR data, determining their ideal sequence and identifying the best per-
forming classification method(s) using Bayesian optimization (Table 2). This process proba-
bilistically converges on the best hyperparameters for each unique series of pre-processing and
classification steps (defined as a pipeline) by iteratively updating the associated Matthew’s cor-
relation coefficient [28, 29]: a statistic scaled between -1 and 1 which includes consideration of
Fig 1. Identification of IR data to be used in classification. (A) Example of two-tiered k-means cluster analysis. (i):
H&E image; (ii): corresponding FTIR hyperspectral image; (iii): the first tier of k-means cluster analysis identifies the
surface epithelium as 3 separate, spectrally similar regions (identified as yellow, brown and blue colored layers by
histopathological comparison with (i)). Histologically, the blue colored cluster broadly corresponds to the basal layer;
the brown cluster to parabasal and prickle-cell (spinous) layers; and the yellow to the keratinized layers; (iv) the second
tier of k-means cluster analysis subdivides the epithelium into four clusters of spectrally similar regions (green, grey,
brown & orange). This second 2-tier clustering appears to separately identify the parabasal (brown) and spinous (grey)
layers. Histopathology plus PCA clustering of FTIR data selects the brown and red clusters for use in modelling. Scale
bar = 200 μm. (B) Illustration of the quality control process. Spectra identified as lying outside the 95% confidence
interval by the Hotelling’s T-squared test (black crosses) were removed from dataset. Data in this figure were obtained
from the same tissue section as in part (A).
https://doi.org/10.1371/journal.pone.0266043.g001
PLOS ONE Infrared spectra predict oral cancer development
PLOS ONE | https://doi.org/10.1371/journal.pone.0266043 March 25, 2022 5 / 14
both the sensitivity and specificity of the resulting classification. This allows for faster conver-
gence to the ideal compared to an approach that samples every possible combination of hyper-
parameters. To assess the performance of each pipeline, 70 training sets were created by using
a leave-one-pair-out cross validation (LOPOCV) method: pairs of samples (comprising 1 T
and 1 NT sample in every possible combination) was set aside as the test set, while data from
the remaining 6 NT and 9 T samples was used for training. Equal numbers of spectra (n = 500)
were used from each sample to avoid sample-related bias that might influence the optimization
and the optimal pipeline was defined as that with the highest mean Matthew’s correlation
coefficient.
Following determination of the optimal pipeline, the same sequence of pre-processing and
classifier steps were used to analyze all of the available data (range 3891–5437 spectra) from
the 17 samples using the same LOPOCV routine as before to create training and test sets.
PCA-LDA is a feature extraction and classifier hybrid that uses a series of linear transforma-
tions to decompose the data from absorption variables to a single variable called a linear
Table 2. Pre-processing steps tested in the PipeOpt objective optimization framework.
Step Method Hyperparameter Options
Smoothing Savitzy-Golay (SG) smoothing Window size 5,7,9,11,13,15,17,19,21
PCA Explained Variance 80–95%
none
Baseline Correction Rubberband N/A Y/N
SG Differentiation Window size (if no smoothing) 5,7,9,11,13,15,17,19,21
Polynomial order 2,3
Differentiation order 1,2
none
Paraffin Correction Removal of the spectral region dominated by paraffin wax (1340–1490 cm-1)
Normalisation Vector N/A Y/N
Min-max N/A Y/N
Amide I N/A Y/N
none
Scaling Standard scaling N/A Y/N
Min-max N/A Y/N
none
Feature Extraction PCA Explained Variance 90–98%
none
Classifier Logistic regression Regularisation strength 0.001–10
Linear discriminant analysis N/A Y/N
Random Forest Max-depth Y/N
Minimum samples per split 2,3,4,5
Minimum samples per leaf 1,2
Bootstrap Y/N
Step: typical pre-processing step utilized in analyzing IR data
Method: methods typically used to perform each pre-processing step
Hyperparameter: typical parameters associated with each method
Options: typical options for each parameter. Each step (apart from Paraffin correction and Classification) also has a
bypass option and the steps may be performed in any order (except for classification).
Bayesian optimization was used to identify hyperparameter options for the resulting 3 x 3 x 1 x 4 x 3 x 2 x 3 = 648
pipelines.
https://doi.org/10.1371/journal.pone.0266043.t002
PLOS ONE Infrared spectra predict oral cancer development
PLOS ONE | https://doi.org/10.1371/journal.pone.0266043 March 25, 2022 6 / 14
discriminant (LD), the value of which is called the LD score. The LD score is dependent upon
the PCA and LDA loading vectors, which are a measure of the relative weight that each wave-
number in the spectrum contributes to that part of the analysis. The LD scores for each data-
point in every lesion were plotted against their frequency of occurrence in relation to their
known transformative capacity and were also used to identify key wavenumbers in the dis-
crimination of T from NT datapoints.
At each iteration of train/test, the predicted outcome (transformation or no transforma-
tion) at every datapoint for the test sample was determined and the lesion as a whole classified
as T or NT based on a simple majority.
The FTIR data was converted from native data format using the ChiToolbox package
MATLAB [30]. All data transformation and statistical analyses were performed using either
in-house developed packages (PipeOpt) or third-party packages implemented in Python v3.9.
Results
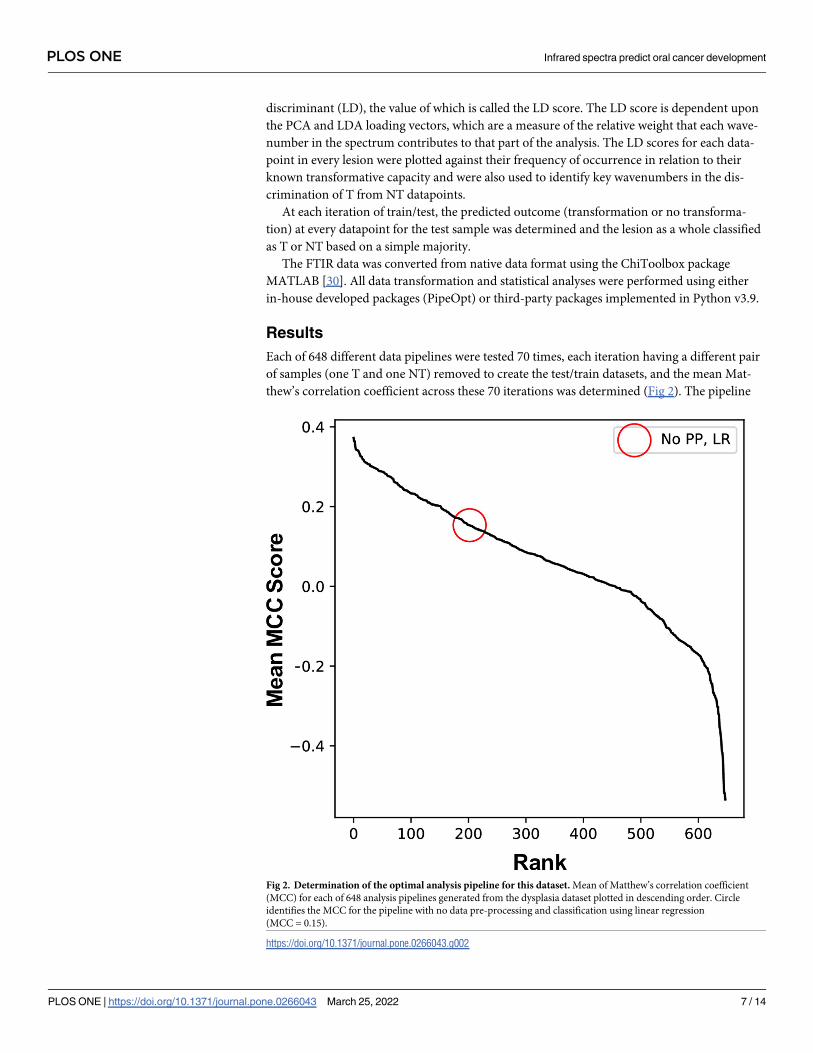
Each of 648 different data pipelines were tested 70 times, each iteration having a different pair
of samples (one T and one NT) removed to create the test/train datasets, and the mean Mat-
thew’s correlation coefficient across these 70 iterations was determined (Fig 2). The pipeline
Fig 2. Determination of the optimal analysis pipeline for this dataset. Mean of Matthew’s correlation coefficient
(MCC) for each of 648 analysis pipelines generated from the dysplasia dataset plotted in descending order. Circle
identifies the MCC for the pipeline with no data pre-processing and classification using linear regression
(MCC = 0.15).
https://doi.org/10.1371/journal.pone.0266043.g002
PLOS ONE Infrared spectra predict oral cancer development
PLOS ONE | https://doi.org/10.1371/journal.pone.0266043 March 25, 2022 7 / 14
with the highest mean correlation coefficient (0.37) was identified from this analysis and is as
follows: denoising of the spectra using the Savitzky-Golay smoothing algorithm [31] with a
window size of 15 and polynomial order of 2; first order differentiation of the spectra to
remove effects such as scattering and background interferences; removal of the spectral region
dominated by paraffin wax (1340–1490 cm-1) [23]; normalization so that the sum of the
squares of each spectrum is equal to 1 (vector normalization) to account for variations in sam-
ple thickness; PCA-LDA classification. In this analysis, PCA was applied to the spectral data to
decompose it into the number of principal components that described 90% of the explained
variance in the original dataset and LDA was then used to discriminate between the two
groups of lesions (T and NT) using the principal components as input.
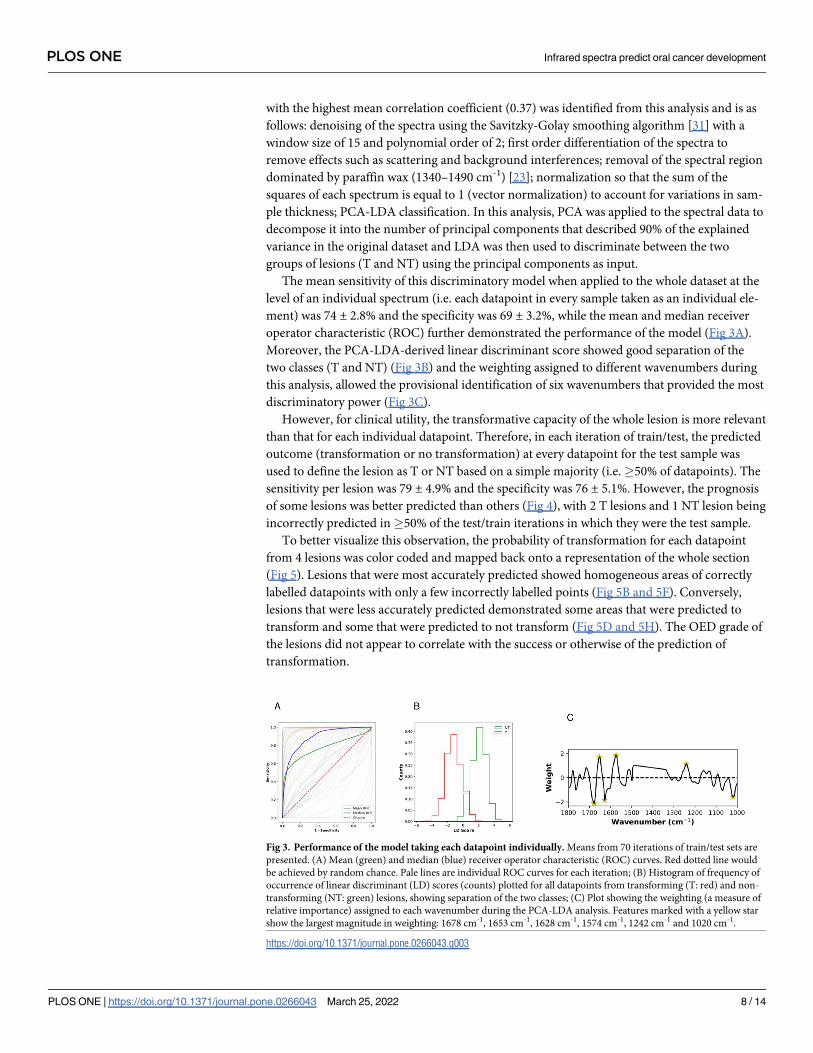
The mean sensitivity of this discriminatory model when applied to the whole dataset at the
level of an individual spectrum (i.e. each datapoint in every sample taken as an individual ele-
ment) was 74 ± 2.8% and the specificity was 69 ± 3.2%, while the mean and median receiver
operator characteristic (ROC) further demonstrated the performance of the model (Fig 3A).
Moreover, the PCA-LDA-derived linear discriminant score showed good separation of the
two classes (T and NT) (Fig 3B) and the weighting assigned to different wavenumbers during
this analysis, allowed the provisional identification of six wavenumbers that provided the most
discriminatory power (Fig 3C).
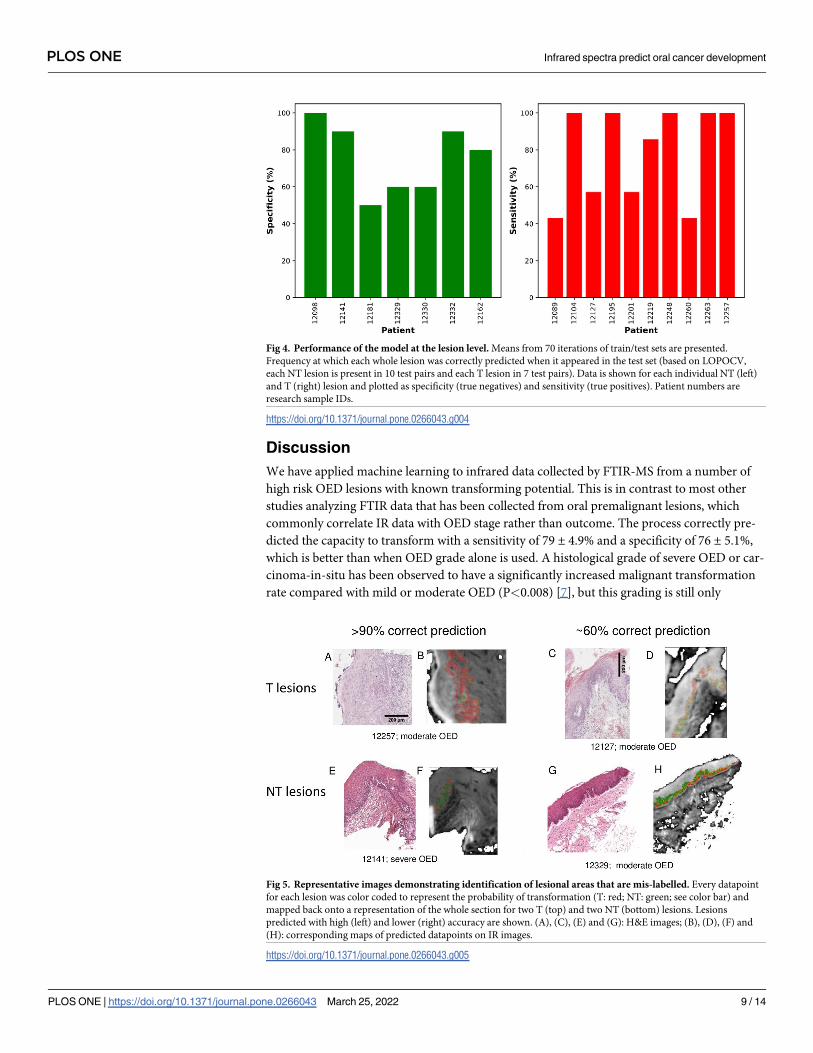
However, for clinical utility, the transformative capacity of the whole lesion is more relevant
than that for each individual datapoint. Therefore, in each iteration of train/test, the predicted
outcome (transformation or no transformation) at every datapoint for the test sample was
used to define the lesion as T or NT based on a simple majority (i.e.�50% of datapoints). The
sensitivity per lesion was 79 ± 4.9% and the specificity was 76 ± 5.1%. However, the prognosis
of some lesions was better predicted than others (Fig 4), with 2 T lesions and 1 NT lesion being
incorrectly predicted in�50% of the test/train iterations in which they were the test sample.
To better visualize this observation, the probability of transformation for each datapoint
from 4 lesions was color coded and mapped back onto a representation of the whole section
(Fig 5). Lesions that were most accurately predicted showed homogeneous areas of correctly
labelled datapoints with only a few incorrectly labelled points (Fig 5B and 5F). Conversely,
lesions that were less accurately predicted demonstrated some areas that were predicted to
transform and some that were predicted to not transform (Fig 5D and 5H). The OED grade of
the lesions did not appear to correlate with the success or otherwise of the prediction of
transformation.
Fig 3. Performance of the model taking each datapoint individually. Means from 70 iterations of train/test sets are
presented. (A) Mean (green) and median (blue) receiver operator characteristic (ROC) curves. Red dotted line would
be achieved by random chance. Pale lines are individual ROC curves for each iteration; (B) Histogram of frequency of
occurrence of linear discriminant (LD) scores (counts) plotted for all datapoints from transforming (T: red) and non-
transforming (NT: green) lesions, showing separation of the two classes; (C) Plot showing the weighting (a measure of
relative importance) assigned to each wavenumber during the PCA-LDA analysis. Features marked with a yellow star
show the largest magnitude in weighting: 1678 cm-1, 1653 cm-1, 1628 cm-1, 1574 cm-1, 1242 cm-1 and 1020 cm-1.
https://doi.org/10.1371/journal.pone.0266043.g003
PLOS ONE Infrared spectra predict oral cancer development
PLOS ONE | https://doi.org/10.1371/journal.pone.0266043 March 25, 2022 8 / 14
Discussion
We have applied machine learning to infrared data collected by FTIR-MS from a number of
high risk OED lesions with known transforming potential. This is in contrast to most other
studies analyzing FTIR data that has been collected from oral premalignant lesions, which
commonly correlate IR data with OED stage rather than outcome. The process correctly pre-
dicted the capacity to transform with a sensitivity of 79 ± 4.9% and a specificity of 76 ± 5.1%,
which is better than when OED grade alone is used. A histological grade of severe OED or car-
cinoma-in-situ has been observed to have a significantly increased malignant transformation
rate compared with mild or moderate OED (P<0.008) [7], but this grading is still only
Fig 4. Performance of the model at the lesion level. Means from 70 iterations of train/test sets are presented.
Frequency at which each whole lesion was correctly predicted when it appeared in the test set (based on LOPOCV,
each NT lesion is present in 10 test pairs and each T lesion in 7 test pairs). Data is shown for each individual NT (left)
and T (right) lesion and plotted as specificity (true negatives) and sensitivity (true positives). Patient numbers are
research sample IDs.
https://doi.org/10.1371/journal.pone.0266043.g004
Fig 5. Representative images demonstrating identification of lesional areas that are mis-labelled. Every datapoint
for each lesion was color coded to represent the probability of transformation (T: red; NT: green; see color bar) and
mapped back onto a representation of the whole section for two T (top) and two NT (bottom) lesions. Lesions
predicted with high (left) and lower (right) accuracy are shown. (A), (C), (E) and (G): H&E images; (B), (D), (F) and
(H): corresponding maps of predicted datapoints on IR images.
https://doi.org/10.1371/journal.pone.0266043.g005
PLOS ONE Infrared spectra predict oral cancer development
PLOS ONE | https://doi.org/10.1371/journal.pone.0266043 March 25, 2022 9 / 14

predictive for 24–40% of such lesions [7, 32]. It is of note that, in the limited cohort used in the
present study, equivalent numbers of severe and moderate OED were present in the T and NT
groups, and OED grade did not correlate with the ability of the classifier to accurately predict
transformation potential.
Two lesions known to transform were predicted to be non-transforming in the current
analysis. Based on our knowledge of oral cancer development, it may be hypothesized that the
lesions are most probably heterogeneous with areas possessing transforming potential and
areas without this potential. Thus, the biopsy may not have been representative of the region
that underwent subsequent transformation. Similarly, given the relatively large size of the
region used for IR imaging compared to the size of individual cells, the IR imaged area will
contain areas displaying an ‘IR transformation fingerprint’ and areas that do not. In the analy-
sis presented here, it is the predominant fingerprint (i.e.�50% of datapoints) that was used to
classify the lesion as a whole, but, clinically, the worst area rather than the predominant signal
may be more important when predicting transformation and selecting appropriate clinical
treatment. Future development of this method would investigate how altering the 50% thresh-
old affects the capability of the model, as the sensitivity would be expected to increase as the
threshold is reduced but at the expense of specificity and vice versa. This is an important area
for clarification in a larger study and is related to clinical needs. Increased sensitivity (i.e. better
prediction of transforming status) could lead to decreased surveillance intervals, treatment
such as excision or enrolment onto chemoprevention trials. Conversely increased specificity
(i.e. better prediction of non-transforming status) might lead to changes in clinical practice to
allow for safe discharge or increased follow-up intervals. The identification of areas predicted
to have transforming capacity in one NT lesion is more difficult to explain, as none of the NT
lesions were excised during the follow-up period. However, it might be hypothesized that very
small islands of putatively transforming OED could have been completely excised during the
biopsy procedure, unintentionally performing a therapeutic excisional biopsy despite the
intention for diagnostic incisional biopsy.
Pre-processing of FTIR data is acknowledged to improve the performance of subsequent
classification models [33], but the choice of both the protocol and the subsequent modelling
method is often highly subjective and its efficacy is dependent on the characteristics of the
dataset. Instead of applying pre-processing steps in an arbitrary manner, a novel objective opti-
mization method was used in the current study to maximize the efficiency of the OED trans-
formation classifier by optimizing the parameters of each pre-processing step of the IR data,
determining their ideal sequence and identifying the best performing classification method(s),
or pipeline, using Bayesian optimization. Considering that the trialed pipelines all contain the-
oretically sensible pre-processing and classifier combinations, the significant variation in Mat-
thew’s correlation coefficient score (-0.53 to 0.37) was surprising. It was noted, however, that
many of the negative correlations were obtained when data was not normalized. Infrared data
are very sensitive to the amount of substance being probed, so mitigating for inevitable vari-
ability in sample thickness and preparation is crucial in order to build models derived from
multiple specimens.
The decision to use a LOPOCV strategy was taken because the small sample size precluded
the division of specimens into larger test/train sets. LOPOCV produces the most robust esti-
mation of the model’s true performance, since every combination of patients is used in the
training and testing of the model. However, the small sample size (n = 17) led to a high stan-
dard deviation in the mean sensitivity, specificity and ROC variance at the individual data-
point level because biological variation both between patients and within individual lesions is
to be expected and will impinge on the analysis under a LOPOCV strategy. Thus, a larger,
multi-center study is required to test the model further.
PLOS ONE Infrared spectra predict oral cancer development
PLOS ONE | https://doi.org/10.1371/journal.pone.0266043 March 25, 2022 10 / 14

Four of the six wavenumbers attributed the most weight during this classification can be
assigned to components of the amide I and II bands [34, 35], which are situated at 1700–1600
cm-1 and 1600–1500 cm-1 respectively. Absorbance at these wavenumbers can be directly
attributed to the vibrating modes of repeating peptide bonds, but the convoluted nature of the
amide bands renders the task of attributing specific moieties to particular wavenumbers diffi-
cult. The remaining features with the highest weight, and hence discriminating power, are at
1242 cm-1 and 1020 cm-1: regions known to be dominated by contributions from DNA, RNA
and glycogen [34]. Thus, a relatively high weighting of the IR data obtained at 1242 cm-1 might
be indicative of an increase in DNA aneuploidy in T lesions compared with NT lesions, a
known early event in oral carcinogenesis [36, 37]. Similarly, the characteristic absorption peak
of glycogen is centered at approximately 1030 cm-1 and its importance in the experiments pre-
sented in this report may correlate with the observation that abundance of the molecule is
depleted in pre-malignant tissue as a result of increased proliferation requiring additional
energy [38]. This association with glycogen depletion has been applied in the use of Lugol’s
Iodine staining in an attempt to identify and clear OED at the margins of oral cancer resec-
tions [39]. Despite these reassuring correlations between wavenumbers with high weighting in
the discriminatory model and previously recognized biological observations, it should be
remembered that the absorbance of IR light at any particular wavenumber by a biological tis-
sue is the sum of the absorbance by a number of different biochemical molecules, and it should
not be expected that a multivariate analysis combining DNA aneuploidy and glycogen levels
will be as effective a discriminator as the model presented here. Future research with larger
sample numbers and intention-to-treat biopsy specimens should use multivariate analysis to
assess how many key wavenumbers are necessary, in conjunction with clinicopathological var-
iables, to build a clinically useful discriminatory model. This reduction in the number of wave-
numbers required for discrimination will, in turn, lead to the development of less expensive
IR-based technology, perhaps utilizing quantum cascade lasers (QCLs) [40, 41], that might be
employed in routine pathology laboratories.
Conclusions
This study of a pathologically defined set of OED specimens with known outcome suggests
that the analysis of IR data can distinguish lesions with the capacity to transform to oral cancer
from those that do not, regardless of OED grade. This represents a novel analysis of FTIR data
collected from oral premalignant lesions, as data is commonly correlated with OED stage
rather than outcome. The results are encouraging, bearing in mind the small sample size and
the inherent clinical and biological limitations of using a small biopsy to reflect a much greater
field of potential malignant change, and may come to represent a step forward in the clinical
assessment of such lesions that allows improved treatment planning. Further research should
concentrate on increasing sample size and complexity to reflect the clinical conundrum and
the development of technology to apply the methodology in a timely and cost-effective
manner.
Author Contributions
Conceptualization: Richard J. Shaw, Peter Weightman, Janet M. Risk.
Data curation: Barnaby G. Ellis.
Formal analysis: Barnaby G. Ellis, Conor A. Whitley, Steve D. Barrett.
Funding acquisition: Steve D. Barrett, Richard J. Shaw, Peter Weightman, Janet M. Risk.
PLOS ONE Infrared spectra predict oral cancer development
PLOS ONE | https://doi.org/10.1371/journal.pone.0266043 March 25, 2022 11 / 14
Investigation: Barnaby G. Ellis, Asterios Triantafyllou, Philip J. Gunning, Caroline I. Smith,
Peter Gardner.
Methodology: Barnaby G. Ellis, Janet M. Risk.
Project administration: Caroline I. Smith, Janet M. Risk.
Resources: Barnaby G. Ellis, Asterios Triantafyllou, Philip J. Gunning, Peter Gardner, Janet
M. Risk.
Software: Barnaby G. Ellis, Conor A. Whitley.
Supervision: Steve D. Barrett, Richard J. Shaw, Peter Weightman, Janet M. Risk.
Visualization: Barnaby G. Ellis.
Writing – original draft: Barnaby G. Ellis, Janet M. Risk.
Writing – review & editing: Barnaby G. Ellis, Conor A. Whitley, Asterios Triantafyllou, Philip
J. Gunning, Caroline I. Smith, Steve D. Barrett, Peter Gardner, Richard J. Shaw, Peter
Weightman, Janet M. Risk.
References1. Ferlay J, Ervik M, Lam F, Colombet M, Mery L, Piñeros M, et al. Global Cancer Observatory: Cancer
Today. Lyon, France: International Agency for Research on Cancer. 2020 [2nd July 2021]. Available
from: https://gco.iarc.fr/today/data/factsheets/cancers/1-Lip-oral-cavity-fact-sheet.pdf
2. Johnson NW, Jayasekara P, Amarasinghe AA. Squamous cell carcinoma and precursor lesions of the
oral cavity: epidemiology and aetiology. Periodontol 2000. 2011; 57(1):19–37. https://doi.org/10.1111/j.
1600-0757.2011.00401.x PMID: 21781177
3. Warnakulasuriya S, Kujan O, Aguirre-Urizar JM, Bagan JV, Gonzalez-Moles MA, Kerr AR, et al. Oral
potentially malignant disorders: A consensus report from an international seminar on nomenclature and
classification, convened by the WHO Collaborating Centre for Oral Cancer. Oral Dis. 2021; 27(8):1862–
80. https://doi.org/10.1111/odi.13704 PMID: 33128420
4. Barnes L, Eveson JW, Reichart P, Sidransky D. World Health Organization Classification of Tumors.
Pathology and Genetics of Head and Neck Tumours. Lyon: IARC Press; 2005.
5. Panwar A, Lindau R, Wieland A. Management for premalignant lesions of the oral cavity. Expert Rev
Anticancer Ther. 2014; 14(3):349–57. https://doi.org/10.1586/14737140.2013.842898 PMID:
24559323
6. Reddi SP, Shafer AT. Oral premalignant lesions: management considerations. Oral Maxillofac Surg
Clin North Am. 2006; 18(4):425–33. https://doi.org/10.1016/j.coms.2006.08.002 PMID: 18088843
7. Mehanna HM, Rattay T, Smith J, McConkey CC. Treatment and follow-up of oral dysplasia—a system-
atic review and meta-analysis. Head Neck. 2009; 31(12):1600–9. https://doi.org/10.1002/hed.21131
PMID: 19455705
8. Muller S. Update from the 4th Edition of the World Health Organization of Head and Neck Tumours:
Tumours of the Oral Cavity and Mobile Tongue. Head Neck Pathol. 2017; 11(1):33–40. https://doi.org/
10.1007/s12105-017-0792-3 PMID: 28247230
9. Kujan O, Khattab A, Oliver RJ, Roberts SA, Thakker N, Sloan P. Why oral histopathology suffers inter-
observer variability on grading oral epithelial dysplasia: an attempt to understand the sources of varia-
tion. Oral Oncol. 2007; 43(3):224–31. https://doi.org/10.1016/j.oraloncology.2006.03.009 PMID:
16931119
10. Warnakulasuriya S, Kovacevic T, Madden P, Coupland VH, Sperandio M, Odell E, et al. Factors predict-
ing malignant transformation in oral potentially malignant disorders among patients accrued over a 10-
year period in South East England. J Oral Pathol Med. 2011; 40(9):677–83. https://doi.org/10.1111/j.
1600-0714.2011.01054.x PMID: 21762430
11. Pitiyage G, Tilakaratne WM, Tavassoli M, Warnakulasuriya S. Molecular markers in oral epithelial dys-
plasia: review. J Oral Pathol Med. 2009; 38(10):737–52. https://doi.org/10.1111/j.1600-0714.2009.
00804.x PMID: 19903246
12. Schepman KP, van der Waal I. A proposal for a classification and staging system for oral leukoplakia: a
preliminary study. Eur J Cancer B Oral Oncol. 1995; 31B(6):396–8. https://doi.org/10.1016/0964-1955
(95)00032-1 PMID: 8746271
PLOS ONE Infrared spectra predict oral cancer development
PLOS ONE | https://doi.org/10.1371/journal.pone.0266043 March 25, 2022 12 / 14
13. Lumerman H, Freedman P, Kerpel S. Oral epithelial dysplasia and the development of invasive squa-
mous cell carcinoma. Oral Surg Oral Med Oral Pathol Oral Radiol Endod. 1995; 79(3):321–9. https://
doi.org/10.1016/s1079-2104(05)80226-4 PMID: 7621010
14. Arduino PG, Surace A, Carbone M, Elia A, Massolini G, Gandolfo S, et al. Outcome of oral dysplasia: a
retrospective hospital-based study of 207 patients with a long follow-up. J Oral Pathol Med. 2009; 38
(6):540–4. https://doi.org/10.1111/j.1600-0714.2009.00782.x PMID: 19453839
15. Ho MW, Risk JM, Woolgar JA, Field EA, Field JK, Steele JC, et al. The clinical determinants of malig-
nant transformation in oral epithelial dysplasia. Oral Oncol. 2012; 48(10):969–76. https://doi.org/10.
1016/j.oraloncology.2012.04.002 PMID: 22579265
16. Monteiro L, Mello FW, Warnakulasuriya S. Tissue biomarkers for predicting the risk of oral cancer in
patients diagnosed with oral leukoplakia: A systematic review. Oral Dis. 2021; 27(8):1977–92. https://
doi.org/10.1111/odi.13747 PMID: 33290585
17. Baker MJ, Byrne HJ, Chalmers J, Gardner P, Goodacre R, Henderson A, et al. Clinical applications of
infrared and Raman spectroscopy: state of play and future challenges. Analyst. 2018; 143(8):1735–57.
https://doi.org/10.1039/c7an01871a PMID: 29504623
18. Paraskevaidi M, Matthew BJ, Holly BJ, Hugh BJ, Thulya CPV, Loren C, et al. Clinical applications of
infrared and Raman spectroscopy in the fields of cancer and infectious diseases. Applied Spectroscopy
Reviews. 2021; 56(8–10):804–68. https://doi.org/10.1080/05704928.2021.1946076
19. Trevisan J, Angelov PP, Carmichael PL, Scott AD, Martin FL. Extracting biological information with
computational analysis of Fourier-transform infrared (FTIR) biospectroscopy datasets: current practices
to future perspectives. Analyst. 2012; 137(14):3202–15. https://doi.org/10.1039/c2an16300d PMID:
22627698
20. Jolliffe IT, Cadima J. Principal component analysis: a review and recent developments. Philosophical
Transactions of the Royal Society A: Mathematical, Physical and Engineering Sciences. 2016; 374
(2065):20150202. https://doi.org/10.1098/rsta.2015.0202 PMID: 26953178
21. Sattlecker M, Stone N, Bessant C. Current trends in machine-learning methods applied to spectro-
scopic cancer diagnosis. TrAC Trends in Analytical Chemistry. 2014; 59:17–25. https://doi.org/10.1016/
j.trac.2014.02.016
22. Baker MJ, Gazi E, Brown MD, Shanks JH, Gardner P, Clarke NW. FTIR-based spectroscopic analysis
in the identification of clinically aggressive prostate cancer. Br J Cancer. 2008; 99(11):1859–66. https://
doi.org/10.1038/sj.bjc.6604753 PMID: 18985044
23. Pilling M, Gardner P. Fundamental developments in infrared spectroscopic imaging for biomedical
applications. Chemical Society Reviews. 2016; 45(7):1935–57. https://doi.org/10.1039/c5cs00846h
PMID: 26996636
24. Ellis BG, Whitley CA, Al Jedani S, Smith CI, Gunning PJ, Harrison P, et al. Insight into metastatic oral
cancer tissue from novel analyses using FTIR spectroscopy and aperture IR-SNOM. Analyst. 2021;
146(15):4895–904. https://doi.org/10.1039/d1an00922b PMID: 34241603
25. Li B, Gu ZY, Yan KX, Wen ZN, Zhao ZH, Li LJ, et al. Evaluating oral epithelial dysplasia classification
system by near-infrared Raman spectroscopy. Oncotarget. 2017; 8(44):76257–65. https://doi.org/10.
18632/oncotarget.19343 PMID: 29100309
26. Banerjee S, Pal M, Chakrabarty J, Petibois C, Paul RR, Giri A, et al. Fourier-transform-infrared-spec-
troscopy based spectral-biomarker selection towards optimum diagnostic differentiation of oral leuko-
plakia and cancer. Anal Bioanal Chem. 2015; 407(26):7935–43. https://doi.org/10.1007/s00216-015-
8960-3 PMID: 26342309
27. Morais CLM, Paraskevaidi M, Cui L, Fullwood NJ, Isabelle M, Lima KMG, et al. Standardization of com-
plex biologically derived spectrochemical datasets. Nat Protoc. 2019; 14(5):1546–77. https://doi.org/10.
1038/s41596-019-0150-x PMID: 30953040
28. Matthews BW. Comparison of the predicted and observed secondary structure of T4 phage lysozyme.
Biochimica et Biophysica Acta (BBA)—Protein Structure. 1975; 405(2):442–51. https://doi.org/10.1016/
0005-2795(75)90109-9 PMID: 1180967
29. Chicco D, Jurman G. The advantages of the Matthews correlation coefficient (MCC) over F1 score and
accuracy in binary classification evaluation. BMC Genomics. 2020; 21(1):6. https://doi.org/10.1186/
s12864-019-6413-7 PMID: 31898477
30. Henderson A. ChiToolbox: MATLAB toolbox for handling hyperspectral data generated by SIMS, FTIR
and Raman instruments [19/7/2021]. Available from: https://bitbucket.org/AlexHenderson/chitoolbox/.
31. Savitzky A, Golay MJE. Smoothing and Differentiation of Data by Simplified Least Squares Procedures.
Analytical Chemistry. 1964; 36(8):1627–39. https://doi.org/https%3A//doi.org/10.1021/ac60214a047
32. de Freitas Silva BS, Batista DCR, de Souza Roriz CF, Silva LR, Normando AGC, dos Santos Silva AR,
et al. Binary and WHO dysplasia grading systems for the prediction of malignant transformation of oral
PLOS ONE Infrared spectra predict oral cancer development
PLOS ONE | https://doi.org/10.1371/journal.pone.0266043 March 25, 2022 13 / 14
leukoplakia and erythroplakia: a systematic review and meta-analysis. Clinical Oral Investigations.
2021; 25(7):4329–40. https://doi.org/10.1007/s00784-021-04008-1 PMID: 34050426
33. Lasch P. Spectral pre-processing for biomedical vibrational spectroscopy and microspectroscopic
imaging. Chemometrics and Intelligent Laboratory Systems. 2012; 117:100–14. https://doi.org/10.
1016/j.chemolab.2012.03.011
34. Movasaghi Z, Rehman S, ur Rehman DI. Fourier Transform Infrared (FTIR) Spectroscopy of Biological
Tissues. Applied Spectroscopy Reviews. 2008; 43(2):134–79. https://doi.org/10.1080/
05704920701829043
35. Barth A, Zscherp C. What vibrations tell us about proteins. Q Rev Biophys. 2002; 35(4):369–430.
https://doi.org/10.1017/s0033583502003815 PMID: 12621861
36. Donadini A, Maffei M, Cavallero A, Pentenero M, Malacarne D, Di Nallo E, et al. Oral cancer genesis
and progression: DNA near-diploid aneuploidization and endoreduplication by high resolution flow
cytometry. Cell Oncol. 2010; 32(5–6):373–83. https://doi.org/10.3233/CLO-2010-0525 PMID:
20448331
37. Alaizari NA, Sperandio M, Odell EW, Peruzzo D, Al-Maweri SA. Meta-analysis of the predictive value of
DNA aneuploidy in malignant transformation of oral potentially malignant disorders. J Oral Pathol Med.
2018; 47(2):97–103. https://doi.org/10.1111/jop.12603 PMID: 28612463
38. Aizawa H, Yamada SI, Xiao T, Shimane T, Hayashi K, Qi F, et al. Difference in glycogen metabolism
(glycogen synthesis and glycolysis) between normal and dysplastic/malignant oral epithelium. Arch
Oral Biol. 2017; 83:340–7. https://doi.org/10.1016/j.archoralbio.2017.08.014 PMID: 28892665
39. McCaul JA, Cymerman JA, Hislop S, McConkey C, McMahon J, Mehanna H, et al. LIHNCS—Lugol’s
iodine in head and neck cancer surgery: a multicentre, randomised controlled trial assessing the effec-
tiveness of Lugol’s iodine to assist excision of moderate dysplasia, severe dysplasia and carcinoma in
situ at mucosal resection margins of oral and oropharyngeal squamous cell carcinoma: study protocol
for a randomised controlled trial. Trials. 2013; 14:310. https://doi.org/10.1186/1745-6215-14-310 PMID:
24063578
40. Pilling MJ, Henderson A, Bird B, Brown MD, Clarke NW, Gardner P. High-throughput quantum cascade
laser (QCL) spectral histopathology: a practical approach towards clinical translation. Faraday Discus-
sions. 2016; 187(0):135–54. https://doi.org/10.1039/c5fd00176e PMID: 27095185
41. Pilling MJ, Henderson A, Gardner P. Quantum Cascade Laser Spectral Histopathology: Breast Cancer
Diagnostics Using High Throughput Chemical Imaging. Analytical Chemistry. 2017; 89(14):7348–55.
https://doi.org/10.1021/acs.analchem.7b00426 PMID: 28628331
PLOS ONE Infrared spectra predict oral cancer development
PLOS ONE | https://doi.org/10.1371/journal.pone.0266043 March 25, 2022 14 / 14