Prediction of coronary artery plaque progression and potential rupture from 320-detector row...
11
ORIGINAL PAPER Prediction of coronary artery plaque progression and potential rupture from 320-detector row prospectively ECG-gated single heart beat CT angiography: Lattice Boltzmann evaluation of endothelial shear stress Frank J. Rybicki Simone Melchionna Dimitris Mitsouras Ahmet U. Coskun Amanda G. Whitmore Michael Steigner Leelakrishna Nallamshetty Fredrick G. Welt Massimo Bernaschi Michelle Borkin Joy Sircar Efthimios Kaxiras Sauro Succi Peter H. Stone Charles L. Feldman Received: 5 November 2008 / Accepted: 29 December 2008 / Published online: 15 January 2009 Ó Springer Science+Business Media, B.V. 2009 Abstract Advances in MDCT will extend coronary CTA beyond the morphology data provided by systems that use 64 or fewer detector rows. Newer coronary CTA technology such as prospective ECG- gating will also enable lower dose examinations. Since the current standard of care for coronary diagnoses is catheterization, CT will continue to be benchmarked against catheterization reference points, in particular temporal resolution, spatial resolution, radiation dose, and volume coverage. This article focuses on single heart beat cardiac acquisitions enabled by 320-detector row CT. Imaging with this system can now be performed with patient radiation doses comparable to catheterization. The high image quality, excellent contrast opacification, and absence of stair-step artifact provide the potential to evaluate endothelial shear stress (ESS) noninvasively with CT. Low ESS is known to lead to the development and S. Melchionna INFM-CNR, Rome, Italy A. U. Coskun Á F. G. Welt Á P. H. Stone Á C. L. Feldman Cardiovascular Division, Department of Medicine, Brigham and Women’s Hospital, Harvard Medical School, Boston, MA, USA A. U. Coskun Mechanical and Industrial Engineering, Northeastern University, Boston, MA, USA M. Bernaschi Á S. Succi Istituto Applicazioni Calcolo, CNR, Rome, Italy S. Succi Initiative in Innovative Computing, Harvard University, Cambridge, MA, USA F. J. Rybicki (&) Á D. Mitsouras Á A. G. Whitmore Á M. Steigner Á L. Nallamshetty Applied Imaging Science Laboratory, Department of Radiology, Brigham and Women’s Hospital, Harvard Medical School, 75 Francis Street, Boston, MA 02115, USA e-mail: [email protected] F. J. Rybicki Á M. Steigner Á L. Nallamshetty Noninvasive Cardiovascular Imaging, Department of Radiology, Brigham and Women’s Hospital, Harvard Medical School, Boston, MA, USA S. Melchionna Á M. Borkin Department of Physics, Harvard University, Cambridge, MA, USA S. Melchionna Á M. Borkin Á J. Sircar Á E. Kaxiras School of Engineering and Applied Science, Harvard University, Cambridge, MA, USA S. Melchionna Department of Physics, University of Rome La Sapienza, Rome, Italy 123 Int J Cardiovasc Imaging (2009) 25:289–299 DOI 10.1007/s10554-008-9418-x
Transcript of Prediction of coronary artery plaque progression and potential rupture from 320-detector row...
ORIGINAL PAPER
Prediction of coronary artery plaque progressionand potential rupture from 320-detector row prospectivelyECG-gated single heart beat CT angiography: LatticeBoltzmann evaluation of endothelial shear stress
Frank J. Rybicki Æ Simone Melchionna Æ Dimitris Mitsouras Æ Ahmet U. Coskun ÆAmanda G. Whitmore Æ Michael Steigner Æ Leelakrishna Nallamshetty ÆFredrick G. Welt Æ Massimo Bernaschi Æ Michelle Borkin Æ Joy Sircar ÆEfthimios Kaxiras Æ Sauro Succi Æ Peter H. Stone Æ Charles L. Feldman
Received: 5 November 2008 / Accepted: 29 December 2008 / Published online: 15 January 2009
� Springer Science+Business Media, B.V. 2009
Abstract Advances in MDCT will extend coronary
CTA beyond the morphology data provided by
systems that use 64 or fewer detector rows. Newer
coronary CTA technology such as prospective ECG-
gating will also enable lower dose examinations.
Since the current standard of care for coronary
diagnoses is catheterization, CT will continue to be
benchmarked against catheterization reference points,
in particular temporal resolution, spatial resolution,
radiation dose, and volume coverage. This article
focuses on single heart beat cardiac acquisitions
enabled by 320-detector row CT. Imaging with this
system can now be performed with patient radiation
doses comparable to catheterization. The high image
quality, excellent contrast opacification, and absence
of stair-step artifact provide the potential to evaluate
endothelial shear stress (ESS) noninvasively with CT.
Low ESS is known to lead to the development and
S. Melchionna
INFM-CNR, Rome, Italy
A. U. Coskun � F. G. Welt � P. H. Stone � C. L. Feldman
Cardiovascular Division, Department of Medicine,
Brigham and Women’s Hospital, Harvard Medical
School, Boston, MA, USA
A. U. Coskun
Mechanical and Industrial Engineering,
Northeastern University, Boston, MA, USA
M. Bernaschi � S. Succi
Istituto Applicazioni Calcolo, CNR, Rome, Italy
S. Succi
Initiative in Innovative Computing, Harvard University,
Cambridge, MA, USA
F. J. Rybicki (&) � D. Mitsouras � A. G. Whitmore �M. Steigner � L. Nallamshetty
Applied Imaging Science Laboratory, Department of
Radiology, Brigham and Women’s Hospital, Harvard
Medical School, 75 Francis Street, Boston, MA 02115,
USA
e-mail: [email protected]
F. J. Rybicki � M. Steigner � L. Nallamshetty
Noninvasive Cardiovascular Imaging, Department of
Radiology, Brigham and Women’s Hospital, Harvard
Medical School, Boston, MA, USA
S. Melchionna � M. Borkin
Department of Physics, Harvard University, Cambridge,
MA, USA
S. Melchionna � M. Borkin � J. Sircar � E. Kaxiras
School of Engineering and Applied Science, Harvard
University, Cambridge, MA, USA
S. Melchionna
Department of Physics, University of Rome La Sapienza,
Rome, Italy
123
Int J Cardiovasc Imaging (2009) 25:289–299
DOI 10.1007/s10554-008-9418-x
progression of atherosclerotic plaque culminating
in high-risk vulnerable plaque likely to rupture and
cause an acute coronary event. The magnitude of local
low ESS, in combination with the local remodeling
response and the severity of systemic risk factors,
determines the natural history of each plaque. This
paper describes the steps required to derive an ESS
map from 320-detector row CT data using the Lattice
Boltzmann method to include the complex geometry
of the coronary arterial tree. This approach diminishes
the limitations of other computational fluid dynam-
ics methods to properly evaluate multiple coronary
arteries, including the complex geometry of coronary
bifurcations where lesions tend to develop.
Keywords Computed tomography �Shear stress � Atherosclerosis � Coronary disease �Vascular remodeling
Introduction
Multi-detector computed tomography (MDCT) is an
emerging modality for coronary artery imaging
because it has potential to assess the coronary artery
lumen, the wall, and plaque. MDCT does not use
catheterization and is potentially suitable for serial
evaluations over time. Earlier generations of MDCT,
such as 16-detector row CT, were limited by exces-
sive radiation exposure, data acquisition that required
prolonged breath-holding, and artifacts that limited
precise characterization of coronary artery morphol-
ogy. The transition from 16- to 64-slice coronary CT
improved spatial resolution, temporal resolution, and
volume coverage per gantry rotation. These advances
made cardiac CT a more robust tool for clinical use
and for innovative diagnostic approaches. One sig-
nificant problem in defining clinical algorithms for
cardiac CT is that the technology developments
outpace the accumulation of large patient series to
perform studies. However, it is generally accepted
that 64-slice CT has a very high negative predictive
value and can be used to exclude coronary artery
disease (CAD) in low- and intermediate-risk patients.
In addition, CT is recognized as not only much
simpler to perform than coronary catheterization, but
also as an exam with fewer complications.
As CT of the heart has expanded beyond 64-detec-
tor rows, further innovations have become available,
including the use of MDCT to characterize coronary
artery plaque and the local coronary artery hemody-
namic environment in a precise, 3-dimensional
manner to identify specific areas of plaque formation
and to predict the nature of future progression. Early
identification of high-risk vulnerable plaque would be
invaluable since such prognostic information would
allow for risk-stratification of individual coronary
lesions and application of highly selective interven-
tions to areas likely to cause a new cardiac event. The
purpose of this review is to describe 320-detector row
CT as a new tool to explore a potentially revolution-
ary application intended to predict the natural history
of individual coronary atherosclerotic plaques.
Lower dose cardiac MDCT
Until recently, state-of-the-art noninvasive coronary
CT acquisitions used 64-slice technology, either from
64-detector rows or 32-detector rows and an alternat-
ing X-ray focal spot. One criticism of 64-slice cardiac
CT has been patient radiation, since the dose delivered
by CT has been higher than that obtained with
diagnostic catheterization. To lower radiation dose,
contemporary cardiac CT protocols have migrated
from retrospective ECG gating where radiation dose is
delivered throughout the cardiac cycle to prospective
ECG gating for which data is acquired, and therefore
radiation dose is delivered, only within a pre-deter-
mined ‘‘phase window’’ of the R–R interval. When
prospective ECG gating is used, no CT data is acquired
for most of the cardiac cycle. Thus, cine evaluation of
the myocardium and valves is not available. However,
as the phase window is narrowed, cardiac CT doses
become comparable to those of diagnostic cardiac
catheterization. The optimum width of the phase
window for prospectively ECG gated CT depends on
patient and hardware considerations; this is an active
area of investigation. However, by narrowing the
phase window and judiciously choosing the mA and
kV settings for image acquisition, very low dose
cardiac CT data sets can be achieved.
The increased volume coverage per gantry rotation
in MDCT has revolutionized the imaging of many
body parts, including the heart. This review focuses
on 320 9 0.5 mm detector row (Toshiba Aquilio-
nONE Dynamic Volume CT, Tochigi-ken, Japan)
coronary CTA with 16 cm of craniocaudal coverage
290 Int J Cardiovasc Imaging (2009) 25:289–299
123
per gantry rotation that achieves single R–R, or
single heart beat, cardiac imaging. In addition to the
faster overall CT acquisition from 320-detector rows,
whole cardiac volumes acquired with this technology
implicitly eliminate ‘‘stair-step’’ artifacts inherent in
sub-volume CT where data for each sub-volume are
acquired over multiple gantry rotations and the
sub-volumes, or slabs, are stacked to complete the
cardiac volume. Another benefit of 320-detector row
technology is that the single R–R acquisition captures
the state of the entire iodinated contrast enhanced
coronary circulation at a single time point, mitigating
the differences in opacification that are inevitable with
sub-volume coronary CTA. The result is uniform
cardiac data sets that are highly amenable to advanced
analyzes. An innovative application of this enhanced
methodology focuses on the noninvasive evaluation
of coronary artery endothelial shear stress (ESS) with
the goal of achieving noninvasive coronary vascular
profiling as an adjunct to the standard morphology
data from cardiac CT. Data concerning plaque
morphology and the hemodynamic environment in
which the plaque is located can be used to then predict
the development of high-risk plaque likely to progress
to plaque rupture and precipitation of an acute clinical
coronary event.
Pathobiological role of local coronary ESS
in the development and progression of CAD
and vulnerable plaque
Atherosclerosis is a chronic, inflammatory, fibropro-
liferative disease primarily of large and medium-sized
conduit arteries. Although the entire coronary circula-
tion is exposed to systemic risk factors, coronary
atherosclerotic lesions primarily form where there is
disturbed coronary flow, specifically bifurcations such
as the branch point of the left anterior descending and
left circumflex arteries [1, 2]. These focal lesions result
primarily from hemodynamic forces, with ESS playing
the most fundamental role [3].
Low ESS modulates endothelial gene expression,
inducing an atherogenic endothelial phenotype and
formation of an early atherosclerotic plaque [3]. In
arterial regions with disturbed flow, low ESS reduces
the bioavailability of nitric oxide, while upregulating
potent vasoconstrictive and mitogenic molecules,
thereby inducing endothelial dysfunction and
exposing the endothelium to the atherogenic effect
of local and systemic risk factors. Low ESS also
promotes low-density lipoprotein-cholesterol (LDL-
C) uptake and mediates the production of reactive
oxygen species (ROS) within the intima. Low ESS
also downregulates the intracellular ROS scavengers,
further augmenting local oxidative stress [3].
Through activation of nuclear factor-jB, low
ESS upregulates the expression of several adhesion
molecules, chemoattractant chemokines, and pro-
inflammatory cytokines [3]. Once monocytes infiltrate
beneath the endothelium, they undergo structural
and functional alterations and differentiate to
macrophages, which express scavenger receptors,
phagocytize the oxidized LDL-C and transform to
foam cells. Foam cells produce cytokines, growth
factors, ROS and matrix degrading enzymes, sustain-
ing the local inflammation, oxidative stress, dynamic
matrix remodeling, and ultimately atherosclerosis
progression. Overexpression and increased activity
of matrix metalloproteinases and cathepsins, which
are the major proteases associated with extracellular
matrix (ECM) degradation, are also mediated directly
by low ESS [4–6].
As plaques progress, the regional disruption of the
internal elastic lamina (IEL), which separates the
diseased intima from the media, constitutes the key
event that drives the formation of fibroatheromas [4].
In the setting of very low levels of local ESS, and
subsequently intense accumulation of inflammatory
cells within the intima, the part of the IEL beneath the
plaque undergoes local degradation by the foam
cells-derived proteases [4]. These IEL breaks consti-
tute the gateway for vascular smooth muscle cells
(VSMCs), which are originally located into the
media, to enter the intima. Within the intima the
VSMCs differentiate to a more synthetic phenotype
to elaborate ECM proteins (e.g. collagen and elastin),
thereby promoting plaque progression. The VSMCs
encompass the core of the lipid-laden foam cells
(lipid core), produce ECM and create the fibrous cap,
separating the thrombogenic lipid material from the
circulating platelets and other pro-thrombotic factors.
The natural history of each early plaque is depen-
dent not only on the formation and progression of
atherosclerosis, but also on the vascular remodeling
response [7–10]. If the local ESS environment is
initially low, atherogenic factors predominate and a
proliferative plaque will form. If the local ESS is
Int J Cardiovasc Imaging (2009) 25:289–299 291
123
sufficiently low, or evolves to a sufficiently low value,
then inflammatory processes will coexist with the
proliferative phenotype, leading to degradation of
the extracellular matrix and, consequently, to local
expansive vascular remodeling which in turn leads to
an even lower local ESS [4]. This progressively lower
ESS further exacerbates the pro-inflammatory and
pro-atherogenic stimuli of the local plaque, creating a
vicious cycle of low ESS, progressively more intense
inflammation and lipid accumulation, and even lower
ESS. This process culminates in the formation of
the so-called ‘‘vulnerable plaque’’ characterized by a
large extracellular lipid pool with a necrotic core and a
thin fibrous cap in the setting of a locally expansively
remodeled artery [3]. This vulnerable plaque, which
is prone to rupture with superimposed thrombus
formation, is the high-risk substrate from which the
majority of acute coronary syndromes originate
(Fig. 1). The vast majority of these inflamed high-
risk vulnerable plaques do not encroach significantly
into the coronary artery lumen, do not limit coronary
blood flow, and can not be detected by myocardial
perfusion imaging.
The marked heterogeneity of natural history
trajectories of coronary plaque lends itself to devel-
opment of a comprehensive risk stratification
approach to characterize each individual plaque at
an early stage [3]. Since the driving factor for
ongoing plaque proliferation, lipid accumulation, and
intense inflammation is the magnitude of local low
ESS and the presence of expansive remodeling,
measurement of these characteristics in vivo should
Fig. 1 Proposed natural history of coronary atherosclerosis
and opportunity for pre-emptive intervention. The initiating
process of atherosclerosis in an atherosclerosis-prone host is a
low ESS environment, leading to the formation of an early
fibroatheroma, which may be diffuse. The vascular response to
that early fibroatheroma likely determines the nature of the
subsequent natural history of that plaque. If there is local
compensatory expansive remodeling, then the local ESS is
normalized, the hemodynamic stimulus for further plaque
progression is resolved, and the early lesion evolves to a
quiescent plaque with limited inflammation. However, in the
presence of certain local, systemic, and genetic factors, the local
vascular wall may undergo excessive expansive remodeling. In
this context the local low ESS environment persists, promoting
further plaque progression and vessel expansion. A self-
perpetuating vicious cycle is established among local low
ESS, excessive expansive remodeling and plaque inflammation,
transforming the early fibroatheroma to a thin cap fibroather-
oma. The stenotic plaques may either evolve with a phenotype
promoting fibroproliferation consistently throughout their
natural history course, or may represent an end-stage of scarring
in the setting of prior inflamed thin cap fibroatheroma through
repetitive microruptures and healing. Also, the stenotic plaques
may infrequently undergo local erosion or develop calcified
nodules, and lead to local thrombus formation and manifesta-
tion of an acute coronary syndrome. The percentages reported
in the figure are based on IVUS studies. In vivo identification of
the natural history course of each individual coronary artery
plaque may allow for pre-emptive intervention to avert an
adverse cardiac event. Figure used with permission from [3]
292 Int J Cardiovasc Imaging (2009) 25:289–299
123
enable risk stratification for the entire coronary
circulation.
Vascular profiling methodology to characterize
local ESS and vascular remodeling
The most comprehensive technique for investigating
the relationship between ESS and vascular pathobi-
ology is a methodology known as vascular profiling
that, to date, utilizes intravascular ultrasound (IVUS)
and coronary angiography to create an accurate 3D
representation of both the lumen and external elastic
membrane (EEM) of individual coronary arteries
[11]. ESS is then derived by numerically solving the
basic equations of fluid mechanics within this 3D
representation of the artery while remodeling char-
acteristics are derived from changes in the
dimensions of lumen and EEM. Vascular profiling
is accurate and highly reproducible [11], and can be
used to track changes in lumen, wall thickness, and
ESS in periods as short as 6–9 months in humans or
experimental animals [4, 12, 13]. A natural history
clinical study (PREDICTION Trial) of atheroscle-
rotic plaques using catheterization and IVUS vascular
profiling techniques in patients with coronary artery
disease is now underway to determine the incremen-
tal value of characterizing the local ESS and
remodeling environment to predict the development
of new acute cardiac events.
Our new ability to noninvasively image the entire
coronary arterial tree in a single heart beat has
sparked a new investigation of CT vascular profiling
described in this article. To date, the major limitation
of determining ESS maps and correlating these
findings with the location of future cardiac events
and, ultimately, patient outcomes has been the
difficulty and risk associated with IVUS. However,
MDCT technology makes these analyzes feasible in a
noninvasive manner. In the subsequent section we
describe the methods, via an example case, of 320-
detector row Dynamic Volume CT vascular profiling.
We highlight the strengths and weaknesses of this
approach, and the uniqueness of low-dose, prospec-
tively ECG-gated wide area detector CT for this new
application that extends the current evaluation of the
coronary arteries beyond the morphology data that is
now routinely obtained. We then describe our strat-
egy to validate this approach in a small series of
patients who will also undergo the more traditional
vascular profiling using IVUS. Finally, we outline a
method to further validate 320-detector row CT
vascular profiling role using data from multiple
institutions.
320-detector row dynamic volume CT for vascular
profiling to predict localization of high-risk
coronary plaque responsible for new coronary
events
Acquisition of CT images
Patients scheduled to undergo CT vascular profiling
are imaged axially using a 320 9 0.5 mm detector
configuration scanner with a rotation time of 350 ms.
The standard cardiac CT protocol uses 120 kV,
although 100 kV can be used in smaller patients to
decrease patient radiation. The typical mA = 400,
although higher settings, up to 580 with this CT unit,
can be used for larger patients. Prospective ECG
gating is used to lower radiation dose; the standard
width of the phase window is 10% (70–80% R–R).
All patients receive 80 ml of iopamidol 370 mg I/ml
(Isovue-370, Bracco Diagnostics, Princeton, NJ)
followed by 40 ml normal saline injected with a dual
injector (EZEM Empower CTA DUAL Injector,
EZEM Inc., Lake Success, NY) at 6 ml/s. In the
typical protocol for coronary CTA, bolus tracking in
the descending aorta is performed using a 200
Hounsfield unit (HU) threshold and a single data set
is acquired. This does not provide information
regarding coronary blood flow that is needed for
ESS. For IVUS vascular profiling, contrast is tracked
as it fills the known arterial volume. The coronary
blood flow rate is simply the volume of the artery
between two points divided by the time for contrast
opacification of that volume. Using multiple whole
heart acquisitions, data can be acquired to estimate
coronary blood flow. Since this requires multiple CT
acquisitions, those not used for coronary anatomy can
be obtained at lower radiation levels by decreasing
the mA, kVP, or both.
All patients with a resting heart rate greater than
65 beats per minute receive intravenous metoprolol in
5 mg increments; patients imaged with a lower heart
rate have more cardiac phases considered to be of
excellent image quality [14]. All patients receive
Int J Cardiovasc Imaging (2009) 25:289–299 293
123
0.4 mg sublingual nitroglycerine before imaging. For
each patient, the reconstruction phase with minimum
artifact is determined at the CT console, and this data
set is transferred to a research image post-processing
workstation (Vitrea 4.0, Vital Images, Minnetonka,
MN, USA).
Computational fluid dynamics: Navier–Stokes
single vessel profiling versus Lattice Boltzmann
methods for vascular profiling
Computation of the flow patterns with the recon-
structed coronary artery lumen has traditionally relied
on numerical solutions to the Navier–Stokes equa-
tions of fluid mechanics. These currently available
methods of CFD require that the volume under
investigation be divided into small voxels and that the
laws of motion and of conservation of mass are
satisfied for each voxel. Using this method, typical
solutions have 1,920 voxels per millimeter of coro-
nary artery and have proven to be computationally
efficient and sufficiently realistic to accurately predict
regions of accelerated atherosclerosis and increased
inflammation. When using IVUS data, this approach
has an important limitation that only one vessel can
be analyzed; branches and bifurcations cannot be
reconstructed and, as a result, are ignored. However,
320-detector row CT yields a high image quality [15],
single heart beat, whole volume representation of
the coronary arterial system, including the complex
geometries of coronary bifurcations. When applied to
CT data, another limitation of conventional CFD
methods is that the coronary branching results in an
impractical computational burden.
In order to compute flow patterns within a
complex CT volumetric representation of the coro-
nary arteries, have adopted the Lattice Boltzmann
method [16] rather than the discretization inherent in
the Navier–Stokes equations. In the Lattice Boltz-
mann method, the volume under consideration
(typically either the left or the right coronary artery
system) is filled with a rectangular array of lattice
points and a form of the classical Boltzmann equation
of kinetic theory is simultaneously solved for each
lattice point. Although the present Lattice Boltzmann
method to deduce ESS is computationally demand-
ing, it has distinct advantages. As noted above, it
enables analyzes of a very complex and complete
coronary anatomy. Second, the Lattice Boltzmann
method can be easily adapted to run on computers
that consist of a very large number of inexpensive
processors, all operating in parallel. Our results were
obtained using a 1,024 node portion of an IBM Blue
Gene supercomputer.
As discussed in greater detail below, the long term
goal of 320-detector row CT vascular profiling is
integration to the CT console. Thus, vast computation
would be considered a relative limitation of this
technique. However, we have recently adapted the
Lattice Boltzmann method code to run on a conven-
tional graphics processing unit [17]; thus the
computational burden of coronary vascular profiling
is considered feasible within the hardware configu-
ration that could be available in future generation CT
scanners.
Luminal volume geometry extraction
Because of the complex course and branching of the
coronary arteries, cardiac CT interpretation requires
advanced image reformation. Such post-processing
tools already include coronary artery segmentation
algorithms to assist in the evaluation of lesions. At
present, commercially available software can provide
fully, or nearly fully, automated segmentation meth-
ods based on HU differences (Fig. 2a).
Work in this project used a research build of the
Vitrea 4.0 workstation that exports the geometry of
the luminal volume, as determined by the built-in
segmentation algorithm, into a data file. This geo-
metric ‘‘mesh’’ consists of a set of 3D Cartesian
coordinates enclosing the volume of the coronary
lumens (Fig. 3a). For this model, all major coronary
arteries plus all branches greater than 1 mm in
diameter were included. In clinical practice, manual
adjustment of the lumen center line is occasionally
required and is fully supported by the software.
However, additional manipulation was not required
in this case because of the excellent iodinated
contrast opacification, lack of cardiac motion on the
best phase obtained, and inherent absence of stair-
step artifact in 320-detector row cardiac CT.
For this example, the mesh reflected the coordi-
nates of the outer surface of the segmented
endoluminal volume at an angular resolution of 1.4�at each selected cross-section, orthogonal to the center
line. Cross-sections were obtained every 0.5 mm. In
IVUS based vascular profiling, the computational grid
294 Int J Cardiovasc Imaging (2009) 25:289–299
123

describing the volume enclosed by the surface mesh is
generated at an angular resolution of 11.25�. The
resolution of the 320-detector row CT derived mesh
was reduced to this requirement in conjunction with
low-pass filtering using a Gaussian filter with standard
deviation equal to 3� along the cross-section, and
0.5 mm longitudinally (Fig. 3b). This was also desir-
able because it reduced small-scale irregularities in
the segmented surface. Such irregularities in the
anatomy of the lumen are inherently introduced by the
segmentation process due to the noise of the physical
imaging system.
A different computational grid is required to
describe the volume enclosed by the lumen for
Navier–Stokes CFD and the Lattice Boltzmann
approaches. The left panel of Fig. 4 presents the 3D
Cartesian computational grid used with Lattice
Boltzmann methods. The spacing of the grid points
is 20 lm in order to sufficiently capture the complex
3D geometry of the branching vessels. Computations
are performed at each grid point. The right panel of
Fig. 4 presents the unstructured grid that is typically
used for Navier–Stokes CFD methods; computations
are performed within each voxel. Voxels are coarser
near the center of the vessel, and reach a radial
resolution of 20 l at the lumen.
Examples of 320-detector row dynamic volume
coronary CT vascular profiling
To validate the current version of the Lattice
Boltzmann Code, a 6 cm length of a human right
coronary artery for which a prior CFD solution had
already existed was reanalyzed using the MUPHY
Lattice Boltzmann code outlined above. The previ-
ously measured coronary flow rate was 1.38 ml/s. To
assure maximum accuracy, the Lattice Boltzmann
lattice points were positioned on a 3D Cartesian grid
at even intervals of 20 lm and the code was run on
1,024 nodes of a Blue Gene supercomputer.
Fig. 2 Left coronary system in a patient imaged with 320-
detector row coronary CTA. a Automatically segmented
coronary arteries and branches with lumen greater than or
equal to 1 mm are illustrated. b Corresponding endothelial
shear stress vascular profiling of the same coronary tree using
Lattice Boltzman code. Color shading shows the ESS values
reflected on the lumen surface, with blue depicting low ESS
and red depicting high ESS
Int J Cardiovasc Imaging (2009) 25:289–299 295
123
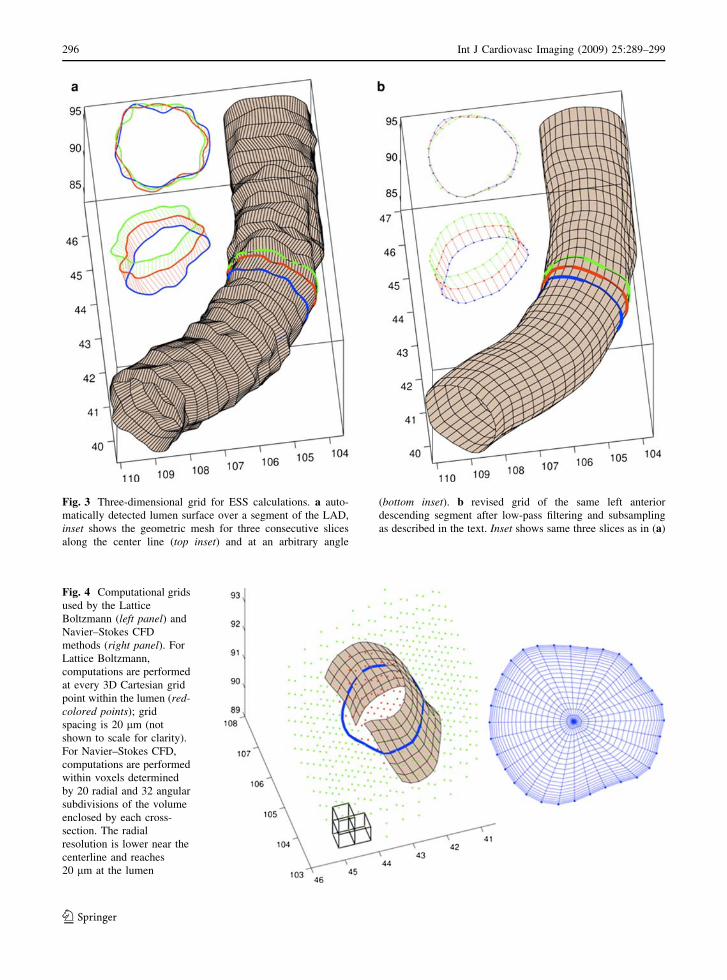
Fig. 3 Three-dimensional grid for ESS calculations. a auto-
matically detected lumen surface over a segment of the LAD,
inset shows the geometric mesh for three consecutive slices
along the center line (top inset) and at an arbitrary angle
(bottom inset). b revised grid of the same left anterior
descending segment after low-pass filtering and subsampling
as described in the text. Inset shows same three slices as in (a)
Fig. 4 Computational grids
used by the Lattice
Boltzmann (left panel) and
Navier–Stokes CFD
methods (right panel). For
Lattice Boltzmann,
computations are performed
at every 3D Cartesian grid
point within the lumen (red-colored points); grid
spacing is 20 lm (not
shown to scale for clarity).
For Navier–Stokes CFD,
computations are performed
within voxels determined
by 20 radial and 32 angular
subdivisions of the volume
enclosed by each cross-
section. The radial
resolution is lower near the
centerline and reaches
20 lm at the lumen
296 Int J Cardiovasc Imaging (2009) 25:289–299
123
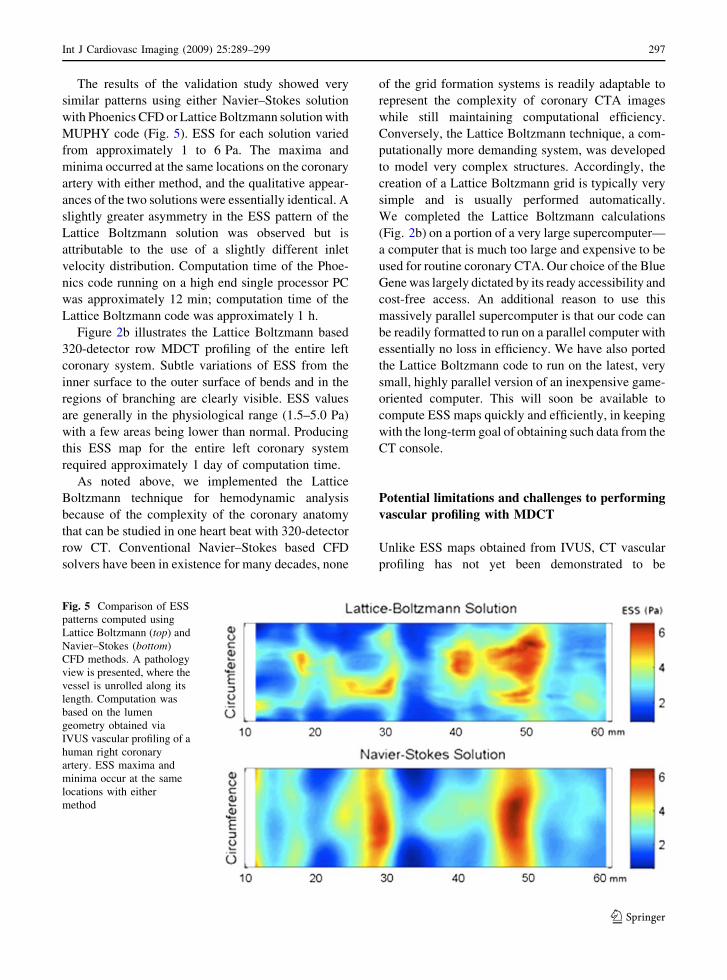
The results of the validation study showed very
similar patterns using either Navier–Stokes solution
with Phoenics CFD or Lattice Boltzmann solution with
MUPHY code (Fig. 5). ESS for each solution varied
from approximately 1 to 6 Pa. The maxima and
minima occurred at the same locations on the coronary
artery with either method, and the qualitative appear-
ances of the two solutions were essentially identical. A
slightly greater asymmetry in the ESS pattern of the
Lattice Boltzmann solution was observed but is
attributable to the use of a slightly different inlet
velocity distribution. Computation time of the Phoe-
nics code running on a high end single processor PC
was approximately 12 min; computation time of the
Lattice Boltzmann code was approximately 1 h.
Figure 2b illustrates the Lattice Boltzmann based
320-detector row MDCT profiling of the entire left
coronary system. Subtle variations of ESS from the
inner surface to the outer surface of bends and in the
regions of branching are clearly visible. ESS values
are generally in the physiological range (1.5–5.0 Pa)
with a few areas being lower than normal. Producing
this ESS map for the entire left coronary system
required approximately 1 day of computation time.
As noted above, we implemented the Lattice
Boltzmann technique for hemodynamic analysis
because of the complexity of the coronary anatomy
that can be studied in one heart beat with 320-detector
row CT. Conventional Navier–Stokes based CFD
solvers have been in existence for many decades, none
of the grid formation systems is readily adaptable to
represent the complexity of coronary CTA images
while still maintaining computational efficiency.
Conversely, the Lattice Boltzmann technique, a com-
putationally more demanding system, was developed
to model very complex structures. Accordingly, the
creation of a Lattice Boltzmann grid is typically very
simple and is usually performed automatically.
We completed the Lattice Boltzmann calculations
(Fig. 2b) on a portion of a very large supercomputer—
a computer that is much too large and expensive to be
used for routine coronary CTA. Our choice of the Blue
Gene was largely dictated by its ready accessibility and
cost-free access. An additional reason to use this
massively parallel supercomputer is that our code can
be readily formatted to run on a parallel computer with
essentially no loss in efficiency. We have also ported
the Lattice Boltzmann code to run on the latest, very
small, highly parallel version of an inexpensive game-
oriented computer. This will soon be available to
compute ESS maps quickly and efficiently, in keeping
with the long-term goal of obtaining such data from the
CT console.
Potential limitations and challenges to performing
vascular profiling with MDCT
Unlike ESS maps obtained from IVUS, CT vascular
profiling has not yet been demonstrated to be
Fig. 5 Comparison of ESS
patterns computed using
Lattice Boltzmann (top) and
Navier–Stokes (bottom)
CFD methods. A pathology
view is presented, where the
vessel is unrolled along its
length. Computation was
based on the lumen
geometry obtained via
IVUS vascular profiling of a
human right coronary
artery. ESS maxima and
minima occur at the same
locations with either
method
Int J Cardiovasc Imaging (2009) 25:289–299 297
123
reproducible. Thus, the next validation step for this
work is a study of patients who undergo vascular
profiling with both 320-detector row CT and IVUS.
Initial results from this investigation are encouraging,
but there are limitations. For example, IVUS has
superior spatial resolution when compared to CT. The
resolution of IVUS is approximately 100 l both
axially and radially. For current vascular profiling,
the axial resolution is degraded to approximately
400 l because samples are obtained only at end-
diastole. Thus, the axial resolution is comparable to
the 350 micron isotropic resolution of 320-detector
row CT. One goal of the next validation step is to
evaluate the impact of a different radial resolution
(100 l for IVUS vs. 350 for CT) to sufficiently
characterize coronary morphology so that CT vascular
profiling maps approximate those obtained by IVUS.
In addition, the more traditional vascular profiling data
acquisition uses either a modified TIMI frame count
method [18] or a flow wire method to determine
coronary blood flow. The direct flow wire measure-
ment is not available for coronary CT profiling. Thus,
estimates of coronary blood flow must be used in the
ESS algorithm. This can be done with a library of
cases developed from the PREDICTION trial. In
addition, it may be possible to estimate coronary blood
flow from images data obtained from the iodinated
contrast media bolus tracking method, somewhat
similar to the modified TIMI frame count method.
For longer term validation, MDCT in general is
challenged in that multi-center trials are difficult to
perform since the technology continues to outpace
the ability to obtain sufficient data. To date, there are
two multi-center 64-detector row MDCT trials that
have been presented in a peer-review format. The
Core64 trial [19] focused on primarily teaching
hospital patients. This study of 291 patients used
receiver operating characteristic analysis to demon-
strate that 64-detector row coronary CTA was
equivalent to quantitative coronary angiography for
the prediction of the need for revascularization.
Patients studied in the ACCURACY trial [20] were
recruited from 16 United States private practice
centers and showed, using a different 64-detector row
coronary CTA platform, a sensitivity = 91%, spec-
ificity = 84%, positive predictive value = 51%, and
negative predictive value = 98%. It is also important
to note that neither of these trials includes long-term
follow-up for which events predicted by CT are
correlated with patient outcomes. At present, a 320-
detector row CT multi-center trial is being planned
with long-term patient follow-up that will be required
to validate vascular profiling.
Conclusions
The goal of vascular profiling is risk stratification of
individual coronary plaques that extends beyond the
morphology data now available from standard coro-
nary CTA. In vivo understanding of the local
hemodynamic environment responsible for future
behavior of individual plaques, when combined with
current data already available, could lead to more
accurate risk stratification of individual lesions. Thus, a
plaque that is identified as ‘‘high-risk’’ of rupturing and
causing an acute coronary syndrome in a patient with
other risk factors could undergo intensive, selective
therapeutic intervention including, in some cases,
placement of a coronary stent or local drug delivery.
Such prophylactic or pre-emptive focal treatment
strategies would be based on the likelihood of the
inflamed vulnerable plaque to rupture, even in the
absence of an associated limitation in coronary blood
flow. The potential clinical and economic implications
of identifying and treating individual high-risk, non-
flow-limiting coronary lesions are enormous.
In summary, coronary artery segments in a low ESS
environment are more likely to develop early athero-
sclerotic plaque, and the persistence of low and very
low ESS states induces differentiation to high-risk
plaques. The methods of vascular profiling, currently
performed with IVUS, accurately and reproducibly
determine coronary ESS and can predict those lesions
that are more likely to cause clinical events. Three-
hundred twenty detector row CT has the potential to
noninvasively yield equivalent information and dra-
matically expand the application of coronary vascular
profiling. This work demonstrates the feasibility of
profiling and highlights the benefits of 320-detector
row CT for this application. Future validation and
implementation steps are needed to further understand
plaque characteristics, local ESS, and the vascular
remodeling response for the population of patients
undergoing advanced coronary CTA.
Acknowledgment This work is supported by a grant to Dr.
Rybicki from Toshiba Medical Systems Corporation.
298 Int J Cardiovasc Imaging (2009) 25:289–299
123

References
1. Malek AM, Alper SL, Izumo S (1999) Hemodynamic shear
stress and its role in atherosclerosis. JAMA 282:2035–
2042. doi:10.1001/jama.282.21.2035
2. Asakura T, Karino T (1990) Flow patterns and spatial
distribution of atherosclerotic lesions in human coronary
arteries. Circ Res 66:1045–1066
3. Chatzizisis YS, Coskun AU, Jonas M et al (2007) Role of
endothelial shear stress in the natural history of coronary
atherosclerosis and vascular remodeling: molecular, cel-
lular, and vascular behavior. J Am Coll Cardiol 49:2379–
2393. doi:10.1016/j.jacc.2007.02.059
4. Chatzizisis YS, Jonas M, Coskun AU et al (2008) Prediction
of the localization of high-risk coronary atherosclerotic
plaques on the basis of low endothelial shear stress:
an intravascular ultrasound and histopathology natural
history study. Circulation 117:993–1002. doi:10.1161/
CIRCULATIONAHA.107.695254
5. Galis ZS, Sukhova GK, Lark MW et al (1994) Increased
expression of matrix metalloproteinases and matrix
degrading activity in vulnerable regions of human athero-
sclerotic plaques. J Clin Invest 94:2493–2503. doi:
10.1172/JCI117619
6. Galis ZS, Khatri JJ (2002) Matrix metalloproteinases in
vascular remodeling and atherogenesis: the good, the bad,
and the ugly. Circ Res 90:251–262
7. Feldman CL, Coskun AU, Yeghiazarians Y et al (2006)
Remodeling characteristics of minimally diseased coronary
arteries are consistent along the length of the artery. Am J
Cardiol 97:13–16. doi:10.1016/j.amjcard.2005.07.121
8. Nakamura M, Nishikawa H, Mukai S et al (2001) Impact
of coronary artery remodeling on clinical presentation of
coronary artery disease: an intravascular ultrasound study.
J Am Coll Cardiol 37:63–69. doi:10.1016/S0735-1097
(00)01097-4
9. Glagov S, Weisenberg E, Zarins CK et al (1987) Com-
pensatory enlargement of human atherosclerotic coronary
arteries. N Engl J Med 316:1371–1375
10. Schoenhagen P, Ziada KM, Kapadia SR et al (2000) Extent
and direction of arterial remodeling in stable versus
unstable coronary syndromes: an intravascular ultrasound
study. Circulation 101:598–603
11. Coskun AU, Yeghiazarians Y, Kinlay S et al (2003)
Reproducibility of coronary lumen, plaque, and vessel wall
reconstruction and of endothelial shear stress measure-
ments in vivo in humans. Catheter Cardiovasc Interv
60:67–78. doi:10.1002/ccd.10594
12. Stone PH, Coskun AU, Kinlay S et al (2003) Effect of
endothelial shear stress on the progression of coronary
artery disease, vascular remodeling, and in-stent restenosis
in humans: in vivo 6 months follow-up study. Circulation
108:438–444. doi:10.1161/01.CIR.0000080882.35274.AD
13. Stone PH, Coskun AU, Kinlay S et al (2007) Regions of
low endothelial shear stress are the sites where coronary
plaque progresses and vascular remodelling occurs in
humans: an in vivo serial study. Eur Heart J 28:705–710.
doi:10.1093/eurheartj/ehl575
14. Steigner ML, Otero HJ, Cai T et al (2009) Narrowing the
phase window width in prospectively ECG-gated single
heart beat 320-detector row coronary CT angiography. Int J
Cardiovasc Imaging 25:85–90. doi:10.1007/s10554-008-
9347-8
15. Rybicki FJ, Otero HJ, Steigner ML et al (2008) Initial
evaluation of coronary images from 320-detector row
computed tomography. Int J Cardiovasc Imaging 24:535–
546. doi:10.1007/s10554-008-9308-2
16. Succi S (2001) The Lattice Boltzmann equation. The
Oxford University Press, Oxford
17. Bernaschi M, Fatica M, Melchionna S et al (2008) A
flexible high-performance Lattice Boltzmann GPU code
for the simulations of fluid flows in complex geometries.
Comput Phys Commun (submitted)
18. Stone PH, Coskun AU, Yeghiazarians Y et al (2003) Pre-
diction of sites of coronary atherosclerosis progression: In
vivo profiling of endothelial shear stress, lumen, and outer
vessel wall characteristics to predict vascular behavior.
Curr Opin Cardiol 18:458–470. doi:10.1097/00001573-
200311000-00007
19. Miller JM, Rochitte CE, Dewey M et al (2007) Late-
breaking clinical trial abstracts from the American Heart
Association’s Scientific Sessions. Circulation 116:2630
20. Min J, Jollis J, Dowe D et al (2007) Assessment by coro-
nary computed tomographic angiography of individuals
undergoing invasive coronary angiography: results from
the multicenter ACCURACY Trial (abstract SSE26-04).
In: 94th scientific assembly and annual meeting of the
radiological society of North America. Chicago, Il: 2007
Int J Cardiovasc Imaging (2009) 25:289–299 299
123