Species Composition, Abundance, and Growth of Three Common Fish Species of the Volta Estuary, Ghana
Upload
independentCategory
view
1download
0
1017
Evaluation of species distribution models by resampling of sites surveyed a century ago by Joseph Grinnell
Adam B. Smith , Maria J. Santos , Michelle S. Koo , Karen M. C. Rowe , Kevin C. Rowe , James L. Patton , John D. Perrine , Steven R. Beissinger and Craig Moritz
A. B. Smith ([email protected]), M. S. Koo, J. L. Patton, S. R. Beissinger and C. Moritz, Museum of Vertebrate Zoology, 3101 Valley Life Sciences Building, Univ. of California, Berkeley, CA 94720-3060, USA. Present address of ABS: Center for Conservation and Sustainable Development, Missouri Botanical Garden, PO Box 299, Saint Louis, MO 63166, USA. SRB also at: Dept of Environmental Science, Policy and Management, 130 Mulford Hall, Univ. of California, Berkeley, CA 94720-3114, USA. – M. J. Santos, Spatial History Project and Bill Lane Center for the American West, History Dept, Stanford Univ., Stanford, CA 94305-2055, USA. – K. M. C. Rowe and K. C. Rowe, 4 Sciences Dept, Museum Victoria, GPO Box 666, Melbourne 3001, VIC, Australia. – J. D. Perrine, Biological Sciences Dept, California Polytech-nic State Univ., San Luis Obispo, CA 93407-0401, USA.
Species distribution models (SDMs) are commonly applied to predict species ’ responses to anticipated global change, but lack of data from future time periods precludes assessment of their reliability. Instead, performance against test data in the same era is assumed to correlate with accuracy in the future. Moreover, high-confi dence absence data is required for testing model accuracy but is often unavailable since a species may be present when undetected. Here we evaluate the performance of eight SDMs trained with historic (1900 – 1939) or modern (1970 – 2009) climate data and occurrence records for 18 mammalian species. Models were projected to the same or the opposing time period and evaluated with data obtained from surveys conducted by Joseph Grinnell and his colleagues in the Sierra Nevada of California from 1900 to 1939 and modern resurveys from 2003 to 2011. Occupancy modeling was used to confi dently assign absences at test sites where species were undetected. SDMs were evaluated using species ’ presences combined with this high-confi dence absence (HCA) set, a low-confi dence set in which non-detections were assumed to indicate absence (LCA), and ran-domly located ‘ pseudoabsences ’ (PSA). Model performance increased signifi cantly with the quality of absences (mean AUC � SE: 0.76 � 0.01 for PSA, 0.79 � 0.01 for LCA, and 0.81 � 0.01 for HCA), and apparent diff erences between SDMs declined as the quality of test absences increased. Models projecting across time performed as well as when pro-jecting within the same time period when assessed with threshold-independent metrics. However, accuracy of presence and absence predictions sometimes declined in cross-era projections. Although most variation in performance occurred among species, autecological traits were only weakly correlated with model accuracy. Our study indicates that a) the quality of evaluation data aff ects assessments of model performance; b) within-era performance correlates positively but unreliably with cross-era performance; and c) SDMs can be reliably but cautiously projected across time.
Anthropogenic climate change promises to rewrite the bio-geography of Earth ’ s species, with some expected to gain, some to lose, and some to shift their current distributions. As a result, conservation planners require reliable methods to project future distributions of species of concern and to prioritize conservation eff ort (Th omas et al. 2004, Carroll et al. 2010, Ogawa-Onishi et al. 2010, Saupe et al. 2011). Species distribution models (SDMs), which correlate species occurrence data with climate variables and other factors indicative of habitat quality to produce maps of environ-mental suitability, are frequently used for such projections. Unfortunately, the reliability of projecting SDMs across time periods relevant to conservation remains largely unknown (Ara ú jo et al. 2005a, b, Dormann 2007, Elith and Leathwick 2009, Kharouba et al. 2009). Scores of studies have assessed the performance of diff erent SDM
algorithms using within-era evaluation, testing models against records from the same region and time period used to train the models (Elith et al. 2006, Hijmans and Graham 2006, Syphard and Franklin 2009). However, within-era assessments of SDMs may give overly optimistic estimates of cross-era performance (Ara ú jo et al. 2005a, Hijmans 2012). While cross-era evaluation increases the independence between training and test data, it requires data from both time periods of interest, which are rarely available for time spans relevant to conservation planning (i.e. several decades or more).
SDMs should be less reliable when projecting across time than within the same era for reasons related to both biology and modeling (Ara ú jo et al. 2005a, b, Dobrowski et al. 2011). From a biological perspective model perfor-mance will be diminished if species distributions are not in
Ecography 36: 1017–1031, 2013 doi: 10.1111/j.1600-0587.2013.00107.x
© 2013 Th e Authors. Ecography © 2013 Nordic Society Oikos Subject Editor: David Nogues-Bravo. Accepted 25 January 2013

1018
equilibrium with the environment in the era from or to which their ranges are projected (Nogu é s-Bravo 2009, Wiens et al. 2009). Disequilibrium can arise if species ’ ranges are shaped by biotic interactions that are inde-pendent of climate (Pellissier et al. 2010, Rubidge et al. 2011), held in check by dispersal limitation from otherwise favorable regions (Early and Sax 2011), or are infl uenced by adaptive evolution (Lavergne et al. 2010). Certain traits related to dispersal, longevity, and reproductive capacity may favor or disfavor equilibrium and thereby correlate with model performance (McPherson and Jetz 2007). As a result, there has been a recent shift from fi nding the best modeling technique to explaining variation in model perfor-mance between species (Guisan et al. 2007, Dobrowski et al. 2011). Th e accuracy of predictions may also decline when projecting across time if models incorrectly fi t or overfi t training data (Elith and Graham 2009, Elith et al. 2010), if the covariance between interacting predictors changes across time (Jim é nez-Valverde et al. 2009), or if models extrapolate beyond the range of training data (Ara ú jo et al. 2005b, Peterson et al. 2007, Nenz é n and Ara ú jo 2011).
False absences compound the problem of assessing the reliability of SDMs. Although false presences can yield misleading results, they are generally uncommon since occurrences can be confi rmed with voucher specimens or similar robust evidence. However, confi rmation of absences requires ‘ negative ’ evidence, which is rarely reported in specimen databases (K é ry 2011). Even when presence – absence data are available, absences are confounded by the possibility that a species was present but undetected (MacKenzie et al. 2006). While attention has been devoted to the eff ects of false absences on the calibration of SDMs that use presence – absence data (Gu and Swihart 2004, Lobo et al. 2010, Rota et al. 2011) or presence – only data (K é ry 2011), the consequences of false absences in data used for model evaluation are less well understood (Foody 2011). One way to address this problem is to employ occu-pancy modeling, which uses the detection probability estimated from repeated surveys to infer the probability of true absence at sites where a species was not detected (MacKenzie et al. 2006, Tingley et al. 2009, K é ry 2011).
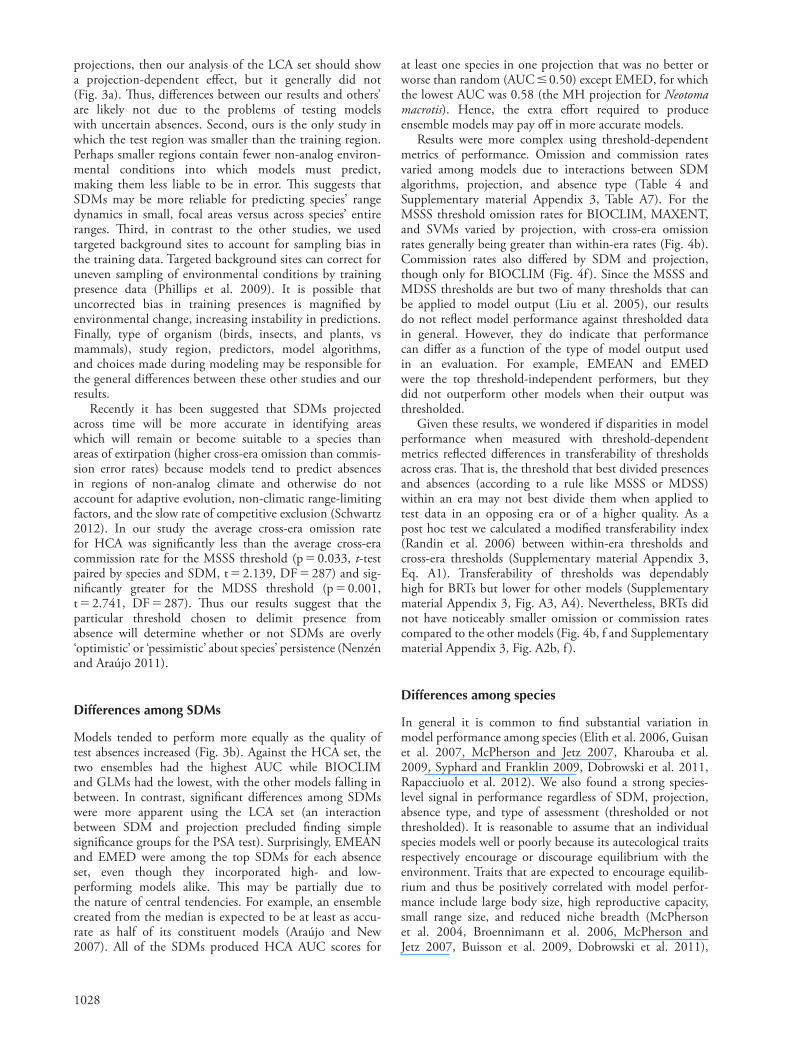
Here, we evaluate the performance of eight SDMs trained with historic (1900 – 1939) or modern (1970 – 2009) museum records which were projected to the same or the opposing time period for 18 mammalian species. Historic evaluation data was obtained from the work of Joseph Grinnell and his colleagues who conducted systematic inventories of vertebrates of the western United States in the early 20th century (Grinnell and Storer 1924). Th eir meticulous fi eld notes ( ∼ 50 000 pages) and specimens ( ∼ 80 000) are preserved at the Univ. of California, Berkeley ’ s Museum of Vertebrate Zoology, and have allowed us to resurvey matching and similar sites between 2003 and 2011 to serve as modern evaluation data (Moritz et al. 2008, Tingley et al. 2009, 2012, Morelli et al. 2012). Our test regions con-sist of three elevational gradients along the Sierra Nevada and southern Cascade Range (Fig. 1a – d). Combined with the appreciable climatic change that has occurred across the region over the past century (Fig. 1e and f; Supplementary material Appendix 1, Table A1), the thoroughness and
design of the original and contemporary surveys allow us to use occupancy modeling to confi dently assign absences and compare the accuracy of cross-era and within-era SDM projections.
Our primary questions are: 1) how well do SDMs project across time periods relevant to conservation; 2) do SDM algorithms diff er in their performance; 3) how does the quality of the test data set infl uence assessment of model accuracy; 4) can performance be predicted by species ’ autecological traits or rates of colonization and extirpation; and 5) can performance of a SDM projected across time be predicted by its performance against test data drawn from the same region and time period as the data used to train it (does within-era performance predict cross-era perfor-mance)? SDMs are commonly assessed using so-called ‘ threshold-independent ’ measures of performance, which calculate model skill across all possible values that could be used to convert model output to a binary ‘ presence/absence ’ state (Fielding and Bell 1997). In contrast, pre-dictions from SDMs are commonly used after thresholds have been applied to convert output to a binary presence/absence state because they are easily interpretable (Nenz é n and Ara ú jo 2011). Th us we examine threshold-dependent and -independent measures of model performance. A diagram of the study design is shown in Fig. 2.
Methods
Training data: species ’ records
Museum records from MaNIS ( � www.manisnet.org � ) and Arctos ( � http://arctos.database.museum/ � ) from the eastern border of the Rocky Mountains (103.77W) to the Pacifi c Ocean (Fig. 1a) and between the northern and southern borders of the US were used to train the SDMs. By using sites from the conterminous western US as training data, we included the full range or a substantial portion of each species ’ range in the model training set (Nenz é n and Ara ú jo 2011). Supplementary material Appendix 2 contains details on data cleaning procedures. Models were trained using records either from 1900 to 1939 (the ‘ historic ’ era) or 1970 to 2009 (the ‘ modern ’ era) and projected to the same era or the opposing era. To allow a fair comparison between SDMs, we equalized training presences in each era by subsampling records in the era with more sites. We only included species with � 30 presences in each era (Wisz et al. 2008) and � 5 test presences and absences (described below) in each of the eras. Th e fi nal data set had 18 species (mini-mum, median, and maximum training sites per species in an era were 50, 130, and 1003, respectively; Supplementary material Appendix 2, Table A2).
Environmental data
We used 30-arcsec ( ∼ 800-m) resolution climate layers of monthly minimum, maximum and mean temperature and precipitation derived from the parameter-elevation regression on independent slopes model (PRISM), averaged across 1900 – 1939 and across 1970 – 2009 (Daly et al. 2000). PRISM is an expert-tuned meteorological interpolation

1019
Figure 1. Th e study region (a), the three regions used for testing SDMs (b – d), and climate change at the Grinnell sites (e – f ). (a – d) Th e test regions and sites (circles). Model training was conducted on species ’ records from across the western US, but model evaluation was per-formed using presence/absence records from the Grinnell sites (b – d). Sites for pseudoabsences (PSA) were drawn from an 80-km buff er around the Sierra Nevada ecoregion (the shaded area). National Park boundaries are shown in the insets (Lassen Volcanic National Park, Yosemite National Park, and in the Southern Sierras Kings Canyon and Sequoia National Parks). (e) Climate change vectors for Grinnell sites. Each arrow represents climate change at a Grinnell site, with the beginning located at the mean minimum temperature of the coldest month and mean precipitation of the driest month in historic times, and the end located at the corresponding values in the modern era. On average minimum temperature and precipitation increased. (f ) Th e same as panel e but for mean maximum temperature of the warmest month and precipitation of the wettest month.
system with predictions based on observed weather measure-ments, and it has higher accuracy in topographically complex areas like the Sierra Nevada compared to other interpolation methods (Parra and Monahan 2008). A description of the PRISM interpolation algorithm and weather station data are presented in Supplementary material Appendix 1. From these layers we derived 19 ‘ BIOCLIM ’ variables (Nix 1986) and kept those with pairwise correlations between – 0.7 and 0.7. When deciding between highly correlated variables, we retained those that we expected to represent environmen-tal ‘ bottlenecks ’ which would impose physiological or
resource-based limits on survival (e.g. minimum tempera-ture of the coldest month, precipitation of the driest month; Austin 2002). Th is resulted in nine predictors averaged across years in each era (Supplementary material Appendix 1, Table A1): mean diurnal temperature range, the ratio of diurnal to yearly temperature range, minimum temperature of the coldest month, maximum temperature of the warmest month, temperature annual range, precipitation of the wet-test month, precipitation of the driest month, and precipita-tion of the warmest quarter, and precipitation seasonality (the coeffi cient of variation of monthly precipitation).

1020
background sites (save for SVMs for which we used a num-ber of target background sites equal to the number of training presences for each species to increase model stabil-ity). Background sites for BRTs, GAMs, and GLMs were weighted to have the same infl uence as the number of presences (Maggini et al. 2006).
Evaluation data: Grinnell surveys and resurveys
Between 1900 and 1939 Joseph Grinnell and his colleagues conducted an extensive inventory of terrestrial vertebrate species in California (Grinnell and Storer 1924, Grinnell et al. 1930, Sumner and Dixon 1953). Our resurveys focused on three elevational gradients in the Sierra Nevada and southern Cascades that have experienced relatively little human development over the past century (Fig. 1; Moritz et al. 2008, Tingley et al. 2012): Lassen (surveyed at elevations spanning 80 to 2510 m and centered on what is now Lassen Volcanic National Park and National Forest), Yosemite (from 50 to 3280 m; focused on Yosemite National Park), and the southern Sierras (from 120 to 3640 m; including Sequoia and Kings Canyon National Parks and Sequoia, Sierra, and Inyo National Forests). We perused Grinnell and colleagues ’ historical fi eld notes and specimen records to ascertain locations of survey sites, species caught, the number of traps set per night (trapping eff ort), and the pattern of captures across nights at each site to use for occupancy modeling to validate absences. Between 2003 and
Species distribution models
We compared performance of six SDMs: BIOCLIM (Busby 1991), boosted regression trees (BRTs; Elith et al. 2008), generalized additive models (GAMs; Wood 2006), general-ized linear models (GLMs), MAXENT (Phillips et al. 2006), and support vector machines (SVMs; Guo et al. 2005). Th ese models were chosen because they are among the most popular SDMs in use or, in the case of BIOCLIM, represent niches in a simplistic manner so may transfer through time better than more complex formulations. Supplementary material Appendix 2 contains detailed descriptions and information on model imple-mentation. We also calculated two ensemble models using the arithmetic mean (EMEAN) and median (EMED) of output from all of the individual models save BIOCLIM. We excluded BIOCLIM from the ensembles because it uses only presence data, whereas all of the other techniques utilize the same presence and background data, with SVMs being the exception (described below). Predictions for each model were rescaled to the range [0, 1] before ensembling (Mateo et al. 2012).
We used records from all non-domesticated, non-managed mammals in the study region as target back-ground sites to minimize sampling bias in geographical (i.e. environmental) space (Phillips et al. 2009) for all SDMs except BIOCLIM, which does not require back-ground data. Each model was trained using the focal species ’ presences and 10 000 randomly selected target
Modern low-confidence
test absences(LCA)
Modern testpseudo-
absences(PSA)
Modern high-confidence
test absences(HCA)
Historiccapturehistory
Historictest
presences
Occupancymodeling
Historic low-confidence
test absences(LCA)
Historic testpseudo-
absences(PSA)
Historic high-confidence
test absences(HCA)
Model trained withhistoric data
Historic species’ recordsand climate layers
Predictions athistoric test sites
Modelevaluation
Moderncapturehistory
Moderntest
presences
Occupancymodeling
Model trained withmodern data
Modern species’ recordsand climate layers
Predictions atmodern test sites
Modelevaluation
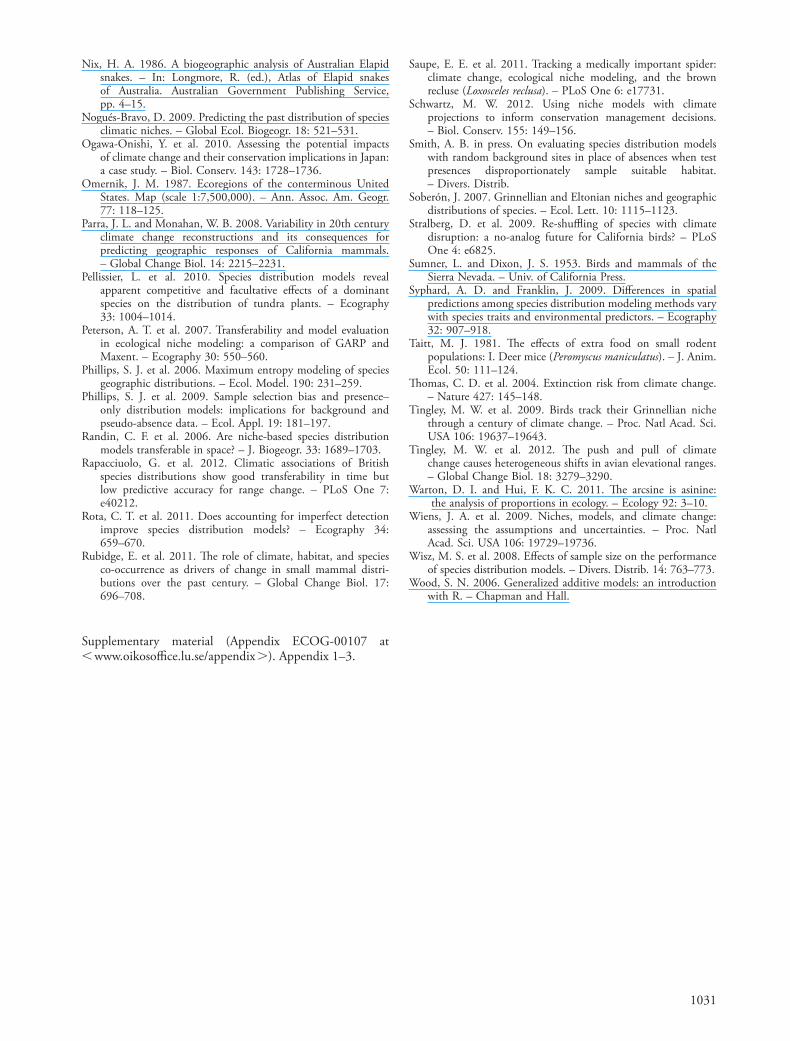
Figure 2. An outline of the study design. For each era occurrence records for each species and contemporaneous climate layers were used to train historic and modern models using one of six algorithms. Each model was then projected to the same era and opposing era using the respective climate surfaces. Capture histories at each Grinnell site in each era were used to generate test presences and three sets of test absences: randomly located ‘ pseudoabsences ’ (PSA) across the Sierra Nevada and southern Cascades, low-confi dence absences (LCA) inferred from non-detections at a site, and high-confi dence absences (HCA) inferred from occupancy modeling. Predictions from the SDMs were then compared to presences and each set of absences at Grinnell sites to evaluate the SDMs.

1021
Th e third set consisted of ‘ high-confi dence ’ absences (HCA) inferred from occupancy modeling (MacKenzie et al. 2006), which uses the pattern of detections (detected/not detected) across successive nights at each site within an era to estimate the probability that a species was present but not detected (Supplementary material Appendix 2, Table A2). Detailed procedures for occupancy models are described in Moritz et al. (2008) and in Supplementary material Appendix 2, so are briefl y presented here. We used the single-season occupancy framework to estimate the probability of a false absence at each site in each era for each species, derived from averaging across a suite of detect-ability and occupancy models that incorporated trapping eff ort, elevation, and era as covariates. Sites where the target species was not detected were assumed to be true absences if the probability of false absence was � 0.10 (Rubidge et al. 2011). Sites where a species was not detected and with a probability of false absence � 0.10 were excluded from the HCA, meaning they were a subset of the LCA. Hereafter, when we refer to the PSA, LCA, and HCA evalu-ation sets we implicitly include species ’ test presences as well as the relevant type of absences.
For each species we evaluated SDM performance for two within-era and two cross-era projections. Th e historic-to-historic projection (HH) used historic training and test data, and the modern-to-modern (MM) comparison used modern training and test data. Th e two cross-era projections (historic-to-modern, HM; and modern-to-historic, MH) used training data in one era and test data in the other. SDM predictions were extracted from then averaged across pixels within a 2-km radius at each test site to match the scale of a Grinnell site.
Threshold-independent analysis of model performance
SDM performance was evaluated using the area under the receiver-operator curve (AUC) and the correlation between predicted values and the probability of presence and absence (COR; Elith et al. 2006). For the PSA set, AUC equals the probability that a randomly chosen presence site will have a higher predicted value than a randomly located site (Phillips et al. 2006). For the LCA and HCA sets, AUC equals the probability that a randomly chosen presence site has a higher predicted value than a randomly chosen absence site, where ‘ absence ’ is a low- or high-confi dence absence. COR represents the model ’ s ability to predict the probability of presence (or ‘ pseudopresence ’ , if PSA is used). Prevalence was kept at 0.5 for the PSA tests by using the same number of pseudoabsences as there were test presences for each species but varied by species and era for the LCA and HCA tests (Supplementary material Appendix 2, Table A2).
We used a two-tiered approach to determine the eff ects of model algorithm, projecting across time, and autecologi-cal traits on model performance. Both tiers involved calcu-lating linear regressions with AUC or COR from evaluation of the PSA, LCA, or HCA sets (or all sets combined) as the response variable with SDM, projection (historic-to-historic, modern-to-modern, modern-to-historic, and historic-to-modern), and their interaction as factors.
2011 we resurveyed these and similar sites across the same regions, yielding 61 sites surveyed in both the historic and modern era, plus an additional 29 sites surveyed in just the historical era and 75 in the modern era, for a total of 90 historical and 136 modern sites for occupancy modeling and SDM evaluation (Supplementary material Appendix 2, Table A2). Following Moritz et al. (2008) and Tingley et al. (2012), we defi ned a site as a 2-km radius circle and within a 100-m elevational band around a point (usually a campsite), since trapping eff ort encompassed a range of habitats within this area. Hereafter we refer to these locations as ‘ Grinnell ’ sites. Supplementary material Appendix 2 provides detailed descriptions of the historic and modern survey methods, and Tingley et al. (2012) describes the three test regions. Data from these sites were used for testing the SDMs but were not part of the training data.
Th e climate of the Grinnell sites and the western US as a whole changed noticeably over the past century (Supplementary material Appendix 1, Table A1). Between the historical and modern survey periods, mean annual temperature increased by 0.4 ° C in the western US and by 0.3 ° C at Grinnell sites, while mean annual precipitation increased by 34 mm in the western US and by 10 mm at Grinnell sites. Relative to the western US, Grinnell sites were on average cooler and wetter, and had greater fl uctua-tions in annual precipitation and temperature. Generally, environmental minima (minimum temperature of the coldest month and minimum precipitation of the driest month) at the Grinnell sites increased between eras, while maxima (maximum temperature of the warmest month and precipitation of the wettest month) remained roughly constant relative to their range (Fig. 1e, f ).
Assessing the effects of false absences on model performance
We assessed model performance using the observed pres-ences at the Grinnell sites and three sets of absences of varying quality. Th e fi rst set consisted of ‘ pseudoabsences ’ (PSA), or randomly-located sites from across the test region, an 80-km buff er around the U.S. Environmental Protection Agency ’ s Sierra Nevada ecoregion (which includes the southern Cascade Range; Omernik 1987; Fig. 1a). PSA are commonly used for evaluation when absence data are unavailable (Hernandez et al. 2006, Phillips et al. 2006, Stralberg et al. 2009). We set the number of PSA sites equal to the number of Grinnell presence sites for each species to avoid bias in test metrics caused by unequal prevalence (ratio of presences to presences plus absences; McPherson et al. 2004, Foody 2011). Th is process was repeated 1000 times for each test set (test presences kept the same, PSA changing each time) to stabilize the stan-dard error of performance metrics to � 0.01 across replicated PSA using the same presences.
Th e second absence set consisted of ‘ low-confi dence ’ absences (LCA) inferred from non-detections at Grinnell sites in each era (Supplementary material Appendix 2, Table A2). Th is type of absence is similar to presence – absence data sets in which non-detection is assumed to indicate absence of the species.

1022
Predicting threshold-independent performance across eras
Th e performance of SDMs against test data from the same era and region as the training data is often used as an indicator of performance of models projected across time periods (Broennimann et al. 2006, Loarie et al. 2008, Ogawa-Onishi et al. 2010, Saupe et al. 2011). To test this assumption we calculated Pearson ’ s correlation coeffi cients for within-era performance versus cross-era performance (e.g. HH AUC across species vs HM AUC or MM AUC across species vs MH AUC). We performed separate correlations for each absence type and across absence types: PSA within-era performance vs PSA cross-era perfor-mance, PSA within-era vs LCA cross-era, PSA within-era vs HCA cross-era, LCA within-era vs HCA cross-era, and HCA within-era vs HCA cross-era. Others have used the transferability index from Randin et al. (2006) for this purpose. However, accuracy varied by absence types, making use of this index problematic because it is penalized when accuracy of one set diff ers from another, even if one set predicts the other well. However, for comparative purposes we also calculated a modifi ed transferability index between like absence sets (i.e. PSA within-era perfor-mance vs PSA cross-era performance, LCA vs LCA, and HCA vs HCA) using Eq. A1 (Supplementary material Appendix 3).
Site-level turnover and threshold-independent performance
We also examined the relationship between model perfor-mance and turnover (colonization and extinction) at the 61 matching Grinnell sites that were surveyed in both the historic and modern eras. Turnover was defi ned as the number of sites changing status across time (present-to-absent or absent-to-present) divided by the total number of sites in which species changed status or stayed the same (present – present or absent – absent). A species was consid-ered ‘ present ’ if it was detected at a site or ‘ absent ’ if it met our criteria for inclusion in the HCA data set. Pearson correlation coeffi cients were calculated across species between turnover rates and the average of HM and MH HCA AUC for each SDM to determine how turnover correlated with model performance.
Threshold-dependent analysis of model performance
Finally, we examined the ability of SDMs to correctly predict presences and absences after thresholding model output to a binary presence/absence state. Two commonly-used thresholds based on sensitivity (proportion of pres-ences correctly predicted) and specifi city (proportion of absences correctly predicted) were applied (Liu et al. 2005): one that maximized the sum of sensitivity and specifi city (MSSS) and another that minimized the diff er-ence between sensitivity and specifi city (MDSS). Th resholds were calculated for each absence set separately using the test presences and the absences of each set. We applied the
Th e fi rst tier of models also included ‘ species ’ as a fi xed eff ect. We reasoned that if autecological traits infl uenced species ’ propensity to be in equilibrium with their environ-ment – and thus increase model performance (Nogu é s-Bravo 2009, Wiens et al. 2009) – then they would together explain as much variation in model performance as a simple ‘ species ’ term. Hence, in the second tier of models we replaced the ‘ species ’ term with 10 autecological traits: activity cycle (nocturnal/diurnal/both), annual rhythm (hibernator/non-hibernator), diet (omnivore/granivore/insectivore/herbivore), adult mass, litter size, litters per year, young per year, range area, and climatic niche breadth and marginality (data from Moritz et al. 2008, Jones et al. 2009, and the IUCN Red List at � www.iucnredlist.org � ). Niche breadth (the range of climatic conditions in which the species is found relative to the available climatic space) and marginality (the diff erence between the species ’ climatic niche and the center of the distribution of avail-able climate), were calculated using ecological niche factor analysis (ENFA; Hirzel et al. 2002) with mean annual temperature and precipitation at all training presence sites in each era. We also included the mean detectability of each species given that it was present estimated from occupancy modeling as a covariate. We initially desired to include number of training presence sites, but it was strongly correlated with range size (r � 0.63, p � 0.005, n � 16), so retained the latter.
We also included other factors in the regressions, depend-ing on the test set. For the regressions with all absence sets combined we added absence type (PSA, LCA, HCA) as a factor to determine the eff ect of absence quality on apparent model performance. Test prevalence and its qua-dratic term was included as a ‘ nuisance ’ variable in analyses of LCA and HCA AUC and COR since an unequal number of test presences and absences can aff ect perfor-mance metrics (McPherson et al. 2004, Foody 2011). Number of test sites (presences � absences) was also used as a covariate in analyses of performance against PSA and HCA since it can also infl uence apparent performance (Bean et al. 2012). Th e number of test sites for the LCA analysis was equal to the number of Grinnell sites in each era so did not diff er between species, and therefore was not used in analyzing the LCA set.
AUC and COR were transformed using a modifi ed logit function prior to analysis following Warton and Hui (2011; COR was fi rst transformed to the range [0, 1] using ( x � 1)/2). All continuous predictors were log trans-formed, centered by subtracting their log means, and standardized by their transformed standard deviations prior to analysis except for detectability, which was logit-transformed then centered and standardized since it took the range [0, 1] (Warton and Hui 2011).
Contrasts between levels of SDM, projection, and absence type in the regressions were explored using Tukey HSD tests when these factors were signifi cant. We then employed stepwise forwards-backwards model selection with p � 0.05 for inclusion of a term. To discern the contribution of each factor to variation in AUC or COR we applied variance partitioning to the fi nal models (Gr ö mping 2007).

1023
in the fi nal model, niche marginality contributed more than twice as much as any other autecological factor (0.12 of total R 2 ; Table 2 and Supplementary material Appendix 3, Table A4) and was positively correlated with performance. In some cases AUC was � 0.5, indicating predictions worse than random. Among SDMs and test sets poor performance was most common for BIOCLIM and GLMs tested against PSA or LCA. Among species Peromyscus maniculatus performed consistently poorly (mean HCA AUC � 0.58 � 0.02) while other species performed consis-tently well, especially Tamias amoenus (mean HCA AUC � 0.91 � 0.01) and Reithrodontomys megalotis (0.92 � 0.02).
Predicting threshold-independent performance across eras from within-era performance
Modelers are often in the position of having to assume that model performance against test data drawn from the same region and time period correlates with performance in another time period from which data is unavailable. We found that HCA AUC from within-era projections (HH or MM) signifi cantly and positively correlated with cross-era HCA AUC for BIOCLIM, BRTs, and SVMs, regardless of the temporal direction in which the cross-era projection was conducted (Table 3 and Supplementary material Appendix 3, Table A6). Surprisingly, within-era LCA AUC was nearly always a good predictor of cross-era HCA AUC. Predicting cross-era HCA AUC using within-era assess-ments against PSA was reliable only for BIOCLIM, but this model also had below-average performance (Fig. 3b). Th e ability to predict performance in one direction (e.g. MM vs MH) did not necessarily imply equivalent ability in the opposing direction (e.g. HH vs HM). For example, when using within-era PSA AUC to predict cross-era HCA AUC for GAMs, the correlation between MM AUC and MH AUC was 0.47 (p � 0.049), but fell to 0.22 (p � 0.380) for the HH vs HM comparison (Table 3). We found fairly high average model transferability within absence types with no signifi cant diff erences between SDMs within the same absence type (Supplementary material Appendix 3, Fig. A1).
Site-level turnover and threshold-independent performance
Mean turnover (colonization � extinction rate) at the Grinnell sites surveyed in both historic and modern eras was 17 � 3% (Supplementary material Appendix 3, Table A7). Some species experienced substantial rates of turnover (e.g. Zapus princeps at 42% of sites), whereas other species experienced none (e.g. 0% for Tamias senex ). Average cross-era AUC was not correlated with turnover (p � 0.05 for each SDM) except for SVMs, for which the relationship was negative (r � 0.62, p � 0.005, n � 18).
Threshold-dependent analysis of model performance
To simplify presentation we focus on omission and commis-sion errors from application of the MSSS threshold, leaving
within-era threshold to the projection of the opposing era to mimic the situation in which modelers fi nd themselves when projecting to a time period from which they have no test data (i.e. the HH threshold was applied to HM projections and MM threshold to MH projections). Omission rates (the proportion of presences incorrectly predicted to be absences) and commission rates (the pro-portion of absences incorrectly predicted to be presences) were calculated for each combination of absence type, threshold, species, SDM, and projection. Omission or commission rates for each threshold were analyzed in sepa-rate analyses of variance using absence type, SDM, projec-tion, all possible two-way interaction terms between these factors, and species as covariates. Error rates were logit-transformed before analyses (Warton and Hui 2011).
Results
Threshold-independent analysis of model performance
Absence type was a signifi cant predictor in regression models of threshold-independent performance for all com-parisons (Table 1 and Supplementary material Appendix 3, Table A3). Mean AUC ( � standard error) increased signifi -cantly with the quality of absences from 0.76 � 0.01 for PSA to 0.79 � 0.01 for LCA to 0.81 � 0.01 for HCA (Fig. 3c). Hereafter we focus on tests using the HCA data set, since it best refl ects patterns of true presence and absence; results for PSA, LCA, and all test sets combined are pre-sented in Supplementary material Appendix 3. Results for COR were qualitatively very similar to analysis of AUC and are also presented in Supplementary material Appendix 3.
HCA AUC did not signifi cantly diff er between projec-tions (Table 1, Fig. 3a), meaning models performed as well when projecting within eras as across eras. Projection con-tributed little to total R ² in regressions with species as a fi xed eff ect, or in regressions replacing ‘ species ’ with autecological traits (Table 2 and Supplementary material Appendix 3, Table A4).
SDM algorithm was marginally signifi cant (p � 0.051) in regressions of HCA AUC with ‘ species ’ as a term but was signifi cant in regressions with ‘ species ’ replaced by aute-cological traits (Table 1). Mean AUC across species and projections varied by SDM from 0.76 (GLM) to 0.85 (EMED). Th e two ensemble models performed equally well and better than BIOCLIM and GLM, with the other models having intermediate performance (though these diff erences are tentative given the marginal signifi cance of SDM in the regression model; Fig. 3b).
Species identity had the largest eff ect on model perfor-mance, and was always signifi cant in the fi rst-tier models (Table 1). Alone it explained 0.36 of the variance in HCA AUC (Table 2 and Supplementary material Appendix 3, Table A4). However, when the ‘ species ’ term was replaced with autecological traits in the second tier models, the traits that remained after stepwise model selection together contributed only 0.28 to total R 2 , suggesting that addi-tional traits not included in our analysis may explain diff er-ences in performance among species. Of the traits retained

1024
Figure 3. AUC as a function of (a) projection, (b) SDM, (c) absence type, and (d) species. In each panel dark bars are tests against pseudoabsences (PSA), light bars against low-quality absences (LCA), and white bars against high-quality absences (HCA). In (a), (b), and (c) diff erent letters denote groups that are signifi cantly diff erent (p � 0.05) using Tukey HSD tests within each absence type. Contrasts between groups were generally only calculated if the relevant term was signifi cant in analyses of variance. A signifi cant interaction between SDM and projection precludes displaying signifi cance groups for the PSA set in the fi rst two panels. Signifi cance groups are coded by letter for each absence type in panels (a) and (b) and between absence types in panel (c). SDM was only marginally signifi cant in tests of HCA AUC so signifi cance groupings for HCA in panel (b) are only suggestive of diff erences, not indicative. Signifi cance groups are not shown in (d), but species has a signifi cant eff ect within each absence type. Mean AUC decreases with the order of the signifi cance group (e.g. group ‘ a ’ has the highest AUC, ‘ b ’ the second highest, etc.). In general, tests are worst against PSA and best against HCA, but AUC varies most by species. Tops of boxes, horizontal lines within boxes, and bottoms of boxes represent the upper 75%, median, and lower 25% quartiles, respectively. Dashed vertical lines extend to the lesser/greater of the maximum/minimum value and 2 standard derivations from the mean. Abbreviations: Call late: Callospermophilus lateralis , Chae cali: Chaetodipus californicus , Micr cali: Microtus californicus , Micr long: M. longicaudus , Micr mont: M. monticolus , Neot fusc: Neotoma fuscipes , Neot macr: N. macrotis , Pero boyl: Peromyscus boylii , Pero mani: P. maniculatus , Pero true: P. truei , Reit mega: Reithrodontomys megalotis , Sore mont: Sorex monticolus , Sore vagr: S. vagrans , Tami amoe: Tamias amoenus , Tami sene: T. senex , Tami spec: T. speciosus , Uroc beld: Urocitellus beldingi , Zapu prin: Zapus princeps . ns � not signifi cant.
analysis of the MDSS threshold for Supplementary material Appendix 3. Across all species, SDMs, and projections mean omission and commission rates against HCA across were 0.19 � 0.01 and 0.25 � 0.01, respectively, indicating that SDMs tended to predict false presences more than false absences using the MSSS threshold ( t -test paired by SDM, projection, and species: p � 10 5 , t � 4.366, DF � 575). In contrast to the threshold-independent analyses, regressions of omission errors indicated that overall rates var-ied by projection and its interaction with SDM (Table 4), notably for BIOCLIM, MAXENT, and SVMs (Fig. 4b). Most SDMs had equal commission error rates (Fig. 4f ).
Commission errors against the LCA and HCA sets were equal to one another and lower than against the PSA set (Fig. 4g). Species was always a signifi cant factor in ana-lyses of omission and commission rates.
Discussion
Th e temporal transferability of SDMs is of keen interest for conservation practitioners. Numerous studies have used SDMs to forecast severe range loss and even extinction of species due to anticipated global change (Th omas et al.

1025
2010, K é ry 2011), we found that SDMs can produce accu-rate projections for some species even when high-quality absence data was unavailable for model calibration (e.g. R. megalotis , T. amoenus ; Fig. 3d). However, knowing which models were accurate and which species were modeled well depended on having high-quality absences for testing (Fig. 3d and Fig. 4d, h).
High detectability of a species does not necessarily obviate the need to apply occupancy modeling to diff erenti-ate false from true absences. In our study, the conditional probability of detection for a species at a site, given that it was present, averaged 0.80 � 0.02 across species, sites, and eras. Despite this fairly high level of detectability, threshold-independent and -dependent measures of performance varied with the quality of absences. For example, mean AUC for R. megalotis increased from 0.59 � 0.02 against the PSA set to 0.88 � 0.01 against the LCA set to 0.92 � 0.01 for the HCA set (Fig. 3d). At fi rst glance this suggests that when HCA is unavailable, models tested with PSA or LCA can be assumed to be more accurate than the available data indicate. Th is would seem to imply that possession of
Table 1. Regressions on AUC for each absence type and all three absence types together using ‘ species ’ as a fi xed factor (see Supplementary material Appendix 3, Table A3 for analysis of COR). Sums of squares are calculated for each term when it is entered last into the model. Number of test sites was not included in the LCA analysis, nor was prevalence for the PSA analysis. Species is signifi -cant in every analysis. SDM is signifi cant in each analysis except for AUC calculated for high-quality absences (HCA), in which it is only marginally signifi cant. Absence type is signifi cant in the ana-lysis combining all three absence sets together. Bold values high-light signifi cant factors.
Source DF Sum of Squares F p
Performance against pseudoabsences (PSA)Projection 3 0.966 5.241 0.872SDM 7 1.097 2.550 10 � 14 Projection SDM 21 2.780 2.154 0.002 Species 17 41.079 39.320 10 � 16 Number of test sites 1 0.624 10.149 0.002 Error 526 32.326
Performance against low-quality absences (LCA)Projection 3 0.044 0.328 0.805SDM 7 1.151 3.694 0.001 Projection SDM 21 0.645 0.691 0.844Species 17 18.442 24.376 10 � 16 Test prevalence 1 0.111 2.496 0.115(Test prevalence) 2 1 0.035 0.786 0.380Error 525 23.364
Performance against high-quality absences (HCA)Projection 3 0.219 0.851 0.466SDM 7 1.212 2.022 0.051Projection SDM 21 0.773 0.430 0.988Species 17 30.133 20.704 10 � 16 Test prevalence 1 1.640 19.162 10 � 5 (Test prevalence) 2 1 1.157 13.517 10 � 4 Number of test sites 1 0.547 6.393 0.012 Error 524 44.861
Performance against all absence types togetherAbsence type 2 5.779 37.128 10 � 16 Projection 3 0.980 4.200 0.006 SDM 7 3.220 5.910 10 � 7 Projection SDM 21 1.938 1.186 0.253Species 17 65.554 49.550 10 � 16 Test prevalence 1 0.276 3.548 0.060(Test prevalence) 2 1 0.066 0.846 0.358Number of test sites 1 0.103 1.330 0.249Error 1674 130.275
2004, Hijmans and Graham 2006, Loarie et al. 2008, Ogawa-Onishi et al. 2010), optimize resiliency of conserva-tion reserves against climate change (Carroll et al. 2010), and predict the future connectivity of migration corridors (Early and Sax 2011). Overall, our results suggest that 1) assessment of true accuracy (within or across eras) depends on having high quality test data; 2) within-era accuracy unreliably predicts cross-era accuracy; and 3) accuracy diff ers as a function of the SDM algorithm and type of projection, but mostly by species. We discuss each fi nding below.
Absences and accuracy of SDMs
Our results emphasize the importance of having high confi dence in absences when assessing the accuracy of SDMs using either threshold-independent or -dependent metrics. While attention has been directed to the confound-ing eff ect of false absences on model calibration (Lobo et al.
Table 2. Partitioning of variance in AUC for the high-quality absences (HCA) set in regression models with ‘ species ’ as a fi xed term or replacing ‘ species ’ with autecological traits (see Supplementary material Appendix 3, Table A4 for other absence types and Table A5 for analysis of COR). Values represent each term ’ s contribution to R 2 . For each absence type a simple regression with projection, SDM, projection SDM, and species was analyzed (prevalence and its square and number of test sites were included as ‘ nuisance ’ terms). The species term was then replaced with autecological traits that were expected to infl uence SDM performance; if traits infl uence model performance substantially, then they should be expected to explain as much variance as the ‘ species ’ term they replace. Terms were only included in the fi nal partitioning if they were signifi cant (p � 0.05) in a forwards/backwards model selection procedure. Pluses and minuses in parentheses indicate the direction of the rela-tionship for non-categorical variables in the fi nal model. ns: not sig-nifi cant; ∗ autecological trait.
Term R 2
Regression with ‘ species ’ as a termProjection 0.01SDM 0.05Species 0.36Prevalence � (prevalence) 2 0.04Number of test sites 0.00 ( ) Total 0.47
Regression replacing ‘ species ’ with traitsProjection nsSDM 0.05Prevalence � (prevalence) 2 0.05Number of test sites nsDetectability in test era 0.01 ( ) Activity cycle ∗ 0.04Annual rhythm ∗ 0.03Diet ∗ 0.03Adult mass ∗ nsLitter size ∗ 0.02 ( � ) Litters per year ∗ 0.02 ( ) Young per year ∗ nsRange area ∗ 0.01 ( � ) Niche (ENFA) breadth ∗ 0.01 ( ) Niche (ENFA) marginality ∗ 0.12 ( � ) Total 0.39Total of autecological traits 0.28

1026
Supplementary material Appendix 3, Fig. A2). Th us our results suggest that the transferability of SDMs across time may be a function of the type of output (thresholded or not thresholded) used in the analysis and the quality of the data used to assess accuracy.
In this context, our fi nding that projection matters little to threshold-independent model accuracy is heartening since one of the primary applications of SDMs in conserva-tion is to project the future potential ranges of species given anthropogenic global change (Wiens et al. 2009). However, we found the ability to predict cross-era perfor-mance using within-era performance varied by SDM and the particular combination of within- and cross-era projections and absence types (Table 3 and Supplementary material Appendix 3, Table A6). Th is is unfortunate since within-era accuracy is often used as a surrogate for cross-era accuracy when test data is unavailable in the target era (Broennimann et al. 2006, Loarie et al. 2008, Ogawa-Onishi et al. 2010, Saupe et al. 2011). Similar results were found in studies of Canadian butterfl ies (Kharouba et al. 2009) and Californian plants (Dobrowski et al. 2011). To further compound the problem, we were unable to identify auteco-logical traits that strongly explain the substantial among-species variation in performance, the exception being niche marginality. Th us, we advise against assuming that the per-formance of a SDM tested against data from the same region and era indicates its ability to project accurately across time.
In general, the few studies that have evaluated the performance of SDMs when projected across timescales similar to ours fi nd cross-era performance is diminished relative to within-era performance (Ara ú jo et al. 2005a, b, Kharouba et al. 2009, Dobrowski et al. 2011, Rubidge et al. 2011, Rapacciuolo et al. 2012). In contrast, we found no decline in cross-era performance for threshold-independent analysis (Fig. 3a) and declines for a limited number of models in the threshold-dependent analysis (Fig. 4b, f and Supplementary material Appendix 3, Fig. A2b, f ). Th ere are several reasons why our results may diff er from these studies. First, given the eff ect of absence quality on apparent performance, it might seem that results from other studies were infl uenced by low-confi dence absences. Of similar studies, only Rubidge et al. (2011) applied occupancy modeling to diff erentiate false from true absences, but they also found diminished performance when models were projected across time. If the quality of absences infl uenced assessments of cross-era
HCA evaluation data, while advantageous, is not necessary, since assessments of performance against PSA or LCA are conservative. However, there is not a consistent positive relationship between model performance and quality of absences. For example, the highest inferred accuracies for some species were against PSA data (e.g. Neotoma macrotis ; Fig. 3d), perhaps because PSA AUC can have a negative relationship with accuracy evaluated using HCA (Smith in press).
Projecting across time
Projections to diff erent time periods should be less accurate than projections within the same era if species are not in equilibrium with their environment (Wiens et al. 2009). In our study projection mattered little to threshold-independent measures of model performance when tested against HCA data (Table 1 and Fig. 3a), but it did infl u-ence omission and commission error rates for thresholded predictions for some SDMs and absence types (Fig. 4 and
Table 3. Pearson correlation coeffi cients for AUC of within-era projections vs AUC of cross-era projections. Strong correlations indicate performance of a cross-era projection can be predicted from performance of a within-era projection. Bolded values are signifi cant at p � 0.05 (n � 18 in each case).
PSA AUC (within-era) vs HCA AUC (opposing era)
LCA AUC (within-era) vs HCA AUC (opposing era)
HCA AUC (within-era) vs HCA AUC (opposing era)
SDM HH vs HM MM vs MH HH vs HM MM vs MH HH vs HM MM vs MH
BIOCLIM 0.53 0.82 0.70 0.82 0.67 0.80 BRT 0.33 0.40 0.65 0.44 0.52 0.47 GAM 0.22 0.47 0.63 0.57 0.46 0.36GLM 0.09 0.46 0.64 0.83 0.42 0.67 MAXENT 0.42 0.25 0.68 0.69 0.47 0.42SVM 0.68 0.24 0.73 0.75 0.63 0.58 EMEAN 0.28 0.30 0.62 0.64 0.44 0.40EMED 0.30 0.26 0.66 0.56 0.42 0.28
Table 4. Analyses of variance of omission and commission error rates vs the high-quality absence (HCA) test set for the threshold that maximizes the sum of sensitivity and specifi city (MSSS; see Supplementary material Appendix 3, Table A7 for the threshold that minimizes the difference between sensitivity and specifi city). Bold values highlight signifi cant factors. See also Fig. 4 and Supplementary material Appendix 3, Fig. A2.
Source DF Sum of Squares F p
Omission error rateAbsence type 2 2.985 5.022 0.007 Projection 3 11.281 12.655 10 � 8 SDM 7 3.774 1.814 0.080Species 17 167.272 33.112 10 � 16 SDM projection 21 19.733 3.162 10 � 6 SDM absence type 14 1.730 0.416 0.970Projection absence type 6 14.072 7.892 10 � 8 Error 1657 492.4
Commission error rateAbsence type 2 4.356 9.178 10 � 4 Projection 3 9.057 12.722 10 � 8 SDM 7 1.679 1.011 0.421Species 17 85.485 21.191 10 � 16 SDM projection 21 13.318 2.672 10 � 5 SDM absence type 14 1.758 0.529 0.917Projection absence type 6 2.614 1.836 0.088Error 1657 393.2

1027
Figure 4. Omission (a – d) and commission rates (e – h) for the threshold that maximizes the sum of sensitivity and specifi city (MSSS). In panels (b) and (f ) the darkest bars represent the historic-to-historic projection, the next-darkest the modern-to-historic projection, second-to-lightest the modern-to-modern projection, and lightest the historic-to-modern projection. In all other panels the dark bars represent error rates against pseudoabsences (PSA), light bars against low-quality absences (LCA), and white bars against high-quality absences (HCA). In (a) and (e) signifi cant interactions between projection and other factors preclude display of signifi cance groups. In (b) and (f ) only signifi cantly diff erent sets within each SDM grouping are noted since SDM and projection had a signifi cant interaction. A signifi cant interaction between projection and absence type precludes display of signifi cance groups in (c). Species (d and h) had a sig-nifi cant eff ect in all analyses but signifi cance groups are not shown for visual clarity. Omission or commission error rate increases with the order of the signifi cance group code (e.g. group ‘ a ’ has the lowest error rate within a comparison, group ‘ b ’ the second-lowest, etc.). Compare to Supplementary material Appendix 3, Fig. A2 for the threshold that minimizes the diff erence between sensitivity and specifi city (MDSS). See the caption of Fig. 3 for species ’ abbreviations. ns � not signifi cant.
1028
at least one species in one projection that was no better or worse than random (AUC � 0.50) except EMED, for which the lowest AUC was 0.58 (the MH projection for Neotoma macrotis ). Hence, the extra eff ort required to produce ensemble models may pay off in more accurate models.
Results were more complex using threshold-dependent metrics of performance. Omission and commission rates varied among models due to interactions between SDM algorithms, projection, and absence type (Table 4 and Supplementary material Appendix 3, Table A7). For the MSSS threshold omission rates for BIOCLIM, MAXENT, and SVMs varied by projection, with cross-era omission rates generally being greater than within-era rates (Fig. 4b). Commission rates also diff ered by SDM and projection, though only for BIOCLIM (Fig. 4f ). Since the MSSS and MDSS thresholds are but two of many thresholds that can be applied to model output (Liu et al. 2005), our results do not refl ect model performance against thresholded data in general. However, they do indicate that performance can diff er as a function of the type of model output used in an evaluation. For example, EMEAN and EMED were the top threshold-independent performers, but they did not outperform other models when their output was thresholded.
Given these results, we wondered if disparities in model performance when measured with threshold-dependent metrics refl ected diff erences in transferability of thresholds across eras. Th at is, the threshold that best divided presences and absences (according to a rule like MSSS or MDSS) within an era may not best divide them when applied to test data in an opposing era or of a higher quality. As a post hoc test we calculated a modifi ed transferability index (Randin et al. 2006) between within-era thresholds and cross-era thresholds (Supplementary material Appendix 3, Eq. A1). Transferability of thresholds was dependably high for BRTs but lower for other models (Supplementary material Appendix 3, Fig. A3, A4). Nevertheless, BRTs did not have noticeably smaller omission or commission rates compared to the other models (Fig. 4b, f and Supplementary material Appendix 3, Fig. A2b, f ).
Differences among species
In general it is common to fi nd substantial variation in model performance among species (Elith et al. 2006, Guisan et al. 2007, McPherson and Jetz 2007, Kharouba et al. 2009, Syphard and Franklin 2009, Dobrowski et al. 2011, Rapacciuolo et al. 2012). We also found a strong species-level signal in performance regardless of SDM, projection, absence type, and type of assessment (thresholded or not thresholded). It is reasonable to assume that an individual species models well or poorly because its autecological traits respectively encourage or discourage equilibrium with the environment. Traits that are expected to encourage equilib-rium and thus be positively correlated with model perfor-mance include large body size, high reproductive capacity, small range size, and reduced niche breadth (McPherson et al. 2004, Broennimann et al. 2006, McPherson and Jetz 2007, Buisson et al. 2009, Dobrowski et al. 2011),
projections, then our analysis of the LCA set should show a projection-dependent eff ect, but it generally did not (Fig. 3a). Th us, diff erences between our results and others ’ are likely not due to the problems of testing models with uncertain absences. Second, ours is the only study in which the test region was smaller than the training region. Perhaps smaller regions contain fewer non-analog environ-mental conditions into which models must predict, making them less liable to be in error. Th is suggests that SDMs may be more reliable for predicting species ’ range dynamics in small, focal areas versus across species ’ entire ranges. Th ird, in contrast to the other studies, we used targeted background sites to account for sampling bias in the training data. Targeted background sites can correct for uneven sampling of environmental conditions by training presence data (Phillips et al. 2009). It is possible that uncorrected bias in training presences is magnifi ed by environmental change, increasing instability in predictions. Finally, type of organism (birds, insects, and plants, vs mammals), study region, predictors, model algorithms, and choices made during modeling may be responsible for the general diff erences between these other studies and our results.
Recently it has been suggested that SDMs projected across time will be more accurate in identifying areas which will remain or become suitable to a species than areas of extirpation (higher cross-era omission than commis-sion error rates) because models tend to predict absences in regions of non-analog climate and otherwise do not account for adaptive evolution, non-climatic range-limiting factors, and the slow rate of competitive exclusion (Schwartz 2012). In our study the average cross-era omission rate for HCA was signifi cantly less than the average cross-era commission rate for the MSSS threshold (p � 0.033, t -test paired by species and SDM, t � 2.139, DF � 287) and sig-nifi cantly greater for the MDSS threshold (p � 0.001, t � 2.741, DF � 287). Th us our results suggest that the particular threshold chosen to delimit presence from absence will determine whether or not SDMs are overly ‘ optimistic ’ or ‘ pessimistic ’ about species ’ persistence (Nenz é n and Ara ú jo 2011).
Differences among SDMs
Models tended to perform more equally as the quality of test absences increased (Fig. 3b). Against the HCA set, the two ensembles had the highest AUC while BIOCLIM and GLMs had the lowest, with the other models falling in between. In contrast, signifi cant diff erences among SDMs were more apparent using the LCA set (an interaction between SDM and projection precluded fi nding simple signifi cance groups for the PSA test). Surprisingly, EMEAN and EMED were among the top SDMs for each absence set, even though they incorporated high- and low-performing models alike. Th is may be partially due to the nature of central tendencies. For example, an ensemble created from the median is expected to be at least as accu-rate as half of its constituent models (Ara ú jo and New 2007). All of the SDMs produced HCA AUC scores for

1029
Conclusions
We found that that a) possession of high-quality absence data is essential for assessing the relative accuracy of SDMs; b) mean model performance within the same era was generally equal to performance when projected to a diff ering era; c) within-era performance tends to correlate positively but unreliably with cross-era performance; and d) model performance varies most dramatically among species, but not by model algorithm or projection.
Our results provide cautious optimism for predicting species ’ biogeographic responses to climate change. Th ey indicate that SDMs trained with climatic data are more reliable than a random assignation of presences and absences for most species, but models of diff erent species perform well or poorly independently of the SDM algorithm and seem to do so irrespective of autecological traits. Unfortunately, identifying reliable models requires high-confi dence absence data which is often unavailable, and within-era performance predicts cross-era performance under limited circumstances. Nevertheless, SDMs will remain in the conservation practitioner ’ s toolbox because, as Wiens et al. (2009, p. 19735) emphasized, ‘ Not using models to peer into the future . . . is not really an option ’ . Th us, we recommend care be taken when projecting SDMs across time and quality of absence data be taken into account when assessing model performance. Th ese points are especially important to consider given that change in climate over the past century in the Sierras Nevada ecoregion and in the western US at large has been small compared to changes expected in the coming century. Th us, our results are likely relevant to the degree of climate change experi-enced by the study region across the past century rather than the absolute amount of time that has passed between Grinnell ’ s era and the present.
Th is study would not have been possible without the foresight of Joseph Grinnell and his colleagues. Th eir fi eld studies were fundamental to the development of the concept of the ecological niche and biogeography (Sober ó n 2007, Wiens et al. 2009) and continue to provide insight into the eff ects of climate change and land use on biodiversity. Our study, among others, demonstrates the importance of well-curated museum specimens and – just as importantly – highly detailed, accessible fi eld notes (Drew 2011). While contemporary research provides a route for understanding the past and present, our data needs to be catalogued and preserved so that it may provide a baseline for future investi-gators who wish to understand the world we leave them.
Acknowledgements – Jane Elith, Sean Maher, Matthew Albrecht, and subject editor David Nogu é s-Bravo provided insightful comments on the manuscript. Jeremy VanDerWal kindly supplied the script for calculating ENFA marginality and specialization, and Matthias Falk and Wayne Gibson kindly provided metadata on the PRISM layers. We wish to thank Joseph Grinnell and numerous past and present fi eld workers who invested years of their lives to document and understand the wildlife of the western United States. Th e Grinnell Resurvey Project was supported by the Yosemite Foundation and the National Science Foundation (DEB 0640859), and ABS was supported by PIER grant 500-02-004, WA #MR-479 from the California Energy Commission while completing this work.
as well as behavioral traits like propensity to hibernate or diurnal activity cycle.
In contrast to these expectations, autecological traits together explained a small portion of the variance in AUC and COR (Table 2, Supplementary material Appendix 3, Table A4, A5). Moritz et al. (2008) also found only weak relationships between elevational range dynamics in the Yosemite region and the same life history traits we used for a superset of the species analyzed here. It is possible that the distributions of poorly modeled species are not determined by the climatic predictors we used or factors directly related to them. For example, P. maniculatus , for which no model performed remarkably well against HCA data (Fig. 3, 4), has an extremely wide distribution so appears to be relatively unrestricted in the climatic space it can inhabit (Taitt 1981). Poorly-modeled species should have traits that make them less sensitive to climate, but our analyses uncovered few strong relationships. Th e one exception is multivariate niche (ENFA) marginal-ity, which contributed more than any other trait to vari-ation in AUC and COR (Table 2, Supplementary material Appendix 3, Table A4, A5). Marginality is a measure of the distance between the center of available climatic space and the species ’ climatic niche (Hirzel et al. 2002), so it may refl ect the ease with which a model can distinguish a species ’ range (Hernandez et al. 2006). Nevertheless, if there is a single trait or suite of traits that capture how well a species can be modeled, it is not fully specifi ed in our list. Moreover, using ‘ species ’ as a ‘ catch-all ’ term to represent traits that we did and did not include still explained less than half of the variation in SDM performance ( ‘ species ’ contribution to R 2 � 0.36 for AUC and 0.45 for COR; Table 2, Supplementary material Appendix 3, Table A4, A5), suggesting that knowledge of all relevant autecological traits would still only be nominally useful for determining which species model well.
Others have found mixed evidence for relationships between species ’ traits and model performance (Guisan et al. 2007, McPherson and Jetz 2007, Kharouba et al. 2009, Syphard and Franklin 2009, Dobrowski et al. 2011). In general relationships seem stronger for poikilothermic taxa (e.g. insects and plants; Guisan et al. 2007, Kharouba et al. 2009, Syphard and Franklin 2009, Dobrowski et al. 2011) than for homeotherms (birds and mammals; McPherson and Jetz 2007 and this study), although evidence is limited.
If a species ’ range is at least partially infl uenced by climatic limitations, then we should expect sites to experi-ence turnover (colonization and/or extinction) as climate changes (Tingley et al. 2009). On the one hand this sug-gests that turnover will correlate positively with model performance if it encourages equilibrium with the environ-ment (Nogu é s-Bravo 2009). Alternatively, if changes in the habitat unrelated to the climate drive turnover (e.g. intrinsic population cycles or biotic interactions), then colonization and extirpation may encourage disequilib-rium, meaning that turnover should correlate negatively with model performance. However, we found no strong relationship between turnover and model performance, suggesting that species may be responding to both kinds of factors in a manner that cancels their infl uence.

1030
Gr ö mping, U. 2007. Estimators of relative importance in linear regression based on variance decomposition. – Am. Stat. 61: 139 – 147.
Gu, W. and Swihart, R. K. 2004. Absent or undetected? Eff ects of non-detection of species occurrence on wildlife-habitat models. – Biol. Conserv. 116: 195 – 203.
Guisan, A. et al. 2007. What matters for predicting the occurrences of trees: techniques, data, or species ’ characteristics? – Ecol. Monogr. 77: 615 – 630.
Guo, Q. et al. 2005. Support vector machines for predicting distribution of Sudden Oak Death in California. – Ecol. Model. 182: 75 – 90.
Hernandez, P. A. et al. 2006. Th e eff ect of sample size and species characteristics on performance of diff erent species distribution modeling methods. – Ecography 29: 773 – 785.
Hijmans, R. J. 2012. Cross-validation of species distribution models: removing spatial sorting bias and calibration with a null model. – Ecology 93: 679 – 688.
Hijmans, R. J. and Graham, C. H. 2006. Th e ability of climate envelope models to predict the eff ect of climate change on species distributions. – Global Change Biol. 12: 2272 – 2281.
Hirzel, A. H. et al. 2002. Ecological-niche factor analysis: how to compute habitat-suitability maps without absence data? – Ecology 83: 2027 – 2036.
Jim é nez-Valverde, A. et al. 2009. Environmental correlation struc-ture and ecological niche model projections. – Biodivers. Inform. 6: 28 – 35.
Jones, K. E. et al. 2009. PanTHERIA: a species-level database of life history, ecology, and geography of extant and recently extinct mammals. – Ecology 90: 2648.
K é ry, M. 2011. Toward the modeling of true species distributions. – J. Biogeogr. 38: 617 – 618.
Kharouba, H. M. et al. 2009. Historically calibrated predictions of butterfl y species ’ range shift using global change as a pseudo-experiment. – Ecology 90: 2213 – 2222.
Lavergne, S. et al. 2010. Biodiversity and climate change: inte-grating evolutionary and ecological responses of species and communities. – Annu. Rev. Ecol. Evol. Syst. 41: 321 – 350.
Liu, C. et al. 2005. Selecting thresholds of occurrence in the prediction of species distributions. – Ecography 28: 385 – 393.
Loarie, S. R. et al. 2008. Climate change and the future of California ’ s endemic fl ora. – PLoS One 3: e2502.
Lobo, J. M. et al. 2010. Th e uncertain nature of absences and their importance in species distribution modeling. – Ecography 33: 103 – 114.
MacKenzie, D. I. et al. 2006. Occupancy estimation and modeling: inferring patterns and dynamics of species occur-rence. – Elsevier.
Maggini, R. et al. 2006. Improving generalized regression analysis for the spatial prediction of forest communities. – J. Biogeogr. 33: 1729 – 1749.
Mateo, R. G. et al. 2012. Do stacked species distribution models refl ect altitudinal diversity patterns? – PLoS One 7: e32586.
McPherson, J. M. and Jetz, W. 2007. Eff ects of species ’ ecology on the accuracy of distribution models. – Ecography 30: 135 – 151.
McPherson, J. M. et al. 2004. Th e eff ects of species ’ range sizes on the accuracy of distribution models: ecological phenomenon or statistical artifact? – J. Appl. Ecol. 41: 811 – 823.
Morelli, T. L. et al. 2012. Anthropogenic refugia ameliorate the severe climate - related decline of a montane mammal along its trailing edge. – Proc. R. Soc. B 279: 4279 – 4286.
Moritz, C. et al. 2008. Impact of a century of climate change on small-mammal communities in Yosemite National Park, USA. – Science 322: 261 – 264.
Nenz é n, H. K. and Ara ú jo, M. B. 2011. Choice of threshold alters projections of species range shifts under climate change. – Ecol. Model. 222: 3346 – 3354.
References
Ara ú jo, M. B. and New, M. 2007. Ensemble forecasting of species distributions. – Trends Ecol. Evol. 22: 42 – 47.
Ara ú jo, M. B. et al. 2005a. Validation of species-climate impact models under climate change. – Global Change Biol. 11: 1504 – 1513.
Ara ú jo, M. B. et al. 2005b. Reducing uncertainty in projections of extinction risk from climate change. – Global Ecol. Biogeogr. 14: 529 – 538.
Austin, M. P. 2002. Spatial prediction of species distribution: an interface between ecological theory and statistical modeling. – Ecol. Model. 157: 101 – 118.
Bean, W. T. et al. 2012. Th e eff ects of small sample size and sample bias on threshold selection and accuracy assessment of species distribution models. – Ecography 35: 250 – 258.
Broennimann, O. et al. 2006. Do geographic distribution, niche property and life form explain plants ’ vulnerability to global change? – Global Change Biol. 12: 1079 – 1093.
Buisson, L. et al. 2009. Uncertainty in ensemble forecasting of species distribution. – Global Change Biol. 16: 1145 – 1157.
Busby, J. R. 1991. BIOCLIM – a bioclimate analysis and prediction system. – In: Margules, C. R. and Austin, M. P. (eds), Nature conservation: cost eff ective biological surveys and data analysis. CSIRO, pp. 64 – 68.
Carroll, C. et al. 2010. Optimizing resiliency of networks to climate change: multispecies conservation planning in the Pacifi c Northwest, USA. – Global Change Biol. 16: 891 – 904.
Daly, C. et al. 2000. High-quality spatial climate data sets for the United States and beyond. – Trans. Am. Soc. Agric. Eng. 43: 1957 – 1962.
Dobrowski, S. Z. et al. 2011. Modeling plant ranges over 75 years of climate change in California, USA: relating transferability to species traits. – Ecol. Monogr. 81: 241 – 257.
Dormann, C. F. 2007. Promising the future? Global change projections of species distributions. – Basic Appl. Ecol. 8: 387 – 397.
Drew, J. 2011. Th e role of natural history institutions and bioinformatics in conservation biology. – Conserv. Biol. 25: 1250 – 1252.
Early, R. and Sax, D. 2011. Analysis of climate paths reveals potential limitations on species range shifts. – Ecol. Lett. 14: 1125 – 1133.
Elith, J. and Graham, C. H. 2009. Do they? How do they? WHY do they? On fi nding reasons for diff ering performances of species distribution models. – Ecography 32: 66 – 77.
Elith, J. and Leathwick, J. R. 2009. Species distribution models: ecological explanation and prediction across space and time. – Annu. Rev. Ecol. Evol. Syst. 40: 677 – 697.
Elith, J. et al. 2006. Novel methods improve prediction of species ’ distributions from occurrence data. – Ecography 29: 129 – 151.
Elith, J. et al. 2008. A working guide to boosted regression trees. – J. Anim. Ecol. 77: 802 – 813.
Elith, J. et al. 2010. Th e art of modeling range-shifting species. – Methods Ecol. Evol. 1: 330 – 342.
Fielding, A. H. and Bell, J. F. 1997. A review of methods for the assessment of prediction errors in conservation presence/absence models. – Environ. Conserv. 24: 38 – 49.
Foody, G. M. 2011. Impacts of imperfect reference data on the apparent accuracy of species presence – absence models and their prediction. – Global Ecol. Biogeogr. 20: 498 – 508.
Grinnell, J. and Storer, T. 1924. Animal life in the Yosemite. – Univ. of California Press.
Grinnell, J. et al. 1930. Vertebrate natural history of a section of northern California through Lassen Peak. – Univ. Calif. Public. Zool. 35: 1 – 584.
1031
Saupe, E. E. et al. 2011. Tracking a medically important spider: climate change, ecological niche modeling, and the brown recluse ( Loxosceles reclusa ). – PLoS One 6: e17731.
Schwartz, M. W. 2012. Using niche models with climate projections to inform conservation management decisions. – Biol. Conserv. 155: 149 – 156.
Smith, A. B. in press. On evaluating species distribution models with random background sites in place of absences when test presences disproportionately sample suitable habitat. – Divers. Distrib.
Sober ó n, J. 2007. Grinnellian and Eltonian niches and geographic distributions of species. – Ecol. Lett. 10: 1115 – 1123.
Stralberg, D. et al. 2009. Re-shuffl ing of species with climate disruption: a no-analog future for California birds? – PLoS One 4: e6825.
Sumner, L. and Dixon, J. S. 1953. Birds and mammals of the Sierra Nevada. – Univ. of California Press.
Syphard, A. D. and Franklin, J. 2009. Diff erences in spatial predictions among species distribution modeling methods vary with species traits and environmental predictors. – Ecography 32: 907 – 918.
Taitt, M. J. 1981. Th e eff ects of extra food on small rodent populations: I. Deer mice ( Peromyscus maniculatus ). – J. Anim. Ecol. 50: 111 – 124.
Th omas, C. D. et al. 2004. Extinction risk from climate change. – Nature 427: 145 – 148.
Tingley, M. W. et al. 2009. Birds track their Grinnellian niche through a century of climate change. – Proc. Natl Acad. Sci. USA 106: 19637 – 19643.
Tingley, M. W. et al. 2012. Th e push and pull of climate change causes heterogeneous shifts in avian elevational ranges. – Global Change Biol. 18: 3279 – 3290.
Warton, D. I. and Hui, F. K. C. 2011. Th e arcsine is asinine: the analysis of proportions in ecology. – Ecology 92: 3 – 10.
Wiens, J. A. et al. 2009. Niches, models, and climate change: assessing the assumptions and uncertainties. – Proc. Natl Acad. Sci. USA 106: 19729 – 19736.
Wisz, M. S. et al. 2008. Eff ects of sample size on the performance of species distribution models. – Divers. Distrib. 14: 763 – 773.
Wood, S. N. 2006. Generalized additive models: an introduction with R. – Chapman and Hall.
Nix, H. A. 1986. A biogeographic analysis of Australian Elapid snakes. – In: Longmore, R. (ed.), Atlas of Elapid snakes of Australia. Australian Government Publishing Service, pp. 4 – 15.
Nogu é s-Bravo, D. 2009. Predicting the past distribution of species climatic niches. – Global Ecol. Biogeogr. 18: 521 – 531.
Ogawa-Onishi, Y. et al. 2010. Assessing the potential impacts of climate change and their conservation implications in Japan: a case study. – Biol. Conserv. 143: 1728 – 1736.
Omernik, J. M. 1987. Ecoregions of the conterminous United States. Map (scale 1:7,500,000). – Ann. Assoc. Am. Geogr. 77: 118 – 125.
Parra, J. L. and Monahan, W. B. 2008. Variability in 20th century climate change reconstructions and its consequences for predicting geographic responses of California mammals. – Global Change Biol. 14: 2215 – 2231.
Pellissier, L. et al. 2010. Species distribution models reveal apparent competitive and facultative eff ects of a dominant species on the distribution of tundra plants. – Ecography 33: 1004 – 1014.
Peterson, A. T. et al. 2007. Transferability and model evaluation in ecological niche modeling: a comparison of GARP and Maxent. – Ecography 30: 550 – 560.
Phillips, S. J. et al. 2006. Maximum entropy modeling of species geographic distributions. – Ecol. Model. 190: 231 – 259.
Phillips, S. J. et al. 2009. Sample selection bias and presence – only distribution models: implications for background and pseudo-absence data. – Ecol. Appl. 19: 181 – 197.
Randin, C. F. et al. 2006. Are niche-based species distribution models transferable in space? – J. Biogeogr. 33: 1689 – 1703.
Rapacciuolo, G. et al. 2012. Climatic associations of British species distributions show good transferability in time but low pre dictive accuracy for range change. – PLoS One 7: e40212.
Rota, C. T. et al. 2011. Does accounting for imperfect detection improve species distribution models? – Ecography 34: 659 – 670.
Rubidge, E. et al. 2011. Th e role of climate, habitat, and species co-occurrence as drivers of change in small mammal distri-butions over the past century. – Global Change Biol. 17: 696 – 708.
Supplementary material (Appendix ECOG-00107 at � www.oikosoffi ce.lu.se/appendix � ). Appendix 1 – 3.
Copyright © 2022 FDOKUMEN