New loci associated with kidney function and chronic kidney disease
Divya Jain et al, International Journal of Computer Science and Mobile Computing, Vol.3 Issue.4, April- 2014, pg. 535-542
© 2014, IJCSMC All Rights Reserved 535
Available Online at www.ijcsmc.com
International Journal of Computer Science and Mobile Computing
A Monthly Journal of Computer Science and Information Technology
ISSN 2320–088X
IJCSMC, Vol. 3, Issue. 4, April 2014, pg.535 – 542
RESEARCH ARTICLE
Predicting the Effect of Diabetes on Kidney using
Classification in Tanagra
Divya Jain1, Sumanlata Gautam
2
¹Computer Science & Engineering, ITM University, Gurgaon, India
²Computer Science & Engineering, ITM University, Gurgaon, India 1 [email protected]; 2 [email protected]
Abstract— As numerous data mining tools & techniques continue to develop along with the healthcare domain, the
applications of data mining in healthcare sector will undoubtedly play a growing role in the world. There exist a large
number of useful techniques in data mining like classification, association, clustering, regression etc. that helps to discover
new trends in huge healthcare databases. This paper comes out with the application of classification and prediction
technique to find the effect of diabetes on kidney. The implementation is done using the application of C4.5 Algorithm in
Tanagra. This paper demonstrated the utility of classification on a dataset containing records of both diabetic and non-
diabetic patients using data mining tool Tanagra. Using Kidney Function Tests (KFT), the effect of diabetes on kidney is
determined. After comparing manually the result of Tanagra with the actual output, we discovered that Tanagra is very near
to the output. Finally, the performance of classifier in Tanagra is evaluated in terms of recall, precision and error rate.
Keywords— Diabetes; Kidney; Prediction; C4.5 Algorithm; Tanagra
I. INTRODUCTION
Data mining [1] is one of the several applications of machine learning. The evolution in this field has been made from time to
time through various direct or indirect methods. Data mining driven approaches analyses data coming from different sources
and convert it into useful information [2]. There exist various scalable and interactive data mining methods which help to find latest patterns in healthcare industry. One of the major applications of data mining is in healthcare sector [3, 4]. Data mining
techniques are used effectively in knowledge discovery in healthcare databases. Now-a-days, the information in databases is
growing rapidly day-by-day. It gets updated almost daily. It seems a bit difficult to analyse the new patterns and anomalies in
databases. For this purpose, data mining tools and techniques are used. We need to be aware of latest advancements in
healthcare area. Classification and prediction techniques [5] are used to construct a model using the given training data and
classification technique is used to predict the class of unknown values with the help of generated model.
II. METHODOLOGY
An easy way to comply with the conference paper formatting requirements is to use this document as a template and simply
type your text into it. The dataset is made manually from the reports collected from the hospital Jyoti diagnostic & Research
Centre. The dataset consists of 148 records of patients with 13 attributes. The attributes are Age, Sex, Urban/Rural, Blood Urea,
Serum Creatinine, Uric Acid, Total Protein, Albumine, Blood Sugar, Type of D, Type, class and status. The attributes are
Divya Jain et al, International Journal of Computer Science and Mobile Computing, Vol.3 Issue.4, April- 2014, pg. 535-542
© 2014, IJCSMC All Rights Reserved 536
related to kidney Function Tests (KFT). Whenever a patient faces problem in kidney, they go for Kidney Function Tests. The
dataset consists of patients suffering from diabetes as well as patients not suffering from diabetes. This is indicated with the help
of attributes ―Type of D‖ and ―Type‖. As we are applying classification technique, ―class‖ attribute is added with discrete
values ‗A‘ and ‗N‘. ‗A‘ means patient is affected by diabetes and that diabetes has significant effect on the kidney of patient.
‗N‘ means diabetes has no effect on kidney of patient. Another attribute ―status‖ is added in the dataset containing 2 discrete
values – ―Learning‖ and ‗to_classify‖. We provide learning to first 100 examples and classifier constructs a model from the training set and then classifier is used to classify the unlabelled records i.e. next 48 records.
A. Diabetes
Diabetes [6] is a disease that threatens the life of people of all nations. It occurs when the blood sugar in the body is increased
above a certain level. It is a disease in which either pancreas in the body are not producing sufficient insulin or cells in the body
are not using insulin properly.There are mainly two types of diabetes, namely, type 1 and type 2 diabetes. Type 1 diabetes
occurs frequently in children and type 2 diabetes is common among adults. Another form of diabetes called Gestational
Diabetes occurs during pregnancy. In most of the cases, it disappears after the baby is born. About 60% of the people suffer
from diabetes in Asia [7]. Obesity, overweight, intake of large quantity of junk food and physical inactivity are some of the
factors that contributes towards diabetes. Usually people ignore the incidence of this disease. But, in reality, diabetes is a serious disease and can lead to other very severe complications if not taken seriously. It can lead to many other complications like skin
complications, foot complications, eye complications, heart disease and kidney disease etc. [8]. The increasing prevalence of
diabetes is also affecting economic gains in various countries.
B. Diabetes and Kidney
The kidneys [9] are essential organs in the excretory system. They help in filtering and removing wastes and toxic elements
from the human body. In addition, they maintain the balance of sodium and fluid in the body.
Diabetes occurs when blood sugar reaches its maximum value. Too much glucose in the blood affects kidney significantly.
Diabetes can harm kidneys severely and can lead to kidney failure. Approximately 44% of people starting dialysis has kidney failure caused by diabetes [10]. American Indians, African Americans and Hispanics are at greater risk of developing kidney
disease caused by diabetes [10]. High blood pressure and high blood glucose can affect filters in kidney.
C. Classification & Prediction
Classification is a technique which groups data into predetermined classes [11]. It is of two types- Supervised Classification and Unsupervised Classification. In the former one, the set of all classes is known to us. In the latter one, the classes are not known.
The former classification is simple and more accurate than the latter one. Classification is done in two phases. In the first phase,
a model is constructed from the training dataset by analysing the labelled records of the dataset [12]. In the next phase, the
model is applied to the testing dataset to classify unlabelled records. There are several techniques used for classification in data
mining like decision trees, neural networks, Bayesian belief networks etc. We can compare classification & prediction methods
based on various factors like accuracy, speed, robustness, scalability etc. [13].
D. C4.5 Algorithm
C4.5 algorithm is a well-known algorithm used to construct decision trees. Decision tree induction is an effective method to
deduce rules from the generated tree. The rules inferred from the tree can be used for predicting the categorical attribute ―class‖
present in databases. There are different variations of decision trees like ID3, CART, C4.5 etc. All of these are efficient in
decision tree generation. The difference lies in the splitting criterion at each node [14]. C4.5 Algorithm is an advancement of
ID3 algorithm that works well only with categorical attributes. C4.5 algorithm [15] works efficiently with both continuous and
categorical attributes. Using this algorithm, the tree is constructed using greedy approach.
E. Tanagra Tool
Tanagra [16] is a machine learning tool used mostly by researchers for data analysis. It was released in the year 2004 and built
in Pascal language [17]. Tanagra is basically used in textual form. Spina is the graphical representation of Tanagra. It is very
useful in mining of data and researchers take advantage of its open access. It gives students and researchers a new developing
platform to add new functionality with the help of existing algorithms and built-in methods.
III. IMPLEMENTATION IN TANAGRA
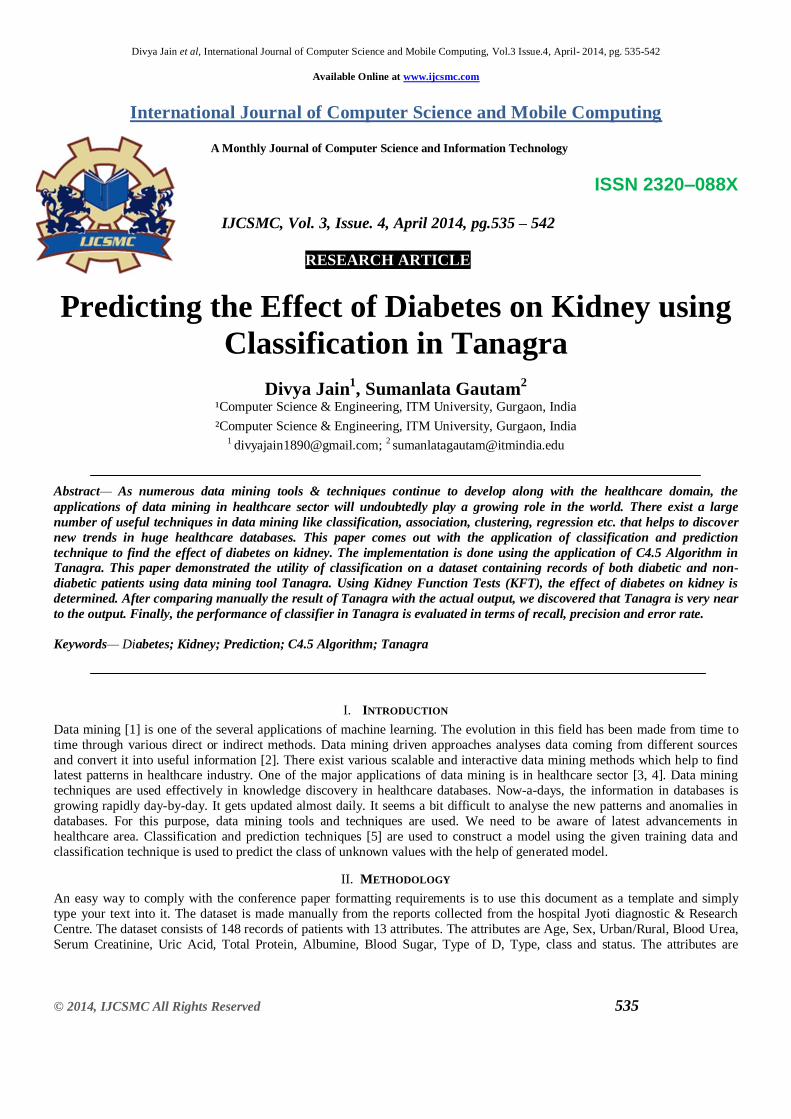
Tanagra has a capacity to load data in txt format. First, open Tanagra and data is loaded in .txt format. After the data is
loaded, Tanagra will scan the data and will display the number of examples and attributes as well as the computation
time as shown in Fig. 1.
Divya Jain et al, International Journal of Computer Science and Mobile Computing, Vol.3 Issue.4, April- 2014, pg. 535-542
© 2014, IJCSMC All Rights Reserved 537
Fig. 1 Loaded Dataset in Tanagra
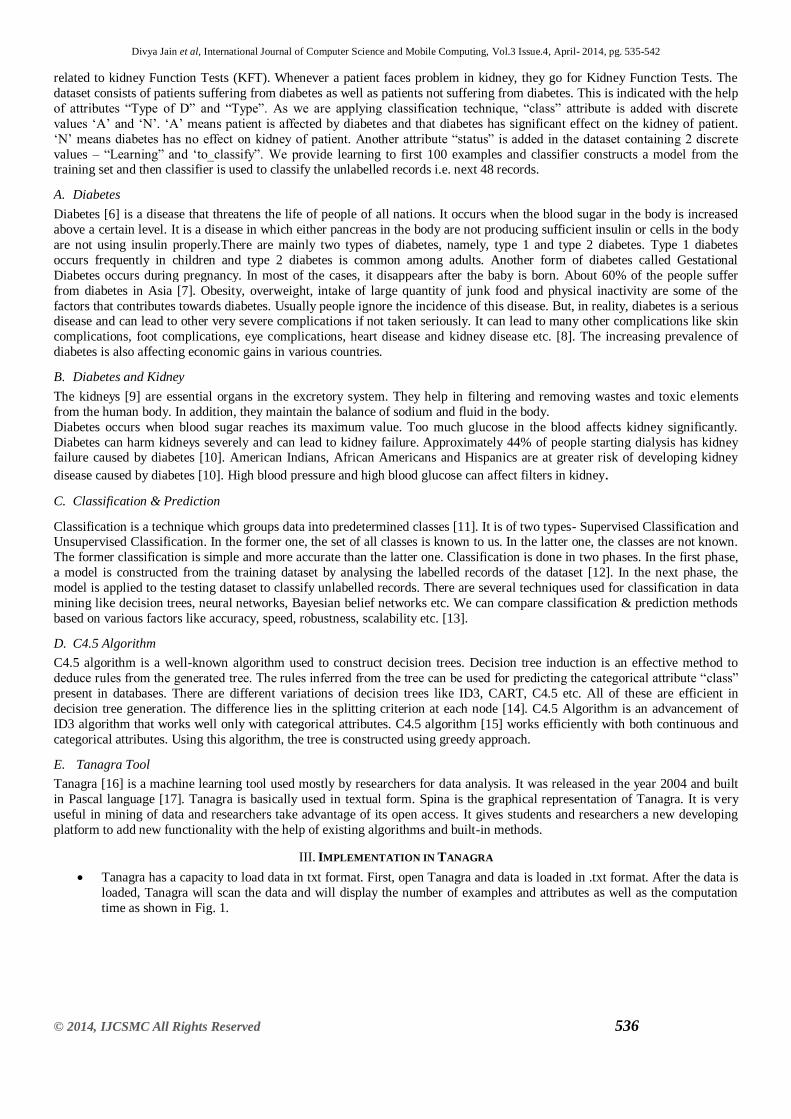
Add a ―View dataset‖ component from the Data Visualization tab of the component palette. Drag and drop ―View
Dataset‖ from components palette under the Dataset node. Click on the View dataset node, then right-click on it to
activate the popup menu and choose the ―View‖ option. The dataset of 148 records with 13 attributes will be displayed
in the right frame. The dataset consists of 5 discrete attributes and 8 continuous attributes.
Fig. 2 Viewing Dataset in Tanagra
Add a ―Discrete Select Examples‖ component from the Instance Selection tab of the component palette. Drag and drop
―Discrete Select Examples‖ from components palette under the View Dataset node. Right-click on the selected
component to activate the popup menu and choose the ―Parameters‖ option. An ―Attribute-value examples option‖ will
be displayed. Select attribute as ―Status‖ and value as ―Learning‖. Here we are providing learning through first 100
records as their class is already known to us.
Divya Jain et al, International Journal of Computer Science and Mobile Computing, Vol.3 Issue.4, April- 2014, pg. 535-542
© 2014, IJCSMC All Rights Reserved 538
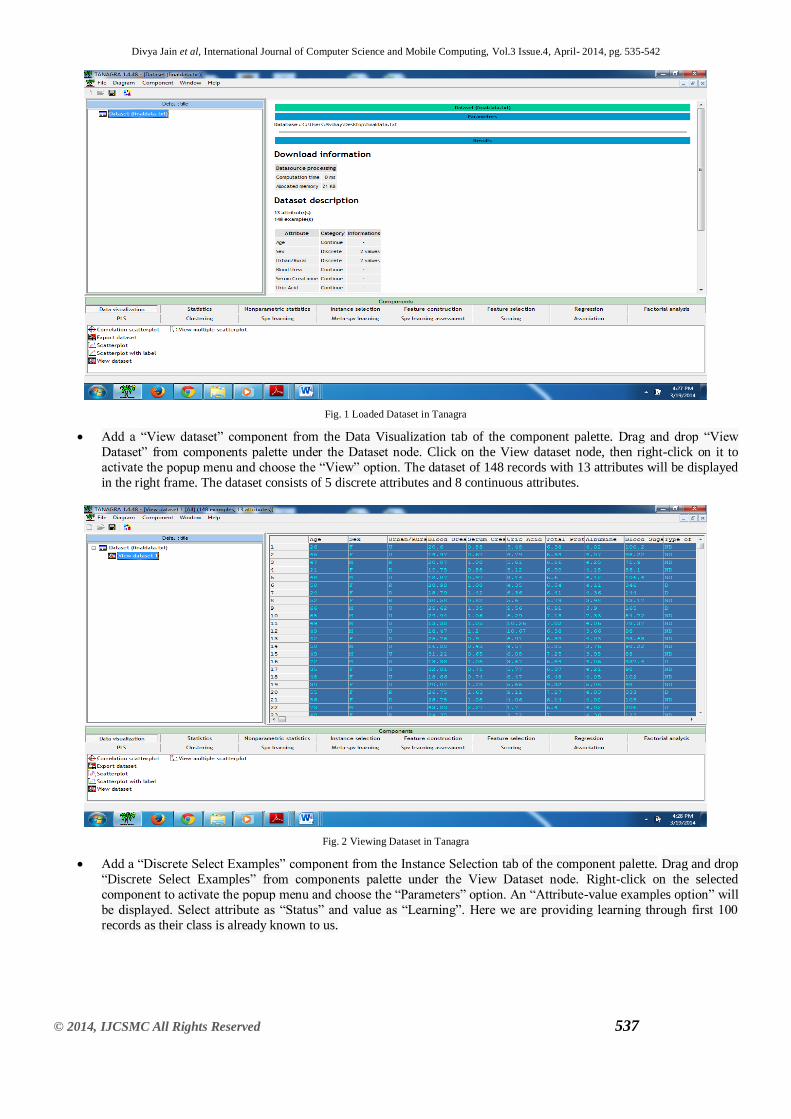
Fig. 3 Selecting Discrete Examples as their class is already known to us.
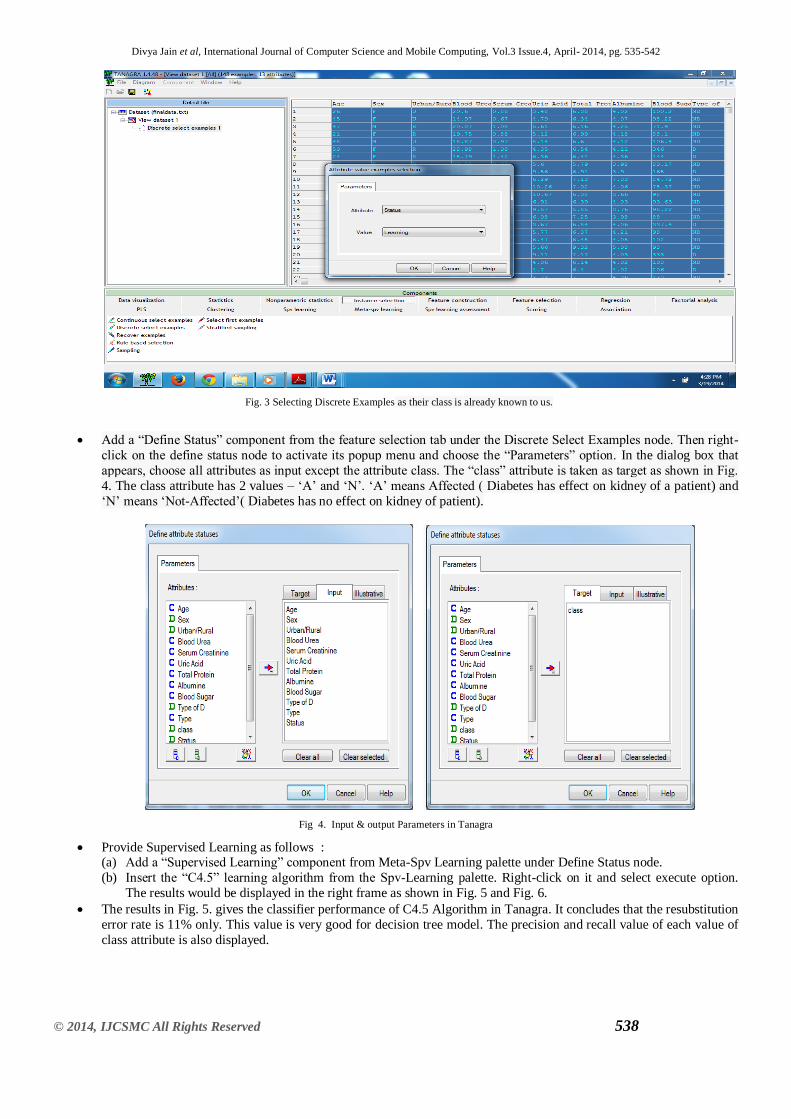
Add a ―Define Status‖ component from the feature selection tab under the Discrete Select Examples node. Then right-
click on the define status node to activate its popup menu and choose the ―Parameters‖ option. In the dialog box that
appears, choose all attributes as input except the attribute class. The ―class‖ attribute is taken as target as shown in Fig.
4. The class attribute has 2 values – ‗A‘ and ‗N‘. ‗A‘ means Affected ( Diabetes has effect on kidney of a patient) and
‗N‘ means ‗Not-Affected‘( Diabetes has no effect on kidney of patient).
Fig 4. Input & output Parameters in Tanagra
Provide Supervised Learning as follows : (a) Add a ―Supervised Learning‖ component from Meta-Spv Learning palette under Define Status node.
(b) Insert the ―C4.5‖ learning algorithm from the Spv-Learning palette. Right-click on it and select execute option.
The results would be displayed in the right frame as shown in Fig. 5 and Fig. 6.
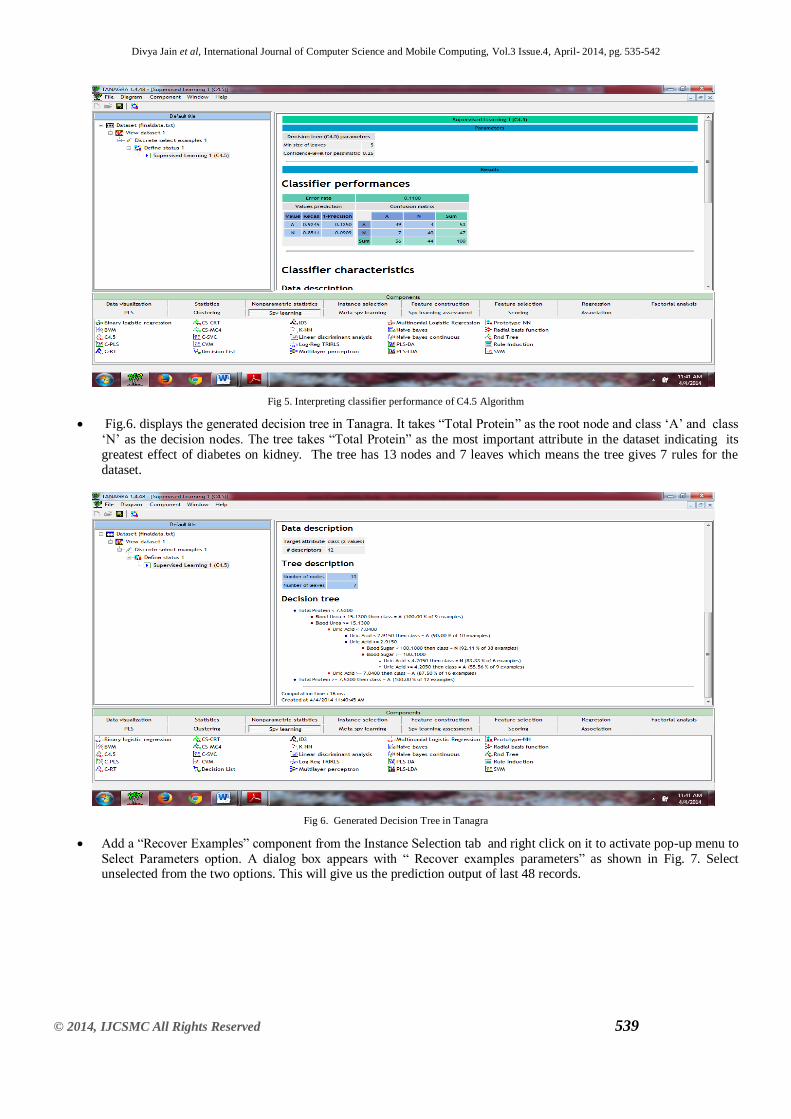
The results in Fig. 5. gives the classifier performance of C4.5 Algorithm in Tanagra. It concludes that the resubstitution
error rate is 11% only. This value is very good for decision tree model. The precision and recall value of each value of
class attribute is also displayed.
Divya Jain et al, International Journal of Computer Science and Mobile Computing, Vol.3 Issue.4, April- 2014, pg. 535-542
© 2014, IJCSMC All Rights Reserved 539
Fig 5. Interpreting classifier performance of C4.5 Algorithm
Fig.6. displays the generated decision tree in Tanagra. It takes ―Total Protein‖ as the root node and class ‗A‘ and class
‗N‘ as the decision nodes. The tree takes ―Total Protein‖ as the most important attribute in the dataset indicating its
greatest effect of diabetes on kidney. The tree has 13 nodes and 7 leaves which means the tree gives 7 rules for the
dataset.
Fig 6. Generated Decision Tree in Tanagra
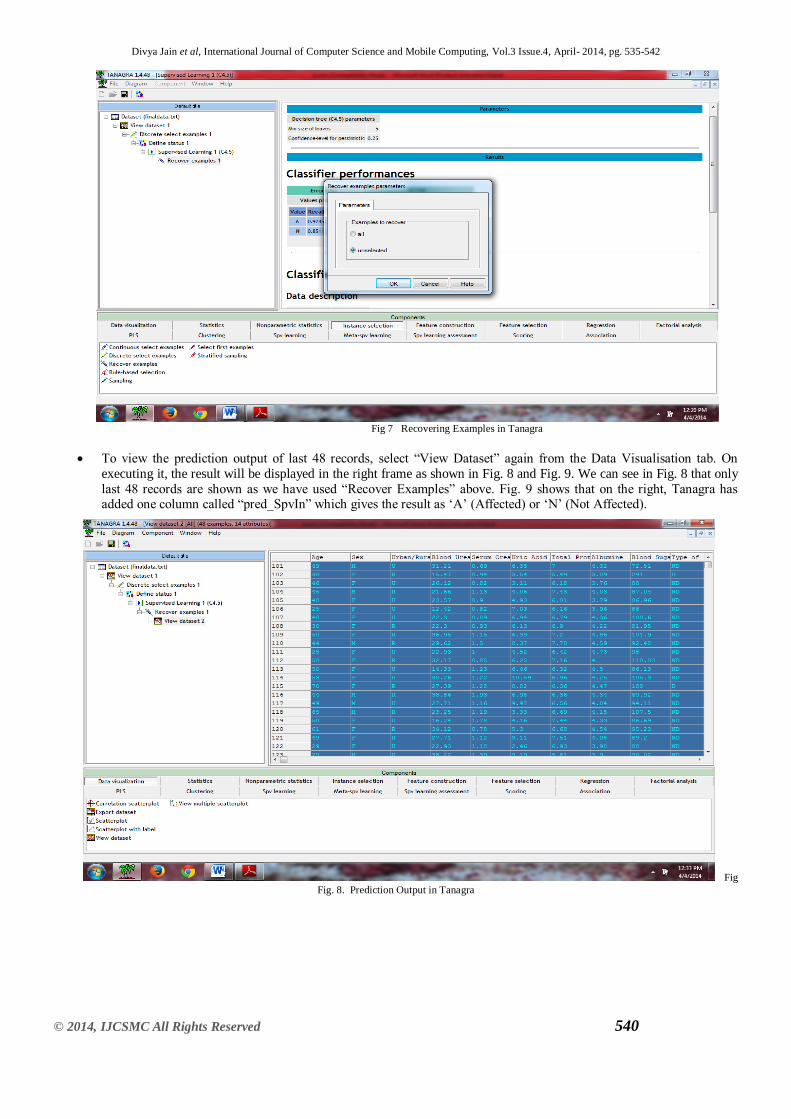
Add a ―Recover Examples‖ component from the Instance Selection tab and right click on it to activate pop-up menu to
Select Parameters option. A dialog box appears with ― Recover examples parameters‖ as shown in Fig. 7. Select unselected from the two options. This will give us the prediction output of last 48 records.
Divya Jain et al, International Journal of Computer Science and Mobile Computing, Vol.3 Issue.4, April- 2014, pg. 535-542
© 2014, IJCSMC All Rights Reserved 540
Fig 7 Recovering Examples in Tanagra
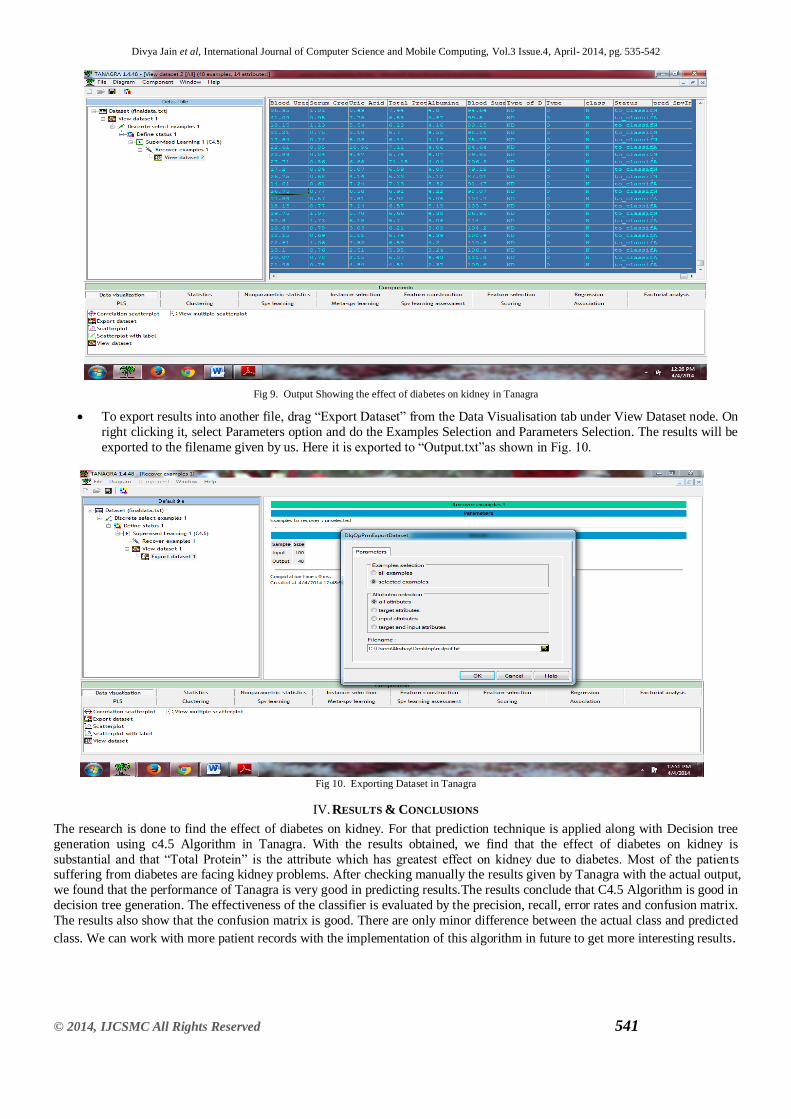
To view the prediction output of last 48 records, select ―View Dataset‖ again from the Data Visualisation tab. On
executing it, the result will be displayed in the right frame as shown in Fig. 8 and Fig. 9. We can see in Fig. 8 that only
last 48 records are shown as we have used ―Recover Examples‖ above. Fig. 9 shows that on the right, Tanagra has added one column called ―pred_SpvIn‖ which gives the result as ‗A‘ (Affected) or ‗N‘ (Not Affected).
Fig
Fig. 8. Prediction Output in Tanagra
Divya Jain et al, International Journal of Computer Science and Mobile Computing, Vol.3 Issue.4, April- 2014, pg. 535-542
© 2014, IJCSMC All Rights Reserved 541
Fig 9. Output Showing the effect of diabetes on kidney in Tanagra
To export results into another file, drag ―Export Dataset‖ from the Data Visualisation tab under View Dataset node. On
right clicking it, select Parameters option and do the Examples Selection and Parameters Selection. The results will be
exported to the filename given by us. Here it is exported to ―Output.txt‖as shown in Fig. 10.
Fig 10. Exporting Dataset in Tanagra
IV. RESULTS & CONCLUSIONS
The research is done to find the effect of diabetes on kidney. For that prediction technique is applied along with Decision tree
generation using c4.5 Algorithm in Tanagra. With the results obtained, we find that the effect of diabetes on kidney is
substantial and that ―Total Protein‖ is the attribute which has greatest effect on kidney due to diabetes. Most of the patien ts suffering from diabetes are facing kidney problems. After checking manually the results given by Tanagra with the actual output,
we found that the performance of Tanagra is very good in predicting results.The results conclude that C4.5 Algorithm is good in
decision tree generation. The effectiveness of the classifier is evaluated by the precision, recall, error rates and confusion matrix.
The results also show that the confusion matrix is good. There are only minor difference between the actual class and predicted
class. We can work with more patient records with the implementation of this algorithm in future to get more interesting results.
Divya Jain et al, International Journal of Computer Science and Mobile Computing, Vol.3 Issue.4, April- 2014, pg. 535-542
© 2014, IJCSMC All Rights Reserved 542
REFERENCES
[1] http://en.wikipedia.org/wiki/Data_mining
[2] http://www.anderson.ucla.edu/faculty/jason.frand/teacher/technologies/palace/datamining.htm
[3] Salim Diwani, ―Overview Applications of Data Mining In Health Care: The Case Study of Arusha Region‖,
International Journal of Computational Engineering Research, Vol 03, Issue, 8, August 2013.
[4] Hian Chye Koh and Gerald Tan, ―Data Mining Applications in Healthcare‖, Journal of Healthcare Information
Management — Vol.19, No.2.
[5] http://www.cs.helsinki.fi/u/ronkaine/tilome/luentomateriaali/TiLoMe-140205.pdf
[6] http://en.wikipedia.org/wiki/Diabetes_mellitus
[7] http://care.diabetesjournals.org/content/34/6/1249.full
[8] http://www.medicalnewstoday.com/info/diabetes/
[9] en.wikipedia.org/wiki/Kidney [10] http://nkdep.nih.gov/learn/are-you-at-risk.shtml
[11] Kalpesh Adhatrao, Aditya Gaykar, Amiraj Dhawan, Rohit Jha and Vipul Honrao,―Predicting Students‘ Performance
Using ID3 and c4.5 Classification Algorithms‖, International Journal of Data Mining & Knowledge Management
Process (IJDKP) Vol.3, No.5, September 2013.
[12] Veronica S. Moertini, ―Towards The Use Of C4.5 Algorithm For Classifying Banking Dataset‖, Integral, Vol 8 No. 2,
October 2003.
[13] http://www.tutorialspoint.com/data_mining/dm_classification_prediction.htm
[14] http://www.cs.helsinki.fi/u/ronkaine/tilome/luentomateriaali/TiLoMe-140205.pdf
[15] Han Jiawei, MichelineKamber, Data Mining: Concepts and Technique. Morgan Kaufmann Publishers, 2000
[16] Ricco RAKOTOMALALA, "TANAGRA: a free software for research and academic purposes", in Proceedings of
EGC'2005, RNTI-E-3, vol. 2, pp.697-702, 2005. [17] Vishal Jain, Gagandeep Singh Narula & Mayank Singh, ―Implementation Of Data Mining In Online Shopping System
Using Tanagra Tool‖, International Journal of Computer Science and Engineering (IJCSE) , ISSN 2278-9960 ,Vol. 2,
Issue 1, Feb 2013, 47-58.
Copyright © 2022 FDOKUMEN