Predicting personality based on smartphone usage - http
55
Predicting personality based on smartphone usage Student details Name: L. van der klei Student number: u258149 THESIS SUBMITTED IN PARTIAL FULFILLMENT OF THE REQUIREMENTS FOR THE DEGREE OF MASTER OF SCIENCE IN DATA SCIENCE & SOCIETY DEPARTMENT OF COGNITIVE SCIENCE & ARTIFICIAL INTELLIGENCE SCHOOL OF HUMANITIES AND DIGITAL SCIENCES TILBURG UNIVERSITY Thesis committee Supervisor: dr. A.T. Hendrickson Second reader: dr. B. Nicenboim Tilburg University School of Humanities & Digital Sciences Department of Cognitive Science & Artificial Intelligence Tilburg, The Netherlands May 2021
-
Upload
khangminh22 -
Category
Documents
-
view
1 -
download
0
Transcript of Predicting personality based on smartphone usage - http

Predicting personality based on smartphone usage
Student details
Name: L. van der klei
Student number: u258149
THESIS SUBMITTED IN PARTIAL FULFILLMENT
OF THE REQUIREMENTS FOR THE DEGREE OF
MASTER OF SCIENCE IN DATA SCIENCE & SOCIETY
DEPARTMENT OF COGNITIVE SCIENCE & ARTIFICIAL INTELLIGENCE
SCHOOL OF HUMANITIES AND DIGITAL SCIENCES
TILBURG UNIVERSITY
Thesis committee
Supervisor: dr. A.T. Hendrickson
Second reader: dr. B. Nicenboim
Tilburg University
School of Humanities & Digital Sciences
Department of Cognitive Science & Artificial Intelligence
Tilburg, The Netherlands
May 2021

2
Preface Since I see that smartphones have so much influence on all my friends and family around me, including
myself. I was interested in the comparison to the online and offline personalities. With the possibility of
using the smartphone data collection I got the opportunity to investigate this topic and to see whether it
is possible to use smartphone data to predict someone’s personality.
I would like to express my appreciation to everyone that helped me during the process of writing my
thesis. Firstly, I would like to thank my supervisor Drew Hendrickson for his guidance during the weekly
meetings along the thesis process and George Aalbers for providing the smartphone usage data
collection. Secondly, my housemates for all the support and encouragements, especially Kirill
Sadovnikov and Charlotte Kerkhof. Thirdly, my parents for listening to some of my frustrations and
helping me to cheer up when I was struggling. Lastly, I want to thank Frederique Romeyn for our daily
walks to take a break and clear my head when needed.

3
Abstract Large amounts of data are being collected everyday with the usage of smartphones. The passive
collection of smartphone leads to new opportunities in research in human behavior, where the active
participation of humans is not required. Prior research has stated the importance of the big five
personalities in several research fields, however little research was done on objectively quantifiable
behavior of individuals. In this research will be investigated to what extent the big five personalities can
be predicted based on smartphone usage. Prior research found several features that could be of influence
on predicting the five personalities. In this research these features are combined with several extracted
features sets when predicting personality. The dataset that has been used for this research contains data
on 221 participants including their personality scores and extracted features from their phone usage in a
period of five months. The features that have been extracted from the raw data set were combinations
of mainly: spatial features, communication application features, features from categorized applications,
and features on notifications, time of smartphone usage and battery percentage. Random forest, logistic
regression and support vector machine models have been tested on the combination of these feature sets.
The best performing machine learning models per personality slightly outperformed their baseline
model. The best performing model for the personalities that could be predicted above baseline was the
random forest model. The best predicted personality in comparison to the baseline was openness. Also,
agreeableness, conscientiousness and neuroticism outperformed their baseline models. Feature
importances were extracted to create more explainability and interpretability in models that were used
for this research. Actual correlations of the important features could not be found in this research.
Keywords: Big five personalities, feature importance, smartphone usage data, classification machine
learning techniques

4
Contents
1. Introduction ..................................................................................................................................... 6
2. Related Work ................................................................................................................................... 8
2.1 The OCEAN-model ................................................................................................................. 8
2.2 Prediction of the big five personalities .................................................................................... 8
2.2.1 Extraversion ..................................................................................................................... 8
2.2.2 Openness ......................................................................................................................... 9
2.2.3 Agreeableness .................................................................................................................. 9
2.2.4 Conscientiousness............................................................................................................ 9
2.2.5 Neuroticism ..................................................................................................................... 9
2.3 Feature extraction .................................................................................................................... 9
2.4 Classification models ............................................................................................................ 10
3. Methods ......................................................................................................................................... 11
4. Experimental Setup ....................................................................................................................... 12
4.1 Feature extraction ........................................................................................................................ 13
4.1.1 First feature set ..................................................................................................................... 13
4.1.2 Second feature set ................................................................................................................. 14
4.1.3 Third feature set .................................................................................................................... 14
4.2 Modeling ..................................................................................................................................... 15
4.2.1 Multiple imputation .............................................................................................................. 15
4.2.2 Feature selection, cross-validation and model fitting ........................................................... 16
4.2.3 Evaluation ............................................................................................................................. 16
4.3 Feature importance ...................................................................................................................... 17
4.1 Software................................................................................................................................. 17
4.1.1 Python ............................................................................................................................ 17
4.4.1 R .................................................................................................................................... 18
5. Results ........................................................................................................................................... 19
5.1 Results of the best models ..................................................................................................... 19
5.1.1 Openness ....................................................................................................................... 19
5.1.2 Agreeableness ................................................................................................................ 21
5.1.3 Neuroticism ................................................................................................................... 22
5.1.4 Conscientiousness.......................................................................................................... 23
5.1.5 Extraversion ................................................................................................................... 24
5.2 Intercorrelations on all extracted features ............................................................................. 26
5.3 Intercorrelations on personalities .......................................................................................... 27
6. Discussion ..................................................................................................................................... 28

5
6.1 Discussion per personality ..................................................................................................... 28
6.1.1 Openness ....................................................................................................................... 28
6.1.2 Agreeableness ................................................................................................................ 28
6.1.3 Neuroticism ................................................................................................................... 28
6.1.4 Conscientiousness.......................................................................................................... 29
6.1.5 Extraversion ................................................................................................................... 29
6.2 Intercorrelations all features .................................................................................................. 29
6.3 Intercorrelations personalities ............................................................................................... 29
6.4 Limitations............................................................................................................................. 30
7. Conclusion ..................................................................................................................................... 31
References ............................................................................................................................................. 32
Appendices and Supplementary Materials ............................................................................................ 37
Appendix A – Categorized applications ............................................................................................ 37
Appendix B - Extracted features ....................................................................................................... 40
Appendix C – Evaluation metrics of all classification models .......................................................... 42
Appendix D – Feature importances per personality .......................................................................... 44
Appendix E - Correlation plots of feature importance personalities ................................................. 45
E.1 Openness ................................................................................................................................. 45
E.2 Agreeableness ......................................................................................................................... 46
E.3 Neuroticism ............................................................................................................................. 48
E.4 Conscientiousness ................................................................................................................... 49
E.5 Extraversion ............................................................................................................................ 51
Appendix F - Correlation plots all features ....................................................................................... 54
F.1 Correlation heat all features ........................................................................................................ 54
F.2 Correlation plots most correlated features................................................................................... 55

6
1. Introduction The world is changing rapidly and smartphones are becoming a large part of human life (Harari, Gosling,
Wang & Campbell, 2015). The features that smartphones have to offer go beyond simply calling and
messaging (Concone, Gaglio, RE & Morana, 2017). With large-scale smartphone usage, large amount
of data is created which could be collected and used for several purposes (Harari et al., 2015). For
example, these data could provide insights that could be used for research in human behavior.
Therefore, these data could be beneficial in predicting the big five personalities (Mollgaard, Lehmann
& Mathiessen, 2017; Harari, Lane, Wang, Crosier, Campbell & Gosling, 2016; Felix, Castro, Rodriguez
& Banos, 2019). Software on smartphone measurement creates opportunities to collect large amounts
of data on mobile media and application usage (Bouwman, de Reuver, Heerschap & Verkasalo, 2013).
It allows for passive collection of data which can be beneficial in predicting personality (Harari, Gosling,
Wang & Campbell, 2015). Collecting data in a passive way means that there is no requirement of active
participation of the participants involved in the data collection and data can be autonomously collected
(Torous & Powell, 2015). In other words, when using passive data on predicting the big five
personalities, taking the big five personality questionnaire is not required anymore. The use of social
media applications could provide data on communication and social behavior (Settanni, Azucar &
Marengo, 2018). Application usage and smartphone usage in general could show patterns of behavior
of individuals (Stalch, 2020). Location data derived from smartphones by using GPS space-time stamps
could provide insights into the mobility of individuals (Ai, Liu & Zhao, 2019; Barbosa et al., 2018).
Also, day- and night-time activity can be distinguished by analyzing smartphone usage data (Stalch et
al., 2020). This thesis has researched whether the big five personalities could be predicted based on
smartphone usage. Therefore, the following research question is formulated:
“𝑇𝑜 𝑤ℎ𝑎𝑡 𝑒𝑥𝑡𝑒𝑛𝑡 𝑐𝑎𝑛 𝑡ℎ𝑒 𝑏𝑖𝑔 𝑓𝑖𝑣𝑒 𝑝𝑒𝑟𝑠𝑜𝑛𝑎𝑙𝑖𝑡𝑖𝑒𝑠 𝑏𝑒 𝑝𝑟𝑒𝑑𝑖𝑐𝑡𝑒𝑑 𝑏𝑎𝑠𝑒𝑑 𝑜𝑛 𝑠𝑚𝑎𝑟𝑡𝑝ℎ𝑜𝑛𝑒 𝑢𝑠𝑎𝑔𝑒? ”
Over the past few years, a lot of research was conducted on the behavior of individuals and the relation
to the big five personality traits. However, little research has been done on objectively quantifiable
behavior of individuals (Stachl et al., 2020). Only a few studies have been conducted on predicting
personality based on smartphone usage, specified on the big five personality traits (Stalch et al., 2020;
Ai et al., 2019; Mønsted, Mollgaard, & Mathiesen, 2018; Peltonen et al., 2020). However, all studies
claim for limitation in generalizability, due to small sample sets, lack of cross-validation and the
participants not being randomly chosen. Therefore, these studies differ in success of prediction of the
five independent personalities and their results might be hard to compare. Previous studies on this topic
have been conducted on students from China (Ai, Liu & Zhao, 2019), Germany (Stalch et al., 2020) and
Denmark (Mønsted, Mollgaard, & Mathiesen, 2018), but also on people from different age categories
and countries (Peltonen et al., 2020). Samples from different countries could lead to other characteristics.
Cultural differences could influence the prediction because of different behavior found in phone usage
(Harari, 2020). This kind of research, in predicting personality traits based on smartphone usage, has
not been done among students in The Netherlands before, so there is still a novelty.
The big five personalities, also known as the OCEAN model, is largely known among researchers in
psychological science (De Raad, 2000). This factor analysis shows five relatively independent
dimensions that include: Openness, Conscientiousness, Extraversion, Agreeableness, and Neuroticism
(McCrae & John, 1992). These personality trait dimensions show differences in the way individuals
think, feel and behave (Wang W., Harari, Wang R., Müller, Masaba & Campbell, 2018).
Insights in human personality are widely used in different kind of fields. Personality could help to
understand the behavior of people in political environments (Gerber, Huber, Doherty & Dowling, 2011).
Knowledge of the personalities of certain people could provide insights in people’s concern of the
environment (Milfont & Sibley, 2012). It could provide indications of academic performance (O’Connor
& Paunonen, 2007). Also, knowledge of personality could be beneficial for job performance, for
7
example in hiring processes (Moy & Lam, 2004; Stoughton, Thompson & Meade, 2013), where the
personality scores might say something about the decision making of people (Byrne, Silasi-Mansat &
Worthy, 2015) or work engagement (Zaidi N. R., Wajid, Zaidi F. B., Zaidi G. B. & Zaidi M. T., 2013).
Machine learning techniques can be used to predict personality. However, machine learning models are
often seen as black-box models (Rudin, 2019; Pargent & Albert-vond der Gönna, 2018; Yarkoni &
Westfall, 2017), which means that there are no insights in how the output is conducted from the model.
These models can be more explainable and interpretable by creating insights into feature importance
(Fisher, Rudin & Dominici, 2018; Gregorutti, Michel & Saint-Pierre, 2015), which could be beneficial
in using the best performing models on new data collections in the future.
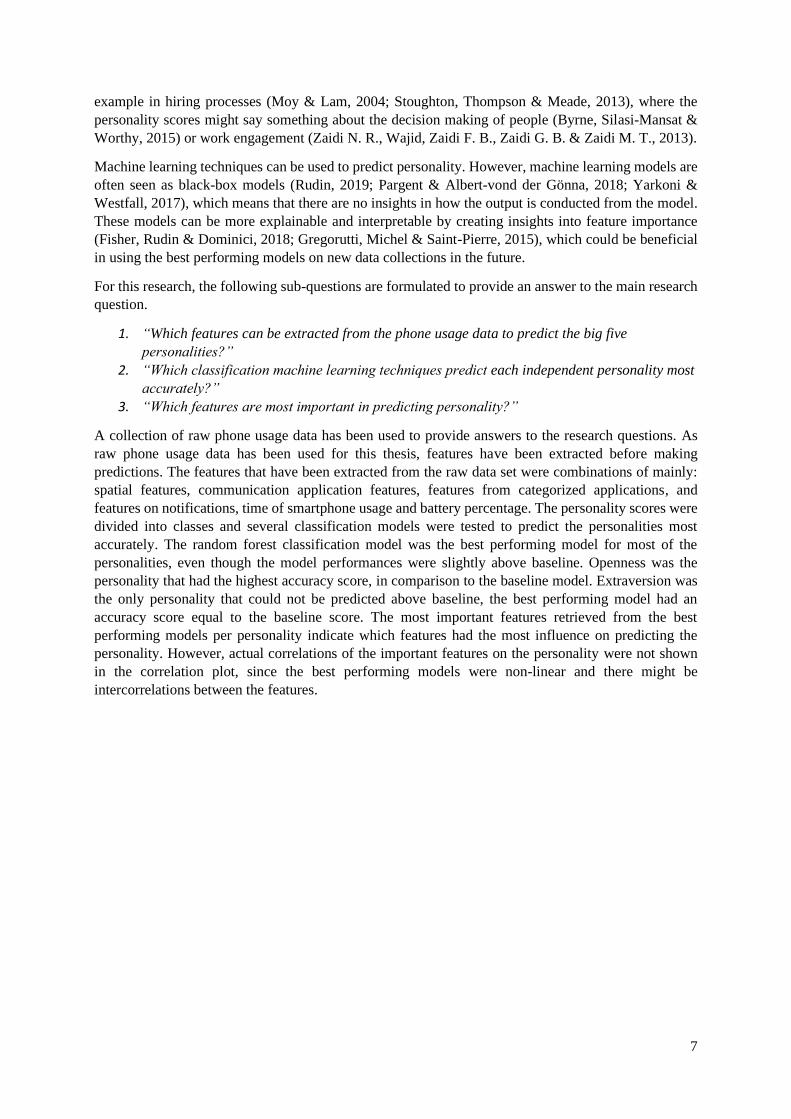
For this research, the following sub-questions are formulated to provide an answer to the main research
question.
1. “Which features can be extracted from the phone usage data to predict the big five
personalities?”
2. “Which classification machine learning techniques predict each independent personality most
accurately?”
3. “Which features are most important in predicting personality?”
A collection of raw phone usage data has been used to provide answers to the research questions. As
raw phone usage data has been used for this thesis, features have been extracted before making
predictions. The features that have been extracted from the raw data set were combinations of mainly:
spatial features, communication application features, features from categorized applications, and
features on notifications, time of smartphone usage and battery percentage. The personality scores were
divided into classes and several classification models were tested to predict the personalities most
accurately. The random forest classification model was the best performing model for most of the
personalities, even though the model performances were slightly above baseline. Openness was the
personality that had the highest accuracy score, in comparison to the baseline model. Extraversion was
the only personality that could not be predicted above baseline, the best performing model had an
accuracy score equal to the baseline score. The most important features retrieved from the best
performing models per personality indicate which features had the most influence on predicting the
personality. However, actual correlations of the important features on the personality were not shown
in the correlation plot, since the best performing models were non-linear and there might be
intercorrelations between the features.

8
2. Related Work In this section, a few relevant studies that are similar to this research have been highlighted. In previous
research, some studies have been focusing on predicting personality traits in relation to smartphone
usage in general (Stalch et al., 2020; Mønsted et al., 2018; Peltonen et al., 2020). A few studies zoomed
in on predicting personality based on specific applications usage, for example, YouTube (Klobas,
McGill, Moghavvemi & Paramanathan, 2018), Facebook (Ross, Orr, Sisic, Arseneault, Simmering &
Orr, 2009), and WhatsApp (Montag et al., 2015). There have also been studies focusing on response
behavior of individuals on notifications to predict personality (Mehrotra, Pejovic, Vermeulen, Hendley
& Musolesi, 2016). Other studies used spatial information to predict personality (Alessandretti,
Lehmann & Baronchelli, 2018; Ai et al., 2019; Barbosa et al., 2020). The main results of the studies will
be compared per personality.
2.1 The OCEAN-model Before diving into the results of previous studies, the big five personalities will be defined. Openness or
Open-Mindedness can be described as people that tend to long for variety, new (intellectual)
experiences, have a creative imagination, and a curious attitude for new things. Conscientious people
are known to be self-disciplined, focused on achievements, organized, responsible, productive, and
methodical. Facets that are typical for Agreeableness are compassion, respectfulness, trustworthiness,
kindness, and friendliness. Extraversion can be described by facets of sociability, assertiveness, and
energy. Neuroticism, or in some articles referred to as Emotional Stability, could be described as
experiencing sadness, embarrassment, distrust, (social) anxiety, and spending time alone (McCrae &
John, 1992; Soto & John, 2017; Peltonen et al., 2020).
These five personalities are claimed to be independent of one another (McCrae & John, 1992). In other
words, score high on one of the five personalities, does not exclude a high score on the other four
personalities. However, other research shows that are some intercorrelations between the five
personalities. In a meta-analysis of the big five intercorrelations by van der Linden, te Nijenhuis &
Bakker (2010) was shown that between conscientiousness and neuroticism was a slightly negative
correlation. Between extraversion and neuroticism and agreeableness and neuroticism there was also a
small negative correlation shown, and conscientiousness and agreeableness were positively correlated.
In the study by Mønsted et al. (2018) on predicting personality based on smartphone usage an
intercorrelation matrix of the personalities was conducted. This matrix showed that extraversion was the
most correlated to the other personalities, the highest correlations were between extraversion and
neuroticism and extraversion and agreeableness.
2.2 Prediction of the big five personalities In this paragraph, the results of predictions on the five personalities will be outlined on each personality
individually. The five personalities are sorted by the success of the prediction of the findings in the
literature.
2.2.1 Extraversion
The most successfully predicted personality trait, in the majority of the studies on predicting personality
based on phone usage, is extraversion (Mønsted et al., 2018; Alessandretti et al., 2018; Harari et al.,
2019; Peltonen et al., 2020; Ai et al., 2019). In one of the studies, this personality was the only one
predicted significantly better than the null model (Mønsted et al., 2018). This is because these studies
had their focus mainly on communication behavior which is positively related to the frequency of
communication via calling, texting, and the use of communication applications, for example WhatsApp
(Montag et al., 2015). Mehrotra et al. (2016) showed in their research that the viewing time and decision
time on smartphone notifications are also of significant influence for this personality. Chittaranjan et al.
(2013) found that extraversion was found positively correlated with office-related applications, but
negatively correlated with gaming, web-browsing, and camera usage. Zooming in on spatial data,
extroverted people are expected to have a higher variety in the places they visit. This is expected because

9
they are characterized by exploring different places, and seeking exciting, novel, and risk-taking
activities (Ai et al., 2019; Alessandretti et al., 2018).
2.2.2 Openness
Stalch et al. (2020) found openness as the most successfully predictable personality in their study. These
predictions were also related to communication and social behavior, but also to camera usage and the
usage of music applications. The personality trait was negatively related to the use of sports applications.
Montag et al. (2015) could not show significant results in WhatsApp usage and openness. Alessandretti
et al. (2018) and Chorley et al. (2015) showed a correlation of openness with long-distance movements
and visiting faraway places, and these individuals would have a tendency of changing their routine over
time. However, the results of the study of Ai et al. (2019) did not show any spatial correlation to
openness.
2.2.3 Agreeableness
In the study by Peltonen et al. (2020), agreeableness was positively correlated to communication
applications. Klobas et al. (2018) showed in their results that the personality trait agreeableness was
correlated with less use of YouTube. The results of the study of Ai et al. (2019) showed that people who
score highly on agreeableness have a larger range of movement. It is expected that this is because these
people are more likely to go out for social activities. Montag et al. (2015) did not succeed in showing
significant results in predicting this personality trait, and also Stalch et al. (2020) did not succeed in
predicting agreeableness.
2.2.4 Conscientiousness
The most important variables found by Stalch et al. (2020), when successfully predicting
conscientiousness, were mainly in the phone activity, the frequency of unique applications used and
there was a correlation between the battery level and the personality. Conscientious people tend to use
their phones the most out of all personalities during the early and late phases of the day. Research by
Peltonen et al. (2020) showed a correlation between the conscientiousness personality trait and the use
of casino games. Montag et al. (2015) showed an inverse correlation with the length of daily WhatsApp
usage and conscientiousness. Klobas et al. (2018) showed that people with this personality tend to make
less use of the YouTube application. Viewing time when receiving notifications on a smartphone also
has a significant influence on conscientiousness, showed the results of the study by Mehrotra et al.
(2016). Zooming in on spatial data, conscientious people are expected to visit places at regular times
and not visit many different places, as their personality indicates that these individuals prefer regular
lifestyles (Ai et al., 2019).
2.2.5 Neuroticism
Just like conscientiousness, the use of casino games positively related to neuroticism, but neuroticism
negatively related to communication applications in the study of Peltonen et al. (2020). However,
Montag et al. (2015) showed a positive correlation between neuroticism and daily WhatsApp usage.
Also, the usage of social media YouTube was positively correlated with this personality trait, which was
shown in the study of Klobas et al. (2018). The viewing time and decision time of notifications are of
significant influence in predicting the personality trait (Mehrotra et al., 2016). It is expected that people
with this personality would not move as much as people with one of the other personalities. People with
neuroticism would lack social competence, like to spend time alone, and may have social anxiety (Ai et
al., 2019). Although, Alessandretti et al. (2018) found that neuroticism correlates with the tendency to
change routines over time. Stalch et al. (2020) did not succeed in predicting this personality.
2.3 Feature extraction There are differences in the results of these researches mentioned above, but also similarities were found.
This was, for example, the case for openness where Alessandretti et al. (2018) and Chorley et al. (2015)
found a correlation between long-distance movements and visiting far places on the personality, but Ai
10
et al. (2019) did not find any correlations between spatial features and the personality. As mentioned,
the results of these studies could not be generalized, which could explain the differences in results.
However, the results provide an indication of the features that could be of influence when predicting
personality, which was useful in feature extraction. For example, there has not been done research before
on the combination of spatial features and communication features, so this will be a novelty. In previous
research, the main focus was on specific features, while in this research several features are combined
to predict personality based on the findings above.
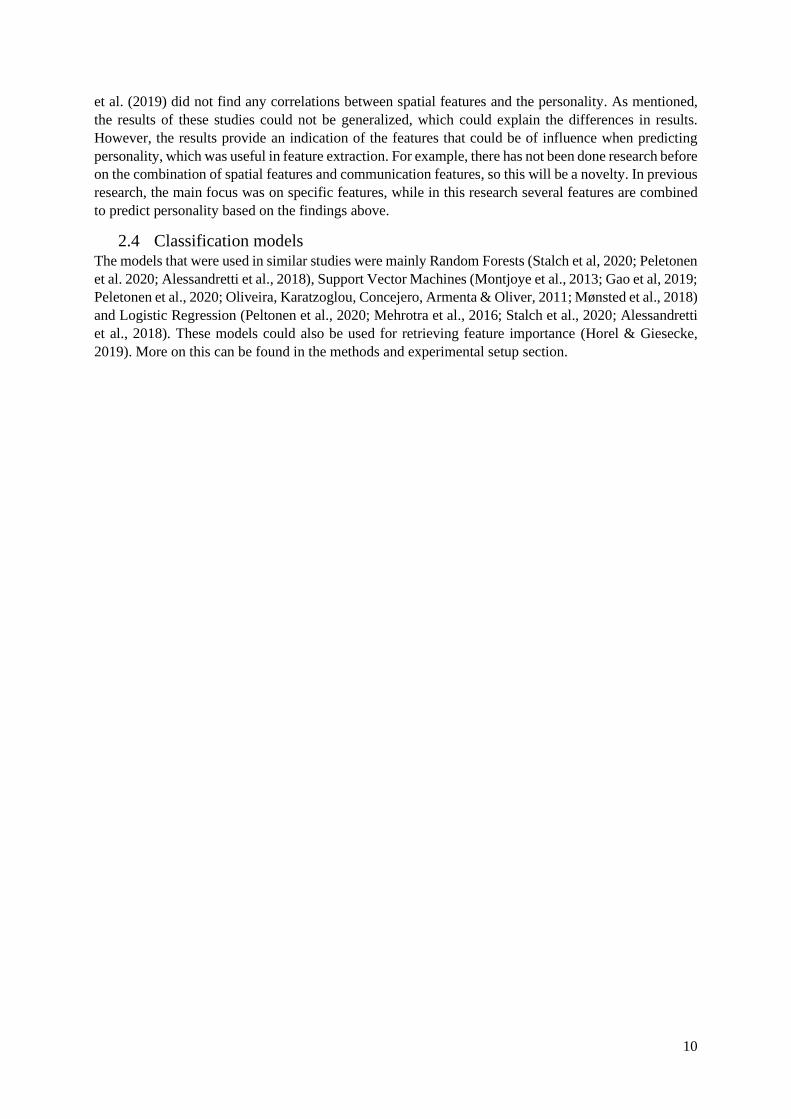
2.4 Classification models The models that were used in similar studies were mainly Random Forests (Stalch et al, 2020; Peletonen
et al. 2020; Alessandretti et al., 2018), Support Vector Machines (Montjoye et al., 2013; Gao et al, 2019;
Peletonen et al., 2020; Oliveira, Karatzoglou, Concejero, Armenta & Oliver, 2011; Mønsted et al., 2018)
and Logistic Regression (Peltonen et al., 2020; Mehrotra et al., 2016; Stalch et al., 2020; Alessandretti
et al., 2018). These models could also be used for retrieving feature importance (Horel & Giesecke,
2019). More on this can be found in the methods and experimental setup section.

11
3. Methods There were multiple feature sets extracted during the research process. Along this research process, the
three sub-questions have been answered using several methods. In total three feature sets have been
extracted from the raw data. Therefore, the research process has been repeated three times to aim for
better results when adding new features when repeating the research process. Figure 1 shows a flow
chart of the application of the methods step-by-step.
First, features have been extracted from the raw smartphone usage data collection. On these extracted
features, a feature selection was applied based on the model that was fitted in the following step. Leave-
one-out cross-validation was used to split the data and to prevent the models from overfitting. Then three
classification machine learning models were fitted to the selected features. The predictions were
retrieved from the models and the evaluation metrics were computed to evaluate the performance of the
models. Together with the predictions, the feature importances were retrieved from the models which
would indicate which features would have the most influence on the predictions of the prediction model
per personality. The information on the feature importance was used to visualize correlations of the
important features to the personalities.
Fig. 1. Flow chart of the research process
Three feature sets were extracted in total to improve the performance of the model and get higher scores
on the evaluation metrics computed from the predictions. The second feature set was added to the results
of the modeling process applied on the first feature set. In other words, the features extracted in the
second feature set were added to the selection of the first feature set and then the modeling process was
repeated on the newly created combination of the feature sets. The third feature set was added to the
selection of the first and second feature set and the modeling process was repeated again.
Not all features were complete in the feature sets. In some part of the data collection the longitude and
latitude coordinates were missing for some of the participants. To counter this problem, multiple
imputation has been applied. The modeling process has been applied on the complete feature sets and
the imputed feature set to see if multiple imputation would improve the performance of the models.
The five personalities were modeled individually since these five personalities are independent of one
another. Three different models were fitted to the combined feature sets with imputations and with only
the complete instances. In total 90 models were tested to find the model with the highest score per
personality.

12
4. Experimental Setup The dataset, that has been used to answer the research questions, exists of a combination of multiple raw
datasets on questionnaire data and phone usage data. The data has been collected from students from
Tilburg University in the period from February 2020 till the end of May 2020. In total 274 participants
were involved in this data collection. The data consists of two parts, the self-report, which the
participants had to fill out before and during the data collection, and the phone usage data that has been
tracked on the background of the participants. Not all data has been collected on all participants, and the
number of days that the data has been collected is not equal for all participants. For 221 participants
both the self-report data and the phone usage data have been collected for at least seven days. This is
the selection of the raw data collection that is used in this research. The self-report dataset consists of
answers to daily surveys and the onboarding survey that contains, among other information, the answers
to the big five personalities questionnaire. In the collection of the phone usage data, information has
been collected on application usage, time, and date of the usage, location data, notification data, and the
battery percentage has been collected.
The shorter version of the big five personalities by Soto & John (2017) was questioned in the self-report,
and the responses were used to compute the personality score. In total, each personality score has a
maximum score of 30 points. For every participant, the five independent personality scores were derived
by computing the proportion of their score to the maximum score possible, which resulted in a score
between 0 and 1 for every personality, see formula 1.
(1)
As mentioned by Mønsted et al. (2018), in this case predicting personality would make more sense with
classification models than with regression models. The reason for this is that there is no precise
interpretation difference in a continuous score for personality (e.g., a difference of 0.04 does not say
much about the accuracy of the prediction). Each personality is divided into three classes: 0, 1, and 2
which stands for “low”, “medium” and “high”. The classes have been computed relative to the range of
the personalities, see table 1. This means that for each personality the range of all scores has been
computed and divided by three so that all personalities would have three classes, see formula 2.
(2)
Table 1. Range of personality score per personality
Personality Range
Openness 0.4 – 1.0
Conscientiousness 0.23 – 0.97
Extraversion 0.2 – 0.97
Agreeableness 0.37 – 0.97
Neuroticism 0.2 – 0.97
Even though the computation of the classes is relative to the range of the classes, the classes are still
imbalanced which means the frequency of the classes per personality is not equal (see figure 2).

13
Fig. 2. A figure of the distribution of classes per personality
4.1 Feature extraction For some participants, the data has not been collected during the whole period the data collection had
taken place. The range of collection is between 7 and 148 days, as can be seen in the distribution
presented in figure 3. To counter this problem, the majority of the features that have been extracted from
the phone usage data collection were averaged per participant per day. Below the three feature sets will
be further explained.
Fig. 3. Distribution of the number of days of data collection
4.1.1 First feature set
As mentioned in the method section, along the way of the modeling process, new feature sets were
extracted from the raw data collection. The first feature set contains spatial features and the frequency
of the use of communication applications per participant per day. The combination of spatial features
and features on application usage on predicting personality has not been researched before, but have
found successful separately in predicting personalities. Therefore, these are both included in the first
extracted feature set.

14
Previous studies have shown that communication applications could significantly influence the
prediction of personality, for instance, social media applications as YouTube (Klobas et al., 2018),
Facebook (Ross et al., 2009), and WhatApp (Montag et al., 2015). In this research, the mean frequency
of the use of communication applications per day was extracted. The communication applications that
were used are WhatsApp, Facebook, Instagram, Snapchat, YouTube, Twitter, LinkedIn, text message,
and phone.
The spatial features were extracted based on the longitude and latitude coordinates in the raw datasets.
Since these data are privacy sensitive the features were extracted in a way that the actual location was
not traceable. The distance was computed between the coordinates, which was used to extract the
frequency of movements between places per participant per day. Also, the mean distance that
participants traveled per day was extracted, and the maximum radius that the participant traveled during
the data collection was extracted. The fourth spatial feature that was extracted was the number of unique
locations that the participants visited per day. Which resulted in thirteen features for the first feature set.
4.1.2 Second feature set
For the second feature set, all applications not related to communication have been categorized and
features on the frequency of use per participant per day have been extracted. There are a large number
of different applications which are used for the same purpose. Since the categorization of the Google
Play store was not specific enough for the purpose of all the applications, the categorization has been
done manually.
There were more than 1000 unique applications used by all the participants. The applications with a
frequency of use of less than 300 were filtered out of the categorization. And only the applications that
served the purpose of the selected categories for this research were included in the categorization.
following categories had been defined for the second feature extraction: transportation, music, video
streaming, weather, shopping, photos and videos, dating, browsing, email, planning, food ordering, and
news. The overview of the specific application names and the category they belong to can be found in
appendix A. The category for games was also considered since this could be of influence as well
according to Peltonen et al. (2020). However, since there is a large number of games and they might
differ in purpose, this category was left out of the feature extraction. This was also the case for office-
related applications, which could be of influence according to Chittaranjan et al. (2013) and sport related
applications (Stalch et al., 2020).
4.1.3 Third feature set
The third feature set consists of features on notifications, battery percentage, unique application usage,
and day- and evening-time activity. The selection was based on the previous studies mentioned in the
related work section. The number of unique notifications per day per participant was extracted along
with the mean priority of all the notifications per day. Also, the number of unique applications that the
participants use per day was extracted. To see if the time of phone usage has an influence on personality,
the phone usage was split into the morning (before noon) and the evening (after noon) and extracted as
features per participant per day. Lastly, the mean battery percentage per participant per day was
extracted.
The overview of all extracted features and the detailed description is included in appendix B.
15
4.2 Modeling In this section the modeling process is described in detail.
4.2.1 Multiple imputation
For 45 out of 221 participants, which is around 20% of the dataset, less than seven days of spatial
information was collected or none at all. The easiest way to deal with this problem is to delete the
instances with missing data and to only use the complete data. However, this could lead to bias results
and inefficiency (Chhabra, Vashisht & Ranjan, 2017). Also, the dataset with the extracted features is
already small, using only the complete cases would make it even smaller and it could influence the
performance of the prediction models for the personalities.
There are several ways to deal with missing values, for example computing the mean, the mode, or
applying regression models (Chhabra, Vashisht & Ranjan, 2017). However, these methods could lead
to biased estimation and inference (Deng, Chang, Ido & Long, 2016). A better way of imputing values
to replace the missing values is multiple imputation (MI) because it produces unbiased parameter
estimates and predictions. It produces standard deviations that are a little larger than the observed data
which could be accounted for additional uncertainty that is introduced by having the missing data (Slade
& Naylor, 2020). When applying MI, each missing datapoint will be replaced with a set of M plausible
estimates. The downside of MI could be that it is a computationally expensive method (Huque, Carlin,
Simpson & Lee, 2018), but since the dataset with the extracted features is not very large the application
of MI is not that computationally expensive.
The MI model, that has been applied to the dataset with the extracted features, is the mice forest function
in Python, which is similar to the mice package in R. This type of multiple imputation uses random
forest techniques to impute new data where the missing values are (Chhabra et al., 2017). The following
parameters were defined when applying the mice forest function: 20 datasets were imputed and the
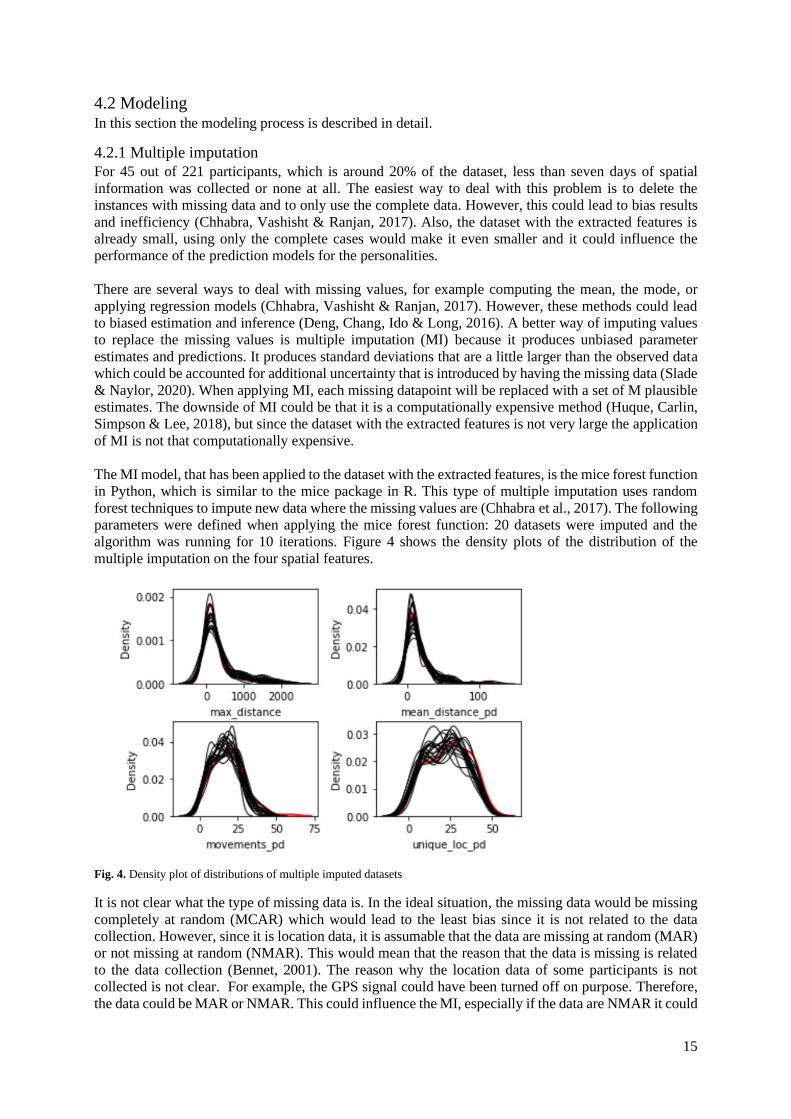
algorithm was running for 10 iterations. Figure 4 shows the density plots of the distribution of the
multiple imputation on the four spatial features.
Fig. 4. Density plot of distributions of multiple imputed datasets
It is not clear what the type of missing data is. In the ideal situation, the missing data would be missing
completely at random (MCAR) which would lead to the least bias since it is not related to the data
collection. However, since it is location data, it is assumable that the data are missing at random (MAR)
or not missing at random (NMAR). This would mean that the reason that the data is missing is related
to the data collection (Bennet, 2001). The reason why the location data of some participants is not
collected is not clear. For example, the GPS signal could have been turned off on purpose. Therefore,
the data could be MAR or NMAR. This could influence the MI, especially if the data are NMAR it could

16
still lead to bias parameter estimates (Madley-Dowd, Hughes, Tilling & Heron, 2019). Due to this risk,
the classification models were trained on both the complete data and the data with imputations. The
predictions and the importances of the features were only retrieved from complete cases. So, the
evaluation metrics of the models were only computed on the complete cases. The reason for this is
because the imputed data should not have too much influence on the predictions and feature importance
since this is not the true data.
4.2.2 Feature selection, cross-validation and model fitting
For this thesis three, classification machine learning models were selected; the non-linear model
Random Forest (RF), and the linear models Logistic Regression (LR) and Support Vector machines
(SVM) using the linear kernel. To get higher performance on the classification models, feature selection
was applied. These feature selection models would result in a selection of features that have the most
influence on predicting personality, which makes the other features redundant. The feature selection has
been applied before fitting the models. There were three types of feature selections dependent on the
three different classification models.
The three classification models that were selected for this research were based on results from previous
studies (see the related work section). Since one of the main goals of this research is to create explainable
and interpretable machine learning models, the models were also selected based on the possibility of
retrieving feature importances from the models. For the models, the default parameters of the python
functions have been used since it was too computationally expensive to run grid search on 90 models.
Since the values in the feature sets are not on the same scale, normalization was applied to change the
numeric values to a common scale (Gonzalez-Abril, Velasco, Angulo & Ortega, 2013). The normalized
feature sets were only required when fitting the SVM model (Hearst, Dumais, Osuna, Platt & Scholkopf,
1998). This was not necessary for the RF and the LR models.
When fitting the models, leave-one-out (LOO) cross-validation was used to estimate the performance
of the classification models. Cross-validation would increase the accuracy reliability of the predictions.
LOO is a special kind of k-fold cross-validation, in which the number of folds is equal the number of
observations, in this case, 221 or 175. This type of cross-validation is specially designed for small
datasets to reduce the chance of overfitting, that is the reason why this type of cross-validations was
selected (Wong, 2015).
4.2.3 Evaluation
To evaluate the performance of the model, three metrics were computed using the predictions and the
true values from the models; the accuracy rate, a poor classification ratio, and the F1-score. The accuracy
rate was measured by computing the proportion of the correctly predicted classes from the total predicted
classes, see formula 3.
(3)
The personality scores were labeled in three classes, which means that the difference between the lowest
and the highest class is higher than with the medium class. In other words, predicting the low class when
the true label is high or the opposite is worse than predicting the medium class. Therefore, another metric
is computed to evaluate this type of occurrence specifically. The metric would show the proportion of
the poor classification compared to the total of misclassified target values, see formula 4.
(4)
Also, the F1-score is computed when evaluating the models. The classes of the personalities are
imbalanced, which means that they are not equally divided. Therefore, the F1-score is also computed as
17
a reference for the accuracy score, see formula 5. This F1-score is specially designed to deal with
imbalanced classes (Scikit-learn developers, 2020a).
(5)
4.3 Feature importance For all models, the importance of the features was retrieved from the models along with the predictions.
Feature importance would give an indication on which features from the feature selection would have
the most influence on predicting the target value (Horel & Giesecke, 2019), in this case, the personality
class. For RF models the feature importance is measured using the prediction accuracy. It measures the
decrease in prediction accuracy when a covariate is permuted (Fisher, Rudin & Dominici, 2018;
Breiman, 2001). For LR and SVM models, the feature importance is measured by the coefficients. For
the LR model, the coefficients for the target feature would indicate the effect of one unit change in the
target feature. This coefficient could be either positive or negative. If it is negative, it would indicate
that the event is less likely at the predictor level than at the reference level (Menard, 200). Coefficients
of the SVM model are weights that represent the vector coordinates that are orthogonal to the hyperplane
which separates the classes as best as possible to get predictions. These coefficients were obtained to
measure the feature importance of the features that have been fitted to the SVM model (Guenther &
Schonlau, 2016). There are different kernels considered for this research that can be used for SVM
models, the linear kernel, and the non-linear kernels the polynomial function (RBF), and radial basis
function (Patle & Chouchan, 2013). However, the coefficients can only be retrieved from the SVM
model with the linear kernel. In the RBF and polynomial kernels, the separating plane exists in another
space, which means that in the model there is a transformation of the original space and therefore the
coefficients are not directly related to the features that are inputted in the SVM model (Wu, Tang & Wu,
2012). Therefore, only the linear kernel of the SVM model is applied in this research.
The feature importances retrieved from the models do not give an indication of how they are actually
correlated to the target value. Therefore, the most important features from the best performing models
per personality were plotted separately with the target value, the personality scores.
4.1 Software The software that has been used was the programming language Python, mainly for feature extraction
and modeling. This language was coded in Jupyter-lab. Visualizations on correlations and other figures
were mainly coded in R, using the Rstudio software.
4.1.1 Python
The feature extraction, cross-validation, and the models were coded in Python, version 3.7.8 via Jupyter-
lab. The random state of 2407 was added in certain functions if necessary, to make the research
replicable. For the feature extraction the “numpy” (Python Software Foundation, 2021a), “pandas”
(Python Software Foundation, 2021b), and “math” (Python Software Foundation, 2021c) packages were
used. The “groupby” function from the pandas package was especially important for feature extraction
to compute the mean per participant per day, to overcome the imbalanced number of days of collection
from the participants (Pandas, 2021). From the math package the functions “radians”, “cos”, “sin”,
“asin”, and “sqrt” were imported to compute the distance for the extraction of the spatial features (Python
Software Foundation, 2021c).
For the MI of the missing values of the spatial features, the package “miceforest” was loaded, and the
functions “MulitpleImputedKernel”, “mice”, and “complete_data” were applied to run the multiple
imputations on the datasets. The plot functions from this package were used to visualize the performance
of the MI (Wilson, 2021).
18
For the feature selection, cross-validation, model fitting, and evaluation the functions were imported
from the “sklearn” package. The functions imported for feature selection were “SelectFromModel”,
“LinearSVC”, “ExtraTreesClassifier”, and “LogisticRegression”. For cross-validation, the function
“LeaveOneOut” was imported. The functions that were used to fit the three different models were
“RandomForestClassifier”, “LogisticRegression” and “svm”. When evaluating the model metrics
“f1_score”, and “accuracy_score” were imported (Scikit-learn developers, 2020b).
The feature importance from the models was extracted from the Sklearn package using the
“feature_importances_” function for the RF models (Scikit-learn developers, 2020c) and the “coef_”
function for the LR and SVM models. The “Seaborn” (Python Software Foundation, 2021d) and
“Matplotlib” (Python Software Foundation, 2021e) packages were used to visualize the results of the
feature importance from the models.
4.1.4 R
R was the programming language that was mainly used for creating correlation plots or bar plots to
visualize the results of this research. For visualizing the “ggplot2” package was used (tidyverse, 2021a),
the “geom_jitter”, “geom_point”, and “geom_bar” plots were mainly used from this package.
Adjustments in cleaning the data before visualization were made using the packages “dplyr” (tidyverse,
2021b), and “caret” (RDocumentation, 2021).

19
5 Results In this section the results of all models are presented, including correlation plots.
5.1 Results of the best models In total 90 models were fitted on the several combinations of feature sets, the scores of all evaluation
metrics on the models are shown in appendix C and all feature importances are shown in appendix D.
Table 2 shows the accuracy score of the best performing models per personality in comparison to the
baseline accuracy scores. The best performing models were chosen for data with imputations and the
complete data. The highest scoring model was on predicting the personality extraversion. However, this
score did not exceed the score of the baseline model for this personality. The best performing models
on the other personalities show a higher accuracy score than the baseline models. Except for the best
scoring model on the conscientiousness personality with imputations, the accuracy score was below
baseline. In most cases, the RF model shows the highest accuracy and is marked as the best performing
model. This could indicate that there is a non-linear relationship of the features to the personalities since
the RF model is a non-linear model and the SVM and LR models are linear models. Below the results
per personality are outlined, sorted by performance.
Table 2. Accuracy scores of best performing models per personality
Personality Dataset Baseline Results Difference Model
Openness Complete 0.46 0.55 0.09 RF
Imputed 0.47 0.51 0.04 RF, LR and SVM
Conscientiousness Complete 0.5 0.55 0.05 RF
Imputed 0.52 0.5 -0.02 RF, LR and SVM
Extraversion Complete 0.57 0.57 0.00 RF and SVM
Imputed 0.6 0.6 0.00 SVM
Agreeableness Complete 0.5 0.56 0.06 RF
Imputed 0.52 0.54 0.02 RF
Neuroticism Complete 0.39 0.42 0.03 RF
Imputed 0.4 0.46 0.06 RF
5.1.4 Openness
The personality with the highest accuracy score compared to the baseline model is openness. The results
are from the RF model fitted on the complete data, 175 instances, with the selection of the most
important features from all three feature sets. The accuracy score of this model was 9% higher than
baseline. From the misclassifications, only 8% were badly classified. The F1-score was used as a
reference to check whether the imbalanced classes would influence the scores (Scikit-learn developers,
2020a). The result was 0.52 which is close to the accuracy score of the model and indicates that the
imbalanced classes did have a major influence on the performance of the model. In figure 5 the most
important features of this model are shown.

20
Fig. 5. Most important feature for the best performing model for openness (sorted by importance)
The frequency of use of YouTube is the most important feature in the best performing model for
openness. Since the retrieved importances from the model do not indicate the actual relationship of the
feature with the personality class, the most important features are plotted against the discrete class labels
of the personality to visualize correlations. Figure 6 shows the relationship between openness and the
frequency of use of the YouTube application. The correlation plot does not show a correlation between
the two variables. The reason for this could be that the predictions were retrieved from a RF model,
which is a non-linear model, therefore there would be no linear correlations. Another explanation could
be that the importance is based on intercorrelations with other features in the model. Figure 6 shows a
correlation plot between openness and the frequency use of YouTube, in appendix E.1 other similar
plots on the important features are shown.
Fig. 6. Correlation plot of openness and the frequency of use of YouTube

21
5.1.5 Agreeableness
Also, for agreeableness, the RF model on the complete data from the feature selection of the three feature
sets was found to be the model with the highest accuracy score. The RF model scored 6% higher on
accuracy than the baseline model. The F1-score for this model was 0.53 which is close to the accuracy
score. Only 4% of the misclassifications were poorly classified. The most important features for this
model are visualized in figure 7. Also, for these features, the correlations of the features with the highest
importance were plotted against the personality classes of agreeableness.
Fig. 7. Most important feature for the best performing model for agreeableness (sorted by importance)
When plotting the most important features of the model with the agreeableness classes, similar results
as for the openness personality were shown. In figure 8 the correlation plot is shown and in appendix
E.2 are the three other most important features of this personality included, with similar results.
Fig. 8. Correlation plot of openness and the frequency of phone usage in the morning

22
5.1.6 Neuroticism
For neuroticism, the highest accuracy score was found on combination of feature set one and two with
imputations. The accuracy score for the best performing model was 46% which was 6% higher than
baseline. The F1-score metric was 0.44, which was close to the accuracy score. However, on the poor
classification ratio, the model did not perform well. The ratio was 0.22, which indicates that 22% of the
misclassifications were poorly classified.
Fig. 9. Most important feature for the best performing model for neuroticism (sorted by importance)
Also, for neuroticism, there was no linear correlation shown when plotting the most important features
against the personality classes. Figure 10 shows the correlation between neuroticism and the frequency
of WhatsApp usage, other correlation plots are included in appendix E.3.
Fig. 10. Correlation plot of neuroticism and the frequency of WhatsApp use

23
5.1.7 Conscientiousness
Conscientiousness was also predicted above baseline, with a small difference of 3%. However, none of
the imputed datasets scored above baseline. The F1-score for this model was 0.53, which was close to
the accuracy score of the model. The classification ratio for this model was 0.11, which means that 11%
of the misclassifications were poorly classified. The best performing model on imputed datasets showed
an accuracy score of 0.5 which is 2% lower than the baseline model. The most important features for
the best performing model are visualized in figure 11.
Fig. 11. Most important feature for the best performing model for conscientiousness (sorted by importance)
Similar to the previously shown correlation plots this personality also does not show any linear
correlations with the most important features. In figure 12 the correlations between conscientiousness
and the frequency of use of music applications is shows and in appendix E.4 the other correlation plots
are shown.
Fig. 12. Correlation plot of conscientiousness and the frequency of music application use
24
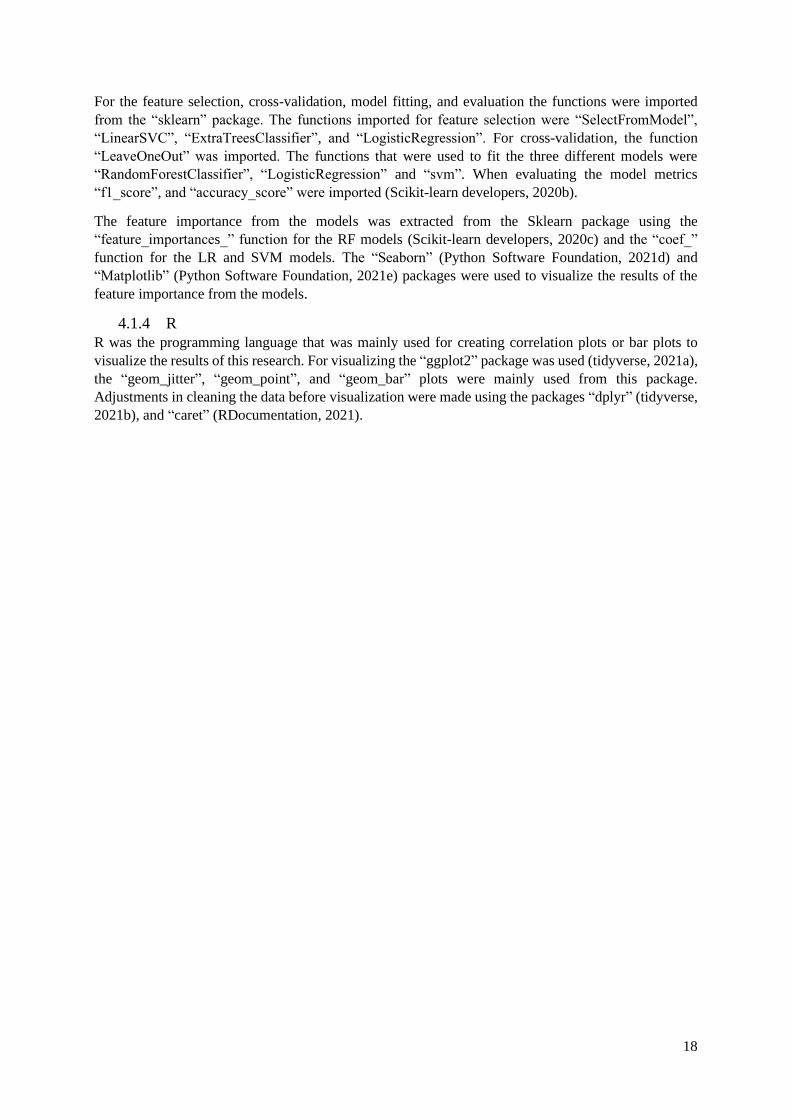
5.1.8 Extraversion
Extraversion was the only personality that could not be predicted above baseline. The scores of the best
performing models were equal to the baseline scores. The complete feature sets and the feature sets with
imputations could not be predicted above baseline, therefore the feature importances of both models are
shown. Figure 13 shows the most important features for the RF model on the complete datasets and
figure 14 on the imputed dataset. The results of the feature importance are different, which is expected
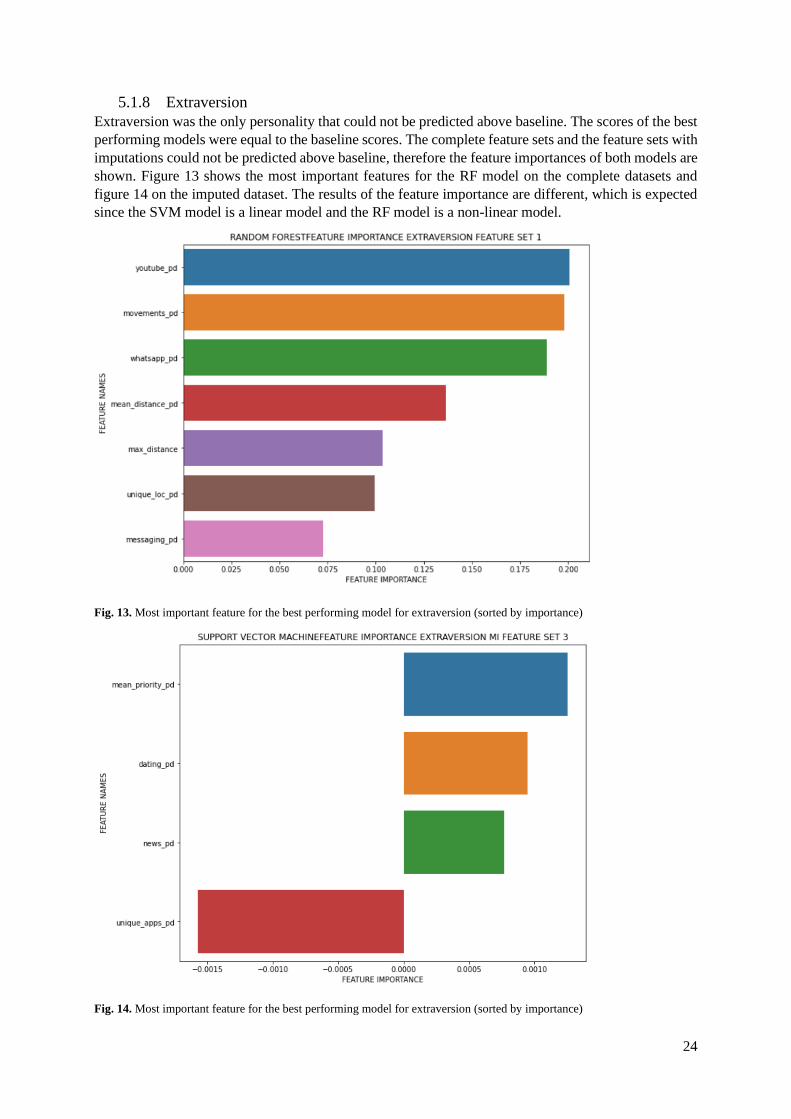
since the SVM model is a linear model and the RF model is a non-linear model.
Fig. 13. Most important feature for the best performing model for extraversion (sorted by importance)
Fig. 14. Most important feature for the best performing model for extraversion (sorted by importance)

25
Since the SVM model is a linear model, a linear correlation was expected on the feature importance and
the personality classes. However, figure 15 does not show any correlations, but this could also be
because the coefficient for the frequency of unique locations is very small so the linear correlation could
not be visible in the plot. Also, figure 16 does not indicate any linear correlations on the frequency of
use of YouTube and extraversion. Other plots on the importances of these models are included in
appendix E.5.
Fig. 15. Correlation plot of extraversion and the number of unique applications
Fig. 16. Correlation plot of extraversion and the frequency of use of the YouTube application
26
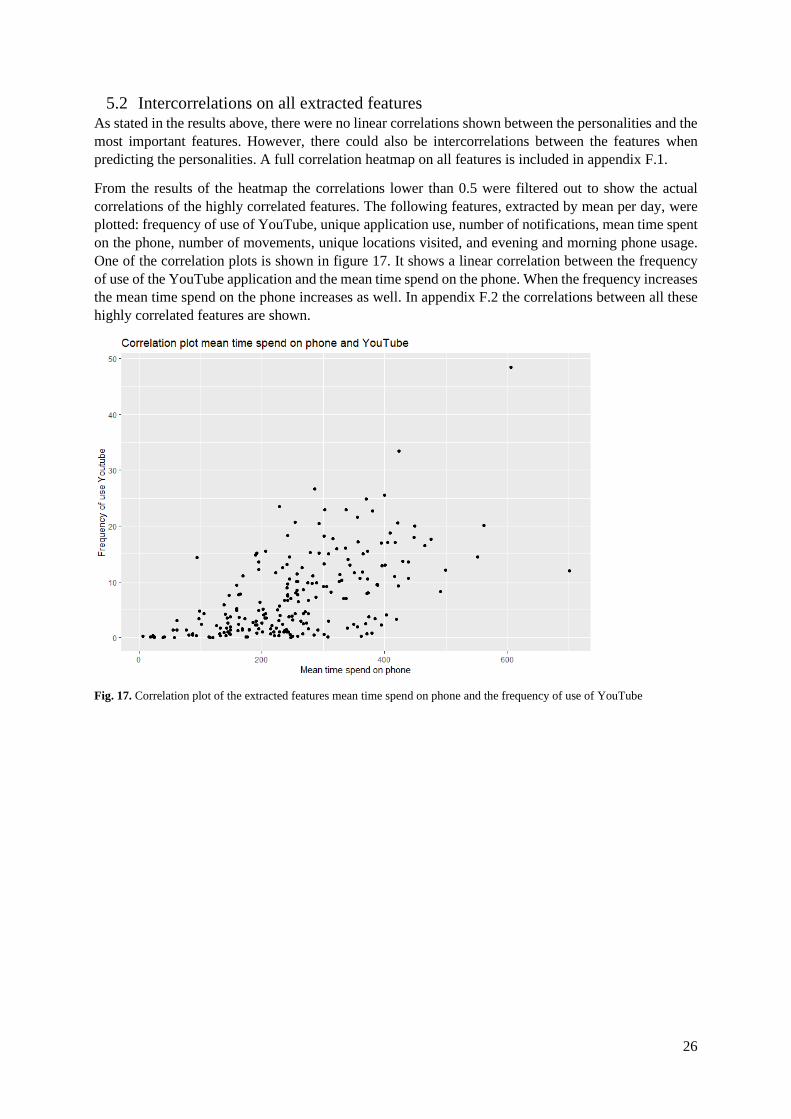
5.2 Intercorrelations on all extracted features As stated in the results above, there were no linear correlations shown between the personalities and the
most important features. However, there could also be intercorrelations between the features when
predicting the personalities. A full correlation heatmap on all features is included in appendix F.1.
From the results of the heatmap the correlations lower than 0.5 were filtered out to show the actual
correlations of the highly correlated features. The following features, extracted by mean per day, were
plotted: frequency of use of YouTube, unique application use, number of notifications, mean time spent
on the phone, number of movements, unique locations visited, and evening and morning phone usage.
One of the correlation plots is shown in figure 17. It shows a linear correlation between the frequency
of use of the YouTube application and the mean time spend on the phone. When the frequency increases
the mean time spend on the phone increases as well. In appendix F.2 the correlations between all these
highly correlated features are shown.
Fig. 17. Correlation plot of the extracted features mean time spend on phone and the frequency of use of YouTube

27
5.3 Intercorrelations on personalities To see if there are intercorrelations between the personalities in the dataset being used for this thesis,
two correlation heatmaps were created. Figure 18 shows the correlations between personalities with the
true classes and figure 19 shows the correlation between the predicted classes. The heatmap for the true
classes shows that the majority of the personalities are not correlated to each other. Extraversion and
neuroticism are slightly correlated with a negative correlation of -0.29. The correlation heatmap on the
predicted classes shows lower correlations between the personalities. The negative correlation between
extraversion and neuroticism is smaller in the plot on the predicted classes than for the true values.
However, this heatmaps shows a small negative correlation between openness and extraversion, which
was not shown in the heatmap for the true correlations.
Fig. 18. Heatmap of correlations true personality classes Fig. 19. heatmap of correlations predicted personality classes
All five personality scores were predicted for the participants from whom the data was collected. In
other words, five predictions were made by five different models on every participant. This could mean
that some personalities were predictable for participants and some were not. In figure 20 is the frequency
visualized on how many personalities were correctly predicted on all participants. The results of the
combination of best performing models on every personality were used to create this plot. For most of
the participants, two or three out of the five personalities were correctly predicted. For just a few
participants all personalities or none of the personalities were correctly predicted.
Fig. 20. Plot of the correctly predicted personalities of all participants

28
6 Discussion The goal of this study was to predict the big five personalities based on features extracted from phone
usage data. Along the process of aiming at the highest accuracy score, several feature sets were extracted
and different models were fitted to combined feature sets. Also, the feature importance was retrieved
from the models and correlation plots were created to visualize possible correlations between the most
important features of the best scoring models and the personality the model belonged to. Besides, the
intercorrelations of only the features and only the personalities have been looked into. The feature
extraction of this study is based on several features of previous studies that have been successfully
predicting personality and combined all together in several feature sets. Below the results per model, the
results of the intercorrelations on the features, and the personalities will be compared to the results of
previous studies mentioned in the related work section.
6.1 Discussion per personality In the paragraph below the results and comparison to related work will be discussed separately.
6.1.4 Openness
The best predicting model, compared to the baseline results, was the RF model with the feature selection
of feature set one, two, and three combined for the personality openness. In the literature,
communication applications, camera usage, music applications and distance information were
mentioned as the most influential (Stalch et al., 2020). The most important feature in the model of this
study was YouTube, which could be listed as a communication application since this is a social media
application (Klobas et al., 2018). However, this application serves several purposes and the data
collection in this research could not show any context of the application use of the participants. The
other application that could be categorized as a communication application would be Instagram, which
was ranked sixth most important feature in this model. Spatial features as long-distance movements and
visiting far places were also found influential by Alessandretti et al. (2018) and Chorley et al. (2015). In
the best performing model for openness, the only spatial feature that was found important was the mean
distance feature, which was ranked as the fourth most important in the model. McCrae & John (1992)
described the facets for openness as people that tend to long for variety and experiences. These facets
could be related tot traveling, and so this could explain the importance of the mean distance feature.
However, since actual correlations are not visible in the correlation plots its is not possible to make any
statements about this. The other three spatial features were not of influence on the performance of the
model. Also, photo and video related applications and music applications were not of influence in the
prediction of openness.
6.1.5 Agreeableness
Also, for agreeableness, the communication applications were found influential on this personality. The
best performing model for agreeableness was found using the RF model with the combination of feature
sets one, two, and three. The usage of the YouTube application, similar to what was found in the
literature (Klobas et al., 2018), was found influential on the predictions of this personality. However,
just as mentioned for openness there was not enough context on this application and the correlation plot
did not show a particular correlation between this feature and the personality classes. Peltonen et al.
(2020) found that agreeableness was correlated with communication applications. The results of the
model for this personality also showed the importances of communication features, which were
WhatsApp and Instagram. Prior research on the influence of spatial data on agreeableness showed that
this personality was positively correlated to a large range of movements (Ai et al., 2019). The results of
the model showed that the maximum distance feature was found important in predicting personality.
The actual correlation between this feature and the personality was not visible in the plot.
6.1.6 Neuroticism
For neuroticism the best performing model was trained on the combined feature sets 1 and 2 with
imputations. The most important feature that was retrieved from this model was the frequency of
29
WhatsApp usage. In research by Montag et al (2015) WhatsApp was also found influential on this
personality. The frequency of use of YouTube was shown as important in the results of the best
performing model for neuroticism, this was also shown in the study conducted by Klobas et al. (2018).
Moreover, communication applications, in general, were found negatively correlated in the literature
(Peltonen et al., 2019). The importance was also shown in this research, but also for neuroticism it was
not possible to find actual correlations between the applications and the personality classes. Lastly,
notification features were mentioned as an influence on this personality (Mehrotra et al, 2016), but the
results of the model did not show any importance of notification features.
6.1.7 Conscientiousness
For conscientiousness, the RF model of the combination of the feature sets one and two were found the
most accurate compared to the baseline model. In the literature, many features were mentioned as
influential on this personality, such as time spent on phone, unique application frequency, battery level
(Stalch et al., 2020), WhatsApp usage (Montag et al., 2015), and YouTube usage (Klobas et al., 2018),
and notifications (Mehrotra et al., 2016). However, none of the features mentioned in the literature were
retrieved as important from the best performing model on conscientiousness.
6.1.8 Extraversion
The accuracy scores for extraversion were not as high as expected. However, for the personality’s
openness, agreeableness, neuroticism, and conscientiousness, the accuracy scores of their best
performing models were higher than their baseline models. This means that the models would predict
the personality better than if the most frequent class of the personality was predicted. Surprisingly, the
personality extraversion was the only personality that was found not predictable in this study, despite
that the majority of previous research found this personality most predictable and therefore most of the
extracted features were based on this success (Alessandretti et al., 2018; Harari et al., 2019; Peltonen et
al., 2020; Ai et al., 2019).
Montag et al. (2015) found WhatsApp influential in predicting extraversion, this was also shown in the
results of the best performing model for extraversion. This could also be linked to the facets mentioned
by McCrae & John (1992) who name social as a characteristic of the personality and WhatsApp is
mainly used to stay in touch with others. Another similarity with the results of Ai et al. (2019) and
Alessandretti et al. (2018) that was found in this research was the influence of spatial features on the
prediction of extraversion.
6.2 Intercorrelations all features The results on the intercorrelation between all features that have been extracted, showed that some
features were highly correlated. However, since no actual correlation between the feature importances
and the personality classes can be shown, it is hard to make any statements about these intercorrelations.
6.3 Intercorrelations personalities In the literature is stated that the five personalities are independent (McCrae & John, 1992). Meta-
analysis on intercorrelations between the personalities showed some negative correlations between
conscientiousness and neuroticism, extraversion and neuroticism, and agreeableness and neuroticism
(van der Linden et al., 2010). Also, Mønsted et al. (2018) found the negative correlation between
neuroticism and extraversion. The results of the intercorrelation heatmap on the true classes showed also
a small negative correlation between extraversion and neuroticism. However, in their study, an
intercorrelation of the same size was also shown between agreeableness and extraversion. This was not
shown in the results of this research, also the other correlations of van der Linden (2010) were not shown
in the results of this research. On the predicted classes the intercorrelations were smaller than on the true
classes. However, in this heatmap, there is a small negative intercorrelation shown for the personality’s
extraversion and openness.
30
6.4 Limitations From the comparisons between previous studies and this study can be seen that there are a lot of
differences in the findings. One of the main reasons for this could be that the previous studies were not
generalizable and the participants were from another country, which could indicate cultural differences
that lead to different results in the personalities (Harari, 2020). So, applying similar models with similar
feature sets could still output different results due to different participants.
Another limitation that could be mentioned is that the phone usage data for this research did not have
any context on the application specific. For example, there was no actual data on what videos were
watched when using the YouTube application or what messages were send with the WhatsApp
applications. In researches by Montag et al. (2015) and Klobas et al. (2018), there was more information
on these application use. However, this could lead to privacy concerns since collecting more data and
more specific data would be privacy sensitive and should be according to the GDPR regulation (Harari,
2020). Besides, the data collection used for this research exists of 221 participants, which means that
the data set that the models were fitted to contained 221 instances. If more there were more people
participating there would be more data to fit the models too, which could have led to better model
performance (Mønsted et al., 2018).
Due to time limitations, not all possible features were extracted from the raw data collection, grid search
was not applied to the tested models and not all possible models have been tested. Based on findings
from previous studies features were extracted for this study. However, there are more features that could
be extracted from this data set. For example, the duration that applications have been used by the
participants could be extracted or there could be more categories selected for feature extraction, such as
gaming applications or sport related applications. Grid search could have been applied for parameter
tuning to all models that have been tested, which could lead to higher model performances and prevents
models from overfitting (Lameski, Zdravevski, Mingov & Kulakov, 2015). This study only focused on
three models, which were selected based on the possibility of explainability and interpretability.
However, different models could have been tested and could have led to different results.
31
7 Conclusion The personalities openness, conscientiousness, agreeableness, and neuroticism can be predicted above
baseline based on smartphone usage, where openness was the best predictable personality. This means
that the predictions from the machine learning models would provide higher accuracy than when the
majority class per personality would be predicted. Despite the findings from the literature, in this
research extraversion was not predictable above baseline.
To provide an answer to the main research questions the three sub-questions were answered. The first
sub-question was formulated as follows: “Which features can be extracted from the phone usage data to
predict the big five personalities?”. From the raw phone usage data collection features on spatial
information, frequency of use of communication applications, frequency of use of other applications
categorized by purpose, notifications, battery percentage, phone usage of different phases of the day,
and the mean time spent on the phone, have been extracted.
These features were used to answer the second sub-question: “Which classification machine learning
techniques predict each independent personality most accurately?”. For all four successfully predicted
personalities the random forest model was the model with the highest accuracy. For extraversion, the
highest accuracy score was found using the support vector machine model on the linear kernel.
The third sub-question is the following: “Which features are most important in predicting personality?”.
In appendix D a full overview is shown of the most important features per personality. These
importances would indicate which data should be collected when predicting a certain personality using
the same model on new data. The actual correlations could not be shown in the correlation plots since
there was no linear correlation between the features and the personality.
Even though most of the personalities were predicted above baseline, the predictions on the personalities
are still considered to be poor. It would not be advised to use these models on predicting personality,
since the models outperformed the baseline with a minor difference. Also, the dataset used for this
research is small, which does not make this research generalizable. Suggestions for further research on
the same data collection could be extraction of more features, applying grid search on the models for
parameter tuning, and fitting other classification models than used in this research. Another possibility
would be fitting regression machine learning models to the data to try to get more accurate predictions.
However, it would be hard to compare the results of regression models with the results of classification
models, since these models would have other evaluation metrics.

32
References Ai, P., Liu, Y., & Zhao, X. (2019). Big Five personality traits predict daily spatial behavior: Evidence
from smartphone data. Personality and Individual Differences, 147, 285-291.
Alessandretti, L., Lehmann, S., & Baronchelli, A. (2018). Understanding the interplay between social
and spatial behaviour. EPJ Data Science, 7(1), 36.
Apley, D. W. (2016). Visualizing the E_ects of Predictor Variables in Black Box Supervised Learning
Models. Retrieved from http://arxiv.org/abs/1612.08468
Barbosa, H., Barthelemy, M., Ghoshal, G., James, C. R., Lenormand, M., Louail, T., ... & Tomasini,
M. (2018). Human mobility: Models and applications. Physics Reports, 734, 1-74.
Bennett, D. A. (2001). How can I deal with missing data in my study?. Australian and New Zealand
journal of public health, 25(5), 464-469.
Bouwman, H., de Reuver, M., Heerschap, N., & Verkasalo, H. (2013). Opportunities and problems
with automated data collection via smartphones. Mobile media & communication, 1(1), 63-68.
Breiman, L. (2001). Random Forests. Machine Learning 45, 5–32. doi.org/10.1023/A:1010933404324
Byrne, K. A., Silasi-Mansat, C. D., & Worthy, D. A. (2015). Who chokes under pressure? The Big
Five personality traits and decision-making under pressure. Personality and individual differences, 74,
22-28.
Chicco, D., & Jurman, G. (2020). The advantages of the Matthews correlation coefficient (MCC) over
F1 score and accuracy in binary classification evaluation. BMC genomics, 21(1), 1-13.
Chhabra, G., Vashisht, V., & Ranjan, J. (2017). A comparison of multiple imputation methods for data
with missing values. Indian Journal of Science and Technology, 10(19), 1-7.
Chittaranjan, G., Blom, J., & Gatica-Perez, D. (2013). Mining large-scale smartphone data for
personality studies. Personal and Ubiquitous Computing, 17(3), 433-450.
Chorley, M. J., Whitaker, R. M., & Allen, S. M. (2015). Personality and location-based social
networks. Computers in Human Behavior, 46, 45-56.
Concone, F., Gaglio, S., Re, G. L., & Morana, M. (2017). Smartphone data analysis for human activity
recognition. In Conference of the Italian Association for Artificial Intelligence 58-71.
Deng, Y., Chang, C., Ido, M. S., & Long, Q. (2016). Multiple imputation for general missing data
patterns in the presence of high-dimensional data. Scientific reports, 6(1), 1-10.
De Raad, B. (2000). The Big Five Personality Factors: The psycholexical approach to personality.
Hogrefe & Huber Publishers.
Fisher, A., Rudin, C., & Dominici, F. (2018). Model class reliance: Variable importance measures for
any machine learning model class, from the” rashomon” perspective. arXiv preprint rXiv:1801.01489,
68.
Gao, N., Shao, W., & Salim, F. D. (2019). Predicting personality traits from physical activity intensity.
Computer, 52(7), 47-56.
Gonzalez-Abril, L., Velasco, F., Angulo, C., & Ortega, J. A. (2013). A study on output normalization
in multiclass SVMs. Pattern Recognition Letters, 34(3), 344-348.

33
Gerber, A. S., Huber, G. A., Doherty, D., & Dowling, C. M. (2011). The big five personality traits in
the political arena. Annual Review of Political Science, 14, 265-287.
Gregorutti, B., Michel, B., & Saint-Pierre, P. (2015). Grouped variable importance with random
forests and application to multiple functional data analysis. Computational Statistics & Data Analysis,
90, 15-35.
Guenther, N., & Schonlau, M. (2016). Support vector machines. The Stata Journal, 16(4), 917-937.
Harari, G. M. (2020). A process-oriented approach to respecting privacy in the context of mobile
phone tracking. Current opinion in psychology, 31, 141-147.
Harari, G. M., Gosling, S. D., Wang, R. U. I., & Campbell, A. T. (2015). Capturing situational
information with smartphones and mobile sensing methods. European Journal of Personality, 29(5),
509-511.
Harari, G. M., Lane, N. D., Wang, R., Crosier, B. S., Campbell, A. T., & Gosling, S. D. (2016). Using
smartphones to collect behavioral data in psychological science: Opportunities, practical
considerations, and challenges. Perspectives on Psychological Science, 11(6), 838-854.
Hearst, M. A., Dumais, S. T., Osuna, E., Platt, J., & Scholkopf, B. (1998). Support vector
machines. IEEE Intelligent Systems and their applications, 13(4), 18-28.
Horel, E., & Giesecke, K. (2019). Computationally efficient feature significance and importance for
machine learning models. arXiv preprint arXiv:1905.09849.
Huque, M. H., Carlin, J. B., Simpson, J. A., & Lee, K. J. (2018). A comparison of multiple imputation
methods for missing data in longitudinal studies. BMC medical research methodology, 18(1), 1-16.
Klobas, J. E., McGill, T. J., Moghavvemi, S., & Paramanathan, T. (2018). Compulsive YouTube
usage: A comparison of use motivation and personality effects. Computers in Human Behavior, 87,
129-139.
Lameski, P., Zdravevski, E., Mingov, R., & Kulakov, A. (2015). SVM parameter tuning with grid
search and its impact on reduction of model over-fitting. In Rough sets, fuzzy sets, data mining, and
granular computing, 464-474.
Madley-Dowd, P., Hughes, R., Tilling, K., & Heron, J. (2019). The proportion of missing data should
not be used to guide decisions on multiple imputation. Journal of clinical epidemiology, 110, 63-73.
McCrae, R. R., & John, O. P. (1992). An Introduction to the Five-Factor Model and Its Applications.
Journal of Personality, 60(2), 175–215. doi:10.1111/j.1467-6494.1992.tb00970.x
Mehrotra, A., Pejovic, V., Vermeulen, J., Hendley, R., & Musolesi, M. (2016). My phone and me:
understanding people's receptivity to mobile notifications. In Proceedings of the 2016 CHI conference
on human factors in computing systems,1021-1032.
Menard, S. (2000). Coefficients of determination for multiple logistic regression analysis. The
American Statistician, 54(1), 17-24.
Milfont, T. L., & Sibley, C. G. (2012). The big five personality traits and environmental engagement:
Associations at the individual and societal level. Journal of Environmental Psychology, 32(2), 187-
195.

34
Mollgaard, A., Lehmann, S., & Mathiesen, J. (2017). Correlations between human mobility and social
interaction reveal general activity patterns. PloS one, 12(12), e0188973.
Mønsted, B., Mollgaard, A., & Mathiesen, J. (2018). Phone-based metric as a predictor for basic
personality traits. Journal of Research in Personality, 74, 16-22.
Montag, C., Błaszkiewicz, K., Sariyska, R., Lachmann, B., Andone, I., Trendafilov, B., ... &
Markowetz, A. (2015). Smartphone usage in the 21st century: who is active on WhatsApp?. BMC
research notes, 8(1), 1-6.
de Montjoye, Y. A., Quoidbach, J., Robic, F., & Pentland, A. S. (2013). Predicting personality using
novel mobile phone-based metrics. In International conference on social computing, behavioral-
cultural modeling, and prediction, 48-55.
Moy, J. W., & Lam, K. F. (2004). Selection criteria and the impact of personality on getting hired.
Personnel Review.
O’Connor, M. C., & Paunonen, S. V. (2007). Big Five personality predictors of post-secondary
academic performance. Personality and Individual differences, 43(5), 971-990.
de Oliveira, R., Karatzoglou, A., Concejero Cerezo, P., Armenta Lopez de Vicuña, A., & Oliver, N.
(2011). Towards a psychographic user model from mobile phone usage. In CHI'11 Extended Abstracts
on Human Factors in Computing Systems, 2191-2196
Pandas (2021). Group by: split-apply-combine.
https://pandas.pydata.org/docs/user_guide/groupby.html
Pargent, F., & Albert-von der Gönna, J. (2019). Predictive modeling with psychological panel data.
Zeitschrift für Psychologie.
Patle, A., & Chouhan, D. S. (2013). SVM kernel functions for classification. In 2013 International
Conference on Advances in Technology and Engineering (ICATE), pp. 1-9.
Peltonen, E., Sharmila, P., Asare, K. O., Visuri, A., Lagerspetz, E., & Ferreira, D. (2020). When
phones get personal: Predicting Big Five personality traits from application usage. Pervasive and
Mobile Computing, 69, 101269.
Python Software Foundation (2021a). Numpy 1.20.3. Retrieved from https://pypi.org/project/numpy/
Python Software Foundation (2021b). Pandas 1.2.4. Retrieved from https://pypi.org/project/pandas/
Python Software Foundation (2021c). Python-math 0.0.1. Retrieved from
https://pypi.org/project/python-math/
Python Software Foundation (2021d). Seaborn 0.11.1. Retrieved from https://pypi.org/project/seaborn/
Python Software Foundation (2021e). Matplotlib 3.4.2. Retrieved from
https://pypi.org/project/matplotlib/
RDocumentation. (2021). Caret package. Retrieved from
https://www.rdocumentation.org/packages/caret/versions/6.0-88
Ross, C., Orr, E. S., Sisic, M., Arseneault, J. M., Simmering, M. G., & Orr, R. R. (2009). Personality
and motivations associated with Facebook use. Computers in human behavior, 25(2), 578-586.
35
Rudin, C. (2019). Stop explaining black box machine learning models for high stakes decisions and
use interpretable models instead. Nature Machine Intelligence, 1(5), 206-215.
Scikit-learn developers (2020a). Sklearn.metric.f1_score. Retrieved from https://scikit-
learn.org/stable/modules/generated/sklearn.metrics.f1_score.html
Scikit-learn developers (2020b). Feature importances with a forest of trees. https://scikit-
learn.org/stable/auto_examples/ensemble/plot_forest_importances.html
Scikit-learn developers (2020c). Supervised learning. Retrieved from https://scikit-
learn.org/stable/supervised_learning.html#supervised-learning
Settanni, M., Azucar, D., & Marengo, D. (2018). Predicting individual characteristics from digital
traces on social media: A meta-analysis. Cyberpsychology, Behavior, and Social Networking, 21(4),
217-228.
Slade, E., & Naylor, M. G. (2020). A fair comparison of tree‐based and parametric methods in
multiple imputation by chained equations. Statistics in medicine, 39(8), 1156-1166.
Soto, C. J., & John, O. P. (2017). Short and extra-short forms of the Big Five Inventory–2: The BFI-2-
S and BFI-2-XS. Journal of Research in Personality, 68, 69-81.
Stachl, C., Au, Q., Schoedel, R., Buschek, D., Völkel, S., Schuwerk, T., ... & Bühner, M. (2019).
Behavioral patterns in smartphone usage predict big five personality traits.
Stachl, C., Au, Q., Schoedel, R., Gosling, S. D., Harari, G. M., Buschek, D., ... & Bühner, M. (2020).
Predicting personality from patterns of behavior collected with smartphones. Proceedings of the
National Academy of Sciences, 117(30), 17680-17687.
Staiano, J., Lepri, B., Aharony, N., Pianesi, F., Sebe, N., & Pentland, A. (2012). Friends don't lie:
inferring personality traits from social network structure. In Proceedings of the 2012 ACM conference
on ubiquitous computing, 321-330.
Stoughton, J. W., Thompson, L. F., & Meade, A. W. (2013). Big five personality traits reflected in job
applicants' social media postings. Cyberpsychology, Behavior, and Social Networking, 16(11), 800-
805.
tidyverse. (2021a). Ggplot2 part of the tidyverse 3.3.2. Retrieved from
https://ggplot2.tidyverse.org/reference/
tidyverse. (2021b). dyplr part of the tidyverse 1.0.6. Retrieved from https://dplyr.tidyverse.org/
Torous, J., & Powell, A. C. (2015). Current research and trends in the use of smartphone applications
for mood disorders. Internet Interventions, 2(2), 169-173.
Wang, W., Harari, G. M., Wang, R., Müller, S. R., Mirjafari, S., Masaba, K., & Campbell, A. T.
(2018). Sensing behavioral change over time: Using within-person variability features from mobile
sensing to predict personality traits. Proceedings of the ACM on Interactive, Mobile, Wearable and
Ubiquitous Technologies, 2(3), 1-21.
Wilson, S. (2020). Miceforest 2.0.4. Retrieved from https://pypi.org/project/miceforest/
Wong, T. T. (2015). Performance evaluation of classification algorithms by k-fold and leave-one-out
cross validation. Pattern Recognition, 48(9), 2839-2846.

36
Wu, X., Tang, W., & Wu, X. (2012). Support vector machine based on hybrid kernel function.
In Information Engineering and Applications (pp. 127-133). Springer, London.
Van der Linden, D., te Nijenhuis, J., & Bakker, A. B. (2010). The general factor of personality: A
meta-analysis of Big Five intercorrelations and a criterion-related validity study. Journal of research
in personality, 44(3), 315-327.
Yarkoni, T., & Westfall, J. (2017). Choosing Prediction Over Explanation in Psychology: Lessons
From Machine Learning. Perspectives on Psychological Science, 12(6), 1100–1122.
doi:10.1177/1745691617693393
Zaidi, N. R., Wajid, R. A., Zaidi, F. B., Zaidi, G. B., & Zaidi, M. T. (2013). The big five personality
traits and their relationship with work engagement among public sector university teachers of Lahore.
African Journal of Business Management, 7(15), 1344-1353.
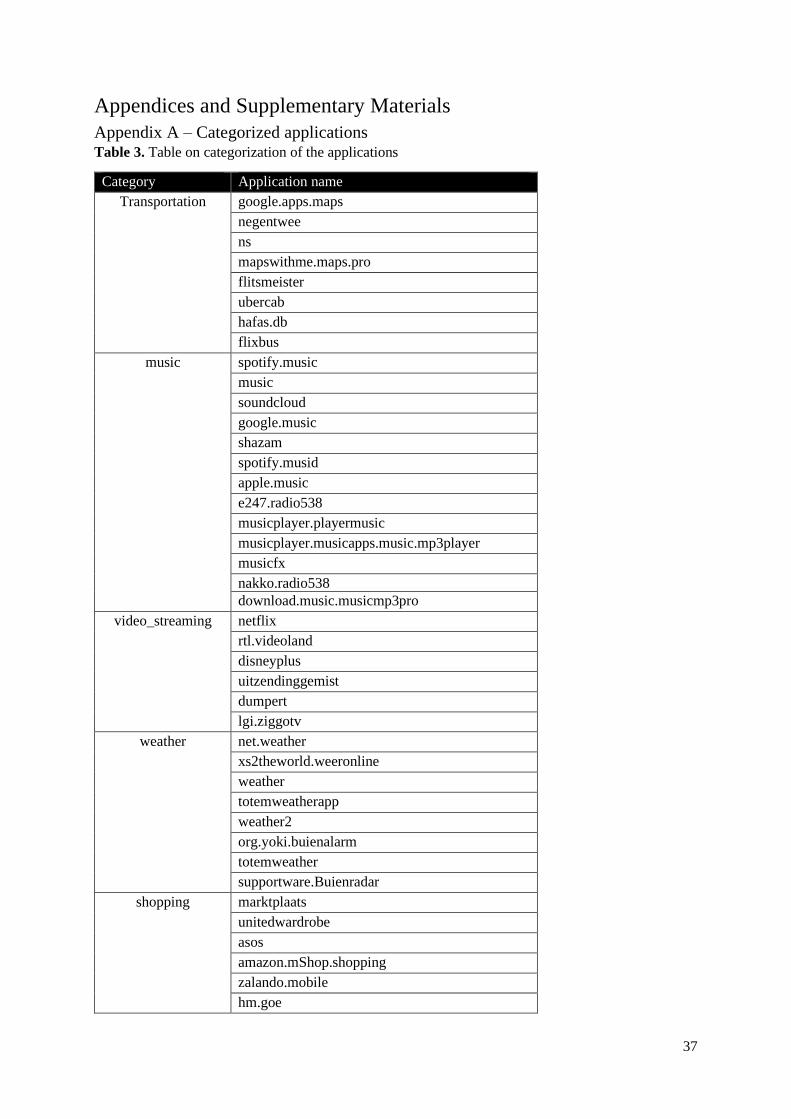
37
Appendices and Supplementary Materials
Appendix A – Categorized applications Table 3. Table on categorization of the applications
Category Application name
Transportation
google.apps.maps
negentwee
ns
mapswithme.maps.pro
flitsmeister
ubercab
hafas.db
flixbus
music
spotify.music
music
soundcloud
google.music
shazam
spotify.musid
apple.music
e247.radio538
musicplayer.playermusic
musicplayer.musicapps.music.mp3player
musicfx
nakko.radio538
download.music.musicmp3pro
video_streaming
netflix
rtl.videoland
disneyplus
uitzendinggemist
dumpert
lgi.ziggotv
weather
net.weather
xs2theworld.weeronline
weather
totemweatherapp
weather2
org.yoki.buienalarm
totemweather
supportware.Buienradar
shopping
marktplaats
unitedwardrobe
asos
amazon.mShop.shopping
zalando.mobile
hm.goe
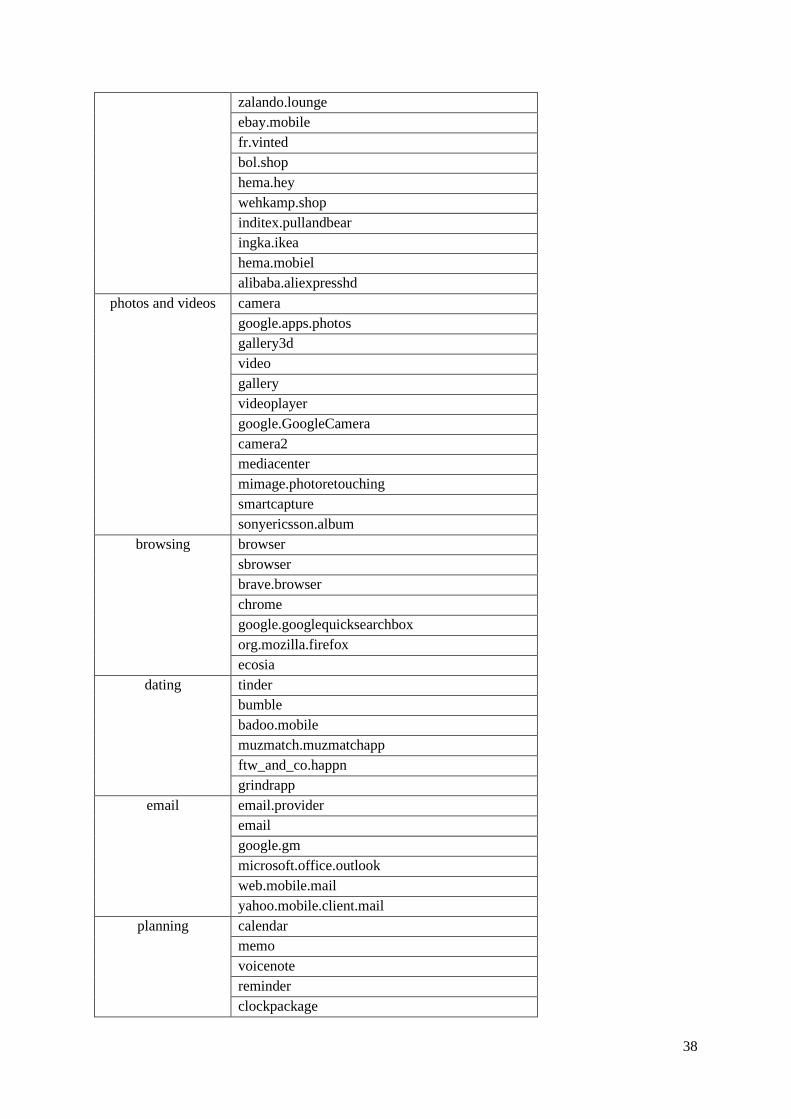
38
zalando.lounge
ebay.mobile
fr.vinted
bol.shop
hema.hey
wehkamp.shop
inditex.pullandbear
ingka.ikea
hema.mobiel
alibaba.aliexpresshd
photos and videos
camera
google.apps.photos
gallery3d
video
gallery
videoplayer
google.GoogleCamera
camera2
mediacenter
mimage.photoretouching
smartcapture
sonyericsson.album
browsing
browser
sbrowser
brave.browser
chrome
google.googlequicksearchbox
org.mozilla.firefox
ecosia
dating
tinder
bumble
badoo.mobile
muzmatch.muzmatchapp
ftw_and_co.happn
grindrapp
email.provider
google.gm
microsoft.office.outlook
web.mobile.mail
yahoo.mobile.client.mail
planning
calendar
memo
voicenote
reminder
clockpackage

39
google.calendar
example.notepad
note
coloros.alarmclock
simplemobiletools.calendar
alarmclock.xtreme.free
microsoft.todos
ibridge.planning
worldclock
deskclock
notes
google.deskclock
socialnmobile.dictapps.notepad.color.note
clock
stayfocused
apalon.myclockfree
ztnstudio.notepad
cc.forestapp
google.keep
works.jubilee.timetree
food_ordering
ubercab.eats
takeaway
deliveroo.orderapp
mcdonalds.mobileapp
News
nos
rtl.rtlnieuws
bbc.mobile.news.ww
sanomamedia.nu
be.persgroep.news.mobilead

40
Appendix B - Extracted features Table 4. Table of all extracted features, their description and the number of the feature set
Note: p.d. = per day. The mean has been computed over the number of days phone usage data has collected per
participant.
Sort Feature description Featureset
Spatial
1. Movements p.d. Frequency of participants
moving from one place to
another per day
F1
2. Mean distance p.d. Computation of the distance
participants travel per day
F1
3. Unique locations p.d. Frequency of unique locations
participants visited per day
F1
4. Maximum distance travelled Maximum distance the
participants travelled over the
time of data collection
F1
Communication
applications
5. WhatsApp frequency p.d. Frequency of WhatsApp use per
day
F1
6. Facebook frequency p.d. Frequency of Facebook use per
day
F1
7. Instagram frequency p.d. Frequency of Instagram use per
day
F1
8. Snapchat frequency p.d. Frequency of Snapchat use per
day
F1
9. YouTube frequency p.d. Frequency of YouTube use per
day
F1
10. Twitter frequency p.d. Frequency of Twitter use per
day
F1
11. LinkedIn frequency p.d. Frequency of LinkedIn use per
day
F1
12. Messaging frequency p.d. Frequency of Messaging
application use per day
F1
13. Calling frequency p.d. Frequency of calling per day F1
Applications
(categorised)
14. Transportation p.d. Frequency of transportation
applications use per day
F2
15. Music p.d. Frequency of music applications
use per day
F2
16. Video streaming p.d. Frequency of video streaming
applications use per day
F2
17. Weather p.d. Frequency of weather
applications use per day
F2
18. Shopping p.d. Frequency of shopping
applications use per day
F2
19. Photos and videos p.d. Frequency of photo and video
related applications use per day
F2
20. Dating p.d. Frequency of dating
applications use per day
F2
21. Browsing p.d. Frequency of browsing
applications use per day
F2
22. Email p.d. Frequency of email applications
use per day
F2
23. Planning p.d. Frequency of planning
applications use per day
F2
24. Food ordering p.d. Frequency of food ordering
applications use per day
F2
25. News p.d. Frequency of news applications
use per day
F2
41
Notifications
26. Notifications p.d. Frequency of received
notifications per day
F3
27. Priority p.d. Sum of priority of received
notifications per day
F3
Other
28. Number of unique apps p.d. Frequency of all unique
application use per day
F3
29. Duration p.d. Total time spend on smartphone
per day
F3
30. Morningness p.d. Frequency of application use in
the morning per day
F3
31. Eveningness p.d. Frequency of application use in
the evening per day
F3
32. Battery percentage p.d. Mean battery percentage per day F3

42
Appendix C – Evaluation metrics of all classification models Tabel 5. Evaltuation metrics of all classification models
O C E A N Model dataset feature set metric
0.46 0.53 0.57 0.5 0.39 RF complete 1 accuracy
0.08 0.11 0 0.15 0.21 RF complete 1 miss classification rate
0.44 0.49 0.41 0.42 0.38 RF complete 1 weighted F1 score
0.41 0.49 0.55 0.49 0.34 LR complete 1 accuracy
0.12 0.03 0.01 0.14 0.15 LR complete 1 miss classification rate
0.39 0.38 0.46 0.44 0.32 LR complete 1 weighted F1 score
0.47 0.5 0.57 0.5 0.4 SVM complete 1 accuracy
0.03 0 0 0.18 0 SVM complete 1 miss classification rate
0.37 0.34 0.41 0.34 0.24 SVM complete 1 weighted F1 score
0.45 0.46 0.53 0.5 0.39 RF imputed 1 accuracy
0.09 0.07 0.07 0.09 0.25 RF imputed 1 miss classification rate
0.43 0.41 0.46 0.47 0.39 RF imputed 1 weighted F1 score
0.43 0.5 0.57 0.52 0.37 LR imputed 1 accuracy
0.05 0.05 0 0.18 0.12 LR imputed 1 miss classification rate
0.38 0.37 0.41 0.45 0.33 LR imputed 1 weighted F1 score
0.51 0.5 0.6 0.49 0.39 SVM imputed 1 accuracy
0.07 0 0 0.15 0.03 SVM imputed 1 miss classification rate
0.46 0.33 0.45 0.32 0.22 SVM imputed 1 weighted F1 score
0.45 0.55 0.54 0.51 0.42 RF complete 2 accuracy
0.07 0.11 0.07 0.08 0.24 RF complete 2 miss classification rate
0.43 0.53 0.48 0.48 0.4 RF complete 2 weighted F1 score
0.46 0.49 0.55 0.54 0.41 LR complete 2 accuracy
0.11 0.04 0.03 0.11 0.16 LR complete 2 miss classification rate
0.45 0.41 0.44 0.49 0.4 LR complete 2 weighted F1 score
0.43 0.5 0.57 0.5 0.39 SVM complete 2 accuracy
0.06 0 0 0.18 0 SVM complete 2 miss classification rate
0.4 0.34 0.41 0.34 0.24 SVM complete 2 weighted F1 score
0.4 0.47 0.54 0.5 0.46 RF imputed 2 accuracy
0.1 0.08 0.04 0.07 0.22 RF imputed 2 miss classification rate
0.38 0.41 0.48 0.47 0.44 RF imputed 2 weighted F1 score
0.51 0.5 0.56 0.5 0.37 LR imputed 2 accuracy
0.06 0.03 0.03 0.12 0.14 LR imputed 2 miss classification rate
0.48 0.4 0.45 0.39 0.31 LR imputed 2 weighted F1 score
0.5 0.5 0.6 0.49 0.39 SVM imputed 2 accuracy
0.07 0 0 0.15 0.02 SVM imputed 2 miss classification rate
0.46 0.33 0.45 0.32 0.23 SVM imputed 2 weighted F1 score
0.55 0.52 0.55 0.56 0.38 RF complete 3 accuracy
0.09 0.13 0.08 0.04 0.27 RF complete 3 miss classification rate
0.52 0.49 0.49 0.53 0.37 RF complete 3 weighted F1 score
0.46 0.46 0.55 0.52 0.37 LR complete 3 accuracy
0.11 0.06 0.04 0.13 0.12 LR complete 3 miss classification rate
0.45 0.39 0.46 0.49 0.33 LR complete 3 weighted F1 score
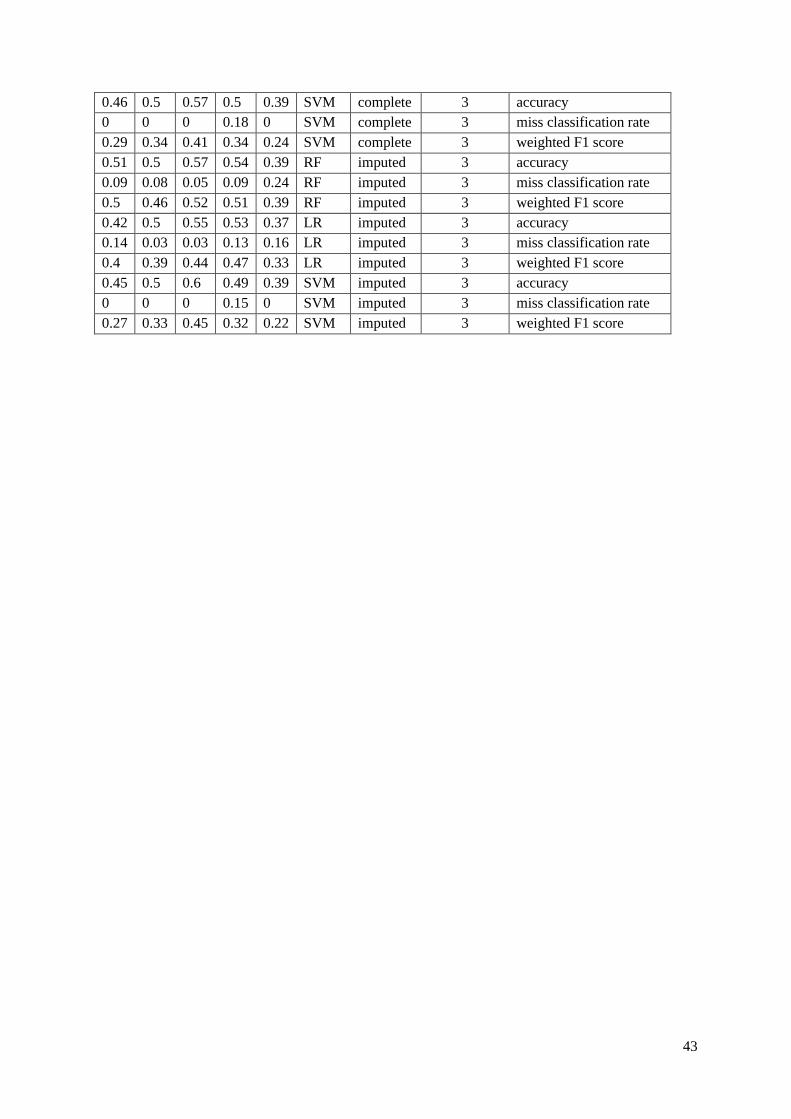
43
0.46 0.5 0.57 0.5 0.39 SVM complete 3 accuracy
0 0 0 0.18 0 SVM complete 3 miss classification rate
0.29 0.34 0.41 0.34 0.24 SVM complete 3 weighted F1 score
0.51 0.5 0.57 0.54 0.39 RF imputed 3 accuracy
0.09 0.08 0.05 0.09 0.24 RF imputed 3 miss classification rate
0.5 0.46 0.52 0.51 0.39 RF imputed 3 weighted F1 score
0.42 0.5 0.55 0.53 0.37 LR imputed 3 accuracy
0.14 0.03 0.03 0.13 0.16 LR imputed 3 miss classification rate
0.4 0.39 0.44 0.47 0.33 LR imputed 3 weighted F1 score
0.45 0.5 0.6 0.49 0.39 SVM imputed 3 accuracy
0 0 0 0.15 0 SVM imputed 3 miss classification rate
0.27 0.33 0.45 0.32 0.22 SVM imputed 3 weighted F1 score
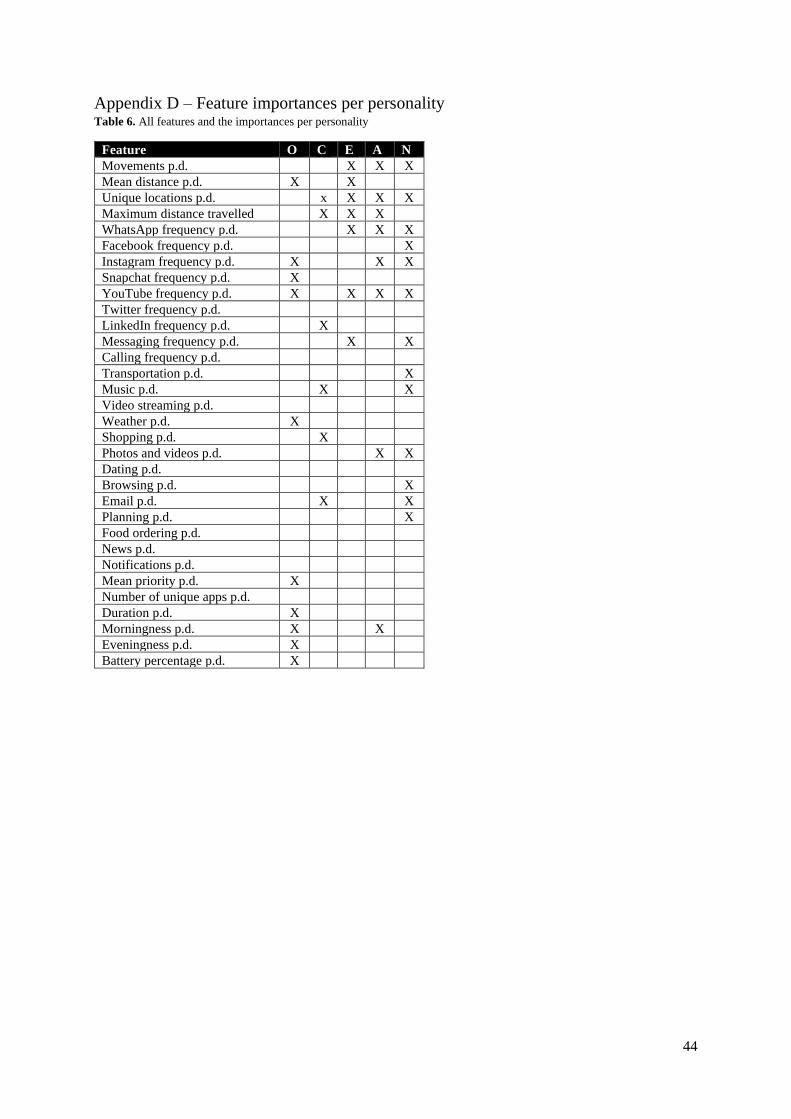
44
Appendix D – Feature importances per personality Table 6. All features and the importances per personality
Feature O C E A N
Movements p.d. X X X
Mean distance p.d. X X
Unique locations p.d. x X X X
Maximum distance travelled X X X
WhatsApp frequency p.d. X X X
Facebook frequency p.d. X
Instagram frequency p.d. X X X
Snapchat frequency p.d. X
YouTube frequency p.d. X X X X
Twitter frequency p.d.
LinkedIn frequency p.d. X
Messaging frequency p.d. X X
Calling frequency p.d.
Transportation p.d. X
Music p.d. X X
Video streaming p.d.
Weather p.d. X
Shopping p.d. X
Photos and videos p.d. X X
Dating p.d.
Browsing p.d. X
Email p.d. X X
Planning p.d. X
Food ordering p.d.
News p.d.
Notifications p.d.
Mean priority p.d. X
Number of unique apps p.d.
Duration p.d. X
Morningness p.d. X X
Eveningness p.d. X
Battery percentage p.d. X
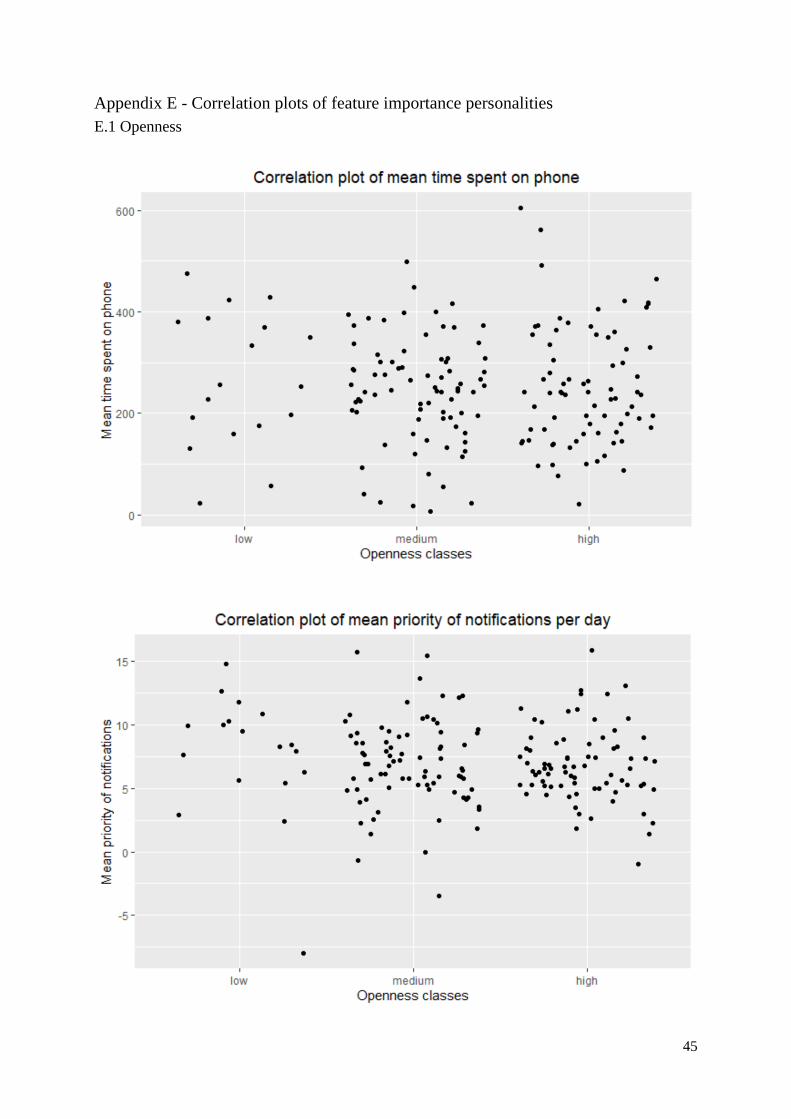
45
Appendix E - Correlation plots of feature importance personalities
E.1 Openness
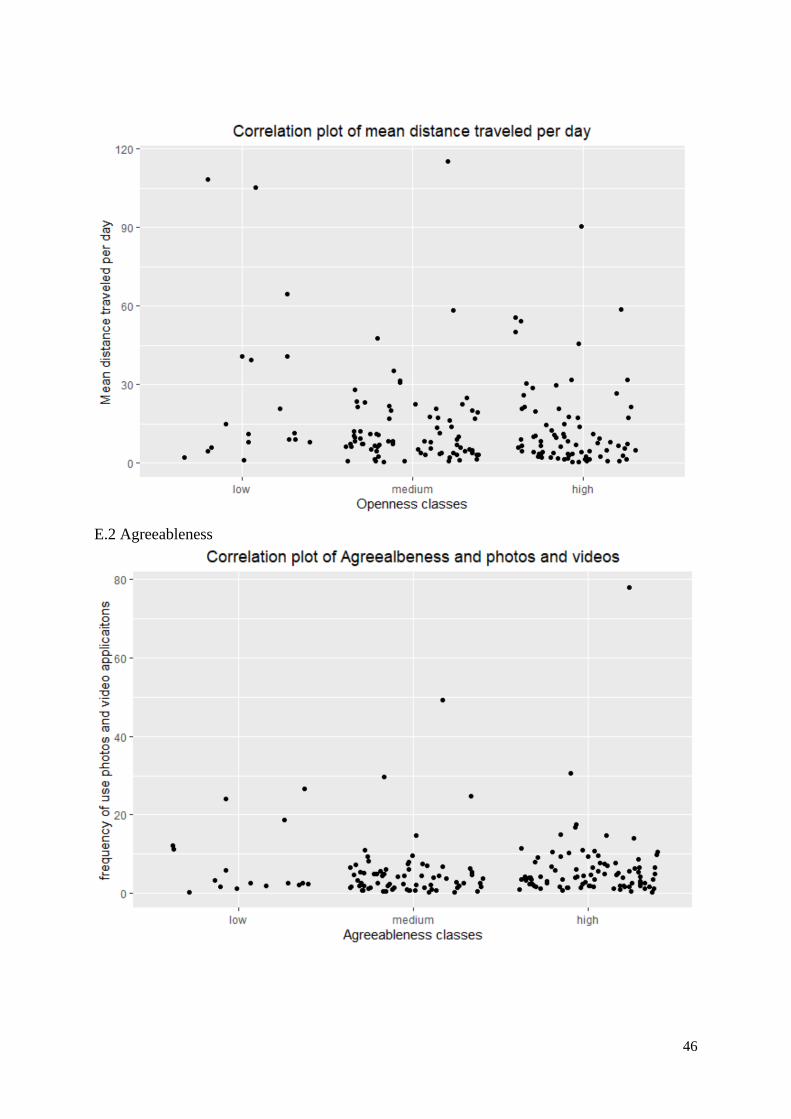
46
E.2 Agreeableness

47

48
E.3 Neuroticism
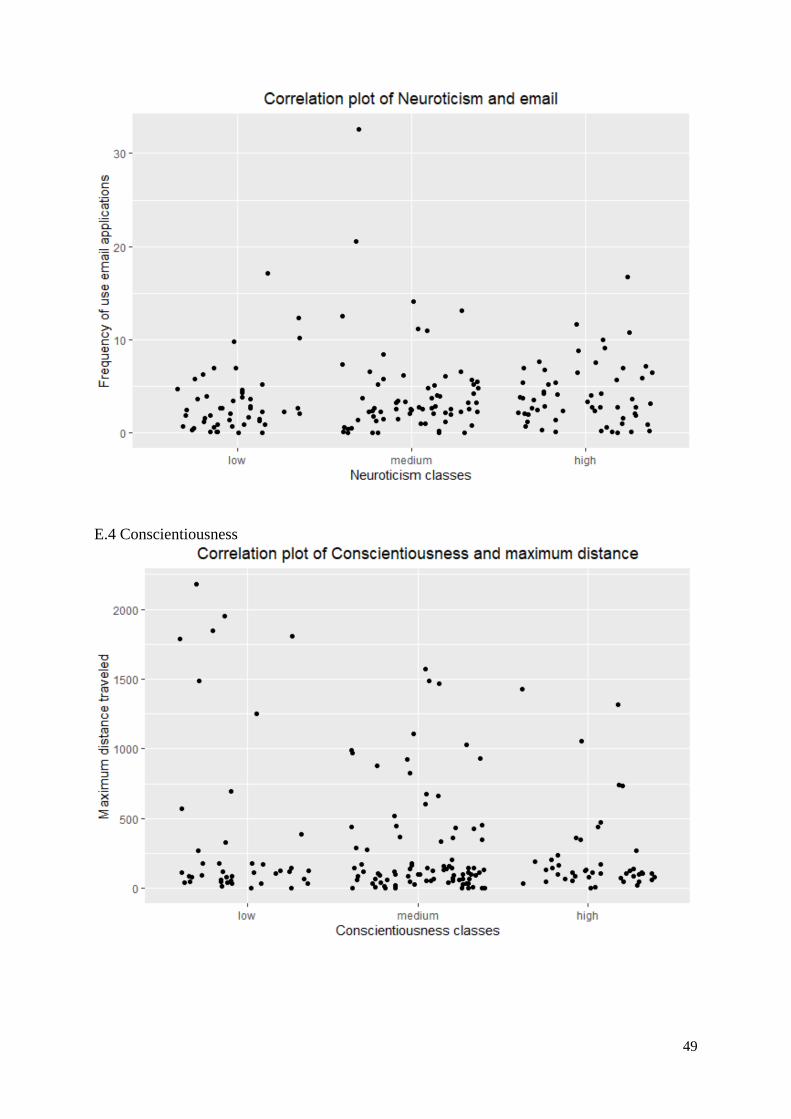
49
E.4 Conscientiousness

50

51
E.5 Extraversion

52
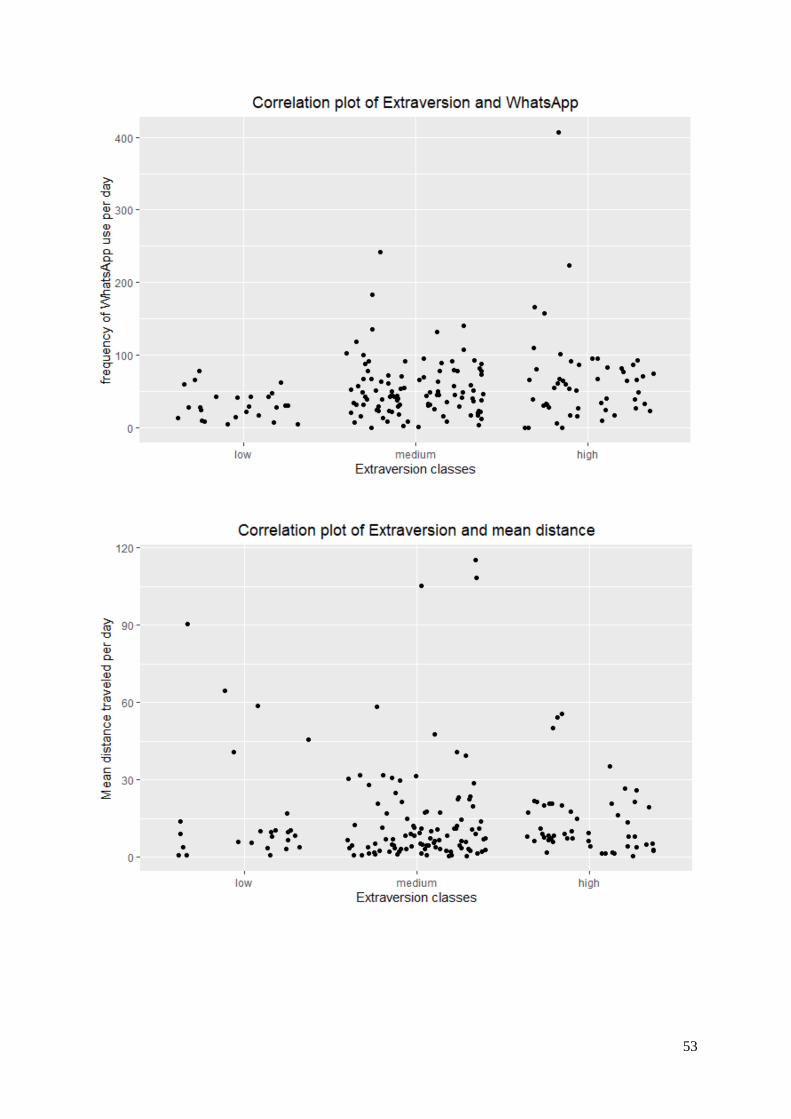
53

54
Appendix F - Correlation plots all features
F.1 Correlation heat all features
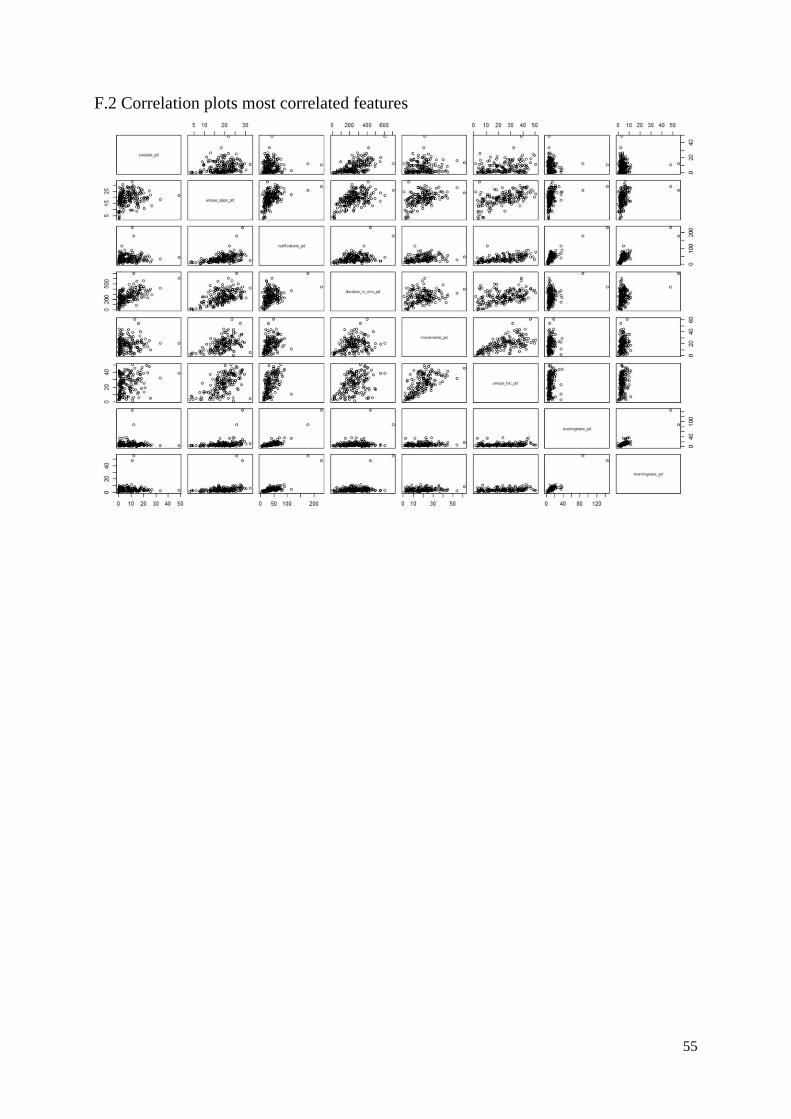
55
F.2 Correlation plots most correlated features