
Predicting overfishing and extinction threats in multispecies fisheries
6
Predicting overfishing and extinction threats in multispecies fisheries Matthew G. Burgess a,1 , Stephen Polasky b,1 , and David Tilman a,c Departments of a Ecology, Evolution, and Behavior and b Applied Economics, University of Minnesota, St. Paul, MN 55108; and c Bren School of the Environment, University of California, Santa Barbara, CA 93106 Contributed by Stephen Polasky, July 30, 2013 (sent for review November 21, 2012) Threats to species from commercial fishing are rarely identified until species have suffered large population declines, by which time remedial actions can have severe economic consequences, such as closure of fisheries. Many of the species most threatened by fishing are caught in multispecies fisheries, which can remain profitable even as populations of some species collapse. Here we show for multispecies fisheries that the biological and socioeco- nomic conditions that would eventually cause species to be se- verely depleted or even driven extinct can be identified decades before those species experience high harvest rates or marked population declines. Because fishing effort imposes a common source of mortality on all species in a fishery, the long-term impact of a fishery on a species is predicted by measuring its loss rate relative to that of species that influence the fishery’s maximal effort. We tested our approach on eight Pacific tuna and billfish populations, four of which have been identified recently as in de- cline and threatened with overfishing. The severe depletion of all four populations could have been predicted in the 1950s, using our approach. Our results demonstrate that species threatened by hu- man harvesting can be identified much earlier, providing time for adjustments in harvesting practices before consequences become severe and fishery closures or other socioeconomically disruptive interventions are required to protect species. early warning | preventative management | overharvesting | mechanistic | assessment M arine fisheries are an important global source of food and livelihoods (1–4), but there are concerns that current fishing practices threaten some marine species with severe de- pletion or eventual extinction (2–5). Many of the largest com- mercial fishing methods, such as trawling, longlining, and seining, unavoidably catch multiple species simultaneously (6–9). Multi- species fisheries pose a particular threat of extinction or severe de- pletion because fishing can remain profitable as long as some valuable species remain abundant, even while others collapse (6–11). In contrast, in a single-species fishery profits tend to fall as the target population declines, thereby removing the incentive to fish before extinction occurs (10). Multispecies fisheries pose a threat to two types of species or stocks (populations): (i ) commercially valued species, called “weak stocks”, which are more vulnerable to over- harvesting than are other commercially valuable species (6), and (ii ) by-catch species, which are caught accidentally and create little economic incentive to cease fishing as their populations collapse because they have little or no commercial value (7–9). Failure to prevent collapse of weak stocks and by-catch species can impose substantial long-term environmental and economic costs. Slow-growing populations are most likely to collapse, but can take several decades to recover (5). Recovery often requires long-term fishery closures or reductions in effort, having sub- stantial economic and social consequences (3, 5). Moreover, population declines caused by one fishery can diminish yields and profits in other commercial or artisanal fisheries that depend on the same species (e.g., ref. 12). Despite these costs, species threatened by fishing have rarely been identified until after their populations have declined substantially (2–5, 7, 8). Assessments of fishery impacts on spe- cies mostly focus on estimating current exploitation rates or past population trends (13–15), which identifies already declining species rather than predicting future declines. Data limitations have made empirical prediction of future threats from fishing challenging, particularly for weak stocks and by-catch species. Oceans are difficult to sample extensively, and few economic incentives exist to gather data on species other than the most commercially valued species (7, 8). Some predictive models (e.g., ref. 16) have been developed to forecast the impacts of some fisheries, but these are often data intensive. Some of the char- acteristics that make a population susceptible to overfishing are well known—for example, low population growth rates (3–11, 17, 18), high value and/or low fishing costs (10, 11, 17–19), and schooling behavior (18). Recently, some correlative approaches based on these characteristics have been developed for assessing likely relative threats to data-poor species (4, 20–22). However, predicting the severity of future threats in absolute terms with this type of approach can be challenging. Here, we present a mechanistic approach that uses readily available data to predict the potential of current fishing practi- ces, if maintained, to eventually cause a population to be driven extinct or “overfished”, here defined as depletion below its maximum sustainable yield (MSY) abundance (N MSY ) (3). Our approach identifies combinations of biological and socioeco- nomic conditions that are likely to eventually lead to high mor- tality rates and population declines. As we show, these conditions can be identified long before either occurs. We test the predictive power of our approach on eight tuna and billfish populations of the Western and Central Pacific Significance Threats to species from commercial fishing are rarely identified until species have suffered large population declines, by which time recovery can require costly remedial actions, such as fishery closures. We present a mechanistic approach to pre- dicting the threats of future extinction or severe depletion posed by current multispecies fishing practices to a given population. We show that severe depletions recently experi- enced by four Pacific tuna and billfish populations could have been predicted in the 1950s, using our approach. Our results demonstrate that threatened species can be identified long before they experience severe population declines, providing time for preventative adjustments in fishing practices before consequences become severe and fishery closures or other socioeconomically disruptive interventions are required to protect species. Author contributions: M.G.B. designed research; M.G.B., S.P., and D.T. performed re- search; and M.G.B., S.P., and D.T. wrote the paper. The authors declare no conflict of interest. See Commentary on page 15859. 1 To whom correspondence may be addressed. E-mail: [email protected] or mgburgess@ umn.edu. This article contains supporting information online at www.pnas.org/lookup/suppl/doi:10. 1073/pnas.1314472110/-/DCSupplemental. www.pnas.org/cgi/doi/10.1073/pnas.1314472110 PNAS | October 1, 2013 | vol. 110 | no. 40 | 15943–15948 SUSTAINABILITY SCIENCE ECOLOGY SEE COMMENTARY
-
Upload
univ-ovidius -
Category
Documents
-
view
2 -
download
0
Transcript of Predicting overfishing and extinction threats in multispecies fisheries
Predicting overfishing and extinction threats inmultispecies fisheriesMatthew G. Burgessa,1, Stephen Polaskyb,1, and David Tilmana,c
Departments of aEcology, Evolution, and Behavior and bApplied Economics, University of Minnesota, St. Paul, MN 55108; and cBren School of theEnvironment, University of California, Santa Barbara, CA 93106
Contributed by Stephen Polasky, July 30, 2013 (sent for review November 21, 2012)
Threats to species from commercial fishing are rarely identifieduntil species have suffered large population declines, by whichtime remedial actions can have severe economic consequences,such as closure of fisheries. Many of the species most threatenedby fishing are caught in multispecies fisheries, which can remainprofitable even as populations of some species collapse. Here weshow for multispecies fisheries that the biological and socioeco-nomic conditions that would eventually cause species to be se-verely depleted or even driven extinct can be identified decadesbefore those species experience high harvest rates or markedpopulation declines. Because fishing effort imposes a commonsource of mortality on all species in a fishery, the long-term impactof a fishery on a species is predicted by measuring its loss raterelative to that of species that influence the fishery’s maximaleffort. We tested our approach on eight Pacific tuna and billfishpopulations, four of which have been identified recently as in de-cline and threatened with overfishing. The severe depletion of allfour populations could have been predicted in the 1950s, using ourapproach. Our results demonstrate that species threatened by hu-man harvesting can be identified much earlier, providing time foradjustments in harvesting practices before consequences becomesevere and fishery closures or other socioeconomically disruptiveinterventions are required to protect species.
early warning | preventative management | overharvesting | mechanistic |assessment
Marine fisheries are an important global source of food andlivelihoods (1–4), but there are concerns that current
fishing practices threaten some marine species with severe de-pletion or eventual extinction (2–5). Many of the largest com-mercial fishing methods, such as trawling, longlining, and seining,unavoidably catch multiple species simultaneously (6–9). Multi-species fisheries pose a particular threat of extinction or severe de-pletion because fishing can remain profitable as long as somevaluable species remain abundant, even while others collapse(6–11). In contrast, in a single-species fishery profits tend to fall asthe target populationdeclines, thereby removing the incentive tofishbefore extinction occurs (10). Multispecies fisheries pose a threat totwo types of species or stocks (populations): (i) commercially valuedspecies, called “weak stocks”, which are more vulnerable to over-harvesting than are other commercially valuable species (6), and (ii)by-catch species, which are caught accidentally and create littleeconomic incentive to cease fishing as their populations collapsebecause they have little or no commercial value (7–9).Failure to prevent collapse of weak stocks and by-catch species
can impose substantial long-term environmental and economiccosts. Slow-growing populations are most likely to collapse, butcan take several decades to recover (5). Recovery often requireslong-term fishery closures or reductions in effort, having sub-stantial economic and social consequences (3, 5). Moreover,population declines caused by one fishery can diminish yields andprofits in other commercial or artisanal fisheries that depend onthe same species (e.g., ref. 12).Despite these costs, species threatened by fishing have rarely
been identified until after their populations have declined
substantially (2–5, 7, 8). Assessments of fishery impacts on spe-cies mostly focus on estimating current exploitation rates or pastpopulation trends (13–15), which identifies already decliningspecies rather than predicting future declines. Data limitationshave made empirical prediction of future threats from fishingchallenging, particularly for weak stocks and by-catch species.Oceans are difficult to sample extensively, and few economicincentives exist to gather data on species other than the mostcommercially valued species (7, 8). Some predictive models (e.g.,ref. 16) have been developed to forecast the impacts of somefisheries, but these are often data intensive. Some of the char-acteristics that make a population susceptible to overfishing arewell known—for example, low population growth rates (3–11, 17,18), high value and/or low fishing costs (10, 11, 17–19), andschooling behavior (18). Recently, some correlative approachesbased on these characteristics have been developed for assessinglikely relative threats to data-poor species (4, 20–22). However,predicting the severity of future threats in absolute terms withthis type of approach can be challenging.Here, we present a mechanistic approach that uses readily
available data to predict the potential of current fishing practi-ces, if maintained, to eventually cause a population to be drivenextinct or “overfished”, here defined as depletion below itsmaximum sustainable yield (MSY) abundance (NMSY) (3). Ourapproach identifies combinations of biological and socioeco-nomic conditions that are likely to eventually lead to high mor-tality rates and population declines. As we show, these conditionscan be identified long before either occurs.We test the predictive power of our approach on eight tuna
and billfish populations of the Western and Central Pacific
Significance
Threats to species from commercial fishing are rarely identifieduntil species have suffered large population declines, by whichtime recovery can require costly remedial actions, such asfishery closures. We present a mechanistic approach to pre-dicting the threats of future extinction or severe depletionposed by current multispecies fishing practices to a givenpopulation. We show that severe depletions recently experi-enced by four Pacific tuna and billfish populations could havebeen predicted in the 1950s, using our approach. Our resultsdemonstrate that threatened species can be identified longbefore they experience severe population declines, providingtime for preventative adjustments in fishing practices beforeconsequences become severe and fishery closures or othersocioeconomically disruptive interventions are required toprotect species.
Author contributions: M.G.B. designed research; M.G.B., S.P., and D.T. performed re-search; and M.G.B., S.P., and D.T. wrote the paper.
The authors declare no conflict of interest.
See Commentary on page 15859.1To whom correspondence may be addressed. E-mail: [email protected] or [email protected].
This article contains supporting information online at www.pnas.org/lookup/suppl/doi:10.1073/pnas.1314472110/-/DCSupplemental.
www.pnas.org/cgi/doi/10.1073/pnas.1314472110 PNAS | October 1, 2013 | vol. 110 | no. 40 | 15943–15948
SUST
AINABILITY
SCIENCE
ECOLO
GY
SEECO
MMEN
TARY
Ocean fisheries. High-seas tuna and billfish have elicited recentconservation concern due to significant population declines andrange contractions found in many species (17, 23, 24). Three ofthe populations in our study, bigeye tuna (Thunnus obesus) andboth the northern and the southern striped marlin (Tetrapturusaudax) populations, have been recently identified as experiencingoverfishing—meaning their exploitation rates have exceeded theMSY exploitation rate (FMSY) (24–27). A fourth, blue marlin(Makaira nigricans), whose overfishing status has been subject toconsiderable uncertainty (28), has undergone a significant pop-ulation decline and range contraction (13, 23, 28). We determinewhether our approach could have predicted threats to these fourpopulations, using data from as early as the 1950s, and assess thethreats predicted by the latest available data to all populations.
The Eventual Threat Index (T)The central premise of our approach is that the shared threat ofeffort in a given multispecies fishery links the fates of species ina way that allows the fates of all species to be predicted if the fateof any one species can be predicted. The fates of some “key”species can be predicted based on their influence on the eco-nomic or regulatory factors that determine maximum fishing ef-fort in the fishery. Other species’ fates can be predicted bymeasuring their vulnerabilities to long-term depletion by thefishery relative to the key species. For the purposes of our ap-proach, we define a “species” at the population level and a “fish-ery” as a group of fishermen using a particular type of gear totarget a particular group of species in a particular region, withroughly uniform relative catch rates of the species (29).For each fishery, j, we measure the “vulnerability” to long-
term depletion of species i at time t [denoted Vij(t)], using threepopulation-specific pieces of data that are readily available formany fisheries: population size [N(t)] (e.g., ref. 30), averagecatch-per-unit effort [CPUE(t)] (e.g., ref. 31), and maximum per-capita growth rate (r) (e.g., refs. 30, 32):
VijðtÞ=CPUEijðtÞriNiðtÞ : [1]
Vulnerability measures the fraction of species i’s maximum pop-ulation growth rate [riNi(t)] lost on average to each unit of fishingeffort (e.g., hooks, days fished, etc.) (10, 11). Because fishingeffort is shared by all species, the fishery’s relative long-termimpacts on different species can be predicted by measuring theirrelative vulnerabilities as defined in Eq. 1 (Fig. 1A). We derivethe mathematical properties of relative vulnerabilities in a gen-eral theoretical model in SI Materials and Methods. In general,effort levels greater than 1/V put a species on a path to extinc-tion, as this implies the total catch rate (CPUE*Effort) is largerthan the maximum population growth rate (rN).If a fishery is profitable, effort increases until either profit
declines to zero because commercially valued species becomedepleted (10, 11) or regulations prevent further increase becausespecies protected by management become depleted (Fig. 1 B andC). Profitability or regulations thus impose an upper bound onfishing effort in the fishery that determines which species willlikely experience a severe decline or extinction.Except in rare cases (19, 33), a fishery would be expected to
cease operation before all of its commercially valued species aredriven extinct, due to a lack of profitability, regulatory inter-vention, or both (e.g., ref. 34). Thus, there is at least one speciesin most fisheries whose importance to the fishery’s profits orregulations ensures that the fishery will close before this speciesis driven extinct. Because high profits and nonbinding limits onthe exploitation of managed species in a fishery tend to lead toincreases in effort (10, 11), most fisheries also have one or morecommercially valued or managed species that are likely to be ex-ploited at least at a minimum rate. Species having both of theseproperties are key species because their long-term fates are most
easily predicted or bounded. We predict the long-term threat ofcurrent fishing practices to a given species by calculating its vulner-ability relative to a key species in each fishery in which it is caught.In a managed fishery, the most vulnerable species targeted by
management is a likely key species, as fishing effort is likely toincrease only until this species reaches the minimum populationsize or maximum exploitation rate allowed by management (Fig.1C). In an unmanaged fishery, the species generating the mostrevenue is a likely key species, as its importance to the fishery’sprofits will likely prevent it from being either driven extinct orunderexploited (10, 11). In the analysis presented here, we iden-tify key species in this manner. However, our approach to threat
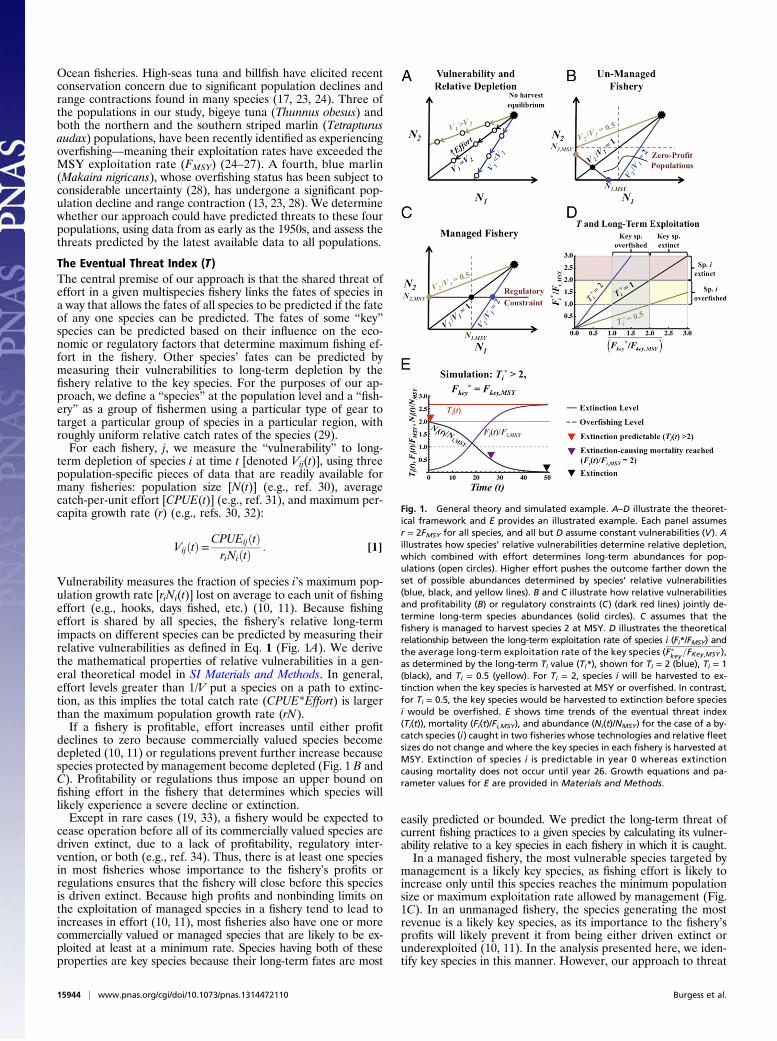
Fig. 1. General theory and simulated example. A–D illustrate the theoret-ical framework and E provides an illustrated example. Each panel assumesr = 2FMSY for all species, and all but D assume constant vulnerabilities (V). Aillustrates how species’ relative vulnerabilities determine relative depletion,which combined with effort determines long-term abundances for pop-ulations (open circles). Higher effort pushes the outcome farther down theset of possible abundances determined by species’ relative vulnerabilities(blue, black, and yellow lines). B and C illustrate how relative vulnerabilitiesand profitability (B) or regulatory constraints (C) (dark red lines) jointly de-termine long-term species abundances (solid circles). C assumes that thefishery is managed to harvest species 2 at MSY. D illustrates the theoreticalrelationship between the long-term exploitation rate of species i (Fi*/FMSY) andthe average long-term exploitation rate of the key species (Fpkey=FKey,MSY ),as determined by the long-term Ti value (Ti*), shown for Ti = 2 (blue), Ti = 1(black), and Ti = 0.5 (yellow). For Ti = 2, species i will be harvested to ex-tinction when the key species is harvested at MSY or overfished. In contrast,for Ti = 0.5, the key species would be harvested to extinction before speciesi would be overfished. E shows time trends of the eventual threat index(Ti(t)), mortality (Fi(t)/Fi,MSY), and abundance (Ni(t)/NMSY) for the case of a by-catch species (i) caught in two fisheries whose technologies and relative fleetsizes do not change and where the key species in each fishery is harvested atMSY. Extinction of species i is predictable in year 0 whereas extinctioncausing mortality does not occur until year 26. Growth equations and pa-rameter values for E are provided in Materials and Methods.
15944 | www.pnas.org/cgi/doi/10.1073/pnas.1314472110 Burgess et al.
prediction is robust to many other approaches to identifying keyspecies (SI Materials and Methods). For instance, if a key speciescould be profitably driven extinct due to the presence of anothervalued species that is more robust, the other valued species wouldbecome the key long before the first was near extinction.Fish species are typically caught in multiple fisheries so to be
practical the threat measure must capture the vulnerability toharvest of each species across all of the fisheries in which it iscaught. For each fishery, we measure its impact on species i rel-ative to that fishery’s key species at time t, using the ratio, Vij(t)/Vkey,j(t). This ratio can also be measured by replacing measures ofCPUE in Eq. 1 with total catch in the fishery, if this is easier tomeasure, as effort will cancel out (Catch = CPUE*Effort). Wemeasure the combined threat of all fisheries to species i at time tby calculating the “eventual threat index”, Ti(t),
TiðtÞ=Xj
��VijðtÞ
Vkey; jðtÞ��
Catchkey; jjðtÞPkCatchkey; jkðtÞ
��: [2]
Ti(t) sums the Vij(t)/Vkey,j(t) ratios for all fisheries catching spe-cies i, including where species i is a key species, and weights theVij(t)/Vkey,j(t) for each fishery j by the catch of its key species inyear t (Catchkey,jj(t)) as a fraction of its key species’ total catchfrom all fisheries in year t (
PkCatchkey,jk(t)).
If fishing practices and relative efforts in different fisheries donot change, then Ti(t) becomes a constant through time, denotedTi*, even as total effort changes (SI Materials and Methods).Fishery managers commonly evaluate threats to populations bycomparing their estimated abundances (N) and mortality rates(F, where F = Catch/N) to those producing MSY (NMSY andFMSY) (e.g., refs. 3, 4, 24–28, 30). With the common assumptionin fisheries that the fishing mortality rate, F at MSY for a species,FMSY, is half of its maximum growth rate, r (35), Ti* can be shown(SI Materials and Methods) to have the useful property
F pi
Fi;MSY=T p
i
F pkey
Fkey;MSY
!; [3a]
where Fi* is species i’s long-term fishing mortality rate, and� Fpkey
Fkey;MSY
�is a weighted average of the long-term fishing mortality
rates of the key species of fisheries catching species i. Thus, Ti(t)predicts the long-term mortality rate (F) that current fishingpractices at time t would eventually impose on species i relativeto the key species of the fisheries in which it is caught, were thesefishing practices to continue indefinitely (Fig. 1D).Managed fisheries often aim to maintain their target species at
their MSY populations (2–4). This would mean that� Fp
key
Fkey;MSY
�= 1
if all fisheries were well managed, and consequently the fishingmortality rate of species i (Fi/FMSY) would approach Ti* in thelong term (i.e., Fi*/Fi,MSY = Ti*). Fig. 1E illustrates this propertyin a simulation model (Materials and Methods). Unmanaged fish-
eries tend to overfish their target species (10, 11) [i.e.,� Fp
key
Fkey;MSY
�> 1].
Because key species are unlikely to be driven extinct by theirfisheries (10, 11, 34), it can be assumed that an upper bound onfishing effort is set by Fkey* ≤ r (i.e., harvest rate ≤ maximumgrowth rate) for all key species. Because we are assuming FMSY =
r/2, this implies� Fp
key
Fkey;MSY
�< 2. Thus, it is reasonable to assume that
T pi ≤
F pi
Fi;MSY< 2T p
i : [3b]
Under these assumptions, measured Ti(t) values should beinterpreted as implying that current fishing practices at time t
pose a high threat of species i’s eventual extinction if Ti(t) ≥ 2(because this implies Fi* ≥ ri), a high threat of eventual overfishingand a possible threat of extinction with poor management if 1 <Ti(t) < 2, a possible threat of overfishing with poor managementif 0.5 < Ti(t) ≤ 1, and a very low threat of overfishing if Ti(t) ≤ 0.5(Fig. 1D). Fishing gear, targeting behaviors, and managementoften change in response to evolving technology (e.g., ref. 36),markets (e.g., ref. 37), or political climate. Thus, Ti(t) should beremeasured on a regular basis.If assuming that r = 2FMSY or that MSY is a measurable
and desired target for management is inappropriate (e.g., ref.38), our index, Ti(t), can still be used to predict threats, butthe threshold values for interpretation (Ti(t) = 2, 1, 0.5)would need to be adjusted (SI Materials and Methods). Our ap-proach can also be adapted to incorporate age structure, by al-tering the procedure for measuring vulnerabilities (SI Materialsand Methods).
Case Study: Western and Central Pacific Tuna and BillfishTo test our approach, we use historical data for eight tuna andbillfish populations of the Western and Central Pacific (39) toestimate yearly T values from the 1950s to the present time, usingEqs. 1 and 2. We compare each population’s earliest possible Tand V estimates (1953–1967, depending on the population) totheir observed abundance and exploitation trends from theseearly years up until the most recent year for which data areavailable (1997–2009, depending on the population) (Figs. 2–4)(24–28, 30, 40–44) (SI Materials and Methods). These pop-ulations are the northern and southern populations of Pacificalbacore tuna (Thunnus alalunga), bigeye tuna (T. obesus), bluemarlin (M. nigricans), the northern and southern Pacific stripedmarlin (T. audax), North Pacific swordfish (Xiphias gladius), andyellowfin tuna (Thunnus albacares). Northern and southernpopulations of some species are treated separately because theyare considered ecologically distinct (25, 26, 40, 42, 43). We useinternational catch data from longline, purse-seine, and pole-and-line fisheries (31) (Fig. 3), together accounting for 92% ofall reported tuna and swordfish catch in this region in 2010 (45).For the purposes of estimating T, we define “fisheries” spatiallyby dividing the Western and Central Pacific Fisheries Commis-sion (WCPFC) Convention area (39) into 15 regions (Fig. S1)(∼30° × 30°), having roughly uniform relative catch rates withinfisheries (45). We also distinguish between shallow- and deep-setlongline catch and between purse-seine catch from schools as-sociated and unassociated with floating objects, as these areknown to have different catch rates (46, 47). We also tried otherways of distinguishing fisheries for our analysis and found ourpredictions were robust to these alternatives (SI Materials andMethods and Fig. S2). We estimate historical T values, assumingopen access, as there was little international management ofthese fisheries before the 1980s (48). For all populations, we findour T estimates robust to considerations of older data limitations(SI Materials and Methods). We use 3-y moving geometric aver-ages of T to reduce noise. We compare T values to averageannual fishing mortality rates (denoted U) (30) from the fisheriesstudied (UCombined = combined catch/average population bio-mass) (Fig. 2 and SI Materials and Methods) instead of in-stantaneous fishing mortality (F), as the latter is difficult toestimate without seasonal and size- or age-structured catch andpopulation data, which are not publicly available for these fish-eries (31). For the same reason, we also use average annualmeasures of CPUE and maximum per-capita growth rate in es-timating V and T (SI Materials and Methods).Longline fishing effort began to expand rapidly in the 1950s
and 1960s, using predominantly shallow sets targeting bigeye andyellowfin tuna in northern and equatorial regions and albacoretuna in southern regions (31, 49) (Fig. 3 and Table S1). Therewas little effort in the purse-seine and pole-and-line fisheries(31). At this time, T estimates (Fig. 2) predicted that NorthPacific swordfish and all three marlin populations were on paths
Burgess et al. PNAS | October 1, 2013 | vol. 110 | no. 40 | 15945
SUST
AINABILITY
SCIENCE
ECOLO
GY
SEECO
MMEN
TARY
toward extinction (T > 2), South Pacific albacore and bigeye tunawere on paths toward overfishing (1 < T < 2), and there were lowthreats to yellowfin and North Pacific albacore tuna (T ≤ 0.5). Inthe mid-1970s, the tuna-targeting longline fishery largely shiftedtoward using deeper sets, with many of the remaining shallowsets targeting swordfish (49) (Fig. 3 and Table S1). This shift infishing technology led to reductions in the threat level predictedby T for most species (Figs. 2 and 3) because the profits from theshallow-set longline fishery were now heavily dependent in manyplaces on swordfish, which has high vulnerability relative to otherspecies (Table S1). This limited the capacity of the shallow-setswordfish fishery to threaten other species. Additionally, thecatch rates of swordfish and albacore tuna were lower in thedeep-set longline fisheries that were targeting bigeye and yel-lowfin. As a result of this technological shift, T estimates forNorth Pacific swordfish, South Pacific albacore tuna, and blue
marlin no longer indicated a threat beginning in the late 1970sand continuing to the early 1990s (Figs. 2–4). Also in the 1970s,the purse-seine and pole-and-line fisheries began to expand,targeting primarily skipjack tuna (Katsuwonus pelamis), withyellowfin and bigeye tuna as significant by-catch (31, 47), par-ticularly in purse-seine sets targeting schools associated withfloating objects (47). This led to increases in T values for yel-lowfin and bigeye tuna. An eventual threat to yellowfin is pre-dicted beginning in the early 1990s (T > 1) (Figs. 2 and 4) as anincreasing fraction of purse-seine landings came from purse-seinesets targeting associated schools (Fig. 3).T values from as early as the 1950s have consistently predicted
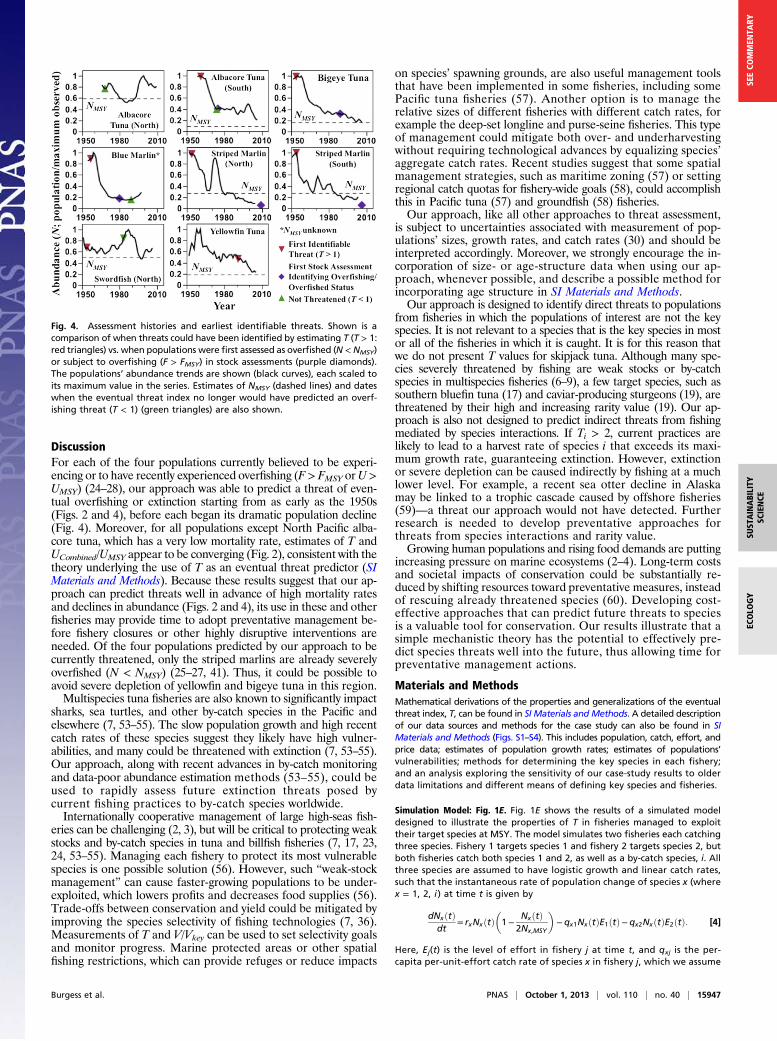
threats of eventual extinction (T ≥ 2) or overfishing (T > 1) fromthen-current fishing technologies for both northern and southernstriped marlin populations (extinction), for blue marlin (extinc-tion, pre-1975, and overfishing until the 1990s), and for bigeyetuna (overfishing) (Figs. 2 and 4). As predicted, all four of thesepopulations eventually did experience mortality rates from thesefisheries (UCombined) exceeding UMSY, but not until decades afterT values predicted this (Fig. 2). Our predictions provided awarning beginning 40 y before this occurred for bigeye tuna andSouth Pacific striped marlin. These four populations also sufferedsignificant population declines and have abundances currently ei-ther at (bigeye tuna) or below (striped marlin) NMSY (25–27) (Fig.4). Blue marlin’s NMSY is unknown (28). These depletions wereonly recognized three or more decades after they could have beenpredicted by measuring T (Fig. 4). Blue marlin has also experi-enced a significant range contraction in this region (23). The firststock assessments identifying these populations as overfished(N < NMSY) or experiencing overfishing (F > FMSY or U >UMSY) came out in the 1980s or later (25–28, 50, 51) (Fig. 4).T values from the last two decades predict a threat of eventual
overfishing to yellowfin tuna (Fig. 2). Although it has not yetbecome overfished (N > NMSY, UCombined < UMSY) (Figs. 2 and 4)(41), its mortality rate is steadily increasing (Fig. 2), and it hasundergone a marked population decline since T predicteda threat (Fig. 4). Early T values (1950–1970) indicated a threat toSouth Pacific albacore tuna (Fig. 2), and it suffered a significantdecline during that period, leading to concern for an overfishingthreat in an early stock assessment (52) (Fig. 4). More recent Tvalues (post-1970s) have not indicated a threat (Fig. 2), and it isnot currently considered to be overfished or experiencingoverfishing (24, 40). Its population has been relatively stable(Fig. 4). Similarly, more recent T values for North Pacificswordfish and albacore tuna do not indicate a threat and neitherpopulation appears to be on a trajectory toward overfishing (42,43) (Figs. 2 and 4).Our most recent estimates of T, under the assumption of open
access, suggest that the northern and southern striped marlinpopulation and yellowfin and bigeye tuna face severe overfishing,and the striped marlin populations may face extinction (Figs. 2and 4), if these fisheries are poorly managed and current tech-nologies remain the same. The striped marlin populations areparticularly threatened by deep-set longline fisheries; and yel-lowfin and bigeye tuna are particularly threatened by purse-seinefisheries targeting schools associated with floating objects (Fig.3). Purse-seine fisheries targeting associated schools have re-ceived recent conservation attention (47). However, shallow-setlongline fisheries have received far more conservation attentionthan deep-set fisheries, as shallow sets tend to have higher by-catch rates (46). Because of the key species’ (bigeye and yel-lowfin tuna) relatively lower vulnerabilities in the deep-set fish-ery, our results suggest that effort in the deep-set fishery hasa greater potential to profitably increase in the future. If thisoccurs, striped marlin would be highly impacted. Althougha continued expansion of purse-seine fishing might mitigate someof the threat to the striped marlin by depleting yellowfin andbigeye tuna, the possible threat of deep-set longline fisheriesmerits further study.
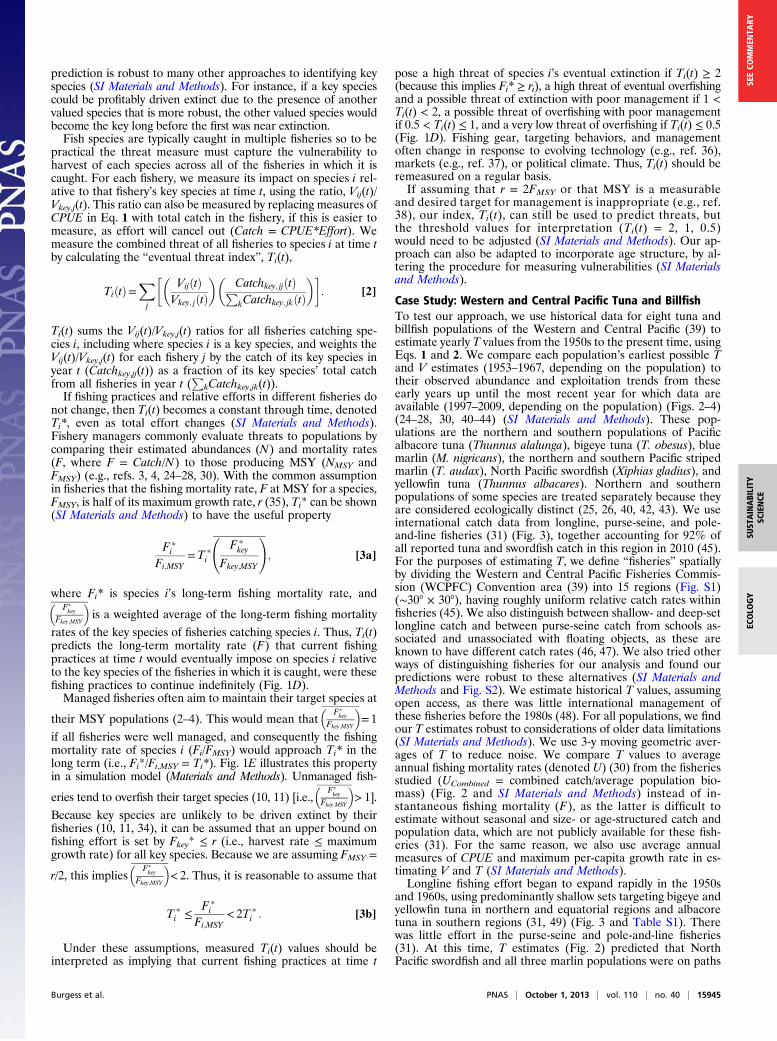
Fig. 2. Exploitation histories and estimable T values. A comparison ofeventual threat index values [T (3-y geometric mean), red] to the combinedfishing mortality rates (UCombined) from longline, purse-seine, and pole-and-line fisheries as a fraction of the mortality rate producing MSY (UMSY),(UCombined/UMSY, purple), for each population. Levels indicating high extinc-tion threats (T, UCombined/UMSY = 2) (solid black lines), high overfishingthreats (T, UCombined/UMSY = 1) (dashed black lines), and low overfishingthreats (T = 0.5) (dotted black lines) are shown.
Fig. 3. Gear-specific threats. Fishing gear-specific estimates of threats (3-ygeometric mean T values summed only over fisheries within each gear type)are shown. T values of 2 (solid line) (high extinction threat), 1 (dashed line)(high overfishing threat), and 0.5 (dotted line) (low overfishing threat) arehighlighted. The shift in longline fishing toward deeper sets beginning inthe 1970s led to a reduction in the threat caused by the shallow-set longlinefishery to all populations and introduced a threat from the deep-set fisheryto striped marlin populations. Purse-seine fisheries have recently begun topose a threat to bigeye and yellowfin tuna.
15946 | www.pnas.org/cgi/doi/10.1073/pnas.1314472110 Burgess et al.
DiscussionFor each of the four populations currently believed to be experi-encing or to have recently experienced overfishing (F> FMSY orU>UMSY) (24–28), our approach was able to predict a threat of even-tual overfishing or extinction starting from as early as the 1950s(Figs. 2 and 4), before each began its dramatic population decline(Fig. 4). Moreover, for all populations except North Pacific alba-core tuna, which has a very low mortality rate, estimates of T andUCombined/UMSY appear to be converging (Fig. 2), consistent with thetheory underlying the use of T as an eventual threat predictor (SIMaterials and Methods). Because these results suggest that our ap-proach can predict threats well in advance of high mortality ratesand declines in abundance (Figs. 2 and 4), its use in these and otherfisheries may provide time to adopt preventative management be-fore fishery closures or other highly disruptive interventions areneeded. Of the four populations predicted by our approach to becurrently threatened, only the striped marlins are already severelyoverfished (N < NMSY) (25–27, 41). Thus, it could be possible toavoid severe depletion of yellowfin and bigeye tuna in this region.Multispecies tuna fisheries are also known to significantly impact
sharks, sea turtles, and other by-catch species in the Pacific andelsewhere (7, 53–55). The slow population growth and high recentcatch rates of these species suggest they likely have high vulner-abilities, and many could be threatened with extinction (7, 53–55).Our approach, along with recent advances in by-catch monitoringand data-poor abundance estimation methods (53–55), could beused to rapidly assess future extinction threats posed bycurrent fishing practices to by-catch species worldwide.Internationally cooperative management of large high-seas fish-
eries can be challenging (2, 3), but will be critical to protecting weakstocks and by-catch species in tuna and billfish fisheries (7, 17, 23,24, 53–55). Managing each fishery to protect its most vulnerablespecies is one possible solution (56). However, such “weak-stockmanagement” can cause faster-growing populations to be under-exploited, which lowers profits and decreases food supplies (56).Trade-offs between conservation and yield could be mitigated byimproving the species selectivity of fishing technologies (7, 36).Measurements of T and V/Vkey can be used to set selectivity goalsand monitor progress. Marine protected areas or other spatialfishing restrictions, which can provide refuges or reduce impacts
on species’ spawning grounds, are also useful management toolsthat have been implemented in some fisheries, including somePacific tuna fisheries (57). Another option is to manage therelative sizes of different fisheries with different catch rates, forexample the deep-set longline and purse-seine fisheries. This typeof management could mitigate both over- and underharvestingwithout requiring technological advances by equalizing species’aggregate catch rates. Recent studies suggest that some spatialmanagement strategies, such as maritime zoning (57) or settingregional catch quotas for fishery-wide goals (58), could accomplishthis in Pacific tuna (57) and groundfish (58) fisheries.Our approach, like all other approaches to threat assessment,
is subject to uncertainties associated with measurement of pop-ulations’ sizes, growth rates, and catch rates (30) and should beinterpreted accordingly. Moreover, we strongly encourage the in-corporation of size- or age-structure data when using our ap-proach, whenever possible, and describe a possible method forincorporating age structure in SI Materials and Methods.Our approach is designed to identify direct threats to populations
from fisheries in which the populations of interest are not the keyspecies. It is not relevant to a species that is the key species in mostor all of the fisheries in which it is caught. It is for this reason thatwe do not present T values for skipjack tuna. Although many spe-cies severely threatened by fishing are weak stocks or by-catchspecies in multispecies fisheries (6–9), a few target species, such assouthern bluefin tuna (17) and caviar-producing sturgeons (19), arethreatened by their high and increasing rarity value (19). Our ap-proach is also not designed to predict indirect threats from fishingmediated by species interactions. If Ti > 2, current practices arelikely to lead to a harvest rate of species i that exceeds its maxi-mum growth rate, guaranteeing extinction. However, extinctionor severe depletion can be caused indirectly by fishing at a muchlower level. For example, a recent sea otter decline in Alaskamay be linked to a trophic cascade caused by offshore fisheries(59)—a threat our approach would not have detected. Furtherresearch is needed to develop preventative approaches forthreats from species interactions and rarity value.Growing human populations and rising food demands are putting
increasing pressure on marine ecosystems (2–4). Long-term costsand societal impacts of conservation could be substantially re-duced by shifting resources toward preventative measures, insteadof rescuing already threatened species (60). Developing cost-effective approaches that can predict future threats to speciesis a valuable tool for conservation. Our results illustrate that asimple mechanistic theory has the potential to effectively pre-dict species threats well into the future, thus allowing time forpreventative management actions.
Materials and MethodsMathematical derivations of the properties and generalizations of the eventualthreat index, T, can be found in SI Materials andMethods. A detailed descriptionof our data sources and methods for the case study can also be found in SIMaterials and Methods (Figs. S1–S4). This includes population, catch, effort, andprice data; estimates of population growth rates; estimates of populations’vulnerabilities; methods for determining the key species in each fishery;and an analysis exploring the sensitivity of our case-study results to olderdata limitations and different means of defining key species and fisheries.
Simulation Model: Fig. 1E. Fig. 1E shows the results of a simulated modeldesigned to illustrate the properties of T in fisheries managed to exploittheir target species at MSY. The model simulates two fisheries each catchingthree species. Fishery 1 targets species 1 and fishery 2 targets species 2, butboth fisheries catch both species 1 and 2, as well as a by-catch species, i. Allthree species are assumed to have logistic growth and linear catch rates,such that the instantaneous rate of population change of species x (wherex = 1, 2, i ) at time t is given by
dNxðtÞdt
= rxNxðtÞ�1−
NxðtÞ2Nx,MSY
�−qx1NxðtÞE1ðtÞ−qx2NxðtÞE2ðtÞ: [4]
Here, Ej(t) is the level of effort in fishery j at time t, and qxj is the per-capita per-unit-effort catch rate of species x in fishery j, which we assume
Fig. 4. Assessment histories and earliest identifiable threats. Shown is acomparison of when threats could have been identified by estimating T (T > 1:red triangles) vs. when populations were first assessed as overfished (N < NMSY)or subject to overfishing (F > FMSY) in stock assessments (purple diamonds).The populations’ abundance trends are shown (black curves), each scaled toits maximum value in the series. Estimates of NMSY (dashed lines) and dateswhen the eventual threat index no longer would have predicted an overf-ishing threat (T < 1) (green triangles) are also shown.
Burgess et al. PNAS | October 1, 2013 | vol. 110 | no. 40 | 15947
SUST
AINABILITY
SCIENCE
ECOLO
GY
SEECO
MMEN
TARY
is constant in this model. Vulnerability, Vxj(t) = qxj/rx is constant. Fishingeffort in both fisheries (j, k = 1, 2; k ≠ j ) grows according to Eq. 5:
dEjðtÞdt
= aEjðtÞ�0:5rj −qjjEjðtÞ−qjkEkðtÞ
: [5]
Here, a is a constant determining the adjustment rate of effort to the targetspecies exploitation rate relative to its target rate (FMSY). We use the followingparameter values: {Nx,MSY= 1,Nx(0)= 2 for all x; E1(0)= E2(0)= 0.1; r1= r2= 1; ri=
0.5;q11=q22=qi1=qi2= 0.1;q12=q21=0.05;a= 0.35}. Species 1 is the key speciesin fishery 1, and species 2 is the key species in fishery 2 for the calculation of Ti(t).
ACKNOWLEDGMENTS. We thank Steve Gaines, Paul Venturelli, Chris Costello,Belinda Befort, Keith Criddle, and two reviewers for their comments and JonBrodziak, Daniel Ricard, and Pierre Kleiber for their assistance with stock as-sessment data. This work was supported by the University of Minnesotaand by the Natural Sciences and Engineering Research Council of Canada(Postgraduate Scholarship D3-389196-2010 to M.G.B.).
1. Godfray HC, et al. (2010) Food security: The challenge of feeding 9 billion people.Science 327(5967):812–818.
2. Beddington JR, Agnew DJ, Clark CW (2007) Current problems in the management ofmarine fisheries. Science 316(5832):1713–1716.
3. Worm B, et al. (2009) Rebuilding global fisheries. Science 325(5940):578–585.4. Costello C, et al. (2012) Status and solutions for the world’s unassessed fisheries.
Science 338(6106):517–520.5. Hutchings JA, Reynolds JD (2004) Marine fish population collapses: Consequences for
recovery and extinction risk. Bioscience 54:298–309.6. Hilborn R (1985) Apparent stock-recruitment relationships in mixed stock fisheries.
Can J Fish Aquat Sci 42:718–723.7. Lewison RL, Crowder LB, Read AJ, Freeman SA (2004) Understanding the impacts of
fisheries bycatch on marine megafauna. Trends Ecol Evol 19:598–604.8. Hall MA, Alverson DL, Metuzals KI (2000) By-catch: Problems and solutions.Mar Pollut
Bull 41:204–219.9. Boyce JR (1996) An economic analysis of the fisheries by-catch problem. J Environ Econ
Manage 31:314–336.10. Clark CW (1976) Mathematical Bioeconomics: The Optimal Management of Renewable
Resources (Wiley, New York).11. Clark CW (1985) Bioeconomic Modelling and Fisheries Management (Wiley, New York).12. Whitmarsh D, Pipitone C, Badalamenti F, D’Anna G (2003) The economic sustainability
of artisanal fisheries: The case of the trawl ban in the Gulf of Castellamare, NW Sicily.Mar Policy 27:489–497.
13. International Union for the Conservation of Nature (2011) IUCN Red List of ThreatenedSpecies. Version 2011.2 (International Union for the Conservation of Nature, Gland,Switzerland). Available at www.iucnredlist.org. Accessed August 27, 2013.
14. Mace GM, et al. (2008) Quantification of extinction risk: IUCN’s system for classifyingthreatened species. Conserv Biol 22(6):1424–1442.
15. Cadima EL (2003) Fish Stock Assessment Manual, FAO Fisheries Technical Paper 393(Food and Agriculture Organization of the United Nations, Rome).
16. Christensen V, Walters CJ (2004) Ecopath with Ecosim: Methods, capabilities andlimitations. Ecol Modell 172(2):109–139.
17. Collette BB, et al. (2011) Conservation. High value and long life—double jeopardy fortunas and billfishes. Science 333(6040):291–292.
18. Roberts CM, Hawkins JP (1999) Extinction risk in the sea. Trends Ecol Evol 14(6):241–246.19. Courchamp F, et al. (2006) Rarity value and species extinction: The anthropogenic
Allee effect. PLoS Biol 4(12):e415.20. Dulvy NK, et al. (2004) Methods of assessing extinction risk in marine fishes. Fish Fish
5:255–276.21. Cheung WWL, Pitcher TJ, Pauly D (2005) A fuzzy logic expert system to estimate intrinsic
extinction vulnerabilities of marine fishes to fishing. Biol Conserv 124(1):97–111.22. Le Quesne WJF, Jennings S (2012) Predicting species vulnerability with minimal data to
support rapid risk assessment of fishing impacts on biodiversity. J Appl Ecol 49(1):20–28.23. Worm B, Tittensor DP (2011) Range contraction in large pelagic predators. Proc Natl
Acad Sci USA 108(29):11942–11947.24. Juan-Jordá MJ, Mosqueira I, Cooper AB, Freire J, Dulvy NK (2011) Global population
trajectories of tunas and their relatives. Proc Natl Acad Sci USA 108(51):20650–20655.25. Langley A, et al. (2006) Stock Assessment of the Striped Marlin (Tetrapturus audax) in
the Southwest Pacific Ocean, WCPFC-SC2-2006/SA WP-6 (Western and Central PacificFisheries Commission, Kolonia, Federated States of Micronesia).
26. Brodziak J, Piner K (2009) Model averaging and probable status of North Pacificstriped marlin, Tetrapturus audax. Can J Fish Aquat Sci 67:793–805.
27. Harley S, Hoyle S, Williams P, Hampton J, Kiebler P (2010) Stock Assessment of BigeyeTuna in the Western and Central Pacific Ocean, WCPFC-SC6-2010/SA-WP-04 (Westernand Central Pacific Fisheries Commission, Kolonia, Federated States of Micronesia).
28. Kleiber P, Hinton MG, Uozumi Y (2003) Assessment of blue marlin (Makaira nigricans)in the Pacific using MULTIFAN-CL. Mar Freshw Res 54:349–360.
29. Branch TA, Hilborn R, Bogazzi E (2005) Escaping the tyranny of the grid: A morerealistic way of defining fishing opportunities. Can J Fish Aquat Sci 56:2404–2419.
30. Ricard D, Minto D, Jensen OP, Baum JK (2012) Evaluating the knowledge base andstatus of commercially exploited marine species with the RAM Legacy Stock AssessmentDatabase. Fish Fish 13:380–398.
31. Western and Central Pacific Fisheries Commission (2012) WCPFC Public Domain Ag-gregated Catch/Effort Data (Western and Central Pacific Fisheries Commission, Kolonia,Federated States of Micronesia). Available at www.wcpfc.int/wcpfc-public-domain-aggregated-catcheffort-data-download-page?sid=2618). Accessed March 1, 2012.
32. Myers RA, Bowen KG, Barrowman NJ (1999) Maximum reproductive rate of fish atlow population sizes. Can J Fish Aquat Sci 56:2404–2419.
33. Clark CW (1973) Profit maximization and the extinction of animal species. J Polit Econ81:950–961.
34. Hutchings JA, Myers RA (1996) What can be learned from the collapse of a renewableresource? Atlantic cod, Gadus morhua, of Newfoundland and Labrador. Can J FishAquat Sci 51:2126–2146.
35. Schaefer MB (1954) Some aspects of populations important to the management ofthe commercial marine fisheries. Bull I-ATCC 1(2):27–56.
36. Gilman E, et al. (2006) Reducing sea turtle by-catch in pelagic longline fisheries. FishFish 7(1):1–22.
37. Delgado CL, et al. (2003) Fish to 2020: Supply and Demand in Changing Global FishMarkets (International Food Policy Research Institute, Washington, DC, and WorldFish Center, Penang, Malaysia).
38. Johannes RE (1998) The case for data-less marine resource management: Examplesfrom tropical nearshore finfisheries. Trends Ecol Evol 13(6):243–246.
39. Western and Central Pacific Fisheries Commission (2013) Convention Area Map (Westernand Central Pacific Fisheries Commission, Kolonia, Federated States of Micronesia).Available at www.wcpfc.int/convention-area-map. Accessed August 27, 2013.
40. Hoyle S (2011) Stock Assessment of Albacore Tuna in the South Pacific Ocean, WCPFC-SC&-2011/SA-WP-06 (Western and Central Pacific Fisheries Commission, Kolonia,Federated States of Micronesia).
41. Langley A, et al. (2009) Stock Assessment of Yellowfin Tuna in the Western and CentralPacific Ocean, WCPFC-SC5-2005/SA-WP-03 (Western and Central Pacific FisheriesCommission, Kolonia, Federated States of Micronesia).
42. International Scientific Committee for Tuna and Tuna-Like Species in the North-Pacific Ocean (2011) Stock Assessment of Albacore Tuna in the North Pacific Oceanin 2011, Report of the Albacore Working Group Stock Assessment Workshop, 424-8633(ISC, Shizuoka, Japan).
43. Brodziak J, Ishimura G (2010) Stock Assessment of North Pacific Swordfish (Xiphiasgladius) in 2009, NOAA Administrative Report H-10-01 (NOAA, Honolulu).
44. Langley A, Hampton J (2008) Stock Assessment of Skipjack Tuna in the Western andCentral Pacific Ocean, WCPFC-SC4-2008/SA-WP-4 (Western and Central Pacific FisheriesCommission, Kolonia, Federated States of Micronesia).
45. Western and Central Pacific Fisheries Commission (2011) Tuna Fishery Yearbook2010 (Western and Central Pacific Fisheries Commission, Kolonia, FederatedStates of Micronesia). Available at www.wcpfc.int/statistical-bulletins. AccessedJune 8, 2012.
46. Crowder LB, Myers RA (2001) Report to Pew Charitable Trusts: A Comprehensive Studyof the Ecological Impacts of the Worldwide Pelagic Longline Industry. Available athttp://moray.ml.duke.edu/faculty/crowder/research/crowder_and_myers_Mar_2002.pdf.Accessed August 4, 2011.
47. Secretariat of the Pacific Community (2001) Report of the Fourteenth Meeting ofthe Standing Committee on Tuna and Billfish (Secretariat of the Pacific Community,Noumea, New Caledonia). Available at http://www.spc.int/DigitalLibrary/Doc/FAME/Meetings/SCTB/14/RPT_SCTB14.pdf. Accessed August 27, 2013.
48. Secretariat of the Pacific Community (2012) The Oceanic Fisheries Programme(Secretariat of the Pacific Community, Noumea, New Caledonia). Available at www.spc.int/oceanfish/en/the-oceanic-fisheries-programme. Accessed August 27, 2013.
49. Kleiber P, et al. (2009) North Pacific Blue Shark Assessment, NOAA Technical Mem-orandum NMFS-PIFSC-17 (NOAA, Honolulu).
50. Miyabe N (1989) Preliminary stock assessment of Pacific bigeye tuna. Report: The 3rdSoutheast Asian Tuna Conference, Indo-Pacific Tuna Development and ManagementProgramme (Food and Agriculture Organization of the United Nations, Rome), pp122–130.
51. Yuen HSH, Miyake PM (1980) Blue marlin, Makaira nigricans. Summary Report of theBillfish Stock Assessment Workshop Pacific Resources, NOAA-TM-NMFS-SWFC-5, edShomura RS (United States National Marine Fisheries Service, Washington, DC), pp 13–19.
52. Skillman RA (1975) An assessment of the south Pacific albacore, Thunnus alalunga,fishery, 1953-72. Mar Fish Rev 37(3):9–17.
53. Clarke SC, Harley SJ, Hoyle SD, Rice JS (2013) Population trends in Pacific Oceanicsharks and the utility of regulations on shark finning. Conserv Biol 27(1):197–209.
54. Worm B, et al. (2013) Global catches, exploitation rates, and rebuilding options forsharks. Mar Policy 40:194–204.
55. Lewison RL, Freeman SA, Crowder LB (2004) Quantifying the effects of fisheries onthreatened species: The impact of pelagic longlines on loggerhead and leatherbacksea turtles. Ecol Lett 7:221–231.
56. Hilborn R, Punt AE, Orensanz J (2004) Beyond band-aids in fisheries management:Fixing world fisheries. Bull Mar Sci 74:493–507.
57. Sibert J, Senina I, Lehodey P, Hampton J (2012) Shifting from marine reserves tomaritime zoning for conservation of Pacific bigeye tuna (Thunnus obesus). Proc NatlAcad Sci USA 109(44):18221–18225.
58. Dougherty DT, Hilborn R, Punt AE, Stewart IJ (2013) Modeling co-occurring species:A simulation study on the effects of spatial scale for setting management strategies.Can J Fish Aquat Sci 70(1):49–56.
59. Estes JA, Tinker MT, Williams TM, Doak DF (1998) Killer whale predation on sea otterslinking oceanic and nearshore ecosystems. Science 282(5388):473–476.
60. Wilson HB, Joseph LN, Moore AL, Possingham HP (2011) When should we save themost endangered species? Ecol Lett 14(9):886–890.
15948 | www.pnas.org/cgi/doi/10.1073/pnas.1314472110 Burgess et al.