Predicting antitrichomonal activity: A computational screening using atom-based bilinear indices and...
23
Predicting antitrichomonal activity: A computational screening using atom-based bilinear indices and experimental proofs Yovani Marrero-Ponce, a,b,c, * Alfredo Meneses-Marcel, d,e Juan A. Castillo-Garit, b,c,f Yanetsy Machado-Tugores, b,c,d Jose ´ Antonio Escario, e Alicia Go ´ mez Barrio, e David Montero Pereira, e Juan Jose ´ Nogal-Ruiz, e Vicente J. Ara ´n, g Antonio R. Martı ´nez-Ferna ´ndez, e Francisco Torrens, a Richard Rotondo, h Froyla ´n Ibarra-Velarde i and Ysaias J. Alvarado j a Institut Universitari de Cie `ncia Molecular, Universitat de Vale `ncia, Edifici d’Instituts de Paterna, Poligon la Coma s/n (detras de Canal Nou), PO Box 22085, E-46071 Valencia, Spain b Unit of Computer-Aided Molecular ‘‘Biosilico’’ Discovery and Bioinformatic Research (CAMD-BIR Unit), Faculty of Chemistry-Pharmacy, Central University of Las Villas, Santa Clara, 54830 Villa Clara, Cuba c Department of Drug Design, Chemical Bioactive Center, Central University of Las Villas, Santa Clara, 54830 Villa Clara, Cuba d Department of Parasitology, Chemical Bioactive Center, Central University of Las Villas, 54830 Villa Clara, Cuba e Departamento de Parasitologı ´a, Facultad de Farmacia, UCM, Pza. Ramo ´ n y Cajal s/n, 28040 Madrid, Spain f Applied Chemistry Research Center, Central University of Las Villas, Santa Clara, 54830 Villa Clara, Cuba g Instituto de Quı ´mica Me ´dica, CSIC, c/ Juan de la Cierva 3, 28006 Madrid, Spain h Mediscovery, Inc. Suite 1050, 601 Carlson Parkway, Minnetonka, MN 55305, USA i Department of Parasitology, Faculty of Veterinarian Medicinal and Zootecnic, UNAM, Mexico DF 04510, Mexico j Laboratorio de Electro ´ nica Molecular, Departamento de Quı ´mica, Modulo II, grano de Oro, Facultad Experimental de Ciencias, La Universidad del Zulia (LUZ), Venezuela Received 10 January 2006; revised 6 June 2006; accepted 8 June 2006 Available online 27 July 2006 Abstract—Existing Trichomonas vaginalis therapies are out of reach for most trichomoniasis people in developing countries and, where available, they are limited by their toxicity (mainly in pregnant women) and their cost. New antitrichomonal agents are need- ed to combat emerging metronidazole-resistant trichomoniasis and reduce the side effects associated with currently available drugs. Toward this end, atom-based bilinear indices, a new TOMOCOMD-CARDD molecular descriptor, and linear discriminant analysis (LDA) were used to discover novel, potent, and non-toxic lead trichomonacidal chemicals. Two discriminant functions were obtained with the use of non-stochastic and stochastic atom-type bilinear indices for heteroatoms and H-bonding of heteroatoms. These atomic-level molecular descriptors were calculated using a weighting scheme that includes four atomic labels, namely atomic masses, van der Waals volumes, atomic polarizabilities, and atomic electronegativities in Pauling scale. The obtained LDA-based QSAR models, using non-stochastic and stochastic indices, were able to classify correctly 94.51% (90.63%) and 93.41% (93.75%) of the chemicals in training (test) sets, respectively. They showed large Matthews’ correlation coefficients (C); 0.89 (0.79) and 0.87 (0.85), for the training (test) sets, correspondingly. The result of predictions on the 15% full-out cross-validation test also evidenced the robustness and predictive power of the obtained models. In addition, canonical regression analyses corroborated the statistical quality of these models (R can of 0.749 and of 0.845, correspondingly); they were also used to compute biological activity canonical scores for each compound. On the other hand, a close inspection of the molecular descriptors included in both equations showed that several of these molecular fingerprints are strongly interrelated with each other. Therefore, these models were orthogonalized using the Randic ´ orthogonalization procedure. These classification functions were then applied to find new lead antitrichomonal agents and six compounds were selected as possible active compounds by computational screening. The designed compounds were synthesized and tested for in vitro activity against T. vaginalis. Out of the six compounds that were designed, and synthesized, three molecules (chemicals VA5-5a, VA5-5c, and VA5-12b) showed high to moderate cytocidal activity at the Bioorganic & Medicinal Chemistry 14 (2006) 6502–6524 0968-0896/$ - see front matter Ó 2006 Elsevier Ltd. All rights reserved. doi:10.1016/j.bmc.2006.06.016 Keywords: TOMOCOMD-CARDD software; Atom-based bilinear index; LDA-based QSAR model; Computational screening; Lead generation; Trichomonacidal; Cytostatic and cytocidal activity. * Corresponding author. Tel.: +53 42 281192; fax: +53 42 281130; e-mail: [email protected] URL: http://www.uv.es/yoma.
Transcript of Predicting antitrichomonal activity: A computational screening using atom-based bilinear indices and...
Bioorganic & Medicinal Chemistry 14 (2006) 6502–6524
Predicting antitrichomonal activity: A computational screeningusing atom-based bilinear indices and experimental proofs
Yovani Marrero-Ponce,a,b,c,* Alfredo Meneses-Marcel,d,e Juan A. Castillo-Garit,b,c,f
Yanetsy Machado-Tugores,b,c,d Jose Antonio Escario,e Alicia Gomez Barrio,e
David Montero Pereira,e Juan Jose Nogal-Ruiz,e Vicente J. Aran,g
Antonio R. Martınez-Fernandez,e Francisco Torrens,a Richard Rotondo,h
Froylan Ibarra-Velardei and Ysaias J. Alvaradoj
aInstitut Universitari de Ciencia Molecular, Universitat de Valencia, Edifici d’Instituts de Paterna,
Poligon la Coma s/n (detras de Canal Nou), PO Box 22085, E-46071 Valencia, SpainbUnit of Computer-Aided Molecular ‘‘Biosilico’’ Discovery and Bioinformatic Research (CAMD-BIR Unit),
Faculty of Chemistry-Pharmacy, Central University of Las Villas, Santa Clara, 54830 Villa Clara, CubacDepartment of Drug Design, Chemical Bioactive Center, Central University of Las Villas, Santa Clara, 54830 Villa Clara, Cuba
dDepartment of Parasitology, Chemical Bioactive Center, Central University of Las Villas, 54830 Villa Clara, CubaeDepartamento de Parasitologıa, Facultad de Farmacia, UCM, Pza. Ramon y Cajal s/n, 28040 Madrid, SpainfApplied Chemistry Research Center, Central University of Las Villas, Santa Clara, 54830 Villa Clara, Cuba
gInstituto de Quımica Medica, CSIC, c/ Juan de la Cierva 3, 28006 Madrid, SpainhMediscovery, Inc. Suite 1050, 601 Carlson Parkway, Minnetonka, MN 55305, USA
iDepartment of Parasitology, Faculty of Veterinarian Medicinal and Zootecnic, UNAM, Mexico DF 04510, MexicojLaboratorio de Electronica Molecular, Departamento de Quımica, Modulo II, grano de Oro,
Facultad Experimental de Ciencias, La Universidad del Zulia (LUZ), Venezuela
Received 10 January 2006; revised 6 June 2006; accepted 8 June 2006
Available online 27 July 2006
Abstract—Existing Trichomonas vaginalis therapies are out of reach for most trichomoniasis people in developing countries and,where available, they are limited by their toxicity (mainly in pregnant women) and their cost. New antitrichomonal agents are need-ed to combat emerging metronidazole-resistant trichomoniasis and reduce the side effects associated with currently available drugs.Toward this end, atom-based bilinear indices, a new TOMOCOMD-CARDD molecular descriptor, and linear discriminant analysis(LDA) were used to discover novel, potent, and non-toxic lead trichomonacidal chemicals. Two discriminant functions wereobtained with the use of non-stochastic and stochastic atom-type bilinear indices for heteroatoms and H-bonding of heteroatoms.These atomic-level molecular descriptors were calculated using a weighting scheme that includes four atomic labels, namely atomicmasses, van der Waals volumes, atomic polarizabilities, and atomic electronegativities in Pauling scale. The obtained LDA-basedQSAR models, using non-stochastic and stochastic indices, were able to classify correctly 94.51% (90.63%) and 93.41% (93.75%)of the chemicals in training (test) sets, respectively. They showed large Matthews’ correlation coefficients (C); 0.89 (0.79) and0.87 (0.85), for the training (test) sets, correspondingly. The result of predictions on the 15% full-out cross-validation test alsoevidenced the robustness and predictive power of the obtained models. In addition, canonical regression analyses corroboratedthe statistical quality of these models (Rcan of 0.749 and of 0.845, correspondingly); they were also used to compute biologicalactivity canonical scores for each compound. On the other hand, a close inspection of the molecular descriptors included in bothequations showed that several of these molecular fingerprints are strongly interrelated with each other. Therefore, these models wereorthogonalized using the Randic orthogonalization procedure. These classification functions were then applied to find new leadantitrichomonal agents and six compounds were selected as possible active compounds by computational screening. The designedcompounds were synthesized and tested for in vitro activity against T. vaginalis. Out of the six compounds that were designed, andsynthesized, three molecules (chemicals VA5-5a, VA5-5c, and VA5-12b) showed high to moderate cytocidal activity at the
0968-0896/$ - see front matter � 2006 Elsevier Ltd. All rights reserved.
doi:10.1016/j.bmc.2006.06.016
Keywords: TOMOCOMD-CARDD software; Atom-based bilinear index; LDA-based QSAR model; Computational screening; Lead generation;
Trichomonacidal; Cytostatic and cytocidal activity.* Corresponding author. Tel.: +53 42 281192; fax: +53 42 281130; e-mail: [email protected]
URL: http://www.uv.es/yoma.
Y. Marrero-Ponce et al. / Bioorg. Med. Chem. 14 (2006) 6502–6524 6503
concentration of 10 lg/ml, other two compounds (VA5-8pre and VA5-8) showed high cytocidal and cytostatic activity at theconcentration of 100 lg/ml and 10 lg/ml, correspondingly, and the remaining chemical (compound VA5-5e) was inactive at theseassayed concentrations. Nonetheless, these compounds possess structural features not seen in known trichomonacidal compoundsand thus can serve as excellent leads for further optimization of antitrichomonal activity. The LDA-based QSAR models presentedhere can be considered as a computer-assisted system that could potentially significantly reduce the number of synthesized and testedcompounds and increase the chance of finding new chemical entities with antitrichomonal activity.� 2006 Elsevier Ltd. All rights reserved.
1. Introduction
Trichomonas vaginalis (Tv) is a common sexuallytransmitted infection that is increasingly recognizedas an important infection in women and men.1,2
Recent data have shown that the annual incidenceof trichomoniasis is more than 170 million casesworldwide.3 In North America alone, more than eightmillion new cases are reported yearly,3 with an estimatedrate of asymptomatic cases as high as 50%.4,5
Tv is recognized as a common cause of vaginitis6 as well asa factor contributing to preterm birth and low birthweight.7 Tv infections have also been linked with in-creased human immunodeficiency virus transmission.8–11
Metronidazole has been the drug of choice for treatingtrichomoniasis since 1959 and is currently the only druglicensed for this purpose in the United States. The rec-ommended metronidazole regimen results in cure ratesof approximately 95%.12 Metronidazole enters the cellthrough diffusion13 and is activated in the hydrogeno-somes of Tv.14 Here, the nitro group of the drug isanaerobically reduced by pyruvate-ferredoxin oxidore-ductase.14 This results in cytotoxic nitro radical–ionintermediates that break the DNA strands.15 The re-sponse is rapid: cell division and motility cease within1 h and cell death occurs within 8 h as seen in cellculture.16
Although there are clinical reports17–24 that documentthe refractoriness of infections with Tv to treatment withmetronidazole, susceptibility tests have failed to demon-strate conclusively that the parasites isolated from suchcases after treatment were resistant to this drug.25,26
Thus, the resistance of Tv has not been generally accept-ed as the factor responsible for failure of metronidazoletherapy,27 since reinfection, irregular medication, poorabsorption of the drug, and its inactivation by the vag-inal flora have not been excluded.26,28,29 However, astrain of Tv, unequivocally resistant to metronidazole,was recently isolated from a female patient who hadnot responded to two courses of treatment with thisagent. The current report is concerned with the isolationof this strain and its in vitro and in vivo susceptibilitiesto metronidazole and other 5-nitroimidazole deriva-tives.30 Therefore, new antitrichomonal agents areneeded to combat emerging metronidazole-resistanttrichomoniasis; they reduce the side effects associatedwith currently available drugs. However, the great costassociated with the development of new drugs and thesmall economic size of the market for this type ofantiprotozoal agents make this development slow.
On the other hand, cheminformatics has become anindependent discipline by itself. For pharmaceutical re-search and development (R&D), this discipline providesthe tools for the identification/selection and design/opti-mization of compounds with improved drug (and/orlead)-like qualities—often reducing the number of testedcompounds, compared with conventional trial-and-er-ror methods.31–34 Although pharmaceutical companiesare highly motivated to reduce the discovery-to-markettime and cost, an increase in R&D dollars dedicatedto the business of discovering new therapeutics has notresulted in a correspondingly increased number of suc-cessful drugs on the market.31–34 Therefore, the develop-ment of a novel computational method is currentlyrequired to deliver a system that significantly reducesthe time-to-market and R&D overheads, and increasesthe rate at which novel chemical entities (NCEs) pro-gress through the pipeline.31–34 Such studies, if theyare successfully implemented, deliver substantial benefitsand act as the bedrock for NCE selection.
Our research group has recently developed simple non-stochastic and stochastic atom- and bond-based molec-ular descriptors (MDs) based on algebraic theory. Theyhave been defined by analogy with the quadratic, linear,and bilinear mathematical maps.35–40 Applicationsincluded the prediction of several physical, physico-chemical, chemical, pharmacokinetical, and pharmaco-logical properties of organic compounds.40–49
Taking into consideration that mentioned above, the aimsof the present paper were: (1) to use a new moleculardescriptor family, atom-based non-stochastic and sto-chastic bilinear indices, in the generation of discriminantfunctions by linear discriminant analysis (LDA) that per-mits the classification of chemicals (antitrichomonal andnon-antitrichomonal drug-like compounds) on a dataset drawn from the literature, (2) to assess the ‘biosilico’models by the use of different validation tests, (3) to devel-op a virtual screening of some libraries in order to identifypotential novel chemical entities (NCEs) and, (4) to eval-uate the in vitro antitrichomonal activity of the best can-didates selected from thousands of chemicals in thevirtual-computational-screening process.
2. Method
In earlier publications, we outlined outstanding featuresconcerned with the theory of 2D atom-based TOMO-COMD-CARDD MDs.36–49 This method codifies molec-ular structure by means of mathematical quadratic,linear and bilinear transformations. In order to calculate
6504 Y. Marrero-Ponce et al. / Bioorg. Med. Chem. 14 (2006) 6502–6524
these algebraic maps for a molecule, the atom-basedmolecular vector, �x (vector representation), as well askth ‘non-stochastic and stochastic graph–theoreticalelectronic-density matrices’ Mk and Sk (matrix represen-tation), correspondingly, are constructed.35–40 Suchatom-adjacency relationships and chemical-informationcodification will be applied in the present study to gen-erate a series of atom-based MDs, atom, group, andatom-type as well as total bilinear indices, to be usedin drug design and chemoinformatic studies.
Therefore, the structure of this section will be as follows:(1) a background in atom-based molecular vector as wellas non-stochastic and stochastic graph–theoretical elec-tronic-density matrices will be described in the next sub-sections (2.1 and 2.2, respectively), and (2) an outline ofthe mathematical definition of bilinear maps and a def-inition of our procedures will be developed in Sections2.3 and 2.4, correspondingly.
2.1. Chemical information and atom-based molecularvector
The atom-based molecular vector ð�xÞ, used to representsmall-to-medium size organic chemicals, has beenexplained elsewhere in some detail.35–40 The components(x) of �x are numerical values, which represent a certainstandard atomic property (atomic labels). Therefore,these weights correspond to different atomicproperties for organic molecules. Thus, a moleculehaving 5,10,15 , . . . ,n atomic nuclei can berepresented by means of vectors with 5,10,15, . . . ,ncomponents, respectively, belonging to the spacesR5;R10;R15; . . . ;Rn, where n is the dimension of the realset ðRnÞ. Therefore, �x is the n-dimensional vector prop-erty of the atoms (atomic nuclei) in a molecule.
This approach allows us to encode organic moleculessuch as 3-mercaptopyridine-4-carbaldehyde throughthe molecular vector �x ¼ ½xN1; xC2; xC3; xC4; xC5; xC6;xC7; xO8; xS9� (see also Table 1 for molecular structure).This vector belongs to the product space R9. However,diverse kinds of atomic weights (x) can be used for cod-ifying information related to each atomic nucleus in themolecule. These atomic labels are chemically meaningfulnumbers or their contributions derived by atom-to-atomanalysis such as atomic logP,50 surface contributions ofpolar atoms,51 atomic molar refractivities,52 atomichybrid polarizabilities,53 Gasteiger–Marsilli atomiccharges,54 atomic masses (M),55 van der Waals volumes(V),55 atomic polarizabilities (P),55 atomic electroneg-ativities (K) in Pauling scale,56 and so on.
Now, if we are interested in codifying the chemical infor-mation by means of two different molecular vectors, forinstance, �x ¼ ½x1; . . . ; xn� and �y ¼ ½y1; . . . ; yn�, then differ-ent combinations of molecular vectors ð�x 6¼ �yÞ are possi-ble when a weighting scheme is used. In the presentreport, we characterized each atomic nucleus with thefollowing parameters: atomic masses (M),55 van derWaals volumes (V),55 atomic polarizabilities (P),55 andatomic Pauling electronegativities (E).56 The values ofthese atomic labels are shown in Table 2. From this
weighting scheme, six (or twelve if �xM � �yV 6¼ �xV � �yM )combinations (pairs) of molecular vectors ð�x; �y; �x 6¼ �yÞcan be computed, �xM � �yV , �xM � �yP , �xM � �yK , �xV � �yP ,�xV � �yK , and �xP � �yK . Here, we used the symbols�xW � �yZ , where the subscripts W and Z mean two differ-ent atomic properties from our weighting scheme anda hyphen (-) expresses the combination (pair) of twoselected atom-label chemical properties. In order toillustrate this, let us consider the same organic moleculeas in the example above (3-mercaptopyridine-4-carbal-dehyde) and the following weighting scheme: M and Vð�xM � �yV ¼ �xV � �yMÞ. The following molecular vectors,�x ¼ ½14:01; 12:01; 12:01; 12:01; 12:01; 12:01; 12:01; 16:0;32:07� and �y ¼ ½15:599; 22:449; 22:449; 22:449; 22:449;22:449; 22:449; 11:494; 24:429�, are obtained when weuse M and V as chemical weights for codifying eachatom in the example molecule in �x and �y vectors,respectively.
2.2. Background in non-stochastic and stochasticgraph–theoretical electronic-density matrices
In molecular topology, molecular structure is expressed,generally, by the hydrogen-suppressed graph. Therefore,a molecule is represented by a graph. Informally, agraph G is a collection of vertices (points) and edges(lines or bonds) connecting these vertices.35–40 In moreformal terms, a simple graph G is defined as an orderedpair [V(G), E(G)], which consists of a nonempty set ofvertices V(G) and a set E(G) of unordered pairs of ele-ments of V(G), called edges.57–59 In this particular case,we are not dealing with a simple graph but with a so-called pseudograph (G). Informally, a pseudograph isa graph with multiple edges or loops between the samevertices or the same vertex. Formally, a pseudographis a set V of vertices along a set E of edges, and a func-tion f from E to {{u,v}j u,v in V} (The f function showswhich pair of vertices is connected by which edge). Anedge is a loop if f(e) = {u} for some vertex u in V.35,36,60
In earlier reports we have introduced new molecularmatrices that describe changes for some time in the elec-tronic distribution throughout the molecular backbone.The n · n kth non-stochastic graph–theoretical electron-ic-density matrix of the molecular pseudograph (G), Mk,is a symmetric square matrix, where n is the number ofatoms (atomic nuclei) in the molecule.35–40 The coeffi-cients kmij are the elements of the kth power of M(G)and are defined as follows:
mij ¼ P ij if i 6¼ j and 9ek 2 EðGÞ¼ Lii if i ¼ j
¼ 0 otherwise
ð1Þ
where E(G) represents the set of edges of G. Pij is thenumber of edges (bonds) between vertices (atomicnuclei) vi and vj; Lii is the number of loops in vi.
The elements mij = Pij of such a matrix represent thenumber of chemical bonds between an atomic nucleusi and other j. The matrix Mk provides the numbers ofwalks of length k that links every pair of vertices vi
and vj. For this reason, each edge in M1 represents 2
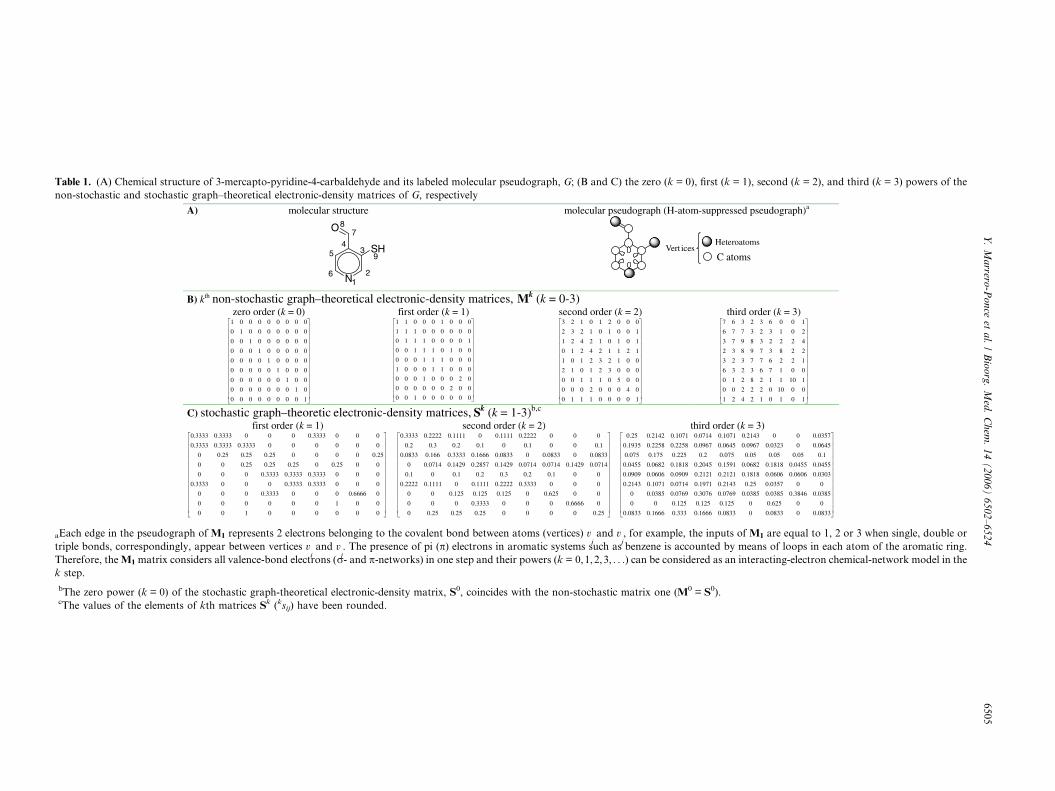
Table 1. (A) Chemical structure of 3-mercapto-pyridine-4-carbaldehyde and its labeled molecular pseudograph, G; (B and C) the zero (k = 0), first (k = 1), second (k = 2), and third (k = 3) powers of the
non-stochastic and stochastic graph–theoretical electronic-density matrices of G, respectively
aEach edge in the pseudograph of M1 represents 2 electrons belonging to the covalent bond between atoms (vertices) viand v
j, for example, the inputs of M1 are equal to 1, 2 or 3 when single, double or
triple bonds, correspondingly, appear between vertices vi
and vj. The presence of pi (p) electrons in aromatic systems such as benzene is accounted by means of loops in each atom of the aromatic ring.
Therefore, the M1 matrix considers all valence-bond electrons (r- and p-networks) in one step and their powers (k = 0,1,2,3, . . .) can be considered as an interacting-electron chemical-network model in the
k step.
bThe zero power (k = 0) of the stochastic graph-theoretical electronic-density matrix, S0, coincides with the non-stochastic matrix one (M0 = S0).cThe values of the elements of kth matrices Sk (ksij) have been rounded.
Y.
Ma
rrero-P
on
ceet
al.
/B
ioo
rg.
Med
.C
hem
.1
4(
20
06
)6
50
2–
65
24
65
05
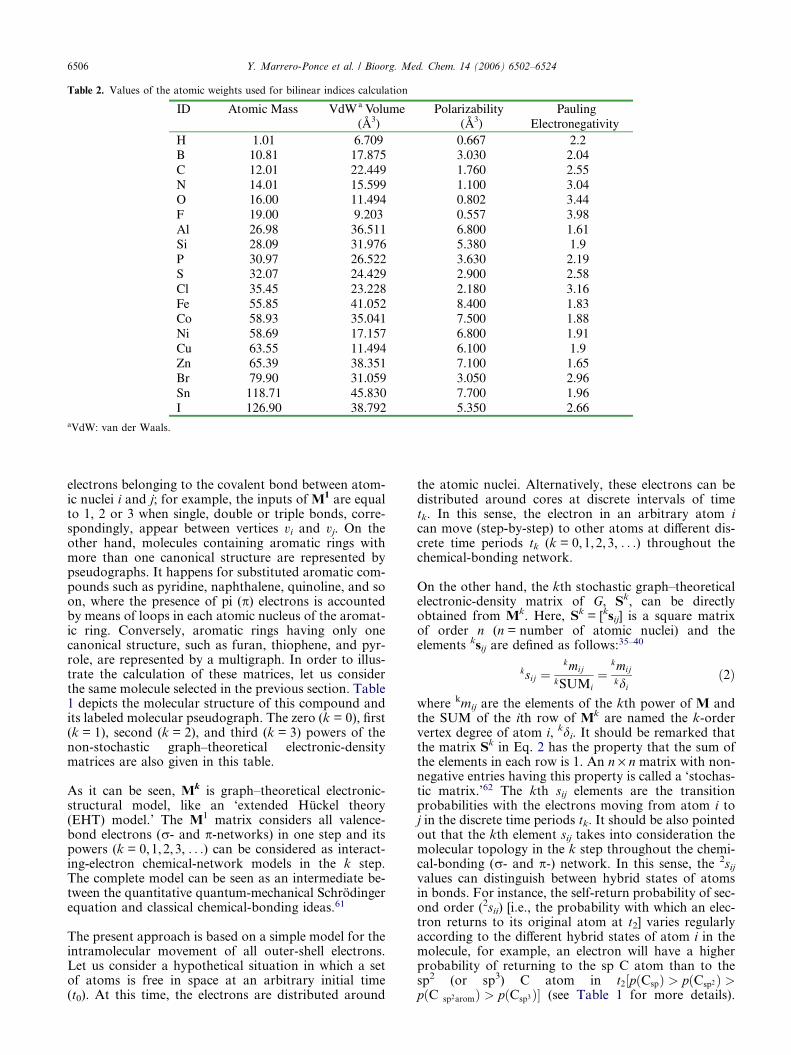
Table 2. Values of the atomic weights used for bilinear indices calculation
aVdW: van der Waals.
6506 Y. Marrero-Ponce et al. / Bioorg. Med. Chem. 14 (2006) 6502–6524
electrons belonging to the covalent bond between atom-ic nuclei i and j; for example, the inputs of M1 are equalto 1, 2 or 3 when single, double or triple bonds, corre-spondingly, appear between vertices vi and vj. On theother hand, molecules containing aromatic rings withmore than one canonical structure are represented bypseudographs. It happens for substituted aromatic com-pounds such as pyridine, naphthalene, quinoline, and soon, where the presence of pi (p) electrons is accountedby means of loops in each atomic nucleus of the aromat-ic ring. Conversely, aromatic rings having only onecanonical structure, such as furan, thiophene, and pyr-role, are represented by a multigraph. In order to illus-trate the calculation of these matrices, let us considerthe same molecule selected in the previous section. Table1 depicts the molecular structure of this compound andits labeled molecular pseudograph. The zero (k = 0), first(k = 1), second (k = 2), and third (k = 3) powers of thenon-stochastic graph–theoretical electronic-densitymatrices are also given in this table.
As it can be seen, Mk is graph–theoretical electronic-structural model, like an ‘extended Huckel theory(EHT) model.’ The M1 matrix considers all valence-bond electrons (r- and p-networks) in one step and itspowers (k = 0,1,2,3, . . .) can be considered as interact-ing-electron chemical-network models in the k step.The complete model can be seen as an intermediate be-tween the quantitative quantum-mechanical Schrodingerequation and classical chemical-bonding ideas.61
The present approach is based on a simple model for theintramolecular movement of all outer-shell electrons.Let us consider a hypothetical situation in which a setof atoms is free in space at an arbitrary initial time(t0). At this time, the electrons are distributed around
the atomic nuclei. Alternatively, these electrons can bedistributed around cores at discrete intervals of timetk. In this sense, the electron in an arbitrary atom ican move (step-by-step) to other atoms at different dis-crete time periods tk (k = 0,1,2,3, . . .) throughout thechemical-bonding network.
On the other hand, the kth stochastic graph–theoreticalelectronic-density matrix of G, Sk, can be directlyobtained from Mk. Here, Sk = [ksij] is a square matrixof order n (n = number of atomic nuclei) and theelements ksij are defined as follows:35–40
ksij ¼kmij
kSUMi¼
kmij
kdið2Þ
where kmij are the elements of the kth power of M andthe SUM of the ith row of Mk are named the k-ordervertex degree of atom i, kdi. It should be remarked thatthe matrix Sk in Eq. 2 has the property that the sum ofthe elements in each row is 1. An n · n matrix with non-negative entries having this property is called a ‘stochas-tic matrix.’62 The kth sij elements are the transitionprobabilities with the electrons moving from atom i toj in the discrete time periods tk. It should be also pointedout that the kth element sij takes into consideration themolecular topology in the k step throughout the chemi-cal-bonding (r- and p-) network. In this sense, the 2sij
values can distinguish between hybrid states of atomsin bonds. For instance, the self-return probability of sec-ond order (2sii) [i.e., the probability with which an elec-tron returns to its original atom at t2] varies regularlyaccording to the different hybrid states of atom i in themolecule, for example, an electron will have a higherprobability of returning to the sp C atom than to thesp2 (or sp3) C atom in t2½pðCspÞ > pðCsp2Þ >pðC sp2aromÞ > pðCsp3Þ� (see Table 1 for more details).
Y. Marrero-Ponce et al. / Bioorg. Med. Chem. 14 (2006) 6502–6524 6507
This is a logical result if the electronegativity scale ofthese hybrid states is taken into account.
2.3. Mathematical bilinear forms: a theoreticalframework
In mathematics, a bilinear form in a real vector space isa mapping b : VxV ! R, which is linear in botharguments.63–68 Therefore, this function satisfies thefollowing axioms for any scalar a and any choice ofvectors �v; �w;�v1;�v2; �w1, and �w2.
(i) bða�v; �wÞ ¼ bð�v; a�wÞ ¼ abð�v; �wÞ(ii) bð�v1 þ �v2; �wÞ ¼ bð�v1; �wÞ þ bð�v2; �wÞ
(iii) bð�v; �w1 þ �w2Þ ¼ bð�v; �w1Þ þ bð�v; �w2Þ
That is, b is bilinear if it is linear in each parameter,taken separately.
Let V be a real vector space in RnðV 2 RnÞ and considerthat the following vector set, f�e1;�e2; . . . ;�eng, is a basisset of Rn. This basis set permits us to write in unambigu-ous form any vectors �x and �y of V, whereðx1; x2; . . . ; xnÞ 2 Rn and ðy1; y2; . . . ; ynÞ 2 Rn are the coor-dinates of the vectors �x and �y, respectively. Therefore,
�x ¼Xn
i¼1
xi�ei ð3Þ
and,
�y ¼Xn
j¼1
yj�ej ð4Þ
Subsequently,
bð�x; �yÞ ¼ bðxi�ei; yj�ejÞ ¼ xiyjbð�ei;�ejÞ ð5ÞIf we take aij as the n · n scalars bð�ei;�ejÞ, that is,
aij ¼ bð�ei;�ejÞ; to i ¼ 1; 2; . . . ; n and j ¼ 1; 2; . . . ; n ð6ÞThen,
bð�x;�yÞ¼Xn
i;j
aijxiyj¼½X �TA½Y �¼ ½x1 . . .xn�a11 . . . ajn
. . . . . . . . .
an1 . . . ann
264
375
y1
..
.
yn
2664
3775
ð7Þ
As it can be seen, the defined system of equations for bmay be written in matrix form (see Eq. 7), where [Y] is acolumn vector (an nx1 matrix) of the coordinates of �y ina basis set of Rn, and [X]T (a 1xn matrix) is the transposeof [X], where [X] is a column vector (an nx1 matrix) ofthe coordinates of �xin the same basis set of Rn.
Finally, we introduce the formal definition of symmetricbilinear form. Let V be a real vector space and b be abilinear function in V · V. The bilinear function b iscalled symmetric if bð�x; �yÞ ¼ bð�y;�xÞ; 8�x; �y 2 V .74,75,32,76–78
Then,
bð�x; �yÞ ¼Xn
i;j
aijxiyj ¼Xn
i;j
ajixjyi ¼ bð�y;�xÞ ð8Þ
2.4. Non-stochastic and stochastic atom-based bilinearindices: total definition
The kth non-stochastic and stochastic bilinear indicesfor a molecule, bkð�x; �yÞ and sbkð�x; �yÞ, respectively, arecomputed from these kth non-stochastic and stochasticgraph–theoretical electronic-density matrices, Mk andSk, as shown in Eqs. 9 and 10:
bkð�x; �yÞ ¼Xn
i¼1
Xn
j¼1
kmijxiyj ð9Þ
sbkð�x; �yÞ ¼Xn
i¼1
Xn
j¼1
ksijxiyj ð10Þ
where n is the number of atoms in the molecule, andx1, . . . ,xn and y1, . . . ,yn are the coordinates or compo-nents of the molecular vectors �x and �y in a canonicalbasis set of Rn.
The defined Eqs. 9 and 10 for bkð�x; �yÞ and sbkð�x; �yÞ mayalso be written as the single matrix equations:
bð�x; �yÞ ¼ ½X �TMk½Y � ð11Þ
sbð�x; �yÞ ¼ ½X �TSk½Y � ð12Þwhere [Y] is a column vector (an nx1 matrix) of the coor-dinates of �y in the canonical basis set of Rn, and [X]T isthe transpose of [X], where [X] is a column vector (annx1 matrix) of the coordinates of �x in the canonical basisset of Rn. Therefore, if we use the canonical basis set, thecoordinates [(x1, . . . ,xn) and (y1, . . . ,yn)] of any molecu-lar vectors (�x and �yÞ coincide with the components ofthose vectors [(x1, . . . ,xn) and (y1, . . . ,yn)]. Therefore,those coordinates can be considered as the weights(atomic labels) of the vertices of the molecular pseudo-graph, due to the fact that the components of the molec-ular vectors are values of some atomic property thatcharacterizes each kind of atomic nuclei in the molecule.
It should be remarked that non-stochastic and stochas-tic bilinear indices are symmetric and non-symmetricbilinear forms, respectively. Therefore, if in the follow-ing weighting scheme, M and V are used as atomicweights to compute these MDs, two different sets ofstochastic bilinear indices, M-V sbH
k ðx; yÞ and V -M sbHk ðx; yÞ
[because �xM � �yV 6¼ �xV � �yM ], can be obtained and onlyone group of non-stochastic bilinear indices[M-V sbH
k ðx; yÞ ¼ V - MsbHk ðx; yÞ because in this case
�xM � �yV ¼ �xV � �yM ] can be calculated.
2.5. Non-stochastic and stochastic atom-based bilinearindices: local (atomic, group, and atom-type) definition
In the last decade, Randic69 proposed a list of desir-able attributes for a MD. Therefore, this list can beconsidered as a methodological guide for the develop-ment of new topological indices (TIs). One of themost important criteria is the possibility of definingthe MDs locally. This attribute refers to the fact that
6508 Y. Marrero-Ponce et al. / Bioorg. Med. Chem. 14 (2006) 6502–6524
the index could be calculated not only for the mole-cule as a whole, but also over certain fragments ofthe structure itself.
Sometimes, the properties of a group of molecules aremore related to a certain zone or fragment than to themolecule as a whole. Thereafter, the global definitionnever satisfies the structural requirements needed to ob-tain a good correlation in QSAR and QSPR studies.Furthermore, the local indices can be used in certainproblems such as:
• Research on drugs, toxics or, generally, anyorganic molecules with a common skeleton, whichis responsible for the activity or property understudy.
• Study on the reactivity of specific sites in a seriesof molecules, which can undergo a chemical reac-tion or enzymatic metabolism.
• In the study of molecular properties such as spec-troscopic measurements, which are obtainedexperimentally in a local way (chromophore).
• In any general case where it is necessary to studynot only the molecule as a whole, but also somelocal properties of certain fragments, the definitionof local descriptors could then be necessary.
Therefore, in addition to total bilinear indices computedfor the whole molecule, local-fragment (atomic, groupor atom-type) formalism can be developed. TheseMDs are termed local non-stochastic and stochasticbilinear indices, bkLð�x; �yÞ and sbkLð�x; �yÞ, respectively.The definition of these descriptors is as follows:
bkLð�x; �yÞ ¼Xn
i¼1
Xn
j¼1
kmijLxiyj ð13Þ
sbkLð�x; �yÞ ¼Xn
i¼1
Xn
j¼1
ksijLxiyj ð14Þ
where kmijL [ksijL] is the kth element of the ‘i’ row and ‘j’column of the local matrix Mk
L½SkL�. This matrix is
extracted from the Mk [Sk] matrix and contains informa-tion referred to the pairs of vertices (atomic nuclei) ofthe specific molecular fragments and also of the molec-ular environment in the kth step. The matrix Mk
L½SkL�
with elements kmijL [ksijL] is defined as follows:
kmijL½ksijL� ¼ kmij½ksijL� if both vi and vj are atomic nuclei
contained within the molecular fragment
¼ 1=2kmij½ksijL� if either vi or vj is an atomic
nucleus contained within the molecular fragment
¼ 0 otherwise ð15Þ
These local analogues can also be expressed in matrixform by the expressions:
bLð�x; �yÞ ¼ ½X �TMkL½Y � ð16Þ
sbLð�x; �yÞ ¼ ½X �TSkL½Y � ð17Þ
It should be remarked that the scheme above followsthe spirit of a Mulliken population analysis of atomicnet charges.70 It should be also pointed out that foreach partitioning of a molecule into Z molecular frag-ments; there will be Z local fragmental matrices. Inthis case, if a molecule is partitioned into Z frag-ments, the matrix Mk[Sk] can be correspondingly par-titioned into Z local matrices Mk
L½SkL�, L = 1, . . . ,Z,
and the kth power of matrix M[S] is exactly thesum of the kth powers of the local Z matrices. There-fore, the total non-stochastic and stochastic bilinearindices are the sum of the non-stochastic and stochas-tic bilinear indices, respectively, of the Z molecularfragments:
bð�x; �yÞ ¼XZ
L¼1
bkLð�x; �yÞ ð18Þ
sbð�x; �yÞ ¼XZ
L¼1
sbkLð�x; �yÞ ð19Þ
Atomic, group, and atom-type bilinear fingerprints arespecific cases of local bilinear indices. Atomic bilinearindices, bkLð�xi; �yiÞ and sbkLð�xi; �yiÞ, can be computed foreach atom i in the molecule and contain electronic aswell as topological structural information from all otheratoms within the structure. The values of atom-levelbilinear indices for the common scaffold atoms can bedirectly used as variables in seeking a QSPR/QSARmodel, as long as these atoms are numbered in the sameway in all the molecules in the database.
In addition, the atom-type bilinear indices can alsobe calculated. In the same way as atom-type E-statevalues,71 for all data sets (including those with a com-mon skeletal core as well as those with diverse struc-tures), these novel local MDs provide much usefulinformation. Therefore, this approach provides the ba-sis for application to a wider range of problems towhich the atomic bilinear indices formalism is applica-ble without the need for superposition.72,73 For thisreason, the present method represents a significantadvantage over traditional QSAR methods. Theatom-type bilinear descriptors are calculated by addingthe kth atomic bilinear indices for all the atoms of thesame type in the molecule. This atom type index allowsa group additive-type scheme in which an index ap-pears for each atom type in the molecule. In theatom-type bilinear indices formalism, each atom inthe molecule is classified into an atom-type (fragment),such as –F, –OH, @O, –CH3, and so on.71–73 There-fore, each atom in the molecule is categorized accord-ing to a valence-state classification scheme includingthe number of attached H-atoms.71 The atom-typedescriptors combine three important aspects of struc-tural information: (1) collective electron and topologi-cal accessibility to the atoms of the same type (foreach structural feature: either atom or hybrid group,either such as –Cl, @O, –CH2–, etc.), (2) presence/ab-sence of the atom type (structural features), and (3)count of the atoms in the atom-type sets.
Y. Marrero-Ponce et al. / Bioorg. Med. Chem. 14 (2006) 6502–6524 6509
Finally, these local MDs can be calculated by a chemical(or functional) group in the molecule, such as heteroa-toms (O, N, and S in all valence states as well as includingthe number of attached H-atoms), hydrogen bonding (H-bonding) to heteroatoms (O, N, and S in all valencestates), halogen atoms (F, Cl, Br, and I), all aliphatic car-bon chains (several atom types), all aromatic atoms (aro-matic rings), and so on. The group-level bilinear indicesare the sum of the individual atom-level bilinear indicesfor a particular group of atoms. For all data set structures,the kth group-based bilinear indices provide importantinformation for QSAR/QSPR studies.
2.6. Sample calculation
It is useful to perform a calculation on a molecule toillustrate the effect of structure on the values of atomicand global bilinear indices. Thus, we use the 3-merca-ptopyridine-4-carbaldehyde molecule. The labeled(atom numbering) molecular structure of this chemicalas well as the non-stochastic and stochastic (atom-level,group, and atom-type as well as total) atom-based bilin-ear indices are shown in Table 3.
The following descriptors, using a weighting scheme ofdifferent combinations of four atomic properties (seeSection 5.1), were calculated in this study:
(i) bk(x,y) and bHk ðx; yÞ are the kth total bilinear indi-
ces not considering and considering the H atomsin the molecule, respectively.
(ii) bkL(xE,yE) and bHkLðxE; yEÞ are the kth local
(group = heteroatoms: S, N, O) bilinear indicesnot considering and considering H atoms in themolecule, correspondingly. These local descriptorsare putative molecular charge, dipole moment,and H-bonding acceptors.
(iii) bHkLðxE�H; yE�HÞ are the kth local (group = H atoms
bonding to heteroatoms: S, N, O) bilinear indicesconsidering H atoms in the molecule. These localdescriptors are putative H-bonding donors (hydro-gen bonding capacity), lipophilicity, and so on.
(iv) bk(xHal, yHal) and bHk ðxHal; yHalÞ are the kth local
(group = halogens: F, Cl, Br, I) bilinear indicesnot considering and considering the H atoms inthe molecule, correspondingly.
(v) The kth total [sbk(x,y) and sbHk ðx; yÞ]€, as well as
atom-type [sbk(xE,yE), sb Hk ðxE; yEÞ and
sb Hk ðxE�H; yE�HÞ] stochastic bilinear indices, were
also computed.
3. Results and discussion
3.1. Clustering and ‘rational’ design of training and testsets
In order to obtain mathematical expressions capable ofdiscriminating between active and inactive compounds,the chemical information contained in a great numberof compounds with and without the desired biologicalactivity must be statistically processed. Taking into
account that the most critical aspect in the constructionof a training data set is the molecular diversity of theincluded compounds, we selected a group of 123 organicchemicals having as much structural variability as possi-ble. The 50 antitrichomonals considered in this study arerepresentative of families with diverse structural pat-terns and action modes. Figure 1 shows a representativesample of such active compounds. On the other hand, 73compounds having different clinical uses were selectedfor the set of inactive compounds, through a randomselection, guaranteeing also a great structural variabili-ty. All these chemicals were taken from the NegwerHandbook,74 and Merck Index,75 where their names,synonyms, and structural formulas can be found.
We performed a hierarchical cluster analysis of the activeand inactive series using statistical software packageSTATISTICA.76 This procedure permits to select com-pounds for the training and test sets, in a representativeway. The main idea of this procedure consists in makinga partition of either active or inactive series of chemicalsin several statistically representative classes ofcompounds. It ensures that any chemical class (asdetermined by the clusters) will be represented in bothcompounds’ series. This ‘rational’ design of the trainingand predicting series allowed us to design both sets thatare representative of the whole ‘experimental universe.’A detailed discussion of this procedure can be seen asSupplementary Data.
3.2. Discriminant models
3.2.1. Development. Linear discriminant analysis (LDA)has become an important tool for the prediction of bio-logical properties.42–49,77–81 On the basis of the simplic-ity of this method many useful discriminant modelshave been developed and presented by different authorsin the literature.42–49,77–81 Therefore, LDA was also thetechnique used in the generation of discriminant func-tions in the current work. Making use of the LDA tech-nique implemented in the STATISTICA software,76 thefollowing linear models were obtained; in which total aswell as local non-stochastic and stochastic bilinear indi-ces were used as independent variables:
Class ¼ � 3:37� 0:07MP bH1LðxE; yEÞ
þ 0:04MEb1LðxE; yEÞþ 0:10MV bH
0LðxE�H; yE�HÞþ 1:39� 10�10MV b15Lðxhal; yhalÞN ¼ 91; k ¼ 0:43; D2 ¼ 5:07;
F ð4; 86Þ ¼ 27:48; p < 0:0001:
ð20Þ
Class ¼ � 6:83þ 0:21MEsbH1LðxE; yEÞ
� 0:20MP sbH1LðxE; yEÞ � 0:08MEsb4LðxE; yEÞ
þ 0:05MP sb4LðxE; yEÞN ¼ 91; k ¼ 0:28; D2 ¼ 9:90;
F ð4; 86Þ ¼ 53:6; p < 0:0001:
ð21Þ
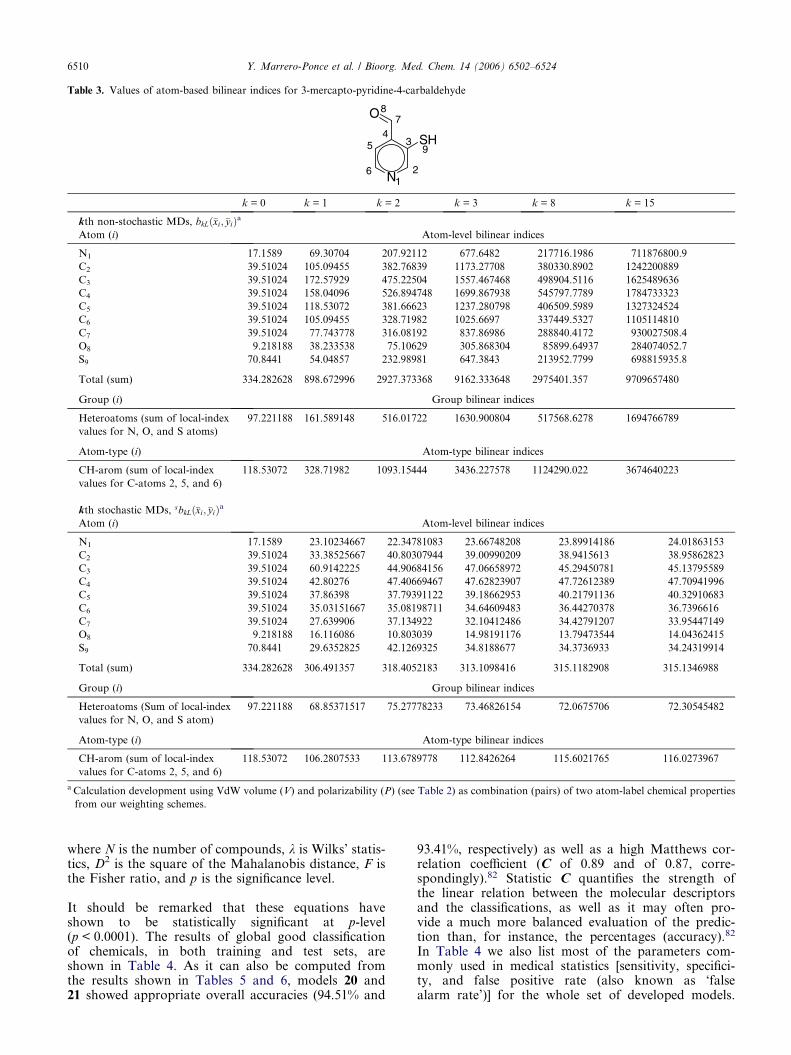
Table 3. Values of atom-based bilinear indices for 3-mercapto-pyridine-4-carbaldehyde
k = 0 k = 1 k = 2 k = 3 k = 8 k = 15
kth non-stochastic MDs, bkLð�xi; �yiÞaAtom (i) Atom-level bilinear indices
N1 17.1589 69.30704 207.92112 677.6482 217716.1986 711876800.9
C2 39.51024 105.09455 382.76839 1173.27708 380330.8902 1242200889
C3 39.51024 172.57929 475.22504 1557.467468 498904.5116 1625489636
C4 39.51024 158.04096 526.894748 1699.867938 545797.7789 1784733323
C5 39.51024 118.53072 381.66623 1237.280798 406509.5989 1327324524
C6 39.51024 105.09455 328.71982 1025.6697 337449.5327 1105114810
C7 39.51024 77.743778 316.08192 837.86986 288840.4172 930027508.4
O8 9.218188 38.233538 75.10629 305.868304 85899.64937 284074052.7
S9 70.8441 54.04857 232.98981 647.3843 213952.7799 698815935.8
Total (sum) 334.282628 898.672996 2927.373368 9162.333648 2975401.357 9709657480
Group (i) Group bilinear indices
Heteroatoms (sum of local-index
values for N, O, and S atoms)
97.221188 161.589148 516.01722 1630.900804 517568.6278 1694766789
Atom-type (i) Atom-type bilinear indices
CH-arom (sum of local-index
values for C-atoms 2, 5, and 6)
118.53072 328.71982 1093.15444 3436.227578 1124290.022 3674640223
kth stochastic MDs, sbkLð�xi;�yiÞaAtom (i) Atom-level bilinear indices
N1 17.1589 23.10234667 22.34781083 23.66748208 23.89914186 24.01863153
C2 39.51024 33.38525667 40.80307944 39.00990209 38.9415613 38.95862823
C3 39.51024 60.9142225 44.90684156 47.06658972 45.29450781 45.13795589
C4 39.51024 42.80276 47.40669467 47.62823907 47.72612389 47.70941996
C5 39.51024 37.86398 37.79391122 39.18662953 40.21791136 40.32910683
C6 39.51024 35.03151667 35.08198711 34.64609483 36.44270378 36.7396616
C7 39.51024 27.639906 37.134922 32.10412486 34.42791207 33.95447149
O8 9.218188 16.116086 10.803039 14.98191176 13.79473544 14.04362415
S9 70.8441 29.6352825 42.1269325 34.8188677 34.3736933 34.24319914
Total (sum) 334.282628 306.491357 318.4052183 313.1098416 315.1182908 315.1346988
Group (i) Group bilinear indices
Heteroatoms (Sum of local-index
values for N, O, and S atom)
97.221188 68.85371517 75.27778233 73.46826154 72.0675706 72.30545482
Atom-type (i) Atom-type bilinear indices
CH-arom (sum of local-index
values for C-atoms 2, 5, and 6)
118.53072 106.2807533 113.6789778 112.8426264 115.6021765 116.0273967
a Calculation development using VdW volume (V) and polarizability (P) (see Table 2) as combination (pairs) of two atom-label chemical properties
from our weighting schemes.
6510 Y. Marrero-Ponce et al. / Bioorg. Med. Chem. 14 (2006) 6502–6524
where N is the number of compounds, k is Wilks’ statis-tics, D2 is the square of the Mahalanobis distance, F isthe Fisher ratio, and p is the significance level.
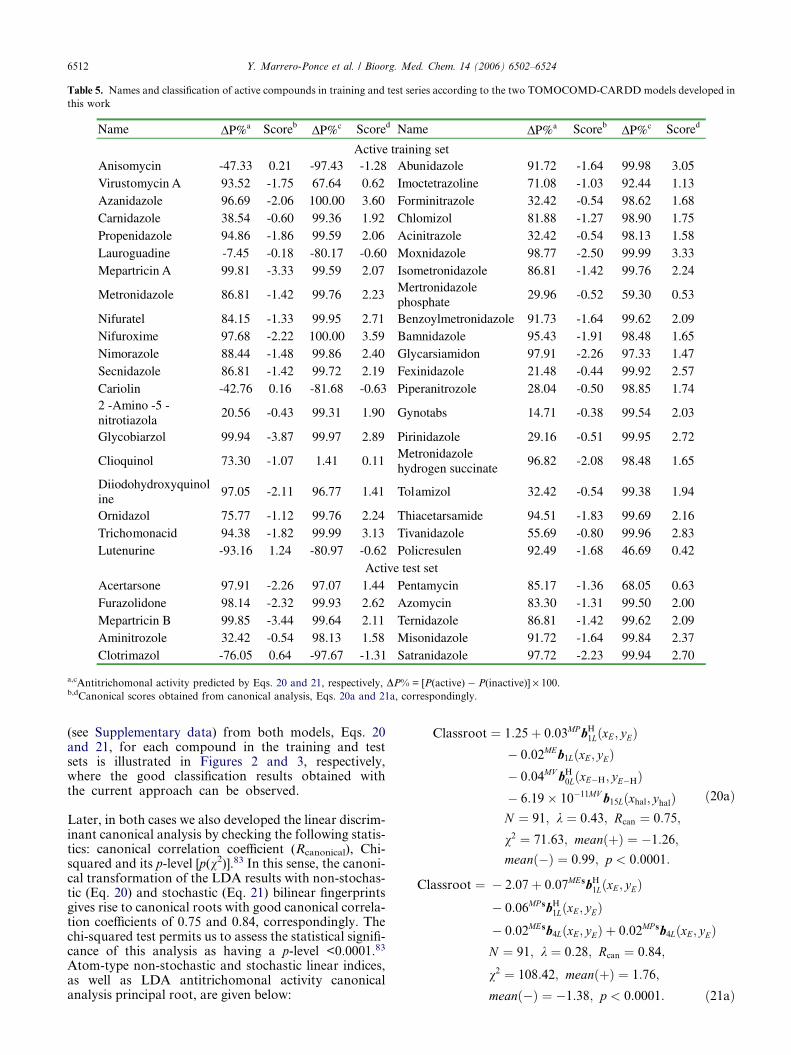
It should be remarked that these equations haveshown to be statistically significant at p-level(p < 0.0001). The results of global good classificationof chemicals, in both training and test sets, areshown in Table 4. As it can also be computed fromthe results shown in Tables 5 and 6, models 20 and21 showed appropriate overall accuracies (94.51% and
93.41%, respectively) as well as a high Matthews cor-relation coefficient (C of 0.89 and of 0.87, corre-spondingly).82 Statistic C quantifies the strength ofthe linear relation between the molecular descriptorsand the classifications, as well as it may often pro-vide a much more balanced evaluation of the predic-tion than, for instance, the percentages (accuracy).82
In Table 4 we also list most of the parameters com-monly used in medical statistics [sensitivity, specifici-ty, and false positive rate (also known as ‘falsealarm rate’)] for the whole set of developed models.
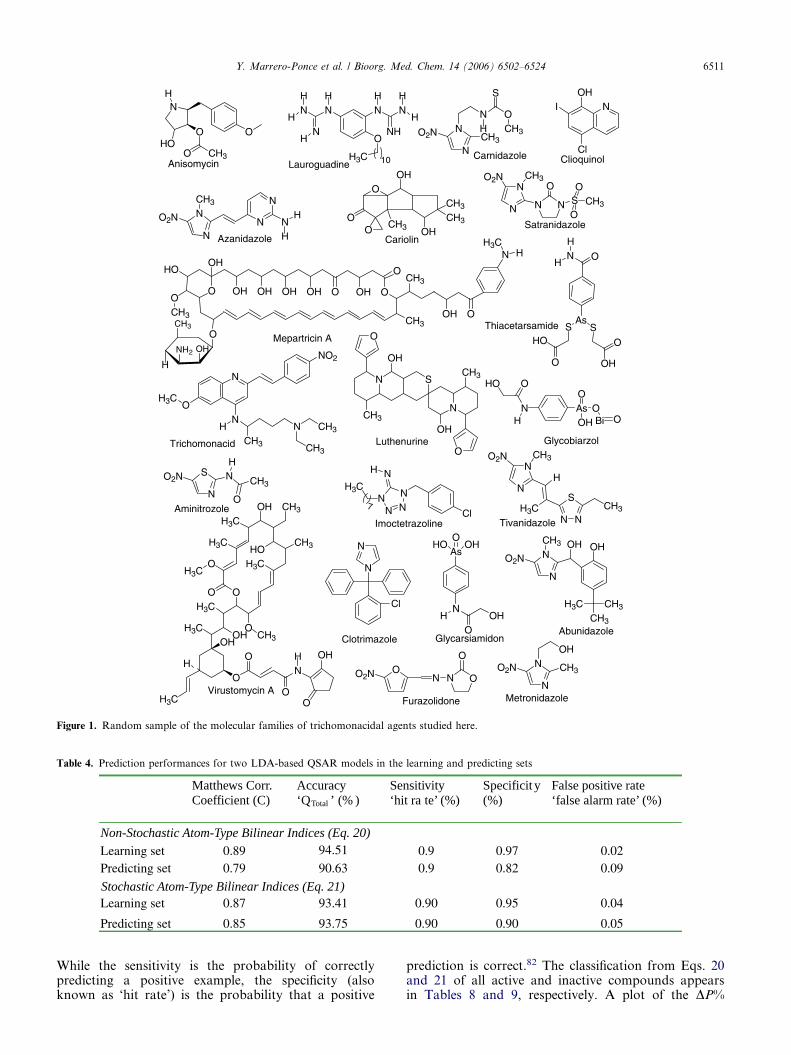
Table 4. Prediction performances for two LDA-based QSAR models in the learning and predicting sets
Matthews Corr. Coefficient (C)
Accuracy‘QTotal ’ (% )
Sensitivity ‘hit ra te’ (%)
Specificit y(%)
False positive rate ‘false alarm rate’ (%)
Non-Stochastic Atom-Type Bilinear Indices (Eq. 20)
Stochastic Atom-Type Bilinear Indices (Eq. 21)
O
N
HO
H
O CH3
O
Anisomycin
N
N
ONH
N
H3C
NH
HH
H
NH
H
H
10LauroguadineN
NO2N
N OH
S
CH3CH3
Carnidazole
NOH
Cl
I
Clioquinol
N
NN
NCH3
O2N NH
H
Azanidazole
OHO
OO CH3 OH
CH3
CH3
Cariolin
AsSS
O
HO O
OH
ONH
H
OHNH2
H
CH3O
O
CH3
O
OHOOHOHOHOHO
HO
OCH3
OH
CH3
OH O
NH3C
H
Mepartricin A
N N
N
N
O2N CH3O
SO
CH3
O
Satranidazole
N
NH
CH3
N CH3
CH3
OH3C
NO2
Trichomonacid
N S
N
O
CH3
CH3
O
OH
OHLuthenurine
N
OHO
AsO
OOH Bi OH
Glycobiarzol
N
SO2N NH
CH3
OAminitrozole
NNN N
N
Cl
H3C
H
7
Imoctetrazoline
N
N
O2N CH3
H3C
H
N N
SCH3
Tivanidazole
ON N O
O
O2N
Furazolidone
HOH3C
O
OH CH3
CH3
O
O
O
H3C
H3C
H3C
OHH3C
OH
O
ON
O
H OH
OH3C
H
CH3
H3C
Virustomycin A
N
N
Cl
Clotrimazole
AsHO OH
O
NH OH
OGlycarsiamidon
N
NCH3
O2NOH
CH3H3CCH3
OH
Abunidazole
N
N
O2N CH3
OH
Metronidazole
Thiacetarsamide
Figure 1. Random sample of the molecular families of trichomonacidal agents studied here.
Y. Marrero-Ponce et al. / Bioorg. Med. Chem. 14 (2006) 6502–6524 6511
While the sensitivity is the probability of correctlypredicting a positive example, the specificity (alsoknown as ‘hit rate’) is the probability that a positive
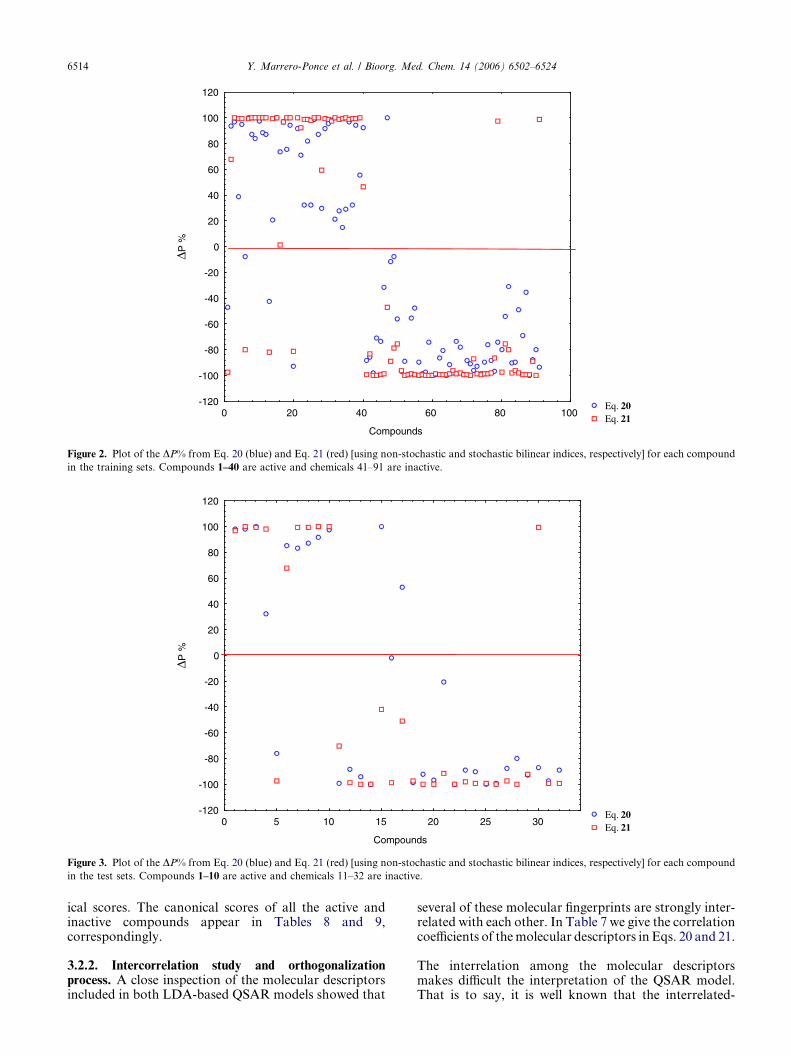
prediction is correct.82 The classification from Eqs. 20and 21 of all active and inactive compounds appearsin Tables 8 and 9, respectively. A plot of the DP%
meanð�Þ ¼ �1:38; p < 0:0001: ð21aÞ
Table 5. Names and classification of active compounds in training and test series according to the two TOMOCOMD-CARDD models developed in
this work
Name Name
a,cAntitrichomonal activity predicted by Eqs. 20 and 21, respectively, DP% = [P(active) � P(inactive)] · 100.b,dCanonical scores obtained from canonical analysis, Eqs. 20a and 21a, correspondingly.
6512 Y. Marrero-Ponce et al. / Bioorg. Med. Chem. 14 (2006) 6502–6524
(see Supplementary data) from both models, Eqs. 20and 21, for each compound in the training and testsets is illustrated in Figures 2 and 3, respectively,where the good classification results obtained withthe current approach can be observed.
Later, in both cases we also developed the linear discrim-inant canonical analysis by checking the following statis-tics: canonical correlation coefficient (Rcanonical), Chi-squared and its p-level [p(v2)].83 In this sense, the canoni-cal transformation of the LDA results with non-stochas-tic (Eq. 20) and stochastic (Eq. 21) bilinear fingerprintsgives rise to canonical roots with good canonical correla-tion coefficients of 0.75 and 0.84, correspondingly. Thechi-squared test permits us to assess the statistical signifi-cance of this analysis as having a p-level <0.0001.83
Atom-type non-stochastic and stochastic linear indices,as well as LDA antitrichomonal activity canonicalanalysis principal root, are given below:
Classroot ¼ 1:25þ 0:03MP bH1LðxE; yEÞ
� 0:02MEb1LðxE; yEÞ� 0:04MV bH
0LðxE�H; yE�HÞ� 6:19� 10�11MV b15Lðxhal; yhalÞN ¼ 91; k ¼ 0:43; Rcan ¼ 0:75;
v2 ¼ 71:63; meanðþÞ ¼ �1:26;
meanð�Þ ¼ 0:99; p < 0:0001:
ð20aÞ
Classroot ¼ � 2:07þ 0:07MEsbH1LðxE; yEÞ
� 0:06MP sbH1LðxE; yEÞ
� 0:02MEsb4LðxE; yEÞ þ 0:02MP sb4LðxE; yEÞN ¼ 91; k ¼ 0:28; Rcan ¼ 0:84;
v2 ¼ 108:42; meanðþÞ ¼ 1:76;
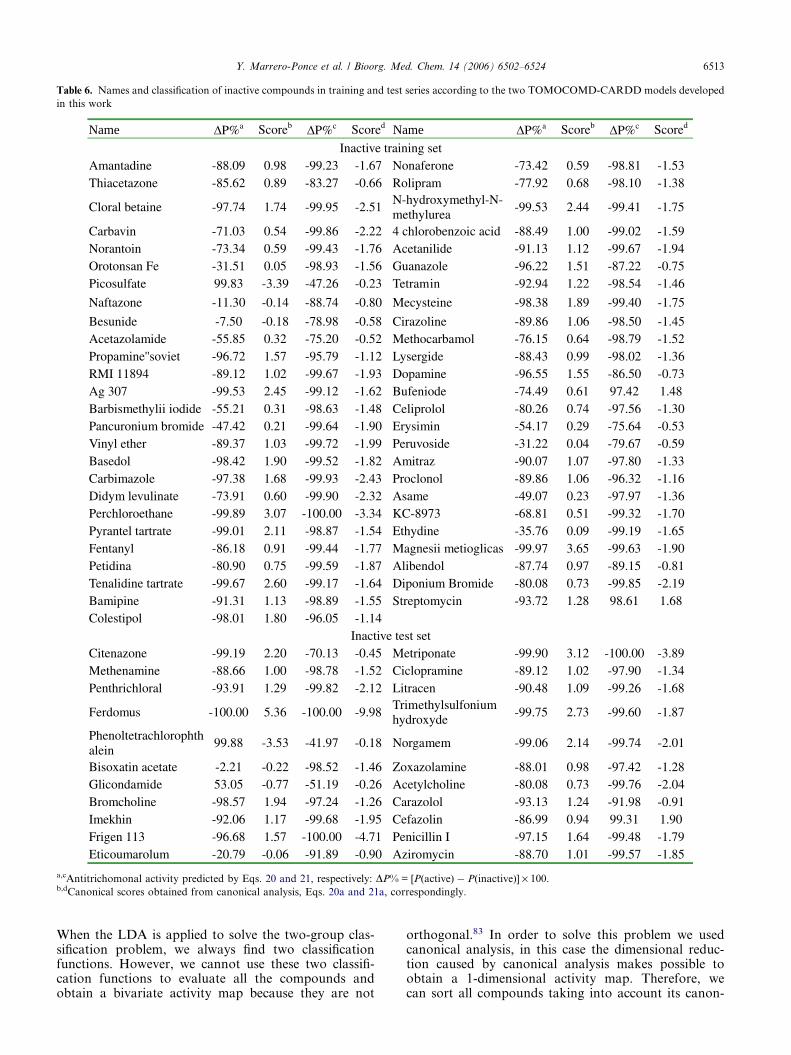
Table 6. Names and classification of inactive compounds in training and test series according to the two TOMOCOMD-CARDD models developed
in this work
Name Name
a,cAntitrichomonal activity predicted by Eqs. 20 and 21, respectively: DP% = [P(active) � P(inactive)] · 100.b,dCanonical scores obtained from canonical analysis, Eqs. 20a and 21a, correspondingly.
Y. Marrero-Ponce et al. / Bioorg. Med. Chem. 14 (2006) 6502–6524 6513
When the LDA is applied to solve the two-group clas-sification problem, we always find two classificationfunctions. However, we cannot use these two classifi-cation functions to evaluate all the compounds andobtain a bivariate activity map because they are not
orthogonal.83 In order to solve this problem we usedcanonical analysis, in this case the dimensional reduc-tion caused by canonical analysis makes possible toobtain a 1-dimensional activity map. Therefore, wecan sort all compounds taking into account its canon-
Eq. 20Eq. 21
0 20 40 60 80 100
Compounds
-120
-100
-80
-60
-40
-20
0
20
40
60
80
100
120
ΔP %
Figure 2. Plot of the DP% from Eq. 20 (blue) and Eq. 21 (red) [using non-stochastic and stochastic bilinear indices, respectively] for each compound
in the training sets. Compounds 1–40 are active and chemicals 41–91 are inactive.
Eq. 20Eq. 21
0 5 10 15 20 25 30
Compounds
-120
-100
-80
-60
-40
-20
0
20
40
60
80
100
120
ΔP %
Figure 3. Plot of the DP% from Eq. 20 (blue) and Eq. 21 (red) [using non-stochastic and stochastic bilinear indices, respectively] for each compound
in the test sets. Compounds 1–10 are active and chemicals 11–32 are inactive.
6514 Y. Marrero-Ponce et al. / Bioorg. Med. Chem. 14 (2006) 6502–6524
ical scores. The canonical scores of all the active andinactive compounds appear in Tables 8 and 9,correspondingly.
3.2.2. Intercorrelation study and orthogonalizationprocess. A close inspection of the molecular descriptorsincluded in both LDA-based QSAR models showed that
several of these molecular fingerprints are strongly inter-related with each other. In Table 7 we give the correlationcoefficients of the molecular descriptors in Eqs. 20 and 21.
The interrelation among the molecular descriptorsmakes difficult the interpretation of the QSAR model.That is to say, it is well known that the interrelated-
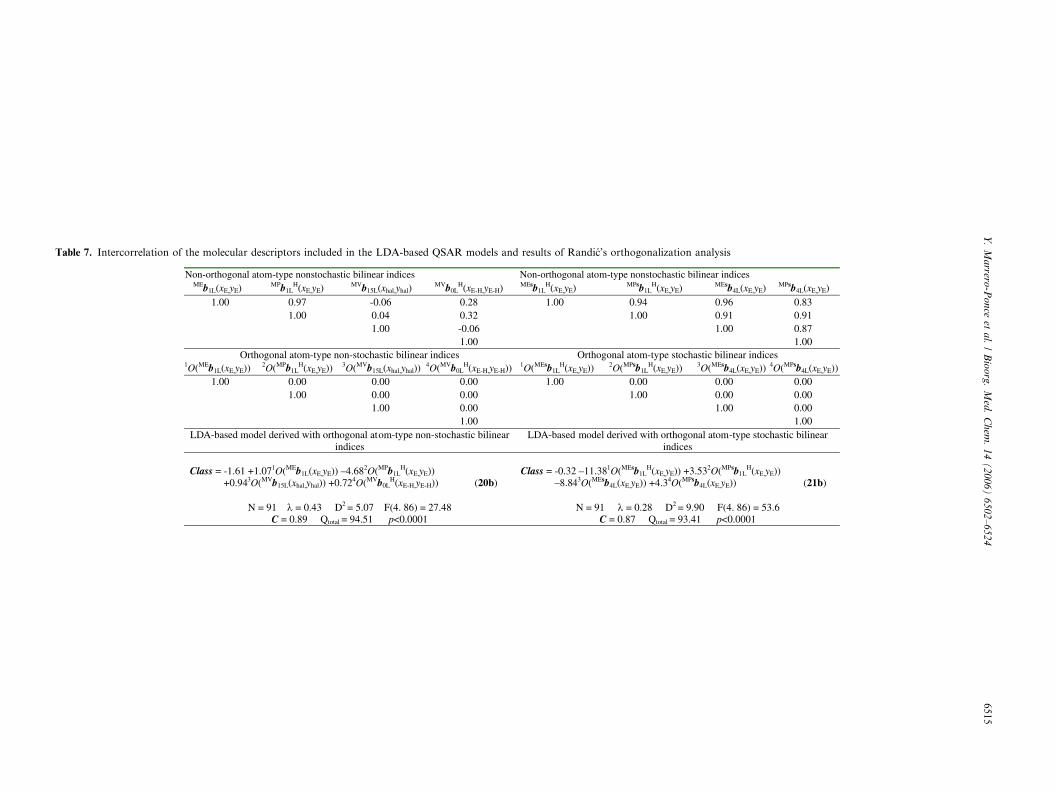
Table 7. Intercorrelation of the molecular descriptors included in the LDA-based QSAR models and results of Randic’s orthogonalization analysis
Y.
Ma
rrero-P
on
ceet
al.
/B
ioo
rg.
Med
.C
hem
.1
4(
20
06
)6
50
2–
65
24
65
15
6516 Y. Marrero-Ponce et al. / Bioorg. Med. Chem. 14 (2006) 6502–6524
ness among the different descriptors can result in highlyunstable correlation coefficients, which make impossi-ble to know the relative importance of an index andunderestimate the utility of the correlation coefficientin a model.75,32,77–79,84,85 To overcome this difficulty,an approach based on the orthogonalization of thedescriptors has been introduced in the literature.86–88
The main philosophy of this approach is to avoidthe exclusion of descriptors on the basis of its collin-earity with other variables included in the model.However, in some cases, strongly interrelated descrip-tors can enhance the quality of a model, because thesmall fraction of a descriptor that is not reproducedby its strongly interrelated pair can provide positivecontributions to the modeling.
This process is an approach in which molecular descrip-tors are transformed in such a way that they do notmutually correlate. Both, the non-orthogonal descrip-tors and derived orthogonal descriptors, contain thesame information. In this sense, the same statisticalparameters of the QSAR models are obtained.86–88 Inaddition, the coefficients of the QSAR model based onorthogonal descriptors are stable to the inclusion ofnovel descriptors, which permit interpreting the correla-tion coefficient and evaluating the role of individual fin-gerprints in the QSAR model.
In Table 7, we also resume the results of the orthogonal-ization of molecular descriptors included in both equa-tions. In this case, the models 20a and 21a correspondto the final models with the orthogonalized bilinear indi-ces. Here, we used the symbols mO(bk(x,y)), where thesuperscript m expresses the order of importance of thevariable (bk(x,y)) after a preliminary forward stepwiseanalysis, and O means orthogonal.
It has to be highlighted here that the orthogonal descrip-tor-based models coincide with the collinear (i.e., ordin-ary) bilinear descriptor-based models in all statisticalparameters. The statistical coefficients of LDA-QSARsk, D2, F, C, accuracy (Qtotal) are the same whether weuse either a set of non-orthogonal descriptors or the cor-responding set of orthogonal indices (see Table 7).86–88
This is not surprising, because the latter models are de-rived as linear combinations of the former ones and,therefore, the latter cannot have more information con-tent than the former have.
This fact also makes possible the interpretation of thecoefficients in the LDA-QSAR equations. Therefore,mO(bk(x)) may be classified according to the distance kinto short- (0–5), mid- (6–10), and long-range non-sto-chastic and stochastic bilinear indices. The informationin Table 7 clearly shows that the major contribution toantitrichomonal activity is provided by short-rangeatom-type (heteroatoms and H atoms bonding to hetero-atoms) bilinear indices. These short-range local descrip-tors are putative molecular charge, dipole moment, aswell as H-bonding acceptors, and H-bonding donors.
In general way, for non-stochastic descriptors the vari-ables weighted with the combination of atomic masses
and van der Waals volumes and the parameters weight-ed with the combination atomic masses and Paulingelectronegativities have a positive contribution to theantitrichomonal activity. While, the variable weightedwith the combination of atomic masses and Paulingelectronegativities has a negative contribution to theantitrichomonal activity. On the other hand, for sto-chastic descriptors the variables weighted with thecombination of atomic masses and atomic polarizabil-ities have a positive contribution to the antitrichomon-al activity. While, variables weighted with thecombination of atomic masses and Pauling electroneg-ativities have a negative contribution to the antitricho-monal activity.
3.2.3. Internal and external validation of the discriminantfunctions. In recent years, exhaustive validation ofmathematical models constitutes a main key of currentQSAR theory.89 In this sense, internal validationmethods (e.g., cross-validation) are considered bymany authors as an indicator or even as the ultimateproof of the stability and high-predictive power of anQSAR model. However, Golbraikh and Tropsha dem-onstrated that high values of leave-one-out square cor-relation coefficient q2 appear to be a necessary, butnot the sufficient, condition for the model to have ahigh predictive power.90 A more exhaustive cross-val-idation method can be used in which a fraction ofthe data (10–20%) is left out and predicted from amodel based on the remaining data. This process(leave-group-out, LGO) is repeated until each observa-tion has been left out at least once.90,91 In this report,each investigated data set was split randomly into sev-en groups of approximately the same size (15%). Eachgroup was left out (LGO) and that group was thenpredicted by a model developed from the remainingobservations (85% of the data). This process was car-ried out seven times on seven unique subsets. In thisway, each observation was left out once, in groupsof 15%, and its value predicted. The mean of theaccuracies for the seven groups will be used as the sig-nificant criterion for assessing model quality. The levelof overall (average) accuracy (for a 15% full leave-out)of 7-fold cross-validation procedure can be taken asgood confirmation of the predictive quality of the model.In addition, to assess the robustness and predictive powerof the found models, external prediction (test) sets werealso used. This type of model validation is important, ifwe take into consideration that the predictive ability ofa QSAR model can be estimated using only an externaltest set of compounds that were not used for buildingthe model.89–91 Therefore, it is important to ensure thatthe prediction algorithms are able to perform well on nov-el data from the same data domain.
The statistical results of a 7-fold cross-validation proce-dure are depicted in Table 8. The overall mean of thecorrect classification in the training (test) set for thisprocess for Eqs. 20 and 21 was 94.51% (93.20%) and92.67% (90.84%), correspondingly. The result of predic-tions on the 15% full cross-validation test evidenced thequality (robustness, stability, and predictive power) ofthe obtained models.
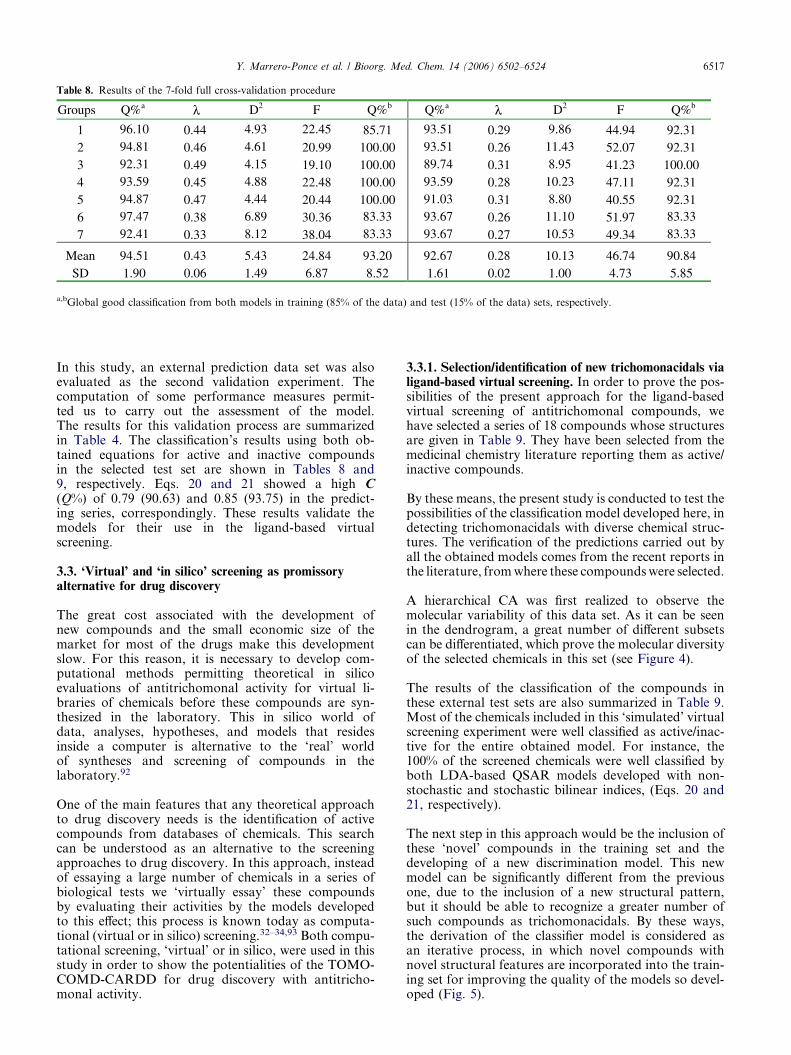
Table 8. Results of the 7-fold full cross-validation procedure
a,bGlobal good classification from both models in training (85% of the data) and test (15% of the data) sets, respectively.
Y. Marrero-Ponce et al. / Bioorg. Med. Chem. 14 (2006) 6502–6524 6517
In this study, an external prediction data set was alsoevaluated as the second validation experiment. Thecomputation of some performance measures permit-ted us to carry out the assessment of the model.The results for this validation process are summarizedin Table 4. The classification’s results using both ob-tained equations for active and inactive compoundsin the selected test set are shown in Tables 8 and9, respectively. Eqs. 20 and 21 showed a high C(Q%) of 0.79 (90.63) and 0.85 (93.75) in the predict-ing series, correspondingly. These results validate themodels for their use in the ligand-based virtualscreening.
3.3. ‘Virtual’ and ‘in silico’ screening as promissoryalternative for drug discovery
The great cost associated with the development ofnew compounds and the small economic size of themarket for most of the drugs make this developmentslow. For this reason, it is necessary to develop com-putational methods permitting theoretical in silicoevaluations of antitrichomonal activity for virtual li-braries of chemicals before these compounds are syn-thesized in the laboratory. This in silico world ofdata, analyses, hypotheses, and models that residesinside a computer is alternative to the ‘real’ worldof syntheses and screening of compounds in thelaboratory.92
One of the main features that any theoretical approachto drug discovery needs is the identification of activecompounds from databases of chemicals. This searchcan be understood as an alternative to the screeningapproaches to drug discovery. In this approach, insteadof essaying a large number of chemicals in a series ofbiological tests we ‘virtually essay’ these compoundsby evaluating their activities by the models developedto this effect; this process is known today as computa-tional (virtual or in silico) screening.32–34,93 Both compu-tational screening, ‘virtual’ or in silico, were used in thisstudy in order to show the potentialities of the TOMO-COMD-CARDD for drug discovery with antitricho-monal activity.
3.3.1. Selection/identification of new trichomonacidals vialigand-based virtual screening. In order to prove the pos-sibilities of the present approach for the ligand-basedvirtual screening of antitrichomonal compounds, wehave selected a series of 18 compounds whose structuresare given in Table 9. They have been selected from themedicinal chemistry literature reporting them as active/inactive compounds.
By these means, the present study is conducted to test thepossibilities of the classification model developed here, indetecting trichomonacidals with diverse chemical struc-tures. The verification of the predictions carried out byall the obtained models comes from the recent reports inthe literature, from where these compounds were selected.
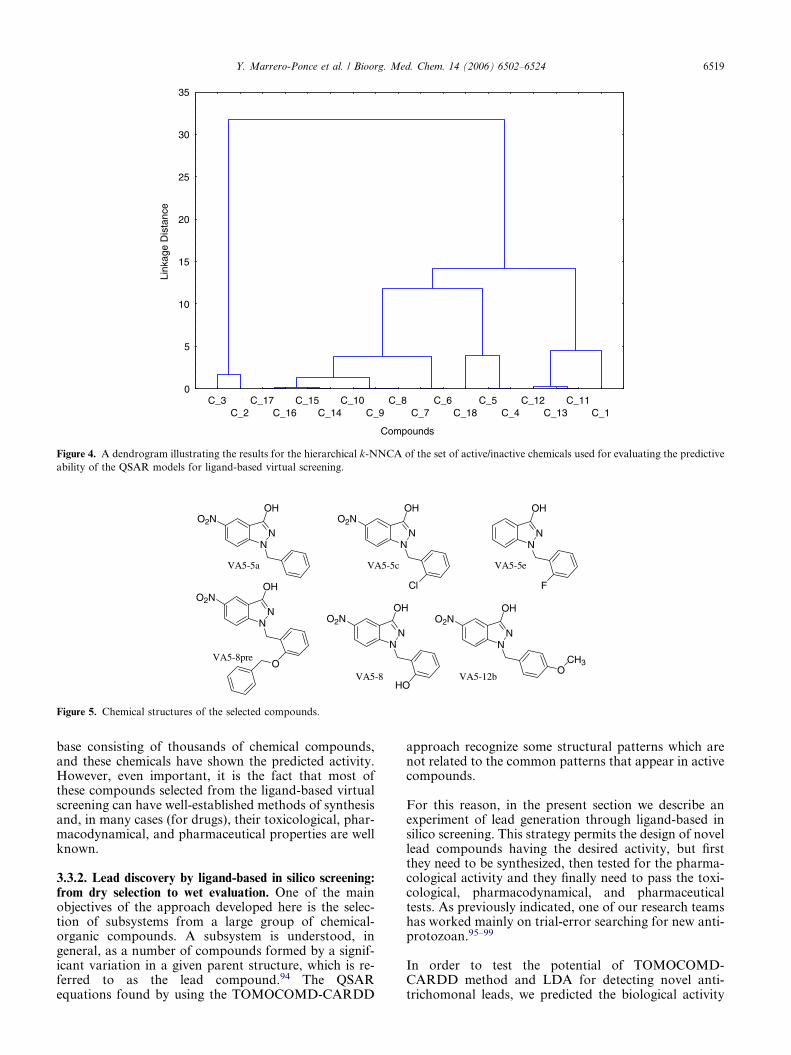
A hierarchical CA was first realized to observe themolecular variability of this data set. As it can be seenin the dendrogram, a great number of different subsetscan be differentiated, which prove the molecular diversityof the selected chemicals in this set (see Figure 4).
The results of the classification of the compounds inthese external test sets are also summarized in Table 9.Most of the chemicals included in this ‘simulated’ virtualscreening experiment were well classified as active/inac-tive for the entire obtained model. For instance, the100% of the screened chemicals were well classified byboth LDA-based QSAR models developed with non-stochastic and stochastic bilinear indices, (Eqs. 20 and21, respectively).
The next step in this approach would be the inclusion ofthese ‘novel’ compounds in the training set and thedeveloping of a new discrimination model. This newmodel can be significantly different from the previousone, due to the inclusion of a new structural pattern,but it should be able to recognize a greater number ofsuch compounds as trichomonacidals. By these ways,the derivation of the classifier model is considered asan iterative process, in which novel compounds withnovel structural features are incorporated into the train-ing set for improving the quality of the models so devel-oped (Fig. 5).
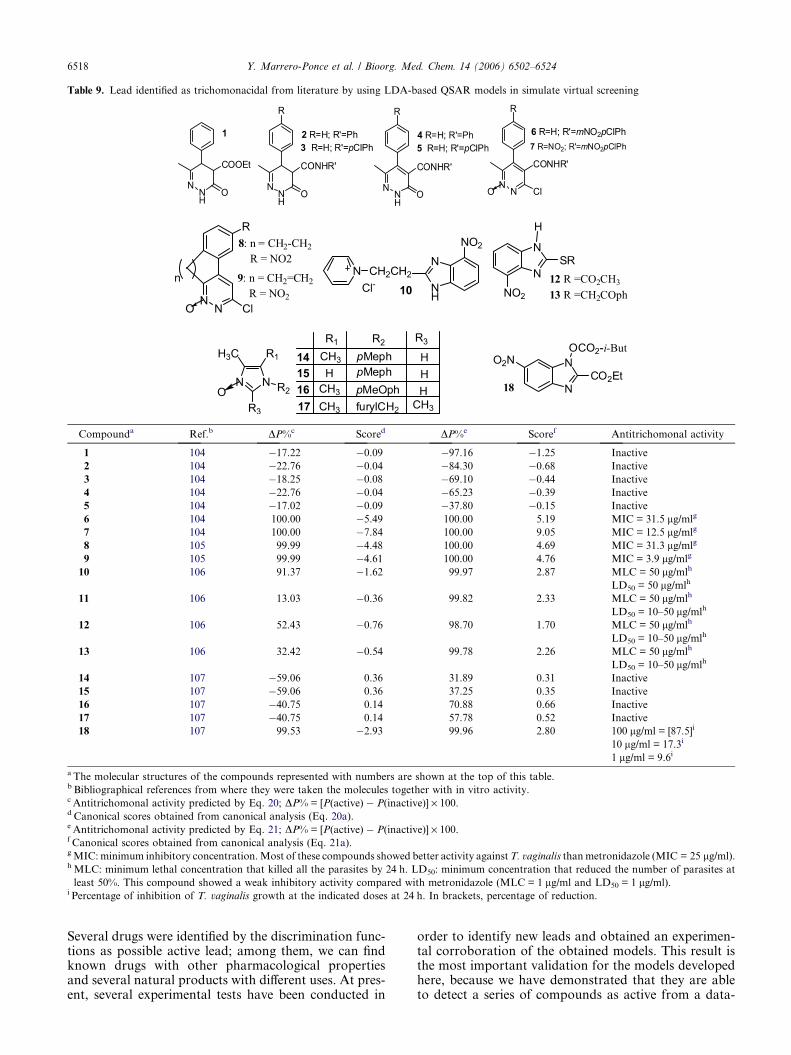
Table 9. Lead identified as trichomonacidal from literature by using LDA-based QSAR models in simulate virtual screening
Compounda Ref.b DP%c Scored DP%e Scoref Antitrichomonal activity
1 104 �17.22 �0.09 �97.16 �1.25 Inactive
2 104 �22.76 �0.04 �84.30 �0.68 Inactive
3 104 �18.25 �0.08 �69.10 �0.44 Inactive
4 104 �22.76 �0.04 �65.23 �0.39 Inactive
5 104 �17.02 �0.09 �37.80 �0.15 Inactive
6 104 100.00 �5.49 100.00 5.19 MIC = 31.5 lg/mlg
7 104 100.00 �7.84 100.00 9.05 MIC = 12.5 lg/mlg
8 105 99.99 �4.48 100.00 4.69 MIC = 31.3 lg/mlg
9 105 99.99 �4.61 100.00 4.76 MIC = 3.9 lg/mlg
10 106 91.37 �1.62 99.97 2.87 MLC = 50 lg/mlh
LD50 = 50 lg/mlh
11 106 13.03 �0.36 99.82 2.33 MLC = 50 lg/mlh
LD50 = 10–50 lg/mlh
12 106 52.43 �0.76 98.70 1.70 MLC = 50 lg/mlh
LD50 = 10–50 lg/mlh
13 106 32.42 �0.54 99.78 2.26 MLC = 50 lg/mlh
LD50 = 10–50 lg/mlh
14 107 �59.06 0.36 31.89 0.31 Inactive
15 107 �59.06 0.36 37.25 0.35 Inactive
16 107 �40.75 0.14 70.88 0.66 Inactive
17 107 �40.75 0.14 57.78 0.52 Inactive
18 107 99.53 �2.93 99.96 2.80 100 lg/ml = [87.5]i
10 lg/ml = 17.3i
1 lg/ml = 9.6i
a The molecular structures of the compounds represented with numbers are shown at the top of this table.b Bibliographical references from where they were taken the molecules together with in vitro activity.c Antitrichomonal activity predicted by Eq. 20; DP% = [P(active) � P(inactive)] · 100.d Canonical scores obtained from canonical analysis (Eq. 20a).e Antitrichomonal activity predicted by Eq. 21; DP% = [P(active) � P(inactive)] · 100.f Canonical scores obtained from canonical analysis (Eq. 21a).g MIC: minimum inhibitory concentration. Most of these compounds showed better activity against T. vaginalis than metronidazole (MIC = 25 lg/ml).h MLC: minimum lethal concentration that killed all the parasites by 24 h. LD50: minimum concentration that reduced the number of parasites at
least 50%. This compound showed a weak inhibitory activity compared with metronidazole (MLC = 1 lg/ml and LD50 = 1 lg/ml).i Percentage of inhibition of T. vaginalis growth at the indicated doses at 24 h. In brackets, percentage of reduction.
6518 Y. Marrero-Ponce et al. / Bioorg. Med. Chem. 14 (2006) 6502–6524
Several drugs were identified by the discrimination func-tions as possible active lead; among them, we can findknown drugs with other pharmacological propertiesand several natural products with different uses. At pres-ent, several experimental tests have been conducted in
order to identify new leads and obtained an experimen-tal corroboration of the obtained models. This result isthe most important validation for the models developedhere, because we have demonstrated that they are ableto detect a series of compounds as active from a data-
C_3C_2
C_17C_16
C_15C_14
C_10C_9
C_8C_7
C_6C_18
C_5C_4
C_12C_13
C_11C_1
Compounds
0
5
10
15
20
25
30
35
Link
age
Dis
tanc
e
Figure 4. A dendrogram illustrating the results for the hierarchical k-NNCA of the set of active/inactive chemicals used for evaluating the predictive
ability of the QSAR models for ligand-based virtual screening.
NN
OHO2N
Cl
NN
OHO2N
NN
OH
F
NN
OH
O
O2N
VA5-5a VA5-5c VA5-5e
VA5-8preN
N
OH
HO
O2N
VA5-8
NN
OH
OCH3
O2N
VA5-12b
Figure 5. Chemical structures of the selected compounds.
Y. Marrero-Ponce et al. / Bioorg. Med. Chem. 14 (2006) 6502–6524 6519
base consisting of thousands of chemical compounds,and these chemicals have shown the predicted activity.However, even important, it is the fact that most ofthese compounds selected from the ligand-based virtualscreening can have well-established methods of synthesisand, in many cases (for drugs), their toxicological, phar-macodynamical, and pharmaceutical properties are wellknown.
3.3.2. Lead discovery by ligand-based in silico screening:from dry selection to wet evaluation. One of the mainobjectives of the approach developed here is the selec-tion of subsystems from a large group of chemical-organic compounds. A subsystem is understood, ingeneral, as a number of compounds formed by a signif-icant variation in a given parent structure, which is re-ferred to as the lead compound.94 The QSARequations found by using the TOMOCOMD-CARDD
approach recognize some structural patterns which arenot related to the common patterns that appear in activecompounds.
For this reason, in the present section we describe anexperiment of lead generation through ligand-based insilico screening. This strategy permits the design of novellead compounds having the desired activity, but firstthey need to be synthesized, then tested for the pharma-cological activity and they finally need to pass the toxi-cological, pharmacodynamical, and pharmaceuticaltests. As previously indicated, one of our research teamshas worked mainly on trial-error searching for new anti-protozoan.95–99
In order to test the potential of TOMOCOMD-CARDD method and LDA for detecting novel anti-trichomonal leads, we predicted the biological activity
Tab
le1
0.
Res
ult
so
fth
eco
mp
uta
tio
nal
eva
luati
on
usi
ng
LD
A-b
ase
dQ
SA
Rm
od
els
an
dp
erce
nta
ges
of
cyto
sta
tic
an
d/o
rcy
toci
da
la
ctiv
ity
[bra
cket
s]fo
rth
eth
ree
con
cen
tra
tio
ns
ass
ayed
inv
itro
ag
ain
st
Tri
cho
mo
na
sva
gin
ali
s
*T
he
mo
lecu
lar
stru
ctu
res
of
the
com
po
un
ds
rep
rese
nte
dw
ith
cod
esare
sho
wn
inF
igu
re2.
a,d
Insi
lico
cla
ssifi
cati
on
ob
tain
edfr
om
mo
del
s2
0a
nd
21
usi
ng
no
n-s
toch
ast
ica
nd
sto
cha
stic
ato
m-t
yp
eb
ilin
ear
ind
ices
,re
spec
tiv
ely.
b,e
Res
ult
sfo
rth
ecl
ass
ifica
tio
no
fco
mp
ou
nd
so
bta
ined
fro
mm
od
els
20
an
d2
1,
corr
esp
on
din
gly
:D
P%
=[P
(act
ive)�
P(i
nact
ive)
]·
10
0.
c,fC
an
on
ica
lsc
ore
so
bta
ined
fro
mm
od
els
20
aa
nd
21
a,
corr
esp
on
din
gly
.gO
bse
rved
(ex
per
imen
tal
act
ivit
y)
cla
ssifi
cati
on
ag
ain
stT
.va
gin
ali
s.hP
ha
rmaco
logic
al
act
ivit
yo
fea
chte
sted
com
po
un
d,
wh
ich
wa
sa
dd
edto
the
cult
ure
sa
td
ose
so
f1
00
,1
0,
an
d1
lg
/ml:
%C
A#
=cy
tost
ati
ca
ctiv
ity
(24
or
48
h)
an
d[%
C#]
=cy
toci
da
la
ctiv
ity
(24
or
48
h).
MT
Z=
met
ron
idazo
le(c
on
cen
trati
on
sfo
rm
etro
nid
azo
lew
ere
2,
1,
an
d0.5
mg/m
l,re
spec
tivel
y).
6520 Y. Marrero-Ponce et al. / Bioorg. Med. Chem. 14 (2006) 6502–6524
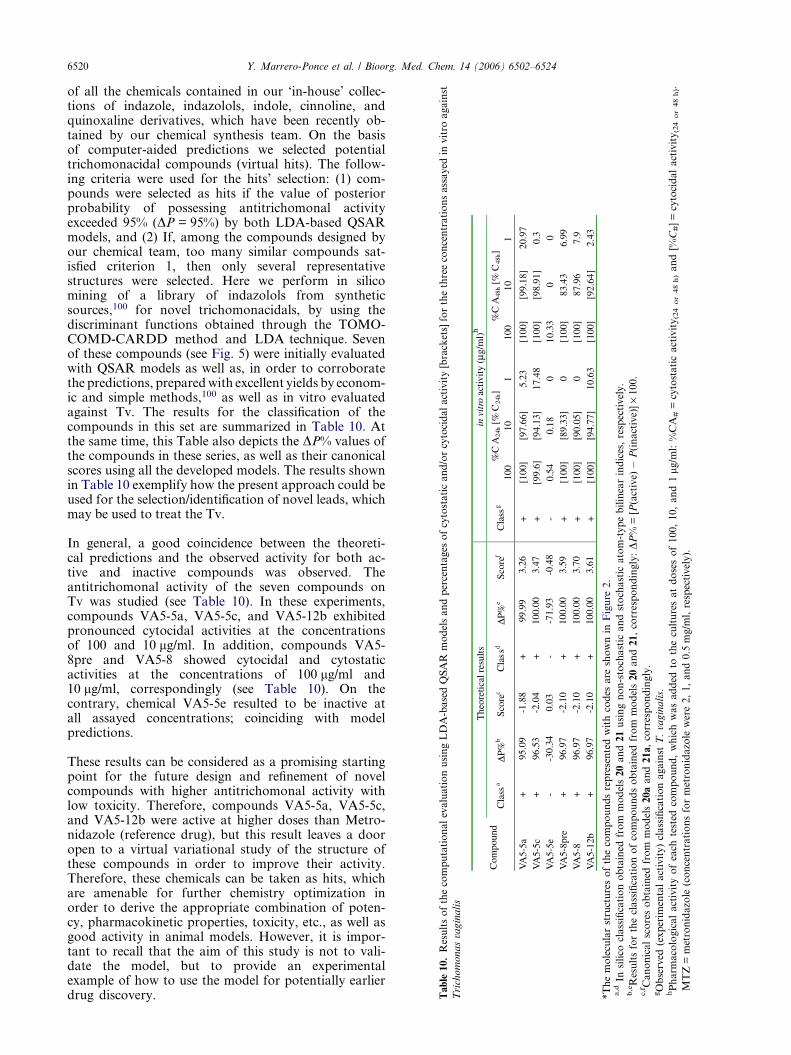
of all the chemicals contained in our ‘in-house’ collec-tions of indazole, indazolols, indole, cinnoline, andquinoxaline derivatives, which have been recently ob-tained by our chemical synthesis team. On the basisof computer-aided predictions we selected potentialtrichomonacidal compounds (virtual hits). The follow-ing criteria were used for the hits’ selection: (1) com-pounds were selected as hits if the value of posteriorprobability of possessing antitrichomonal activityexceeded 95% (DP = 95%) by both LDA-based QSARmodels, and (2) If, among the compounds designed byour chemical team, too many similar compounds sat-isfied criterion 1, then only several representativestructures were selected. Here we perform in silicomining of a library of indazolols from syntheticsources,100 for novel trichomonacidals, by using thediscriminant functions obtained through the TOMO-COMD-CARDD method and LDA technique. Sevenof these compounds (see Fig. 5) were initially evaluatedwith QSAR models as well as, in order to corroboratethe predictions, prepared with excellent yields by econom-ic and simple methods,100 as well as in vitro evaluatedagainst Tv. The results for the classification of thecompounds in this set are summarized in Table 10. Atthe same time, this Table also depicts the DP% values ofthe compounds in these series, as well as their canonicalscores using all the developed models. The results shownin Table 10 exemplify how the present approach could beused for the selection/identification of novel leads, whichmay be used to treat the Tv.
In general, a good coincidence between the theoreti-cal predictions and the observed activity for both ac-tive and inactive compounds was observed. Theantitrichomonal activity of the seven compounds onTv was studied (see Table 10). In these experiments,compounds VA5-5a, VA5-5c, and VA5-12b exhibitedpronounced cytocidal activities at the concentrationsof 100 and 10 lg/ml. In addition, compounds VA5-8pre and VA5-8 showed cytocidal and cytostaticactivities at the concentrations of 100 lg/ml and10 lg/ml, correspondingly (see Table 10). On thecontrary, chemical VA5-5e resulted to be inactive atall assayed concentrations; coinciding with modelpredictions.
These results can be considered as a promising startingpoint for the future design and refinement of novelcompounds with higher antitrichomonal activity withlow toxicity. Therefore, compounds VA5-5a, VA5-5c,and VA5-12b were active at higher doses than Metro-nidazole (reference drug), but this result leaves a dooropen to a virtual variational study of the structure ofthese compounds in order to improve their activity.Therefore, these chemicals can be taken as hits, whichare amenable for further chemistry optimization inorder to derive the appropriate combination of poten-cy, pharmacokinetic properties, toxicity, etc., as well asgood activity in animal models. However, it is impor-tant to recall that the aim of this study is not to vali-date the model, but to provide an experimentalexample of how to use the model for potentially earlierdrug discovery.
Y. Marrero-Ponce et al. / Bioorg. Med. Chem. 14 (2006) 6502–6524 6521
4. Conclusions
In conclusions, the combination of LDA and TOMO-COMD-CARDD MDs can contribute to the design ofnew compounds with antitrichomonal activity and pos-sibly identify drugs with a broader spectrum of antipro-tozoan activity. Computational screening of thousandsof virtual and in silico molecules using this method insearch for optimal substitutions is readily feasible andis far less costly than combinatorial chemistry and in vi-tro screening. The main conclusion of this report is thatit has been able to develop QSAR models for the mainstep of drug discovery: lead identification (also knownas lead generation step). These in silico models permitone to classify new ‘physical’ or ‘virtual’ chemicals as ac-tive or inactive ones in the chemotherapy of the tricho-moniasis, and they will permit a more rational discoveryof new lead compounds with antitrichomonal activity.In fact, this report showed the five new chemicals withpotentialities in antitrichomonal therapeutics. Thesecompounds possess structural features not seen inknown trichomonacidal compounds and thus can serveas excellent leads for further optimization of antitricho-monal activity. The identification of this new family,making use of the TOMOCOMD-CARDD approach,constitutes an example of how this rational computer-aided design method can help to reduce cost, and toincrease the rate in which NCEs progress through thepipeline.
5. Experimental
5.1. Computational strategies
Molecular fingerprints were generated by means of theinteractive program for molecular design and bioinfor-matic research TOMOCOMD.101 It consists of foursubprograms; each one of them allows both drawingthe structures (drawing mode) and calculating molecular2D/3D descriptors (calculation mode). The modulesare named computed-aided ‘rational’ drug design(CARDD), computed-aided modeling in protein science(CAMPS), computed-aided nucleic acid research (CA-NAR) and computed-aided bio-polymers docking(CABPD). The CARDD module was selected for draw-ing all the structures, as well as for the computation ofnon-stochastic and stochastic bilinear indices. The mainsteps for the application of this method in QSAR/QSPRand for drug design can be briefly summarized asfollows:
1. Drawing of the molecular pseudographs for eachmolecule in the data set, using the drawing mode.
2. Use appropriate weights in order to differentiate themolecular atoms. The weights used in this study arethose previously proposed for the calculation of theDRAGON descriptors,55,56,102,103 that is, atomicmass (M), atomic polarizability (P), atomic electro-negativity in Pauling scale (E), plus van der Waalsatomic volume (V).The values of these atomic labelsare shown in Table 2.
3. Computation of the total and local (atomic, group,and atom-type) bilinear indices can be carried outin the software calculation mode, where one canselect the atomic properties and the descriptor familybefore calculating the MDs. This software generates atable in which the rows correspond to the com-pounds, and the columns correspond to the atom-based (both total and local) bilinear maps or otherMD family implemented in this program.
4. Development of a QSPR/QSAR equation by usingseveral multivariate analytical techniques, forinstance, linear discriminant analysis. Therefore,one can find a quantitative relationship between anactivity A and the bilinear fingerprints having, forinstance, the following appearance:
A ¼ a0b0ðx; yÞ þ a1b1ðx; yÞ þ a2b2ðx; yÞ þ . . . :
þ akbkðx; yÞ þ c ð22Þ
where A is the measured activity, bk(x,y) are the kthnon-stochastic total bilinear indices, and the ak’s arethe coefficients obtained by the linear regressionanalysis.5. Test of the robustness and predictive power of theQSPR/QSAR equation by using internal [leave-group-out (LGO)] and external (using a test set andan external predicting set) validation techniques.
5.2. Database selection
A data set of 123 organic-chemicals having a great struc-tural variability was collected from the literature for thepresent study.74,75 The data set of active compounds (50chemicals used as trichomonacidal in clinic) was chosen,considering a representation of most of the differentstructural patterns and action modes for the case ofcompounds with antitrichomonal activity. In this sense,it is remarkable that the wide variability of drugs andmechanisms of action of active compounds in the train-ing and prediction sets assures an adequate extrapola-tion power, and increases the possibilities of thediscovery of new lead compounds with novel mecha-nisms of antitrichomonal activity, one of the most criti-cal aspects in the construction of non-congeneric data.Therefore, this data set provides a useful tool for scien-tific research in synthesis, natural-product chemistry,theoretical chemistry, and other areas related to the fieldof antiprotozoal drugs.
In addition, the set of inactive compounds was obtainedby selecting at random 73 drugs with differentpharmacological uses. These drugs include, for instance,antibiotic, antivirals, sedatives/hypnotics, diuretics, anti-convulsants, hemostatics, oral hypoglycemics, antihyper-tensives, antihelminthics, anticancer, antifungal, etc,guaranteeing also a great structural variability. However,the declaration of these compounds as ‘inactive’ anti-trichomonal per se does not guarantee that they do notexhibit trichomonacidal side-effects for some of thoseorganic-chemical drugs that have been left undetectedso far. This problem can be reflected in the results of clas-sification for the series of inactive chemicals. Therefore,the developed LDA-based QSAR models can classify
6522 Y. Marrero-Ponce et al. / Bioorg. Med. Chem. 14 (2006) 6502–6524
some of these compounds as active against the Tv, help-ing with the identification of new chemicals, among drugsfrom large data sets with other pharmacological uses.
Finally, two kinds of cluster analyses (CA) were per-formed for active and inactive series of compounds,in order to split (design) the data set into training andpredicting series in a ‘rational’ way.
5.3. Data analysis and processing
Statistical analyses were performed using STATISTI-CA77 software package. Cluster analysis and linear dis-criminant analysis modules were used to perform bothseries of compounds (training and test) and to get clas-sification functions, correspondingly. After that, as away to improve the statistical interpretation of the mod-els, the Randic’s method of orthogonalization wascarried out. For a detailed description of all these meth-ods please see the Supplementary data.
5.4. Chemical methods
The synthesis and characterization of seven indazolols,and cross references have been reported by other ofour research teams.100
5.5. Determination of in vitro trichomonacidal activity
The biological activity was assayed on T. vaginalisJH31A#4 Ref. No. 30326 (ATCC, MD, USA) in modi-fied Diamond medium supplemented with equine serumand grown at 37 �C (5% CO2). The compounds were add-ed to the cultures at several concentrations (100, 10, and1 lg/ml) after 6 h of the seeding (0 h). Viable protozoawere assessed at 24 and 48 h after incubation at 37 �Cby using the Neubauer chamber. Metronidazole (Sig-ma–Aldrich, SA, Spain) was used as reference drug atconcentrations of 2, 1, and 0.5 lg/ml. Cytocidal and cyto-static activities were determined by calculation of per-centages of cytocidal (%C) and cytostatic activities(%CA), in relation to controls as previously reported.96,97
Acknowledgments
One of the authors (M.-P.Y.) thanks the program‘Estades Temporals per a Investigadors Convidats’ fora fellowship to work at Valencia University (2006–2007). F.T. thanks support from Spanish MEC DGI(Project No. CTQ2004-07768-C02-01/BQU) and Gener-alitat Valenciana (DGEUI INF01-051 and INFRA03-047, and OCYT GRUPOS03-173).
Supplementary data
A detailed description of cluster analysis, linear discrim-inant analysis, orthogonalization of descriptors, and‘virtual’ and ‘in silico’ screening is available via theInternet at http://www.sciencedirect.com. Supplementa-ry data associated with this article can be found, in theonline version, at doi:10.1016/j.bmc.2006.06.016.
References and notes
1. Petrin, D.; Delgaty, K.; Bhatt, R.; Garber, G. Clin.Microbiol. 1998, 11, 300.
2. Krieger, J. N. Sex. Transm. Dis. 2000, 27, 241.3. World Health Organization. In Global program on AIDS.
World Health Organization, Geneva, Switzerland, 1995,pp 2–27.
4. Wisdom, A. R.; Dunlop, E. M. C. Br. J. Vener. Dis. 1965,41, 90.
5. Fouts, A. C.; Kraus, S. J. J. Infect. Dis. 1980, 141, 137.6. Quan, M. Clin. Cornerstone 2000, 3, 36.7. Cotch, M. F.; Pastorek, J. G., II; Nugent, R. P.; Hillier,
S. L.; Gibbs, R. S.; Martin, D. H.; Eschenbach, D. A.;Edelman, R.; Carey, J. C.; Regan, J. A.; Krohn, M. A.;Klebanoff, M. A.; Rao, A. V.; Rhoads, G. G. Sex.Transm. Dis. 1997, 24, 353.
8. Bowden, F. J.; Garnett, G. P. Sex. Transm. Infect. 1999,75, 372.
9. Hook, E. W., III Sex. Transm. Dis. 1999, 26, 388.10. Sorvillo, F.; Kovacs, A.; Kerndt, P.; Stek, A.; Mudersp-
ach, L.; Sanchez-Keeland, L. Am. J. Trop. Med. Hyg.1998, 58, 495.
11. Laga, M.; Manoka, A.; Kivuvu, M.; Malele, V.; Tuliza,M.; Nzila, N.; Goeman, J.; Behets, F.; Batter, V.; Alary,M.; Heyward, W. L.; Ryder, R. W.; Piot, P. AIDS.London 1993, 7, 95.
12. Centers for Disease Control and Prevention. Morbid.Mortal. Weekly Report, 1993, 42, p 70.
13. Muller, M.; Lindmark, R. G. Antimicrob. Agents Che-mother. 1976, 9, 696.
14. Muller, M. Biochem. Pharmacol. 1986, 35, 37.15. Tocher, J. H.; Edwards, D. I. Biochem. Pharmacol. 1994,
48, 1089.16. Nielsen, M. H. Acta Pathol. Microbiol. Scand. Sect., B
1976, 84, 93.17. Arnold, M. Ther. Umsch. 1966, 23, 356.18. Aure, J. C.; Gjonnaess, H. Acta Obstet. Gynecol. Scand.
1969, 48, 440.19. de Carneri, I. In A. Corradetti, Ed.; In Proceedings of the
First International Congress of Parasitology, PergamonPress: New York, 1966;Vol. 1, pp 366–367.
20. de Carneri, I.; Baldi, G. F.; Giannone, R.; Passalia, S.Arch. Ostet. Gynecol. 1963, 68, 422.
21. Diddle, A. W. Am. J. Obstet. Gynecol. 1967, 98, 583.22. Giannone, R. M. Gynecology 1972, 24, 354.23. Kurnatowska, A. Wiad Parazytol. 1969, 15, 399.24. Robinson, S. C. Can. Med. Assoc. J. 1962, 86, 665.25. Korner, B.; Jensen, H. K. Br. J. Vener. Dis. 1976, 52,
404.26. McFadzean, J. A.; Pugh, L. M.; Squires, S. L.; Whelan,
J. P. F. Br. J. Vener. Dis. 1969, 45, 161.27. Roe, F. J. C. J. Antimicrob. Chemother. 1977, 3, 205.28. Kane, P. O.; McFadzean, J. A.; Squires, S. Br. J. Vener.
Dis. 1961, 37, 276.29. Nicol, C. S.; Evans, A. J.; McFadzean, J. A.; Squires, S.
L. Lancet 1966, 441.30. Meingassner, J. G.; Thurner J. Antimicrob. Agents
Chemother. 1979, 15, 254.31. Apweiler, R. Biosilico 2003, I, 5.32. Xu, J.; Hagler, A. Molecules 2002, 7, 566.33. Seifert, H. J. M.; Wolf, K.; Vitt, D. Biosilico 2003, 1, 143.34. Dixit, K. S.; Mitra, S. N. CRIPS 2002, 3, 1.35. Marrero-Ponce, Y. J. Chem. Inf. Comput. Sci 2004, 44,
2010.36. Marrero-Ponce, Y. Molecules 2003, 8, 687.37. Marrero-Ponce, Y.; Torrens, F. Molecules, submitted
for publication (see also ECSOC-9, Conference HallG, G-014).
Y. Marrero-Ponce et al. / Bioorg. Med. Chem. 14 (2006) 6502–6524 6523
38. Marrero-Ponce, Y.; Torrens, F. J. Comput.-Aided Mol.Des., accepted for publication.
39. Marrero-Ponce, Y.; Torrens, F. J. Phys. Chem. A.,submitted for publication (see also ECSOC-9, Confer-ence Hall G, G-015).
40. Marrero-Ponce, Y.; Torrens, F. J. Mol. Struct. (THEO-CHEM), submitted for publication.
41. Marrero-Ponce, Y.; Castillo-Garit, J. A. J. Comput.-Aided Mol. Des. 2005, 19, 369.
42. Marrero-Ponce, Y.; Huesca, G. A.; Ibarra, V. F. J. Mol.Struct. (THEOCHEM) 2005, 717, 67.
43. Marrero-Ponce, Y.; Montero, T. A.; Romero, Z. C.;Iyarreta, V. M.; Mayon, P. M.; Garcıa, S. R. Bioorg.Med. Chem. 2005, 13, 1293.
44. Marrero-Ponce, Y.; Iyarreta, V. M.; Montero, T. A.;Romero, Z. C.; Brandt, C. A.; Avila, P. E.; Kirchgat-ter, K.; Machado, Y. J. Chem. Inf. Model. 2005, 45,1082.
45. Marrero-Ponce, Y.; Medina, M. R.; Martinez, Y.;Torrens, F.; Romero, Z. V.; Castro, E. A.; Abalo, R.G. J. Mol. Model. 2006, 12, 255–271.
46. Meneses, M. A.; Marrero-Ponce, Y.; Machado-Tugores,Y.; Montero-Torres, A.; Montero Pereira, D.; Escario, J.A.; Nogal-Ruiz, J. J.; Ochoa, C.; Aran, V. J.; Martınez-Fernandez, A. R.; Garcıa Sanchez, R. N. Bioorg. Med.Chem. Lett. 2005, 15, 3838.
47. Castillo-Garit, J. A.; Marrero-Ponce, Y.; Torrens, F.Bioorg. Med. Chem. 2006, 14, 2398–2408.
48. Marrero-Ponce, Y.; Cabrera, M. A.; Romero, Z. V.;Bermejo, M.; Siverio, D.; Torrens, F. Internet Electron. J.Mol. Des. 2005, 4, 124.
49. Marrero-Ponce, Y.; Meneses, M. A.; Machado, T. Y.;Montero, P. D.; Escario, J. A.; Nogal, R. J. J.; Ochoa,C.; Aran, V. J.; Martınez, F. A. R.; Garcıa, S. R. N.;Montero, T. A.; Torrens, F. Curr. Drug Discov. Technol.2005, 2, 245–265.
50. Wang, R.; Gao, Y.; Lai, L. Perspect. Drug Discov. Des.2000, 19, 47.
51. Ertl, P.; Rohde, B.; Selzer, P. J. Med. Chem. 2000, 43,3714.
52. Ghose, A. K.; Crippen, G. M. J. Chem. Inf. Comput. Sci.1987, 27, 21.
53. Millar, K. J. J. Am. Chem. Soc. 1990, 112, 8533.54. Gasteiger, J.; Marsilli, M. Tetrahedron Lett. 1978, 34,
3181–3184.55. Kier, L. B.; Hall, L. H. Molecular Connectivity in
Structure–Activity analisis; Research Studies: Letch-worth, UK, 1986.
56. Pauling, L. In The Nature of Chemical Bond; CornellUniversity: Ithaca, NY, 1939; pp 2–60.
57. Rouvray, D. H. In Chemical Applications of GraphTheory; Balaban, A. T., Ed.; Academic: London, 1976;pp 180–181.
58. Trinajstic, N. Chemical Graph Theory; CRC: BocaRaton, FL, 1983; 2nd ed.; 1992; pp 32–33.
59. Gutman, I.; Polansky, O. E. In Mathematical Concepts inOrganic Chemistry; Springer: Berlin, 1986.
60. Estrada, E.; Patlewicz, G. Croat. Chim. Acta 2004, 77,203.
61. Klein, D. J. Internet Electron. J. Mol. Des. 2003, 2,814.
62. Edwards, C. H.; Penney, D. E. In Elementary LinearAlgebra; Prentice-Hall: Englewood Cliffs, NY, USA,1988.
63. Jacobson, N. In Basic Algebra I, 2nd ed.; W.H. Freemanand Company: New York, 1985; pp 343–361.
64. Riley, K. F.; Hobson, M. P.; Vence, S. J. In Mathemat-ical Methods for Physics and Engineering; CambridgeUniversity: Cambridge, 1998; pp 228–236.
65. Hernandez, E. Algebra y Geometrıa. Universidad Auto-noma de Madrid: Madrid, 1987; pp 521–544.
66. de Burgos-Roman, J. Algebra y Geometrıa Cartesıana.McGraw-Hill Interamericana de Espana, Madrid;2da Edicion, 2000; pp 208–246.
67. de Burgos-Roman, J. Curso de Algebra y Geometrıa.Alambra Longman, Ed.; Madrid, 1994; pp. 638-684.
68. Werner, G. In Linear Algebra, 4th ed.; Springer: NewYork, 1981; pp 261–288.
69. Randic, M. J. Math. Chem 1991, 7, 155.70. Walker, P. D.; Mezey, P. G. J. Am. Chem. Soc. 1993, 115,
12423.71. Kier, L. B.; Hall, L. H. In Molecular Structure Descrip-
tion. The Electrotopological State; Academic: New York,1999.
72. Hall, L. H.; Story, C. T. J. Chem. Inf. Comput. Sci. 1996,36, 1004.
73. Gough, J. D.; Hall, L. H. J. Chem. Inf. Comput. Sci.1999, 39, 356–361.
74. Negwer, M., Ed.; Organic-Chemical Drugs and theirSynonyms, Akademie: Berlin, 1987.
75. Chapman & Hall. The Merck Index, ver. 12:3, 1999.76. STATISTICA Software (data analysis software system),
vs 6.0; StatSoft Inc., 2001. <www.statsoft.com/>.77. Estrada, E.; Pena, A.; Garcıa, D. R. J. J. Comput.-Aided
Mol. Des. 1998, 12, 583–595.78. Gonzalez-Dıaz, H.; Marrero-Ponce, Y.; Hernandez, I.;
Bastida, I.; Tenorio, E.; Nasco, O.; Uriarte, U.; Castan-edo, N.; Cabrera, M. A.; Aguila, E.; Marrero, O.; Morales,A.; Perez, M. Chem. Res. Toxicol. 2003, 16, 1318.
79. de Julian-Ortiz, J. V.; de Alapont, C. G.; Rıos-Santam-arina, I.; Garcıa-Domenech, R.; Galvez, J. J. Mol.Graphics Modell. 1998, 16, 14.
80. Estrada, E.; Uriarte, E. Curr. Med. Chem. 2001, 8, 1573.81. van de Waterbeemd, H. Discriminant Analysis for
Activity Prediction. In Chemometric Methods in Molec-ular Design; van de Waterbeemd, H., Ed.; VCH: Wein-heim, 1995; pp 265–288.
82. Baldi, P.; Brunak, S.; Chauvin, Y.; Andersen, C. A.;Nielsen, H. Bioinformatics 2000, 16, 412.
83. Ford, M.-G.; Salt, D.-W. The Use of Canonical Corre-lation Analysis. In Chemometric methods in moleculardesign; van de Waterbeemd, H., Ed.; VCH: Weinhein,1995; pp 283–292.
84. Mc Farland, J. W.; Gans, D. J. In Chemometric Methodsin Molecular Design; van de Waterbeemd, H., Ed.; VCH:Weinheim, 1995; pp 295–307.
85. Johnson, R. A.; Wichern, D. W. Applied MultivariateStatistical Analysis; Prentice-Hall: Englewood Cliffs (NJ),1988.
86. Randic, M. J. Chem. Inf. Comput. Sci. 1991, 31, 311.87. Randic, M. New J. Chem. 1991, 15, 517.88. Randic, M. J. Mol. Struct. (THEOCHEM) 1991, 233, 45.89. Wold, S.; Erikson, L. In Chemometric Methods in
Molecular Design; van de Waterbeemd, H., Ed.; VCH:New York, 1995; pp 309–318.
90. Golbraikh, A.; Tropsha, A. J. Mol. Graphics Modell.2002, 20, 269.
91. Rose, K.; Hall, L. H.; Kier, L. B. J. Chem. Inf. Comput.Sci. 2002, 42, 651.
92. Estrada, E.; Pena, A. Bioorg. Med. Chem. 2000, 8, 2755.93. Watson, C. Biosilico 2003, 1, 83.94. Estrada, E.; Uriarte, E.; Montero, A.; Teijeira, M.;
Santana, L.; De Clercq, E. J. Med. Chem. 2000, 10,1975.
95. Aguirre, G.; Boiani, M.; Cerecetto, H.; Gerpe, A.;Gonzalez, M.; Fernandez, S. Y.; Denicola, A.; Ochoade Ocariz, C.; Nogal, R. J. J.; Montero, D.; Escario, J. A.Arch. Pharm. (Weinheim, Ger.) 2004, 337, 259.
6524 Y. Marrero-Ponce et al. / Bioorg. Med. Chem. 14 (2006) 6502–6524
96. Kouznetsov, V. V.; Rivero, C. J.; Ochoa, P. C.; Stashenko,E.; Martınez, J. R.; Montero, P. D.; Nogal, R. J. J.;Fernandez, P. C.; Muelas, S. S.; Gomez, B. A.; Bahsas, A.;Amaro, L. J. Arch. Pharm. (Weinheim, Ger.) 2005, 338, 1.
97. Kouznetsov, V. V.; Vargas, M. L. Y.; Tibaduiza, B.;Ochoa, C.; Montero, P. D.; Nogal, R. J. J.; Fernandez,C.; Muelas, S.; Gomez, A.; Bahsas, A.; Amaro-Luis, J.Arch. Pharm. (Weinheim, Ger.) 2004, 337, 127.
98. Ochoa, A.; Perez, E.; Perez, R.; Suarez, M.; Ochoa, E.;Rodrıguez, H.; Gomez, A.; Muelas, S.; Nogal, R. J. J.;Martınez, R. A. Arzneim.-Forsch./Drug Res. 1999, 49,764.
99. Meneses, M. A.; Montero, D.; Escario, J.A;, Nogal,R.J.J.; Ochoa, C.; Aran, V.J.; Martınez, F.A.R. IXEuropean Multicolloquium of Parasitology, Valencia,July 18-23, 2004; Spain.
100. Aran, V. J.; Flores, M.; Munoz, P.; Paez, J. A.; Sanchez,V. P.; Stud, M. Liebigs Ann. Chem. 1996, 683.
101. Marrero-Ponce Y.; Romero, V. 2002; TOMOCOMDsoftware. Central University of Las Villas. TOMO-
COMD (topological molecular computer design) forWindows, version 1.0 is a preliminary experimentalversion; in future a professional version will be obtainedupon request to Y. Marrero: [email protected] [email protected].
102. Consonni, V.; Todeschini, R.; Pavan, M. J. Chem. Inf.Comput. Sci. 2002, 42, 682.
103. Todeschini, R.; Gramatica, P. Perspect. Drug DiscoveryDes. 1998, 9, 355.
104. Gavini, E.; Juliano, C.; Mule, A.; Pirisino, G. Farmaco1997, 52, 67.
105. Gavini, E.; Juliano, C.; Mule, A.; Pirisino, G.; Muri-neddu, G.; Pinna, A. Arch. Pharm. (Weinheim, Ger.)2000, 333, 341.
106. Alcalde, E.; Perez, L.; Dinares, I.; Frigola J. Chem.Pharm. Bull. 1995, 43, 493.
107. Aguirre, G.; Boiani, M.; Cerecetto, H.; Gerpe, A.;Gonzalez, M.; Fernandez, S. Y.; Denicola, A.; Ochoade Ocariz, C.; Nogal, R. J. J.; Montero, D.; Escario, J. A.Arch. Pharm. (Weinheim, Ger.) 2004, 337, 259.