Pre-Feasibility Model for the Creation of Green Pedestrian ...
149
Pre-Feasibility Model for the Creation of Green Pedestrian Zones by Anneri Maritz Thesis presented in fulfilment of the requirements for the degree of Master of Engineering in Civil Engineering in the Faculty of Engineering at Stellenbosch University Supervisor: Mr. Christiaan Jurgens April 2019
-
Upload
khangminh22 -
Category
Documents
-
view
2 -
download
0
Transcript of Pre-Feasibility Model for the Creation of Green Pedestrian ...

Pre-Feasibility Model for the Creation ofGreen Pedestrian Zones
byAnneri Maritz
Thesis presented in fulfilment of the requirements for the degree ofMaster of Engineering in Civil Engineering in the Faculty of Engineering
at Stellenbosch University
Supervisor: Mr. Christiaan Jurgens
April 2019

DECLARATION
By submitting this thesis electronically, I declare that the entirety of the work contained therein is my
own original work, that I am the authorship owner thereof (unless to the extent explicitly otherwise
stated) and that I have not previously in its entirety or in part submitted it for obtaining any
qualification.
Date: April 2019
Copyright © 2019 Stellenbosch University
All rights reserved
Stellenbosch University https://scholar.sun.ac.za

ii | P a g e
ABSTRACT
City centres facilitate various activities ranging from business and cultural activities to providing
residential accommodation (Coca-Stefaniak, 2013). A healthy environment is of importance to ensure
the optimal functioning of a city or town centre for its users and residents (Derby City Council, 2017).
Unfortunately it can be expected that future environmental problems may be concentrated in urban
areas (CSIR, 1999).
There are various methods to aid in mitigating the negative effects associated with environmental
problems (Hawley, 2014). In this study, green pedestrian schemes are investigated as a solution.
By creating pedestrian zones in city areas, also utilizing green engineering technologies, the amount
of green space in the city per capita will increase (Lee et al., 2015). It is anticipated that with more
green space, there should be retardation in urban sprawling and other associated benefits including
environmental, health, social and economic benefits (Blaga, 2013).
The primary aim of this study is to develop a pre-feasibility model to be used as aid in determining if
the implementation of a green pedestrian zone would be feasible in an area as identified by local
authorities. The pre-feasibility model entails a combination of mathematical modelling and other
decision modelling techniques. The pre-feasibility model consists of two parts namely a location
characteristic checklist and a mathematical model.
The location characteristic checklist aids in determining whether a proposed area would be suitable
for a successful pedestrian zone. From literature and industry critique it can be concluded that the
most significant characteristics for a successful pedestrian zone are that the area should have a mixed
land use, should be within close proximity of public transport facilities and should provide a sense of
safety and security.
The second part of the pre-feasibility model is a mathematical model. The effects of pedestrian
schemes on air quality, economic factors, social factors and the traffic on the surrounding network are
modelled. Multiple linear regression was used to predict what the expected increase or decrease in
certain air pollutants could be post pedestrianization as a result of the removal of vehicles and the
application of green engineering technologies to the proposed area. Averages of previous studies
regarding economic, social and traffic circumstances are determined and are presented in the pre-
feasibility model as anticipated and expected benefits.
As a final step, the developed pre-feasibility model is applied to the inner town centre of Stellenbosch.
From the model outputs it is concluded that the identified area of Church Street, Andringa Street and
Ryneveld Street adhere to most of the location characteristics except for the proposed area not being
within close proximity of public transport facilities. It is further found that the pedestrian scheme may
have a slight worsening effect on the air quality in total. The implementation of green engineering
technologies will however contribute to the removal of additional air pollutants. The predetermined
economic and social benefits are expected to be positive based on previous studies.
Stellenbosch University https://scholar.sun.ac.za

iii | P a g e
OPSOMMING
Verskeie aktiwiteite word deur ‘n middestad geakkomodeer. Hierdie aktiwiteite sluit besigheids- en
kulturele aktiwitieite in asook verblyfsgeleenthede (Coca-Stefaniak, 2013). Die welstand van ’n
middestad speel dus ‘n belangrike rol om te verseker dat die stad optimaal funksioneer (Derby City
Council, 2017). As gevolg van vinnige verstedeliking en groei in die bevolkingsdigtheid, word daar
verwag dat toekomstige omgewingsprobleme in stedelike areas gekonsentreerd sal wees (CSIR,
1999).
Daar is verskeie metodes om die negatiewe uitwerking van hierdie omgewingsprobleme teen te werk
(Hawley, 2014). Groen voetgangersones word in hierdie studie nagevors as oplossing.
Deur voetganersones met addisionele groen ingenieurstegnologië in stedelike gebiede te skep, is daar
‘n toename in die groen spasie area per persoon (Lee et al., 2015). Daar word verwag dat meer groen
spasie ‘n vertraging in stedelike verspreiding asook ander voordele soos omgewing-, gesondheids-,
sosiale- en ekonomies voordele teweeg sal bring (Blaga, 2013).
Die hoofdoel van hierdie studie is om ‘n pre-lewensvatbaarheid model te ontwikkel wat gebruik kan
word as hulpmiddel om te bepaal of die implementering van ‘n groen voetgangersone in ‘n area, soos
geidentifiseer deur plaaslike owerhede, lewensvatbaar sal wees of nie. Die pre-lewensvatbaarheid
model is ‘n kombinasie van ‘n wiskundige model en ander besluitnemingstegnieke. Die pre-
lewensvatbaarheid model bestaan uit twee dele, naamlik ‘n kontrolelys en ‘n wiskundige model.
Die kontrolelys vir ligging eienskappe help in die bepaling of ‘n voorgestelde area vir ‘n
voetgangersone gepas sal wees om ‘n suksesvolle voetgagersone te verseker. Vanuit die literatuur en
kritiek ontvang vanuit die industrie, is daar tot die gevolgtrekking gekom dat noodsaaklike eienskappe
vir ‘n suksesvolle voetgangersone insluit dat die area gemengde gebruike moet hê, dat die area naby
publieke vervoer fasiliteite moet wees en dat die area die gevoel van veiligheid en sekuriteit moet
skep.
Die tweede gedeelte van die pre-lewensvatbaarheid model is ‘n wiskundige model. Die uitwerking
van voetgangersones op die kwaliteit van die lug, ekonomie, sosiale aspekte en die verkeer in die
omliggende netwerk word gemodelleer. Veelvoudige lineêre regressie is gebruik om te voorspel wat
die verwagte toename of afname in sekere lugbesoedelingstowwe sal wees na die implementering van
‘n voetgangersone as gevolg van die verwydering van voertuie en die toepassing van groen
ingenieurstegnologië in die voorgestelde area. Die gemiddeldes van vorige studies in verband met die
ekonomiese-, sosiale- en verkeerstoestande is bepaal en voorgestel in die pre-lewensvatbaarheid
model as verwagte voordele.
Die pre-lewensvatbaarheidmodel is toegepas op die middedorp van Stellenbosch. Vanuit die
modelresultate kan afgelei word dat die voorgestelde area van Kerkstraat, Andringastraat en
Ryneveldstraat voldoen aan die meerderheid liggingeienskappe behalwe dat die voorgestelde area nie
naby publieke vervoer fasiliteite geleë is nie. Verder is daar gevind dat die voorgestelde
voetgangersone ‘n effense negatiewe uitwerking op die kwaliteit van lug sal hê. Die implementering
van groen ingenieurstegnologië sal egter bydra tot die verwydering van addisionele
lugbesoedelingstowwe. Betreffende die ekonomiese en sosiale voordele word daar verwag dat dit
positief sal wees soos bepaal uit vorige studies.
Stellenbosch University https://scholar.sun.ac.za
iv | P a g e
ACKNOWLEDGEMENTS
I would like to thank the following people:
1. My parents for always bearing with me, their support and the lots of late night cups of tea;
2. My friends for giving me the much needed support and occasional distractions;
3. Professor Jan Wium for always provinding valueable inputs and recommendations to help me
keep on track;
4. And to Mr Chris Jurgens for always providing feedback and valueable comments and
especially for his willigness to have discussions at the end of a long day.
Stellenbosch University https://scholar.sun.ac.za

v | P a g e
CONTENTS
DECLARATION ..................................................................................................................................... i
ABSTRACT ............................................................................................................................................ ii
OPSOMMING ....................................................................................................................................... iii
ACKNOWLEDGEMENTS ................................................................................................................... iv
LIST OF FIGURES ............................................................................................................................. viii
LIST OF TABLES .................................................................................................................................. x
LIST OF EQUATIONS ......................................................................................................................... xi
LIST OF ABBREVIATIONS ............................................................................................................... xii
1. INTRODUCTION .............................................................................................................................. 1
1.1 Problem Statement ........................................................................................................................ 1
1.2 Aim and Objectives ....................................................................................................................... 3
1.3 Thesis Layout and Primary Focus of Thesis ................................................................................. 4
1.4 Scope and Limitations ................................................................................................................... 5
1.5 Definitions..................................................................................................................................... 6
2. STUDY METHODOLOGY ............................................................................................................... 7
3.LITERATURE REVIEW: Part 1-Environmental Problems ................................................................ 9
3.1 Current State of Environmental Affairs ........................................................................................ 9
3.1.1 Types of Environmental Concerns ....................................................................................... 10
3.2 Possible Solutions to Environmental Issues ................................................................................ 11
3.2.1 Pedestrian Schemes .............................................................................................................. 11
4. LITERATURE REVIEW: Part 2-Pedestrianization as Solution ...................................................... 13
4.1 Background to the Origin of Pedestrian Facilities ...................................................................... 13
4.2 Existing Pedestrian Zones around the World .............................................................................. 15
4.2.1 Super Blocks in Barcelona, Spain......................................................................................... 15
4.2.2 NYC: Times Square and the Highline .................................................................................. 17
4.2.3 Copenhagen Bicycle Friendly City Centres .......................................................................... 18
4.3 Green Spaces and Pedestrian Zones in South Africa .................................................................. 19
4.4 How Pedestrian Zones and the Environment Fit Together ......................................................... 24
4.4.1 Why a Green Pedestrian Zone? ............................................................................................ 24
4.4.2 Advantages of a Green Pedestrian Zone ............................................................................... 24
4.4.3 Disadvantages of a Green Pedestrian Zone .......................................................................... 27
5. LITERATURE REVIEW: Part 3-Previous Studies .......................................................................... 28
6. LITERATURE REVIEW: Part 4-Summary and Conclusions .......................................................... 29
7. CONSTRUCTION OF PRE-FEASIBILITY MODEL ..................................................................... 31
Stellenbosch University https://scholar.sun.ac.za
vi | P a g e
7.1 Pre-Feasibility Model Part 1: Location Determination ............................................................... 31
7.1.1 Location Characteristics of Successful Pedestrian Zones ..................................................... 31
7.1.2 Pre-feasibility Model Part 1: Suggested Checklist to Evaluate Location of Pedestrian Zone
....................................................................................................................................................... 36
7.2 Pre-Feasibility Model Part 2: Mathematical Model .................................................................... 38
7.2.1 Mathematical Modelling ....................................................................................................... 38
7.2.2 Pre-Feasibility Model Development ..................................................................................... 40
7.2.2.1 Air Quality ......................................................................................................................... 42
7.2.2.2 Economic Impacts ............................................................................................................. 55
7.2.2.3 Social Impacts .................................................................................................................... 57
7.2.2.4 Impacts on Traffic of Surrounding Network ..................................................................... 59
8. CASE STUDY: STELLENBOSCH ................................................................................................. 61
8.1 Description of Stellenbosch Mid-Town ...................................................................................... 61
8.2 Why Stellenbosch as Case Study ................................................................................................ 63
8.3 Application of Pre-Feasibility Model ......................................................................................... 65
8.4 Evaluation of the Pedestrianization of Stellenbosch According to the Outcomes of the Pre-
Feasibility Model. ............................................................................................................................. 73
9. INDUSTRY CRITIQUE ................................................................................................................... 76
9.1 Critique Regarding the Location Checklist ................................................................................. 76
9.2 Critique Regarding the Mathematical Model .............................................................................. 78
9.3 Critique Regarding the Pedestrianization of Stellenbosch .......................................................... 78
10. RESULTS AND INTERPRETATION ........................................................................................... 79
11. OTHER FACTORS TO CONSIDER WHEN CREATING A GREEN PEDESTRIAN ZONE .... 81
12. CONCLUSIONS ............................................................................................................................. 84
13. FUTURE RESEARCH ................................................................................................................... 86
14. BIBLIOGRAPHY ........................................................................................................................... 87
APPENDIX A: ELABORATION OF ENVIRONMENTAL CONCERNS....................................... A-1
A.1 Urbanization and Urban Sprawling as Environmental Concern ........................................... A-1
A.2 Effect of Urbanization on Green Space ................................................................................ A-3
A.3 Air Pollution as Environmental Concern .............................................................................. A-3
APPENDIX B: POSSIBLE SOLUTIONS TO ENVIRONMENTAL PROBLEMS .......................... B-1
B.1 Public Transport .................................................................................................................... B-1
B.2 Integrative Urban Design ...................................................................................................... B-1
B.3 Waste Management ............................................................................................................... B-3
B.4 Biomimicry ........................................................................................................................... B-3
B.5 Charges and Regulations as Incentive to Reduce Air Pollution ............................................ B-4
Stellenbosch University https://scholar.sun.ac.za

vii | P a g e
B.6 Electric Cars .......................................................................................................................... B-5
B.7 The Paris Agreement ............................................................................................................. B-5
B.8 Green Engineering Technologies .......................................................................................... B-6
APPENDIX C: DESCRIPTION OF PREVIOUS STUDIES ............................................................. C-1
C.1 The Effect of Pedestrianization on Air Quality ........................................................................ C-1
C.2 The Effect of Green Pedestrian Zones on Noise Pollution ..................................................... C-10
C.3 The Effect of Pedestrianization on Economic Factors ........................................................... C-11
C.4 The Effect of Pedestrianization on Social Benefits ................................................................ C-16
C.5 The Impact of Pedestrianization on the Surrounding Traffic ................................................. C-21
C.6 The Effect of Green Engineering Technologies ..................................................................... C-24
C.6.1 Noise Pollution ................................................................................................................. C-24
C.6.2 Economic Benefits ........................................................................................................... C-24
C.6.3 Improved Air Quality ....................................................................................................... C-24
C.6.4. Other Benefits ................................................................................................................. C-30
C.7 The Effect of Green Spaces on the Environment ................................................................... C-30
APPENDIX D: SEMI-STRUCTURED INTERVIEWS .................................................................... D-1
APPENDIX E: ETHICAL CONSENT FORMS ................................................................................ D-3
Stellenbosch University https://scholar.sun.ac.za

viii | P a g e
LIST OF FIGURES Figure 1: Bicycle accommodation in Copenhagen, Denmark (Robinson, 2016) .................................... 2
Figure 2: Scope of thesis ......................................................................................................................... 4
Figure 3: Literature review road map - Part 1 ......................................................................................... 9
Figure 4: Pedestrian zone in Chester, England (WMC Retail Partners, 2017) ..................................... 12
Figure 5: Schildergrasse, Cologne, Germany Pedestrian Zone (left) (Scrivener, 2016) and Gothenburg,
Sweden (right) (Active Boomer Adventures, 2016) ............................................................................. 12
Figure 6: Literature review road map – Part 2 ...................................................................................... 13
Figure 7: Carriageway with elevated sidewalks in Pompeii, Ancient Roman City (Huxham, 2014) ... 14
Figure 8: Pedestrian zone in Kassel (Hoffman, 2017) .......................................................................... 14
Figure 9: Strøget, Copenhagen (WMC Retail Partners, 2017) ............................................................. 15
Figure 10: Superblocks in Barcelona (Bausells, 2016) ......................................................................... 16
Figure 11: Traffic flow around Superblocks (Bausells, 2016) .............................................................. 16
Figure 12: Vehicle-Pedestrian collisions in Bowtie (Design Trust for Public Space, 2018) ................ 17
Figure 13: Time Square before (left) and after (right) pedestrianization schemes (Goldwyn, 2014) ... 18
Figure 14: Transformation of Copenhagen (1962 to 1996) (Wallztrom, 2004) .................................... 18
Figure 15: Map of South Africa showing city/town boundaries, built-up areas and parks ................... 20
Figure 16: Cape Peninsula and surrounding areas ................................................................................ 20
Figure 17: Cape Peninsula and surrounding areas: park areas (left), park areas in city / town
boundaries (centre) and park areas within built-up areas (right) .......................................................... 21
Figure 18: Green space per capita (RSA park areas excluding GPZs) (Baharash Architecture, 2018) 22
Figure 19: Cape Town pedestrian zones (Green Map, 2018) ............................................................... 22
Figure 20: Extract from Cape Town Green Map (Baharash Architecture, 2018) ................................. 23
Figure 21: Positive consequences associated with GPZs ...................................................................... 24
Figure 22: Pedestrian Fatalities in Cities (Ribbens, 2017) .................................................................... 26
Figure 23: Literature review road map: Part 3 ...................................................................................... 28
Figure 24: Literature review road map-Part 4 ....................................................................................... 29
Figure 25: Open (left) versus Closed (right) networks (Everitt et al., 2008) ........................................ 35
Figure 26: Link between the reality and a modelled situation (Microsoft, 2018) ................................. 38
Figure 27: Meta-questions and study specific answers on them (Microsoft, 2018) ............................. 39
Figure 28: Proposed pedestrian streets for the Stellenbosch case study ............................................... 61
Figure 29: View of Church Street in Stellenbosch town centre (Photo: A Maritz) .............................. 62
Figure 30: View of Andringa Street in Stellenbosch town centre (Photo: A Maritz) ........................... 62
Figure 31: View of Ryneveld Street in Stellenbosch town centre (Photo: A Maritz) ........................... 62
Figure 32: Street Soiree event in Stellenbosch where the streets are closed for vehicles during the
event (Photo: A Maritz) ........................................................................................................................ 64
Figure 33: Access and exit points for the proposed pedestrian scheme in Stellenbosch ...................... 68
Figure 34: Surrounding roads to accommodate displaced traffic ......................................................... 68
Figure 35: Compact area forms part of the proposed pedestrian scheme in Stellenbosch .................... 69
Figure 36: Routes part of the open road network surrounding the proposed pedestrian scheme in
Stellenbosch .......................................................................................................................................... 69
Figure 37: Area of built up area in Stellenbosch town centre ............................................................... 70
Figure 38: Suggested green roof layout in the proposed pedestrian zone and area of each green roof 71
Figure 39: Locations of intersections analysed as adapted from source (Mohr, 2017) ......................... 74
Figure 40: Intersection drop kerb design (Watanabe et. al, 2007) ........................................................ 82
Stellenbosch University https://scholar.sun.ac.za
ix | P a g e
Figure A1: Urban sprawl and its impacts as adapted from source (Musakwa & Van Niekerk, 2018) . A-
2
Figure A2: Effects of urbanization (White et. al., 2017) .................................................................... A-2
Figure A3: Levels of PM in Asian, African and European cities (White et. al., 2017) ...................... A-4
Figure A4: Annual mean PM concentrations in South Africa and Nigeria (White et. al., 2017) ....... A-4
Figure B1: Curitiba in Brazil introduced the first Bus Rapid Transit (BRT) (Open Streets, 2017) .... B-1
Figure B2: Mobility in Bogota (Arias, 2015) ..................................................................................... B-2
Figure B3: Dar es Salaam BRT (Capital Markets in Africa, 2015) .................................................... B-2
Figure B4: People in Curitiba lining up to exchange their waste for bus tickets or food (International
New Town Institute, 2018) ................................................................................................................. B-3
Figure B5: Harare Eastgate Centre (Doan, 2012) ............................................................................... B-3
Figure B6: Low Emission Zone (Carvalho, 2017) and location (urbnblog, 2018) ............................. B-4
Figure B7: Architect's impression of Western Cape Department of Transport and Public Works R152-
million investment in a green building for their new regional offices (Western Cape Government,
2015) ................................................................................................................................................... B-5
Figure B8: Green roofs in the city of Denver (ProudGreenBuilding, 2017)....................................... B-6
Figure C1: Chester case study pedestrianization scheme (Chiquetto, 1997) ...................................... C-2
Figure C2: Summary of results for pedestrianization in Chester as adapted from source (Chiquetto,
1997) ................................................................................................................................................... C-3
Figure C3: Nuremberg pedestrianized Old Town (Dombrowski, 2018) ............................................ C-4
Figure C4: Pedestrianized streets of Nuremberg (Wallztrom, 2004) .................................................. C-4
Figure C5: Oxford High Street (Milasan, 2014) ................................................................................. C-5
Figure C6: Pedestrianized streets of Oxford and Cambridge (Wallztrom, 2004) ............................... C-6
Figure C7: Pedestrianized streets in the historical peninsula of Istanbul (Üzümoğlu et al., 2015) .... C-7
Figure C8: Katerini, Greece, pedestrian scheme (Brebbia, 2000) ...................................................... C-8
Figure C9: Island of Rhodes, Greece, pedestrian scheme (Brebbia, 2000) ........................................ C-9
Figure C10: Asuncion Street, Seville, Spain (Sevillano, 2015) ........................................................ C-13
Figure C11: Kajaani, Finland pedestrian zone (Wallztrom, 2004) ................................................... C-14
Figure C12: Pedestrian zone in Wolverhampton, England (Wallztrom, 2004) ................................ C-15
Figure C13: Tourism expenditure in Cape Town by activity (left) and by location (right) (White et. al.,
2017) ................................................................................................................................................. C-16
Figure C14: Considerations for green development (White et. al., 2017) ........................................ C-17
Figure C15: Pedestrianized streets of Ghent (Wallztrom, 2004) ...................................................... C-19
Figure C16: Problems associated with increasing congestion (Wallztrom, 2004) ........................... C-21
Figure C17: Percentage changes in traffic indicators due to pedestrianization as adapted from source
(Chiquetto, 1997) .............................................................................................................................. C-22
Figure C18: Cycle of traffic settling (Wallztrom, 2004) ................................................................... C-23
Figure C19: Total NO2 removal (Mg) by trees, shrubs and grass per annum (Currie & Bass, 2008) .. C-
26
Figure C20: Total O3 removal (Mg) by trees, shrubs and grass per annum (Currie & Bass, 2008) .. C-27
Figure C21: Total PM10 removal (Mg) by trees, shrubs and grass per annum (Currie & Bass, 2008) . C-
27
Figure C22: Total SO2 removal (Mg) by trees, shrubs and grass per annum (Currie & Bass, 2008)C-28
Figure C23: Sample circular plot (Currie & Bass, 2008).................................................................. C-29
Stellenbosch University https://scholar.sun.ac.za

x | P a g e
LIST OF TABLES Table 1: Statistics related to green spaces in South Africa ................................................................... 21
Table 2: Summary of previous studies .................................................................................................. 30
Table 3: Location characteristics associated with pedestrian zones ..................................................... 32
Table 4: Location characteristics ranked according to occurrence ....................................................... 33
Table 5: Survey results for the characteristics of pedestrian zones ...................................................... 34
Table 6: Suggested checklist as part 1 of the pre-feasibility model ...................................................... 37
Table 7: Final user interface of the pre-feasibility model (Part 2) ........................................................ 41
Table 8: Portion of pre-feasibility model to calculate the effects of pedestrian zones on air quality ... 42
Table 9: Length of pedestrianized area and vehicles removed from this area ...................................... 44
Table 10: Numbering system for user interface (air quality due to vehicles removed) ........................ 45
Table 11: Input data for linear regression model of PM ....................................................................... 46
Table 12: Regression statistics and linear regression model outcomes for PM .................................... 46
Table 13: Correlation between input variables of linear regression model ........................................... 47
Table 14: Regression statistics and linear regression model outcomes for PM, second iteration ......... 48
Table 15: Input data for linear regression model of HC ....................................................................... 48
Table 16: Regression statistics and linear regression model outcomes for HC .................................... 49
Table 17: Input data for linear regression model of NOx ...................................................................... 50
Table 18: Regression statistics and linear regression model outcomes for NOx ................................... 50
Table 19: Input data for linear regression model of CO ....................................................................... 51
Table 20: Regression statistics and linear regression model outcomes for CO .................................... 52
Table 21: Removal of air pollutants due to green engineering technologies ........................................ 53
Table 22: Summary of economic impacts due pedestrianization in previous studies ........................... 56
Table 23: Portion of pre-feasibility model to calculate the effects of pedestrian zones on economic
factors .................................................................................................................................................... 56
Table 24: Summary of social impacts due pedestrianization in previous studies ................................. 58
Table 25: Summary of impacts on noise pollution due pedestrianization in previous studies ............. 58
Table 26: Portion of pre-feasibility model to calculate effects of pedestrian zones on social factors .. 59
Table 27: Summary of impacts on the surrounding traffic network due pedestrianization in previous
studies ................................................................................................................................................... 59
Table 28: Portion of pre-feasibility model to calculate the effects of pedestrian zones on the
surrounding traffic network .................................................................................................................. 60
Table 29: Completed pre-feasibility model for the case of Stellenbosch ............................................. 72
Table 30: Impact of pedestrianization on the surrounding intersections as adapted from source (Mohr,
2017) ..................................................................................................................................................... 74
Table 31: Updated suggested checklist as part 1 of the pre-feasibility model ...................................... 77
Table C1: Emission counts of Chester case study .............................................................................. C-2
Table C2: Impact of pedestrianization on air quality in Nuremberg................................................... C-5
Table C3: Change in air pollutants before and after pedestrianization of the historical peninsula in
Istanbul ................................................................................................................................................ C-7
Table C4: Positive consequences of pedestrianization of Katerini and Rhodes, Greece .................... C-9
Table C5: Summary of changes in air pollutants in previous studies due to pedestrianization ........ C-10
Table C6: Annual removal rate of air pollutants per canopy cover by different vegetation types in
Chicago (Yang et al., 2018) .............................................................................................................. C-25
Table C7: Deposition velocities of pollutants over different vegetation types (Yang et al., 2018) .. C-25
Table C8: Summary of air pollutant removal for the case study of Toronto .................................... C-29
Stellenbosch University https://scholar.sun.ac.za

xi | P a g e
LIST OF EQUATIONS Equation 1: Linear regression ............................................................................................................... 43
Equation 2: Multiple linear regression .................................................................................................. 43
Equation 3: Percentage change in PM due to vehicle removal ............................................................. 47
Equation 4: Percentage change in HC due to vehicle removal ............................................................. 49
Equation 5: Percentage change in NOx due to vehicle removal ............................................................ 51
Equation 6: Percentage change in CO due to vehicle removal ............................................................. 52
Equation 7: Set of equations to determine removal of air pollutants due to green engineering
technologies .......................................................................................................................................... 55
Stellenbosch University https://scholar.sun.ac.za
xii | P a g e
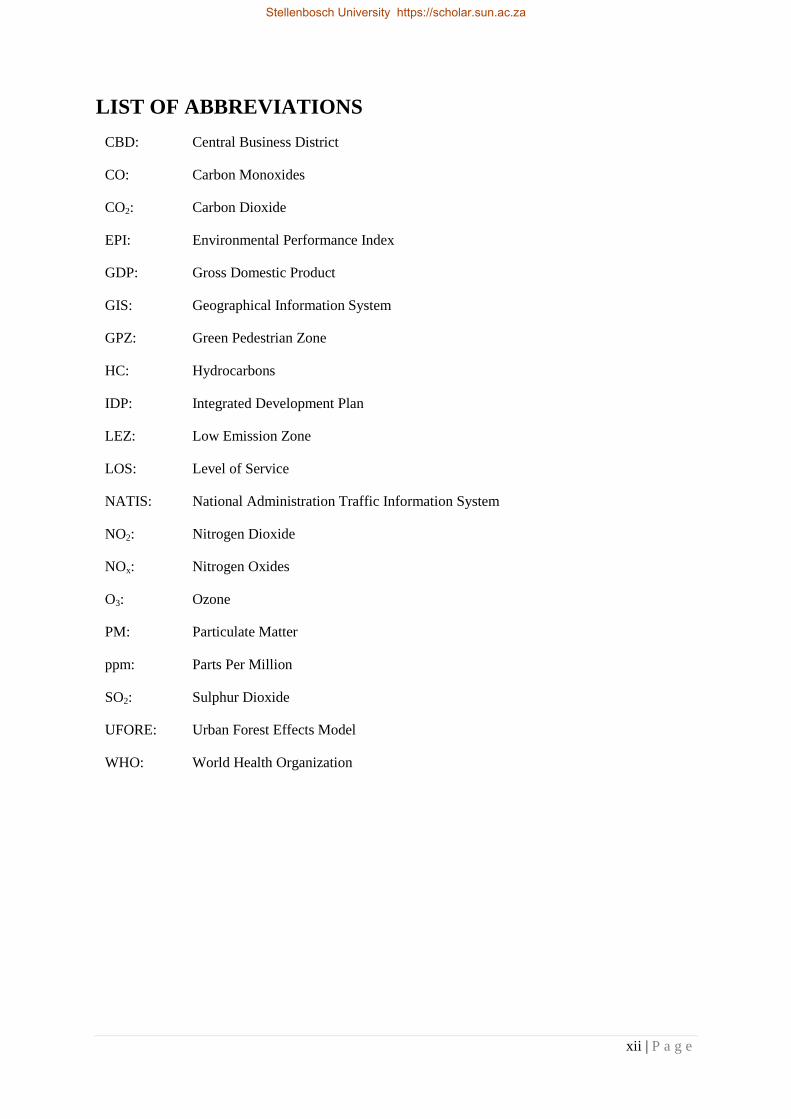
LIST OF ABBREVIATIONS
CBD: Central Business District
CO: Carbon Monoxides
CO2: Carbon Dioxide
EPI: Environmental Performance Index
GDP: Gross Domestic Product
GIS: Geographical Information System
GPZ: Green Pedestrian Zone
HC: Hydrocarbons
IDP: Integrated Development Plan
LEZ: Low Emission Zone
LOS: Level of Service
NATIS: National Administration Traffic Information System
NO2: Nitrogen Dioxide
NOx: Nitrogen Oxides
O3: Ozone
PM: Particulate Matter
ppm: Parts Per Million
SO2: Sulphur Dioxide
UFORE: Urban Forest Effects Model
WHO: World Health Organization
Stellenbosch University https://scholar.sun.ac.za
1 | P a g e
1. INTRODUCTION
City and town centres sustain the local community, provide a retail platform, are environments for
leisure and entertainment and provide a means for people of different cultures to express themselves.
City centres serve as a connection between the private and public sectors, are synonymous with
employment and serve as the Central Business District (CBD). The state of any city or town centre is
therefore of significant importance (Coca-Stefaniak, 2013).
More than half of the world’s population is living in cities and South Africa is no exception.
According to the July 2018 estimates of the United Nations, the current population of South Africa is
57.4 million of which 62.9% is urban (Worldometers, 2018).
The consequence of an ever increasing urban population is that cities are one of the primary
generators of greenhouse gasses (CIFF, 2017). Future environmental problems will be concentrated in
cities and urban areas (CSIR, 1999). It is suggested that a possible solution to some of the
environmental problems in city centres is the creation of green pedestrian zones (GPZs) in
overpopulated and congested CBD areas. Green pedestrian zones can improve living conditions in
city centres and will reduce the negative impact on everyday life of environmental problems,
overpopulation and congestion (Soni & Soni, 2016).
In this thesis the feasibility of GPZs as a possible solution to environmental problems is researched. A
mathematical model is developed as aid in determining the feasibility of GPZs in the CBD or town
centre. The model will form an integral part of the decision making process of local authorities on the
implementation of GPZs. The output of the model will assist in the decision making process as to
proceed with the investment of a costly and detailed transport model and impact assessment or not.
The pre-feasibility model will provide a guideline on the preferred location to implement GPZs and
will provide typical boundary conditions to incorporate. It will provide an approximation on the
expected effects of implementing GPZs. The model will be derived from information and data
obtained from the literature and findings from previous studies.
The effects of a typical green pedestrian zone on the town centre of Stellenbosch are researched as
practical case study in applying the pre-feasibility model.
1.1 Problem Statement
A healthy environment is required for the optimal functioning of a city or town centre and its residents
(Derby City Council, 2017). The vitality and viability of town centres should continually be assessed
if meeting the development needs of the town and habitants.
Different areas in a town centre are associated with different roles and activities. Typical activities
that are impacted by the state of the town centre include residential living, retail, business and leisure
activities. An understanding of the development opportunities and character of the town associated
with these activities can contribute to the successful and sustainable nature of any town centre.
The provision of public transport and provision for cycling and pedestrian zones are factors to be
incorporated in the development plans of towns. Such town plans should underpin the town centre’s
economic, cultural and social roles (Derby City Council, 2017).
Stellenbosch University https://scholar.sun.ac.za
2 | P a g e
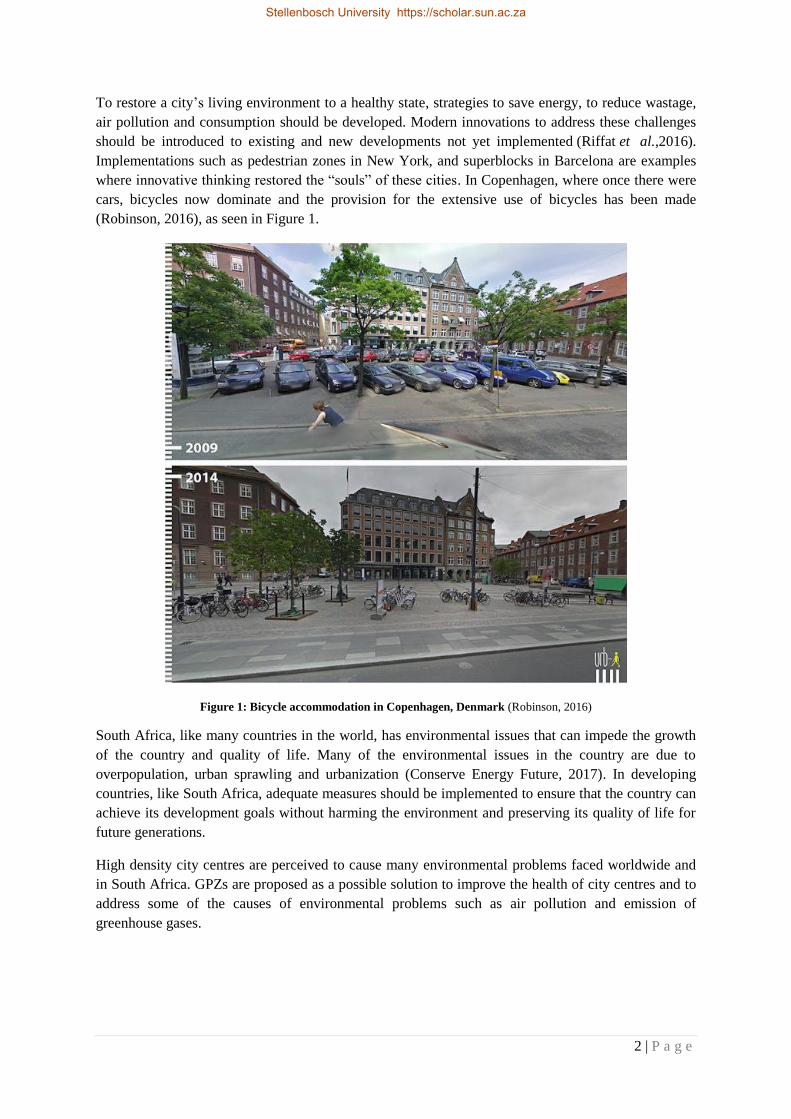
To restore a city’s living environment to a healthy state, strategies to save energy, to reduce wastage,
air pollution and consumption should be developed. Modern innovations to address these challenges
should be introduced to existing and new developments not yet implemented (Riffat et al.,2016).
Implementations such as pedestrian zones in New York, and superblocks in Barcelona are examples
where innovative thinking restored the “souls” of these cities. In Copenhagen, where once there were
cars, bicycles now dominate and the provision for the extensive use of bicycles has been made
(Robinson, 2016), as seen in Figure 1.
Figure 1: Bicycle accommodation in Copenhagen, Denmark (Robinson, 2016)
South Africa, like many countries in the world, has environmental issues that can impede the growth
of the country and quality of life. Many of the environmental issues in the country are due to
overpopulation, urban sprawling and urbanization (Conserve Energy Future, 2017). In developing
countries, like South Africa, adequate measures should be implemented to ensure that the country can
achieve its development goals without harming the environment and preserving its quality of life for
future generations.
High density city centres are perceived to cause many environmental problems faced worldwide and
in South Africa. GPZs are proposed as a possible solution to improve the health of city centres and to
address some of the causes of environmental problems such as air pollution and emission of
greenhouse gases.
Stellenbosch University https://scholar.sun.ac.za

3 | P a g e
1.2 Aim and Objectives
The following primary research question is aimed to be addressed in this study:
1. Will the implementation of a green pedestrian zone be feasible in an area as identified by
local authorities? As aid to answer this question, a mathematical pre-feasible model is
postulated.
The objectives of the thesis are to:
1. Research the environmental problems faced today in city and town centres and methods to
mitigate these problems;
2. Research previous studies of pedestrian zones and investigate how GPZs may improve
environmental conditions, quality of life and whether GPZs are a feasible solution to mitigate
some of the negative environmental impacts currently faced in city and town centres ;
3. Evaluate the best existing green engineering methods to include in green pedestrian zones
typical applicable to South Africa;
4. Develop a model to determine the feasibility of a green pedestrian zone. The model will
include describing factors on where to locate a green pedestrian zone, what the aspects are to
consider when a proposed green pedestrian zone will be implemented and what positive
effects can be expected once a green pedestrian zone is implemented. Though the aim would
be to develop the pre-feasibility model as a mathematical model, the end result may include or
be expanded with alternative decision modelling techniques.
As case study and validation of the model, apply the mathematical model practically on the
town centre of Stellenbosch.
Stellenbosch University https://scholar.sun.ac.za
4 | P a g e
1.3 Thesis Layout and Primary Focus of Thesis
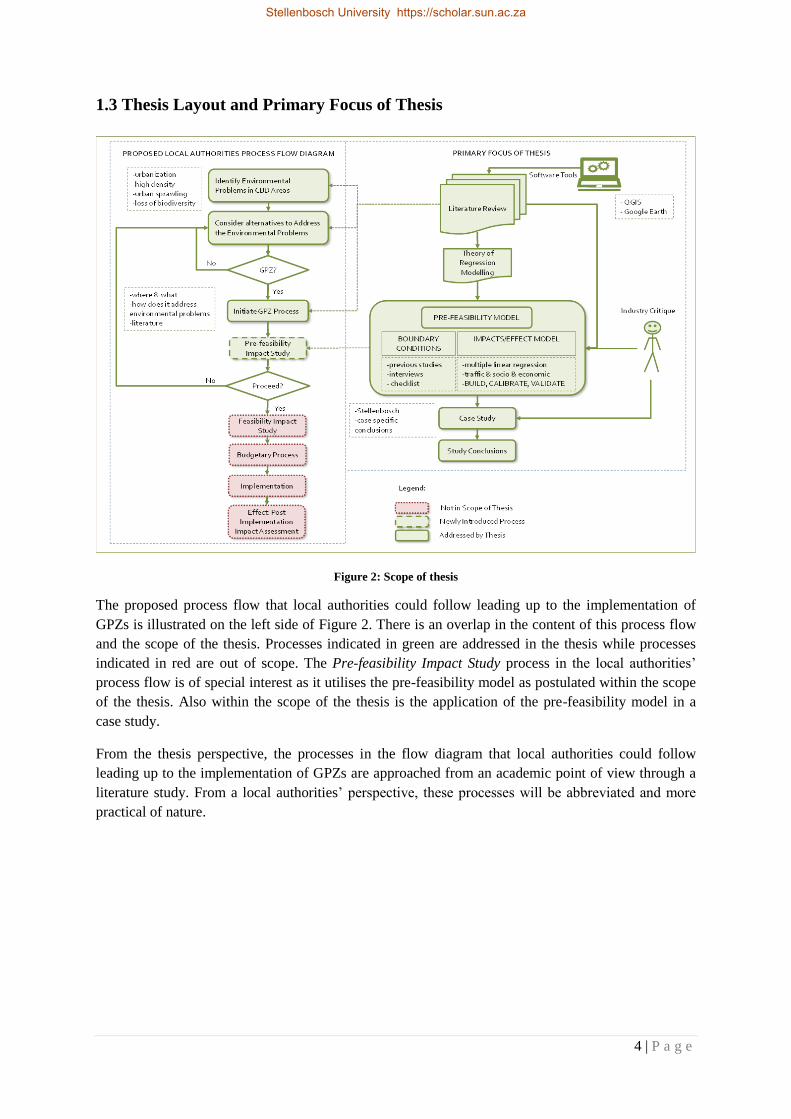
Figure 2: Scope of thesis
The proposed process flow that local authorities could follow leading up to the implementation of
GPZs is illustrated on the left side of Figure 2. There is an overlap in the content of this process flow
and the scope of the thesis. Processes indicated in green are addressed in the thesis while processes
indicated in red are out of scope. The Pre-feasibility Impact Study process in the local authorities’
process flow is of special interest as it utilises the pre-feasibility model as postulated within the scope
of the thesis. Also within the scope of the thesis is the application of the pre-feasibility model in a
case study.
From the thesis perspective, the processes in the flow diagram that local authorities could follow
leading up to the implementation of GPZs are approached from an academic point of view through a
literature study. From a local authorities’ perspective, these processes will be abbreviated and more
practical of nature.
Stellenbosch University https://scholar.sun.ac.za
5 | P a g e
1.4 Scope and Limitations
In this thesis only the factors directly affecting the quality of life of residents, retailers and pedestrians
within the designated area and the road users on the network under consideration are addressed. These
factors can be grouped into four main groups namely environmental factors, social and health factors
(effects on people), economic factors and the traffic conditions. The scope of the thesis includes the
following:
1. Environmental issues considered are those classified as high-priority and include aspects
affecting air quality, water and sanitation, forests, biodiversity and habitat and the climate.
The only environmental problems with a direct and immediate impact on the users of a
potential pedestrian zone are air pollution and noise pollution. Therefore only air and noise
pollution are included in the proposed pre-feasibility model.
2. Only aspects with an impact on the environment, social factors, economic factors and traffic
conditions are included in the model as follows:
Environmental impacts such as the immediate reduction in significant air pollution
materials;
Mental and physical health of the users of the area under consideration and how the
quality of life within the area under consideration is perceived;
Impact of pedestrianized areas on surrounding traffic;
Direct economic impacts on restaurateurs and retailers within a typical study area;
Other aspects to consider when creating a pedestrian zone. These aspects include the
design and layout considerations influencing the functioning of a proposed
pedestrian zone, financing opportunities for the proposed pedestrian zone and
planning considerations.
3. Results are mainly expressed in terms of percentage increase or percentage decrease. Cost
related results are in terms of the South African Rand. Occasionally, different units are used
and defined where applicable.
4. The data derived from previous studies are used as input in creating a mathematical model.
The pre-feasibility model includes only the process up to where an answer can be derived on whether
the pedestrian zone in the identified area will be feasible or not. If the answer is positive, local
authorities can then decide to continue with a more formal and in depth study as illustrated in Figure
2. The formal in depth study is however not in the scope of the thesis.
Stellenbosch University https://scholar.sun.ac.za

6 | P a g e
Other factors not included in the thesis, but which form part of the limitations are listed as follows:
1. Even though green technologies such as green roofs have the benefit of reduced run-off and
storm water, run-off and storm water do not have an immediate impact on the users of a
pedestrian zone and are therefore not included;
2. The numerical results presented as outcome of the model are based on data obtained from
previous studies and industry knowledge. Limited industry data is available and therefore the
data used in the mathematical modelling process places a limitation on the accuracy of the
model outcome;
3. The purpose of the pre-feasibility is to aid in the decision making process and not to serve as a
detailed transport model. With formal transport modelling being an expensive process, as
confirmed by a transportation planner, Me Gerber in an interview, the pre-feasibility only
serves as a first step to determine whether the second step of formal transport modelling will
be worth the expense;
4. The only green engineering technologies considered are the implementation of green roofs
and green walls within the designated area. These are relatively easy to install, maintain and
are readily available in South Africa. Other green engineering technologies such as green
pavements and renewable energy methods (i.e. solar panel bicycle lanes) are not considered.
5. The scope of city and town planning is very broad. This study does therefore not include
factors relating to legal matters, any policies and frameworks with regards to land use and the
planned intention of land use or existing zoning schemes. The fact that policies and legislation
are import considerations is acknowledged in Chapter 11.
6. The developed pre-feasibility model is semi validated by comparing the model outcomes with
that of a previous study. This validation process does however not include the validation of
the modelling of air quality.
1.5 Definitions
The concept of Green Engineering applied in this study includes the design and use of processes and
products in such a manner to minimize negative effects and promote sustainability (US EPA, 2017).
Existing green engineering methods are used in the study. The methods included in this study are the
use of green roofs, green walls/facades and the planting of trees.
A pedestrian zone is a car-free area in cities or towns reserved for pedestrians and sometimes cyclists.
There is very little to no automobile traffic, with only a few access points to the area for deliveries or
emergencies. Pedestrian zones do not have any parking facilities. According to the Highway Capacity
Manual of 2010, a pedestrian zone is a street dedicated to pedestrian use. This can be on a full-time or
part-time basis (Transportation Research Board, 2010). For this study it is assumed that the pedestrian
zone is on a full-time basis, but will still provide vehicle access for priority vehicles.
A green pedestrian zone is an ordinary pedestrian zone where green engineering methods are
incorporated. Green engineering methods may include green roofs, green facades, only closing off the
area for cars and the planting of trees. Green pedestrian zones can be newly built or can be created in
existing areas. Only green pedestrian zones created in existing areas are researched in this study.
Stellenbosch University https://scholar.sun.ac.za
7 | P a g e
2. STUDY METHODOLOGY
In this chapter the steps taken to achieve the study aims and objectives are provided. The study is
divided into the following main steps:
1. LITERATURE REVIEW: Research based on the current status of the environment and how
to address possible environmental problems;
2. PRE-FEASIBILITY MODEL: Development of pre-feasibility model to determine the
impact of pedestrian zones on the following immediate factors:
a. Air quality;
b. Economy;
c. Social and cultural implication;
d. Surrounding traffic;
e. Location specifications;
3. CASE STUDY: Evaluating the pre-feasibility model by conducting a case study on the inner
town centre of Stellenbosch;
4. EVALUATION and INTERPRETATION.
The methodology for the LITERATURE REVIEW:
1. Conduct literature research on the current status of the environment and how to address
possible environmental problems.
2. The literature research, as presented in Chapters 3 to 6, includes previous studies,
environmental problems in South Africa, solutions to stated problems, and pedestrian zones
as possible solution to stated problems, existing pedestrian zones and existing green
engineering methods.
The methodology for the PRE-FEASIBILITY MODEL:
1. Conduct literature research on methods to analyse the data obtained from previous studies and
literature as included in steps one and two of the literature review methodology.
2. Determine the best mathematical approaches to follow in the construction of the pre-
feasibility model.
3. Develop mathematical equations.
4. Test the model based on the obtained data (calibration).
5. The steps followed to complete each part of the pre-feasibility model as mentioned in the
previous two points above, are elaborated upon in detail in Chapter 7.
The methodology for the CASE STUDY:
1. Test and validate the developed pre-feasibility model. A former study conducted for the inner
town centre of Stellenbosch is used as input data.
2. Evaluate the outcomes obtained from the pre-feasibility model by comparing it to the outcomes
obtained by the former study. The case study is thus a validation of the pre-feasibility model.
Stellenbosch University https://scholar.sun.ac.za
8 | P a g e
The methodology for EVALUATION and INTERPRETATION:
1. Evaluate the accuracy of the pre-feasibility model based on the validation obtained from the
case study and compare the outcomes of the pre-feasibility model to literature.
2. Obtain input and recommendations by presenting the developed pre-feasibility model to
industry professionals. This step includes interviews with identified professionals as follows:
Me Nina Otto, city and town planner at AECOM;
Mr André Pelser, Head of Rate Payers Association Stellenbosch;
Me Cara Gerber, transportation and strategic planner at AECOM.
3. Interpret the functioning of the pre-feasibility model based on steps one and two.
4. Elaborate on limitations of the model.
5. Provide recommendations on how to improve the developed model. Include factors which
may contribute to the validity of the model and how to address some of the limitations.
6. Discuss other factors that should be addressed provided that a green pedestrian zone has been
considered feasible and will be formally implemented.
Stellenbosch University https://scholar.sun.ac.za
9 | P a g e
3. LITERATURE REVIEW: Part 1-Environmental Problems
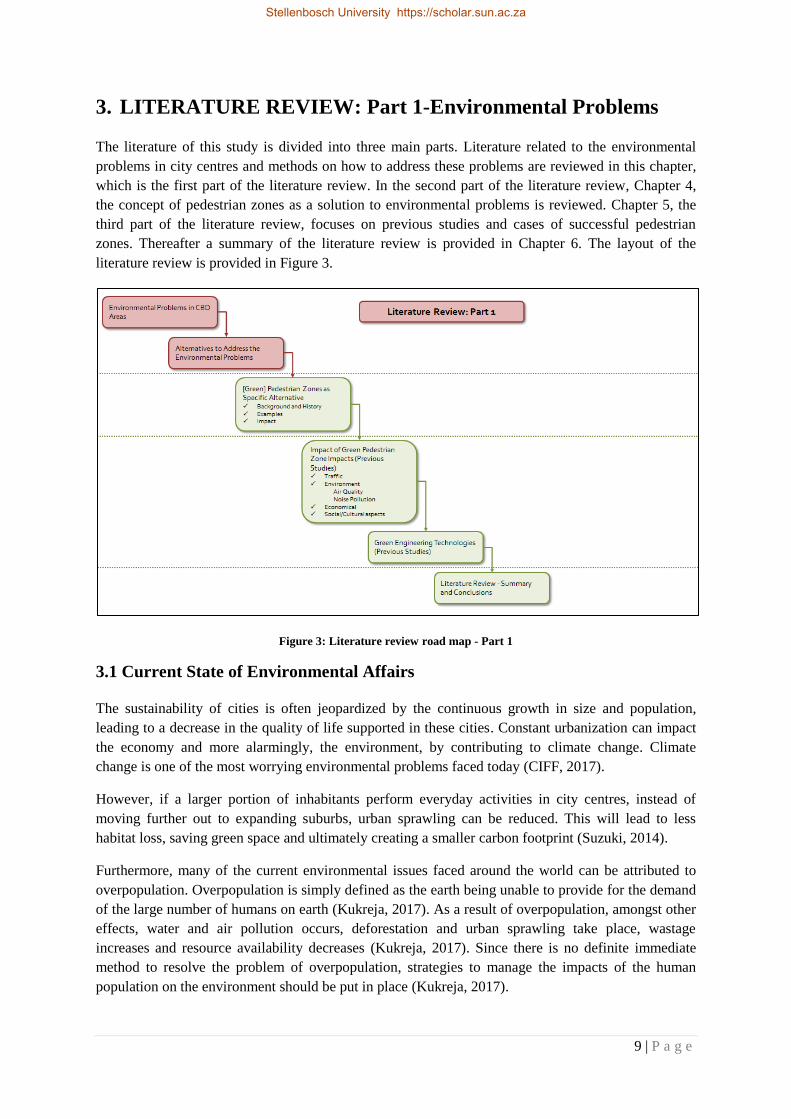
The literature of this study is divided into three main parts. Literature related to the environmental
problems in city centres and methods on how to address these problems are reviewed in this chapter,
which is the first part of the literature review. In the second part of the literature review, Chapter 4,
the concept of pedestrian zones as a solution to environmental problems is reviewed. Chapter 5, the
third part of the literature review, focuses on previous studies and cases of successful pedestrian
zones. Thereafter a summary of the literature review is provided in Chapter 6. The layout of the
literature review is provided in Figure 3.
Figure 3: Literature review road map - Part 1
3.1 Current State of Environmental Affairs
The sustainability of cities is often jeopardized by the continuous growth in size and population,
leading to a decrease in the quality of life supported in these cities. Constant urbanization can impact
the economy and more alarmingly, the environment, by contributing to climate change. Climate
change is one of the most worrying environmental problems faced today (CIFF, 2017).
However, if a larger portion of inhabitants perform everyday activities in city centres, instead of
moving further out to expanding suburbs, urban sprawling can be reduced. This will lead to less
habitat loss, saving green space and ultimately creating a smaller carbon footprint (Suzuki, 2014).
Furthermore, many of the current environmental issues faced around the world can be attributed to
overpopulation. Overpopulation is simply defined as the earth being unable to provide for the demand
of the large number of humans on earth (Kukreja, 2017). As a result of overpopulation, amongst other
effects, water and air pollution occurs, deforestation and urban sprawling take place, wastage
increases and resource availability decreases (Kukreja, 2017). Since there is no definite immediate
method to resolve the problem of overpopulation, strategies to manage the impacts of the human
population on the environment should be put in place (Kukreja, 2017).
Stellenbosch University https://scholar.sun.ac.za

10 | P a g e
3.1.1 Types of Environmental Concerns
The Environmental Performance Index (EPI) measures the ability of a country to safeguard and
protect its ecosystems and human health. South Africa was ranked at position 72 on the 2014 EPI
(Yale University, 2017). South Africa however downgraded to position 81 on the 2016 EPI rankings.
South Africa is also responsible for the most deforestation in Africa. 17.2% of the tree cover in the
country is lost per year, with Swaziland following closely with 16.4% (Yale University, 2017). The
following are statistics and opportunities where South Africa can improve on environmental
protection (Wonder Plant, 2014):
1. South Africa releases approximately 511 million tonnes of carbon dioxide into the
atmosphere each year;
2. The carbon emission in South Africa is 9.18 tonnes per capita per year. This is double the
world average of 4.49 tonnes per capita;
3. The carbon emissions due to the consumption of fossil fuels increased by 24% from 1996.
Major environmental problems currently faced worldwide include: (Kukreja, 2017; Nils
Zimmermann, 2016)
1. Pollution: including air, water and soil pollution with air pollution mainly caused by motor
vehicle and industrial emissions, and water pollution caused by acid rain and urban runoff;
2. Global Warming: a changing climate as result of human practises such as the emission of
greenhouse gases;
3. Overpopulation: the fast growth of the population resulting in unsustainable resource levels;
4. Natural Resource Depletion;
5. Increased Waste Disposal;
6. Loss of Biodiversity: extinction of species due to inconsiderate human activities;
7. Deforestation: the loss of green cover and trees;
8. Ocean Acidification: as direct result of excessive CO2 production;
9. Ozone Layer Depletion: Chlorofluorocarbons corroding the ozone layer;
10. Acid Rain: combustion of fossil fuels releasing sulphur dioxide into the atmosphere causing
the rainfall to become acidic;
11. Urban Sprawl: migration of people from high density urban areas to low density suburban or
rural areas;
A detailed discussion of the following environmental concerns is provided in Appendix A:
Urbanization and Urban Sprawling as Environmental Concern;
Effect of Urbanization on Green Space;
Air Pollution as Environmental Concern.
Stellenbosch University https://scholar.sun.ac.za
11 | P a g e
3.2 Possible Solutions to Environmental Issues
With the increase in population size, followed by environmental degradation and increased pollution
and often under poor governance, it becomes more urgent to come up with solutions to address all of
these environmental problems. The first step is to find ways in which to transform cities to become
more resilient and sustainable, to become more inclusive and safe, and finally to become more
productive and healthy. Some of the key role players in creating transformed cities include architects,
urban planners, engineers and policy makers (Hawley, 2014).
Urban sustainability is the improvement of city life including ecological, economic, social, cultural
and political components that will leave no burden on future generations and ensure a healthy
environment for all residents. Some of the key actions to contribute to sustainable development are to
reduce (Hawley, 2014):
1. Energy consumption;
2. Encroachment on ecological/natural spaces;
3. Usage of harmful building materials;
4. Carbon footprint and to
5. Manage waste better.
Examples are provided in Appendix B on how the above mentioned key actions have been achieved
in some cities in terms of (Hawley, 2014):
1. Public Transport;
2. Integrative Urban Design;
3. Waste Management;
4. Biomimicry;
5. Low-Carbon Cities, T-Charge, Congestion Tax and Low Emission Zone Charge;
6. Electric Cars;
7. The Paris Agreement;
8. Green Engineering Technologies;
Detail on the use of Pedestrian Schemes in achieving the above mentioned key actions is provided in
section 3.2.1 below and in Chapter 4.
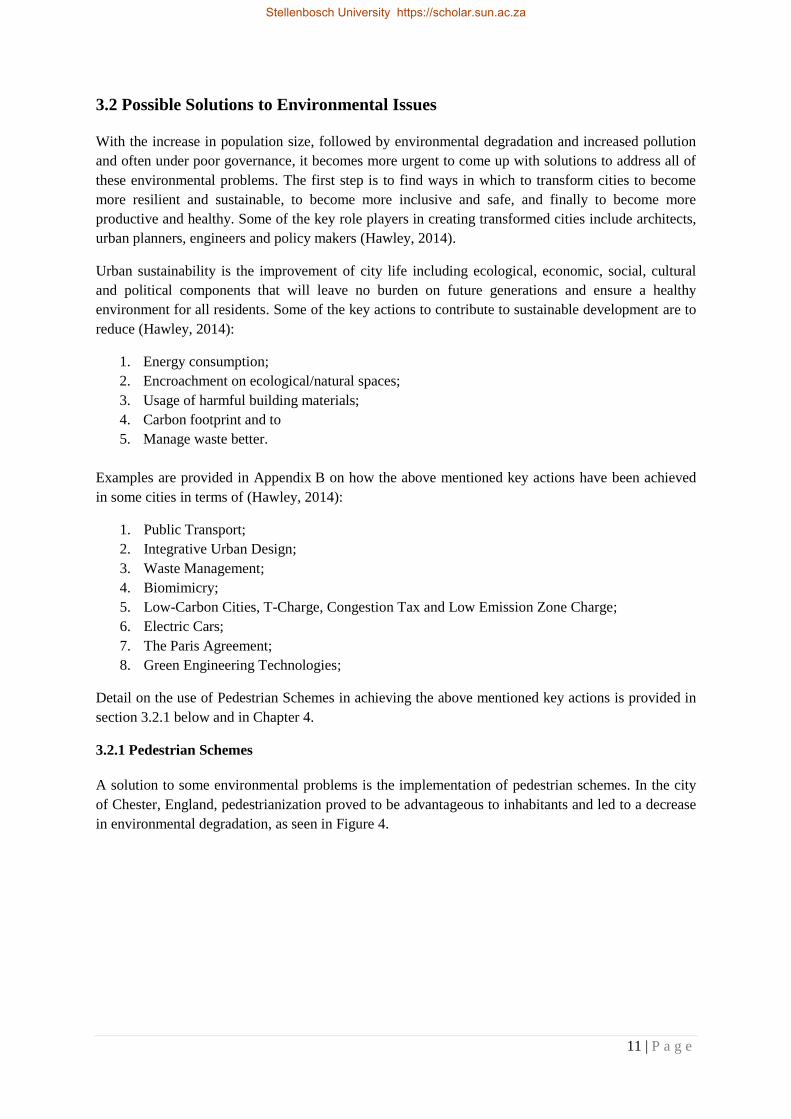
3.2.1 Pedestrian Schemes
A solution to some environmental problems is the implementation of pedestrian schemes. In the city
of Chester, England, pedestrianization proved to be advantageous to inhabitants and led to a decrease
in environmental degradation, as seen in Figure 4.
Stellenbosch University https://scholar.sun.ac.za
12 | P a g e
Figure 4: Pedestrian zone in Chester, England (WMC Retail Partners, 2017)
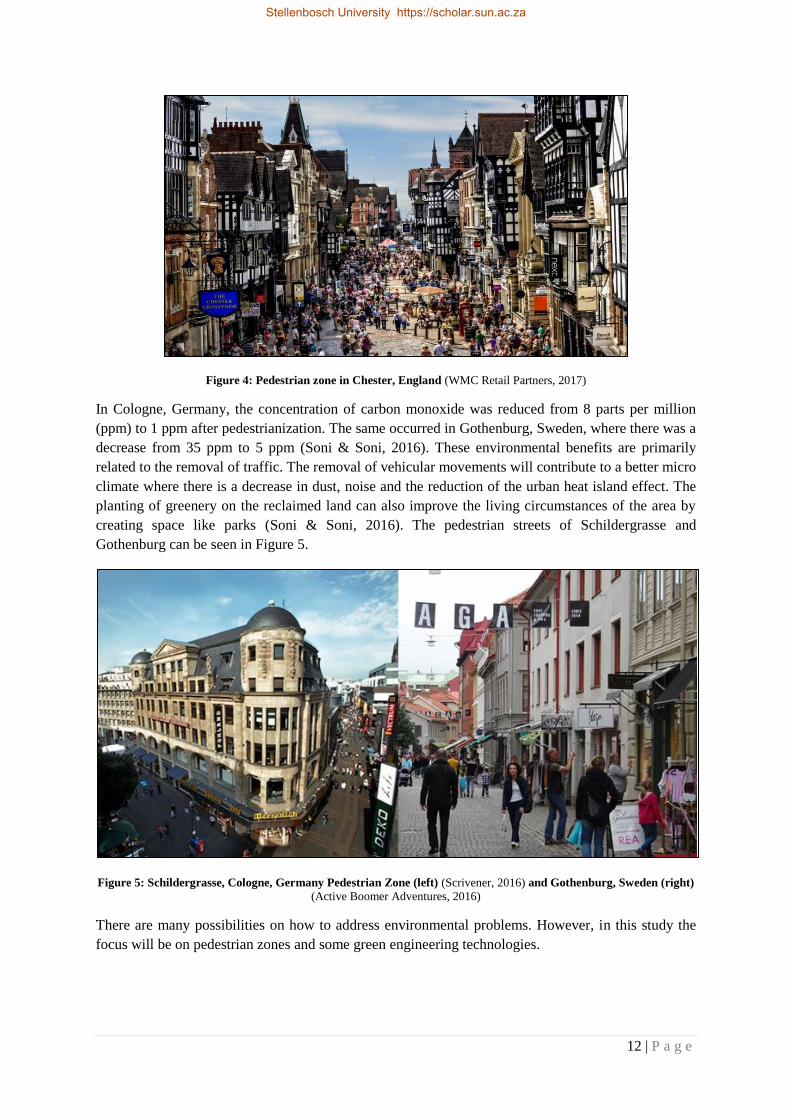
In Cologne, Germany, the concentration of carbon monoxide was reduced from 8 parts per million
(ppm) to 1 ppm after pedestrianization. The same occurred in Gothenburg, Sweden, where there was a
decrease from 35 ppm to 5 ppm (Soni & Soni, 2016). These environmental benefits are primarily
related to the removal of traffic. The removal of vehicular movements will contribute to a better micro
climate where there is a decrease in dust, noise and the reduction of the urban heat island effect. The
planting of greenery on the reclaimed land can also improve the living circumstances of the area by
creating space like parks (Soni & Soni, 2016). The pedestrian streets of Schildergrasse and
Gothenburg can be seen in Figure 5.
Figure 5: Schildergrasse, Cologne, Germany Pedestrian Zone (left) (Scrivener, 2016) and Gothenburg, Sweden (right)
(Active Boomer Adventures, 2016)
There are many possibilities on how to address environmental problems. However, in this study the
focus will be on pedestrian zones and some green engineering technologies.
Stellenbosch University https://scholar.sun.ac.za

13 | P a g e
4. LITERATURE REVIEW: Part 2-Pedestrianization as Solution
In this chapter pedestrianization as a solution to environmental problems is reviewed in depth as
second part of the literature review. Figure 6 illustrates the part of the literature review included in
this chapter. In this chapter the origin, value and functioning of pedestrian zones are discussed.
Figure 6: Literature review road map – Part 2
4.1 Background to the Origin of Pedestrian Facilities
The oldest form of transportation is walking. Walking still forms part of the every trip. The beginning
and the end of a commute start as pedestrian actions. The concepts of pedestrian zones, pedestrian
streets and more importantly, car-free spaces date back to ancient times. The prosperity of ancient
cities was often expressed by pedestrian zones in the form of plains, plazas and walkways. Roman
cities became known for their pedestrian friendly street designs with elevated sidewalks as seen in
Figure 7.
Stellenbosch University https://scholar.sun.ac.za
14 | P a g e
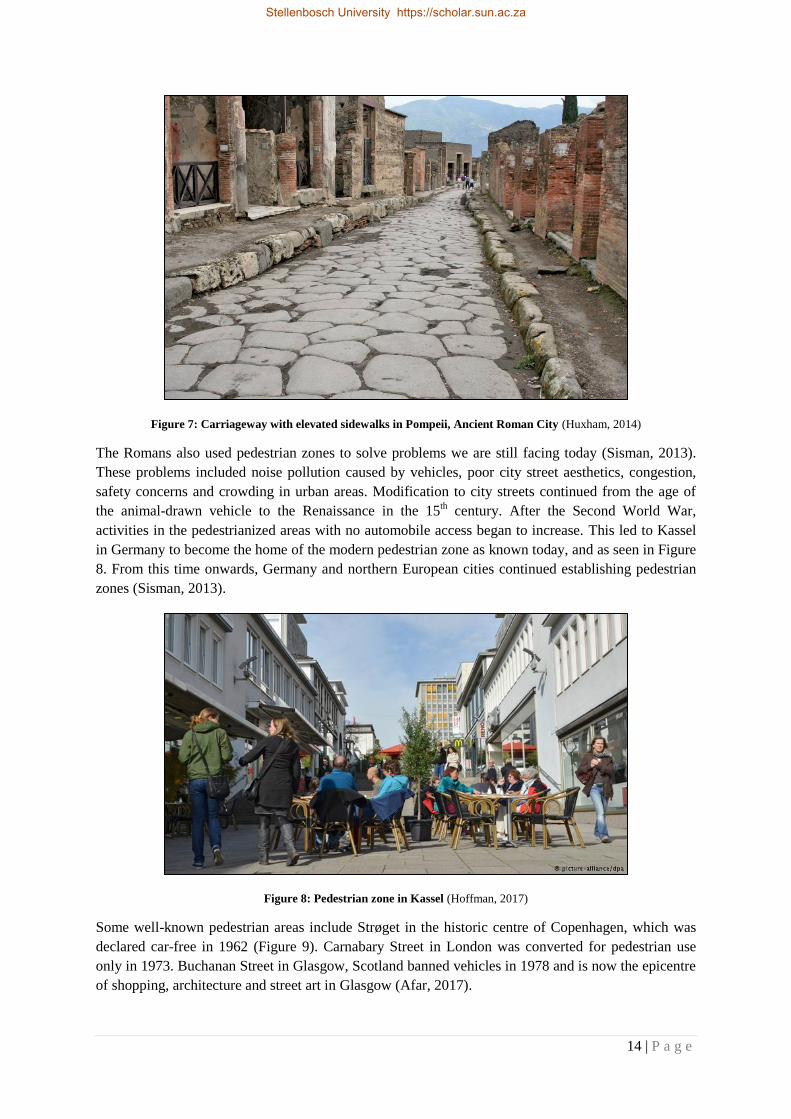
Figure 7: Carriageway with elevated sidewalks in Pompeii, Ancient Roman City (Huxham, 2014)
The Romans also used pedestrian zones to solve problems we are still facing today (Sisman, 2013).
These problems included noise pollution caused by vehicles, poor city street aesthetics, congestion,
safety concerns and crowding in urban areas. Modification to city streets continued from the age of
the animal-drawn vehicle to the Renaissance in the 15th century. After the Second World War,
activities in the pedestrianized areas with no automobile access began to increase. This led to Kassel
in Germany to become the home of the modern pedestrian zone as known today, and as seen in Figure
8. From this time onwards, Germany and northern European cities continued establishing pedestrian
zones (Sisman, 2013).
Figure 8: Pedestrian zone in Kassel (Hoffman, 2017)
Some well-known pedestrian areas include Strøget in the historic centre of Copenhagen, which was
declared car-free in 1962 (Figure 9). Carnabary Street in London was converted for pedestrian use
only in 1973. Buchanan Street in Glasgow, Scotland banned vehicles in 1978 and is now the epicentre
of shopping, architecture and street art in Glasgow (Afar, 2017).
Stellenbosch University https://scholar.sun.ac.za

15 | P a g e
Figure 9: Strøget, Copenhagen (WMC Retail Partners, 2017)
Rapid urbanization and increasing traffic volumes, especially in city centres, restrain people from
walking. Any city will benefit aesthetically, socially and economically from providing safe and
comfortable traffic free open spaces (Sisman, 2013).
4.2 Existing Pedestrian Zones around the World
A major design aspect of “cities for the future” is the creation of car free living (Riffat et al., 2016).
The dependency on cars to commute however became more popular over time. This decreased the
quality of life for many people due to long hours spent in congested traffic. People tend to live in
suburban areas and work within the urban CBD areas. With a daily commute, in some cases up to two
hours, health problems can occur such as stress and even weight gain (Suzuki, 2014). Congestion on
most roads is caused by the vehicles within municipality boundaries.
Non-motorized transport, public transport facilities, adequate pedestrian and cycling infrastructure can
be implemented as solution to the problem of vehicular commutes and time spent in congestion.
Development policies in urban areas should also encourage for at least 50% of urban activities to be
within 1km of residential areas. This will make it possible to rely on smaller and more fuel efficient
cars (Sustainability Institute, 2012).
In this section some examples of where pedestrian zones are used to minimise the reliance on cars, are
investigated.
4.2.1 Super Blocks in Barcelona, Spain
In the City of Barcelona, Spain, a new strategy was implemented to restrict vehicular traffic to only
major roads and converting secondary roads into pedestrian streets where citizens can live in leisure
with the added benefit of reduced pollution (Bausells, 2016). The city developed this mobility plan to
reduce traffic by 21% in order to address the excessive levels of noise and air pollution (Bausells,
2016).
Stellenbosch University https://scholar.sun.ac.za

16 | P a g e
Superilles (superblocks) are small square neighbourhoods, together forming a grid as seen in Figure
10. These blocks were originally engineered to spread out the population evenly and to provide all
with a green space in the centre of the block to ultimately contribute to public health. Due to urban
development the initial idea to prohibit cars from the superblocks failed and so the superblocks got
filled with cars. From there the high noise and air pollution levels originated (Bausells, 2016).
Figure 10: Superblocks in Barcelona (Bausells, 2016)
A superblock consists of nine smaller blocks. By redirecting the traffic around the superblocks to only
travel along the perimeter and removing cars from the centres of these blocks, 60% of streets were
freed up for pedestrian use. Vehicles would only be allowed to enter the in-between streets if they
were residents or business providers and at a reduced speed of 10km/h (Bausells, 2016). The traffic
flow configuration can be seen in Figure 11, where the roads indicated in green form part of the
network closed for vehicular traffic.
Figure 11: Traffic flow around Superblocks (Bausells, 2016)
The city planned to complement this project by promoting the use of public transport, walking and the
use of bicycles. This aim was achieved by adding a bus network to the major roads and by the
introduction of 300km of bicycle lanes. Ultimately, the city aimed to provide public transport access
Stellenbosch University https://scholar.sun.ac.za

17 | P a g e
within 300 metres and at an average waiting time of not more than 5 minutes for anyone, anywhere
within the superblocks (Bausells, 2016).
4.2.2 NYC: Times Square and the Highline
Times Square in New York is one of the city’s most popular destinations for locals and tourist alike.
Time Square is home to a plenty of cafés, restaurants and boutiques and serves as the venue for
various events such as music concerts, New Year celebrations and carnivals. It therefore came as no
surprise that pedestrian crowding become synonymous with the square. Some of the problems faced
included (Design Trust for Public Space, 2018):
1. Overcrowded and congested sidewalks;
2. High volumes of pedestrians;
3. No room to walk, except in the streets;
4. Crowding during day and night;
5. Disorganized streets;
6. Unnecessary obstacles, planters, structures and barricades, filling the already limited space;
7. Vendors using the sidewalk as “showroom”.
Level of Service (LOS) is a qualitative measure to determine the performance of the service, with “A”
being adequate and good and “F” indicating congested circumstances (Transportation Research
Board, 2010). During a survey in 2014 with 2350 local employees at New York Times Square, 68%
complained about the poor LOS, which was then at level D within the square and which would cause
them to consider employment elsewhere (Goldwyn, 2014).
Broadway Street and Seventh Avenue at Times Square intersect at a diagonal to form a bowtie-shaped
crossing. This area is therefore also known as the “Bowtie” (Design Trust for Public Space, 2018).
The amount of vehicle-pedestrian collisions in the square was another problem caused by the
restricted pedestrian space. Figure 12 presents the collision counts for the years 2002, 2003 and 2004
at various points around the “Bowtie”.
Figure 12: Vehicle-Pedestrian collisions in Bowtie (Design Trust for Public Space, 2018)
Stellenbosch University https://scholar.sun.ac.za

18 | P a g e
With 89% of the space in Times Square allocated to vehicles and 11% to pedestrians, even though
pedestrians made out 90% of the users of the area, the city of New York realised that the utilisation of
the existing space should be revisited (Goldwyn, 2014).
The process of providing solutions to the abovementioned problems captured thoughts such as
creating a place where people WANT to be and re-thinking the relationship between pedestrians and
vehicles. Even though the solutions did not involve the removal of all vehicular traffic, the vehicular
flow through the area was balanced and redirected to some of the surrounding streets. This was done
to free up more space for pedestrians and to increase the sidewalks around the Bowtie. Signals were
timed to provide more green time for pedestrians. The spatial distribution between the different modes
within the area changed and more pedestrian areas were created. This can be seen in Figure 13 where
spaces initially allocated as roadway were transformed to pedestrian space.
Figure 13: Time Square before (left) and after (right) pedestrianization schemes (Goldwyn, 2014)
4.2.3 Copenhagen Bicycle Friendly City Centres
Copenhagen, Denmark, is one of the most famous bicycle and pedestrian orientated cities in Europe.
As with many other cities in Europe, while the traffic congestion increased, the number of parking
spaces increased and the conditions for pedestrians deteriorated. This resulted in the pedestrianization
of the main street, Strøget, on the 17th of November 1962. The new car free area became popular with
the local residents from the first day and proved to be a success, even though scepticism was initially
high.
Today, over 96 000m2 of Copenhagen is car-free with 33% allocated to streets and 67% to city
squares. The city centre became more attractive and is used for multiple purposes such as festivals,
outdoor ice skating in the winter, music concerts and a gathering spot for social and cultural activities.
The city managed to create these car-free spaces by limiting the number of parking spaces, reducing
the number of car lanes in several main roads, restricting through traffic and by developing public
transport facilities. In 2004, 80% of all journeys were made per foot and 14% by bicycle (Wallztrom,
2004). In Figure 14 the transformation of the city can be seen. The blue indicates the car-free zones
and how the car free space increased from 1962 (only 15 800m2) to 1996 (95 750m
2).
Figure 14: Transformation of Copenhagen (1962 to 1996) (Wallztrom, 2004)
Stellenbosch University https://scholar.sun.ac.za

19 | P a g e
4.3 Green Spaces and Pedestrian Zones in South Africa
There is a growing trend in population and vehicle volumes in South Africa. The population grew by
almost 4 million people over a period of five years. The population was 51 770 560 million in 2011
and increased to 55 653 654 million in 2016 (StatsSA, 2017). The July 2018 estimates of the United
Nations give the population of South Africa to be 57.4 million of which 62.9% is urban
(Worldometers, 2018). According to the National Administration Traffic Information System
(NATIS) a total of 12 027 860 vehicles were registered at the end of February 2017. At the end of
December 2016, 11 964 234 vehicles were registered. A month later, at the end of January 2017, the
vehicle count increased to 12 009 553. This is an increase of 45 319 vehicles. The major cities of
South Africa contain more than half of the registered vehicles. There are currently 4 643 741
registered vehicles in Gauteng, 1 935 054 in Western Cape and 1 607 946 in KwaZulu-Natal (Van der
Post, 2017). This growth in vehicle volumes and growth in population place strain on the natural
environment and open spaces within cities.
Potential threats to retaining urban green spaces in South Africa are business park developments,
housing developments and transportation projects. Pertinent currently in South Africa is the unlawful
establishment of informal settlements within metro and municipal borders with Vrygrond in Cape
Town as an example (Dullah Omar Institute, 2016).
The map of South Africa is provided in Figure 15 with city and town boundaries, built-up areas and
parks displayed as different coloured overlays. From this map an overview of the current status of
green spaces in South Africa can be derived. Similarly, on a regional level, Figure 16 provides an
overview for the Cape Peninsula and surrounding areas. The Open Source QGIS Geographical
Information System (GIS) software program (QGIS version 3.2) was used to plot and process MapIt
shapefile data to create Figure 15 and Figure 16.
With built-up areas covering approximately 2.4% (as calculated with the QGIS tool based on MapIt
data) of the 1,219,912 km2 South African land area (Worldometers, 2018), it means that on average
the urban density for the more than 36 million city and town dwellers [62.9% of the 57.4 million total
population (Worldometers, 2018),] is calculated at 1233 persons per km2 .
Stellenbosch University https://scholar.sun.ac.za
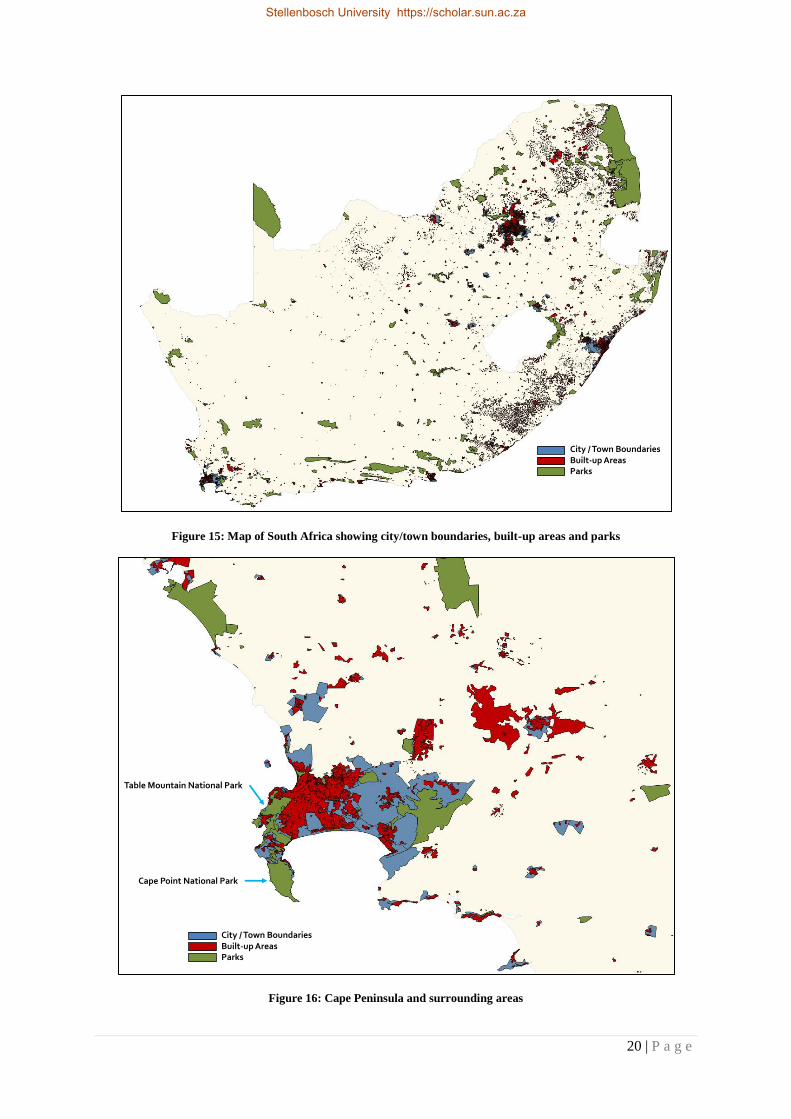
20 | P a g e
Figure 15: Map of South Africa showing city/town boundaries, built-up areas and parks
Figure 16: Cape Peninsula and surrounding areas
City / Town BoundariesBuilt-up AreasParks
City / Town BoundariesBuilt-up AreasParks
Table Mountain National Park
Cape Point National Park
Stellenbosch University https://scholar.sun.ac.za

21 | P a g e
QGIS provides a number of useful features to process GIS data. These features include the ability to
create a new overlay from overlapping overlays. Another feature is to calculate areas within an
overlay and to export an overlay as a spreadsheet. Utilising these features, the map in Figure 17 was
created to demonstrate the different areas in the Cape Town area.
Figure 17: Cape Peninsula and surrounding areas: park areas (left), park areas in city / town boundaries (centre) and
park areas within built-up areas (right)
Further, by utilising these features, the statistics as provided in Table 1 were also derived. The value
for green space per capita as calculated and listed in Table 1 is compared with published values and is
graphically presented in Figure 18. From Figure 18 it is noted that South Africa ranks on the lower
end.
Table 1: Statistics related to green spaces in South Africa
Area Coverage Source
Park Areas 5.354% of South Africa QGIS calculated (MapIt data)
Built-Up Areas 2.400% of South Africa QGIS calculated (MapIt data)
City / Town Boundaries 2.214% of South Africa QGIS calculated (MapIt data)
Parks in City / Town Boundaries 0.17% of South Africa QGIS calculated (MapIt data)
Parks in City / Town Boundaries 4.85% of City / Town
Boundaries
QGIS calculated (MapIt data)
Parks in Built-up Areas 0.052% of South Africa QGIS calculated (MapIt data)
Parks in Built-up Areas 2.21% of Built-up Areas QGIS calculated (MapIt data)
South African size (published) 1 219 912 km2 (Dullah Omar Institute, 2016)
South African population (published) 57.4 million UN estimation (Worldometers, 2018)
South African urban population
(published)
62.9% UN estimation (Worldometers, 2018)
Park area 65 314 km2 QGIS Calculated (MapIt data)
Park area per capita 1138 m2 QGIS Calculated (MapIt data)
City / Town area 27 008 km2 QGIS Calculated (MapIt data)
City park area 1309 km2 QGIS Calculated (MapIt data)
City park area per capita 36 m2 QGIS Calculated (MapIt data)
Urban (built-up) area 29 273 km2 QGIS Calculated (MapIt data)
Urban (built-up) park area 528 km2 QGIS Calculated (MapIt data)
Urban (built-up) park area per capita 17 m2 QGIS Calculated
Stellenbosch University https://scholar.sun.ac.za

22 | P a g e
Figure 18: Green space per capita (RSA park areas excluding GPZs) (Baharash Architecture, 2018)
The Cape Town Green Map initiative was founded in 2009 in preparation for the 2010 Soccer World
Cup, building on the success of Germany’s 2006 model and takes into account the impact on the
environment of such a huge event (Green Map, 2018).
The Cape Town Green Map is one of multiple projects, focusing on greening initiatives, carbon
reduction and offset, water conservation, sustainable transport, integrated waste management,
biodiversity awareness, green procurement, responsible tourism and environmental awareness
(Baharash Architecture, 2018). From Green Maps, significant green zones of interest for Cape Town
are presented in Figure 19. An extract from the Cape Town Green Map is provided in Figure 20.
Figure 19: Cape Town pedestrian zones (Green Map, 2018)
17m2 36m2
Stellenbosch University https://scholar.sun.ac.za

23 | P a g e
Figure 20: Extract from Cape Town Green Map (Baharash Architecture, 2018)
Stellenbosch University https://scholar.sun.ac.za

24 | P a g e
4.4 How Pedestrian Zones and the Environment Fit Together
In this section the operations, advantages and disadvantages of pedestrian zones and the impact of
pedestrian zones on the environment are discussed.
4.4.1 Why a Green Pedestrian Zone?
By creating a green pedestrian zone in city or town areas with a high density, the amount of green
space per capita will increase. This will lead to higher quality of living environment (Lee et al., 2015).
The flowchart in Figure 21 illustrates the positive consequences in environmental safeguarding caused
by the creation of green pedestrian zones. As consequence, at least 7 of the 12 major high-priority
environmental problems faced today (as described in paragraph 3.1.1) will be reduced.
Figure 21: Positive consequences associated with GPZs
In order to create a GREEN pedestrian zone, existing green engineering methods are introduced to the
area. With the implementation of green roofs and walls or facades, urban runoff will be reduced,
hence less water pollution. Green roofs and walls or facades conserve energy, support lower air
pollution, reduce carbon emissions, promote urban cooling and provide a habitat for insect
biodiversity (GreenWall_Australia, 2014).
Green paving solutions can also be used in the area. Solutions can include solar reflective coatings on
existing pavements to reduce heat, permeable pavers to manage storm water or eco-friendly concrete
alternatives (Rose Paving LLC, 2017).
4.4.2 Advantages of a Green Pedestrian Zone
Not only will the environment benefit from green pedestrian zones but also the local community
which include residents, retailers and restauranteurs. The increased attractiveness of a pedestrianized
environment will promote walking as a mode of travel and therefore increase the number of
pedestrians making use of the pedestrianized area. An awareness and appreciation of the historic
environment of the city or town will be created. It is anticipated that a traffic-free zone will induce an
increase in property value and other economic and business activities (increased retail turnover) due
to more tourists and shoppers being attracted to the zone (Chiquetto, 1997).
Stellenbosch University https://scholar.sun.ac.za
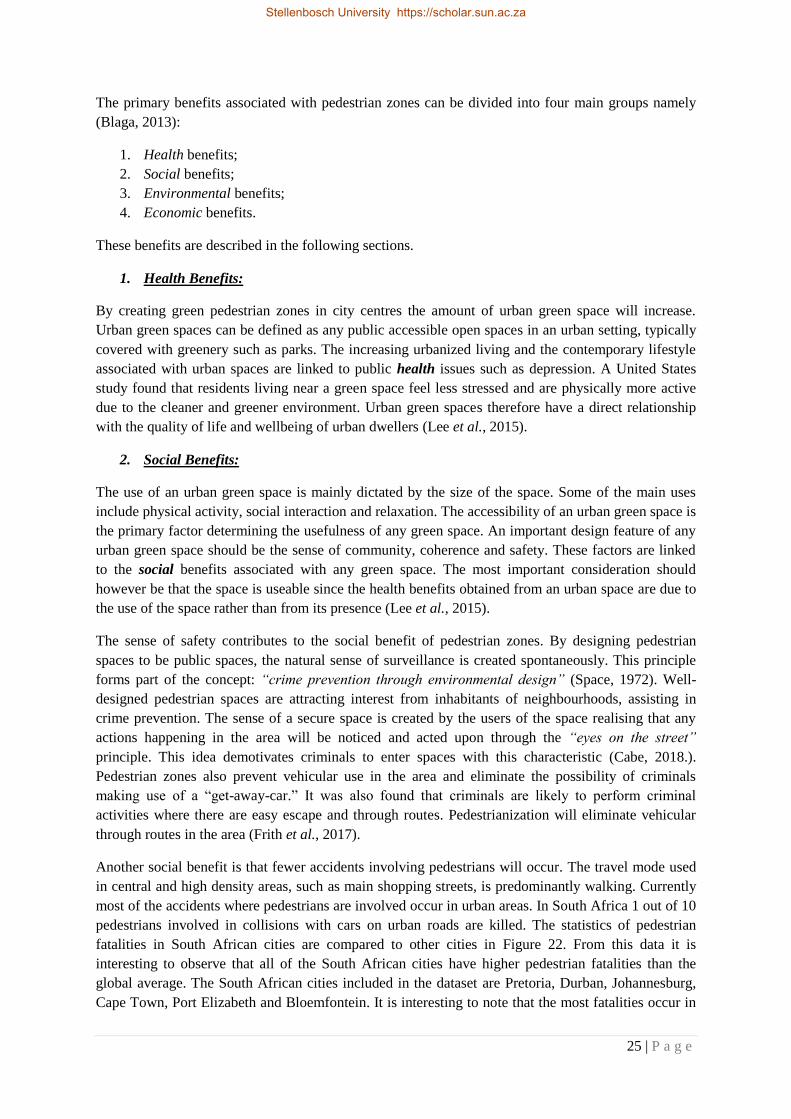
25 | P a g e
The primary benefits associated with pedestrian zones can be divided into four main groups namely
(Blaga, 2013):
1. Health benefits;
2. Social benefits;
3. Environmental benefits;
4. Economic benefits.
These benefits are described in the following sections.
1. Health Benefits:
By creating green pedestrian zones in city centres the amount of urban green space will increase.
Urban green spaces can be defined as any public accessible open spaces in an urban setting, typically
covered with greenery such as parks. The increasing urbanized living and the contemporary lifestyle
associated with urban spaces are linked to public health issues such as depression. A United States
study found that residents living near a green space feel less stressed and are physically more active
due to the cleaner and greener environment. Urban green spaces therefore have a direct relationship
with the quality of life and wellbeing of urban dwellers (Lee et al., 2015).
2. Social Benefits:
The use of an urban green space is mainly dictated by the size of the space. Some of the main uses
include physical activity, social interaction and relaxation. The accessibility of an urban green space is
the primary factor determining the usefulness of any green space. An important design feature of any
urban green space should be the sense of community, coherence and safety. These factors are linked
to the social benefits associated with any green space. The most important consideration should
however be that the space is useable since the health benefits obtained from an urban space are due to
the use of the space rather than from its presence (Lee et al., 2015).
The sense of safety contributes to the social benefit of pedestrian zones. By designing pedestrian
spaces to be public spaces, the natural sense of surveillance is created spontaneously. This principle
forms part of the concept: “crime prevention through environmental design” (Space, 1972). Well-
designed pedestrian spaces are attracting interest from inhabitants of neighbourhoods, assisting in
crime prevention. The sense of a secure space is created by the users of the space realising that any
actions happening in the area will be noticed and acted upon through the “eyes on the street”
principle. This idea demotivates criminals to enter spaces with this characteristic (Cabe, 2018.).
Pedestrian zones also prevent vehicular use in the area and eliminate the possibility of criminals
making use of a “get-away-car.” It was also found that criminals are likely to perform criminal
activities where there are easy escape and through routes. Pedestrianization will eliminate vehicular
through routes in the area (Frith et al., 2017).
Another social benefit is that fewer accidents involving pedestrians will occur. The travel mode used
in central and high density areas, such as main shopping streets, is predominantly walking. Currently
most of the accidents where pedestrians are involved occur in urban areas. In South Africa 1 out of 10
pedestrians involved in collisions with cars on urban roads are killed. The statistics of pedestrian
fatalities in South African cities are compared to other cities in Figure 22. From this data it is
interesting to observe that all of the South African cities have higher pedestrian fatalities than the
global average. The South African cities included in the dataset are Pretoria, Durban, Johannesburg,
Cape Town, Port Elizabeth and Bloemfontein. It is interesting to note that the most fatalities occur in
Stellenbosch University https://scholar.sun.ac.za

26 | P a g e
Bloemfontein (Ribbens, 2017). By transforming such areas to be only accessible to non-motorized
traffic, pedestrian safety will be promoted resulting in less pedestrian accidents.
Figure 22: Pedestrian Fatalities in Cities (Ribbens, 2017)
3. Environmental Benefits:
The environment will improve in terms of aesthetics and lower local air and noise pollution through
the introduction of green pedestrian zones. Other environmental benefits associated with urban green
spaces are a reduction in the urban heat island effect, which in turn reduces energy costs to cool
buildings, minimizing of air, water and noise pollution, absorption of CO2 greenhouse emissions and a
reduction of urban runoff (Lee et al.,2015).
4. Economic Benefits:
The effects of traffic-calming and pedestrian schemes implemented in Germany and the UK on
retailing were researched. It was noted that the shops situated inside the pedestrianized areas were
more successful than those situated outside of the pedestrianized areas. It can therefore be concluded
that the implementation of pedestrianization schemes can have positive economic benefits (Hass-
Klau, 1993a).
5. Other Benefits:
In the past the main objective in the planning of cities was to maximise the flow of traffic and
pedestrians were not a priority. With increased congestion and vehicles having right of way in most
city centres, the cities became “dead places” from a social point of view. Some authors describe these
vehicle orientated streets as “killed by vehicles” (Soni & Soni, 2016). Due to limited space available
in city centres as socio-economic systems, the only feasible solution to upgrade the environment and
mobility in these areas is pedestrianization. This method has been applied in some of these pedestrian
inaccessible places and contributed in the revitalization of these city centres (Soni & Soni, 2016).
Stellenbosch University https://scholar.sun.ac.za

27 | P a g e
Most of the successful pedestrianized areas and pedestrian orientated cities are located in Europe.
With Europe situated in the Northern Hemisphere the continent is associated with colder temperatures
and more rain. It can therefore be concluded that weather does not have a significant impact on the
use of pedestrian areas.
4.4.3 Disadvantages of a Green Pedestrian Zone
Some of the disadvantages associated with pedestrian zones include:
1. Negative Traffic Impact;
2. Negative Accessibility Impact;
3. Negative Economic Impact.
1. Negative Traffic Impact
In some cases pedestrianization worsened traffic flows in surrounding areas with increased travel time
and fuel consumption (Chiquetto, 1997).
2. Negative Accessibility Impact
Pedestrianization can decrease the accessibility of an area to car users and discourage car users to
travel to the specific pedestrian zone, especially in the case where the traffic-free zone is situated far
from other activity centres (Chiquetto, 1997).
3. Negative Economic Impact
Due to the inaccessibility in some cases, property devaluation and poor retail turnover can occur
(Chiquetto, 1997). Therefore, careful location planning for any pedestrianization scheme is of high
importance.
The location characteristics and boundary conditions for a suitable area to be converted into a
pedestrian zone are provided in Chapter 7 as part of the pre-feasibility model. Additional costs will
have to be covered by local municipalities or communities in order to create any pedestrian zone or
green pedestrian zone.
Stellenbosch University https://scholar.sun.ac.za
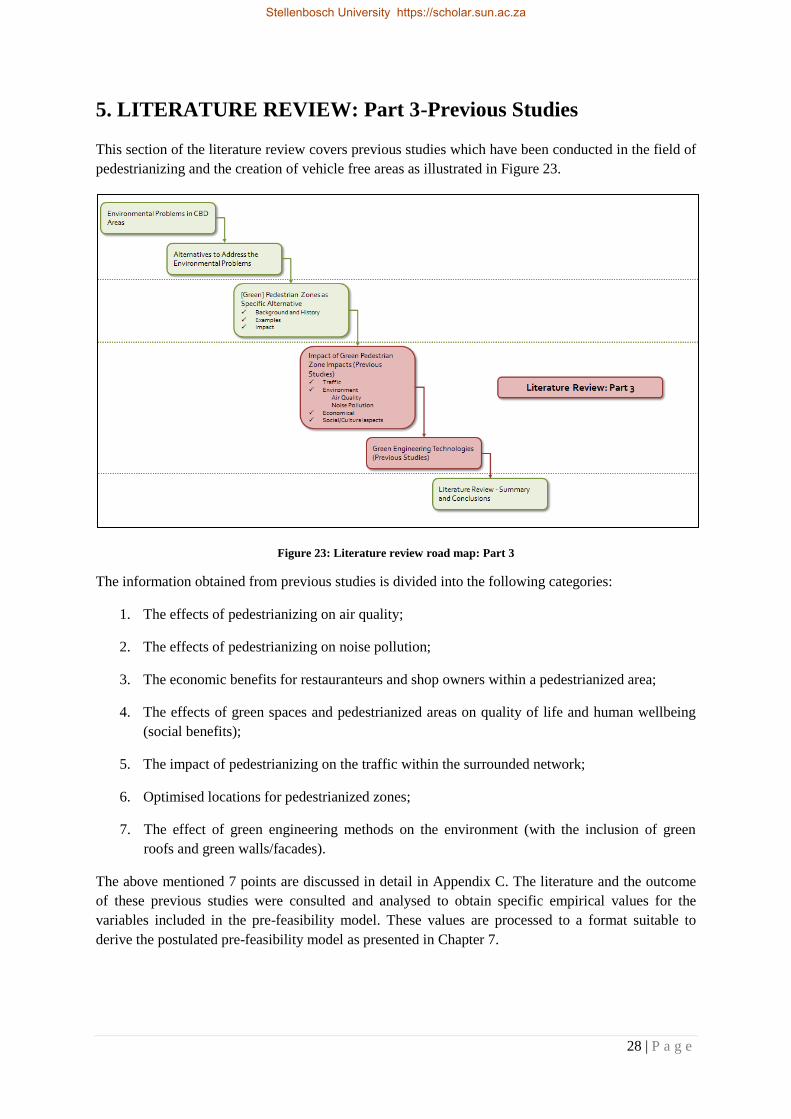
28 | P a g e
5. LITERATURE REVIEW: Part 3-Previous Studies
This section of the literature review covers previous studies which have been conducted in the field of
pedestrianizing and the creation of vehicle free areas as illustrated in Figure 23.
Figure 23: Literature review road map: Part 3
The information obtained from previous studies is divided into the following categories:
1. The effects of pedestrianizing on air quality;
2. The effects of pedestrianizing on noise pollution;
3. The economic benefits for restauranteurs and shop owners within a pedestrianized area;
4. The effects of green spaces and pedestrianized areas on quality of life and human wellbeing
(social benefits);
5. The impact of pedestrianizing on the traffic within the surrounded network;
6. Optimised locations for pedestrianized zones;
7. The effect of green engineering methods on the environment (with the inclusion of green
roofs and green walls/facades).
The above mentioned 7 points are discussed in detail in Appendix C. The literature and the outcome
of these previous studies were consulted and analysed to obtain specific empirical values for the
variables included in the pre-feasibility model. These values are processed to a format suitable to
derive the postulated pre-feasibility model as presented in Chapter 7.
Stellenbosch University https://scholar.sun.ac.za

29 | P a g e
6. LITERATURE REVIEW: Part 4-Summary and Conclusions
This is the final chapter of the literature review as illustrated in Figure 24. In this chapter the main
conclusions drawn from the literature review are summarized.
Figure 24: Literature review road map-Part 4
The conclusion that can be drawn from the first two parts of the literature review is that environmental
problems do exist. There are however many methods to mitigate and reduce some of the problems.
South Africa is no exception and should also implement strategies on how to address environmental
problems. Some of the major environmental problems currently of concern include air pollution,
urbanization and climate change. A possible solution to these problems can be the implementation of
pedestrian areas in city centres.
In the third part of the literature review successful pedestrian zones have been researched. The results
obtained from the previous studies will be analysed to create the proposed pre-feasibility model. The
main conclusions drawn from the previous studies, as discussed in Chapter 5 and Appendix C, are
summarized in Table 2. From the previous studies the following main reasons for pedestrianization
were identified:
1. Environmental degradation in terms of poor air quality, noise pollution and health scares
associated with air pollution;
2. Old architecture degradation due to air pollution;
3. Residents living in some of the areas were confronted with high levels of traffic passing
through their living area;
4. Pedestrian and vehicle collisions;
5. High levels of congestion;
6. Traffic negatively impacting areas with high pedestrian, tourist or student activity;
7. Poor quality of life for residents in dense and traffic prone areas.
Stellenbosch University https://scholar.sun.ac.za

30 | P a g e
Table 2: Summary of previous studies
It is important to evaluate the environmental impacts of pedestrianization and traffic management
schemes by comparing the circumstances of the scheme “before” and “after” implementation
(Brebbia, 2000). There is however a limited number of studies that provide “before” and “after”
values.
Finding Example Cities Sources
Pedestrianization of an area improves the environment
-Reduction in levels of air pollutants was noticed after the
implementation of pedestrian schemes
Chester
Nuremburg
Oxford
Cambridge
Istanbul
Katerini
Rhodes
(Wallztrom, 2004);
(Brebbia, 2000);
(Üzümoğlu et al., 2015);
(Chiquetto, 1997)
Pedestrianization reduces noise pollution
Durham
Leeds
Chester
(Chiquetto, 1997)
Pedestrianization has a positive effect on the retail within
the pedestrianized area
-Increase in turnover recorded
Cambridge
Istanbul
Seville
Kajaani
(Wallztrom, 2004);
(Üzümoğlu et al., 2015);
(Castillo-Manzano et al.,
2014)
Pedestrianization led to an increase in the use of public
transport
Wolverhampton
Oxford
Ghent
(Wallztrom, 2004);
Pedestrianization holds social benefits
-Increase in the perception of the environment, feeling of
safety and overall feeling of area recorded
Cambridge
Kajaani
Ghent
Seoul
Seville
(Wallztrom, 2004);
(Castillo-Manzano et al.,
2014);
(Soni & Soni, 2016)
Pedestrianization does not have severe effects on the
traffic of the surrounding network
-Traffic evaporation has been experienced in certain cities
Chester
Rhodes
Katerini
Nuremburg
Cambridge
Oxford
(Chiquetto, 1997);
(Brebbia, 2000);
(Wallztrom, 2004);
Effect of green roofs and facades
-Reduction in noise pollution
-Absorption of air pollutants
Chicago
Toronto
Hong Kong
(Yang et al., 2008);
(Currie & Bass, 2008);
(Li et al., 2010)
Stellenbosch University https://scholar.sun.ac.za
31 | P a g e
7. CONSTRUCTION OF PRE-FEASIBILITY MODEL
In this chapter the construction of the pre-feasibility model is presented. The aim is to develop a pre-
feasibility model that will enable decision makers to determine whether an identified area will suffice
as a pedestrian area.
The pre-feasibility model is compiled in two parts. The first part is a suggested checklist to determine
the feasibility of the identified location for a planned pedestrian zone. The concept of mathematical
modelling is used to construct the second part. The second part will further aid in determining the
possible benefits that can be expected from the planned pedestrian zone. The factors affected by the
installation of a green pedestrian zone addressed in this study include:
1. Location of green pedestrian zone Part 1: Suggested Checklist
2. Air quality
3. Economic Impacts
4. Social Impacts Part 2: Mathematical Model
5. Traffic Impacts
7.1 Pre-Feasibility Model Part 1: Location Determination
In this section the development of the first part of the pre-feasibility model is discussed. This includes
the main reasons for creating a pedestrian zone and the location characteristics associated with a
successful pedestrian zone.
7.1.1 Location Characteristics of Successful Pedestrian Zones
Previous studies have been consulted in determining the abovementioned characteristics. It is found
that pedestrian zones are ideally placed in areas where constrained pedestrian space is available and
driving in this specific area is associated with an unpleasant experience. These areas are typically
within a shopping district and where both vehicle volumes and pedestrian volumes are high. The
location of a pedestrian zone will typically be in a busy city or town centre. Table 3 provides a
summary of eleven existing pedestrian zones and the location characteristics associated with each.
Stellenbosch University https://scholar.sun.ac.za

32 | P a g e
Table 3: Location characteristics associated with pedestrian zones
Pedestrian Zone Location Characteristics Source
Pedestrianization of
Times Square in New
York City
Overcrowded sidewalks
Plentiful on-street retailers, vendors and cafés present
High level of accidents involving pedestrians
(Design Trust for Public
Space, 2018)
Pedestrianization in
Chester and
Nuremburg
Located in central streets of historic town
Location was prone to congestion before pedestrianization
(Chiquetto, 1997)
(Wallztrom, 2004)
Pedestrianization in
Kajaani and
Wolverhampton
Located in central main streets and main squares of historic
town
Congested prior to pedestrianization
(Wallztrom, 2004)
Pedestrianization in
Oxford
Located in High Street, one of the main shopping streets (Wallztrom, 2004)
Pedestrianization in
Cambridge
Located in central streets of historic town
Located where high volumes of students and tourists were
present
Located in old and narrow streets
(Wallztrom, 2004)
Pedestrianization of
Historic Peninsula of
Istanbul
Located in central commercial area
Dense residential area
High volume of tourists
Removed bus routes through pedestrianized area
(Üzümoğlu et al., 2015)
Pedestrianization in
Katerini
Located in central commercial area
Dense residential area
High traffic volumes prior to pedestrianization
(Brebbia, 2000)
Pedestrianization in
Rhodes
Located in central commercial area
High tourist volumes
(Brebbia, 2000)
Pedestrianization in
Seville
Located in central commercial area
High volume of pedestrians
Congested prior to pedestrianization
Very noisy before pedestrianization
(Castillo-Manzano et al.,
2014)
In Table 4 these characteristics are analysed according to the frequency of the location characteristic
being present. It can be assumed that the higher the occurrence of this characteristic, the higher the
importance of this characteristic is for the success of a pedestrian zone.
Stellenbosch University https://scholar.sun.ac.za

33 | P a g e
Table 4: Location characteristics ranked according to occurrence
Location Characteristic % occurrence
Located in central streets of historic town 11/11 = 100%
Congested prior to pedestrianization 6/11 = 54.5%
Overcrowded sidewalks / high pedestrian levels 5/11 = 45.5%
Dense residential area 2/11 = 18.2%
High level of accidents involving pedestrians 1/11 = 9%
Located in old and narrow streets 1/11 = 9%
Removed bus routes through pedestrianized area 1/11 = 9%
Very noisy before pedestrianization 1/11 = 9%
A study in Lithuanian cities was conducted to determine the criteria for a successful pedestrian zone
from the view of the users of the area. The main objectives of creating a pedestrian zone are to
separate pedestrians from vehicles and to provide a safe and comfortable environment within a city
centre. Overall, the research suggests that social, economic and environmental criteria should be met
in order to guarantee the vitality of a pedestrian zone and to improve the quality of life for residents.
The results were obtained by surveying 100 inhabitants of three cities, namely Vilnius, Kaunas and
Klaipeda. The surveyed inhabitants were provided with a list of criteria which they were to rate from
most important to least important. The results are presented in Table 5 (Dičiunaite-Rauktiene et al.,
2018). The criteria are grouped as environmental, social or economic criteria. The criterion ranked as
number 1 is considered the most important and number 20 the least important.
Stellenbosch University https://scholar.sun.ac.za

34 | P a g e
Table 5: Survey results for the characteristics of pedestrian zones
Criteria
Category
Criteria Description and Rank S
oci
al C
rite
ria
1-Accessible parking (in terms of distance)
2-Residential area: apartments, hotels and homes
3-Comfortable and safe space for pedestrians
6-Accessibility via public transport
9-Safety and low crime rates
10-Night-time street lighting
11-Comfortable and safe space for cyclists
12-Cultural space: aesthetic appearance for the streets and buildings, architectural and cultural heritage
monuments and their preservation
13-Space adapted for relaxation and recreation
16-Promoting healthy lifestyle: space for cyclists, athletes and people who engage in other types of active
leisure
17-Developing communities: spaces for meetings and interaction
20-Entertainment: attractive space for entertainment, culture, art projects, city festivals, fairs and other
events.
En
vir
on
men
tal
Cri
teri
a
4-Air pollution: protection against road transport pollution
5-Noise protection against vehicle noise
7-Presence of trees and green zones
Eco
no
mic
Cri
teri
a
8-Tourism development
14-Incentives for small and medium businesses
15-Commerce and meeting visitors’ needs
18- Job creation
19-Customer friendly parking and parking prices
Stellenbosch University https://scholar.sun.ac.za

35 | P a g e
In previous studies, especially with the implementation of pedestrianization schemes in Katerini and
Rhodes in Greece, it was found that the following considerations should be included when planning a
pedestrianization scheme (Brebbia, 2000) (Hass-Klau, 1993a):
1. High pedestrian volumes will be accommodated in the central areas at an acceptable LOS;
2. The traffic conditions in the greater network;
3. Traffic signal installation at central junctions or the alterations of existing traffic signal timing
to accommodate the new traffic conditions;
4. The improved level of shop and store accessibility;
5. Access of service vehicles to the pedestrianized streets;
6. Improvement of the environment over the whole network;
7. Bus routes and changes to existing bus routes;
8. Increase in the amount of bus/public transport users due to the removal of private vehicles;
9. Environmentally friendly public transport alternatives such as minibuses;
10. The prevention of accidents due to pedestrianization;
11. The reduction of vehicle emissions in the greater area;
12. Vehicle delays at main congested junctions (reductions);
13. Reduction of vehicle energy consumption;
14. Improvement of aesthetics (no more parking and traffic intruding visuals);
15. Elimination of noise pollution caused by traffic;
16. On-street parking policy within the greater area and the construction of additional parking
stations near the city centre;
17. Changes in land use, including the increase in the rent of office space and retail;
18. Pedestrian schemes work best on routes that do not directly form part of the bus network;
19. Accessibility to public transport.
Another consideration is whether the proposed area for pedestrianization forms part of an open or
closed network. In an open network, community access for both pedestrians and cyclists are provided,
but enables through traffic. In open networks the probability of collisions between the users of
different transportation modes is more likely. In a closed network, through traffic is not promoted,
making closed networks ideal for residential areas. Closed networks are however not beneficial in
promoting the movement and connectivity of cyclists and pedestrians. Traffic is able to move in as
many directions as possible when in an open network. Closed networks however steer traffic onto a
limited number of higher order roads. Figure 25 illustrates the difference between open and closed
road networks (Everitt et al., 2008).
Figure 25: Open (left) versus Closed (right) networks (Everitt et al., 2008)
Stellenbosch University https://scholar.sun.ac.za
36 | P a g e
7.1.2 Pre-Feasibility Model Part 1: Suggested Checklist to Evaluate Location of Pedestrian Zone
By analysing the location characteristics from successful existing pedestrian zones, it was determined
that there are characteristics that remain constant. The characteristics stated in section 7.1.1 have been
used to create a suggested checklist to determine the location feasibility of a proposed pedestrian area.
This suggested checklist forms the first part of the pre-feasibility model. The characteristics from
existing pedestrian zones have been grouped into three parts accordingly:
Compulsory Characteristics: Include characteristics present in all of the existing pedestrian zones
analysed. Since these characteristics are constant throughout all of the pedestrian zones analysed it is
accepted that these characteristics play a vital role in the success of the pedestrian zone. It is therefore
recommended that when the suggested checklist is filled out that all of these characteristics should be
present for the proposed pedestrian area to be successful. Part 1 of the suggested checklist is thus
considered to be a case of “all-or-nothing”. All of the characteristics should be met. In the case where
not all of the aspects are met, there should be a very good motivation as to why the pedestrian zone
should still be considered.
Strongly Recommended Characteristics: Include characteristics that users of pedestrian areas deem
important. Users of pedestrian areas have identified these characteristics as important for them as
users to feel that the area is successful and to promote the use of these areas. The characteristics
included in this part are therefore aspects that should be met once the pedestrian zone is implemented.
When filling out part 2 of the suggested checklist it is suggested that most of these aspects should be
met.
Recommended Characteristics: Include characteristics that should be considered. These characteristics
are not solely based on evidence, but have been identified as important by some sources and can
contribute in the success of a pedestrian zone. It is therefore recommended that these characteristics
are met, but in the case where these characteristics are not met it will not necessarily impact the
success of the pedestrian zone negatively.
Table 6 provides the suggested checklist as Part 1 of the pre-feasibility model.
Stellenbosch University https://scholar.sun.ac.za
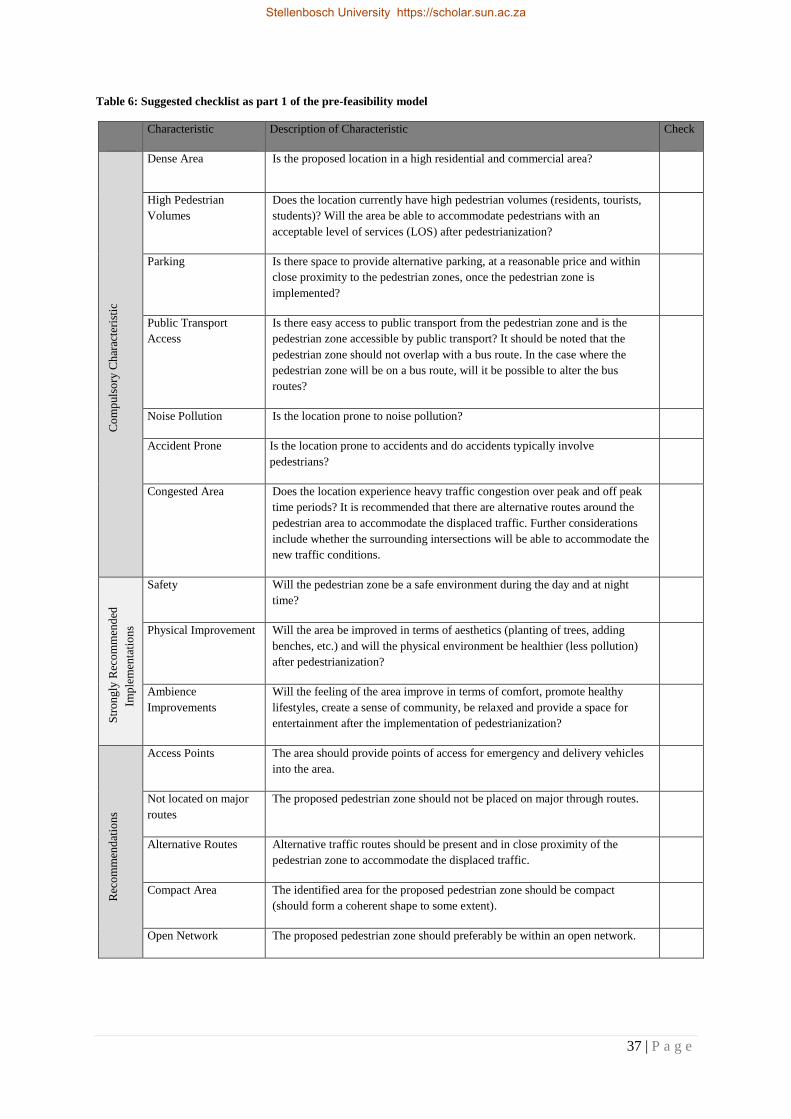
37 | P a g e
Table 6: Suggested checklist as part 1 of the pre-feasibility model
Characteristic Description of Characteristic Check
Co
mp
uls
ory
Ch
arac
teri
stic
Dense Area Is the proposed location in a high residential and commercial area?
High Pedestrian
Volumes
Does the location currently have high pedestrian volumes (residents, tourists,
students)? Will the area be able to accommodate pedestrians with an
acceptable level of services (LOS) after pedestrianization?
Parking Is there space to provide alternative parking, at a reasonable price and within
close proximity to the pedestrian zones, once the pedestrian zone is
implemented?
Public Transport
Access
Is there easy access to public transport from the pedestrian zone and is the
pedestrian zone accessible by public transport? It should be noted that the
pedestrian zone should not overlap with a bus route. In the case where the
pedestrian zone will be on a bus route, will it be possible to alter the bus
routes?
Noise Pollution Is the location prone to noise pollution?
Accident Prone Is the location prone to accidents and do accidents typically involve
pedestrians?
Congested Area Does the location experience heavy traffic congestion over peak and off peak
time periods? It is recommended that there are alternative routes around the
pedestrian area to accommodate the displaced traffic. Further considerations
include whether the surrounding intersections will be able to accommodate the
new traffic conditions.
Str
on
gly
Rec
om
men
ded
Imp
lem
enta
tio
ns
Safety Will the pedestrian zone be a safe environment during the day and at night
time?
Physical Improvement Will the area be improved in terms of aesthetics (planting of trees, adding
benches, etc.) and will the physical environment be healthier (less pollution)
after pedestrianization?
Ambience
Improvements
Will the feeling of the area improve in terms of comfort, promote healthy
lifestyles, create a sense of community, be relaxed and provide a space for
entertainment after the implementation of pedestrianization?
Rec
om
men
dat
ion
s
Access Points The area should provide points of access for emergency and delivery vehicles
into the area.
Not located on major
routes
The proposed pedestrian zone should not be placed on major through routes.
Alternative Routes Alternative traffic routes should be present and in close proximity of the
pedestrian zone to accommodate the displaced traffic.
Compact Area The identified area for the proposed pedestrian zone should be compact
(should form a coherent shape to some extent).
Open Network The proposed pedestrian zone should preferably be within an open network.
Stellenbosch University https://scholar.sun.ac.za
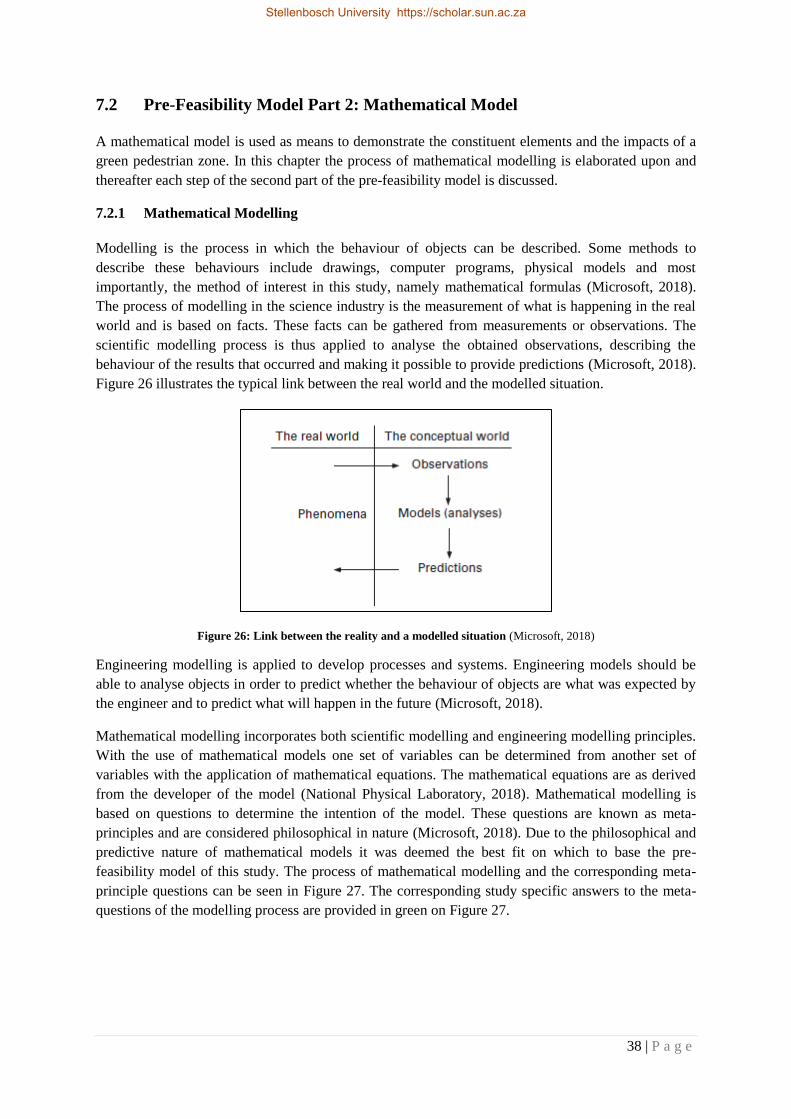
38 | P a g e
7.2 Pre-Feasibility Model Part 2: Mathematical Model
A mathematical model is used as means to demonstrate the constituent elements and the impacts of a
green pedestrian zone. In this chapter the process of mathematical modelling is elaborated upon and
thereafter each step of the second part of the pre-feasibility model is discussed.
7.2.1 Mathematical Modelling
Modelling is the process in which the behaviour of objects can be described. Some methods to
describe these behaviours include drawings, computer programs, physical models and most
importantly, the method of interest in this study, namely mathematical formulas (Microsoft, 2018).
The process of modelling in the science industry is the measurement of what is happening in the real
world and is based on facts. These facts can be gathered from measurements or observations. The
scientific modelling process is thus applied to analyse the obtained observations, describing the
behaviour of the results that occurred and making it possible to provide predictions (Microsoft, 2018).
Figure 26 illustrates the typical link between the real world and the modelled situation.
Figure 26: Link between the reality and a modelled situation (Microsoft, 2018)
Engineering modelling is applied to develop processes and systems. Engineering models should be
able to analyse objects in order to predict whether the behaviour of objects are what was expected by
the engineer and to predict what will happen in the future (Microsoft, 2018).
Mathematical modelling incorporates both scientific modelling and engineering modelling principles.
With the use of mathematical models one set of variables can be determined from another set of
variables with the application of mathematical equations. The mathematical equations are as derived
from the developer of the model (National Physical Laboratory, 2018). Mathematical modelling is
based on questions to determine the intention of the model. These questions are known as meta-
principles and are considered philosophical in nature (Microsoft, 2018). Due to the philosophical and
predictive nature of mathematical models it was deemed the best fit on which to base the pre-
feasibility model of this study. The process of mathematical modelling and the corresponding meta-
principle questions can be seen in Figure 27. The corresponding study specific answers to the meta-
questions of the modelling process are provided in green on Figure 27.
Stellenbosch University https://scholar.sun.ac.za
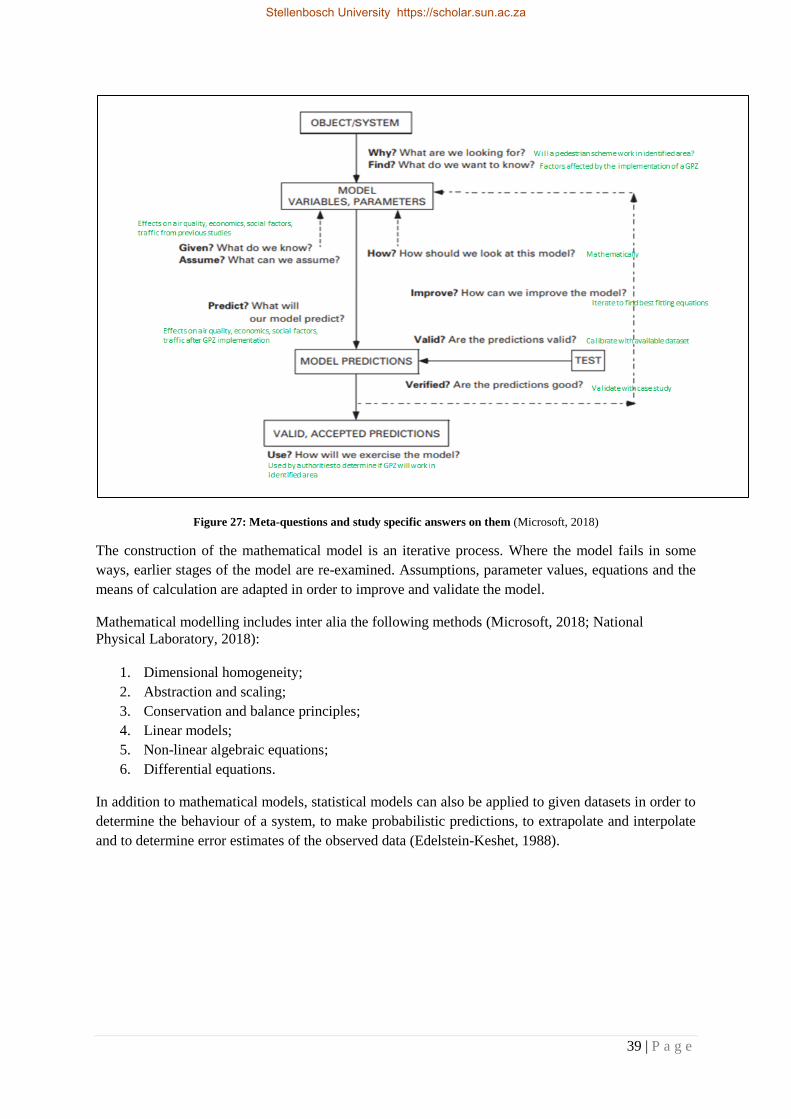
39 | P a g e
Figure 27: Meta-questions and study specific answers on them (Microsoft, 2018)
The construction of the mathematical model is an iterative process. Where the model fails in some
ways, earlier stages of the model are re-examined. Assumptions, parameter values, equations and the
means of calculation are adapted in order to improve and validate the model.
Mathematical modelling includes inter alia the following methods (Microsoft, 2018; National
Physical Laboratory, 2018):
1. Dimensional homogeneity;
2. Abstraction and scaling;
3. Conservation and balance principles;
4. Linear models;
5. Non-linear algebraic equations;
6. Differential equations.
In addition to mathematical models, statistical models can also be applied to given datasets in order to
determine the behaviour of a system, to make probabilistic predictions, to extrapolate and interpolate
and to determine error estimates of the observed data (Edelstein-Keshet, 1988).
Stellenbosch University https://scholar.sun.ac.za

40 | P a g e
The process of modelling involves the following (National Physical Laboratory, 2018):
1. Building of the model;
2. Determining the solutions of the mathematical equations;
3. Fitting the model to data;
4. Analysis of accuracy of model;
5. Optimising the model;
6. Evaluation of uncertainties;
7. Validation of model;
8. Development of software to apply model.
It is important to note that input information is not always exact and can have associated uncertainties.
The solutions obtained from the developed equations will therefore also have uncertainties which
should be taken into account when assessing the quality of the outputs (National Physical Laboratory,
2018).
In this study a combination of mathematical modelling and statistics will be used to develop equations from the given datasets.
7.2.2 Pre-Feasibility Model Development
Linear modelling is used to determine the effect of green pedestrian zones on air quality.
Mathematical statistics is used to determine the effect of pedestrian zones on the anticipated economic
and social benefits as well as the impact of pedestrian zones on the surrounding traffic network.
The user interface of Part 2 of the pre-feasibility model is presented in Table 7. Each factor affected
by the installation of a green pedestrian zone is modelled separately. The factors included are:
1. Air quality
2. Economic Impacts
3. Social Impacts Part 2: Mathematical Model
4. Traffic Impacts
Stellenbosch University https://scholar.sun.ac.za
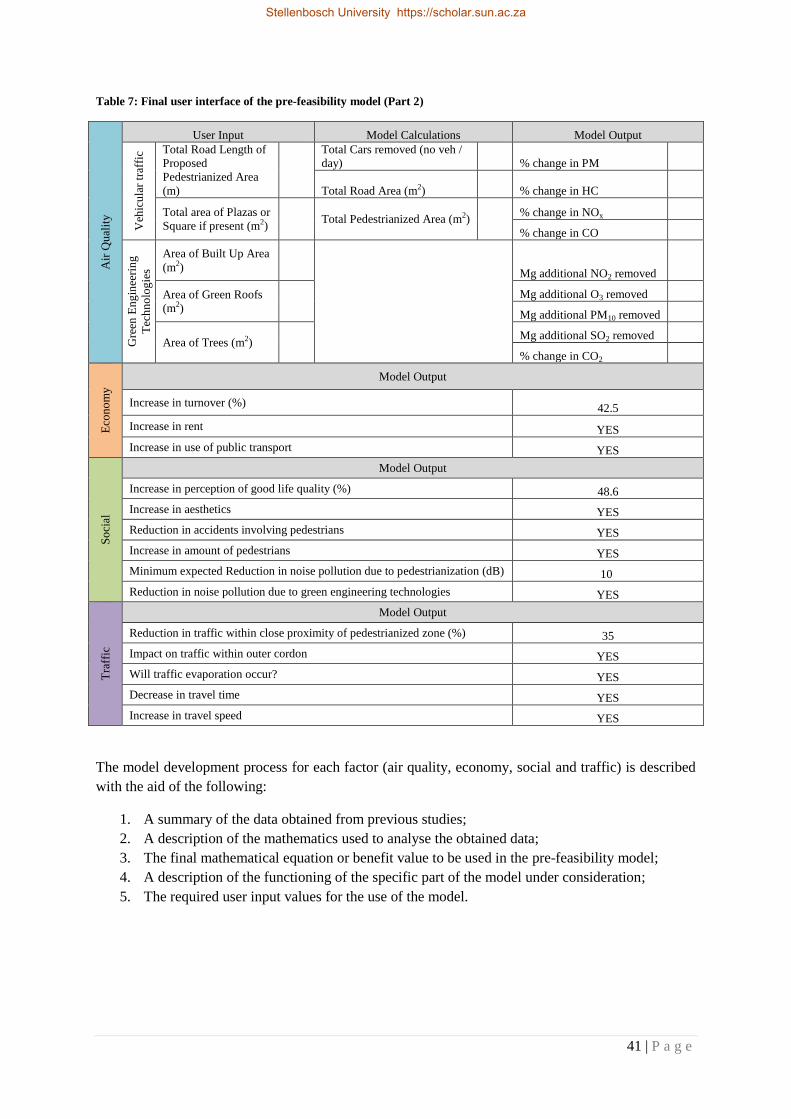
41 | P a g e
Table 7: Final user interface of the pre-feasibility model (Part 2) A
ir Q
ual
ity
User Input Model Calculations Model Output V
ehic
ula
r tr
affi
c Total Road Length of
Proposed
Pedestrianized Area
(m)
Total Cars removed (no veh /
day) % change in PM
Total Road Area (m2) % change in HC
Total area of Plazas or
Square if present (m2)
Total Pedestrianized Area (m2)
% change in NOx
% change in CO
Gre
en E
ng
inee
rin
g
Tec
hn
olo
gie
s
Area of Built Up Area
(m2)
Mg additional NO2 removed
Area of Green Roofs
(m2)
Mg additional O3 removed
Mg additional PM10 removed
Area of Trees (m2)
Mg additional SO2 removed
% change in CO2
Eco
no
my
Model Output
Increase in turnover (%) 42.5
Increase in rent YES
Increase in use of public transport YES
So
cial
Model Output
Increase in perception of good life quality (%) 48.6
Increase in aesthetics YES
Reduction in accidents involving pedestrians YES
Increase in amount of pedestrians YES
Minimum expected Reduction in noise pollution due to pedestrianization (dB) 10
Reduction in noise pollution due to green engineering technologies YES
Tra
ffic
Model Output
Reduction in traffic within close proximity of pedestrianized zone (%) 35
Impact on traffic within outer cordon YES
Will traffic evaporation occur? YES
Decrease in travel time YES
Increase in travel speed YES
The model development process for each factor (air quality, economy, social and traffic) is described
with the aid of the following:
1. A summary of the data obtained from previous studies;
2. A description of the mathematics used to analyse the obtained data;
3. The final mathematical equation or benefit value to be used in the pre-feasibility model;
4. A description of the functioning of the specific part of the model under consideration;
5. The required user input values for the use of the model.
Stellenbosch University https://scholar.sun.ac.za
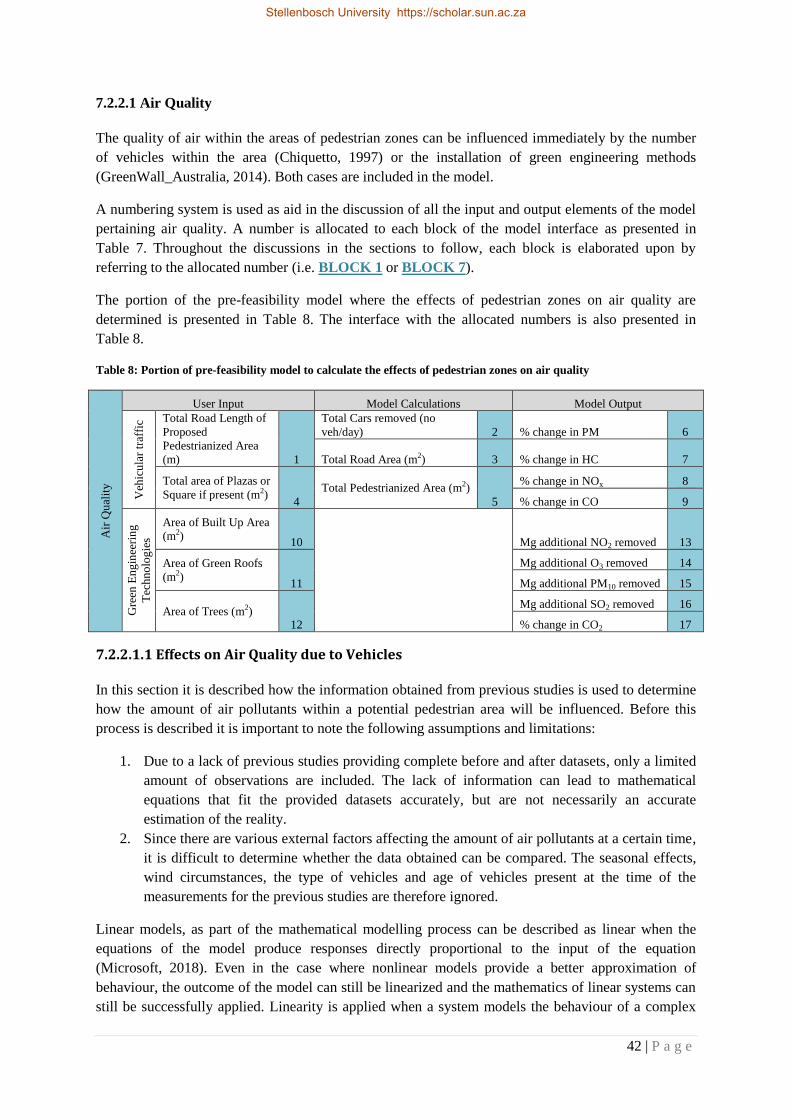
42 | P a g e
7.2.2.1 Air Quality
The quality of air within the areas of pedestrian zones can be influenced immediately by the number
of vehicles within the area (Chiquetto, 1997) or the installation of green engineering methods
(GreenWall_Australia, 2014). Both cases are included in the model.
A numbering system is used as aid in the discussion of all the input and output elements of the model
pertaining air quality. A number is allocated to each block of the model interface as presented in
Table 7. Throughout the discussions in the sections to follow, each block is elaborated upon by
referring to the allocated number (i.e. BLOCK 1 or BLOCK 7).
The portion of the pre-feasibility model where the effects of pedestrian zones on air quality are
determined is presented in Table 8. The interface with the allocated numbers is also presented in
Table 8.
Table 8: Portion of pre-feasibility model to calculate the effects of pedestrian zones on air quality
Air
Qu
alit
y
User Input Model Calculations Model Output
Veh
icu
lar
traf
fic Total Road Length of
Proposed
Pedestrianized Area
(m) 1
Total Cars removed (no
veh/day) 2 % change in PM 6
Total Road Area (m2) 3 % change in HC 7
Total area of Plazas or
Square if present (m2) 4
Total Pedestrianized Area (m2)
5
% change in NOx 8
% change in CO 9
Gre
en E
ng
inee
rin
g
Tec
hn
olo
gie
s
Area of Built Up Area
(m2) 10
Mg additional NO2 removed 13
Area of Green Roofs
(m2) 11
Mg additional O3 removed 14
Mg additional PM10 removed 15
Area of Trees (m2) 12
Mg additional SO2 removed 16
% change in CO2 17
7.2.2.1.1 Effects on Air Quality due to Vehicles
In this section it is described how the information obtained from previous studies is used to determine
how the amount of air pollutants within a potential pedestrian area will be influenced. Before this
process is described it is important to note the following assumptions and limitations:
1. Due to a lack of previous studies providing complete before and after datasets, only a limited
amount of observations are included. The lack of information can lead to mathematical
equations that fit the provided datasets accurately, but are not necessarily an accurate
estimation of the reality.
2. Since there are various external factors affecting the amount of air pollutants at a certain time,
it is difficult to determine whether the data obtained can be compared. The seasonal effects,
wind circumstances, the type of vehicles and age of vehicles present at the time of the
measurements for the previous studies are therefore ignored.
Linear models, as part of the mathematical modelling process can be described as linear when the
equations of the model produce responses directly proportional to the input of the equation
(Microsoft, 2018). Even in the case where nonlinear models provide a better approximation of
behaviour, the outcome of the model can still be linearized and the mathematics of linear systems can
still be successfully applied. Linearity is applied when a system models the behaviour of a complex
Stellenbosch University https://scholar.sun.ac.za

43 | P a g e
set of inputs. The response of a system is obtained by the sum of the individual inputs by superposing
the individual responses to the individual inputs. This is known as the principle of superposition and is
used by engineers to predict a response of a system with complicated inputs. The inputs into a system
is thus broken down into a set of simpler inputs (Microsoft, 2018).
The statistical concept of linear regression, more specifically multiple linear regression, will be
applied as a linear model to determine how the installation of a pedestrian zone will affect the amount
of different air pollutants released within the identified area.
Linear regression is a predictive analysis where a set of predictor variables are examined in order to
determine which of the predictor variables are significant predictors of a single outcome variable. The
predictor variables are known as the independent variables and the predicted variable is known as the
dependant variable. Regression therefore estimates the relationship between one dependant variable
and one or more independent variables. The principle uses of regression analysis are the following
(Microsoft, 2018):
1. Determining the strength of independent variables (predictors) on the dependent variable
(how much change occurs in the dependent variable with a change in the independent
variable);
2. Forecasting effects;
3. Determining and forecasting trends.
With the addition of independent variables to the linear regression model, the explained variance of
the model will increase. The variance is typically expressed as R2. An R
2 value of 1 indicates a perfect
fit where the independent variables accurately explain the variance in the dependent variable. An R2
value of 0 indicates no correlation between the independent and dependent variables. A good model
will typically provide R2 values between 0.3 and 0.8. Variance measures how far a set of numbers are
spread out from the mean value of the dataset (Statistics Solutions, 2013).
The simplest form of a regression equation is where there is only one dependent and one independent
variable, as can be seen in Equation 1 (Statistics Solutions, 2013):
𝒚 = 𝜷𝒐 + 𝜷𝒏. 𝒙 Equation 1: Linear regression
Where 𝑦 = estimated dependent variable
𝛽𝑜 = constant (function intercept)
𝛽𝑛 = regression coefficient
𝑥 = independent variable
Multiple linear regressions which will be used in this study include a few independent variables and a
single dependent variable. Multiple linear regression models are derived by using the results from
statistical regression analyses of the data obtained from previous studies. A multiple linear regression
model is in the form of Equation 2:
𝒚 = 𝜷𝒐 + 𝜷𝟏. 𝒙𝟏 + ⋯ + 𝜷𝒏. 𝒙𝒏 Equation 2: Multiple linear regression
Stellenbosch University https://scholar.sun.ac.za
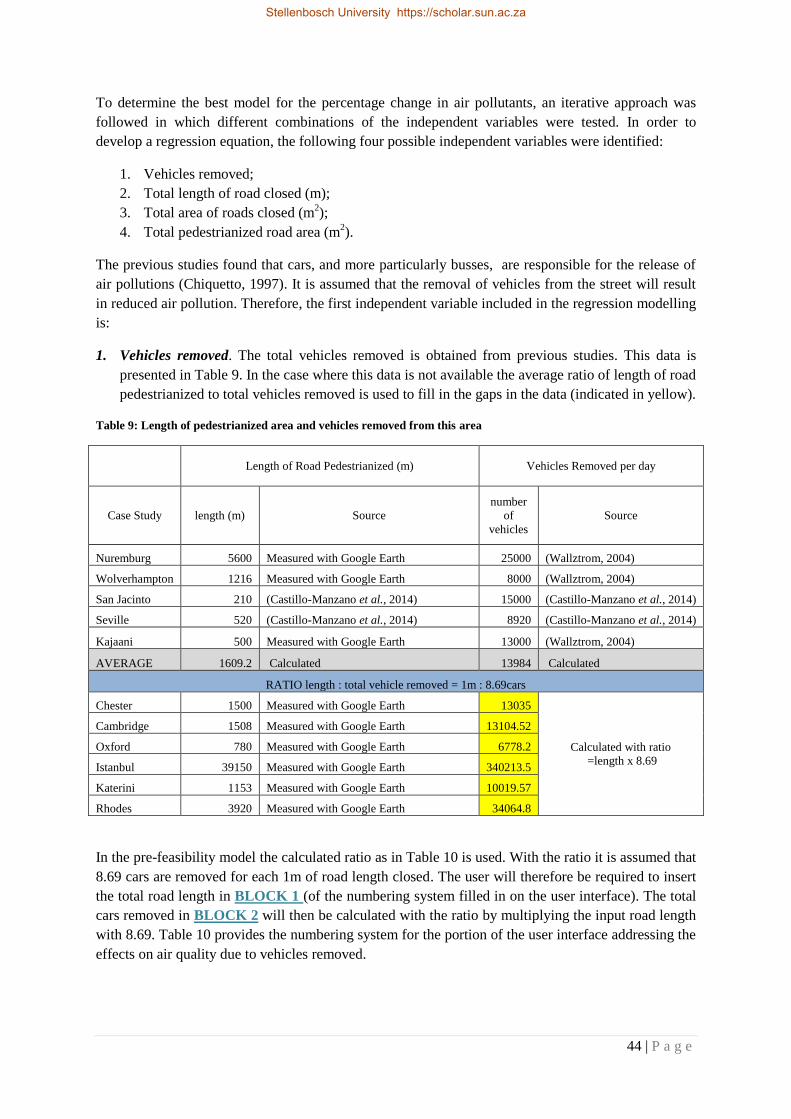
44 | P a g e
To determine the best model for the percentage change in air pollutants, an iterative approach was
followed in which different combinations of the independent variables were tested. In order to
develop a regression equation, the following four possible independent variables were identified:
1. Vehicles removed;
2. Total length of road closed (m);
3. Total area of roads closed (m2);
4. Total pedestrianized road area (m2).
The previous studies found that cars, and more particularly busses, are responsible for the release of
air pollutions (Chiquetto, 1997). It is assumed that the removal of vehicles from the street will result
in reduced air pollution. Therefore, the first independent variable included in the regression modelling
is:
1. Vehicles removed. The total vehicles removed is obtained from previous studies. This data is
presented in Table 9. In the case where this data is not available the average ratio of length of road
pedestrianized to total vehicles removed is used to fill in the gaps in the data (indicated in yellow).
Table 9: Length of pedestrianized area and vehicles removed from this area
Length of Road Pedestrianized (m) Vehicles Removed per day
Case Study length (m) Source
number
of
vehicles
Source
Nuremburg 5600 Measured with Google Earth 25000 (Wallztrom, 2004)
Wolverhampton 1216 Measured with Google Earth 8000 (Wallztrom, 2004)
San Jacinto 210 (Castillo-Manzano et al., 2014) 15000 (Castillo-Manzano et al., 2014)
Seville 520 (Castillo-Manzano et al., 2014) 8920 (Castillo-Manzano et al., 2014)
Kajaani 500 Measured with Google Earth 13000 (Wallztrom, 2004)
AVERAGE 1609.2 Calculated 13984 Calculated
RATIO length : total vehicle removed = 1m : 8.69cars
Chester 1500 Measured with Google Earth 13035
Calculated with ratio
=length x 8.69
Cambridge 1508 Measured with Google Earth 13104.52
Oxford 780 Measured with Google Earth 6778.2
Istanbul 39150 Measured with Google Earth 340213.5
Katerini 1153 Measured with Google Earth 10019.57
Rhodes 3920 Measured with Google Earth 34064.8
In the pre-feasibility model the calculated ratio as in Table 10 is used. With the ratio it is assumed that
8.69 cars are removed for each 1m of road length closed. The user will therefore be required to insert
the total road length in BLOCK 1 (of the numbering system filled in on the user interface). The total
cars removed in BLOCK 2 will then be calculated with the ratio by multiplying the input road length
with 8.69. Table 10 provides the numbering system for the portion of the user interface addressing the
effects on air quality due to vehicles removed.
Stellenbosch University https://scholar.sun.ac.za

45 | P a g e
Table 10: Numbering system for user interface (air quality due to vehicles removed) A
ir Q
ual
ity
User Input Model Calculations Model Output
Veh
icu
lar
traf
fic Total Road Length of
Proposed Pedestrianized
Area (m) 1
Total Cars removed (no veh /
day) 2
% change in PM
Total Road Area (m2) 3 % change in HC
Total area of Plazas or
Square if present (m2) 4
Total Pedestrianized Area (m2)
5
% change in NOx
% change in CO
It is assumed that with a larger area closed off for vehicular access, more vehicles will be removed
from the overall network, resulting in an anticipated further reduction in air pollution. Therefore, the
independent variables identified to model this second assumption are:
2. Total length of road closed (m), with the length of roads obtained from previous studies and
Google Earth measurements.
3. Total area of roads closed (m2), determined as road length times the road width. The road width
is assumed to be 3m due to the majority of the previous studies having narrow one-way streets in
the old town. This was determined as an average measurement between the different road widths
of the case studies included in the previous studies and Google Earth measurements. The model
calculation of BLOCK 3 is therefore equal to total road length multiplied by 3m.
4. and total pedestrianized road area (m2), determined as the sum of the area of plazas (as obtained
from previous studies and Google Earth measurements) and the total area of roads closed.
BLOCK 4 is therefore specified as an input value by the user in the case where there will be
additional areas such as plazas also pedestrianized and not only road segments. The total
pedestrianized area of BLOCK 5 will therefore be the sum of the total area of plazas (input
value) in BLOCK 4 and the calculated total road area of BLOCK 3.
The air pollutants included in this model are particulate matter (PM), nitrogen oxides (NOx),
hydrocarbons (HC) and carbon monoxide (CO). The dependent variable in the regression modelling
process is the amount of air pollution. Each air pollutant is modelled separately with the independent
variables as listed above. It is an iterative process to determine the best equation to fit the datasets for
the different air pollutants, where different combinations of independent variables are included to
ultimately determine the best fitting equation resulting in the most accurately calibrated model.
Stellenbosch University https://scholar.sun.ac.za
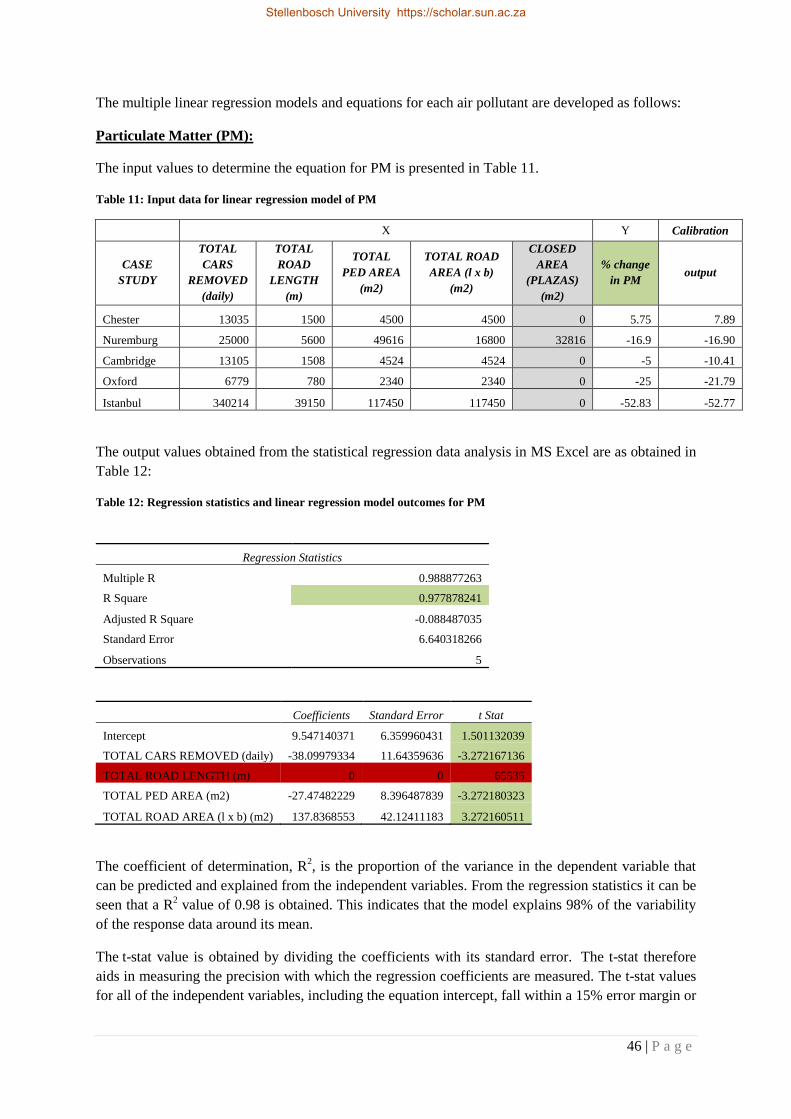
46 | P a g e
The multiple linear regression models and equations for each air pollutant are developed as follows:
Particulate Matter (PM):
The input values to determine the equation for PM is presented in Table 11.
Table 11: Input data for linear regression model of PM
X Y Calibration
CASE
STUDY
TOTAL
CARS
REMOVED
(daily)
TOTAL
ROAD
LENGTH
(m)
TOTAL
PED AREA
(m2)
TOTAL ROAD
AREA (l x b)
(m2)
CLOSED
AREA
(PLAZAS)
(m2)
% change
in PM output
Chester 13035 1500 4500 4500 0 5.75 7.89
Nuremburg 25000 5600 49616 16800 32816 -16.9 -16.90
Cambridge 13105 1508 4524 4524 0 -5 -10.41
Oxford 6779 780 2340 2340 0 -25 -21.79
Istanbul 340214 39150 117450 117450 0 -52.83 -52.77
The output values obtained from the statistical regression data analysis in MS Excel are as obtained in
Table 12:
Table 12: Regression statistics and linear regression model outcomes for PM
Regression Statistics
Multiple R 0.988877263
R Square 0.977878241
Adjusted R Square -0.088487035
Standard Error 6.640318266
Observations 5
Coefficients Standard Error t Stat
Intercept 9.547140371 6.359960431 1.501132039
TOTAL CARS REMOVED (daily) -38.09979334 11.64359636 -3.272167136
TOTAL ROAD LENGTH (m) 0 0 65535
TOTAL PED AREA (m2) -27.47482229 8.396487839 -3.272180323
TOTAL ROAD AREA (l x b) (m2) 137.8368553 42.12411183 3.272160511
The coefficient of determination, R2, is the proportion of the variance in the dependent variable that
can be predicted and explained from the independent variables. From the regression statistics it can be
seen that a R2 value of 0.98 is obtained. This indicates that the model explains 98% of the variability
of the response data around its mean.
The t-stat value is obtained by dividing the coefficients with its standard error. The t-stat therefore
aids in measuring the precision with which the regression coefficients are measured. The t-stat values
for all of the independent variables, including the equation intercept, fall within a 15% error margin or
Stellenbosch University https://scholar.sun.ac.za

47 | P a g e
confidence interval of 85% (t-stat values > 1.44). The absolute value of the t-stat values are taken
when compared to the confidence interval (z value) of the error margin.
Equation 3 is derived from this regression as follows:
% 𝑐ℎ𝑎𝑛𝑔𝑒 𝑖𝑛 𝑃𝑀
= 9.547 − 38.1(𝑡𝑜𝑡𝑎𝑙 𝑐𝑎𝑟𝑠 𝑟𝑒𝑚𝑜𝑣𝑒𝑑) + 0(𝑡𝑜𝑡𝑎𝑙 𝑟𝑜𝑎𝑑 𝑙𝑒𝑛𝑔𝑡ℎ)
− 27.47(𝑡𝑜𝑡𝑎𝑙 𝑝𝑒𝑑𝑒𝑠𝑡𝑟𝑖𝑎𝑛𝑖𝑧𝑒𝑑 𝑎𝑟𝑒𝑎) + 137.84(𝑡𝑜𝑡𝑎𝑙 𝑟𝑜𝑎𝑑 𝑎𝑟𝑒𝑎)
Equation 3: Percentage change in PM due to vehicle removal
The coefficients for the equation above are obtained from the regression model. This equation is
applied to the dataset in order to calibrate the model. The percentage change in PM, as determined
with the application of the derived equation, is presented in the output column of Table 11: Input data
for linear regression model of PMIt can be seen that the output values are of the same order as the
values obtained from previous studies, thus indicating that the derived equation is a good fit and
accurately represents the dataset. BLOCK 6 of the master pre-feasibility model will therefore be
equal to the developed linear regression equation.
Air
Qu
alit
y
User Input Model Calculations Model Output
Veh
icu
lar
traf
fic Total Road Length of
Proposed Pedestrianized
Area (m)
Total Cars removed (no veh /
day)
% change in PM 6
Total Road Area (m2) % change in HC
Total area of Plazas or
Square if present (m2)
Total Pedestrianized Area (m2)
% change in NOx
% change in CO
From the results it can however be seen that the independent variable of total road length produces a
coefficient equal to zero. This indicates that this variable does not have an influence on the dependent
variable of percentage change in PM. According to the correlation calculation done between the
independent variables, as presented in Table 13, it can however be seen that there is a strong
correlation between the other independent variables and the total road length, with correlation values
approximately equal to 1, indicating a strong linear relationship between the independent variables.
Table 13: Correlation between input variables of linear regression model
TOTAL CARS
REMOVED (daily)
TOTAL ROAD
LENGTH (m)
TOTAL PED
AREA (m2)
TOTAL ROAD AREA (l
x b) (m2)
TOTAL CARS
REMOVED (daily) 1 0.997413661 0.933095608 0.997413661
TOTAL ROAD
LENGTH (m) 0.997413661 1 0.956530531 1
TOTAL PED AREA
(m2) 0.933095608 0.956530531 1 0.956530531
TOTAL ROAD AREA
(l x b) (m2) 0.997413661 1 0.956530531 1
A second regression was conducted where the total road length as independent variable was removed.
The regression statistics for this model estimation is provided in Table 14. It can be concluded that the
obtained R2 value of 0.74, for this model is deemed acceptable. The t-stat values however indicate an
error margin of larger than 30%, which is unacceptable. The independent variables do therefore not
accurately explain the variation in the dependent variable. Furthermore, it is also noted that the
coefficients obtained for the regression equation is very small, again indicating that the independent
Stellenbosch University https://scholar.sun.ac.za

48 | P a g e
variables do not have a significant impact on the dependent variable. The independent variable total
cars removed produce a coefficient equal to zero. This can be attributed to the removal of the
independent variable total road length from this regression.
Table 14: Regression statistics and linear regression model outcomes for PM, second iteration
Regression Statistics
Multiple R 0.860825074
R Square 0.741019809
Adjusted R Square 0.482039618
Standard Error 16.06561462
Observations 5
Coefficients Standard Error t Stat
Intercept -6.717819283 9.599067563 -0.699840817
TOTAL CARS REMOVED (daily) 0 0 65535
TOTAL PED AREA (m2) -0.000166354 0.000448187 -0.371169659
TOTAL ROAD AREA (l x b) (m2) -2.57104E-05 5.10586E-05 -0.503545974
From the two regression models tested to determine the percentage change in PM it can be concluded
that the first model is the more accurate model and will therefore be used in the pre-feasibility model.
Hydrocarbons (HC):
The input values to determine the equation for Hydrocarbons (HC) is presented in Table 15.
Table 15: Input data for linear regression model of HC
X Y Calibration
CASE
STUDY
TOTAL
CARS
REMOVED
(daily)
TOTAL
PED
AREA
(m2)
TOTAL
ROAD
LENGTH
(m)
TOTAL
ROAD
AREA (l x
b) (m2)
CLOSED
AREA
(PLAZAS)
(m2)
% change in
HC output
Chester 13035 4500 1500 4500 0 -6 -6.00
Katerini 10020 3459 1153 3459 0 -25 -25.00
Rhodes 34065 11760 3920 11760 0 -32.3 -32.30
A requirement in conducting a linear regression is for the total of independent variables included in
the regression model to be equal to one less than the total observations. Therefore, only the total cars
removed and the total pedestrianized area were used as independent variables for the case of HC. The
output values obtained from the statistical regression data analysis in MS Excel are as presented in
Table 16.
Stellenbosch University https://scholar.sun.ac.za
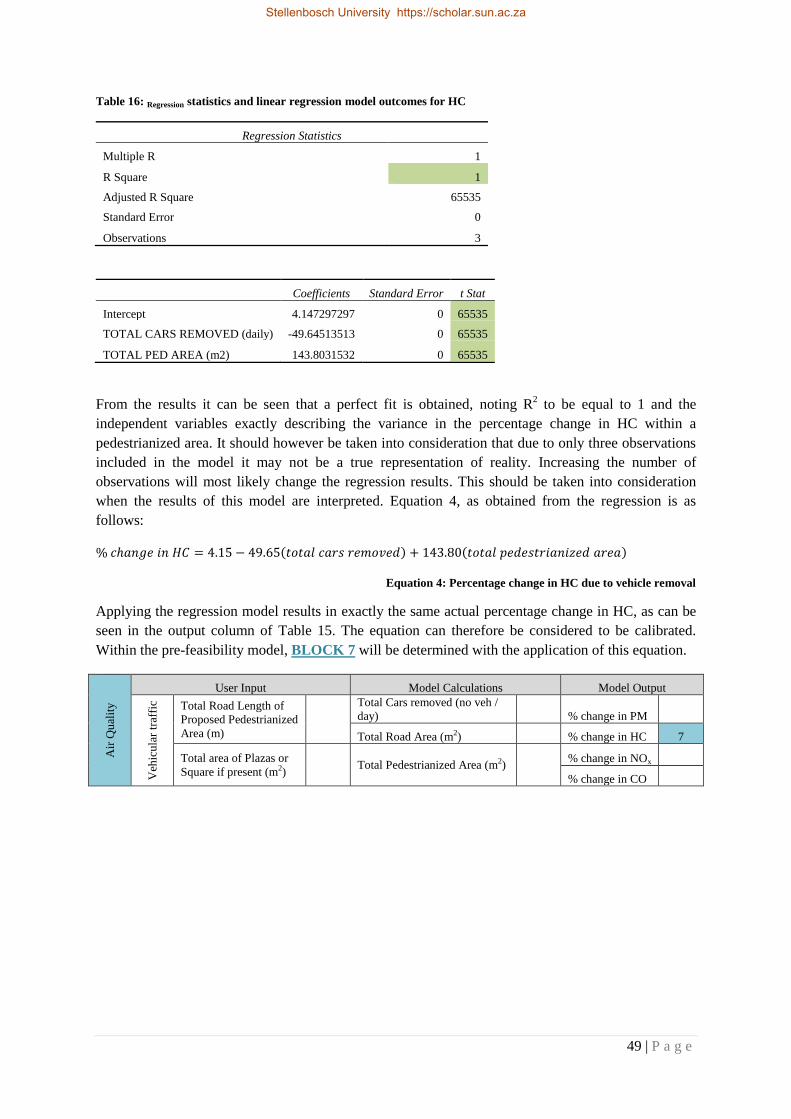
49 | P a g e
Table 16: Regression statistics and linear regression model outcomes for HC
Regression Statistics
Multiple R 1
R Square 1
Adjusted R Square 65535
Standard Error 0
Observations 3
Coefficients Standard Error t Stat
Intercept 4.147297297 0 65535
TOTAL CARS REMOVED (daily) -49.64513513 0 65535
TOTAL PED AREA (m2) 143.8031532 0 65535
From the results it can be seen that a perfect fit is obtained, noting R2 to be equal to 1 and the
independent variables exactly describing the variance in the percentage change in HC within a
pedestrianized area. It should however be taken into consideration that due to only three observations
included in the model it may not be a true representation of reality. Increasing the number of
observations will most likely change the regression results. This should be taken into consideration
when the results of this model are interpreted. Equation 4, as obtained from the regression is as
follows:
% 𝑐ℎ𝑎𝑛𝑔𝑒 𝑖𝑛 𝐻𝐶 = 4.15 − 49.65(𝑡𝑜𝑡𝑎𝑙 𝑐𝑎𝑟𝑠 𝑟𝑒𝑚𝑜𝑣𝑒𝑑) + 143.80(𝑡𝑜𝑡𝑎𝑙 𝑝𝑒𝑑𝑒𝑠𝑡𝑟𝑖𝑎𝑛𝑖𝑧𝑒𝑑 𝑎𝑟𝑒𝑎)
Equation 4: Percentage change in HC due to vehicle removal
Applying the regression model results in exactly the same actual percentage change in HC, as can be
seen in the output column of Table 15. The equation can therefore be considered to be calibrated.
Within the pre-feasibility model, BLOCK 7 will be determined with the application of this equation.
Air
Qu
alit
y
User Input Model Calculations Model Output
Veh
icu
lar
traf
fic Total Road Length of
Proposed Pedestrianized
Area (m)
Total Cars removed (no veh /
day)
% change in PM
Total Road Area (m2) % change in HC 7
Total area of Plazas or
Square if present (m2)
Total Pedestrianized Area (m2)
% change in NOx
% change in CO
Stellenbosch University https://scholar.sun.ac.za

50 | P a g e
Nitrogen Oxides NOx:
The input values to determine the equation for Nitrogen Oxides (NOx) are presented in Table 17.
Table 17: Input data for linear regression model of NOx
As previously stated, a requirement in conducting a linear regression is for the total of independent
variables included in the regression model to be equal to one less than the total observations.
Therefore, only the total cars removed, the total road length and the total pedestrianized area were
used as independent variables for the case of NOx. The output values obtained from the statistical
regression data analysis in MS Excel are presented in Table 18.
Table 18: Regression statistics and linear regression model outcomes for NOx
Regression Statistics
Multiple R 1
R Square 1
Adjusted R Square 65535
Standard Error 0
Observations 4
Coefficients Standard Error t Stat
Intercept 16.38243243 0 65535
TOTAL CARS REMOVED (daily) -89.31504504 0 65535
TOTAL ROAD LENGTH (m) 969.3538086 0 65535
TOTAL PED AREA (m2) -64.40577403 0 65535
Similar to the results obtained for HC, a perfect fit is obtained for the case of NOx. This can be noted
from R2 being equal to 1, again indicating that the independent variables to be exactly describing the
variance in the percentage change in NOx within a pedestrianized area. It should however be taken
into consideration that due to only three observations included in the model it may not be a true
representation of reality and additional observations will most likely change the regression results.
This should be considered when the results of this model are interpreted.
X Y Calibration
Case Study
TOTAL
CARS
REMOVE
D (daily)
TOTAL
ROAD
LENGTH
(m)
TOTAL
PED
AREA
(m2)
TOTAL
ROAD
AREA (l x
b) (m2)
CLOSED
AREA
(PLAZAS)
(m2)
%
change
in NOx
output
Chester 13035 1500 4500 4500 0 -0.5 -0.50
Nuremburg 25000 5600 49616 16800 32816 -35.3 -35.30
Katerini 10020 1153 3459 3459 0 -35 -35.00
Rhodes 34065 3920 11760 11760 0 -45.6 -45.60
Stellenbosch University https://scholar.sun.ac.za

51 | P a g e
Equation 5 obtained from the regression is as follows:
% 𝑐ℎ𝑎𝑛𝑔𝑒 𝑖𝑛 𝑁𝑂𝑥
= 16.38 − 89.32(𝑡𝑜𝑡𝑎𝑙 𝑐𝑎𝑟𝑠 𝑟𝑒𝑚𝑜𝑣𝑒𝑑) + 969.35(𝑡𝑜𝑡𝑎𝑙 𝑟𝑜𝑎𝑑 𝑙𝑒𝑛𝑔𝑡ℎ)
− 64.41(𝑡𝑜𝑡𝑎𝑙 𝑝𝑒𝑑𝑒𝑠𝑡𝑟𝑖𝑎𝑛𝑖𝑧𝑒𝑑 𝑎𝑟𝑒𝑎)
Equation 5: Percentage change in NOx due to vehicle removal
The output obtained from the regression equation as applied for NOx, is exactly the same as obtained
from previous studies and therefore the model is regarded as calibrated as seen in Table 17. Equation
5 is used in Part 2 of the pre-feasibility model to calculate the value of BLOCK 8.
Air
Qu
alit
y
User Input Model Calculations Model Output
Veh
icu
lar
traf
fic Total Road Length of
Proposed Pedestrianized
Area (m)
Total Cars removed (no veh /
day)
% change in PM
Total Road Area (m2) % change in HC
Total area of Plazas or
Square if present (m2)
Total Pedestrianized Area (m2)
% change in NOx 8
% change in CO
Carbon Monoxide (CO):
The last air pollutant included in the study is Carbon Monoxide (CO). The available data on CO as
obtained from previous studies is presented in Table 19:
Table 19: Input data for linear regression model of CO
X Y Calibration
Case Study
TOTAL
CARS
REMOVE
D (daily)
TOTAL
ROAD
LENGTH
(m)
TOTAL PED
AREA (m2)
TOTAL
ROAD
AREA (l x
b) (m2)
CLOSE
D AREA
(PLAZA
S) (m2)
% change
in CO output
Chester 13035 1500 4500 4500 0 -6.5 1.51
Nuremburg 25000 5600 49616 16800 32816 -12.4 -12.40
Oxford 6779 780 2340 2340 0 -75 -65.52
Katerini 10020 1153 3459 3459 0 -17.2 -34.96
Rhodes 34065 3920 11760 11760 0 -43.8 -43.53
Stellenbosch University https://scholar.sun.ac.za
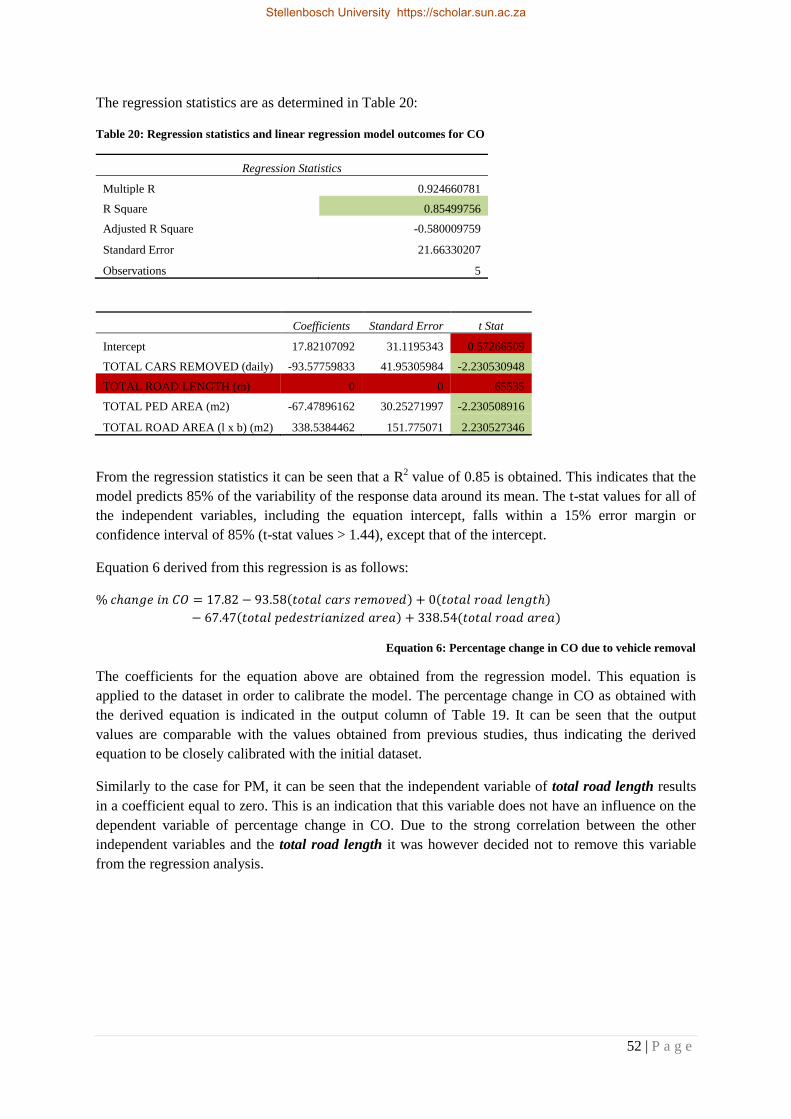
52 | P a g e
The regression statistics are as determined in Table 20:
Table 20: Regression statistics and linear regression model outcomes for CO
Regression Statistics
Multiple R 0.924660781
R Square 0.85499756
Adjusted R Square -0.580009759
Standard Error 21.66330207
Observations 5
Coefficients Standard Error t Stat
Intercept 17.82107092 31.1195343 0.57266509
TOTAL CARS REMOVED (daily) -93.57759833 41.95305984 -2.230530948
TOTAL ROAD LENGTH (m) 0 0 65535
TOTAL PED AREA (m2) -67.47896162 30.25271997 -2.230508916
TOTAL ROAD AREA (l x b) (m2) 338.5384462 151.775071 2.230527346
From the regression statistics it can be seen that a R2 value of 0.85 is obtained. This indicates that the
model predicts 85% of the variability of the response data around its mean. The t-stat values for all of
the independent variables, including the equation intercept, falls within a 15% error margin or
confidence interval of 85% (t-stat values > 1.44), except that of the intercept.
Equation 6 derived from this regression is as follows:
% 𝑐ℎ𝑎𝑛𝑔𝑒 𝑖𝑛 𝐶𝑂 = 17.82 − 93.58(𝑡𝑜𝑡𝑎𝑙 𝑐𝑎𝑟𝑠 𝑟𝑒𝑚𝑜𝑣𝑒𝑑) + 0(𝑡𝑜𝑡𝑎𝑙 𝑟𝑜𝑎𝑑 𝑙𝑒𝑛𝑔𝑡ℎ)
− 67.47(𝑡𝑜𝑡𝑎𝑙 𝑝𝑒𝑑𝑒𝑠𝑡𝑟𝑖𝑎𝑛𝑖𝑧𝑒𝑑 𝑎𝑟𝑒𝑎) + 338.54(𝑡𝑜𝑡𝑎𝑙 𝑟𝑜𝑎𝑑 𝑎𝑟𝑒𝑎)
Equation 6: Percentage change in CO due to vehicle removal
The coefficients for the equation above are obtained from the regression model. This equation is
applied to the dataset in order to calibrate the model. The percentage change in CO as obtained with
the derived equation is indicated in the output column of Table 19. It can be seen that the output
values are comparable with the values obtained from previous studies, thus indicating the derived
equation to be closely calibrated with the initial dataset.
Similarly to the case for PM, it can be seen that the independent variable of total road length results
in a coefficient equal to zero. This is an indication that this variable does not have an influence on the
dependent variable of percentage change in CO. Due to the strong correlation between the other
independent variables and the total road length it was however decided not to remove this variable
from the regression analysis.
Stellenbosch University https://scholar.sun.ac.za
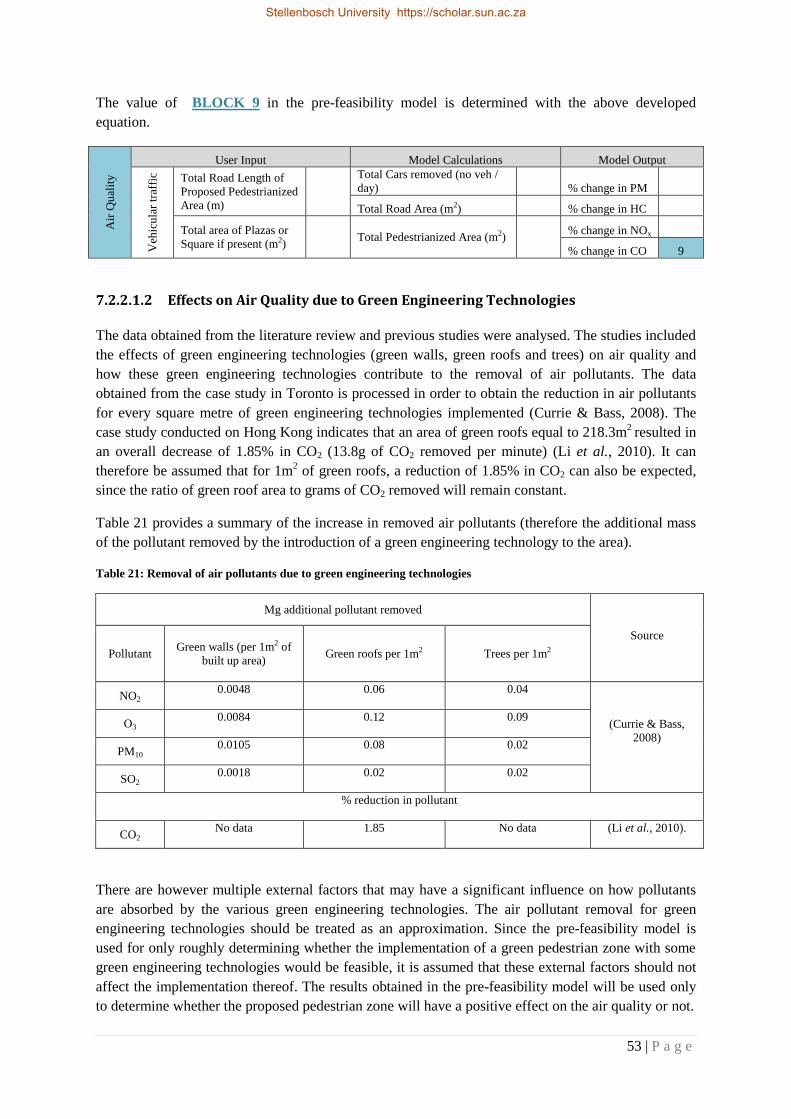
53 | P a g e
The value of BLOCK 9 in the pre-feasibility model is determined with the above developed
equation. A
ir Q
ual
ity
User Input Model Calculations Model Output V
ehic
ula
r tr
affi
c Total Road Length of
Proposed Pedestrianized
Area (m)
Total Cars removed (no veh /
day)
% change in PM
Total Road Area (m2) % change in HC
Total area of Plazas or
Square if present (m2)
Total Pedestrianized Area (m2)
% change in NOx
% change in CO 9
7.2.2.1.2 Effects on Air Quality due to Green Engineering Technologies
The data obtained from the literature review and previous studies were analysed. The studies included
the effects of green engineering technologies (green walls, green roofs and trees) on air quality and
how these green engineering technologies contribute to the removal of air pollutants. The data
obtained from the case study in Toronto is processed in order to obtain the reduction in air pollutants
for every square metre of green engineering technologies implemented (Currie & Bass, 2008). The
case study conducted on Hong Kong indicates that an area of green roofs equal to 218.3m2 resulted in
an overall decrease of 1.85% in CO2 (13.8g of CO2 removed per minute) (Li et al., 2010). It can
therefore be assumed that for 1m2 of green roofs, a reduction of 1.85% in CO2 can also be expected,
since the ratio of green roof area to grams of CO2 removed will remain constant.
Table 21 provides a summary of the increase in removed air pollutants (therefore the additional mass
of the pollutant removed by the introduction of a green engineering technology to the area).
Table 21: Removal of air pollutants due to green engineering technologies
Mg additional pollutant removed
Source
Pollutant Green walls (per 1m2 of
built up area) Green roofs per 1m2 Trees per 1m2
NO2 0.0048 0.06 0.04
(Currie & Bass,
2008)
O3 0.0084 0.12 0.09
PM10 0.0105 0.08 0.02
SO2 0.0018 0.02 0.02
% reduction in pollutant
CO2 No data 1.85 No data (Li et al., 2010).
There are however multiple external factors that may have a significant influence on how pollutants
are absorbed by the various green engineering technologies. The air pollutant removal for green
engineering technologies should be treated as an approximation. Since the pre-feasibility model is
used for only roughly determining whether the implementation of a green pedestrian zone with some
green engineering technologies would be feasible, it is assumed that these external factors should not
affect the implementation thereof. The results obtained in the pre-feasibility model will be used only
to determine whether the proposed pedestrian zone will have a positive effect on the air quality or not.
Stellenbosch University https://scholar.sun.ac.za

54 | P a g e
Generally, the following factors affecting the absorption of air pollutants should be taken into
consideration in the case where new measurements are taken. These factors were however not
considered in developing the pre-feasibility model (Currie & Bass, 2008) (GreenWall_Australia,
2014) (Yang et al., 2008) (Li et al., 2010):
1. The orientation of the green walls/roofs;
2. Existing urban vegetation;
3. Vegetation on the green walls/roofs;
4. Types of trees;
5. Transpiration rates for different plant leave types;
6. Measures/methods how the changes in pollution is captured;
7. Wind speeds;
8. Seasons;
9. Type of city (city conditions) and climates of different cities;
10. The initial concentration of air pollutants;
11. Times of day when measurements were taken.
The following aspects are also influenced by green engineering technologies. These factors do
however not have immediate impacts on the users of the pedestrian zone. These factors are therefore
excluded from the study:
1. energy consumption of buildings;
2. energy consumption for air-conditioning in the case where the heat is discharged at pedestrian
level;
3. economic analysis associated with the removal of pollutants;
4. urban run-off;
5. urban heat island effect.
Within Part 2 of the pre-feasibility model, the user of the model will be required to provide the area of
built up area to determine the effect of green walls, area of green roofs and area of trees to be planted.
This input data will form the values for BLOCKS 10, 11 and 12.
Air
Qu
alit
y
User Input
Model Output
Gre
en E
ng
inee
rin
g
Tec
hn
olo
gie
s
Area of Built Up Area
(m2) 10
Mg additional NO2 removed 13
Area of Green Roofs
(m2) 11
Mg additional O3 removed 14
Mg additional PM10 removed 15
Area of Trees (m2) 12
Mg additional SO2 removed 16
% change in CO2 17
Stellenbosch University https://scholar.sun.ac.za
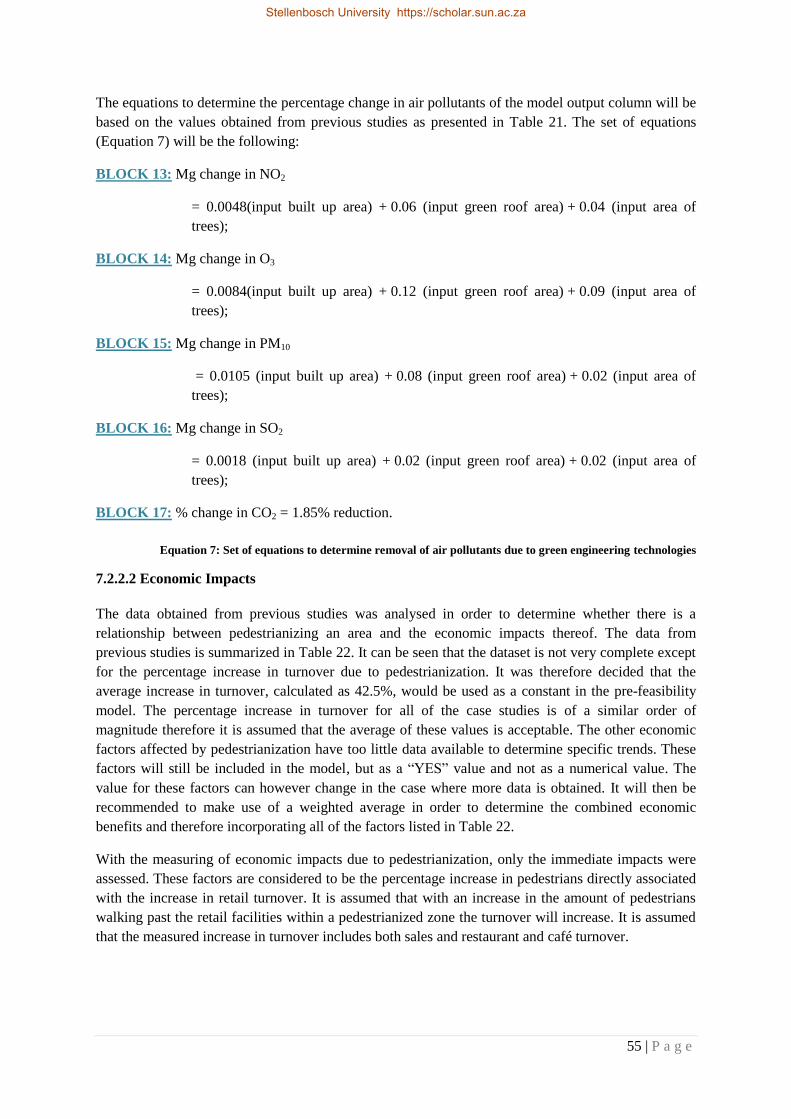
55 | P a g e
The equations to determine the percentage change in air pollutants of the model output column will be
based on the values obtained from previous studies as presented in Table 21. The set of equations
(Equation 7) will be the following:
BLOCK 13: Mg change in NO2
= 0.0048(input built up area) + 0.06 (input green roof area) + 0.04 (input area of
trees);
BLOCK 14: Mg change in O3
= 0.0084(input built up area) + 0.12 (input green roof area) + 0.09 (input area of
trees);
BLOCK 15: Mg change in PM10
= 0.0105 (input built up area) + 0.08 (input green roof area) + 0.02 (input area of
trees);
BLOCK 16: Mg change in SO2
= 0.0018 (input built up area) + 0.02 (input green roof area) + 0.02 (input area of
trees);
BLOCK 17: % change in CO2 = 1.85% reduction.
Equation 7: Set of equations to determine removal of air pollutants due to green engineering technologies
7.2.2.2 Economic Impacts
The data obtained from previous studies was analysed in order to determine whether there is a
relationship between pedestrianizing an area and the economic impacts thereof. The data from
previous studies is summarized in Table 22. It can be seen that the dataset is not very complete except
for the percentage increase in turnover due to pedestrianization. It was therefore decided that the
average increase in turnover, calculated as 42.5%, would be used as a constant in the pre-feasibility
model. The percentage increase in turnover for all of the case studies is of a similar order of
magnitude therefore it is assumed that the average of these values is acceptable. The other economic
factors affected by pedestrianization have too little data available to determine specific trends. These
factors will still be included in the model, but as a “YES” value and not as a numerical value. The
value for these factors can however change in the case where more data is obtained. It will then be
recommended to make use of a weighted average in order to determine the combined economic
benefits and therefore incorporating all of the factors listed in Table 22.
With the measuring of economic impacts due to pedestrianization, only the immediate impacts were
assessed. These factors are considered to be the percentage increase in pedestrians directly associated
with the increase in retail turnover. It is assumed that with an increase in the amount of pedestrians
walking past the retail facilities within a pedestrianized zone the turnover will increase. It is assumed
that the measured increase in turnover includes both sales and restaurant and café turnover.
Stellenbosch University https://scholar.sun.ac.za
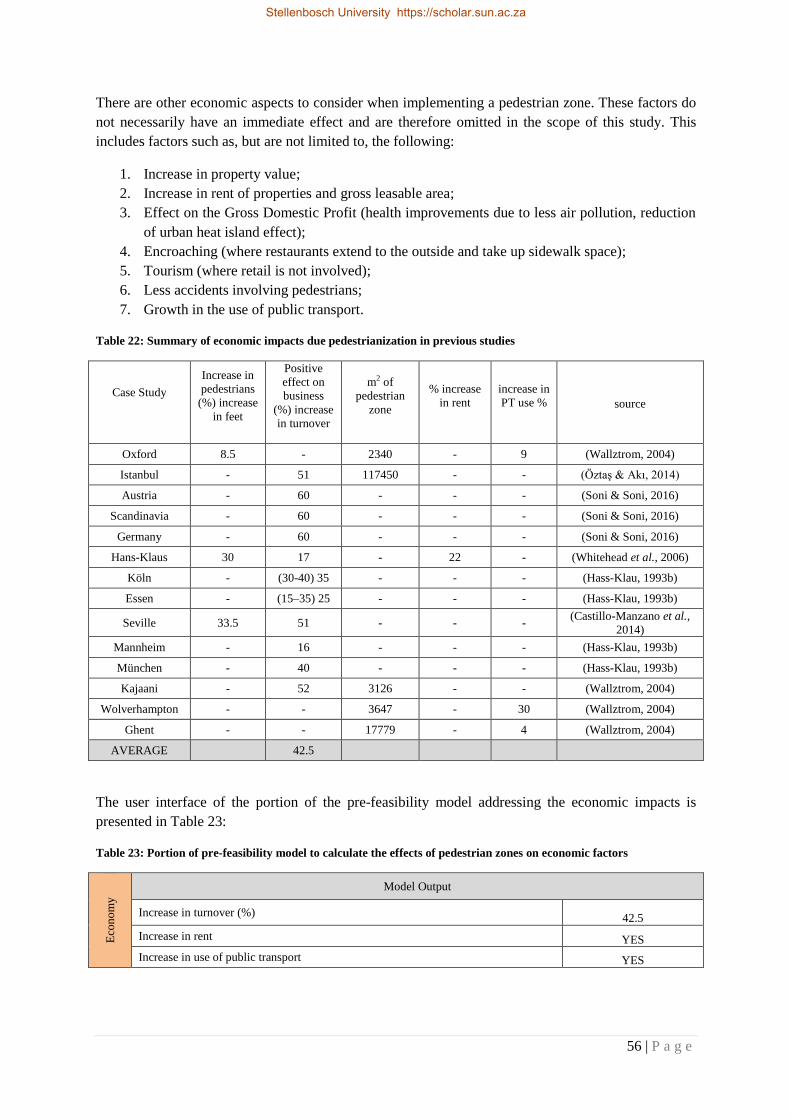
56 | P a g e
There are other economic aspects to consider when implementing a pedestrian zone. These factors do
not necessarily have an immediate effect and are therefore omitted in the scope of this study. This
includes factors such as, but are not limited to, the following:
1. Increase in property value;
2. Increase in rent of properties and gross leasable area;
3. Effect on the Gross Domestic Profit (health improvements due to less air pollution, reduction
of urban heat island effect);
4. Encroaching (where restaurants extend to the outside and take up sidewalk space);
5. Tourism (where retail is not involved);
6. Less accidents involving pedestrians;
7. Growth in the use of public transport.
Table 22: Summary of economic impacts due pedestrianization in previous studies
Case Study
Increase in
pedestrians
(%) increase
in feet
Positive
effect on
business
(%) increase
in turnover
m2 of
pedestrian
zone
% increase
in rent
increase in
PT use % source
Oxford 8.5 - 2340 - 9 (Wallztrom, 2004)
Istanbul - 51 117450 - - (Öztaş & Akı, 2014)
Austria - 60 - - - (Soni & Soni, 2016)
Scandinavia - 60 - - - (Soni & Soni, 2016)
Germany - 60 - - - (Soni & Soni, 2016)
Hans-Klaus 30 17 - 22 - (Whitehead et al., 2006)
Köln - (30-40) 35 - - - (Hass-Klau, 1993b)
Essen - (15–35) 25 - - - (Hass-Klau, 1993b)
Seville 33.5 51 - - - (Castillo-Manzano et al.,
2014)
Mannheim - 16 - - - (Hass-Klau, 1993b)
München - 40 - - - (Hass-Klau, 1993b)
Kajaani - 52 3126 - - (Wallztrom, 2004)
Wolverhampton - - 3647 - 30 (Wallztrom, 2004)
Ghent - - 17779 - 4 (Wallztrom, 2004)
AVERAGE 42.5
The user interface of the portion of the pre-feasibility model addressing the economic impacts is
presented in Table 23:
Table 23: Portion of pre-feasibility model to calculate the effects of pedestrian zones on economic factors
Eco
no
my
Model Output
Increase in turnover (%) 42.5
Increase in rent YES
Increase in use of public transport YES
Stellenbosch University https://scholar.sun.ac.za
57 | P a g e
In conclusion, the pre-feasibility model for the economic benefits will provide a predetermined set of
outputs. The outputs will therefore be an estimation based on the results of the previous studies and
therefore no input will be required. The estimated benefits of pedestrianization on the immediate
economy will be:
1. 42.5% increase in turnover (average of previous studies);
2. Increase in rent;
3. Increase in the use of public transport.
Some limitations and uncertainties associated with the data which are considered to be negligible
include factors such as:
1. Time period after which the increase in turnover is measured;
2. It is assumed that the measurements were taken as an average value and not measured over a
time period where retail will generally increase such as Christmas time or peak tourist
seasons.
7.2.2.3 Social Impacts
The same approach as with the economic impacts was followed in determining the impact of
pedestrian zones on social aspects. The data obtained from previous studies were analysed in order to
determine whether there is a relationship between pedestrianizing an area and the social benefits for
the residents and users of the area. The data from these previous studies is summarized in Table 24.
Again, the dataset is not comprehensive, except for the percentage increase in the perception of a
good quality of life.
By considering the results on the percentage increase in the perception of good life quality it is
noticeable that it ranges from very high (90%) to very low (4.5%). The initial thought was to
eliminate the outliers from the dataset by means of the interquartile range. The dataset is however too
small to accurately use this method to eliminate outliers. It is further assumed that the results obtained
are correct and not that of measurement or recording errors. Therefore it was decided to keep the
outliers in the dataset in order to take into account that these outliers may be of importance.
A second approach was taken in order to identify possible trends in how the perception of quality of
life is influenced by pedestrianization by determining if there are any noticeable trends in the average
ratio of pedestrianized area to percentage increase in perception of good life quality. It was anticipated
that with an increase in total pedestrianized area, the perception of the quality of life would be higher.
This was however not the case and no correlation between the ratio of the pedestrianized area and the
perception of good life quality (%) could be determined.
As a final approach it was decided to use the average of the perception of good quality of life and thus
accommodating all outliers. The other social factors affected by pedestrianization have too little data
available to determine specific trends.
Stellenbosch University https://scholar.sun.ac.za
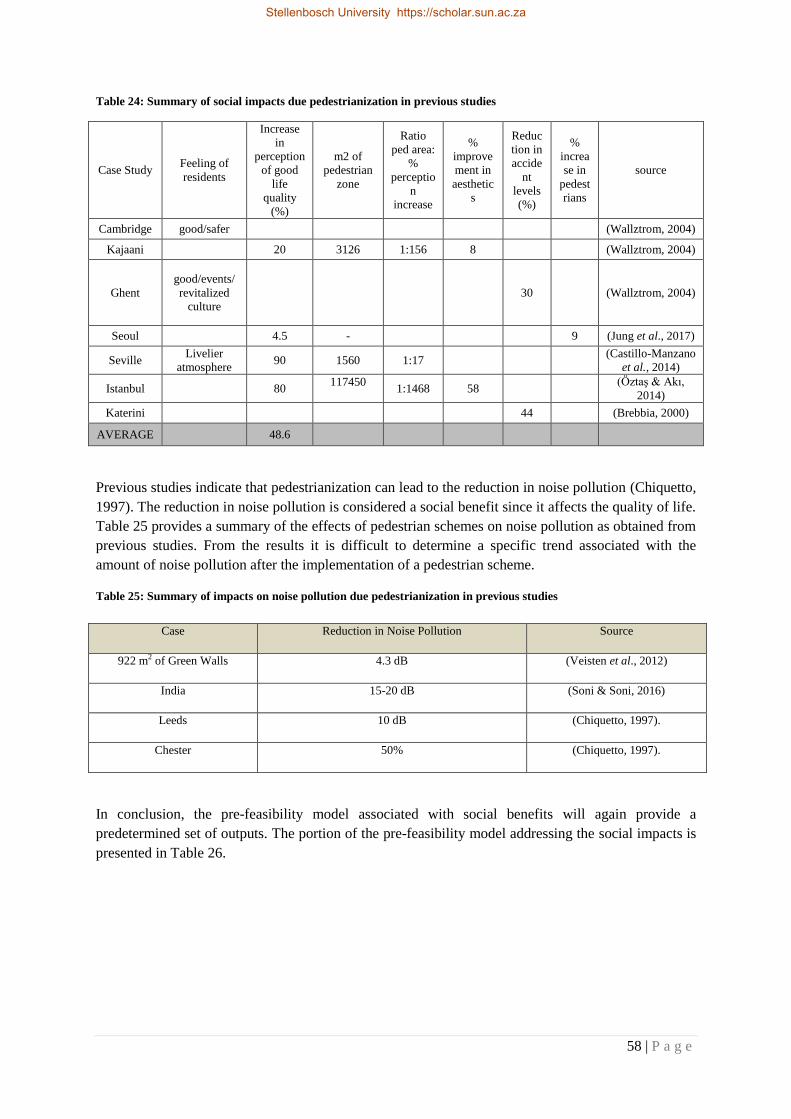
58 | P a g e
Table 24: Summary of social impacts due pedestrianization in previous studies
Case Study Feeling of
residents
Increase
in
perception
of good
life
quality
(%)
m2 of
pedestrian
zone
Ratio
ped area:
%
perceptio
n
increase
%
improve
ment in
aesthetic
s
Reduc
tion in
accide
nt
levels
(%)
%
increa
se in
pedest
rians
source
Cambridge good/safer
(Wallztrom, 2004)
Kajaani
20 3126 1:156 8
(Wallztrom, 2004)
Ghent
good/events/
revitalized
culture
30
(Wallztrom, 2004)
Seoul
4.5 -
9 (Jung et al., 2017)
Seville Livelier
atmosphere 90 1560 1:17
(Castillo-Manzano
et al., 2014)
Istanbul
80 117450
1:1468 58
(Öztaş & Akı,
2014)
Katerini
44
(Brebbia, 2000)
AVERAGE 48.6
Previous studies indicate that pedestrianization can lead to the reduction in noise pollution (Chiquetto,
1997). The reduction in noise pollution is considered a social benefit since it affects the quality of life.
Table 25 provides a summary of the effects of pedestrian schemes on noise pollution as obtained from
previous studies. From the results it is difficult to determine a specific trend associated with the
amount of noise pollution after the implementation of a pedestrian scheme.
Table 25: Summary of impacts on noise pollution due pedestrianization in previous studies
In conclusion, the pre-feasibility model associated with social benefits will again provide a
predetermined set of outputs. The portion of the pre-feasibility model addressing the social impacts is
presented in Table 26.
Case Reduction in Noise Pollution Source
922 m2 of Green Walls 4.3 dB (Veisten et al., 2012)
India 15-20 dB (Soni & Soni, 2016)
Leeds 10 dB (Chiquetto, 1997).
Chester 50% (Chiquetto, 1997).
Stellenbosch University https://scholar.sun.ac.za

59 | P a g e
Table 26: Portion of pre-feasibility model to calculate effects of pedestrian zones on social factors S
oci
al
Model Output
Increase in perception of good life quality (%) 48.6
Increase in aesthetics YES
Reduction in accidents involving pedestrians YES
Increase in amount of pedestrians YES
Minimum expected reduction in noise pollution due to pedestrianization (dB) 10
Reduction in noise pollution due to green engineering technologies YES
The outputs are therefore an estimation based on the results of the previous studies and therefore no
input will be required. The estimated benefits of pedestrianization on the immediate social
environment for the pre-feasibility model are therefore:
1. 48.6% increase in the perception of a good quality of life (average of previous studies);
2. Increase in aesthetics;
3. Reduction in accidents involving pedestrians;
4. Increase in the amount of pedestrians;
5. A reduction of at least 10dB in noise pollution (due to pedestrianization);
6. Reduction in noise pollution due to green engineering technologies.
It is assumed that the perception of a good quality of life includes the following factors:
1. Health benefits;
2. Feeling of community;
3. Feeling of safety;
4. Feeling of nature;
5. Increase in the activity levels of individuals;
6. Decrease in levels of depression;
7. Livelier atmosphere in the area.
7.2.2.4 Impacts on Traffic of Surrounding Network
Considering previous studies it was found that traffic evaporation took place in all of the cases. Table
27 provides a summary of the results obtained from previous studies.
Table 27: Summary of impacts on the surrounding traffic network due pedestrianization in previous studies
Case Study Presence of
Traffic
Evaporation
% decrease in
travel time
%
increase
in travel
speed
% reduction in
traffic within
close proximity
of GPZ
% change in
traffic within
the larger road
network
source
Chester Yes 2.8 3.1 - - (Chiquetto,
1997).
Kajaani Yes - - - No increase (Wallztrom,
2004) Wolverhampton Yes - - 14 1 decrease
Nuremburg Yes - - 25 19 increase
Cambridge Yes - - 80 No increase
Oxford Yes - - 20 1.13 decrease
AVERAGE 35
Stellenbosch University https://scholar.sun.ac.za
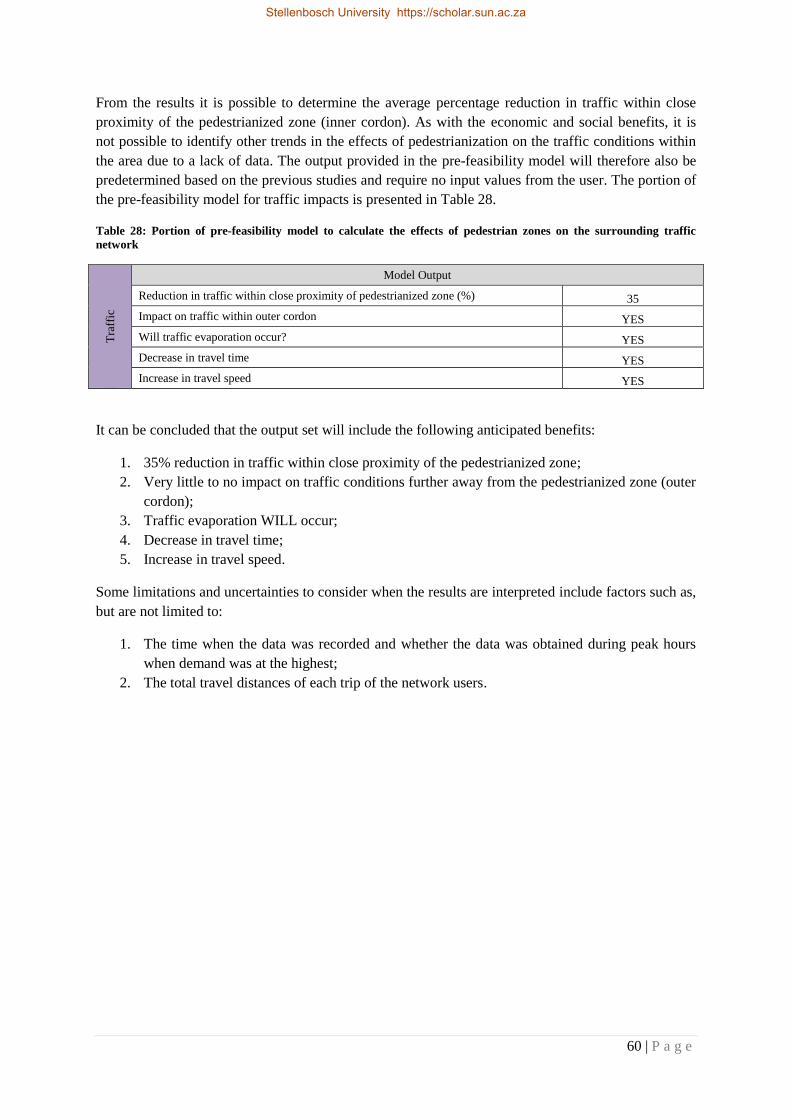
60 | P a g e
From the results it is possible to determine the average percentage reduction in traffic within close
proximity of the pedestrianized zone (inner cordon). As with the economic and social benefits, it is
not possible to identify other trends in the effects of pedestrianization on the traffic conditions within
the area due to a lack of data. The output provided in the pre-feasibility model will therefore also be
predetermined based on the previous studies and require no input values from the user. The portion of
the pre-feasibility model for traffic impacts is presented in Table 28.
Table 28: Portion of pre-feasibility model to calculate the effects of pedestrian zones on the surrounding traffic
network
Tra
ffic
Model Output
Reduction in traffic within close proximity of pedestrianized zone (%) 35
Impact on traffic within outer cordon YES
Will traffic evaporation occur? YES
Decrease in travel time YES
Increase in travel speed YES
It can be concluded that the output set will include the following anticipated benefits:
1. 35% reduction in traffic within close proximity of the pedestrianized zone;
2. Very little to no impact on traffic conditions further away from the pedestrianized zone (outer
cordon);
3. Traffic evaporation WILL occur;
4. Decrease in travel time;
5. Increase in travel speed.
Some limitations and uncertainties to consider when the results are interpreted include factors such as,
but are not limited to:
1. The time when the data was recorded and whether the data was obtained during peak hours
when demand was at the highest;
2. The total travel distances of each trip of the network users.
Stellenbosch University https://scholar.sun.ac.za
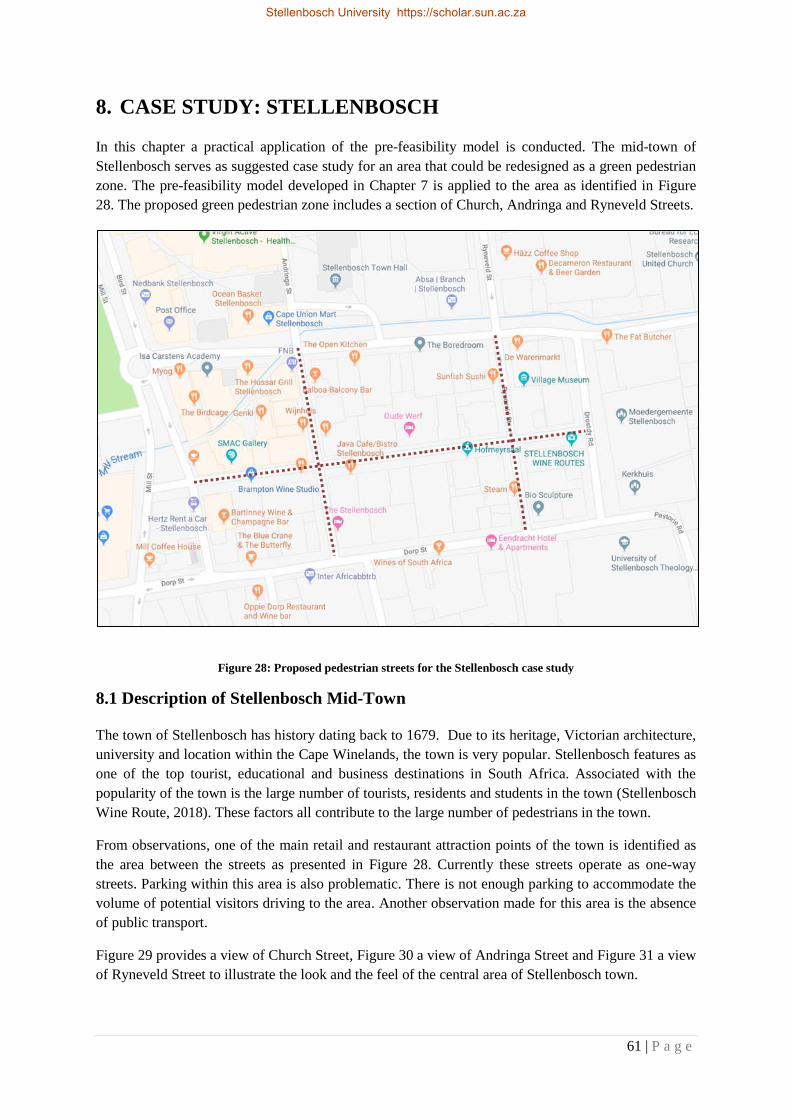
61 | P a g e
8. CASE STUDY: STELLENBOSCH
In this chapter a practical application of the pre-feasibility model is conducted. The mid-town of
Stellenbosch serves as suggested case study for an area that could be redesigned as a green pedestrian
zone. The pre-feasibility model developed in Chapter 7 is applied to the area as identified in Figure
28. The proposed green pedestrian zone includes a section of Church, Andringa and Ryneveld Streets.
Figure 28: Proposed pedestrian streets for the Stellenbosch case study
8.1 Description of Stellenbosch Mid-Town
The town of Stellenbosch has history dating back to 1679. Due to its heritage, Victorian architecture,
university and location within the Cape Winelands, the town is very popular. Stellenbosch features as
one of the top tourist, educational and business destinations in South Africa. Associated with the
popularity of the town is the large number of tourists, residents and students in the town (Stellenbosch
Wine Route, 2018). These factors all contribute to the large number of pedestrians in the town.
From observations, one of the main retail and restaurant attraction points of the town is identified as
the area between the streets as presented in Figure 28. Currently these streets operate as one-way
streets. Parking within this area is also problematic. There is not enough parking to accommodate the
volume of potential visitors driving to the area. Another observation made for this area is the absence
of public transport.
Figure 29 provides a view of Church Street, Figure 30 a view of Andringa Street and Figure 31 a view
of Ryneveld Street to illustrate the look and the feel of the central area of Stellenbosch town.
Stellenbosch University https://scholar.sun.ac.za
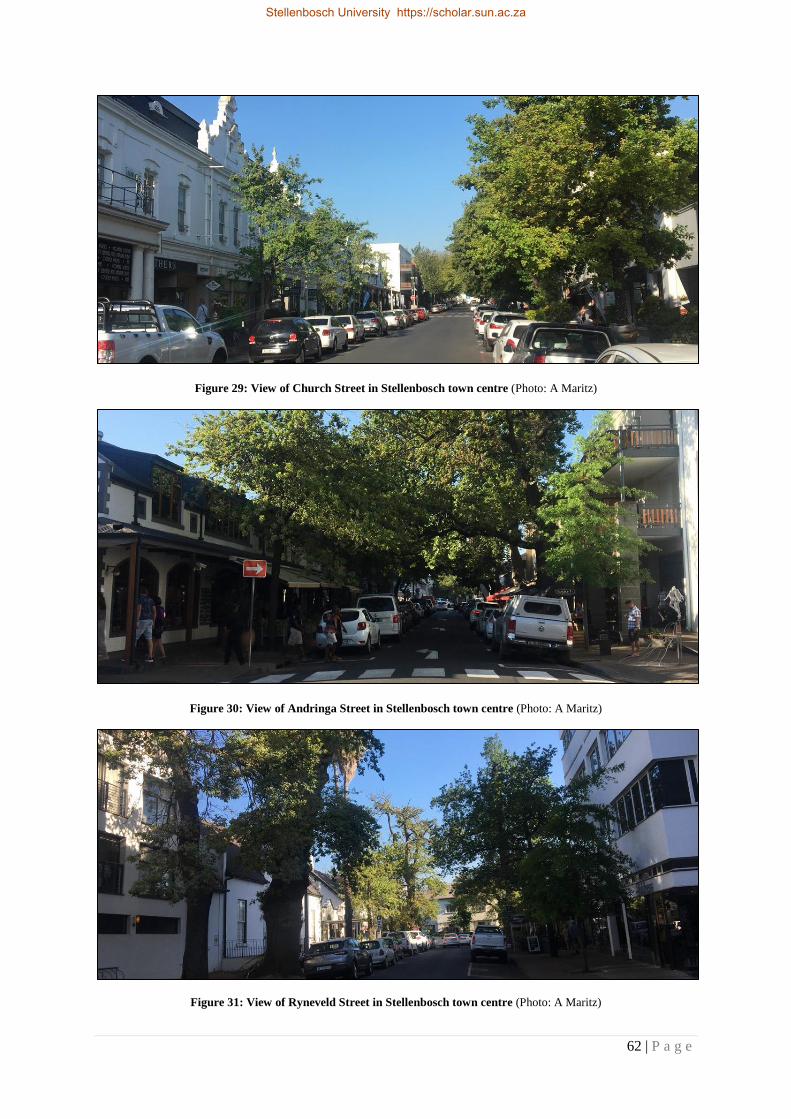
62 | P a g e
Figure 29: View of Church Street in Stellenbosch town centre (Photo: A Maritz)
Figure 30: View of Andringa Street in Stellenbosch town centre (Photo: A Maritz)
Figure 31: View of Ryneveld Street in Stellenbosch town centre (Photo: A Maritz)
Stellenbosch University https://scholar.sun.ac.za

63 | P a g e
8.2 Why Stellenbosch as Case Study
From discussions with Mr Sani, the owner of Wijnhuis restaurant in Ryneveld Street, and Mr Pelser,
the chairman of the Stellenbosch Rate and Tax Payers Association, it can be derived that the current
debate in the historic town of Stellenbosch is about the retention of the rural character of the town
versus urban development. Vineyards and other farmland within the municipal boundaries are
replaced by business park developments, hospitals and residential areas. In addition, plans for road
development in the area are of great concern to residents.
The University of Stellenbosch is also driving an expansion programme resulting in additional needs
for student housing in the town. The expansion programme is also the cause for a large number of
students commuting from Cape Town and surrounding areas resulting in a substantial increase in
traffic.
Apart from the influence of the University of Stellenbosch, a relative large number of alternative
tertiary education institutions and schools in Stellenbosch accommodate both local and commuting
students. With the number of university students to be more than 31 000 and taking the number of
students from alternative tertiary education institutions and pupils from schools into consideration this
number can easily be doubled in a town with a population of 170 000 (Du Plessis, 2018).
Existing infrastructure cannot handle the influx of new residents, students and businesses into
Stellenbosch. There is a concern by the Rate Payers Association that, while local authorities are
addressing new infrastructural needs through development and urbanisation, Stellenbosch may
eventually end up as yet another suburb of Cape Town, very similar to Durbanville, losing its rural
character.
Endeavouring to counter the negative impact of urban development in Stellenbosch on the quality of
life for residents, students, businesses and tourists alike, Stellenbosch was chosen as case study for
this thesis. Figure 32 provides a view one of the streets temporarily closed for vehicular traffic during
an event.
Stellenbosch University https://scholar.sun.ac.za

64 | P a g e
Figure 32: Street Soiree event in Stellenbosch where the streets are closed for vehicles during the event
(Photo: A Maritz)
As a resident of Stellenbosch the following observations were made (some of the observations have
also been made in previous studies):
1. The use of non-motorized transport is a very popular mode of transport around the whole
town of Stellenbosch, but specifically within the central town area (Moody, 2012);
2. The pedestrian volumes are high over the whole town (due to many residents, tourists and
students);
3. The leisure area of the town (as defined in Figure 28) is often congested. When visiting this
area by car, parking is a problem;
4. The amount of pedestrians noticed in this central area outnumber the amount of cars usually
driving through this area or parked in this area;
5. The atmosphere of the central town area is relaxed with visitors in the area strolling through
the streets, browsing through the art galleries and sitting at the on-street cafes. This ambience
is disturbed by cars driving by;
6. There is a lack of public transport in Stellenbosch; therefore travellers within the town rely on
the use of private cars.
A previous study was conducted in this area namely “Traffic Impact of Pedestrianization in
Stellenbosch”. Mr W Mohr and Professor SJ Anderson, from the University of Stellenbosch, were
responsible to complete this study in 2017 (Mohr, 2017). The results obtained from this study are used
to determine the validity of the developed pre-feasibility model where possible. The study is also used
to compare the obtained results and to fill in some of the required input fields as required by the pre-
feasibility model.
Stellenbosch University https://scholar.sun.ac.za

65 | P a g e
8.3 Application of Pre-Feasibility Model
In this section the developed model is applied to the inner central area of Stellenbosch
Pre-feasibility Model Part 1: Suggested Checklist as Applied to Stellenbosch
The checklist is completed based on known information for the proposed pedestrian area of
Stellenbosch.
Stellenbosch University https://scholar.sun.ac.za

66 | P a g e
Characteristic Description of Characteristic Check Note P
art
1:
Co
mp
uls
ory
Ch
arac
teri
stic
Dense Area Is the proposed location in a high density residential and commercial
area?
√ 1
High Pedestrian
Volumes
Does the location currently have high pedestrian volumes (residents,
tourists, students)? Will the area be able to accommodate pedestrians
with an acceptable LOS after pedestrianization?
√ 2
Parking Is there space to provide alternative parking at a reasonable price and
within close proximity to the pedestrian zone, once the pedestrian zone
is implemented?
√ 3
Public Transport
Access
Is there easy access to public transport from the pedestrian zone and is
the pedestrian zone accessible by public transport? It should be noted
that the pedestrian zone should not overlap with a bus route. In the case
where the pedestrian zone will be on a bus route, will it be possible to
alter the bus routes?
x 4
Noise Pollution Is the location prone to noise pollution? √ 5
Accident Prone Is the location prone to accidents and accidents typically involving
pedestrians?
x 6
Congested Area Does the location experience heavy traffic congestion during peak and
off peak time periods? It is recommended that there should be
alternative routes around the pedestrian area to accommodate the
displaced traffic. Further considerations include whether the
surrounding intersections will be able to accommodate the new traffic
conditions.
√ 7
Par
t 2
: S
tron
gly
Rec
om
men
ded
Imp
lem
enta
tio
ns
Safety Will the pedestrian zone be a safe environment during the day and at
night time?
√ 8
Physical
Improvement
Will the area be improved in terms of aesthetics (planting of trees,
adding benches, etc.) and will the physical environment be healthier
(less pollution) after pedestrianization?
√ 8
Ambience
Improvements
Will the feeling of the area improve in terms of comfort, promote
healthy lifestyles, create a sense of community, be relaxed and provide
a space for entertainment after the implementation of pedestrianization?
√ 8
Par
t 3
: R
eco
mm
end
atio
ns
Access Points The area should provide points of access for emergency and delivery
vehicles into the area.
√ 9
Not located on major
routes
The proposed pedestrian zone should not be placed on major through
routes.
√ 10
Alternative Routes Alternative traffic routes should be present and in close proximity of
the pedestrian zone to accommodate the displaced traffic.
√ 10
Compact Area The identified area for the proposed pedestrian zone should be compact
(should form a coherent shape to some extent).
√ 11
Open Network The proposed pedestrian zone should preferably be within an open
network.
√ 12
Stellenbosch University https://scholar.sun.ac.za

67 | P a g e
Discussion of the suggested checklist:
NOTE 1: The proposed pedestrian location is located in a dense area. There are multiple restaurant,
cafes, shops, hotels and galleries situated on these streets. There are also apartment buildings and
apartments on top of some of the commercial entities.
NOTE 2: The volume of pedestrians in this area is high due to residents, many tourists and students
making use of this area.
NOTE 3: According to the previous study by Mr Mohr and Prof Anderson there is adequate
alternative space to accommodate the parking of private cars that will be removed from the proposed
area. The parking area that will serve as the additional parking is situated approximately 300m away
from the central area. In the case where this additional parking area will not be able to provide
sufficient parking bays as is, the opportunity exists to construct a multi-story parking garage at this
location.
NOTE 4: The forms of transport observed in the Stellenbosch central area include private vehicles,
non-motorized transport and taxis. There is no form of public transport available. In general, and in
according to the derived checklist this may point to a potential unsuccessful implementation of a
pedestrian zone in the proposed area due to difficulty in accessing the area. For the Stellenbosch case
this may not be true since the area is already known for high pedestrian volumes as is. The town of
Stellenbosch is small enough to access the area by foot and public transport is not needed to gain
access as applicable to big cities.
NOTE 5: As a frequent visitor to the area the cars driving past are experienced as a disturbance,
especially at times when a quiet meal is enjoyed at one of the street side cafes.
NOTE 6: No data on accidents involving pedestrians in this area could be obtained. Since the
reduction in the number of pedestrian accidents is in accordance with the model a compulsory
characteristic for a proposed pedestrian zone, this could mechanistically point to potential
unsuccessful implementation of a pedestrian zone resulting in senseless conclusions.
NOTE 7: From prior experience, driving through the proposed streets an average speed of 10km/h
was obtained. This is a very low speed compared to the speed that can be achieved on the surrounding
streets (e.g. 40-60km/h). The main reason for the low speed is the many pedestrians and other road
users moving in and out of parking bays and is not a result of congestion. It can be seen as an unlikely
route that will be taken when a traveller is heading through the town. The principle of Braess’s
Paradox will thus still apply (refer to paragraph C.5 for a description of this principle). It is the same
as in the case where road users will find an alternative faster route when stuck in traffic.
NOTE 8: The area already complies with these proposed characteristics. It is therefore anticipated that
with the implementation of a pedestrian scheme in this area, the circumstances will not decay and
only improve from the current situation.
NOTE 9: There will be sufficient vehicle access points to and exit points from the pedestrian zone to
accommodate delivery, emergency and waste removal vehicles, as well as vehicles belonging to
residents of the area. Provided that the roads included in this area remain one-way streets there will be
three access points to and three exit points from the pedestrianized area as illustrated in Figure 33.
Stellenbosch University https://scholar.sun.ac.za

68 | P a g e
Figure 33: Access and exit points for the proposed pedestrian scheme in Stellenbosch
NOTE 10: As discussed under note 7, the surrounding roads operate at higher speeds than the
proposed pedestrianized streets. These roads are therefore considered to be sufficient to accommodate
the displaced traffic. Figure 34 illustrates the additional roads available. These roads include Dorp
Street, Plein Street and Drostdy Street. Dorp Street and Plein Street are considered to be main roads
and therefore the proposed pedestrianized streets do not interfere with main routes.
Figure 34: Surrounding roads to accommodate displaced traffic
Stellenbosch University https://scholar.sun.ac.za

69 | P a g e
NOTE 11: The proposed area for pedestrianization is considered compact. The streets that will form
part of the area are all intersecting. The circumference of the whole pedestrianized area can be
grouped into a rectangular shape as illustrated in Figure 35.
Figure 35: Compact area forms part of the proposed pedestrian scheme in Stellenbosch
NOTE 12: The proposed area lies within an open network. Figure 36 illustrates the different route
options available for through traffic.
Figure 36: Routes part of the open road network surrounding the proposed pedestrian scheme in Stellenbosch
Stellenbosch University https://scholar.sun.ac.za
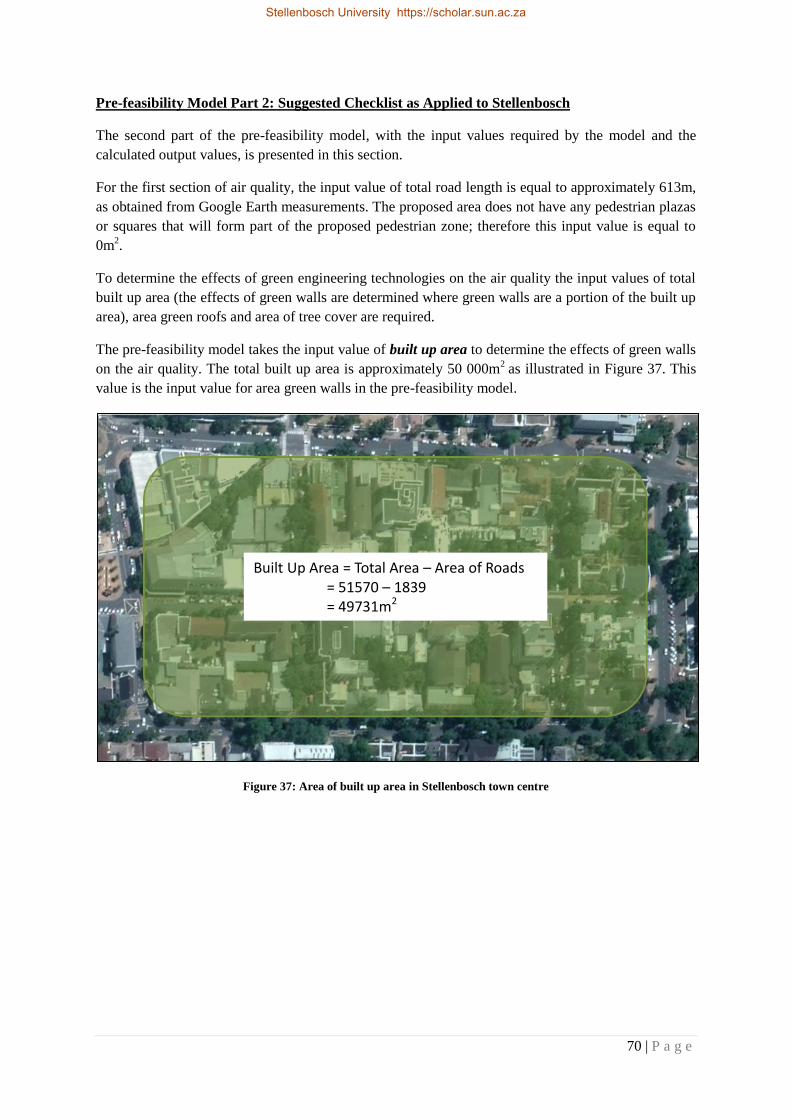
70 | P a g e
Pre-feasibility Model Part 2: Suggested Checklist as Applied to Stellenbosch
The second part of the pre-feasibility model, with the input values required by the model and the
calculated output values, is presented in this section.
For the first section of air quality, the input value of total road length is equal to approximately 613m,
as obtained from Google Earth measurements. The proposed area does not have any pedestrian plazas
or squares that will form part of the proposed pedestrian zone; therefore this input value is equal to
0m2.
To determine the effects of green engineering technologies on the air quality the input values of total
built up area (the effects of green walls are determined where green walls are a portion of the built up
area), area green roofs and area of tree cover are required.
The pre-feasibility model takes the input value of built up area to determine the effects of green walls
on the air quality. The total built up area is approximately 50 000m2
as illustrated in Figure 37. This
value is the input value for area green walls in the pre-feasibility model.
Figure 37: Area of built up area in Stellenbosch town centre
Built Up Area = Total Area – Area of Roads
= 51570 – 1839
= 49731m2
Stellenbosch University https://scholar.sun.ac.za

71 | P a g e
For evaluating the model based on a feasible case study, a number of buildings that could potentially
be retrofitted with green roofs were chosen at random. The green roof layout is presented in Figure
38. In the case where this proposed green roof plan is implemented the total green roof area will be
3694m2. This is therefore the input value for area of green walls in the pre-feasibility model.
Figure 38: Suggested green roof layout in the proposed pedestrian zone and area of each green roof
There are already trees present in the proposed area. Should any additional trees be planted in the
proposed zone and it is assumed to be young and small trees, it is feasible to assume that such trees
would typically take up an area of 1m2
initially. For evaluating the model based on a feasible case
study, an arbitrary number of 30 trees are selected for additional trees to be planted in the proposed
area to be pedestrianized. The input value for area of trees will therefore be 30m2. Initially the effects
of the additional trees are expected to be negligible, but will become more beneficial over time. The
completed user interface for the pre-feasibility model for the case of Stellenbosch can be seen in
Table 29.
Stellenbosch University https://scholar.sun.ac.za

72 | P a g e
Table 29: Completed pre-feasibility model for the case of Stellenbosch
Air
Qu
alit
y
User Input Model Calculations Model Output
Veh
icu
lar
traf
fic
Total Road
Length of
Proposed
Pedestrianized
Area (m) 613
Total Cars removed (no veh /
day) 5327 % change in PM 7.73
Total Road Area (m2) 1839 % change in HC -1.49
Total area of
Plazas or Square
if present (m2) 0
Total Pedestrianized Area (m2)
1839
% change in NOx 6.80
% change in CO 8.35
Gre
en E
ng
inee
rin
g
Tec
hn
olo
gie
s
Area of Built Up
Area (m2) 50 000
Mg additional NO2 removed 462.84
Area of Green
Roofs (m2) 3694
Mg additional O3 removed 865.98
Mg additional PM10 removed 821.12
Area of Trees
(m2) 30
Mg additional SO2 removed 164.48
% change in CO2 1.85
Eco
no
my
Model Output
Increase in turnover (%) 42.5
Increase in rent YES
Increase in use of public transport YES
So
cial
Model Output
Increase in perception of good life quality (%) 48.6
Increase in aesthetics YES
Reduction in accidents involving pedestrians YES
Increase in amount of pedestrians YES
Minimum expected Reduction in Noise Pollution due to Pedestrianization
(dB) 10
Reduction in noise pollution due to green engineering technologies YES
Tra
ffic
Model Output
Reduction in traffic within close proximity of pedestrianized zone (%) 35
Impact on traffic within outer cordon YES
Will traffic evaporation occur? YES
Decrease in travel time YES
Increase in travel speed YES
Stellenbosch University https://scholar.sun.ac.za

73 | P a g e
8.4 Evaluation of the Pedestrianization of Stellenbosch according to the outcomes
of the Pre-Feasibility Model.
Each part of the pre-feasibility model and the results obtained for the case study are discussed in this
section.
Part 1: Suggested Checklist
According to the suggested checklist the proposed area may not be suited for a pedestrian zone based
on two factors namely:
1. There is no public transport access to the pedestrian area,
2. No accidents involving pedestrians have been recorded.
There is however no public transport present in Stellenbosch. Since it is a small town with the
location of the proposed pedestrian zone in the middle of the town, the area is still accessible by non-
motorized transport modes. This factor is therefore irrelevant for this case study.
The second aspect that suggests that the location of the proposed pedestrian zone may not be feasible
is the lack of statistics pertaining accidents involving pedestrians. Should statistics become available,
this factor may have an influence on the pedestrian zone location, but due to the lack thereof this
factor is ignored for this case study.
Part 2: Mathematical Model
Air Quality:
Considering the second part of the pre-feasibility model it is noticed that the air quality will have an
overall worsening effect. The only pollutant that will be reduced as a result of the pedestrianization
scheme is HC. This pollutant will be reduced by 1.49%. It should be noted that with the previous
studies included in the development of the model, the total road length of pedestrianized area was
much higher than the road length of the case study. A possible reason for the worsening of air quality
can be attributed to the displacement of traffic. With traffic displaced around larger pedestrianized
areas the extra travel distance will not have such a significant impact on the air quality. With smaller
areas, such as Stellenbosch, the traffic is displaced to the roads precisely parallel to the roads
proposed to be pedestrianized. Therefore the air pollution caused by the traffic on the surrounding
network will still be present within the pedestrianized zone.
The benefits of green engineering technologies are however very positive and will result in the
removal of additional air pollutants.
Economic and Social Benefits:
As discussed in Chapter 4, due to limited data available only predetermined output values of the
expected benefits can be included in the model.
Traffic Benefits:
As with the economic and social benefits, due to limited data available only predetermined output
values of the expected benefits can be included in the model. The benefits as presented in the pre-
feasibility model can however be compared to the results obtained from the study conducted by Mr
Stellenbosch University https://scholar.sun.ac.za
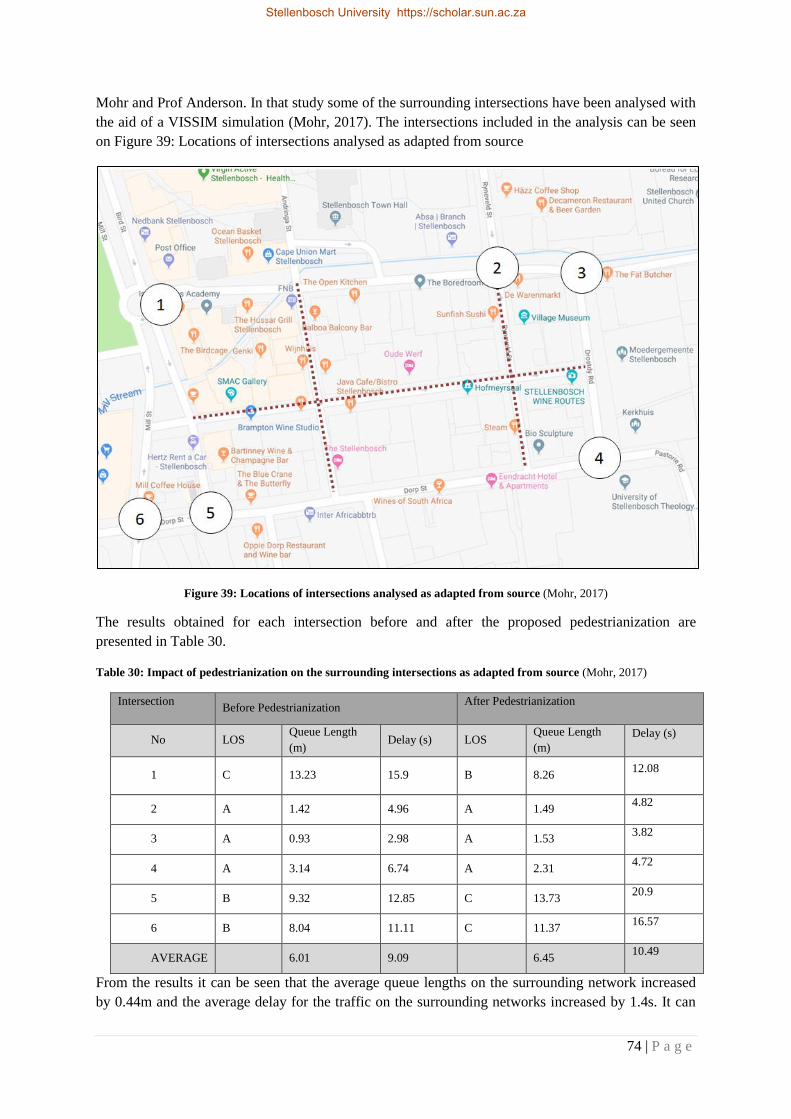
74 | P a g e
Mohr and Prof Anderson. In that study some of the surrounding intersections have been analysed with
the aid of a VISSIM simulation (Mohr, 2017). The intersections included in the analysis can be seen
on Figure 39: Locations of intersections analysed as adapted from source
Figure 39: Locations of intersections analysed as adapted from source (Mohr, 2017)
The results obtained for each intersection before and after the proposed pedestrianization are
presented in Table 30.
Table 30: Impact of pedestrianization on the surrounding intersections as adapted from source (Mohr, 2017)
Intersection Before Pedestrianization
After Pedestrianization
No LOS Queue Length
(m) Delay (s) LOS
Queue Length
(m)
Delay (s)
1 C 13.23 15.9 B 8.26 12.08
2 A 1.42 4.96 A 1.49 4.82
3 A 0.93 2.98 A 1.53 3.82
4 A 3.14 6.74 A 2.31 4.72
5 B 9.32 12.85 C 13.73 20.9
6 B 8.04 11.11 C 11.37 16.57
AVERAGE 6.01 9.09 6.45 10.49
From the results it can be seen that the average queue lengths on the surrounding network increased
by 0.44m and the average delay for the traffic on the surrounding networks increased by 1.4s. It can
Stellenbosch University https://scholar.sun.ac.za

75 | P a g e
therefore be concluded that these results do not agree with the results as presented in the pre-
feasibility model. The increase in queue lengths and travel times are however very small and
authorities can easily accept these increases as negligible changes. It can therefore be concluded that
the proposed pedestrianization scheme, although not leading to better overall functioning of the road
network, will have very little impact and cause minimal changes to the operation of the current road
network.
Stellenbosch University https://scholar.sun.ac.za
76 | P a g e
9. INDUSTRY CRITIQUE
Semi-structured interviews were held with professionals in the area of city and town planning and
strategic transportation planning. The professionals were presented with the pre-feasibility model and
asked to provide critique. In this chapter their insights are discussed and incorporated into the pre-
feasibility model where possible.
Part 1 of the pre-feasibility model, the Location Determination Checklist, was discussed with Me
Nina Otto, a professional City and Town Planner. Part 2, the Mathematical model was discussed with
Me Cara Gerber, a professional Transportation and Strategic Planning Engineer.
A semi-structured conversation was also conducted with Mr Sandri and Mr Pelser simultaneously. Mr
Sandri is the owner of Wijnhuis restaurant in Andringa Street, located in the proposed area to be
pedestrianized in Stellenbosch as the case study. Mr Pelser is the chairman of the Stellenbosch Rate
Payers Association. The written consent of the interview participants are provided in Appendix E.
9.1 Critique Regarding the Location Checklist
From the conversation with Me Otto (City and Town Planner), it can be concluded that one of the
most important aspects regarding the location of a proposed pedestrian zone is the type of land use.
The area where a pedestrian zone is proposed should be described as of “mixed use”, meaning that
there should be many trip attractors during the morning peak, for instance work opportunities, retail
and even other residential units.
From the conversation with Me Otto the characteristics which should not be present in a proposed
pedestrian zone were also noted. These include for example that there should be no vacant plots or
areas in the pedestrian zone since these create the feeling of an unsafe and an exposed environment to
passing by pedestrians.
Me Otto also provided additional critique and inputs pertaining technical terminology and phrasing as
preferred by industry. As final remark Me Otto emphasized the importance of keeping in mind that
the model is to determine characteristics of the location of the pedestrian zone and not characteristics
of the final product, i.e. the characteristics of the implemented pedestrian zone.
The inputs from Me Otto have been incorporated into the model. The amended location checklist is
presented in Table 31. It is recommended that the amended model is used in future. Since the
amendments to the model are more of cosmetic nature, they do not affect the model outcome. It is
therefore unnecessary to retest the amended model.
In general Me Otto indicated that the location checklist addresses all necessary aspects.
For some of the typical questions discussed during the semi-structured interview refer to Appendix D.
Stellenbosch University https://scholar.sun.ac.za
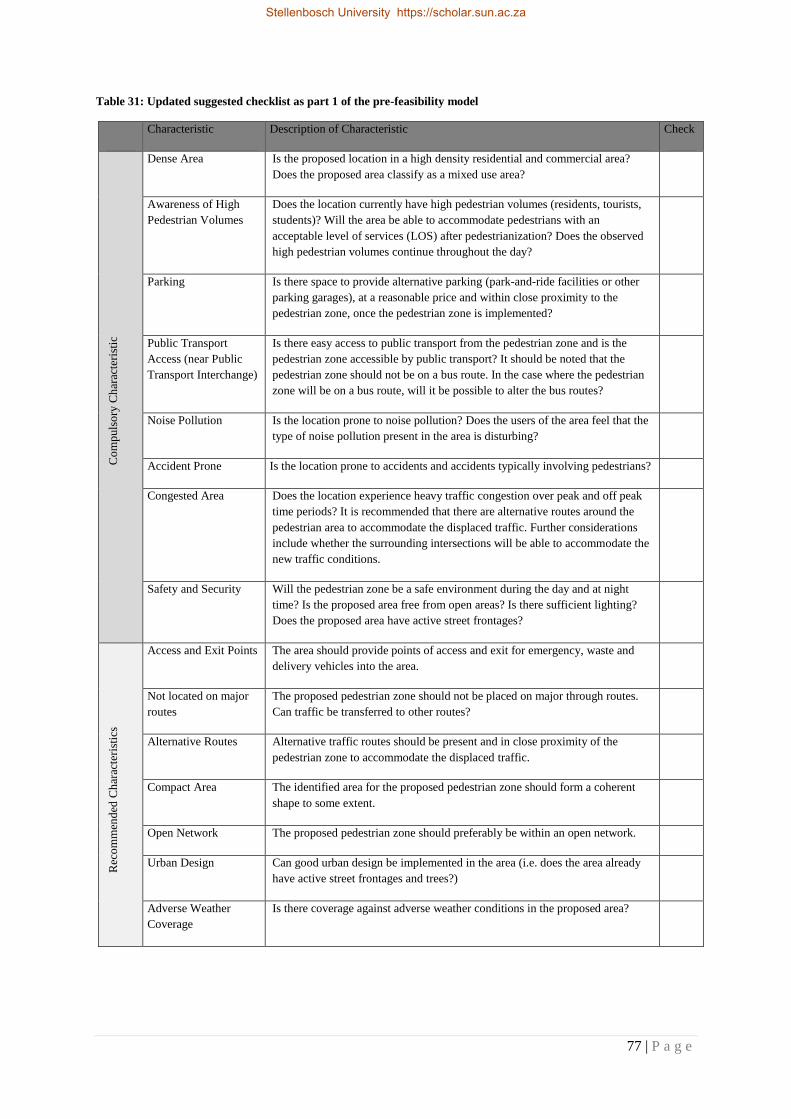
77 | P a g e
Table 31: Updated suggested checklist as part 1 of the pre-feasibility model
Characteristic Description of Characteristic Check
Co
mp
uls
ory
Ch
arac
teri
stic
Dense Area Is the proposed location in a high density residential and commercial area?
Does the proposed area classify as a mixed use area?
Awareness of High
Pedestrian Volumes
Does the location currently have high pedestrian volumes (residents, tourists,
students)? Will the area be able to accommodate pedestrians with an
acceptable level of services (LOS) after pedestrianization? Does the observed
high pedestrian volumes continue throughout the day?
Parking Is there space to provide alternative parking (park-and-ride facilities or other
parking garages), at a reasonable price and within close proximity to the
pedestrian zone, once the pedestrian zone is implemented?
Public Transport
Access (near Public
Transport Interchange)
Is there easy access to public transport from the pedestrian zone and is the
pedestrian zone accessible by public transport? It should be noted that the
pedestrian zone should not be on a bus route. In the case where the pedestrian
zone will be on a bus route, will it be possible to alter the bus routes?
Noise Pollution Is the location prone to noise pollution? Does the users of the area feel that the
type of noise pollution present in the area is disturbing?
Accident Prone Is the location prone to accidents and accidents typically involving pedestrians?
Congested Area Does the location experience heavy traffic congestion over peak and off peak
time periods? It is recommended that there are alternative routes around the
pedestrian area to accommodate the displaced traffic. Further considerations
include whether the surrounding intersections will be able to accommodate the
new traffic conditions.
Safety and Security Will the pedestrian zone be a safe environment during the day and at night
time? Is the proposed area free from open areas? Is there sufficient lighting?
Does the proposed area have active street frontages?
Rec
om
men
ded
Ch
arac
teri
stic
s
Access and Exit Points The area should provide points of access and exit for emergency, waste and
delivery vehicles into the area.
Not located on major
routes
The proposed pedestrian zone should not be placed on major through routes.
Can traffic be transferred to other routes?
Alternative Routes Alternative traffic routes should be present and in close proximity of the
pedestrian zone to accommodate the displaced traffic.
Compact Area The identified area for the proposed pedestrian zone should form a coherent
shape to some extent.
Open Network The proposed pedestrian zone should preferably be within an open network.
Urban Design Can good urban design be implemented in the area (i.e. does the area already
have active street frontages and trees?)
Adverse Weather
Coverage
Is there coverage against adverse weather conditions in the proposed area?
Stellenbosch University https://scholar.sun.ac.za
78 | P a g e
9.2 Critique Regarding the Mathematical Model
In the conversation with Me Gerber (Transportation and Strategic Planning Engineer), the conclusion
was that the developed mathematical model can be used without modification. Me Gerber considered
this model to be easy, quick and inexpensive to use by anyone (even with limited experience) as
decision support tool. According to her the model outcome can potentially be used to motive why a
project could be initiated or not and serves as a measure to discriminate between feasible and
unfeasible projects when confronted with a large number of projects. She stated that the model can
potentially be considered as a useful tool in comparing different project options based on a common
standard.
Although no critique was obtained on the model interface, Me Gerber stated that the model could be
refined in future research. She strongly recommended that with future research all of the factors
currently included in the model could also be translated to a single economic value.
Noteworthy is that Me Gerber agreed that the use of the previous study conducted by Mr Mohr on
Stellenbosch may be a good way to test the model. However, the misalignment between his results
and the model outcome should not be interpreted as an invalidation of the model as Mr Mohr’s study
period is shorter than the information period on which the model is based upon.
For some additional information obtained from this conversation refer to Appendix D.
9.3 Critique Regarding the Pedestrianization of Stellenbosch
To get a better grasp on factors the community may consider as important, Mr Sandri (owner of
Wijnhuis Restaurant) was consulted for his perceptions on the pedestrianization of the inner town
centre of Stellenbosch. The main purpose of the conversation was to verify if the factors listed in the
checklist are representative of those considered by him as important and where improvements can be
made to the checklist.
According to Mr Sandri the pedestrianization of Stellenbosch may not be as feasible as one would like
to believe. He perceives the current vehicle and pedestrian situation to be acceptable in the suggested
pedestrian zone and that changes may not necessarily benefit the community within this area, neither
socially or economically. His major concern is the possibility that the characteristics of the town
centre may change post-pedestrianization to one where alcohol is misused resulting in public bad
behaviour. This concern may however be addressed through regulation and bylaws. Provision could
be made to limit the land use to the current restaurant and cafe types, and not allowing bars and clubs
that could negatively affect the current tranquillity of the area. Other than the possibility of public bad
behaviour Mr Sandri agreed with the recommendation that the aesthetics of the area should improve
and that the sense of safety and security is an important inclusion in the checklist.
Mr Pelser (Stellenbosch Rate Payers Association) was consulted to determine whether a model such
as the pre-feasibility model may be beneficial from a planning perspective. He agreed that this type of
model may assist decision makers and may be used in the selection process between potential projects
local authorities may want to execute. The discussion with Mr Pelser also included the topic on how a
pedestrianization project may be funded. Typically, the project will be identified and incorporated into
the Integrated Development Plan (IDP). Funding will then either be obtained from the local municipal
budget where tax earnings will be the main source of income or from funding provided by the national
or provincial authorities.
Stellenbosch University https://scholar.sun.ac.za

79 | P a g e
10. RESULTS AND INTERPRETATION
In this section the overall results obtained in this study are summarised and interpreted. The results are
divided into three main parts as follows:
1. Literature review;
2. The creation of the pre-feasibility model;
3. The application of the pre-feasibility model to Stellenbosch as case study.
1. Literature Review:
From the literature review there is a clear indication that environmental problems do exist in South
Africa. Typical causes for these environmental problems are rapid urbanization, urban sprawling and
overpopulation. This in turn leads to other environmental problems like air pollution and loss of
biodiversity.
With the knowledge of the existence of environmental problems comes the responsibility to address
these problems. There are various solutions in addressing environmental problems of which the
implementation of pedestrian schemes is one identified for further research. Previous studies of
pedestrianization were investigated. The results obtained from these studies indicate that the
implementation of pedestrian zones is a feasible method to address some of the identified
environmental problems. Pedestrian zones can aid in minimizing air pollution and congestion by
providing additional open space. Other benefits such as social and economic benefits are also
associated with pedestrian zones.
2. The pre-feasibility model:
The previous studies included in the literature review were analysed in order to identify possible
trends and to develop mathematical equations to model the associated benefits of pedestrianization
and the application of green engineering technologies. The previous studies were also used to
determine the optimum location for a proposed pedestrian zone.
From the previous studies it can be concluded that the success of a pedestrian zone largely depends on
the location. Previous studies were consulted to develop a location characteristic checklist to aid in
determining whether a proposed area for a pedestrian zone will be feasible or not. The characteristics
that may influence the success of a pedestrian zone the most include the land use (the identified area
should be of mixed land use), accessibility of the area with public transport, whether alternative roads
are available and the sense of safety to pedestrians that will be provided by the pedestrian zone.
In the development of the pre-feasibility model it was further determined that mathematical equations
can be developed with linear regression to determine the effects of pedestrianization on air quality.
Overall, an increase in the quality of air can be expected as a benefit associated with
pedestrianization.
Averages of previous studies pertaining economic, social and traffic circumstances can be determined
and are presented in the pre-feasibility model as anticipated and expected benefits. The associated
economic benefits that can be expected include an increase of 42.5% in turnover, an increase in rental
earnings and an increase in the use of public transport. Expected social benefits are an increase of
48.6% in the perception of a good quality of life, an increase in the aesthetics of the area, less (even
Stellenbosch University https://scholar.sun.ac.za

80 | P a g e
zero) accidents involving pedestrians, an increase in the pedestrian count within the area (this will
create a sense of community) and the reduction of at least 10dB in noise pollution. Regarding traffic
conditions on the surrounding network, it is anticipated that the implementation of a pedestrian
scheme will not cause a long term worsening of the traffic conditions on the rest of the traffic network
and the concept of traffic evaporation can be expected. A reduction of 35% in traffic within close
proximity of the pedestrian zone, a decrease in travel time and an increase in travel speed can be
expected, provided that the area of the proposed pedestrian zone adheres to the recommended location
characteristics.
The need for a pre-feasibility model as developed in this study was confirmed by obtaining industry
critique. Interviews with industry professionals confirmed that the developed pre-feasibility model
should be able to aid in the decision making process to proceed with the implementation of a
pedestrian scheme or not.
It can further be concluded that the characteristics addressed in the location checklist include those
characteristics bringing either total success or total failure and that this checklist provides a good
guideline to determine the location of a pedestrian zone.
3. The case study of Stellenbosch:
The developed pre-feasibility model was applied to the inner town centre of Stellenbosch. From the
model outputs it is concluded that the identified area of Church Street, Andringa Street and Ryneveld
Street adhere to most of the location characteristics. A characteristic shortcoming is that this identified
area is not within close proximity of a public transport interchange. The concern is therefore that it
will be difficult for pedestrians to move to and from the pedestrianized zone. A positive however is
that there are some additional parking within 300m of the proposed zone. The discretion of the
decision making authorities should be applied in determining whether this factor will have an
influence on the success of the proposed pedestrian scheme. The final decision should be well
motivated.
The model outcome with regards to air quality indicate that the pedestrian scheme will have a slight
worsening effect on the air quality. This can most likely be attributed to the size of the proposed area.
Due to the small size of the proposed area, the pollution caused by the displaced traffic will still be
present in the pedestrian scheme. The implementation of green engineering technologies will however
contribute to the removal of additional air pollutants.
The predetermined economic and social benefits are expected to be positive based on previous
studies.
The model outcome with regards to traffic conditions was compared with a previous study conducted
for Stellenbosch. The developed pre-feasibility model indicates that the pedestrian scheme will benefit
the traffic conditions on the surrounding network. The previous study however indicates that a slight
worsening in the traffic conditions can be expected. Industry critique indicated that the previous study
can however not be used to validate the developed pre-feasibility model since the pre-feasibility
model is based on data obtained from studies conducted over a longer time frame.
Stellenbosch University https://scholar.sun.ac.za

81 | P a g e
11. OTHER FACTORS TO CONSIDER WHEN CREATING A
GREEN PEDESTRIAN ZONE
Due to the broad scope of urban planning, transportation planning and the economy of a country, not
all the factors playing a role in the implementation of a green pedestrian zone are included in this
study. In this chapter a summative list is provided of other factors to consider in the planning process
of a pedestrian zone. The factors included in this list are a collection from multiple sources and
conversations with industry professionals. Other factors to consider include, but are not limited to the
following:
1. Policies and Legislative Framework:
Transport and land use integration and the bigger picture of the transportation planning of
an area;
Town planning and zoning schemes;
Precinct planning;
Development policies;
Budgets and project allocations;
Rates and taxes schemes;
The concept of spatial justice;
Encroaching of restaurants or cafes onto the sidewalks.
2. Functioning of Pedestrian and Green Pedestrian Zones
Parking: Parking cannot be removed completely and methods on how to provide additional
or alternative parking should be considered. This can include the building of extra parking
garages or park-and-ride-facilities. The number of parking bays available may also have an
effect on property value. The provision of either on-street or off-street parking for vehicles
requiring special access to the pedestrian zone should be considered;
Access permits: Residents, emergency vehicles, delivery vehicles and waste removal
vehicles should be granted permits to enter the pedestrian zone;
Speed reduction: A much lower speed should be enforced for the vehicles entering
pedestrian zones;
Non-motorized transport design factors: Provision should be made for people with
disabilities by providing bubble blocks at drop kerbs (as seen in Figure 40), audio-tactile
sensors at signalised intersections allocated on the outer corners of the pedestrian zone and
consideration should be given for bicycle lanes and the right of way for pedestrians. The
signage and road markings should also be included in the design factors (Watanabe et. al,
2007).
Stellenbosch University https://scholar.sun.ac.za

82 | P a g e
Figure 40: Intersection drop kerb design (Watanabe et. al, 2007)
3. Interaction or interfacing between Urban Planning, Public Transport and Pedestrian Zone
The type of public transport provided in close proximity to the pedestrian zone should be
considered. It is typically recommended that non-road based transport (for instance trains) and
pedestrian zones function together. This can typically be described as a train terminal with
entrances and exits to a pedestrian zone. There should also consideration be given on how the
pedestrian zones will be separated from the transit area. This can include urban design features
such as bollards or a whole new artificial zone can be created.
4. Acceptance of Pedestrian Zone
To persuade the community of the benefits associated with the proposed pedestrian zone,
good marketing strategies should be followed to include the community in the process.
Normally, the implementation of a pedestrian zone may have to be approved by the
community through public participation process.
5. Financing of a Pedestrian Zone
Financing the proposed pedestrian zone is obviously a very important consideration. An
example on how funds could be generated while creating a healthier CBD area is in
London where commuters and residents have to pay for the use of a vehicle within the city
centre through a special tax (Carvalho, 2017). During an interview with Mr Pelser, the
chairman of the Stellenbosch Rate Payers Association, this concept was also discussed.
The conclusion was however that the London taxation model may not be feasible in South
Africa or a town like Stellenbosch due to the perception that South Africans are already
overtaxed. The funding for projects of this nature will either be generated by the municipal
Stellenbosch University https://scholar.sun.ac.za
83 | P a g e
authority itself through existing taxation or allocated through alternative cooperative
governmental structures.
The project development process will typically be to identify and scope the project,
followed by incorporating the project into the Integrated Development Plan (IDP). The
final step will then be to obtain sufficient funding prior to implementation.
6. Economic Impact on the following aspects should be considered:
Tourism;
Property Taxes;
Gross Domestic Profit;
Health Costs;
Carbon Taxes.
Stellenbosch University https://scholar.sun.ac.za

84 | P a g e
12. CONCLUSIONS
The creation of green pedestrian zones in overpopulated urban and suburban areas can serve as a
solution to some of the major environmental problems faced in South Africa and worldwide.
The primary research question was whether the implementation of a green pedestrian zone can be
feasible in an area identified by local authorities. As aid to answer this question, a mathematical pre-
feasibility model was postulated based on previous studies.
The study objectives and how the objectives were met are discussed as follows:
1. Research the environmental problems faced today in city and town centres and methods to
mitigate these problems:
A literature review was conducted to determine which environmental problems are present worldwide
and particularly in South Africa. These problems were found to include, but are not limited to,
pollution, global warming, and overpopulation, loss of biodiversity, deforestation and depletion of the
ozone layer. Some of the main causes of environmental problems originate in cities and areas of dense
population as a result of urban sprawling and rapid urbanization. It is however concluded that there
are various methods to address these problems for example public transport, integrative urban design,
electric cars and pedestrianization, which was the focus of this study.
2. Research previous studies of pedestrian zones and investigate how GPZs may improve
environmental conditions, quality of life and whether GPZs is a feasible solution to mitigate
some of the negative environmental impacts currently faced in city and town centres:
Form literature of previous studies is can be concluded that pedestrian zones are a feasible solution to
some of the environmental problems. Green pedestrian zones can aid in the improvement of air
quality and the absorption of air pollutants. Green pedestrian zones can also add green space to the
community and contribute to improvements with regards to the social and economic conditions. Form
previous studies the conclusion is made that specific characteristics are required in determining
whether a pedestrian zone will be an effective solution.
3. Evaluate the best existing green engineering methods to include in green pedestrian zones
typical to South Africa:
In this study research was conducted on existing green engineering technologies. In South Africa the
most popular green engineering technologies are green roofs and green walls and therefore these
technologies were included in the pre-feasibility model. Form the literature and the pre-feasibility
model it can be concluded that the addition of green roofs and walls, as well as the planting of
additional trees, will contribute to address environmental problems such as air pollution and the urban
heat island effect.
Stellenbosch University https://scholar.sun.ac.za
85 | P a g e
4. Develop a model to determine the feasibility of a green pedestrian zone:
A model was developed that include describing factors on where to locate a green pedestrian zone,
what the aspects are to consider when a proposed green pedestrian zone will be implemented and
what positive effects can be expected once a green pedestrian zone is implemented.
It can be concluded that there are certain location characteristics that an area should meet for a
proposed pedestrian scheme to be successful. The most significant characteristics are that the type of
land use in the identified area should be mixed, the proposed pedestrian zone should be able to
interface with public transport facilities and the sense of safety and security should be created. It is
further concluded that multiple linear regression can be used to model the change in air quality when a
green pedestrian zone is implemented. Averages on benefits obtained in previous studies indicate that
the proposed pedestrian zone will benefit the economic and social factors of the area as well as the
traffic on the surrounding network.
Though the aim was to develop the pre-feasibility model as a mathematical model, the end result
includes alternative decision modelling techniques such as a location checklist.
As case study and validation of the model, the mathematical model was practically applied on the
town centre of Stellenbosch. From this exercise it can be concluded that Stellenbosch adheres to some
of the recommended characteristics but lacking public transport facilities, which is considered one of
the “must have” characteristics. It is further found that the pedestrian scheme may have a slight
worsening effect on the air quality in total. This could possibly be that due to the small size of the
proposed area, the pollution caused by the displaced traffic will still be present in the pedestrian
scheme. The implementation of green engineering technologies will however contribute to the
removal of additional air pollutants. The predetermined economic and social benefits are expected to
be positive based on previous studies.
Stellenbosch University https://scholar.sun.ac.za

86 | P a g e
13. FUTURE RESEARCH
Due to the broad scope of pedestrian zones and the transportation planning industry there are many
possibilities for additional research in this field. Not only can the study presented in this thesis be
taken further, but new research topics can also be derived from this study.
The following list provides future research opportunities to supplement or enhance this study:
Obtain results from more additional previous studies in order to expand the data range. This
research will contribute to the accuracy of the developed model equations;
Expand Part 2 of the pre-feasibility model to translate the factors addressed in the model as a
single economic value and benefit;
Develop a third part to the pre-feasibility model that includes a checklist for all legal aspects,
policies and frameworks that should be consulted before the implementation of a pedestrian zone;
Include more green engineering technologies such as green pavement, recycling bins and solar
street lighting;
Develop a model to determine the implementation cost of a proposed green pedestrian zone;
Conduct a Cost-Benefit Analysis;
Obtain additional thorough previous studies to validate the developed pre-feasibility model.
Some new research topics developed from this study may include:
Research how many green pedestrian zones should be implemented in South Africa to neutralize
the total carbon footprint of the country;
How will the growth in green electrical cars impact the need for green pedestrian zones as a
measure to address air pollution?
Stellenbosch University https://scholar.sun.ac.za

87 | P a g e
14. BIBLIOGRAPHY
Active Boomer Adventures. 2016. Goteborg Sweden: A City of Neighborhoods and Parks - Active
Boomer Adventures. [Online], Available:
http://www.activeboomeradventures.com/2016/08/17/goteborg-sweden-a-city-of-
neighborhoods-and-parks/ [2018, October 21].
Afar. 2017. No Cars Allowed: The 10 Best Pedestrian Streets Around the World | AFAR. [Online],
Available: https://www.afar.com/slideshows/no-cars-allowed-the-10-best-pedestrian-streets-
around-the-world?slide=1 [2017, August 13].
Anderson, P.M.L., Avlonitis, G. & Ernstson, H. 2014. Ecological outcomes of civic and expert-led
urban greening projects using indigenous plant species in Cape Town, South Africa. Landscape
and Urban Planning. 127:104–113.
Arias, G. 2015. MOBILITY IN BOGOTÁ - Mental Map. [Online], Available:
https://www.mindomo.com/es/mindmap/mobility-in-bogota-
b258ae7a21354861bd16f3a24e209863 [2018, July 16].
Baharash Architecture. 2018. Liveable cities: How much green space does your city have? [Online],
Available: https://www.baharash.com/liveable-cities-how-much-green-space-does-your-city-
have/ [2018, July 17].
Bausells, M. 2016. Superblocks to the rescue: Barcelona’s plan to give streets back to residents |
Cities | The Guardian. [Online], Available:
https://www.theguardian.com/cities/2016/may/17/superblocks-rescue-barcelona-spain-plan-
give-streets-back-residents [2018, March 10].
Blaga, O. 2013. Pedestrian zones as important urban strategies in redevelopment of community –
Case study : Alba Iulia. Transylvanian Review of Administrative Sciences. (38):5–22.
Brebbia, C.A. 2000. The Impact of Pedestrianization Schemes on the Environmental Quality at
Central Areas.
Burger, S. 2017. Proposed carbon tax “least-cost manner” to ensuring greenhouse-gas reduction –
Treasury. [Online], Available: http://www.engineeringnews.co.za/article/proposed-carbon-tax-
least-cost-manner-to-ensuring-greenhouse-gas-reduction-treasury-2017-12-15 [2018, February
19].
Cabe. n.d. The Value of Public Space. [Online], Available:
https://www.designcouncil.org.uk/sites/default/files/asset/document/the-value-of-public-
space1.pdf [2017, October 30].
Capital Markets in Africa. 2015. African Investment And Finance | Capital Markets in Africa.
[Online], Available: http://www.capitalmarketsinafrica.com/afdb-approves-us-141-71million-
for-the-dar-es-salaam-bus-rapid-transit-system-project/ [2018, July 16].
Carvalho, R. 2017. London to introduce vehicle pollution tax from October. [Online], Available:
https://uk.reuters.com/article/uk-britain-london-pollution/london-to-introduce-vehicle-pollution-
tax-from-october-idUKKBN15W1DH [2018, June 23].
Castillo-Manzano, J.I., Lopez-Valpuesta, L. & Asencio-Flores, J.P. 2014. Extending pedestrianization
processes outside the old city center; conflict and benefits in the case of the city of Seville.
Habitat International. 44:194–201.
Stellenbosch University https://scholar.sun.ac.za
88 | P a g e
Chiquetto, S. 1997. The environmental impacts from the implementation of a pedestrianization
scheme. Transportation Research Part D: Transport and Environment. 2(2):133–146.
CIFF. 2017. Cities and climate change: Cities on the frontline. [Online], Available:
https://ciff.org/impact/cities-frontline/?gclid=CjwKCAjwt8rMBRBOEiwA2F2biFLcalhX-
2Sd6_-uH7l2HVzMMR6QLcv_HWGElxcvpo0_hAEPviByPBoCIXgQAvD_BwE [2017,
August 15].
Coca-Stefaniak, A. 2013. Successfull Town Centres. [Online], Available:
http://thegreatbritishhighstreet.co.uk/pdf/Successful-Town-Centres.pdf?2.
Conserve Energy Future. 2017. Causes and Effects of Environmental Degradation. [Online],
Available: https://www.conserve-energy-future.com/causes-and-effects-of-environmental-
degradation.php [2017, September 25].
CSIR. 1999. Ecologically Sound Urban Development. 1–14. [Online], Available:
https://www.csir.co.za/sites/default/files/Documents/Chapter_05_08_02_Vol_I.pdf.
Currie, B.A. & Bass, B. 2008. Estimates of air pollution mitigation with green plants and green roofs
using the UFORE model.
Darko, W.O. & Atuahene, F. 2015. The contradiction of Demotorisation : a Literature Argument.
5(12):127–143.
Derby City Council. 2017. Matter 4 : City Centre , Other Centres and Town Centre Uses. [Online],
Available:
http://www.derby.gov.uk/media/derbycitycouncil/contentassets/documents/policiesandguidance/
planning/DerbyCityCouncil_Matter4.pdf [2017, March 09].
Design Trust for Public Space. n.d. Times Square : The Next 100 Years.
Dičiunaite-Rauktiene, R., Gurskiene, V., Burinskiene, M. & Maliene, V. 2018. The usage and
perception of pedestrian zones in Lithuanian Cities: Multiple Criteria and comparative analysis.
Sustainability (Switzerland). 10(3):1–22.
de Dios Ortuzar, J. and W. 2012. Modelling Transport. In Vol. 4 Modelling Transport. 367–373.
Dullah Omar Institute. 2016. City of Cape Town v Persons who are presently unlawfully occupying
Erf 1800, Capricorn: Vrygrond Development and Others [2003] 3 All SA 371 (C) — Dullah
Omar Institute. [Online], Available: https://dullahomarinstitute.org.za/socio-economic-
rights/Cases/South African Cases/high-court-cases/city-of-cape-town-v-persons-who-are-
presently-unlawfully-occupying-erf-1800-capricorn-vrygrond-development-and-others-2003-3-
all-sa-371-c [2018, October 24].
Edelstein-Keshet, L. 1988. Mathematical models in biology. McGraw-Hill. [Online], Available:
https://serc.carleton.edu/introgeo/mathstatmodels/index.html [2018, September 24].
Edmonds, I. 2013. Urbanization in South Africa | African Development Portrayed in Film |
Vanderbilt University. [Online], Available:
https://my.vanderbilt.edu/f13afdevfilm/2013/09/urbanization-in-south-africa/ [2018, June 14].
Frith, M.J., Johnson, S.D. & Fry, H.M. 2017. ROLE OF THE STREET NETWORK IN
BURGLARS’ SPATIAL DECISION-MAKING*. Criminology. 55(2):344–376.
Goldwyn. Eric. 2014. How “People-Centered” Design Made Times Square the Place To Be on New
Stellenbosch University https://scholar.sun.ac.za
89 | P a g e
Years Eve – Next City. [Online], Available: https://nextcity.org/daily/entry/urban-design-times-
square-concrete-bowtie-density-gehl-new-years-eve [2018, March 17].
Green Map. n.d. All Green Maps | Green Map System. [Online], Available:
https://www.greenmap.org/greenhouse/en/maps/list/all [2018, July 17].
greenroofs.org. 2018. About Green Roofs — Green Roofs for Healthy Cities. [Online], Available:
https://greenroofs.org/about-green-roofs/ [2018, July 02].
GreenWall_Australia. 2014. Evidence-based benefits of green roofs, walls and facades. [Online],
Available: http://greenwallaustralia.com.au/downloads/greenwall_info_pack.pdf [2017, June
06].
Hass-Klau, C. 1993a. Impact of pedestrianization and traffic calming on retailing A review of the
evidence from Germany and the UK. Transport Policy. 1(1):21–31. [Online], Available:
http://publiekeruimte.info/Data/Documents/rc5abtiq/39/Pedestrianization---retailing.pdf [2018,
June 04].
Hass-Klau, C. 1993b. Impact of pedestrianization and traffic calming on retailing A review of the
evidence from Germany and the UK. Transport Policy. 1(1):21–31. [Online], Available:
http://publiekeruimte.info/Data/Documents/rc5abtiq/39/Pedestrianization---retailing.pdf [2017,
October 30].
Hawley, K. 2014. Transforming cities for sustainability: Facts and Figures - SciDev.Net. [Online],
Available: http://www.scidev.net/global/cities/feature/transforming-cities-sustainability-facts-
figures.html [2017, February 13].
Huxham, T. 2014. My #NerdAlert Pilgrimage to the Roman Ruins of Pompeii, Italy. [Online],
Available: https://www.trevorhuxham.com/2014/05/my-nerdalert-pilgrimage-to-roman-
ruins.html [2018, October 21].
IRENA. 2017. Renewable Energy Auctions: Analysing 2016. [Online], Available:
http://www.irena.org/publications/2017/Jun/Renewable-Energy-Auctions-Analysing-2016
[2018, February 20].
Jung, H., Lee, S. young, Kim, H.S. & Lee, J.S. 2017. Does improving the physical street environment
create satisfactory and active streets? Evidence from Seoul’s Design Street Project.
Transportation Research Part D: Transport and Environment. 50.
Kilian, A. 2017. Western Cape Dept of Transport completes R152m green building project. [Online],
Available: http://www.engineeringnews.co.za/article/dept-of-transport-completes-r152m-green-
building-project-2017-07-12 [2017, July 13].
Kukreja, R. 2017. 15 Current Environmental Problems That Our World is Facing - Conserve Energy
Future. [Online], Available: http://www.conserve-energy-future.com/15-current-environmental-
problems.php [2017, May 26].
Lee, A.C.K., Jordan, H.C. & Horsley, J. 2015. Value of urban green spaces in promoting healthy
living and wellbeing: prospects for planning. Risk management and healthcare policy. 8:131–7.
Li, J.-F., Wai, O.W.H., Li, Y.S., Zhan, J.-M., Ho, Y.A., Li, J. & Lam, E. 2010. Effect of green roof on
ambient CO 2 concentration.
Microsoft. n.d. What Is Mathematical Modeling? [Online], Available:
https://www.sfu.ca/~vdabbagh/Chap1-modeling.pdf [2018, August 22].
Stellenbosch University https://scholar.sun.ac.za

90 | P a g e
Milasan, L. 2014. Oxford high street editorial photography. Image of oxford - 49020627. [Online],
Available: https://www.dreamstime.com/editorial-photography-oxford-high-street-uk-july-
crowds-people-shopping-shops-central-image49020627 [2018, October 17].
Moody, M. 2012. The case for transition to a sustainable transport system in Stellenbosch by.
Stellenbosch.
Musakwa, W. & Van Niekerk, A. n.d. Monitoring Urban Sprawl and Sustainable Urban Development
Using the Moran Index: A Case Study of Stellenbosch, South Africa. International Journal of
Applied Geospatial Research. 5(3):1–20.
National Physical Laboratory. 2018. Mathematical and Statistical Modelling : Modelling :
Mathematics & Scientific Computing : Research : Mathematics, Modelling &
Simulation : Science + Technology : National Physical Laboratory. [Online], Available:
http://www.npl.co.uk/mathematics-scientific-computing/modelling/mathematical-and-statistical-
modelling/ [2018, September 24].
Nils Zimmermann. 2016. Five of the world′s biggest environmental problems | DW Environment |
DW | 11.10.2016. [Online], Available: http://www.dw.com/en/five-of-the-worlds-biggest-
environmental-problems/a-35915705 [2017, May 28].
OneStreet. 2018. Traffic Evaporation. [Online], Available: https://www.onestreet.org/resources-for-
increasing-bicycling/115-traffic-evaporation [2018, October 17].
Öztaş, Ç.Ç. & Akı, M. 2014. ISTANBUL HISTORIC PENINSULA PEDESTRIANIZATION
PROJECT. [Online], Available: www.embarqturkiye.org [2018, May 29].
Plant, W. 2014. Wonder Plant. [Online], Available: https://www.wonderplant.co.za/ [2017, June 05].
Van der Post, J. 2017. You’ll never guess how many vehicles are registered in SA. Wheels24. 28
March. [Online], Available: http://www.wheels24.co.za/News/Industry_News/youll-never-
guess-how-many-vehicles-are-registered-in-sa-20170328.
Ribbens, H. 2017. Human Factors in Traffic Collisions. In Pedestrian Behaviour and Risk in the
South African Context. 4–5.
Ribbens, H., Everitt, P. & Noah, M. 2008. Safety of Non-motorized Road Users. [Online], Available:
http://researchspace.csir.co.za/dspace/bitstream/handle/10204/2756/Ribbens_2008.pdf?sequence
=1.
Riffat, S., Powell, R. & Aydin, D. 2016. Future cities and environmental sustainability. Future Cities
and Environment. 2(1):1.
Robinson, M. 2016. Urb-i and Google Street View amazing public-space transformations - Business
Insider. [Online], Available: http://uk.businessinsider.com/urbi-public-space-transformations-
2016-3?IR=T/#we-are-a-society-addicted-to-cars-according-to-the-four-young-founders-of-urb-
i-1 [2018, October 24].
Robinson, M. 2017. Business Insider UK: 50 incredible public-space transformations captured by
Google Street View. [Online], Available: http://uk.businessinsider.com/google-street-view-
public-space-transformations-2017-6?IR=T [2018, October 17].
Rose Paving LLC. 2017. Green Paving Solutions | LEED Green, Eco-Friendly Pavement Services.
[Online], Available: http://www.rosepaving.com/parking-lot-paving-chicago/solutions/green-
paving-solutions/ [2017, June 06].
Stellenbosch University https://scholar.sun.ac.za

91 | P a g e
Scrivener, E. 2016. Best shopping streets in Cologne | Global Blue. [Online], Available:
http://www.globalblue.com/destinations/germany/best-shopping-streets-in-cologne/#slide2
[2018, October 20].
Sevillano, S. 2015. Soliloquy Sevillano / splotches and snippets from a rambling tourist. [Online],
Available: http://blogs.cornell.edu/cuaksp57/ [2018, October 17].
Shackleton, C.M. & Blair, A. 2013. Perceptions and use of public green space is influenced by its
relative abundance in two small towns in South Africa. Landscape and Urban Planning.
113:104–112.
Sheffi, Y. 1985. Urban Transportation Networks. New Jersey. [Online], Available:
http://web.mit.edu/sheffi/www/selectedMedia/sheffi_urban_trans_networks.pdf.
Sisman, E.E. 2013. Pedestrain Zones.
Soni, N. & Soni, N. 2016. Benefits of pedestrianization and warrants to pedestrianize an area. Land
Use Policy. 57.
Space, D. 1972. CHAPTER 9: CRIME PREVENTION THROUGH ENVIRONMENTAL DESIGN.
[Online], Available:
http://www.brooklynpark.org/assets/1/25/Chapter_9_Crime_Prevention_Through_Environmenta
l_Design.pdf [2017, October 30].
Statistics Solutions. 2013. What is Linear Regression? [Online], Available:
http://www.statisticssolutions.com/what-is-linear-regression/ [2018, August 23].
StatsSA | Interactive Graphs. 2017. [Online], Available: http://cs2016.statssa.gov.za/?page_id=270
[2017, August 13].
Stellenbosch Wine Route. 2018. Stellenbosch Wine Route | South Africa. [Online], Available:
http://www.wineroute.co.za/page/?page=ourstory.htm [2018, September 26].
Sustainability Institute. 2012. Stellenbosch Municipality. Stellenbosch. [Online], Available:
file:///C:/Users/Anneri/Downloads/Stellenbosch_Municipality_SDF_Part_1 (1).pdf.
Suzuki, D. 2014. Discourage Urban Sprawl | Reduce your carbon footprint | What you can do | David
Suzuki Foundation. [Online], Available: http://www.davidsuzuki.org/what-you-can-do/reduce-
your-carbon-footprint/discourage-urban-sprawl/ [2017, August 15].
Transport for London. n.d. About the LEZ - Transport for London. [Online], Available:
https://tfl.gov.uk/modes/driving/low-emission-zone/about-the-lez?intcmp=2263 [2018, June 23].
Transportation Research Board. 2010. HCM2010. Washington, DC.
US EPA, O. 2017. Green Engineering. [Online], Available: https://www.epa.gov/green-engineering
[2017, February 10].
Üzümoğlu, T., Tolgay, S., Helvacı, F.Ö., Yıldız, A. & Doğan, M. 2015. ASSESSMENT OF THE AIR
QUALITY EFFECTS OF PEDESTRIANIZATION ON İSTANBUL’S HISTORIC PENINSULA.
Istanbul. [Online], Available: www.embarqturkiye.org [2018, March 18].
Veisten, K., Smyrnova, Y., Klæboe, R., Hornikx, M., Mosslemi, M. & Kang, J. 2012. Valuation of
green walls and green roofs as soundscape measures: including monetised amenity values
together with noise-attenuation values in a cost-benefit analysis of a green wall affecting
Stellenbosch University https://scholar.sun.ac.za

92 | P a g e
courtyards. International journal of environmental research and public health. 9(11):3770–88.
Wallztrom, M. 2004. Reclaiming city streets for people Chaos or quality of life? [Online], Available:
http://ec.europa.eu/environment/pubs/pdf/streets_people.pdf [2017, April 11].
Watanabe, K., Ueno, M., Kamiya, D., Nishiyama, A., Matsumura, M., Wataya, T., Takahashi, J.B.,
Nishikawa, S., et al. 2007. [ No Title ]. Nature Biotechnology. 25(6):681–686.
White, R., Turpie, J. & Letley, G. 2017. Greening Africa’s Cities. [Online], Available:
www.worldbank.org.
Whitehead, T., Simmonds, D. & Preston, J. 2006. The effect of urban quality improvements on
economic activity.
WMC Retail Partners. 2017. Chester - WMC Retail. [Online], Available: http://www.wmc-
retail.com/2016/08/23/chester/ [2018, July 16].
Worldometers - real time world statistics. 2018. [Online], Available: http://www.worldometers.info/
[2018, October 17].
Van Wyngaardt, M. 2017. Green building improvements needed to meet Paris agreement. [Online],
Available: http://www.engineeringnews.co.za/article/green-building-improvements-needed-to-
meet-paris-agreement-2017-12-15/rep_id:4136 [2018, February 19].
Yale University. 2017. GLOBAL METRICS FOR THE ENVIRONMENT. [Online], Available:
http://epi.yale.edu/sites/default/files/2016EPI_Full_Report_opt.pdf [2017, June 05].
Yang, J., Yu, Q. & Gong, P. 2008. Quantifying air pollution removal by green roofs in Chicago.
Stellenbosch University https://scholar.sun.ac.za
A-1 | P a g e
APPENDIX A: ELABORATION OF ENVIRONMENTAL
CONCERNS
In this section a discussion of the following environmental concerns are provided:
A.1 Urbanization and Urban Sprawling as Environmental Concern
Nearly two thirds of the population in South Africa live in urban areas, meeting the definition of
urbanization (Edmonds, 2013). Due to the high rate of urbanisation, urban sprawling is inevitable.
The environmental and socio-economic cost associated with urban sprawling is unsustainable. The
increase in vehicle miles travelled results in the loss of natural resources, an increase in energy
consumption and higher levels of air pollution, all contributing to the environmental costs (Musakwa
& Van Niekerk, 2018).
Socio-economic costs as result of urban sprawling include the decay of city centres, social and
psychological costs and an increase in infrastructure and public service costs (Musakwa & Van
Niekerk, 2018). In South Africa, urban sprawling is mainly caused by the lack of accessibility and
functional open spaces which is in turn directly related to vehicle miles travelled (Musakwa & Van
Niekerk, 2018).
Households located in areas which are close to work, spend less time per day travelling, thus saving
costs and emitting less greenhouse gases. Trips also get shorter with an increase in density indicating
that more citizens should be located in city centres where shorter trip lengths and times can be
expected. Energy efficiency is reduced as the distance between people and buildings increase. In
addition, in compact cities the fuel consumption per capita is much less than in low-density sprawling
cities. This is another motivation to revitalise city centres in order to make cities more liveable and to
reduce sprawling (Musakwa & Van Niekerk, 2018) .
Motivations to counter urban sprawling include (Musakwa & Van Niekerk, 2018):
1. With less vehicle miles travelled, less vehicle emissions and greenhouse gasses are released
into the atmosphere, reducing the contribution to climate change;
2. Infrastructure costs per capita decrease with an increase in density;
3. Costs of energy infrastructure can be amortised by the steady source of revenue provided by
dense developments;
4. Urban sprawl increases social costs by depriving access to the environment, resulting in the
deprivation of interaction between residents. Neighbourhoods become less compact and loses
the sense of social vibrancy;
5. Urban expansion brings about losses in natural resources (fauna and flora), farmland, and
natural habitats;
6. Urban sprawl can result in the declining of city centres as area for new developments (the city
centre is “killed”). As an example, in Durban, developments north of the CBD area are
favoured. A similar trend was noticed in Harare, Zimbabwe.
The effect of urban sprawling on urban sustainability is illustrated in Figure A1.
Stellenbosch University https://scholar.sun.ac.za

A-2 | P a g e
Figure A1: Urban sprawl and its impacts as adapted from source (Musakwa & Van Niekerk, 2018)
A chain reaction of the effects of urbanization is illustrated in Figure A2. From this chain reaction it
can be seen that urbanization has an impact on the natural environment that can revert back to the
urban city character. The natural environment also has an impact on the economy.
Figure A2: Effects of urbanization (White et. al., 2017)
Stellenbosch University https://scholar.sun.ac.za
A-3 | P a g e
The effects of urbanization can be summarized as follows:
Urbanisation impacts natural environment → natural environment impacts cities → cities
influence living circumstances and therefore welfare.
A.2 Effect of Urbanization on Green Space
In some African cities such as Cairo in Egypt or Luanda in Angola, the green space per capita is 1m2.
The World Health Organization however recommends that the green space per capita should be at
least 9 m2 and the United Nations recommend at least 30 m
2. Green spaces include public parks,
greenways, waterways, and other recreation areas (White et. al., 2017).
In South Africa the trend of urban development encroaching on the natural environment is also
apparent. The Durban Bay estuary has been reduced by 57% and only 4% of the natural shoreline and
3% of the mangrove forests still remain (White et. al., 2017).
In addition, it should be noted that urbanization also causes hydrological changes. Rainfall is
prevented by roofs, paved areas, roads, buildings and other hard surfaces to infiltrate the soil and thus
increasing the rate and volume of storm water run-off. This can lead to river channels becoming
eroded or the increase of flood inundation areas. Some of these changes can be attributed to climate
change, but the primary cause is the change in land cover. The wetlands, rivers and estuaries of Cape
Town, South Africa, underwent transformation and are now systems dominated by reeds due to the
additional water brought into the city as an effect of insufficient infiltration.
In South Africa, the cities of Cape Town and Durban are situated within biodiversity rich areas,
meaning that urbanization in these cities will negatively affect biodiversity and cause the loss thereof.
Every year Durban loses 2% of its terrestrial vegetation. This is one of the results of only 10% of open
space in Durban being formally protected. Similarly in Cape Town, 13 plant species have become
extinct and 319 species endangered (White et. al., 2017).
A.3 Air Pollution as Environmental Concern
It is important to note that once an environment has been lost it is difficult to rehabilitate it to its
natural state. It is however possible for cities to intervene in order to improve the environmental
situation. London and Mexico are examples of where the quality of the environment was improved to
the benefit of its inhabitants. London implemented strict regulations that prohibit the dumping of
pollutants and the directing of sewage and solid waste into River Thames. This resurged river fauna
and flora. In Mexico old cars were replaced, lead was removed from fuel, provision of public
transport was expanded and the use of natural gasoline was adopted. These efforts drastically reduced
air pollution and associated health problems experienced in both London and Mexico. Effectively
both the cities became more liveable (White et. al., 2017).
From Figure A3, it can be seen that African cities generate higher levels of particulate matter (PM)
compared to other regions. Comparing Johannesburg to cities from developed countries such as
London or New York (which are both larger cities than Johannesburg), it is clear that Johannesburg
should reduce the amount of particulate matter released into the atmosphere. Noteworthy is that
Johannesburg produces more particulate matter per year than what is acceptable by the World Health
Organization (White et. al., 2017). Small particular matter includes black carbon, nitrates, sulphates,
dust and other pollutants. These particles penetrate the lungs and the cardiovascular system, causing
Stellenbosch University https://scholar.sun.ac.za

A-4 | P a g e
severe health implications. Reduced levels of particular matter are therefore beneficial to all people
and the natural environment.
Figure A3: Levels of PM in Asian, African and European cities (White et. al., 2017)
Air pollution was the cause of 5.5 million premature deaths in 2013 (White et. al., 2017). Each year
the amount of premature deaths caused by air pollution, increases. In 2010 there was a total of
678 397 premature deaths in Africa caused by air pollution. This figure increased to 712 482 in 2013.
This includes household air pollution and ambient particulate matter pollution. In most African
countries, formal regulation on air pollution is lacking. According to the latest WHO urban air quality
database, 98% of low to middle income cities do not meet the WHO air quality standard. The annual
mean concentration of PM10 in some South African cities can be seen in Figure A4.
Figure A4: Annual mean PM concentrations in South Africa and Nigeria (White et. al., 2017)
Stellenbosch University https://scholar.sun.ac.za

B-1 | P a g e
APPENDIX B: POSSIBLE SOLUTIONS TO
ENVIRONMENTAL PROBLEMS
In this section a variety of different solutions to environmental problems, as discussed in Chapter 3, is
discussed. The possible solutions include the following (Hawley, 2014):
1. Public Transport;
2. Integrative Urban Design;
3. Waste Management;
4. Biomimicry;
5. Low-Carbon Cities, T-Charge, Congestion Tax and Low Emission Zone Charge;
6. Electric Cars;
7. The Paris Agreement;
8. Green Engineering Technologies;
B.1 Public Transport
The city of Curitiba in Brazil introduced the first Bus Rapid Transit (BRT) system as a form of public
transport. This initiative opened up 52m2
of green space per capita (Hawley, 2014). By creating
compact transport services with dedicated areas to move in, space is saved. In Figure B1 the BRT of
Curitiba can be seen.
Figure B1: Curitiba in Brazil introduced the first Bus Rapid Transit (BRT) (Open Streets, 2017)
B.2 Integrative Urban Design
Integrative Urban Design emphasises the functioning of a system as a whole. In the city of Bogota,
Colombia, mobility strategies are integrated into urban design to promote sustainability. Mobility in
terms of the transport system can include the integration of bus routes, bicycle pathways and rail lines
Stellenbosch University https://scholar.sun.ac.za

B-2 | P a g e
to function as a connected network (Hawley, 2014). In Figure B2 the dedicated areas for the different
modes of transport can be seen as an integrated mobility network.
Figure B2: Mobility in Bogota (Arias, 2015)
In Dar es Salaam, Tanzania, a BRT system was planned specifically with high-capacity and low
carbon buses that are cleaner, quieter and more fuel-efficient than conventional buses. This form of
integrated design is well suited for public transport. Another example of integrated design can be
building constructions that utilise water- and energy-reduction systems and make use of local
materials to reduce the use of natural as well as harmful resources (Hawley, 2014). Figure B3
provides an example of the BRT system in Tanzania.
Figure B3: Dar es Salaam BRT (Capital Markets in Africa, 2015)
Stellenbosch University https://scholar.sun.ac.za
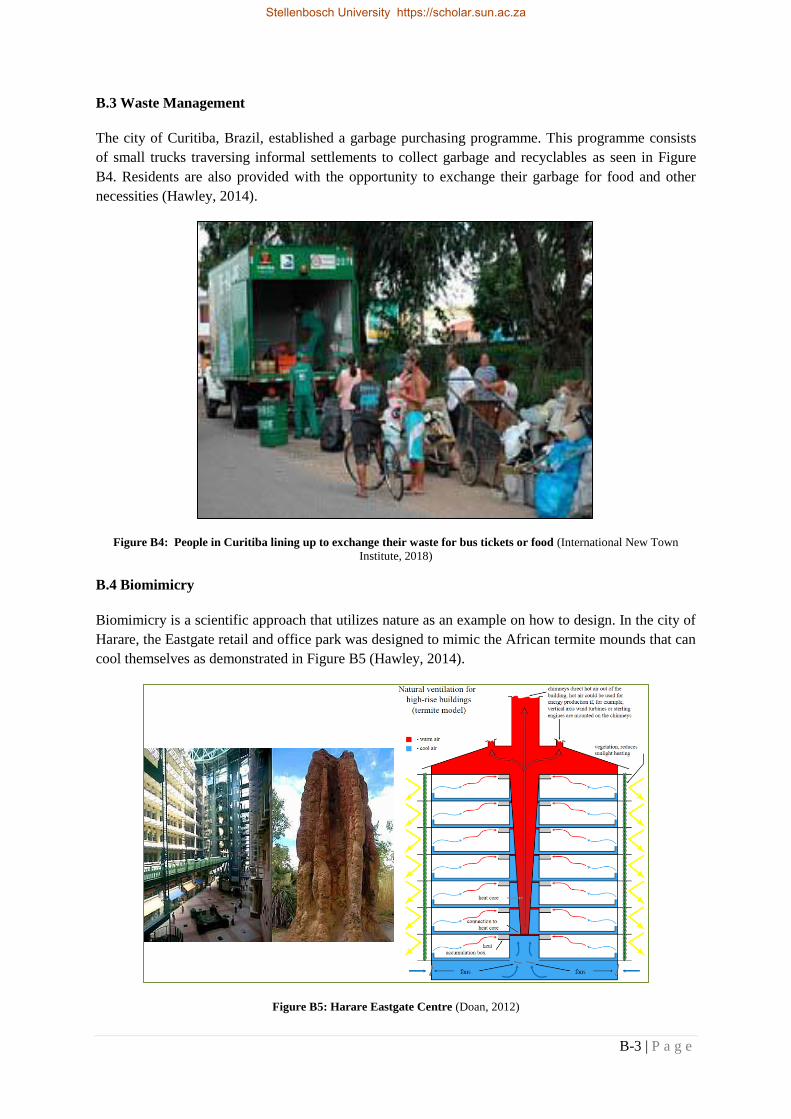
B-3 | P a g e
B.3 Waste Management
The city of Curitiba, Brazil, established a garbage purchasing programme. This programme consists
of small trucks traversing informal settlements to collect garbage and recyclables as seen in Figure
B4. Residents are also provided with the opportunity to exchange their garbage for food and other
necessities (Hawley, 2014).
Figure B4: People in Curitiba lining up to exchange their waste for bus tickets or food (International New Town
Institute, 2018)
B.4 Biomimicry
Biomimicry is a scientific approach that utilizes nature as an example on how to design. In the city of
Harare, the Eastgate retail and office park was designed to mimic the African termite mounds that can
cool themselves as demonstrated in Figure B5 (Hawley, 2014).
Figure B5: Harare Eastgate Centre (Doan, 2012)
Stellenbosch University https://scholar.sun.ac.za
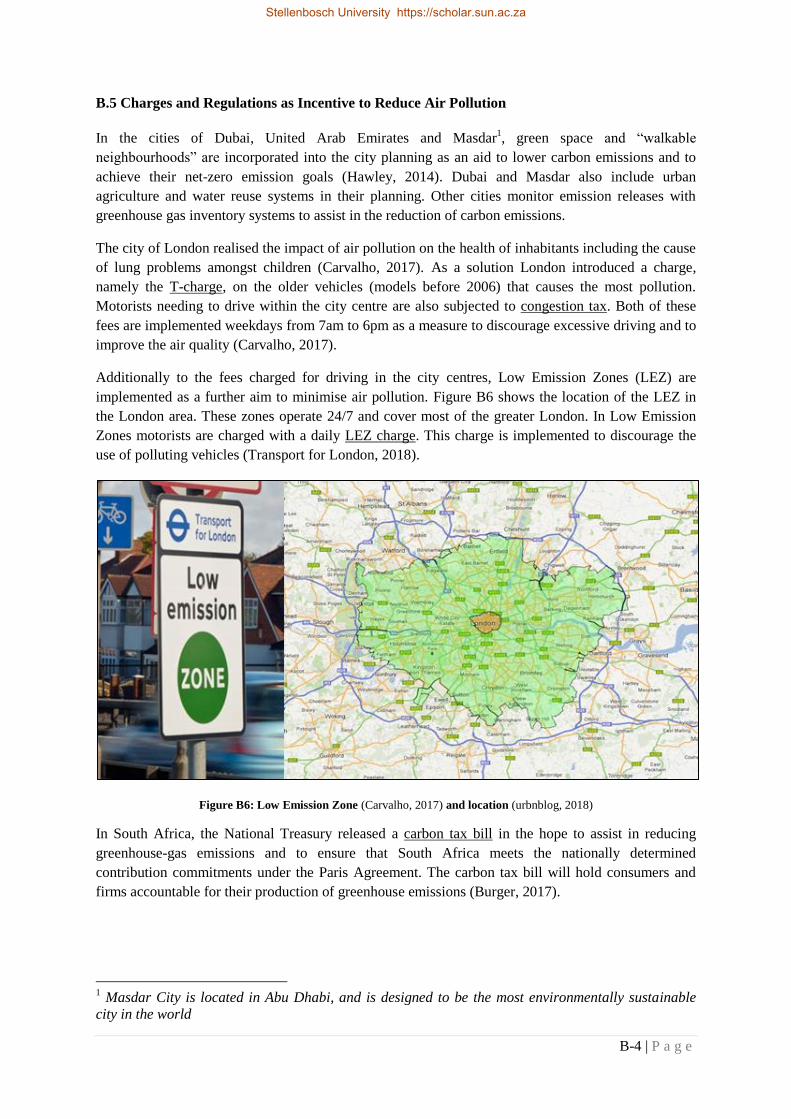
B-4 | P a g e
B.5 Charges and Regulations as Incentive to Reduce Air Pollution
In the cities of Dubai, United Arab Emirates and Masdar1, green space and “walkable
neighbourhoods” are incorporated into the city planning as an aid to lower carbon emissions and to
achieve their net-zero emission goals (Hawley, 2014). Dubai and Masdar also include urban
agriculture and water reuse systems in their planning. Other cities monitor emission releases with
greenhouse gas inventory systems to assist in the reduction of carbon emissions.
The city of London realised the impact of air pollution on the health of inhabitants including the cause
of lung problems amongst children (Carvalho, 2017). As a solution London introduced a charge,
namely the T-charge, on the older vehicles (models before 2006) that causes the most pollution.
Motorists needing to drive within the city centre are also subjected to congestion tax. Both of these
fees are implemented weekdays from 7am to 6pm as a measure to discourage excessive driving and to
improve the air quality (Carvalho, 2017).
Additionally to the fees charged for driving in the city centres, Low Emission Zones (LEZ) are
implemented as a further aim to minimise air pollution. Figure B6 shows the location of the LEZ in
the London area. These zones operate 24/7 and cover most of the greater London. In Low Emission
Zones motorists are charged with a daily LEZ charge. This charge is implemented to discourage the
use of polluting vehicles (Transport for London, 2018).
Figure B6: Low Emission Zone (Carvalho, 2017) and location (urbnblog, 2018)
In South Africa, the National Treasury released a carbon tax bill in the hope to assist in reducing
greenhouse-gas emissions and to ensure that South Africa meets the nationally determined
contribution commitments under the Paris Agreement. The carbon tax bill will hold consumers and
firms accountable for their production of greenhouse emissions (Burger, 2017).
1 Masdar City is located in Abu Dhabi, and is designed to be the most environmentally sustainable
city in the world
Stellenbosch University https://scholar.sun.ac.za
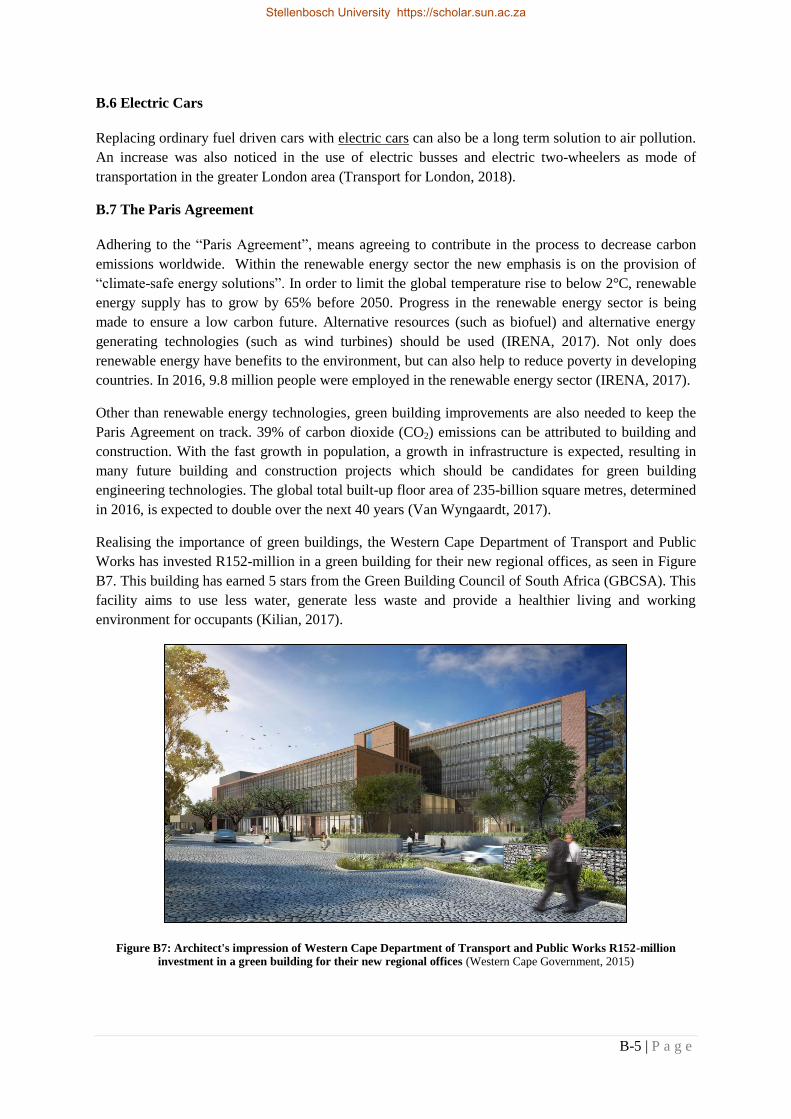
B-5 | P a g e
B.6 Electric Cars
Replacing ordinary fuel driven cars with electric cars can also be a long term solution to air pollution.
An increase was also noticed in the use of electric busses and electric two-wheelers as mode of
transportation in the greater London area (Transport for London, 2018).
B.7 The Paris Agreement
Adhering to the “Paris Agreement”, means agreeing to contribute in the process to decrease carbon
emissions worldwide. Within the renewable energy sector the new emphasis is on the provision of
“climate-safe energy solutions”. In order to limit the global temperature rise to below 2°C, renewable
energy supply has to grow by 65% before 2050. Progress in the renewable energy sector is being
made to ensure a low carbon future. Alternative resources (such as biofuel) and alternative energy
generating technologies (such as wind turbines) should be used (IRENA, 2017). Not only does
renewable energy have benefits to the environment, but can also help to reduce poverty in developing
countries. In 2016, 9.8 million people were employed in the renewable energy sector (IRENA, 2017).
Other than renewable energy technologies, green building improvements are also needed to keep the
Paris Agreement on track. 39% of carbon dioxide (CO2) emissions can be attributed to building and
construction. With the fast growth in population, a growth in infrastructure is expected, resulting in
many future building and construction projects which should be candidates for green building
engineering technologies. The global total built-up floor area of 235-billion square metres, determined
in 2016, is expected to double over the next 40 years (Van Wyngaardt, 2017).
Realising the importance of green buildings, the Western Cape Department of Transport and Public
Works has invested R152-million in a green building for their new regional offices, as seen in Figure
B7. This building has earned 5 stars from the Green Building Council of South Africa (GBCSA). This
facility aims to use less water, generate less waste and provide a healthier living and working
environment for occupants (Kilian, 2017).
Figure B7: Architect's impression of Western Cape Department of Transport and Public Works R152-million
investment in a green building for their new regional offices (Western Cape Government, 2015)
Stellenbosch University https://scholar.sun.ac.za
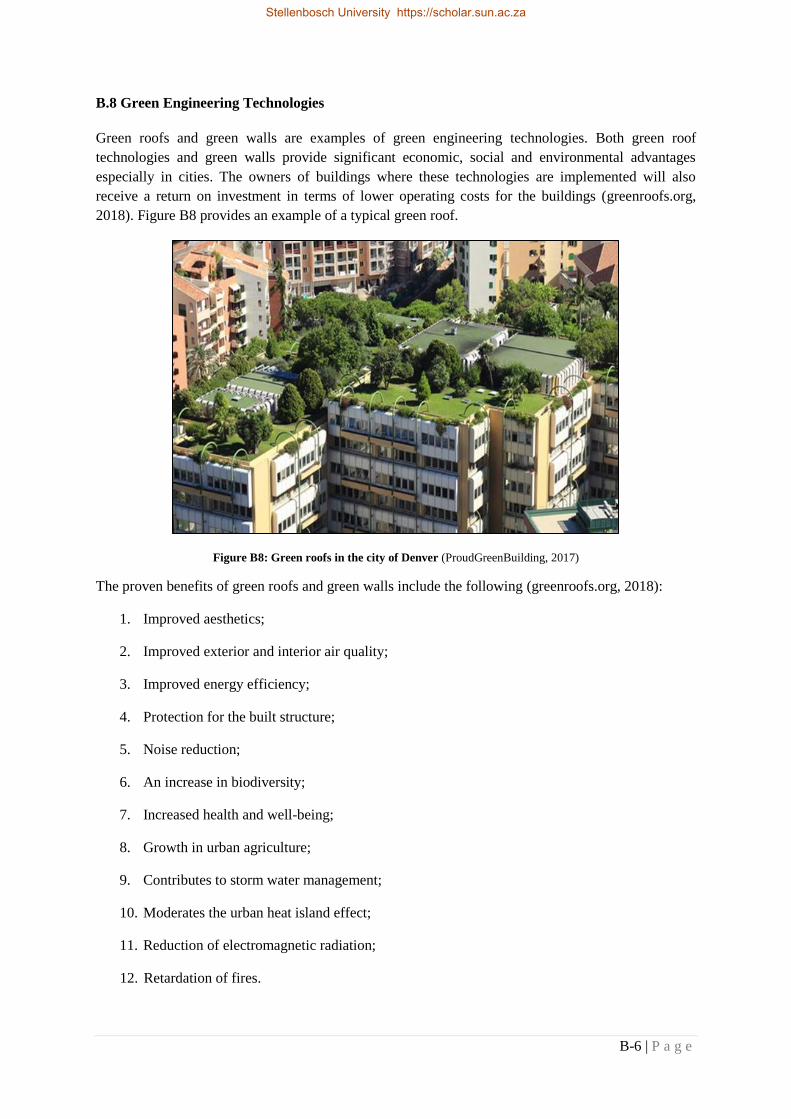
B-6 | P a g e
B.8 Green Engineering Technologies
Green roofs and green walls are examples of green engineering technologies. Both green roof
technologies and green walls provide significant economic, social and environmental advantages
especially in cities. The owners of buildings where these technologies are implemented will also
receive a return on investment in terms of lower operating costs for the buildings (greenroofs.org,
2018). Figure B8 provides an example of a typical green roof.
Figure B8: Green roofs in the city of Denver (ProudGreenBuilding, 2017)
The proven benefits of green roofs and green walls include the following (greenroofs.org, 2018):
1. Improved aesthetics;
2. Improved exterior and interior air quality;
3. Improved energy efficiency;
4. Protection for the built structure;
5. Noise reduction;
6. An increase in biodiversity;
7. Increased health and well-being;
8. Growth in urban agriculture;
9. Contributes to storm water management;
10. Moderates the urban heat island effect;
11. Reduction of electromagnetic radiation;
12. Retardation of fires.
Stellenbosch University https://scholar.sun.ac.za
C-1 | P a g e
APPENDIX C: DESCRIPTION OF PREVIOUS STUDIES
In this section the previous studies included in the research to develop the pre-feasibility model, are
discussed.
C.1 The Effect of Pedestrianization on Air Quality
The effects of pedestrianized schemes in the following five cities are included in this section:
1. Chester,
2. Nuremburg,
3. Oxford,
4. Istanbul,
5. Katerini and Rhodes.
1. The Chester Case
In a transport and travel research study for Chester, UK, it was found that traffic flow characteristics
and the speed at which vehicles travel as part of the transportation system in urban areas are the
primary cause for air and noise pollution (Chiquetto, 1997).
The study researched how the implementation of a pedestrianization scheme could impact the
environment. The rate at which emissions are released by vehicles were found to be much higher in
congested areas where the principle driving pattern is that of acceleration followed by deceleration
movements. These movements are typically found in urban areas, where pedestrian activities are also
expected (Chiquetto, 1997).
The entire urban and road network of Chester was considered. The urban network is provided in
Figure C1, where the solid dark lines indicate roads in the area where the pedestrianization scheme
has been implemented.
Stellenbosch University https://scholar.sun.ac.za

C-2 | P a g e
Figure C1: Chester case study pedestrianization scheme (Chiquetto, 1997)
Traffic contributes significantly to the release of greenhouse emissions, of which the primary
emissions include carbon monoxide (CO), hydrocarbons (HC), carbon dioxide (CO2), oxides of
nitrogen (NOx) and particular matter (PM). These emissions were investigated and were measured in
kilograms per hour. As part of the implementation of the pedestrianization scheme in the central area,
traffic in the central area was diverted to the surrounding network. The primary characteristics of
traffic contributing to air and noise pollution are traffic flow, speed, travel distance and level of
congestion.
The emissions in the total network and central area before and after the closure of the central streets
for traffic were measured and are presented in Table C1. The percentage difference in each of the
emissions before and after pedestrianization is also provided (Chiquetto, 1997).
Table C1: Emission counts of Chester case study
Before Percentage Change After
Central Area Total Network Central Area Total Network Central Area Total Network
Em
issi
on
kg
/h
Em
issi
on
kg
/h
Em
issi
on
%
Em
issi
on
%
Em
issi
on
kg
/h
Em
issi
on
kg
/h
CO 200 CO 1000 CO -6.5 CO 4.5 CO 187 CO 1045
HC 50 HC 250 HC -6 HC 4.5 HC 47 HC 261.25
NOx 30 NOx 200 NOx 0.5 NOx 5.5 NOx 30.15 NOx 211
CO2 5300 CO2 30600 CO2 -5 CO2 5 CO2 5035 CO2 32130
PM 1.8 PM 20 PM 5.75 PM 6 PM 1.9035 PM 21.2
From the data presented in Table C1 it can be seen that there was a slight decrease in the total
greenhouse emissions produced in the central area, except for NOx and PM. The average decrease is
Stellenbosch University https://scholar.sun.ac.za
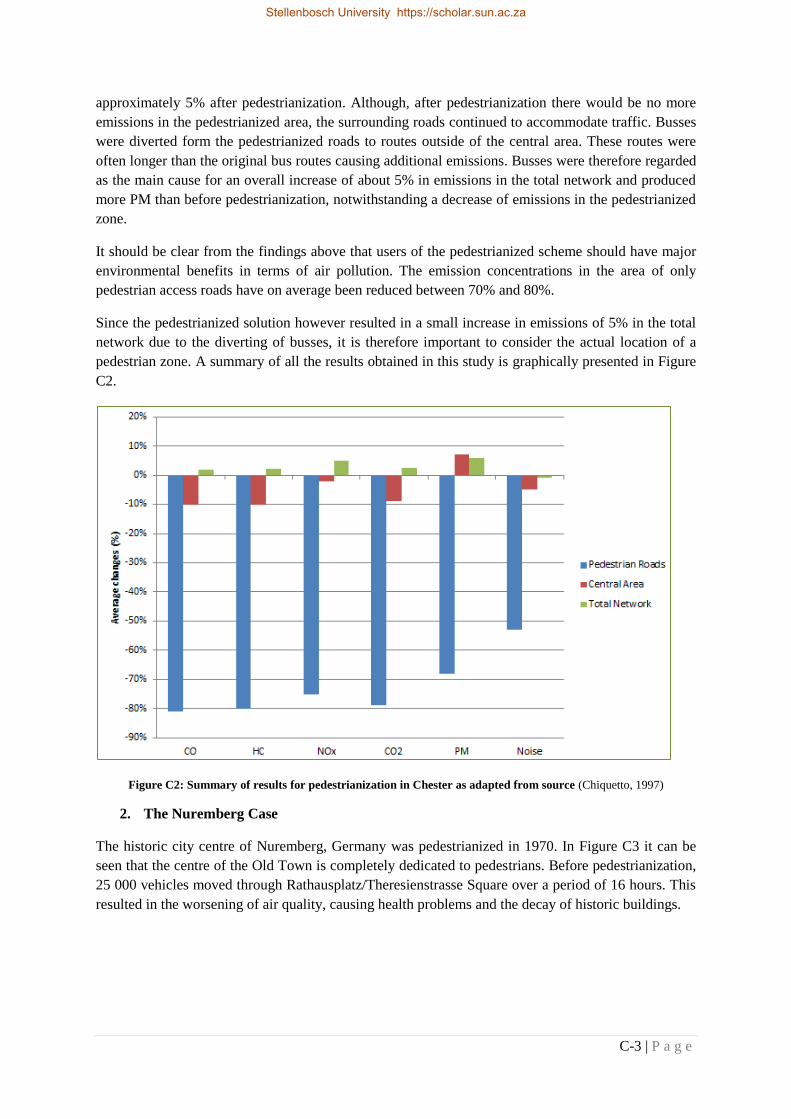
C-3 | P a g e
approximately 5% after pedestrianization. Although, after pedestrianization there would be no more
emissions in the pedestrianized area, the surrounding roads continued to accommodate traffic. Busses
were diverted form the pedestrianized roads to routes outside of the central area. These routes were
often longer than the original bus routes causing additional emissions. Busses were therefore regarded
as the main cause for an overall increase of about 5% in emissions in the total network and produced
more PM than before pedestrianization, notwithstanding a decrease of emissions in the pedestrianized
zone.
It should be clear from the findings above that users of the pedestrianized scheme should have major
environmental benefits in terms of air pollution. The emission concentrations in the area of only
pedestrian access roads have on average been reduced between 70% and 80%.
Since the pedestrianized solution however resulted in a small increase in emissions of 5% in the total
network due to the diverting of busses, it is therefore important to consider the actual location of a
pedestrian zone. A summary of all the results obtained in this study is graphically presented in Figure
C2.
Figure C2: Summary of results for pedestrianization in Chester as adapted from source (Chiquetto, 1997)
2. The Nuremberg Case
The historic city centre of Nuremberg, Germany was pedestrianized in 1970. In Figure C3 it can be
seen that the centre of the Old Town is completely dedicated to pedestrians. Before pedestrianization,
25 000 vehicles moved through Rathausplatz/Theresienstrasse Square over a period of 16 hours. This
resulted in the worsening of air quality, causing health problems and the decay of historic buildings.
Stellenbosch University https://scholar.sun.ac.za

C-4 | P a g e
Figure C3: Nuremberg pedestrianized Old Town (Dombrowski, 2018)
The streets of Nuremberg that were pedestrianized are graphically indicated in Figure C4.
Figure C4: Pedestrianized streets of Nuremberg (Wallztrom, 2004)
Stellenbosch University https://scholar.sun.ac.za

C-5 | P a g e
Table C2 provides the change in air quality due to pedestrianization in the city of Nuremberg. The
weight of air pollutants are given in μg/m3 before and after pedestrianization (Wallztrom, 2004).
Table C2: Impact of pedestrianization on air quality in Nuremberg
Pollutant Data for 1982/83 BEFORE
pedestrianization (μg/m3)
Data for 1988/89 AFTER
pedestrianization (μg/m3)
Percentage Change
(%)
Sulphur dioxide (SO2) 33 28 -15.15
Nitrogen monoxide (NO) 122 86 -29.5
Nitrogen dioxide (NO2) 100 61 -39.0
Nitrogen oxides (NOx) 139 90 -35.3
Carbon monoxide (CO) 3400 2980 -12.4
Particulate Matter (PM) 77 64 -16.9
Lead (Pb) 0.249 0.248 -0.4
3. The Oxford Case
High Street in Oxford, UK was closed for cars in 1999, motivated by the deteriorating environmental
conditions such as the increased air and noise pollution due to the increasing number of cars. The
deteriorating environmental conditions negatively impacted the historic nature of Oxford and the
quality of life of habitants. Pedestrians walking in High Street can be seen in Figure C5.
Pedestrianization had a very positive impact and air quality improved substantially
(Wallztrom, 2004).
There was a 25% reduction in PM and 75% decrease in CO (Wallztrom, 2004).
Figure C5: Oxford High Street (Milasan, 2014)
Stellenbosch University https://scholar.sun.ac.za
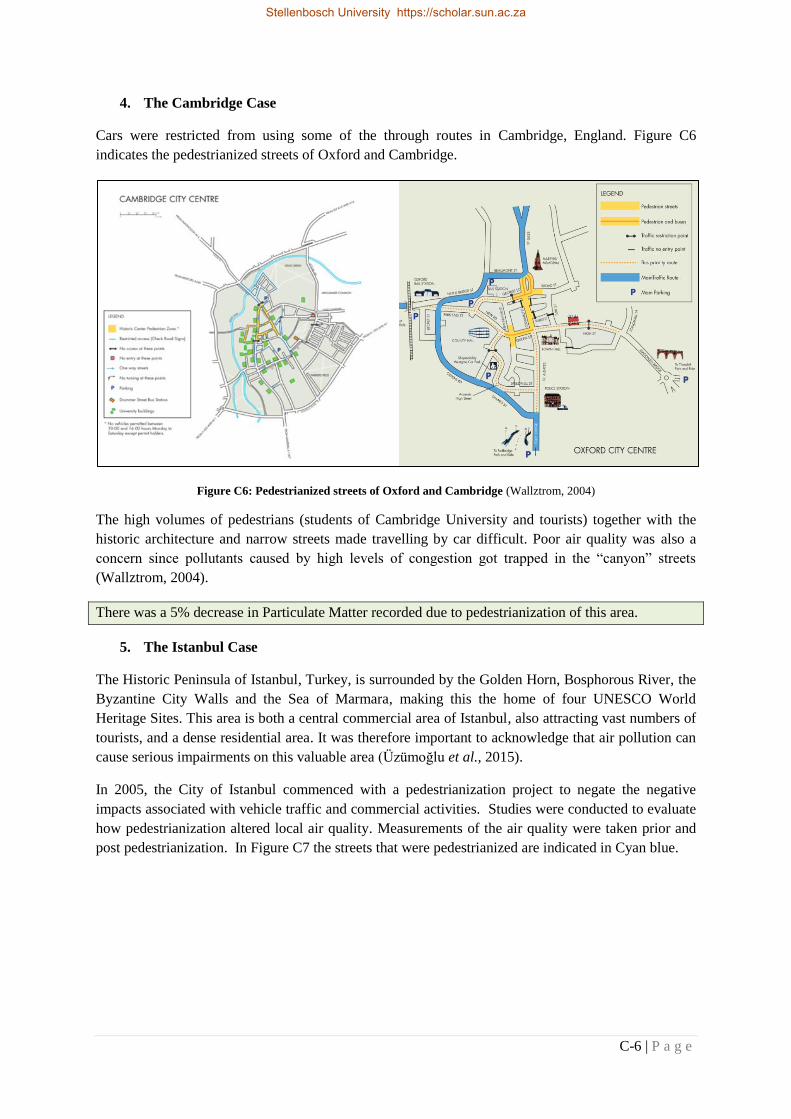
C-6 | P a g e
4. The Cambridge Case
Cars were restricted from using some of the through routes in Cambridge, England. Figure C6
indicates the pedestrianized streets of Oxford and Cambridge.
Figure C6: Pedestrianized streets of Oxford and Cambridge (Wallztrom, 2004)
The high volumes of pedestrians (students of Cambridge University and tourists) together with the
historic architecture and narrow streets made travelling by car difficult. Poor air quality was also a
concern since pollutants caused by high levels of congestion got trapped in the “canyon” streets
(Wallztrom, 2004).
There was a 5% decrease in Particulate Matter recorded due to pedestrianization of this area.
5. The Istanbul Case
The Historic Peninsula of Istanbul, Turkey, is surrounded by the Golden Horn, Bosphorous River, the
Byzantine City Walls and the Sea of Marmara, making this the home of four UNESCO World
Heritage Sites. This area is both a central commercial area of Istanbul, also attracting vast numbers of
tourists, and a dense residential area. It was therefore important to acknowledge that air pollution can
cause serious impairments on this valuable area (Üzümoğlu et al., 2015).
In 2005, the City of Istanbul commenced with a pedestrianization project to negate the negative
impacts associated with vehicle traffic and commercial activities. Studies were conducted to evaluate
how pedestrianization altered local air quality. Measurements of the air quality were taken prior and
post pedestrianization. In Figure C7 the streets that were pedestrianized are indicated in Cyan blue.
Stellenbosch University https://scholar.sun.ac.za
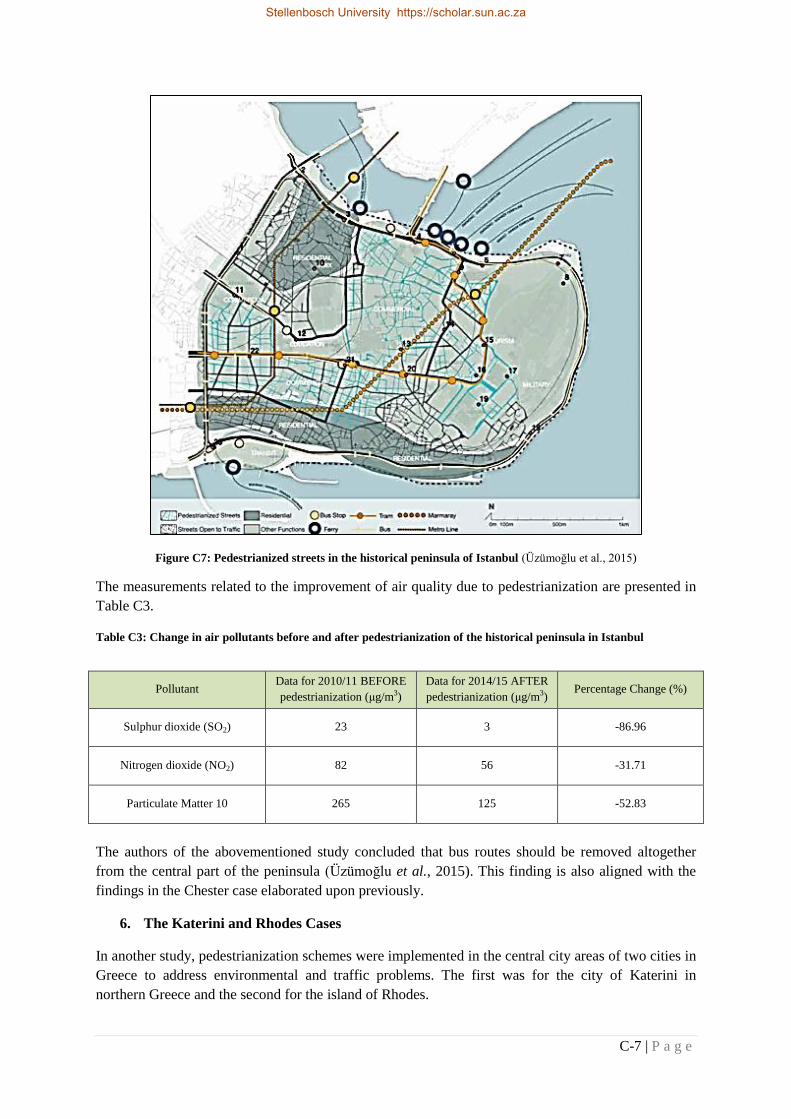
C-7 | P a g e
Figure C7: Pedestrianized streets in the historical peninsula of Istanbul (Üzümoğlu et al., 2015)
The measurements related to the improvement of air quality due to pedestrianization are presented in
Table C3.
Table C3: Change in air pollutants before and after pedestrianization of the historical peninsula in Istanbul
Pollutant Data for 2010/11 BEFORE
pedestrianization (μg/m3)
Data for 2014/15 AFTER
pedestrianization (μg/m3) Percentage Change (%)
Sulphur dioxide (SO2) 23 3 -86.96
Nitrogen dioxide (NO2) 82 56 -31.71
Particulate Matter 10 265 125 -52.83
The authors of the abovementioned study concluded that bus routes should be removed altogether
from the central part of the peninsula (Üzümoğlu et al., 2015). This finding is also aligned with the
findings in the Chester case elaborated upon previously.
6. The Katerini and Rhodes Cases
In another study, pedestrianization schemes were implemented in the central city areas of two cities in
Greece to address environmental and traffic problems. The first was for the city of Katerini in
northern Greece and the second for the island of Rhodes.
Stellenbosch University https://scholar.sun.ac.za

C-8 | P a g e
Traffic problems included pedestrian flow volumes, growth in traffic volumes, improper geometric
characteristics and the need to bypass the city, leading to the implementation of the pedestrian
schemes (Brebbia, 2000).
Issues experienced in central Katerini leading to pedestrianization included:
1. Through traffic (heavy traffic volumes) passing via the commercial centre;
2. Bypass route alternatives were limited;
3. A road hierarchy was absent;
4. Inhabitants living along the streets in the city centre were negatively influenced by the heavy
traffic (noise pollution, air pollution, visual intrusion, accidents).
The city of Rhodes faced severe traffic and high tourist volumes during summer months. This led to
environmental problems threatening the old city. A pedestrianization scheme was proposed in the part
of the old city where commercial activities took place. In Figure C8 the pedestrianized scheme of
Katerini is provided and in Figure C9 that of the Island of Rhodes.
Figure C8: Katerini, Greece, pedestrian scheme (Brebbia, 2000)
Pedestrian Zone Scheme
National Highway Athens - Thessaloniki
Stellenbosch University https://scholar.sun.ac.za
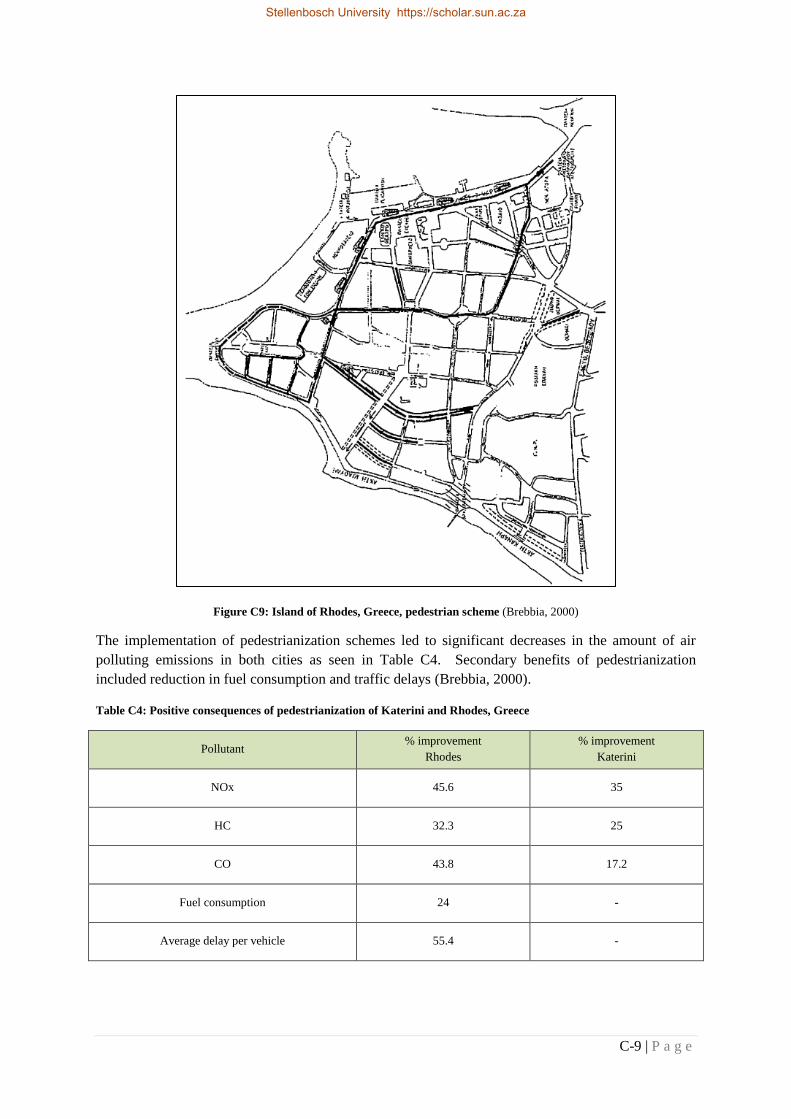
C-9 | P a g e
Figure C9: Island of Rhodes, Greece, pedestrian scheme (Brebbia, 2000)
The implementation of pedestrianization schemes led to significant decreases in the amount of air
polluting emissions in both cities as seen in Table C4. Secondary benefits of pedestrianization
included reduction in fuel consumption and traffic delays (Brebbia, 2000).
Table C4: Positive consequences of pedestrianization of Katerini and Rhodes, Greece
Pollutant % improvement
Rhodes
% improvement
Katerini
NOx 45.6 35
HC 32.3 25
CO 43.8 17.2
Fuel consumption 24 -
Average delay per vehicle 55.4 -
Stellenbosch University https://scholar.sun.ac.za

C-10 | P a g e
In 42% of accidents experienced on the road networks of Greece a single vehicle and a pedestrian are
involved. To improve traffic safety a strategy of completely separating cyclist and pedestrians from
cars was developed.
From the Katerini and Rhodes cases it can be concluded that pedestrianization schemes are efficient
methods to improve the overall environment and air quality. A significant reduction was observed in
the values of NOx, HC and CO in the pedestrianized areas. The environmental benefits in these cases
can be attributed to the on-street parking policy that was implemented in the greater road network
together with parking stations in the city centre perimeter (Brebbia, 2000).
Table C5 provides a summary of all the results obtained from previous studies. These results are
analysed and interpreted in Chapter 7 in order to incorporate the effect of pedestrian schemes on air
quality.
Table C5: Summary of changes in air pollutants in previous studies due to pedestrianization
Case Study
% Change in Pollutant
CO HC NOx CO2 PM SO2 NO Pb NO2
Chester -6.5 -6 +0.5 -5 +5.75 - - - -
Nuremberg -12.4 - -35.3 - -16.9 -15.15 -29.5 -0.4 -39
Oxford -75 - - - -25 - - - -
Cambridge - - - - -5 - - - -
Istanbul - - - - -52.83 -86.96 -31.71
Katerini -17.2 -25 -35 - - - - - -
Rhodes -43.8 -32.3 -45.6 - - - - - -
C.2 The Effect of Green Pedestrian Zones on Noise Pollution
Noise pollution is mainly caused by the geometry of the road network, the buildings adjacent to the
roads with noise reflecting facades in addition to the amount of road junctions and the distance
between junctions (Chiquetto, 1997). Three scenarios are included as part of the research on noise
pollution namely:
1. Chester,
2. Durham and Leeds,
3. Green walls.
Stellenbosch University https://scholar.sun.ac.za

C-11 | P a g e
1. The Chester Case
The pedestrianization scheme in Chester, UK contributed to the reduction of noise pollution. Before
the implementation of the pedestrianization scheme, noise levels ranged between 80 and 82 dB(A),
which is higher than the recommended 70 dB(A) over a period of 18 hours. After the
pedestrianization scheme has been implemented noise levels were reduced by an average of 50%, as
seen on the graph in Figure C2 (Chiquetto, 1997).
2. The Durham and Leeds Cases
Parts of the cities of Durham and Leeds in the UK were evaluated to determine the positive effects of
pedestrianization on noise pollution. Before the implementation of a pedestrianization scheme, the
noise levels in the study area of Durham exceeded the acceptable limit of 68 dB(A) at that time. In
Leeds, the noise levels have been reduced from 65-75 to 60-65 dB(A) after pedestrianization was
implemented (Chiquetto, 1997).
3. The Case of Green Walls
The effect of green walls on noise pollution was also tested. A green wall with an area of 922m2
(48m x 19.2m) was placed on an apartment building situated on a main road. Approximately 20 000
vehicles passed the building per day at an average speed of 50 km/h. The vehicles consisted out of
95% light vehicles and 5% heavy vehicles. The average noise level before the implementation of
green walls was 63.77 dB(A). After the green wall was installed a reduction of approximately 4.3
dB(A) was recorded (Veisten et al., 2012).
C.3 The Effect of Pedestrianization on Economic Factors
The economic effects of pedestrian schemes should not be considered in isolation. The following
external factors should be evaluated in combination with the economic effects (Hass-Klau, 1993a):
1. Any trends locally and nationally;
2. Accessibility of the pedestrianized scheme by public transport or motor-vehicles;
3. Overall town planning strategy;
4. Design of the scheme;
5. Density of the nearby or surrounding population.
Through the implementation of pedestrian schemes the economic advantages thereof were identified
in a number of cases as elaborated upon in this section. The following previous studies and cases have
been consulted in the research on the effect of pedestrian zones on the economy:
1. Organisation for Economic Co-operation and Development (OECD) Study Case;
2. The Oxford and Cambridge Cases;
3. The Istanbul Case;
4. The Seville Case;
5. The Kajaani Case;
6. The Wolverhampton Case;
7. Rhodes and Katerini Cases;
8. Relationship between Urban Health and Economic Benefits.
Stellenbosch University https://scholar.sun.ac.za
C-12 | P a g e
Each study will now be described in more detail.
1. Organisation for Economic Co-operation and Development (OECD) Study Case
Research in 1989 concluded that pedestrianization improves the physical environment, in turn
contributing to economic improvements in terms of retail turnover. It was noted that retailers in areas
that underwent pedestrianization experienced a growth in sales. One hundred pedestrianized cities
around the world were investigated. It was found that the turnover in 49% of these city centres
increased and 25% remained constant. More than 60% increase in turnover was recorded in Austria,
Scandinavia and Germany (Darko & Atuahene, 2015).
Research conducted on pedestrianization by Hall, Hass-Klau and Monheim confirmed the apparent
obvious that the number of shoppers and turnover in an area are directly proportional to the number of
pedestrians in the streets (Darko & Atuahene, 2015).
In pedestrianized areas of Belgium residents were provided with free public transport. This improved
commerce and business in those areas and resulted in a growth in municipal revenue and a reduction
in business tax rates (Darko & Atuahene, 2015).
Studies of Texas, USA concluded that office buildings with good pedestrian amenities have higher
occupancy rates. This was confirmed in Toronto where it was found that buildings not situated on the
pedestrian corridors have higher vacancy rates and get half the annual rent income (Darko &
Atuahene, 2015).
In most cases it was found that pedestrianization increased land value, resulting in rent increases and
increases in property tax assessments. It was found that increased sales at pedestrian corridors offset
rent increases. Sales explosion in York, UK resulted into a 400% increase in rent (Soni & Soni, 2016).
Hass-Klaus reported that pedestrianized streets can result in a 20% to 40% increase in the amount of
shoppers for retail services. A mean increase of 17% in retail turnover was calculated, although an
increase in the range of 10% to 25% is suggested as an expected increase in retail turnover. A mean
increase of 22% in retail rents was calculated. An increase in the range of 10% to 30% is suggested
(Whitehead et al, 2006).
2. The Oxford and Cambridge Cases
In Oxford a small decline in trade for the city globally was noticed in the late 1990’s. In the same
period, an increase of 8.5% in pedestrians was however noticed for pedestrianized streets. This
increase consequently resulted in increased trade. An increase of 9% in bus passengers was also
recorded (Wallztrom, 2004).
Economic benefits were also observed in Cambridge. Less congestion resulted in time saving for
public transport users and no significant loss of trade was recorded in the pedestrian area, with only an
increase in the number noticed for pedestrians and tourists using the area. With the increased number
of pedestrians it could only be derived that it resulted in an increase in trade (Wallztrom, 2004).
Stellenbosch University https://scholar.sun.ac.za

C-13 | P a g e
3. The Istanbul Case
A commercial survey was conducted within the area of the historic Peninsula of Istanbul which
underwent pedestrianization. From the survey of respondents within that area 47% were retailers and
the other 53% wholesalers (Öztaş & Akı, 2014).
A total of 50% of the respondents indicated that their collection and delivery activities were benefitted
by the pedestrianization in the area. Within the retail sector, 51% of the survey respondents indicated
that the pedestrianization scheme affected their business positively. Only 35% of the retailers
disagreed. Amongst the wholesalers, 52% respondents agreed that the impact of pedestrianization on
their business was positive while 38% of the wholesalers disagreed. From the survey respondents 53%
confirmed that the pedestrianization caused an increase in street vendors. Many were however
displeased with this situation (Öztaş & Akı, 2014).
4. The Seville Case
Seville has the largest city centre in Spain with an area of 394 hectare and a population of 702 355
inhabitants. During the period of 2006 to 2008 pedestrianization was implemented in the old city
centre. Asuncion Street is 875m long of which 520m thereof has been pedestrianized as seen in Figure
C10.
Figure C10: Asuncion Street, Seville, Spain (Sevillano, 2015)
Before the implementation of the pedestrianized scheme the streets were constantly congested with
vehicles, retailers and pedestrians. In access of 8920 vehicles moved through the city centre daily and
released 160 tonnes of CO per annum (Castillo-Manzano et al, 2014).
San Jacinto Street is 655m long with 210m of the street pedestrianized. Before pedestrianization
15000 vehicles used the street daily (Castillo-Manzano et al, 2014). San Jacinto Street was also
known as the noisiest street in Seville.
After the implementation of the pedestrianized areas, a survey was conducted in 2009 to determine
the impact of the pedestrianization. The survey was repeated in 2012 to determine the longer term
effects.
Stellenbosch University https://scholar.sun.ac.za

C-14 | P a g e
The initial survey showed that 26.5% of respondents increased the frequency of visits to the zone
post-pedestrianization in comparison to 33.5% responding to the new survey. From the initial survey
respondents with retail interests, 47% indicated an increase in sales while 51% indicated an increase
in the repeated survey. From the initial survey, 55% of the respondents indicated an increase of
consumption from food and beverage establishments in comparison to 62% in the repeated survey
(Castillo-Manzano et al, 2014).
It is interesting to note that these results were obtained despite the rapid decline in the Spanish
economy during the 2011 to 2012 period (Castillo-Manzano et al, 2014).
5. The Kajaani Case
The main square and a portion of High Street in Kajaani, Finland were pedestrianized in 1996. The
pedestrianization scheme was implemented in an effort to address congestion, air pollution, the
migration of the population from the city centre and the urban decay caused by vacant properties. The
city managed to remove 13000 vehicles per day from the main square. This resulted in a 52%
improvement in retail business (Wallztrom, 2004). The main pedestrian square of Kajaani is
illustrated in Figure C11.
Figure C11: Kajaani, Finland pedestrian zone (Wallztrom, 2004)
6. The Wolverhampton Case
The pedestrianization of the central core roads of Wolverhampton, England in 1991 led to the removal
of 8000 vehicles/day from the city centre. The main reasons for the pedestrianization scheme were the
high congestion levels, worsening environmental conditions and the decline in economic activities.
After the pedestrian scheme was implemented, the central core for investment became the
pedestrianized streets. A 30% increase in the use of public transport was also noticed (Wallztrom,
2004). The pedestrianized streets of Wolverhampton can be seen in Figure C12.
Stellenbosch University https://scholar.sun.ac.za

C-15 | P a g e
Figure C12: Pedestrian zone in Wolverhampton, England (Wallztrom, 2004)
7. The Rhodes and Katerini Cases
In the case where Rhodes and Katerini were pedestrianized a reduction in fuel consumption and
average delay per vehicle were recorded, positively affecting the local economy (Brebbia, 2000).
8. The Relationship between Urban Health and Economic Benefits
The overall “health” of urban areas should also be taken into account when the economic benefits for
a CBD area are considered. A combination of environmental degradation, poorly maintained
buildings and infrastructure, undermanaged street trading and transport as well as high crime levels
have negative economic implications.
The economic chain reaction in urban cities can be described as:
Neglected environments (lack enhancements such as trees and gardens) → low
environmental quality → city regarded as low priority by financial investors.
Cleaner and greener cities motivate happier, healthier and more productive habitants, international
business and tourism and are more attractive to property developers. As an example, in Durban the
price of property is strongly influenced by environmental factors. Higher prices are associated with a
better condition of the surrounding environment and open spaces. Degraded open spaces are not only
associated with lower prices, but also with crime. From this study it was concluded that people value
public space more than private gardens since such areas are perceived as safer, more accessible and
multifunctional (White et. al., 2017).
Noteworthy is that approximately 15.5 million people visited Durban in 2012. This resulted in a total
expenditure of R6 132 million and contributed R10 500 million to the Gross Domestic Product (GDP)
(White et. al., 2017).
In Cape Town the urban open spaces contribute to 18-43% of tourism revenues (White et. al., 2017).
Figure C13 provides a breakdown of the type and location of activities generating tourist expenditure
in Cape Town with the highest expenditure in business within the built environment. With a large
percentage of business activities within the CBD areas, it can be concluded that green cities through
green pedestrian zones would be more conducive to business, tourism and shopping.
Stellenbosch University https://scholar.sun.ac.za
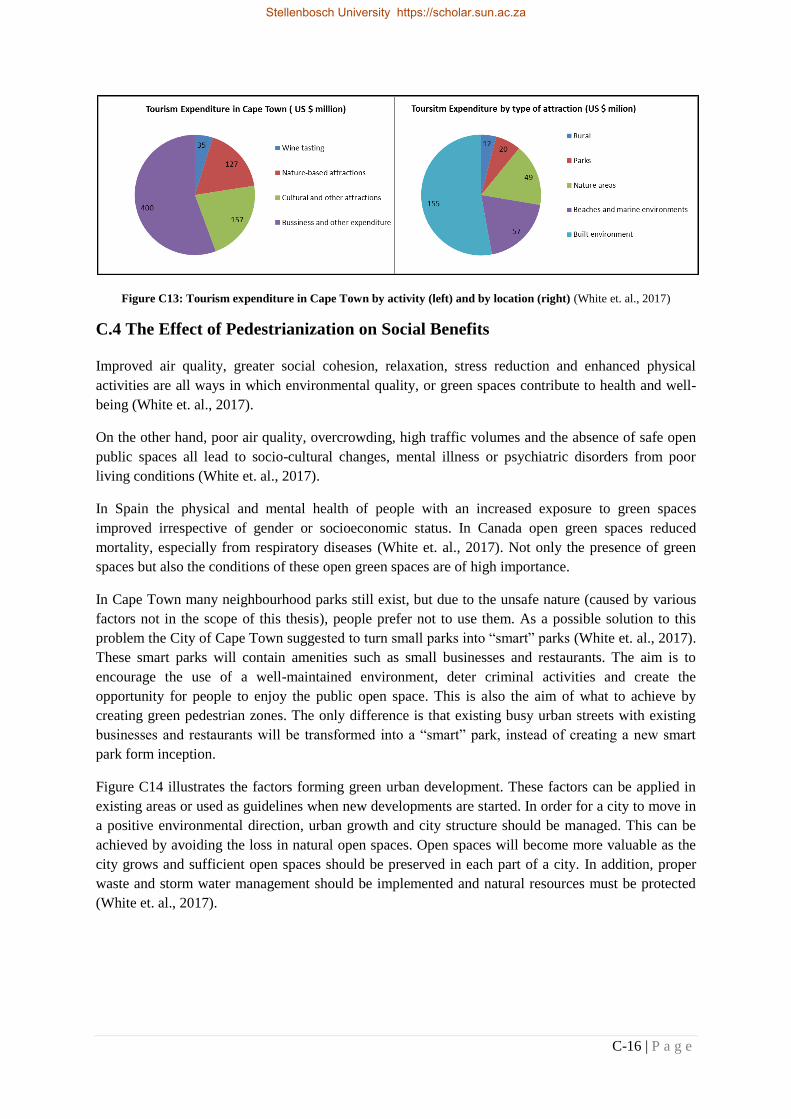
C-16 | P a g e
Figure C13: Tourism expenditure in Cape Town by activity (left) and by location (right) (White et. al., 2017)
C.4 The Effect of Pedestrianization on Social Benefits
Improved air quality, greater social cohesion, relaxation, stress reduction and enhanced physical
activities are all ways in which environmental quality, or green spaces contribute to health and well-
being (White et. al., 2017).
On the other hand, poor air quality, overcrowding, high traffic volumes and the absence of safe open
public spaces all lead to socio-cultural changes, mental illness or psychiatric disorders from poor
living conditions (White et. al., 2017).
In Spain the physical and mental health of people with an increased exposure to green spaces
improved irrespective of gender or socioeconomic status. In Canada open green spaces reduced
mortality, especially from respiratory diseases (White et. al., 2017). Not only the presence of green
spaces but also the conditions of these open green spaces are of high importance.
In Cape Town many neighbourhood parks still exist, but due to the unsafe nature (caused by various
factors not in the scope of this thesis), people prefer not to use them. As a possible solution to this
problem the City of Cape Town suggested to turn small parks into “smart” parks (White et. al., 2017).
These smart parks will contain amenities such as small businesses and restaurants. The aim is to
encourage the use of a well-maintained environment, deter criminal activities and create the
opportunity for people to enjoy the public open space. This is also the aim of what to achieve by
creating green pedestrian zones. The only difference is that existing busy urban streets with existing
businesses and restaurants will be transformed into a “smart” park, instead of creating a new smart
park form inception.
Figure C14 illustrates the factors forming green urban development. These factors can be applied in
existing areas or used as guidelines when new developments are started. In order for a city to move in
a positive environmental direction, urban growth and city structure should be managed. This can be
achieved by avoiding the loss in natural open spaces. Open spaces will become more valuable as the
city grows and sufficient open spaces should be preserved in each part of a city. In addition, proper
waste and storm water management should be implemented and natural resources must be protected
(White et. al., 2017).
Stellenbosch University https://scholar.sun.ac.za

C-17 | P a g e
Figure C14: Considerations for green development (White et. al., 2017)
The following previous studies are reviewed:
1. Cambridge;
2. Kajaani;
3. Wolverhampton;
4. Ghent;
5. Seoul;
6. Seville;
7. Istanbul;
8. Katerini.
The social benefits associated with each case study are described in the following sections.
Stellenbosch University https://scholar.sun.ac.za
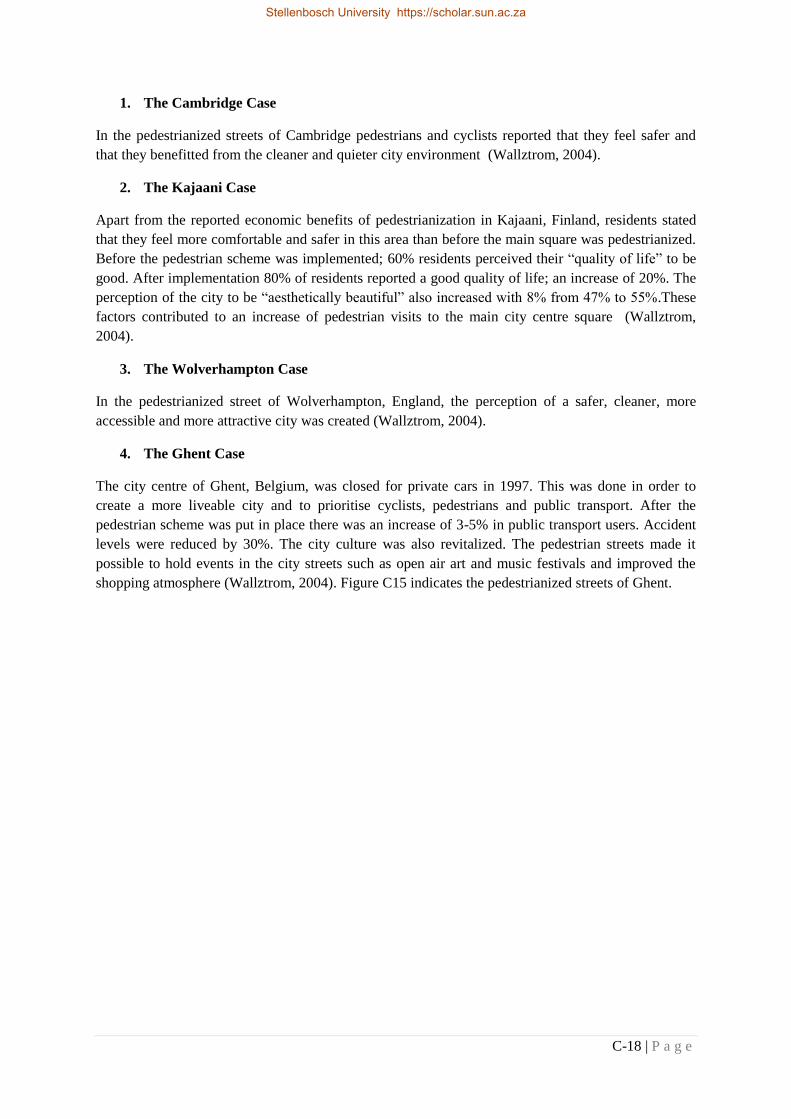
C-18 | P a g e
1. The Cambridge Case
In the pedestrianized streets of Cambridge pedestrians and cyclists reported that they feel safer and
that they benefitted from the cleaner and quieter city environment (Wallztrom, 2004).
2. The Kajaani Case
Apart from the reported economic benefits of pedestrianization in Kajaani, Finland, residents stated
that they feel more comfortable and safer in this area than before the main square was pedestrianized.
Before the pedestrian scheme was implemented; 60% residents perceived their “quality of life” to be
good. After implementation 80% of residents reported a good quality of life; an increase of 20%. The
perception of the city to be “aesthetically beautiful” also increased with 8% from 47% to 55%.These
factors contributed to an increase of pedestrian visits to the main city centre square (Wallztrom,
2004).
3. The Wolverhampton Case
In the pedestrianized street of Wolverhampton, England, the perception of a safer, cleaner, more
accessible and more attractive city was created (Wallztrom, 2004).
4. The Ghent Case
The city centre of Ghent, Belgium, was closed for private cars in 1997. This was done in order to
create a more liveable city and to prioritise cyclists, pedestrians and public transport. After the
pedestrian scheme was put in place there was an increase of 3-5% in public transport users. Accident
levels were reduced by 30%. The city culture was also revitalized. The pedestrian streets made it
possible to hold events in the city streets such as open air art and music festivals and improved the
shopping atmosphere (Wallztrom, 2004). Figure C15 indicates the pedestrianized streets of Ghent.
Stellenbosch University https://scholar.sun.ac.za
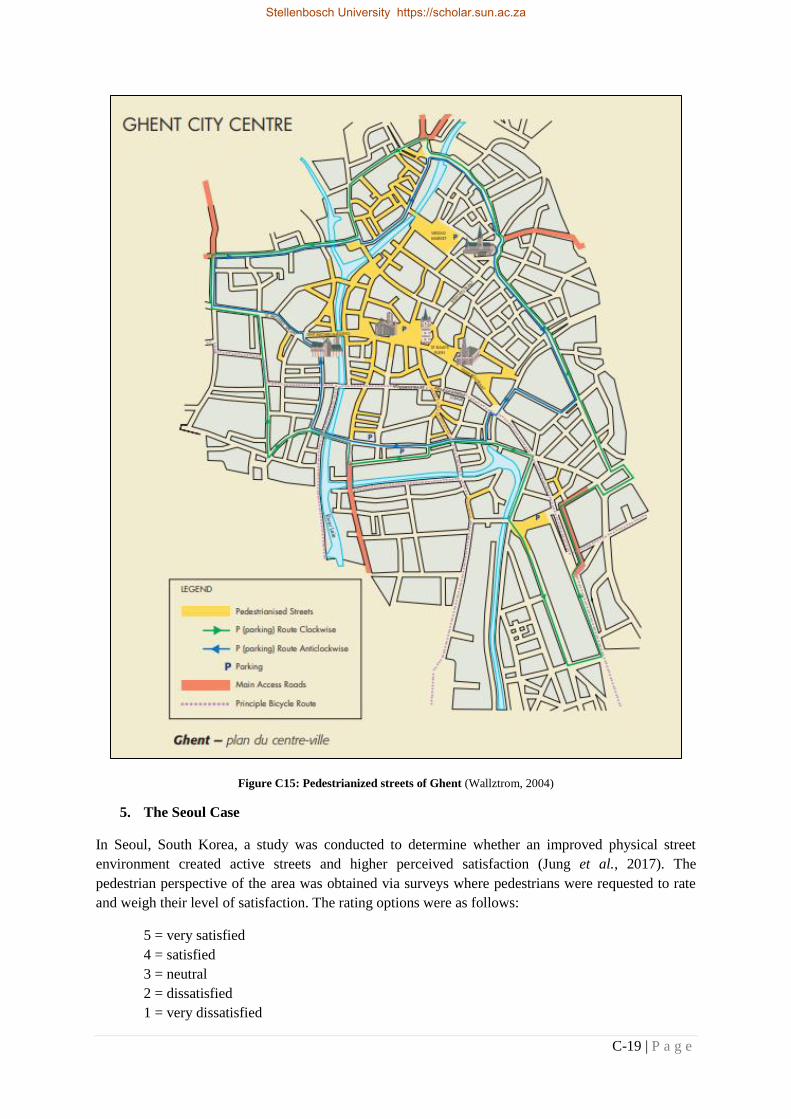
C-19 | P a g e
Figure C15: Pedestrianized streets of Ghent (Wallztrom, 2004)
5. The Seoul Case
In Seoul, South Korea, a study was conducted to determine whether an improved physical street
environment created active streets and higher perceived satisfaction (Jung et al., 2017). The
pedestrian perspective of the area was obtained via surveys where pedestrians were requested to rate
and weigh their level of satisfaction. The rating options were as follows:
5 = very satisfied
4 = satisfied
3 = neutral
2 = dissatisfied
1 = very dissatisfied
Stellenbosch University https://scholar.sun.ac.za

C-20 | P a g e
The first hypothesis tested in this study was that with physical street improvements the level of
pedestrian satisfactory would also increase. Physical improvements include safety, cleanliness,
scenery and convenience. The first survey was conducted in 2009. A second survey was conducted in
2012.
In 2009 the average rating for pedestrian satisfaction in streets where no physical improvements were
done was 3.256. This decreased to 3.092 in the 2012 survey. In contrast to the finding above, the
streets where design alterations were implemented to improve physical appearance the average
satisfaction rating increased from 3.213 to 3.355 from 2009 to 2012 (Jung et al., 2017).
A second hypothesis was also tested. This hypothesis was not focused on pedestrian satisfaction, but
on the pedestrian volume and how to increase pedestrian volume by changing the streetscape. The
streetscape was changed by adding features such as streetlights, trees, benches and other street
furniture. In 2009 before changes were brought about, the pedestrian volumes were estimated as
7249.6 persons. After the streetscape changes were implemented a pedestrian volume of 7908.6
persons were estimated in 2012 (Jung et al., 2017).
6. The Seville Case
In the city of Seville, Spain, surveys were conducted among pedestrians and residents to determine the
city atmosphere before and after pedestrianization. Over 90% of the respondents to the surveys
indicated that the area had a livelier atmosphere after the installation of pedestrianization. The only
negative aspects citizens highlighted were the way in which the road works were carried out and the
disruption it caused. Pre-pedestrianization conflicts were soon changed to become more welcoming of
pedestrianization (Castillo-Manzano et al., 2014).
7. The Istanbul Case
Surveys within the business, residential and student district of the Historic Peninsula of Istanbul
revealed the following benefits form creating pedestrian streets within the historical peninsula (Öztaş
& Akı, 2014):
1. 68% increase in street safety;
2. 58% increased visual quality;
3. 56% increase in attraction to historical buildings;
4. 52% increase in walkability;
5. Overall 80% satisfaction rate.
8. The Katerini Case
Accidents in the greater street network of Katerini were reduced by 44% as a result of
pedestrianization. An overall improvement in the level of safety along the road network was noted. It
was further reported that the quality of life in central areas of Katerini also improved (Brebbia, 2000).
Stellenbosch University https://scholar.sun.ac.za
C-21 | P a g e
C.5 The Impact of Pedestrianization on the Surrounding Traffic
80% of the European population live in cities. It is therefore of importance to improve the urban
liveability. It is however a difficult task since the dependency on cars is still too high and the use of
cars is still on the increase. It is found that 50% of all journeys in urban areas are less than 5km long
and 33% less than 3km (Wallztrom, 2004). The environmental, social and economic challenges that
are caused by increasing traffic are illustrated in Figure C16.
Figure C16: Problems associated with increasing congestion (Wallztrom, 2004)
In the city of Chester the closure of some of the central area roads increased the overall traffic
circulation, resulting in reduced congestion levels, reduced travel times and lower fuel consumption.
This is explained by the “Braess’s Paradox”, where user equilibrium will occur. User equilibrium
indicates that each user will minimize their own travel time and associated travel costs (Sheffi, 1985).
Wardrop’s first principle states that under equilibrium conditions traffic arranges itself in congested
networks in such a way that all of the used routes within a network between any origin and destination
have equal and minimum costs. All of the unused routes will have greater costs. Wardrop’s principles
are frequently explained by Braess’s Paradox where under certain conditions, the addition of capacity
to a road network can actually worsen the network operations. It is due to the selfish nature of drivers
always seeking the routes with the minimum associated time and cost (de Dios Ortuzar et al, 2012). It
can therefore be concluded that it is not always necessary to add capacity to a road network to relief
congestion. Users will always determine the most cost effective route whatever the capacity. It can
also be concluded that in the case where capacity is removed by pedestrian schemes, the traffic that
was on the routes that are now closed, will spontaneously re-arrange itself in the surrounding network.
Stellenbosch University https://scholar.sun.ac.za

C-22 | P a g e
Although there was a slight increase in travel distance in the total network of Chester, traffic flowed
more freely over the total network after the pedestrianization scheme was implemented. The average
travel speed increased with 3.1%, the average travel time decreased with 2.75% and the fuel usage
decreased with 2.25%. A decreased consumption of fuel provides an economic benefit. Figure C17
provides a graphical representation of these findings (Chiquetto, 1997).
Figure C17: Percentage changes in traffic indicators due to pedestrianization as adapted from source
(Chiquetto, 1997)
A study conducted by Wallztrom investigated whether the reclaiming of city streets for pedestrian use
would result in chaos or an improved quality of life. This study highlighted that road traffic affects the
quality of the environment and the quality of life in town and city centres within these environments.
Traditionally the approach to solve congestion would be to provide additional road space. This
solution was however proven to not be as effective as anticipated, since traffic jams in areas where
extra traffic lanes were provided, worsened. A lack of space in which to expand could also impose
new problems. A new approach to solve congestion in cities would be to start using the existing road
capacity more efficiently. The aim should be to create new attractive public spaces in areas that were
once congested and to encourage the use of alternative travel modes (Wallztrom, 2004). The
experience with this new approach was that the traffic problems following the implementation of a
scheme were less severe than predicted, that the traffic problems existing after implementation
“evaporated”2 and that the urban environment became more liveable.
After the implementation of a scheme, there is an adjustment period. In this adjustment period, the
drivers previously found in the vicinity, changes their travel behaviour resulting in the traffic
problems eventually evaporating. This period is also known as the settling period and includes short
term activities where drivers cram initially but later start to search for alternative routes. In the
medium term drivers start to develop flexible trip planning, change transport mode, review trip
2 The terminology of “traffic evaporation” is used for the phenomenon that resulted from strategic
removal of road space previously dedicated to motor vehicles (OneStreet, 2018)
Stellenbosch University https://scholar.sun.ac.za

C-23 | P a g e
planning and combine trips. In the long term drivers may switch locations for activities and workplace
or even homes. This seldom occurs. The cycle of “settling” can be seen graphically in Figure C18.
Figure C18: Cycle of traffic settling (Wallztrom, 2004)
In the case where the historic city centre of Nuremburg was pedestrianized there was a 25% reduction
in traffic flow through the historic centre. There was however a recorded 19% increase in traffic on
the surrounding streets. This does indicate that there was still an overall reduction in traffic of 6%
(Wallztrom, 2004).
It was further noted in the city of Cambridge that there was a traffic reduction of 80% on the closed
routes with no traffic increase on the neighbouring routes (Wallztrom, 2004).
In Kajaani, traffic evaporated where a daily number of 13000 vehicles were removed from the main
square. No additional traffic was recorded on the surrounding network (Wallztrom, 2004).
The same trend was noticed in Wolverhampton where traffic evaporation caused a decrease of 14% in
traffic within the city core and an overall decrease of 1% in traffic on the surrounding network. In
Oxford the pedestrianized streets resulted in traffic flows that decreased by 20% in inner cordon and
1.13% on outer cordon (Wallztrom, 2004).
In the case where Rhodes and Katerini were pedestrianized a reduction of road accidents was
observed in this area. In order to improve the level of safety over the greater network additional
measures such as traffic signal interventions, junction redesign, proper signage and revised road super
elevation (vertical and horizontal alignment) should be considered. In both of these cities the
implementation of an on-street parking policy and parking stations near the pedestrian zone opened up
space at intersections, thus increasing the capacity of junctions by 14-15% (Brebbia, 2000).
Stellenbosch University https://scholar.sun.ac.za

C-24 | P a g e
C.6 The Effect of Green Engineering Technologies
The green engineering technologies researched, include mainly green roofs and the effect of green
roofs on the air quality within the surrounds of green roofs. Green walls and trees are also included in
the research.
The most significant benefits associated with green roofs and green facades and walls are described in
the following section. The benefits addressed include the following:
1. Noise Pollution;
2. Economic Benefits;
3. Improved Air Quality;
4. Other Benefits.
Each benefit will now be elaborated upon.
C.6.1 Noise Pollution
Green roofs and walls can provide some decrease in noise pollution. In Melbourne a study showed
that green roofs can lead to a reduction of 10 dB in noise levels. In Singapore green walls were tested
and the results indicated the same outcome (GreenWall_Australia, 2014). For additional information
of how green walls reduce noise pollution refer to paragraph C.2.
C.6.2 Economic Benefits
In Canada it was found that the property value of buildings with green roofs increased with 11% and
buildings with views over green roofs have a 4.5% increase in property value. Various studies done
on the economic effect of green walls or roofs proved that green roofs and walls are beneficial for
property value (Veisten et al., 2012). Some of the results include:
10.5% increase in property value in Toronto;
3.9% increase in property value in Québec (Canada);
1.4% increase in land price in Tokyo;
2.7% increase in land price in Kitakyushu;
Houses in New York with a green roof have 16.2% higher prices.
Furthermore, green roofs and walls can reduce the costs associated with heating and cooling of
buildings (GreenWall_Australia, 2014).
C.6.3 Improved Air Quality
In the narrow streets of city centres, green walls and roofs provide improvement in the urban air
quality. With an increased area covered in vegetation more pollutants will be disposed of. In London
it was found that vegetation (in the form of green walls and roofs) resulted in a decrease of 23% -
60% in Particulate Matter and a decrease of 15% - 40% in nitrogen dioxide (GreenWall_Australia,
2014). In this section the following three case studies are included:
1. The case of Chicago;
2. The case of Toronto;
3. The case of Hong Kong.
Stellenbosch University https://scholar.sun.ac.za
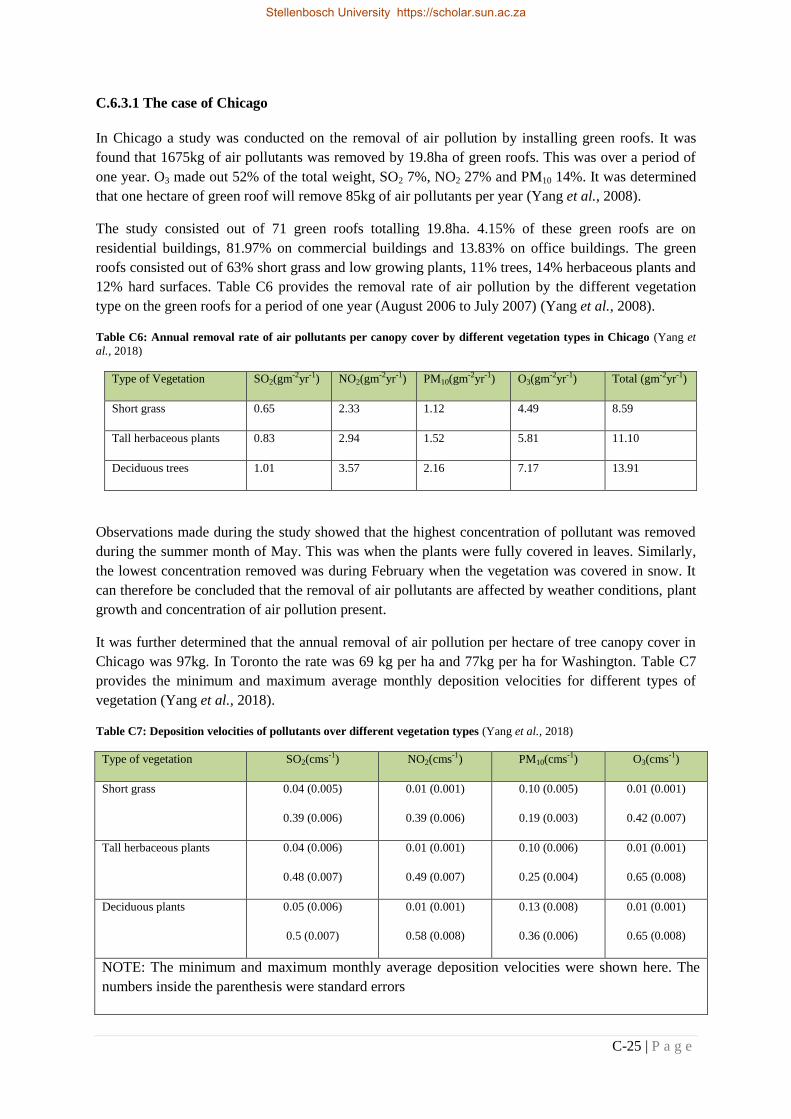
C-25 | P a g e
C.6.3.1 The case of Chicago
In Chicago a study was conducted on the removal of air pollution by installing green roofs. It was
found that 1675kg of air pollutants was removed by 19.8ha of green roofs. This was over a period of
one year. O3 made out 52% of the total weight, SO2 7%, NO2 27% and PM10 14%. It was determined
that one hectare of green roof will remove 85kg of air pollutants per year (Yang et al., 2008).
The study consisted out of 71 green roofs totalling 19.8ha. 4.15% of these green roofs are on
residential buildings, 81.97% on commercial buildings and 13.83% on office buildings. The green
roofs consisted out of 63% short grass and low growing plants, 11% trees, 14% herbaceous plants and
12% hard surfaces. Table C6 provides the removal rate of air pollution by the different vegetation
type on the green roofs for a period of one year (August 2006 to July 2007) (Yang et al., 2008).
Table C6: Annual removal rate of air pollutants per canopy cover by different vegetation types in Chicago (Yang et
al., 2018)
Type of Vegetation SO2(gm-2yr-1) NO2(gm-2yr-1) PM10(gm-2yr-1) O3(gm-2yr-1) Total (gm-2yr-1)
Short grass 0.65 2.33 1.12 4.49 8.59
Tall herbaceous plants 0.83 2.94 1.52 5.81 11.10
Deciduous trees 1.01 3.57 2.16 7.17 13.91
Observations made during the study showed that the highest concentration of pollutant was removed
during the summer month of May. This was when the plants were fully covered in leaves. Similarly,
the lowest concentration removed was during February when the vegetation was covered in snow. It
can therefore be concluded that the removal of air pollutants are affected by weather conditions, plant
growth and concentration of air pollution present.
It was further determined that the annual removal of air pollution per hectare of tree canopy cover in
Chicago was 97kg. In Toronto the rate was 69 kg per ha and 77kg per ha for Washington. Table C7
provides the minimum and maximum average monthly deposition velocities for different types of
vegetation (Yang et al., 2018).
Table C7: Deposition velocities of pollutants over different vegetation types (Yang et al., 2018)
Type of vegetation SO2(cms-1) NO2(cms-1) PM10(cms-1) O3(cms-1)
Short grass 0.04 (0.005)
0.39 (0.006)
0.01 (0.001)
0.39 (0.006)
0.10 (0.005)
0.19 (0.003)
0.01 (0.001)
0.42 (0.007)
Tall herbaceous plants 0.04 (0.006)
0.48 (0.007)
0.01 (0.001)
0.49 (0.007)
0.10 (0.006)
0.25 (0.004)
0.01 (0.001)
0.65 (0.008)
Deciduous plants 0.05 (0.006)
0.5 (0.007)
0.01 (0.001)
0.58 (0.008)
0.13 (0.008)
0.36 (0.006)
0.01 (0.001)
0.65 (0.008)
NOTE: The minimum and maximum monthly average deposition velocities were shown here. The
numbers inside the parenthesis were standard errors
Stellenbosch University https://scholar.sun.ac.za
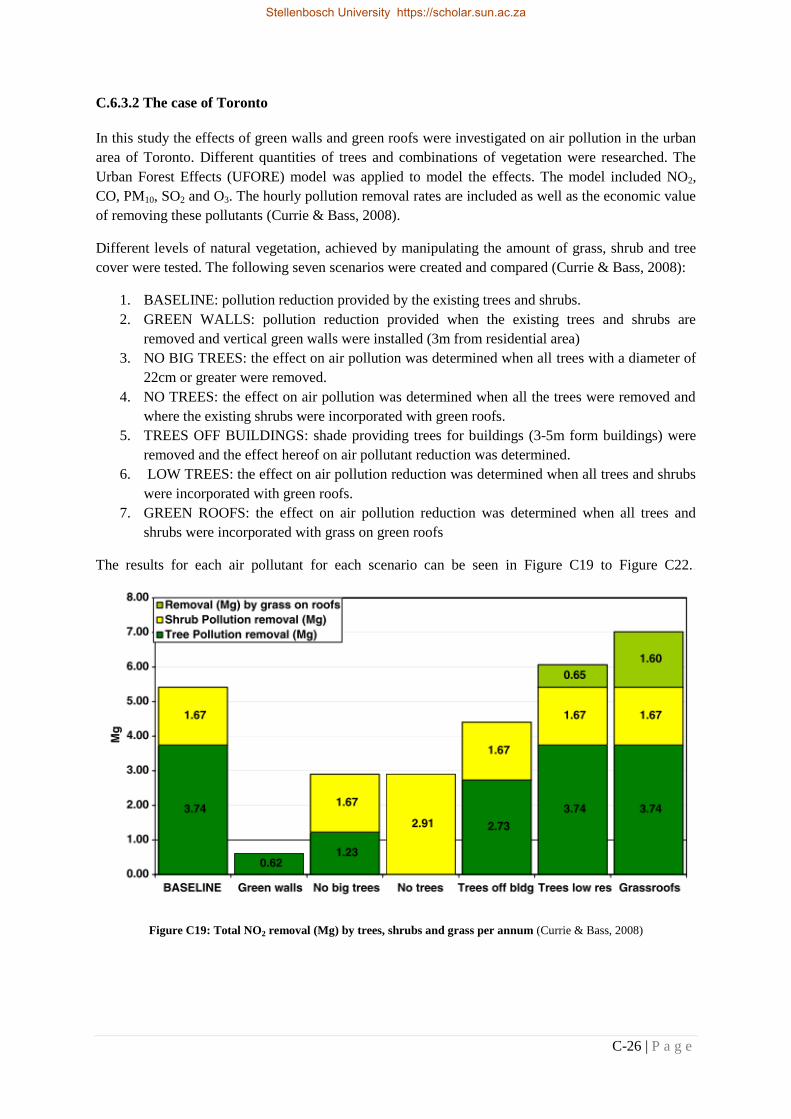
C-26 | P a g e
C.6.3.2 The case of Toronto
In this study the effects of green walls and green roofs were investigated on air pollution in the urban
area of Toronto. Different quantities of trees and combinations of vegetation were researched. The
Urban Forest Effects (UFORE) model was applied to model the effects. The model included NO2,
CO, PM10, SO2 and O3. The hourly pollution removal rates are included as well as the economic value
of removing these pollutants (Currie & Bass, 2008).
Different levels of natural vegetation, achieved by manipulating the amount of grass, shrub and tree
cover were tested. The following seven scenarios were created and compared (Currie & Bass, 2008):
1. BASELINE: pollution reduction provided by the existing trees and shrubs.
2. GREEN WALLS: pollution reduction provided when the existing trees and shrubs are
removed and vertical green walls were installed (3m from residential area)
3. NO BIG TREES: the effect on air pollution was determined when all trees with a diameter of
22cm or greater were removed.
4. NO TREES: the effect on air pollution was determined when all the trees were removed and
where the existing shrubs were incorporated with green roofs.
5. TREES OFF BUILDINGS: shade providing trees for buildings (3-5m form buildings) were
removed and the effect hereof on air pollutant reduction was determined.
6. LOW TREES: the effect on air pollution reduction was determined when all trees and shrubs
were incorporated with green roofs.
7. GREEN ROOFS: the effect on air pollution reduction was determined when all trees and
shrubs were incorporated with grass on green roofs
The results for each air pollutant for each scenario can be seen in Figure C19 to Figure C22..
Figure C19: Total NO2 removal (Mg) by trees, shrubs and grass per annum (Currie & Bass, 2008)
Stellenbosch University https://scholar.sun.ac.za
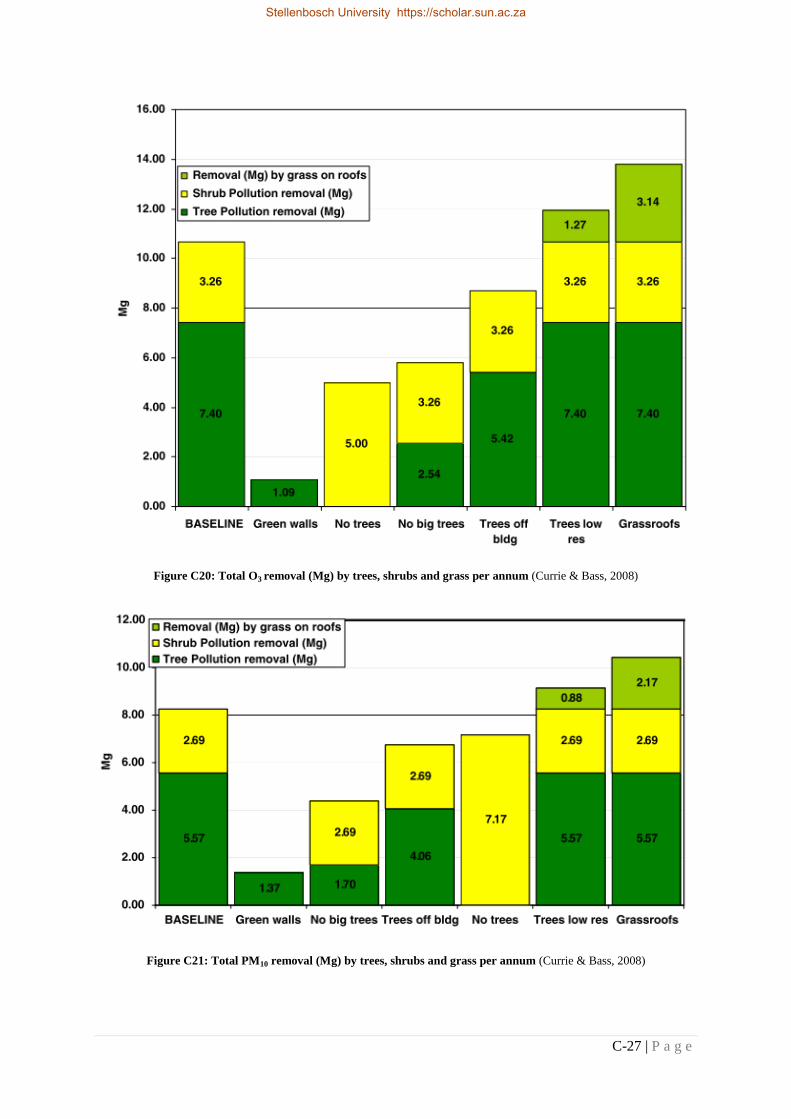
C-27 | P a g e
Figure C20: Total O3 removal (Mg) by trees, shrubs and grass per annum (Currie & Bass, 2008)
Figure C21: Total PM10 removal (Mg) by trees, shrubs and grass per annum (Currie & Bass, 2008)
Stellenbosch University https://scholar.sun.ac.za
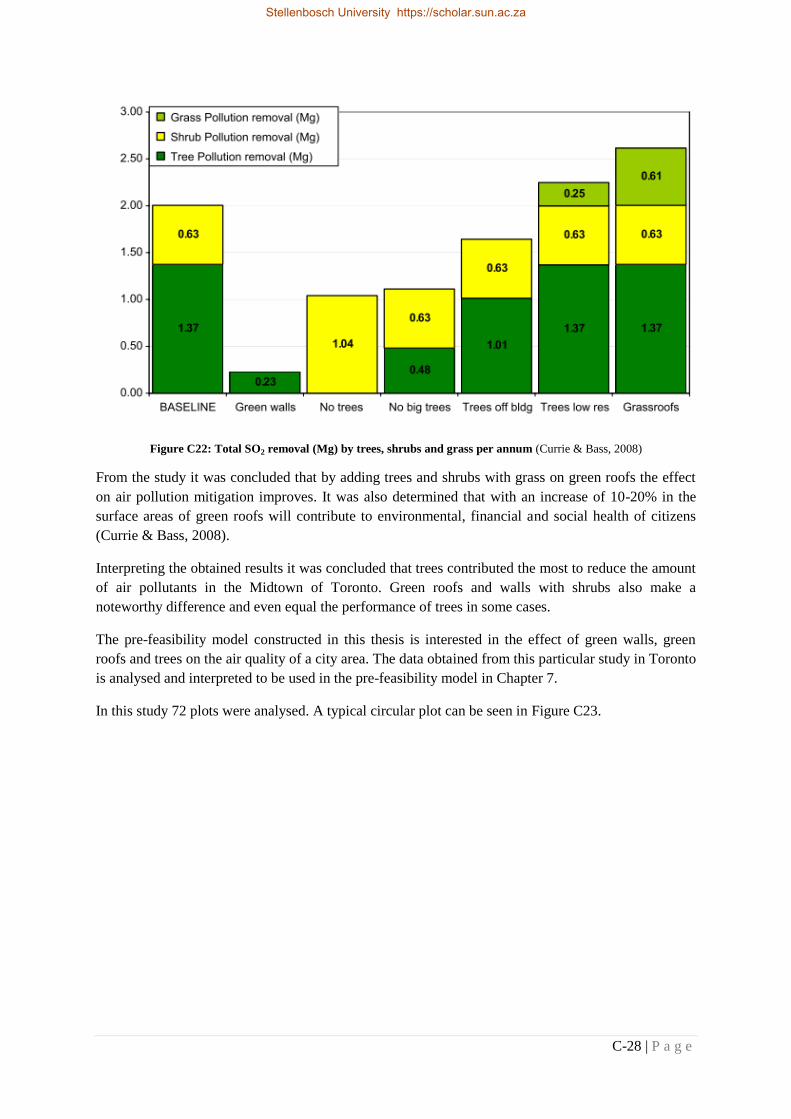
C-28 | P a g e
Figure C22: Total SO2 removal (Mg) by trees, shrubs and grass per annum (Currie & Bass, 2008)
From the study it was concluded that by adding trees and shrubs with grass on green roofs the effect
on air pollution mitigation improves. It was also determined that with an increase of 10-20% in the
surface areas of green roofs will contribute to environmental, financial and social health of citizens
(Currie & Bass, 2008).
Interpreting the obtained results it was concluded that trees contributed the most to reduce the amount
of air pollutants in the Midtown of Toronto. Green roofs and walls with shrubs also make a
noteworthy difference and even equal the performance of trees in some cases.
The pre-feasibility model constructed in this thesis is interested in the effect of green walls, green
roofs and trees on the air quality of a city area. The data obtained from this particular study in Toronto
is analysed and interpreted to be used in the pre-feasibility model in Chapter 7.
In this study 72 plots were analysed. A typical circular plot can be seen in Figure C23.
Stellenbosch University https://scholar.sun.ac.za
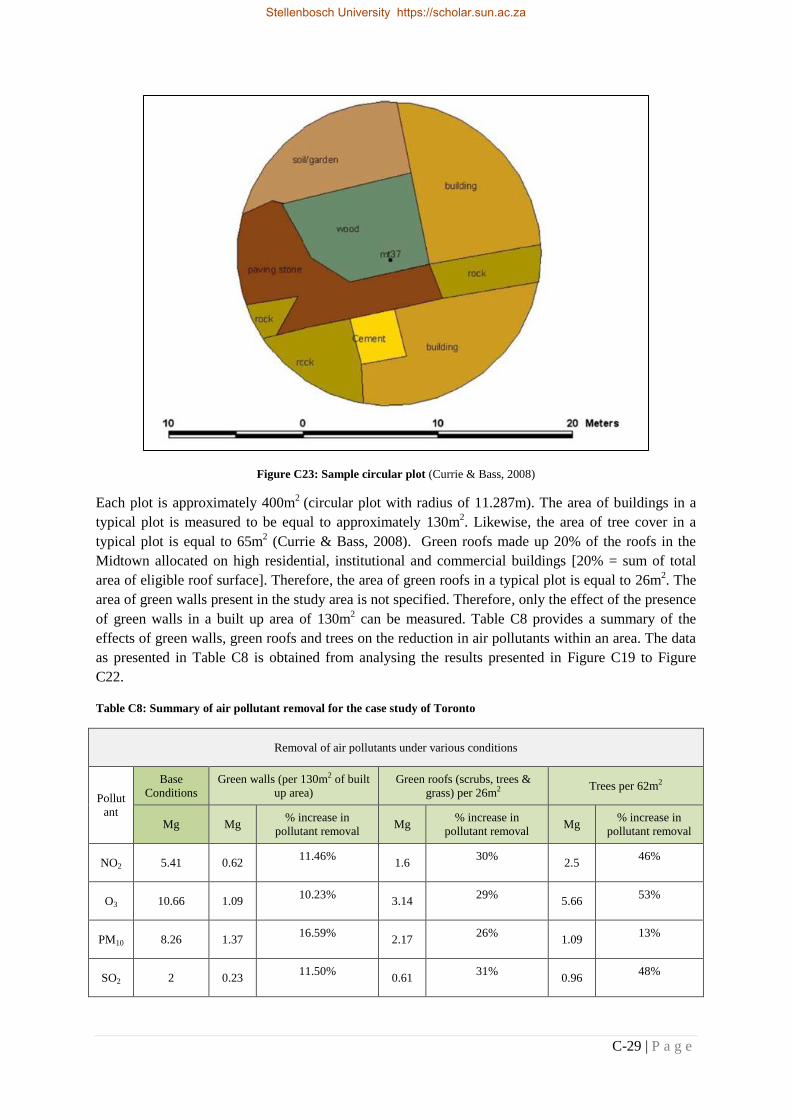
C-29 | P a g e
Figure C23: Sample circular plot (Currie & Bass, 2008)
Each plot is approximately 400m2
(circular plot with radius of 11.287m). The area of buildings in a
typical plot is measured to be equal to approximately 130m2. Likewise, the area of tree cover in a
typical plot is equal to 65m2 (Currie & Bass, 2008). Green roofs made up 20% of the roofs in the
Midtown allocated on high residential, institutional and commercial buildings [20% = sum of total
area of eligible roof surface]. Therefore, the area of green roofs in a typical plot is equal to 26m2. The
area of green walls present in the study area is not specified. Therefore, only the effect of the presence
of green walls in a built up area of 130m2 can be measured. Table C8 provides a summary of the
effects of green walls, green roofs and trees on the reduction in air pollutants within an area. The data
as presented in Table C8 is obtained from analysing the results presented in Figure C19 to Figure
C22.
Table C8: Summary of air pollutant removal for the case study of Toronto
Removal of air pollutants under various conditions
Pollut
ant
Base
Conditions
Green walls (per 130m2 of built
up area)
Green roofs (scrubs, trees &
grass) per 26m2 Trees per 62m2
Mg Mg % increase in
pollutant removal Mg
% increase in
pollutant removal Mg
% increase in
pollutant removal
NO2 5.41 0.62 11.46%
1.6 30%
2.5 46%
O3 10.66 1.09 10.23%
3.14 29%
5.66 53%
PM10 8.26 1.37 16.59%
2.17 26%
1.09 13%
SO2 2 0.23 11.50%
0.61 31%
0.96 48%
Stellenbosch University https://scholar.sun.ac.za

C-30 | P a g e
C.6.3.3 The case of Hong Kong
A study conducted in Hong Kong measured the absorption of CO2 before and after the
implementation of green roofs. The area of the green roof used in this study is 218.3m2
(18.5m x 11.8m) and the leaves on the green roof is estimated to have an area of 657m2. An
absorption rate of 0.03m/min and environmental CO2 concentration of 700 mg/m3
was used in the
study. It was found that the green roof absorbed approximately 13.8g of CO2 in a minute. The overall
reduction on CO2 within the area of the green roof was approximately 1.85% (Li et al., 2010).
C.6.4. Other Benefits
Green engineering technologies can contribute to lessen the urban heat island effect. The pollutants
are directly captured by the vegetation which also contributes to the minimization of the urban heat
island effect and the production of smog. In the Greater Melbourne area the vegetation of green roofs
and walls are used to cool urban areas. This is known as green infrastructure.
Green engineering technologies can also reduce the storm water run-off in urban areas due to green
roofs absorbing excess water. Green roofs also contribute in improving the quality of the run-off
water (GreenWall_Australia, 2014).
C.7 The Effect of Green Spaces on the Environment
A study on the ecological outcomes of civic and expert-led urban greening projects using indigenous
plant species in Cape Town, South Africa was conducted. This study investigated the outcome of
plant greening interventions in the city of Cape Town. The study explores how society forms the
urban ecology and how public green space and gardens form part of the urban fabric. In this study a
linkage is created between the responsibility of the civil society to achieve conservation goals and the
quality of life associated with these ecological outcomes (Anderson et. al., 2014).
Urban green spaces such as parks and urban forests play a vital role in sustaining an urban and social-
ecology. In the 2460 km2 city area of Cape Town there is 3350 plant species with abundance in
Fynbos. Due to urban growth, Cape Town has the highest concentration of threatened plant species
per area in the world, with only 14% of the original area left for vegetation and 11 of the 19
vegetation types in the city are threatened (Anderson et. al., 2014).
Form this it can be taken that attention should be given to the existence of the natural flora in urban
planning. Solutions can include the rehabilitation of existing vegetated areas or creating new
vegetation areas. The study concluded that by intervening in existing green spaces by the removal of
waste and intruder plants, the biodiversity of the endemic plant and insect species, especially
pollinating species such as bees can be promoted. Furthermore, the creation of new green spaces will
also contribute to the conservation and promotion of the urban ecology and biodiversity. This is
however only attainable when the civil society, residents, civic associations, urban planners, and other
parties collaborate (Anderson et. al., 2014).
A study was conducted in Port Alfred and Fort Beaufort. In this study the perceptions of residents in
Port Alfred and Fort Beaufort on public green spaces were researched (Shackleton & Blair, 2013).
Residents in both towns indicated that they would like to have more public green spaces in their town.
From the results it was concluded that the following factors play a significant role in whether
residents will make use of a public green space:
Stellenbosch University https://scholar.sun.ac.za

C-31 | P a g e
1. Distance to public green space;
2. Whether the public green space is well maintained;
3. Whether the public green space is safe3;
4. Whether the public green space has good facilities, is spacious and has sufficient vegetation.
The residents further indicated that the benefits they gained from using public green space are
relaxation, recreation, employment opportunities and environmental benefits. Another important
conclusion drawn from this study is that it is important to capture the needs of the people who will be
using the space in order for the space to be optimally utilized (Shackleton & Blair, 2013).
3 41% of residents in Fort Beaufort and 49% in Port Alfred indicated that they felt unsafe when using
public green spaces
Stellenbosch University https://scholar.sun.ac.za
D-1 | P a g e
APPENDIX D: SEMI-STRUCTURED INTERVIEWS
Semi-structured interviews were conducted with industry professionals. The interviews consisted
primarily of critique on the developed pre-feasibility model. Part 1 of the pre-feasibility model, the
Location Determination Checklist, was discussed with Me Nina Otto, a professional City and Town
Planner. Part 2, the Mathematical model, was discussed with Me Cara Gerber, a professional
Transportation and Strategic Planning Engineer. Some of the other typical questions asked and the
answers gathered during these semi-structured interviews are provided in this Appendix.
Semi-Structured Interview with Me Nina Otto, City and Town Planner:
1. According to your experience, what type of area functions the best as a closed area? Do the
factors included in the location checklist cover the primary characteristics associated with a
successful pedestrian zone?
The answer to this question was that areas with mixed land use are considered ideal for pedestrian
zones. The comment was made that the factors included in the location checklist address all of the
important location parameters.
2. Currently the model recommends that all of the location characteristics be met for the
proposed pedestrian zone to be successful. Do you agree?
The answer was that in the case where all of the checklist characteristics are met, the success is very
likely; the authority using the model should however use their own discretion and motivations in the
case where some checks are not met depending on the reasoning for this particular authority to install
a pedestrian zone.
3. Do you know of any other successful pedestrian areas that were implemented in an area
where cars initially had priority?
The example of the pedestrian zone near the University of Oxford was mentioned. One of the factors
that contribute to the success of this pedestrian zone is that the authorities responsible for this
pedestrian zone realised that parking cannot be completely removed. A park-and-ride system (parking
elsewhere with a shuttle services) was therefore implemented.
4. Do you think there is a better method to determine the success of a proposed area for
pedestrianization? How is the location for a pedestrian zone currently determined?
The answer to this question was that Transport Oriented Development (TOD) principles are currently
considered when planning pedestrian zones form an urban planning point of view. Zoning schemes
and land use policies are also taken into consideration. Currently there is no specific standard form to
determine the location of a pedestrian zone.
Stellenbosch University https://scholar.sun.ac.za

D-2 | P a g e
Semi-Structured Interview with Me Cara Gerber, Transportation and Strategic Planning
Engineer:
1. According to previous studies, constant accelerating and decelerating movements cause the
most traffic pollution. Currently the mathematical model calculates the air quality benefits by
using a unit of vehicles removed daily. Do you think it is necessary to model parking
movements additionally?
The answer was that in the case where a very detailed answer is required it can be beneficial to
include parking movements separately, but the model as it is currently, most likely include this factor
already. By removing vehicles, the associated parking movements are also removed spontaneously. It
will not make a significant change to add parking movements to the current model, since the model
provides outputs as a positive or negative. In order to refine this aspect of the model specific streets
can be used as input.
2. Do the development of projects in the strategic planning industry take economic and social
benefits into account?
The answer indicated that these factors are certainly of high importance. In South Africa the economic
feasibility of projects however drives the success of the projects. Social benefits however do have an
economic value and should therefore be included in the decision making and planning process. With
this question the recommendation was made to create a model where all of the factors currently
addressed are provided in terms of an economic value and benefit. It was further concluded that a
specific weight cannot be attributed to air quality, economic, social or traffic factors. The specific case
will determine which factor is the most important and which benefits are aimed for.
3. How does a change in the transport network impact the flow of traffic? Have you experienced
the concept of “traffic evaporation” with a change in the transport network? What factors
typically indicate the efficiency of a network? Delays and queue lengths are used in the model
validation.
Over a long enough period traffic will sort itself out and the network will return to a state of
equilibrium. Therefore, with regards to the model validation, it should be considered that the previous
study with which the model is compared does not stretch over a long enough period. It can be
anticipated that if the time period is increased the model validation outputs will differ and indicate
more positive changes. Queue lengths and delays are a good measure to determine the operations of
intersections; it can however change drastically depending on the time of day.
4. Is the mathematical model practical and is there a need for a model of this nature in the
industry?
The answer obtained for this question was that the industry will definitely benefit from a tool like this
to aid in decision making. It will enable authorities to compare different project possibilities on the
same grounds. Since it is an easy, quick and cheap tool to use, companies will also be able to save on
costs prior to major investigations.
Stellenbosch University https://scholar.sun.ac.za

D-3 | P a g e
APPENDIX E: ETHICAL CONSENT FORMS
Stellenbosch University https://scholar.sun.ac.za