PowerPoint 簡報 - Greentown China Holdings Limited
55
-
Upload
khangminh22 -
Category
Documents
-
view
0 -
download
0
Transcript of PowerPoint 簡報 - Greentown China Holdings Limited


Table of Contents
2
1H 2018 Results Overview ················································································ 3
1H 2018 Financial Highlights ············································································· 6
1H 2018 Operational Review··············································································· 19
Prospects ························································································· 28
Appendix I:Projects Pre-sales in 1H 2018··················································· 41
Appendix II : Property Sales Recognized in 1H 2018················································· 42
Appendix III : Newly-added Land Reserves in 1H 2018··········································· 44
Appendix IV : Projects to be Completed in 2H 2018 ··············································· 46
Appendix V : Offshore Financing Overview (As at 30 Jun 2018) ································ 48
Appendix VI : Key Projects to be Launched in 2H 2018 ·········································· 49

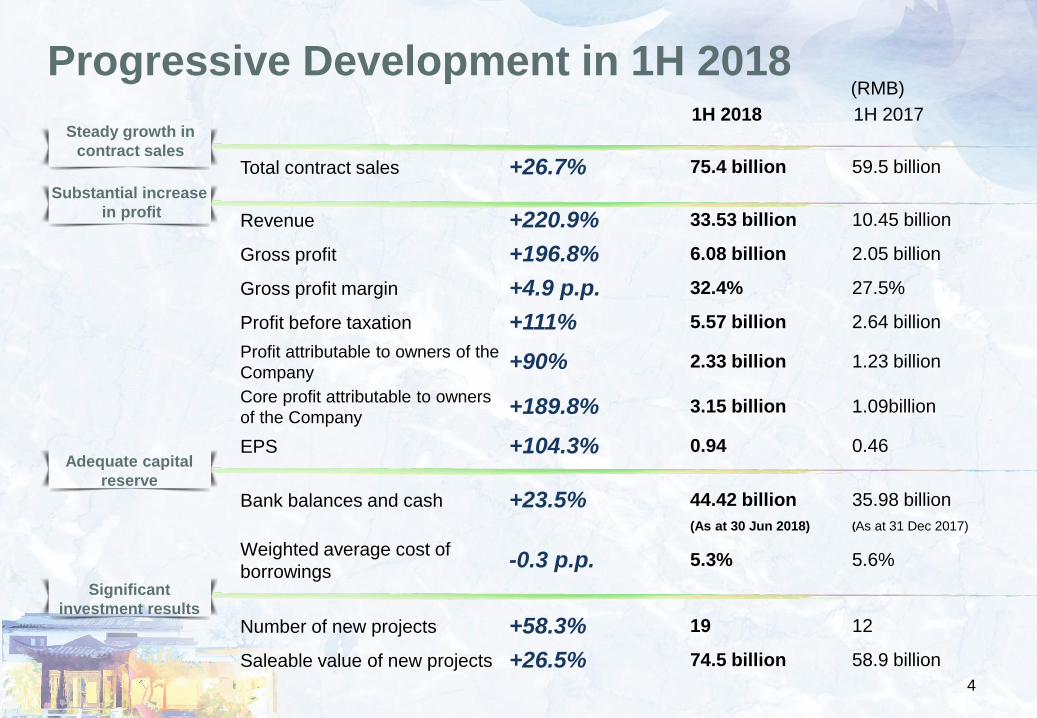
Progressive Development in 1H 20181H 2018 1H 2017
Total contract sales +26.7% 75.4 billion 59.5 billion
Revenue +220.9% 33.53 billion 10.45 billion
Gross profit +196.8% 6.08 billion 2.05 billion
Gross profit margin +4.9 p.p. 32.4% 27.5%
Profit before taxation +111% 5.57 billion 2.64 billion
Profit attributable to owners of the
Company+90% 2.33 billion 1.23 billion
Core profit attributable to owners
of the Company+189.8% 3.15 billion 1.09billion
EPS +104.3% 0.94 0.46
Bank balances and cash +23.5% 44.42 billion 35.98 billion
(As at 30 Jun 2018) (As at 31 Dec 2017)
Weighted average cost of
borrowings-0.3 p.p. 5.3% 5.6%
Number of new projects +58.3% 19 12
Saleable value of new projects +26.5% 74.5 billion 58.9 billion
(RMB)
Substantial increase
in profit
Adequate capital
reserve
Significant
investment results
4
Steady growth in
contract sales

2018 Top 100 Real Estate Enterprises in China Development Research
Center of the State Council
Tsinghua University Real
Estate Research Institute
China Index Academy
- Top 10 Chinese Real Estate Enterprises by
Comprehensive Strength
- Top 10 Largest Chinese Real Estate Enterprises
Social Responsibility Enterprise of the year
2018 Customer Satisfaction Leading Brand China Index Academy
2018 China Real Estate “Golden Brick Award”
21st Century Real Estate
Forum- The Most Influential Corporate Brand of the year
- Annual Real Estate Finance Innovation Award
2018 China Real Estate Brand Value TOP10China Real Estate
Business
2018 TOP10 China Green Real Estate Enterprise
Third-party Green Ranking
2018 TOP10 China Full Renovation Enterprise
2018 TOP10 Green Real Estate (residential)
2018 TOP10 Chinese Prefabricated Construction
Enterprise
5
Industry Leading Honors


7
For the 6 months ended 30 June
(RMB million) 2018 2017 Change
Revenue 33,534 10,449 +220.9%
Gross profit 6,078 2,048 +196.8%
Gross profit margin* 32.4% 27.5% +4.9 p.p.
Gross profit margin from property sales* 31.9% 26.4% +5.5 p.p.
Share of results of JVs/ associates 302 376 -19.7%
Net gain on disposal of subsidiaries 491 1,626 -69.8%
Administrative expenses -1,246 -925 +34.7%
Selling expenses -530 -522 +1.5%
Finance costs -627 -736 -14.8%
Provision and reversal of impairment
losses on certain assets-82 -64 +28.1%
Fair value gain on re-measurement of
associates and a joint venture to
acquisition date for business integration
achieved in stages
591 4 +587
Key Financial Data

Key Financial Data
8
For the 6 months ended 30 June
(RMB million) 2018 2017 Change
Profit before taxation 5,575 2,642 +111%
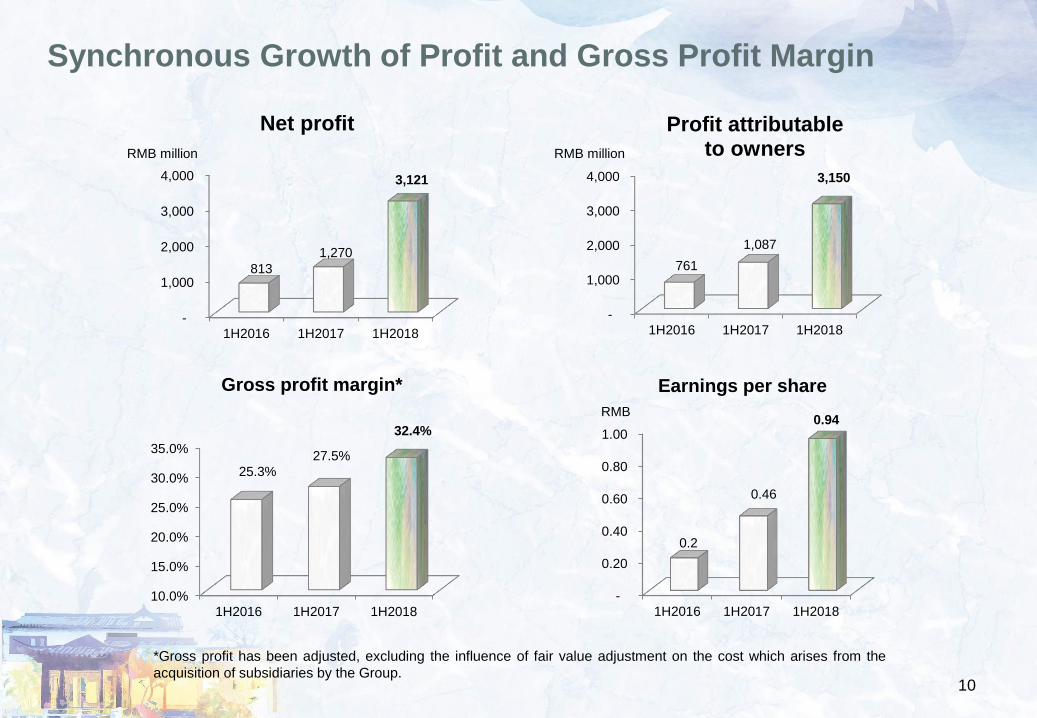
Net profit 3,121 1,270 +145.7%
Profit attributable to owners 2,335 1,229 +90%
Core profit attributable to owners** 3,150 1,087 +189.8%
Basic earnings per share (RMB) 0.94 0.46 +104.3%
** Core profit attributable to owners has been adjusted, excluding the foreign exchanges losses or gains, acquisition
gain, post-tax effect of provision and reversal of impairment loss on certain assets, and net post-tax effect of fair
value changes on certain assets during the Period.
* Gross profit has been adjusted, excluding the fair value adjustment on the cost which arises from the acquisition of
subsidiaries by the Group.

Key Financial Data
9
(RMB million) 30 Jun 2018 31 Dec 2017 Change
Total assets 257,394 235,828 +9.1%
Total borrowings 73,219 57,706 +26.9%
Net assets 52,243 46,794 +11.6%
Properties for development 40,624 25,468 +59.5%
Properties under development 86,605 83,149 +4.2%
Completed properties for sale 12,375 20,651 -40.1%
Bank balances and cash 44,418 35,977 +23.5%
Contract liabilities 58,911 65,900 -10.6%
-
1,000
2,000
3,000
4,000
1H2016 1H2017 1H2018
761
1,087
3,150
Profit attributable to owners
Synchronous Growth of Profit and Gross Profit Margin
-
1,000
2,000
3,000
4,000
1H2016 1H2017 1H2018
813
1,270
3,121
Net profit
10.0%
15.0%
20.0%
25.0%
30.0%
35.0%
1H2016 1H2017 1H2018
25.3%
27.5%
32.4%
Gross profit margin*
-
0.20
0.40
0.60
0.80
1.00
1H2016 1H2017 1H2018
0.2
0.46
0.94
Earnings per share
10
*Gross profit has been adjusted, excluding the influence of fair value adjustment on the cost which arises from the
acquisition of subsidiaries by the Group.
RMB million RMB million
RMB

Prudent Financial Control and Stable Debt Structure
0.0%
20.0%
40.0%
60.0%
80.0%
2016.6.30 2017.6.30 2018.6.30
70%
57.9% 55.1%
Net gearing ratio
0.0%
5.0%
10.0%
15.0%
20.0%
2016.6.30 2017.6.30 2018.6.30
14%
18%17.3%
Bank balances and cash/ Total assets*
4.5%
5.0%
5.5%
6.0%
6.5%
1H2016 1H2017 1H2018
6.3%
5.6%
5.3%
Weighted average interest cost
*Including pledged bank deposits
11
-
5,000
10,000
15,000
20,000
25,000
30,000
2016.6.30 2017.6.30 2018.6.30
27,648
23,479
28,801
Net borrowings
RMB million

Administrative Expenses
*The increase in the cost of the human resources is mainly attributable to the amortization of RMB64.9 million from the new
share option granted by the Group to the directors and senior management at the end of 2017. The Group has hired
multiple mid- to high-end talents for the development of diversified businesses to promote the implementation of the
strategy of “balancing the development of light assets and heavy assets”.
** Daily operating expenses have increased year-on-year in accordance to the Company's revenue. However, its ratio to
revenue has dropped significantly. This is mainly because the comprehensive budget management and the efforts to further
optimize cost control have achieved initial results.
12
For the 6 months ended 30 June
(RMB million) 2018 2017 Change
Cost of human resources* 586 394 +48.7%
Daily operating expenses**
(including hotel depreciation)384 293 +31.1%
Others 276 238 +16%
Total 1,246 925 +34.7%

Selling Expenses
13
For the 6 months ended 30 June
(RMB million) 2018 2017 Change
Cost of human resources 190 226 -15.9%
Cost of marketing activities* 250 207 +20.8%
Other operating fees 90 89 +1.1%
Total 530 522 +1.5%
* The Company's sales increased significantly in the Period while the increase in the cost of marketing activities was
relatively small, and its ratio to revenue decreased significantly, mainly due to the Company's active expansion of marketing
channels and strict control of expenses.

In 1H 2018, the capitalization rate was 75.2% (1H 2017: 60%). The increase was mainly due to the acquisition
of a batch of quality land since the 4th quarter of 2017, and the increase in borrowing funds usage.
The weighted average interest cost of the total borrowings in 1H 2018 is 5.3% (1H 2017: 5.6%).
In 1H 2018, the weighted average borrowing amount of total borrowings was RMB 70.6 billion (1H 2017: RMB
57 billion).
Notes:
Interest Expenses
14
For the 6 months ended 30 June
(RMB million) 2018 2017 Change
Expenditure interest 627 736 -14.8%
Capitalized interest 1,899 1,103 +72.2%
Total 2,526 1,839 +37.4%

1H 2018 1H 2017
¥18,586
¥5,073
¥5,361
¥355
¥1,866
¥5,931
32%
2%
29%
27%
10%
20%
¥3,132
45%¥6,941
8%¥159
¥1,146
1%
26%
¥4,087
¥15,465
Revenue and Cost Structure
In 1H 2018, the Group’s gross profit was
RMB6,078 million, 196.8% higher than
RMB2,048 million in 1H 2017.
15
Gross profit**
Other direct costs
Capitalized interests***
Construction costs
Land costs
Breakdown of revenue and cost per sqm (RMB/sqm) *
*Including both saleable areas above and under ground.
**Gross profit has been adjusted, excluding the influence
of fair value adjustment on the cost which arises from
the acquisition of subsidiaries by the Group.
***The increase in capitalized interest expense is mainly
due to the impact of amortization of the significant
financing component in pre-sale contracts on costs.
The Group achieved a gross profit margin
of 32.4% in 1H 2018, significantly higher
than 27.5% in 1H 2017. In particular, the
gross profit margin of property sales was
31.9% , significantly higher than 26.4% in
1H 2017. Such increase was mainly due to
the delivery of Tianjin National Games
Village, Qingdao Ideal City and Shanghai
Bund House in the Period, which enjoyed
high gross profit margins and accounted for
a great proportion of total property sales.

Financial Position (As at 30 Jun 2018)
16
(RMB million)Due within
1 year
Due within
1-2 years
Due over
2 years
30 Jun 2018 31 Dec 2017
Total Total
Bank and other borrowings 18,640 11,294 12,713 42,647 37,183
Corporate debt instruments 6,035 4,483 16,842 27,360 17,374
Senior notes - - 3,212 3,212 3,149
Total borrowings 24,675 15,777 32,767 73,219 57,706
% of total borrowings 33.7% 21.5% 44.8% 100% 100%
Bank balances and cash 44,418 35,977
Net borrowings 28,801 21,729
Net assets 52,243 46,794
Net gearing ratio 55.1% 46.4%
Notes: For the 6 months ended 30 June 2018, the weighted average interest cost of total borrowings was 5.3% (1H 2017:
5.6%).
As at 30 June 2018, the Group’s bank balances and cash was 1.8x of the balance of borrowings due within 1 year.
Offshore borrowings amounted to RMB11.1 billion, accounting for 15.2% of the total borrowings.
Greentown Group has obtained credit quota of more than RMB209.6 billion from financial institutions, of which
approximately RMB147.5 billion remains available as at 30 June 2018.

Financing
Onshore financing
In 1H 2018, the Group's domestic financing quota was sufficient and the channels were smooth. A total of
RMB6 billion in corporate bonds and RMB4 billion in short-term commercial papers were issued.
Greentown Asset Management undertakes the strategy of “real estate financialization”, which builds a
financial service platform, improves the liquidity of assets, and strives to develop new financing channels. In
January 2018, the supply chain ABS quota of RMB10 billion was approved by the Shenzhen Stock Exchange
and can be issued within two years. Three tranches have been successfully issued so far.
Corporate bonds
Issued (1H 2018):
RMB6 billion
Issued (Aug):
RMB 1.65 billion
Commercial papers
Issued (1H 2018):
RMB4 billion
Supply chain ABS
Issued (1H 2018):
RMB293 million
Issued (Jul & Aug):
RMB820 million
In 1H 2018, de-leverage, risk prevention and strict regulations exerted greater financial pressure on real estate
companies. The US dollar interest rate hike also pushed the market interest rate to increase gradually, and the
difficulty of corporate financing increased. The Group actively explored financing channels, maintained relatively
low financing costs and sufficient funds.
17

Tenor Size Interest rate
3-year USD 300 million LIBOR+2.8%
5-year USD 300 million LIBOR+3.3%
Tenor Size Interest rate
3-year USD 800 million HIBOR/LIBOR+2.565%
Offshore financing
Club loan signing ceremony
In the same month, the Company signed a US$600 million
unsecured bilateral loan agreement with BOC Hong Kong.
In July 2018, the Company entered into an unsecured club loan
agreement with 18 major banks in Hong Kong such as HSBC.
18
Financing
Bilateral loan signing ceremony
In face of the mounting challenges in domestic and overseas capital markets, the Group
has continued to garner robust support from leading banks in Hong Kong and been
awarded with an aggregate of US$1,400 million loan facilities in a week. The new facilities
are not only larger in size, but also lower in interest rates with longer tenor, underscoring
Greentown China’s outstanding creditability and investors’ intact confidence in its
continued growth. The funds obtained will mainly be used for the refinancing of the
Company’s existing offshore debts.
Pre-sales Overview
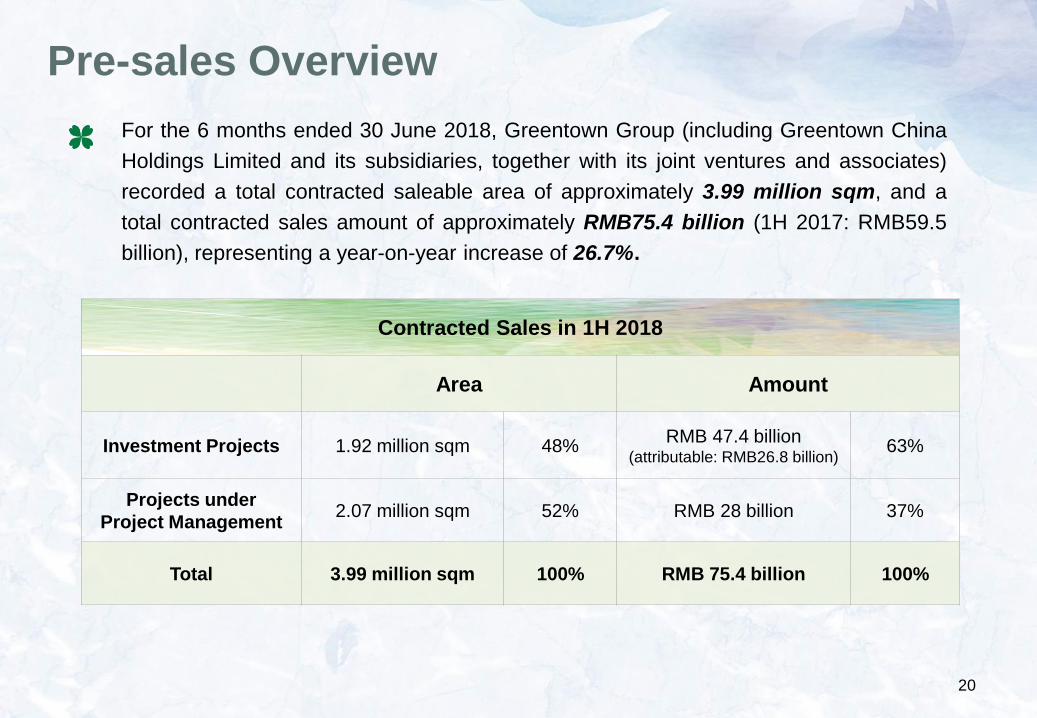
Contracted Sales in 1H 2018
Area Amount
Investment Projects 1.92 million sqm 48%RMB 47.4 billion
(attributable: RMB26.8 billion)63%
Projects under
Project Management2.07 million sqm 52% RMB 28 billion 37%
Total 3.99 million sqm 100% RMB 75.4 billion 100%
20
For the 6 months ended 30 June 2018, Greentown Group (including Greentown China
Holdings Limited and its subsidiaries, together with its joint ventures and associates)
recorded a total contracted saleable area of approximately 3.99 million sqm, and a
total contracted sales amount of approximately RMB75.4 billion (1H 2017: RMB59.5
billion), representing a year-on-year increase of 26.7%.

Investment Projects
Projects under Project Management
45.4 44.2 47.4
15.3
28
2016 2017 2018
In 1H 2018, the average selling price of Greentown investment projects reached a market-
leading level of RMB24,637 per sqm (1H 2017: RMB21,540 per sqm).
Bohai Rim15.6%
Pearl River Delta0.5%
Others3.9%
Hangzhou24.8%Chengdu-
Chongqing1%
Overseas0.1%
45.4
59.5
75.424,637
21,540
19,281
Yangtze River Delta
(Excl. Zhejiang)
11.4%
Zhejiang
(Excl. Hangzhou)
42.7%
21
Pre-sales Overview
For the 6 months ended 30 June
Pre-sales*(RMB billion)
Average selling price of investment projects
(RMB/sqm)
Geographical distribution of
investment projects*
Notes:
* Contracted Sales Amount
* Based on pre-sales amount
2016 2017 2018

22
Pre-sales Overview
Beautiful Life Developer
Conference
In the context of tighter regulation and control over real estate industry,
the Company adopted a proactive sales strategy, and the sell-through rate
continued to increase, and the inventory amount decreased significantly.
In 1H 2018, the sell-through rate of newly launched investment
projects reached 80%, with some projects exceeding 90%. The
overall sell-through rate of investment projects is about 62%.
Accelerated sell-through
Significantly reduced inventory
As at 30 June 2018, the saleable amount of the inventory
investment projects was RMB29.1 billion, which dropped
significantly from RMB41.3 billion on 31 December 2017.
Amongst which, inventories in third- and fourth-tier cities
decreased from RMB18.1 billion at the beginning of the
year to RMB9.2 billion.
New project name release
Ningbo Willow Breeze
Wine Tasting Event

Significant results in investment
Newly-added Land Reserves in 1H 2018
Newly-added Land Bank
Total number of projects 19
Total GFA 4.4 million sqm
Attributable GFA 2.44 million sqm
Total land premium RMB24.8 billion
Total land premium paid by
GreentownRMB18.4 billion
Average land cost per GFA RMB10,111 /sqm
Estimated newly added saleable
amountApproximately RMB74.5 billion
Saleable amount attributable to the
GroupApproximately RMB43.3 billion
In 1H 2018, while deepening its presence in the Yangtze River
Delta, the Group continued to increase investment in core cities
such as Wuhan, Xi‘an, Chongqing, Tianjin, etc., and made its
debut into Fuzhou. The Group also invested in projects with fast
turnover, grasping the opportunities to replenish its land bank
efficiently.
Yangtze River Delta41.1%
Chengdu-Chongqing
9.4%
Others (Xi’an, Wuhan,
Fuzhou, etc) 42.1%
Beijing-Tianjin-Hebei7.4%
Newly-added land breakdown
by city level (by est. sales value)
23
Newly-added land
Geographical breakdown (by GFA)
First-, second- tier
83.1%
Third-, fourth- tier16.9%

Region
Total
GFA
(‘000 sqm)
Total
Saleable Area
(‘000 sqm)
Average LandCost per GFA*
(RMB/sqm)
Hangzhou 4,205 2,731 8,368
Zhejiang
(Excl. Hangzhou)9,137 6,224 4,168
Shanghai 333 218 14,710
Jiangsu 1,526 1,009 12,948
Beijing 1,253 825 17,626
Tianjin 890 627 3,528
Shandong 4,886 3,719 2,439
Henan 454 265 541
Hebei 888 497 969
Hunan 275 266 763
Hubei 698 487 10,304
Xinjiang 362 340 1,133
Hainan 1,248 845 2,786
Liaoning 723 571 3,488
Guangdong 763 509 10,538
Sichuan 560 470 8,528
Chongqing 515 367 5,747
Heilongjiang 464 385 757
Inner Mongolia 175 138 232
Shaanxi 2,619 1,902 1,137
Anhui 9 8 2,610
Fujian 212 135 13,844
Overseas 779 694 844
Total 32,974 23,232 5,239
Bohai Rim26.2%
Yangtze River Delta
(Excl. Zhejiang)
5.6%
Hangzhou12.8%
Zhejiang (Excl. Hangzhou)
27.7%
Chengdu-Chongqing
3.3%
Others19.7%
Pearl River Delta2.3%
Overseas2.4%
Total Land Bank Overview
As at 30 June 2018, Greentown Group had a total of
106 projects (including projects under development and
pending for development) with a GFA of approximately
32.97 million sqm, of which approximately 20.73 million
sqm was attributable to the Group.
Progressive optimization of land reserve
Structure
24*Average land cost is calculated as total land cost divided by total GFA.
Projects in first- and second-tier cities accounted for
70% of the total saleable value.
Geographical breakdown (by GFA)
The total saleable area amounted to approximately
23.23 million sqm, of which approximately 14.38 million
sqm was attributable to the Group.

Development Scale
As at 30 June 2018, Greentown Group had a total GFA under construction of 40.30 million
sqm for investment and non-investment projects, amongst which GFA of investment projects
under construction reached 16.36 million sqm, GFA under construction of projects under
project management was 23.94 million sqm, as the development scale continues to expand.
25
Investment Projects1H 2018 completion
(million sqm)
2H 2018 estimates
(million sqm)
Commence construction 3.24 4.88
Delivery 1.83 3.53
The Group has been accelerating the development cycle of its new projects. New projects
acquired in 1H 2018 are expected to translate into saleable resources of approximately RMB
9.5 billion for the year, equivalent to a conversion rate of 13% (1H 2017: 9 %).
26
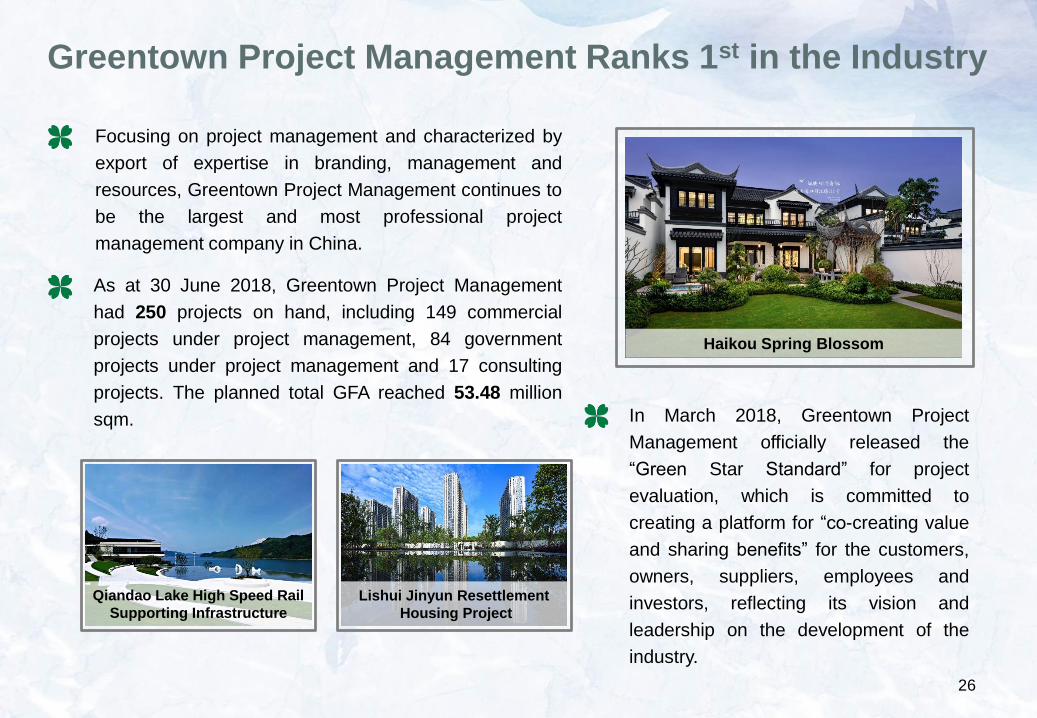
Greentown Project Management Ranks 1st in the Industry
Focusing on project management and characterized by
export of expertise in branding, management and
resources, Greentown Project Management continues to
be the largest and most professional project
management company in China.
As at 30 June 2018, Greentown Project Management
had 250 projects on hand, including 149 commercial
projects under project management, 84 government
projects under project management and 17 consulting
projects. The planned total GFA reached 53.48 million
sqm. In March 2018, Greentown Project
Management officially released the
“Green Star Standard” for project
evaluation, which is committed to
creating a platform for “co-creating value
and sharing benefits” for the customers,
owners, suppliers, employees and
investors, reflecting its vision and
leadership on the development of the
industry.
Haikou Spring Blossom
Qiandao Lake High Speed Rail
Supporting Infrastructure
Lishui Jinyun Resettlement
Housing Project

Inclusion into MSCI China All Shares Index
1. MSCI China All Shares Index
2. MSCI Asia Pacific ex-Japan Financials
& Real Estate Index
3. MSCI Emerging Market Index
4. Hang Seng Composite Mid-Cap Index
5. Hang Seng Composite Index
6. Hang Seng Composite Properties and
Construction Index
7. S&P Pan Asia Index
8. FTSE China HK Listed Index
List of stock indices
inclusive of GreentownIn May 2018, the Company was included in MSCI
China All Shares Index, which came into effect on
31 May 2018.
There were 302 additions to the MSCI China All
Shares Index this time, Greentown was selected
as one of the few property securities in the MSCI
indices. This fully reflects the Group’s recognition
in the international capital market and further
enhances the Group’s reputation and status in
the international investment community and
capital markets.
As a leading player in the Chinese real estate
market, the Company is a constituent stock in
multiple stock indices, demonstrating the capital
market’s affirmation of the Company.
27


29
The land reserve can ensure stable
development in the next three years with
the land cost at a relatively low level,
which endows the Company with strong
ability to defend cyclical risks;
In order to ensure different levels of
housing demand are met, the future
supply structure adjustment of the real
estate market will be market-oriented to
diversify the form of residence.
The olive-type product structure, rich
product sequence and quality service are in
line with market development needs in the
future.
The Company has smooth financing
channels and stable debt ratio, thus when
the land market cools down, there will be
sufficient funds for investment to timely
acquire high-quality lands.
Strong anti-risk ability and materialization of profitability
The 2:6:2 product structure has been
initially formed (20% adapt to high-end
market demand, 60% are cost-effective
products, and the remaining 20% are to
develop high-quality resettlement houses
and social security houses);
Regulatory measures on the real estate
sector will continue; policies such as
sales restriction and price caps will rein
in growth of housing price, and the
turnover rate and sales return will be
greatly affected.
Outlook
Expectations on the
market environment
Key strengths of
the Company

Outlook
Product
quality
Develop the blue ocean market
segments of the real estate
industry, namely ideal towns,
beautiful countryside and living
services.
Transform from the excessive
dependence of resources and
capital to the reliance of the
brand, talents, and professional
abilities.
Give full play to the advantages
of mixed ownership enterprises;
major shareholders to help
maintain Greentown’s core
strengths and long-term
competitiveness.
Inheritance Breakthrough Development
Diversified channels to replenish
saleable resources; optimize land
reserve structure; expand
capacity in a timely manner to
break through the existing scale.
Development
momentum
Shareholder
support
Emerging
segments
Promote cost effectiveness and
innovation on the basis of
product quality to solidify the
benchmarking position of
Greentown’s products and
reputation among customers.
Customer-centric services to
enhance customer satisfaction
and loyalty; constantly improve
service scope to create a better
life for owners.
Scale
breakthrough
30
Service
quality

31
Continue to focus on investment and development, and accelerate the turnover rate without sacrificing
product quality; replenish quality lands at a timely manner to break through the existing scale.
At present, the Group has developed eight product series, including residential properties, commercial
properties, urban complexes, public properties (hospitals, schools, etc.), social security properties, ideal
town series, sports series, and Young City series, with an aim to stand out in different market segments.
Enrich product series to optimize the asset-heavy business
The Company will focus on ideal town series, sports series, Young City series and other featured property
series, to fully utilize its advantages, and obtain more low-cost, profitable projects to seek new growth
drivers.
Balancing the Development of Heavy and Light Assets
Ideal town series
With the vision of creating a beautiful lifestyle, the Group
will actively explore the blue ocean market, such as ideal
town, beautiful countryside and other real estate segments.
It will become the driving force of the new urbanization and
rural revitalization and become the new growth driver of the
Company.Hainan Blue Town Zhoushan Changzhi Island

32
Hangzhou Young City Ningbo Young City
Young City series
The Company has successfully built the first comprehensive local
metro properties (“TOD” properties), namely Hangzhou Young City
and Ningbo Young City, and has reached strategic cooperation
intentions with key urban rail transit groups in core cities like
Wuhan and Foshan. In the future, the Company will build more
high-quality metro properties riding on the opportunities brought by
the rapid development of rail transit.
Sports series
With the experience of construction and event services of four
National Games Villages, namely Jinan, Shenyang, Tianjin and
Xi'an, the Company will actively acquire and carefully create
more sports series projects, replenish high-quality land reserve
and enhance brand influence. Tianjin National Games Village Jinan National Games Village
Enrich product series to optimize the asset-heavy business
Balancing the Development of Heavy and Light Assets
33
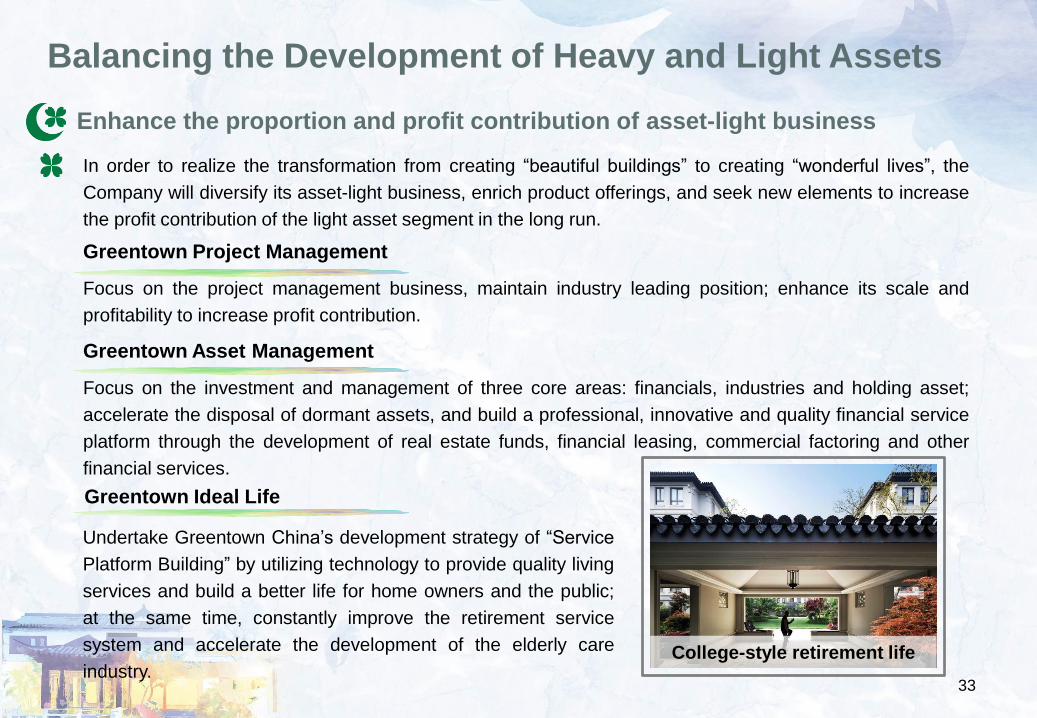
Greentown Asset Management
Greentown Project Management
Greentown Ideal Life
Focus on the project management business, maintain industry leading position; enhance its scale and
profitability to increase profit contribution.
Focus on the investment and management of three core areas: financials, industries and holding asset;
accelerate the disposal of dormant assets, and build a professional, innovative and quality financial service
platform through the development of real estate funds, financial leasing, commercial factoring and other
financial services.
College-style retirement life
In order to realize the transformation from creating “beautiful buildings” to creating “wonderful lives”, the
Company will diversify its asset-light business, enrich product offerings, and seek new elements to increase
the profit contribution of the light asset segment in the long run.
Enhance the proportion and profit contribution of asset-light business
Balancing the Development of Heavy and Light Assets
Undertake Greentown China’s development strategy of “Service
Platform Building” by utilizing technology to provide quality living
services and build a better life for home owners and the public;
at the same time, constantly improve the retirement service
system and accelerate the development of the elderly care
industry.

34
Build a full industry chain covering the R&D, design, construction,
consulting, housing 4S services, testing, supporting industries
(building materials and equipment) according to the Company's
business development needs; and continue to explore and
expand business scope, and increase products’ add-on value.
Greentown Housing Technology
Xiong’an Company
The Group will use the established Greentown Xiong'an City
Operation Company as the vehicle to cooperate with CCCG to
begin strategic cooperation in Xiong'an New Area. It will ride on
the Greentown brand to provide project management and all-
round living services, and explore the innovative model of “new
urban integrated operation service provider”.
Greentown housing 4S
Xiong’an New Area
Balancing the Development of Heavy and Light Assets
Enhance the proportion and profit contribution of asset-light business

35
Greentown China
(03900. HK)
CCCG
(28.83%)
The Wharf
(24.94%)
Founding
Shareholder
Mr. Song Weiping
(10.43%)
Ping An Securities
and associates
(8.05%)
The Group will capitalize on the resources and the rich capital market experience of its major
shareholders, namely CCCG, a state-owned enterprise, the Wharf, blue chip Hong Kong enterprise
and Ping An Securities to carry out multi-dimensional strategic cooperation. The Group will also ride
on Mr. Song Weiping, the Group’s founding shareholder’s unremitting pursuit in product and service
quality enhancement, and strive to establish itself as a model of mixed ownership enterprises.
Other public
shareholders
(27.75%)
To Become the Model of Mixed Ownership Enterprises

36
Multilevel
In-depth
Cooperation
Corporate governance
Resources sharing
Capitalize on the brand value of Greentown to jointly participate in urbanization construction
projects, explore emerging industries, and increase the proportion of Greentown’s asset-
light business.
Development of asset-light business
CCCG will continue to provide full support for Greentown's credit rating and financing; the Group will
fully utilize the financial management and control system of CCCG to further improve its cost control
and enhance profit margins.
Credit support
Financial services
Ride on the resources and rich experience of CCCG in finance to promote the development of Greentown real
estate funds, financial leasing, commercial factoring, etc., and further accelerate the implementation of
Greentown‘s “Real Estate Financialization” strategy.
Strengthening Strategic Cooperation with CCCG
On 1 August 2018, Mr. Zhang Yadong joined the board of the Company and was appointed as Executive Director
and Chief Executive Officer. He has extensive experience in urban and rural construction and real estate
management. The Company is expected to make new strides towards quality and sustainable development under
his leadership.
On top of the existing cooperation on projects, CCCG will share more quality project resources, give
play to the Greentown brand and construction capabilities, and gradually form a strategic
partnership with clear roles, mutual benefits and close coordination.

37
Precise Investment Layout
Adhere to core investment strategy
Optimize investment strategy
Promptly optimize and adjust the Group’s investment strategy: adjust from the
opportunistic approach in the first half, to the risk prevention and control in the
second half of the year, and seek strategic opportunities to invest in the 4th
quarter of the year and the first half of next year to accelerate investments in
both heavy and light assets and form a combination of general development
projects and strategic projects.
Diversify investment channels
Watch for investment channels such as M&A, urban renewal, and village land
use projects, vigorously develop its new TOD business, and promote the pilot
development of integrated development models such as industry-city integration.
The Group will adhere to the value investment strategy of “core cities, core
locations”, and further cultivate in regions where it has presence to further
optimize its national investment layout. With a focus on sales and profit, the
Group will stick to its core investment strategy, while seeking market
opportunities in various regions and cities to ensure accurate investment layout.

Improve Financial Management and Focus on Profit Realization
On the basis of ensuring the traditional
financing model, the Group will
broaden financing channels and
models and increase capital market
financing.
Effectively strengthen cash flow
management, speed up the collection
of receivables, and improve the
collection of funds to improve capital
efficiency.
Further strengthen the overall budget
management, enhance the internal
control capabilities and build value-
added capabilities to create better
operating profits.
With active and sound financial
management as the core and cash
flow analysis as the foundation, a
new financial risk warning model will
be constructed to strengthen the
financial risk management system.
Channel
expansion
Efficiency
enhancement
Profit
creation
Risk
control
38

Saleable GFA
(million sqm)
Saleable Amount
(RMB billion)
Investment projects 4.17 116.5
Projects under project management 3.98 52.4
Total 8.15 168.9
In 2H 2018, 108 investment projects or project
phases will meet the pre-sale conditions.
Breakdown of saleable projects in 2H 2018
Others
7.9%
Saleable Resources in 2H 2018
Saleable resources of investment project
Overseas
0.4%
39
Inventories from 1H 2018 amounted to RMB29.1
billion while RMB87.4 billion would be new
launches in 2H 2018*.
As at 30 June 2018, the total revenue contracted
but not recognized amounted to RMB103.2
billion (attributable: RMB56.6 billion).
The saleable GFA in first- and second-tier cities
is expected to reach 2.44 million sqm, amounting
to approximately RMB82.5 billion and accounting
for 71% of the saleable value in 2018.
Note: Excluding new projects that will be acquired and become saleable in 2H 2018.
Zhejiang
(Excl. Hangzhou)
24.1%
Chengdu-
Chongqing
4.4%
Hangzhou
23.7%Pearl River
Delta
4.1%
Yangtze River Delta
(Excl. Hangzhou)
12.9%
Bohai Rim
22.5%


*Area sold includes area above ground
Appendix I: Project Pre-sales in 1H 2018
41
ProjectsArea Sold*
(sqm)
Amount
(RMB million)
ASP
(RMB/sqm)
Ningbo Young City 160,958 356,962 22,177
Hangzhou Phoenix Mansion 30,482 282,422 92,651
Wenzhou Xijiangyue 93,808 251,821 26,844
Zhoushan Changzhi Island 140,897 227,358 16,137
Shanghai Bund House 13,563 225,140 165,990
Hangzhou Arcadia Town 94,140 189,090 20,086
Hangzhou Xixi Yunlu 25,181 174,295 69,217
Lishui Liuxiangyuan 80,190 170,841 21,304
Taizhou Ningjiang Mingyue 96,619 160,084 16,569
Wuxi Fengqi Heming 49,507 150,972 30,495
Others 1,136,559 2,546,092 22,402
Total 1,921,904 4,735,077 24,637

Projects Type of PropertiesArea Sold*
(sqm)
Sales Revenue
(RMB million)% of Total
ASP
(RMB/sqm)
Tianjin National Games
VillageIntegrated community 464,080 12,171 38.7% 26,226
Chengdu Wenrude High-rise apartment, villa 131,527 3,212 10.2% 24,421
Qingdao Ideal City Integrated community 186,259 2,470 7.9% 13,261
Shanghai Bund House High-rise apartment 17,626 2,371 7.5% 134,517
Jinan Yulan GardenHigh-rise apartment,
multi-storey apartments, villa138,342 1,418 4.5% 10,250
Yuyao Mingyuan High-rise apartment 90,330 1,165 3.7% 12,897
Qingdao Jiaozhou
Lagerstroemia SquareHigh-rise apartment 128,928 1,044 3.3% 8,098
Shengzhou Greentown
MansionHigh-rise apartment, villa 85,248 1,026 3.3% 12,035
Hainan Blue Town Integrated community 26,682 763 2.4% 28,596
Hefei Jade Lake Rose
GardenHigh-rise apartment, villa 43,577 672 2.1% 15,421
Others 377,879 5,108 16.4% 13,518
Total 1,690,478 31,420 100% 18,586
* Area sold includes area above ground and underground
Appendix II: Property Sales Recognized in 1H 2018- Subsidiaries
42

Projects Type of PropertiesArea Sold*
(sqm)
Sales Revenue
(RMB million)% of Total
ASP
(RMB/sqm)
Hangzhou Young City High-rise apartment 144,618 2,939 31.1% 20,323
Hangzhou Wulin No.1 High-rise apartment 5,166 393 4.2% 76,074
Jinan National Games
VillageHigh-rise apartment, villa 16,381 366 3.9% 22,343
Qingdao Deep Blue
CenterHigh-rise apartment 5,650 342 3.6% 60,531
Wenzhou Xijiangyue High-rise apartment 10,111 246 2.6% 24,330
Hangzhou Xixi Yunlu Villa 3,802 236 2.5% 62,073
Hangzhou Phoenix
MansionHigh-rise apartment 15,244 932 9.8% 61,139
Wuxi Lihu Camphora
GardenHigh-rise apartment 48,219 857 9.1% 17,773
Hangzhou Arcadia Town High-rise apartment, villa 29,013 584 6.2% 20,129
Shenyang National
Games VillageHigh-rise apartment, villa 42,083 368 3.9% 8,745
Others 138,317 2,200 23.1% 15,905
Total 458,604 9,463 100% 20,634
Appendix II: Property Sales Recognized in 1H 2018– JVs and Associates
43* Area sold includes area above ground and underground
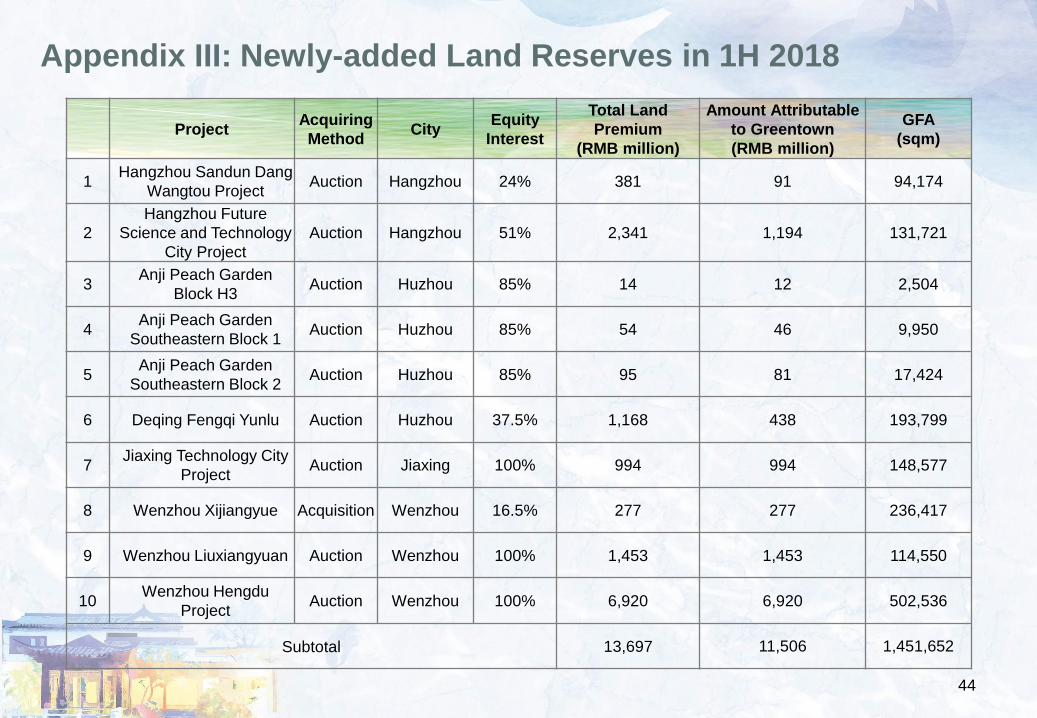
ProjectAcquiring
MethodCity
Equity
Interest
Total Land
Premium
(RMB million)
Amount Attributable
to Greentown
(RMB million)
GFA
(sqm)
1Hangzhou Sandun Dang
Wangtou ProjectAuction Hangzhou 24% 381 91 94,174
2
Hangzhou Future
Science and Technology
City Project
Auction Hangzhou 51% 2,341 1,194 131,721
3Anji Peach Garden
Block H3Auction Huzhou 85% 14 12 2,504
4Anji Peach Garden
Southeastern Block 1Auction Huzhou 85% 54 46 9,950
5Anji Peach Garden
Southeastern Block 2Auction Huzhou 85% 95 81 17,424
6 Deqing Fengqi Yunlu Auction Huzhou 37.5% 1,168 438 193,799
7Jiaxing Technology City
ProjectAuction Jiaxing 100% 994 994 148,577
8 Wenzhou Xijiangyue Acquisition Wenzhou 16.5% 277 277 236,417
9 Wenzhou Liuxiangyuan Auction Wenzhou 100% 1,453 1,453 114,550
10Wenzhou Hengdu
ProjectAuction Wenzhou 100% 6,920 6,920 502,536
Subtotal 13,697 11,506 1,451,652
Appendix III: Newly-added Land Reserves in 1H 2018
44

Appendix III: Newly-added Land Reserves in 1H 2018
* The estimated saleable amount is expected to reach RMB74.5 billion 45
ProjectAcquiring
MethodCity
Equity
Interest
Total Land
Premium
(RMB million)
Amount Attributable
to Greentown
(RMB million)
GFA
(sqm)
11Zhoushan
Orchid ResidenceAuction Zhoushan 45% 1,357 611 151,099
12Changshu Southern
New City ProjectAuction Changshu 100% 1,622 1,622 203,607
13 Tianjin Jinghai Project Auction Tianjin 60% 1,366 820 326,823
14Wuhan International
Expo Center ProjectAcquisition Wuhan 14% 739 739 464,205
15Chongqing Xiyong
ProjectAuction Chongqing 49% 1,850 906 412,572
16 Fuzhou Willow Breeze Auction Fuzhou 51% 2,930 1,494 211,640
17Xi'an National Games
Village Block 224Auction Xi’an 51% 608 310 416,355
18Xi'an National Games
Village Block 103Auction Xi’an 51% 308 157 352,092
19Xi'an National Games
Village Block 179Acquisition Xi’an 51% 277 277 407,819
Subtotal 11,057 6,936 2,946,212
Total 24,754 18,442 4,397,864

\ Project Equity interest PhaseGFA
(sqm)
Su
bsid
iari
es
Hangzhou Willow Breeze 50% I 120,710
Hangzhou Jinlin Mansion 50% I 193,185
Lin’an Spring Blossom 18% IV 46,281
Zhoushan Changzhi Island 96.9% Xiangyunyuan II 82,913
Yuyao Mingyuan 100% IV 159,894
Nanjing Yunqi Rose Garden 79.9% I, II 147,517
Qingdao Ideal City 80% Lanyuan 102,374
Qingdao Jiaozhou
Lagerstroemia Square100% V 13,117
Xintai Yulan Garden 70% VI,VII 79,322
Hefei Jade Lake Rose Garden 100% VIII 8,820
Hainan Blue Town 51% XII, XIII, XXV 132,199
Changsha Bamboo Garden 49.5% Southern V, Northern V 33,315
Xinjiang Lily Apartment 50% X 212,057
Zhengzhou Yanming Lake
Rose Garden100% VII 3,486
Subtotal 1,335,190
Appendix IV: Projects to be Completed in 2H 2018
46

Project Equity interest PhaseGFA
(sqm)
JV
s/A
ss
oc
iate
s
Hangzhou Young City 25.6% III 240,219
Hangzhou Legend Mansion 22.5% I 203,315
Hangzhou Arcadia Town 50% XII/XIII 225,417
Zhoushan Rose Garden 51% Huiyuan, Yayuan 232,286
Shengzhou Opera Town 32.5%Integrated commercial
complex I38,100
Ningbo Center 49.3% II, III 208,922
Taizhou Yulan Plaza 49% IV 38,038
Xuzhou Lagerstroemia Mansion 60% II, III, IV 176,471
Jinan National Games Village 45%IV、XIII、XVI、XVII、XVIII、XX (partially)
179,441
Jinan Center 39% I 98,741
Shandong Laiwu Xueye Lake
Peach Garden49% III (partially) 28,812
Dalian Taoyuan Lane 40% II, III 119,510
Shenyang National Games Village 50% II, III (partially) 347,806
Chongqing Orchid Residence 50% I 21,614
Huangshi Yulan Garden 30% V 31,582
Subtotal 2,190,274
Total 3,525,464
Appendix IV: Projects to be Completed in 2H 2018
47

As at 30 June 2018, other overseas financing, including the onshore guarantee for offshore loan, amounted to USD375
million, and the total overseas financing amounted to USD3.041 billion.
In July 2018, the Company has signed agreements regarding USD800 million club loan and USD600 million bilateral loan.
As at 23 July 2018, the Company has redeemed the outstanding USD576 million club loan.
As at 9 August 2018, the Company has redeemed the outstanding USD240 million bilateral loan.
Notes:
TypeSize
(USD million)Tenor Maturity Next Callable Interest Rate
Club Loan 576 3-year 18 March 2019 - LIBOR+3.13%
Bilateral Loan 240 3-year 8 April 2019 - LIBOR+3%
USD Senior Notes 500 5-year 11 August 2020 11 August 2018 5.875%
Perpetual Securities 500 - Perpetual 28 January 2019 9%
Perpetual Securities 400 - Perpetual 15 April 2019 5.5%
Perpetual Securities 450 - Perpetual 11 July 2020 5.25%
Total 2,666 - - - -
Appendix V: Offshore Financing Overview(As at 30 June 2018)
48

Region Major Projects to be Launched
HangzhouHangzhou Guiyu Chaoyang, Hangzhou Yunqi Peach Garden,
Hangzhou Helu, Hangzhou Qinyuan
Zhejiang
(excluding Hangzhou)
Deqing Fengqi Yunlu, Ningbo Willow Breeze,
Wenzhou Liuxiangyuan
Yangtze River Delta Region
(excluding Zhejiang)
Nantong Qinyuan, Wuxi Fengqi Heming,
Nanjing Yunqi Rose Garden
Bohai Rim Region Beijing Xifu Haitang, Tianjin Spring Blossom
Other CitiesChengdu Sincere Garden, Chongqing Orchid Residence,
Fuzhou Willow Breeze
Appendix VI: Key Projects to be Launched in 2H 2018
49
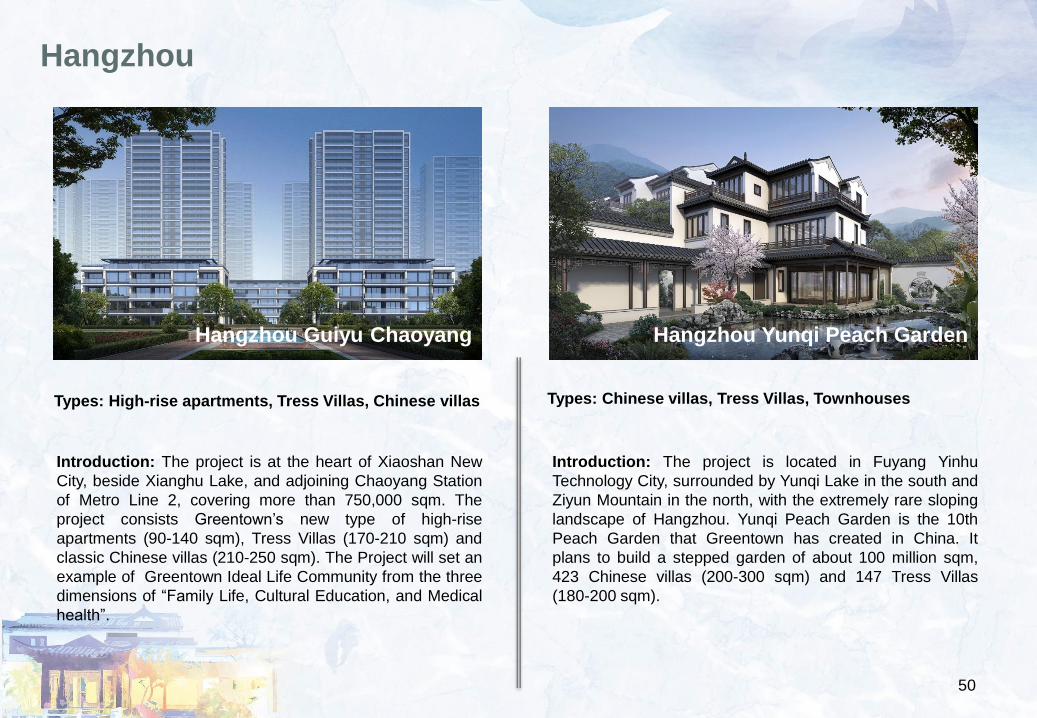
Hangzhou
Hangzhou Guiyu Chaoyang Hangzhou Yunqi Peach Garden
50
Types: High-rise apartments, Tress Villas, Chinese villas Types: Chinese villas, Tress Villas, Townhouses
Introduction: The project is at the heart of Xiaoshan New
City, beside Xianghu Lake, and adjoining Chaoyang Station
of Metro Line 2, covering more than 750,000 sqm. The
project consists Greentown’s new type of high-rise
apartments (90-140 sqm), Tress Villas (170-210 sqm) and
classic Chinese villas (210-250 sqm). The Project will set an
example of Greentown Ideal Life Community from the three
dimensions of “Family Life, Cultural Education, and Medical
health”.
Introduction: The project is located in Fuyang Yinhu
Technology City, surrounded by Yunqi Lake in the south and
Ziyun Mountain in the north, with the extremely rare sloping
landscape of Hangzhou. Yunqi Peach Garden is the 10th
Peach Garden that Greentown has created in China. It
plans to build a stepped garden of about 100 million sqm,
423 Chinese villas (200-300 sqm) and 147 Tress Villas
(180-200 sqm).

Types: Trees Villas, High-rise apartments
Introduction: The project is located in the new city of east
Ningbo, enjoying both the prosperity of the CBD and the
quietness of the Ecological Residential Area. The products
include four-storey innovative Trees Villas (170-240 sqm)
and TOP-series decorated high-rise apartments (110-165
sqm). Joining hands with the three internationally famous
design companies of GAD, Landau, and Taiwan DA-interior,
it is about to ingeniously create the third Tress Villa in China.
Deqing Fengqi Yunlu
Zhejiang
51
Types: Trees Villas, High-rise apartments
Introduction: The project is located in the core section of
Deqing Science and Technology New City, with a total floor
area of approximately 190,000 sqm. It is jointly developed
by Greentown, Dajia and Dothink. There are 19 high-rise
buildings (90-170 sqm) and 7 Trees Villas (180-240 sqm).
Besides Fengqi Lake, the project faces the permanent
meeting place of the UN World Geographic Information
Conference, and embraces the bustling old city in the north.
Ningbo Willow Breeze

Wuxi Fengqi Heming Nantong Qinyuan
Yangtze River Delta
52
Types: High-rise apartments, villas
Introduction: The project is a fully-furnished residence
located at the core of Taihu new city. The project comprises
9 blocks of Greentown’s second generation 112-168 sqm
high-rise apartments, 3 blocks of 168 sqm low-rise
apartments and 21 sets of 150-210 sqm villas. The project
enjoys Australia DAHD landscape design, and amenities
such as infinity pools, badminton courts, golf courses and
themed open floors.
Types: High-rise apartments
Introduction: Nantong Qinyuan is located at the core of
Wushui Commercial Circle in Nantong Gangzha District. It
enjoys the Tonglu Canal, close to Wanda Plaza and 1912
Cultural Street. It also has three-dimensional traffic
connecting different parts of the city. The total GFA of the
project is about 140,000 sqm. It is planned to build 13 17-
storey second-generation Greentown high-rise apartments
ranging from 95 to 175 sqm. A large central garden of about
4,000 sqm, an infinity pool, and three lobbies are under
planning. It will also be equipped with an interactive
intelligent runway and a KEEP fitness system.

无锡凤起和鸣
Beijing Xifu Haitang Tianjin Spring Blossom
Bohai Rim
Types: Chinese villas, Chinese townhouses
Introduction: The project is only 20 minutes away from
Tianjin City. It is close to Tuanbo Lake and boasts rich
waterscape resources. The overall plot ratio is only 0.7,
which is a rare low-density high-end community in Tianjin.
Products mainly consist of Chinese-style villas and 6 to 9-
storey townhouses. The Chinese-style villas are
approximately 127-280 sqm; the townhouses are
approximately 89-155 sqm.
Types: Chinese townhouses
Introduction: The project is located at the intersection of
Xishan Scenic Area and Yongding River in Beijing. It is
located in the ecological conservation area of west Beijing.
The main products are modern 5 to 8-storey Chinese-style
townhouses with elevators. The area of the apartments
ranges from 90 to 130 sqm. The plot ratio is 1.6-1.8, which
creates low-density housing for the contemporary Beijing
families with upgrade demand.
53

54
Chengdu Sincere GardenFuzhou Willow Breeze
Other Regions
Types: High-rise apartmentsTypes: High-rise apartments
Introduction: The project is located next to Yixin Lake in
Tianfu New District, Chengdu. It is the first residential lake
area in the southwestern region. It will be created into the
second-generation Greentown Classic high-rise, apartment
sizes range from 110 to 220 sqm and a landscaped garden
of 100,000 sqm.
Introduction: The Project is located as Fuzhou's popular
plate—the May Fourth North Plate. The project is a finely-
decorated high-rise. There are 14 towers with an area of 98-
148 sqm Greentown second-generation modern high-rise
apartments. Most of the layout of the apartment adopts “+1”
room design, most of which are three- or four-bedroom
functional layout. The community is set to come with an
enclosed park, landscaped atrium of more than 11,000 sqm,
commercial district of 15,000 sqm on the east, which will
meet the basic needs of the owners. As Greentown’s debut
in Fuzhou, it is bound to offer products of the best quality.

GREENTOWN CHINA HOLDINGS LIMITED
绿城中国控股有限公司
For more information,
please follow Greentown’s
official WeChat page
Investor Relations Contacts
Mr. Simon FungChief Financial Officer
Tel: +852 2523 3138
Email: [email protected]
Ms. Phyllis YuInvestor Relations
Tel: +86 571 8790 2676
Email: [email protected]
Ms. Hazel ChanInvestor Relations
Tel: +852 2530 0996
Email: [email protected]
Ms. Sherry XuHead of Investor Relations
Tel: +86 571 8790 2207
Email: [email protected]