
Power System Review 2016-17 - NT - Utilities Commission
209
Power System Review 2016‑17 www.ulicom.nt.gov.au The Ulies Commission of the Northern Territory
-
Upload
khangminh22 -
Category
Documents
-
view
4 -
download
0
Transcript of Power System Review 2016-17 - NT - Utilities Commission
Power System Review2016‑17
www.utilicom.nt.gov.au
The Utilities Commission of the Northern Territory

ii | Power System Review 2016-17

Executive Summary | iii
Executive summaryIntroduction
The 2016-17 Power System Review (review) is prepared by the Utilities Commission in accordance with section 45 of the Electricity Reform Act (Appendix B provides an extract of section 45). The review covers the Northern Territory’s regulated power systems, namely Darwin-Katherine, Alice Springs and Tennant Creek.
The review’s main role is to inform the Treasurer, government, licence holders and stakeholders on the current (2016-17) performance of the Territory’s power systems and trends in such performance, and future requirements and risks to the electricity industry in the Territory.
This year’s review seeks to include more information on the future technical and operational impacts from increased renewable energy, noting the Territory Government has a policy to achieve 50 per cent renewable energy by 2030.
Moving into the future there will be technical issues around how to incorporate greater levels of renewable energy into the regulated systems. While there are potential benefits that renewable energy can bring to capacity, diversity and choice for customers, there are also potential increased costs. The challenge is to deal with those technical issues at least cost to the system and ultimately consumers.
Other major upcoming changes that could have a significant impact on the three systems include the Territory Government’s current market reforms, System Control’s review of Generation Performance Standards (GPS) and reforms to the Territory gas markets.
The commission will engage with the relevant stakeholders and monitor these developments over the next year and report on their impact in the 2017-18 Power System Review.
Roadmap to renewablesThe Territory Government is seeking to reach a level of 50 per cent renewable energy for electricity consumption by 2030.
There is the likelihood of increased costs, especially in the provision of ancillary services necessary to ensure system security. However, new solar generation in the Territory will potentially give rise to increased generation capacity, investment and diversity of supply. Existing higher-cost generation capacity may be retired earlier than planned as it is displaced by new low-cost generation, this will have implications for returns to the owner of the assets and impact the reliability assessment.
Behind-the-meter solar photovoltaic (PV) and domestic-level battery systems will also increase opportunities for consumers to have greater control over their electricity supply.
If left to grow unmanaged, solar generation will detrimentally affect the secure operation of the power system. This is a particularly significant issue when minimum system demand reaches low levels, in particular when system demand reaches the spinning reserve requirements. Spinning reserve is generation in addition to system demand to ensure a secure system. Where system demand drops further, below the minimum level of spinning reserves, then System Control may have to constrain the solar generation to ensure there is sufficient levels of dispatchable synchronous generation online. In the longer term,

iv | Power System Review 2016-17
investment may be required in equipment such as batteries and synchronous condensers to maintain a secure system, leading to increased costs.
There are a number of potential solutions to these issues but they are likely to lead to increased system costs. Careful coordination of solutions will be required to ensure an efficient outcome. This will include understanding the trade-offs between strengthened GPS, ancillary services and network investment.
It is noted, the three regulated systems have different levels of solar PV penetration and weather patterns. It is likely the regulated systems may require different solutions at different times. This may include different pricing regimes in the individual systems, to provide appropriate incentives for customers.
The Australian Energy Market Operator (AEMO) conducted modelling on behalf of the commission that looked ahead 10 years and included a neutral (base) scenario and a 50 per cent renewables by 2030 (RE50%) scenario.
The modelling highlights that, with a continuous growth in solar generation, there will likely to be technical issues in a few years in Alice Springs. For simplicity, the modelling has assumed that the 50 per cent renewable energy target is achieved on a pro rata basis across the various systems. However, in practice and taking into account the technical issues of each system, it is likely a more holistic approach will be required to achieve that target.
The commission will consider the cost trade-offs between GPS, ancillary services and network investment as part of its assessment of System Control’s proposed GPS. Further, the commission’s 2017-18 Power System Review will examine the impact on system costs of introducing renewables while maintaining system security requirements.
The commission has approved two licences for grid-connected solar generation and is currently considering a third application. There is growing interest in installing solar generation in the Territory.
Overall performance Table i sets out a summary of the performance and risk to the three regulated systems in the Territory.
Executive Summary | v
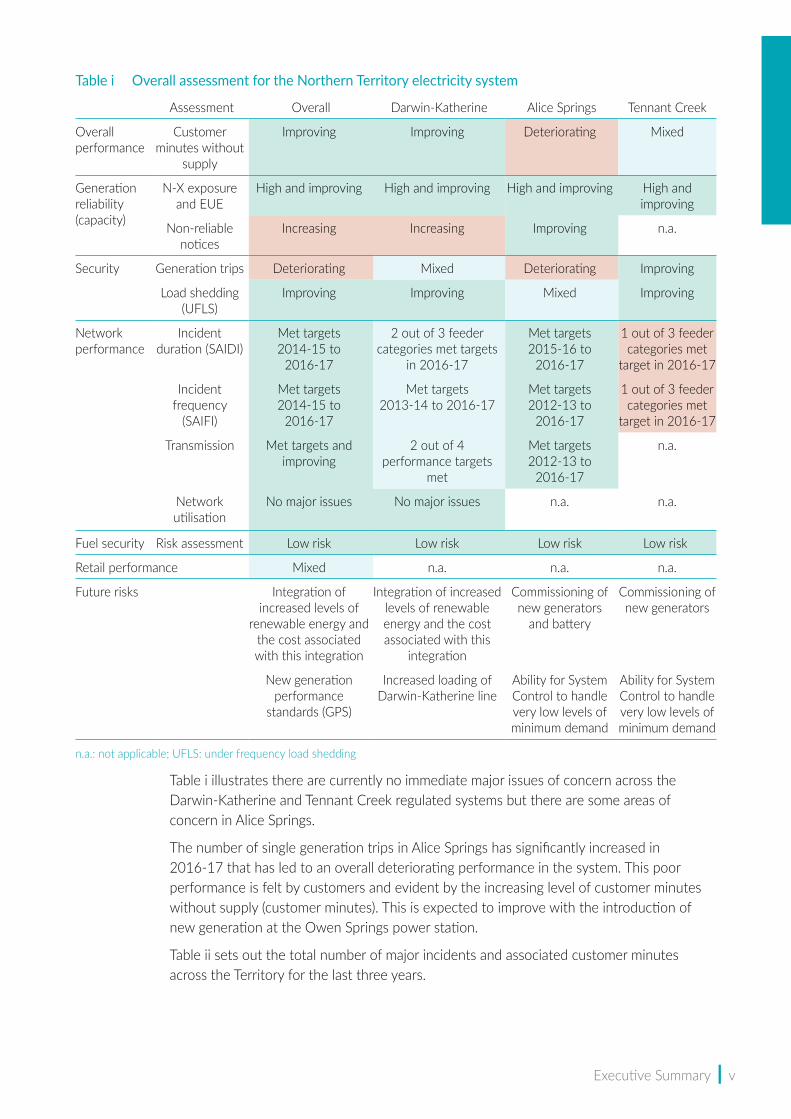
Table i Overall assessment for the Northern Territory electricity system
Assessment Overall Darwin-Katherine Alice Springs Tennant Creek
Overall performance
Customer minutes without
supply
Improving Improving Deteriorating Mixed
Generation reliability (capacity)
N-X exposure and EUE
High and improving High and improving High and improving High and improving
Non-reliable notices
Increasing Increasing Improving n.a.
Security Generation trips Deteriorating Mixed Deteriorating Improving
Load shedding (UFLS)
Improving Improving Mixed Improving
Network performance
Incident duration (SAIDI)
Met targets 2014-15 to
2016-17
2 out of 3 feeder categories met targets
in 2016-17
Met targets 2015-16 to
2016-17
1 out of 3 feeder categories met
target in 2016-17
Incident frequency
(SAIFI)
Met targets 2014-15 to
2016-17
Met targets 2013-14 to 2016-17
Met targets 2012-13 to
2016-17
1 out of 3 feeder categories met
target in 2016-17
Transmission Met targets and improving
2 out of 4 performance targets
met
Met targets 2012-13 to
2016-17
n.a.
Network utilisation
No major issues No major issues n.a. n.a.
Fuel security Risk assessment Low risk Low risk Low risk Low risk
Retail performance Mixed n.a. n.a. n.a.
Future risks Integration of increased levels of
renewable energy and the cost associated with this integration
Integration of increased levels of renewable energy and the cost associated with this
integration
Commissioning of new generators
and battery
Commissioning of new generators
New generation performance
standards (GPS)
Increased loading of Darwin-Katherine line
Ability for System Control to handle very low levels of minimum demand
Ability for System Control to handle very low levels of minimum demand
n.a.: not applicable; UFLS: under frequency load shedding
Table i illustrates there are currently no immediate major issues of concern across the Darwin-Katherine and Tennant Creek regulated systems but there are some areas of concern in Alice Springs.
The number of single generation trips in Alice Springs has significantly increased in 2016-17 that has led to an overall deteriorating performance in the system. This poor performance is felt by customers and evident by the increasing level of customer minutes without supply (customer minutes). This is expected to improve with the introduction of new generation at the Owen Springs power station.
Table ii sets out the total number of major incidents and associated customer minutes across the Territory for the last three years.
vi | Power System Review 2016-17
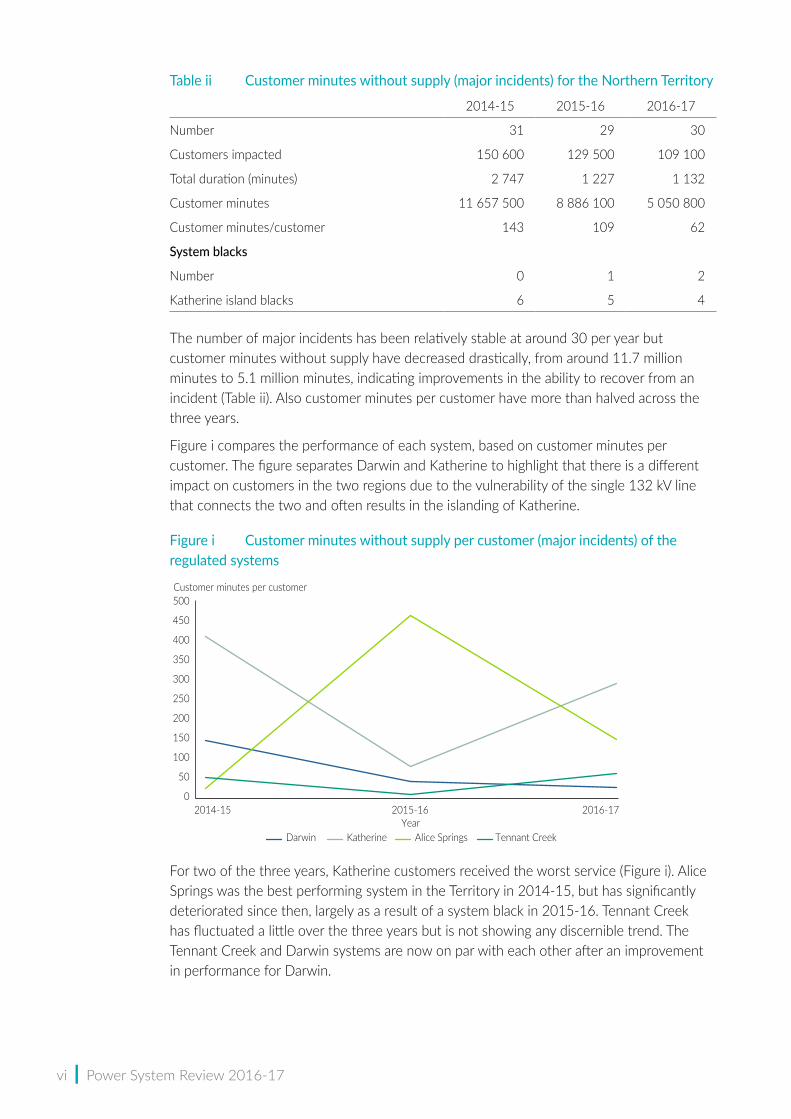
Table ii Customer minutes without supply (major incidents) for the Northern Territory
2014-15 2015-16 2016-17
Number 31 29 30
Customers impacted 150 600 129 500 109 100
Total duration (minutes) 2 747 1 227 1 132
Customer minutes 11 657 500 8 886 100 5 050 800
Customer minutes/customer 143 109 62
System blacks
Number 0 1 2
Katherine island blacks 6 5 4
The number of major incidents has been relatively stable at around 30 per year but customer minutes without supply have decreased drastically, from around 11.7 million minutes to 5.1 million minutes, indicating improvements in the ability to recover from an incident (Table ii). Also customer minutes per customer have more than halved across the three years.
Figure i compares the performance of each system, based on customer minutes per customer. The figure separates Darwin and Katherine to highlight that there is a different impact on customers in the two regions due to the vulnerability of the single 132 kV line that connects the two and often results in the islanding of Katherine.
Figure i Customer minutes without supply per customer (major incidents) of the regulated systems
For two of the three years, Katherine customers received the worst service (Figure i). Alice Springs was the best performing system in the Territory in 2014-15, but has significantly deteriorated since then, largely as a result of a system black in 2015-16. Tennant Creek has fluctuated a little over the three years but is not showing any discernible trend. The Tennant Creek and Darwin systems are now on par with each other after an improvement in performance for Darwin.
0
50
100
150
200
250
300
350
400
450
500
2014-15 2015-16 2016-17
Customer minutes per customer
YearDarwin Katherine Alice Springs Tennant Creek

Executive Summary | vii
Annual consumption and capacityThis review models:
• underlying demand/consumption, which includes in front and behind-the-meter demand and consumption (that is, total demand)
• system demand/consumption that focuses on energy supplied through the network
• dispatchable demand/consumption that focuses on energy delivered by dispatchable generation (currently gas and diesel).
Figure ii sets out the annual energy system consumption forecast for the Territory from 2014-15 to 2026-27 using a base and 50 per cent renewable energy (RE50%) scenario.
Figure ii Annual energy system consumption forecast, Northern Territory
The overall assessment is that annual system consumption will decrease (-1.5% per annum) over the next few years under the base scenario as more behind-the-meter PV systems are installed. Consumption growth will remain low (0.3% per annum) from around 2019-20 to 2026-27. Under the RE50% scenario annual system consumption would see a more significant decrease (-2.9% per annum) over the next few years with a steady decline (-0.2% per annum) continuing from around 2020 to 2027. Note, Darwin-Katherine and Tennant Creek are forecast to have some growth (figures 4.3 and 6.2) but Alice Springs (Figure 5.3) is forecast to have a gradual reduction in consumption.
Table iii shows the current and modelled 2026-27 (base and RE50%) installed capacity of residential, commercial and large-scale PV installations in the three regulated systems and combined in megawatts (MW).
Annual energy (GWh)
Year ended JuneActual Base Renewable energy 50%
1600
1650
1700
1750
1800
1850
1900
1950
2000
14-15 15-16 16-17 17-18 18-19 19-20 20-21 21-22 22-23 23-24 24-25 25-26 26-27
viii | Power System Review 2016-17
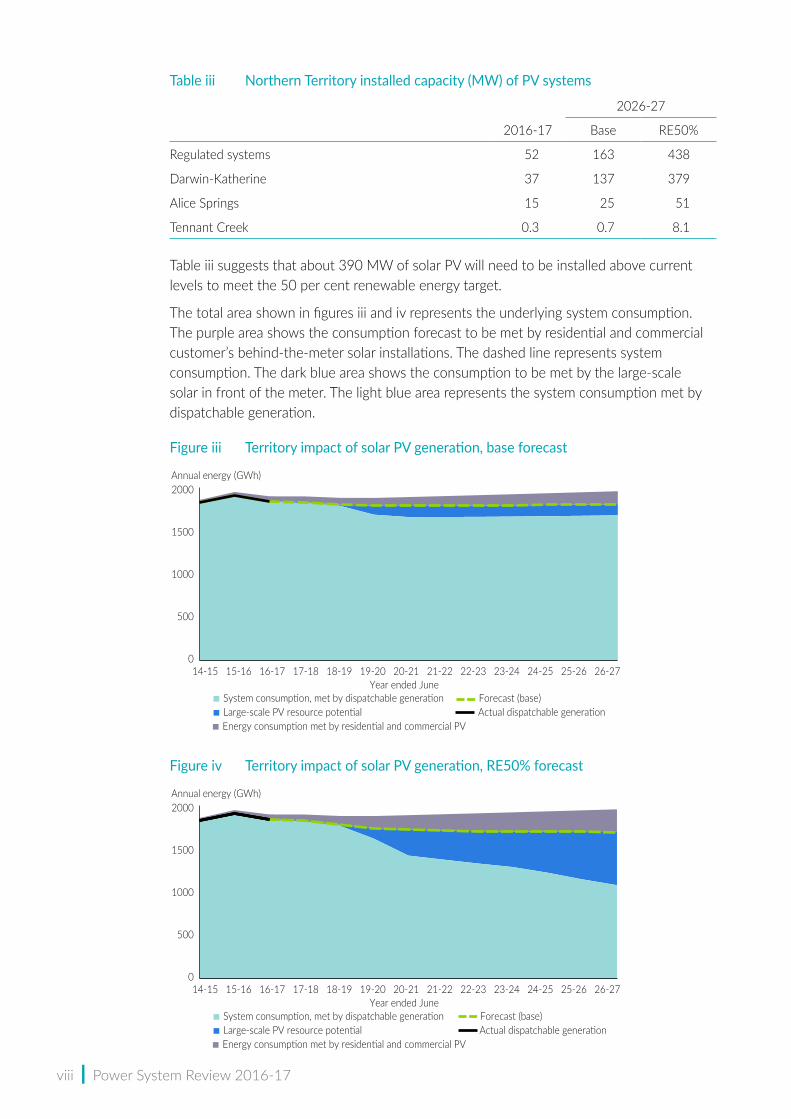
Table iii Northern Territory installed capacity (MW) of PV systems
2016-17
2026-27
Base RE50%
Regulated systems 52 163 438
Darwin-Katherine 37 137 379
Alice Springs 15 25 51
Tennant Creek 0.3 0.7 8.1
Table iii suggests that about 390 MW of solar PV will need to be installed above current levels to meet the 50 per cent renewable energy target.
The total area shown in figures iii and iv represents the underlying system consumption. The purple area shows the consumption forecast to be met by residential and commercial customer’s behind-the-meter solar installations. The dashed line represents system consumption. The dark blue area shows the consumption to be met by the large-scale solar in front of the meter. The light blue area represents the system consumption met by dispatchable generation.
Figure iii Territory impact of solar PV generation, base forecast
Figure iv Territory impact of solar PV generation, RE50% forecast
0
500
1000
1500
2000
14-15 15-16 16-17 17-18 18-19 19-20 20-21 21-22 22-23 23-24 24-25 25-26 26-27
Annual energy (GWh)
Year ended JuneSystem consumption, met by dispatchable generationLarge-scale PV resource potential
Forecast (base)Actual dispatchable generation
Energy consumption met by residential and commercial PV
Executive Summary | ix
In the RE50% scenario, a portion of energy usually met by dispatchable generation (gas and diesel) is displaced by large-scale PV generation (assuming full utilisation of resource potential)1. Under the RE50% scenario, dispatchable generators are forecast to meet 1100GWh of demand in 2027, down 42 per cent from 1900GWh in 2016-17.
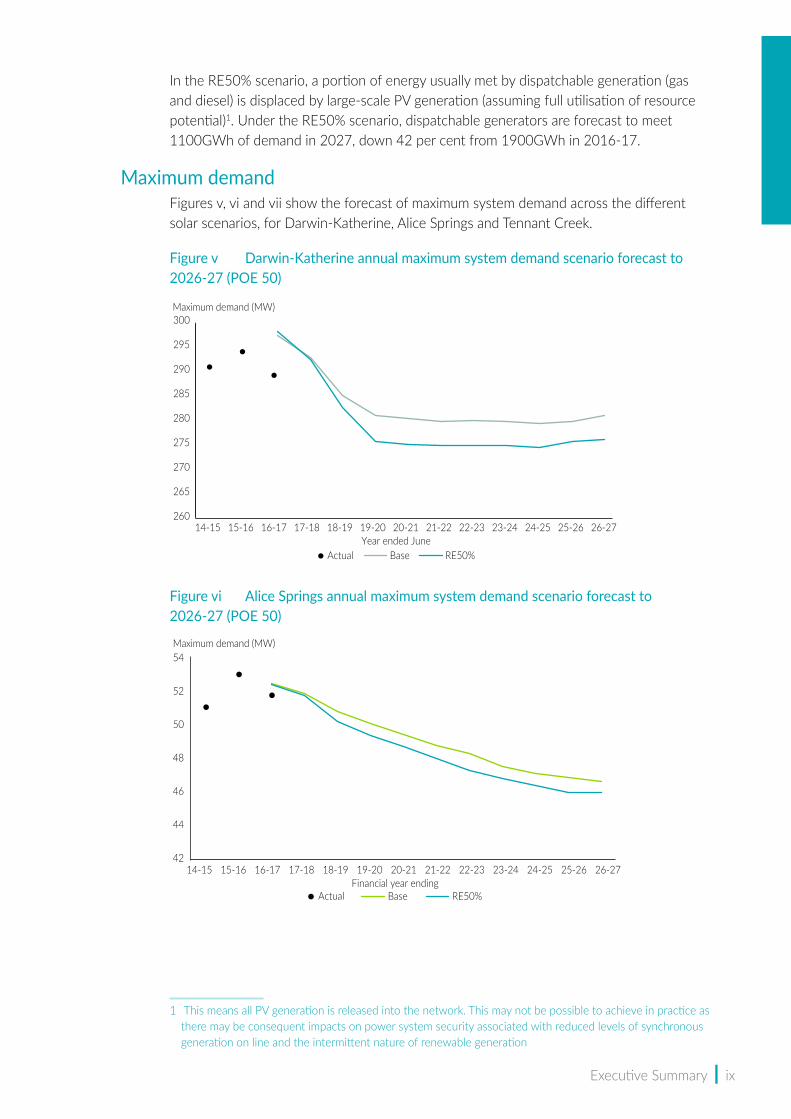
Maximum demandFigures v, vi and vii show the forecast of maximum system demand across the different solar scenarios, for Darwin-Katherine, Alice Springs and Tennant Creek.
Figure v Darwin‑Katherine annual maximum system demand scenario forecast to 2026‑27 (POE 50)
Figure vi Alice Springs annual maximum system demand scenario forecast to 2026‑27 (POE 50)
1 This means all PV generation is released into the network. This may not be possible to achieve in practice as there may be consequent impacts on power system security associated with reduced levels of synchronous generation on line and the intermittent nature of renewable generation
260
265
270
275
280
285
290
295
300
14-15 15-16 16-17 17-18 18-19 19-20 20-21 21-22 22-23 23-24 24-25 25-26 26-27
Maximum demand (MW)
Year ended JuneBase RE50%Actual
14-15 15-16 16-17 17-18 18-19 19-20 20-21 21-22 22-23 23-24 24-25 25-26 26-27
Maximum demand (MW)
Financial year endingActual RE50%Base
42
44
46
48
50
52
54
x | Power System Review 2016-17
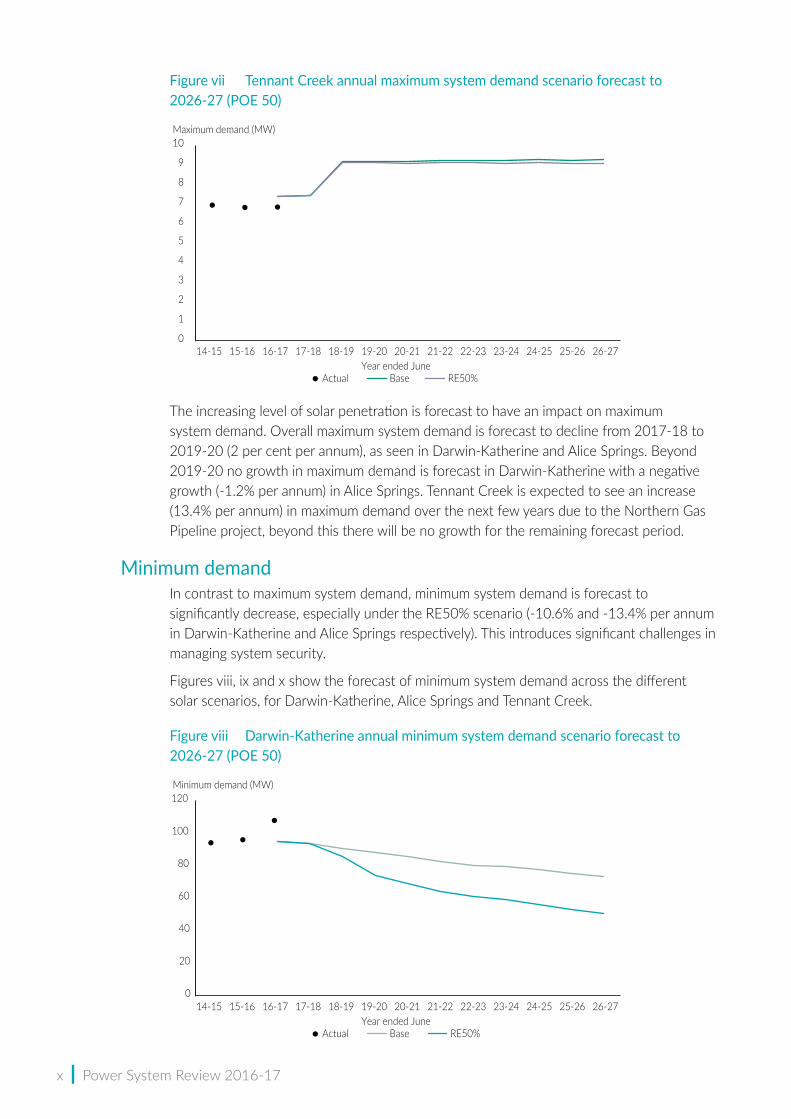
Figure vii Tennant Creek annual maximum system demand scenario forecast to 2026‑27 (POE 50)
The increasing level of solar penetration is forecast to have an impact on maximum system demand. Overall maximum system demand is forecast to decline from 2017-18 to 2019-20 (2 per cent per annum), as seen in Darwin-Katherine and Alice Springs. Beyond 2019-20 no growth in maximum demand is forecast in Darwin-Katherine with a negative growth (-1.2% per annum) in Alice Springs. Tennant Creek is expected to see an increase (13.4% per annum) in maximum demand over the next few years due to the Northern Gas Pipeline project, beyond this there will be no growth for the remaining forecast period.
Minimum demand In contrast to maximum system demand, minimum system demand is forecast to significantly decrease, especially under the RE50% scenario (-10.6% and -13.4% per annum in Darwin-Katherine and Alice Springs respectively). This introduces significant challenges in managing system security.
Figures viii, ix and x show the forecast of minimum system demand across the different solar scenarios, for Darwin-Katherine, Alice Springs and Tennant Creek.
Figure viii Darwin‑Katherine annual minimum system demand scenario forecast to 2026‑27 (POE 50)
14-15 15-16 16-17 17-18 18-19 19-20 20-21 21-22 22-23 23-24 24-25 25-26 26-27
Maximum demand (MW)
Year ended JuneActual Base RE50%
0
1
2
3
4
5
6
7
8
9
10
14-15 15-16 16-17 17-18 18-19 19-20 20-21 21-22 22-23 23-24 24-25 25-26 26-27
Minimum demand (MW)
Year ended JuneActual
0
20
40
60
80
100
120
Base RE50%
Executive Summary | xi
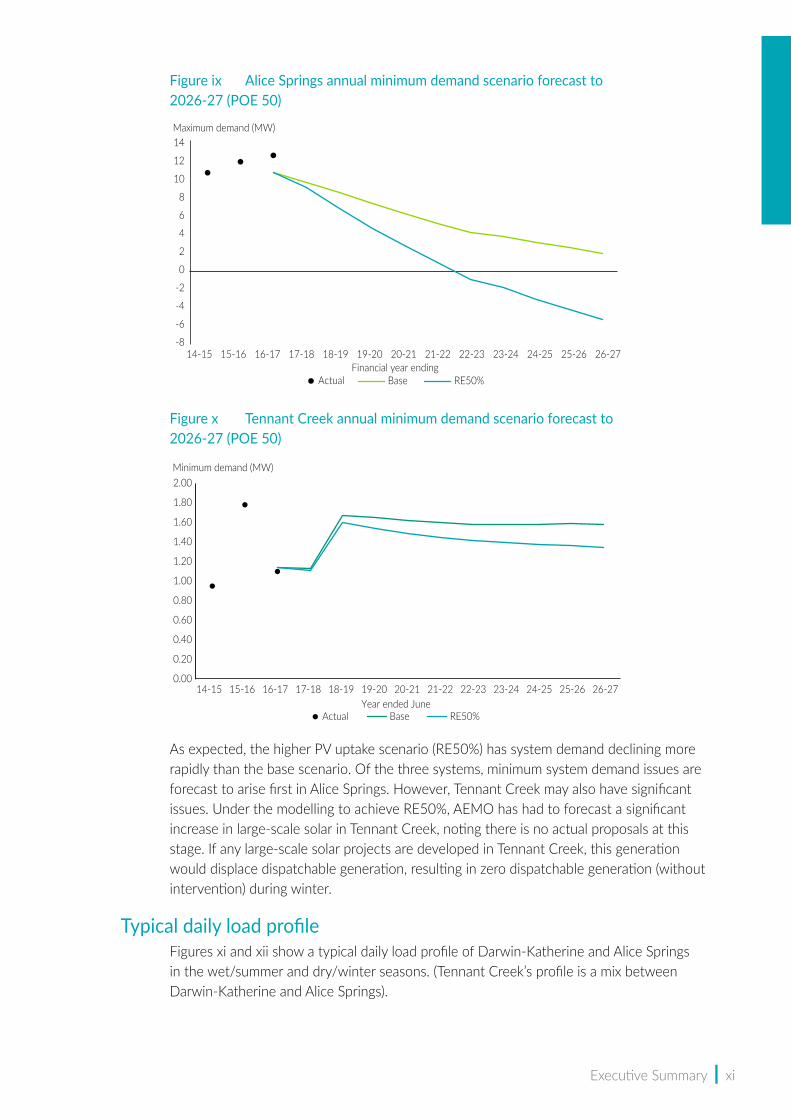
Figure ix Alice Springs annual minimum demand scenario forecast to 2026‑27 (POE 50)
Figure x Tennant Creek annual minimum demand scenario forecast to 2026‑27 (POE 50)
As expected, the higher PV uptake scenario (RE50%) has system demand declining more rapidly than the base scenario. Of the three systems, minimum system demand issues are forecast to arise first in Alice Springs. However, Tennant Creek may also have significant issues. Under the modelling to achieve RE50%, AEMO has had to forecast a significant increase in large-scale solar in Tennant Creek, noting there is no actual proposals at this stage. If any large-scale solar projects are developed in Tennant Creek, this generation would displace dispatchable generation, resulting in zero dispatchable generation (without intervention) during winter.
Typical daily load profileFigures xi and xii show a typical daily load profile of Darwin-Katherine and Alice Springs in the wet/summer and dry/winter seasons. (Tennant Creek’s profile is a mix between Darwin-Katherine and Alice Springs).
14-15 15-16 16-17 17-18 18-19 19-20 20-21 21-22 22-23 23-24 24-25 25-26 26-27
Maximum demand (MW)
Financial year endingActual RE50%Base
-8
-6
-4
-2
0
2
4
6
8
10
12
14
14-15 15-16 16-17 17-18 18-19 19-20 20-21 21-22 22-23 23-24 24-25 25-26 26-27
Minimum demand (MW)
Year ended JuneActual Base RE50%
0.00
0.20
0.40
0.60
0.80
1.00
1.20
1.40
1.60
1.80
2.00

xii | Power System Review 2016-17
The figures shows underlying demand (dashed lines), system demand (solid lines) and dispatchable demand (dotted lines). As there are no large-scale solar power stations in Darwin-Katherine the system demand and dispatchable demand are the same.
Figure xi Darwin‑Katherine daily demand profile 2016‑17 (wet season versus dry season)
Figure xii Alice Springs daily load profile 2016‑17 (summer versus winter)
The demand profile for both Darwin-Katherine and Alice Springs are noticeably different between the two seasons. The winter and summer profiles strongly follow the way customers use airconditioners and heaters.
Alice Springs’ profile is dramatically different to the Darwin-Katherine profile. Alice Springs has two very different profiles across the seasons, whereas Darwin-Katherine has a relatively consistent profile across seasons. This again indicates the different systems will have different issues and thus require different approaches to address them. It shows during winter, Alice Springs’ middle of the day minimum is close to the minimum during the night. In contrast, Darwin-Katherine’s minimum is still clearly at night.
Demand (MW)
Time of day (half-hour)00:30 02:00 03:30 05:00 06:30 08:00 09:30 11:00 12:30 15:30 17:00 18:30 20:00 21:30 23:0014:000
50
100
150
200
250
300
Wet season system demand Wet season underlying Wet season dispatchableDry season system demand Dry season underlying Dry season dispatchable
Demand (MW)
Time of day (half-hour)00:30 02:00 03:30 05:00 06:30 08:00 09:30 11:00 12:30 15:30 17:00 18:30 20:00 21:30 23:0014:00
Summer system demand Summer underlying Summer dispatchableWinter system demand Winter underlying Winter dispatchable
0
5
10
15
20
25
30
35
40
45
50
Executive Summary | xiii
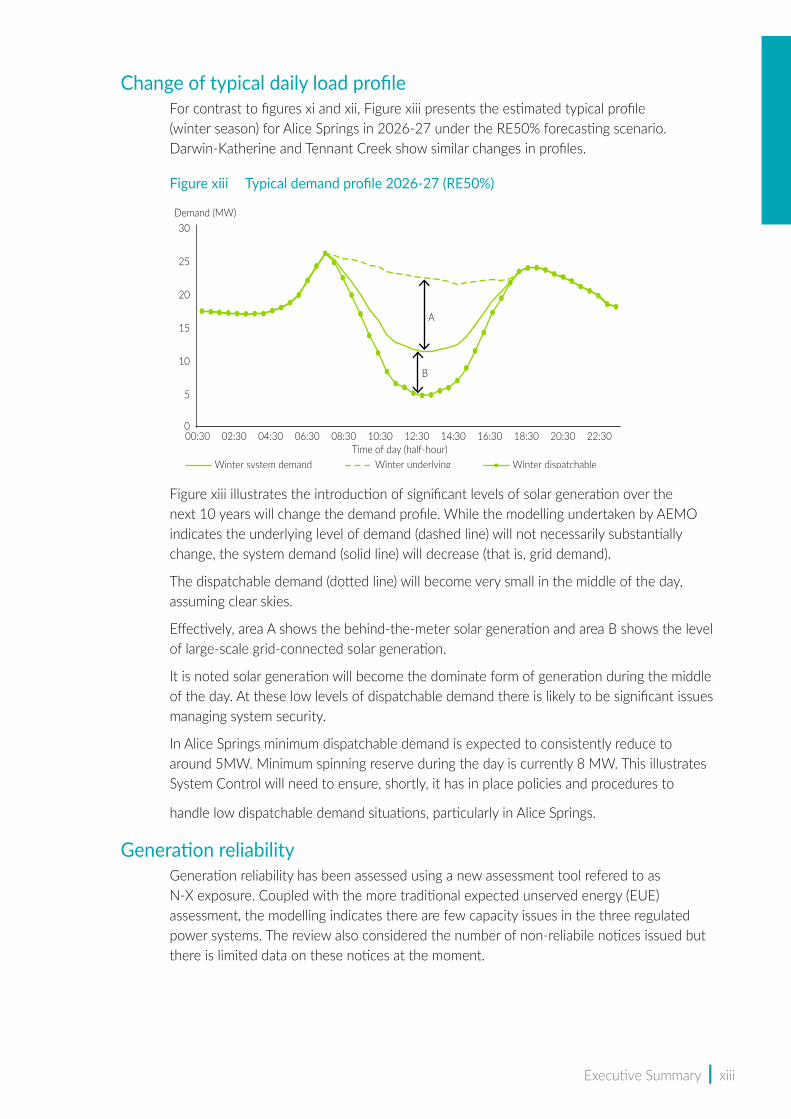
Change of typical daily load profileFor contrast to figures xi and xii, Figure xiii presents the estimated typical profile (winter season) for Alice Springs in 2026-27 under the RE50% forecasting scenario. Darwin-Katherine and Tennant Creek show similar changes in profiles.
Figure xiii Typical demand profile 2026‑27 (RE50%)
Figure xiii illustrates the introduction of significant levels of solar generation over the next 10 years will change the demand profile. While the modelling undertaken by AEMO indicates the underlying level of demand (dashed line) will not necessarily substantially change, the system demand (solid line) will decrease (that is, grid demand).
The dispatchable demand (dotted line) will become very small in the middle of the day, assuming clear skies.
Effectively, area A shows the behind-the-meter solar generation and area B shows the level of large-scale grid-connected solar generation.
It is noted solar generation will become the dominate form of generation during the middle of the day. At these low levels of dispatchable demand there is likely to be significant issues managing system security.
In Alice Springs minimum dispatchable demand is expected to consistently reduce to around 5MW. Minimum spinning reserve during the day is currently 8 MW. This illustrates System Control will need to ensure, shortly, it has in place policies and procedures to
handle low dispatchable demand situations, particularly in Alice Springs.
Generation reliabilityGeneration reliability has been assessed using a new assessment tool refered to as N-X exposure. Coupled with the more traditional expected unserved energy (EUE) assessment, the modelling indicates there are few capacity issues in the three regulated power systems. The review also considered the number of non-reliabile notices issued but there is limited data on these notices at the moment.
Demand (MW)
Time of day (half-hour)Winter system demand Winter underlying Winter dispatchable
00:30 02:30 04:30 06:30 08:30 10:30 12:30 14:30 16:30 18:30 20:30 22:300
5
10
15
20
25
30
A
B
xiv | Power System Review 2016-17
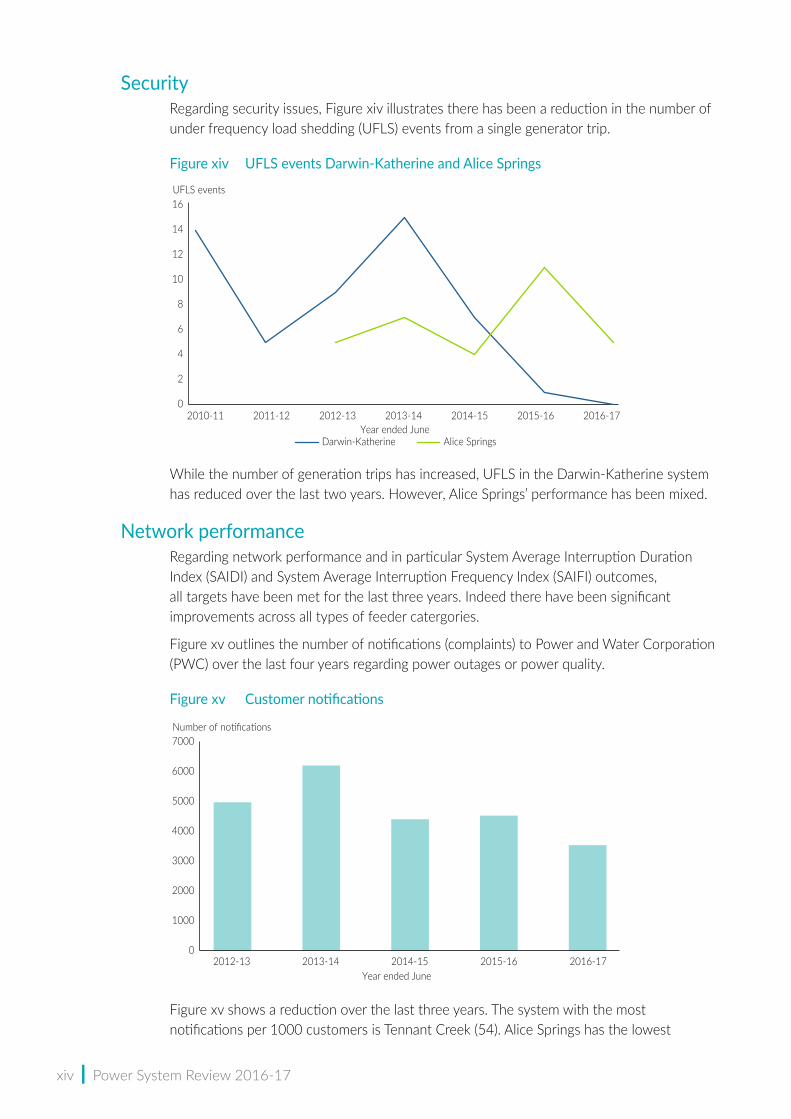
SecurityRegarding security issues, Figure xiv illustrates there has been a reduction in the number of under frequency load shedding (UFLS) events from a single generator trip.
Figure xiv UFLS events Darwin‑Katherine and Alice Springs
While the number of generation trips has increased, UFLS in the Darwin-Katherine system has reduced over the last two years. However, Alice Springs’ performance has been mixed.
Network performanceRegarding network performance and in particular System Average Interruption Duration Index (SAIDI) and System Average Interruption Frequency Index (SAIFI) outcomes, all targets have been met for the last three years. Indeed there have been significant improvements across all types of feeder catergories.
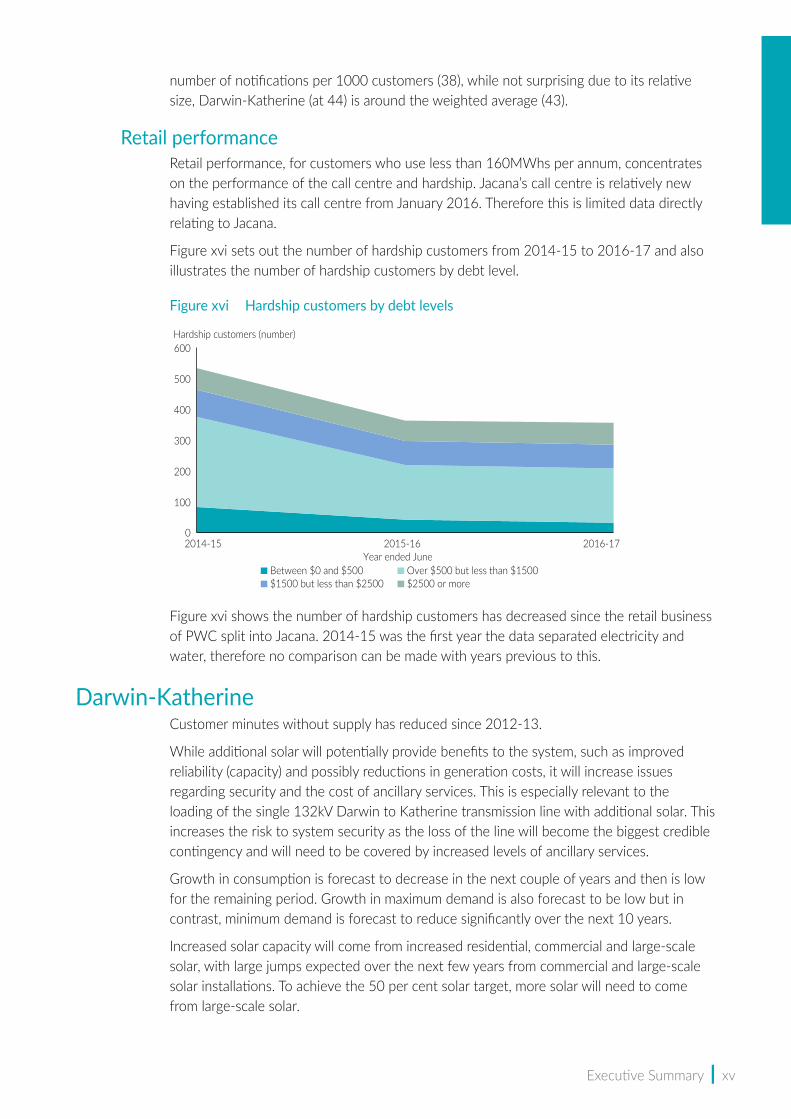
Figure xv outlines the number of notifications (complaints) to Power and Water Corporation (PWC) over the last four years regarding power outages or power quality.
Figure xv Customer notifications
Figure xv shows a reduction over the last three years. The system with the most notifications per 1000 customers is Tennant Creek (54). Alice Springs has the lowest
0
2
4
6
8
10
12
14
16
2010-11 2011-12 2012-13 2013-14 2014-15 2015-16 2016-17
UFLS events
Year ended JuneDarwin-Katherine Alice Springs
0
1000
2000
3000
4000
5000
6000
7000
2012-13 2013-14 2014-15 2015-16 2016-17
Number of notifications
Year ended June
Executive Summary | xv
number of notifications per 1000 customers (38), while not surprising due to its relative size, Darwin-Katherine (at 44) is around the weighted average (43).
Retail performanceRetail performance, for customers who use less than 160MWhs per annum, concentrates on the performance of the call centre and hardship. Jacana’s call centre is relatively new having established its call centre from January 2016. Therefore this is limited data directly relating to Jacana.
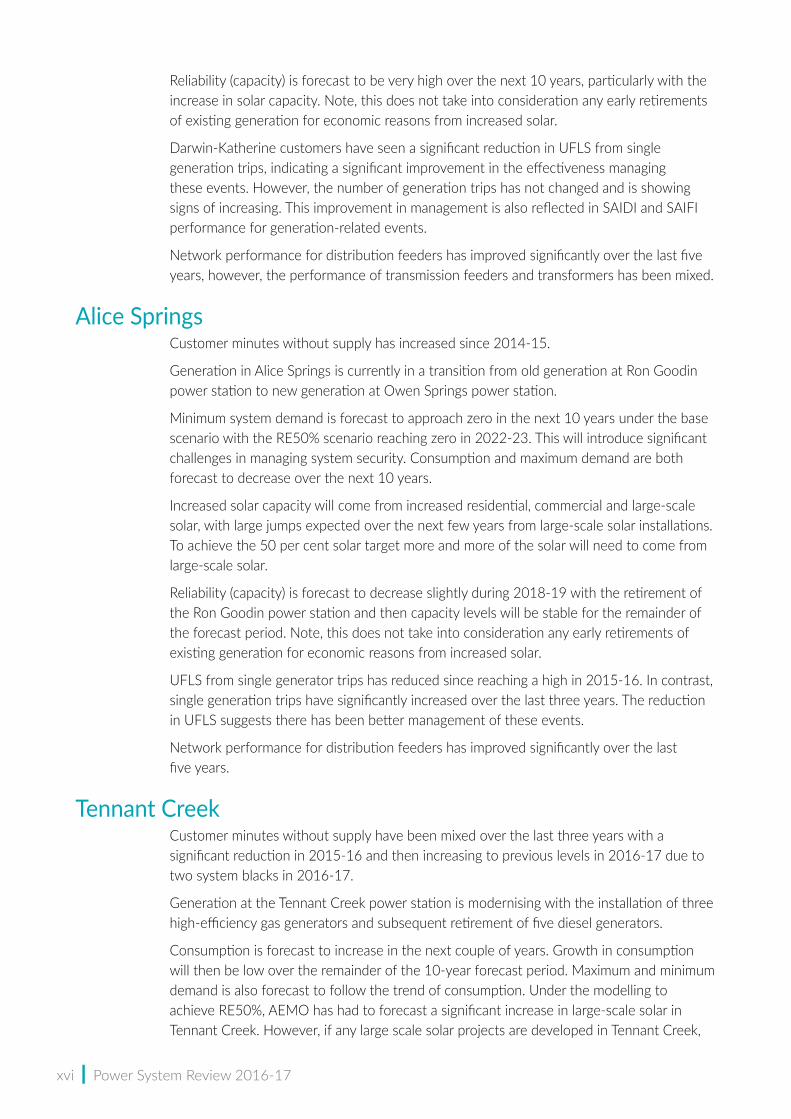
Figure xvi sets out the number of hardship customers from 2014-15 to 2016-17 and also illustrates the number of hardship customers by debt level.
Figure xvi Hardship customers by debt levels
Figure xvi shows the number of hardship customers has decreased since the retail business of PWC split into Jacana. 2014-15 was the first year the data separated electricity and water, therefore no comparison can be made with years previous to this.
Darwin‑KatherineCustomer minutes without supply has reduced since 2012-13.
While additional solar will potentially provide benefits to the system, such as improved reliability (capacity) and possibly reductions in generation costs, it will increase issues regarding security and the cost of ancillary services. This is especially relevant to the loading of the single 132kV Darwin to Katherine transmission line with additional solar. This increases the risk to system security as the loss of the line will become the biggest credible contingency and will need to be covered by increased levels of ancillary services.
Growth in consumption is forecast to decrease in the next couple of years and then is low for the remaining period. Growth in maximum demand is also forecast to be low but in contrast, minimum demand is forecast to reduce significantly over the next 10 years.
Increased solar capacity will come from increased residential, commercial and large-scale solar, with large jumps expected over the next few years from commercial and large-scale solar installations. To achieve the 50 per cent solar target, more solar will need to come from large-scale solar.
0
100
200
300
400
500
600
2014-15 2015-16 2016-17
Between $0 and $500Year ended June
Hardship customers (number)
Over $500 but less than $1500$1500 but less than $2500 $2500 or more
xvi | Power System Review 2016-17
Reliability (capacity) is forecast to be very high over the next 10 years, particularly with the increase in solar capacity. Note, this does not take into consideration any early retirements of existing generation for economic reasons from increased solar.
Darwin-Katherine customers have seen a significant reduction in UFLS from single generation trips, indicating a significant improvement in the effectiveness managing these events. However, the number of generation trips has not changed and is showing signs of increasing. This improvement in management is also reflected in SAIDI and SAIFI performance for generation-related events.
Network performance for distribution feeders has improved significantly over the last five years, however, the performance of transmission feeders and transformers has been mixed.
Alice SpringsCustomer minutes without supply has increased since 2014-15.
Generation in Alice Springs is currently in a transition from old generation at Ron Goodin power station to new generation at Owen Springs power station.
Minimum system demand is forecast to approach zero in the next 10 years under the base scenario with the RE50% scenario reaching zero in 2022-23. This will introduce significant challenges in managing system security. Consumption and maximum demand are both forecast to decrease over the next 10 years.
Increased solar capacity will come from increased residential, commercial and large-scale solar, with large jumps expected over the next few years from large-scale solar installations. To achieve the 50 per cent solar target more and more of the solar will need to come from large-scale solar.
Reliability (capacity) is forecast to decrease slightly during 2018-19 with the retirement of the Ron Goodin power station and then capacity levels will be stable for the remainder of the forecast period. Note, this does not take into consideration any early retirements of existing generation for economic reasons from increased solar.
UFLS from single generator trips has reduced since reaching a high in 2015-16. In contrast, single generation trips have significantly increased over the last three years. The reduction in UFLS suggests there has been better management of these events.
Network performance for distribution feeders has improved significantly over the last five years.
Tennant CreekCustomer minutes without supply have been mixed over the last three years with a significant reduction in 2015-16 and then increasing to previous levels in 2016-17 due to two system blacks in 2016-17.
Generation at the Tennant Creek power station is modernising with the installation of three high-efficiency gas generators and subsequent retirement of five diesel generators.
Consumption is forecast to increase in the next couple of years. Growth in consumption will then be low over the remainder of the 10-year forecast period. Maximum and minimum demand is also forecast to follow the trend of consumption. Under the modelling to achieve RE50%, AEMO has had to forecast a significant increase in large-scale solar in Tennant Creek. However, if any large scale solar projects are developed in Tennant Creek,
Executive Summary | xvii
this generation would displace dispatchable generation, resulting in zero dispatchable generation (without intervention) during winter. This will introduce significant challenges in managing system security.
Reliability (capacity) is forecast to be adequate over the next 10 years, particularly with the increase in solar capacity. Note, this does not take into consideration any early retirements of existing generation for economic reasons from increased solar.
Network performance of distribution feeders has been mixed over the last five years.
Fuel supply (gas)Gas is the primary source of fuel for Territory electricity generation. Virtually all domestic gas consumption in the Territory is used for power generation (93 per cent).
The majority of the gas for the Territory is supplied by the Blacktip facility. Blacktip is at an early stage of its producing life, having produced for only eight of a 25-year supply term to PWC. Current demand in the Territory can be easily met by Blacktip gas.
The two major risks to the system are:
• loss of supply from the Blacktip facility (short or long term)
• leak or major rupture of the main pipelines.
There are a number of projects occurring at the moment that will change the Territory’s gas market and contingency supplies, specifically INPEX’s liquefied natural gas (LNG) plant, Jemena’s Northern Gas Pipeline (NGP) and Territory Generation’s new gas-fired generators in Alice Springs.
Jemena’s NGP is a new transmission pipeline currently under construction and will transport gas in a single direction from the Territory to the east coast gas market. Although it is possible to reverse the flow and transport gas from Mt Isa to Tennant Creek, this will incur additional costs and require time (up to 12 months) to make the necessary pipeline modifications.
Currently, Darwin LNG can supply 100 per cent of the Territory’s gas requirement (contract ends 2022). In the near future, INPEX will also have the capability to supply full back-up to meet the Territory’s requirements. However, while these supplies can theoretically supply the volume of gas required, there are contractual (volume restrictions) and practical (pressure issues) limitations.
Alternative contingencies include pipeline line pack, diesel and the southern gas fields. However, these measures are not capable of replacing 100 per cent of the Territory’s electricity generation requirements, especially for extended periods.
xviii | Power System Review 2016-17
Glossary1P reserves Proven reserves with a reasonable certainty of being recovered
2P reserves Proven and probable reserves
ACOD average circuit outage duration index
AEMC Australian Energy Market Commission
AEMO Australian Energy Market Operator
AER Australian Energy Regulator
ancillary services Used to maintain system security
APA APA Group
ATOD average transformer outage duration index
behind the meter Electricity produced by consumers behind the meter, such as residential solar energy
BESS Battery Energy Storage System
CIPS Channel Island power station
customer minutes Number of minutes customers are without supply, calculated by multiplying the number of customers affected by the duration of the incident
CSO community service obligation
Dispatchable generation
Scheduled generation, can be planned and its output is controllable
EDL EDL NGD (NT) Pty Ltd
ENI ENI Australia Limited
ENTPA Electricity Networks Third Party Access Act
ER Act Electricity Reform Act
from the grid Electricity generated by entities holding generator licences. Does not include electricity generated and consumed by consumers, such as residential solar energy (behind the meter).
EUE Expected unserved energy (see also USE). The expected unserved energy (EUE) reliability standard is forward looking, compared to the Unserved Energy (USE) reliability standard, which is used to measure actual performance
FCO frequency of circuit outage index
feeder Any of the medium-voltage lines used to distribute electric power from a substation to consumers or to smaller substations
feed-in-tariff Rate received for selling electricity to the grid by a small behind the meter customer
FTO frequency of transformer outages
GPS generation performance standards
GWh gigawatt hour, 1 GWh = 1 million kWh
HV high voltage
INTEM Interim Northern Territory Electricity Market
IPP Independent power producer. Licensed IPPs are parties who do not wish to participate fully in the electricity supply market and generate electricity under contract for another generator

Glossary | xix
Jacana Jacana Energy is a government owned corporation established in accordance with the Government Owned Corporations Act. Jacana has a licence to participant in the electricity industry.
km kilometre, 1km = 1000 metres
kV kilovolt
LNG liquefied natural gas
load shedding Disconnecting customers from the power system (that is, reduce load on the system) to restore frequency to the normal operating range
LOS lack of standby
LORR loss of reactive power reserve
MVA megavolt ampere
MW megawatt, 1MW = 1 million watts
NEL national electricity law
NEM National Electricity Market
NER National Electricity Rules
NGP Northern Gas Pipeline, previously known as NEGI (North Eastern Gas Pipeline)
NMP Network Management Plan (prepared by PWC)
NPD Network Price Determination
NTC network technical code
Territory Northern Territory
N-X Planning criteria allowing for full supply to be maintained to an area supplied by the installed capacity of N independent supply sources, with X number of those sources out of service (with X usually being the units with the largest installed capacity)
OSPS Owen Springs power station
POE 10 point of exceedance, maximum demand projection that is expected to be exceeded, on average, one year in 10 (a 10 per cent probability)
POE 50 point of exceedance, maximum demand projection that is expected to be exceeded, on average, five years in 10 (a 50 per cent probability)
p.a. per annum
PJ petajoule, 1PJ = 1 billion mega joules
PJ/a petajoule per annum
PJ/d petajoule per day
PRMS petroleum resource management system
PV photovoltaic
PWC Power and Water Corporation is a government owned corporation established in accordance with the Government Owned Corporations Act. PWC currently has both a licence to operate the network and perform system control operations. It also holds retail and generation licences in respect to supplying remote and indigenous communities
PWC Networks The networks business division of PWC
RE50% 50 percent renewable energy by 2030
xx | Power System Review 2016-17
RGPS Ron Goodin power station
regulated systems Darwin-Katherine, Tennant Creek and the Alice Springs region
SAIDI System Average Interruption Duration Index – the average number of minutes that a customer is without supply in a given period
SAIFI System Average Interruption Frequency Index – the average number of times a customer’s supply is interrupted in a given period
SCTC System Control Technical Code
spinning reserves The ability to immediately and automatically increase generation or reduce demand in response to an increase or decrease in frequency
System Control PWC holds a licence to conduct system control functions. An independently operated business unit within PWC, known as System Control provides these services.
TGen Territory Generation is a government owned corporation established in accordance with the Government Owned Corporations Act. TGen has a licence to participant in the electricity industry.
TJ terajoule, 1 TJ = 1 million megapoules
UC Act Utilities Commission Act
UFLS under frequency load shedding – reducing or disconnecting customer load from the power system to restore frequency to the normal operating range
USE unserved energy (see also EUE). The Expected Unserved Energy (EUE) reliability standard is forward looking, compared to the Unserved Energy (USE) reliability standard, which is used to measure actual performance.
VCR value of customer reliability
WPS Weddell power station
ZSS Zone substation
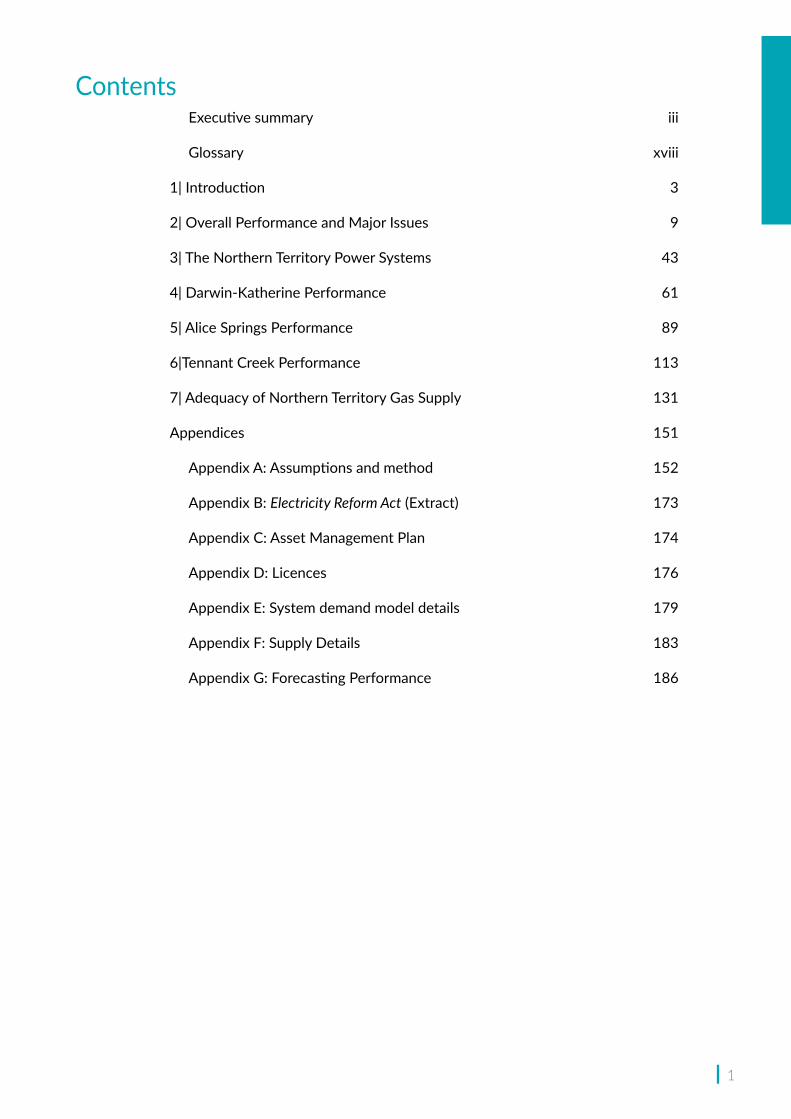
ContentsExecutive summary iii
Glossary xviii
1| Introduction 3
2| Overall Performance and Major Issues 9
3| The Northern Territory Power Systems 43
4| Darwin‑Katherine Performance 61
5| Alice Springs Performance 89
6|Tennant Creek Performance 113
7| Adequacy of Northern Territory Gas Supply 131
Appendices 151
Appendix A: Assumptions and method 152
Appendix B: Electricity Reform Act (Extract) 173
Appendix C: Asset Management Plan 174
Appendix D: Licences 176
Appendix E: System demand model details 179
Appendix F: Supply Details 183
Appendix G: Forecasting Performance 186
| 1


1| Introduction
4 | Power System Review 2016-17
1.1 PurposeThe 2016-17 Power System Review is prepared by the Utilities Commission in accordance with section 45 of the Electricity Reform Act (ER Act) (Appendix B provides an extract of section 45). The review is restricted to the Northern Territory’s regulated power systems, namely Darwin-Katherine, Alice Springs and Tennant Creek.
The review’s main role is to inform the Treasurer, government, licence holders and stakeholders on the 2016-17 performance of the Territory’s power systems and trends in such performance, and future requirements and risks to the electricity industry in the Territory. The review generally looks forward 10 years and may serve in part as a planning aid for participants and intending participants in the industry.
In this review, the commission is particularly focused on system performance and quality of services provided to consumers.
This report provides:
• the overall performance of the industry (Chapter 2)
• information on the Territory electricity industry (Chapter 3)
• the performance in Darwin-Katherine, Alice Springs and Tennant Creek (chapters 4, 5 and 6)
• information on the adequacy of the fuel supply in the Territory (Chapter 7).
The Assumptions and methodology used to undertake the review are presented in the Appendix.
The electricity industry is a complex system of relationships and arrangements. There are three main components to the industry that have to be assessed: generation, network and retail. These services are provided by different entities and across three different regulated systems.
Each component and system has its own challenges and these challenges change over time. This year’s review seeks to include more information on the future impact from renewable energy, noting the Territory Government has a policy to achieve 50 per cent renewable energy by 2030. Obviously major changes to a power system, a 100 years in its making, will bring both opportunities and risks.
To assess how this may take shape in the future, and how it impacts generation adequacy, AEMO modelled three solar scenarios:
i. Base: The expected uptake of rooftop and larger scale PV, based on continuation of current trends.
ii. RE30%: Achieving 30 per cent of energy (in the regulated networks) from renewables by 2030.
iii. RE50%: Achieving 50 per cent of energy (in the regulated networks) from renewables by 2030.
Notwithstanding the complexity of the industry, ultimately the customer’s main focus is the number and duration of outages and whether or not these outages are becoming more or less frequent over time, and this is balanced with customers’ expectations regarding cost. The overall performance of the industry (Chapter 3) is based on the impacts felt by customers.

Introduction | 5
However, each individual system needs to be assessed across a number of different elements and risks that include:
• demand history and demand forecast
• generation reliability
• security
• network performance.
Regular reporting on the electricity industry should help improve understanding and transparency of issues and, consequently, improve planning, investment, understanding of value for money (price compared to level of service) and general performance by holding electricity businesses accountable for their performance and impacts on customer outcomes.
As in previous reviews, the Australian Energy Market Operator (AEMO) has significantly assisted the commission in preparing this review. AEMO’s involvement helps improve consistency with similar national reports. Specifically, AEMO assisted with demand forecasting, supply adequacy modelling, transmission network performance, review of major network incidents and advice on power system issues.
Additionally, the consulting firm Entura provided advice on fuel supply arrangements, customer service performance, review of major generation incidents, progress against findings from previous reviews, and assessment of historical performance of generation and network components.
1.2 What is the Utilities CommissionThe Utilities Commission is a statutory authority established under the Utilities Commission Act (UC Act) as an independent economic regulator for the Territory.
The Commission’s objectives and matters it must consider in undertaking its work is encapsulated in the Commission’s Strategic Statement:
The Utilities Commission seeks to protect the long‑term interests of consumers of services provided by regulated industries with respect to price, reliability and quality.
The Commission will seek to ensure consumer requirements are met by enhancing the economic efficiency of regulated industries through promoting competition, fair and efficient market conduct and effective independent regulation.
The object of the UC Act is to create an economic regulatory framework for regulated industries in the Territory that protects the long-term interests of consumers by promoting competition, and fair and efficient market conduct or, in the absence of a competitive market, promotes the simulation of competitive market conduct and prevention of the misuse of monopoly power.
Section 6(1) of UC Act defines a general set of functions for the Commission. However, the Commission’s specific roles in regulated industries are defined in industry-specific legislation. At present, the Commission’s regulatory role encompasses the electricity, water and sewerage, and ports industries in the Territory. Specifically:
Electricity industry: The Commission administers a licensing regime and industry codes for industry participants, administers pricing orders made by the government, prepares an
6 | Power System Review 2016-17
annual Power System Review (that is, this review) and deals with complaints from industry participants.
Water and sewerage industry: The Commission administers a licensing regime and pricing order.
Ports industry: The Commission administers a pricing and access regime for prescribed services provided by the operator of declared ports (currently only the Port of Darwin).
The Commission is also empowered to provide advice to its ministers, the Treasurer (for electricity, water and sewerage) and the Minister for Infrastructure, Planning and Logistics (for ports), on any matter as requested from time to time.
Section 6(2) of the UC Act sets out that the Commission must have regard to various factors that give particular emphasis to the achievement of economic efficiency and protection of consumers. The Commission must also have regard to any relevant objectives contained within industry-specific legislation.
1.3 DisclaimerThis review is prepared using information sourced from participants of the electricity supply industry, Territory Government agencies, consultant reports and publicly available information. The review is in respect of the financial year ending 30 June 2017. The Commission understands the information received to be current as at March 2018.
This review contains predictions, estimates and statements based on the Commission’s interpretation of data provided by electricity industry participants and assumptions about the power system, including load growth forecasts and the effect of potential major developments in particular power systems. The Commission considers the review as an accurate report within the normal tolerance of economic forecasts.
Any person using the information in this review should independently verify the accuracy, completeness, reliability and suitability of the information and source data. The Commission accepts no liability (including liability to any person by reason of negligence) for any use of the information in this review or for any loss, damage, cost or expense incurred or arising by reason of any error, negligent act, omission or misrepresentation in the information in this review or otherwise.
Any questions regarding this report should be directed to the Utilities Commission [email protected] or by phone 08 8999 5480.

Introduction | 7

2| Overall Performance and Major Issues
10 | Power System Review 2016-17
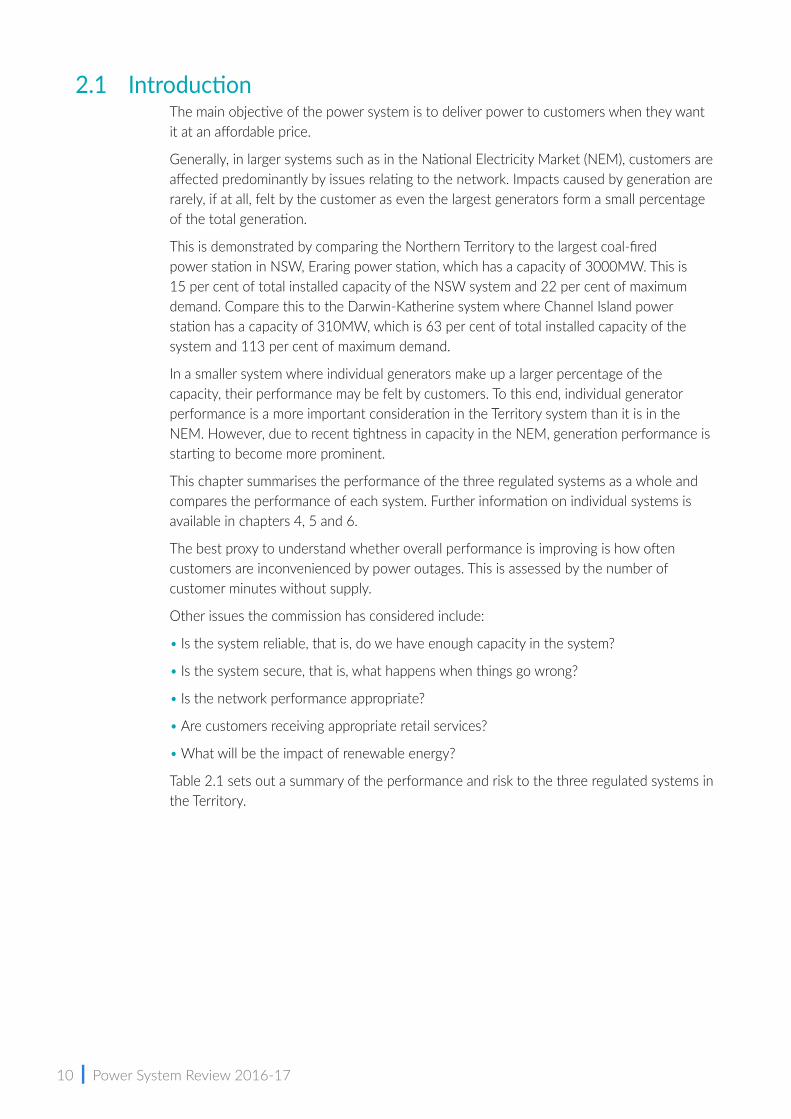
2.1 Introduction The main objective of the power system is to deliver power to customers when they want it at an affordable price.
Generally, in larger systems such as in the National Electricity Market (NEM), customers are affected predominantly by issues relating to the network. Impacts caused by generation are rarely, if at all, felt by the customer as even the largest generators form a small percentage of the total generation.
This is demonstrated by comparing the Northern Territory to the largest coal-fired power station in NSW, Eraring power station, which has a capacity of 3000MW. This is 15 per cent of total installed capacity of the NSW system and 22 per cent of maximum demand. Compare this to the Darwin-Katherine system where Channel Island power station has a capacity of 310MW, which is 63 per cent of total installed capacity of the system and 113 per cent of maximum demand.
In a smaller system where individual generators make up a larger percentage of the capacity, their performance may be felt by customers. To this end, individual generator performance is a more important consideration in the Territory system than it is in the NEM. However, due to recent tightness in capacity in the NEM, generation performance is starting to become more prominent.
This chapter summarises the performance of the three regulated systems as a whole and compares the performance of each system. Further information on individual systems is available in chapters 4, 5 and 6.
The best proxy to understand whether overall performance is improving is how often customers are inconvenienced by power outages. This is assessed by the number of customer minutes without supply.
Other issues the commission has considered include:
• Is the system reliable, that is, do we have enough capacity in the system?
• Is the system secure, that is, what happens when things go wrong?
• Is the network performance appropriate?
• Are customers receiving appropriate retail services?
• What will be the impact of renewable energy?
Table 2.1 sets out a summary of the performance and risk to the three regulated systems in the Territory.
Overall Performance and Major Issues | 11
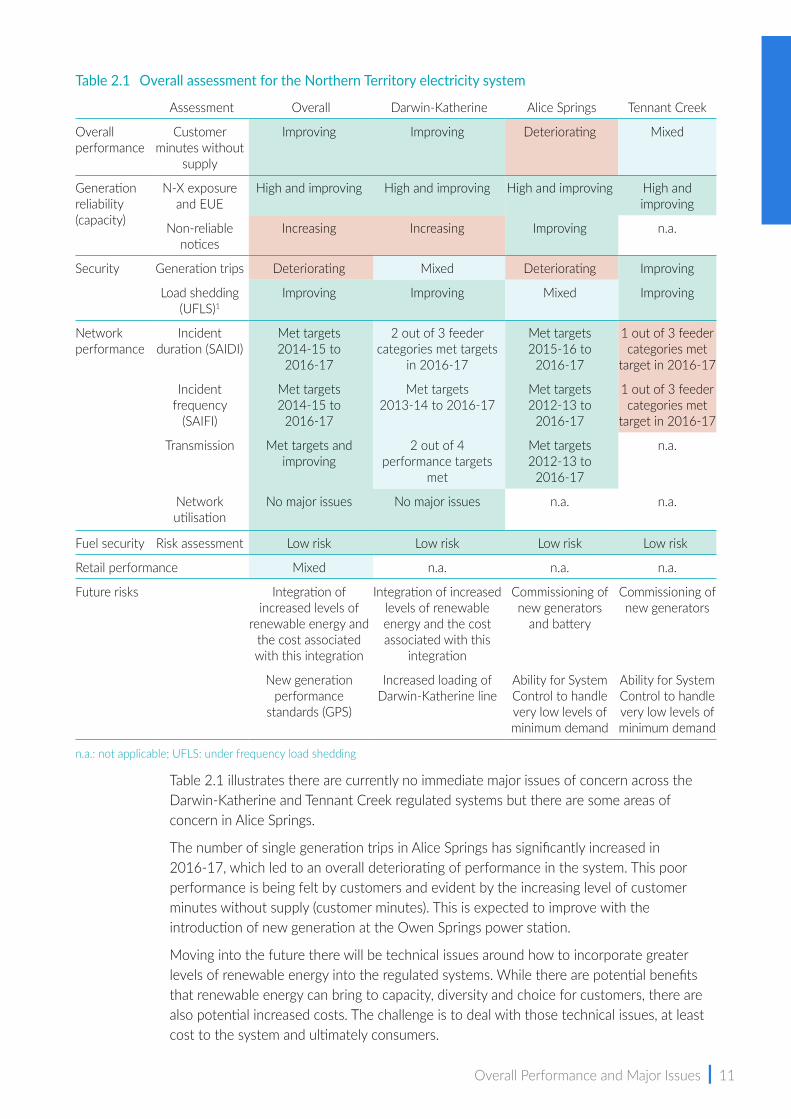
Table 2.1 Overall assessment for the Northern Territory electricity system
Assessment Overall Darwin-Katherine Alice Springs Tennant Creek
Overall performance
Customer minutes without
supply
Improving Improving Deteriorating Mixed
Generation reliability (capacity)
N-X exposure and EUE
High and improving High and improving High and improving High and improving
Non-reliable notices
Increasing Increasing Improving n.a.
Security Generation trips Deteriorating Mixed Deteriorating Improving
Load shedding (UFLS)1
Improving Improving Mixed Improving
Network performance
Incident duration (SAIDI)
Met targets 2014-15 to
2016-17
2 out of 3 feeder categories met targets
in 2016-17
Met targets 2015-16 to
2016-17
1 out of 3 feeder categories met
target in 2016-17
Incident frequency
(SAIFI)
Met targets 2014-15 to
2016-17
Met targets 2013-14 to 2016-17
Met targets 2012-13 to
2016-17
1 out of 3 feeder categories met
target in 2016-17
Transmission Met targets and improving
2 out of 4 performance targets
met
Met targets 2012-13 to
2016-17
n.a.
Network utilisation
No major issues No major issues n.a. n.a.
Fuel security Risk assessment Low risk Low risk Low risk Low risk
Retail performance Mixed n.a. n.a. n.a.
Future risks Integration of increased levels of
renewable energy and the cost associated with this integration
Integration of increased levels of renewable energy and the cost associated with this
integration
Commissioning of new generators
and battery
Commissioning of new generators
New generation performance
standards (GPS)
Increased loading of Darwin-Katherine line
Ability for System Control to handle very low levels of minimum demand
Ability for System Control to handle very low levels of minimum demand
n.a.: not applicable; UFLS: under frequency load shedding
Table 2.1 illustrates there are currently no immediate major issues of concern across the Darwin-Katherine and Tennant Creek regulated systems but there are some areas of concern in Alice Springs.
The number of single generation trips in Alice Springs has significantly increased in 2016-17, which led to an overall deteriorating of performance in the system. This poor performance is being felt by customers and evident by the increasing level of customer minutes without supply (customer minutes). This is expected to improve with the introduction of new generation at the Owen Springs power station.
Moving into the future there will be technical issues around how to incorporate greater levels of renewable energy into the regulated systems. While there are potential benefits that renewable energy can bring to capacity, diversity and choice for customers, there are also potential increased costs. The challenge is to deal with those technical issues, at least cost to the system and ultimately consumers.
12 | Power System Review 2016-17
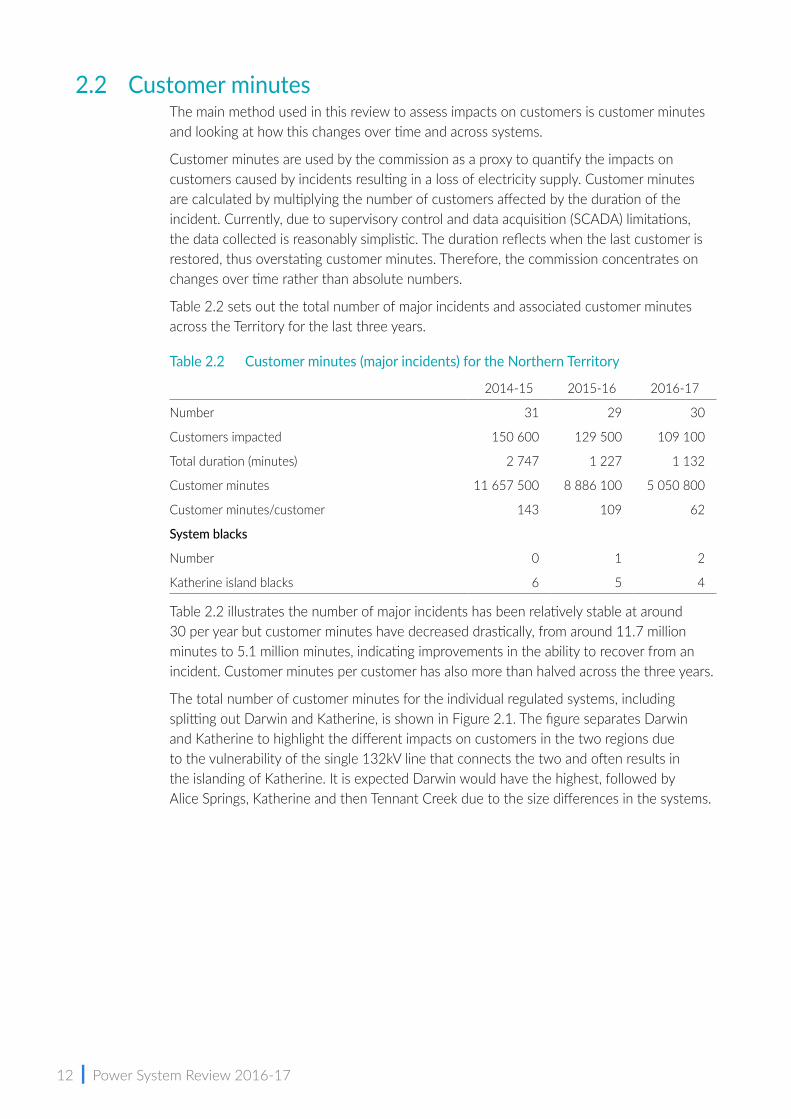
2.2 Customer minutesThe main method used in this review to assess impacts on customers is customer minutes and looking at how this changes over time and across systems.
Customer minutes are used by the commission as a proxy to quantify the impacts on customers caused by incidents resulting in a loss of electricity supply. Customer minutes are calculated by multiplying the number of customers affected by the duration of the incident. Currently, due to supervisory control and data acquisition (SCADA) limitations, the data collected is reasonably simplistic. The duration reflects when the last customer is restored, thus overstating customer minutes. Therefore, the commission concentrates on changes over time rather than absolute numbers.
Table 2.2 sets out the total number of major incidents and associated customer minutes across the Territory for the last three years.
Table 2.2 Customer minutes (major incidents) for the Northern Territory
2014-15 2015-16 2016-17
Number 31 29 30
Customers impacted 150 600 129 500 109 100
Total duration (minutes) 2 747 1 227 1 132
Customer minutes 11 657 500 8 886 100 5 050 800
Customer minutes/customer 143 109 62
System blacks
Number 0 1 2
Katherine island blacks 6 5 4
Table 2.2 illustrates the number of major incidents has been relatively stable at around 30 per year but customer minutes have decreased drastically, from around 11.7 million minutes to 5.1 million minutes, indicating improvements in the ability to recover from an incident. Customer minutes per customer has also more than halved across the three years.
The total number of customer minutes for the individual regulated systems, including splitting out Darwin and Katherine, is shown in Figure 2.1. The figure separates Darwin and Katherine to highlight the different impacts on customers in the two regions due to the vulnerability of the single 132kV line that connects the two and often results in the islanding of Katherine. It is expected Darwin would have the highest, followed by Alice Springs, Katherine and then Tennant Creek due to the size differences in the systems.

Overall Performance and Major Issues | 13
Figure 2.1 Customers minutes (major incidents) of the regulated systems
However, Figure 2.1 illustrates that Darwin has seen a significant reduction since 2014-15 and Alice Springs customer minutes spiked in 2015-16 due to a system black. Even removing the system black from the equation, overall performance in Alice Springs has been deteriorating. Katherine reported a reduction in 2015-16 but this was partially reversed in 2016-17.
Due to the limited size of Tennant Creek, relative to the other systems, Figure 2.1 does not provide any guidance on Tennant Creek.
When customer minutes are divided by the number of customers in the system, it allows systems of different sizes to be compared to each other. Figure 2.2 compares the performance of each system.
Figure 2.2 Customer minutes per customer (major incidents) of the regulated systems
0
1
2
3
4
5
6
7
8
9
10
2014-15 2015-16 2016-17
Customer minutes (M)
YearDarwin Katherine Alice Springs Tennant Creek
0
50
100
150
200
250
300
350
400
450
500
2014-15 2015-16 2016-17
Customer minutes per customer
YearDarwin Katherine Alice Springs Tennant Creek
14 | Power System Review 2016-17
Figure 2.2 illustrates that for two of the three years, Katherine customers received the worst service. Alice Springs was the best performing system in the Territory in 2014-15 but has significantly deteriorated since then. Tennant Creek has fluctuated a little over the three years but is not showing any discernible trend. The Tennant Creek and Darwin systems are now on par with each other, after an improvement in performance for Darwin.
The performance of Alice Springs will be very poor in 2017-18 due to two system blacks in November 2017, which will be covered in the next review. However, the commission is hopeful that after the commissioning of new generators and a battery during 2018, Alice Springs’ performance will materially improve in the future.
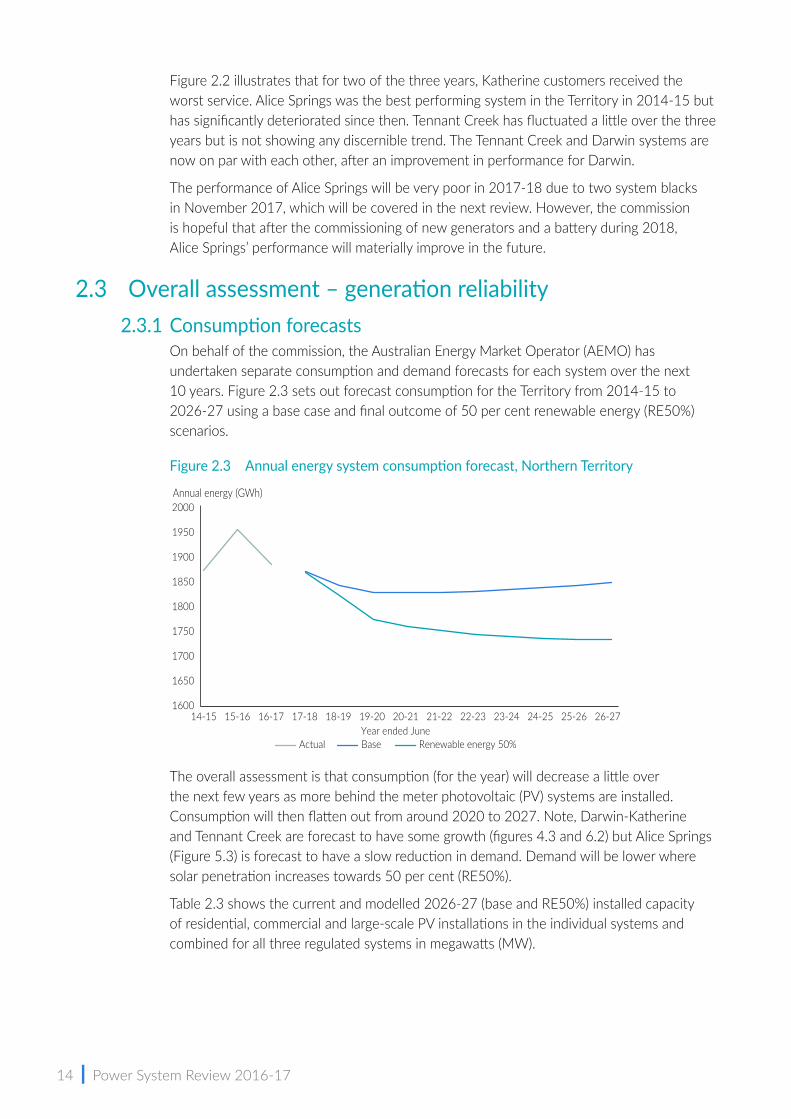
2.3 Overall assessment – generation reliability2.3.1 Consumption forecasts
On behalf of the commission, the Australian Energy Market Operator (AEMO) has undertaken separate consumption and demand forecasts for each system over the next 10 years. Figure 2.3 sets out forecast consumption for the Territory from 2014-15 to 2026-27 using a base case and final outcome of 50 per cent renewable energy (RE50%) scenarios.
Figure 2.3 Annual energy system consumption forecast, Northern Territory
The overall assessment is that consumption (for the year) will decrease a little over the next few years as more behind the meter photovoltaic (PV) systems are installed. Consumption will then flatten out from around 2020 to 2027. Note, Darwin-Katherine and Tennant Creek are forecast to have some growth (figures 4.3 and 6.2) but Alice Springs (Figure 5.3) is forecast to have a slow reduction in demand. Demand will be lower where solar penetration increases towards 50 per cent (RE50%).
Table 2.3 shows the current and modelled 2026-27 (base and RE50%) installed capacity of residential, commercial and large-scale PV installations in the individual systems and combined for all three regulated systems in megawatts (MW).
Annual energy (GWh)
Year ended JuneActual Base Renewable energy 50%
1600
1650
1700
1750
1800
1850
1900
1950
2000
14-15 15-16 16-17 17-18 18-19 19-20 20-21 21-22 22-23 23-24 24-25 25-26 26-27

Overall Performance and Major Issues | 15
Table 2.3 Northern Territory installed capacity (MW) of PV systems
Type 2016-17
2026-27
Base RE50%
Darwin-Katherine Residential 28 73 113
Commercial 9 17 44
Large-scale 0 47 222
Total 37 137 379
Alice Springs Residential 9 14 20
Commercial 2 7 12
Large-scale 4 4 19
Total 15 25 51
Tennant Creek Residential 0.3 0.6 0.9
Commercial 0 0.1 0.2
Large-scale 0 0 7.0
Total 0.3 0.7 8.1
Regulated systems Residential 37 88 134
Commercial 11 24 56
Large-scale 4 51 248
Total 52 163 438
The table shows about 390MW of solar PV will need to be installed to meet the 50 per cent scenario across the Territory.
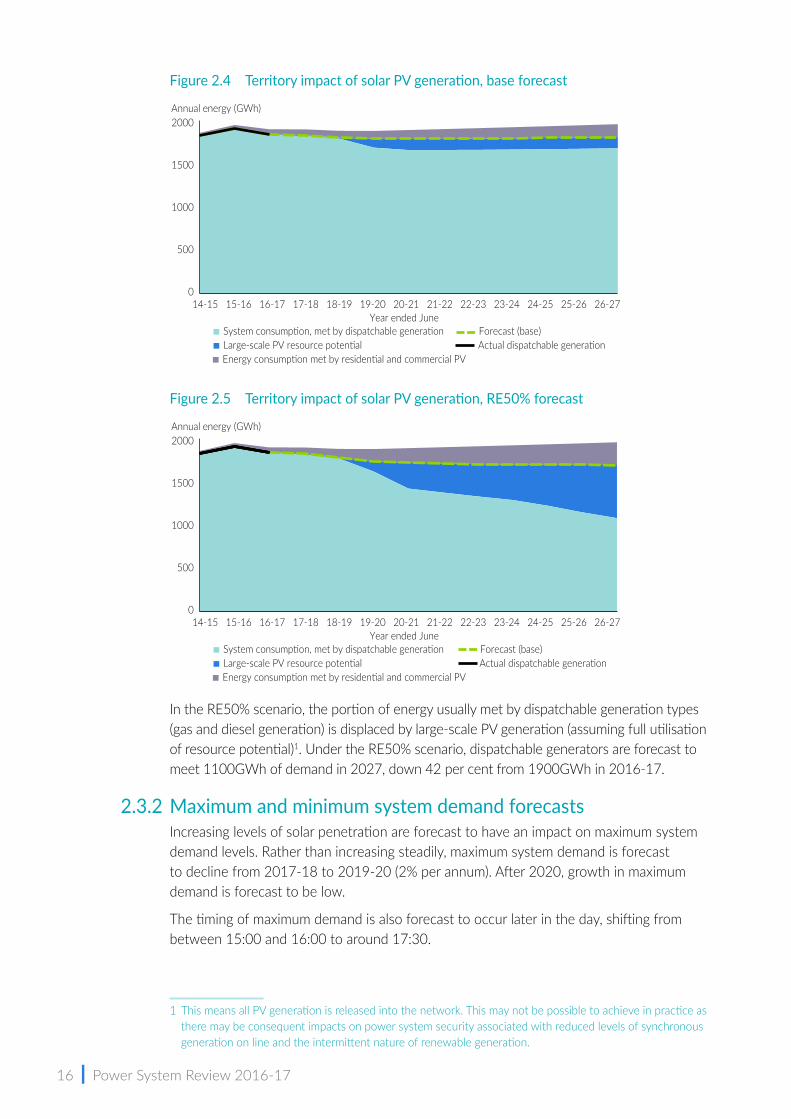
The impact of solar PV generation on total system consumption and system consumption met by dispatchable generation can be seen in Figure 2.4 (base forecast) and Figure 2.5 (RE50% forecast).
The total area shown in figures 2.4 and 2.5 represents the underlying system consumption. The purple area shows the consumption forecast to be met by residential and commercial customer’s behind the meter solar installations. Thus the green dashed line represents system consumption. The dark blue area shows the consumption to be met by the large-scale solar stations in front of the meter. The light blue area represents the system consumption met by dispatchable generation.
16 | Power System Review 2016-17
Figure 2.4 Territory impact of solar PV generation, base forecast
Figure 2.5 Territory impact of solar PV generation, RE50% forecast
In the RE50% scenario, the portion of energy usually met by dispatchable generation types (gas and diesel generation) is displaced by large-scale PV generation (assuming full utilisation of resource potential)1. Under the RE50% scenario, dispatchable generators are forecast to meet 1100GWh of demand in 2027, down 42 per cent from 1900GWh in 2016-17.
2.3.2 Maximum and minimum system demand forecastsIncreasing levels of solar penetration are forecast to have an impact on maximum system demand levels. Rather than increasing steadily, maximum system demand is forecast to decline from 2017-18 to 2019-20 (2% per annum). After 2020, growth in maximum demand is forecast to be low.
The timing of maximum demand is also forecast to occur later in the day, shifting from between 15:00 and 16:00 to around 17:30.
1 This means all PV generation is released into the network. This may not be possible to achieve in practice as there may be consequent impacts on power system security associated with reduced levels of synchronous generation on line and the intermittent nature of renewable generation.
0
500
1000
1500
2000
14-15 15-16 16-17 17-18 18-19 19-20 20-21 21-22 22-23 23-24 24-25 25-26 26-27
Annual energy (GWh)
Year ended JuneSystem consumption, met by dispatchable generationLarge-scale PV resource potential
Forecast (base)Actual dispatchable generation
Energy consumption met by residential and commercial PV

Overall Performance and Major Issues | 17
In contrast to maximum demand, which is forecast to have relatively minor impacts, minimum system demand is forecast to significantly decrease, especially under the RE50% scenario. In fact, it is forecast to approach negative demand in Alice Springs and Tennant Creek, and 30MW in Darwin-Katherine by 2026-27 under the RE50% scenario.
Similar to the above forecast, AEMO has also forecast underlying demand (total demand). Installed residential and commercial PV capacity is forecast to grow from 10 per cent of maximum underlying demand in 2016-17 to 30 per cent of maximum underlying demand in 2026-27 under the base scenario, and 50 per cent under the RE50% scenario.
2.3.3 Generation reliability (capacity) forecastThe consumption and demand forecasts are required to be matched against the level of expected capacity in the system, to ensure the system has sufficient levels of capacity.
While there is some minor capacity issues expected over the next few years, capacity is expected to improve as the levels of solar penetration increases, increasing overall capacity of the system across the year and during current maximum demand periods, although this is likely to result in increased systems costs.
It should be noted, the modelling did not take into account that as the level of solar increases, the viability of existing thermal generation is likely to change. Under the RE50% scenario these generators will be used less and may become uneconomic to keep in service, leading to possible early retirement. If this happens, the reliability assessment will be negatively affected and increased system security issues introduced. Alternatively, keeping existing thermal generation operating under these conditions would alleviate the issues but increase the cost of ancillary services and potentially the level of the community service obligation to pay for it, depending on the form of the market at the time.
This trend has been observed in the NEM and other systems with high penetration levels of renewables.
Generation ageFigure 2.6 illustrates the age profile of generation as a percentage of installed capacity across the three systems.
Figure 2.6 Age profile of generation capacity in Darwin‑Katherine, Alice Springs and Tennant Creek systems
0
0.1
0.2
0.3
0.4
0.5
0.6
0.7
<10 years old 10-20 years old >20 years old
Generating capacity (MW)
Age of generatorDarwin-Katherine (500MW) Alice Springs (125MW) Tennant Creek (25MW)
18 | Power System Review 2016-17
Figure 2.6 outlines the differences in the regulated system’s generation fleets.
In the Darwin-Katherine region, while there is some aging equipment at Channel Island power station, this is balanced by newer equipment at Channel Island power station and Weddell. Although Weddell and some Channel Island power station generators are approaching mid-life and will soon move to the intermediate 10 to 20-year category, they have received substantial component replacements over the years.
The large aeroderivative gas turbines at Channel Island power station are relatively new and so give the impression the balance is adequate. The challenge will be to maintain the inertia requirements, of which the older machines provide high levels, as well as the installed capacity as these older assets at Channel Island power station are retired.
Alice Springs shows a split between the new assets at Owen Springs power station and the old assets at Ron Goodin power station. With the imminent retirement of the Ron Goodin power station units and the expanded capacity at Owen Springs power station, there will be a much younger generation fleet in Alice Springs in the near future.
The commission notes Territory Generation (TGen) is also currently commissioning a new battery at Ron Goodin power station in Alice Springs.
While this new generation in Alice Springs will not increase capacity, it should result in improved levels of generation performance through reductions in the number of outages and trips in these systems. This is especially important in Alice Springs where the performance of the Ron Goodin power station has shown signs of deterioration as it nears the end of its service life.
Indeed, Ron Goodin power station’s 11.7MW R9 (ASEA Turbine GT35C) is the oldest of its type still running in the world. It was first commissioned at Ron Goodin in 1987. However, this is not the oldest generator in TGen’s fleet of generators. The R1 generator (Mirlees KVSS12), which is a 1.9MW standby black-start diesel generator at Ron Goodin was commissioned in 1966.
Tennant Creek shows a balance between old and new generators. This will be skewed towards the newer end of the spectrum with the ongoing replacement of machines due to be completed by the end of 2018.
2.3.4 Non‑reliable notice (reliability)System Control issues non-reliable notices when a regulated system does not have sufficient capacity to meet the required levels of spinning reserve. The number and duration of non-reliable notices provide a basic assessment of the current level of reliability in the regulated systems.
Figure 2.7 shows the number of non-reliable days in each system during 2016-17. Issuing of non-reliable notices started in January 2016. Thus current information is limited.
Overall Performance and Major Issues | 19
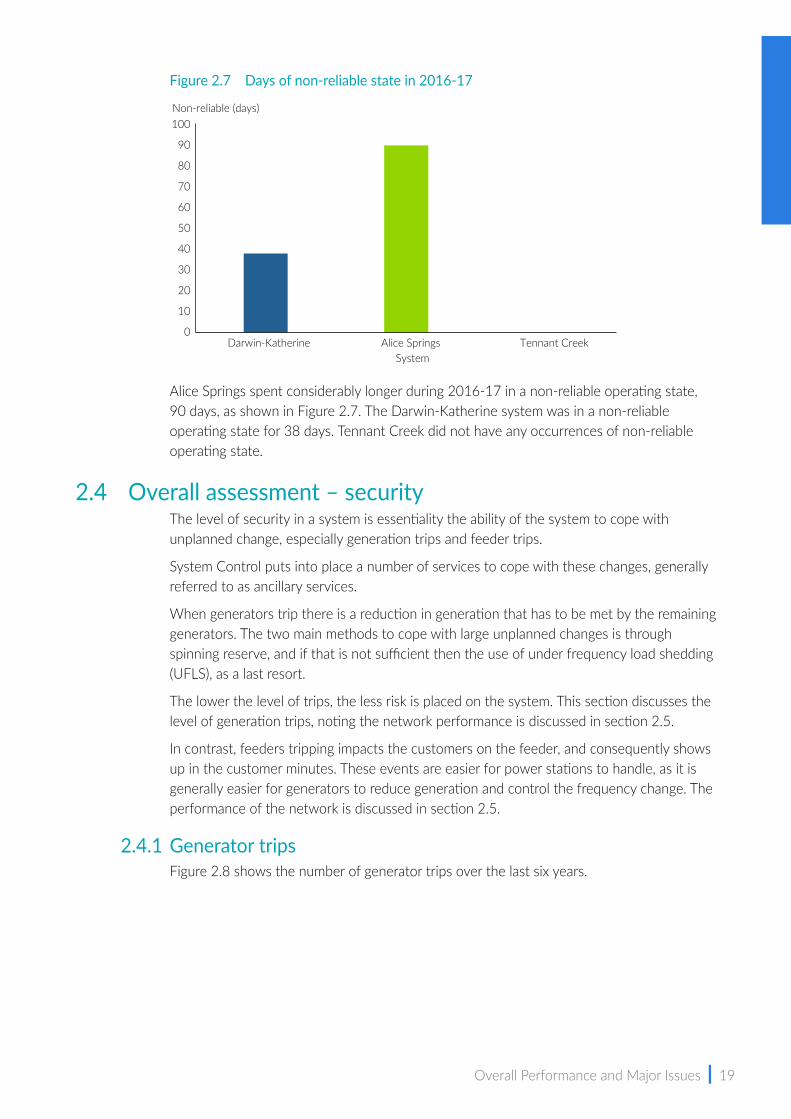
Figure 2.7 Days of non‑reliable state in 2016‑17
Alice Springs spent considerably longer during 2016-17 in a non-reliable operating state, 90 days, as shown in Figure 2.7. The Darwin-Katherine system was in a non-reliable operating state for 38 days. Tennant Creek did not have any occurrences of non-reliable operating state.
2.4 Overall assessment – securityThe level of security in a system is essentiality the ability of the system to cope with unplanned change, especially generation trips and feeder trips.
System Control puts into place a number of services to cope with these changes, generally referred to as ancillary services.
When generators trip there is a reduction in generation that has to be met by the remaining generators. The two main methods to cope with large unplanned changes is through spinning reserve, and if that is not sufficient then the use of under frequency load shedding (UFLS), as a last resort.
The lower the level of trips, the less risk is placed on the system. This section discusses the level of generation trips, noting the network performance is discussed in section 2.5.
In contrast, feeders tripping impacts the customers on the feeder, and consequently shows up in the customer minutes. These events are easier for power stations to handle, as it is generally easier for generators to reduce generation and control the frequency change. The performance of the network is discussed in section 2.5.
2.4.1 Generator tripsFigure 2.8 shows the number of generator trips over the last six years.
0
10
20
30
40
50
60
70
80
90
100
Darwin-Katherine Alice Springs Tennant Creek
Non-reliable (days)
System
20 | Power System Review 2016-17
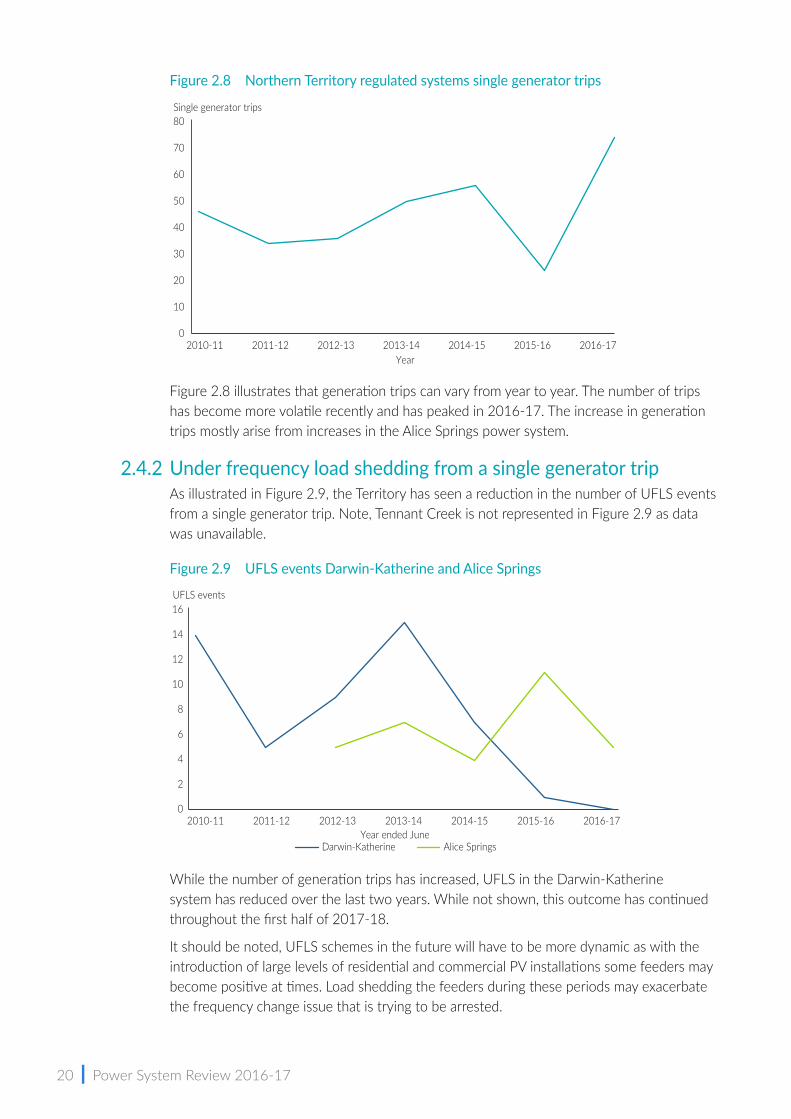
Figure 2.8 Northern Territory regulated systems single generator trips
Figure 2.8 illustrates that generation trips can vary from year to year. The number of trips has become more volatile recently and has peaked in 2016-17. The increase in generation trips mostly arise from increases in the Alice Springs power system.
2.4.2 Under frequency load shedding from a single generator tripAs illustrated in Figure 2.9, the Territory has seen a reduction in the number of UFLS events from a single generator trip. Note, Tennant Creek is not represented in Figure 2.9 as data was unavailable.
Figure 2.9 UFLS events Darwin‑Katherine and Alice Springs
While the number of generation trips has increased, UFLS in the Darwin-Katherine system has reduced over the last two years. While not shown, this outcome has continued throughout the first half of 2017-18.
It should be noted, UFLS schemes in the future will have to be more dynamic as with the introduction of large levels of residential and commercial PV installations some feeders may become positive at times. Load shedding the feeders during these periods may exacerbate the frequency change issue that is trying to be arrested.
0
10
20
30
40
50
60
70
80
2010-11 2011-12 2012-13 2013-14 2014-15 2015-16 2016-17
Single generator trips
Year
0
2
4
6
8
10
12
14
16
2010-11 2011-12 2012-13 2013-14 2014-15 2015-16 2016-17
UFLS events
Year ended JuneDarwin-Katherine Alice Springs
Overall Performance and Major Issues | 21
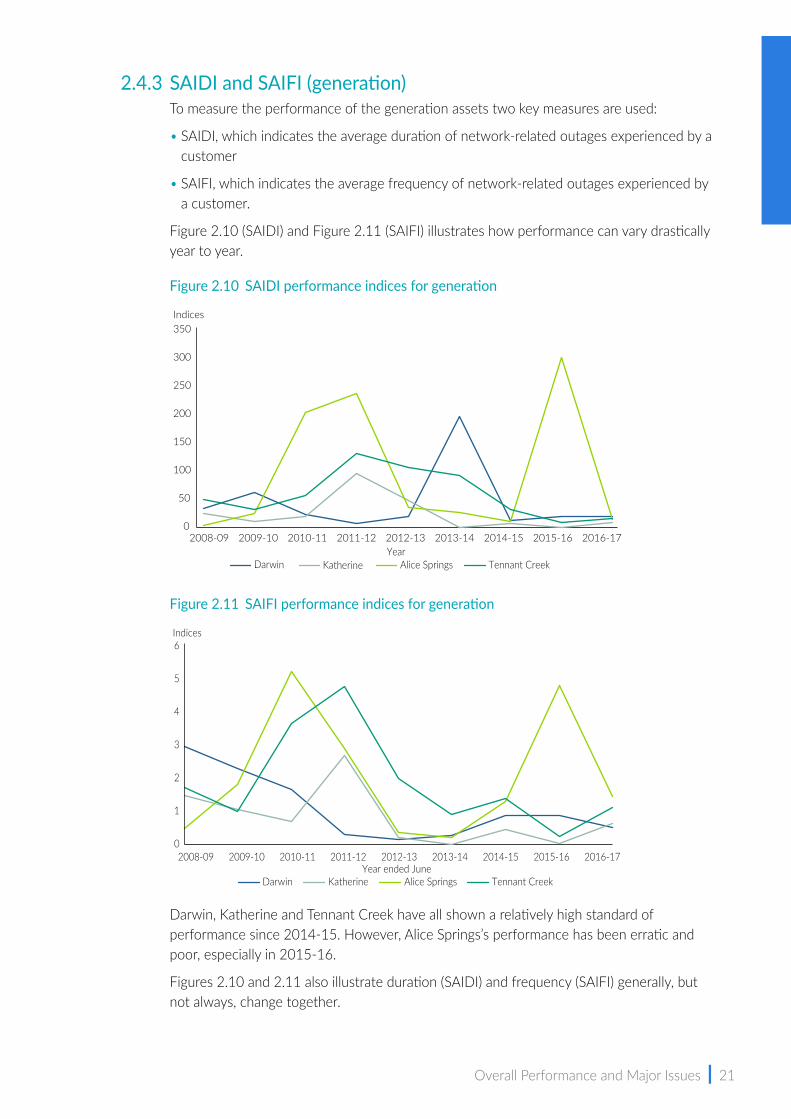
2.4.3 SAIDI and SAIFI (generation)To measure the performance of the generation assets two key measures are used:
• SAIDI, which indicates the average duration of network-related outages experienced by a customer
• SAIFI, which indicates the average frequency of network-related outages experienced by a customer.
Figure 2.10 (SAIDI) and Figure 2.11 (SAIFI) illustrates how performance can vary drastically year to year.
Figure 2.10 SAIDI performance indices for generation
Figure 2.11 SAIFI performance indices for generation
Darwin, Katherine and Tennant Creek have all shown a relatively high standard of performance since 2014-15. However, Alice Springs’s performance has been erratic and poor, especially in 2015-16.
Figures 2.10 and 2.11 also illustrate duration (SAIDI) and frequency (SAIFI) generally, but not always, change together.
2008-09 2009-10 2010-11 2011-12 2012-13 2013-14 2014-15 2015-16 2016-170
50
100
150
200
250
300
350
Year
Indices
Darwin Katherine Alice Springs Tennant Creek
2008-09 2009-10 2010-11 2011-12 2012-13 2013-14 2014-15 2015-16 2016-170
1
2
3
4
5
6
Year ended June
Indices
Darwin Katherine Alice Springs Tennant Creek

22 | Power System Review 2016-17
2.5 Overall assessment – network performancePower and Water Corporation (PWC) Networks division is a natural monopoly and is subject to a price determination. PWC has performance targets approved by the commission. These targets are taken into account by the Australian Energy Regulator (AER) when determining PWC’s prices.
In particular, targets were set for the current (2012-13 to 2018-19) determination and recently for the next determination (2019-20 and 2024-25), which is currently under consideration by the AER.
Current targets are set for distribution and transmission performance.
2.5.1 DistributionDistribution performance is based on SAIDI and SAIFI.
To ensure consistency with national definitions and the AER requirements, national definitions of feeders will be adopted from 1 July 2019. Thus, the current targets and the approved (2019) targets are not directly comparable as they have slightly different feeder classifications. The most significant change is from 2019 onwards as the commission has removed the requirement to report on transmission lines separately, which is consistent with the AER’s treatment of PWC’s feeders. The second impact is that from 1 July 2019 some urban feeders will be classified as short rural feeders. The commission also removed the impact of a system black in Darwin in 2013-14 to concentrate on the underlying performance.
Table 2.4 shows the current targets and the new approved targets that are based on the PWC five-year average.
Table 2.4 PWC proposed network performance targets
Measure Current targetPWC 5 Y/Median (new feeder
definition, without system black) Approved target
CBD SAIDI 18.8 3.3 4.0
SAIFI 0.4 0.08 0.1
Urban SAIDI 136 138 140
SAIFI 2.5 2.0 2.0
Rural short SAIDI 496.3 190.4 190
SAIFI 8.1 2.9 3.0
Rural long SAIDI 2 165.9 1 663 1 500
SAIFI 35.1 19.8 19
Table 2.4 illustrates that PWC’s performance has significantly improved across three of the four main areas. The fourth classification, namely urban feeders, has remained stable but it is noted this is a feeder classification impacted by the changes in definition.
SAIDI Table 2.5 shows PWC’s reported performance (annual reporting) using current feeder definitions against its current SAIDI targets. Figures in red highlight instances where PWC have not achieved its targets.
Overall Performance and Major Issues | 23
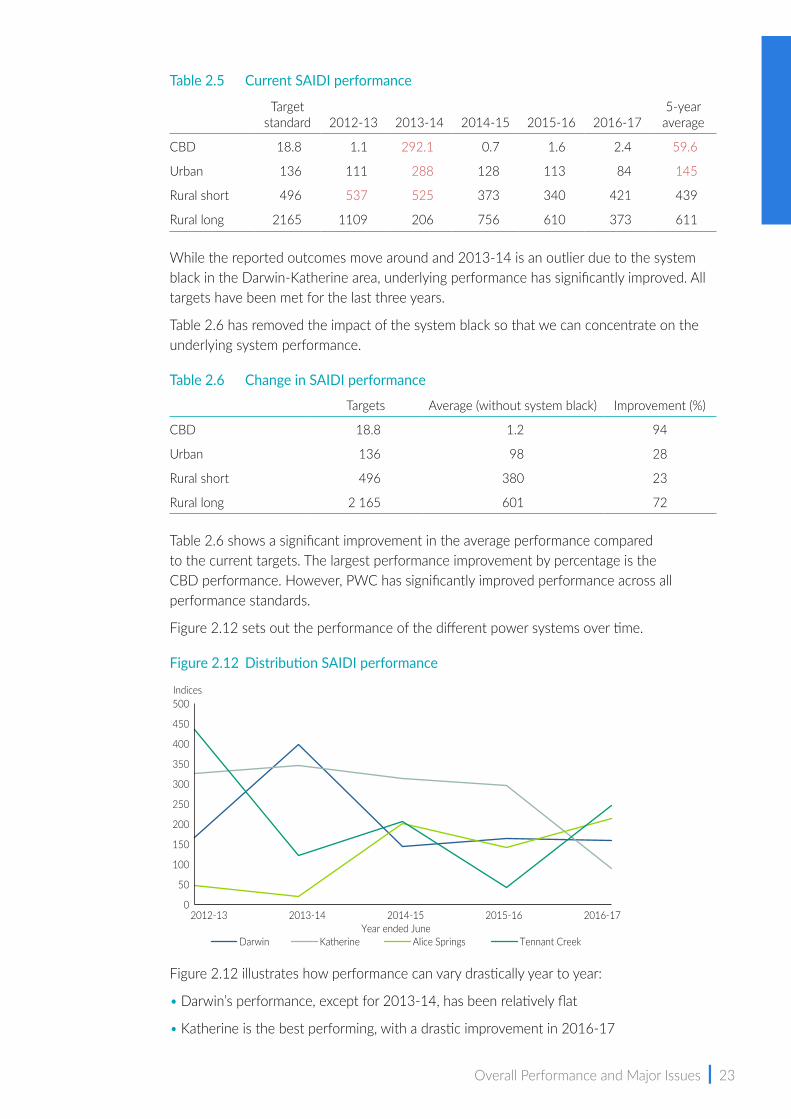
Table 2.5 Current SAIDI performance
Target standard 2012-13 2013-14 2014-15 2015-16 2016-17
5-year average
CBD 18.8 1.1 292.1 0.7 1.6 2.4 59.6
Urban 136 111 288 128 113 84 145
Rural short 496 537 525 373 340 421 439
Rural long 2165 1109 206 756 610 373 611
While the reported outcomes move around and 2013-14 is an outlier due to the system black in the Darwin-Katherine area, underlying performance has significantly improved. All targets have been met for the last three years.
Table 2.6 has removed the impact of the system black so that we can concentrate on the underlying system performance.
Table 2.6 Change in SAIDI performance
Targets Average (without system black) Improvement (%)
CBD 18.8 1.2 94
Urban 136 98 28
Rural short 496 380 23
Rural long 2 165 601 72
Table 2.6 shows a significant improvement in the average performance compared to the current targets. The largest performance improvement by percentage is the CBD performance. However, PWC has significantly improved performance across all performance standards.
Figure 2.12 sets out the performance of the different power systems over time.
Figure 2.12 Distribution SAIDI performance
Figure 2.12 illustrates how performance can vary drastically year to year:
• Darwin’s performance, except for 2013-14, has been relatively flat
• Katherine is the best performing, with a drastic improvement in 2016-17
0
50
100
150
200
250
300
350
400
450
500
2012-13 2013-14 2014-15 2015-16 2016-17
Indices
Year ended JuneDarwin Katherine Alice Springs Tennant Creek
24 | Power System Review 2016-17
• of most concern, Alice Springs has shown an upward trend, urban and short rural feeders have increased from 2012-13 to 2016-17
• Tennant Creek has been on a downward trend until 2016-17.
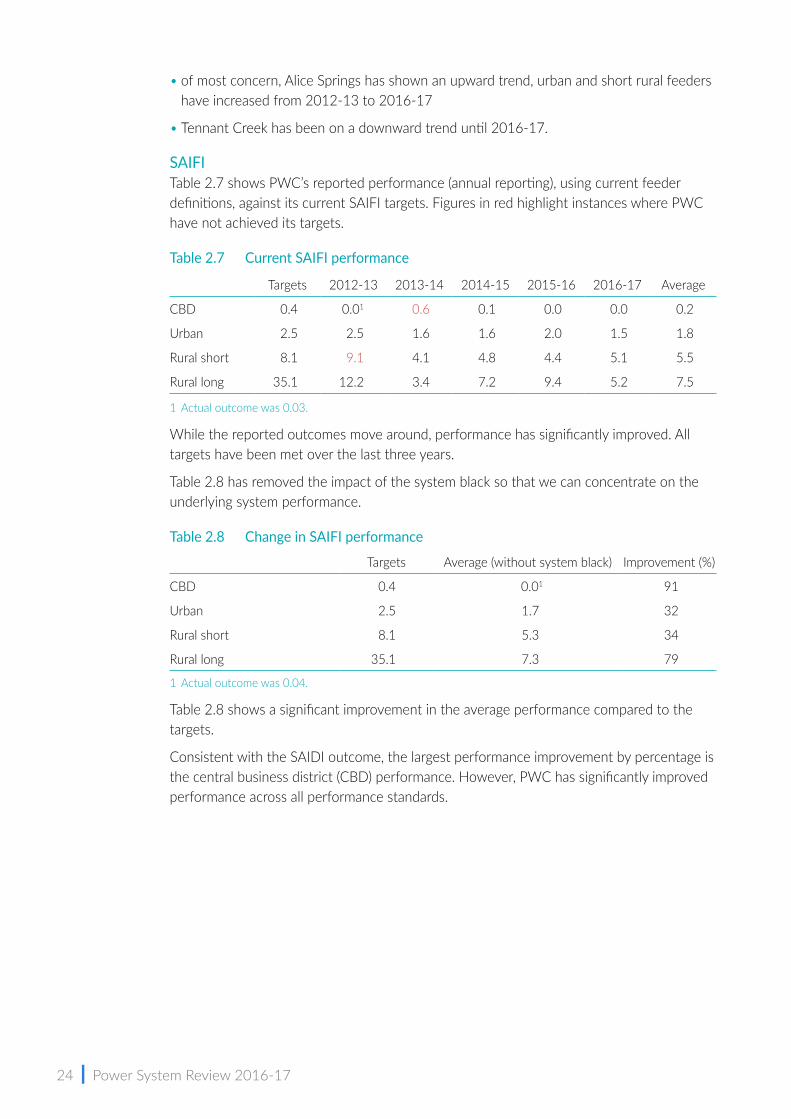
SAIFI Table 2.7 shows PWC’s reported performance (annual reporting), using current feeder definitions, against its current SAIFI targets. Figures in red highlight instances where PWC have not achieved its targets.
Table 2.7 Current SAIFI performance
Targets 2012-13 2013-14 2014-15 2015-16 2016-17 Average
CBD 0.4 0.01 0.6 0.1 0.0 0.0 0.2
Urban 2.5 2.5 1.6 1.6 2.0 1.5 1.8
Rural short 8.1 9.1 4.1 4.8 4.4 5.1 5.5
Rural long 35.1 12.2 3.4 7.2 9.4 5.2 7.5
1 Actual outcome was 0.03.
While the reported outcomes move around, performance has significantly improved. All targets have been met over the last three years.
Table 2.8 has removed the impact of the system black so that we can concentrate on the underlying system performance.
Table 2.8 Change in SAIFI performance
Targets Average (without system black) Improvement (%)
CBD 0.4 0.01 91
Urban 2.5 1.7 32
Rural short 8.1 5.3 34
Rural long 35.1 7.3 79
1 Actual outcome was 0.04.
Table 2.8 shows a significant improvement in the average performance compared to the targets.
Consistent with the SAIDI outcome, the largest performance improvement by percentage is the central business district (CBD) performance. However, PWC has significantly improved performance across all performance standards.

Overall Performance and Major Issues | 25
Figure 2.13 sets out the performance of the different power systems over time.
Figure 2.13 Distribution SAIFI performance
Figure 2.13 illustrates how performance can vary drastically year to year:
• Darwin’s performance has shown a small but consistent improvement in performance
• Katherine’s performance has been diverse, with 2013-14 and 2016-17 showing the best results
• of most concern, Alice Springs has shown an upward trend, both urban and short rural feeders have increased from 2012-13 to 2016-17
• Tennant Creek has been on a downward trend until 2016-17.
2.5.2 TransmissionTo measure the performance of the transmission assets, four key measures are used:
• average circuit outage duration (ACOD) – the average length of the outage, calculated as the sum of the duration for all transmission circuit outages divided by the sum of transmission outages
• frequency of circuit outages (FCO) –the number of incidents across a period of time
• average transformer outage duration (ATOD) – the average length of outages caused by transformer issues, calculated as the sum of the duration for all transmission transformer outages divided by the sum of transmission outages
• frequency of transformer outages (FTO) – the number of incidents across a period of time.
Tables 2.9 and 2.10 show the frequency and duration of outages for circuits and transformers in Darwin-Katherine and Alice Springs, noting Tennant Creek does not report against any transmission feeders. The vast bulk of transmission lines lie in the Darwin-Katherine area and therefore this section concentrates on the Darwin-Katherine outcomes. In comparison to Darwin-Katherine, Alice Springs has a very small transmission network. As per Figure 5.1, Alice Springs has two 30 kilometre (km) 66KV lines that are classified as transmission lines. These lines are relatively new and consequently have not had any incidents since 2012-13.
0
2
4
6
8
10
12
2012-13
Label?
2013-14 2014-15Year ended June
2015-16 2016-17
Darwin Katherine Alice Springs Tennant Creek
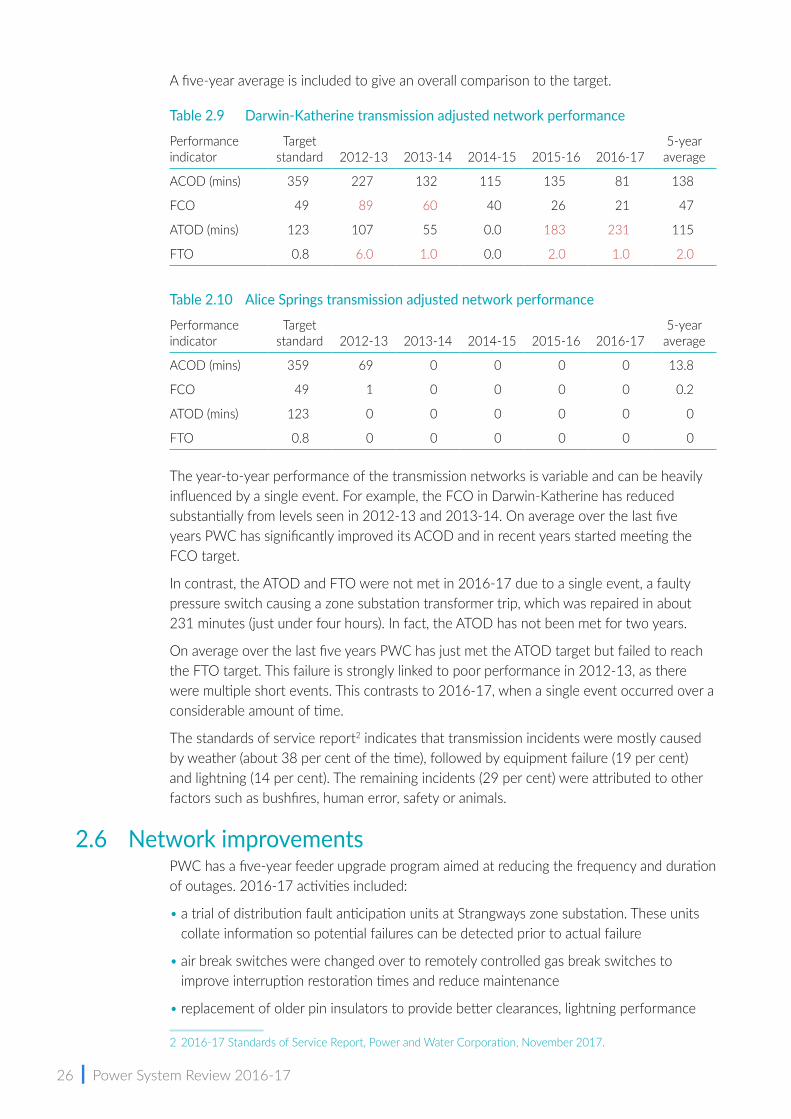
26 | Power System Review 2016-17
A five-year average is included to give an overall comparison to the target.
Table 2.9 Darwin‑Katherine transmission adjusted network performance
Performance indicator
Target standard 2012-13 2013-14 2014-15 2015-16 2016-17
5-year average
ACOD (mins) 359 227 132 115 135 81 138
FCO 49 89 60 40 26 21 47
ATOD (mins) 123 107 55 0.0 183 231 115
FTO 0.8 6.0 1.0 0.0 2.0 1.0 2.0
Table 2.10 Alice Springs transmission adjusted network performance
Performance indicator
Target standard 2012-13 2013-14 2014-15 2015-16 2016-17
5-year average
ACOD (mins) 359 69 0 0 0 0 13.8
FCO 49 1 0 0 0 0 0.2
ATOD (mins) 123 0 0 0 0 0 0
FTO 0.8 0 0 0 0 0 0
The year-to-year performance of the transmission networks is variable and can be heavily influenced by a single event. For example, the FCO in Darwin-Katherine has reduced substantially from levels seen in 2012-13 and 2013-14. On average over the last five years PWC has significantly improved its ACOD and in recent years started meeting the FCO target.
In contrast, the ATOD and FTO were not met in 2016-17 due to a single event, a faulty pressure switch causing a zone substation transformer trip, which was repaired in about 231 minutes (just under four hours). In fact, the ATOD has not been met for two years.
On average over the last five years PWC has just met the ATOD target but failed to reach the FTO target. This failure is strongly linked to poor performance in 2012-13, as there were multiple short events. This contrasts to 2016-17, when a single event occurred over a considerable amount of time.
The standards of service report2 indicates that transmission incidents were mostly caused by weather (about 38 per cent of the time), followed by equipment failure (19 per cent) and lightning (14 per cent). The remaining incidents (29 per cent) were attributed to other factors such as bushfires, human error, safety or animals.
2.6 Network improvementsPWC has a five-year feeder upgrade program aimed at reducing the frequency and duration of outages. 2016-17 activities included:
• a trial of distribution fault anticipation units at Strangways zone substation. These units collate information so potential failures can be detected prior to actual failure
• air break switches were changed over to remotely controlled gas break switches to improve interruption restoration times and reduce maintenance
• replacement of older pin insulators to provide better clearances, lightning performance
2 2016-17 Standards of Service Report, Power and Water Corporation, November 2017.
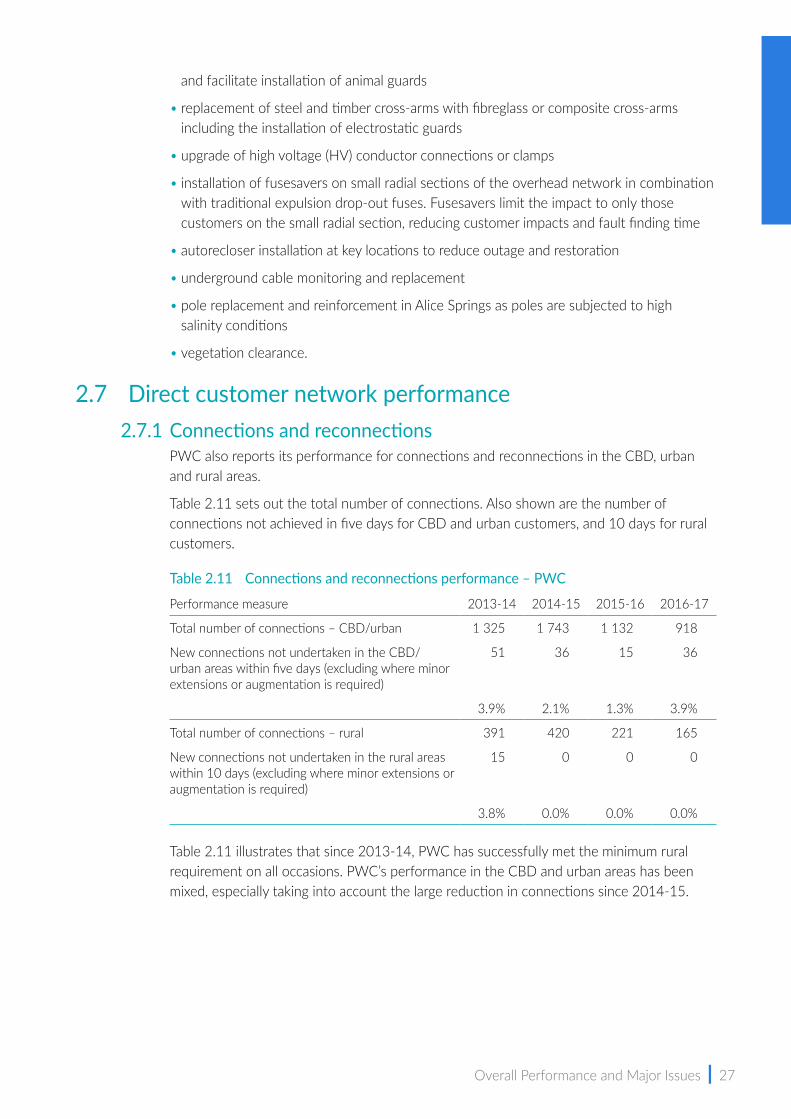
Overall Performance and Major Issues | 27
and facilitate installation of animal guards
• replacement of steel and timber cross-arms with fibreglass or composite cross-arms including the installation of electrostatic guards
• upgrade of high voltage (HV) conductor connections or clamps
• installation of fusesavers on small radial sections of the overhead network in combination with traditional expulsion drop-out fuses. Fusesavers limit the impact to only those customers on the small radial section, reducing customer impacts and fault finding time
• autorecloser installation at key locations to reduce outage and restoration
• underground cable monitoring and replacement
• pole replacement and reinforcement in Alice Springs as poles are subjected to high salinity conditions
• vegetation clearance.
2.7 Direct customer network performance2.7.1 Connections and reconnections
PWC also reports its performance for connections and reconnections in the CBD, urban and rural areas.
Table 2.11 sets out the total number of connections. Also shown are the number of connections not achieved in five days for CBD and urban customers, and 10 days for rural customers.
Table 2.11 Connections and reconnections performance – PWC
Performance measure 2013-14 2014-15 2015-16 2016-17
Total number of connections – CBD/urban 1 325 1 743 1 132 918
New connections not undertaken in the CBD/urban areas within five days (excluding where minor extensions or augmentation is required)
51 36 15 36
3.9% 2.1% 1.3% 3.9%
Total number of connections – rural 391 420 221 165
New connections not undertaken in the rural areas within 10 days (excluding where minor extensions or augmentation is required)
15 0 0 0
3.8% 0.0% 0.0% 0.0%
Table 2.11 illustrates that since 2013-14, PWC has successfully met the minimum rural requirement on all occasions. PWC’s performance in the CBD and urban areas has been mixed, especially taking into account the large reduction in connections since 2014-15.

28 | Power System Review 2016-17
Table 2.12 sets out the number of connections in new subdivisions and the average length of time it takes to install these connections.
Table 2.12 New connections in urban areas to new subdivisions – PWC
2012-13 2013-14 2014-15 2015-16 2016-17
Total 120 109 104 83 53
Average weeks 14 12.5 11.1 11.1 10.8
Table 2.11 shows the total number of connections have been decreasing since 2012-13 and the average time taken to install the connections has also been decreasing.
Note, these performance standards are subject to guarantee service level (GSL) payments.
2.7.2 Networks customer power quality notificationsThe reporting requirements for complaints relating to network quality of supply are ‘the percentage and total number of complaints associated with the transmission network and distribution network quality of supply issues’.
Figure 2.14 outlines the number of notifications (complaints) to PWC over the last four years regarding power outages or power quality.
Figure 2.14 Customer notifications
Figure 2.14 shows a downward trend over the last four years.
Table 2.13 shows the reasons for the notifications range from no power to fluctuating power. The break up is based on 2016-17 data but the reasons for notifications from one year to the next are relatively steady and 2016-17 appears to be reasonably typical.
Table 2.13 Network customer power quality notifications by type 2016‑17
Percentage
No power 70
Part power 23
Low power 3
Fluctuation 5
0
1000
2000
3000
4000
5000
6000
7000
2012-13 2013-14 2014-15 2015-16 2016-17
Number of notifications
Year ended June
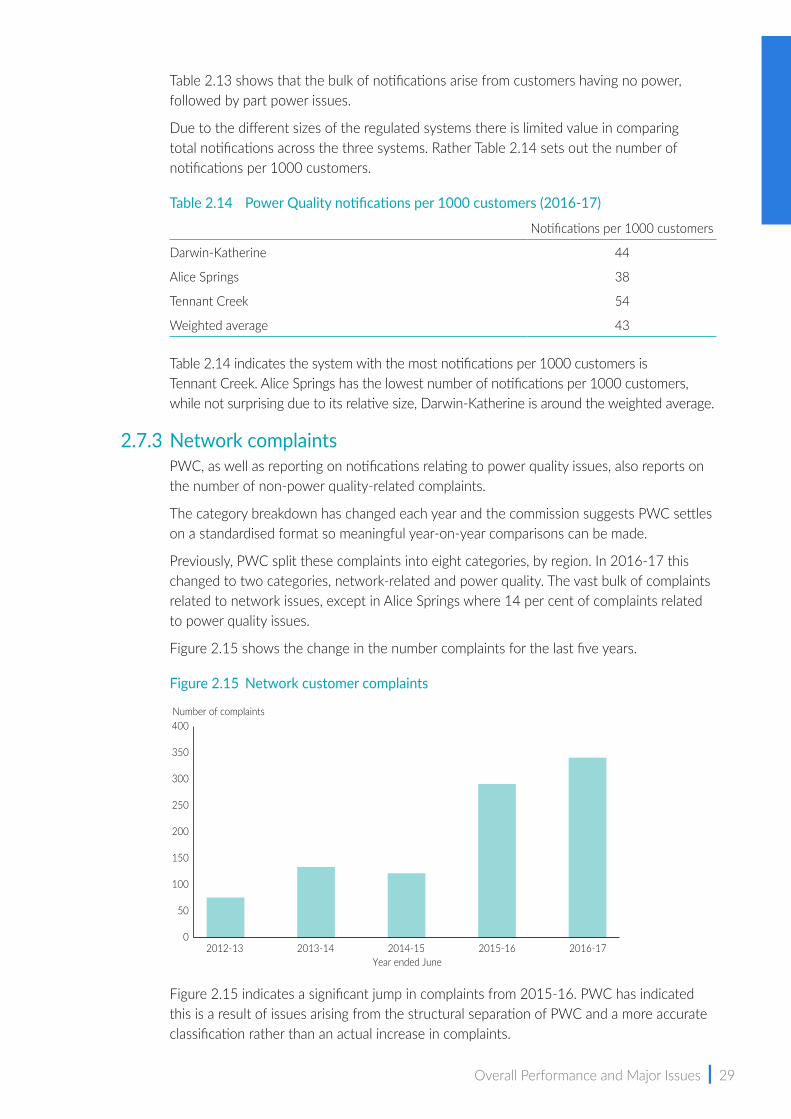
Overall Performance and Major Issues | 29
Table 2.13 shows that the bulk of notifications arise from customers having no power, followed by part power issues.
Due to the different sizes of the regulated systems there is limited value in comparing total notifications across the three systems. Rather Table 2.14 sets out the number of notifications per 1000 customers.
Table 2.14 Power Quality notifications per 1000 customers (2016‑17)
Notifications per 1000 customers
Darwin-Katherine 44
Alice Springs 38
Tennant Creek 54
Weighted average 43
Table 2.14 indicates the system with the most notifications per 1000 customers is Tennant Creek. Alice Springs has the lowest number of notifications per 1000 customers, while not surprising due to its relative size, Darwin-Katherine is around the weighted average.
2.7.3 Network complaintsPWC, as well as reporting on notifications relating to power quality issues, also reports on the number of non-power quality-related complaints.
The category breakdown has changed each year and the commission suggests PWC settles on a standardised format so meaningful year-on-year comparisons can be made.
Previously, PWC split these complaints into eight categories, by region. In 2016-17 this changed to two categories, network-related and power quality. The vast bulk of complaints related to network issues, except in Alice Springs where 14 per cent of complaints related to power quality issues.
Figure 2.15 shows the change in the number complaints for the last five years.
Figure 2.15 Network customer complaints
Figure 2.15 indicates a significant jump in complaints from 2015-16. PWC has indicated this is a result of issues arising from the structural separation of PWC and a more accurate classification rather than an actual increase in complaints.
0
50
100
150
200
250
300
350
400
2012-13 2013-14 2014-15 2015-16 2016-17
Number of complaints
Year ended June
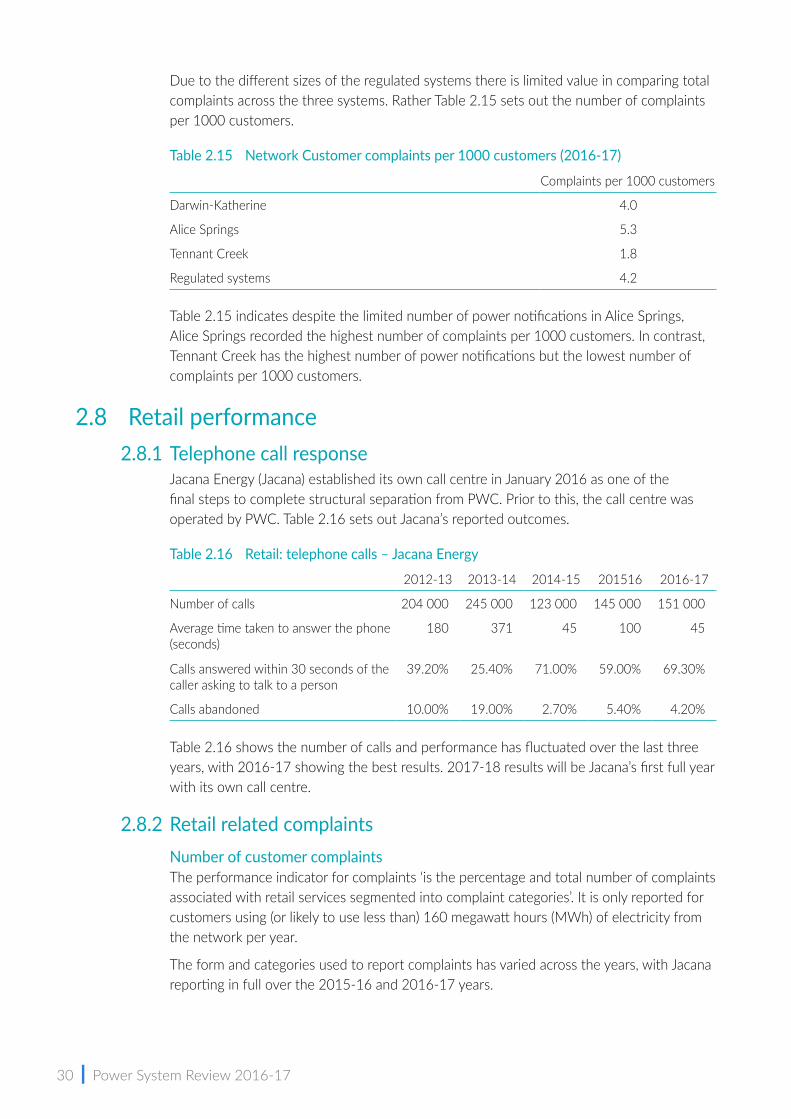
30 | Power System Review 2016-17
Due to the different sizes of the regulated systems there is limited value in comparing total complaints across the three systems. Rather Table 2.15 sets out the number of complaints per 1000 customers.
Table 2.15 Network Customer complaints per 1000 customers (2016‑17)
Complaints per 1000 customers
Darwin-Katherine 4.0
Alice Springs 5.3
Tennant Creek 1.8
Regulated systems 4.2
Table 2.15 indicates despite the limited number of power notifications in Alice Springs, Alice Springs recorded the highest number of complaints per 1000 customers. In contrast, Tennant Creek has the highest number of power notifications but the lowest number of complaints per 1000 customers.
2.8 Retail performance 2.8.1 Telephone call response
Jacana Energy (Jacana) established its own call centre in January 2016 as one of the final steps to complete structural separation from PWC. Prior to this, the call centre was operated by PWC. Table 2.16 sets out Jacana’s reported outcomes.
Table 2.16 Retail: telephone calls – Jacana Energy
2012-13 2013-14 2014-15 201516 2016-17
Number of calls 204 000 245 000 123 000 145 000 151 000
Average time taken to answer the phone (seconds)
180 371 45 100 45
Calls answered within 30 seconds of the caller asking to talk to a person
39.20% 25.40% 71.00% 59.00% 69.30%
Calls abandoned 10.00% 19.00% 2.70% 5.40% 4.20%
Table 2.16 shows the number of calls and performance has fluctuated over the last three years, with 2016-17 showing the best results. 2017-18 results will be Jacana’s first full year with its own call centre.
2.8.2 Retail related complaintsNumber of customer complaintsThe performance indicator for complaints ‘is the percentage and total number of complaints associated with retail services segmented into complaint categories’. It is only reported for customers using (or likely to use less than) 160 megawatt hours (MWh) of electricity from the network per year.
The form and categories used to report complaints has varied across the years, with Jacana reporting in full over the 2015-16 and 2016-17 years.
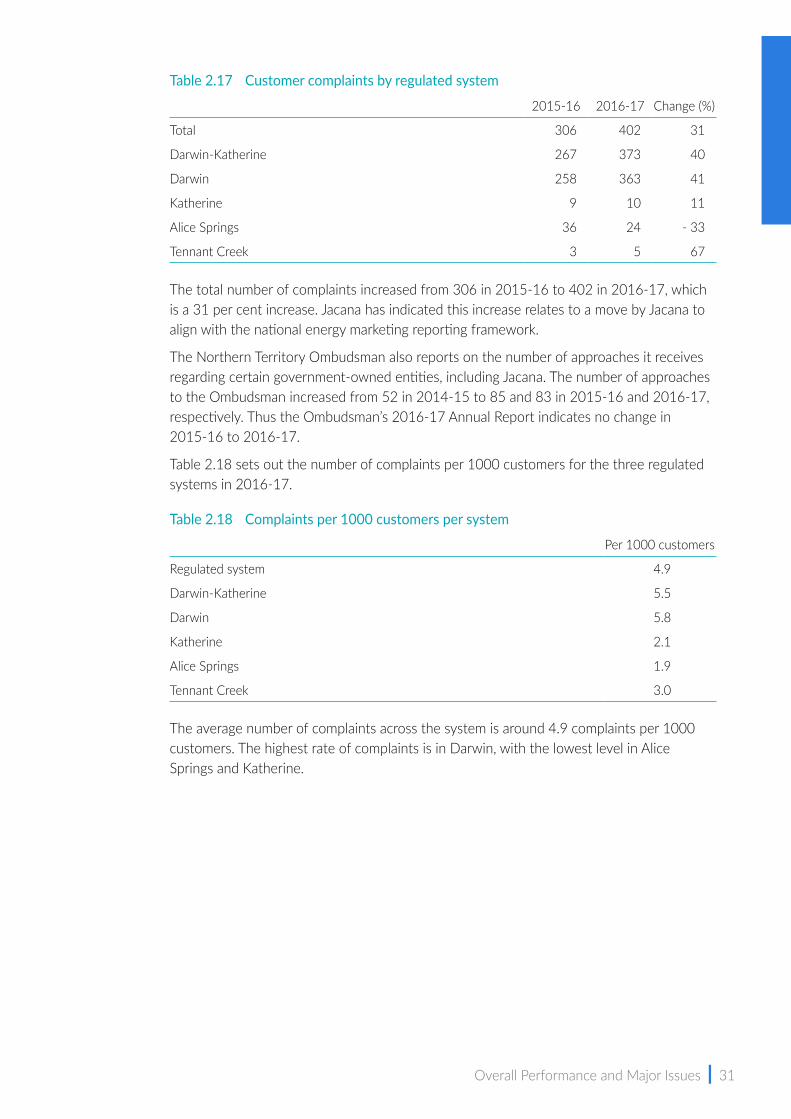
Overall Performance and Major Issues | 31
Table 2.17 Customer complaints by regulated system
2015-16 2016-17 Change (%)
Total 306 402 31
Darwin-Katherine 267 373 40
Darwin 258 363 41
Katherine 9 10 11
Alice Springs 36 24 - 33
Tennant Creek 3 5 67
The total number of complaints increased from 306 in 2015-16 to 402 in 2016-17, which is a 31 per cent increase. Jacana has indicated this increase relates to a move by Jacana to align with the national energy marketing reporting framework.
The Northern Territory Ombudsman also reports on the number of approaches it receives regarding certain government-owned entities, including Jacana. The number of approaches to the Ombudsman increased from 52 in 2014-15 to 85 and 83 in 2015-16 and 2016-17, respectively. Thus the Ombudsman’s 2016-17 Annual Report indicates no change in 2015-16 to 2016-17.
Table 2.18 sets out the number of complaints per 1000 customers for the three regulated systems in 2016-17.
Table 2.18 Complaints per 1000 customers per system
Per 1000 customers
Regulated system 4.9
Darwin-Katherine 5.5
Darwin 5.8
Katherine 2.1
Alice Springs 1.9
Tennant Creek 3.0
The average number of complaints across the system is around 4.9 complaints per 1000 customers. The highest rate of complaints is in Darwin, with the lowest level in Alice Springs and Katherine.

32 | Power System Review 2016-17
Figure 2.16 sets out the complaints by category. The categories are consistent with the AER’s categories.
Figure 2.16 Retail customer complaints
Figure 2.16 shows ‘other’ and ‘billing’ dominate the types of complaints with very little regarding marketing. This is not surprising, noting Jacana’s prices are subject to a Pricing Order set by the Treasurer and there is little real competition for smaller customers, who are the bulk of Jacana’s customers. The top issues raised with the Ombudsman in relation to Jacana Energy in 2016-17 were:
• disconnection (21) unreasonable or in error, charging reconnection fee
• excessive charges (17)
• financial hardship, debt collection arrangements, credit listing (17)
• billing (13), for example, bill not received or two bills received at the same time or sent to wrong address.
2.9 Customer hardship programsJacana was the only retailer to report on a hardship program. Its current program guidelines are outlined in its Stay Connected Policy (available on Jacana’s website jacanaenergy.com.au/residential/payment_options/Stay_Connected.pdf). The Stay Connected Policy is run in collaboration with Somerville, Anglicare, Salvation Army, St Vincent’s de Paul and Catholic Care.
Domestic customers can qualify as a Stay Connected customer either through Jacana or an independent accredited financial counsellor (such as the charities listed above).
Qualification as a Stay Connect Customer is generally based on the customer’s inability to pay the current debt in a timely manner due to low income or other circumstances. Stay Connect customers:
• are provided with a payment plan to repay current debt over a period of time
• will not be disconnected
• may receive assistance in reducing consumption, accessing concession schemes, other welfare programs and financial counselling services.
0
50
100
150
200
250Number of complaints
Billing Marketing Other2016-17
Year ended June

Overall Performance and Major Issues | 33
Stay Connected cases are kept confidential.
Incorporated within the Stay Connected Policy is an electronic voucher (e-voucher) scheme. The purpose of the e-voucher scheme is to assist financially disadvantaged people in a crisis situation. It is not intended for ongoing income support.
Jacana provides $175 000 per annum of electronic vouchers and pre-pay meter tokens (evouchers) across the five charities. The charities determine eligibility and distribute the funding to domestic customers on behalf of Jacana Energy. The amount of e-voucher assistance issued is to be determined by the charities by assessing the customer’s needs in accordance with the agency’s normal case management procedures.
While Jacana Energy respects the independence of the agency’s assessment, it reserves the right to disallow e-vouchers where electronic vouchers are:
• provided by more than one agency
• provided for payment of charges other than consumption, connection and related charges for electricity.
Jacana is seeking to make improvements to their hardship program. Jacana reported a new approach to hardship programs will be rolled out with the new billing system in 2018. The new policy will adopt a holistic approach to customers facing payment difficulties and will focus, in particular, on earlier interventions and other measures to help limit debt accumulation, such as earlier warnings on debt levels and flexible payment plans.
2.9.1 2016‑17 outcomesFigure 2.17 sets out the number of hardship customers from 2014-15 to 2016-17 and illustrates the number of hardship customers by debt level.
Figure 2.17 Hardship customers by debt levels
Figure 2.17 shows the number of hardship customers has decreased since the retail business of PWC split into Jacana. 2014-15 was the first year that the data separated electricity and water, therefore no comparison can be made with years previous to this.
0
100
200
300
400
500
600
2014-15 2015-16 2016-17
Between $0 and $500Year ended June
Hardship customers (number)
Over $500 but less than $1500$1500 but less than $2500 $2500 or more
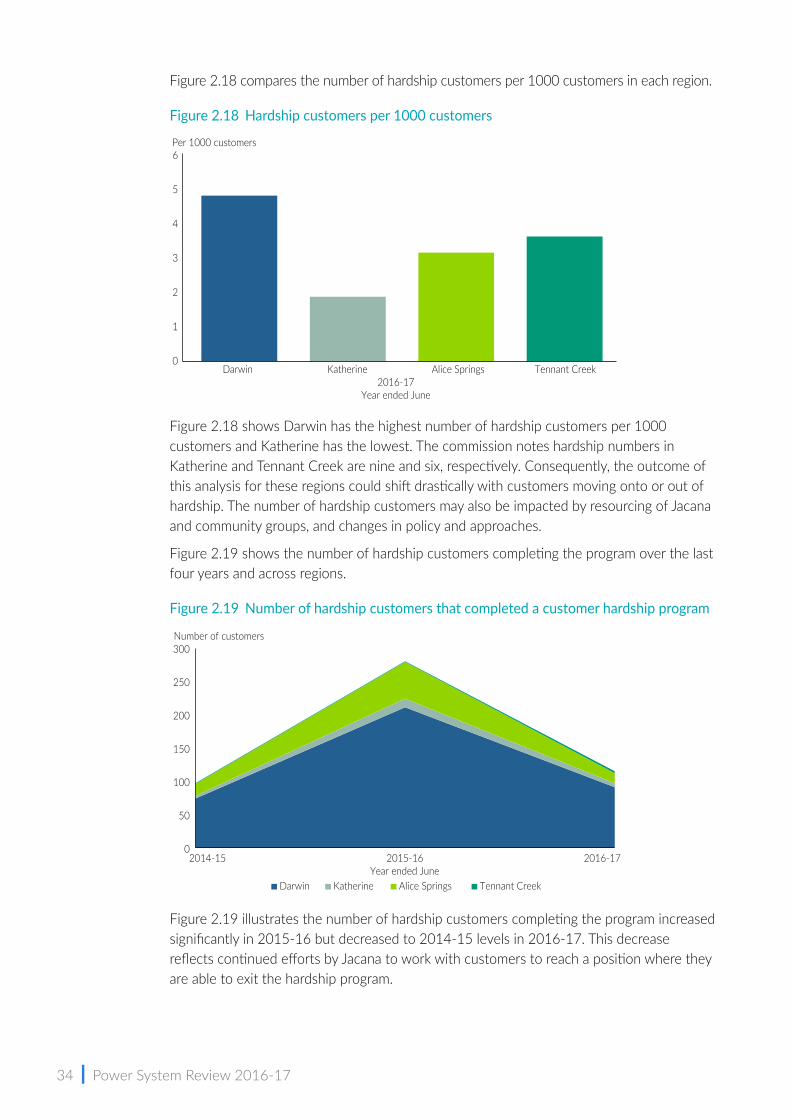
34 | Power System Review 2016-17
Figure 2.18 compares the number of hardship customers per 1000 customers in each region.
Figure 2.18 Hardship customers per 1000 customers
Figure 2.18 shows Darwin has the highest number of hardship customers per 1000 customers and Katherine has the lowest. The commission notes hardship numbers in Katherine and Tennant Creek are nine and six, respectively. Consequently, the outcome of this analysis for these regions could shift drastically with customers moving onto or out of hardship. The number of hardship customers may also be impacted by resourcing of Jacana and community groups, and changes in policy and approaches.
Figure 2.19 shows the number of hardship customers completing the program over the last four years and across regions.
Figure 2.19 Number of hardship customers that completed a customer hardship program
Figure 2.19 illustrates the number of hardship customers completing the program increased significantly in 2015-16 but decreased to 2014-15 levels in 2016-17. This decrease reflects continued efforts by Jacana to work with customers to reach a position where they are able to exit the hardship program.
0
1
2
3
4
5
6
2016-17Year ended June
Per 1000 customers
Darwin Katherine Alice Springs Tennant Creek
0
50
100
150
200
250
300Number of customers
2014-15Year ended June
2015-16 2016-17
Darwin Katherine Alice Springs Tennant Creek

Overall Performance and Major Issues | 35
Figure 2.20 shows the average electricity bill of all customers who were on the customer hardship program.
Figure 2.20 Average bill of a hardship customer
Figure 2.20 illustrates the average bill increased over the last three years. However, this will be influenced by the reduction in customers with relatively small bills (less than $500) being included in the program. A reduction in the number of customers with small bills will increase the average bill.
Figure 2.21 shows the number of disconnections for failure to pay and reconnections in the same name.
Figure 2.21 Number of disconnections
Jacana stated that in 2015-16 the number of disconnections was quite high compared to other retailers operating nationally. Jacana Energy sought to address this issue by implementing a new SMS warning service where customers are sent an SMS advising they have two days to pay outstanding monies before they are disconnected.
This resulted in a significant reduction in the number of customers disconnected, which more than halved from 2015-16 to 2016-17.
0
200
400
600
800
1000
1200
1400
1600
1800
2000
Year ended June2014-15 2015-16 2016-17
$
0
1000
2000
3000
4000Number
2015-16Year ended June
2016-17
Darwin Katherine Alice Springs Tennant Creek
36 | Power System Review 2016-17
2.10 Issues – retail competitionThe Territory’s regulated electricity industry is designed to be a competitive market, with a number of reforms (past and future) designed to encourage increased retail competition.
However, to date this has resulted in limited competition in both the generation and retail markets.
A number of issues need to be considered when assessing the current level of competition and potential for further competition for electricity customers by retailers and generators in the Territory:
• Is there sufficient numbers of customers for competition and will this provide an efficient cost structure for the industry?
• Is there sufficient competition in the generation market to drive retail competition?
• Are there any regulatory constraints on competition?
2.10.1 Sufficient customer numbers Retailers provide services to customers and generally do not have significant fixed costs or upfront financial requirements. Thus, the entry costs for retailers is relatively low and the size of the retailer can be adjusted according to the retailer’s number of customers.
These factors imply the cost structure of a retailer allows for competition for customers, especially for larger consumers. For example, currently the strongest competition between retailers is for customers consuming greater than 160MWh. The level of competition is expected to increase further with the introduction of a new retailer, Next Business Energy.
The level of competition for these customers illustrates potential for a level of retail competition.
2.10.2 Generation marketThe services retailers provide include billing and connection services, which form a very small component of the customer’s bill (around 4 per cent of the total bill). The retailer also provides a financial service, in that they purchase wholesale (bulk) electricity and on-sell this electricity to customers. That is, they organise and take on the contractual risks with generators and the network providers on behalf of the customers.
While network costs are fixed by the AER and therefore the same for all retailers, the cost of generation is governed by the contractual arrangements between the retailer and generator.
At the moment the bulk of electricity capacity is controlled by TGen. Thus currently retailers that do not have their own generation, have limited options to purchase bulk electricity. However, this is likely to change with the uptake of solar technology and improvements in gas turbine technology.
The size of the power systems in the Territory are very small, which by their nature restricts the size of generators that can be installed. This can inhibit certain types of generators and generally increases costs due to poor economies of scale. However, there is a large number of smaller generators on the market, designed for smaller systems (such as mine sites) and excess gas is available in the Territory (see chapter 7). Additionally, the economies of scale present in gas generation does not appear to be as strong for solar generation as it is more modular, and quicker and cheaper to install, commission and maintain.
Overall Performance and Major Issues | 37
The commission has approved two licences for solar generation and is currently considering a third application. There is clearly interest in installing solar generation in the Territory. Given the current state of the market the commission believes there will be increased competition in the generation market over the next five years.
The commission believes a current restriction on this increased competition is regulatory uncertainty. The major uncertainties are the Territory Government’s current market reforms, implementation of the Roadmap to Renewables’ 50 per cent target, System Control’s introduction of Generation Performance Standards and reforms to the Territory gas markets.
2.10.3 Regulatory constraints (Pricing Order)Government sets the maximum price for all customers consuming less than 750MWh per annum through a Pricing Order and pays an associated community service obligation payment to retailers to fund the gap between the regulated rate and the cost of supply.
There is no information available on how the Government sets the Pricing Order. The commission also understands the Pricing Order is designed to protect customers from high prices.
2.10.4 Regulatory constraints (smart meters)The Retail Supply Code states that a customer requires an interval meter in order to churn. The commission believes this requirement is a major barrier to competition and has proposed removing this requirement in the draft of an updated Retail Supply Code.
Currently, only 6 per cent of customers have the ability to switch retailer without installing a new meter, and based on PWC’s proposal to the AER, it will be around 2027 before 50 per cent of customers have a smart meter and thus would be able to churn.
2.11 Issue – renewable energy 2.11.1 Roadmap to Renewables
In December 2016, the Territory Government announced the establishment of an expert panel to provide advice and develop a Roadmap to Renewables report, which seeks to deliver a target of 50 per cent renewable energy for electricity consumption by 2030. The expert panel reported to the Government in late 2017. Based on this report, the Government is currently developing its implementation plan for this policy.
The commission notes that adding significant amounts of solar energy into the regulated systems will introduce technical challenges to ensure ongoing system security, which may increase overall costs.
While there is the potential for some increased costs, especially in relation to ancillary services, new solar generation in the Territory will potentially give rise to increased generation capacity, investment and diversity of supply. Investment in new large-scale generation will be on the basis of being able to deliver energy at less than current generation costs, potentially decreasing the cost of generation over time. In this situation, some existing higher-cost generation capacity may be retired early as it is displaced by new low-cost generation. Retirement prior to scheduled retirements will have implications for returns to the owner of the assets and impact the reliability assessment. It should be noted this review has assumed no early retirements.
38 | Power System Review 2016-17
Behind the meter and domestic level battery systems will also increase opportunities for consumers to have greater control over their electricity supplies.
It is noted the different regulated systems have different levels of solar PV penetration and weather patterns. It is likely the different regulated systems may require different solutions at different times. This may include different pricing regimes to provide appropriate incentives for customers in the various systems.
The modelling highlights that, with a continuous growth in solar generation, there will likely to be technical issues in a few years in Alice Springs and Tennant Creek. For simplicity, the modelling has assumed that the 50 per cent renewable energy target is achieved on a pro rata basis across the various systems. However, in practice and taking into account the technical issues of each system, it is likely that a more holistic approach will be required to achieve that target.
2.11.2 Integration of renewablesIf left to grow unmanaged, solar generation will detrimentally affect the secure operation of the power system. This is because solar increases variability into the system, and (being asynchronous) does not contribute to system inertia or network strength. If solar replaces synchronous generation, system inertia and network strength is reduced. This is a particularly significant issue when minimum system demand reaches low levels. Integrating renewables therefore requires careful management to ensure system security is maintained.
Note, the role of the distribution network is likely to change in the future under a high level of solar penetration scenario. Traditionally electricity has flowed in one direction from a source of centralised generation to the end user. As the level of residential and commercial PV installations increases, the electricity may start to flow in the reverse direction with some feeders becoming positive. This is likely to lead to issues of voltage management and unforeseen new challenges that will have to be carefully managed.
Managing minimum demandTraditionally, power system modelling has concentrated on maximum demand to ensure sufficient capacity is available. However, now with the increasing levels of asynchronous (solar PV) generation, minimum demand forecasting is a key element.
Issues arise when minimum system demand reaches low levels, in particular when system demand reaches the spinning reserve requirements. The spinning reserve requirement is set because power systems require a minimum level of reserve to provide inertia, control and flexibility to securely operate the system. That is, there always has to be some reserve to cope with normal operational variations and credible events.
Where system demand drops below the minimum level of spinning reserves, System Control may have to constrain the solar generation to ensure sufficient levels of synchronous generation. This is already occurring in South Australia.
It may be possible to lower spinning reserve requirements by installing synchronous condensers or batteries, although this may incur increased system costs.
Other potential solutions include increasing the amount of generation stored, absorbing the generation with resistor banks or changing prices to increase demand when solar output is high, again these may incur additional costs.
Overall Performance and Major Issues | 39
Utility‑scale investmentPossible future large scale investments may include:
• Synchronous condensers that could provide synchronous services such as inertia and system strength, and would potentially allow the minimum synchronous unit requirements3 to be alleviated. If all the required system security services can be delivered from other sources4, this could allow the last remaining gas-fired units to be shut down at these times, providing further ‘headroom’ for the operation of rooftop PV.
• Large-scale storage could assist with absorbing excess rooftop PV generation, for later utilisation. Very large storage capacities would be required if this were pursued as a standalone solution, but as a part of a multi-faceted approach, this may prove cost-effective. Medium-size storage may also arise, especially if community-level solar schemes and trading start to appear.
• Resistor banks could assist with absorbing excess rooftop PV generation at a lower capital cost than energy storage.
• Voltage control equipment could assist with maintaining stable system voltages, alleviating network constraints.
Increasing load to match generationThe potential to shift night-time demand to daylight hours would also provide benefits. Possible opportunities for shifting demand include:
• shifting domestic hot water and pool pump loads to the daytime and negotiating with large electricity users that may have some temporal flexibility (such as utility water pumping loads)
• in the medium term, the rollout of domestic battery systems, home energy management systems, electric vehicles and ‘smart’ appliances could unlock potential for much larger quantities of load shifting, if customers are appropriately incentivised.
If the issues of minimum demand cannot be solved, System Control will be required to have the authority and practical ability to constrain solar systems, large and small. Having feed-in management capabilities would avoid the need for blanket ‘caps’ on PV installation or blanket restrictions on grid feed-in, which have been implemented by international jurisdictions.
A ‘smart’ feed-in management capability would allow the grid feed-in from rooftop PV systems to be constrained by System Control, when required for system security.
It is anticipated that rooftop PV systems would be constrained very rarely (less than 1 per cent of the time), and during the coming decade this will be associated mostly with emergency conditions such as cyclones, bushfires, severe weather and forced outages on network components, all of which cause a need to temporarily reduce network flows.
3 Synchronous unit requirements generally form part of the determination of the required minimum spinning reserve.
4 This scenario would also require frequency control services such as regulation be delivered from other sources, such as utility-scale batteries or orchestrated distributed energy resources.

40 | Power System Review 2016-17
2.11.3 Efficient costsSolving these issues is likely to require additional investment and operating costs. Careful coordination of solutions will be required to ensure an efficient outcome. This will include understanding the trade-offs between GPS and ancillary services.
It will also require intelligent incentives through pricing to ensure stakeholders are held to account for their impacts on the system and face correct pricing signals to ensure appropriate and efficient investment is undertaken by government and the private sector. Over time, households and small commercial consumers should also receive incentives that encourage investment and consumption behaviour to both reduce energy costs and contribute to the overall system efficiency.
The commission will consider the cost trade-offs as part of its assessment of System Control’s proposed GPS. Further, the commission’s 2017-18 Power System Review will examine the most efficient method of meeting system security requirements.

Overall Performance and Major Issues | 41

3| The Northern Territory Power Systems

44 | Power System Review 2016-17
3.1 Regulated power systemsThis Review focuses on the regulated systems, namely the three larger electricity systems operated in the Territory:
• Darwin-Katherine system – the largest system, which supplies Darwin city, Palmerston, suburbs and surrounding areas of Darwin, the township of Katherine and its surrounding rural areas. Katherine is connected to Darwin with a single 132 kilovolt (kV) transmission line (also linking Manton Dam, Batchelor and Pine Creek).
• Alice Springs system – the second largest system, which supplies the township and surrounding rural areas.
• Tennant Creek system – the smallest regulated system, which supplies the township of Tennant Creek and surrounding rural areas.
Other licenced systems and power stations that operate in the Territory but are not included in this review include: EDL NGD (NT) Pty Ltd’s McArthur River Mine; Energy Resources of Australia’s Ranger Uranium Mine (Jabiru); TKLN Solar Pty Ltd’s stations at Ti Tree, Kalkarindji and Alpurrurulam; Groote Eylandt Mining Company’s station at Alyangula; Territory Generation’s (TGen) stations at Yulara and Kings Canyon; Power and Water Corporation’s (PWC) systems at Yulara and Kings Canyon; and stations and systems in communities under the Indigenous Essential Services program, including at Borroloola, Elliott, Daly Waters, Timber Creek, and Ti Tree.
3.2 Overview of how the electricity system worksThe traditional basic process followed by the electricity system is:
• consumers turn on electric devices (that is, change demand)
• generators react to this demand and generate the required level of electricity at the required quality to meet consumers demand
• electricity is transported almost instantaneously across network transmission and distribution power lines (feeders) to the consumer.
Figure 3.1 sets out the basic process. The figure also shows the transformation of the traditional electricity grid to a more complex grid with renewable energy and storage. The grid changes from a one directional flow to a bi-directional flow.
Figure 3.1 A visual representation of a typical power system
Source: Australian Energy Market Commission

The Northern Territory Power System | 45
Further information on each element is set out below.
3.2.1 Types of generationGeneration in the Territory will continue to evolve from its historic reliance on gas and diesel to a more diverse mix including solar and batteries. Recent licence applications received by the commission have included, for the first time, large-scale solar generation in Darwin-Katherine, which will complement the small scale solar systems operated by residential and businesses for own-use consumption.
TGen is currently commissioning its first large-scale battery in Alice Springs and is exploring the benefits of investing in a battery storage system for the Darwin region.
Table 3.1 looks at the capabilities of different types of generation such as impacts on capacity and contributions to minimum standards of performance, and system security such as frequency, inertia and voltage control.
Table 3.1 Generation capabilities
Frequency regulation
Frequency contingency Inertia Capacity Scheduled Voltage Feasible in the NT
Generation technologies
Gas/diesel
Coal X
Solar PV X X X Storage required
Solar thermal Storage required
Wind Some types can provide
Some types can provide
Some types can provide
Storage required X
Geothermal Not investigated
Hydro X
Biofuels and biomass Not investigated
Ancillary service technologies
Batteries Emulated Storage
Flywheels n.a. Emulated Storage n.a.
Chemical storage Varies on design
Varies on design
Varies on design
Storage Varies on design
Not investigated
Synchronous condenser n.a. n.a. n.a. n.a.
n.a.: not applicable
Table 3.1 is a simplistic view of the technologies and does not consider cost effectiveness. It illustrates that the dominate generation in the Territory, gas and diesel, provides the necessary capabilities to operate the system.
The Territory has no coal resources, and poor wind and hydro sources. Not listed is wave or tidal, as these technologies are at the early trial stages in Australia.
Table 3.1 does not quantify that different technologies have different capabilities of service. For example:
• there is emerging evidence that batteries can provide faster and more precise frequency regulation than gas and coal generators
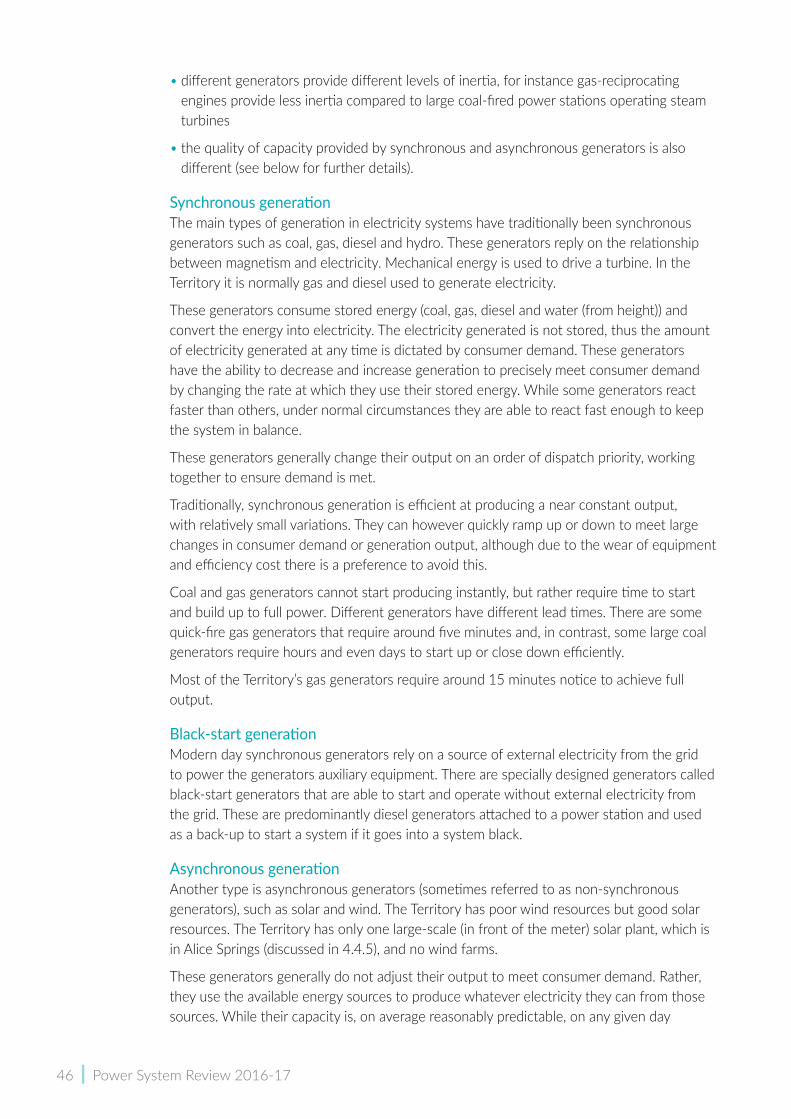
46 | Power System Review 2016-17
• different generators provide different levels of inertia, for instance gas-reciprocating engines provide less inertia compared to large coal-fired power stations operating steam turbines
• the quality of capacity provided by synchronous and asynchronous generators is also different (see below for further details).
Synchronous generationThe main types of generation in electricity systems have traditionally been synchronous generators such as coal, gas, diesel and hydro. These generators reply on the relationship between magnetism and electricity. Mechanical energy is used to drive a turbine. In the Territory it is normally gas and diesel used to generate electricity.
These generators consume stored energy (coal, gas, diesel and water (from height)) and convert the energy into electricity. The electricity generated is not stored, thus the amount of electricity generated at any time is dictated by consumer demand. These generators have the ability to decrease and increase generation to precisely meet consumer demand by changing the rate at which they use their stored energy. While some generators react faster than others, under normal circumstances they are able to react fast enough to keep the system in balance.
These generators generally change their output on an order of dispatch priority, working together to ensure demand is met.
Traditionally, synchronous generation is efficient at producing a near constant output, with relatively small variations. They can however quickly ramp up or down to meet large changes in consumer demand or generation output, although due to the wear of equipment and efficiency cost there is a preference to avoid this.
Coal and gas generators cannot start producing instantly, but rather require time to start and build up to full power. Different generators have different lead times. There are some quick-fire gas generators that require around five minutes and, in contrast, some large coal generators require hours and even days to start up or close down efficiently.
Most of the Territory’s gas generators require around 15 minutes notice to achieve full output.
Black‑start generationModern day synchronous generators rely on a source of external electricity from the grid to power the generators auxiliary equipment. There are specially designed generators called black-start generators that are able to start and operate without external electricity from the grid. These are predominantly diesel generators attached to a power station and used as a back-up to start a system if it goes into a system black.
Asynchronous generation Another type is asynchronous generators (sometimes referred to as non-synchronous generators), such as solar and wind. The Territory has poor wind resources but good solar resources. The Territory has only one large-scale (in front of the meter) solar plant, which is in Alice Springs (discussed in 4.4.5), and no wind farms.
These generators generally do not adjust their output to meet consumer demand. Rather, they use the available energy sources to produce whatever electricity they can from those sources. While their capacity is, on average reasonably predictable, on any given day
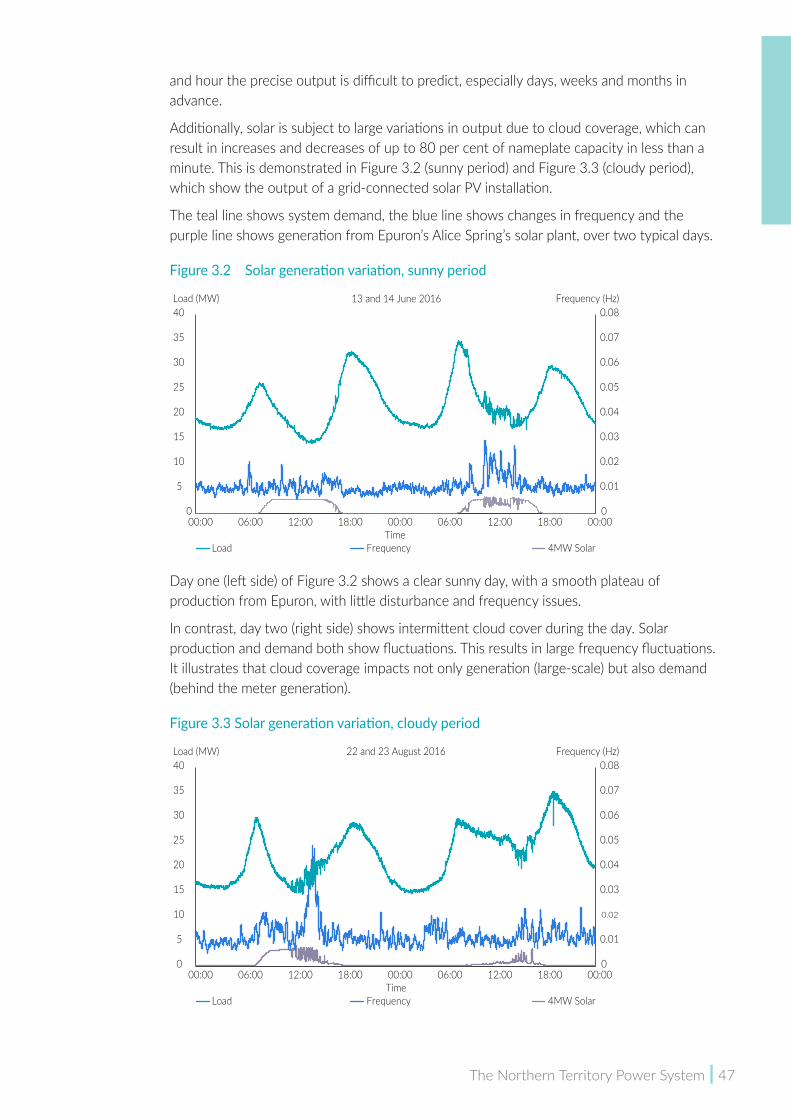
The Northern Territory Power System | 47
and hour the precise output is difficult to predict, especially days, weeks and months in advance.
Additionally, solar is subject to large variations in output due to cloud coverage, which can result in increases and decreases of up to 80 per cent of nameplate capacity in less than a minute. This is demonstrated in Figure 3.2 (sunny period) and Figure 3.3 (cloudy period), which show the output of a grid-connected solar PV installation.
The teal line shows system demand, the blue line shows changes in frequency and the purple line shows generation from Epuron’s Alice Spring’s solar plant, over two typical days.
Figure 3.2 Solar generation variation, sunny period
Day one (left side) of Figure 3.2 shows a clear sunny day, with a smooth plateau of production from Epuron, with little disturbance and frequency issues.
In contrast, day two (right side) shows intermittent cloud cover during the day. Solar production and demand both show fluctuations. This results in large frequency fluctuations. It illustrates that cloud coverage impacts not only generation (large-scale) but also demand (behind the meter generation).
Figure 3.3 Solar generation variation, cloudy period
0
0.01
0.02
0.03
0.04
0.05
0.06
0.07
0.08
0
5
10
15
20
25
30
35
40Frequency (Hz)Load (MW)
Time
13 and 14 June 2016
Load 4MW SolarFrequency
00:00 06:00 12:00 18:00 00:00 06:00 12:00 18:00 00:00
0
0.01
0.03
0.04
0.05
0.06
0.07
0.08
0
5
10
15
20
25
30
35
40
00:00 06:00 12:00 18:00 00:00 06:00 12:00 18:00 00:00
Frequency (Hz)Load (MW)
Time
0.02
22 and 23 August 2016
Load 4MW SolarFrequency

48 | Power System Review 2016-17
In contrast, day one (left side) is partially cloudy in Figure 3.3. The impact on frequency is extreme during the period of cloud coverage. Day two (right side) shows that with heavy cloud coverage, generation can drop to very low levels (purple line). The demand profile is also impacted, with much higher levels of demand during the middle of the day.
At low levels of solar generation, this can be covered by current levels of ancillary services, but as the percentage of solar generation increases, the level and cost of providing ancillary services is likely to increase. Solar requires supplementary technologies, such as batteries and cloud forecasting services to improve its ability to be predictable and stable. For example, cloud forecasting services can allow solar plants to ramp (change) their electricity production in a controlled manner prior to cloud coverage, reducing the impact on the whole system. This technology is not currently employed in the regulated systems.
Without these additional technologies, solar (and wind) can be subjected to constraints (limitations on generation) imposed by the local system controller. For example, on cloudy or patchy days solar generation may be constrained to around 20 per cent of its capacity to avoid large variations in generation during the day, reducing the cost and complexity of providing ancillary services.
The commission notes maximum demand (peak) is generally linked to the hottest (sunniest) days, so solar (in front and behind the meter) does help service this demand and contribute to capacity.
Dispatchable generationDispatchable generation is also referred to as scheduled generation. Dispatchable generation can be planned and its output is controllable. For example, in the National Electricity Market (NEM) scheduled generators have to bid into the market to be dispatched by the Australian Energy Market Operator (AEMO) in accordance with a dispatch schedule. That is, they are required to be able to meet the level of generation they are dispatched at, at each five-minute dispatch interval.
Historically dispatchable generators have been related to synchronous generators as these typically have a controllable fuel source, which means output is controllable and thus dispatchable. These generators have the ability to change their level of generation as required by System Control.
However, asynchronous generators can be dispatchable, particularly where the intermittency in the fuel source is overcome by integrating a storage system into the plant, although the competitiveness of electricity generated depends on the cost of that storage.
BatteriesBatteries generally rely on chemical reactions to generate electricity. These chemical reactions can be reset with electricity (the battery can be recharged). Batteries can consume and generate electricity at very short notice, potentially making them very useful to help deal with supply and demand variations.
TGen’s first large battery system is currently being commissioned in Alice Springs. The purpose of this battery is to provide ancillary services to Alice Springs, noting TGen’s new gas reciprocating engines provide low levels of inertia.

The Northern Territory Power System | 49
3.2.2 Electricity transmissionElectricity is required to be transported to consumers.
Transportation is undertaken in a two-stage process that starts with transmission. Electricity generators are usually located away from where most people live and work. Transmission networks operate at high voltages to deliver electricity over large distances. The high voltage is important as this provides an efficient method of transporting electricity over long distances because higher voltages result in smaller transmission losses.
Transmission networks consist of towers and the wires (also referred to as lines and feeders) that run between them (or underground cables), transformers, switching equipment, reactive power devices, and monitoring and telecommunications equipment.
PWC plans, builds, maintains and operates the transmission network in the Territory. The largest transmission lines are 132kV. As a comparison, nationally lines of this size are classified as distribution feeders. Transmission lines in the NEM are above 220kV.
3.2.3 Electricity distributionThe distribution networks transport electricity from transmission networks to end-use customers. The high voltage electricity used for transmission from the generator is converted into lower voltages by substation transformers. It is then carried by feeders to consumers.
PWC plans, builds, maintains and operates the distribution networks in the Territory. The networks range from 11kV to 66kV lines.
3.3 LicencesThe Electricity Reform Act requires entities wishing to participate in the Territory’s electricity industry to gain a licence, noting there are some exceptions to this requirement.
The commission is responsible for considering licence applications and issuing licences.
Electricity industry participants licensed to operate in the regulated systems at 30 June 2017 are listed in the Appendix. Additionally, for completeness the tables also includes licence holders who provide services outside these three systems and providers who have formal exemptions.
The main licences are:
• generation licences allow the licence holder to generate and sell electricity to retailers
• special licences, such as the independent Power Producers (IPP) licence allows a licence holder to generate electricity but only sell to an entity that holds a full generator licence
• retail licences allow the licence holder to purchase electricity from generators and sell to end-use customers
• network licence allows the licence holder to operate a network (as a monopoly provider)
• System Control licence allows the licence holder to operate the power system.
There are currently five privately owned generation businesses that hold IPP licences and sell electricity through TGen under power purchase agreements. Two operate in the Darwin-Katherine system and one in the Alice Springs system, with the two remaining operating in remote systems. Groote Eylandt Mining Company also holds a special licence that allows it to generate, sell and provide network services at Alyangula.
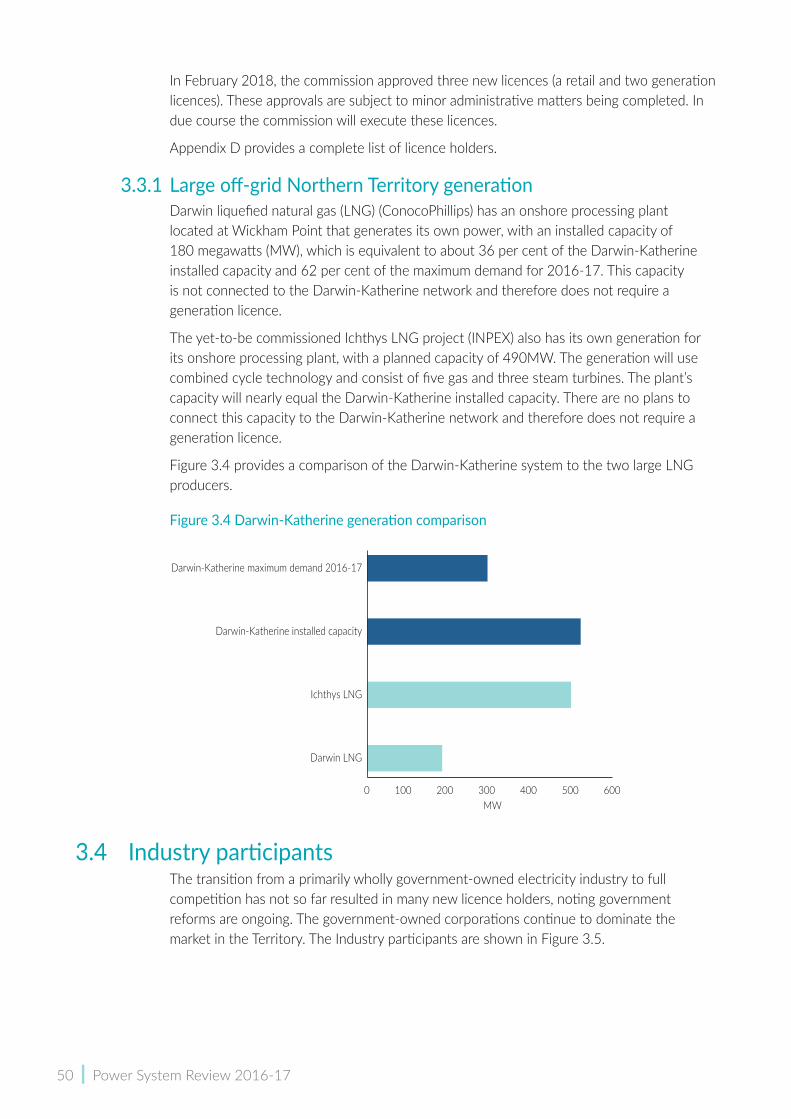
50 | Power System Review 2016-17
In February 2018, the commission approved three new licences (a retail and two generation licences). These approvals are subject to minor administrative matters being completed. In due course the commission will execute these licences.
Appendix D provides a complete list of licence holders.
3.3.1 Large off‑grid Northern Territory generationDarwin liquefied natural gas (LNG) (ConocoPhillips) has an onshore processing plant located at Wickham Point that generates its own power, with an installed capacity of 180 megawatts (MW), which is equivalent to about 36 per cent of the Darwin-Katherine installed capacity and 62 per cent of the maximum demand for 2016-17. This capacity is not connected to the Darwin-Katherine network and therefore does not require a generation licence.
The yet-to-be commissioned Ichthys LNG project (INPEX) also has its own generation for its onshore processing plant, with a planned capacity of 490MW. The generation will use combined cycle technology and consist of five gas and three steam turbines. The plant’s capacity will nearly equal the Darwin-Katherine installed capacity. There are no plans to connect this capacity to the Darwin-Katherine network and therefore does not require a generation licence.
Figure 3.4 provides a comparison of the Darwin-Katherine system to the two large LNG producers.
Figure 3.4 Darwin‑Katherine generation comparison
3.4 Industry participantsThe transition from a primarily wholly government-owned electricity industry to full competition has not so far resulted in many new licence holders, noting government reforms are ongoing. The government-owned corporations continue to dominate the market in the Territory. The Industry participants are shown in Figure 3.5.
0 100 200 300 400 500 600
Darwin LNG
Ichthys LNG
Darwin-Katherine installed capacity
Darwin-Katherine maximum demand 2016-17
MW

The Northern Territory Power System | 51
Figure 3.5 Industry participants
3.4.1 Power and Water Corporation (Networks)PWC is a government owned corporation and is subject to oversight by a shareholding minister (the Treasurer) and portfolio minister (the Minister for Essential Services) under the Government Owned Corporations Act.
PWC is the only major network provider in the Territory, providing services to Darwin-Katherine, Alice Springs, Tennant Creek, Yulara, Kings Canyon and in communities under the Indigenous Essential Services program, including at Borroloola, Elliott, Daly Waters, Timber Creek and Ti Tree.
It is responsible for planning, building and maintaining reliable electricity network grids to transmit electricity between generators and end-use consumers across the Territory.
This includes distributing electricity to an estimated 243 700 people across 1.3 million square kilometres (km), while maintaining 5900km of overhead lines, 3200km of underground cable and 37 500 poles and towers across the Territory.
Electricity network prices are regulated and subject to determinations by the Australian Energy Regulator (AER). The determination process is currently underway, with the next determination to be in place by 1 July 2019, aer.gov.au/networks-pipelines/determinations-access-arrangements/power-and-water-corporation-determination-2019-24.
3.4.2 Power and Water Corporation (System Control)System security requires inertia, system strength, frequency and voltage control. These parameters need to be controlled in narrow ranges to avoid major disruptions to the power supply.

52 | Power System Review 2016-17
System Control is a business unit within PWC. PWC has a licence to monitor and control the operation of the regulated power systems in the Territory to ensure these systems operate reliably, safely and securely. This central coordination is essential because the power system is in a continual state of flux due to changes in consumer behaviour, generators and the environment. The reaction to all of these changes need to be managed.
System Control is responsible for the real time operations, operations planning, power system technical assessments, incident reviews, and operational and technical regulatory reporting. It has responsibility for matching generation supply and customer demand on a day-to-day basis, by directing generators to generate (or restrict generation). The System Controller also currently determines the amount of ancillary services (such as spinning reserve) needed to ensure a secure system. In the NEM, AEMO performs similar functions.
The System Control Licence issued by the Utilities Commission determines PWC’s statutory obligations. Since 27 May 2015, System Control has been performing the trading and dispatch functions of the Interim Northern Territory Electricity Market (INTEM).
System Control is partly funded through a specific charge levied on retailers. This charge is approved by the commission. System Control has recently proposed changes to its current level of charges, which will be considered by the commission over 2018.
3.4.3 Territory GenerationTGen is a government owned corporation and is subject to oversight by a shareholding minister (the Treasurer) and portfolio minister (the Minister for Essential Services) under the Government Owned Corporations Act.
TGen was formerly an operational business unit of PWC but started operations in its own right on 1 July 2014.
TGen is the largest electricity supplier in the Northern Territory, owning around 620MW of installed capacity and contracting around 5MW from IPP for supply to the regulated systems. TGen produces (and contracts) about 1900 gigawatt hours (GWh) of electricity per year using gas, diesel, biomass and solar technologies to power the Territory’s major population centres and towns.
It has facilities in Darwin-Katherine, Alice Springs, Tennant Creek, Yulara and Kings Canyon.
3.4.4 EDLEDL holds generation and retail licences. It currently operates the 27MW gas-fired power station at Pine Creek. EDL previously held an IPP licence but on 30 June 2016 gained a full generation licence. This is the first time EDL has been directly involved in providing information for this review.
3.4.5 EpuronEpuron operates the only large-scale solar plant in the Territory. It is a 4MW plant located in Alice Springs (Uterne Solar power plant). It holds an IPP licence and sells its electricity to TGen. Epuron also provides generation services through its TKLN enterprise at Ti Tree (324kW), Kalkarindji (403kW) and Alpurrurulam (266kW).
Epuron is also part investors, with Island GP, of the proposed Katherine solar plant.
The Northern Territory Power System | 53
3.4.6 Brewer estatesBrewer power station in Alice Springs was operated by Central Power under an IPP licence. IPP licences require the generator to have an arrangement with a fully licenced generator. Central’s arrangement with TGen expired in March 2017. Under the IPP licence, Central Power’s IPP licence subsequently expired.
3.4.7 Jacana EnergyJacana Energy is a government owned corporation and is subject to oversight by a shareholding minister (the Treasurer) and portfolio minister (the Minister for Essential Services) under the Government Owned Corporations Act.
Jacana was formerly an operational business unit of PWC but commenced operations in its own right on 1 July 2014.
As the Territory’s largest electricity retailer (it has the vast majority of customers in the regulated systems), Jacana provides electricity retail services for residential, small and large commercial customers throughout the urban, rural and remote (excluding Indigenous Essential Services) areas. Jacana is the principle interface with customers.
Jacana’s role is to look after its customer’s electricity needs and act as first point of contact for any electricity matters. Jacana purchases electricity in bulk from generators and turns this into a range of retail products, facilitates connection of its customers to the grid, delivers billing and payment facilities, and customer service to meet customer needs.
3.4.8 Other retailersThere are a small number of privately owned retailers in the Territory; EDL, QEnergy Limited, ERM Power Retail Pty Ltd and Rimfire Energy.
Rimfire Energy is the most active of these retailers. Rimfire has been operating as a retailer in the Territory since gaining a retail licence on 11 August 2014. Rimfire’s customers are generally large-scale consumers. It has customers across the three regulated systems.
Batchelor Solar Farm Pty Ltd (Rimfire) is currently applying for a generation licence linked to a proposed solar plant at Batchelor.
Next Business Energy’s retail licence was recently approved by the commission. This licence will be executed in 2018.
3.5 DemandTable 3.2 shows demand ranges and the load factor (average divided by maximum) for each system. To benchmark the Territory regions, values for South Australia, Cairns and New South Wales are also presented.
Table 3.2 shows Darwin-Katherine is the largest system in the Territory and experienced a maximum system demand of 289MW in 2016-17. Demand in Darwin-Katherine is comparable to demand in greater Cairns.
The two smaller systems, Alice Springs and Tennant Creek, experienced maximum demands of 52MW and 6.8MW, respectively. All Territory systems experience demand much lower than NEM regions, particularly New South Wales, the largest region in the NEM in terms of demand. This leads to different issues faced by the Territory power systems, including those related to diversity and number of generation sources, and lower demand levels and customer base.
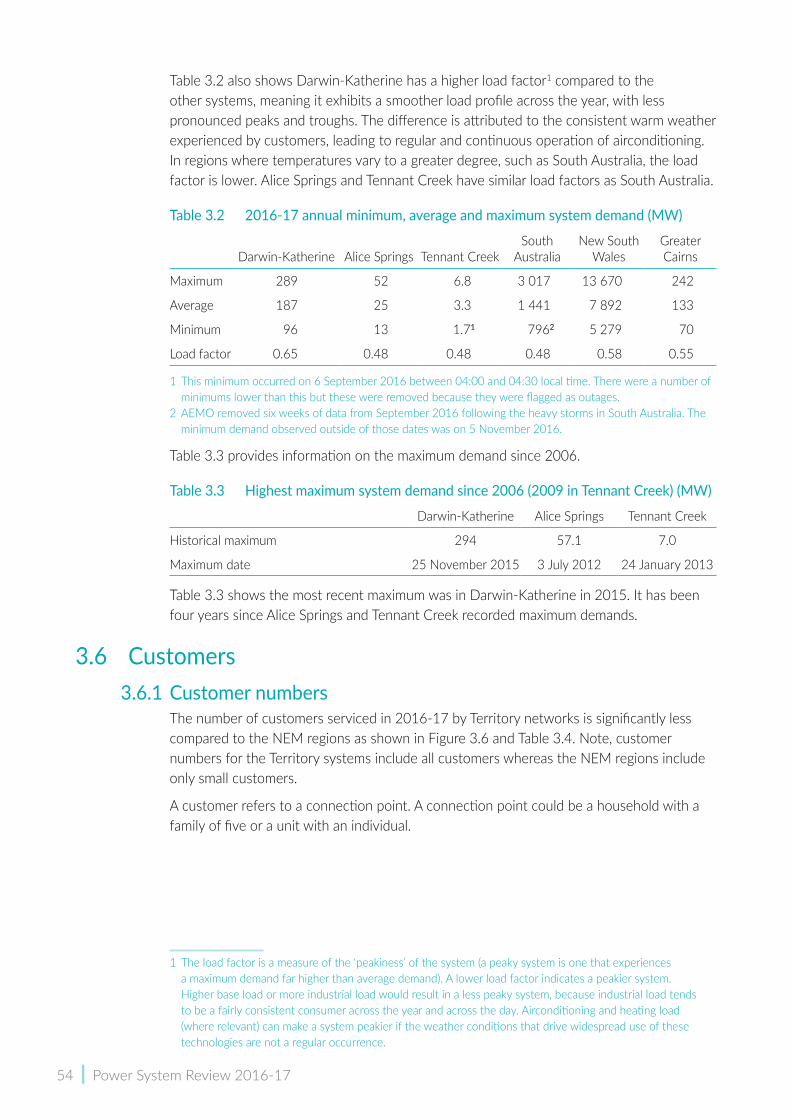
54 | Power System Review 2016-17
Table 3.2 also shows Darwin-Katherine has a higher load factor1 compared to the other systems, meaning it exhibits a smoother load profile across the year, with less pronounced peaks and troughs. The difference is attributed to the consistent warm weather experienced by customers, leading to regular and continuous operation of airconditioning. In regions where temperatures vary to a greater degree, such as South Australia, the load factor is lower. Alice Springs and Tennant Creek have similar load factors as South Australia.
Table 3.2 2016‑17 annual minimum, average and maximum system demand (MW)
Darwin-Katherine Alice Springs Tennant CreekSouth
AustraliaNew South
WalesGreater Cairns
Maximum 289 52 6.8 3 017 13 670 242
Average 187 25 3.3 1 441 7 892 133
Minimum 96 13 1.71 7962 5 279 70
Load factor 0.65 0.48 0.48 0.48 0.58 0.55
1 This minimum occurred on 6 September 2016 between 04:00 and 04:30 local time. There were a number of minimums lower than this but these were removed because they were flagged as outages.
2 AEMO removed six weeks of data from September 2016 following the heavy storms in South Australia. The minimum demand observed outside of those dates was on 5 November 2016.
Table 3.3 provides information on the maximum demand since 2006.
Table 3.3 Highest maximum system demand since 2006 (2009 in Tennant Creek) (MW)
Darwin-Katherine Alice Springs Tennant Creek
Historical maximum 294 57.1 7.0
Maximum date 25 November 2015 3 July 2012 24 January 2013
Table 3.3 shows the most recent maximum was in Darwin-Katherine in 2015. It has been four years since Alice Springs and Tennant Creek recorded maximum demands.
3.6 Customers 3.6.1 Customer numbers
The number of customers serviced in 2016-17 by Territory networks is significantly less compared to the NEM regions as shown in Figure 3.6 and Table 3.4. Note, customer numbers for the Territory systems include all customers whereas the NEM regions include only small customers.
A customer refers to a connection point. A connection point could be a household with a family of five or a unit with an individual.
1 The load factor is a measure of the ‘peakiness’ of the system (a peaky system is one that experiences a maximum demand far higher than average demand). A lower load factor indicates a peakier system. Higher base load or more industrial load would result in a less peaky system, because industrial load tends to be a fairly consistent consumer across the year and across the day. Airconditioning and heating load (where relevant) can make a system peakier if the weather conditions that drive widespread use of these technologies are not a regular occurrence.
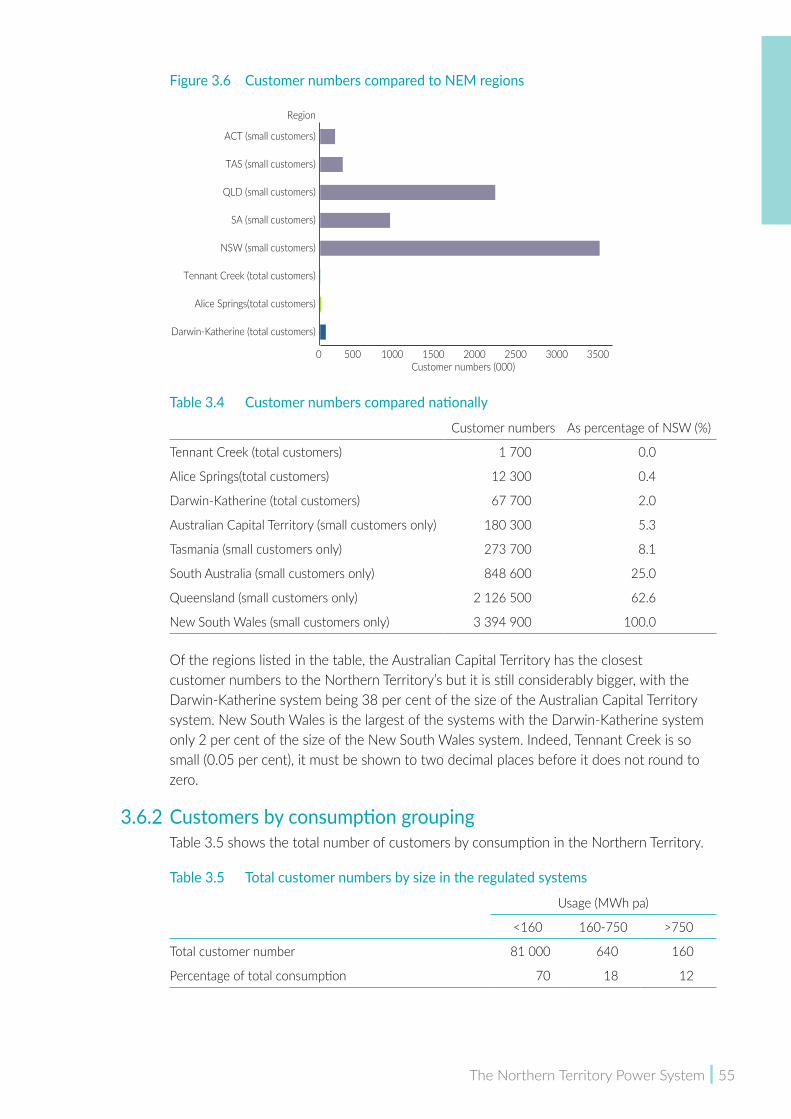
The Northern Territory Power System | 55
Figure 3.6 Customer numbers compared to NEM regions
Table 3.4 Customer numbers compared nationally
Customer numbers As percentage of NSW (%)
Tennant Creek (total customers) 1 700 0.0
Alice Springs(total customers) 12 300 0.4
Darwin-Katherine (total customers) 67 700 2.0
Australian Capital Territory (small customers only) 180 300 5.3
Tasmania (small customers only) 273 700 8.1
South Australia (small customers only) 848 600 25.0
Queensland (small customers only) 2 126 500 62.6
New South Wales (small customers only) 3 394 900 100.0
Of the regions listed in the table, the Australian Capital Territory has the closest customer numbers to the Northern Territory’s but it is still considerably bigger, with the Darwin-Katherine system being 38 per cent of the size of the Australian Capital Territory system. New South Wales is the largest of the systems with the Darwin-Katherine system only 2 per cent of the size of the New South Wales system. Indeed, Tennant Creek is so small (0.05 per cent), it must be shown to two decimal places before it does not round to zero.
3.6.2 Customers by consumption groupingTable 3.5 shows the total number of customers by consumption in the Northern Territory.
Table 3.5 Total customer numbers by size in the regulated systems
Usage (MWh pa)
<160 160-750 >750
Total customer number 81 000 640 160
Percentage of total consumption 70 18 12
0 500 1000 1500 2000 2500 3000 3500
Darwin-Katherine (total customers)
Alice Springs(total customers)
Tennant Creek (total customers)
NSW (small customers)
SA (small customers)
QLD (small customers)
TAS (small customers)
ACT (small customers)
Customer numbers (000)
Region
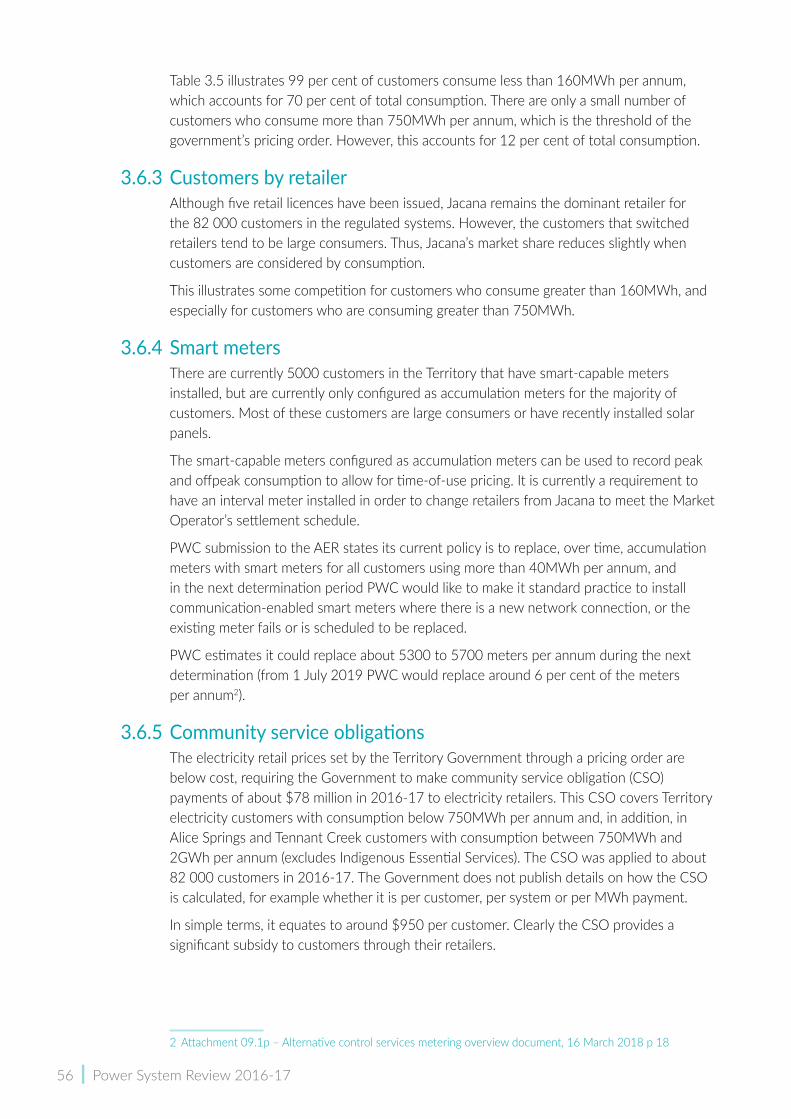
56 | Power System Review 2016-17
Table 3.5 illustrates 99 per cent of customers consume less than 160MWh per annum, which accounts for 70 per cent of total consumption. There are only a small number of customers who consume more than 750MWh per annum, which is the threshold of the government’s pricing order. However, this accounts for 12 per cent of total consumption.
3.6.3 Customers by retailerAlthough five retail licences have been issued, Jacana remains the dominant retailer for the 82 000 customers in the regulated systems. However, the customers that switched retailers tend to be large consumers. Thus, Jacana’s market share reduces slightly when customers are considered by consumption.
This illustrates some competition for customers who consume greater than 160MWh, and especially for customers who are consuming greater than 750MWh.
3.6.4 Smart metersThere are currently 5000 customers in the Territory that have smart-capable meters installed, but are currently only configured as accumulation meters for the majority of customers. Most of these customers are large consumers or have recently installed solar panels.
The smart-capable meters configured as accumulation meters can be used to record peak and offpeak consumption to allow for time-of-use pricing. It is currently a requirement to have an interval meter installed in order to change retailers from Jacana to meet the Market Operator’s settlement schedule.
PWC submission to the AER states its current policy is to replace, over time, accumulation meters with smart meters for all customers using more than 40MWh per annum, and in the next determination period PWC would like to make it standard practice to install communication-enabled smart meters where there is a new network connection, or the existing meter fails or is scheduled to be replaced.
PWC estimates it could replace about 5300 to 5700 meters per annum during the next determination (from 1 July 2019 PWC would replace around 6 per cent of the meters per annum2).
3.6.5 Community service obligationsThe electricity retail prices set by the Territory Government through a pricing order are below cost, requiring the Government to make community service obligation (CSO) payments of about $78 million in 2016-17 to electricity retailers. This CSO covers Territory electricity customers with consumption below 750MWh per annum and, in addition, in Alice Springs and Tennant Creek customers with consumption between 750MWh and 2GWh per annum (excludes Indigenous Essential Services). The CSO was applied to about 82 000 customers in 2016-17. The Government does not publish details on how the CSO is calculated, for example whether it is per customer, per system or per MWh payment.
In simple terms, it equates to around $950 per customer. Clearly the CSO provides a significant subsidy to customers through their retailers.
2 Attachment 09.1p – Alternative control services metering overview document, 16 March 2018 p 18

The Northern Territory Power System | 57
3.7 Network sizeThe Territory has low customer and load density. The low load density and wide geographical spread of customer impacts on network topography, with much of the transmission and distribution network characterised by long radial (single) lines.
Table 3.6 shows the networks size for the Northern Territory, South Australia, Tasmania and the Australian Capital Territory, noting networks owned by network providers in the NEM form part of a single interconnected electricity system.
Table 3.6 Network size compared to customer numbers
Lines (km) Customers per km Customer numbers
Northern Territory 9 000 9 82 000
SA Networks 88 000 10 849 000
TasNetworks 26 000 11 274 000
NSW 296 000 11 3 395 000
Evoenergy (ACT) 5 000 35 180 000
The size of the Territory network in terms of kilometres of line is relatively large for the small number of customers and capacity. SA Networks is most comparable in terms of customers per kilometre of line.
3.8 Regulation of the power system3.8.1 Past reform
In 2000, the Territory Government introduced a third-party access regime for electricity networks, removed legislative restrictions on competition in the retail and generation sectors and established the Utilities Commission as an independent industry regulator. From July 2002, the Power and Water Authority was corporatised as PWC.
A staged approach to retail contestability was adopted. Market access was allowed initially for supply of customers using above 4GWh per annum with the intention, eventually, of all electricity customers being contestable. Prices for non-contestable customers would be set through a Pricing Order issued by the Territory Government. In 2010 retail contestability was extended to customers at all consumption levels.
However, maximum retail prices for customers with annual electricity consumption less than 750MWh continue to be set by the Territory Government through an Electricity Pricing Order and currently maximum prices are below cost.
3.8.2 More recent reforms Additional reforms have been developed and implemented in recent years.
The Territory Government adopted the national electricity regulatory framework (the National Electricity Law (NEL) and National Electricity Rules (NER)) on 1 July 2016, and is applying the NER in a phased approach with amendments to make it appropriate for the Territory’s circumstances. This includes adopting many national electricity arrangements, including oversight and input from the national regulatory institutions, namely the AER and the Australian Energy Market Commission, and receiving advice and information from AEMO on an as-needed basis. The commission supports this policy direction, with appropriate adjustments to suit the unique features of the Territory’s system.
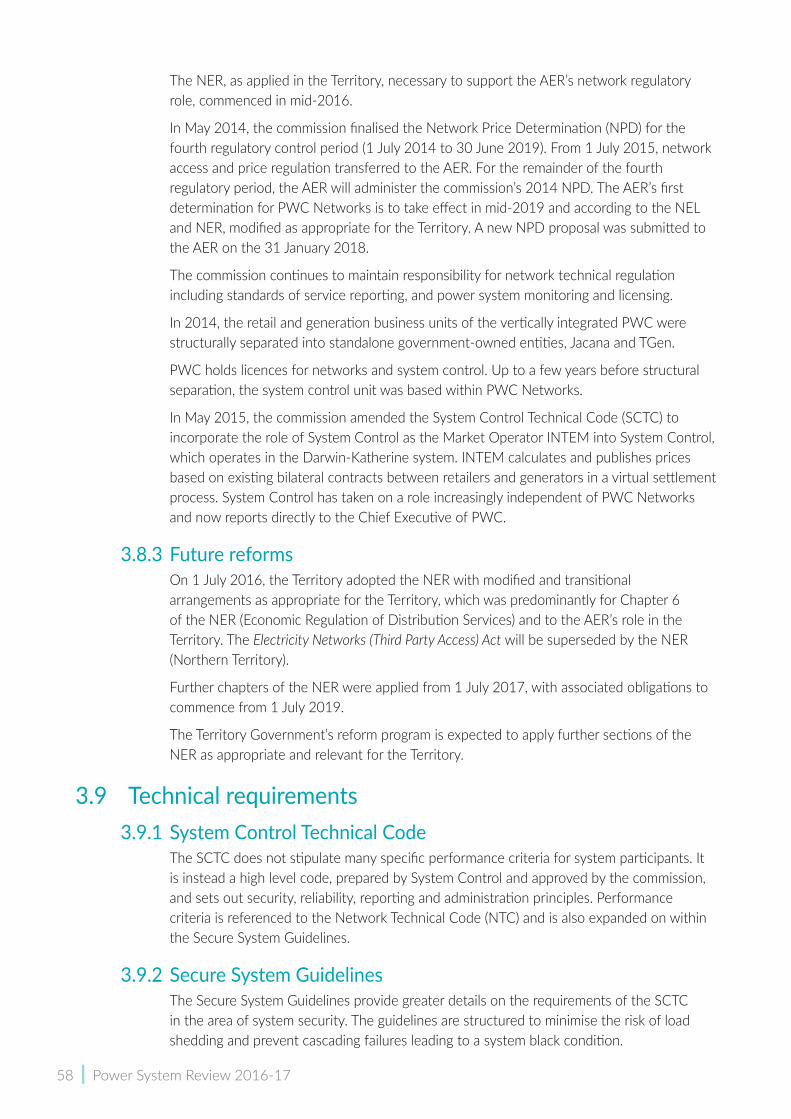
58 | Power System Review 2016-17
The NER, as applied in the Territory, necessary to support the AER’s network regulatory role, commenced in mid-2016.
In May 2014, the commission finalised the Network Price Determination (NPD) for the fourth regulatory control period (1 July 2014 to 30 June 2019). From 1 July 2015, network access and price regulation transferred to the AER. For the remainder of the fourth regulatory period, the AER will administer the commission’s 2014 NPD. The AER’s first determination for PWC Networks is to take effect in mid-2019 and according to the NEL and NER, modified as appropriate for the Territory. A new NPD proposal was submitted to the AER on the 31 January 2018.
The commission continues to maintain responsibility for network technical regulation including standards of service reporting, and power system monitoring and licensing.
In 2014, the retail and generation business units of the vertically integrated PWC were structurally separated into standalone government-owned entities, Jacana and TGen.
PWC holds licences for networks and system control. Up to a few years before structural separation, the system control unit was based within PWC Networks.
In May 2015, the commission amended the System Control Technical Code (SCTC) to incorporate the role of System Control as the Market Operator INTEM into System Control, which operates in the Darwin-Katherine system. INTEM calculates and publishes prices based on existing bilateral contracts between retailers and generators in a virtual settlement process. System Control has taken on a role increasingly independent of PWC Networks and now reports directly to the Chief Executive of PWC.
3.8.3 Future reforms On 1 July 2016, the Territory adopted the NER with modified and transitional arrangements as appropriate for the Territory, which was predominantly for Chapter 6 of the NER (Economic Regulation of Distribution Services) and to the AER’s role in the Territory. The Electricity Networks (Third Party Access) Act will be superseded by the NER (Northern Territory).
Further chapters of the NER were applied from 1 July 2017, with associated obligations to commence from 1 July 2019.
The Territory Government’s reform program is expected to apply further sections of the NER as appropriate and relevant for the Territory.
3.9 Technical requirements3.9.1 System Control Technical Code
The SCTC does not stipulate many specific performance criteria for system participants. It is instead a high level code, prepared by System Control and approved by the commission, and sets out security, reliability, reporting and administration principles. Performance criteria is referenced to the Network Technical Code (NTC) and is also expanded on within the Secure System Guidelines.
3.9.2 Secure System GuidelinesThe Secure System Guidelines provide greater details on the requirements of the SCTC in the area of system security. The guidelines are structured to minimise the risk of load shedding and prevent cascading failures leading to a system black condition.
The Northern Territory Power System | 59
The guidelines set out standards regarding factors such as contingency events, frequency control, spinning reserve policy, under frequency load shedding policy and voltage levels. Lack of standby generation, fuel alert and loss of reactive power reserve levels are also defined in the guidelines.
3.9.3 Draft Generation Performance StandardsIn response to the increased interest in large-scale solar generation in the Territory, System Control is seeking to review and amend technical requirements regarding Generation Performance Standards (GPS). The GPS are to account for the introduction of new forms of asynchronous generation and the fact that the SCTC and NTC primarily relate to the management of dispatchable synchronous sources of generation. The aim of the proposed GPS is to ensure system security and reliability is maintained as the mix of generation changes.
System Control, as part of its submission on recent generation licence applications, has submitted preliminary GPS. The review will not only consider the level of performance required by generators but will also consider the most appropriate regulatory instrument to amend.
The preliminary GPS was based on the NTC, SCTC and current reforms to the NER. In some areas the standards expand and adapt on current requirements to be more suitable for the Territory networks. The more important changes relate to active power control, frequency control and inertia.
3.9.4 Cost trade‑offThere is a cost trade-off relating to the level of services (and risks) provided and the cost charged to customers.
A large percentage of a consumers’ bills goes towards generation and network services. The level of service and risks targeted by the industry will directly change the short term and longer term operational costs and investment decisions.
For example, generators operate most efficiently when they operate near capacity. However, System Control requires TGen to provide spinning reserve. Spinning reserve is created when a generator operates below capacity and therefore has the capacity to quickly ramp up to compensate for large changes. However, operating below efficient levels results in higher per MW costs for the generator, since more generators are required to be dispatched for the same net output.
Generally, spinning reserve is put in place to cover for another generator tripping (that is, a contingency event) and the system losing significant generation output.
The higher the level of spinning reserve in the system, the higher the likelihood that in case of a contingency event, the system will be able to ride through (recover) from the event without interruptions to the customer. However, this comes at a cost and consumers ultimately pay.
Through its governance role in relation to the technical requirements discussed above, the commission plays an important role in assessing this trade-off between costs, security, reliability and protecting the long-term interests of consumers. This governance role is likely to become increasingly important as the various aspects of technical regulation are reviewed to accommodate increased penetration of new forms of generation while maintaining security and reliability at the lowest possible cost.


4| Darwin‑Katherine Performance
62 | Power System Review 2016-17
4.1 Introduction The Darwin-Katherine power system is the largest of the three regulated power systems in the Northern Territory. It supplies Darwin city, Palmerston, suburbs and surrounding areas of Darwin, the township of Katherine and its surrounding rural areas.
Figure 4.1 illustrates the Darwin-Katherine power system, with the lines in red, that is, lines from Katherine to Channel Island and Channel Island to Hudson Creek are the only transmission lines in this system. A 132 kilovolt (kV) double circuit overhead transmission line connects Channel Island power station to Hudson Creek terminal station, which serves the Darwin area. This system has a single 132kV overhead transmission line (around 300 kilometres (km)) from Channel Island to Katherine with three connection points in between at Manton, Bachelor and Pine Creek.
The total generation capacity in the system is over 500 megawatts (MW) and the fuel type of the generation units is made up of dual fuel (gas/diesel), gas only, heat recovery steam and landfill gas. The operational maximum demand in 2016-17 was 290MW. The generation plants in the Darwin-Katherine network are Territory Generation’s (TGen) power stations at Channel Island (310MW), Weddell (129MW), Katherine (35MW), plus EDL’s Pine Creek power station (27MW) and the Shoal Bay landfill gas generator (1.1MW).
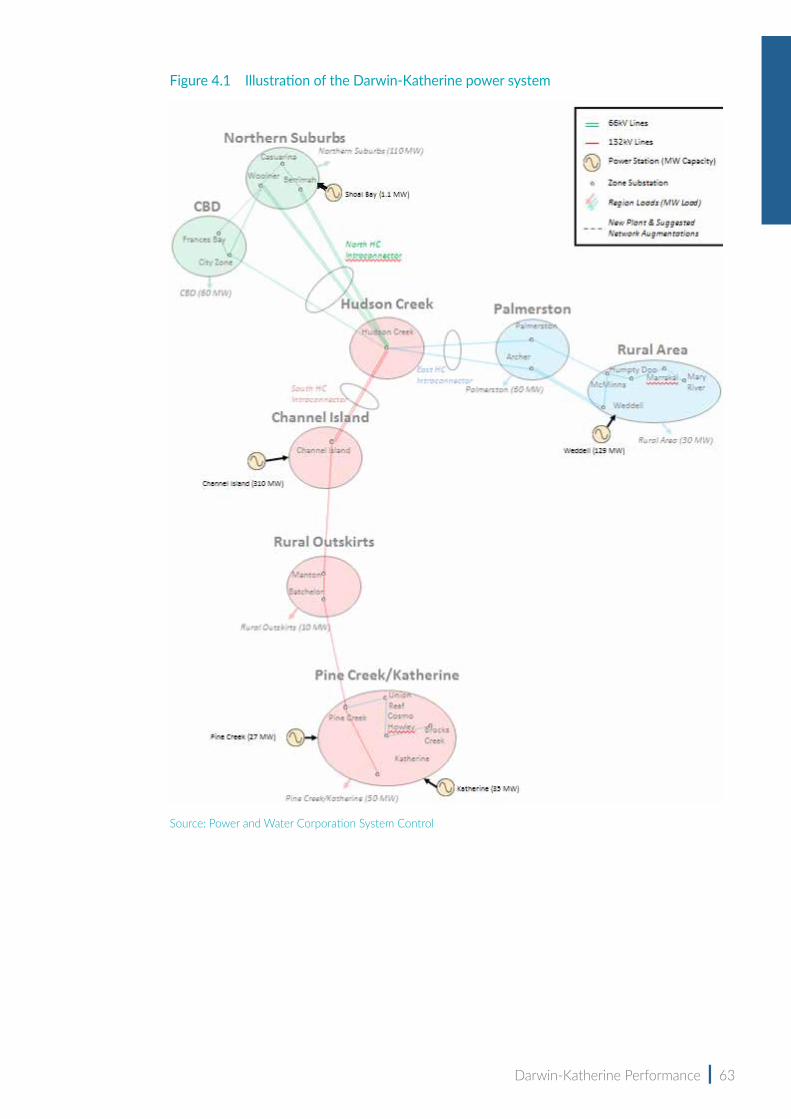
Darwin-Katherine Performance | 63
Figure 4.1 Illustration of the Darwin‑Katherine power system
Source: Power and Water Corporation System Control
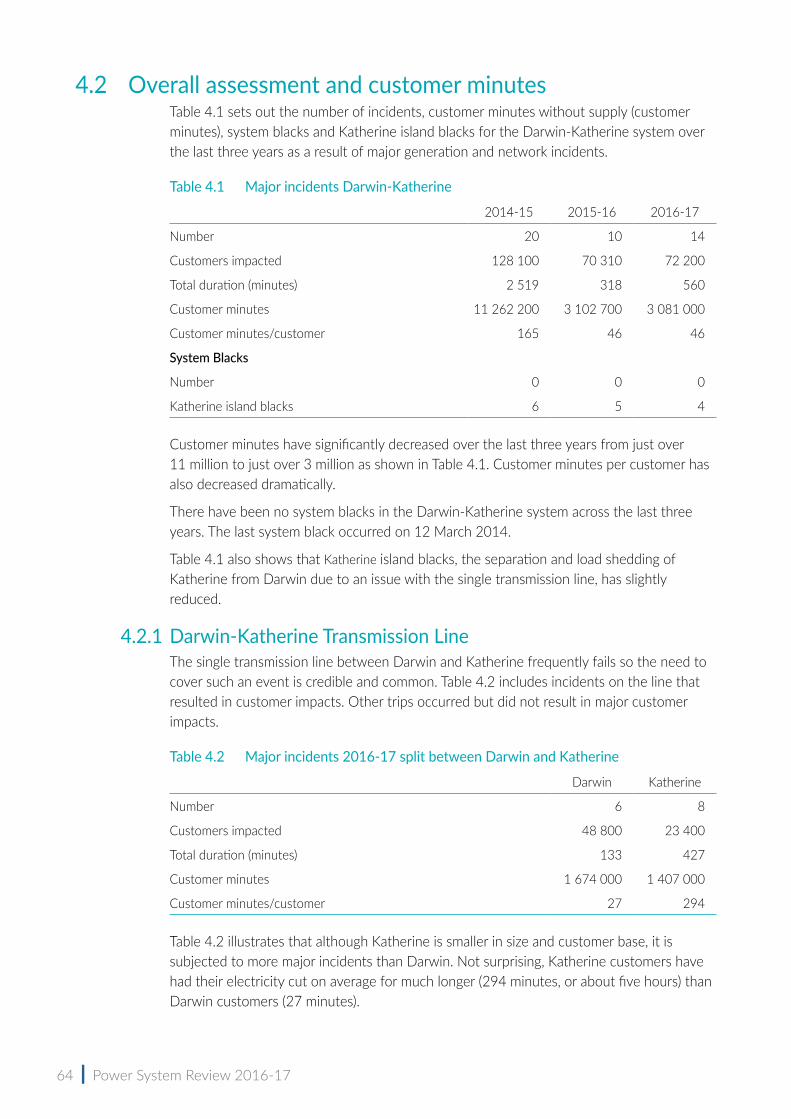
64 | Power System Review 2016-17
4.2 Overall assessment and customer minutesTable 4.1 sets out the number of incidents, customer minutes without supply (customer minutes), system blacks and Katherine island blacks for the Darwin-Katherine system over the last three years as a result of major generation and network incidents.
Table 4.1 Major incidents Darwin‑Katherine
2014-15 2015-16 2016-17
Number 20 10 14
Customers impacted 128 100 70 310 72 200
Total duration (minutes) 2 519 318 560
Customer minutes 11 262 200 3 102 700 3 081 000
Customer minutes/customer 165 46 46
System Blacks
Number 0 0 0
Katherine island blacks 6 5 4
Customer minutes have significantly decreased over the last three years from just over 11 million to just over 3 million as shown in Table 4.1. Customer minutes per customer has also decreased dramatically.
There have been no system blacks in the Darwin-Katherine system across the last three years. The last system black occurred on 12 March 2014.
Table 4.1 also shows that Katherine island blacks, the separation and load shedding of Katherine from Darwin due to an issue with the single transmission line, has slightly reduced.
4.2.1 Darwin‑Katherine Transmission LineThe single transmission line between Darwin and Katherine frequently fails so the need to cover such an event is credible and common. Table 4.2 includes incidents on the line that resulted in customer impacts. Other trips occurred but did not result in major customer impacts.
Table 4.2 Major incidents 2016‑17 split between Darwin and Katherine
Darwin Katherine
Number 6 8
Customers impacted 48 800 23 400
Total duration (minutes) 133 427
Customer minutes 1 674 000 1 407 000
Customer minutes/customer 27 294
Table 4.2 illustrates that although Katherine is smaller in size and customer base, it is subjected to more major incidents than Darwin. Not surprising, Katherine customers have had their electricity cut on average for much longer (294 minutes, or about five hours) than Darwin customers (27 minutes).
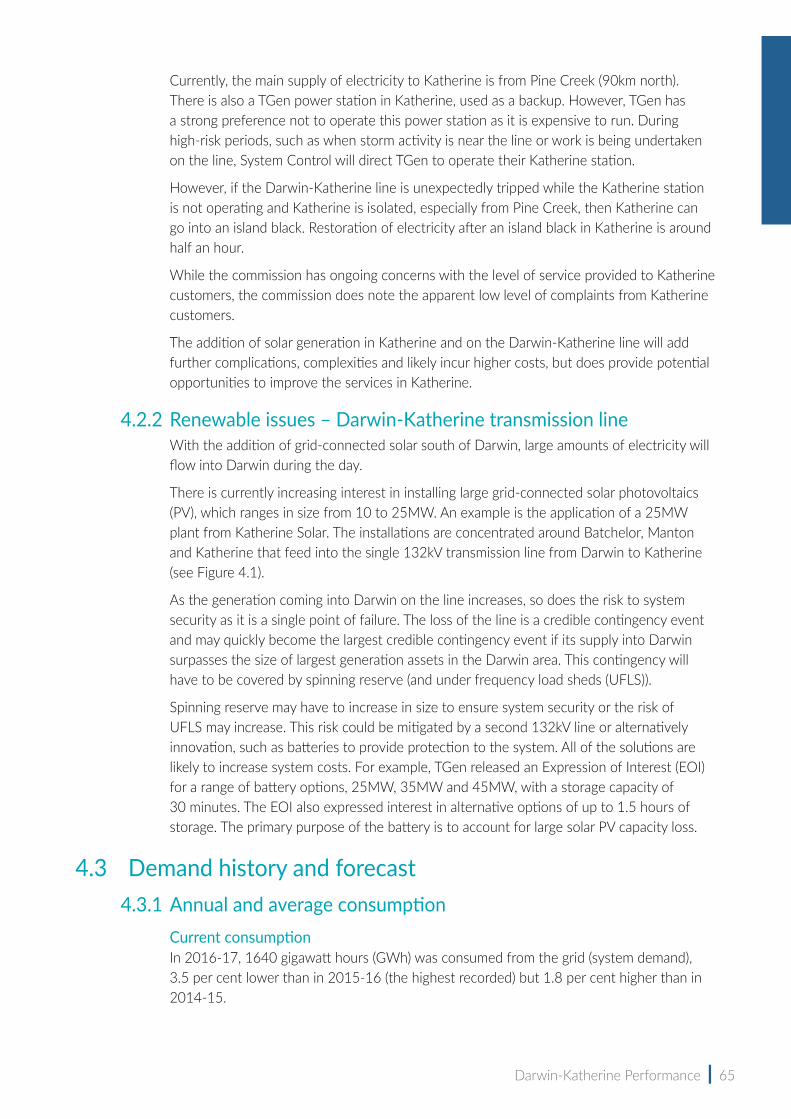
Darwin-Katherine Performance | 65
Currently, the main supply of electricity to Katherine is from Pine Creek (90km north). There is also a TGen power station in Katherine, used as a backup. However, TGen has a strong preference not to operate this power station as it is expensive to run. During high-risk periods, such as when storm activity is near the line or work is being undertaken on the line, System Control will direct TGen to operate their Katherine station.
However, if the Darwin-Katherine line is unexpectedly tripped while the Katherine station is not operating and Katherine is isolated, especially from Pine Creek, then Katherine can go into an island black. Restoration of electricity after an island black in Katherine is around half an hour.
While the commission has ongoing concerns with the level of service provided to Katherine customers, the commission does note the apparent low level of complaints from Katherine customers.
The addition of solar generation in Katherine and on the Darwin-Katherine line will add further complications, complexities and likely incur higher costs, but does provide potential opportunities to improve the services in Katherine.
4.2.2 Renewable issues – Darwin‑Katherine transmission lineWith the addition of grid-connected solar south of Darwin, large amounts of electricity will flow into Darwin during the day.
There is currently increasing interest in installing large grid-connected solar photovoltaics (PV), which ranges in size from 10 to 25MW. An example is the application of a 25MW plant from Katherine Solar. The installations are concentrated around Batchelor, Manton and Katherine that feed into the single 132kV transmission line from Darwin to Katherine (see Figure 4.1).
As the generation coming into Darwin on the line increases, so does the risk to system security as it is a single point of failure. The loss of the line is a credible contingency event and may quickly become the largest credible contingency event if its supply into Darwin surpasses the size of largest generation assets in the Darwin area. This contingency will have to be covered by spinning reserve (and under frequency load sheds (UFLS)).
Spinning reserve may have to increase in size to ensure system security or the risk of UFLS may increase. This risk could be mitigated by a second 132kV line or alternatively innovation, such as batteries to provide protection to the system. All of the solutions are likely to increase system costs. For example, TGen released an Expression of Interest (EOI) for a range of battery options, 25MW, 35MW and 45MW, with a storage capacity of 30 minutes. The EOI also expressed interest in alternative options of up to 1.5 hours of storage. The primary purpose of the battery is to account for large solar PV capacity loss.
4.3 Demand history and forecast4.3.1 Annual and average consumption
Current consumptionIn 2016-17, 1640 gigawatt hours (GWh) was consumed from the grid (system demand), 3.5 per cent lower than in 2015-16 (the highest recorded) but 1.8 per cent higher than in 2014-15.
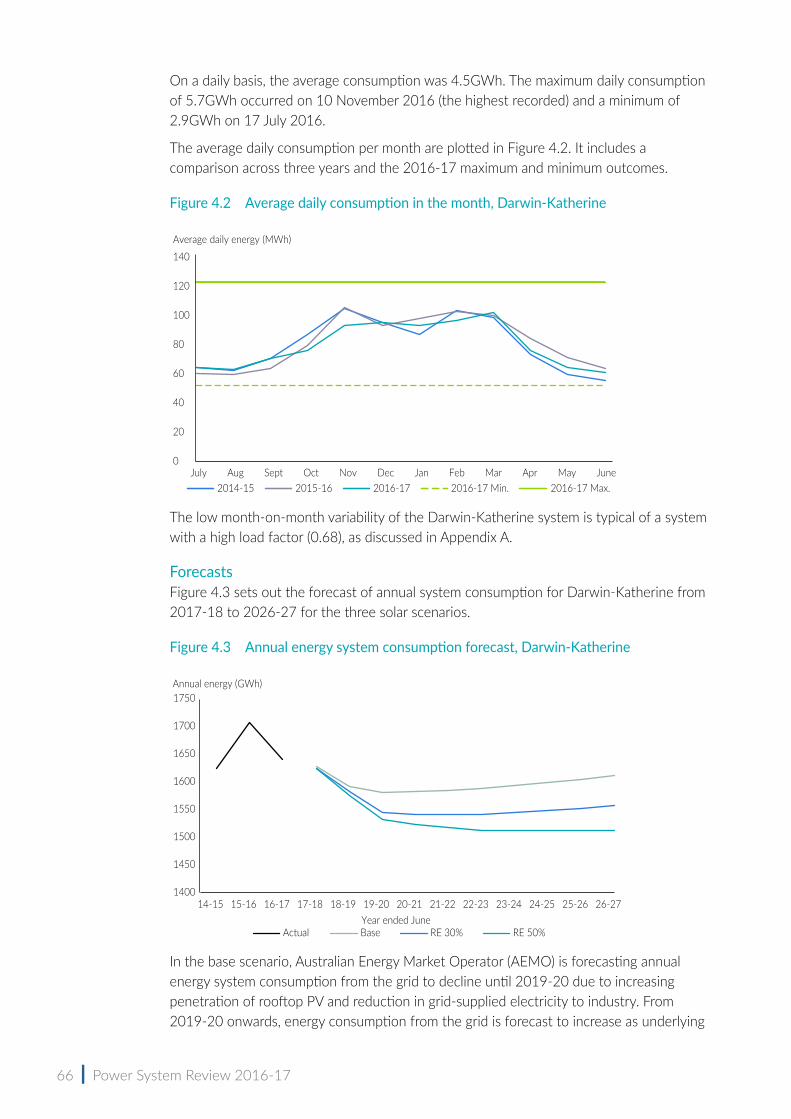
66 | Power System Review 2016-17
On a daily basis, the average consumption was 4.5GWh. The maximum daily consumption of 5.7GWh occurred on 10 November 2016 (the highest recorded) and a minimum of 2.9GWh on 17 July 2016.
The average daily consumption per month are plotted in Figure 4.2. It includes a comparison across three years and the 2016-17 maximum and minimum outcomes.
Figure 4.2 Average daily consumption in the month, Darwin‑Katherine
The low month-on-month variability of the Darwin-Katherine system is typical of a system with a high load factor (0.68), as discussed in Appendix A.
ForecastsFigure 4.3 sets out the forecast of annual system consumption for Darwin-Katherine from 2017-18 to 2026-27 for the three solar scenarios.
Figure 4.3 Annual energy system consumption forecast, Darwin‑Katherine
In the base scenario, Australian Energy Market Operator (AEMO) is forecasting annual energy system consumption from the grid to decline until 2019-20 due to increasing penetration of rooftop PV and reduction in grid-supplied electricity to industry. From 2019-20 onwards, energy consumption from the grid is forecast to increase as underlying
0
20
40
60
80
100
120
140
July Aug Sept Oct Nov Dec Jan Feb Mar Apr May June
Average daily energy (MWh)
2014-15 2015-16 2016-17 2016-17 Min. 2016-17 Max.
1400
1450
1500
1550
1600
1650
1700
1750
14-15 15-16 16-17 17-18 18-19 19-20 20-21 21-22 22-23 23-24 24-25 25-26 26-27Year ended June
Actual RE 50%RE 30%Base
Annual energy (GWh)
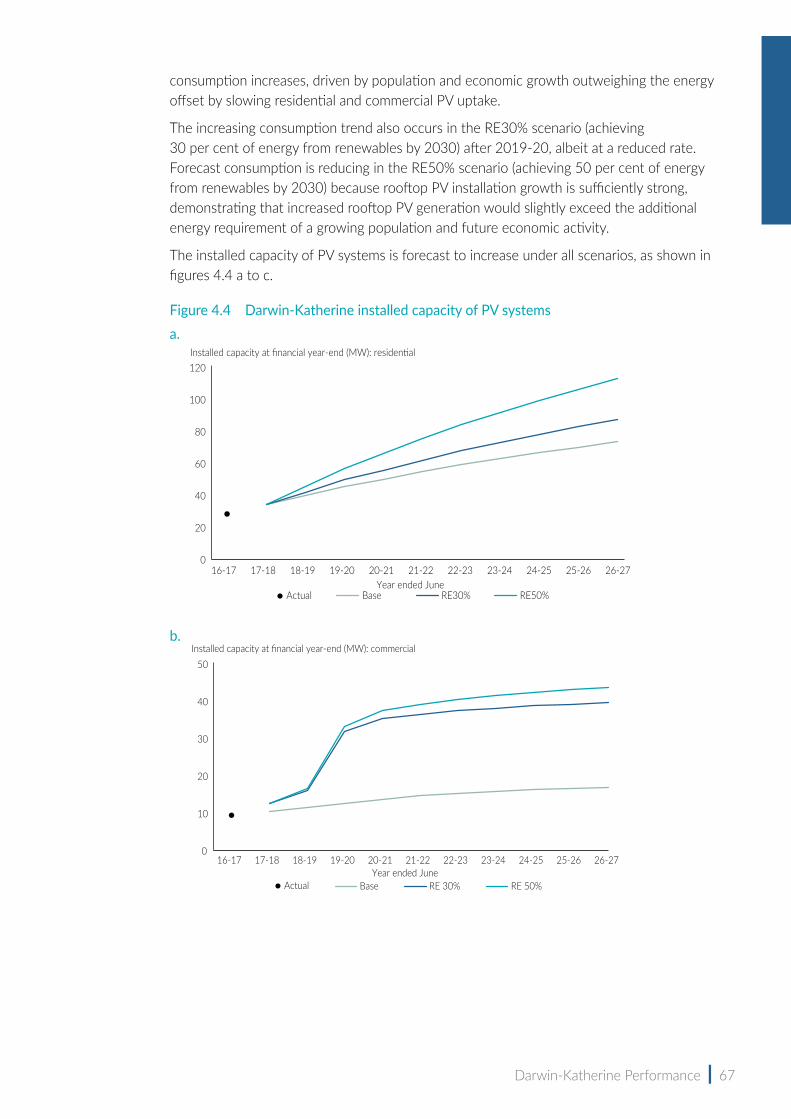
Darwin-Katherine Performance | 67
consumption increases, driven by population and economic growth outweighing the energy offset by slowing residential and commercial PV uptake.
The increasing consumption trend also occurs in the RE30% scenario (achieving 30 per cent of energy from renewables by 2030) after 2019-20, albeit at a reduced rate. Forecast consumption is reducing in the RE50% scenario (achieving 50 per cent of energy from renewables by 2030) because rooftop PV installation growth is sufficiently strong, demonstrating that increased rooftop PV generation would slightly exceed the additional energy requirement of a growing population and future economic activity.
The installed capacity of PV systems is forecast to increase under all scenarios, as shown in figures 4.4 a to c.
Figure 4.4 Darwin‑Katherine installed capacity of PV systemsa.
b.
Installed capacity at financial year-end (MW): residential
16-17 17-18 18-19 19-20 20-21 21-22 22-23 23-24 24-25 25-26 26-27Year ended June
RE50%RE30%BaseActual
0
20
40
60
80
100
120
Installed capacity at financial year-end (MW): commercial
16-17 17-18 18-19 19-20 20-21 21-22 22-23 23-24 24-25 25-26 26-27Year ended June
RE 50%RE 30%BaseActual
0
10
20
30
40
50
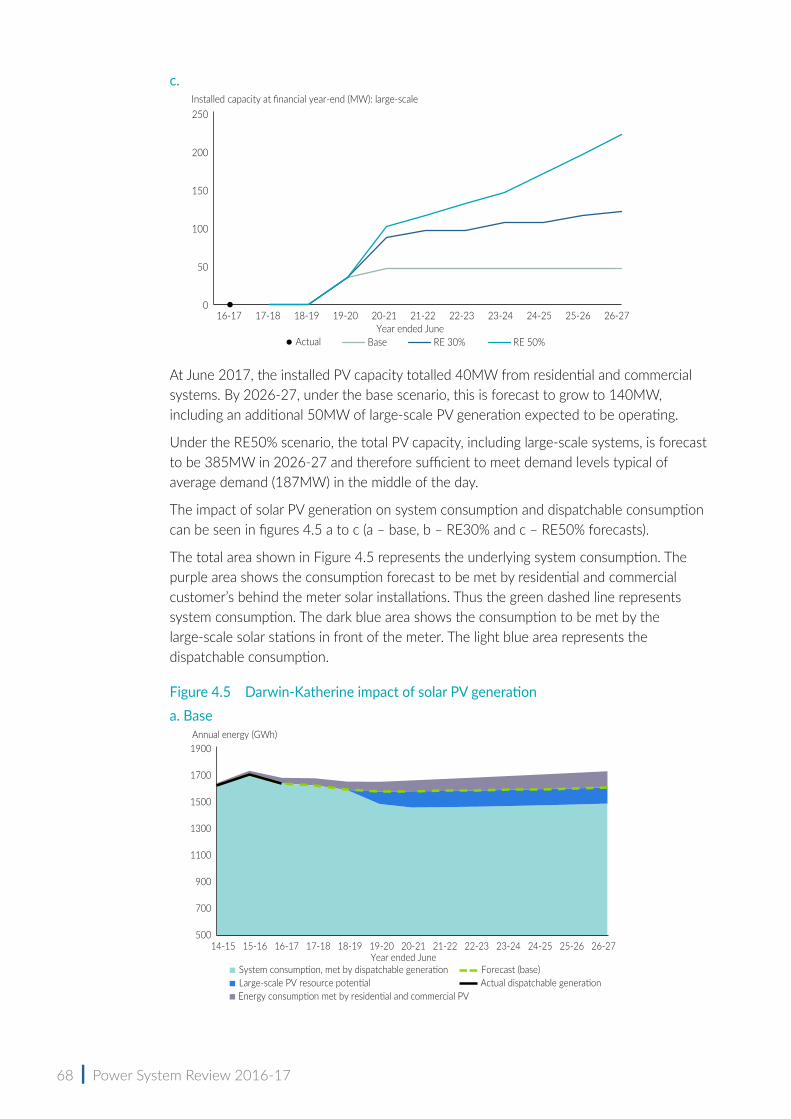
68 | Power System Review 2016-17
c.
At June 2017, the installed PV capacity totalled 40MW from residential and commercial systems. By 2026-27, under the base scenario, this is forecast to grow to 140MW, including an additional 50MW of large-scale PV generation expected to be operating.
Under the RE50% scenario, the total PV capacity, including large-scale systems, is forecast to be 385MW in 2026-27 and therefore sufficient to meet demand levels typical of average demand (187MW) in the middle of the day.
The impact of solar PV generation on system consumption and dispatchable consumption can be seen in figures 4.5 a to c (a – base, b – RE30% and c – RE50% forecasts).
The total area shown in Figure 4.5 represents the underlying system consumption. The purple area shows the consumption forecast to be met by residential and commercial customer’s behind the meter solar installations. Thus the green dashed line represents system consumption. The dark blue area shows the consumption to be met by the large-scale solar stations in front of the meter. The light blue area represents the dispatchable consumption.
Figure 4.5 Darwin‑Katherine impact of solar PV generationa. Base
Installed capacity at financial year-end (MW): large-scale
16-17 17-18 18-19 19-20 20-21 21-22 22-23 23-24 24-25 25-26 26-27
RE 50%RE 30%BaseActual
0
50
100
150
200
250
Year ended June
14-15 15-16 16-17 17-18 18-19 19-20 20-21 21-22 22-23 23-24 24-25 25-26 26-27Year ended June
Annual energy (GWh)
500
700
900
1100
1300
1500
1700
1900
System consumption, met by dispatchable generationLarge-scale PV resource potential
Forecast (base)Actual dispatchable generation
Energy consumption met by residential and commercial PV

Darwin-Katherine Performance | 69
b. RE30%
c. RE50%
In the RE30% and RE50% scenarios, the portion of energy usually met by other generation types (gas-fired generation) is displaced by large-scale PV generation (assuming full utilisation of resource potential)1. In this situation, under the RE50% scenario, dispatchable generators are forecast to meet 1000GWh of demand in 2026-27, down 37 per cent from 1600GWh in 2016-17. Issues anticipated when integrating large amounts of solar PV into power systems are discussed in more detail in 2.11.
Similar to the above forecast, AMEO has also forecast underlying demand. Installed residential and commercial PV capacity is forecast to grow from 10 per cent of maximum underlying demand in 2016-17 to:
• 30 per cent of maximum underlying demand in 2026-27 under the base scenario
• 40 per cent under the RE30% scenario
• 50 per cent under the RE50% scenario.
1 All PV generation is released into the network. This may not be possible to achieve in practice as there may be consequent impacts on power system security associated with reduced levels of synchronous generation on line and the intermittent nature of renewable generation
Annual energy (GWh)
500
700
900
1100
1300
1500
1700
1900
14-15 15-16 16-17 17-18 18-19 19-20 20-21 21-22 22-23 23-24 24-25 25-26 26-27Year ended June
System consumption, met by dispatchable generationLarge-scale PV resource potential
Forecast (base)Actual dispatchable generation
Energy consumption met by residential and commercial PV
Annual energy (GWh)
500
700
900
1100
1300
1500
1700
1900
System consumption, met by dispatchable generationLarge-scale PV resource potential
Forecast (base)Actual dispatchable generation
Energy consumption met by residential and commercial PV
14-15 15-16 16-17 17-18 18-19 19-20 20-21 21-22 22-23 23-24 24-25 25-26 26-27Year ended June
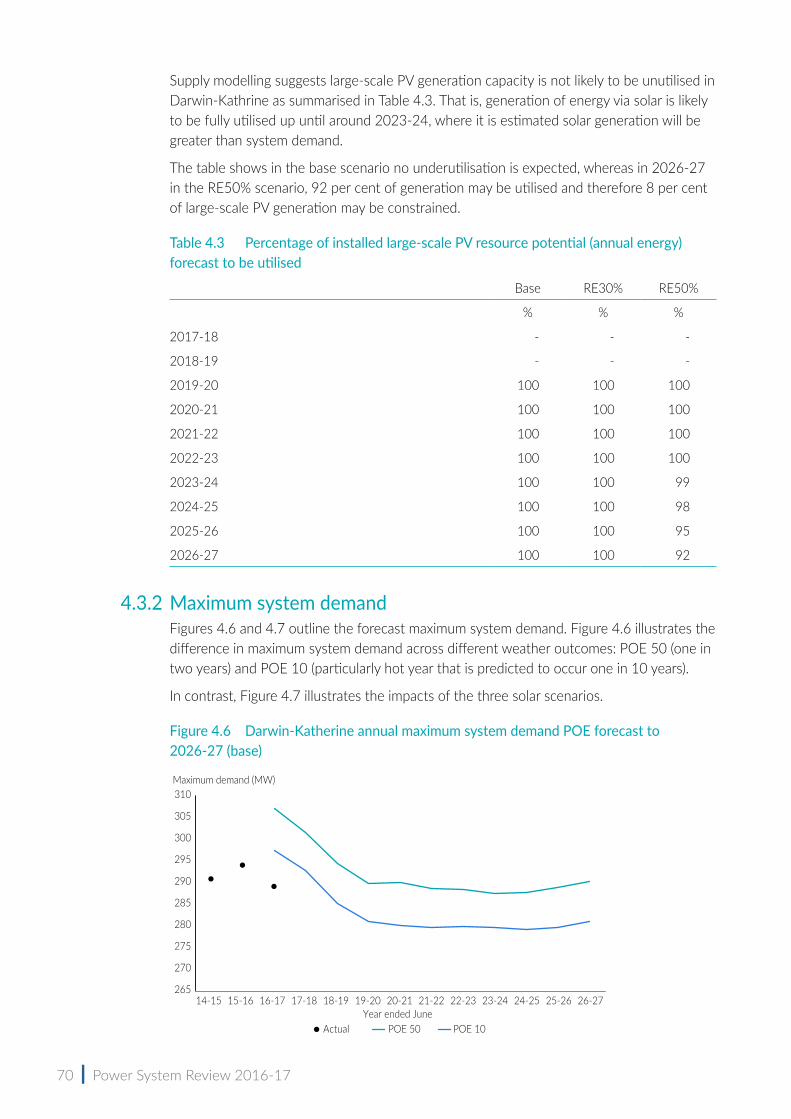
70 | Power System Review 2016-17
Supply modelling suggests large-scale PV generation capacity is not likely to be unutilised in Darwin-Kathrine as summarised in Table 4.3. That is, generation of energy via solar is likely to be fully utilised up until around 2023-24, where it is estimated solar generation will be greater than system demand.
The table shows in the base scenario no underutilisation is expected, whereas in 2026-27 in the RE50% scenario, 92 per cent of generation may be utilised and therefore 8 per cent of large-scale PV generation may be constrained.
Table 4.3 Percentage of installed large‑scale PV resource potential (annual energy) forecast to be utilised
Base RE30% RE50%
% % %
2017-18 - - -
2018-19 - - -
2019-20 100 100 100
2020-21 100 100 100
2021-22 100 100 100
2022-23 100 100 100
2023-24 100 100 99
2024-25 100 100 98
2025-26 100 100 95
2026-27 100 100 92
4.3.2 Maximum system demandFigures 4.6 and 4.7 outline the forecast maximum system demand. Figure 4.6 illustrates the difference in maximum system demand across different weather outcomes: POE 50 (one in two years) and POE 10 (particularly hot year that is predicted to occur one in 10 years).
In contrast, Figure 4.7 illustrates the impacts of the three solar scenarios.
Figure 4.6 Darwin‑Katherine annual maximum system demand POE forecast to 2026‑27 (base)
14-15 15-16 16-17 17-18 18-19 19-20 20-21 21-22 22-23 23-24 24-25 25-26 26-27
Maximum demand (MW)
Year ended JuneActual POE 50 POE 10
265
270
275
280
285
290
295
300
305
310
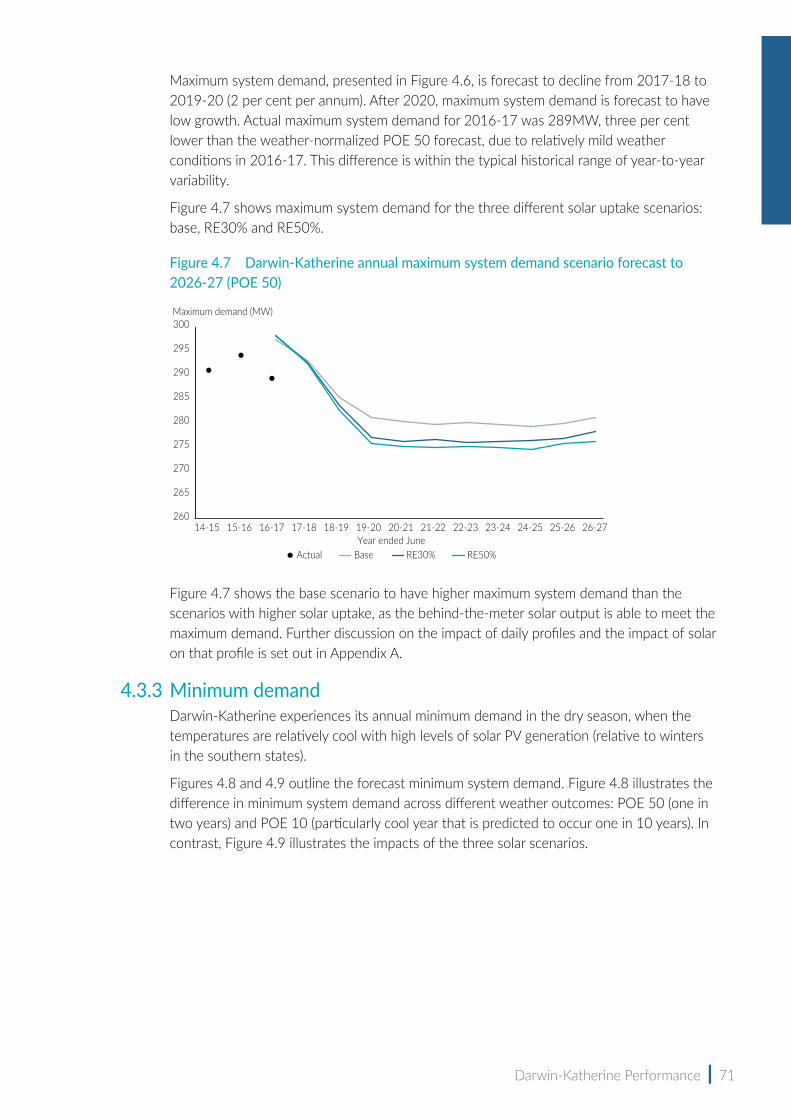
Darwin-Katherine Performance | 71
Maximum system demand, presented in Figure 4.6, is forecast to decline from 2017-18 to 2019-20 (2 per cent per annum). After 2020, maximum system demand is forecast to have low growth. Actual maximum system demand for 2016-17 was 289MW, three per cent lower than the weather-normalized POE 50 forecast, due to relatively mild weather conditions in 2016-17. This difference is within the typical historical range of year-to-year variability.
Figure 4.7 shows maximum system demand for the three different solar uptake scenarios: base, RE30% and RE50%.
Figure 4.7 Darwin‑Katherine annual maximum system demand scenario forecast to 2026‑27 (POE 50)
Figure 4.7 shows the base scenario to have higher maximum system demand than the scenarios with higher solar uptake, as the behind-the-meter solar output is able to meet the maximum demand. Further discussion on the impact of daily profiles and the impact of solar on that profile is set out in Appendix A.
4.3.3 Minimum demandDarwin-Katherine experiences its annual minimum demand in the dry season, when the temperatures are relatively cool with high levels of solar PV generation (relative to winters in the southern states).
Figures 4.8 and 4.9 outline the forecast minimum system demand. Figure 4.8 illustrates the difference in minimum system demand across different weather outcomes: POE 50 (one in two years) and POE 10 (particularly cool year that is predicted to occur one in 10 years). In contrast, Figure 4.9 illustrates the impacts of the three solar scenarios.
260
265
270
275
280
285
290
295
300
14-15 15-16 16-17 17-18 18-19 19-20 20-21 21-22 22-23 23-24 24-25 25-26 26-27
Maximum demand (MW)
Year ended JuneBase RE30% RE50%Actual
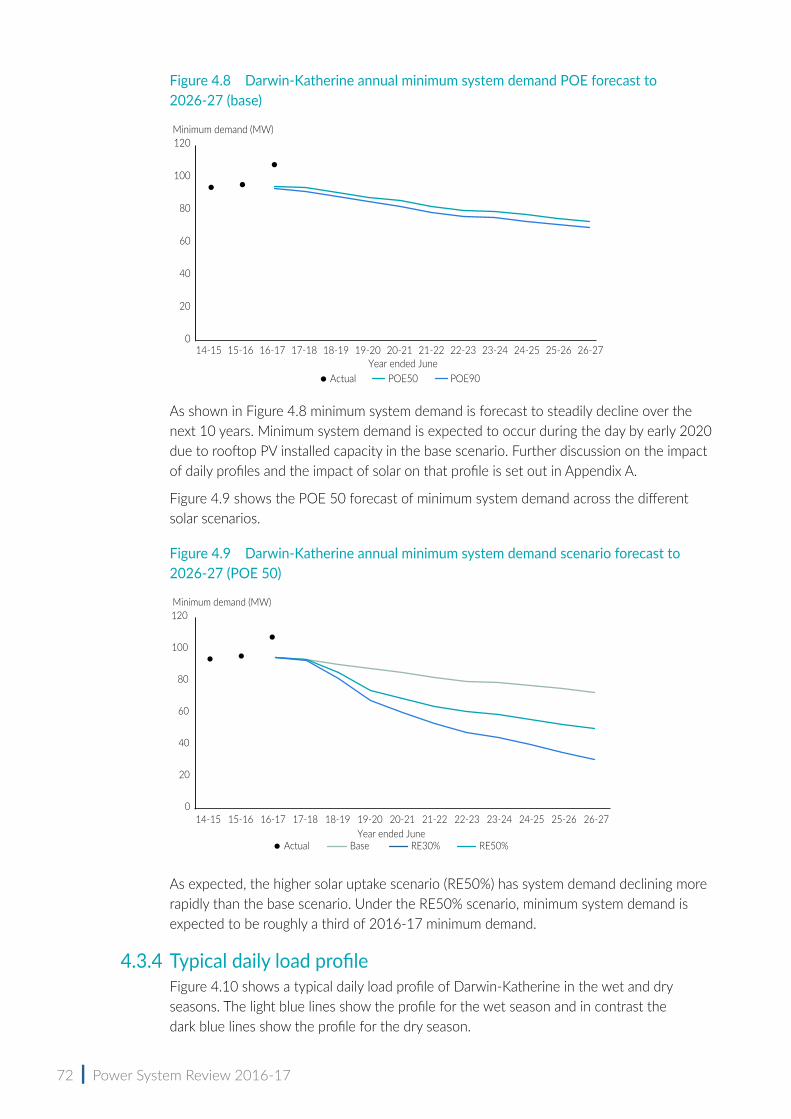
72 | Power System Review 2016-17
Figure 4.8 Darwin‑Katherine annual minimum system demand POE forecast to 2026‑27 (base)
As shown in Figure 4.8 minimum system demand is forecast to steadily decline over the next 10 years. Minimum system demand is expected to occur during the day by early 2020 due to rooftop PV installed capacity in the base scenario. Further discussion on the impact of daily profiles and the impact of solar on that profile is set out in Appendix A.
Figure 4.9 shows the POE 50 forecast of minimum system demand across the different solar scenarios.
Figure 4.9 Darwin‑Katherine annual minimum system demand scenario forecast to 2026‑27 (POE 50)
As expected, the higher solar uptake scenario (RE50%) has system demand declining more rapidly than the base scenario. Under the RE50% scenario, minimum system demand is expected to be roughly a third of 2016-17 minimum demand.
4.3.4 Typical daily load profileFigure 4.10 shows a typical daily load profile of Darwin-Katherine in the wet and dry seasons. The light blue lines show the profile for the wet season and in contrast the dark blue lines show the profile for the dry season.
14-15 15-16 16-17 17-18 18-19 19-20 20-21 21-22 22-23 23-24 24-25 25-26 26-27
Minimum demand (MW)
Year ended JuneActual
0
20
40
60
80
100
120
POE50 POE90
14-15 15-16 16-17 17-18 18-19 19-20 20-21 21-22 22-23 23-24 24-25 25-26 26-27
Minimum demand (MW)
Year ended JuneActual
0
20
40
60
80
100
120
Base RE30% RE50%
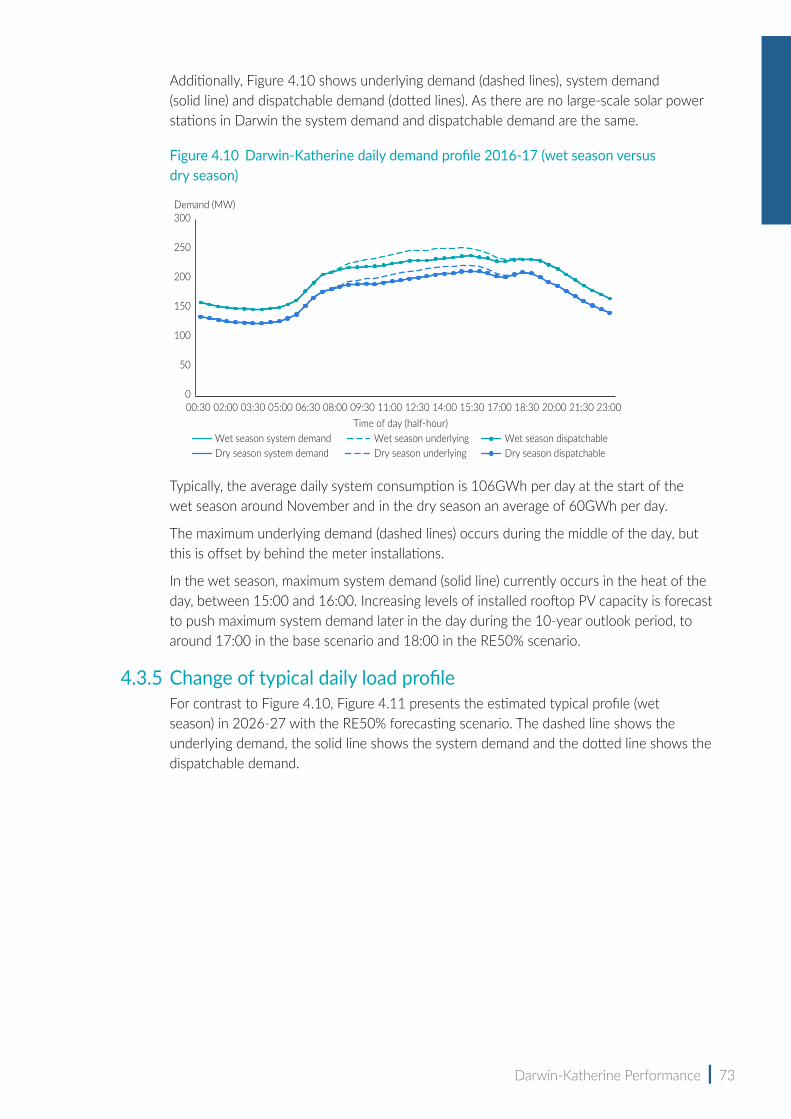
Darwin-Katherine Performance | 73
Additionally, Figure 4.10 shows underlying demand (dashed lines), system demand (solid line) and dispatchable demand (dotted lines). As there are no large-scale solar power stations in Darwin the system demand and dispatchable demand are the same.
Figure 4.10 Darwin‑Katherine daily demand profile 2016‑17 (wet season versus dry season)
Typically, the average daily system consumption is 106GWh per day at the start of the wet season around November and in the dry season an average of 60GWh per day.
The maximum underlying demand (dashed lines) occurs during the middle of the day, but this is offset by behind the meter installations.
In the wet season, maximum system demand (solid line) currently occurs in the heat of the day, between 15:00 and 16:00. Increasing levels of installed rooftop PV capacity is forecast to push maximum system demand later in the day during the 10-year outlook period, to around 17:00 in the base scenario and 18:00 in the RE50% scenario.
4.3.5 Change of typical daily load profileFor contrast to Figure 4.10, Figure 4.11 presents the estimated typical profile (wet season) in 2026-27 with the RE50% forecasting scenario. The dashed line shows the underlying demand, the solid line shows the system demand and the dotted line shows the dispatchable demand.
Demand (MW)
Time of day (half-hour)00:30 02:00 03:30 05:00 06:30 08:00 09:30 11:00 12:30 15:30 17:00 18:30 20:00 21:30 23:0014:000
50
100
150
200
250
300
Wet season system demand Wet season underlying Wet season dispatchableDry season system demand Dry season underlying Dry season dispatchable

74 | Power System Review 2016-17
Figure 4.11 2026‑27 (RE50%) typical demand profile
Figure 4.11 illustrates that the introduction of significant levels of solar generation over the next 10 years will change the profile of demand. While the underlying level of demand (dashed line) will not necessarily substantially change, the system demand (solid line) will decrease (that is, grid demand).
The dispatchable demand (dotted line) will become very small in the middle of the day, assuming clear skies.
Effectively, area ‘A’ shows the behind the meter solar generation and area ‘B’ shows the level of large-scale grid-connected solar generation.
Note, solar generation will become the dominate form of generation during the middle of the day. Around 80 per cent of a solar generation installation is subject to variation due to cloud coverage. Also, cloud coverage is not necessarily universal or consistent, and 80 per cent of total solar generation being impacted at once is unlikely (especially without prior knowledge). However, a large percentage of the solar generation will need to be supported by other generation technologies, such as gas.
Figure 4.11 also illustrates minimum dispatchable demand is expected to significantly reduce. This will make managing the system increasingly more difficult.
4.3.6 Demand at the substation level The growth rates of the maximum demand (regardless of when the system peaks) wet season forecasts for the zone substations in the Darwin-Katherine system are displayed in Figure 4.12.
Demand (MW)
Time of day (half-hour)Wet season system demand Wet season underlying Wet season dispatchable
00:30 02:00 03:30 05:00 06:30 08:00 09:30 11:00 12:30 15:30 17:00 18:30 20:00 21:30 23:0014:000
50
100
150
200
250
300
A
B

Darwin-Katherine Performance | 75
Figure 4.12 Zone substation growth rates (wet season, 10% POE, 2017‑18 to 2026‑27)
High growth rates are driven by increasing load related to new industrial and residential developments in and around Darwin, especially in the Wishart area (development in Palmerston). The forecast reductions in demand are driven by rooftop PV and, in the case of Weddell, industrial demand due to the dismantling of an INPEX accommodation village.
The demand at substation level is likely to change significantly under a high penetration of solar scenario, with some feeders potentially becoming positive at certain times of the day.
4.4 Generation reliability4.4.1 N–X exposure
This assessment provides information on how many generators can be offline before there is a heightened risk of capacity issues. This section also looks at how often the system may be in a high-risk situation.
Specifically, Figure 4.13 shows the level of dispatchable capacity, given X number of generators offline. For example the first column shows dispatchable capacity when all generators are operating, the second column shows capacity when the largest generator is offline and so on.
In contrast, the black solid line shows the level of capacity required to service maximum dispatchable demand, including reserves. However, if required System Control can reduce reserves. The black dashed line shows the absolute bare minimum (no reserves).
Where the column is greater than the black solid line there is excess capacity, where the column is less than the black solid line, then there is not sufficient capacity to meet demand.
The black diamonds provide an indication (see right axis) of the likelihood that the relevant number of generators would be offline. For example, 4 to 5 per cent of the time we are
-15 -10 -5 0 5 10 15 20 %
Weddell (66/22 kV)Casuarina (66/11 kV)
Strangways (66/22 kV)Pine Creek (11/22 kV)
Frances Bay (66/11 kV)Leayner (66/11 kV)
Manton (132/22 kV)Katherine (22 kV loads)
Palmerston (66/11 kV, all transformers)Batchelor (132/22 kV)
Darwin (66/11 kV)Woolner (66/11 kV)
Mary River (66/22 kV)Humpty Doon (66/22 kV)
Centre yard (66/11 kV)Pine Creek (66 kV loads)
Berrimah (66/11 kV)Archer (66/11 kV)
Marrakai 66/22 kV)Wishart Modular (66/11 kV)
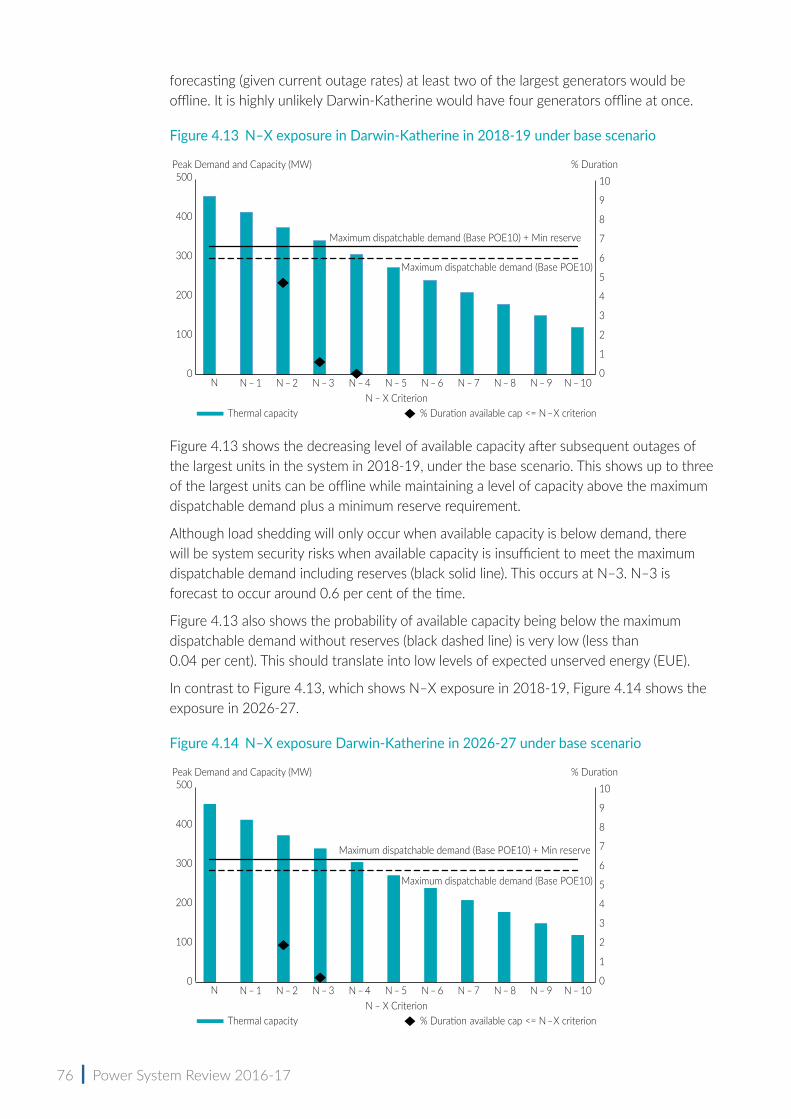
76 | Power System Review 2016-17
forecasting (given current outage rates) at least two of the largest generators would be offline. It is highly unlikely Darwin-Katherine would have four generators offline at once.
Figure 4.13 N–X exposure in Darwin‑Katherine in 2018‑19 under base scenario
Figure 4.13 shows the decreasing level of available capacity after subsequent outages of the largest units in the system in 2018-19, under the base scenario. This shows up to three of the largest units can be offline while maintaining a level of capacity above the maximum dispatchable demand plus a minimum reserve requirement.
Although load shedding will only occur when available capacity is below demand, there will be system security risks when available capacity is insufficient to meet the maximum dispatchable demand including reserves (black solid line). This occurs at N–3. N–3 is forecast to occur around 0.6 per cent of the time.
Figure 4.13 also shows the probability of available capacity being below the maximum dispatchable demand without reserves (black dashed line) is very low (less than 0.04 per cent). This should translate into low levels of expected unserved energy (EUE).
In contrast to Figure 4.13, which shows N–X exposure in 2018-19, Figure 4.14 shows the exposure in 2026-27.
Figure 4.14 N–X exposure Darwin‑Katherine in 2026‑27 under base scenario
0
1
2
3
4
5
6
7
8
9
10
N N – 1 N – 2 N – 3 N – 4 N – 5 N – 6 N – 7 N – 8 N – 9 N – 10N – X Criterion
% DurationPeak Demand and Capacity (MW)
Thermal capacity
Maximum dispatchable demand (Base POE10)
Maximum dispatchable demand (Base POE10) + Min reserve
% Duration available cap <= N–X criterion
0
100
200
300
400
500
0
1
2
3
4
5
6
7
8
9
10
N N – 1 N – 2 N – 3 N – 4 N – 5 N – 6 N – 7 N – 8 N – 9 N – 10N – X Criterion
% DurationPeak Demand and Capacity (MW)
Thermal capacity
Maximum dispatchable demand (Base POE10)
Maximum dispatchable demand (Base POE10) + Min reserve
% Duration available cap <= N –X criterion
0
100
200
300
400
500
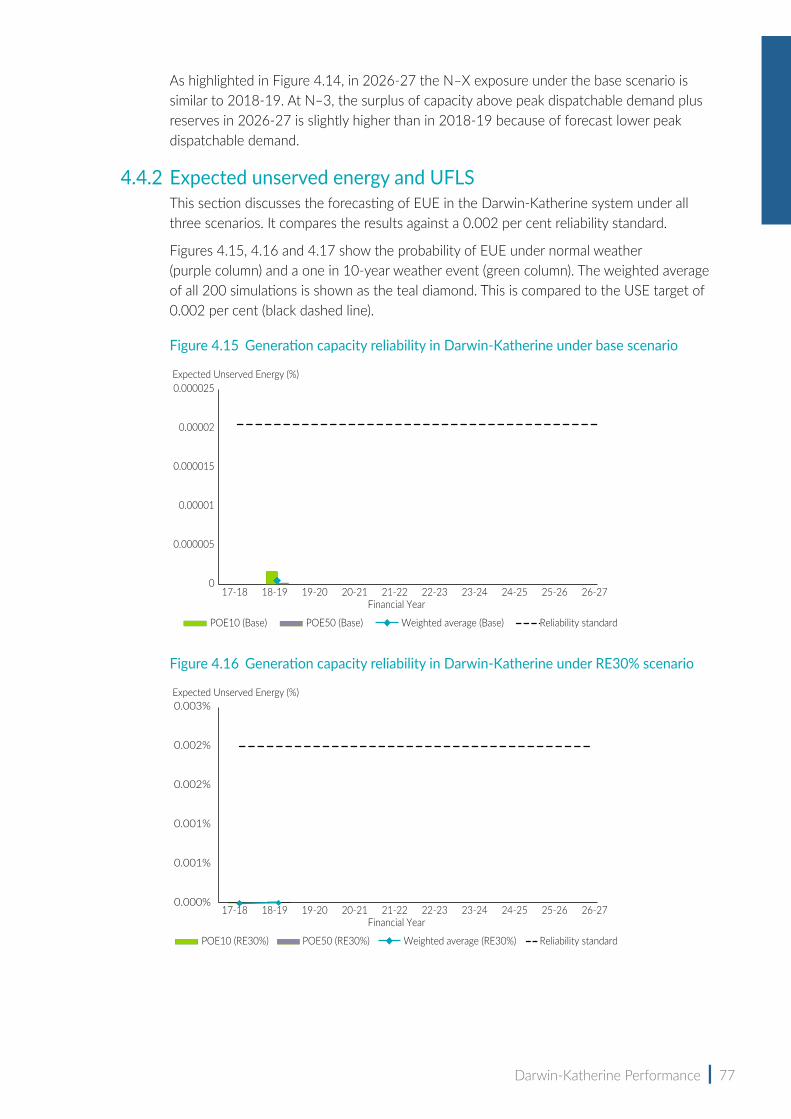
Darwin-Katherine Performance | 77
As highlighted in Figure 4.14, in 2026-27 the N–X exposure under the base scenario is similar to 2018-19. At N–3, the surplus of capacity above peak dispatchable demand plus reserves in 2026-27 is slightly higher than in 2018-19 because of forecast lower peak dispatchable demand.
4.4.2 Expected unserved energy and UFLSThis section discusses the forecasting of EUE in the Darwin-Katherine system under all three scenarios. It compares the results against a 0.002 per cent reliability standard.
Figures 4.15, 4.16 and 4.17 show the probability of EUE under normal weather (purple column) and a one in 10-year weather event (green column). The weighted average of all 200 simulations is shown as the teal diamond. This is compared to the USE target of 0.002 per cent (black dashed line).
Figure 4.15 Generation capacity reliability in Darwin‑Katherine under base scenario
Figure 4.16 Generation capacity reliability in Darwin‑Katherine under RE30% scenario
POE10 (Base)
Expected Unserved Energy (%)
0
0.000005
0.00001
0.000015
0.00002
0.000025
17-18 18-19 19-20 20-21 21-22 22-23 23-24 24-25 25-26 26-27Financial Year
Reliability standardPOE50 (Base) Weighted average (Base)
Expected Unserved Energy (%)
17-18 18-19 19-20 20-21 21-22 22-23 23-24 24-25 25-26 26-27Financial Year
0.000%
0.001%
0.001%
0.002%
0.002%
0.003%
POE10 (RE30%) Reliability standardPOE50 (RE30%) Weighted average (RE30%)

78 | Power System Review 2016-17
Figure 4.17 Generation capacity reliability in Darwin‑Katherine under RE50% scenario
The modelling results project the EUE in the Darwin-Katherine system under all three scenarios will be well below the 0.002 per cent reliability standard.
Regarding the base scenario (Figure 4.15), EUE is observed in 2018-19 but is forecast to decline from this point. This is lower than was forecast in the 2015-16 Power System Review due to the combined effect of a decrease in forecast demand and additional solar capacity. From 2019-20 onwards, there are no observations of EUE due to the 35MW increase in large-scale solar PV capacity and decline in forecast demand.
In 2018-19, there is one sample (out of 200) that results in EUE well above the standard (0.016 per cent). Even with a surplus of capacity, there is some probability high levels of EUE can occur when there is high levels of outages during high demand periods. In the simulation results, the maximum EUE was due to a 68MW known planned outage and over 100MW of additional unplanned outages in Darwin-Katherine system. However, in practice this would not occur as the planned outage would be delayed if there was already a number of unplanned outages.
Figure 4.16 (RE30%) and Figure 4.17 (RE50%) illustrates the introduction of additional capacity, in this case solar, reduces the risk of EUE. The levels of EUE are forecast in 2017-18 (0.0000001 per cent) and 2018-19 (0.000004-0.00001 per cent). As with the base scenario, there are no EUE observations beyond 2019-20.
The low levels of EUE observed in the simulations are consistent with the N–X exposure, which illustrated Darwin-Katherine had sufficient reserves to meet demand, even with the relatively unlikely occurrence of multiple outages across four units.
4.4.3 Non‑reliable noticesThis section reviews the time spent in a non-reliable operating state, which is when the system does not have adequate generation capacity. Figure 4.18 sets out the duration (hours) by month on the left axis (teal columns) and frequency of notices by month on the right axis (blue line).
Expected Unserved Energy (%)
17-18 18-19 19-20 20-21 21-22 22-23 23-24 24-25 25-26 26-27Financial Year
0
0.000005
0.00001
0.000015
0.00002
0.000025
POE10 (RE30%) Reliability standardPOE50 (RE30%) Weighted average (RE30%)
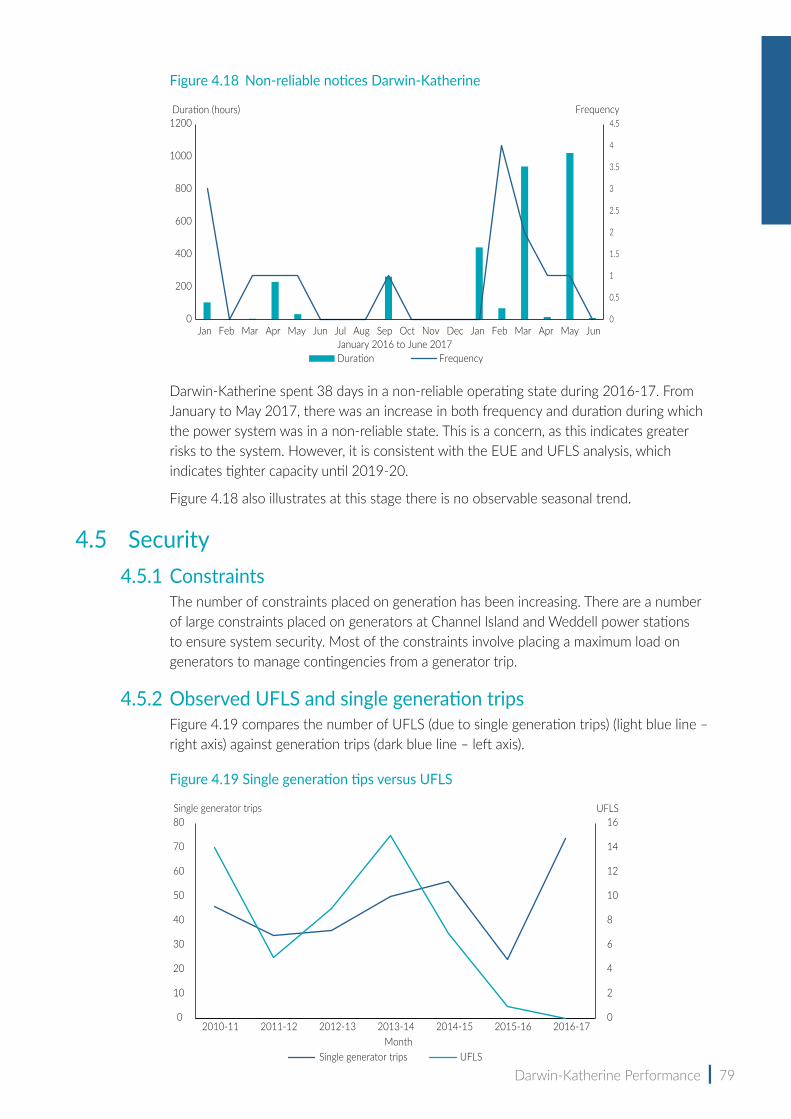
Darwin-Katherine Performance | 79
Figure 4.18 Non‑reliable notices Darwin‑Katherine
Darwin-Katherine spent 38 days in a non-reliable operating state during 2016-17. From January to May 2017, there was an increase in both frequency and duration during which the power system was in a non-reliable state. This is a concern, as this indicates greater risks to the system. However, it is consistent with the EUE and UFLS analysis, which indicates tighter capacity until 2019-20.
Figure 4.18 also illustrates at this stage there is no observable seasonal trend.
4.5 Security4.5.1 Constraints
The number of constraints placed on generation has been increasing. There are a number of large constraints placed on generators at Channel Island and Weddell power stations to ensure system security. Most of the constraints involve placing a maximum load on generators to manage contingencies from a generator trip.
4.5.2 Observed UFLS and single generation tripsFigure 4.19 compares the number of UFLS (due to single generation trips) (light blue line – right axis) against generation trips (dark blue line – left axis).
Figure 4.19 Single generation tips versus UFLS
January 2016 to June 2017
0
0.5
1
1.5
2
2.5
3
3.5
4
4.5
0
200
400
600
800
1000
1200FrequencyDuration (hours)
Duration Frequency
Jan Mar Jul Sep Nov Jan May JunAprFeb MarMay Jun Aug Oct Feb AprDec
Month
0
2
4
6
8
10
12
14
16
0
10
20
30
40
50
60
70
80
2010-11 2011-12 2012-13 2013-14 2014-15 2015-16 2016-17
UFLSSingle generator trips
UFLSSingle generator trips

80 | Power System Review 2016-17
Figure 4.19 illustrates that the number UFLS events from single generator trips in the last three years has reduced significantly from 15 in 2013-14 to zero in 2016-17. This reduction is in contrast to the number of generation trips that varied from year to year. 2015-16 had the lowest number of trips but 2016-17 has the highest. The number of generation trips in 2016-17 is a concern to the commission.
4.5.3 Generation incidentsIn the Darwin-Katherine system there were three major generation events. The incidents are summarised in Table 4.4.
Table 4.4 Generation incident summary
Incident Cause UFLSTime to report (business days)
20/09/16 Darwin-Katherine Darwin-Katherine power system – 132kV Katherine unit 2 tripped – Katherine UFLS Stage 1 – cause pending investigation
Generator trip Katherine stage 1
252
20/11/16 Darwin-Katherine Darwin-Katherine power system – Channel Island unit 1 and unit 7 tripped – DK UFLS stage 2B – equipment failure
Generator trip DK stage 2B 230
22/05/17 Darwin-Katherine Darwin-Katherine power system – Weddell unit 1 and 2 tripped – DK UFLS stage 2A – equipment failure
Fuel issue DK stage 2A 166
The duration between the incident and the time at which the report is finalised is an area of concern for the commission.
The key recommendations arising from the incident investigations in Darwin-Katherine are summarised in Table 4.5.
Table 4.5 Recommendations identified in the generation incident investigation reports Recommendation
Katherine trip Implement all seven of TGEN’s recommendations listed in the final report.
Greater System Control involvement in future generator control system commissioning processes.
Channel Island trips Replacement of the auxiliary transformer OTI (TGEN).
Modification to TGEN supervisory control and data acquisition (SCADA) (TGEN).
Regular checks/maintenance on temperature indicators (TGEN).
Investigation into mega volt ampere reactive (MVAR) response of Weddell unit 3 (TGEN).
System Control engineers to be notified when a protection relay is replaced (System Control).
Modification of PCPS (EDL).
Weddell trips TGEN to establish an internal process, procedures and supervision for any modification of control and protection settings on generating units and their controls.
TGEN to ensure controls on generating units critical to both active and reactive reserves are telemetered to System Control’s SCADA.
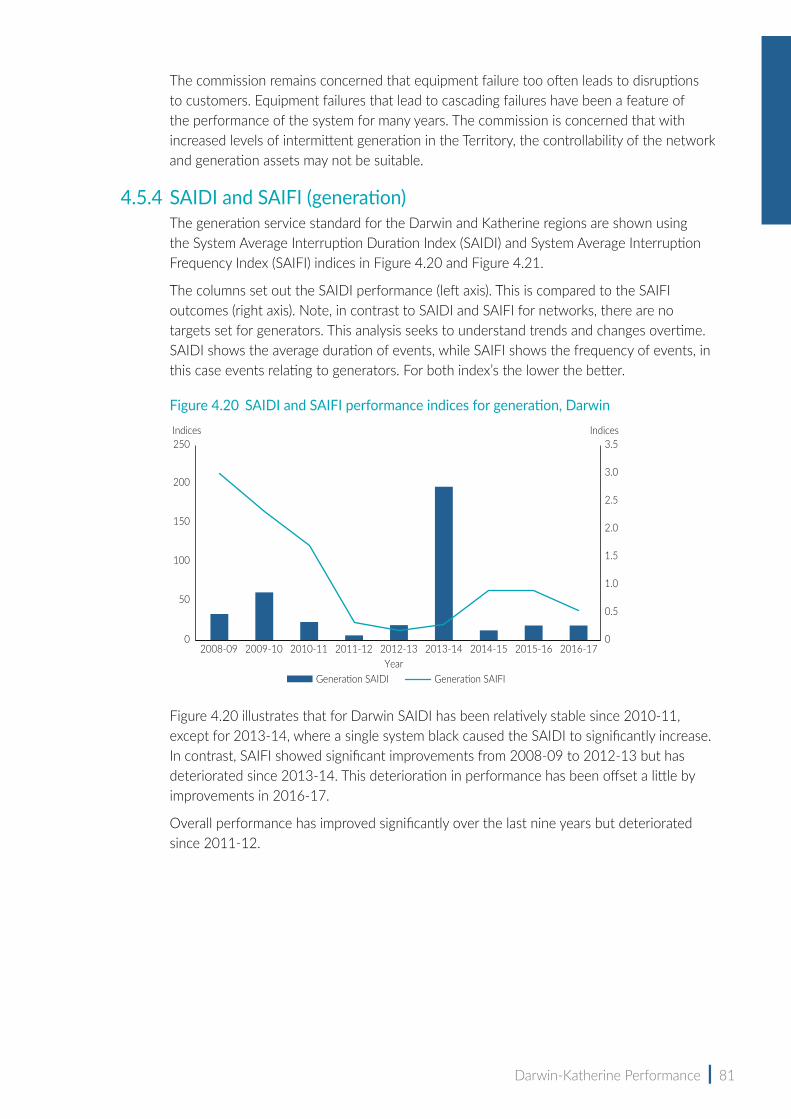
Darwin-Katherine Performance | 81
The commission remains concerned that equipment failure too often leads to disruptions to customers. Equipment failures that lead to cascading failures have been a feature of the performance of the system for many years. The commission is concerned that with increased levels of intermittent generation in the Territory, the controllability of the network and generation assets may not be suitable.
4.5.4 SAIDI and SAIFI (generation)The generation service standard for the Darwin and Katherine regions are shown using the System Average Interruption Duration Index (SAIDI) and System Average Interruption Frequency Index (SAIFI) indices in Figure 4.20 and Figure 4.21.
The columns set out the SAIDI performance (left axis). This is compared to the SAIFI outcomes (right axis). Note, in contrast to SAIDI and SAIFI for networks, there are no targets set for generators. This analysis seeks to understand trends and changes overtime. SAIDI shows the average duration of events, while SAIFI shows the frequency of events, in this case events relating to generators. For both index’s the lower the better.
Figure 4.20 SAIDI and SAIFI performance indices for generation, Darwin
Figure 4.20 illustrates that for Darwin SAIDI has been relatively stable since 2010-11, except for 2013-14, where a single system black caused the SAIDI to significantly increase. In contrast, SAIFI showed significant improvements from 2008-09 to 2012-13 but has deteriorated since 2013-14. This deterioration in performance has been offset a little by improvements in 2016-17.
Overall performance has improved significantly over the last nine years but deteriorated since 2011-12.
Year
0
0.5
1.0
1.5
2.0
2.5
3.0
3.5
0
250
50
100
150
200
Indices Indices
Generation SAIDI Generation SAIFI
2008-09 2012-13 2013-14 2014-152011-12 2015-162010-11 2016-172009-10

82 | Power System Review 2016-17
Figure 4.21 SAIDI and SAIFI performance indices for generation, Katherine
Figure 4.21 illustrates the Katherine SAIDI has been trending down since 2008-09, except for 2011-12. However, against this trend SAIDI has shown a concerning increase in 2016-17. SAIFI has followed a very similar trend. Figure 4.21 also illustrates that due to Katherine’s small size, its performance can fluctuate from zero to quite high due to a couple of incidents.
Overall performance has improved significantly over the last nine years.
4.6 Network performance Current targets are set for distribution and transmission performance. Targets are set for the three systems as a whole but this review also compares the outcomes to the targets for each system to understand how each region contributes to achievement of the targets.
Two key measures are used to measure the performance of the distribution assets, SAIDI and SAIFI.
Four key measures are used to measure the performance of the transmission assets:
• ACOD – average length of the outage
• FCO – frequency of circuit outages, the number of incidents over a period of time
• ATOD – average length of outages caused by transformer issues
• FTO – number of incidents across a period of time.
4.6.1 DistributionSAIDI Table 4.6 shows Power and Water Corporation’s (PWC) reported performance (annual reporting), using current feeder definitions against its current SAIDI targets. Figures in red highlight instances where PWC did not achieve its targets. Note, 2013-14 does not include the results of the system black but rather has been adjusted to provide an overview of the underlying performance.
Year
Indices Indices
Generation SAIDI Generation SAIFI
0
10
20
30
40
50
60
70
80
90
100
0.5
1.0
1.5
2.0
2.5
3.0
02008-09 2012-13 2013-14 2014-152011-12 2015-162010-11 2016-172009-10
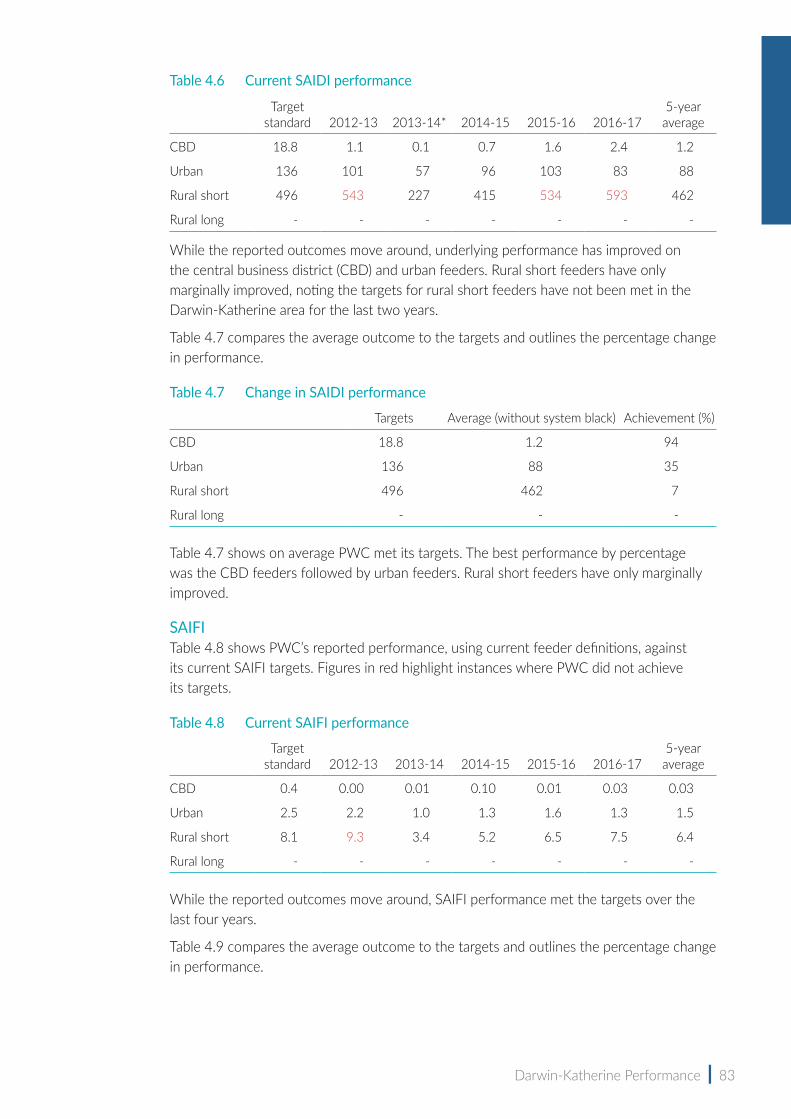
Darwin-Katherine Performance | 83
Table 4.6 Current SAIDI performance
Target standard 2012-13 2013-14* 2014-15 2015-16 2016-17
5-year average
CBD 18.8 1.1 0.1 0.7 1.6 2.4 1.2
Urban 136 101 57 96 103 83 88
Rural short 496 543 227 415 534 593 462
Rural long - - - - - - -
While the reported outcomes move around, underlying performance has improved on the central business district (CBD) and urban feeders. Rural short feeders have only marginally improved, noting the targets for rural short feeders have not been met in the Darwin-Katherine area for the last two years.
Table 4.7 compares the average outcome to the targets and outlines the percentage change in performance.
Table 4.7 Change in SAIDI performance
Targets Average (without system black) Achievement (%)
CBD 18.8 1.2 94
Urban 136 88 35
Rural short 496 462 7
Rural long - - -
Table 4.7 shows on average PWC met its targets. The best performance by percentage was the CBD feeders followed by urban feeders. Rural short feeders have only marginally improved.
SAIFI Table 4.8 shows PWC’s reported performance, using current feeder definitions, against its current SAIFI targets. Figures in red highlight instances where PWC did not achieve its targets.
Table 4.8 Current SAIFI performance
Target standard 2012-13 2013-14 2014-15 2015-16 2016-17
5-year average
CBD 0.4 0.00 0.01 0.10 0.01 0.03 0.03
Urban 2.5 2.2 1.0 1.3 1.6 1.3 1.5
Rural short 8.1 9.3 3.4 5.2 6.5 7.5 6.4
Rural long - - - - - - -
While the reported outcomes move around, SAIFI performance met the targets over the last four years.
Table 4.9 compares the average outcome to the targets and outlines the percentage change in performance.
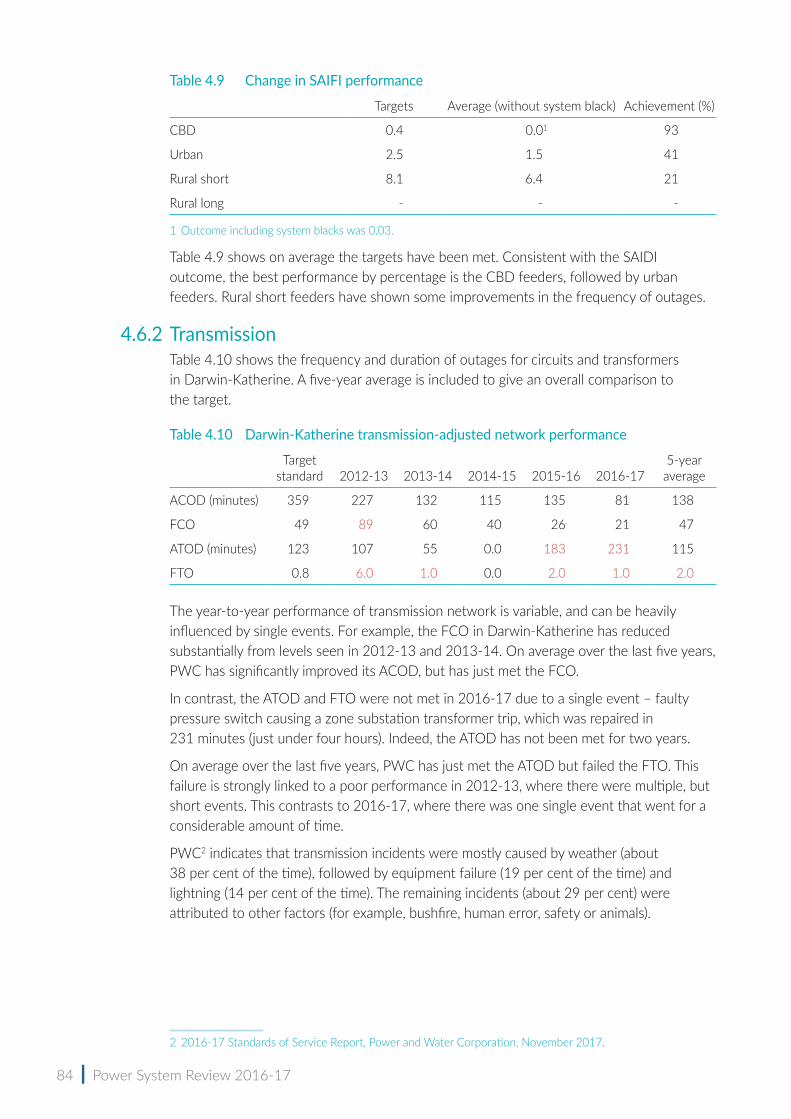
84 | Power System Review 2016-17
Table 4.9 Change in SAIFI performance
Targets Average (without system black) Achievement (%)
CBD 0.4 0.01 93
Urban 2.5 1.5 41
Rural short 8.1 6.4 21
Rural long - - -
1 Outcome including system blacks was 0.03.
Table 4.9 shows on average the targets have been met. Consistent with the SAIDI outcome, the best performance by percentage is the CBD feeders, followed by urban feeders. Rural short feeders have shown some improvements in the frequency of outages.
4.6.2 TransmissionTable 4.10 shows the frequency and duration of outages for circuits and transformers in Darwin-Katherine. A five-year average is included to give an overall comparison to the target.
Table 4.10 Darwin‑Katherine transmission‑adjusted network performance
Target standard 2012-13 2013-14 2014-15 2015-16 2016-17
5-year average
ACOD (minutes) 359 227 132 115 135 81 138
FCO 49 89 60 40 26 21 47
ATOD (minutes) 123 107 55 0.0 183 231 115
FTO 0.8 6.0 1.0 0.0 2.0 1.0 2.0
The year-to-year performance of transmission network is variable, and can be heavily influenced by single events. For example, the FCO in Darwin-Katherine has reduced substantially from levels seen in 2012-13 and 2013-14. On average over the last five years, PWC has significantly improved its ACOD, but has just met the FCO.
In contrast, the ATOD and FTO were not met in 2016-17 due to a single event – faulty pressure switch causing a zone substation transformer trip, which was repaired in 231 minutes (just under four hours). Indeed, the ATOD has not been met for two years.
On average over the last five years, PWC has just met the ATOD but failed the FTO. This failure is strongly linked to a poor performance in 2012-13, where there were multiple, but short events. This contrasts to 2016-17, where there was one single event that went for a considerable amount of time.
PWC2 indicates that transmission incidents were mostly caused by weather (about 38 per cent of the time), followed by equipment failure (19 per cent of the time) and lightning (14 per cent of the time). The remaining incidents (about 29 per cent) were attributed to other factors (for example, bushfire, human error, safety or animals).
2 2016-17 Standards of Service Report, Power and Water Corporation, November 2017.
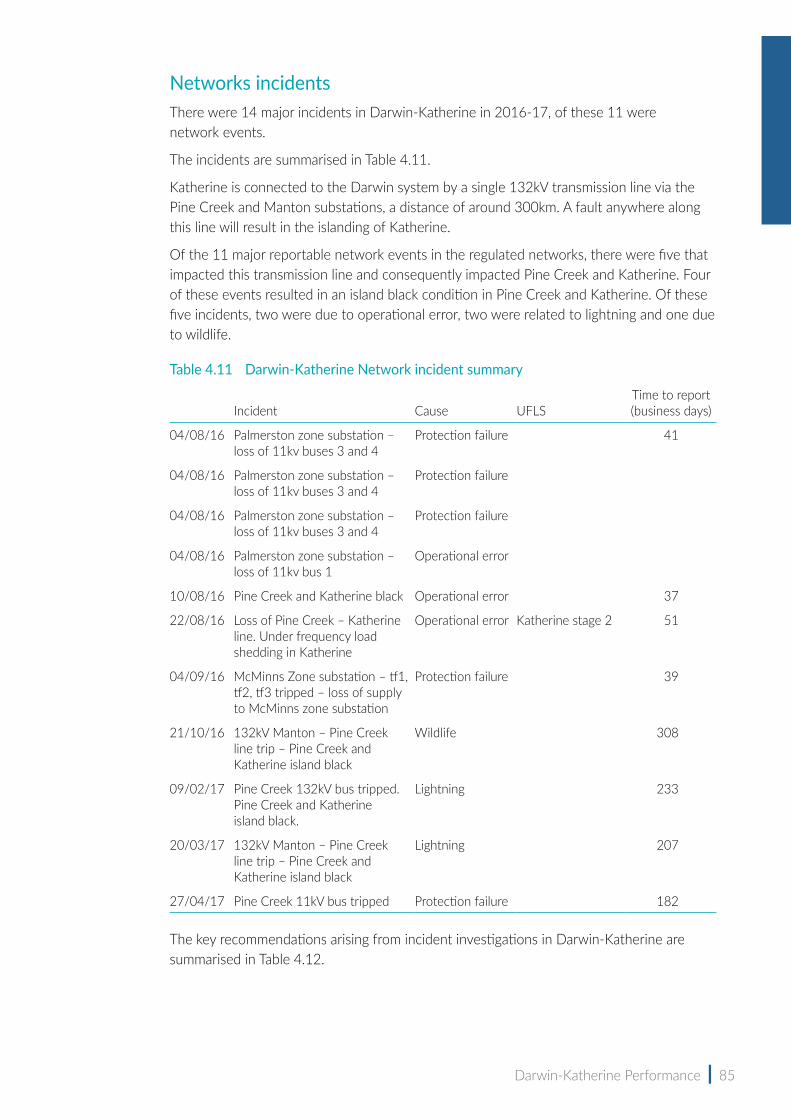
Darwin-Katherine Performance | 85
Networks incidentsThere were 14 major incidents in Darwin-Katherine in 2016-17, of these 11 were network events.
The incidents are summarised in Table 4.11.
Katherine is connected to the Darwin system by a single 132kV transmission line via the Pine Creek and Manton substations, a distance of around 300km. A fault anywhere along this line will result in the islanding of Katherine.
Of the 11 major reportable network events in the regulated networks, there were five that impacted this transmission line and consequently impacted Pine Creek and Katherine. Four of these events resulted in an island black condition in Pine Creek and Katherine. Of these five incidents, two were due to operational error, two were related to lightning and one due to wildlife.
Table 4.11 Darwin‑Katherine Network incident summary
Incident Cause UFLSTime to report (business days)
04/08/16 Palmerston zone substation – loss of 11kv buses 3 and 4
Protection failure 41
04/08/16 Palmerston zone substation – loss of 11kv buses 3 and 4
Protection failure
04/08/16 Palmerston zone substation – loss of 11kv buses 3 and 4
Protection failure
04/08/16 Palmerston zone substation – loss of 11kv bus 1
Operational error
10/08/16 Pine Creek and Katherine black Operational error 37
22/08/16 Loss of Pine Creek – Katherine line. Under frequency load shedding in Katherine
Operational error Katherine stage 2 51
04/09/16 McMinns Zone substation – tf1, tf2, tf3 tripped – loss of supply to McMinns zone substation
Protection failure 39
21/10/16 132kV Manton – Pine Creek line trip – Pine Creek and Katherine island black
Wildlife 308
09/02/17 Pine Creek 132kV bus tripped. Pine Creek and Katherine island black.
Lightning 233
20/03/17 132kV Manton – Pine Creek line trip – Pine Creek and Katherine island black
Lightning 207
27/04/17 Pine Creek 11kV bus tripped Protection failure 182
The key recommendations arising from incident investigations in Darwin-Katherine are summarised in Table 4.12.

86 | Power System Review 2016-17
Table 4.12 Recommendations identified in the network incident investigation reports for Darwin‑Katherine
Recommendation
Bus trips at Palmerston substation (4 events)
System Control to review and refresh controllers on operational procedures.
Replace damaged protection wiring (completed).
Pine Creek and Katherine black
System Control to review and refresh controllers on operational procedures.
Install TESLA (power flow disturbance recorder) at Pine Creek.
Performance and Code compliance testing of Pine Creek generating units.
Enable emergency voltage control on capacitors at Katherine zone substation.
Loss of Pine Creek – Katherine line
Review of Katherine UFLS scheme.
Review maintenance completion process to ensure protection flags are reset.
Review of SCADA alarms to improve interpretation.
System Control to review and refresh internal fault response actions.
Restore amp analogue for 22kV ties between Katherine power station and 22kV network board.
Loss of supply to McMinns substation
Power Networks and System Control develop guidelines for dispatch of personnel.
Power Networks to provide System Control with a plan for replacement of protection relays.
4.6.3 Network utilisationWith no update to the 2017 Network Management Plan the analysis of network utilisation in this review is based on the changes the commission understands to have occurred in the network since the last review. The commission noted the ongoing work on the Channel Island to Hudson Creek 132kV lines in the 2015-16 review. This work is now complete.
The demand forecast changes between the previous review does not suggest a change to the commission’s assessment of transmission capacity adequacy from 2015-16.
The forecast utilisations are shown in Figure 4.22.
The introduction of more renewable generation to the network will change the power flows across the network. The commission notes displacement of gas generation from Channel Island and Weddell by solar PV installations south of Darwin will impact on the utilisation of the transmission network. These changes should be the subject of future utilisation analysis.
While the commission has not considered the network topology, a benchmark of 50 per cent has been used as a useful indicator of heightened risks. Contingency analysis undertaken by PWC shows there are no overloads that result from contingencies with these loadings once the Archer-Palmerston 66kV augmentation is complete.
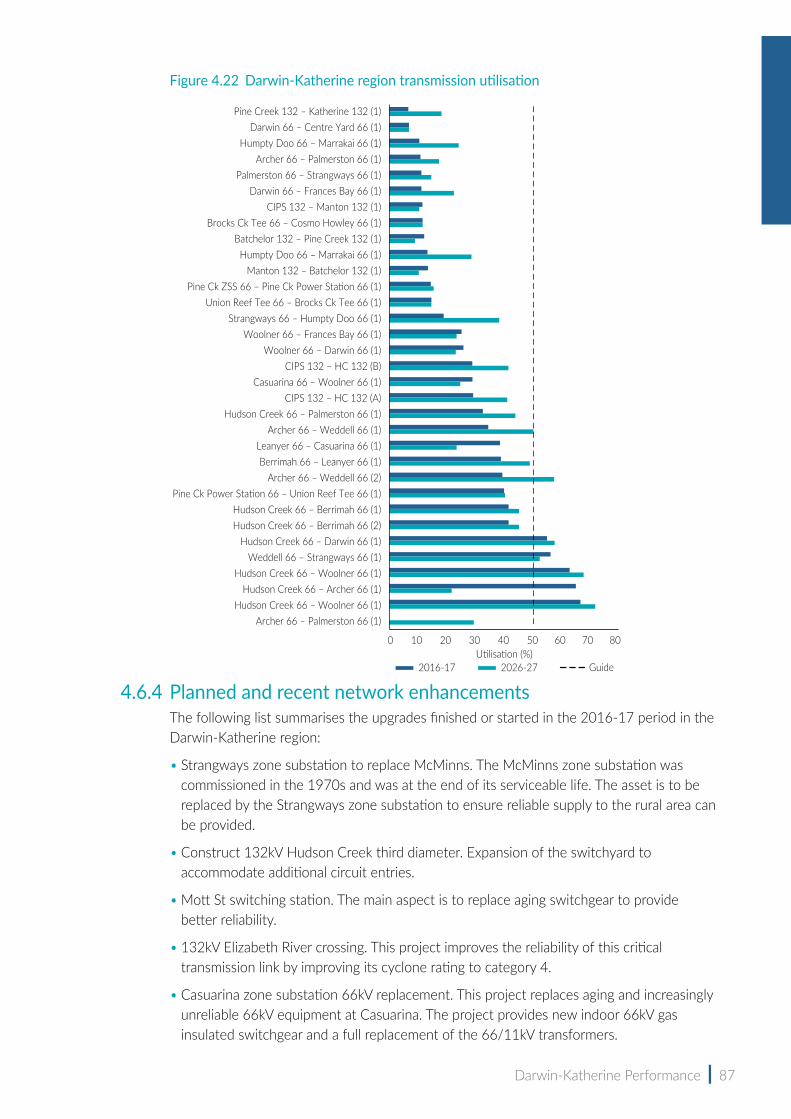
Darwin-Katherine Performance | 87
Figure 4.22 Darwin‑Katherine region transmission utilisation
4.6.4 Planned and recent network enhancements The following list summarises the upgrades finished or started in the 2016-17 period in the Darwin-Katherine region:
• Strangways zone substation to replace McMinns. The McMinns zone substation was commissioned in the 1970s and was at the end of its serviceable life. The asset is to be replaced by the Strangways zone substation to ensure reliable supply to the rural area can be provided.
• Construct 132kV Hudson Creek third diameter. Expansion of the switchyard to accommodate additional circuit entries.
• Mott St switching station. The main aspect is to replace aging switchgear to provide better reliability.
• 132kV Elizabeth River crossing. This project improves the reliability of this critical transmission link by improving its cyclone rating to category 4.
• Casuarina zone substation 66kV replacement. This project replaces aging and increasingly unreliable 66kV equipment at Casuarina. The project provides new indoor 66kV gas insulated switchgear and a full replacement of the 66/11kV transformers.
Utilisation (%)2016-17 2026-27 Guide
Pine Creek 132 – Katherine 132 (1)Darwin 66 – Centre Yard 66 (1)
Humpty Doo 66 – Marrakai 66 (1)Archer 66 – Palmerston 66 (1)
Palmerston 66 – Strangways 66 (1)Darwin 66 – Frances Bay 66 (1)
CIPS 132 – Manton 132 (1)Brocks Ck Tee 66 – Cosmo Howley 66 (1)
Batchelor 132 – Pine Creek 132 (1)Humpty Doo 66 – Marrakai 66 (1)
Manton 132 – Batchelor 132 (1)Pine Ck ZSS 66 – Pine Ck Power Station 66 (1)
Union Reef Tee 66 – Brocks Ck Tee 66 (1)
Woolner 66 – Frances Bay 66 (1)Woolner 66 – Darwin 66 (1)
CIPS 132 – HC 132 (B)Casuarina 66 – Woolner 66 (1)
CIPS 132 – HC 132 (A)Hudson Creek 66 – Palmerston 66 (1)
Archer 66 – Weddell 66 (1)Leanyer 66 – Casuarina 66 (1)Berrimah 66 – Leanyer 66 (1)
Archer 66 – Weddell 66 (2)Pine Ck Power Station 66 – Union Reef Tee 66 (1)
Hudson Creek 66 – Berrimah 66 (1)Hudson Creek 66 – Berrimah 66 (2)
Hudson Creek 66 – Darwin 66 (1)Weddell 66 – Strangways 66 (1)
Hudson Creek 66 – Woolner 66 (1)Hudson Creek 66 – Archer 66 (1)
Hudson Creek 66 – Woolner 66 (1)Archer 66 – Palmerston 66 (1)
Strangways 66 – Humpty Doo 66 (1)
0 10 20 30 40 50 60 70 80


5| Alice Springs Performance
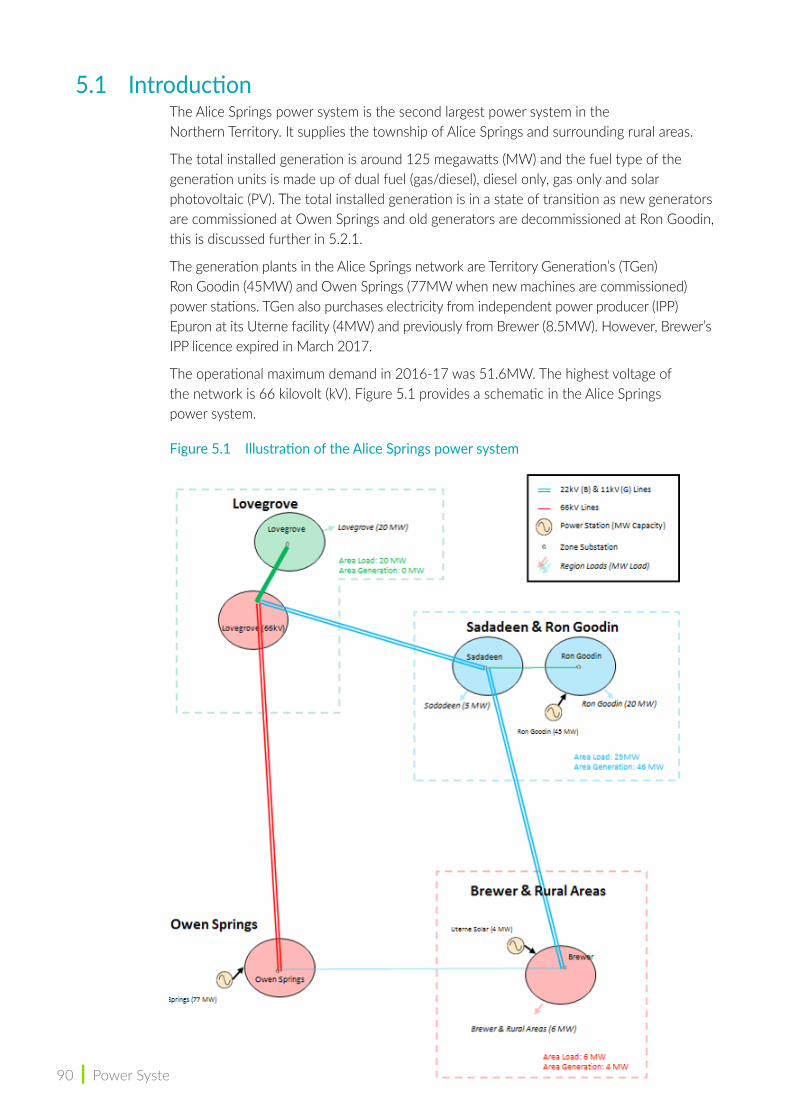
90 | Power System Review 2016-17
5.1 Introduction The Alice Springs power system is the second largest power system in the Northern Territory. It supplies the township of Alice Springs and surrounding rural areas.
The total installed generation is around 125 megawatts (MW) and the fuel type of the generation units is made up of dual fuel (gas/diesel), diesel only, gas only and solar photovoltaic (PV). The total installed generation is in a state of transition as new generators are commissioned at Owen Springs and old generators are decommissioned at Ron Goodin, this is discussed further in 5.2.1.
The generation plants in the Alice Springs network are Territory Generation’s (TGen) Ron Goodin (45MW) and Owen Springs (77MW when new machines are commissioned) power stations. TGen also purchases electricity from independent power producer (IPP) Epuron at its Uterne facility (4MW) and previously from Brewer (8.5MW). However, Brewer’s IPP licence expired in March 2017.
The operational maximum demand in 2016-17 was 51.6MW. The highest voltage of the network is 66 kilovolt (kV). Figure 5.1 provides a schematic in the Alice Springs power system.
Figure 5.1 Illustration of the Alice Springs power system
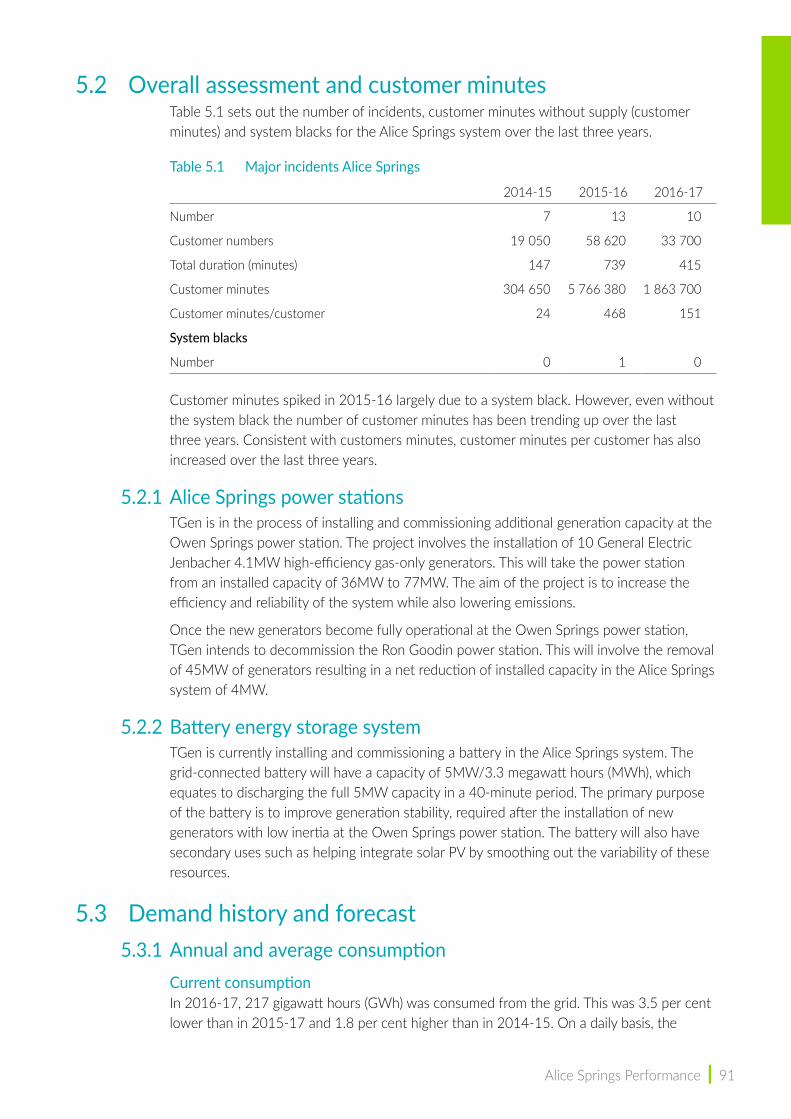
Alice Springs Performance | 91
5.2 Overall assessment and customer minutesTable 5.1 sets out the number of incidents, customer minutes without supply (customer minutes) and system blacks for the Alice Springs system over the last three years.
Table 5.1 Major incidents Alice Springs
2014-15 2015-16 2016-17
Number 7 13 10
Customer numbers 19 050 58 620 33 700
Total duration (minutes) 147 739 415
Customer minutes 304 650 5 766 380 1 863 700
Customer minutes/customer 24 468 151
System blacks
Number 0 1 0
Customer minutes spiked in 2015-16 largely due to a system black. However, even without the system black the number of customer minutes has been trending up over the last three years. Consistent with customers minutes, customer minutes per customer has also increased over the last three years.
5.2.1 Alice Springs power stationsTGen is in the process of installing and commissioning additional generation capacity at the Owen Springs power station. The project involves the installation of 10 General Electric Jenbacher 4.1MW high-efficiency gas-only generators. This will take the power station from an installed capacity of 36MW to 77MW. The aim of the project is to increase the efficiency and reliability of the system while also lowering emissions.
Once the new generators become fully operational at the Owen Springs power station, TGen intends to decommission the Ron Goodin power station. This will involve the removal of 45MW of generators resulting in a net reduction of installed capacity in the Alice Springs system of 4MW.
5.2.2 Battery energy storage systemTGen is currently installing and commissioning a battery in the Alice Springs system. The grid-connected battery will have a capacity of 5MW/3.3 megawatt hours (MWh), which equates to discharging the full 5MW capacity in a 40-minute period. The primary purpose of the battery is to improve generation stability, required after the installation of new generators with low inertia at the Owen Springs power station. The battery will also have secondary uses such as helping integrate solar PV by smoothing out the variability of these resources.
5.3 Demand history and forecast 5.3.1 Annual and average consumption
Current consumptionIn 2016-17, 217 gigawatt hours (GWh) was consumed from the grid. This was 3.5 per cent lower than in 2015-17 and 1.8 per cent higher than in 2014-15. On a daily basis, the
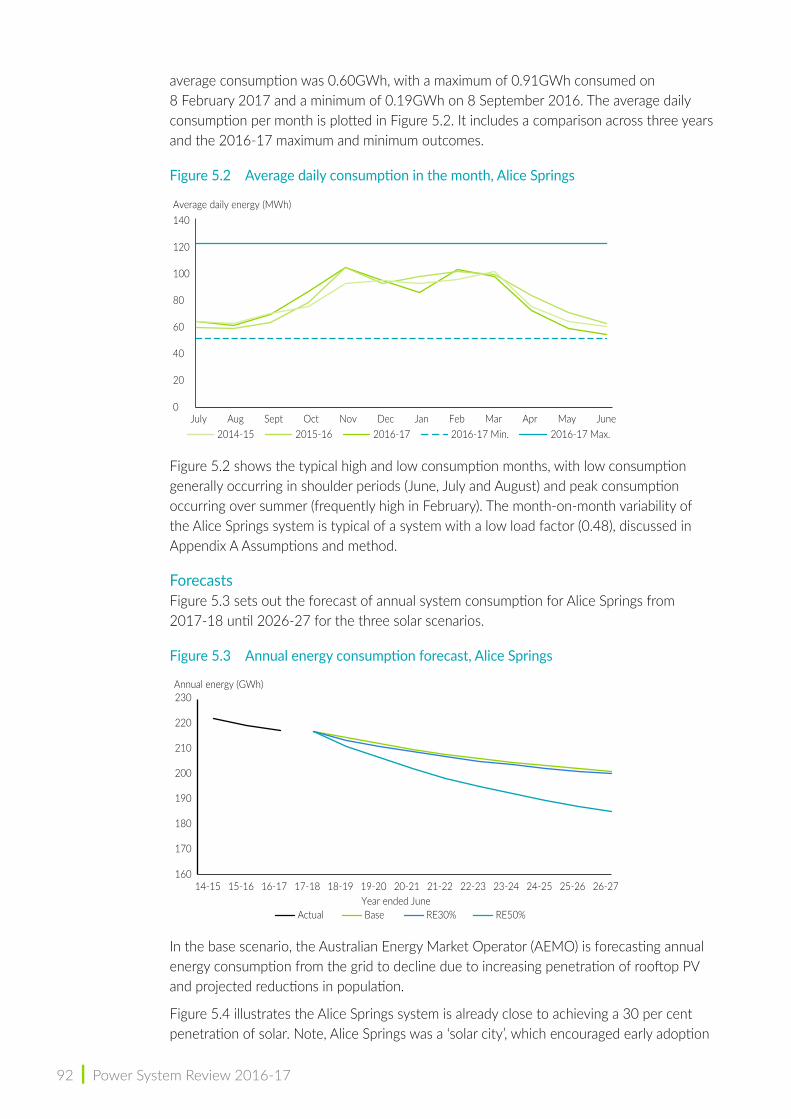
92 | Power System Review 2016-17
average consumption was 0.60GWh, with a maximum of 0.91GWh consumed on 8 February 2017 and a minimum of 0.19GWh on 8 September 2016. The average daily consumption per month is plotted in Figure 5.2. It includes a comparison across three years and the 2016-17 maximum and minimum outcomes.
Figure 5.2 Average daily consumption in the month, Alice Springs
Figure 5.2 shows the typical high and low consumption months, with low consumption generally occurring in shoulder periods (June, July and August) and peak consumption occurring over summer (frequently high in February). The month-on-month variability of the Alice Springs system is typical of a system with a low load factor (0.48), discussed in Appendix A Assumptions and method.
ForecastsFigure 5.3 sets out the forecast of annual system consumption for Alice Springs from 2017-18 until 2026-27 for the three solar scenarios.
Figure 5.3 Annual energy consumption forecast, Alice Springs
In the base scenario, the Australian Energy Market Operator (AEMO) is forecasting annual energy consumption from the grid to decline due to increasing penetration of rooftop PV and projected reductions in population.
Figure 5.4 illustrates the Alice Springs system is already close to achieving a 30 per cent penetration of solar. Note, Alice Springs was a ‘solar city’, which encouraged early adoption
0
20
40
60
80
100
120
140
July Aug Sept Oct Nov Dec Jan Feb Mar Apr May June
Average daily energy (MWh)
2014-15 2015-16 2016-17 2016-17 Min. 2016-17 Max.
14-15 15-16 16-17 17-18 18-19 19-20 20-21 21-22 22-23 23-24 24-25 25-26 26-27Year ended June
Actual RE50%RE30%Base
Annual energy (GWh)
160
170
180
190
200
210
220
230

Alice Springs Performance | 93
of solar. Declines are hastened in the RE50% scenario, associated with increased residential and commercial rooftop PV, which reduces grid-supplied demand.
As at June 2017, installed solar capacity was 10MW coming from residential and commercial rooftop PV systems, with an additional 4MW of large-scale capacity at the Uterne solar farm.
The installed capacity of solar PV systems is forecast to increase under all scenarios, as shown in figure 5.4 a to c.
Figure 5.4 Alice Springs installed capacity of solar PV systems
a.
b.
Installed capacity at financial year-end (MW): residential
16-17 17-18 18-19 19-20 20-21 21-22 22-23 23-24 24-25 25-26 26-27Year ended June
RE50%RE30%BaseActual
0
5
10
15
20
25
Installed capacity at financial year-end (MW): commercial
16-17 17-18 18-19 19-20 20-21 21-22 22-23 23-24 24-25 25-26 26-27Year ended June
RE50%RE30%BaseActual
0
2
4
6
8
10
12
14
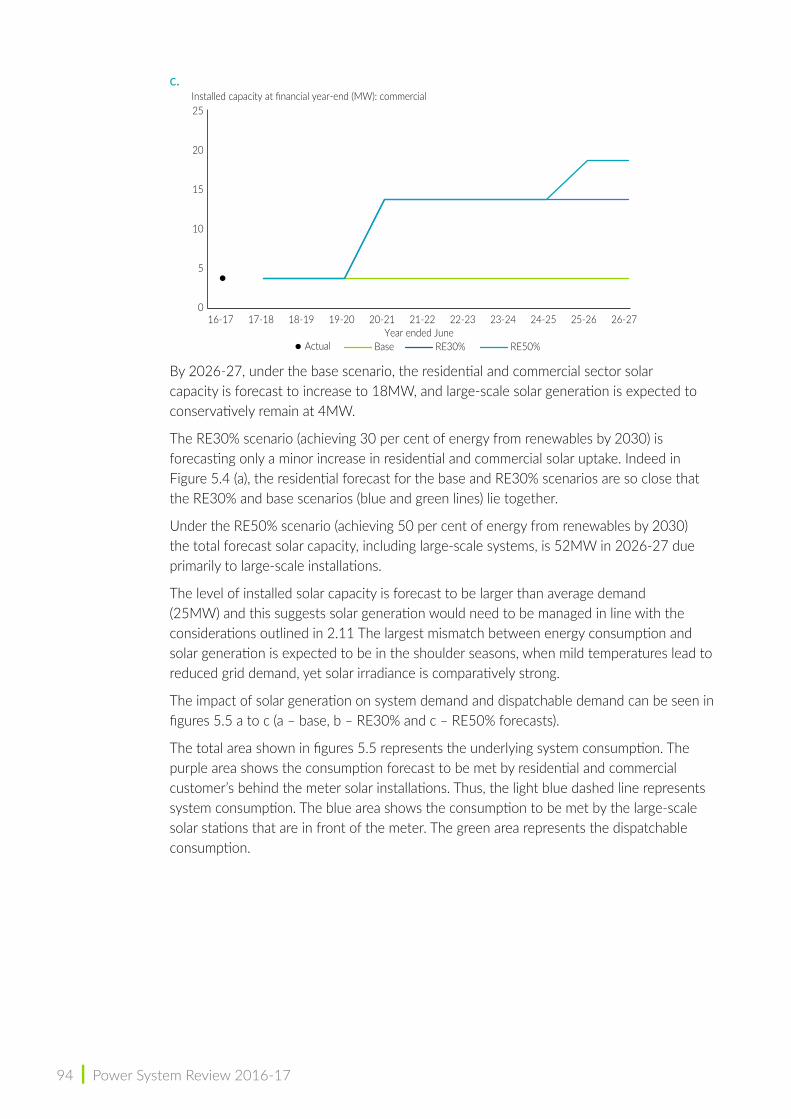
94 | Power System Review 2016-17
c.
By 2026-27, under the base scenario, the residential and commercial sector solar capacity is forecast to increase to 18MW, and large-scale solar generation is expected to conservatively remain at 4MW.
The RE30% scenario (achieving 30 per cent of energy from renewables by 2030) is forecasting only a minor increase in residential and commercial solar uptake. Indeed in Figure 5.4 (a), the residential forecast for the base and RE30% scenarios are so close that the RE30% and base scenarios (blue and green lines) lie together.
Under the RE50% scenario (achieving 50 per cent of energy from renewables by 2030) the total forecast solar capacity, including large-scale systems, is 52MW in 2026-27 due primarily to large-scale installations.
The level of installed solar capacity is forecast to be larger than average demand (25MW) and this suggests solar generation would need to be managed in line with the considerations outlined in 2.11 The largest mismatch between energy consumption and solar generation is expected to be in the shoulder seasons, when mild temperatures lead to reduced grid demand, yet solar irradiance is comparatively strong.
The impact of solar generation on system demand and dispatchable demand can be seen in figures 5.5 a to c (a – base, b – RE30% and c – RE50% forecasts).
The total area shown in figures 5.5 represents the underlying system consumption. The purple area shows the consumption forecast to be met by residential and commercial customer’s behind the meter solar installations. Thus, the light blue dashed line represents system consumption. The blue area shows the consumption to be met by the large-scale solar stations that are in front of the meter. The green area represents the dispatchable consumption.
Installed capacity at financial year-end (MW): commercial
16-17 17-18 18-19 19-20 20-21 21-22 22-23 23-24 24-25 25-26 26-27Year ended June
RE50%RE30%BaseActual
0
5
10
15
20
25
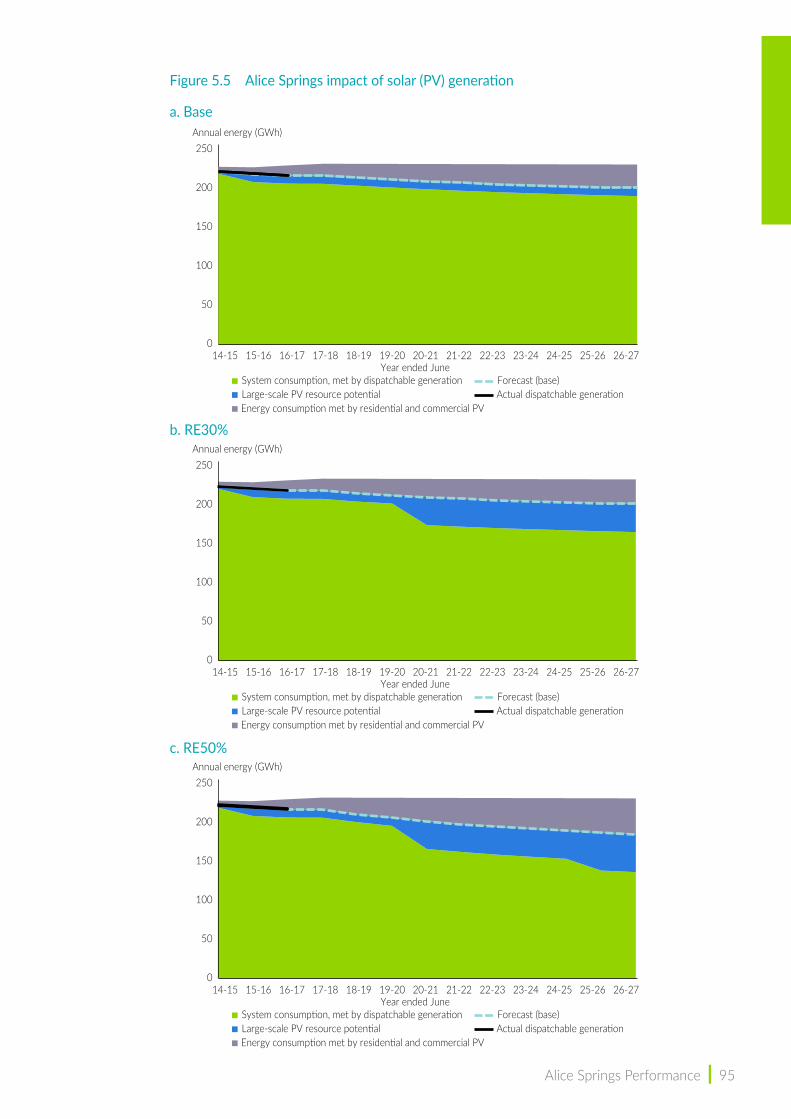
Alice Springs Performance | 95
Figure 5.5 Alice Springs impact of solar (PV) generation
a. Base
b. RE30%
c. RE50%
14-15 15-16 16-17 17-18 18-19 19-20 20-21 21-22 22-23 23-24 24-25 25-26 26-27Year ended June
Annual energy (GWh)
System consumption, met by dispatchable generationLarge-scale PV resource potential
Forecast (base)Actual dispatchable generation
Energy consumption met by residential and commercial PV
0
50
100
150
200
250
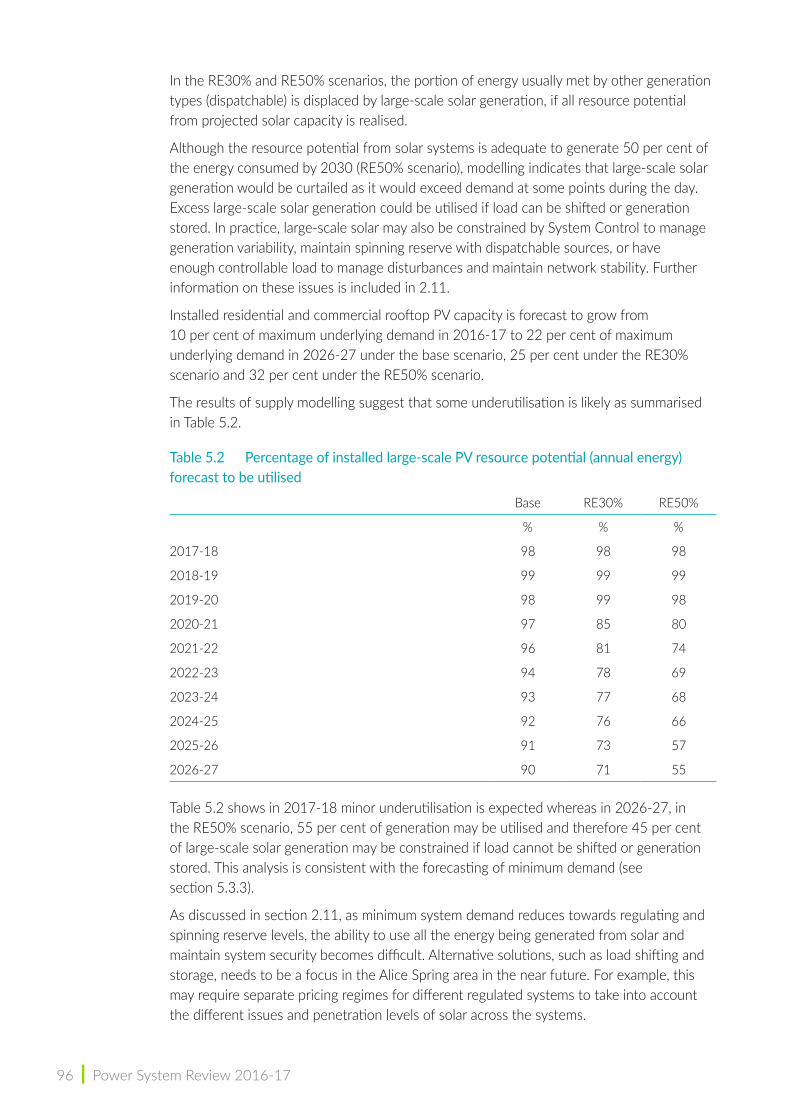
96 | Power System Review 2016-17
In the RE30% and RE50% scenarios, the portion of energy usually met by other generation types (dispatchable) is displaced by large-scale solar generation, if all resource potential from projected solar capacity is realised.
Although the resource potential from solar systems is adequate to generate 50 per cent of the energy consumed by 2030 (RE50% scenario), modelling indicates that large-scale solar generation would be curtailed as it would exceed demand at some points during the day. Excess large-scale solar generation could be utilised if load can be shifted or generation stored. In practice, large-scale solar may also be constrained by System Control to manage generation variability, maintain spinning reserve with dispatchable sources, or have enough controllable load to manage disturbances and maintain network stability. Further information on these issues is included in 2.11.
Installed residential and commercial rooftop PV capacity is forecast to grow from 10 per cent of maximum underlying demand in 2016-17 to 22 per cent of maximum underlying demand in 2026-27 under the base scenario, 25 per cent under the RE30% scenario and 32 per cent under the RE50% scenario.
The results of supply modelling suggest that some underutilisation is likely as summarised in Table 5.2.
Table 5.2 Percentage of installed large‑scale PV resource potential (annual energy) forecast to be utilised
Base RE30% RE50%
% % %
2017-18 98 98 98
2018-19 99 99 99
2019-20 98 99 98
2020-21 97 85 80
2021-22 96 81 74
2022-23 94 78 69
2023-24 93 77 68
2024-25 92 76 66
2025-26 91 73 57
2026-27 90 71 55
Table 5.2 shows in 2017-18 minor underutilisation is expected whereas in 2026-27, in the RE50% scenario, 55 per cent of generation may be utilised and therefore 45 per cent of large-scale solar generation may be constrained if load cannot be shifted or generation stored. This analysis is consistent with the forecasting of minimum demand (see section 5.3.3).
As discussed in section 2.11, as minimum system demand reduces towards regulating and spinning reserve levels, the ability to use all the energy being generated from solar and maintain system security becomes difficult. Alternative solutions, such as load shifting and storage, needs to be a focus in the Alice Spring area in the near future. For example, this may require separate pricing regimes for different regulated systems to take into account the different issues and penetration levels of solar across the systems.
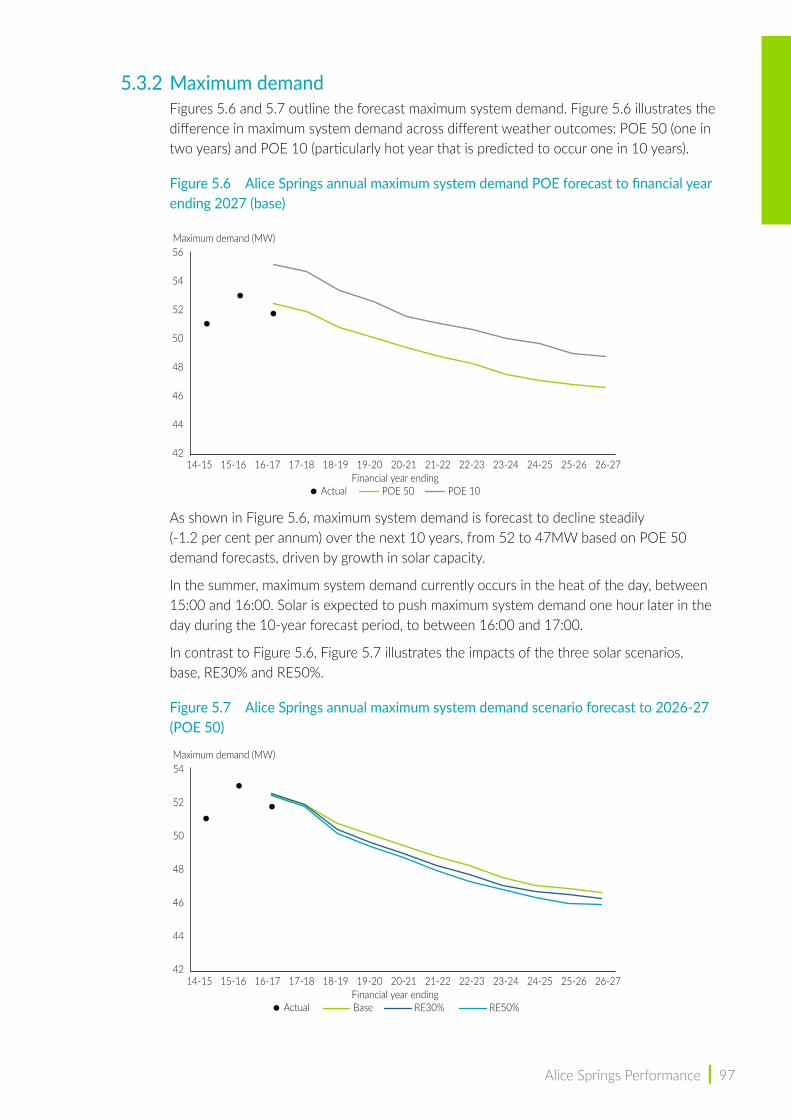
Alice Springs Performance | 97
5.3.2 Maximum demandFigures 5.6 and 5.7 outline the forecast maximum system demand. Figure 5.6 illustrates the difference in maximum system demand across different weather outcomes: POE 50 (one in two years) and POE 10 (particularly hot year that is predicted to occur one in 10 years).
Figure 5.6 Alice Springs annual maximum system demand POE forecast to financial year ending 2027 (base)
As shown in Figure 5.6, maximum system demand is forecast to decline steadily (-1.2 per cent per annum) over the next 10 years, from 52 to 47MW based on POE 50 demand forecasts, driven by growth in solar capacity.
In the summer, maximum system demand currently occurs in the heat of the day, between 15:00 and 16:00. Solar is expected to push maximum system demand one hour later in the day during the 10-year forecast period, to between 16:00 and 17:00.
In contrast to Figure 5.6, Figure 5.7 illustrates the impacts of the three solar scenarios, base, RE30% and RE50%.
Figure 5.7 Alice Springs annual maximum system demand scenario forecast to 2026‑27 (POE 50)
42
44
46
48
50
52
54
56
14-15 15-16 16-17 17-18 18-19 19-20 20-21 21-22 22-23 23-24 24-25 25-26 26-27
Maximum demand (MW)
Financial year endingActual POE 50 POE 10
14-15 15-16 16-17 17-18 18-19 19-20 20-21 21-22 22-23 23-24 24-25 25-26 26-27
Maximum demand (MW)
Financial year endingActual RE50%RE30%Base
42
44
46
48
50
52
54

98 | Power System Review 2016-17
As expected, Figure 5.7 shows the base forecast having higher system supplied demand than the solar scenarios. However, the difference between the base and the solar scenarios is relatively minor, indicating solar will not have a significant impact on the maximum demand outcomes.
5.3.3 Minimum demandAlice Springs experiences its annual minimum demand in the winter season, when temperatures are relatively cool with high levels of solar (relative to winters in the south of Australia).
Figures 5.8 and 5.9 outline the forecast minimum system demand. Figure 5.8 illustrates the difference in minimum system demand across different weather outcomes: POE 50 (one in two years) and POE 10 (particularly cool year that is predicted to occur one in 10 years).
Figure 5.8 Alice Springs annual minimum demand POE forecast to 2026‑27 (base)
Minimum demand is forecast to steadily decline over the next 10 years. Minimum demand is expected to start occurring during the day over the next few years in the base scenario. Issues associated with increasing penetration of solar are discussed further in 2.11.
In contrast to Figure 5.8, Figure 5.9 shows the POE 50 forecast of minimum system demand across the different solar scenarios.
Figure 5.9 Alice Springs annual minimum demand scenario forecast to 2026‑27 (POE 50)
14-15 15-16 16-17 17-18 18-19 19-20 20-21 21-22 22-23 23-24 24-25 25-26 26-27
Maximum demand (MW)
Financial year endingActual
0
2
4
6
8
10
12
14
POE 50 POE 90
14-15 15-16 16-17 17-18 18-19 19-20 20-21 21-22 22-23 23-24 24-25 25-26 26-27
Maximum demand (MW)
Financial year endingActual RE50%RE30%Base
-8
-6
-4
-2
0
2
4
6
8
10
12
14
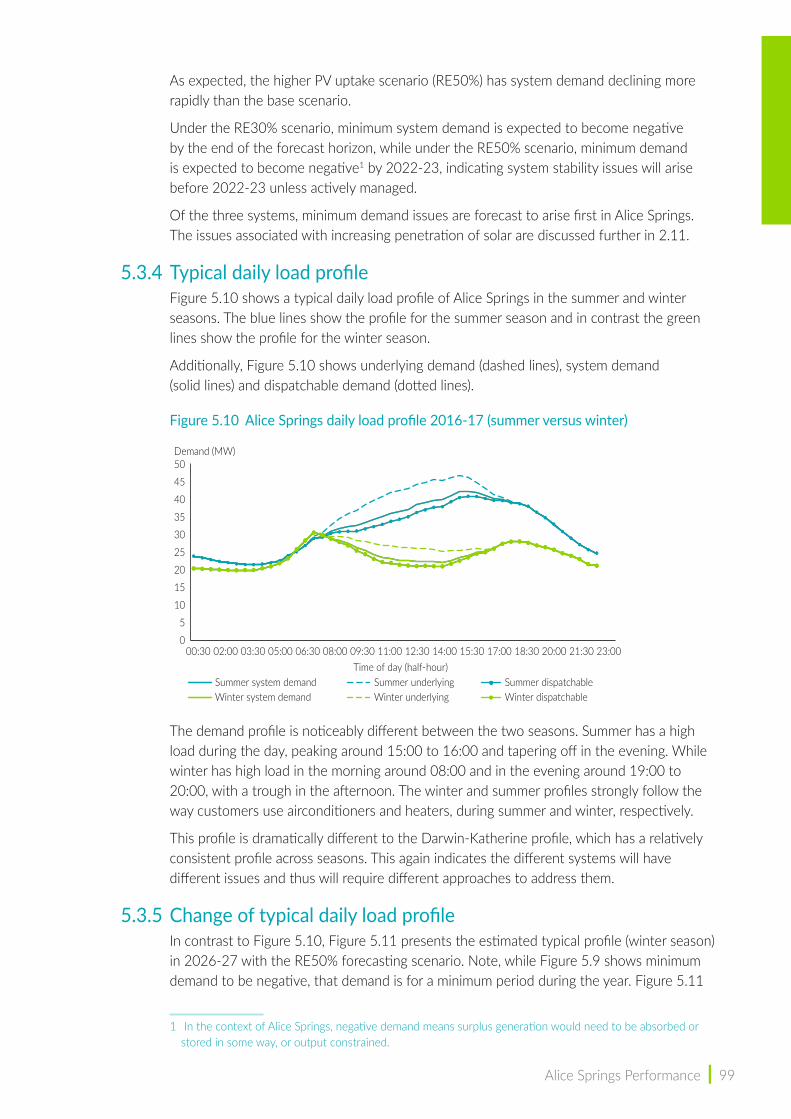
Alice Springs Performance | 99
As expected, the higher PV uptake scenario (RE50%) has system demand declining more rapidly than the base scenario.
Under the RE30% scenario, minimum system demand is expected to become negative by the end of the forecast horizon, while under the RE50% scenario, minimum demand is expected to become negative1 by 2022-23, indicating system stability issues will arise before 2022-23 unless actively managed.
Of the three systems, minimum demand issues are forecast to arise first in Alice Springs. The issues associated with increasing penetration of solar are discussed further in 2.11.
5.3.4 Typical daily load profileFigure 5.10 shows a typical daily load profile of Alice Springs in the summer and winter seasons. The blue lines show the profile for the summer season and in contrast the green lines show the profile for the winter season.
Additionally, Figure 5.10 shows underlying demand (dashed lines), system demand (solid lines) and dispatchable demand (dotted lines).
Figure 5.10 Alice Springs daily load profile 2016‑17 (summer versus winter)
The demand profile is noticeably different between the two seasons. Summer has a high load during the day, peaking around 15:00 to 16:00 and tapering off in the evening. While winter has high load in the morning around 08:00 and in the evening around 19:00 to 20:00, with a trough in the afternoon. The winter and summer profiles strongly follow the way customers use airconditioners and heaters, during summer and winter, respectively.
This profile is dramatically different to the Darwin-Katherine profile, which has a relatively consistent profile across seasons. This again indicates the different systems will have different issues and thus will require different approaches to address them.
5.3.5 Change of typical daily load profileIn contrast to Figure 5.10, Figure 5.11 presents the estimated typical profile (winter season) in 2026-27 with the RE50% forecasting scenario. Note, while Figure 5.9 shows minimum demand to be negative, that demand is for a minimum period during the year. Figure 5.11
1 In the context of Alice Springs, negative demand means surplus generation would need to be absorbed or stored in some way, or output constrained.
Demand (MW)
Time of day (half-hour)00:30 02:00 03:30 05:00 06:30 08:00 09:30 11:00 12:30 15:30 17:00 18:30 20:00 21:30 23:0014:00
Summer system demand Summer underlying Summer dispatchableWinter system demand Winter underlying Winter dispatchable
0
5
10
15
20
25
30
35
40
45
50
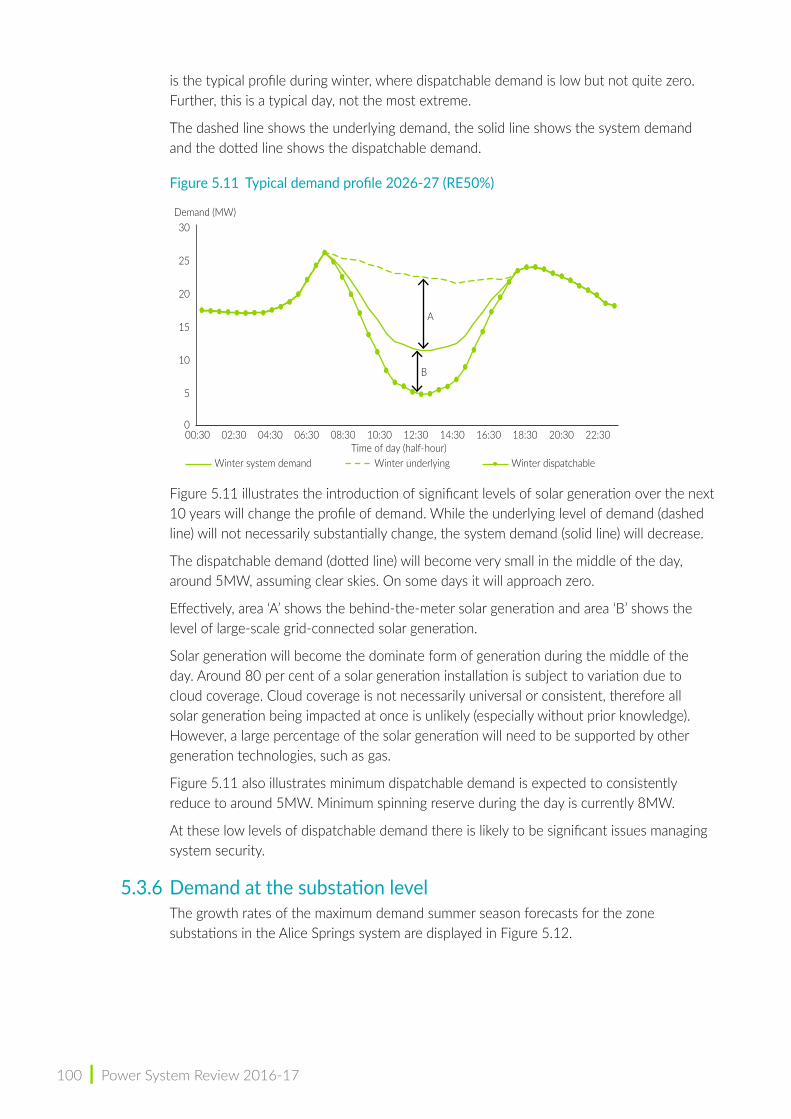
100 | Power System Review 2016-17
is the typical profile during winter, where dispatchable demand is low but not quite zero. Further, this is a typical day, not the most extreme.
The dashed line shows the underlying demand, the solid line shows the system demand and the dotted line shows the dispatchable demand.
Figure 5.11 Typical demand profile 2026‑27 (RE50%)
Figure 5.11 illustrates the introduction of significant levels of solar generation over the next 10 years will change the profile of demand. While the underlying level of demand (dashed line) will not necessarily substantially change, the system demand (solid line) will decrease.
The dispatchable demand (dotted line) will become very small in the middle of the day, around 5MW, assuming clear skies. On some days it will approach zero.
Effectively, area ‘A’ shows the behind-the-meter solar generation and area ‘B’ shows the level of large-scale grid-connected solar generation.
Solar generation will become the dominate form of generation during the middle of the day. Around 80 per cent of a solar generation installation is subject to variation due to cloud coverage. Cloud coverage is not necessarily universal or consistent, therefore all solar generation being impacted at once is unlikely (especially without prior knowledge). However, a large percentage of the solar generation will need to be supported by other generation technologies, such as gas.
Figure 5.11 also illustrates minimum dispatchable demand is expected to consistently reduce to around 5MW. Minimum spinning reserve during the day is currently 8MW.
At these low levels of dispatchable demand there is likely to be significant issues managing system security.
5.3.6 Demand at the substation levelThe growth rates of the maximum demand summer season forecasts for the zone substations in the Alice Springs system are displayed in Figure 5.12.
Demand (MW)
Time of day (half-hour)Winter system demand Winter underlying Winter dispatchable
00:30 02:30 04:30 06:30 08:30 10:30 12:30 14:30 16:30 18:30 20:30 22:300
5
10
15
20
25
30
A
B

Alice Springs Performance | 101
Figure 5.12 Zone substation growth rates (summer season, POE 10, 2017‑18 to 2026‑27)
Declining demand is driven by regional population growth and increasing forecast penetration of rooftop PV.
Increasing demand at Owen Springs (11/66kV) and Lovegrove (66/22kV) is due to the scheduled 2018 retirement of the Ron Goodin power station. This retirement will increase loads on these two substations, which connect the Owen Springs power station with the Alice Springs 22kV network. The majority of demand by 2018-19 is expected to be met by Owen Springs power station, with Uterne Solar Farm forecast to contribute 4MW to the summer season peak demand. Consequently, demand met by Owen Springs power station is seen at Owen Springs (11/66kV) and Lovegrove (66/22kV) substations.
The demand at substation level is likely to change significantly under a high penetration of solar scenario, with some feeders potentially becoming positive at certain times of the day.
5.4 Generation reliability5.4.1 N – X exposure
This assessment provides information on how many generators can be offline before a heightened risk of capacity issues. This section also looks at how often the system may be in a high-risk situation.
Specifically, Figure 5.13 shows the level of dispatchable capacity, given X number of generators being offline. For example, the first green column shows dispatchable capacity when all generators are operating, the second column shows capacity when the largest generator is offline and so on.
In contrast, the solid black line shows the level of capacity required to service maximum dispatchable demand, including reserves. However, if required System Control can reduce reserves. The dashed black line shows the absolute minimum (no reserves).
The blue diamonds provide an indication (right axis) of the likelihood the relevant number of generators would be offline. For example, 9 to 10 per cent of the time we are forecasting (given current outage rates) at least two of the largest generators would be offline. It is highly unlikely Alice Springs would have four generators offline at once.
-3.0 -2.0 -1.0 0.0 1.0 2.0 3.0 4.0 5.0 6.0 %
Ron Goodin Zone Substation (11kV)
Lovegrove Zone Substation (22/11 kV)
Brewer + Sadadeen (22 kV loads)
Lovegrove Zone Substation (22 kV load)
Owen Springs (11/66 kV)
Lovegrove Zone Substation (66/22 kV)
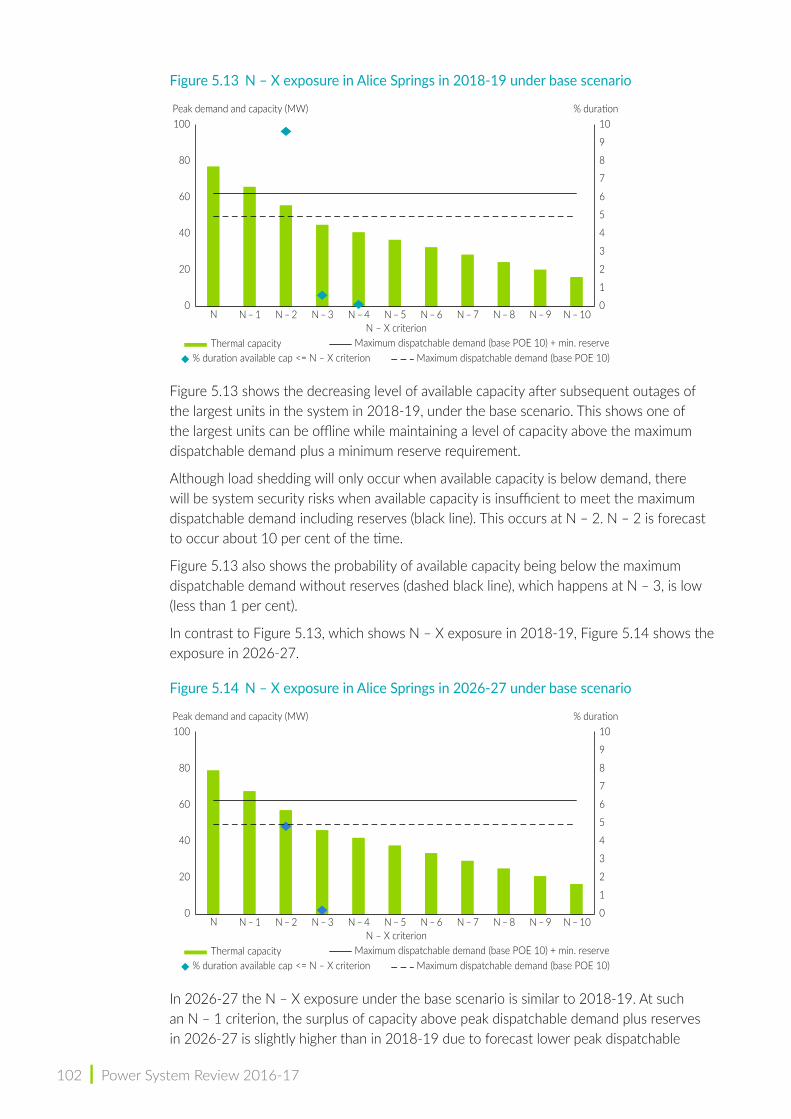
102 | Power System Review 2016-17
Figure 5.13 N – X exposure in Alice Springs in 2018‑19 under base scenario
Figure 5.13 shows the decreasing level of available capacity after subsequent outages of the largest units in the system in 2018-19, under the base scenario. This shows one of the largest units can be offline while maintaining a level of capacity above the maximum dispatchable demand plus a minimum reserve requirement.
Although load shedding will only occur when available capacity is below demand, there will be system security risks when available capacity is insufficient to meet the maximum dispatchable demand including reserves (black line). This occurs at N – 2. N – 2 is forecast to occur about 10 per cent of the time.
Figure 5.13 also shows the probability of available capacity being below the maximum dispatchable demand without reserves (dashed black line), which happens at N – 3, is low (less than 1 per cent).
In contrast to Figure 5.13, which shows N – X exposure in 2018-19, Figure 5.14 shows the exposure in 2026-27.
Figure 5.14 N – X exposure in Alice Springs in 2026‑27 under base scenario
In 2026-27 the N – X exposure under the base scenario is similar to 2018-19. At such an N – 1 criterion, the surplus of capacity above peak dispatchable demand plus reserves in 2026-27 is slightly higher than in 2018-19 due to forecast lower peak dispatchable
0
1
2
3
4
5
6
7
8
9
10
0
20
40
60
80
100
N N – 1 N – 2 N – 3 N – 4 N – 5 N – 6 N – 7 N – 8 N – 9 N – 10N – X criterion
% durationPeak demand and capacity (MW)
Thermal capacityMaximum dispatchable demand (base POE 10)
Maximum dispatchable demand (base POE 10) + min. reserve% duration available cap <= N – X criterion
0
1
2
3
4
5
6
7
8
9
10
0
20
40
60
80
100
N N – 1 N – 2 N – 3 N – 4 N – 5 N – 6 N – 7 N – 8 N – 9 N – 10N – X criterion
% durationPeak demand and capacity (MW)
Thermal capacityMaximum dispatchable demand (base POE 10)
Maximum dispatchable demand (base POE 10) + min. reserve% duration available cap <= N – X criterion
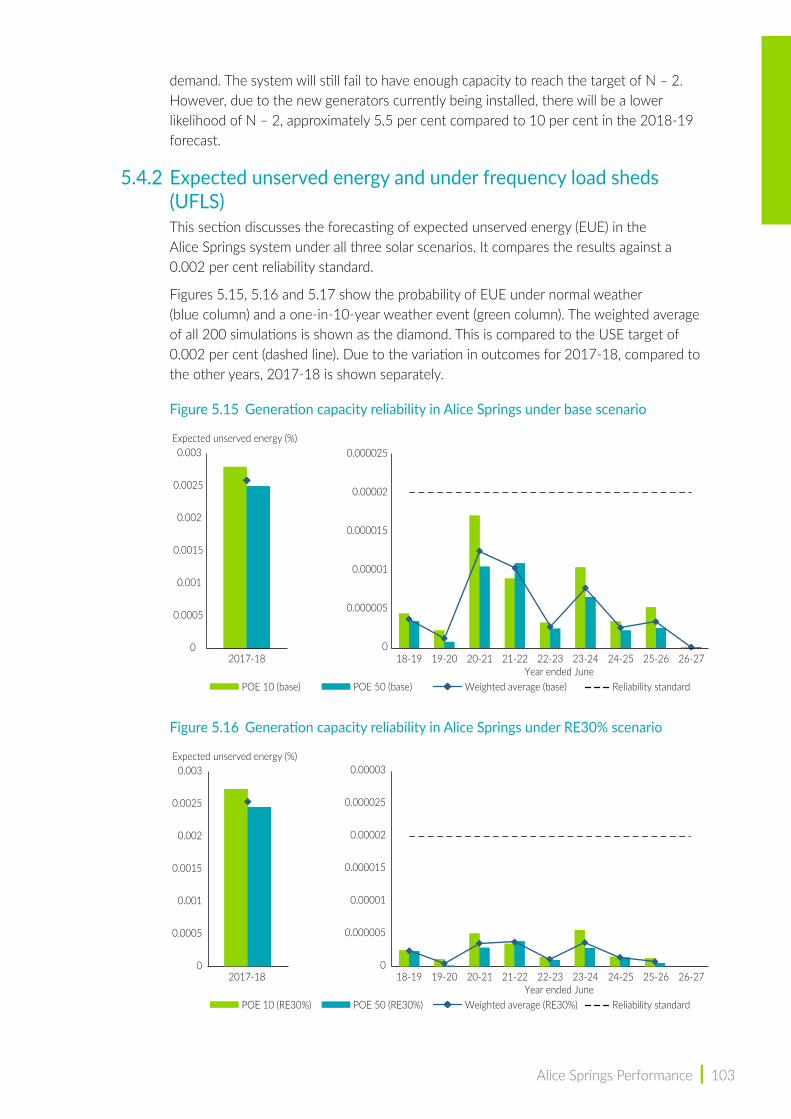
Alice Springs Performance | 103
demand. The system will still fail to have enough capacity to reach the target of N – 2. However, due to the new generators currently being installed, there will be a lower likelihood of N – 2, approximately 5.5 per cent compared to 10 per cent in the 2018-19 forecast.
5.4.2 Expected unserved energy and under frequency load sheds (UFLS)This section discusses the forecasting of expected unserved energy (EUE) in the Alice Springs system under all three solar scenarios. It compares the results against a 0.002 per cent reliability standard.
Figures 5.15, 5.16 and 5.17 show the probability of EUE under normal weather (blue column) and a one-in-10-year weather event (green column). The weighted average of all 200 simulations is shown as the diamond. This is compared to the USE target of 0.002 per cent (dashed line). Due to the variation in outcomes for 2017-18, compared to the other years, 2017-18 is shown separately.
Figure 5.15 Generation capacity reliability in Alice Springs under base scenario
Figure 5.16 Generation capacity reliability in Alice Springs under RE30% scenario
Year ended June
0
0.0005
0.001
0.0015
0.002
0.0025
0.003
2017-18
Expected unserved energy (%)
0
0.000005
0.00001
0.000015
0.00002
0.000025
18-19 19-20 20-21 21-22 22-23 23-24 24-25 25-26 26-27
POE 10 (base) POE 50 (base) Weighted average (base) Reliability standard
Year ended June
0
0.0005
0.001
0.0015
0.002
0.0025
0.003
2017-18
Expected unserved energy (%)
18-19 19-20 20-21 21-22 22-23 23-24 24-25 25-26 26-27
POE 10 (RE30%) POE 50 (RE30%) Weighted average (RE30%) Reliability standard
0
0.000005
0.00001
0.000015
0.00002
0.000025
0.00003
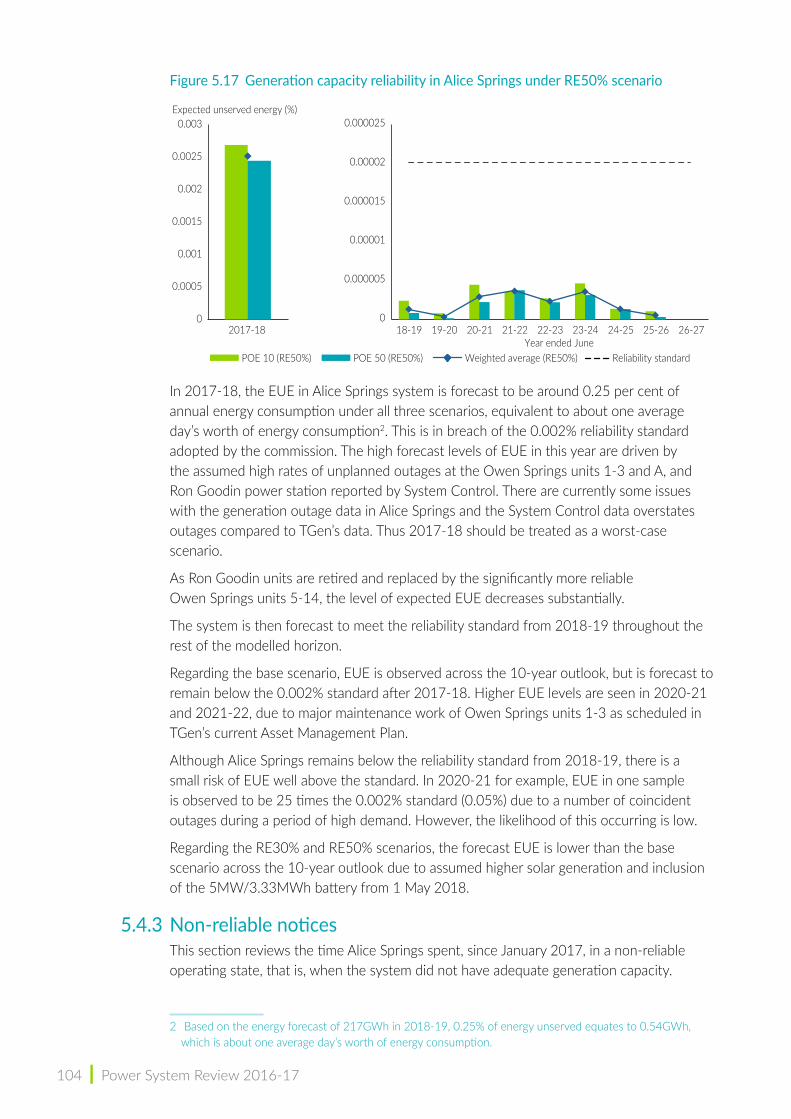
104 | Power System Review 2016-17
Figure 5.17 Generation capacity reliability in Alice Springs under RE50% scenario
In 2017-18, the EUE in Alice Springs system is forecast to be around 0.25 per cent of annual energy consumption under all three scenarios, equivalent to about one average day’s worth of energy consumption2. This is in breach of the 0.002% reliability standard adopted by the commission. The high forecast levels of EUE in this year are driven by the assumed high rates of unplanned outages at the Owen Springs units 1-3 and A, and Ron Goodin power station reported by System Control. There are currently some issues with the generation outage data in Alice Springs and the System Control data overstates outages compared to TGen’s data. Thus 2017-18 should be treated as a worst-case scenario.
As Ron Goodin units are retired and replaced by the significantly more reliable Owen Springs units 5-14, the level of expected EUE decreases substantially.
The system is then forecast to meet the reliability standard from 2018-19 throughout the rest of the modelled horizon.
Regarding the base scenario, EUE is observed across the 10-year outlook, but is forecast to remain below the 0.002% standard after 2017-18. Higher EUE levels are seen in 2020-21 and 2021-22, due to major maintenance work of Owen Springs units 1-3 as scheduled in TGen’s current Asset Management Plan.
Although Alice Springs remains below the reliability standard from 2018-19, there is a small risk of EUE well above the standard. In 2020-21 for example, EUE in one sample is observed to be 25 times the 0.002% standard (0.05%) due to a number of coincident outages during a period of high demand. However, the likelihood of this occurring is low.
Regarding the RE30% and RE50% scenarios, the forecast EUE is lower than the base scenario across the 10-year outlook due to assumed higher solar generation and inclusion of the 5MW/3.33MWh battery from 1 May 2018.
5.4.3 Non‑reliable noticesThis section reviews the time Alice Springs spent, since January 2017, in a non-reliable operating state, that is, when the system did not have adequate generation capacity.
2 Based on the energy forecast of 217GWh in 2018-19, 0.25% of energy unserved equates to 0.54GWh, which is about one average day’s worth of energy consumption.
Year ended June
0
0.0005
0.001
0.0015
0.002
0.0025
0.003
2017-18
Expected unserved energy (%)
18-19 19-20 20-21 21-22 22-23 23-24 24-25 25-26 26-27
POE 10 (RE50%) POE 50 (RE50%) Weighted average (RE50%) Reliability standard
0
0.000005
0.00001
0.000015
0.00002
0.000025

Alice Springs Performance | 105
Figure 5.18 sets out the duration (hours) by month on the left axis (green columns) and the frequency of notices by month on the right axis (blue line).
Figure 5.18 Non‑reliable notices for Alice Springs
Since January 2017, although not consistent, Alice Springs has started to have a couple of notices a month. With the limited data available it is difficult to see any trends.
5.5 Security5.5.1 Constraints
The number of constraints placed on Alice Springs has been increasing. There are a number of constraints placed on maximum voltage levels through certain network assets. This has led to some further constraints placed on generation at Owen Springs power station to avoid network assets getting overloaded.
5.5.2 Observed UFLS and single generation tripsFigure 5.19 compares the number of UFLS due to single generation trips (green line – right axis) against generation trips (blue line – left axis).
Figure 5.19 Single generation tips versus UFLS
January 2016 to June 2017
0
0.5
1
1.5
2
2.5
3
3.5
4
4.5
0
200
400
600
800
1000
1200FrequencyDuration (hours)
Duration Frequency
Jan Mar Jul Sep Nov Jan May JunAprFeb MarMay Jun Aug Oct Feb AprDec
0
2
4
6
8
10
12
0
5
10
15
20
25
30
35
2012-13 2013-14 2014-15 2015-16 2016-17
UFLSSingle genertor trips
Year ended JuneSingle generator trips UFLS
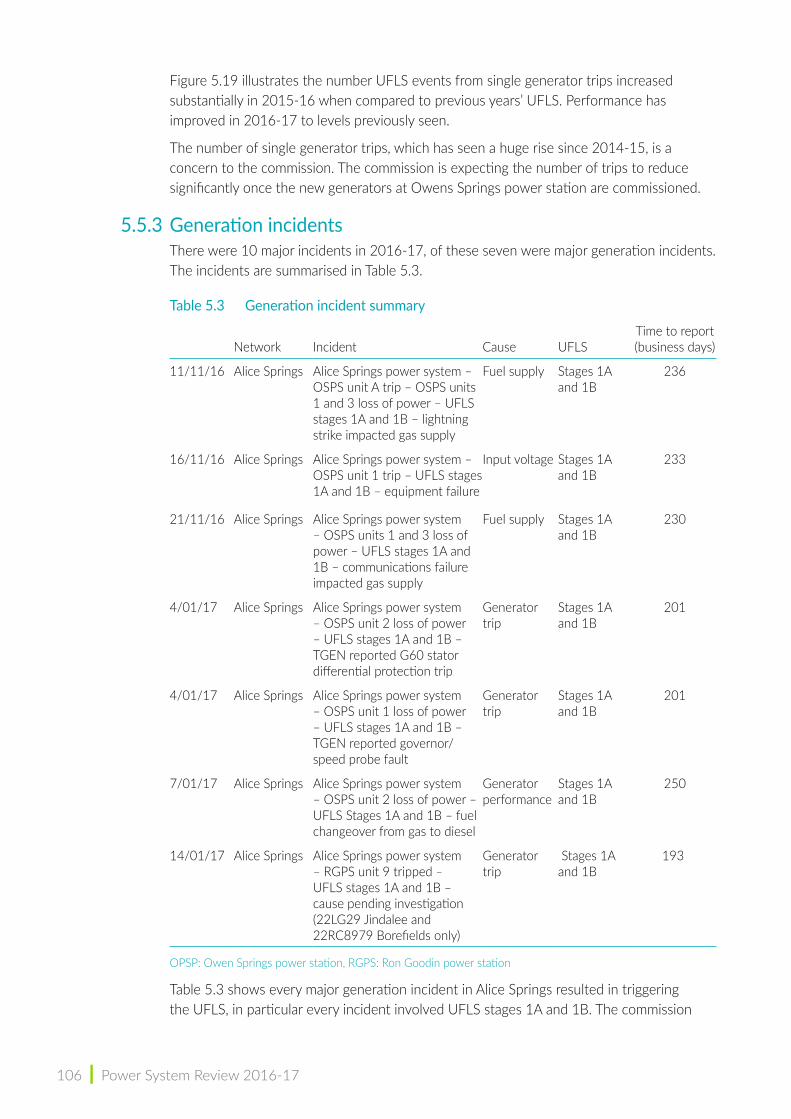
106 | Power System Review 2016-17
Figure 5.19 illustrates the number UFLS events from single generator trips increased substantially in 2015-16 when compared to previous years’ UFLS. Performance has improved in 2016-17 to levels previously seen.
The number of single generator trips, which has seen a huge rise since 2014-15, is a concern to the commission. The commission is expecting the number of trips to reduce significantly once the new generators at Owens Springs power station are commissioned.
5.5.3 Generation incidentsThere were 10 major incidents in 2016-17, of these seven were major generation incidents. The incidents are summarised in Table 5.3.
Table 5.3 Generation incident summary
Network Incident Cause UFLSTime to report (business days)
11/11/16 Alice Springs Alice Springs power system – OSPS unit A trip – OSPS units 1 and 3 loss of power – UFLS stages 1A and 1B – lightning strike impacted gas supply
Fuel supply Stages 1A and 1B
236
16/11/16 Alice Springs Alice Springs power system – OSPS unit 1 trip – UFLS stages 1A and 1B – equipment failure
Input voltage Stages 1A and 1B
233
21/11/16 Alice Springs Alice Springs power system – OSPS units 1 and 3 loss of power – UFLS stages 1A and 1B – communications failure impacted gas supply
Fuel supply Stages 1A and 1B
230
4/01/17 Alice Springs Alice Springs power system – OSPS unit 2 loss of power – UFLS stages 1A and 1B – TGEN reported G60 stator differential protection trip
Generator trip
Stages 1A and 1B
201
4/01/17 Alice Springs Alice Springs power system – OSPS unit 1 loss of power – UFLS stages 1A and 1B – TGEN reported governor/speed probe fault
Generator trip
Stages 1A and 1B
201
7/01/17 Alice Springs Alice Springs power system – OSPS unit 2 loss of power – UFLS Stages 1A and 1B – fuel changeover from gas to diesel
Generator performance
Stages 1A and 1B
250
14/01/17 Alice Springs Alice Springs power system – RGPS unit 9 tripped – UFLS stages 1A and 1B – cause pending investigation (22LG29 Jindalee and 22RC8979 Borefields only)
Generator trip
Stages 1A and 1B
193
OPSP: Owen Springs power station, RGPS: Ron Goodin power station
Table 5.3 shows every major generation incident in Alice Springs resulted in triggering the UFLS, in particular every incident involved UFLS stages 1A and 1B. The commission

Alice Springs Performance | 107
understands that System Control rotates the UFLS stages between customers to ensure the same customers are not always affected.
The duration between the incident and the time at which the report is finalised is an area of concern for the commission.
A summary of the key recommendations arising from the incident investigations in Alice Springs are presented in Table 5.4.
Table 5.4 Recommendations identified in the generation incident investigation reports
Recommendation
Owen Springs trips Seamless fuel changeover of generators
TESLA recorder equipment installed/repaired
Review of work conducted on offline machines that may pose a risk to online machines
Better scheduling of work
Maintenance work on equipment
Review generator operating characteristics and performance
Ron Goodin trip
TESLA recorder equipment installed/repaired
Review generator operating characteristics and performance
The commission has observed a recurring theme in the final incident report recommendations that certain Alice Springs generation assets may benefit from the installation of TESLA recording equipment.
5.5.4 System Average Interruption Duration Index (SAIDI) and System Average Interruption Frequency Index (SAIFI) generationThe SAIDI and SAIFI performance for the Alice Springs generating units is presented in Figure 5.20.
The columns set out the SAIDI performance (left axis). This is compared to the SAIFI outcomes (right axis). Note, in contrast to SAIDI and SAIFI for networks, there are no targets set for generators. This analysis seeks to understand trends and changes over time. SAIDI shows the average duration of events, while SAIFI shows the frequency of events, in this case events relating to generators. For both indices, the lower the better.

108 | Power System Review 2016-17
Figure 5.20 SAIDI and SAIFI performance indices for generation, Alice Springs
Figure 5.20 illustrates SAIDI has been trending down since 2011-12, except for 2015-16 where a system black caused the SAIDI to significantly increase. Similarly, SAIFI has been trending down since 2011-12 except for 2015-16, which included a system black.
5.6 Network performanceCurrent targets are set for distribution and transmission performance. Targets are set for the three systems as a whole, but this review also compares the outcomes to the targets for each system to understand how each region contributes to achievement of the targets.
Two key measures are used to measure the performance of the distribution assets, SAIDI and SAIFI.
Four key measures are used to measure the performance of the transmission assets:
• ACOD – average length of the outage
• FCO – frequency of circuit outages, the number of incidents over a period of time
• ATOD – average length of outages caused by transformer issues
• FTO – number of incidents across a period of time.
5.6.1 DistributionSAIDITable 5.5 shows Power and Water Corporation’s (PWC) reported performance (annual reporting), using current feeder definitions, against its current SAIDI targets. Figures in red indicate instances where PWC has not achieved its targets.
Table 5.5 Current SAIDI performance
Target standard 2012-13 2013-14 2014-15 2015-16 2016-17
5-year average
CBD - - - - - - -
Urban 136 54 25 215 133 86 102
Rural short 496 123 16 44 40 213 87
Rural long - - - - - - -
0 0
50
100
150
200
250
300
350
1.0
2.0
3.0
4.0
5.0
6.0Indices
Year ending June
Indices
Generation SAIDI Generation SAIFI
12-13 13-14 14-15 15-1608-09 09-10 10-11 11-12 16-17
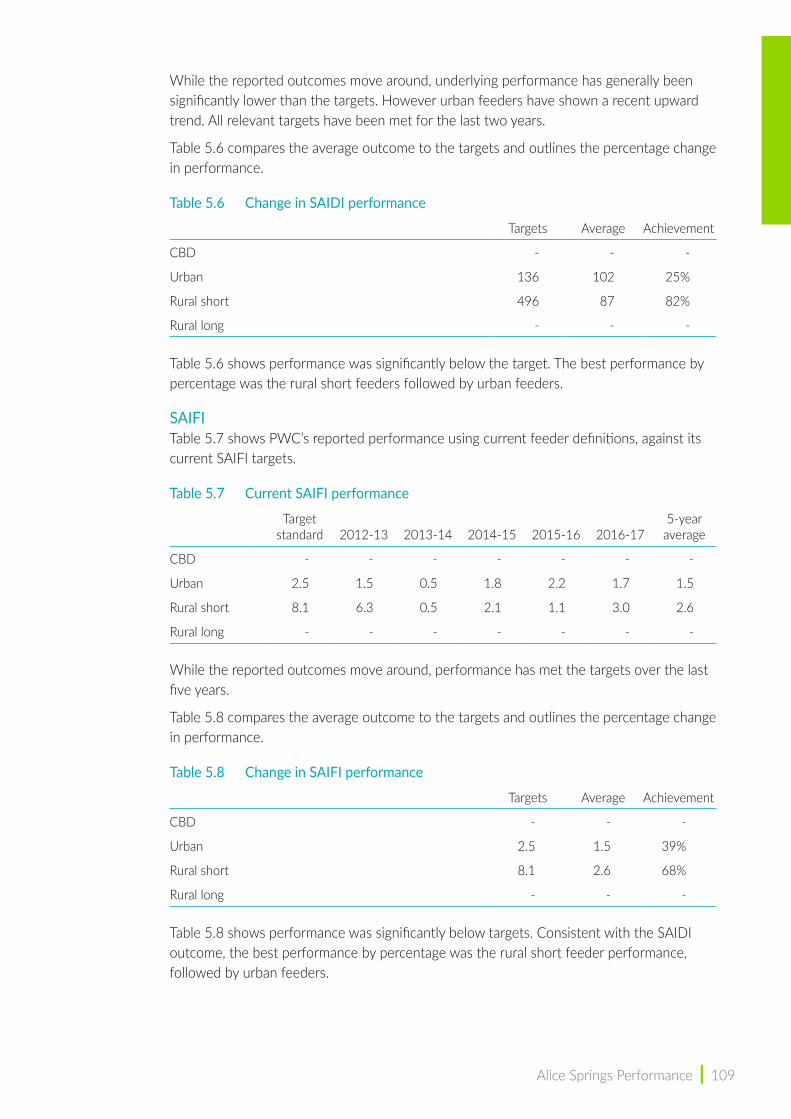
Alice Springs Performance | 109
While the reported outcomes move around, underlying performance has generally been significantly lower than the targets. However urban feeders have shown a recent upward trend. All relevant targets have been met for the last two years.
Table 5.6 compares the average outcome to the targets and outlines the percentage change in performance.
Table 5.6 Change in SAIDI performance
Targets Average Achievement
CBD - - -
Urban 136 102 25%
Rural short 496 87 82%
Rural long - - -
Table 5.6 shows performance was significantly below the target. The best performance by percentage was the rural short feeders followed by urban feeders.
SAIFITable 5.7 shows PWC’s reported performance using current feeder definitions, against its current SAIFI targets.
Table 5.7 Current SAIFI performance
Target standard 2012-13 2013-14 2014-15 2015-16 2016-17
5-year average
CBD - - - - - - -
Urban 2.5 1.5 0.5 1.8 2.2 1.7 1.5
Rural short 8.1 6.3 0.5 2.1 1.1 3.0 2.6
Rural long - - - - - - -
While the reported outcomes move around, performance has met the targets over the last five years.
Table 5.8 compares the average outcome to the targets and outlines the percentage change in performance.
Table 5.8 Change in SAIFI performance
Targets Average Achievement
CBD - - -
Urban 2.5 1.5 39%
Rural short 8.1 2.6 68%
Rural long - - -
Table 5.8 shows performance was significantly below targets. Consistent with the SAIDI outcome, the best performance by percentage was the rural short feeder performance, followed by urban feeders.
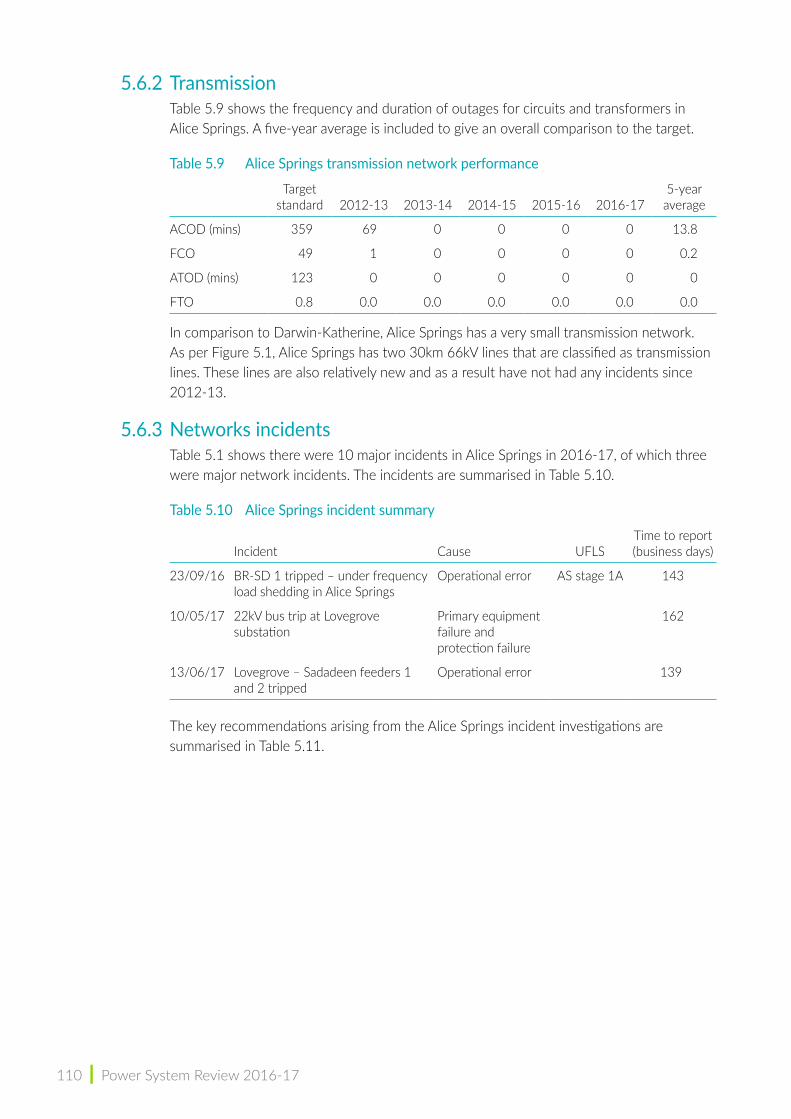
110 | Power System Review 2016-17
5.6.2 TransmissionTable 5.9 shows the frequency and duration of outages for circuits and transformers in Alice Springs. A five-year average is included to give an overall comparison to the target.
Table 5.9 Alice Springs transmission network performance
Target standard 2012-13 2013-14 2014-15 2015-16 2016-17
5-year average
ACOD (mins) 359 69 0 0 0 0 13.8
FCO 49 1 0 0 0 0 0.2
ATOD (mins) 123 0 0 0 0 0 0
FTO 0.8 0.0 0.0 0.0 0.0 0.0 0.0
In comparison to Darwin-Katherine, Alice Springs has a very small transmission network. As per Figure 5.1, Alice Springs has two 30km 66kV lines that are classified as transmission lines. These lines are also relatively new and as a result have not had any incidents since 2012-13.
5.6.3 Networks incidents Table 5.1 shows there were 10 major incidents in Alice Springs in 2016-17, of which three were major network incidents. The incidents are summarised in Table 5.10.
Table 5.10 Alice Springs incident summary
Incident Cause UFLSTime to report (business days)
23/09/16 BR-SD 1 tripped – under frequency load shedding in Alice Springs
Operational error AS stage 1A 143
10/05/17 22kV bus trip at Lovegrove substation
Primary equipment failure and protection failure
162
13/06/17 Lovegrove – Sadadeen feeders 1 and 2 tripped
Operational error 139
The key recommendations arising from the Alice Springs incident investigations are summarised in Table 5.11.
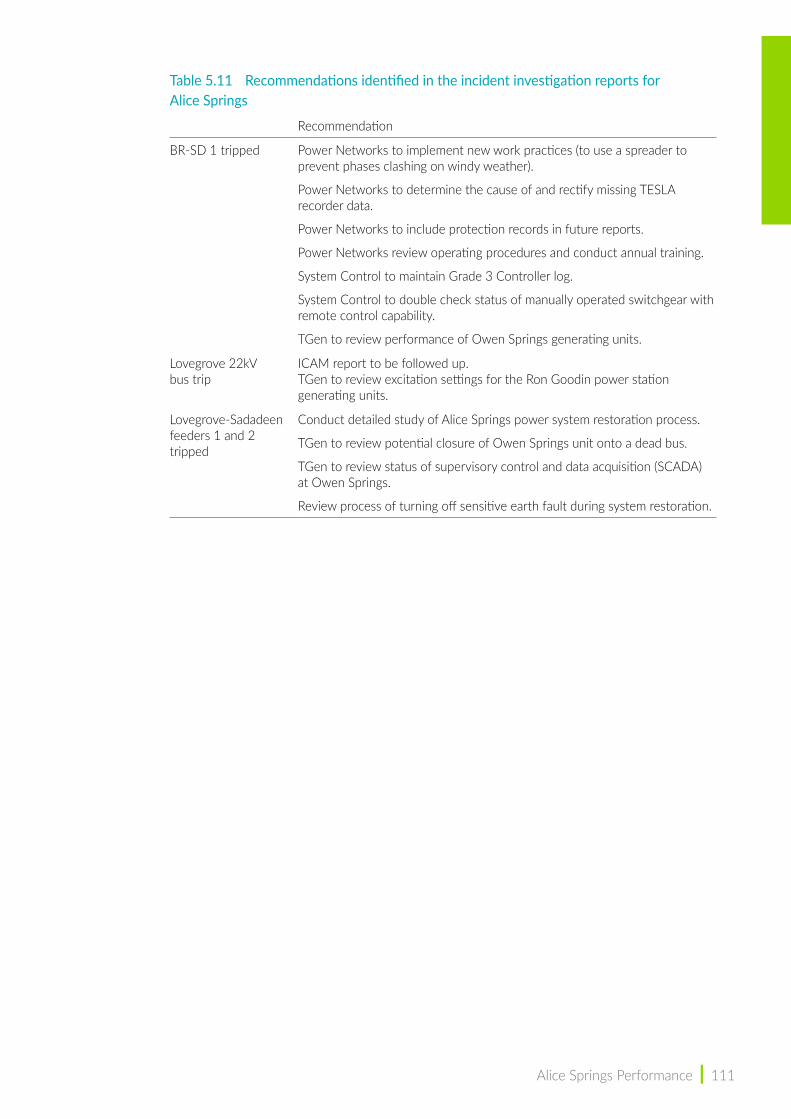
Alice Springs Performance | 111
Table 5.11 Recommendations identified in the incident investigation reports for Alice Springs
Recommendation
BR-SD 1 tripped Power Networks to implement new work practices (to use a spreader to prevent phases clashing on windy weather).
Power Networks to determine the cause of and rectify missing TESLA recorder data.
Power Networks to include protection records in future reports.
Power Networks review operating procedures and conduct annual training.
System Control to maintain Grade 3 Controller log.
System Control to double check status of manually operated switchgear with remote control capability.
TGen to review performance of Owen Springs generating units.
Lovegrove 22kV bus trip
ICAM report to be followed up. TGen to review excitation settings for the Ron Goodin power station generating units.
Lovegrove-Sadadeen feeders 1 and 2 tripped
Conduct detailed study of Alice Springs power system restoration process.
TGen to review potential closure of Owen Springs unit onto a dead bus.
TGen to review status of supervisory control and data acquisition (SCADA) at Owen Springs.
Review process of turning off sensitive earth fault during system restoration.

6|Tennant Creek Performance
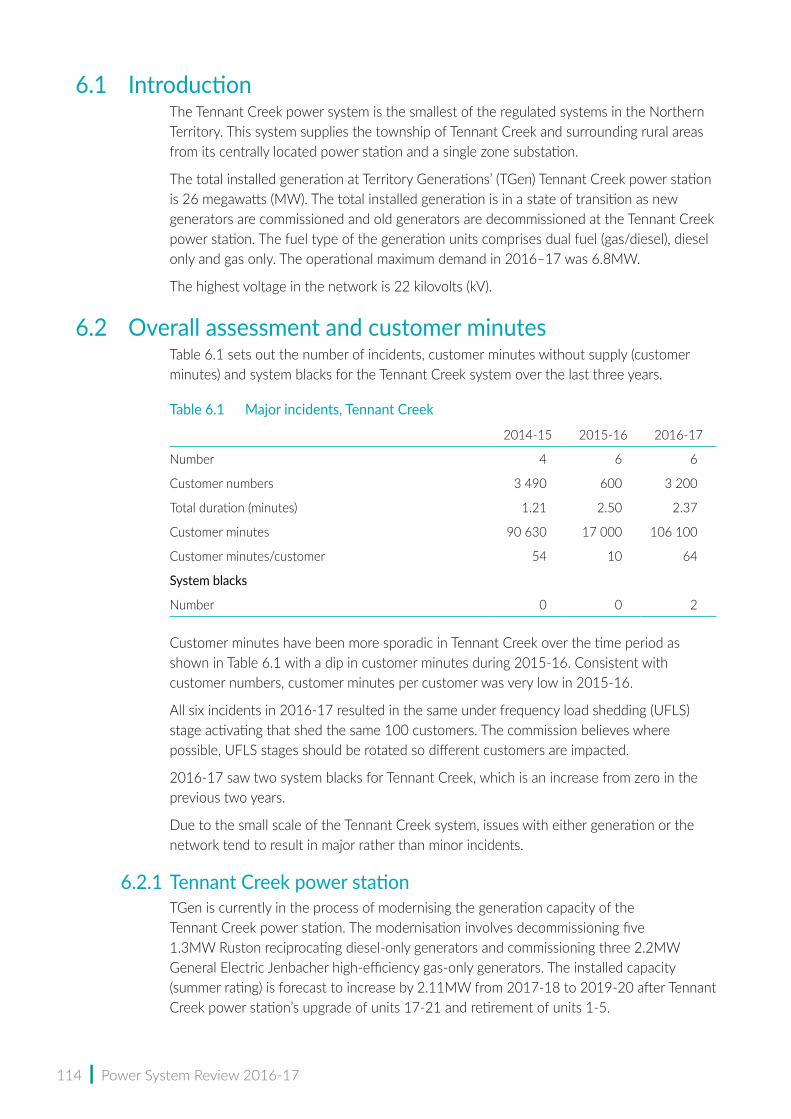
114 | Power System Review 2016-17
6.1 Introduction The Tennant Creek power system is the smallest of the regulated systems in the Northern Territory. This system supplies the township of Tennant Creek and surrounding rural areas from its centrally located power station and a single zone substation.
The total installed generation at Territory Generations’ (TGen) Tennant Creek power station is 26 megawatts (MW). The total installed generation is in a state of transition as new generators are commissioned and old generators are decommissioned at the Tennant Creek power station. The fuel type of the generation units comprises dual fuel (gas/diesel), diesel only and gas only. The operational maximum demand in 2016–17 was 6.8MW.
The highest voltage in the network is 22 kilovolts (kV).
6.2 Overall assessment and customer minutesTable 6.1 sets out the number of incidents, customer minutes without supply (customer minutes) and system blacks for the Tennant Creek system over the last three years.
Table 6.1 Major incidents, Tennant Creek
2014-15 2015-16 2016-17
Number 4 6 6
Customer numbers 3 490 600 3 200
Total duration (minutes) 1.21 2.50 2.37
Customer minutes 90 630 17 000 106 100
Customer minutes/customer 54 10 64
System blacks
Number 0 0 2
Customer minutes have been more sporadic in Tennant Creek over the time period as shown in Table 6.1 with a dip in customer minutes during 2015-16. Consistent with customer numbers, customer minutes per customer was very low in 2015-16.
All six incidents in 2016-17 resulted in the same under frequency load shedding (UFLS) stage activating that shed the same 100 customers. The commission believes where possible, UFLS stages should be rotated so different customers are impacted.
2016-17 saw two system blacks for Tennant Creek, which is an increase from zero in the previous two years.
Due to the small scale of the Tennant Creek system, issues with either generation or the network tend to result in major rather than minor incidents.
6.2.1 Tennant Creek power stationTGen is currently in the process of modernising the generation capacity of the Tennant Creek power station. The modernisation involves decommissioning five 1.3MW Ruston reciprocating diesel-only generators and commissioning three 2.2MW General Electric Jenbacher high-efficiency gas-only generators. The installed capacity (summer rating) is forecast to increase by 2.11MW from 2017-18 to 2019-20 after Tennant Creek power station’s upgrade of units 17-21 and retirement of units 1-5.
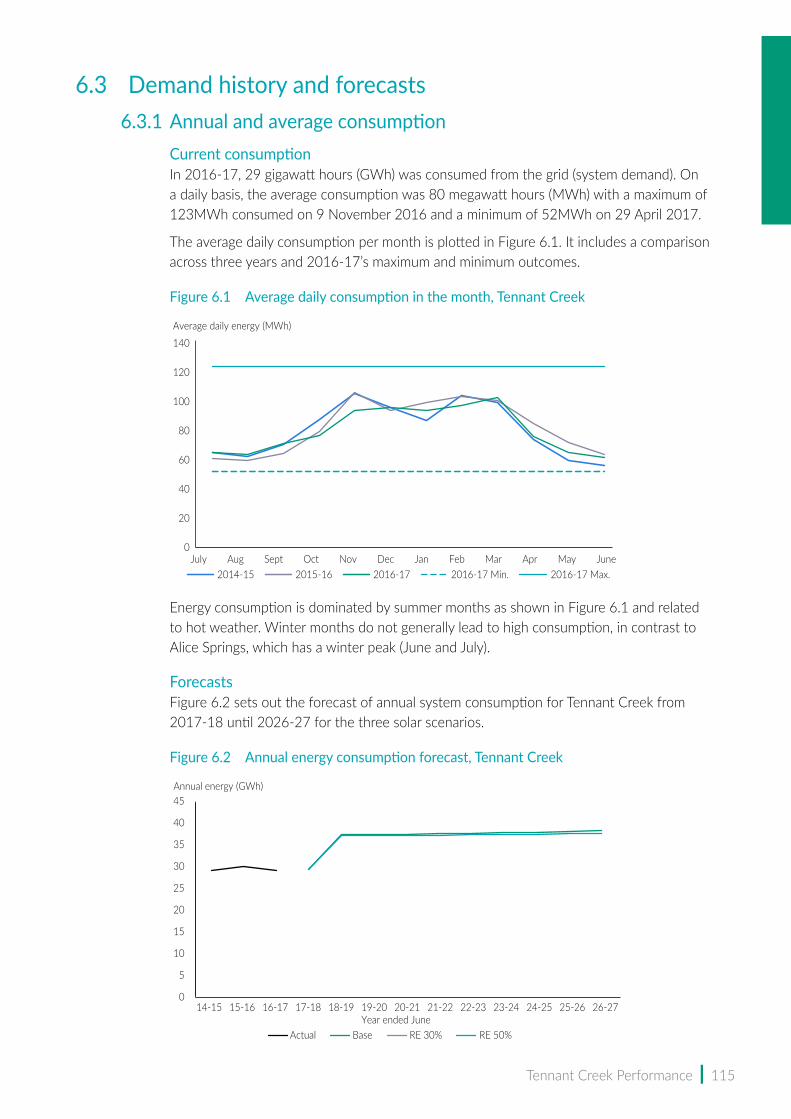
Tennant Creek Performance | 115
6.3 Demand history and forecasts6.3.1 Annual and average consumption
Current consumptionIn 2016-17, 29 gigawatt hours (GWh) was consumed from the grid (system demand). On a daily basis, the average consumption was 80 megawatt hours (MWh) with a maximum of 123MWh consumed on 9 November 2016 and a minimum of 52MWh on 29 April 2017.
The average daily consumption per month is plotted in Figure 6.1. It includes a comparison across three years and 2016-17’s maximum and minimum outcomes.
Figure 6.1 Average daily consumption in the month, Tennant Creek
Energy consumption is dominated by summer months as shown in Figure 6.1 and related to hot weather. Winter months do not generally lead to high consumption, in contrast to Alice Springs, which has a winter peak (June and July).
ForecastsFigure 6.2 sets out the forecast of annual system consumption for Tennant Creek from 2017-18 until 2026-27 for the three solar scenarios.
Figure 6.2 Annual energy consumption forecast, Tennant Creek
0
20
40
60
80
100
120
140
July Aug Sept Oct Nov Dec Jan Feb Mar Apr May June
Average daily energy (MWh)
2014-15 2015-16 2016-17 2016-17 Min. 2016-17 Max.
14-15 15-16 16-17 17-18 18-19 19-20 20-21 21-22 22-23 23-24 24-25 25-26 26-27Year ended June
RE 50%RE 30%Base
Annual energy (GWh)
0
5
10
15
20
25
30
35
40
45
Actual
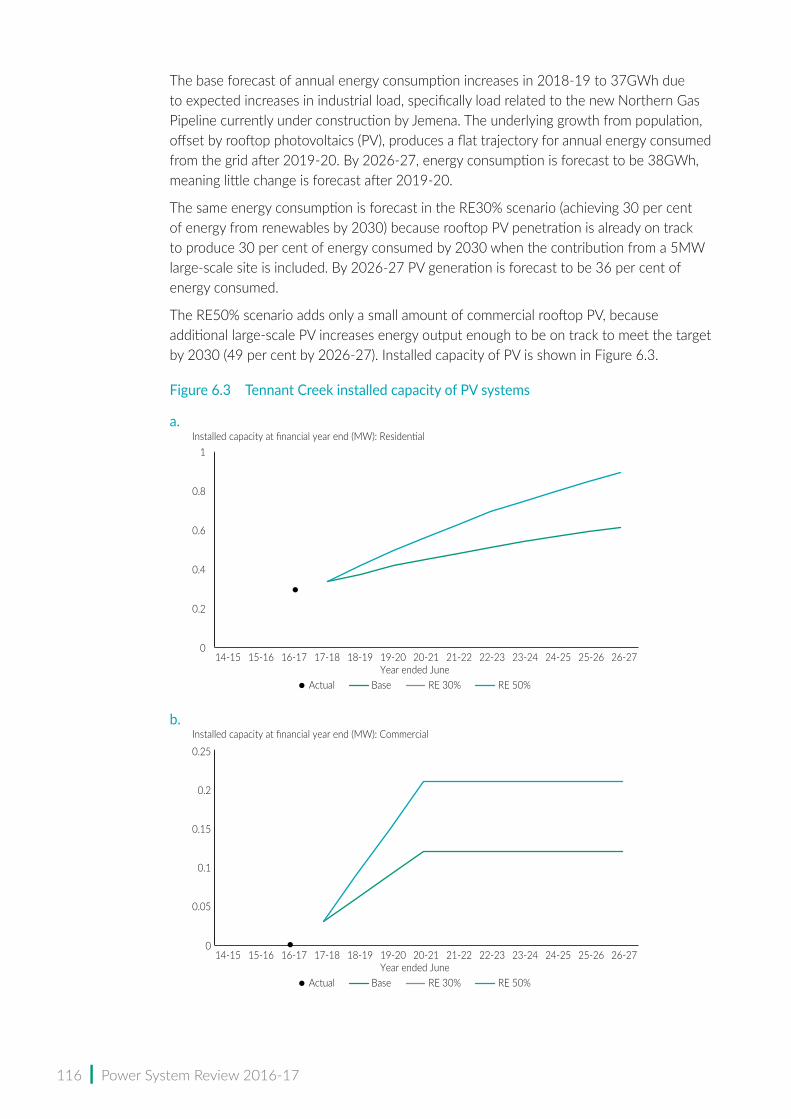
116 | Power System Review 2016-17
The base forecast of annual energy consumption increases in 2018-19 to 37GWh due to expected increases in industrial load, specifically load related to the new Northern Gas Pipeline currently under construction by Jemena. The underlying growth from population, offset by rooftop photovoltaics (PV), produces a flat trajectory for annual energy consumed from the grid after 2019-20. By 2026-27, energy consumption is forecast to be 38GWh, meaning little change is forecast after 2019-20.
The same energy consumption is forecast in the RE30% scenario (achieving 30 per cent of energy from renewables by 2030) because rooftop PV penetration is already on track to produce 30 per cent of energy consumed by 2030 when the contribution from a 5MW large-scale site is included. By 2026-27 PV generation is forecast to be 36 per cent of energy consumed.
The RE50% scenario adds only a small amount of commercial rooftop PV, because additional large-scale PV increases energy output enough to be on track to meet the target by 2030 (49 per cent by 2026-27). Installed capacity of PV is shown in Figure 6.3.
Figure 6.3 Tennant Creek installed capacity of PV systems
a.
b.
14-15 15-16 16-17 17-18 18-19 19-20 20-21 21-22 22-23 23-24 24-25 25-26 26-27Year ended June
Actual RE 50%RE 30%
Installed capacity at financial year end (MW): Residential
0
0.2
0.4
0.6
0.8
1
Base
14-15 15-16 16-17 17-18 18-19 19-20 20-21 21-22 22-23 23-24 24-25 25-26 26-27Year ended June
Actual RE 50%RE 30%
Installed capacity at financial year end (MW): Commercial
0
Base
0.05
0.1
0.15
0.2
0.25
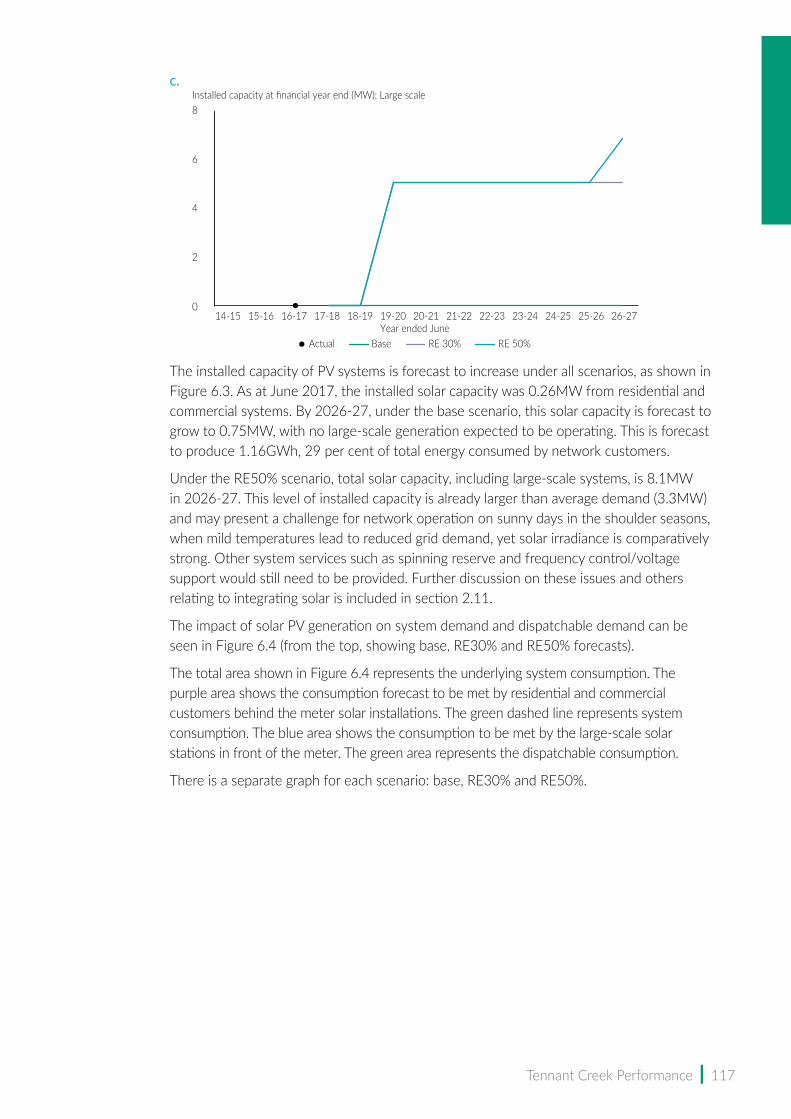
Tennant Creek Performance | 117
c.
The installed capacity of PV systems is forecast to increase under all scenarios, as shown in Figure 6.3. As at June 2017, the installed solar capacity was 0.26MW from residential and commercial systems. By 2026-27, under the base scenario, this solar capacity is forecast to grow to 0.75MW, with no large-scale generation expected to be operating. This is forecast to produce 1.16GWh, 29 per cent of total energy consumed by network customers.
Under the RE50% scenario, total solar capacity, including large-scale systems, is 8.1MW in 2026-27. This level of installed capacity is already larger than average demand (3.3MW) and may present a challenge for network operation on sunny days in the shoulder seasons, when mild temperatures lead to reduced grid demand, yet solar irradiance is comparatively strong. Other system services such as spinning reserve and frequency control/voltage support would still need to be provided. Further discussion on these issues and others relating to integrating solar is included in section 2.11.
The impact of solar PV generation on system demand and dispatchable demand can be seen in Figure 6.4 (from the top, showing base, RE30% and RE50% forecasts).
The total area shown in Figure 6.4 represents the underlying system consumption. The purple area shows the consumption forecast to be met by residential and commercial customers behind the meter solar installations. The green dashed line represents system consumption. The blue area shows the consumption to be met by the large-scale solar stations in front of the meter. The green area represents the dispatchable consumption.
There is a separate graph for each scenario: base, RE30% and RE50%.
14-15 15-16 16-17 17-18 18-19 19-20 20-21 21-22 22-23 23-24 24-25 25-26 26-27Year ended June
Actual RE 50%RE 30%
Installed capacity at financial year end (MW): Large scale
0
Base
2
4
6
8

118 | Power System Review 2016-17
Figure 6.4 Energy consumption as met by generationa. Base
b. RE30%
c. RE50%
14-15 15-16 16-17 17-18 18-19 19-20 20-21 21-22 22-23 23-24 24-25 25-26 26-27Year ended June
Annual energy (GWh)
System consumption, met by dispatchable generationLarge-scale PV resource potential
Forecast (base)Actual dispatchable generation
Energy consumption met by residential and commercial PV
0
5
10
15
20
25
30
35
40
45
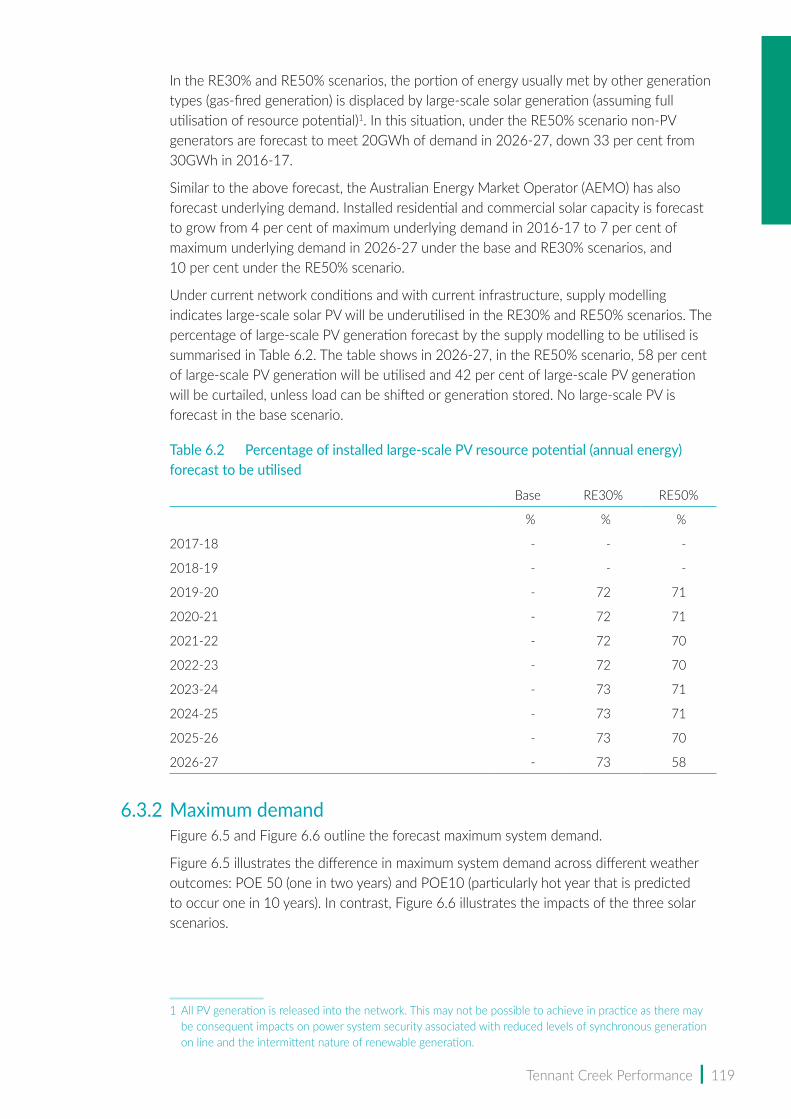
Tennant Creek Performance | 119
In the RE30% and RE50% scenarios, the portion of energy usually met by other generation types (gas-fired generation) is displaced by large-scale solar generation (assuming full utilisation of resource potential)1. In this situation, under the RE50% scenario non-PV generators are forecast to meet 20GWh of demand in 2026-27, down 33 per cent from 30GWh in 2016-17.
Similar to the above forecast, the Australian Energy Market Operator (AEMO) has also forecast underlying demand. Installed residential and commercial solar capacity is forecast to grow from 4 per cent of maximum underlying demand in 2016-17 to 7 per cent of maximum underlying demand in 2026-27 under the base and RE30% scenarios, and 10 per cent under the RE50% scenario.
Under current network conditions and with current infrastructure, supply modelling indicates large-scale solar PV will be underutilised in the RE30% and RE50% scenarios. The percentage of large-scale PV generation forecast by the supply modelling to be utilised is summarised in Table 6.2. The table shows in 2026-27, in the RE50% scenario, 58 per cent of large-scale PV generation will be utilised and 42 per cent of large-scale PV generation will be curtailed, unless load can be shifted or generation stored. No large-scale PV is forecast in the base scenario.
Table 6.2 Percentage of installed large‑scale PV resource potential (annual energy) forecast to be utilised
Base RE30% RE50%
% % %
2017-18 - - -
2018-19 - - -
2019-20 - 72 71
2020-21 - 72 71
2021-22 - 72 70
2022-23 - 72 70
2023-24 - 73 71
2024-25 - 73 71
2025-26 - 73 70
2026-27 - 73 58
6.3.2 Maximum demandFigure 6.5 and Figure 6.6 outline the forecast maximum system demand.
Figure 6.5 illustrates the difference in maximum system demand across different weather outcomes: POE 50 (one in two years) and POE10 (particularly hot year that is predicted to occur one in 10 years). In contrast, Figure 6.6 illustrates the impacts of the three solar scenarios.
1 All PV generation is released into the network. This may not be possible to achieve in practice as there may be consequent impacts on power system security associated with reduced levels of synchronous generation on line and the intermittent nature of renewable generation.

120 | Power System Review 2016-17
Figure 6.5 Tennant Creek annual maximum system demand POE forecast to 2026‑27 (base)
Tennant Creek is a summer-peaking network. Like Alice Springs, Tennant Creek has both cooling load and heating load, although its winter season peak is roughly 2.5MW (30 per cent) lower than its summer season peak.
Figure 6.5 shows maximum system demand is forecast to remain flat until 2018-19 and then with the introduction of a large load, to grow by about 2MW in 2018-19. From 2018-19, maximum system demand is forecast to remain relatively flat.
Maximum system demand currently occurs in the heat of the day, between 14:00 and 16:00 in the summer season. This will continue to be the case based on these forecasts.
Figure 6.6 shows maximum system demand for the three different solar uptake scenarios (base, RE30%, and RE50%).
Figure 6.6 Tennant Creek annual maximum system demand scenario forecast to 2026‑27 (POE 50)
The chart shows the base scenario to have slightly higher grid-supplied demand than the RE50% due to higher uptake of commercial and residential solar.
14-15 15-16 16-17 17-18 18-19 19-20 20-21 21-22 22-23 23-24 24-25 25-26 26-27
Maximum demand (MW)
Year ended JuneActual POE10 POE50
0
2
4
6
8
10
12
14-15 15-16 16-17 17-18 18-19 19-20 20-21 21-22 22-23 23-24 24-25 25-26 26-27
Maximum demand (MW)
Year ended JuneActual Base RE30% RE50%
0
1
2
3
4
5
6
7
8
9
10
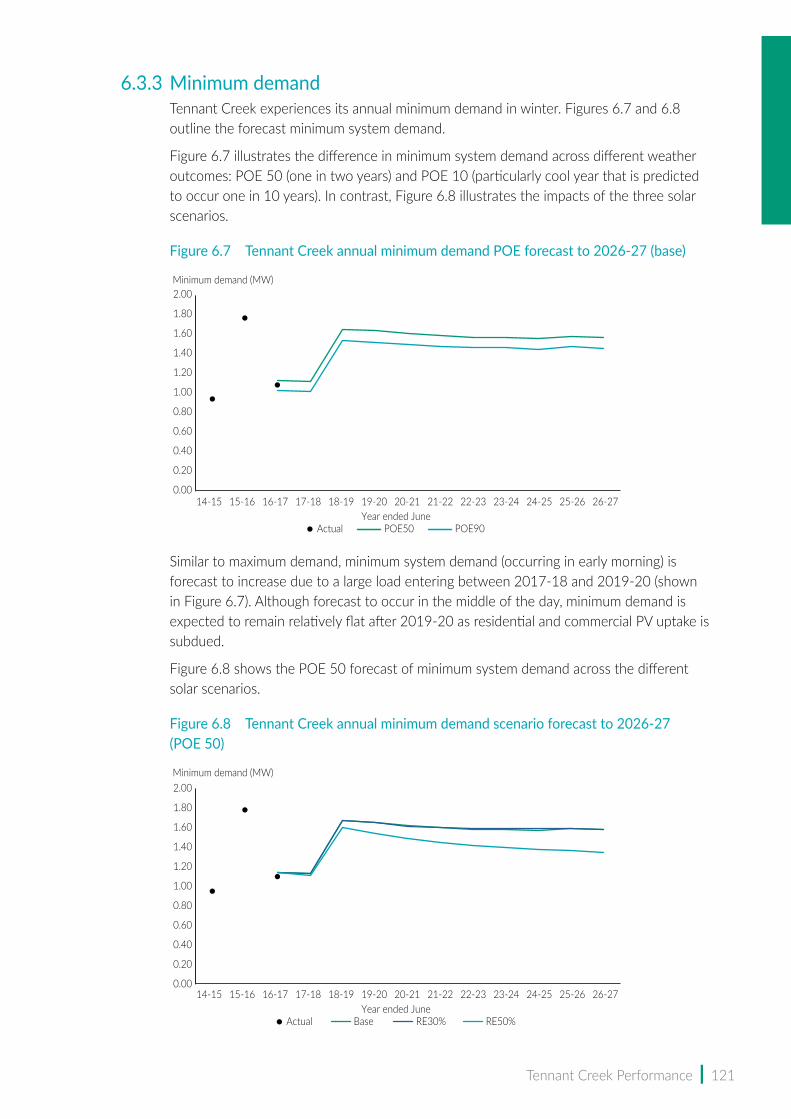
Tennant Creek Performance | 121
6.3.3 Minimum demandTennant Creek experiences its annual minimum demand in winter. Figures 6.7 and 6.8 outline the forecast minimum system demand.
Figure 6.7 illustrates the difference in minimum system demand across different weather outcomes: POE 50 (one in two years) and POE 10 (particularly cool year that is predicted to occur one in 10 years). In contrast, Figure 6.8 illustrates the impacts of the three solar scenarios.
Figure 6.7 Tennant Creek annual minimum demand POE forecast to 2026‑27 (base)
Similar to maximum demand, minimum system demand (occurring in early morning) is forecast to increase due to a large load entering between 2017-18 and 2019-20 (shown in Figure 6.7). Although forecast to occur in the middle of the day, minimum demand is expected to remain relatively flat after 2019-20 as residential and commercial PV uptake is subdued.
Figure 6.8 shows the POE 50 forecast of minimum system demand across the different solar scenarios.
Figure 6.8 Tennant Creek annual minimum demand scenario forecast to 2026‑27 (POE 50)
14-15 15-16 16-17 17-18 18-19 19-20 20-21 21-22 22-23 23-24 24-25 25-26 26-27
Minimum demand (MW)
Year ended JuneActual POE50 POE90
0.00
0.20
0.40
0.60
0.80
1.00
1.20
1.40
1.60
1.80
2.00
14-15 15-16 16-17 17-18 18-19 19-20 20-21 21-22 22-23 23-24 24-25 25-26 26-27
Minimum demand (MW)
Year ended JuneActual Base RE30% RE50%
0.00
0.20
0.40
0.60
0.80
1.00
1.20
1.40
1.60
1.80
2.00
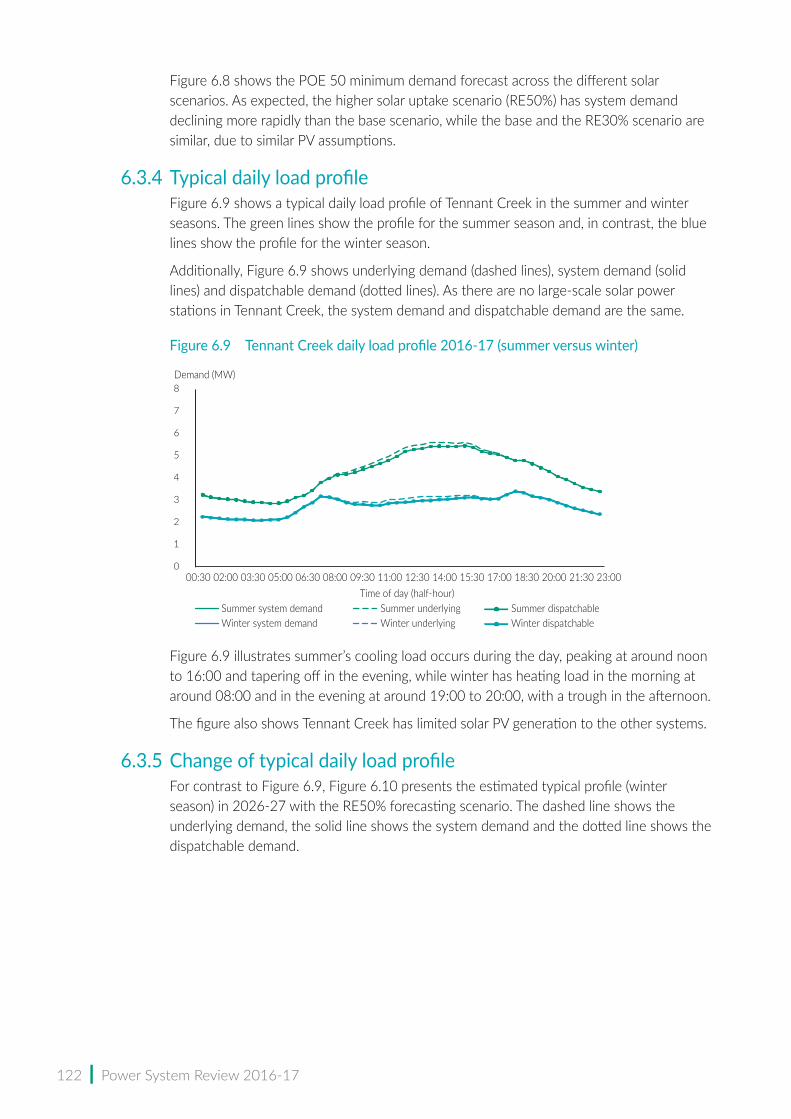
122 | Power System Review 2016-17
Figure 6.8 shows the POE 50 minimum demand forecast across the different solar scenarios. As expected, the higher solar uptake scenario (RE50%) has system demand declining more rapidly than the base scenario, while the base and the RE30% scenario are similar, due to similar PV assumptions.
6.3.4 Typical daily load profileFigure 6.9 shows a typical daily load profile of Tennant Creek in the summer and winter seasons. The green lines show the profile for the summer season and, in contrast, the blue lines show the profile for the winter season.
Additionally, Figure 6.9 shows underlying demand (dashed lines), system demand (solid lines) and dispatchable demand (dotted lines). As there are no large-scale solar power stations in Tennant Creek, the system demand and dispatchable demand are the same.
Figure 6.9 Tennant Creek daily load profile 2016‑17 (summer versus winter)
Figure 6.9 illustrates summer’s cooling load occurs during the day, peaking at around noon to 16:00 and tapering off in the evening, while winter has heating load in the morning at around 08:00 and in the evening at around 19:00 to 20:00, with a trough in the afternoon.
The figure also shows Tennant Creek has limited solar PV generation to the other systems.
6.3.5 Change of typical daily load profileFor contrast to Figure 6.9, Figure 6.10 presents the estimated typical profile (winter season) in 2026-27 with the RE50% forecasting scenario. The dashed line shows the underlying demand, the solid line shows the system demand and the dotted line shows the dispatchable demand.
Demand (MW)
0
3
8
1
2
4
5
6
7
Time of day (half-hour)00:30 02:00 03:30 05:00 06:30 08:00 09:30 11:00 12:30 15:30 17:00 18:30 20:00 21:30 23:0014:00
Summer system demand Summer underlying Summer dispatchableWinter system demand Winter underlying Winter dispatchable

Tennant Creek Performance | 123
Figure 6.10 Typical demand profile 2026‑27 (RE50%)
Figure 6.10 illustrates the introduction of significant levels of solar generation over the next 10 years will change the profile of demand. While the underlying level of demand (dashed line) will not necessarily substantially change, the system demand (solid line) will decrease (that is, grid demand).
The dispatchable demand (dotted line) will become zero in the middle of the day, assuming clear skies.
Effectively, area ‘A’ shows the behind the meter solar generation and area ‘B’ shows the level of large-scale grid-connected solar generation.
Note, solar generation will become the dominate form of generation during the middle of the day. However, a large percentage of the solar generation will need to be supported by other generation technologies, such as gas.
Figure 6.10 also illustrates that minimum dispatchable demand will be zero (without constraints). At these low levels of dispatchable demand, there is likely to be significant issues managing system security.
6.3.6 Demand at the substation levelTable 6.3 sets out the growth rates for maximum demand for the single substation in Tennant Creek.
Table 6.3 Zone substation growth rates (summer season, POE 10, 2017‑18 to 2026‑27)
Rate (per annum)
Tennant Creek zone substation (11/22kV) 2.7%
Table 6.3 shows an annual growth rate of 2.7 per cent, driven by industrial developments at Tennant Creek that are forecast to increase demand by summer 2018-19.
The demand at substation level is likely to change significantly under a high penetration of solar scenario, with some feeders potentially becoming positive at certain times of the day.
Demand (MW)
Time of day (half-hour)Winter System Demand Winter Underlying Winter Dispatchable
0
0.5
1
1.5
2
2.5
3
3.5
4
4.5
5
A
B
00:30 02:00 03:30 05:00 06:30 08:00 09:30 11:00 12:30 15:30 17:00 18:30 20:00 21:30 23:0014:00
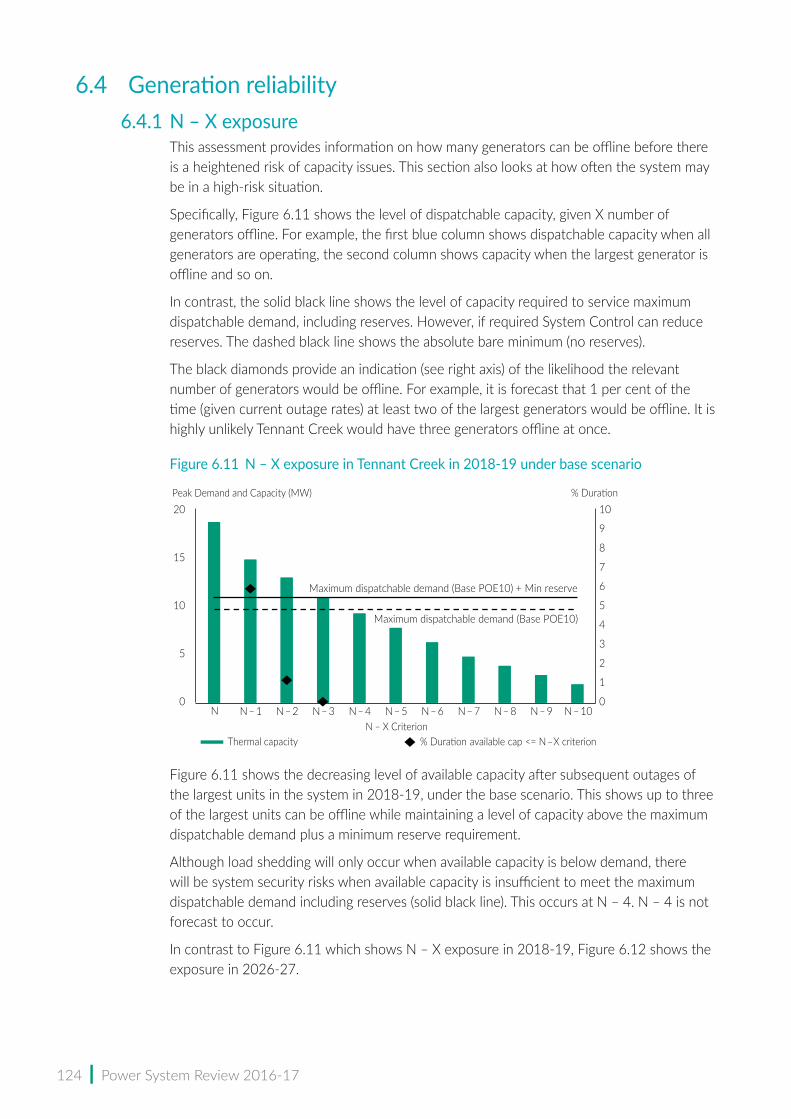
124 | Power System Review 2016-17
6.4 Generation reliability6.4.1 N – X exposure
This assessment provides information on how many generators can be offline before there is a heightened risk of capacity issues. This section also looks at how often the system may be in a high‑risk situation.
Specifically, Figure 6.11 shows the level of dispatchable capacity, given X number of generators offline. For example, the first blue column shows dispatchable capacity when all generators are operating, the second column shows capacity when the largest generator is offline and so on.
In contrast, the solid black line shows the level of capacity required to service maximum dispatchable demand, including reserves. However, if required System Control can reduce reserves. The dashed black line shows the absolute bare minimum (no reserves).
The black diamonds provide an indication (see right axis) of the likelihood the relevant number of generators would be offline. For example, it is forecast that 1 per cent of the time (given current outage rates) at least two of the largest generators would be offline. It is highly unlikely Tennant Creek would have three generators offline at once.
Figure 6.11 N – X exposure in Tennant Creek in 2018‑19 under base scenario
Figure 6.11 shows the decreasing level of available capacity after subsequent outages of the largest units in the system in 2018‑19, under the base scenario. This shows up to three of the largest units can be offline while maintaining a level of capacity above the maximum dispatchable demand plus a minimum reserve requirement.
Although load shedding will only occur when available capacity is below demand, there will be system security risks when available capacity is insufficient to meet the maximum dispatchable demand including reserves (solid black line). This occurs at N – 4. N – 4 is not forecast to occur.
In contrast to Figure 6.11 which shows N – X exposure in 2018‑19, Figure 6.12 shows the exposure in 2026‑27.
0
1
2
3
4
5
6
7
8
9
10
0
5
10
15
20
N N – 1 N – 2 N – 3 N – 4 N – 5 N – 6 N – 7 N – 8 N – 9 N – 10N – X Criterion
% DurationPeak Demand and Capacity (MW)
Thermal capacity
Maximum dispatchable demand (Base POE10)
Maximum dispatchable demand (Base POE10) + Min reserve
% Duration available cap <= N –X criterion
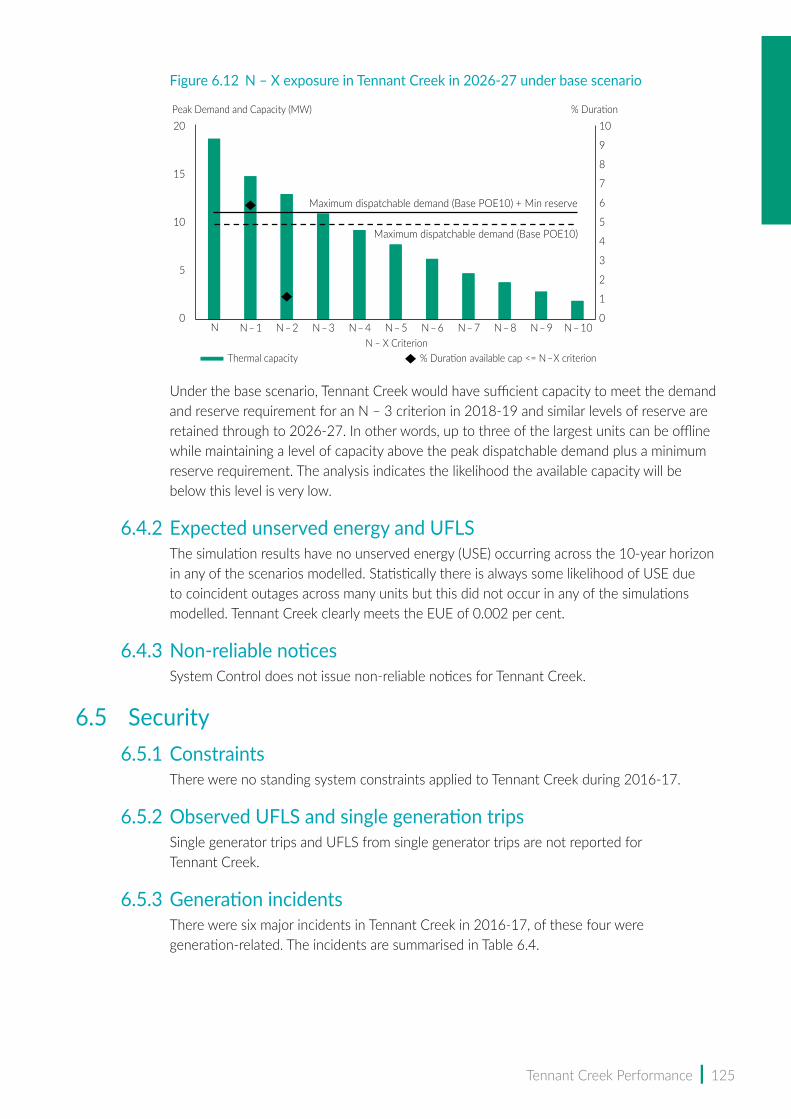
Tennant Creek Performance | 125
Figure 6.12 N – X exposure in Tennant Creek in 2026‑27 under base scenario
Under the base scenario, Tennant Creek would have sufficient capacity to meet the demand and reserve requirement for an N – 3 criterion in 2018‑19 and similar levels of reserve are retained through to 2026‑27. In other words, up to three of the largest units can be offline while maintaining a level of capacity above the peak dispatchable demand plus a minimum reserve requirement. The analysis indicates the likelihood the available capacity will be below this level is very low.
6.4.2 Expected unserved energy and UFLSThe simulation results have no unserved energy (USE) occurring across the 10‑year horizon in any of the scenarios modelled. Statistically there is always some likelihood of USE due to coincident outages across many units but this did not occur in any of the simulations modelled. Tennant Creek clearly meets the EUE of 0.002 per cent.
6.4.3 Non‑reliable noticesSystem Control does not issue non‑reliable notices for Tennant Creek.
6.5 Security6.5.1 Constraints
There were no standing system constraints applied to Tennant Creek during 2016‑17.
6.5.2 Observed UFLS and single generation tripsSingle generator trips and UFLS from single generator trips are not reported for Tennant Creek.
6.5.3 Generation incidentsThere were six major incidents in Tennant Creek in 2016‑17, of these four were generation‑related. The incidents are summarised in Table 6.4.
0
1
2
3
4
5
6
7
8
9
10
0
5
10
15
20
N N – 1 N – 2 N – 3 N – 4 N – 5 N – 6 N – 7 N – 8 N – 9 N – 10N – X Criterion
% DurationPeak Demand and Capacity (MW)
Thermal capacity
Maximum dispatchable demand (Base POE10)
Maximum dispatchable demand (Base POE10) + Min reserve
% Duration available cap <= N –X criterion
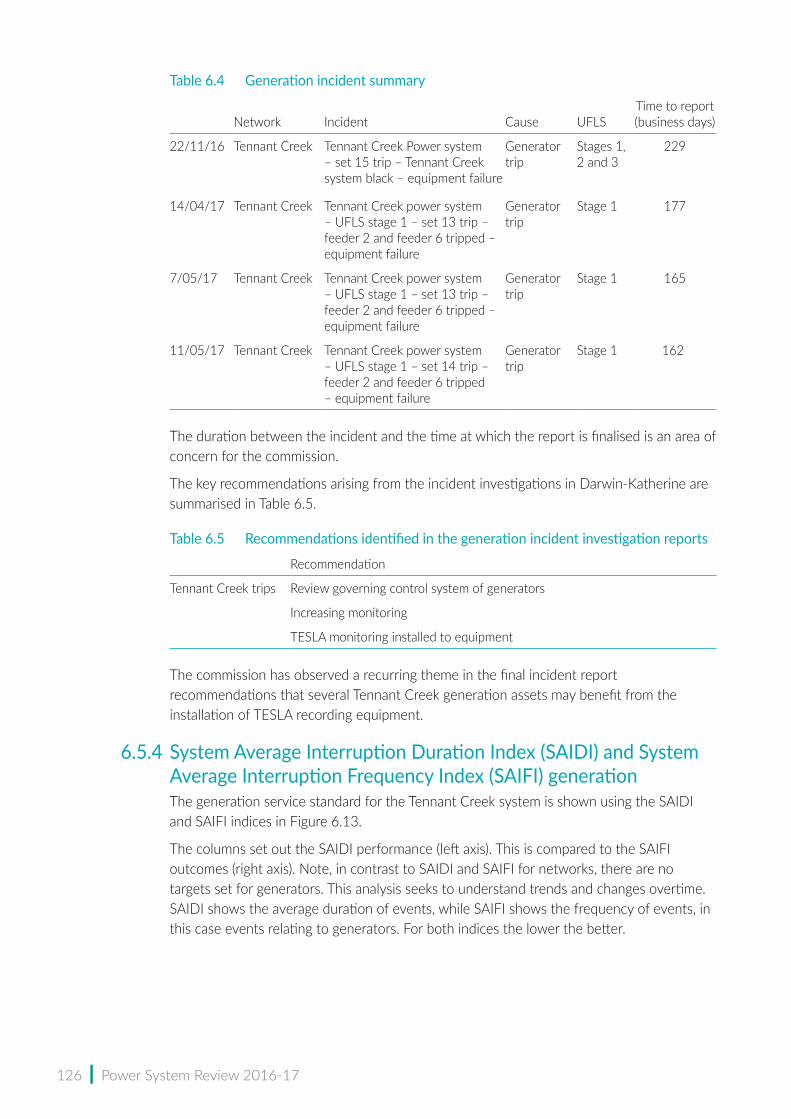
126 | Power System Review 2016-17
Table 6.4 Generation incident summary
Network Incident Cause UFLSTime to report (business days)
22/11/16 Tennant Creek Tennant Creek Power system – set 15 trip – Tennant Creek system black – equipment failure
Generator trip
Stages 1, 2 and 3
229
14/04/17 Tennant Creek Tennant Creek power system – UFLS stage 1 – set 13 trip – feeder 2 and feeder 6 tripped – equipment failure
Generator trip
Stage 1 177
7/05/17 Tennant Creek Tennant Creek power system – UFLS stage 1 – set 13 trip – feeder 2 and feeder 6 tripped – equipment failure
Generator trip
Stage 1 165
11/05/17 Tennant Creek Tennant Creek power system – UFLS stage 1 – set 14 trip – feeder 2 and feeder 6 tripped – equipment failure
Generator trip
Stage 1 162
The duration between the incident and the time at which the report is finalised is an area of concern for the commission.
The key recommendations arising from the incident investigations in Darwin-Katherine are summarised in Table 6.5.
Table 6.5 Recommendations identified in the generation incident investigation reports
Recommendation
Tennant Creek trips Review governing control system of generators
Increasing monitoring
TESLA monitoring installed to equipment
The commission has observed a recurring theme in the final incident report recommendations that several Tennant Creek generation assets may benefit from the installation of TESLA recording equipment.
6.5.4 System Average Interruption Duration Index (SAIDI) and System Average Interruption Frequency Index (SAIFI) generationThe generation service standard for the Tennant Creek system is shown using the SAIDI and SAIFI indices in Figure 6.13.
The columns set out the SAIDI performance (left axis). This is compared to the SAIFI outcomes (right axis). Note, in contrast to SAIDI and SAIFI for networks, there are no targets set for generators. This analysis seeks to understand trends and changes overtime. SAIDI shows the average duration of events, while SAIFI shows the frequency of events, in this case events relating to generators. For both indices the lower the better.

Tennant Creek Performance | 127
Figure 6.13 SAIDI and SAIFI performance indices for generation, Tennant Creek
Figure 6.13 illustrates that SAIDI was relatively high from 2011‑12 to 2013‑14, but has been quite low since 2014‑15. Similarly, SAIFI has shown the same profile.
6.6 Network performanceCurrent targets are set for distribution and transmission performance. Targets are set for the three systems as a whole but this review also compares the outcomes to the targets for each system to understand how each region contributes to the achievement of the targets.
To measure the performance of the distribution assets, two key measures are used, SAIDI and SAIFI.
There are no transmission feeders in the Tennant Creek power system.
6.6.1 DistributionSAIDITable 6.6 shows Power and Water Corporation’s (PWC) reported performance (annual reporting) using current feeder definitions against its current SAIDI targets. Figures in red highlight instances where PWC have not achieved its targets.
Table 6.6 Current SAIDI performance
Target standard 2012‑13 2013‑14 2014-15 2015-16 2016-17
5-year average
CBD - - - - - - -
Urban 136 538 147 230 45 195 231
Rural short 496 271 247 1 144 202 551 483
Rural long 2 165 7 674 172 391 112 394 1 749
While the reported outcomes move around, underlying performance has been mixed. Urban feeder performance has been poor. Rural short feeder performance is mixed with only three of five years achieving the target. The rural long feeder performance was particularly poor in 2012‑13 but since then has shown significant improvements.
20
40
60
80
100
120
140
1.0
2.0
3.0
4.0
5.0
6.0Indices
Year
Indices
Generation SAIDI Generation SAIFI
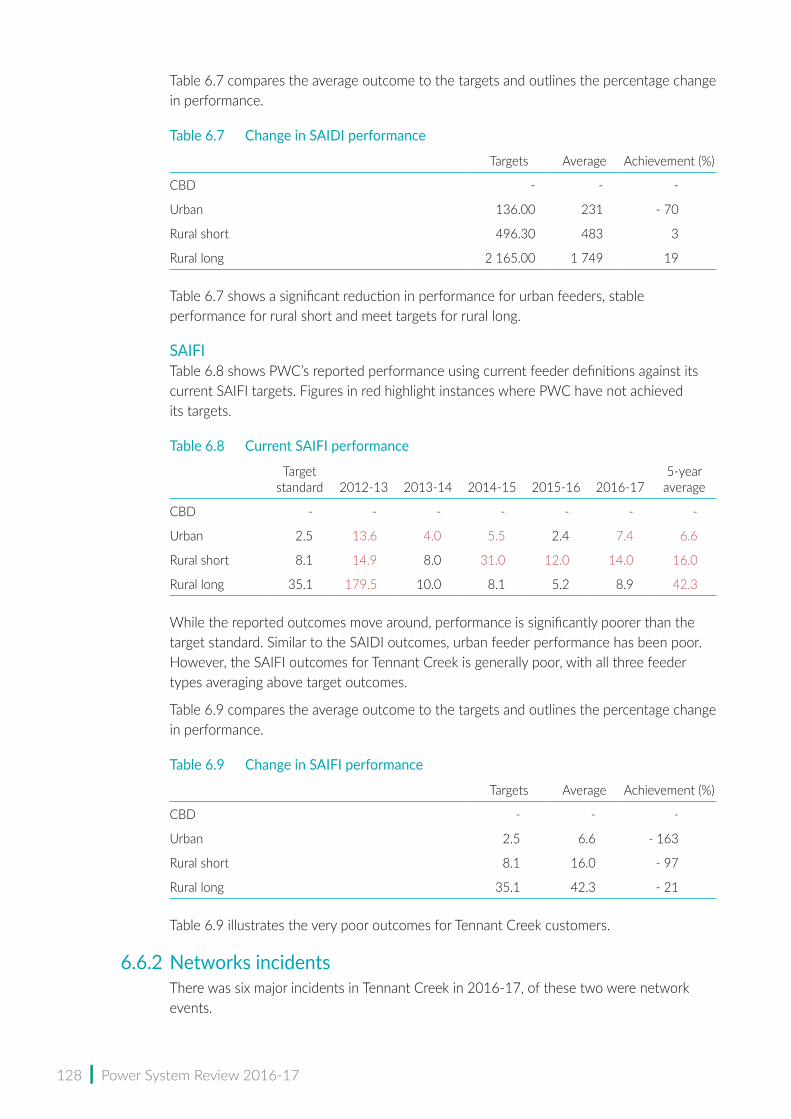
128 | Power System Review 2016-17
Table 6.7 compares the average outcome to the targets and outlines the percentage change in performance.
Table 6.7 Change in SAIDI performance
Targets Average Achievement (%)
CBD - - -
Urban 136.00 231 - 70
Rural short 496.30 483 3
Rural long 2 165.00 1 749 19
Table 6.7 shows a significant reduction in performance for urban feeders, stable performance for rural short and meet targets for rural long.
SAIFITable 6.8 shows PWC’s reported performance using current feeder definitions against its current SAIFI targets. Figures in red highlight instances where PWC have not achieved its targets.
Table 6.8 Current SAIFI performance
Target standard 2012-13 2013-14 2014-15 2015-16 2016-17
5-year average
CBD - - - - - - -
Urban 2.5 13.6 4.0 5.5 2.4 7.4 6.6
Rural short 8.1 14.9 8.0 31.0 12.0 14.0 16.0
Rural long 35.1 179.5 10.0 8.1 5.2 8.9 42.3
While the reported outcomes move around, performance is significantly poorer than the target standard. Similar to the SAIDI outcomes, urban feeder performance has been poor. However, the SAIFI outcomes for Tennant Creek is generally poor, with all three feeder types averaging above target outcomes.
Table 6.9 compares the average outcome to the targets and outlines the percentage change in performance.
Table 6.9 Change in SAIFI performance
Targets Average Achievement (%)
CBD - - -
Urban 2.5 6.6 - 163
Rural short 8.1 16.0 - 97
Rural long 35.1 42.3 - 21
Table 6.9 illustrates the very poor outcomes for Tennant Creek customers.
6.6.2 Networks incidentsThere was six major incidents in Tennant Creek in 2016-17, of these two were network events.
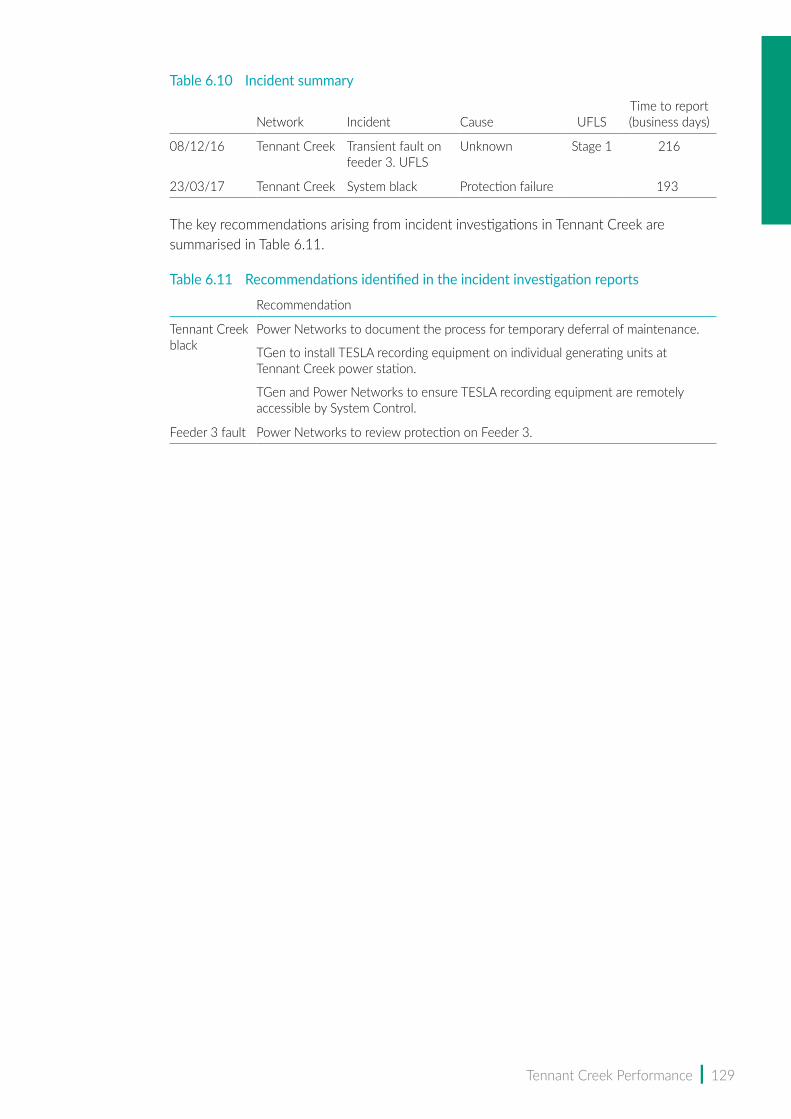
Tennant Creek Performance | 129
Table 6.10 Incident summary
Network Incident Cause UFLSTime to report (business days)
08/12/16 Tennant Creek Transient fault on feeder 3. UFLS
Unknown Stage 1 216
23/03/17 Tennant Creek System black Protection failure 193
The key recommendations arising from incident investigations in Tennant Creek are summarised in Table 6.11.
Table 6.11 Recommendations identified in the incident investigation reports
Recommendation
Tennant Creek black
Power Networks to document the process for temporary deferral of maintenance.
TGen to install TESLA recording equipment on individual generating units at Tennant Creek power station.
TGen and Power Networks to ensure TESLA recording equipment are remotely accessible by System Control.
Feeder 3 fault Power Networks to review protection on Feeder 3.


7| Adequacy of Northern Territory Gas Supply

132 | Power System Review 2016-17
7.1 Fuel supply Gas is the primary source of fuel to the Northern Territory electricity market. The Territory domestic gas market demand in 2016-17 was approximately 24.4 petajoules (PJ) with over 93 per cent of the Territory’s regulated electricity capacity as gas-fired generation. Virtually all domestic gas consumption in the Territory is used for power generation.
The security of existing gas supply and future sources of gas is therefore critical to the Territory’s ongoing energy requirements.
7.1.1 The playersA summary of the major Territory domestic gas market details is outlined in Table 9.1.
Table 9.1 Northern Territory gas market summary
Description Entities Comment
Major gas producers providing domestic gas
Eni Australia Ltd (Blacktip gas field) and Amadeus gas producers (Central Petroleum and Macquarie Infrastructure Corporation)
Eni is the major gas supplier to the Territory market, representing over 83% of Territory gas demand. Note Blacktip supply is fully contracted by Power and Water Corporation (PWC).
Amadeus Gas Pipeline (AGP) supply the balance of the Territory gas market.
Liquefied natural gas (LNG) producers
Darwin LNG (owned by ConocoPhillips), Santos, INPEX, Eni, JERA (a joint venture between Tokyo Electric and Chibu Electric) and Tokyo Gas
Darwin LNG and INPEX have offshore gas wells with production facilities in Darwin. Note INPEX has not yet started production.
These entities (will) provide gas to the international LNG market.
They only supply gas to the domestic market as part of backup gas supply agreements.
Major gas buyers that purchase gas directly from upstream producers
PWC, McArthur River mine and Energy Developments Limited (EDL)
PWC is the major gas buyer from upstream producers in the Territory.
PWC’s supply (via its upstream purchases) to the domestic market represents over 88% of Territory gas demand. PWC’s main gas buyer is Territory Generation (TGen).
PWC is effectively a gas wholesaler.
McArthur River mine (owned by Glencore) is situated in the Gulf of Carpentaria, 900km southeast of Darwin. It is a zinc, silver and lead mine. Glencore provides electricity for the mine and associated village. McArthur River mine purchases gas from Amadeus gas producers.
EDL’s Pine Creek power station signed a gas supply contract with Central Petroleum to supply about 2PJ per annum from 1 June 2017 for a five-year term. Previously gas was supplied by PWC to Pine Creek power station. EDL now buys gas directly from the Amadeus Basin and EDL is considered a major gas buyer and consumer from June 2017.
Major consumers TGen, McArthur River mine and EDL.
Top four gas buyers represent 99% of Territory gas demand. The users purchase their gas requirement from PWC or directly from the Amadeus gas producers.
TGen’s gas demand alone accounts for 85% of Territory gas demand.
EDL uses up to 2PJ per annum.
continued
Adequacy of Northern Territory Gas Supply | 133
Description Entities Comment
Transport APA Group, Energy Infrastructure Investments, PWC and Jemena
APA owns the AGP, which transports gas from the Amadeus Basin to Darwin. It runs down the spine of the Territory.
Energy Infrastructure Investments owns the Bonaparte Gas Pipeline, which transports Blacktip gas from the Wadeye onshore processing plant to Ban Ban Springs, which is the point of interconnection with the AGP.
Energy Infrastructure Investment also owns the 12km Wickham Point Pipeline, commissioned in 2009. It delivers backup supply from Darwin LNG plant to Weddell power station (in Darwin).
PWC owns the pipeline lateral from Daly Waters to McArthur River mine.
Jemena is currently constructing the Northern Gas Pipeline (NGP) from Tennant Creek to Mt Isa.
Wickham Point Pipeline.
Major users of gas transportation capacity in Territory transmission pipelines
PWC and McArthur River mine
PWC is the major user of gas transportation capacity in Territory transmission pipelines. It has first priority over all firm transportation capacity in the Bonaparte Pipeline and the AGP. PWC has a transport contract with Jemena’s NGP to transport gas to Incitec Pivot’s Phosphate Hill fertiliser plant at Mt Isa. PWC has only contracted about 30% of Jemena’s full pipeline capacity.
McArthur River mine has a contract with APA to transport Amadeus Basin gas in the AGP to Daly Waters and a contract with PWC to transport to McArthur River mine.
7.1.2 Gas supply and productionNorthern Territory domestic gas fieldsThe primary source of domestic gas supply in the Territory is Eni’s offshore Blacktip gas field in the Bonaparte Basin. Eni is a major Italian oil and gas company. Refer to Figure 9.1 for a map of gas pipelines and gas fields.
PWC has a long-term gas contract with Eni that represents over 90 per cent of PWC’s gas purchases. PWC has fully contracted all of Blacktip production. The Blacktip gas field is forecast to supply PWC gas to the end of 2034 and estimated to have about 500 to 600PJ of 2P reserves remaining. 2P reserves denotes proved and probable reserves under the Petroleum Resource Management System (PRMS), developed by the American society of petroleum engineers to classify oil and gas resources. 2P reserves have a 50 per cent confidence level of being produced over the life of the asset. 1P reserves are proved reserves and have a 90 per cent confidence that gas actually recovered from the reservoir will be more than the 1P reserve assessment.
The Amadeus Basin contains the Mereenie and Palm Valley gas fields (owned by Central Petroleum and Macquarie Group) and the Dingo gas field (not shown) that is owned solely by Central Petroleum. The Amadeus gas fields are mature, having been in production for over 30 years. While there may be the potential to increase Amadeus Basin gas reserves through additional exploration and appraisal, the Amadeus Basin’s existing gas reserves available for sale are small compared to Eni’s Blacktip gas field.
Central Petroleum recently announced a contract with Ensign Australia Pty Ltd to operate its rig 932 to drill up to four more new wells. These wells are considered to be focused

134 | Power System Review 2016-17
on increasing Amadeus gas deliverability and recovery of existing reserves for the commencement of Jemena’s NGP in late 2018.
It is currently estimated there is up to 100 PJ of conventional proven and probable tail 2P gas reserves remaining in the Amadeus Basin, most of these in the Mereenie gas field.
Gas priceThe development of the Blacktip field created gas-on-gas competition in the Territory for the first time. The large quantities of Blacktip gas supply and the unutilised productive capability of Amadeus Basin gas resulted in an oversupply of gas in the Territory. This created a competitive gas market for customers and put downward price pressure for new gas supply contracts.
The price of gas is not regulated in the Territory. Producers, retailers and buyers are free to negotiate terms. For example, the contract between Central Petroleum and EDL was privately negotiated. Due to the confidential nature of these bilateral gas contracts, there is limited publically available information on the price of gas in the Territory.
This report does not review or analyse the price of gas.
7.1.3 Transport and deliveryGas is transported long distances from the upstream production centres to various power stations throughout the Territory via gas transmission pipelines.
To enable a greater amount of energy to be efficiently transported long distances, gas entering the transmission pipeline from the upstream production centres is compressed to increase the pressure of the gas in the transmission pipeline. Transmission pipelines transport gas at high pressure, in some cases up to a maximum pressure of 15 000 kilopascal (kPa) (equivalent to 85 times the pressure of a car tyre).
Where a transmission pipeline is over about 200km long, it is common for these pipelines to have mid-line compressor stations to boost pressure, which increases the flow rate over longer distances of transportation. The length of a transmission pipeline does not impact the technical ability to transport gas but will increase the overall cost of gas transportation.
Typically, the major gas buyers purchasing gas from upstream gas production centres are the parties that transport gas in transmission pipelines. That is, they enter into a bilateral contract with the owners of the gas transmission pipeline to transport certain quantities of gas for a defined period of time on agreed commercial terms.
There are two major existing gas transmission pipelines in the Territory, namely:
i. AGP that transports gas from the Amadeus Basin to Darwin
ii. the Bonaparte Gas Pipeline that transports Blacktip gas from the Wadeye onshore processing plant to Ban Ban Springs, which is the point of interconnection with the AGP.
Adequacy of Northern Territory Gas Supply | 135
Amadeus Gas PipelineThe AGP is the Territory’s longest transmission pipeline and is about 1600km long. The AGP has one compressor station mid-line at Warrego near Tennant Creek (not shown in Figure 13.2). The large geographical extent of Australia means most transmission pipelines in Australia are long compared to overseas pipelines. Other long transmission pipelines in Australia include:
• Dampier to Bunbury pipeline (WA) – 1854km
• Goldfield Gas Pipeline (WA) – 1427km
• Moomba to Sydney pipeline (NSW) – 2030km.
The AGP is the ‘spine’ transmission pipeline which was the foundation pipeline that enabled Amadeus Basin gas to be supplied from Alice Springs to Darwin and other towns in the Territory. The AGP commenced gas transportation in 1986.
The AGP is 100 per cent owned by APA (a major publically listed ASX infrastructure company) and the AGP pipeline tariff is fully regulated by the Australian Energy Regulatory (AER). The AGP’s firm forward haul tariff that APA charges new users is set by the AER. The forward haul tariff is the cost APA charges its users to transport gas from the Amadeus Basin in central Australia (or any other point along the AGP) to Darwin. The AER’s current (2017) regulated forward haul tariff is $0.58 per gigajoule (GJ). The prevailing tariff period continues to 30 June 2021, with another review by the AER at this time.
PWC is the AGP’s largest user of gas transportation services and has an existing long-term contact for most of AGP transport capacity. While there is the possibility for small users to contract new capacity in the AGP, new large users are likely to be constrained by PWC’s existing contracted capacity and would have to pay to expand capacity in the AGP. It is also likely any new users of AGP transportation services would have a lower level of service priority than PWC, given PWC was the first and only foundation user of the AGP.
The section of the AGP where existing capacity is most constrained is the section from Ban Ban Springs (Bonaparte Pipeline interconnect with the AGP) to Darwin.
Bonaparte PipelineThe Bonaparte Pipeline supplies Blacktip gas into the AGP and is subsequently transported to various off-takes along the AGP.
The Bonaparte Pipeline is owned privately by Energy Infrastructure Investments. APA owns 19.9 per cent of Energy Infrastructure Investments and is the operator of the pipeline. The Bonaparte Pipeline is not covered by regulation. All firm transportation capacity in the Bonaparte Pipeline is contracted by PWC.
Northern Gas PipelineJemena’s NGP is a new transmission pipeline currently under construction and will connect the Territory with the east coast gas market (from Tennant Creek to Mt Isa, about 622km). Typical to other long distance transmission pipelines in Australia, the NGP is a high pressure pipeline and has a maximum allowable pressure rating of 15 300kPa.
The NGP is not regulated like the AGP and any new user of NGP transportation services negotiate a bilateral service agreement with Jemena. Jemena has published its maximum NGP firm forward haul transportation tariff and nitrogen removal tariff on its website. This effectively sets the maximum cost Jemena will charge users for new NGP transportation
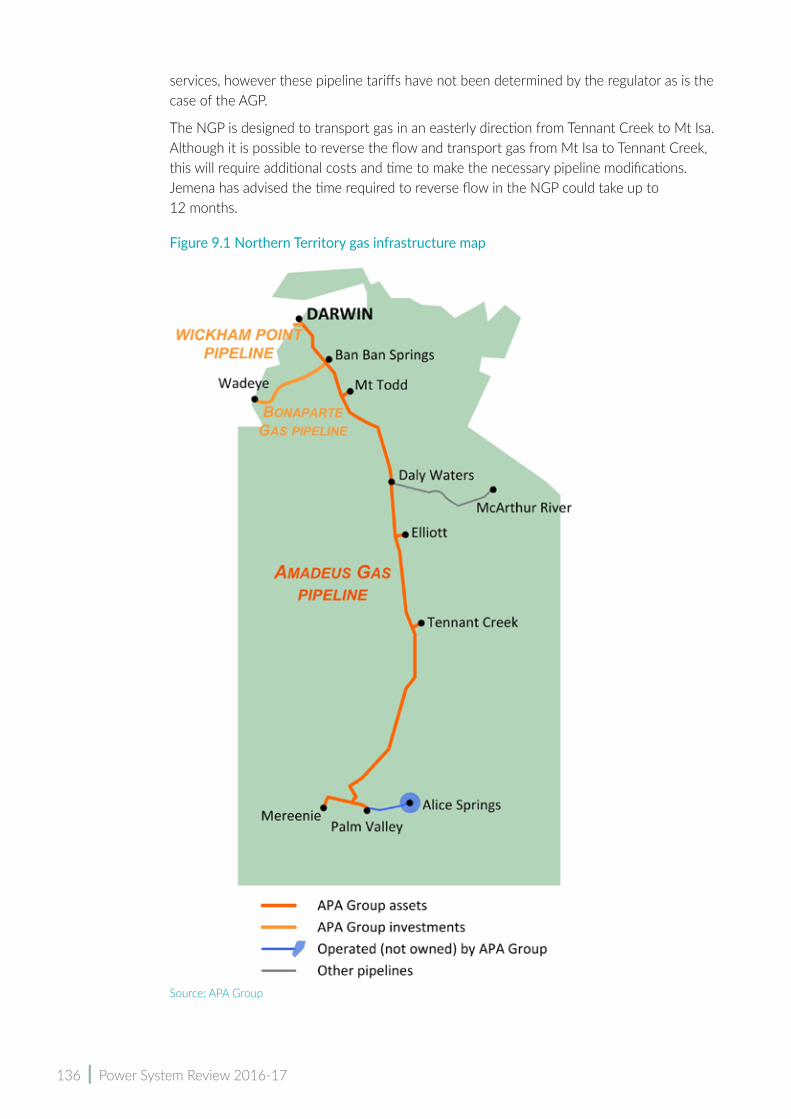
136 | Power System Review 2016-17
services, however these pipeline tariffs have not been determined by the regulator as is the case of the AGP.
The NGP is designed to transport gas in an easterly direction from Tennant Creek to Mt Isa. Although it is possible to reverse the flow and transport gas from Mt Isa to Tennant Creek, this will require additional costs and time to make the necessary pipeline modifications. Jemena has advised the time required to reverse flow in the NGP could take up to 12 months.
Figure 9.1 Northern Territory gas infrastructure map
Source: APA Group
Adequacy of Northern Territory Gas Supply | 137
7.1.4 DemandThe total Territory gas market demand increased from about 10PJ per annum in 1987 to about 20PJ per annum by 2005. Since 2005, gas demand has continued to grow, albeit at a slower pace to about 24.4PJ per annum in 2017.
The largest industrial gas customer in the Territory is McArthur River mine. McArthur River uses gas for all its power requirements and its annual demand is about 3PJ per annum. Other than McArthur River mine, the remaining power demand in the Territory is mostly residential and small industrial demand.
There are no known projects likely to require significant quantities of gas in the foreseeable future.
7.1.5 Last major incident (September 2014)On 11 September 2014, Blacktip gas field experienced a total cessation of production due to a failure of power and electrical communications to the offshore platform. At the same time, PWC’s backup supply from Darwin LNG was unavailable because of major planned maintenance. As a consequence of no gas being supplied into the system, the Territory experienced periods of blackouts until gas supply could be re-established. The key learnings from this incident was to develop:
• an emergency response procedure that co-ordinates and manages any gas supply shortfall with major stakeholders, including Eni, TGen and APA to minimise electricity interruptions
• publication and co-ordination of planned maintenance activities between gas producers, TGen and APA to minimise the risk of overlapping maintenance activities
• improved internal communications within PWC and also PWC and the Territory Government.
7.1.6 The Territory compared to the east coast gas market The east coast domestic market is an interconnected market through a major transmission pipeline network that links gas supply to Queensland, New South Wales, South Australia, Victoria and Tasmania. There are a number of material differences between the east coast domestic gas market and the Territory domestic gas market, as detailed in Table 9.2.
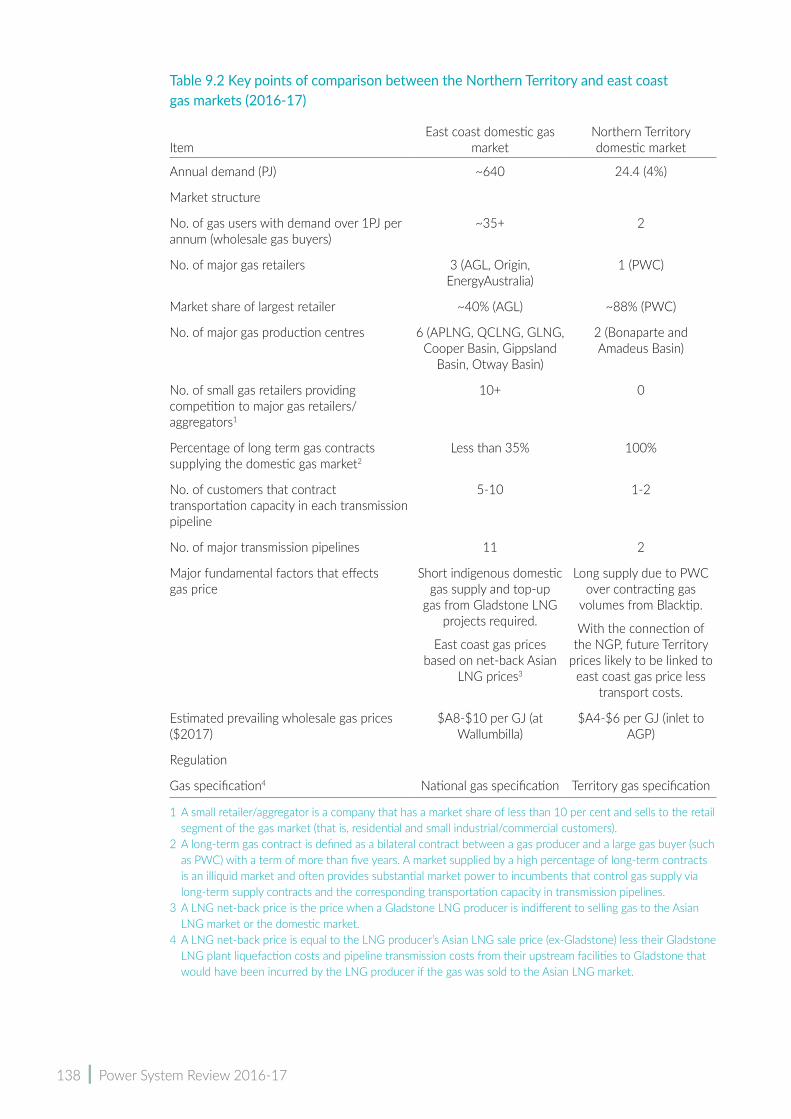
138 | Power System Review 2016-17
Table 9.2 Key points of comparison between the Northern Territory and east coast gas markets (2016‑17)
ItemEast coast domestic gas
marketNorthern Territory domestic market
Annual demand (PJ) ~640 24.4 (4%)
Market structure
No. of gas users with demand over 1PJ per annum (wholesale gas buyers)
~35+ 2
No. of major gas retailers 3 (AGL, Origin, EnergyAustralia)
1 (PWC)
Market share of largest retailer ~40% (AGL) ~88% (PWC)
No. of major gas production centres 6 (APLNG, QCLNG, GLNG, Cooper Basin, Gippsland
Basin, Otway Basin)
2 (Bonaparte and Amadeus Basin)
No. of small gas retailers providing competition to major gas retailers/aggregators1
10+ 0
Percentage of long term gas contracts supplying the domestic gas market2
Less than 35% 100%
No. of customers that contract transportation capacity in each transmission pipeline
5-10 1-2
No. of major transmission pipelines 11 2
Major fundamental factors that effects gas price
Short indigenous domestic gas supply and top-up
gas from Gladstone LNG projects required.
East coast gas prices based on net-back Asian
LNG prices3
Long supply due to PWC over contracting gas
volumes from Blacktip.
With the connection of the NGP, future Territory
prices likely to be linked to east coast gas price less
transport costs.
Estimated prevailing wholesale gas prices ($2017)
$A8-$10 per GJ (at Wallumbilla)
$A4-$6 per GJ (inlet to AGP)
Regulation
Gas specification4 National gas specification Territory gas specification
1 A small retailer/aggregator is a company that has a market share of less than 10 per cent and sells to the retail segment of the gas market (that is, residential and small industrial/commercial customers).
2 A long-term gas contract is defined as a bilateral contract between a gas producer and a large gas buyer (such as PWC) with a term of more than five years. A market supplied by a high percentage of long-term contracts is an illiquid market and often provides substantial market power to incumbents that control gas supply via long-term supply contracts and the corresponding transportation capacity in transmission pipelines.
3 A LNG net-back price is the price when a Gladstone LNG producer is indifferent to selling gas to the Asian LNG market or the domestic market.
4 A LNG net-back price is equal to the LNG producer’s Asian LNG sale price (ex-Gladstone) less their Gladstone LNG plant liquefaction costs and pipeline transmission costs from their upstream facilities to Gladstone that would have been incurred by the LNG producer if the gas was sold to the Asian LNG market.

Adequacy of Northern Territory Gas Supply | 139
The east coast’s national gas specification is different from the Territory gas specification. The major discrepancy is the level of nitrogen permitted in the Territory gas specification but not in the east coast’s national gas specification.
The scale of the Territory market is small, less than 4 per cent of the east coast market. The Victorian gas market alone is over 10 times the size of the Territory gas market.
The low number of wholesale gas buyers (defined as those customers with demand over 1PJ per annum) in the Territory is low with only PWC and McArthur River currently qualified in 2016-17, noting EDL now also has a large contract in the Territory. This is compared to over 35 buyers in the east coast. The greater the number of wholesale gas buyers, the more liquidity there is in the wholesale market as buyers sell between themselves to manage their gas demand and enter into new sales contracts directly with upstream producers or retailers.
The market structure in the Territory is dominated by PWC, being the largest buyer and controlling nearly all transportation capacity in the two major existing transmission pipelines.
Notwithstanding elements of reduced market competition in the Territory, the Territory has excess gas supply that supports lower gas prices compared to the east coast market.
The east coast market is linked to Asian LNG net-back prices. Gladstone LNG producers produce and purchase gas for export, but can sell excess gas domestically. A number of issues, including the recent linking of east coast gas supplies to international markets and government restrictions on exploration, have resulted in shortfalls in domestic gas supply production and significant increases in prices.
The Federal Government has the ability to require Gladstone producers to supply more gas into the domestic market instead of exporting their gas to the Asian LNG market. The Gladstone producers sell domestic gas at the LNG net-back price.
7.1.7 Regulatory changes and their potential impact on the Territory gas marketIn May 2016, the Australian Energy Market Commission (AEMC) completed a review of east coast wholesale gas markets and pipeline frameworks (the East Coast Review). A key initiative from this review involved AMEC undertaking a process to improve the efficiency that transportation capacity is allocated and used by market participants, and facilitate a platform for day-ahead gas transportation capacity trading in east coast gas markets.
On 24 November 2017, the Council of Australian Governments (COAG) Energy Council agreed that a review by AEMC be undertaken in early 2018 to determine whether the transportation capacity trading reform package should extend to the Territory. This review is currently underway and AEMC’s report is to be finalised by March 2018. The issues to be considered by the AEMC include:
i. The Territory domestic market is small and illiquid with only three major buyers. The number of gas customers that could benefit (if at all) from capacity trading is most likely limited to these three large gas buyers.
ii. Pipeline capacity trading is day-ahead only. This may not support new infrastructure that requires long-term security of transportation capacity. Day-ahead capacity trading could potentially lower costs for existing purchasers, but it is unlikely to encourage development of new energy-intensive projects.
140 | Power System Review 2016-17
iii. Day-ahead transporting capacity trading does not address the major competition and structural issue affecting the Territory gas market, which is the dominant market position of PWC.
iv. There are limited sources of domestic gas supply in the Territory market (at least in the short to medium term) needed to make use of day-ahead transportation capacity. With Blacktip fully contracted to PWC, the only source of gas other than PWC is the Amadeus Basin, noting the NGP is designed to only flow from the Territory into Queensland.
v. The potential benefits to upstream gas producers that may have lower transport costs and increased access to pipeline capacity to transport gas out of the Territory and deliver gas to east coast gas markets on a short-term basis once Jemena’s NGP is operational.
7.2 Territory supply and demand summary – 2016‑177.2.1 Territory gas demand
TGen gas demand for 2016-17 was about 20.8PJ1, representing around 85 per cent of all gas consumed in the Territory. The total Territory gas demand for 2016-17 was 24.4PJ, representing PWC’s customer demand (including TGen’s demand) and McArthur River mine’s demand.
7.2.2 PWC gas supply: annual demandPWC has a contract to purchase gas from Eni’s offshore Blacktip gas field in the Bonaparte Basin via the Wadeye gas processing plant. The contract runs for 25 years. It commenced in 2009 for the supply of up to 740PJ of gas2 over the life of the project.
The annual contract quantities from Blacktip increase over time to allow for growth in the Territory’s demand, based on assumptions at the time the contract was agreed in 2006. The increase in annual quantities are greater than current forecast growth in gas demand.
7.2.3 PWC gas supply: maximum daily quantityPWC’s maximum daily gas demand is less than its contracted maximum daily supply capacity from Blacktip. There are currently no issues with PWC meeting its daily maximum demand. PWC’s daily peak demand is expected to grow faster than its annual demand and should be monitored each year to ensure peak demand is adequately covered, especially with the introduction of additional PWC supply to the east coast gas market upon commencement of Jemena’s NGP.
7.2.4 Gas transportation capacity The transportation capacity of the Bonaparte Pipeline and the Ban Springs to Darwin section of the AGP is over 100 terajoule (TJ) per day3, which is in excess of the Territory’s peak daily gas demand. PWC has entered into long-term transportation agreements with the owners of the Bonaparte and AGP to transport Blacktip gas to its various power station delivery points in the Territory.
1 Demand includes gas used in TGen’s power purchase agreements.2 Eni press release, Eni starts development of Blacktip gas field offshore Australia, 30 June 2006.3 PWC Transportation Assessment
Adequacy of Northern Territory Gas Supply | 141
7.3 Security of Territory gas supply 2016‑177.3.1 Introduction
Gas supply to the Territory is assessed to have ‘n-1’ redundancy for a short to medium period of time. An n-1 system redundancy has spare supply capability sufficient to supply 100 per cent of the Territory’s gas requirement, should the primary source of gas supply fail.
The two major risks to the system are:
• loss of supply from Blacktip (short or long term)
• leak or major rupture of the main pipelines.
To a lesser extent, the loss of Dingo will also impact on local production in Alice Springs.
There are a number of projects occurring at the moment that will change the Territory gas market and contingency supplies. Specifically the Territory has INPEX’s LNG plant, Jemena’s NGP and TGen’s new gas-fired generators in Alice Springs.
Currently, Blacktip and Darwin LNG can individually supply 100 per cent of the Territory’s gas requirement. In the near future INPEX will also have capability to supply full backup capabilities and possibly additional support from east coast gas under certain circumstances. However, note while these supplies can theoretically supply the volume of gas required, there are contractual and practical limitations to backup supplies. These relate to restrictions in total volume across the year (contractual) and pressure issues that limit supply to Alice Springs (practical).
When the INPEX backup supply arrangement commences (in mid-2018) Darwin gas system security will increase to n-2 until 2022. PWC’s Darwin LNG backup arrangement expires in 2022.
The alternative contingency is pipeline line pack, diesel and southern gas fields. Line pack is only capable of supplying 100 per cent of electricity demand for less than a day. The other contingencies include supplementary diesel backup generation and, for Alice Springs, supplementary supply available from the Dingo gas field and potentially the Mereenie and Palm Valley gas fields. However these measures are not capable of replacing 100 per cent of Territory’s energy requirements.
7.3.2 RisksRedundancy of Blacktip infrastructure The Blacktip gas field consists of two offshore wells with an unmanned and remotely operated well head platform. The onshore plant consists of three export compressors, simple separation and dehydration facilities, and utilities such as power generation. This type of facility is similar to other upstream gas projects in eastern Australia like those in the Otway basin that supply gas to the Victorian domestic market. Generally, unmanned offshore facilities will have a lower level of reliability than manned or onshore facilities. The additional time taken to fly out to an unmanned platform and assess the nature of any production issues will increase the time of a supply interruption.
The two development wells provide some level of field deliverability redundancy. The onshore gas plant at Wadeye has three export compressors that are required to be fully operational to produce gas at maximum production rates. Where a gas plant has an extra unit on standby for each major processing element (that is, compression, dehydration,
142 | Power System Review 2016-17
liquid separation and utilities), the gas plant is referred to as having full ‘n-1’ redundancy. At maximum production rates (approx. 110 to 120 TJ per day), the Wadeye facility does not have full redundancy for periods of planned maintenance activity or an unplanned trip of major processing elements of the gas plant. Plant utilities such as steam and power are often a source of production issues for a plant like the Wadeye facility and an interruption to power was the cause of the September 2014 incident.
PWC’s maximum day requirement for gas is currently significantly below the maximum capacity of the Blacktip gas plant. The amount of redundant plant capacity (created by current low levels of demand) will decrease over time as the rate of maximum day demand increase. PWC’s daily demand will jump to a new level when new supply through Jemena’s NGP to eastern Australia commences in late 2018.
Without full n-1 redundancy on all major elements of plant processing capacity, there is an increased risk of minor or major shortfalls during periods of plant failure coinciding with maximum gas demand. Given PWC’s strong backup arrangements, this is not an area of concern but should be noted and may involve a greater level of management of PWC’s daily gas supplies in the medium term.
Blacktip planned and unplanned maintenance Typical to other gas sales agreements, there are limits on the duration of planned and unplanned maintenance interruptions of gas supply from Blacktip facilities each contract year. Importantly, there are also restrictions on the number of days in a row for a single interruption. The duration and scale of any Blacktip supply shortfall will determine whether PWC is required to call upon its backup gas arrangements. The permitted periods of planned and unplanned maintenance and maximum number of days of continuous interruption are well within PWC’s backup capabilities from Darwin LNG.
Blacktip reserves Gas reserves and well deliverability are critical elements of gas supply security. Field performance should be regularly monitored over time. Blacktip’s current 1P reserves are sufficient to satisfy its long-term contractual obligations to PWC. Blacktip is at an early stage of its producing life, having produced for only eight years of a 25-year supply term to PWC. The Utilities Commission will continue to monitor reserves, well deliverability and levels of reservoir water production at regular intervals over the life of the project.
While there are no current indications of Blacktip reserve or deliverability issues, and ongoing risks are low given 1P reserves are sufficient to satisfy Eni’s contractual obligations to PWC, a major failure of Blacktip reserves or deliverability would be classified as a catastrophic event and lead to a widescale gas shortage with material cost implications for the Territory. In future reviews the commission will seek information from PWC on its contingency plans in the event of a major failure of Blacktip reserves, noting uncontracted Amadeus Basin reserved gas may be limited once the NGP is commissioned.
Dingo In September 2013, PWC entered into a new gas sales agreement to develop the Dingo gas field, located 60km south of Alice Springs. PWC’s initial supply tranche is around 15PJ over a 10-year term from the Dingo gas field, with options to increase supply up to 31PJ of gas over a 20-year supply period if sufficient reserves are available. Gas supply from the Dingo gas field to PWC commenced in April 2015. Dingo gas is connected to the pipeline transmission system at Brewer Estate, 20km south of Alice Springs. The development of
Adequacy of Northern Territory Gas Supply | 143
Dingo provides an additional supply option for PWC and will also improve the efficiency of the new Owen Springs power station. Dingo gas is ‘leaner’ (that is, it contains lower levels of liquefiable hydrocarbons) compared to ‘rich’ conventional gas from Mereenie. Modern gas engines run more efficiently, utilising leaner natural gas (low heating value gas) compared to rich natural gas streams (higher heating value gas).
7.3.3 Backup supplyThe major sources of backup supply are LNG, Amadeus, east coast, diesel and line pack.
LNG backup supply – timingPWC’s backup supply arrangements with Darwin LNG and INPEX are not considered traditional firm supply agreements as their respective LNG production would take precedence over supply to PWC. The backup supply arrangements also have a long lead time before backup supply can commence – 24 hours to respond to a request then 48 hours for supply to commence. This period to commence backup supply is too long to assist if a significant emergency response is required. PWC relies on a reasonable endeavours obligation with Darwin LNG and INPEX to commence earlier backup supply. Given the scale of the LNG operations and the importance of gas supply to the Territory, it is likely Darwin LNG or INPEX would supply gas to PWC as soon as possible when requested, rather than commencing supply at the end of the formal notice time. Despite the likelihood of a faster commencement of supply by Darwin LNG or INPEX than the contractual timeframes, there is a risk associated with a slow start of backup supply.
Darwin LNGPWC has an existing backup arrangement with Darwin LNG’s Wickham Point facility. This arrangement will continue until the end of 2022. Assuming a Darwin-Katherine maximum demand of 65TJ per day, the existing Darwin LNG backup arrangement could supply the region for five to six weeks (or longer periods during low demand). PWC has previously utilised Darwin LNG backup supply during periods of planned and unplanned interruption of Blacktip production. At the time of the 11 September 2014 incident, Darwin LNG was undergoing planned maintenance and therefore not immediately available at the time when supply from Blacktip was interrupted. Other than this incident, PWC’s Darwin LNG backup arrangement has been proven to be effective and is currently PWC’s main mechanism to manage supply shortfalls from Blacktip.
The Darwin-Katherine (where the majority of generation is located) can be supplied using Darwin LNG backup gas. Pipeline pressures in the Amadeus pipeline may not be sufficient to transport Darwin LNG backup gas south of Tennant Creek.
Where there is a partial supply from Blacktip, Blacktip gas would continue to supply southern demand. Where there is a total loss of Blacktip gas, the southern region would be supplied through a combination of pipeline line pack, Darwin LNG (if pipeline pressure is suitable), Dingo gas and diesel generation. In an extended outage, additional gas from the Amadeus Basin is likely to be required to supply the southern region.
INPEX PWC has executed an agreement for a second backup supply of LNG with INPEX. This arrangement will commence upon operation of INPEX’s LNG plant in mid-2018 for a period of 15 years. This second PWC backup arrangement will greatly improve security of gas supply to the Territory, not only in duration of northern backup supply capability
144 | Power System Review 2016-17
(by doubling the period of coverage to at least 13 weeks), but also by managing the circumstance of a simultaneous interruption of gas supply from Blacktip and Darwin LNG. INPEX’s maximum delivery pressure is lower than Darwin LNG and is likely to have limited ability to supply gas further south than Darwin.
East coast gasEast coast gas supply is unlikely to be a major source of backup supply to the Territory in the short to medium term. Reversing the direction of flow in the NGP to deliver east coast gas into the Territory could take up to 12 months due to the time to undertake necessary pipeline modifications.
Furthermore, the amount of east coast gas that could enter the AGP would be heavily dependent on the delivery pressure of the NGP at Tennant Creek. Finally, east coast gas would also need to flow up the Ballera to Mt Isa pipeline before entering the NGP and then into the Territory. While there is some spare capacity in the Ballera to Mt Isa pipeline there would not be sufficient capacity to fully supply Territory demand. The conclusion is that physical east coast gas supply into the Territory is a medium-term supply solution and not viable to assist with short-term supply interruptions. PWC is likely to cease supplying the east coast market and hold back Blacktip gas to assist the Territory gas market in the event of a gas supply interruption.
Amadeus Basin gas – Mereenie and Palm Valley gas fields The commencement of Jemena’s NGP from late 2018 will open up new gas supply opportunities for Mereenie and Palm Valley, which could result in large quantities of the uncontracted Amadeus Basin gas reserves supplied to eastern Australia. Jemena’s NGP is likely to transform the Territory gas market from one of excess conventional gas supply capabilities to limited quantities of uncontracted conventional gas reserves from Amadeus Basin and Blacktip.
The likely reduction in Amadeus Basin’s uncontracted gas reserves will reduce gas supply security in the Territory as the availability of additional supply or backup gas supply from the Amadeus Basin reduces.
Pipeline line packSpare gas stored in transmission pipelines is referred to as pipeline line pack. Spare pipeline line pack is considered a small and short-term supplement to the main gas contingency strategy. The amount of line pack that can be used to supplement gas demand during a shortfall of Blacktip production depends on:
• the prevailing pipeline operating pressure, as the quantity of spare pipeline line pack is increased at higher pipeline operating pressures
• pipeline throughput and the amount of spare or unutilised firm transportation capacity.
Gas transmission pipelines that are short or transport gas close to their maximum design capacity have virtually no spare pipeline line pack. Gas pipelines that are long and have large quantities of unutilised capacity can have material quantities of spare line pack to supplement demand during periods of gas shortfall.
PWC has provided high level estimates of available line pack that can be taken from the relevant pipelines before generation is restricted:
• Bonaparte Gas Pipeline – up to 35TJ

Adequacy of Northern Territory Gas Supply | 145
• AGP (Ban Ban Springs to Darwin) – less than 5TJ
• AGP (Ban Ban Springs to Alice Springs) – up to 100TJ
• Wickham Point Pipeline (Darwin LNG to Channel Island) – up to 1TJ
• Palm Valley to Alice Springs Pipeline – less than 4TJ.
It is important to note however, the above estimates of current spare pipeline line pack in the AGP will significantly change with commencement of Jemena’s NGP. The direction of gas flows in the AGP will change upon commencement of the NGP and hence the availability of line pack in this pipeline.
The northern section of the AGP from Ban Ban Springs to Darwin has limited spare line pack because of its short distance and high flow rates. The Bonaparte gas pipeline represents the largest source of spare line pack for the northern region, however at maximum demand rates Bonaparte gas pipeline’s spare line pack would maintain Darwin-Katherine generation for less than one day if gas production ceased from Blacktip.
BatteriesTGen is currently commissioning a 5 megawatt (MW) battery in Alice Springs. The battery’s primary purpose is to provide inertia and other ancillary services. It is designed to provide short-term fast-reacting supply. The battery would not by itself provide backup supply in the case of a gas shortage or failure, but could help with the start-up and conversion of generators from gas to diesel.
Diesel backupTGen has a number of facilities capable of using diesel as a last resort if no sources of backup gas or spare line pack are available. Katherine, Tennant Creek, Ron Goodin and Owen Springs power stations have duel fuel (gas and diesel) generation capabilities. Additionally, Channel Island has some gas generators that can be converted to diesel in 24 to 48 hours.
Dual fuel generators generally have higher output running diesel than gas but are much more expensive to operate. Thus dual fuel generators normally operate on gas where possible.
With regard to Alice Springs, Ron Goodin will be decommissioned in 2019. This will result in nine generators with a capacity of 44.6MW being decommissioned. These generators are either diesel or dual fuel gas/diesel. These generators are being replaced by 10 new gas-only generators (41MW capacity).
This will reduce the availability of diesel generation in Alice Springs to around 36.4MW (plus Uterne’s 4MW solar). This is not sufficient to meet normal daily peak demands during summer.
Similarly, Tennant Creek is decommissioning five 1.3MW generators and commissioning three 2.2MW generators reducing the capacity of diesel generation from 14.9MW to 8.4MW.
Regarding Darwin, there is not sufficient diesel generation to operate the network. Further, some of this capacity requires 24 to 48 hours conversion time.
TGen has substantial diesel storage capacity at all its dual-fired facilities, although the new diesel tanks at Owen Springs power station have a smaller diesel storage capacity than the tanks at the old Ron Goodwin power station.
146 | Power System Review 2016-17
The operational inventory of diesel storage varies, depending on the location and availability of backup gas supply. Diesel backup is the last major source of fuel after all gas supply contingencies have been exhausted. While stand-by diesel stocks incur a significant cost, they remain a critical part of Territory power system security, particularly south of the Darwin-Katherine system.
7.3.4 Gas transportation Pipeline failure Neither the Bonaparte Pipeline nor the AGP have operating mid-line pipeline compressor stations. The lack of an operating mid-line compressor station reduces the risk of a transmission interruption.
Pipeline rupture of the Bonaparte Pipeline or AGP is likely to cause some level of gas interruption to electricity generation in the Territory. The location of the pipeline rupture would determine the extent of gas interruption, however this type of event is rare.
A major rupture is likely to be rectified within five to 10 weeks. Minor pipeline leaks are likely to be repaired within 24 hours.
7.3.5 Contingency analysis – failure of Blacktip or gas transportation An analysis of the contingency arrangements for a major and minor failure of Blacktip supply and gas transportation capacity is detailed in Table 9.3. The key contingency analysis conclusions are:
i. A partial loss of the Territory’s main source of gas supply (Blacktip gas field) for less than 10 weeks should be within normal contingency arrangements with no interruption to Territory power generation.
ii. A full loss of Blacktip gas for more than five weeks would exceed PWC’s normal contingency supply arrangements with Darwin LNG and require additional high cost gas purchases from Darwin LNG to maintain Territory power generation. Additional supply from the Amadeus Basin is likely to be required to maintain power generation in the southern Alice Springs region.
iii. The worst case or disaster scenario would be a catastrophic failure of the Blacktip gas field due to a major reserve failure due to fire or explosion of its facilities. This is likely to lead to some level of curtailment of power generation for up to 12 months until Jemena can reverse flow in the NGP and re-establishes full gas supply to the Territory from the east coast market. The level of power interruption in the Territory during this 12-month period to reverse flow in the Jemena pipeline would depend on how much additional gas can be secured from Darwin LNG, INPEX and Amadeus, and purchase of diesel.
iv. Pipeline rupture of the AGP or the Bonaparte Pipeline for more than 24 hours is likely to lead to some level of power interruption (depending on the location of the rupture) although the duration is likely to be short, given the expected fast response time to repair a pipeline rupture.

Adequacy of Northern Territory Gas Supply | 147
Table 9.3 Gas contingency analysis
Incident Event Contingency/outcome
Partial loss of Blacktip supply, less than 10 days
Minor plant failure or shutdown
• northern supply from Darwin LNG, INPEX or both
• southern supply from Blacktip
• no impact, within normal contingency
Partial loss of Blacktip supply for more than 10 weeks
Major failure of plant or equipment requiring extended period of repair
• northern supply from Darwin LNG, INPEX or both, additional gas maybe required
• southern supply from Blacktip
• outside normal contingency and may require additional gas purchases from Amadeus/Darwin LNG/INPEX/diesel
Full loss of Blacktip supply for less than 10 days
Significant failure of plant or extended maintenance
• northern supply from Darwin LNG, INPEX or both
• southern supply from pipeline Darwin LNG (subject to sufficient pipeline pressures), northern LNG backup, Amadeus gas or diesel
• no impact, within normal contingency, unless Amadeus gas required
Full loss of Blacktip for more than five weeks
Catastrophic failure of field or plant, reserve failure, fire or explosion
• northern supply from Darwin LNG, INPEX, diesel. Additional gas supply would be required
• southern supply from additional Darwin LNG (subject to sufficient pipeline pressures), Amadeus Basin gas or diesel.
• outside normal contingency and requires additional gas purchases from Amadeus, Darwin LNG or INPEX. Large additional costs, but gas should be available from Darwin LNG or INPEX to satisfy PWC’s full gas requirements but this cannot be guaranteed
Pipeline rupture Minor rupture – less than 24 hours
• Blacktip, Darwin LNG or INPEX backup, pipeline line pack where rupture doesn’t prevent gas supply
• diesel where rupture prevents gas supply
• no impact, within normal contingency
Pipeline rupture Major rupture – more than five weeks
• Blacktip, Darwin LNG or INPEX backup, pipeline line pack where rupture doesn’t prevent gas supply
• diesel where rupture prevents gas supply
• possibly outside normal contingency and would require additional gas purchases from Amadeus, Darwin LNG or INPEX
• Low-risk event given the fast response time to repair a pipeline rupture
7.4 Future Territory gas market 7.4.1 Future Territory gas supply/demand during Blacktip supply term
(end of 2034)Gas requirements to satisfy the Territory’s electricity demand are forecast to have flat to slightly negative growth during the next five years. Increased efficiency from modern generation facilities and new solar generation are offsetting small increases in power demand. PWC has sufficient peak gas supply capacity, annual gas volume and gas

148 | Power System Review 2016-17
transportation capacity to satisfy the Territory’s electricity demand on an annual and peak-day basis during this period.
Beyond the next five-year timeframe, a rapid transition to renewable energy to meet the 50 per cent renewable target by 2030 would substantially reduce the Territory’s annual gas requirements near the end of the Blacktip supply term, however peak-day gas demand is likely to continue to grow. Assuming gas continues to be the main fuel source for peak-day electricity demand, gas will be required to cover the portion of renewable generation that cannot be guaranteed to be supplied during periods of peak electricity demand.
Unless some other technology, such as storage that can replace gas to cover a substantial portion of non-firm renewable generation, gas capacity will have to supply close to 100 per cent of the Territory’s daily peak power requirements. This will impact how PWC manages its Blacktip gas supply over time as PWC will have to quarantine its daily Blacktip gas capacity for peak electricity demand but sell sufficient non-firm gas on an annual basis to satisfy its take-or-pay obligations under the Blacktip gas sale agreement.
This scenario of reduce future annual gas requirements but high peak daily gas demand will also have a significant impact on TGen and its mix of backup generation capacity to manage the increasing level of non-firm renewable generation.
7.4.2 New Territory gas supply post end of Blacktip supply term (end of 2034)PWC’s existing gas sale agreement with Blacktip is not due to expire until 2034. Regardless of the long timeframe until the end of Blacktip supply, it would be prudent to consider new gas supply now and take advantage of the time to explore, appraise and develop new gas supply. Note, 2034 is an estimate and subject to change as we move closer to the date.
There is a scenario that no onshore gas is available post 2034 and the Territory’s gas demand post 2034 will be too small to justify any new offshore development dedicated to domestic supply. Under this scenario, securing some form of gas from an LNG project would be critical. Underground gas storage to assist supply of the peak daily gas demand may also be required post the Blacktip gas sales agreement and should be evaluated.
Currently PWC holds the major gas contract on behalf of the Territory Government and on-sells this supply to TGen. There may be benefits in splitting this contract between PWC and TGen. This would provide TGen with more direct control over its gas supplies and allow PWC to focus on selling any excess gas to third parties.
Adequacy of Northern Territory Gas Supply | 149
7.4.3 Territory gas market implications of Jemena’s new NGPJemena’s NGP will enable existing Territory gas buyers and producers to sell gas to east coast gas customers, which will have a material impact on the Territory gas market. The NGP’s key impacts on the Territory gas market are likely to include:
i. An improvement in the gas supply-demand balance for PWC. PWC’s foundation gas supply to Incitec Pivot’s Phosphate Hill plant in north-west Queensland will assist the recovery of previously incurred take-or-pay gas to Eni under its Blacktip gas sales agreement. The NGP should also eliminate the risk of PWC incurring any future take-or-pay costs to Eni.
ii. An increase in gas prices as the Territory market becomes linked to higher east coast market prices less the cost to transport Territory gas to the east coast.
iii. Support further onshore exploration and appraisal of new gas reserves in the Territory, given the prospect of supply to the larger east coast gas market, which supports rapid commercialisation of new gas reserves (subject to resolution of gas fracking in the Territory).
iv. An increased risk of gas not being available for new Territory customers, especially if PWC or the Amadeus Basin producers sell all their uncontracted gas reserves to east coast customers.
v. The possibility of procuring gas from the east coast gas market if investment was gained to reverse the flow in the NGP.
7.4.4 New Territory onshore gas supplyThe Territory has the potential to develop a large new onshore gas industry from highly prospective unconventional shale gas resources in the northern part of the Territory or tight gas in the south. Any new onshore gas supply could be critical to supply the Territory gas market post expiry of the Blacktip gas supply agreement.
The time required to explore, appraise and develop new gas supply tends to take much longer than expected. It is possible that new large scale onshore unconventional gas supply in the Territory could take over 10 years to materialise.


| Appendices

152 | Power System Review 2016-17
Appendix A Assumptions and methodThis chapter discusses the major assumptions and methods used to assess the performance of the regulated systems and future risks to the systems.
To understand these issues the review is required to understand the level of demand and capacity (supply) in the systems. This review forecasts demand for the next 10 years.
Currently there is no overarching government policy on the level of reliability and security the electricity industry should be targeting. However work is currently underway by the Department of Treasury and Finance to implement a reliability standard in the Northern Territory. There is some network performance standards set out in the Network Technical Code (NTC). The Utilities commission, where appropriate, has also adopted certain standards or seeks to assess performance over an extended period of time.
A.1 Customer impactsThe main method used in this review to assess impacts on customers is customer minutes without supply (customer minutes) and looking at how this changes over time and across systems.
A.1.1 Customer minutesCustomer minutes are used by the commission as a proxy to quantify the impacts on customers caused by both reliability and security that result in a loss of electricity supply. Customer minutes are calculated by multiplying the number of customers affected by the duration of the incident. Currently, due to Supervisory Control and Data Acquisition (SCADA) limitations, the data collected is reasonably simplistic. The duration reflects when the last customer is restored, thus overstating customer minutes.
When customer minutes are divided by the number of customers in the system it allows systems of different sizes to be compared to each other.
Nationally, most methods to benchmark the performance of the electricity industry concentrates on the impact to customers from a single area, such as network performance. However, in the Territory this only provides a partial story as factors that would not impact larger systems, such as generation performance, also have a large impact. Thus the commission is seeking a performance indicator that covers all issues in the Territory. The most direct measure is customer minutes.
A.2 Demand forecastsOn behalf of the commission, the Australian Energy Market Operator (AEMO) has undertaken demand forecasting for the three regulated systems over the next 10 years. The forecasts look at average (total), maximum (peak) and minimum. Due to uncertainties in the future, the modelling also includes different scenarios.
These scenarios seek to highlight possible issues, uncertainty and risks, especially when matched against supply forecast to highlight areas of concern or risks.
A.2.1 Demand versus consumptionDemand is defined as the energy at a point in time whereas consumption is energy consumed over a period of time.
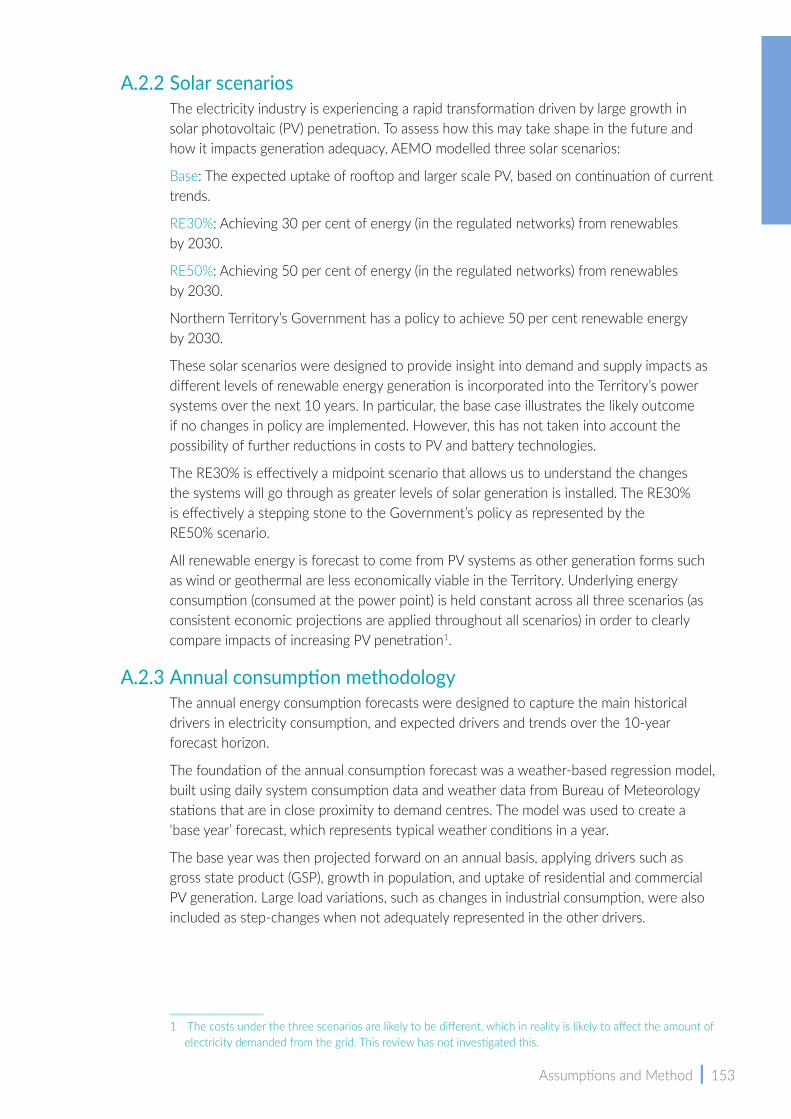
Assumptions and Method | 153
A.2.2 Solar scenarios
1 The costs under the three scenarios are likely to be different, which in reality is likely to affect the amount of electricity demanded from the grid. This review has not investigated this.
The electricity industry is experiencing a rapid transformation driven by large growth in solar photovoltaic (PV) penetration. To assess how this may take shape in the future and how it impacts generation adequacy, AEMO modelled three solar scenarios:
Base: The expected uptake of rooftop and larger scale PV, based on continuation of current trends.
RE30%: Achieving 30 per cent of energy (in the regulated networks) from renewables by 2030.
RE50%: Achieving 50 per cent of energy (in the regulated networks) from renewables by 2030.
Northern Territory’s Government has a policy to achieve 50 per cent renewable energy by 2030.
These solar scenarios were designed to provide insight into demand and supply impacts as different levels of renewable energy generation is incorporated into the Territory’s power systems over the next 10 years. In particular, the base case illustrates the likely outcome if no changes in policy are implemented. However, this has not taken into account the possibility of further reductions in costs to PV and battery technologies.
The RE30% is effectively a midpoint scenario that allows us to understand the changes the systems will go through as greater levels of solar generation is installed. The RE30% is effectively a stepping stone to the Government’s policy as represented by the RE50% scenario.
All renewable energy is forecast to come from PV systems as other generation forms such as wind or geothermal are less economically viable in the Territory. Underlying energy consumption (consumed at the power point) is held constant across all three scenarios (as consistent economic projections are applied throughout all scenarios) in order to clearly compare impacts of increasing PV penetration1.
A.2.3 Annual consumption methodologyThe annual energy consumption forecasts were designed to capture the main historical drivers in electricity consumption, and expected drivers and trends over the 10-year forecast horizon.
The foundation of the annual consumption forecast was a weather-based regression model, built using daily system consumption data and weather data from Bureau of Meteorology stations that are in close proximity to demand centres. The model was used to create a ‘base year’ forecast, which represents typical weather conditions in a year.
The base year was then projected forward on an annual basis, applying drivers such as gross state product (GSP), growth in population, and uptake of residential and commercial PV generation. Large load variations, such as changes in industrial consumption, were also included as step-changes when not adequately represented in the other drivers.

154 | Power System Review 2016-17
A.2.4 Maximum and minimum demand methodology
2 2016 Methodology information paper, 2016, available at http://www.aemo.com.au/Electricity/National-Electricity-Market-NEM/Planning-and-forecasting/National-Electricity-Forecasting-Report
3 AEMO-Transmission-Connection-Point-Forecasting-Methodology, 2016, available at http://www.aemo.com.au/Electricity/National-Electricity-Market-NEM/Planning-and-forecasting/Transmission-Connection-Point-Forecasting.
AEMO developed a regional maximum and minimum demand forecasting methodology in line with that used for the National Electricity Market (NEM) national electricity forecasts2. The methodology provides probabilistic demand forecasts by season, because demand is dependent on weather conditions (primarily temperature) and random shocks in response to weather, and these vary from year to year.
Due to this variability, maximum and minimum demand forecasts are expressed as probability of exceedance (POE) values from a distribution, rather than a point forecast. For any given season or year:
• a 10 per cent POE maximum demand value is expected to be exceeded, on average, one year in 10 (i.e. hot weather)
• a 50 per cent POE maximum/minimum value is expected to be exceeded, on average, one year in two (i.e. average weather)
• a 90 per cent POE minimum demand value is expected to be exceeded, on average, nine years in 10 (i.e. cool weather).
Maximum demand at zone substations was forecast in line with AEMO’s Transmission Connection Point Forecasting Methodology3, under the Base scenario. This represents a change to the methodology previously employed. The main improvements include the simulation of demand and weather at daily granularity, explicit calculation of the impact of rooftop PV and reconciliation to a system-level forecast.
A.2.5 Demand and consumption definitions (underlying, system and dispatchable) Demand and consumption modelling has been performed on underlying demand or underlying consumption, which is an estimate of the power used by consumers. This produces a tight relationship between demand and weather, allowing the impact of embedded generation (rooftop PV) to be modelled.
System demand or system consumption is defined as the power sent into the network by licenced generators:
• for Darwin-Katherine – generation from Channel Island, Weddell, Pine Creek and Katherine, and any new large-scale generation
• for Alice Springs – generation from Owen Springs, Uterne, Brewer (now closed), Ron Goodin and any new large-scale generation
• for Tennant Creek – Tennant Creek power station and any new large-scale generation.
Auxiliary power, used for on-site generation, and household PV generation is not included as part of system demand or consumption.
For the purpose of assessing demand or consumption met by thermal generators (in the supply modelling), a third definition – dispatchable demand or dispatchable consumption – is used. This represents demand or consumption met by generating sources other than

Assumptions and Method | 155
large-scale PV (such as Uterne) which, in the regulated networks, are typically gas-fired generating units.
4 See Northern Territory Budget 2017-18, Northern Territory Economy, Department of Treasury and Finance, at https://budget.nt.gov.au/2017-18-budget-papers.
A.2.6 Season definitionsMaximum demand forecasts were presented on a seasonal basis. The wet/summer season is defined to be the period 1 November to 31 March. The dry/winter season is defined as the period 1 June to 31 August. Shoulder periods, used when assessing minimum demand, are the remaining months.
A.2.7 Demand data and network informationPower and Water Corporation (PWC) Networks provided:
• demand data, used to conduct historical analysis and construct forecasting models, including half-hourly data at the zone substations, in addition to system-level demand
• Network information on outage events, used to assist in cleaning historical demand data
• information about industrial demand changes, future load transfers and anticipated new load.
A.2.8 Economy and populationForecasts of population and GSP were based on the projections in the 2017-18 Budget Papers4, using the long-term average for the years after 2020-21. The GSP projection was for the Territory and not considered to be directly indicative of economic activity in Tennant Creek and Alice Springs. Therefore, the GSP and population projections were applied to Darwin-Katherine and only population was applied to Tennant Creek and Alice Springs.
The population forecasts used for Darwin-Katherine were based on the combined Greater Darwin and Katherine population (2 per cent growth per annum in the long term). Tennant Creek’s population growth was based on Barkley population (0.9 per cent growth per annum in the long term) and Alice Springs’ population growth (0.1 per cent decline per annum in the long term) was applied to the Alice Springs network.
A.2.9 Weather dataTemperature, humidity, and solar irradiance data was sourced from the Bureau of Meteorology at half-hourly temporal resolution (hourly for irradiance) to model intra-day relationships between demand and weather. Weather data was also used in supply modelling to ensure PV output is consistent with the weather-driven demand conditions used at each time-step in the simulation.
Darwin Airport, Tennant Creek Airport and Alice Springs Airport were the main observing stations used for system-level modelling. For the zone substations, observations from Douglas River and Tindal RAAF were also used to improve the representativeness of the data used.
A.2.10 Residential, commercial and large‑scale PV Installed PV capacity was split into residential, commercial and large-scale. Residential and commercial PV systems offset demand met by the grid, while large-scale systems

156 | Power System Review 2016-17
operate as system generators and therefore contribute to meeting system demand (that is, grid-supplied energy, for example, Uterne in Alice Springs).
Historical installation records were provided by PWC Networks and used as a foundation for the projections.
The Base scenario PV projections were based on the following assumptions:
• Residential systems – AEMO assumed 15 per cent of Darwin-Katherine households and 20 per cent of Alice Springs households will have PV systems in 2026-27, adopted from existing penetration levels in other Australian states. Tennant Creek projection was based on comparable growth rates with an average capacity for future installations of 6.5 kW per unit.
• Commercial systems – the average capacity was assumed to be 30 kW per unit and AEMO forecast a total of 418 units would be installed over the 10-year forecast period, with a higher uptake of about 60 units per year in the first four years of the forecast. This was based on recent installation rates as recorded by PWC Networks.
• Large-scale systems – The commission has limited information on precise construction times for large-scale system. Construction timing for projects in the early phase of development are subject to significant change. The following estimates have been included to provide an indication of possible changes to the system. For precise construction times please contact the individual entities involved. At Alice Springs, Uterne’s 4 megawatt (MW) plant is operational. In the Darwin-Katherine network the commission has approved a licence for Katherine Solar for a 25MW plant, which the commission has estimated will connect in 2019-20. We have also included two other plants: 10MW (2019-20) and 12MW (2020-21) at Batchelor and Manton, respectively. System demand includes the generation from these systems.
For the two alternate scenarios (RE30% and RE50%), AEMO based PV projections on moderate increases in residential and commercial PV, leaving large-scale PV systems to meet the remaining energy production requirement in each scenario.
It is assumed the availability of suitable roof space is finite and at some stage the installation of residential and commercial PV will become more difficult and expensive, with decreasing benefits. For example, there is only a certain amount of north facing roof space, or roof space not heavily shaded or is structurally designed to cope with the additional weight. It is assumed to move from 30 to 50 per cent will mostly be related to large-scale PV as the residential and commercial market is likely to be saturated.
A.2.11 ReservesThe electricity system requires reserves to operate in a secure operating state. The reserve allows for normal fluctuations in demand to be instantaneously met. There are two main types of reserves, regulating and spinning reserve. Reserves form part of the demand that generators have to meet, hence its inclusion in the demand section. Once set, the maintenance of reserves is important for the security of the system.
AEMO has modelled the minimum reserve requirements of each power system in the Territory.
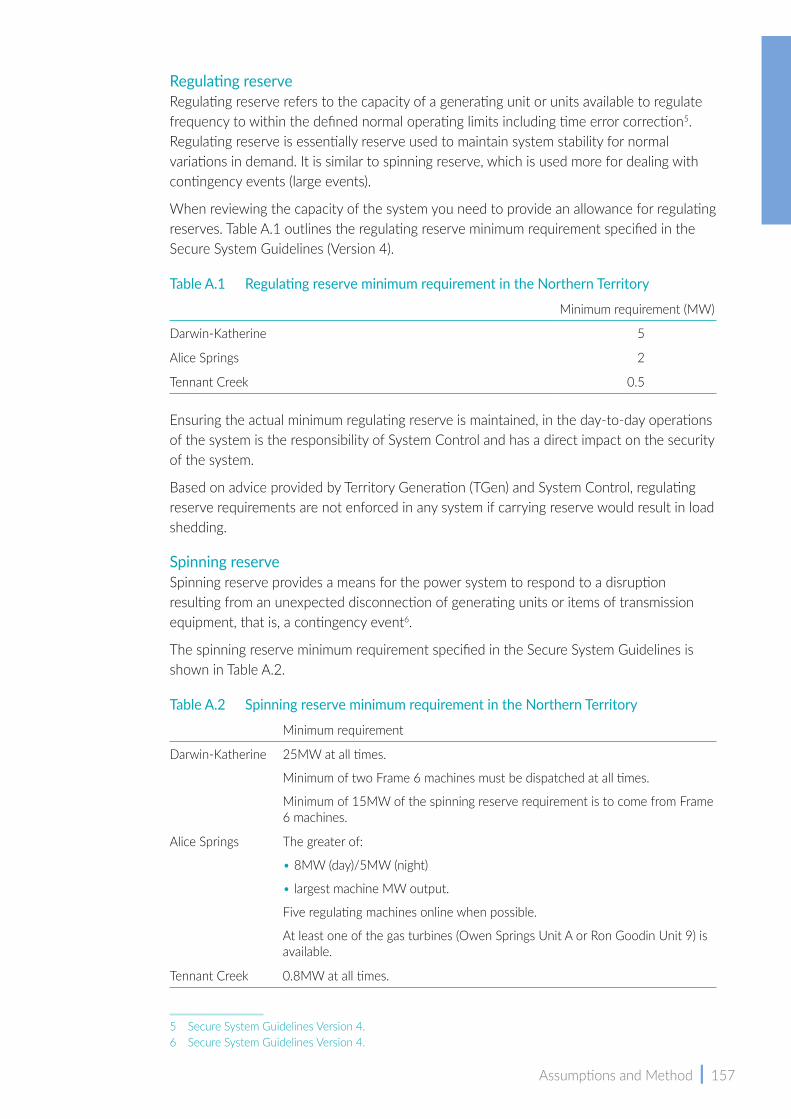
Assumptions and Method | 157
Regulating reserveRegulating reserve refers to the capacity of a generating unit or units available to regulate frequency to within the defined normal operating limits including time error correction5. Regulating reserve is essentially reserve used to maintain system stability for normal variations in demand. It is similar to spinning reserve, which is used more for dealing with contingency events (large events).
When reviewing the capacity of the system you need to provide an allowance for regulating reserves. Table A.1 outlines the regulating reserve minimum requirement specified in the Secure System Guidelines (Version 4).
Table A.1 Regulating reserve minimum requirement in the Northern Territory
Minimum requirement (MW)
Darwin-Katherine 5
Alice Springs 2
Tennant Creek 0.5
Ensuring the actual minimum regulating reserve is maintained, in the day-to-day operations of the system is the responsibility of System Control and has a direct impact on the security of the system.
Based on advice provided by Territory Generation (TGen) and System Control, regulating reserve requirements are not enforced in any system if carrying reserve would result in load shedding.
Spinning reserveSpinning reserve provides a means for the power system to respond to a disruption resulting from an unexpected disconnection of generating units or items of transmission equipment, that is, a contingency event6.
The spinning reserve minimum requirement specified in the Secure System Guidelines is shown in Table A.2.
Table A.2 Spinning reserve minimum requirement in the Northern Territory
Minimum requirement
Darwin-Katherine 25MW at all times.
Minimum of two Frame 6 machines must be dispatched at all times.
Minimum of 15MW of the spinning reserve requirement is to come from Frame 6 machines.
Alice Springs The greater of:
• 8MW (day)/5MW (night)
• largest machine MW output.
Five regulating machines online when possible.
At least one of the gas turbines (Owen Springs Unit A or Ron Goodin Unit 9) is available.
Tennant Creek 0.8MW at all times.
5 Secure System Guidelines Version 4.6 Secure System Guidelines Version 4.
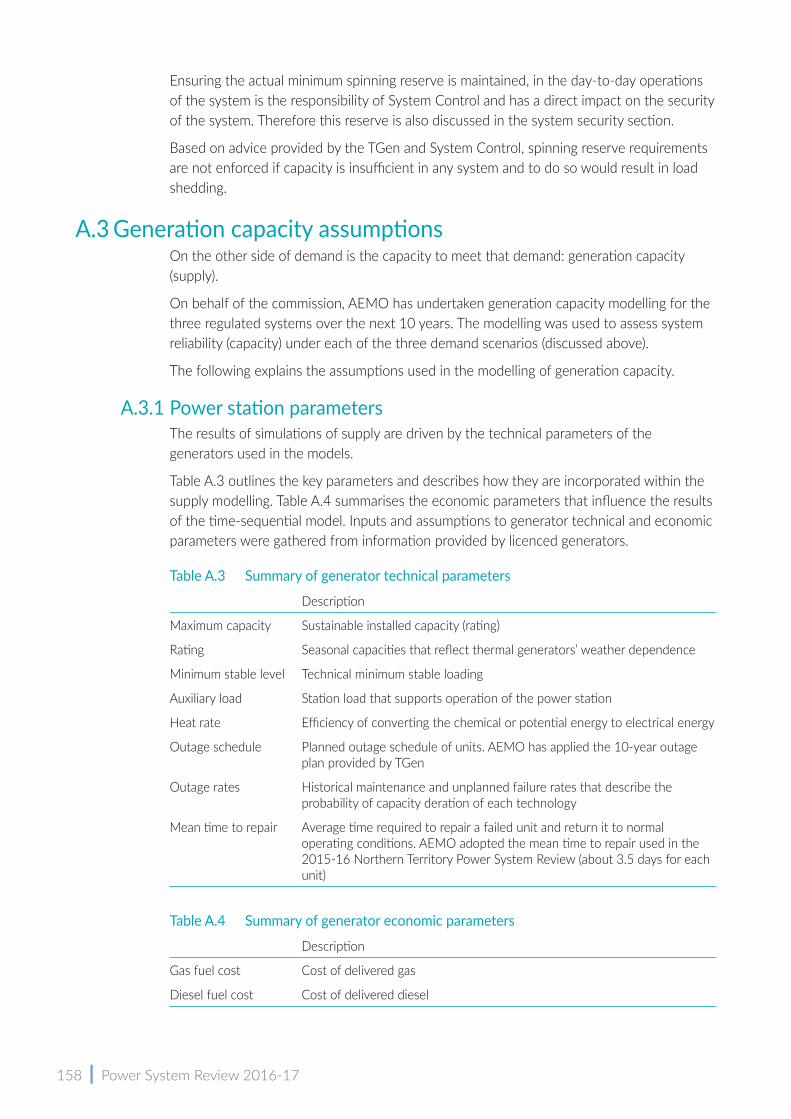
158 | Power System Review 2016-17
Ensuring the actual minimum spinning reserve is maintained, in the day-to-day operations of the system is the responsibility of System Control and has a direct impact on the security of the system. Therefore this reserve is also discussed in the system security section.
Based on advice provided by the TGen and System Control, spinning reserve requirements are not enforced if capacity is insufficient in any system and to do so would result in load shedding.
A.3 Generation capacity assumptionsOn the other side of demand is the capacity to meet that demand: generation capacity (supply).
On behalf of the commission, AEMO has undertaken generation capacity modelling for the three regulated systems over the next 10 years. The modelling was used to assess system reliability (capacity) under each of the three demand scenarios (discussed above).
The following explains the assumptions used in the modelling of generation capacity.
A.3.1 Power station parametersThe results of simulations of supply are driven by the technical parameters of the generators used in the models.
Table A.3 outlines the key parameters and describes how they are incorporated within the supply modelling. Table A.4 summarises the economic parameters that influence the results of the time-sequential model. Inputs and assumptions to generator technical and economic parameters were gathered from information provided by licenced generators.
Table A.3 Summary of generator technical parameters
Description
Maximum capacity Sustainable installed capacity (rating)
Rating Seasonal capacities that reflect thermal generators’ weather dependence
Minimum stable level Technical minimum stable loading
Auxiliary load Station load that supports operation of the power station
Heat rate Efficiency of converting the chemical or potential energy to electrical energy
Outage schedule Planned outage schedule of units. AEMO has applied the 10-year outage plan provided by TGen
Outage rates Historical maintenance and unplanned failure rates that describe the probability of capacity deration of each technology
Mean time to repair Average time required to repair a failed unit and return it to normal operating conditions. AEMO adopted the mean time to repair used in the 2015-16 Northern Territory Power System Review (about 3.5 days for each unit)
Table A.4 Summary of generator economic parameters
Description
Gas fuel cost Cost of delivered gas
Diesel fuel cost Cost of delivered diesel
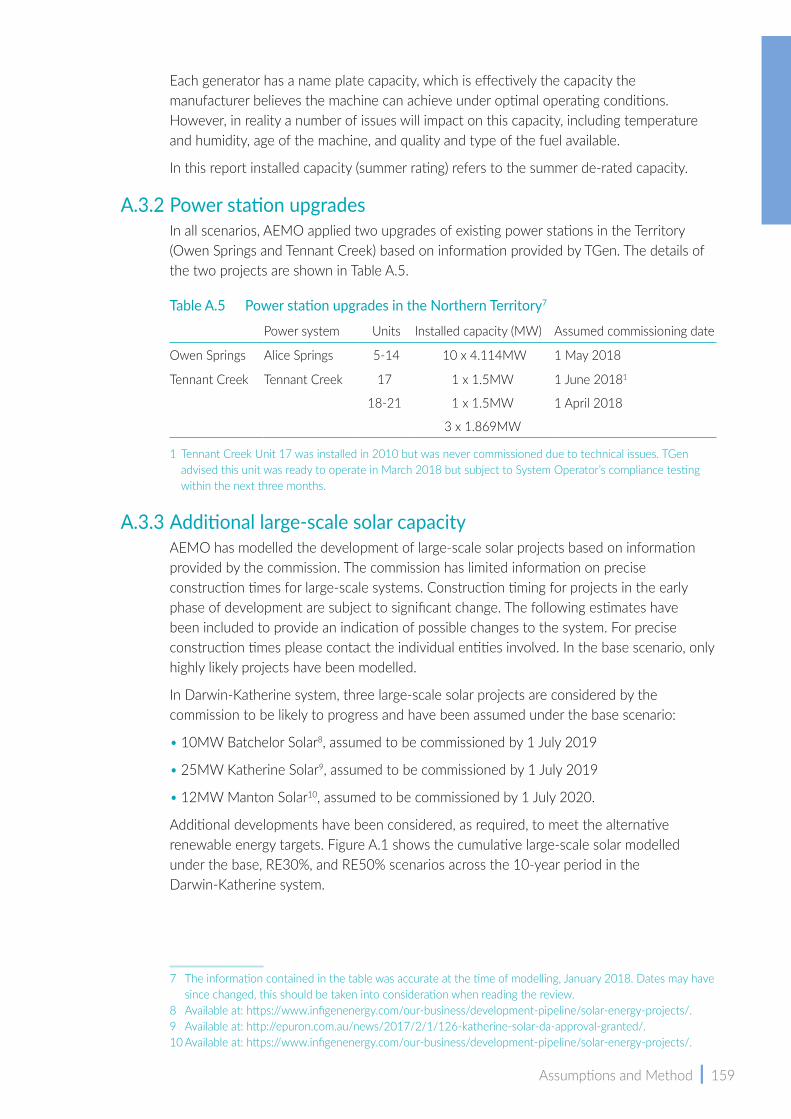
Assumptions and Method | 159
Each generator has a name plate capacity, which is effectively the capacity the manufacturer believes the machine can achieve under optimal operating conditions. However, in reality a number of issues will impact on this capacity, including temperature and humidity, age of the machine, and quality and type of the fuel available.
In this report installed capacity (summer rating) refers to the summer de-rated capacity.
7 The information contained in the table was accurate at the time of modelling, January 2018. Dates may have since changed, this should be taken into consideration when reading the review.
8 Available at: https://www.infigenenergy.com/our-business/development-pipeline/solar-energy-projects/.9 Available at: http://epuron.com.au/news/2017/2/1/126-katherine-solar-da-approval-granted/.10 Available at: https://www.infigenenergy.com/our-business/development-pipeline/solar-energy-projects/.
A.3.2 Power station upgradesIn all scenarios, AEMO applied two upgrades of existing power stations in the Territory (Owen Springs and Tennant Creek) based on information provided by TGen. The details of the two projects are shown in Table A.5.
Table A.5 Power station upgrades in the Northern Territory7
Power system Units Installed capacity (MW) Assumed commissioning date
Owen Springs Alice Springs 5-14 10 x 4.114MW 1 May 2018
Tennant Creek Tennant Creek 17
18-21
1 x 1.5MW
1 x 1.5MW
3 x 1.869MW
1 June 20181
1 April 2018
1 Tennant Creek Unit 17 was installed in 2010 but was never commissioned due to technical issues. TGen advised this unit was ready to operate in March 2018 but subject to System Operator’s compliance testing within the next three months.
A.3.3 Additional large‑scale solar capacityAEMO has modelled the development of large-scale solar projects based on information provided by the commission. The commission has limited information on precise construction times for large-scale systems. Construction timing for projects in the early phase of development are subject to significant change. The following estimates have been included to provide an indication of possible changes to the system. For precise construction times please contact the individual entities involved. In the base scenario, only highly likely projects have been modelled.
In Darwin-Katherine system, three large-scale solar projects are considered by the commission to be likely to progress and have been assumed under the base scenario:
• 10MW Batchelor Solar8, assumed to be commissioned by 1 July 2019
• 25MW Katherine Solar9, assumed to be commissioned by 1 July 2019
• 12MW Manton Solar10, assumed to be commissioned by 1 July 2020.
Additional developments have been considered, as required, to meet the alternative renewable energy targets. Figure A.1 shows the cumulative large-scale solar modelled under the base, RE30%, and RE50% scenarios across the 10-year period in the Darwin-Katherine system.
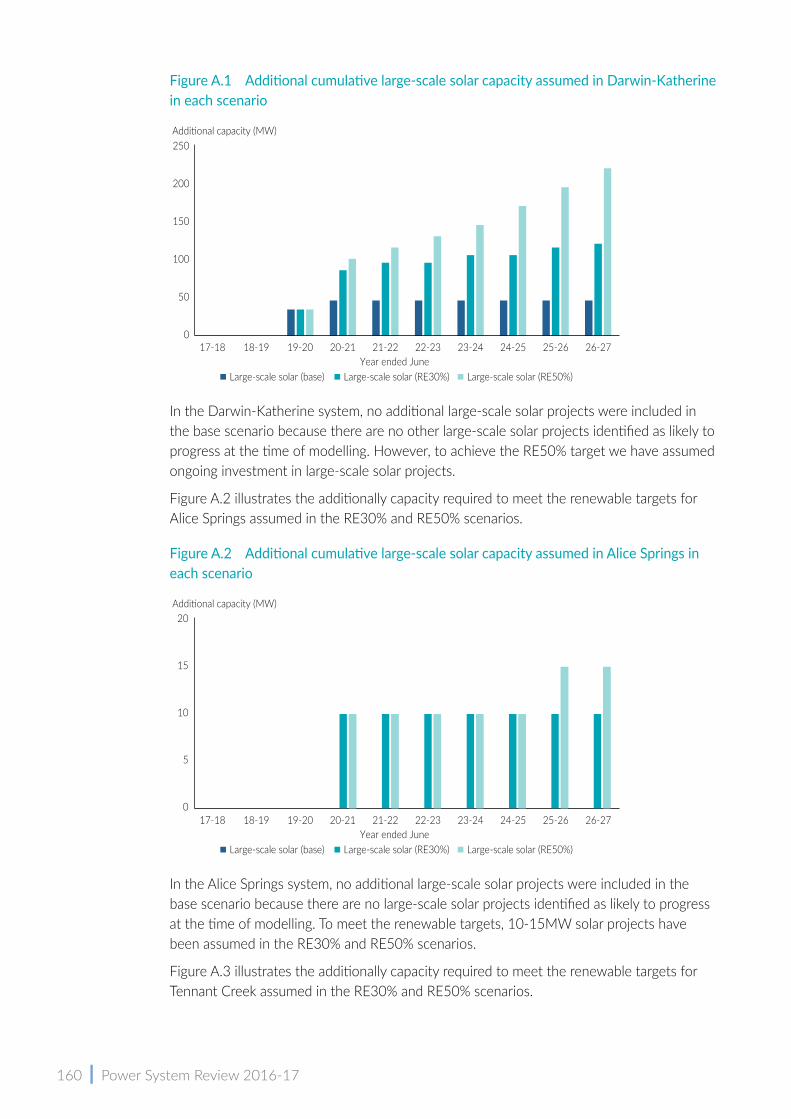
160 | Power System Review 2016-17
Figure A.1 Additional cumulative large‑scale solar capacity assumed in Darwin‑Katherine in each scenario
In the Darwin-Katherine system, no additional large-scale solar projects were included in the base scenario because there are no other large-scale solar projects identified as likely to progress at the time of modelling. However, to achieve the RE50% target we have assumed ongoing investment in large-scale solar projects.
Figure A.2 illustrates the additionally capacity required to meet the renewable targets for Alice Springs assumed in the RE30% and RE50% scenarios.
Figure A.2 Additional cumulative large‑scale solar capacity assumed in Alice Springs in each scenario
In the Alice Springs system, no additional large-scale solar projects were included in the base scenario because there are no large-scale solar projects identified as likely to progress at the time of modelling. To meet the renewable targets, 10-15MW solar projects have been assumed in the RE30% and RE50% scenarios.
Figure A.3 illustrates the additionally capacity required to meet the renewable targets for Tennant Creek assumed in the RE30% and RE50% scenarios.
0
50
100
150
200
250
17-18 18-19 19-20 20-21 21-22 22-23 23-24 24-25 25-26 26-27
Additional capacity (MW)
Year ended JuneLarge-scale solar (base) Large-scale solar (RE30%) Large-scale solar (RE50%)
17-18 18-19 19-20 20-21 21-22 22-23 23-24 24-25 25-26 26-27
Additional capacity (MW)
Year ended JuneLarge-scale solar (base) Large-scale solar (RE30%) Large-scale solar (RE50%)
0
5
10
15
20
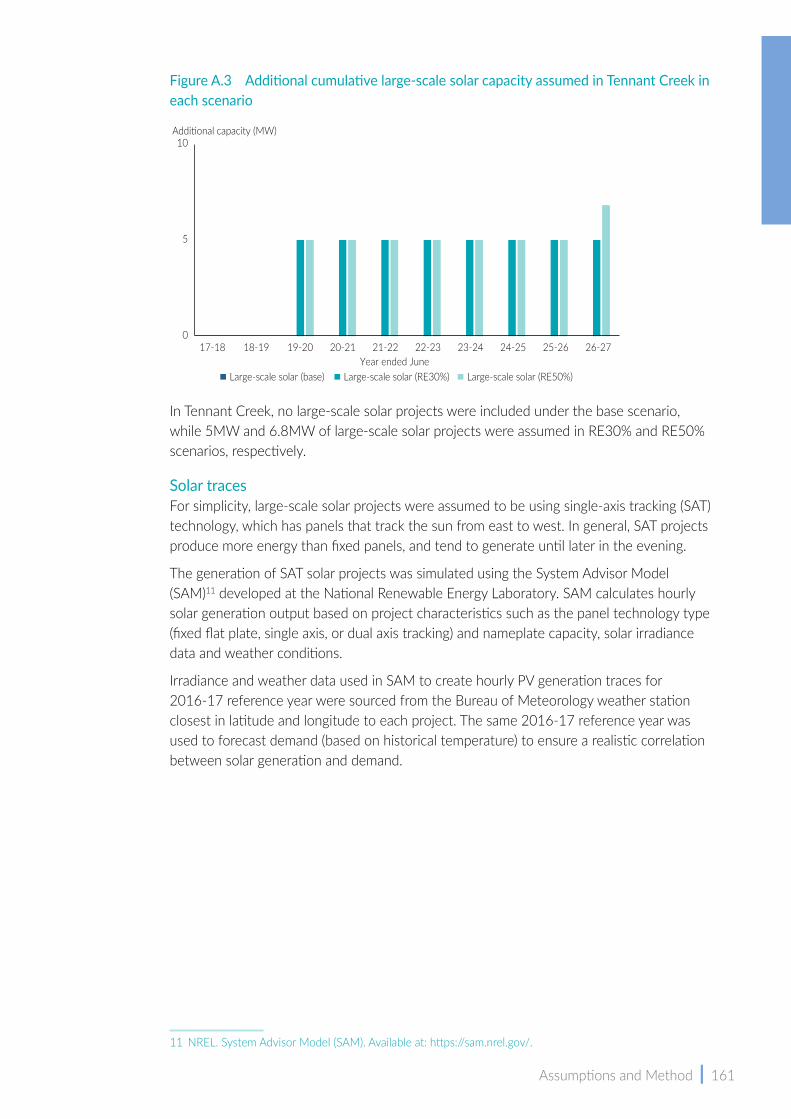
Assumptions and Method | 161
Figure A.3 Additional cumulative large‑scale solar capacity assumed in Tennant Creek in each scenario
In Tennant Creek, no large-scale solar projects were included under the base scenario, while 5MW and 6.8MW of large-scale solar projects were assumed in RE30% and RE50% scenarios, respectively.
Solar tracesFor simplicity, large-scale solar projects were assumed to be using single-axis tracking (SAT) technology, which has panels that track the sun from east to west. In general, SAT projects produce more energy than fixed panels, and tend to generate until later in the evening.
The generation of SAT solar projects was simulated using the System Advisor Model (SAM)11 developed at the National Renewable Energy Laboratory. SAM calculates hourly solar generation output based on project characteristics such as the panel technology type (fixed flat plate, single axis, or dual axis tracking) and nameplate capacity, solar irradiance data and weather conditions.
Irradiance and weather data used in SAM to create hourly PV generation traces for 2016-17 reference year were sourced from the Bureau of Meteorology weather station closest in latitude and longitude to each project. The same 2016-17 reference year was used to forecast demand (based on historical temperature) to ensure a realistic correlation between solar generation and demand.
11 NREL. System Advisor Model (SAM). Available at: https://sam.nrel.gov/.
17-18 18-19 19-20 20-21 21-22 22-23 23-24 24-25 25-26 26-27
Additional capacity (MW)
Year ended JuneLarge-scale solar (base) Large-scale solar (RE30%) Large-scale solar (RE50%)
0
5
10
162 | Power System Review 2016-17
12 The information contained in the table was accurate at the time of modelling, January 2018. Dates may have since changed, this should be taken into consideration when reading the review.
A.3.4 Power station retirementsAEMO has modelled the retirement of Ron Goodin power station and a number of Tennant Creek generators, as shown in Table A.6. This was based on information provided by TGen.
Table A.6 Power station retirements12
Power system Units Estimated total capacity (MW) Assumed retirement date
Ron Goodin Alice Springs 1–5, 9
6–8
2 x 1.9MW
1 x 11.7MW
3 x 4.2MW
3 x 5.5MW
30 June 20181
31 December 20182
Tennant Creek Tennant Creek 1–5 5 x 1.3MW 31 July 20183
1 This is based on TGen’s 2017 Asset Management Plan.2 Ron Goodin units 6-8 were assumed to be decommissioned six months after decommissioning Ron Goodin
units 1-5 and 9 to provide allowance for the transition. This transition is reflected in the 2017 Asset Management Plan.
3 Tennant Creek units 1-5 were assumed to be decommissioned by 31 July 2018. This is four months before the commissioning of Tennant Creek units 17-21.
A.3.5 Large‑scale battery storage projectsAEMO has modelled large-scale battery storage projects in the RE30% and RE50% scenarios only, as provided in Table A.7.
The Alice Springs battery energy storage system was not included in the base scenario as at the time of modelling it was not a committed project. AEMO do not believe it materially changes the unserved energy outlook, given forced outage rates are the main driver of unserved energy (USE).
Table A.7 Large‑scale battery storage projects under RE30% and RE50% scenarios
Power system Assumed capacityAssumed commissioning date
Darwin-Katherine battery energy storage system
Darwin-Katherine 17.5MWh/ 35MW 1 January 2020
Alice Springs battery energy storage system
Alice Springs 3.33MWh/ 5MW 1 May 20181
1 This was assumed to coincide with the timing of the Owen Springs power station upgrade.
A.4 Generation reliabilityReliability issues are generally foreseeable and solvable.
Reliability in the power system means there is enough generation capacity to supply customer demand. The main question is do we have sufficient generation and network capacity to meet maximum demand.
A complexity to reliability in the Territory is that each system has a limited number of generators that provide a large percentage of the total capacity of the system. From time

Assumptions and Method | 163
to time, generators are not always available due to planned and unplanned outages. Where relatively large numbers of generators are frequently unavailable this will impact the system’s level of reliability.
Reliability is a key indicator of system health. When the system is unreliable, that is, it does not have sufficient capacity, then there will be an increased chance of outages (load shedding), especially at times of high demand.
Extended outages can cause significant economic loss for the economy and cause significant inconvenience to consumers, noting that maximum demand is generally on the hottest days of the year.
Unlike the NEM where a target for USE of 0.002 is used for generation, the Territory system does not currently have a numerical target, although work is currently underway on a reliability standard. The commission has traditionally adopted the NEM’s target to assess the health and risks to the Territory’s generation in the absence of a local target. The target actual outcome is the USE, but when forecasting outcomes, this review refers to the expected unserved energy (EUE). That is, USE is current, EUE is forecast.
A.4.1 Generation reliability assessment methodologiesThis section discusses the different approaches used to assess the reliability of generation in the Territory. Each approach provides a different view of reliability and highlights potential risks moving forward.
• N-X exposure
• Expected Unserved Energy (EUE)
• non-reliable state/non-reliable notices.
The details of the approaches are summarised below.
A.4.2 N‑X and N‑X exposureN-X is a traditional, simple, approach that assesses the installed capacity against the forecast peak dispatchable demand, allowing for potential outages including planned maintenance and unit outages. However, we have amended this assessment slightly.
Rather, AEMO has considered how many of the largest units could be offline while still meeting the peak dispatchable demand and minimum reserve requirements (see section A.2.11), as advised by System Control. As a means of illustrating the likelihood of load shedding, AEMO has also provided the probability that available capacity would be equal to or below each N – X level based on simulated data. Available capacity data was based on the results of the hourly probabilistic simulation.
As solar generation has been removed from the demand to calculate peak dispatchable demand, only thermal generators are considered in the capacity calculations.
A.4.3 Expected unserved energy EUE probabilistic approaches quantify the anticipated reliability of the system compared with an adopted reliability standard.
Hourly market modelling simulations were used across 200 Monte Carlo iterations to identify the probability of installed capacity being insufficient to meet demand given the likelihood of coincident outages across the generation portfolio in each system. Planned and unplanned outages were critical inputs to this assessment.
164 | Power System Review 2016-17
Reliability outcomes are shown in comparison to a reliability standard of 0.002% USE. The reliability standard used in the National Electricity Market and the WA Wholesale Electricity Market is 0.002 per cent USE.
Expected USE (that is, EUE) was derived by applying the weighting factors adopted from the 2017 Electricity Statement of Opportunities Methodology. Weighting of 30.4 per cent and 69.6 per cent are applied to the level of USE in the POE 10 and POE 50 simulations, respectively.
EUE standard and under frequency load shedding Under frequency load shedding (UFLS) schemes are used when demand exceeds capacity. AEMO have modelled the likelihood of this occurring due to capacity constraints. Additionally, to cover for a sudden loss in generation (or large increase in demand), System Control uses spinning reserve and UFLS schemes.
When capacity is tight System Control will in the first instance reduce spinning reserves, which obviously increases the risks to the security of the system. If the spinning reserve is not sufficient, then System Control will activate its UFLS scheme.
UFLS turns certain feeders off (load sheds) resulting in disconnection of certain customers. The feeders and thus customers to be disconnected are predetermined. The greater the gap in generation and load, the more feeders and thus customers will have to be shed. System Control generally seeks to have the ability to shed in stages. UFLS schemes generally have the capacity to shed at least 75 per cent of customers.
Customers are reconnected when generation can be increased sufficiently to meet the underlying demand or demand can be decreased to match available generation. UFLS stages are quicker and easier to recover than allowing the system to go into a system black.
UFLS operations have a cost to customers. A proxy for this cost is the Value of Customer Reliability (VCR) value. VCR represents a customer’s willingness to pay for reliable supply of electricity (in dollars per kWh). For example, AEMO uses the VCR to assess the merits of carrying out additional investments. System Control uses the latest Victorian VCR, which is September 2014.
Ideally, the cost of acquiring spinning reserve (a cost borne regardless of the number of events) is less than (or equal) to the likely impact to customers of the UFLS events.
The VCR is an average across customers. Clearly, different customers will be impacted differently, and depending on the timing and ambient conditions the impact will vary. For example, the impact of no electricity to run air conditioning and fans during the build-up is different to the impact during a dry season night.
Where spinning reserve is too high, the cost will be greater than the benefits to customers (from reduced UFLS) and vice versa too low spinning reserve than the impact on customers will be greater than the cost of spinning reserve.
To assess the impact on customers, in the NEM, the Australian Energy Market Commission’s (AEMC) reliability panel assess the annual EUE. The value of EUE is calculated as an accumulation of the load shedding that occurred due to UFLS action from the major incidents reported. The details are included in the assessment of each region in subsequent chapters of this review.
In the NEM, the USE is set at 0.002 per cent of the total energy for a given financial year demanded (which the commission has used in the absence of a Territory target). This is equivalent to a loss of load probability (LOLP) of one day in 10 years or 0.1 days per year.

Assumptions and Method | 165
Actual outcomes will fluctuate from year to year, as there are generally only a limited number of UFLS events in each system.
If the government was to create an overarching reliability assessment, which is understood to be underdevelopment, and an associated Territory Reliability Panel, then the Territory panel would assess whether EUE is an appropriate measure, and if so whether the national requirements are appropriate and affordable in the Territory context.
The commission notes this measure only reflects one aspect of impacts on customers.
A.4.4 Non‑reliable noticesSince January 2016 for Darwin-Katherine and January 2017 for Alice Springs, System Control has been issuing non-reliable notices detailing periods of heightened risk, when the capacity of the system is compromised, normally due to high levels of demand and generation outages. However, it should be noted, non-reliable notices can be issued throughout the year and are not solely related to periods of high demand.
A simplistic measure of system health is to compare the number and duration of these non-reliable notices. When a system has significant levels of spare capacity and outage rates are low then you would expect to see fewer non-reliable notices.
The commission has reviewed the number and duration by system by month to assess changes over time. As more data is collected, the commission will be able to highlight trends and changes.
A.4.5 Generation outagesTo understand whether the Territory power systems will have enough capacity (generation) to supply customer demand, it is important to understand how often generators are available.
Generators cannot operate 100 per cent of the time. They need down time to undertake essential maintenance. Further, and especially as they age, generators also have unplanned outages and require time for repairs.
Due to the low number of generators per system, and the large proportion of capacity that they hold, having several generators out at once, especially at peak periods, may cause issues for the reliability of the system. Understanding generator outages is therefore crucial to understanding future risks and forecasting capacity.
In the generation assessment, three types of generator outages have been modelled:
• Known planned outages – generator known planned outages have been assumed to be timed in accordance with TGen’s current Asset Management Plan. These include necessary inspections, repairs and refurbishments scheduled by TGen to ensure long-term performance of their generator assets. Known planned outages of generators outside of TGen’s portfolio are not publicly available and were not included in the model.
• Unknown planned outages – generator unknown planned outages, or maintenance rates, were included in the model as annual percentages. These rates were based on the information sourced from licenced generators. In the model, there is a clear distinction between unknown and known planned outages. While known planned outages have a defined schedule, unknown planned outages have been dynamically assigned to coincide with low periods of risk.

166 | Power System Review 2016-17
• Unplanned outages – generator unplanned outages are modelled in a probabilistic manner using Monte Carlo simulations13. The timing of these was randomly allocated based on the assumed outage rates. These rates were based on historical data and information provided by TGen and System Control. The assumed unplanned outage rates in each power system are provided in Table A.8, Table A.9 and Table A.10. Unplanned outage rates of Pine Creek and Shoal Bay power stations are not included in the table due to confidentiality.
TGen was unable to supply outage rates for Alice Springs for 2016-17 due to technical problems with its data. TGen stated that data from the Ron Goodin power station’s (RGPS) data logging server was extracted for the 2016-17 Standard of Service report (as required for the Electricity Standard of Service Code). The data was found to have multiple errors and was corrupted. This affected RGPS and Owen Springs power station (OSPS) hourly availability factors. The data inaccuracies came about following the upgrade for the RGPS data logging server undertaken by TGen. The upgrade from the old system produced system bugs that triggered errors during the switch. These errors are irreversible.
In June 2017, a new ROC PI Historian system for OSPS was installed and tested to capture, collect and store all data from the OSPS engines. This system became fully operational in December 2017. As RGPS is scheduled to shortly be decommissioned, TGen has not invested in a new data logging system at RGPS.
System Control was able to supply information but unfortunately the methodology used between the two sets of data are different. The System Control data provides much higher rates, as it is based on availability per day, rather than per hour. Thus, outage rates for current Alice Springs generators (some of which will be retired shortly) are a worst-case scenario. The use of this System Control data does not materially impact on the final modelling outcomes. The outage rates for TGen’s new generators in Alice Springs and Tennant Creek are based on national standards.
Table A.8 Average station unplanned outages in Darwin‑Katherine
Generator unit
Unplanned outage rates (%)
Source2017-18 2018-19 2019-20 beyond
CIPS 2.17 2.17 2.17 2016-17 historical data from TGen
KPS 1.63 1.65 1.62 TGen projection
WPS 1.58 1.58 1.62 TGen projection
Table A.9 Average station unplanned outages in Alice Springs
Generator unit
Unplanned outage rates (%)
Source2017-18 2018-19 2019-20 beyond
OSPS 1-3, A 11.13 11.13 11.13 2016-17 (8 months) historical data from PWC (worst case)
OSPS 5-14 0.42 0.97 0.97 TGen projection
RGPS 37.02 37.021 - (8 months) historical data from PWC (worst case)
1 This only applies to Ron Goodin units 6-8 as units 1-5 and 9 are assumed retired on this period.
13 A total of 200 Monte Carlo iterations have been modelled, with 100 POE 10 and 100 POE 50 iterations.

Assumptions and Method | 167
Table A.10 Average station unplanned outages in Tennant Creek
Generator unit
Unplanned outage rates (%)
Source2017-18 2018-19 2019-20 beyond
TCPS 1-16 2.76 2.76 2.761 2016-17 historical data from TGen
TCPS 17-21 0.82 1.65 1.65 TGen projection
1 This only applies to Tennant Creek units 10-16 as units 1-5 are assumed retired on this period.
A.5 SecurityClosely related to reliability is the level of security within the system. Systems with low levels of reliability are likely to also have lower levels of security.
Security generally refers to the ability of the system to handle changes and variations, particularly the ability to handle credible contingency events. The power system is secure when technical parameters such as voltage and frequency are maintained within defined limits.
If the security of the system is poor, then there is a heightened risk of credible contingency events cascading into load shedding or even a system black.
That is, one minor and predictable event, such as a generator tripping or a feeder tripping, can cause cascading events if not sufficiently controlled by the ancillary services put into place to handle these issues. Recent system blacks in Alice Springs resulted from feeders tripping, which led to cascading system failures, resulting in multiple generators tripping to avoid damage, culminating in system blacks. It is noted, after these events changes have been put in place to ensure the next time similar events occur in Alice Springs, the system is able to ride through these impacts.
This section discusses the different approaches used to assess the security of the systems in the Territory. Each approach provides a different view of security and highlights potential risks moving forward:
• constraints
• UFLS
• generation trips
• SAIDI and SAIFI (network and generation)
• transmission network performance
• incident reports.
The details of the approaches are summarised below.
A.5.1 Constraints System Control places constraints on the network and generators to manage risks to acceptable levels. In very simple terms the more constraints placed on energy entities, the less efficient the entities are likely to run and will result in higher costs and underlying risks in the system. An increasing number of constraints may be an early warning sign of larger fundamental issues with the system.
Constraints can be reacting to short-term issues that are relatively easily resolved or longer-term issues that may require significant investment to resolve.
168 | Power System Review 2016-17
For example, System Control currently has constraints in place for Channel Island power station limiting the maximum combined output of units 4, 5 and 6 as they share a single point of failure that has no redundancy.
A.5.2 UFLS Historically, in the Territory UFLS have generally been related to generation trips. Credible contingency events include single generator trips, while multiple generation trips are defined as non-credible contingency events.
Over the last few years System Control has concentrated on removing UFLS relating to credible contingency events, in particular single generation trips.
The commission has reviewed and assessed the number of UFLS for each system in relation to single generation trips to understand changes over time. Lower numbers of UFLS should result in lower customer minutes and improved services for customers.
As discussed in the reliability section, UFLS are used when on-line capacity is not sufficient to meet demand. Additionally, to cover for a sudden loss in generation (or large increase in demand), System Control uses spinning reserve and UFLS schemes. System Control will in the first instance cover any loss in generation via spinning reserve.
While most generating units operate most efficiently at or near full capacity, some units will be required to operate at lower dispatch targets so they have spare capacity and thus can quickly respond to a large reduction in generation (that is, another generator tripping) or increase in demand by ramping up.
If the spinning reserve is not sufficient, the UFLS scheme will operate as a back-up. This scheme automatically disconnects certain feeders, that is, load shedding. The feeders and thus customers to be disconnected are predetermined. The greater the gap in generation and load, the more feeders and thus customers will have to be shed. Customers will be reconnected when generation can be increased sufficiently to meet the underlying demand. For example, idle machines may be required to be started. Typically in the Territory this takes about 15 minutes to achieve full output.
There is a trade-off between running spinning reserve and UFLS schemes. The higher the level of spinning reserve, the greater the cost of generation as more machines are operated at sub-optimal levels (inefficiently). However, if spinning reserve is reduced, then there is a heightened risk of more UFLS events due to a generation trip, causing costs to customers.
A.5.3 Generation trips A major risk to the power system is generators tripping (stopping) suddenly. As explained above, generators tripping is a normal risk all system controllers need to be able to manage. The first line of defence is spinning reserve, followed by UFLS. The higher the likelihood of generators tripping, the higher the risks inherent in the power system and generally higher the cost of operating ancillary services, and more likely there will be increased constraints (which add costs to the system). That is, systems with more generator trips are likely to be more costly to operate, given a fixed level of service to customers. Maintenance, operational modes, configuration, age and heat are some of the factors that impact on the risk of generators tripping.
The commission has assessed the number of generator trips, over time to assess the change in performance and inherent risks in the systems.
Assumptions and Method | 169
A.5.4 SAIDI and SAIFI (generation)To measure the performance of the generation assets two key measures are used:
• SAIDI, which indicates the average duration of network and generation-related outages experienced by a customer
• SAIFI, which indicates the average frequency of network and generation-related outages experienced by a customer.
The commission tracks SAIDI and SAIFI for generators in the Territory, but does not set specific targets.
A.6 Network performanceA.6.1 Network utilisation
Network utilisation assesses the spare capacity for individual feeders across the networks, to understand whether there is any local bottlenecks or future investment required.
This assessment is based on network management plans (NMP). PWC has not recently updated its NMP, thus this assessment is based on PWC’s previous plan. The commission is not aware of any major change to forecast or investments that makes this approach inappropriate.
A.6.2 SAIDI and SAIFI (networks)To measure the performance of the distribution assets, two key measures are used: SAIDI and SAIFI.
As PWC Networks is a natural monopoly and subject to a price determination, PWC has targets approved by the commission. These targets are taken into account in the Australian Energy Regulator (AER) determining PWC’s revenue requirements and, ultimately, prices.
PWC has targets that cover SAIDI and SAIFI (Table A.11) as well as transmission targets, as per the requirements of the Electricity Standards of Service Code, now superseded by the Northern Territory Electricity Industry Performance Code (EIP Code).
PWC’s current targets were set as part of its current determination: 2013-14 to 2018-19.
PWC submitted proposed network performance targets for the period from 1 July 2019 to 20 June 2024 to the commission, as required by the EIP Code. The commission approved the targets in March 2018.
To ensure consistency with national definitions and the AER requirements, national definitions of feeders will be adopted from 1 July 2019. Thus, the current targets and the approved (2019) targets are not directly comparable as they have slightly different feeder classifications. The most significant change is that from 2019 onwards the commission has removed the requirement to report on transmission lines separately, which is consistent with the AER’s treatment of PWC’s feeders. However, the impact of any outages on transmission lines will significantly impact PWC’s ability to meet its targets. The second impact results in some urban feeders now been classified as short rural feeders.
PWC is charging customers on the basis they will provide at least the SAIDI and SAIFI targets. If these targets are not achieved then this indicates PWC is not operating efficiently and customers are not receiving value for money.

170 | Power System Review 2016-17
Table A.11 shows the current targets and the new approved targets, which have been based on PWC five-year average.
Table A.11 PWC proposed network performance targets
Measure Current target PWC 5 Y/median Approved target
CBD SAIDI 18.8 3.3 4
SAIFI 0.4 0.08 0.1
Urban SAIDI 136 138 140
SAIFI 2.5 2.0 2
Rural short SAIDI 496.3 190.44 190
SAIFI 8.1 2.9 3
Rural long SAIDI 2165.9 1663 1500
SAIFI 35.1 19.8 19
Table A.11, illustrates that PWC’s performance has significantly improved across three of the four main areas. The fourth classification, namely urban feeders has remained stable, but it is noted this is a feeder classification impacted by the changes in definition.
A.6.3 Transmission network performanceThe four indicators used to measure transmission performance are:
• average circuit outage duration (ACOD) – this indicator measures the average length of the outage and is calculated as the sum of the duration for all transmission circuit outages divided by the sum of transmission outages
• frequency of circuit outages (FCO) – this measures the number of incidents across a period of time
• average transformer outage duration (ATOD) – this indicator measures the average length of outages caused by transformer issues. It is calculated as the sum of the duration for all transmission transformer outages divided by the sum of transmission outages
• frequency of transformer outages (FTO) – this measures the number of incidents across a period of time.
A.7 Incident reportsClause 7 of the System Control Technical Code (SCTC) provides information on reporting requirements in relation to reportable incidents.
An initial report is to be provided to the commission within 14 business days of any reportable incident.
Initial reports for only two incidents were provided within the 14 business day requirement. Actual reporting timeframes varied from five business days to 207 business days. The average reporting time was 69 business days.
A final report on any major reportable incident is to be provided to the commission as soon as reasonably practical.
Assumptions and Method | 171
A.7.1 IncidentsA major reportable incident is defined in clause 7.3.2 of the SCTC as an event that caused:
• loss of load arising from a failure of a generation asset
• loss of load arising from a failure of a transmission asset (or equivalent) of more than 0.1 system minutes, excluding any incident where load is shed as agreed by contract
• an outage lasting longer than 15 minutes arising from equipment failure or operator error in a zone substation
• an outage lasting longer than six hours affecting more than 200 customers and, in the opinion of System Control, should be classified as a major incident requiring comprehensive investigation,
• or an outage lasting longer than 30 minutes affecting more than 1000 customers and, in the opinion of System Control, should be classified as a major incident requiring comprehensive investigation.
The commission notes two of the above requirements are based on the ‘opinion’ of System Control. Clause 7 of the SCTC provides information on reporting requirements in relation to reportable incidents.
• an initial report is to be provided to the commission within 14 business days of any reportable incident. The commission notes this requirement was rarely met during 2016-17
• a final report on any major reportable incident is to be provided to the commission as soon as reasonably practical. Actual reporting timeframes varied from 38 to 309 business days. The average reporting time was 172 business days. By way of comparison, the average reporting time in the NEM was 65 business days.
The incident reports are important as it helps System Control and licence holders understand incidents, learn from those incidents and seek to improve the system’s response to similar incidents in the future. Thus, it is important the incident reports are of high quality and any consistent pattern of failure is understood and acted upon.
Generation incidents reportsThe commission has reviewed the generation incidents in each of the three systems. A total of 18 load-shedding events occurred across the three systems in the 2016-17 period. The following analysis is applied to each of the events in the ensuing sections of the report:
• assess and summarise the nature of the event
• calculation of load shedding where applicable
• calculation of the EUE for applicable events.
All final reports for 2016-17 have been completed although the commission remains concerned that reports are not always prepared in a timely manner. Generation event reports invariably require multi-entity reporting since generators must advise System Control as to the nature of the event and then System Control is responsible for producing the report.
172 | Power System Review 2016-17
Networks incident reportsAEMO on behalf of the commission reviewed reports on major reportable network-related incidents for the 2016-17 financial year and considered the following:
• timeliness of the reporting process and whether the investigation process was appropriate
• whether the recommendations arising from the investigation appear to be tracked and followed up in a systematic manner
• any trends noted from the frequent islanding of Katherine
• any other trends noted.
Based on information provided to AEMO14 at the time of review there were 30 major reportable incidents during 2016-17. This is one more than in 2015-16. Of these, 16 incidents were caused by faults on the transmission or distribution networks compared to eight in 2015-16.
AEMO believes these incidents were correctly identified as major reportable incidents. AEMO has not reviewed other incidents to determine if any of those should have been classified as major reportable incidents.
The final reports on 15 of these incidents were available to AEMO at the time of review. These reports were compiled by System Control.
14 Power System Events Process Tracking – Major (excel database of incidents maintained by the Utilities commission).
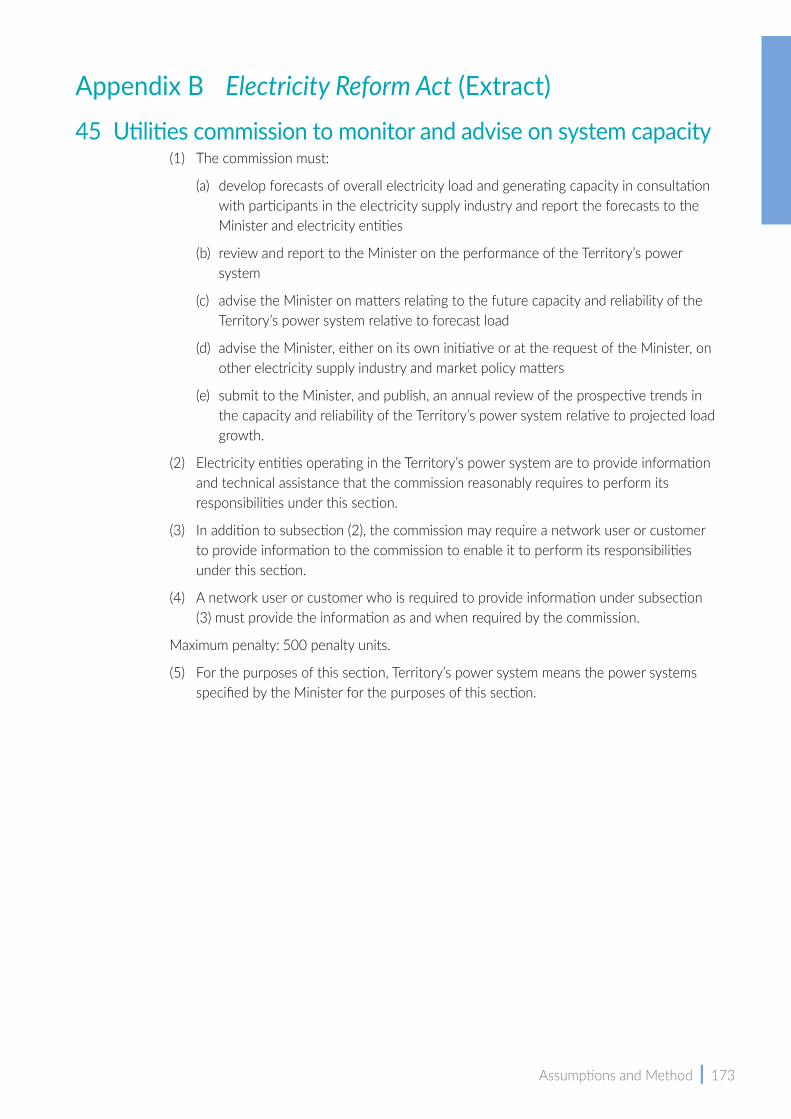
Assumptions and Method | 173
Appendix B Electricity Reform Act (Extract)45 Utilities commission to monitor and advise on system capacity
(1) The commission must:
(a) develop forecasts of overall electricity load and generating capacity in consultation with participants in the electricity supply industry and report the forecasts to the Minister and electricity entities
(b) review and report to the Minister on the performance of the Territory’s power system
(c) advise the Minister on matters relating to the future capacity and reliability of the Territory’s power system relative to forecast load
(d) advise the Minister, either on its own initiative or at the request of the Minister, on other electricity supply industry and market policy matters
(e) submit to the Minister, and publish, an annual review of the prospective trends in the capacity and reliability of the Territory’s power system relative to projected load growth.
(2) Electricity entities operating in the Territory’s power system are to provide information and technical assistance that the commission reasonably requires to perform its responsibilities under this section.
(3) In addition to subsection (2), the commission may require a network user or customer to provide information to the commission to enable it to perform its responsibilities under this section.
(4) A network user or customer who is required to provide information under subsection (3) must provide the information as and when required by the commission.
Maximum penalty: 500 penalty units.
(5) For the purposes of this section, Territory’s power system means the power systems specified by the Minister for the purposes of this section.
174 | Power System Review 2016-17
Appendix C Asset Management PlanC.1 Generation
15 AMS – 002: Strategic Asset Management Plan (03/07/2017)
The TGen Strategic Asset Management Plan15 outlines the generator’s planning approach. The document lays out the governance approach to asset management including the required capability of the organisation. Overall the commission finds the document of suitable quality and has observed some evidence of the plan being followed and refined as time progresses. The specific asset management plans are specified at station level. This review focuses on six of these stations:
Channel IslandThe plan does not address asset replacement or overhaul type considerations for those units that will exceed their planned life within the next 10 years.
WeddellThe power station is in the early to middle period of its expected life and so routine maintenance and refurbishment activities are the main features of the plan within the planning horizon of 10 years.
KatherineThe plan forecasts a reduction in the demand on the Katherine units across the next few years due to the increased solar capacity to be installed in the Darwin-Katherine region.
Tennant CreekThe plan shows the retirements and upgrades occurring at the station yielding efficiency gains across the projection.
Owen SpringsThe plan does not yet include consideration of the extension of the OSPS.
Ron GoodinThe plan shows the decommissioning of the plant to be complete prior to the start of the 2019-20 financial year.
The six asset management plans have been provided to the commission and have been revised within the last 12 months. The plans present the cost and schedule of maintenance across the next 10 years.
In general, the commission is satisfied that the plans represent a credible approach to generation asset management. The generation adequacy sections of this report discuss the need for additional generation capacity. This will be critical moving forward since it is not only installed capacity but the balance of inertia, governing response and efficiency that will determine the right generation mix in each of the regions. The visibility of the regional requirements and TGen’s plans to meet those requirements will be something that the commission will focus on in future reviews.
Assumptions and Method | 175
C.2 NetworksThe NMP has not been updated since last reviewed for the 2015-16 Power System Review. In the NEM, transmission and distribution network service providers develop and publish an Annual Planning Report outlining strategies and plans for the next five to 10-year period in relation to expected future operation of transmission and distribution networks. This would be a suitable document for outlining and communicating network management and improvement plans in the future. Based on the current NMP, following areas could be expanded for transparency of network limitations and further network improvements.
Transmission line utilisation:
• give further consideration to whether the existing 132 kV circuits have spare capacity to accommodate additional load
Fault levels:
• both fault levels and circuit breaker interruption capability should be included within future NMPs. Currently, only fault levels are included
• both balanced and unbalanced fault levels for committed changes to the transmission network should be included within future NMPs;
Voltage control management:
• historical performance of voltage and reactive power control, and voltage and reactive power management plan to meet future maximum and minimum demand should be included within future NMPs
• PWC should investigate other cost-effective solutions (for example, reactive plants) instead of running Pine Creek generators to manage over voltages during light load conditions
Power system stability:
• power system stability limits (relevant stability limits applicable to the power system) for different operating conditions should be included within future NMPs
Power system stability with solar PV penetration:
• PWC to closely monitor technical issues to the power system associated with increasing solar PV penetration and reduced synchronous generators in service
Transmission network performance:
• causes for transformer outages (including proposed and planned improvements to keep future transformer outages within the targets) should be included within future NMPs.

176 | Power System Review 2016-17
Appendix D LicencesTable D1 Generation licence holders
Licence type Organisation Installation covered by licence
Generation TGen Channel Island power station (Darwin)
Weddell power station (Darwin)
Katherine power station (Katherine)
Tennant Creek power station (Tennant Creek)
Ron Goodin power station (Alice Springs)
Owen Springs power station (Alice Springs)
Yulara power station (Yulara)
Minor Commercial power Station (Kings Canyon)
Generation Power and Water Corporation
Berrimah power station (currently inactive)
Indigenous communities under the Indigenous Essential Services (IES) program
Minor Commercial power stations: Elliot, Daly Waters, Ti Tree, Timber Creek, Borroloola
Generation EDL NGD (NT) Pty Ltd Pine Creek power station (Pine Creek)
Special Licence (Independent Power Producer)
EDL NGD (NT) Pty Ltd McArthur River power station McArthur River Phase 3 Expansion power station
Special Licence (Independent Power Producer)
Energy Resources of Australia Ltd
Generation plant housed at Ranger uranium mine site (Jabiru)
Special Licence (Independent Power Producer)
LMS Energy Pty Ltd Shoal Bay renewable energy facility (Darwin)
Special Licence (Independent Power Producer)
Uterne Power Plant Pty Ltd
Single-axis tracking solar photovoltaic system 4MWp AC (Alice Springs)
Special Licence (Independent Power Producer)
TKLN Solar Pty Ltd Solar photovoltaic installation with installed solar capacity of 324kW (Ti Tree)
Solar photovoltaic installation with installed solar capacity of 403kW (Kalkarindji)
Solar photovoltaic installation with installed solar capacity of 266kW (Alpurrurulam)
Special Licence (Isolated System)
Groote Eylandt Mining Company Pty Ltd
A multi-unit 15MW maximum demand diesel power station (Alyangula)

Assumptions and Method | 177
Table D2 Retail licence holders
Licence type Organisation Location covered by licence
Retail Power and Water Corporation
Jabiru
Nhulunbuy
Alyangula
McArthur River Mine
Indigenous communities under the Indigenous Essential Services (IES) program
Retail Jacana Energy Darwin-Katherine
Alice Springs
Tennant Creek
Daly Waters
Borroloola
Timber Creek
Elliot
Newcastle Waters
Yulara power station (Yulara)
Ti Tree
Kings Canyon
Retail EDL NGD (NT) Pty Ltd Darwin-Katherine
Alice Springs
Tennant Creek
Retail QEnergy Limited Darwin-Katherine
Alice Springs
Tennant Creek
Retail ERM Power Retail Pty Ltd Darwin-Katherine
Alice Springs
Tennant Creek
Retail Rimfire Energy Pty Ltd Darwin-Katherine
Alice Springs
Tennant Creek
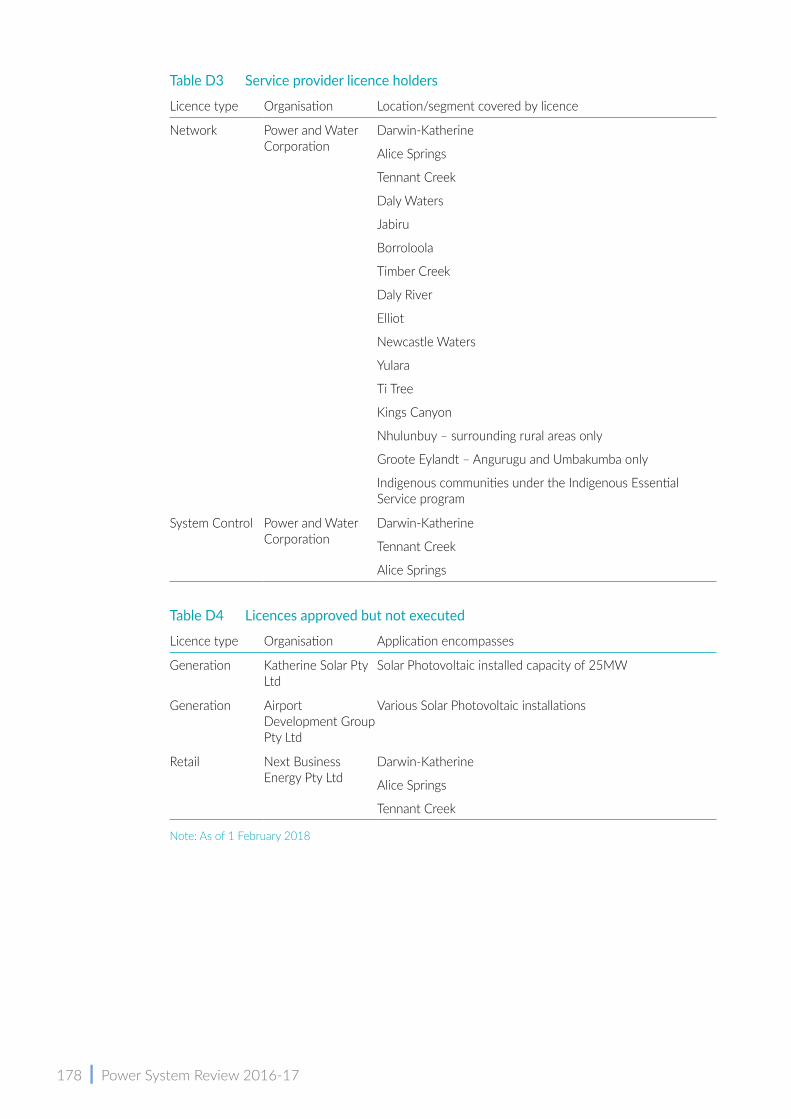
178 | Power System Review 2016-17
Table D3 Service provider licence holders
Licence type Organisation Location/segment covered by licence
Network Power and Water Corporation
Darwin-Katherine
Alice Springs
Tennant Creek
Daly Waters
Jabiru
Borroloola
Timber Creek
Daly River
Elliot
Newcastle Waters
Yulara
Ti Tree
Kings Canyon
Nhulunbuy – surrounding rural areas only
Groote Eylandt – Angurugu and Umbakumba only
Indigenous communities under the Indigenous Essential Service program
System Control Power and Water Corporation
Darwin-Katherine
Tennant Creek
Alice Springs
Table D4 Licences approved but not executed
Licence type Organisation Application encompasses
Generation Katherine Solar Pty Ltd
Solar Photovoltaic installed capacity of 25MW
Generation Airport Development Group Pty Ltd
Various Solar Photovoltaic installations
Retail Next Business Energy Pty Ltd
Darwin-Katherine
Alice Springs
Tennant Creek
Note: As of 1 February 2018
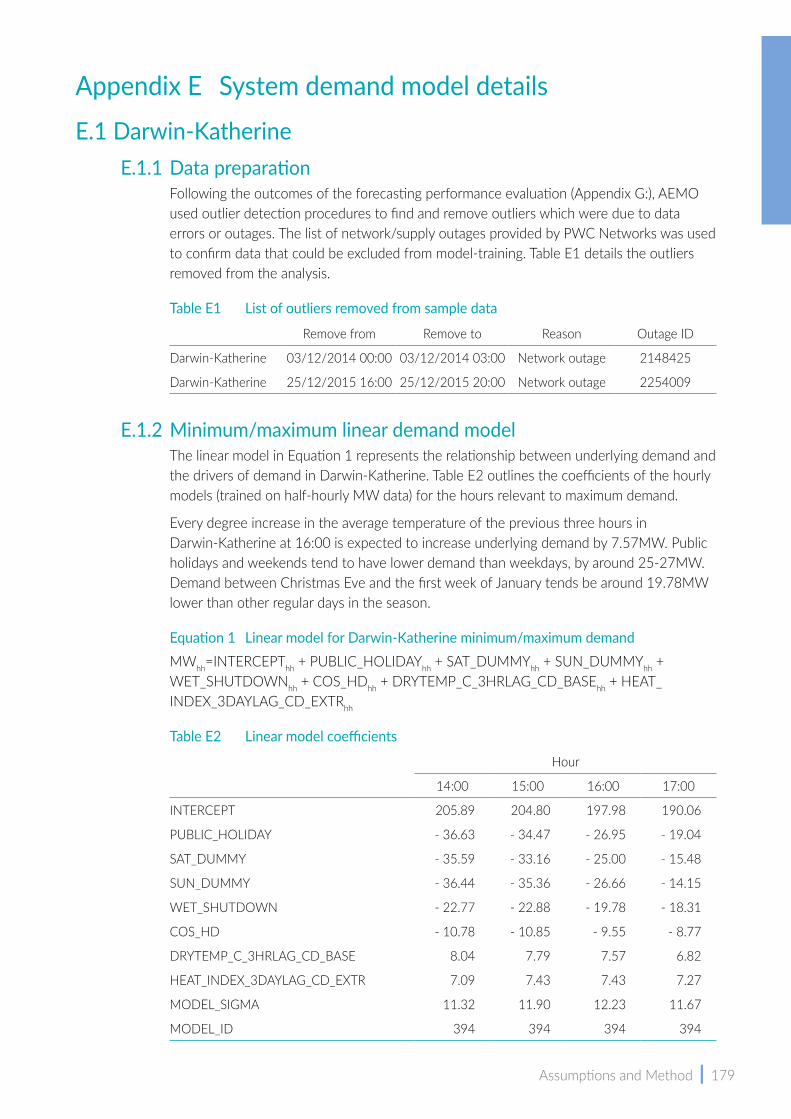
Assumptions and Method | 179
Appendix E System demand model detailsE.1 Darwin‑Katherine
E.1.1 Data preparationFollowing the outcomes of the forecasting performance evaluation (Appendix G:), AEMO used outlier detection procedures to find and remove outliers which were due to data errors or outages. The list of network/supply outages provided by PWC Networks was used to confirm data that could be excluded from model-training. Table E1 details the outliers removed from the analysis.
Table E1 List of outliers removed from sample data
Remove from Remove to Reason Outage ID
Darwin-Katherine 03/12/2014 00:00 03/12/2014 03:00 Network outage 2148425
Darwin-Katherine 25/12/2015 16:00 25/12/2015 20:00 Network outage 2254009
E.1.2 Minimum/maximum linear demand modelThe linear model in Equation 1 represents the relationship between underlying demand and the drivers of demand in Darwin-Katherine. Table E2 outlines the coefficients of the hourly models (trained on half-hourly MW data) for the hours relevant to maximum demand.
Every degree increase in the average temperature of the previous three hours in Darwin-Katherine at 16:00 is expected to increase underlying demand by 7.57MW. Public holidays and weekends tend to have lower demand than weekdays, by around 25-27MW. Demand between Christmas Eve and the first week of January tends be around 19.78MW lower than other regular days in the season.
Equation 1 Linear model for Darwin‑Katherine minimum/maximum demandMWhh=INTERCEPThh + PUBLIC_HOLIDAYhh + SAT_DUMMYhh + SUN_DUMMYhh + WET_SHUTDOWNhh + COS_HDhh + DRYTEMP_C_3HRLAG_CD_BASEhh + HEAT_INDEX_3DAYLAG_CD_EXTRhh
Table E2 Linear model coefficients
Hour
14:00 15:00 16:00 17:00
INTERCEPT 205.89 204.80 197.98 190.06
PUBLIC_HOLIDAY - 36.63 - 34.47 - 26.95 - 19.04
SAT_DUMMY - 35.59 - 33.16 - 25.00 - 15.48
SUN_DUMMY - 36.44 - 35.36 - 26.66 - 14.15
WET_SHUTDOWN - 22.77 - 22.88 - 19.78 - 18.31
COS_HD - 10.78 - 10.85 - 9.55 - 8.77
DRYTEMP_C_3HRLAG_CD_BASE 8.04 7.79 7.57 6.82
HEAT_INDEX_3DAYLAG_CD_EXTR 7.09 7.43 7.43 7.27
MODEL_SIGMA 11.32 11.90 12.23 11.67
MODEL_ID 394 394 394 394

180 | Power System Review 2016-17
E.2 Alice SpringsE.2.1 Data preparation
16 A cooling degree (CD) is the amount of degrees Celsius of an ambient air temperature above a set critical temperature. This is used in demand forecasting to quantify hot weather periods which correlate to increased demand for cooling. The heating degree (HD) is analogous to the CD – it is measured as the amount of degrees Celsius of air temperature below a set critical temperature, used to indicate periods when increased demand for heating can be expected.
Following the outcomes of the forecasting performance evaluation (Appendix G:), AEMO used outlier detection procedures to find and remove outliers which were due to data errors or outages. AEMO used outlier detection procedures to find and remove outliers which were due to data errors or outages. AEMO then used the list of network/supply outages provided by PWC to remove confirmed network/supply outages from the data. Table E3 details the outliers removed from the analysis.
Table E3 List of outliers removed from sample data
Remove from Remove to Reason Outage ID
Alice Springs 10/01/2015 00:00 10/01/2015 18:30 Network outage 2157487
Alice Springs 09/01/2016 17:00 09/01/2016 18:00 Network outage 2257859
Alice Springs 30/01/2016 14:00 31/01/2016 00:00 Network outage 2263507
Alice Springs 31/08/2016 00:00 02/09/2016 00:00 Too Low
Alice Springs 08/09/2016 00:00 14/09/2016 00:00 Too Low
Alice Springs 10/05/2017 03:00 10/05/2017 07:00 Network outage 2395257
E.2.2 Minimum/maximum linear demand modelThe linear model in Equation 2 represents the relationship between underlying demand and the drivers of demand in Alice Springs. Table E4 outlines the coefficients of the hourly models (trained on half-hourly MW data) for the hours relevant to maximum demand.
Every degree increase above the CD16 critical temperature in Alice Springs at 15:00 is expected to increase underlying demand by 1.21MW. A degree decrease below the HD critical temperature is expected to increase demand by 0.77MW. Public holidays and weekends tend to have lower demand than weekdays, by around 5MW. Demand between Christmas Eve and the first week of January tends be around 3.49MW lower than other regular days in the season.
Equation 2 Linear model for Alice Springs maximum demand MWhh = β0INTERCEPThh + β2 PUBLIC_HOLIDAYhh +β3 SAT_DUMMYhh + β4 SUN_DUMMYhh +β5 SUMMER_SHUTDOWNhh +β6 COS_CDhh + β7 COS_HDhh + β8 DRYTEMP_C_3DAYLAG_CD_EXTRhh + β9 DRYTEMP_C_DAYLAG_CD_EXTRhh + β10 DRYTEMP_C_3HRLAG_CD_BASEhh +β11 DRYTEMP_C_CD_BASEhh + β12 DRYTEMP_C_3HRLAG_HD_BASEhh + β13 DRYTEMP_C_HD_BASEhh
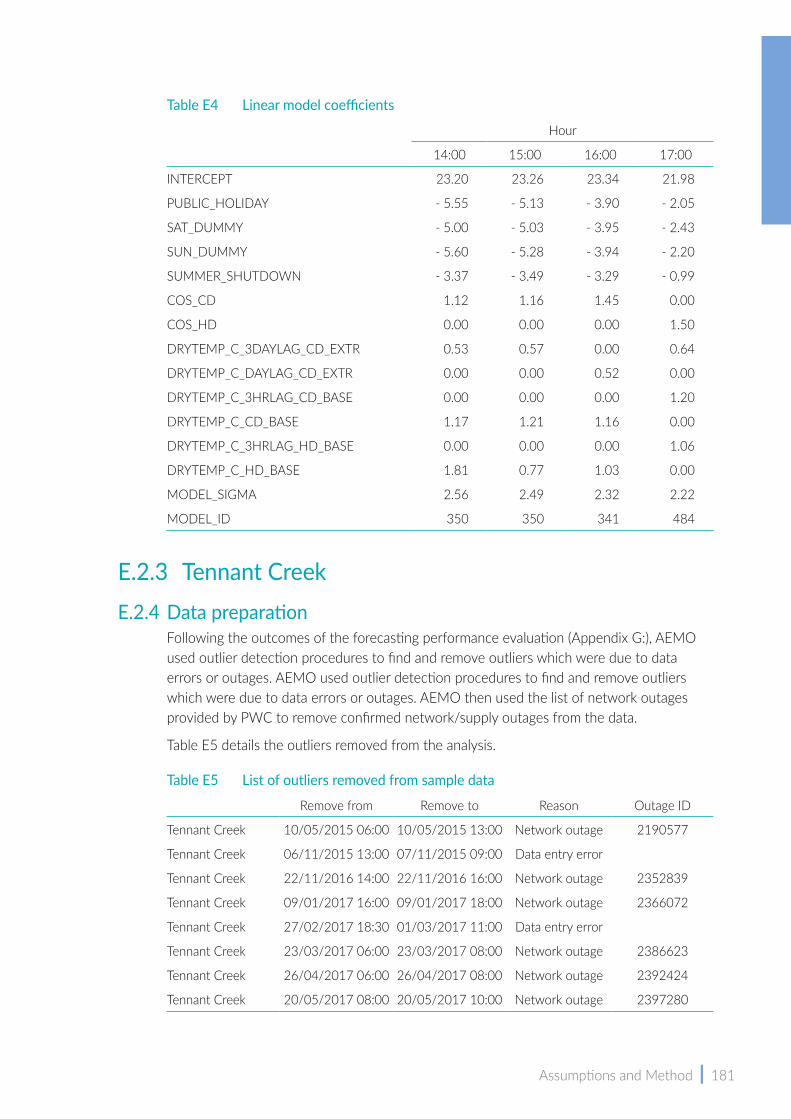
Assumptions and Method | 181
Table E4 Linear model coefficients
Hour
14:00 15:00 16:00 17:00
INTERCEPT 23.20 23.26 23.34 21.98
PUBLIC_HOLIDAY - 5.55 - 5.13 - 3.90 - 2.05
SAT_DUMMY - 5.00 - 5.03 - 3.95 - 2.43
SUN_DUMMY - 5.60 - 5.28 - 3.94 - 2.20
SUMMER_SHUTDOWN - 3.37 - 3.49 - 3.29 - 0.99
COS_CD 1.12 1.16 1.45 0.00
COS_HD 0.00 0.00 0.00 1.50
DRYTEMP_C_3DAYLAG_CD_EXTR 0.53 0.57 0.00 0.64
DRYTEMP_C_DAYLAG_CD_EXTR 0.00 0.00 0.52 0.00
DRYTEMP_C_3HRLAG_CD_BASE 0.00 0.00 0.00 1.20
DRYTEMP_C_CD_BASE 1.17 1.21 1.16 0.00
DRYTEMP_C_3HRLAG_HD_BASE 0.00 0.00 0.00 1.06
DRYTEMP_C_HD_BASE 1.81 0.77 1.03 0.00
MODEL_SIGMA 2.56 2.49 2.32 2.22
MODEL_ID 350 350 341 484
E.2.3 Tennant CreekE.2.4 Data preparation
Following the outcomes of the forecasting performance evaluation (Appendix G:), AEMO used outlier detection procedures to find and remove outliers which were due to data errors or outages. AEMO used outlier detection procedures to find and remove outliers which were due to data errors or outages. AEMO then used the list of network outages provided by PWC to remove confirmed network/supply outages from the data.
Table E5 details the outliers removed from the analysis.
Table E5 List of outliers removed from sample data
Remove from Remove to Reason Outage ID
Tennant Creek 10/05/2015 06:00 10/05/2015 13:00 Network outage 2190577
Tennant Creek 06/11/2015 13:00 07/11/2015 09:00 Data entry error
Tennant Creek 22/11/2016 14:00 22/11/2016 16:00 Network outage 2352839
Tennant Creek 09/01/2017 16:00 09/01/2017 18:00 Network outage 2366072
Tennant Creek 27/02/2017 18:30 01/03/2017 11:00 Data entry error
Tennant Creek 23/03/2017 06:00 23/03/2017 08:00 Network outage 2386623
Tennant Creek 26/04/2017 06:00 26/04/2017 08:00 Network outage 2392424
Tennant Creek 20/05/2017 08:00 20/05/2017 10:00 Network outage 2397280
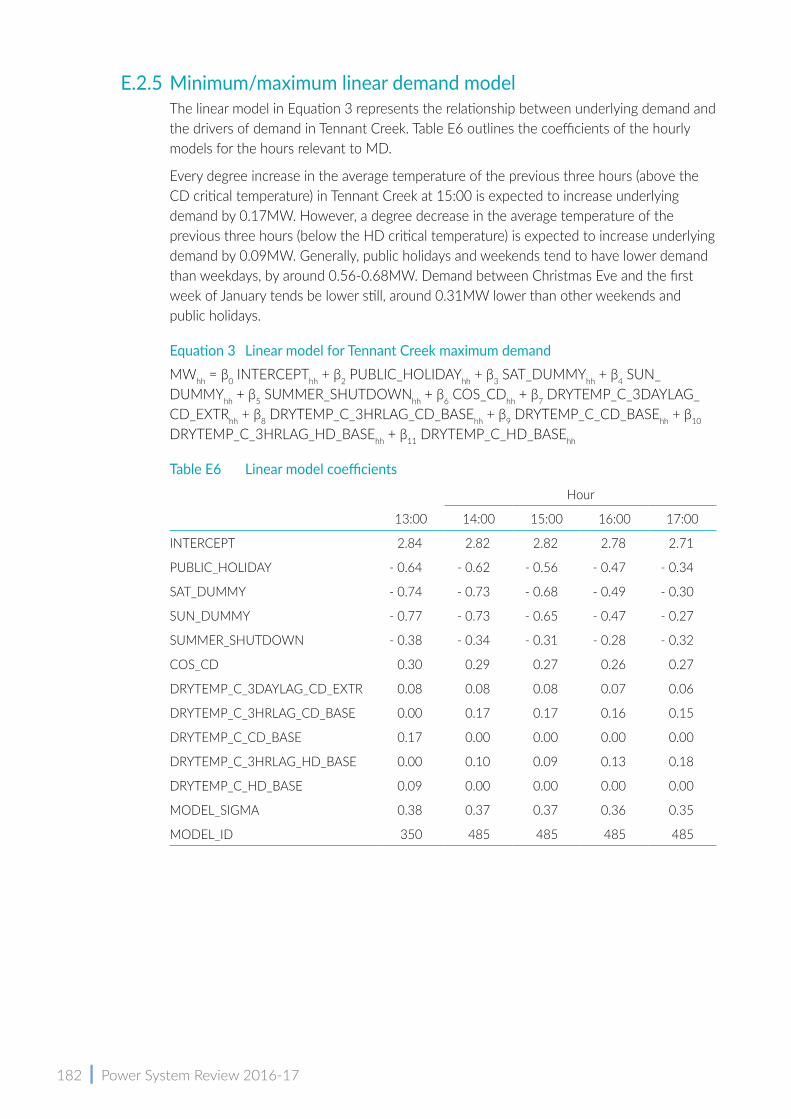
182 | Power System Review 2016-17
E.2.5 Minimum/maximum linear demand modelThe linear model in Equation 3 represents the relationship between underlying demand and the drivers of demand in Tennant Creek. Table E6 outlines the coefficients of the hourly models for the hours relevant to MD.
Every degree increase in the average temperature of the previous three hours (above the CD critical temperature) in Tennant Creek at 15:00 is expected to increase underlying demand by 0.17MW. However, a degree decrease in the average temperature of the previous three hours (below the HD critical temperature) is expected to increase underlying demand by 0.09MW. Generally, public holidays and weekends tend to have lower demand than weekdays, by around 0.56-0.68MW. Demand between Christmas Eve and the first week of January tends be lower still, around 0.31MW lower than other weekends and public holidays.
Equation 3 Linear model for Tennant Creek maximum demand MWhh = β0 INTERCEPThh + β2 PUBLIC_HOLIDAYhh + β3 SAT_DUMMYhh + β4 SUN_DUMMYhh + β5 SUMMER_SHUTDOWNhh + β6 COS_CDhh + β7 DRYTEMP_C_3DAYLAG_CD_EXTRhh + β8 DRYTEMP_C_3HRLAG_CD_BASEhh + β9 DRYTEMP_C_CD_BASEhh + β10 DRYTEMP_C_3HRLAG_HD_BASEhh + β11 DRYTEMP_C_HD_BASEhh
Table E6 Linear model coefficients
Hour
13:00 14:00 15:00 16:00 17:00
INTERCEPT 2.84 2.82 2.82 2.78 2.71
PUBLIC_HOLIDAY - 0.64 - 0.62 - 0.56 - 0.47 - 0.34
SAT_DUMMY - 0.74 - 0.73 - 0.68 - 0.49 - 0.30
SUN_DUMMY - 0.77 - 0.73 - 0.65 - 0.47 - 0.27
SUMMER_SHUTDOWN - 0.38 - 0.34 - 0.31 - 0.28 - 0.32
COS_CD 0.30 0.29 0.27 0.26 0.27
DRYTEMP_C_3DAYLAG_CD_EXTR 0.08 0.08 0.08 0.07 0.06
DRYTEMP_C_3HRLAG_CD_BASE 0.00 0.17 0.17 0.16 0.15
DRYTEMP_C_CD_BASE 0.17 0.00 0.00 0.00 0.00
DRYTEMP_C_3HRLAG_HD_BASE 0.00 0.10 0.09 0.13 0.18
DRYTEMP_C_HD_BASE 0.09 0.00 0.00 0.00 0.00
MODEL_SIGMA 0.38 0.37 0.37 0.36 0.35
MODEL_ID 350 485 485 485 485
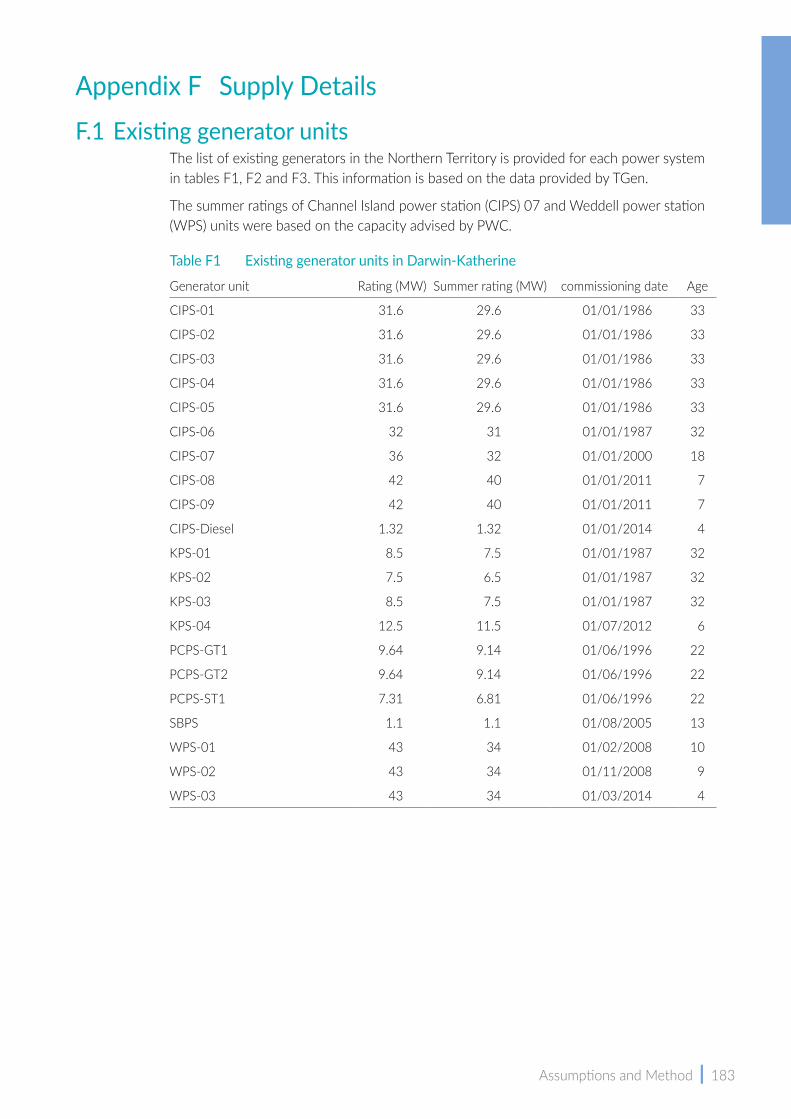
Assumptions and Method | 183
Appendix F Supply DetailsF.1 Existing generator units
The list of existing generators in the Northern Territory is provided for each power system in tables F1, F2 and F3. This information is based on the data provided by TGen.
The summer ratings of Channel Island power station (CIPS) 07 and Weddell power station (WPS) units were based on the capacity advised by PWC.
Table F1 Existing generator units in Darwin‑Katherine
Generator unit Rating (MW) Summer rating (MW) commissioning date Age
CIPS-01 31.6 29.6 01/01/1986 33
CIPS-02 31.6 29.6 01/01/1986 33
CIPS-03 31.6 29.6 01/01/1986 33
CIPS-04 31.6 29.6 01/01/1986 33
CIPS-05 31.6 29.6 01/01/1986 33
CIPS-06 32 31 01/01/1987 32
CIPS-07 36 32 01/01/2000 18
CIPS-08 42 40 01/01/2011 7
CIPS-09 42 40 01/01/2011 7
CIPS-Diesel 1.32 1.32 01/01/2014 4
KPS-01 8.5 7.5 01/01/1987 32
KPS-02 7.5 6.5 01/01/1987 32
KPS-03 8.5 7.5 01/01/1987 32
KPS-04 12.5 11.5 01/07/2012 6
PCPS-GT1 9.64 9.14 01/06/1996 22
PCPS-GT2 9.64 9.14 01/06/1996 22
PCPS-ST1 7.31 6.81 01/06/1996 22
SBPS 1.1 1.1 01/08/2005 13
WPS-01 43 34 01/02/2008 10
WPS-02 43 34 01/11/2008 9
WPS-03 43 34 01/03/2014 4
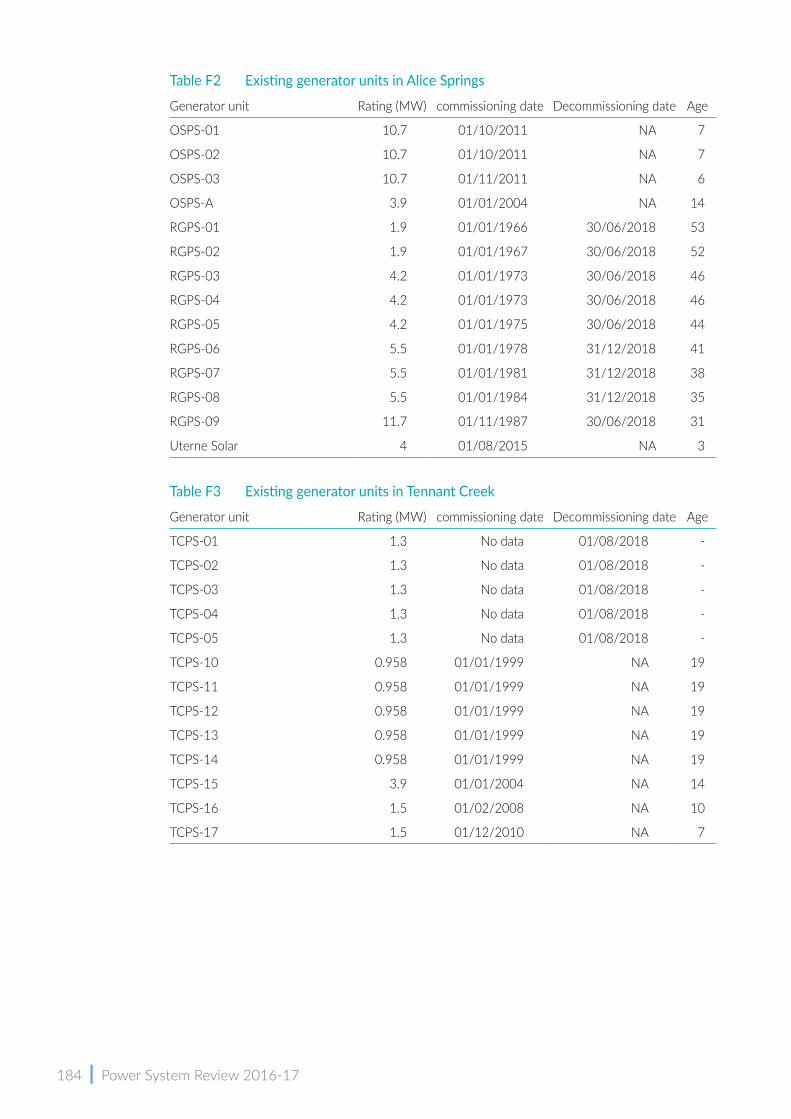
184 | Power System Review 2016-17
Table F2 Existing generator units in Alice Springs
Generator unit Rating (MW) commissioning date Decommissioning date Age
OSPS-01 10.7 01/10/2011 NA 7
OSPS-02 10.7 01/10/2011 NA 7
OSPS-03 10.7 01/11/2011 NA 6
OSPS-A 3.9 01/01/2004 NA 14
RGPS-01 1.9 01/01/1966 30/06/2018 53
RGPS-02 1.9 01/01/1967 30/06/2018 52
RGPS-03 4.2 01/01/1973 30/06/2018 46
RGPS-04 4.2 01/01/1973 30/06/2018 46
RGPS-05 4.2 01/01/1975 30/06/2018 44
RGPS-06 5.5 01/01/1978 31/12/2018 41
RGPS-07 5.5 01/01/1981 31/12/2018 38
RGPS-08 5.5 01/01/1984 31/12/2018 35
RGPS-09 11.7 01/11/1987 30/06/2018 31
Uterne Solar 4 01/08/2015 NA 3
Table F3 Existing generator units in Tennant Creek
Generator unit Rating (MW) commissioning date Decommissioning date Age
TCPS-01 1.3 No data 01/08/2018 -
TCPS-02 1.3 No data 01/08/2018 -
TCPS-03 1.3 No data 01/08/2018 -
TCPS-04 1.3 No data 01/08/2018 -
TCPS-05 1.3 No data 01/08/2018 -
TCPS-10 0.958 01/01/1999 NA 19
TCPS-11 0.958 01/01/1999 NA 19
TCPS-12 0.958 01/01/1999 NA 19
TCPS-13 0.958 01/01/1999 NA 19
TCPS-14 0.958 01/01/1999 NA 19
TCPS-15 3.9 01/01/2004 NA 14
TCPS-16 1.5 01/02/2008 NA 10
TCPS-17 1.5 01/12/2010 NA 7

Assumptions and Method | 185
F.2 Projected unserved energyTable F4 Projected unserved energy in Darwin‑Katherine
Base RE30% RE50%
2017-18 - 0.0000001 -
2018-19 0.000051 0.000004 0.000010
2019-20 - - -
2020-21 - - -
2021-22 - - -
2022-23 - - -
2023-24 - - -
2024-25 - - -
2025-26 - - -
2026-27 - - -
Table F5 Projected unserved energy in Alice Springs
Base RE30% RE50%
2017-18 0.256455 0.253750 0.251834
2018-19 0.000373 0.000237 0.000131
2019-20 0.000123 0.000041 0.000033
2020-21 0.001251 0.000352 0.000290
2021-22 0.001034 0.000373 0.000365
2022-23 0.000272 0.000110 0.000235
2023-24 0.000774 0.000364 0.000357
2024-25 0.000261 0.000137 0.000134
2025-26 0.000339 0.000071 0.000054
2026-27 0.000010 - -
Table F6 Projected unserved energy in Tennant Creek
Base RE30% RE50%
2017-18 - - -
2018-19 - - -
2019-20 - - -
2020-21 - - -
2021-22 - - -
2022-23 - - -
2023-24 - - -
2024-25 - - -
2025-26 - - -
2026-27 - - -
186 | Power System Review 2016-17
Appendix G Forecasting PerformanceG.1 Annual energy consumption
17 ‘Outages’, in the context of assessing demand forecasts, means any network or supply interruptions or disruptions that result in customers being without power leading to reduced system demand.
The forecasting methodology was informed by a comparison of the last Power System Review’s forecasts to the 2016-17 actuals.
The annual energy forecast differences were 0.5 per cent for Darwin-Katherine (forecast was 8.7GWh lower than actual), 1.8 per cent for Alice Springs (forecast was 2.6GWh higher than actual), and 2.1 per cent for Tennant Creek (forecast was 0.6GWh higher than actual). A screening performance metric of 2 per cent was set for the energy forecasts, leading to Alice Springs and Tennant Creek being investigated further.
At Alice Springs, the difference is mainly (75 per cent) attributed to underestimated rooftop PV generation, which caused a lower total energy consumption than forecast.
At Tennant Creek, the difference is attributed to model error, indicating some improvement to the model is possible. The current forecast is improved, with the 2017-18 energy (29.4GWh) forecast to be 1.2 per cent above the 2016-17 actual, reducing the gap by almost half (down from 2.1 per cent).
G.2 Maximum and minimum demandThe methodology was informed by a comparison of the last Power System Review’s forecasts to the 2016-17 actuals.
Darwin‑Katherine: • Actual maximum demand was between the POE 50 and the POE 90 Base forecasts. This indicates good performance of the model. Actual weather was cooler than typically experienced on maximum demand days, which supports the actual being lower than POE 50 demand.
• Minimum demand forecasts were lower than the actual minimum in 2016-17, and this is attributed to network outage17 events biasing the model towards lower predictions.
Alice Springs: • Maximum demand forecasts (both POE 50 and POE 10) were higher than the actual maximum in 2016-17 (51.9MW). The 50 per cent POE forecast was 55.1MW, resulting in a difference of 3.2MW. Consistent with the annual energy forecast, this is attributed to higher than expected rooftop PV generation.
• Actual minimum demand (for typical network operation) in Alice Springs is not easily identified because of the need to identify and clean out atypical events. Nonetheless, the comparison of the POE 50 minimum demand forecast for Alice Springs indicated forecast underestimation attributed to outliers in raw data. Due to this, a key area for improving the minimum demand forecasts for Alice Springs was to improve data cleaning.

Assumptions and Method | 187
Tennant Creek: • The POE 50 forecast for maximum demand was 7.2MW, 0.4MW higher than the actual maximum in 2016-17 (6.8MW). The actual did fall above the POE 90 level, however, suggesting there is no severe bias in the model, as the 0.4MW difference can be attributed to weather variability.
• Actual minimum demand at Tennant Creek (1.71MW) was close to the POE 10 (1.84MW) suggesting it is reasonably well modelled yet possibly under-forecast, given the POE 50 was 1.46MW (0.25MW lower than actual). In smaller systems like Tennant Creek, data cleaning becomes increasingly important, as outages can result in demand changes that are large relative to the size of the network. These effects deteriorate the link between demand and weather in the model, leading to poor model performance. For that reason, as with Alice Springs, a key area for improving the minimum demand forecasts for Tennant Creek was to improve data cleaning.
G.3 Zone substationsG.3.1 Darwin‑Katherine
A bias towards over forecasting appears evident, with 12 out of 24 POE 50 forecasts higher than the actual by more than 10 per cent. Eight forecasts were lower than actual and four were within 10 per cent of the actual.
• Leanyer – forecast higher than actual due to expected transfers from Casuarina and Berrimah which did not impact the forecasts.
• Manton – forecast higher because a new load was expected to be connected and did not eventuate (delayed).
• McMinns (now Strangways) – forecast higher due to expected increases of an industrial customer (increased load did not eventuate).
• Palmerston 66-11 kV and Palmerston 11-22 kV – Palmerston Hospital’s load was lower than expected, and new residential developments progressed slower than expected.
• Husdon Creek – over-forecast due to methodology. The model was based on maximum demand analysis only and did not include weather effects. The model has since been upgraded to include weather and daily data granularity in the current forecasts.
• Casuarina – forecast was low due to expected transfers to Leanyer.
• Berrimah – forecast was low due to expected transfers to Leanyer.
188 | Power System Review 2016-17
G.3.2 Alice SpringsThe comparison of actuals and forecasts for the 2016-17 year provided the following insights:
• An over-forecasting bias is apparent at Lovegrove 66-22 kV, Lovegrove 22-11 kV, and Brewer-Sadadeen 11 kV. This suggests forecasts can be improved to align more closely with actual demand as no significant structural changes in demand have occurred (such as load transfers to other substations). The methodology has been updated to account for this in the current forecasts.
• Actual maximum demand at Lovegrove 22 kV was higher than the POE 50, but within 10 per cent of the POE 10. The difference is attributed to unforeseen changes in industrial demand. Actual maximum demand at Sadadeen (Ron Goodin) 11 kV was also higher than the 50 per cent POE forecast, but again within 10 per cent of the 10 per cent POE.
• Maximum demand at Owen Springs and Lovegrove 66-22 kV is dictated by the operation of the Owen Springs power station rather than customer demand. As such it is not well correlated to drivers that can be projected into the future.
G.3.3 Tennant CreekPlease refer to the discussion on the regional forecast performance for Tennant Creek. As there is only one substation the regional forecast for 2016-17 is the same as the zone substation forecast.

Assumptions and Method | 189