Kai Yan's Thesis NT-WL-Final Version
165
Transformation of Biogenic Carbohydrates into Levulinic Acid and further Hydrogenation using Supported Nanoparticle Catalysts Synthesized by Chemical Fluid Deposition Von der Fakultät für Mathematik, Informatik und Naturwissenschaften der RWTH Aachen University zur Erlangung des akademischen Grades eines Doktors der Naturwissenschaften genehmigte Dissertation vorgelegt von M. Sc. Kai Yan Aus Anhui / PR China Berichter: Universitätsprofessor Dr. Walter Leitner Universitätsprofessor Dr. Jürgen Klankermayer Tag der mündlichen Prüfung: 28. November 2011 Diese Dissertation ist auf den Internetseiten der Hochschulbibliothek online verfügbar.
-
Upload
khangminh22 -
Category
Documents
-
view
4 -
download
0
Transcript of Kai Yan's Thesis NT-WL-Final Version

Transformation of Biogenic Carbohydrates
into Levulinic Acid and further Hydrogenation
using Supported Nanoparticle Catalysts
Synthesized by Chemical Fluid Deposition
Von der Fakultät für Mathematik, Informatik und Naturwissenschaften
der RWTH Aachen University zur Erlangung des akademischen Grades
eines Doktors der Naturwissenschaften genehmigte Dissertation
vorgelegt von
M. Sc. Kai Yan
Aus Anhui / PR China
Berichter: Universitätsprofessor Dr. Walter Leitner
Universitätsprofessor Dr. Jürgen Klankermayer
Tag der mündlichen Prüfung: 28. November 2011
Diese Dissertation ist auf den Internetseiten der Hochschulbibliothek online
verfügbar.
Die vorliegende Arbeit wurde in der Zeit von Oktober 2008 bis November 2011 am
Max-Planck-Institut für Kohlenforschung in Mülheim an der Ruhr unter der Leitung
von Herrn Prof. Dr. Walter Leitner angefertigt.
Referent: Prof. Dr. Walter Leitner
Koreferent: Prof. Dr. Jürgen Klankermayer

Acknowledgments Firstly and foremost, I would like to thank my supervisors and mentors,
Prof. Dr. Walter Leitner and Dr. Nils Theyssen, for giving me the opportunity to carry
out this interesting and challenging scientific work. Especially for Dr. Theyssen, I am
deeply grateful for his immense support and guidance throughout the entire PhD
thesis. Through his superb leadership he gave me the maximum freedom and great
opportunity for personal development. He is also a good model young researcher for
me. His passion is always unlimited and makes most things perfectly. I would also
like to thank Prof. Dr. Walter Leitner for his fruitful support and agreeing to be my
first referee in the examination board.
Many thanks to Professor Leitner and Dr. Theyssen for the wholehearted introduction
into the world of sustainable biofuel-production and for trusting me fully by the given
freedom. Our exiting team work at the beginning of my thesis has developed into a
sincere friendship, which I cherish and am very proud of.
During my PhD thesis, I was very fortunate to work at the Max-Planck-Institute (MPI)
für Kohlenforschung in Mülheim an der Ruhr. My deep gratitude and respect goes to
the co-worker and the technical staff of the MPI in Mülheim. In particular, I would
like to thank Dr. R. Weiß and especially Mr. F. Qin for a close and highly fruitful
collaboration. During my PhD study, nearly all catalysts were prepared and provided
by them.
Besides, the following coworkers are highly acknowledged for their continuous
support in analyzing my samples:
• C. Heigen (GC),
• H. Hinrichs and A. Deege (HPLC),
• Dr. C. Weidenthaler (XRD and XPS),
• S. Palm (EDX),
• Dr. W. Schmidt (BET),
• H. Bongard (SEM) and
• A. Dreier and B. Spliethoff (TEM).

I would like to thank all members of the Dr. Theyssen Group not only for the highly
professional team work I experienced there, but also for the great time during social
activities. I will never forget our daily breakfast meetings, the famous Christmas
parties, birthday celebrations and the group trips.
Finally, I would like to express my sincere thanks to my great parents, brother, sister
and my girlfriend, for their unlimited support and unconditional love. I love all of you!

Content
CHAPTER 1 – INTRODUCTION........................................................................................................1
1.1 THESIS OUTLINE .............................................................................................................................1
1.2 FUEL GENERATION AND CHEMICALS PRODUCTION DERIVED FROM BIOMASS..................................3
1.3 DEFINITION, COMPOSITION AND UTILIZATION OF BIOMASS.............................................................4
1.3.1 Definition and composition of biomass ..................................................................................4
1.3.2 Technological description of biomass utilization ...................................................................9
1.3.3 Utilization of biomass in TMFB Project...............................................................................11
1.4 CONVERSION OF BIOMASS TO LEVULINIC ACID.............................................................................13
1.4.1 Methods and catalytic system ...............................................................................................13
1.4.2 Mechanistic aspects of the formation of levulinic acid.........................................................21
1.5 POTENTIAL APPLICATIONS OF LA AND ITS DERIVATIVES..............................................................23
1.5.1 Building blocks derived from levulinic acid .........................................................................23
1.5.2 Economical and ecological considerations ..........................................................................23
1.6 CONVERSION OF BIOMASS-DERIVED MONOMERS TO Γ-VALERLACTONE........................................25
1.6.1 Properties of γ-valerolactone ...............................................................................................25
1.6.2 Catalytic system for production of γ-valerolactone ..............................................................27
1.6.3 Mechanistic asepcts for formation of γ-valerolactone..........................................................29
1.7 POTENTIAL DERIVATIVES FROM Γ-VALEROLACTONE ....................................................................30
1.8 PREPARATION OF NANO-CATALYST BY CHEMICAL FLUID DEPOSITION..........................................32
1.8.1 Supercritical fluids ...............................................................................................................32
1.8.2 Preparation of nanostructured catalysts using chemical fluid deposition............................35
1.9 DESCRIPTION AND ACKNOWLEDGEMENT OF THE INTERDISCIPLINARY COLLABORATION..............39
1.10 REFERENCES..............................................................................................................................40
CHAPTER 2 EXPERIMENTAL SECTION .....................................................................................47
2.1 CHEMICALS ..................................................................................................................................47
2.2 SBA-15 AND ALSBA-15 SYNTHESIS............................................................................................47
2.2.1 Preparation of SBA-15 .........................................................................................................47
2.2.2 Preparation of AlSBA-15......................................................................................................48
2.3 MCM-41, ALMCM-41 AND ZRMCM-41 SYNTHESIS..................................................................48
2.3.1 MCM-41 synthesis ................................................................................................................48
2.3.2 AlMCM-41 synthesis.............................................................................................................49
2.3.3 ZrMCM-41 synthesis ............................................................................................................49
2.4 HY SYNTHESIS..............................................................................................................................49
2.5 SYNTHESIS OF (CYCLOPENTADIENYL) ALLYL -PALLADIUM (II) .....................................................49
2.6 SYNTHESIS OF PD NANOPARTICLE BY A MODIFIED CHEMICAL FLUID DEPOSITION.........................51
2.7 HOMO- AND BIMETALLIC CATALYSTS SYNTHESIS BY CHEMICAL FLUID DEPOSITION.....................51

2.8 SELECTIVE DEHYDRATION OF D-FRUCTOSE AND D-GLUCOSE.......................................................53
2.8.1 Dehydration procedure.........................................................................................................53
2.8.2 Sample analysis by HPLC ....................................................................................................54
2.9 DEHYDRATION OF HMF ...............................................................................................................61
2.10 HYDROGENATION OF LEVULINIC ACID INTO Γ-VALEROLACTONE................................................61
2.11 STATISTICAL ANALYSIS BY DESIGN EXPERT..............................................................................62
2.12 PROVING ETHYL LEVULINATE FORMATION .................................................................................62
2.13 FORMIC ACID AS A SUBSTRATE...................................................................................................63
2.14 CATALYST RECYCLING...............................................................................................................63
2.15 REFERENCES..............................................................................................................................64
CHAPTER 3 – SYNTHESIS OF HOMO- AND BIMETALLIC NANOPARTICLES
CATALYSTS BY CHEMICAL FLUID DEPOSITION...................................................................66
3.1 INTRODUCTION.............................................................................................................................66
3.2 THE CHOICE OF SUITABLE SUPPORTS............................................................................................68
3.2.1 XRD analysis ........................................................................................................................69
3.2.2 BET analysis.........................................................................................................................70
3.3. SYNTHESIS OF PD/SBA-15 BY A MODIFIED CFD .........................................................................73
3.4 SYNTHESIS OF HOMO-AND BIMETALLIC CATALYSTS USING CFD..................................................76
3.4.1 The choice of metal precursor ..............................................................................................76
3.4.2 Synthesis of monometallic Pd catalysts ................................................................................77
3.4.3 Homo- and bimetallic metal catalysts synthesis ...................................................................78
3.5 REFERENCES.................................................................................................................................79
CHAPTER 4 – DEHYDRATION OF SUGAR USING SUPPORTED METAL
NANOPARTICLES CATALYSTS.....................................................................................................84
4.1 INTRODUCTION.............................................................................................................................84
4.2 CATALYTIC PERFORMANCE OF PD/SBA-15 PREPARED BY A MODIFIED CFD................................85
4.2.1 Solvent effect and metal influence on dehydration of D-fructose .........................................85
4.2.2 Rehydration of HMF.............................................................................................................88
4.2.3 Fructose dehydration in water – changes of pH, pressure and weight.................................90
4.2.4 Stability of the resulted catalysts ..........................................................................................91
4.2.5 Short summary......................................................................................................................92
4.3 DEHYDRATION OF D-FRUCTOSE USING HOMO-AND BIMETALLIC NANOCATALYSTS BY CFD ........92
4.3.1 Evaluation of supported homo-Pd nanoparticles catalysts ..................................................92
4.3.2 Evaluation of homo-and bimetallic nanoparticles catalysts.................................................95
4.3.3 Catalyst characterization of fresh and spent catalysts .........................................................98
4.3.4 Optimization of D-fructose dehydration .............................................................................104
4.3.5 Catalysts stability and recyclability....................................................................................105
4.3.6 Fructose dehydration in ethanol – changes of pH, pressure and mass ..............................108
4.3.7 Performance using other support materials .......................................................................109

4.3.8 Network of dehydration of D-fructose ................................................................................111
4.3.9 Proposed reaction pathways in the dehydration of D-fructose to LA.................................112
4.4 DEHYDRATION OF D-GLUCOSE TO LEVULINIC ACID ...................................................................120
4.4.1 Solvent effect and metal influence ......................................................................................120
4.4.2 Optimization D-glucose dehydration..................................................................................123
4.5 CONCLUSION..............................................................................................................................124
4.6 REFERENCES...............................................................................................................................125
CHAPTER 5 - HYDROGENATION OF LEVULINIC ACID USING HOMO- AND
BIMETALLIC CATALYSTS ...........................................................................................................130
5.1 EVALUATION OF SUPPORTED PD NANOPARTICLES......................................................................130
5.2 EVALUATION OF HOMO- AND BIMETALLIC NANOPARTICLES CATALYSTS....................................134
5.3 STATISTICAL ANALYSIS USING DESIGN EXPERT.........................................................................136
5.4 CATALYST CHARACTERIZATION.................................................................................................137
5.5 OPTIMIZATION OF HYDROGENATION...........................................................................................143
5.6 CATALYST RECYCLING ...............................................................................................................145
5.8 TRANSFORMATION OF LA TO PENTANOIC ACID..........................................................................147
5.8 POSSIBLE PATHWAYS OF LEVULINIC ACID HYDROGENATION......................................................148
5.9 CONCLUSION..............................................................................................................................149
5.10 REFERENCES............................................................................................................................150
SUMMARY.........................................................................................................................................152
PUBLICATIONS ORIGINATING FROM THE PRESENT STUDY ..........................................156
CONFERENCE CONTRIBUTIONS ...............................................................................................156
POSTER PRESENTATIONS ...........................................................................................................157

1
Chapter 1 – Introduction
Abstract
In this chapter, an outline of this thesis is firstly drafted and then a general overview
on the use of biomass for chemicals and potential biofuels production will be provided.
As shown, the biomass-derived monomers levulinic acid (LA) and γ-valerolactone
(GVL) are among the most promising platform chemicals for sustainable production
of chemicals and biofuels. The diverse catalytic transformation systems developed for
the conversion of different biomass derived-monomers to LA and GVL are also
reviewed. Moreover, an overview on the preparation of supported nano-particles
catalysts by chemical fluid deposition is also provided here. In the end, a detailed
description of contributions from collaborating people is given.
1.1 Thesis Outline
The primary objective of this thesis was to synthesize and identify powerful metal
catalysts and key factors for the conversion of D-fructose and D-glucose to LA as
well as the hydrogenation of LA to GVL.
In chapter 1 a general overview on the use of biomass for chemicals and potential
biofuel production is provided. The catalytic transformation systems developed for the
conversion of biomass-derived monomers to LA and GVL are reviewed. Meanwhile,
an intensive overview of the preparation of supported nano-particles catalysts using
chemical fluid deposition is provided.
Chapter 2 contains the experimental section. It includes the catalysts preparation
method and their characterization. Furthermore, the reaction conditions of the
investigated catalytic reactions and their analysis methodology is given here. Finally,
the used procedure for catalyst recycling and information concerning the
Experimental Design approach is described here.
In chapter 3 the preparation of palladium ensembles on SBA-15 by a modified
chemical fluid deposition approach is described. The synthesis of the supported nano-
metal catalysts in a bottom up procedure using chemical fluid deposition as a

2
universal and highly controllable production method is discussed. Here, SBA-15 is
used as a mesoporous support/co-catalyst. Homo- and bimetallic Pd and/or Pt are
deposited into SBA-15 by hydrogenolysis of the metal precursors (cyclopentadienyl)
allyl-palladium (II) [CpPd(η3-C3H5)] and (1, 5-cyclooctadiene)-dimethylplatinum (II)
[(1,5-cod)Pt(CH3)2] with different variables and constants. The experimental catalyst
synthesis plan and analysis is chosen in accordance to design of experiments (DOE,
used software: Design Expert 7.1) applying response surface plans with typically
seven factors. Based on a uniform design, an initially explored plan with 35 different
protocols for palladium catalysts and experimental plan with 32 different protocols for
nanoparticles homo- and bimetallic Pd and/or Pt are processed to investigate the
influence of a variety of reaction parameters.
In chapter 4, the obtained catalysts by a modified chemical fluid deposition
method were applied in selective dehydration of D-fructose using different solvents. It
is shown that the choice of the used solvent has a strong influence on the product
distributions. Furthermore, the stability of the resulted catalysts is briefly described in
this chapter.
Later, we employ the conversion of D-fructose to LA in ethanol solvent as a
standard reaction to screen a wide variety of the supported homo- and bimetallic
nanoparticles prepared by chemical fluid deposition method. Besides, the resulted
catalysts were also used for transformation of D-glucose in combination with a salt
additive. It is shown that the choice of the used solvent and metal are crucial for the
product distributions. Furthermore, the stability of the resulted catalysts is also
described in this chapter.
The performance of the wide variety of nanoparticles catalysts was also
investigated in the hydrogenation of levulinic acid to γ-valerolactone and later to
pentanoic acid which is described in chapter 5. Here, the maximization of GVL yields
and TON optimization have been in the central focus. Furthermore, the stability and
recyclability of the resulted catalysts are characterized.
In the end, the progress of this work is summarized and an outlook is presented
here as well.
3
1.2 Fuel generation and chemicals production derived from biomass
Today, our society is faced with several primary and long-term challenges – ˝climate
change and the continuing reduce of fossil resources such as petroleum, natural gas
and coal˝ are two remarkable and emergent examples we face at a global level.1 Fossil
resources are the primary source of energy and chemicals for our society and
economic developemnt.2-4 The Council of the European Union (EU) estimated that
nearly 90% of the energy consumption in the world is currently derived from fossil
resources and an even higher value (96%) for the transportation sector.5 However, the
use of fossil resources for the generation of energy and the production of chemicals is
closely associated with several unavoidable issues:
1. The used fossil fuel resources are limited and unrenewable.3 As the concept of
sustainable development describe: ˝If we want to maintain lasting economic
prosperity and social welfare – that is, for today’s generation as well as the
generations to come – then we must bear in mind the finite limits of our
planet’s capacity to withstand the pressure of human activity.˝5, 6
2. The US Department of Energy (DOE) stated in 2002: ˝The current
consumption rate is too far faster from the increased demand of industries and
the development of economies than the formed speed of fossil fuels.˝4
3. The consumption of fossil resources would result in ˝net emissions of CO2 into
the environment, which would lead to global warming and other climatic
effects˝.2, 3
4. ˝The uneven geographical distribution of the fossil resources is the origin of
political, economic and security issues worldwide˝, as described by EU.5, 6
The resolution to these issues require and force the society to search and employ the
sustainable sources for energy and chemicals.4 At the same time, ˝resolutions taken to
this end in different policy areas can impact on each other. It is therefore essential to
˝take an integrated approach to find really viable solutions to the problems at hand˝.3
Against these backgrounds, a transfer of the current fossil fuel-based economy
toward a more renewable energy-based one is stimulating in the whole EU, and its
ambitious goals to ˝produce 20% of fuels and 25% of chemicals from renewable
sources by 2030 have been declared˝.5, 6 In general, with decreasing fossil resources
and fast increasing needs of energy and chemicals from our economic and society

4
development, demand for fuels worldwide, climate concerns about the use of fossil-
based energy resources, and political focus have forced and sparked the utilization of
an abundant and renewable biofuels and chemicals resource: biomass.3-7
The first generation biofuels (covers Biodesel, Bioethanol, Biogas, Straight
Vegetable Oil, et al6) and chemicals are produced from ‘cereal crops, oil crops and
sugar crops using the established technology’.6 The use of first generation technology
has been the subject of considerable media attention, widespread public and political
debate, and campaigns by civil societies to draw attention to the environmental and
social impacts of biofuels from food crops.5, 6
The second generation biofuels (covers Biomass to Liquid, Cellulosic ethanol,
Biohydrogen, Algal biofuels, et al) and chemicals are produced from cellulosic
materials (lignocellulosic feedstocks). These raw material options may result in the
production of more advanced biofuel in a higher yield. The raw materials such as
cellulose, hemicellulose and lignin, were considered more sustainable and do not
compete directly with food. However, ‘there can be competition for land use as well
as competition between the potential use of cellulosic materials for liquid biofuels and
current (rapidly expanding) use for heat and power generation through combustion as
solid biofuels’.6 New technology is being developed to produce biofuels and
chemicals from more sustainable lignocellulosic materials.
1.3 Definition, composition and utilization of biomass
1.3.1 Definition and composition of biomass
Biomass, a renewable energy source, is a biological material from different plants,
such as wood and waste.8 It is commonly plant matter grown to generate electricity or
produce heat.8 Biomass is mainly carbon, hydrogen and oxygen based. ˝Nitrogen and
small quantities of other atoms, including alkali, alkaline earth and heavy metals can
be found as well˝.8 Metals are often found in functional molecules such as ˝the
porphyrins which are for example present in chlorophyll which contains magnesium˝.8
Plants in particular combine water and carbon dioxide to sugar building blocks.9 The
sugar building blocks as the starting point for the major fractions can be found in all
terrestrial plants, hemicellulose and cellulose.4, 7
5
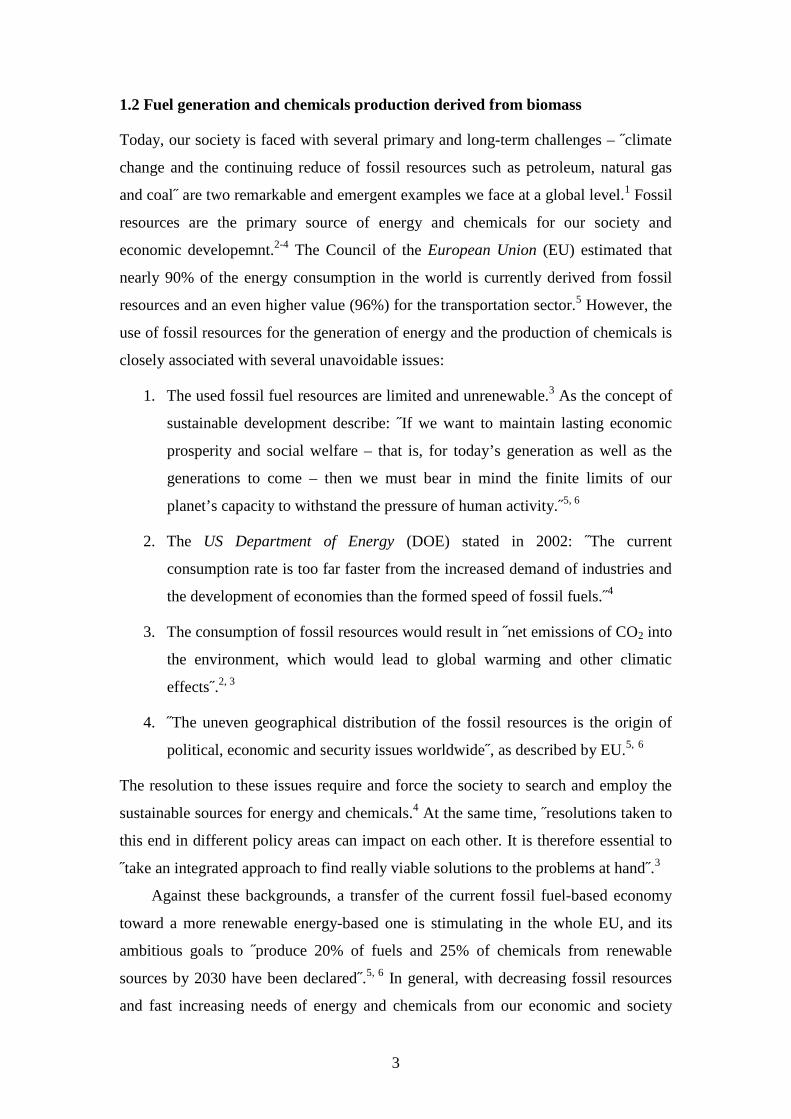
The chemical composition of biomass depends strongly on its source and
geographical distribution.9, 10 Normally, biomass consists of 40–50% of cellulose, 15–
30% hemicelluloses and 10–25% lignin (see Figure 1.1).10 Cellulose (a crystalline
glucose monomer unit) and hemicellulose (many different sugar monomers) make up
60-85 wt% of terrestrial biomass.8 Lignin, a large polyaromatic compound, is the
other major component of biomass, which accounts for 10–25%.8 Other minor
components of biomass include ˝triglycerides, alkaloids, pigments, resins, sterols,
terpenes, terpenoids, and waxes˝.7, 8 Importantly, ˝certain plants, such as rapeseed or
soybeans, can have large amounts of these minor components ˝.9, 10
Figure 1.1 Overview of different biomass fractions (lignocellulose, cellulose, lignin and hemicellulose). The structure of lignocellulose is adapted from Hsu et al.11
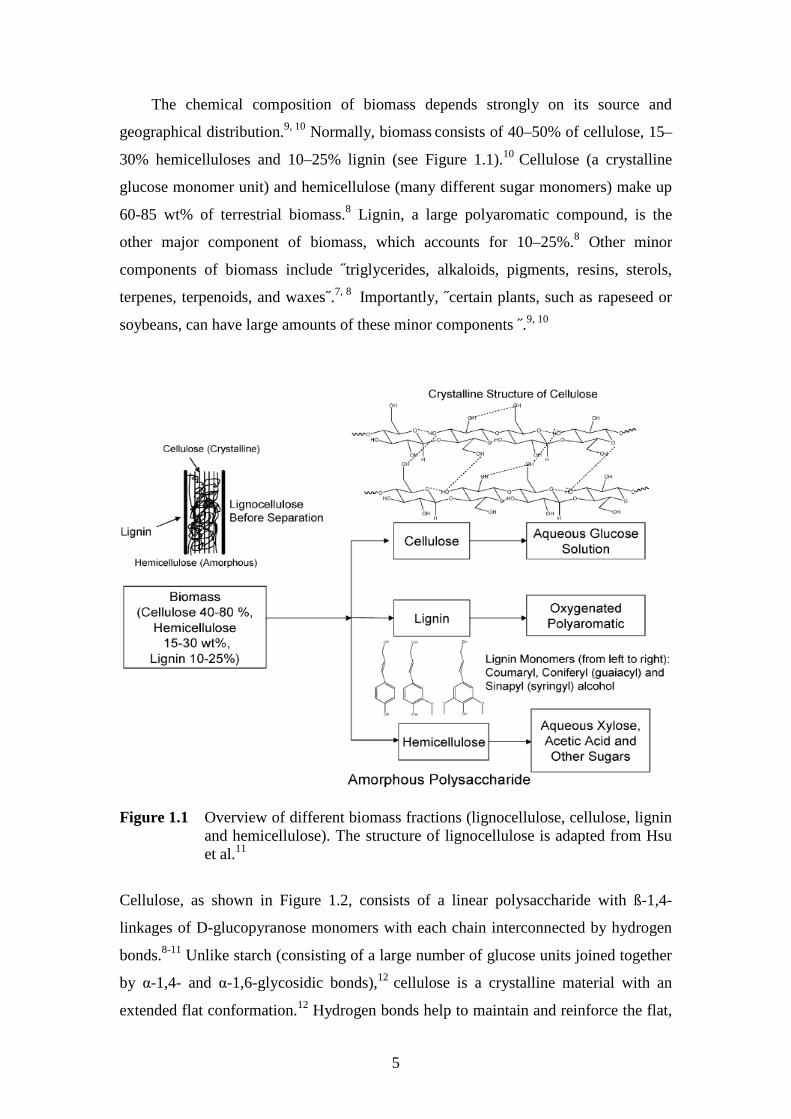
Cellulose, as shown in Figure 1.2, consists of a linear polysaccharide with ß-1,4-
linkages of D-glucopyranose monomers with each chain interconnected by hydrogen
bonds.8-11 Unlike starch (consisting of a large number of glucose units joined together
by α-1,4- and α-1,6-glycosidic bonds),12 cellulose is a crystalline material with an
extended flat conformation.12 Hydrogen bonds help to maintain and reinforce the flat,
6
linear conformation of the chain.10 The top and bottom of the cellulose chains are
essentially completely hydrophobic.9 The sides of the cellulose chains are hydrophilic
and capable of hydrogen bonding, because all the ˝aliphatic hydrogen atoms are in
axial positions, and the polar hydroxyl groups are in equatorial positions˝.10 The
degree of polymerization of cellulose (see Figure 1.3) is approximately 10,000 to
15,000 glucopyranose monomer units in wood and cotton, respectively.12, 13 36 chains
(D-glucopyranose monomers units) associate to form microfibrils. Thereby the cell
wall is stabilized with internal and intramolecular hydrogen bond, making cellulose a
tough compound to break down.10 Enzymes or strong acidic catalysts are needed for
hydrolysis, whereby cellulose is depolymerised into cellobiose (glucose dimmer),
cellotriose (glucose trimer) and cellotetrose (glucose tetramer). Complete acid
hydrolysis results in the formation of glucose.13, 14
Figure1.2 Cellulose results from intramolecular condensation of β-glucose at the 1,4-position. The structure is adapted from Corma10 and Wikipendia.12

7
Figure 1.3 Overview of polymerization degree of cellulose. The structure is adapted from Wikipendia.12
Hemicellulose is a sugar polymer that typically constitutes 15-30 wt% of biomass (see
Figure 1.4). This complex polysaccharide occurs in association with cellulose in the
cell walls.9, 10 The most abundant building block of hemicellulose is xylan (a xylose
polymer linked at the 1 and 4 positions). Usually, all the pentoses are present. Xylose
is always the sugar present in the largest amount. In contrast to cellulose that is
crystalline, strong, and resistant to hydrolysis, hemicellulose has a random,
amorphous structure with little strength. It is easily hydrolyzed by strong mineral acid
or base, but nature provides an arsenal of hemicellulase enzymes for its hydrolysis.10
Figure 1.4 Structural building blocks of hemicelluloses. The structure of hemicellulose is adapted from Ulvskov.14
Ten to twenty-five weight percent of biomass is typically composed of lignin which is
a highly branched aromatic polymer (see Figure 1.5) found in the cell walls of certain
biomass, particularly wooden biomass.15 Lignin is often associated with cellulose and

8
hemicellulose making up lignocellulose compounds. The way produced from
lignocellulose influences its structure and reactivity.15
Figure 1.5 Proposed structure of a hard wood lignin structure (adapted from Weckhuysen).15
Figure 1.6 shows representative monomer structures of lignin.16 Soft wood lignins are
formed from coniferyl alcohol. Hard wood lignins have both coniferyl and sinapyl
alcohol as monomer units.17, 18 Grass lignin contains coniferyl, sinapyl, and coumaryl
alcohol.19, 20 Lignin is an irregular polymer, which is formed by an enzyme-initiated
free-radical polymerization of the alcohol precursors.19 The bonding in the polymer
can occur at many different sites in the phenylpropane monomer due to electron
delocalization in the aromatic ring, the double bond-containing side chain, and the
oxygen functionalities.8, 21

9
Figure 1.6 Common lignin linkages adapted from Chakar et al.16
1.3.2 Technological description of biomass utilization
The wide utilization of biomass for the production of biofuels and chemicals (see
Figure 1.7) has sparked numerous researches and industrious efforts in the world.5, 22
The traditional use of biomass is direct combustion in stoves or boilers for heat. This
is a significant source of energy for worldwide industries and homes.5 Biomass can
also be converted to “biofuels” – liquid and gaseous fuels such as ethanol, methanol,
gasoline, diesel fuel and methane.
BuildingBlocks
SecondaryChemicals
IntermediatesPlatformsPrecursorsBiomass
Starch
Hemicellulose
Cellulose
Lignin
Lipids, Oil
Protein
Carbohydrates
SynGas
Sugar- Glucose- Fructose- Xylose
Lignin
Lipids/Oil
Protein
SynGasC1
C2
C3
C4
C6
Aro-matics
C5
directPolymers
Glycerol
Lactic acid
Propionicacid
Lysine
Carnitine
Products/Uses
Ethanol
MethanolEther Fuel additives
IndustrialSolvents
Olefins Green solvents Transportation
Diacids, Esters
Emulsifiers
Textiles
Dilactid
PLA
Furfural
Levulinicacid
CaprolactamNylons
Furane
…..
Polyurethanes
……
Acrylate
Polyacrylate1,3-PDO
THF
Safe Food Supply
Environment
Communication
Housing
Recreation
Health a. Hygiene Gallic acid
Polysaccharides
Resins
Chemicalintermediates
Phenolics
….
Figure 1.7 Potential products from biomass conversion. This figure was adapted from NREL report.22

10
The processes for direct utilization to energy or converting biomass to fuels include a
broad range of thermal, chemical and biological processes: 5-7, 10, 22
1. The direct combustion processes heat the biomass in the presence of unlimited
oxygen to produce energy. The products of the reaction are additional heat,
ash, and smoke. It converts solid biomass into gaseous products through high
temperature oxidation reactions.7, 22
2. Gasification heats the biomass to temperatures of 600–1000
°C in an
environment of limited oxygen.10 ˝The biomass begins to char and gives off a
gaseous product that is a mixture of carbon monoxide, hydrogen, and
methane.˝18 This gas mixture can be burned directly in industrial processes, or
it can be cleaned up and used as a substitute for natural gas.18 Purified syngas
can be converted to methanol, which can be used as a pure fuel or it can be
transformed to liquid alkanes via Fischer-Tropsch synthesis.18, 21
3. Pyrolysis heats the biomass to temperatures of 300
– 500
°C in the absence of
air. The biomass “melts” and vaporizes, ˝producing petroleum-like oil˝, which
can be converted to gasoline or other chemicals or materials.21
4. Anaerobic digestion is a biological process that uses bacteria in the absence of
oxygen to convert biomass into a mixture of methane and carbon dioxide.
Liquid and solid wastes are particularly amendable to this process, which is
already providing energy in many locations around the world.22
5. Fermentation is another biological process that employs yeast to convert the
sugars derived from biomass into ethanol.21 Some forms of biomass are made
up of simple sugars that can be used directly, for example, sugar cane and
sugar beets.22 Others are made up of carbohydrates that must first be broken
down by enzymatic hydrolysis.
6. Oil extraction can be done with a variety of plants. ˝Peanut, rapeseed, and
some species of aquatic algae are examples of suitable plants for this purpose.
The oils can be chemically upgraded to diesel fuel and burned in engines.˝22
7. Bio-diesel is produced from various types of vegetable oil in Europe and in the
United States. But it is also made in considerable quantities at home-sites for
use in diesel engines as a substitute or an additive to mix with petroleum-

11
diesel fuels. The main advantage in using bio-diesel is that it produces no by-
products containing sulfur.7, 8
The technologies for producing biofuels are at various stages of commercial
development. But the efficiencies and economics of all the processes stand to benefit
from ongoing research. There is still a lot of work to be done in the research fields to
make biofuels economically feasible. As we can see, methods that are currently
industrial practice are bioethanol and biodiesel.23 They use only parts of the plant
material, which often compete with the food supply chain. Moreover, this technology
is also often confronted with environmental impact, land availability and indirect
effects of bioenergy production. The approaches to use lignocellulosic material focus
on rather unselective conversion processes to generate susbtistutes for hydrocarbon
fuels (e.g. biomass to liquid, BTL). An attractive alternative would be the selective
conversion of the biomass constituents into small oxygenates molecules with tailor-
made properties for future optimized combustion engines.23b The resulting challenges
for fundamental science are addressed in the research programme of the Cluster of
Excellence “Tailor-Made fuels from Biomass” at RWTH Aachen.23a Various "value
chains" are being developed and demonstrated for the conversion of sustainable
lignocellulosic feedstocks into a range of biofuels, as well as other valuable
chemicals.23
1.3.3 Utilization of biomass in TMFB Project
According to the Cluster of Excellence ˝Tailor-Made Fuel from Biomass (TMFB)˝,
under which framework the current study has been executed, the utilization of
biomass integrates biomass conversion processes and equipment to produce fuels,
power and chemicals from biomass (Figure 1.8).23a
12
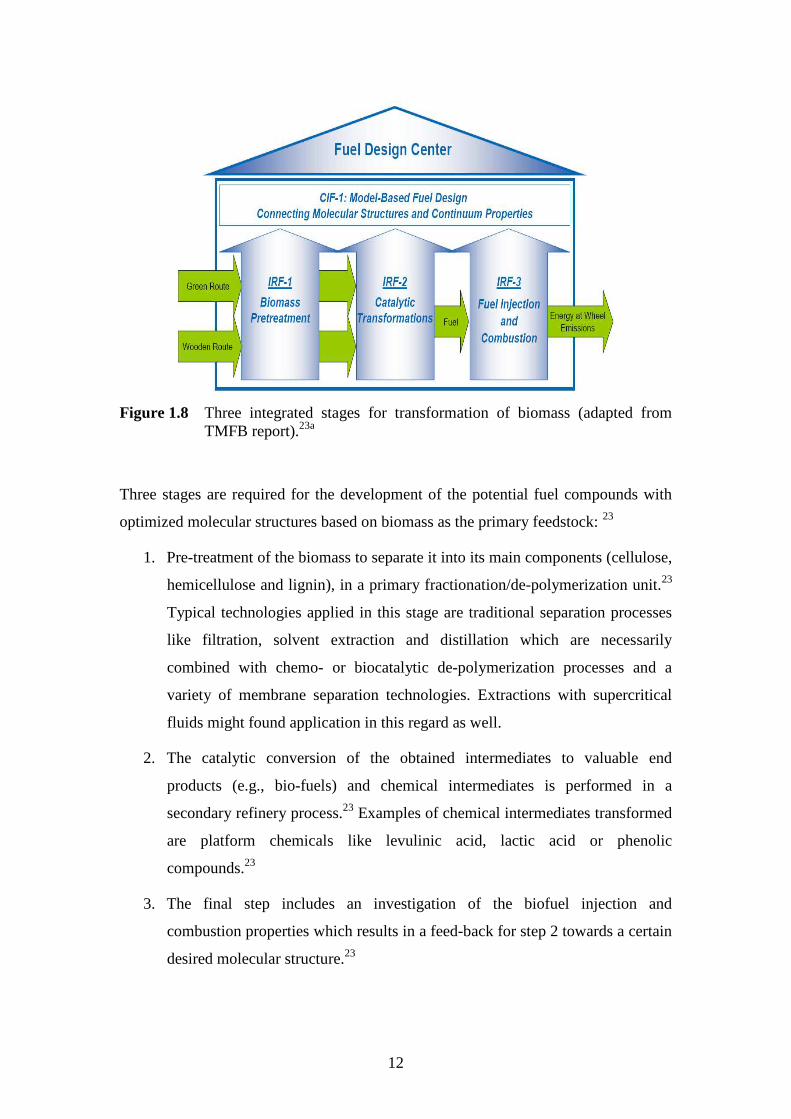
Figure 1.8 Three integrated stages for transformation of biomass (adapted from TMFB report).23a
Three stages are required for the development of the potential fuel compounds with
optimized molecular structures based on biomass as the primary feedstock: 23
1. Pre-treatment of the biomass to separate it into its main components (cellulose,
hemicellulose and lignin), in a primary fractionation/de-polymerization unit.23
Typical technologies applied in this stage are traditional separation processes
like filtration, solvent extraction and distillation which are necessarily
combined with chemo- or biocatalytic de-polymerization processes and a
variety of membrane separation technologies. Extractions with supercritical
fluids might found application in this regard as well.
2. The catalytic conversion of the obtained intermediates to valuable end
products (e.g., bio-fuels) and chemical intermediates is performed in a
secondary refinery process.23 Examples of chemical intermediates transformed
are platform chemicals like levulinic acid, lactic acid or phenolic
compounds.23
3. The final step includes an investigation of the biofuel injection and
combustion properties which results in a feed-back for step 2 towards a certain
desired molecular structure.23

13
1.4 Conversion of biomass to levulinic acid
1.4.1 Methods and catalytic system
Researchers from National Renewable Energy Laboratory (NREL) and Pacific North-
west National Laboratory (PNNL) have recently conducted an extensive study to
identify the most valuable sugar-based building blocks from lignocellulosic
biomass.22, 24 Levulinic acid was considered as one of the most promising top-twelve
building blocks, which is accessible from lignocellulosic biomass (Figure 1.9).22, 24
Figure 1.9 Transformation of lignocellulosic biomass to levulinic acid22, 24
Levulinic acid (LA; 4-oxopentanoic acid) is a water-soluble acid (pKa = 4.59) with a
high-boiling point (520 K), that crystallizes at room temperature (melting point 311
K). The molecular structure of LA contains two reactive functional groups (–C=O and
–COOH) that provide the opportunity for a variety of synthetic transformations.24, 25
LA is normally formed by treatment of D-glucose which has to be isomerised to
D-fructose. In the presence of acidic species, fructose is dehydrated, producing a
number of compounds such as 5-hydroxymethylfurfural (HMF), levulinic acid, formic
acid, and others (Figure 1.10).26-28 HMF is prone to recombine with sugars or itself via
aldol- condensation in acidic solution, resulting in polymers with undefined structures
and stoichiometry called humins.29, 30 It is thus expected that by changing the solvent
system as well as the amount and/or the nature of the employed catalyst, the reaction
rates of different steps can be influenced to alter the distribution of products
obtained.31-34

14
Figure 1.10 Possible reaction pathways from cellulose to levulinic acid
To exploit the large potential of LA as key platform chemical, a large number of
chemical industry firms and researchers devoted numerous endeavors to address afore
mentioned issues. The first pioneered study on the preparation of LA was reported as
early as the 1840s by G. J. Mulder.35 His group t ried to prepare LA by heating a
mixture of sucrose with mineral acid such as HCl. Unfortunately, details on the
reaction conditions and the LA yield are unknown. ˝In 1940, the first commercial
scale production of levulinic acid in an autoclave was started in United States by
Stanley.˝35 The pioneered work done by groups of Hanna36 and Heeres37 using kernel
grain sorghum and starch as starting material for the production of levulinic acid.
Notably, the maximum yield of levulinic acid obtained was as high as 50%.
The conversion of HMF into levulinic acid have been studied by the groups of
Hawley26 in the eighties whereby a LZY zeolite catalyst was chosen and later on by
Heeres37 who reported a maximum yield of 60% using sulphuric acid as a catalyst.
Horváth and coworkers38 reported the conversion of sucrose to levulinic acid with
54% yield and rehydration of HMF to levulinic acid with 54% yield in 2008.
Sulphuric acid or Nafion NR50 – a solid acid which is easy to separate with recycle –
was used as catalysts in water as a reaction medium.
Mascal and co-workers recently reported the dehydration of glucose to levulinic
acid with 79% yield using hydrochloric acid as a catalyst and dimethyl chloride as a
solvent. Likewise 5-(chloromethyl) furfural was dehydrated into LA at 190 oC in
water in 91% yield. 39 Jin and coworkers converted carbohydrate biomass to HMF and
levulinic acid. The highest yield of LA was 55%, which was obtained with HCl at a
pH of 1.5 and 5 min reaction time.40

15
Zhuang and coworkers investigated the conversion of cellulose to levulinic acid
by different metal chlorides including alkali metals (Li, Na and K), alkaline earth
metals (Mg and Ca), transition metals (Cr, Mn, Fe, Co, Cu and Zn) and Al as a group
IIIA metal. Among those metal chlorides, chromium chloride was found to be
exceptionally effective for the conversion of cellulose to levulinic acid, affording an
optimum yield of 67 mol% after a reaction time of 180 min at 200 °C.41 Lucht and
coworker investigated the conversion of cellulose to glucose and LA via a solid
catalyst system based on Nafion SAC 13 or FeCl3/silica. Here, 5% yield of LA was
obtained.42
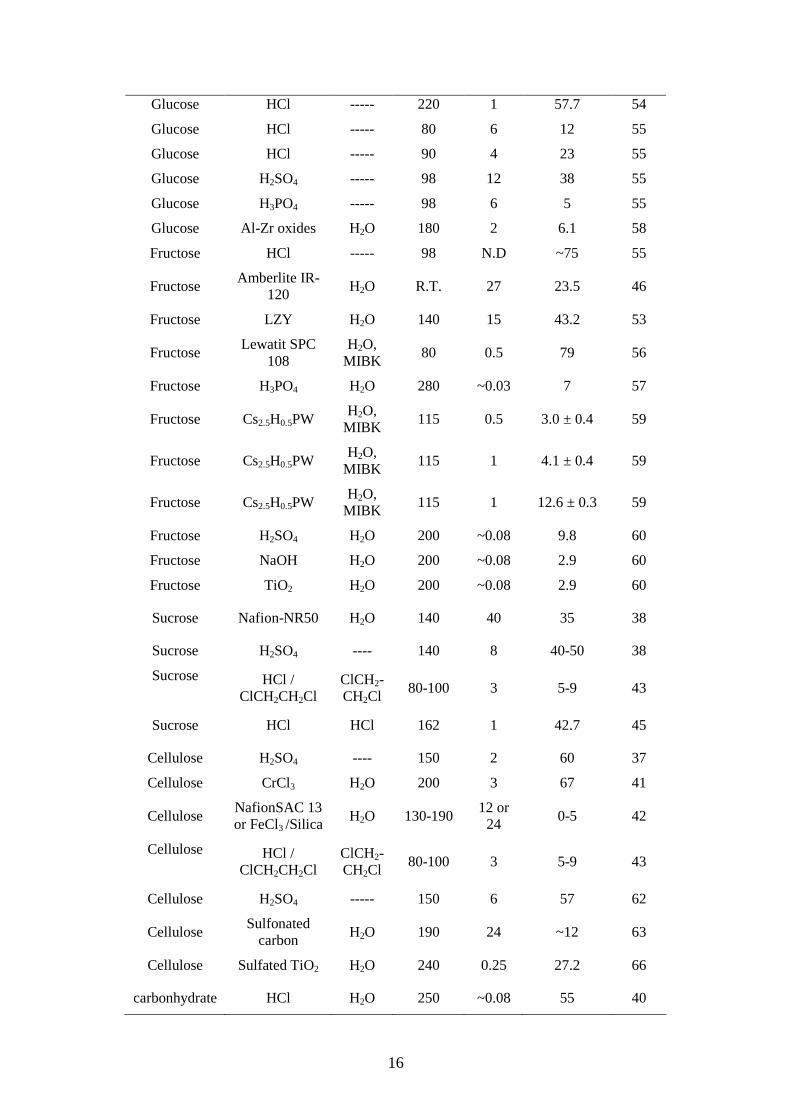
In order to give a comprehensive overview of biomass based synthetic protocols
for LA formation, representative studies and methods are summarized in Table 1.1.
Table 1.1 Summary for production of levulinic acid from literatures and patents
Feedstock Catalyst Solvent T / °C t / h Y (LA) / % Ref.
HMFa LZY Zeolite ---- 140 15 43.2 26
HMF Nafion-NR50 H2O 100 40 54 38
Glucose HCl-C2H4Cl2 ---- 80-100 3 79 39
Glucoseb FeCl3 H2O 180 2 30 41
Glucoseb CrCl3 H2O 180 2 60 41
Glucoseb CuCl2 H2O 180 2 ~23 41
Glucoseb AlCl3 H2O 180 2 ~71 41
Glucose HCl /
ClCH2CH2 Cl ClCH2-CH2Cl
80-100 3 5-9 43
Glucose HCl H2O R.T. 24 15 44
5-Cl M-furfural
----- H2O 190 0.33 91.2 39
Glucose Amberlite IR-
120 H2O R.T. 124 5.8 46
Glucose H2SO4 H2O 160-240 N.D 35.4 47
Glucose HCl H2O 160 0.25 41.4 48
Glucose Clay H2O 150 24 12 49
Glucose HY Zeolite H2O 150 24 6 50
Glucose MFI Zeolite H2O 180 8 35.8 51
Glucose H2SO4 H2SO4 170-210 1 80.7 52
16
Glucose HCl ----- 220 1 57.7 54
Glucose HCl ----- 80 6 12 55
Glucose HCl ----- 90 4 23 55
Glucose H2SO4 ----- 98 12 38 55
Glucose H3PO4 ----- 98 6 5 55
Glucose Al-Zr oxides H2O 180 2 6.1 58
Fructose HCl ----- 98 N.D ~75 55
Fructose Amberlite IR-
120 H2O R.T. 27 23.5 46
Fructose LZY H2O 140 15 43.2 53
Fructose Lewatit SPC
108 H2O,
MIBK 80 0.5 79 56
Fructose H3PO4 H2O 280 ~0.03 7 57
Fructose Cs2.5H0.5PW H2O,
MIBK 115 0.5 3.0 ± 0.4 59
Fructose Cs2.5H0.5PW H2O,
MIBK 115 1 4.1 ± 0.4 59
Fructose Cs2.5H0.5PW H2O,
MIBK 115 1 12.6 ± 0.3 59
Fructose H2SO4 H2O 200 ~0.08 9.8 60
Fructose NaOH H2O 200 ~0.08 2.9 60
Fructose TiO2 H2O 200 ~0.08 2.9 60
Sucrose Nafion-NR50 H2O 140 40 35 38
Sucrose H2SO4 ---- 140 8 40-50 38
Sucrose
HCl / ClCH2CH2Cl
ClCH2-CH2Cl
80-100 3 5-9 43
Sucrose HCl HCl 162 1 42.7 45
Cellulose H2SO4 ---- 150 2 60 37
Cellulose CrCl3 H2O 200 3 67 41
Cellulose NafionSAC 13 or FeCl3 /Silica
H2O 130-190 12 or 24
0-5 42
Cellulose
HCl / ClCH2CH2Cl
ClCH2-CH2Cl
80-100 3 5-9 43
Cellulose H2SO4 ----- 150 6 57 62
Cellulose Sulfonated
carbon H2O 190 24 ~12 63
Cellulose Sulfated TiO2 H2O 240 0.25 27.2 66
carbonhydrate HCl H2O 250 ~0.08 55 40

17
Kernel grain sorghum
H2SO4 ---- 200 ~0.67 32.6 36
Microcrystal-cellulose
HCl ----- 220 1 35.4 54
α-cellulose HCl ----- 220 1 45.2 54
Starch HCl ----- 220 1 53.7 54
Corn stover HCl /
ClCH2CH2Cl ClCH2-CH2Cl
80-100 3 5-9 43
Water hyacinth
H2SO4 H2O 175 0.5 53 61
Rice straw S2O8
2-/ZrO2-
SiO2-Sm2O3 H2O 150 0.25 6.6 65
Rice straw S2O8
2-/ZrO2-
SiO2-Sm2O3 H2O 180 0.25 8.2 65
Rice straw S2O8
2-/ZrO2-
SiO2-Sm2O3 H2O 200 0.25 9.3 65
Rice straw S2O8
2-/ZrO2-
SiO2-Sm2O3 H2O 240 0.25 8.6 65
Starch H2SO4 ------ 200 1 47.5 66
Wheat straw H2SO4 ------ 210 0.6 19.9 67
Gelidium amasii
H2SO4 ----- 160 ~0.7 3.0 68
N. D.: not exactly defined, a: water was added after reaction to dissolve products. b: these values were obtained from Figure 3 in Reference 41.
Based on literatures, HMF was traditionally thought as the intermediate for formation
of levulinic acid under acidic condition. A large number of researches have been
focused on the production of HMF using different solvents and different catalysts
including homogeneous and heterogeneous catalysts. In order to better understand the
developemt between production of HMF and levulinic acid, the representative results
of HMF from literatures and patents are also summarized in Table 1.2.
Table 1.2 Summary of literature reports for production of HMF
Feedstock Catalyst Solvent Temp. / °C
Time / h
Y(HMF) / % Ref.
Fructose Lewatit SPC 108, microporous resin
H2O, MIBK 80 0.5 12 56
Fructose Amberlyst-15 N, N-DMF 100 3 73 69

18
Fructose Nafion NR50 N, N-DMF 100 3 45 69
Fructose H3PO4-treated niobic acid and
Niobium phosphate H2O 100 0.5 ~29 70
Fructose TUD-1 Zeolite (Si/Al = 21)
H2O + Toluene 170 4 ~20 71
Fructose H3PO4 H2O 240 ~0.04 65 57
Fructose HCl H2O 210-270
~0.02 12 72
Fructose ZrP H2O 240 ~0.03 50.2 73
Fructose Propylsulfonic
acid-functionalized silica
MIBK / 2-butanol /H2O
180 0.5 48.8 74
Fructose TiO2 H2O 200 ~0.08 38.1 60
Fructose ZrO2 H2O 200 ~0.08 30.5 60
Fructose PTSA choline chloride
100 0.5 67 75
Fructose ChoCl / citric acid
monohydrate AcOEt
(extraction) 80 1 91 76
Fructose SiO2-gel H2O + MIBK 88 8 47 77
Fructose Amberlyst-15 [BMIM][BF 4]/
DMSO 80 34 87 77
Fructose PTSA [BMIM][BF 4]/
DMSO 80 34 68 77
Fructose H2SO4 Actone/H2O
(90/10) 180 ~0.06 ~77 78
Fructose RhCl3 [EMIM]Cl 80 3 ~83 79
Fructose PtCl2 [EMIM]Cl 80 3 ~83 79
Fructose CrCl3 [EMIM]Cl 80 3 ~69 79
Fructose H-form mordenites MIBK+H 2O 165 2 73 28
Fructose [NMP][CH3SO4] DMSO 90 2 72.3 34
Fructose [NMP][HSO4] DMSO 90 2 69.4 34
Fructose Nafion DMSO 120 2 94 80
Fructose HY zeolite DMSO 120 2 76 80
Fructose WO3/ZrO2 DMSO 120 2 94 80
Fructose H3PW12O40 DMSO 120 2 95 80
Fructose [HMIm]SO3Cl DMSO 100 ~0.03 83 81
Fructose [NMM][CH3SO3] (DMF–LiBr) 90 2 74.8 82
Fructose [BMIM]Cl ----- 120 2 78.6 29
Fructose [BMIM]Cl H2SO4 120 0.5 96 29

19
Fructose [BMIM]Cl CrCl3 100 6 83 83
Fructose [BMIM]Cl CrCl2 100 6 76 83
Fructose Amberlyst-15 [BMIM]Cl /acetone
25 6 78.2 84
Fructose Amberlyst-15 [BMIM]Cl
/DMSO 25 6 78.3 84
Fructose Amberlyst-15 [BMIM]Cl
/AcOEt 25 6 81.1 84
Fructose Amberlyst-15 [BMIM]Cl
/EtOH 25 6 80.2 84
Fructose Amberlyst-15 [BMIM]Cl
/MeOH 25 6 82.0 84
Fructose Amberlyst-15 [BMIM][PF 6] /
DMSO 80 24 80 85
Fructose PTSA [BMIM][PF 6] /
DMSO 80 20 75 85
Fructose [nmp] [HSO4] DMSO 90 2 69.4 34
Fructose [nmp] [CH3SO4] DMSO 90 2 72.3 34
Fructose [nmp] [CH3SO4] EtOH 85 2 5.9 34
Fructose [nmp] [CH3SO4] H2O 90 2 2.7 34
Fructose H2SO4/KCl DMA 80 2 56 86
Fructose H2SO4/LiBr DMA 100 4 92 86
Fructose H2SO4/NaBr DMA 100 2 93 86
Fructose H2SO4/LiI DMA 100 6 89 86
Fructose H2SO4/NaI DMA 100 5 91 86
Fructose H2SO4/KI DMA 100 5 92 86
Glucose Al-Zr oxides H2O 180 2 14.4 58
Glucose TiO2 H2O 200 0.05 7.7 60
Glucose ZrO2 H2O 200 0.05 4.6 60
Glucose CrCl3 · 6H2O [BMIM]Cl 100 4 91 87
Glucose CrCl3 · 6H2O [BMIM]Cl 100 4 79 87
Glucose CrCl3 · 6H2O [BMIM]Cl ~100 1 17 88
Glucose CrCl2 (different
amount) [BMIM]Cl 100 6 66 83
Glucose CrCl2 [BMIM]Cl 100 6 65 83
Glucose CrCl3 [BMIM]Cl 100 6 78 83
Glucose CrCl3 (different
amount) [BMIM]Cl 100 6 72 83
Glucose CeCl3 [BMIM]Cl 140 6 3 89
Glucose PrCl3 [BMIM]Cl 140 6 7 89

20
Glucose Yb(OTf)3 [BMIM]Cl 140 6 24 89
Glucose SnCl4 · 5H2O [EMIM][BF 4] 100 3 53 90
Glucose CrCl2 [EMIM]Cl 100 3 ~68 79
Glucose CrCl3 [EMIM]Cl 100 3 ~45 79
Glucose CeCl3 [EMIM]Cl 140 6 3 89
Glucose PrCl3 [EMIM]Cl 140 6 13 89
Glucose NdCl3 [EMIM]Cl 140 6 12 89
Glucose Yb(OTf)3 [EMIM]Cl 140 6 10 89
Glucose HCl DMSO 90 2 21.2 34
Glucose CrCl2 DMA 100 4 60 86
Glucose CrCl2/LiBr DMA 100 4 79 86
Glucose CrCl2/LiI DMA 100 4 54 86
Glucose H2SO4 [BMIM]Cl 120 2 11.9 29
Glucose TUD-1 Zeolite H2O + Toluene 170 6 17 71
Mannose H2SO4 [BMIM]Cl 120 0.3 2.1 86
Cellobiose CrCl3 · 6H2O [BMIM]Cl 100 4 37 87
Maltose CrCl3 · 6H2O [BMIM]Cl 100 4 33 87
Sucrose CrCl3 · 6H2O [BMIM]Cl 100 4 73 87
Cellobiose SnCl4 · 5H2O [EMIM][BF 4] 100 3 57 90
Sucrose SnCl4 · 5H2O [EMIM][BF 4] 100 3 65 90
Sucrose ------ [HMIM]Cl 90 0.5 ~50 85
Sucrose [BMIM]Cl H2O 80 2 ~55 85
Cellulose CrCl3 · 6H2O [BMIM]Cl 100 4 17 88
Cellulose CrCl3 · 6H2O [BMIM]Cl/
[emim] [HSO4] 100 4 8 87
Cellulose CrCl3 [EMIM]Cl 140 1 53 86
Inulin SnCl4 · 5H2O [EMIM][BF 4] 100 3 40 90
Starch SnCl4 · 5H2O [EMIM][BF 4] 100 24 47 89
Starch CrCl3 · 6H2O [BMIM]Cl 100 4 0.7 87
Corn stalk CrCl3 · 6H2O [BMIM]Br 100 0.05 45 91
Corn stover
CrCl2/HCl [EMIM]Cl 140 3 29 86
Pine wood CrCl3 · 6H2O [BMIM]Br 100 0.05 52 91
Rice straw CrCl3 · 6H2O [BMIM]Br 100 0.05 52 91
Glucose H3PO4 H2O 250 0.08 50 40
Inulin TUD-1 Zeolite H2O + Toluene 170 6 20 71
Sucrose TUD-1 Zeolite H2O + Toluene 170 4 17 71
Cellobiose TUD-1 Zeolite H2O + Toluene 170 4 12 71

21
Although major achievements in HMF or LA production could be reached, the main
disadvantages still exists, especially for production of LA, which can be shortly
summarized as following:
(1) In combination with the frequently used mineral acids such as hydrochloric
acid or sulphuric acid, serious drawbacks originate from the corrosiveness of
those media towards steel based high pressure equipment, which is needed to
run the reactions at temperatures around 200 °C in a condensed form.
(2) The usage of high boiling point solvents such as DMF or DMSO might be an
alternative to (1) as it allows normal pressure applications. However the
necessary separation and isolation of the gained products is tedious and cost-
intensive. In principle, the same problem occurs if suitable ionic liquids are
applied.
(3) If bio-catalysts are used for the transformation, their separation from the
reaction mixture is anything but trivial in most cases.
Overall, the need for more selective and active catalysts, which are easily separable
robust, and which are compatible with earlier and following transformation steps is
still a major goal in this field.
1.4.2 Mechanistic aspects of the formation of levulinic acid
Numerous studies have contributed to investigate possible reaction mechanisms of
sugar dehydration to LA. However, until now a fully comprehensive reaction network
able to explain the variety of product distributions obtained, is still lacking.92-96 The
available information implies that C6-sugars initially would be dehydrated to form 5-
hydroxymethylfurfural (HMF) as an intermediate which was subsequently hydrated to
give the final products levulinic and formic acid. Figure 1.11 shows the proposed
acidic mechanism for the conversion of C6 sugars, such as D-fructose to HMF. A
study by Antal and coworkers suggested that HMF is formed from dehydration of
fructose in its furanose form and occurs through a series of cyclic furan intermediates
(Figure1.11, pathway b).93 Moreau and coworkers postulated that HMF is formed via

22
an enediol pathway (Figure 1.11, pathway a) in which the enediol is the decisive
intermediate in the isomerization of glucose to fructose. The further conversion of
HMF into LA would then be the result of water addition to the C-2 and C-3
bond of
the furan ring to give the final products levulinic and formic acid (see Figure 1.12).28,
96
Figure 1.11 Possible dehydration mechanisms for formation of HMF.24 The
acyclic route is labeled with an “a,” the cyclic route with a “b”.26
Figure 1.12 Proposed mechanisms for formation of levulinic acid from HMF97

23
1.5 Potential applications of LA and its derivatives
1.5.1 Building blocks derived from levulinic acid
LA can be generated at least in principle from almost all C6 sugars manufactured in
the biorefinery, and for that reason, has frequently been suggested as a starting
material for a wide number of compounds.9, 25 Reductions, oxidations and
condensations reactions could give access to potential derivatives (Figure 1.13).
Figure 1.13 Overview of important LA derivatives. This figure was adapted from
PNNL report.24
1.5.2 Economical and ecological considerations
The family of compounds available from LA is quite broad, and addresses a number
of large volume chemical markets.25
(1) Conversion of LA to 2-methyltetrahydrofuran (2-MTHF) 98, 99 and various
levulinate esters in the Cluster of Excellence ˝Tailor-Made Fuel from Biomass
(TMFB)˝ address ˝fuel markets as gasoline and biodiesel additives,
Levulinic acid
2-MTHF
Acrylic acid
Aminolevulinate
Acetylacrylic acid
Levulinate esters
1,4-Pentanediol
Diphenolic acid
Angelica lactone
GVL

24
respectively˝.100 2-MTHF is a highly flammable mobile liquid which is
currently mainly used as a replacement for THF in special applications. In
comparison with THF, 2-MTHF dissolves only small amounts of water which
allows easier separations if an additional water phase must be present.101, 102
(2) Levulinate esters have been considered as potentially renewable diesel
fuels.103-105 Besides, these ketoesters are good substrates for a variety of
condensation and addition reactions.106-108 A levulinate ester was also
efficiently converted into a glassy polymer via reaction with primary alkyl
amines. This polymer may have application in coatings and films.105-109
(3) δ-Amino-levulinic acid is ˝a herbicide and a precursor for porphyrins and
hemoglobin. It targets a market of 90 – 140 thousand tons per year and is
produced with costs between 4 and 6 $/kg.˝24 This material could be used in
the production of new acrylate polymers110, ˝addressing a market of 1.1 billion
t/a with production costs of about 2.8 $/kg˝.24
(4) Diphenolic acid is of particular interest because it can serve as a replacement
for bisphenol A in the production of polycarbonates.24, 111 It can be prepared
by the condensation reaction of phenol with levulinic acid in the presence of
hydrochloric acid. ˝The polycarbonate resin market is almost 2 million t/a,
with product values of about 5 $/kg.˝112
(5) New technology also suggests that LA could be used for production of acrylic
acid via oxidative processes.113, 114
(6) LA is also a potential starting material for production of succinic acid, which
is now used within ˝the food and beverage industry, primarily as a sweetener.
Global production is estimated at 16.000 to 30.000 tons a year, with an annual
growth rate of 10%.˝115
(7) Production of LA derived lactones offers the opportunity to enter a large
solvent market, as these materials could be converted into analogs of N-
methylpyrrolidinone.116, 117 Reduction of LA leads to 1,4-pentanediol, 98 which
could be used for production of new polyesters.118, 119

25
1.6 Conversion of biomass-derived monomers to γ-valerlactone
1.6.1 Properties of γ-valerolactone
It was recently proposed that γ-valerolactone (GVL), a frequently used food additive,
exhibits promising characteristics of a sustainableplatform chemical, including the
possibility to use it for the production of either energy or carbon-based consumer
products.120 It is renewable, has low melting (-31 °C), high boiling (207 °C) and flash
points (96 °C), a definitive but acceptable smell for easy recognition of leaks and
spills, low toxicity, and high solubility in water to assist biodegradation.121
In addition, Horváth and coworkers have shown that its vapor pressure is
0.65 kPa at 25 °C, and it only increases to 3.5 kPa at 80 °C. GVL does not hydrolyze
under neutral conditions and does not form a measurable amount of peroxides in a
glass flask under air in weeks, making it a safe material for large scale use (Table 1.3).
Comparative evaluation of GVL and ethanol as fuel additives performed on ˝a
mixture of 10 Vol-% GVL or EtOH and 90 Vol-% 95-octane gasoline, shows very
similar properties (Table 1.4).˝ 121 Since GVL does not form an azeotrope with water,
the latter can be readily removed by distillation, resulting in a less energy demanding
process for the production of GVL than that of absolute ethanol. 121
Table 1.3 Selected physical properties of potential fuels121
Terms Methanol122 Ethanol MTBE 123 ETBE123 GVL 2MTHF 124
M / g mol-1 32.04 46.07 88.15 102.17 100.12 86.13
Carbon (wt %) 37.5 52.2 66.1 70.53 60 69.7
Hydrogen (wt %) 12.6 13.1 13.7 13.81 8 11.6
Oxygen (wt %) 49.9 34.7 18.2 15.66 32 18.7
Boiling point /°C 65 78 55 69-71 207 80
Melting point /°C -98 -114 -109 -94 -31 -136
Flash Point /°C 12 13 -30 -19 96.1 -11.1
Density / g mL-1 0.7918 0.789 0.7404 0.7364 1.0485 0.86
Solubility in water / (mg/ml)
miscible miscible 42 N.D. ≥ 100 13
MTBE ~ methyl t-butyl ether, ETBE ~ ethyl t-butyl ether, 2MTHF ~ 2-methyl THF.

26
Finally, Horváth and coworkers also argue that the use of a single chemical entity,
such as GVL, as a sustainable liquid instead of a mixture of compounds could
significantly simplify its worldwide monitoring and regulation.121 In order to further
summarize the property and potential biofuel application, selected properties were
listed in comparison with other typically recognized fuels (Table 1.3 & 1.4).
Table 1.4 Selected properties of different fuel blendings in comparison with standard fuel. The data was mainly adapted from Horváth.121
Terms MSZ EN228* requirements
AN-95 gasoline
AN-95 / EtOH (90/10)
AN-95 / GVL (90/10)
Density / kg m-3 720-775 733.5 737.8 765.8
Oxidation stability, min 360 OK OK OK
Peroxide numbera / mg kg-1
1.75 1.40 1.72
Vapor pressure (DVPE) / kPa
45-60 (summer) 60-90 (winter)
54.6 65.1 56.6
Evaporated up to 70 °C (v/v%)b
20-48 (summer) 22-50 (winter)
27.2 47.9 24.1
Evaporated up to 100 °C (v/v%)b 46-71 52.3 57.3 46.2
Evaporated up to 150 °C (v/v%)b Min.75 90.0 90.7 80.0
Final boiling point / °C max.
210 181.9 181.6 202.2
Distillation residue (v/v%)b Max.2 1.0 1.0 0.9
Motor octane numberc Min.85 88.8 89.3 89.2
Research octane number (blending
RON)d Min.95 97.2 97.4 97.3
* EN228 (gasoline) is a blending with low quantity of alcohol (max 2.7% oxygen, max 5% ethanol, max 3% methanol). MSZ: Hungary requirement. AN-95: RON 95, standard fuel.
a Peroxide number / mg kg-1 = [(A-B)N • 1000 • 8]/m, where A is the volume of Na2S2O3 solution (in mL) required for titration of the sample, B is the volume of Na2S2O3 solution (in mL) required for titration of the blank, N = normality of the Na2S2O3 solution, and m is the mass of the probed sample used (in g).122
b Volume ratio of evaporated part (or of residue)121 c Motor octane number is a measure of how the fuel behaves when under load, as it is
determined at 900 rpm engine speed.125 d RON is determined by running the fuel in a test engine with a variable compression ratio
under controlled conditions, and comparing the results with those for mixtures of iso-octane and n-heptane. 125

27
1.6.2 Catalytic system for production of γ-valerolactone
The derivative γ-valerolactone (GVL) is typically obtained from levulinic acid (LA)
by a catalytic hydrogenation using molecular hydrogen or hydrogen transfer agents.
The intermediate 4-hydroxypentanoic acid is unstable in its open form and the
cyclisation to GVL occurs easily.126 Typical hydrogenation of LA to GVL using
heterogeneous catalysts in combination with molecular hydrogen or hydrogen transfer
agents are either performed in solvent free or in organic solvents like dioxane or ethyl
ether.126 Supercritical carbon (scCO2) dioxide was used as well.127
Manzer and coworker reached 97% yield with a Ru/C catalyst at 150 °C and
34.5 bar hydrogen in dioxane.126 Bourne et al. reported 99% yield with a Ru/Al2O3
catalyst at 200 °C. The total pressure of 20 MPa originates from a mixture of
compressed carbon dioxide and hydrogen (20% excess towards LA).127 Horváth and
coworker applied a homogenous Ru complex [(η6-C6Me6)Ru(bpy)(H2O)] and formic
acid as the hydrogen donor. The reactions were performed in water at 140 °C.38 More
recently, Leitner and coworkers98 have developed a multifunctional homogeneous
catalysis system (composed of Ru based organic metal precursor Ru(acac)3, ligands
and acidic additives) for highly selective and flexible catalytic conversions of
levulinic acid to yield quantitative GVL at 100 bars H2 and 160 oC.
The recent progress towards the production of GVL based on biomass-derived
feedstocks is summarized in Table 1.5.
Table 1.5 Representative studies for production of GVL from literatures and patents
Feedstock Catalyst Solvent T / °C H2 sources t
/ h Y (GVL) /
% Ref.
LA Ru(acac)3 +
TPPTS H2O 140 69 bar H2 12 95 38
LA [(η6-C6Me6)
Ru(bpy) (H2O)][SO4]
H2O 70 HCOONa 18 25 38
LA Ru(acac)3 +
PBu3 ---- 200 82.8 bar H2 6 37 38
LA 5% Ru/C ---- 150 HCOOH +
H2 2 >99 62
LA Ru(acac)3 + PnOct3 +
---- 160 100 bar H2 18 >99 98

28
NH4PF6
LA Ru/C Dioxane 150 34.5 bar H2 4 97 126
LA a Ru/SiO2 H2O+CO2 200 100 bar H2 N.D. >99 127
LA Raney Ni ---- ~200 48.3 bar H2 N.D. 94 128
LA Ru-P/SiO2
Ru/C H2O 150 HCOOH 6 30 129
LA Ru/C H2O 150 40 bar H2 1 30 129
LA Ru/C H2O 150 HCOOH
+40 bar H2 1 49 129
LA Ru/TiO2 H2O 150 HCOOH
+40 bar H2 1 63 129
LA Ru/C CH3OH 130 12 bar H2 3 91 130
LA Pd/Al2O3 ------ 220 HCOOH 12 29 131
LA PtO2 ethyl ether 250 ~3 barH2 44 87 132
LA b 5% Ru/C Dioxane 265 1-25 bar H2 50 98.6 133
LA b 5% Pd/C Dioxane 265 1-25 bar H2 50 90 133
LA b 5% Pt/C Dioxane 265 1-25 bar H2 50 30 133
LA RuCl2(PPh3)3 ------- 180 Unknown 24 99 134
LA Ruthenium complex
H2O + Toluene
200 90 bar H2 8 86 134
LA CuCr- oxide ------ 190 200 bar H2 1.3 94 135
LA Raney Ni ----- 220 48 bar H2 3 94 135
LA 5% Ru/C Dioxane 174 H2+CO2
(250 bar) N.D. 42.1 136
LA 5% Ru/Al2O3 Dioxane 199 H2+CO2
(279 bar) N.D. 22.8 136
LA 5%Pt/SiO2 Dioxane 176 H2+CO2
(201 bar) N.D. 4.08 136
LA 5%Ru/Al2O3 Dioxane 200 H2+CO2
(202 bar) N.D. 21.4 136
LA 5%Ru/C Dioxane 201 H2+CO2
(201 bar) N.D. 73.2 136
LA 5% Ru/ Al 2O3
Dioxane 201 H2+CO2
(200 bar) N.D. 75.3 136
LA 3.5%
Ru/TiO2 Dioxane 140
H2+CO2
(219 bar) N.D. 70.6 136
LA 5% Rh/C Dioxane 141 H2+CO2
(247 bar) N.D. 98.9 136
LA 5% Ir/C Dioxane 141 H2+CO2
(250 bar) N.D. 43.0 136
Ethyl 10% Ni/Si ---- 200 HCOOH N.D. 40 137

29
levulinate
Ethyl levulinate
10% Ni/Si ---- 250 HCOOH N.D. 73 137
Glucose Ru(CO)4 I2
+ Nb2O5 H2O 200 30 bar H2 8 37.7 138
Glucose Ru(CO)4 I2
+HI H2O 200 30 bar H2 8 39.1 138
Fructose HCO2-CF3,
Ru/C H2O +
HCO2-CF3 180 HCOOH 16 52 139
Fructose HCO2-CF3,
Ru/C H2O +
HCO2-CF3 180 94 bar H2 8 62 139
Glucose HCO2-CF3,
Ru/C H2O +
HCO2-CF3 180 94 bar H2 8 38 139
Glucose HCO2-CF3, Ru/TPPTS
H2O + HCO2-CF3
180 94 bar H2 8 23 139
Sucrose HCO2-CF3, Ru/TPPTS
H2O + HCO2-CF3
180 94 bar H2 8 52 139
Glucose HCO2-CF3, Ru/TPPTS
H2O + HCO2-CF3
180 94 bar H2 8 29 139
N.D.: not defined, a: the system pressure composed of H2 and CO2, b: fixed bed flow reactor.
Although the above mentioned methods (Table 1.5) were operated at mild conditions
and good yields of GVL were achieved in many cases, more focus have to be spent on
long term stability to achieve high turnover numbers and high yield with efficient
separation procedures. The design of supported metal catalysts with high activity and
yield is a worthwhile task here.
1.6.3 Mechanistic aspects for formation of γ-valerolactone
Due to wide range of potential GVL applications, numerous reactions have been
checked for an efficient production of GVL and investigation of the mechanism.
Thus the understanding of the mechanism for the formation of GVL from LA over
heterogeneous catalysts is relatively mature.

30
Figure 1.14 Reaction pathways for conversion of levulinic acid to γ-valeroclatone.
Numeric values indicate ∆G0 (∆H0) in KJ/mol at 523 K. All the data were cited from references [3], [82] and [85].
It was proposed that the first step during hydrogenation reaction is chemisorption of
molecular hydrogen and liquid levulinic acid on the metal support.130 Two endergonic
reaction pathways are discussed in literature for GVL formation then, which depend
on the order of the hydrogenation and dehydration step (Figure 1.14).30, 140-142 The
first one assumes the formation of pseudolevulinic acid by an intramolecular addition
of the carboxyl on the carbonyl group in an equilibrium reaction. Pseudolevulinic acid
is then dehydrated to α-angelica lactone which is finally hydrogenated to GVL. The
second pathway starts with the hydrogenation of LA to 4-hydroxypentanoic acid.
Then simple lactonization gives of GVL. Which of these pathways occurs preferen-
tially is certainly a function of the used solvent (water free conditions favour route 1)
and the present hydrogen pressure (high values favor route 2). As a side reaction,
water elimination of 4-hydroxypentanoic acid to penteonic acid occurs which tends to
form pentanoic acid under these hydrogen rich reaction conditions.143, 144
1.7 Potential derivatives from γ-valerolactone
Consecutive reactions of GVL are mainly based on ring opening (Figure 1.15).143, 98, 99
For example, the above mentioned pentenoic acid can undergo decarboxylation to
produce a mixture of butenes or can be hydrogenated to produce pentanoic acid.
Pentanoic acid itself is sensitive towards ketonization into 5-nonanone and carbon
dioxide as a co-product.145-147

31
Figure 1.15 The potential derivatives from the conversion of GVL.143, 146
Dumesic and coworkers143, 146 investigated the thermodynamics of these carbon
dioxide releasing reactions, which have large negative Gibbs energies. Consequently,
the production of 2-butanone from levulinic acid (∆Go = −117 kJ mol−1), the
formation of butenes from pentenoic acid (∆Go = −123 kJ mol−1) and the ketonization
of two molecules of pentanoic acid to form 5-nonanone (∆Go = −65 kJ mol−1) are
processes which are thermodynamically favored at 523 K.143, 146, 147 The
decarboxylation reactions are also exothermic, and although this usually implies that
they should be more favored at lower temperatures, the large change in free energy
renders these reactions essentially irreversible. Ketonization is an endothermic
reaction (∆Ho = 14 kJ mol−1) that takes place at higher temperatures.147, 148
In the Cluster of Excellence ˝Tailor-Made Fuel from Biomass (TMFB)˝, Leitner
and coworkers 98 have developed a multifunctional homogeneous catalysis system
(composed of Ru based organic metal precursor Ru(acac)3, ligands and acidic
additives) for highly selective and flexible catalytic conversions of levulinic acid to
yield quantitative GVL at 100 bars H2 and 160 oC in an stainless steel high pressure
reactor. Later, they employed a density functional theory (DFT) study and
corroborated with experimental data from catalytic processes and NMR investigations.
They found a common mechanistic pathway for the reduction of the C=O
functionality in aldehydes, ketones, lactones, and even free carboxylic acids could be
identified for [Ru(TriPhos)H]+ as the catalytically active unit. They proposed hydride
transfer from the Ru-H group to the carbonyl or carboxyl carbon is followed by
protonation of the resulting Ru-O unit via σ-bond metathesis from a coordinated
dihydrogen molecule.99 This finding greatly promoted our understanding of the
32
hydrogenation mechanism and further better rational to design the transformation of
other biomass-derived monomers---aldehydes, ketones, lactones.
1.8 Preparation of nano-catalyst by chemical fluid deposition
1.8.1 Supercritical fluids
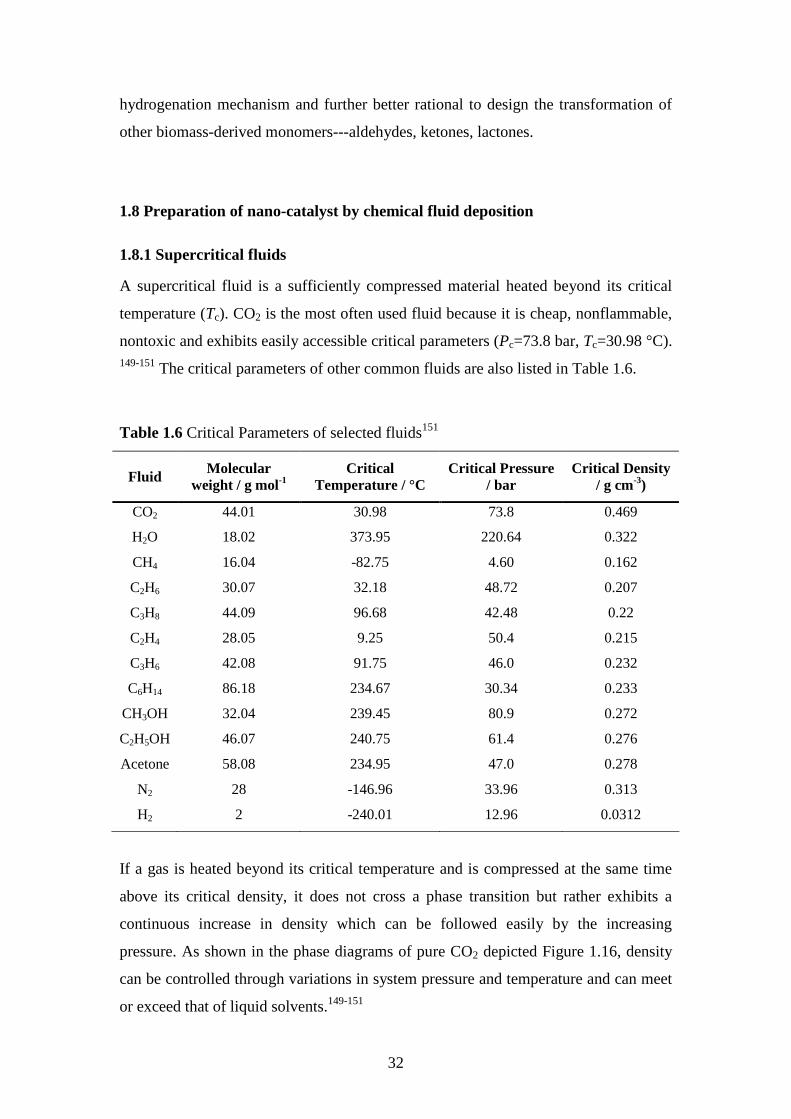
A supercritical fluid is a sufficiently compressed material heated beyond its critical
temperature (Tc). CO2 is the most often used fluid because it is cheap, nonflammable,
nontoxic and exhibits easily accessible critical parameters (Pc=73.8 bar, Tc=30.98 °C).
149-151 The critical parameters of other common fluids are also listed in Table 1.6.
Table 1.6 Critical Parameters of selected fluids151
Fluid Molecular weight / g mol-1
Critical Temperature / °C
Critical Pressure / bar
Critical Density / g cm-3)
CO2 44.01 30.98 73.8 0.469
H2O 18.02 373.95 220.64 0.322
CH4 16.04 -82.75 4.60 0.162
C2H6 30.07 32.18 48.72 0.207
C3H8 44.09 96.68 42.48 0.22
C2H4 28.05 9.25 50.4 0.215
C3H6 42.08 91.75 46.0 0.232
C6H14 86.18 234.67 30.34 0.233
CH3OH 32.04 239.45 80.9 0.272
C2H5OH 46.07 240.75 61.4 0.276
Acetone 58.08 234.95 47.0 0.278
N2 28 -146.96 33.96 0.313
H2 2 -240.01 12.96 0.0312
If a gas is heated beyond its critical temperature and is compressed at the same time
above its critical density, it does not cross a phase transition but rather exhibits a
continuous increase in density which can be followed easily by the increasing
pressure. As shown in the phase diagrams of pure CO2 depicted Figure 1.16, density
can be controlled through variations in system pressure and temperature and can meet
or exceed that of liquid solvents.149-151

33
Figure 1.16 Selected property of CO2 phase diagram: (a) CO2 pressure-temperature
phase diagram; (b) CO2 density-pressure phase diagram.151, 152
In comparison, a continuously compressed gas phase below its critical
temperature (called vapor phase) will condense at its vapor pressure yielding a
coexisting liquid phase. Further vapor addition would not result in a pressure rise until
the complete reactor is filled with a liquid. If the coexisting gas-liquid phase system is
heated, the transition into a homogeneous supercritical phase will occur at Tc as
shown in Figure 1.16.
Figure 1.16 Phase transition of the coexisting gas-liquid phase (shown left) to the
supercritical CO2 phase (on the right) by heating. The yellow color
originated from dissolved ferrocene. The figure of phase transition
was from reference No. 153.
Most physicochemical properties in supercritical fluids (SCF) are highly pressure-
dependent. For example viscosity or heat capacity differs substantially if a fluid
density of 0.5 g/mL or 0.8 g/mL is applied. Quite often, values are observed which are

34
between those of the liquid and gaseous states (Table 1.7). At temperatures above the
critical point, surface tension of the previous liquid phase vanishes. The combination
of liquid- and gas-like properties enables solution-based chemistry and processing in a
supercritical medium that behaves much like a gas.
Table1.7 Comparison of the selected properties of gases, liquids and supercritical fluids (SCF) 150, 151
Type Density / kg m-3
Viscosity / Pa·s
Diffusivity / cm2 s-1
Surface Tension / dyn cm-1
Gas 10-3 10-5 10-1 0
Liquid 1 10-3 10-5 20-50
SCF 0.1-1 10-4-10-5 10-3 0
Liquid-like densities enable the dissolution of many organic and organometallic
compounds in SCF that can serve as precursors and reagents for subsequent
processing steps. For example, Figure 1.18 shows the solubility of nickelocene in
scCO2 at three temperatures as a function of density.154
Figure 1.18 Solubility of nickelocene in scCO2 as a function of pressure154
Supercritical carbon dioxide (scCO2) has been proven to offer a number of interesting
opportunities as a medium for performing various catalytic reactions.151, 152 Particu-
larly, its great miscibility with gaseous reagents as well as organic compounds has led

35
to exceedingly high-speed reaction rates that are hardly achievable in conventional
liquid solvents due to inherent gas-liquid mass transport limitations.
1.8.2 Preparation of nanostructured catalysts using chemical fluid deposition
Metal deposition is of considerable interest due to its wide application. The
advantages of chemical fluid deposition (CFD) over most conventional deposition
techniques are due to the unique properties of the supercritical fluids, where involve
the chemical reduction of organometallic compounds inside to yield high purity
deposits.154 Deposition can be carried out within the smallest features avoiding (i)
damage otherwise arising from capillary forces, (ii) concerns about residual solvent
contamination, or (ii) limitations to wetting or flow in confined geometries. Moreover,
transport in supercritical solution eliminates limitations of precursor and reagent
volatility that often prove to be prohibitive in vapor-phase processes. CFD can be
viewed as a hybrid of solution plating and vapor phase techniques.154, 155
The pioneering CFD-studies by Watkins were dedicated towards the formation of
metallic films on supports.154, 156-163 The process involves the dissolution of a metallic
precursor in a supercritical fluid, its sorption onto a support and the conversion to
metal ensembles by reduction. Typically, the reaction is initiated upon the addition of
H2 or other reducing agent. The approach has been used to prepare a wide variety of
metallic films including Pt, Pd, Ru and Rh on various types of supports.163-171
Representative studies from literatures and patents are summarized in Table 1.8
Table 1.8 Summary of representative CFD-studies from literaturea.
Film Precursor Reactant Solvent Deposition T / °C Substrate Ref.
Pd Pd(tmhd)2 ----- Pentane 600 Si, SiO2 168
Pd Pd(hfac)2 H2 CO2 60-80 TiW, Al2O3 156, 169
Pd Pd(hfac)2 H2 CO2 60-80 polyimide 156, 169
Pd CpPd(η3-C4H7) H2 CO2 40-60 Al 2O3,
polyimide 156, 169
Pd CpPd(η3-C3H5) H2 CO2 60 Si, Al2O3, polyimide
156-158
Pt (cod)Pt(Me)2 H2 CO2 60-80 Si, Al2O3 157, 162

36
Pd Pd(hfac)2 H2 CO2 75 (im), 250 (re)
γ- Al2O3 172
Pd Pd(hfac)2 H2 CO2 28.5 (im),
75 (re)
γ- Al2O3
α- Al2O3 173
Pd Pd(hfac)2 H2 CO2 45-150 γ- Al2O3
α- Al2O3 174
Pd Pd(hfac)2 H2 CO2 45-150 SiOx 174
Pd Pd(hfac)2 H2 CO2 40 SBA-15 175
Pd Pd(hfac)2 H2 CO2 N.D. CNT 176
Pd* Pd(acac)2 H2 CO2 200 MCM-41 177
Pt-Cu Pt(acac)2, Cu(hfa)2
H2 CO2 200 MCNT 176
Pt-Ru Pt(acac)2,
Ru(acac)3 H2 CO2 200 MCNT 176
Pt-Au,
Pt(acac)2
AuMe2(acac) H2 CO2 200 MCNT 176
Pt-Pd Pt(acac)2
Pd(hfac)2 H2 CO2 200 MCNT 176
Pt-Ni Ni(hfa)2 H2 CO2 200 MCNT 176
Pt Pt(acac)2 H2 CO2 200 MCNT 176
Pt Pt(acac)2 H2 CO2 400 SiO2 165
Pt (cod)Pt(Me)2 H2 CO2 80 (im), 300(re)
carbon aero gel,
166
Pt (cod)Pt(Me)2 H2 CO2 80 (im), 200(re)
carbon black
166
Pt (cod)Pt(Me)2 H2 CO2 80 (im), 300(re)
silica 166
Pt (cod)Pt(Me)2 H2 CO2 80 (im), 300(re)
γ- Al2O3 166
Pt (cod)Pt(Me)2 H2 CO2 80 (im), 200(re)
Nafion 112 film
166
Pt (cod)Pt(Me)2 H2 CO2 60-80 polyimide,
SiO2 170
Ru Ru(acac)3 H2 CO2 300 -1000 Carbon 167
Ru Ru(cod)(tmhd)2 H2 CO2 300 -1000 Carbon 167
Ru Ru(acac)3 H2 CO2 200 MCM-41 177
Rh Rh(acac)3 H2 CO2 200 MCM-41 177
Ru-Rh Ru(acac)3
Rh(acac)3 H2 CO2 200 MCM-41 177

37
Ru-Pd Ru(acac)3
Pd(acac)2 H2 CO2 200 MCM-41 177
Rh-Pd Rh(acac)3
Pd(acac)2 H2 CO2 200 MCM-41 177
Ru RuCp2 H2 CO2 250-350 Si, Au, TiN 160, 171
Ru [Ru(CO)2 Cp]2 H2 CO2 225-300 Si 160
Ru Ru3(CO)12 H2 CO2 175-300 Si, Ta 160
Ru Ru(tmhd)3 H2 CO2 175-250 Si 160
Ru Ru(tmhd)2 (cod) H2 CO2 200-300 Si, Ta 160
Cu Cu(tmhd)2 EtOH CO2 270-300 Co, TaN 157
Cu Cu(tmhd)2 EtOH CO2 270-300 TiN, Ni 157
Cu Cu(tmhd)2 EtOH CO2 270-300 SiO2 157
Cu Cu(tmhd)2 H2 CO2 300 TaN 157
Cu Cu(tmhd)2 BuOH CO2 270 Co 157
Cu Cu(tmhd)2 MeOH CO2 270 Co 157
Cu Cu(tmhd)2 PrOH CO2 270 Co 157
Cu Cu(hfac)2 H2 CO2 180-400 TiN, Ru 158, 183
Cu Cu(hfac)2 H2 CO2 180-400 Si, Au 158, 183
Cu Cu(hfac)2 H2 CO2 180-400 TiN, TaN, 179, 180
Cu Cu(hfac)2 H2 CO2 180-400 WN 179, 180
Cu Cu(dibm)2 H2 CO2 200-280 TiN, TaN 173, 181
Cu Cu(tmod)2 H2 CO2 220-270 TiN 182
Ni NiCp2 H2 CO2 130-200 Si, TaN, 158, 177
Ni NiCp2 H2 CO2 130-200 TiN, CNT 182
Ni Ni(tmhd)2 ---- Pentane 600 Si, SiO2 168
Rh (acac)Rh(cod) H2 CO2 60 Pd-
polyimide 157
Ag Ag(cod)(hfac) ----- Acetone 150-250 Ru, TaN,
TiN 184
Ag Ag triflate ----- Diethyl ether
600 Si, SiO2 168
Ag AgI ----- Acetone 600 Si, SiO2 168
Au (acac)Au(Me)2 H2 CO2 60-125 SiO2, Ni, 185
Au (acac)Au(Me)2 H2 CO2 60-125 Pd-Si, TiN 185
Au (acac)Au(Me)2 H2 CO2 60-125 Ni-Pd-
polyimide 185
Au (acac)Au(Me)2 H2 CO2 60-125 Pd-
Polyimide 185
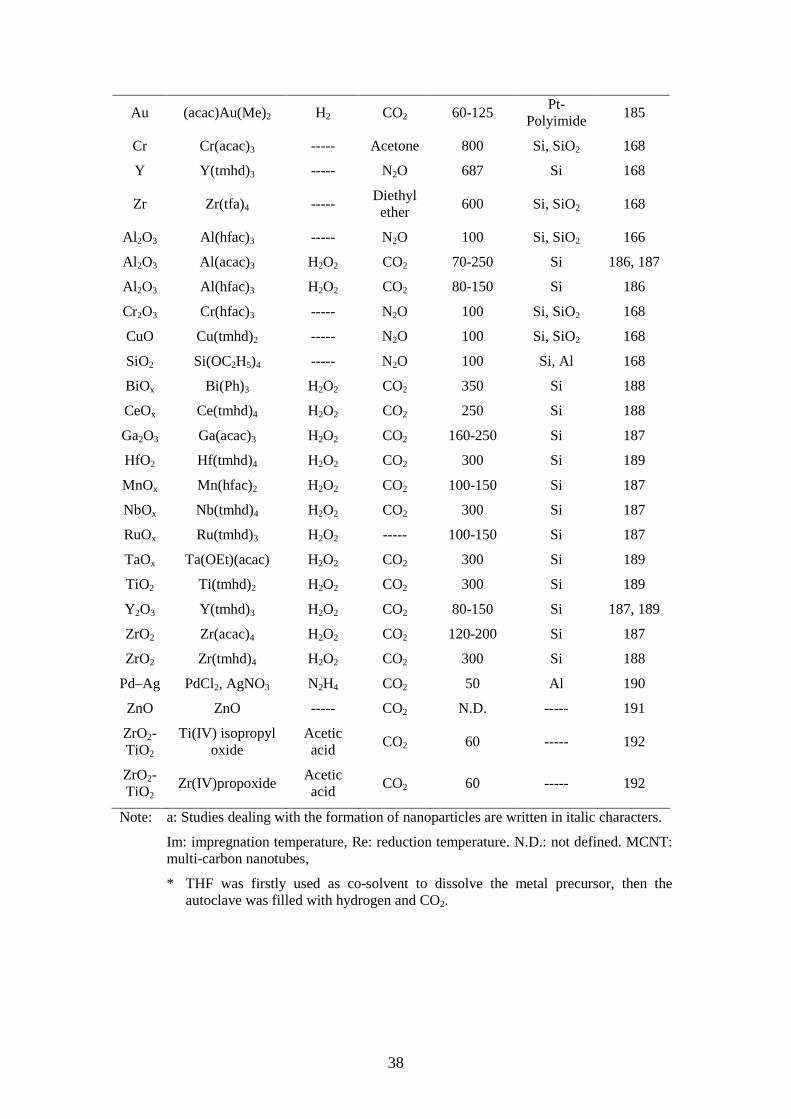
38
Au (acac)Au(Me)2 H2 CO2 60-125 Pt-
Polyimide 185
Cr Cr(acac)3 ----- Acetone 800 Si, SiO2 168
Y Y(tmhd)3 ----- N2O 687 Si 168
Zr Zr(tfa)4 ----- Diethyl ether
600 Si, SiO2 168
Al 2O3 Al(hfac)3 ----- N2O 100 Si, SiO2 166
Al 2O3 Al(acac)3 H2O2 CO2 70-250 Si 186, 187
Al 2O3 Al(hfac)3 H2O2 CO2 80-150 Si 186
Cr2O3 Cr(hfac)3 ----- N2O 100 Si, SiO2 168
CuO Cu(tmhd)2 ----- N2O 100 Si, SiO2 168
SiO2 Si(OC2H5)4 ----- N2O 100 Si, Al 168
BiOx Bi(Ph)3 H2O2 CO2 350 Si 188
CeOx Ce(tmhd)4 H2O2 CO2 250 Si 188
Ga2O3 Ga(acac)3 H2O2 CO2 160-250 Si 187
HfO2 Hf(tmhd)4 H2O2 CO2 300 Si 189
MnOx Mn(hfac)2 H2O2 CO2 100-150 Si 187
NbOx Nb(tmhd)4 H2O2 CO2 300 Si 187
RuOx Ru(tmhd)3 H2O2 ----- 100-150 Si 187
TaOx Ta(OEt)(acac) H2O2 CO2 300 Si 189
TiO2 Ti(tmhd)2 H2O2 CO2 300 Si 189
Y2O3 Y(tmhd)3 H2O2 CO2 80-150 Si 187, 189
ZrO2 Zr(acac)4 H2O2 CO2 120-200 Si 187
ZrO2 Zr(tmhd)4 H2O2 CO2 300 Si 188
Pd–Ag PdCl2, AgNO3 N2H4 CO2 50 Al 190
ZnO ZnO ----- CO2 N.D. ----- 191
ZrO2-TiO2
Ti(IV) isopropyl oxide
Acetic acid
CO2 60 ----- 192
ZrO2-TiO2
Zr(IV)propoxide Acetic acid
CO2 60 ----- 192
Note: a: Studies dealing with the formation of nanoparticles are written in italic characters.
Im: impregnation temperature, Re: reduction temperature. N.D.: not defined. MCNT: multi-carbon nanotubes,
* THF was firstly used as co-solvent to dissolve the metal precursor, then the autoclave was filled with hydrogen and CO2.
39
1.9 Description and acknowledgement of the interdisciplinary collaborative
interactions during the preparation of thesis
The current work is part of a project named “Synthesis of Nanocatalysts by Chemical
Fluid Deposition” in the Cluster of Excellence “Tailor-made Fuels from Biomass”.
Beyond my supervisors, several people contributed substantially to some parts of the
presented work which are listed in the following:
(1) Dr. Rainer Weiß worked in this project from 01/2008 to 03/2009. Our
collaboration lasted from 10/2008 to 03/2009. The catalyst design, preparation
and part of the characterization work in Chapter 3 were mainly done by him
during this period. After he left our group (03/2009), the catalysts synthesis
was partly reproduced by me.
(2) Mr. Fei Qin worked in this project from 10/2008 to 10/2010. During this
period, all used catalysts in sugar dehydration (chapter 4 and 5) and
hydrogenation of levulinic acid (chapter 6) were prepared by him, including
SBA-15 and Pd precursor synthesis. The characterization of fresh catalysts
and the reduction of spent catalysts were done by him as well. From 10/2010
to 7/2011 the catalysts described in Chapter 5 and 6 were partly repeated by
me. Different mesoporous and microporous supports, such as MCM-41, HY
and their corresponding supported metal catalysts, were prepared by me. The
analysis of the catalytic reactions by DOE was done by Dr. Nils Theyssen.
(3) Mrs. Susanna Früh worked for 6 weeks in this project. She mainly
contributed in the dehydration of D-glucose (Chapter 5) using metal and salt
catalysts. The reactions were partly done by her.
(4) The analysis of LA hydrogenation reactions were done by our GC and MS
department and were mainly operated by Mrs. Corinna Heigen. The analysis
of the sugar dehydration reactions were done by Mrs. Heike Hinrichs from
our HPLC-department.

40
1.10 References
1. A. J. Ragauskas, C. K. Williams, B. H. Davison, G. Britovsek, J. Cairney, C. A. Eckert, W. J. Frederick, Jr., J. P. Hallett, D. J. Leak, C. L. Liotta, J. R. Mielenz, R. Murphy, R. Templer, T. Tschaplinski, Science, 311 (2006) 484.
2. J. N. Chheda, J. A. Dumesic, Catal. Today, 123 (2007) 59.
3. J. C. Serrano-Ruiz, R.M. West, J.A. Dumesic, Annu. Rev. Chem. Bio. Eng., 1 (2010) 79.
4. U.S. Dep. Energy. 2002. Roadmap for biomass technologies in the United States. http://www.brdisolutions.com/pdfs/FinalBiomassRoadmap.pdf
5. Directive 2003/30/EC Eur. Union Parliament., Off. J. Eur. Union. 2003. http://ec.europa.eu/energy/res/legislation/doc/biofuels/en_final.pdf
6. European Biofuel Technology Platform: http://www.biofuelstp.eu/fuelproduction.html
7. J. F. Tolan in Biorefineries — Industrial Processes and Products. Status Quo and Future Directions (B. Kamm, P. R. Gruber, M. Kamm (Eds.)), Wiley-VCH, Weinheim, 2006, p. 193 – 207.
8. Link: http://en.wikipedia.org/wiki/Biomass
9. A. Corma, S. Iborra, A. Velty, Chem. Rev., 107 (2007) 2411.
10. G. W. Huber, S. Iborra, A. Corma, Chem. Rev., 106 (2006) 4044.
11. T. A. Hsu, M. R. Ladisch, G. T. Tsao, Chem. Technol., 10 (1980) 315.
12. http://en.wikipedia.org/wiki/Cellulose
http://en.wikipedia.org/wiki/File:Plant_cell_wall_diagram.svg
13. A. Carroll, C. Somerville, Annu. Rev. Plant Biol., 60 (2009) 165.
14. H. V. Scheller, P. Ulvskov, Annu. Rev. Plant Biol., 61 (2010) 263.
15. J. Zakzeski, P. C. A. Bruijnincx, A. L. Jongerius, B. M. Weckhuysen, Chem. Rev., 110 (2010) 3552.
16. F. S. Chakar, A. J. Ragauskas, Ind. Crop. Prod., 20 (2004) 131.
17. S. K. Ritter, Chem. Eng. News, 46 (2008) 15.
18. M. Stöcker, Angew. Chem. Int. Ed., 47 (2008) 9200.
19. A. Sakakibari, Wood Sci. Technol., 14 (1980) 89.
20. M. Y. Balakshin, E. A. Capanema, H.M. Chang, In Characterization of Lignocellulosic Materials; T. Q. Hu (Eds.), Oxford, U.K., 2008, p 148.
21. D. J. Nowakowski, A. V. Bridgwater, D. C. Elliott, D. Meier, P. de Wild, J. Anal. Appl. Pyrol., 88 (2010) 53.
22. National Renewable Energy Laboratory (NREL): http://www.nrel.gov/biomass/biorefinery.html
23. a) Cluster of Excellence, Tailor-Made Fuel from Biomass, three years Report 2008, 2009, 2010, RWTH Aachen, Germany. b) W. Leitner, in Die Zukunft der Energie (Eds.: P. Gruss, F. Schüth), C. H. Beck, München, 2008, pp. 190 – 211;

41
24. T. A. Werpy, J. E. Holladay, J. F. White. 2004. Top Value Added Chemicals From Biomass: I. Results of Screening for Potential Candidates from Sugars and Synthesis Gas. US Department of Energy.
http://www.eere.energy.gov/biomass/pdfs/35523.pdf.
25. B. V. Timokhin, V. A. Baransky, G. D. Eliseeva, Russ. Chem. Rev., 68 (1999) 73.
26. J. Jow, G. L. Rorrer, M. C. Hawley, D. T. A. Lamport, Biomass, 14 (1987) 185.
27. B. F. M. Kuster, Starch – Stärke, 42 (1990) 314.
28. C. Moreau, R. Durand, S. Razigade, J. Duhamet, P. Faugeras, P. Rivalier, P. Ros, G. Avignon, Appl. Catal. A 145 (1996) 211.
29. C. Sievers, I. Musin, T. Marzialetti, M. B. V. Olarte, P. K. Agrawal, C.W. Jones, ChemSusChem, 2 (2009) 665.
30. B. Girisuta, L. Janssen, H. J. Heeres, Chem. Eng. Res. Des., 84 (2006) 339.
31. Y. R. Leshkov, J. A. Dumesic. Top. Catal., 52 (2009) 297.
32. X. H. Qi, M. Watanabe, T. M. Aida, R. L. Smith, Green Chem., 10 (2008) 799.
33. R. Rinaldi, N. Meine, J. Stein, R. Palkovits, F. Schüth, ChemSusChem, 3 (2010) 266.
34. X. Tong, Y. D. Li, ChemSusChem, 3 (2010) 350.
35. G. J. Mulder, J. Prakt. Chem., 21 (1840) 219.
36. Q. Fang, M. A. Hanna, Bioresource Technol., 81 (2002) 187.
37. B. Girisuta, L. P. B. M. Janssen, H. J. Heeres, Ind. Eng. Chem. Res., 46 (2007) 1696.
38. H. Mehdi, V. Fábos, R. Tuba, A. Bodor, L. T. Mika I. T. Horváth, Top. Catal., 48 (2008) 49.
39. M. Mascal, E. B. Nikitin, Green Chem., 12 (2010) 370.
40. Y. Takeuchi, F. Jin, K. Tohji, H. Enomoto, J. Mater. Science, 43 (2008) 2472.
41. L. C. Peng, L. Lin, J. H. Zhang, J. P. Zhuang, B. X. Zhang, Y. Gong, Molecules, 15 (2010) 5258.
42. J. Hegner, K. C. Pereira, B. DeBoef, B. L. Lucht, Tetrahedron Lett., 51 (2010) 2356.
43. M. Mascal, E. B. Nikitin. ChemSusChem, 2 (2009) 859.
44. P. P. T. Sah, S.-Y. Ma, J. Am. Chem. Soc., 52 (1930) 4880.
45. R. W. Thomas, H. A. Schuette, J. Am. Chem. Soc., 53 (1931) 2324.
46. B. C. Redmon, Process for the production of levulinic acid, US Patent 2,738,367, 1956.
47. S. McKibbins, J. F. Harris, J. F. Saeman, W. K. Neill, Forest Prod. J. 12 (1962) 17.
48. L. J. Carlson, Process for the manufactures of levulinic acid, US patent 3, 065, 263, 1962.
49. K. Lourvanij, G. L.Rorrer, Appl. Catal. A 109 (1994) 147.
50. K. Lourvanij, G. L. Rorrer, J. Chem. Technol. Biotechnol., 69 (1997) 35.
51. W. Zeng, D. G. Cheng, H. Zhang, F. Q. Chen, X. L. Zhan, React. Kinet. Mech. Catal., 100 (2010) 377.
52. C. Chang, X. J. Ma, P. L.Cen, Chinese J. Chem. Eng., 14 (2006) 708.
53. J. Jow, G. L. Rorrer, M. C. Hawley, D. T. A. Lamport, Biomass 14 (1987) 185.
54. L. Deng, J. Li, D.-M. Lai, Y. Fu, Q.-X. Guo, Angew. Chem. Int. Ed., 48 (2009) 6529.

42
55. V. E. Tarabanko, M. Yu, S. V. Aralova, B. N. Kuznetsov, React. Kinet. Catal. Lett., 75 (2002) 117.
56. M. Kröger, U. Prüße, K.-D. Vorlop, Top. Catal., 13 (2000) 237.
57. F. S. Asghari, H. Yoshida, Ind. Eng. Chem. Res., 45 (2006) 2163.
58. W. Zeng, D-G. Cheng, F. Q. Chen, X. L. Zhan, Catal. Lett., 133 (2009) 221.
59. Q. Zhao, L. Wang, S. Zhao, X. H. Wang, S. T. Wang, Fuel, 90 (2011) 2289
60. X. H. Qi, M. Watanabe, T. M. Aida, R. L. Smith, Catal. Commun., 9 (2008) 2244.
61. B. Girisuta, B. Danon, R. Manurung, L. P. B. M. Janssen, H. J. Heeres, Bioresource Technol., 99 (2008) 8367.
62. J. C. Serrano-Ruiz, D. J. Braden, R. M. West, J. A. Dumesic, Appl. Catal. B. 100 (2010) 184.
63. F. Chambon, F. Rataboul, C. Pinel, A. Cabiac, E. Guillon, N. Essayem, Appl. Catal., B 105 (2011) 171.
64. J. S. Liang, L. J. Wang, Adv. Mater. Res., 96 (2010) 183.
65. H. Z. Chen, B. Yu, S. Y. Jin, Bioresour. Technol., 102 (2011) 3568.
66. J. Y. Cha, M. A. Hanna, Ind. Crops Prod., 16 (2002) 109.
67. C. Chang, P. Cen, X. Ma, Bioresour. Technol., 98 (2007) 1448.
68. G. T. Jeong, D. H. Park, Appl. Biochem. Biotechnol., 161 (2010) 41.
69. A. Takagaki, M. Ohara, S. Nishimura, K. Ebitani, Chem. Commun., 2009, 6276.
70. T. Armaroli, G. Busca, C. Carlini, M. Giuttari, A.M. Raspolli Galletti, G. Sbrana, J. Mol. Catal. A151 (2000) 233.
71. S. Lima, M. M. Antunes, A. Fernandes, M. Pillinger, M. F. Ribeiro, A. A. Valente, Molecules, 15 ( 2010) 3863.
72. F. S. Asghari, H. Yoshida, Ind. Eng. Chem. Res., 46 (2007) 7703.
73. F. S. Asghari, H. Yoshida, Carbohydr. Res., 341 (2006) 2379.
74. A. J. Crisci, M. H. Tucker, J. A. Dumesic, S. L. Scott, Top. Catal., 53 (2010) 1185.
75. F. Ilgen, D. Ott, D. Kralisch, C. Reil, A. Palmberger, B. König, Green Chem., 11 (2009) 1948.
76. S. Q. Hu, Z. F. Zhang, Y. X. Zhou, B. X. Han, H. L. Fan, W. J. Li, J. L. Song, Y. Xie, Green Chem., 10 (2008) 1280.
77. C. Lansalot-Matras, C. Moreau, Catal. Commun., 4 (2003) 517.
78. M. Bicker, J. Hirth. H. Vogel, Green Chem., 5 (2003) 280.
79. H. Zhao, J. E. Holladay, H. Brown, Z. C. Zhang, Science, 316 (2007) 1597.
80. K. Shimizu, R. Uozumi, A. Satsuma, Catal. Commun., 10 (2009) 1849.
81. Q. X. Bao, K. Qiao, D. Tomida. Chem. Lett., 39 (2010) 728.
82. X. L. Tong, Y. Ma, Y. D. Li , Carbohydr. Res., 345 (2010) 1698.
83. G. Yong, Y. Zhang, J. Y. Ying, Angew. Chem. Int. Ed., 47 (2008) 9345.
84. X. H. Qi, M. Watanabe, T. M. Aida, R. L., Jr. Smith, ChemSusChem, 2 (2009) 944.
85. C. Moreau, A. Finiels, L. Vanoye, J. Mol. Catal. A, 253 (2006) 165.
86. J. B. Binder, R. T. Raines, J. Am. Chem. Soc., 131 (2009) 1979.

43
87. S. Lima, P. Neves, M. M. Antunes, M. Pillinger, N. Ignatyev, A. A. Valente, Appl. Catal. A, 363 (2009) 93.
88. C. Li, Z. Zhang, Z. K. Zhao, Tetrahedron Lett., 50 (2009) 5403.
89. T. Stählberg, M. G. Sørensen, A. Riisager, Green Chem., 12 (2010) 321.
90. S. Hu, Z. Zhang, J. Song, X. Zhou, B. X. Han, Green Chem., 11 (2009) 1746.
91. Z. Zhang, Z. K.Zhao, Bioresour. Technol., 101 (2010) 1111.
92. A. S. Amarasekara, L. D. Williams, C. C. Ebede, Carbohydr. Res., 343 (2008) 3021.
93. M. J. Antal, W. S. L. Mok, G. N. Richards, Carbohydr. Res., 199 (1990) 91.
94. M. Otsuka, Y. Hirose, T. Kinoshita, T. Masawa, Manufacture of levulinic acid.
US patent 37552849 (1973).
95. D. W. Rackemann, W. O. S. Doherty, Biofuels, Bioprod. Bioref., 5 (2011) 198.
96. C. Moreau, R. Durand, J. Duhamet, P. Rivalier, J. Carbohydr. Chem., 16 (1997) 709.
97. J. Horvat, B. Klaic, B. Metelko, V. Sunjic, Tetrahedron Lett., 26 (1985) 2111.
98. F. M. A. Geilen, B. Engendahl, A. Harwardt, W. Marquardt, J. Klankermayer, W. Leitner, Angew. Chem. 2010, 122, 5642; Angew. Chem. Int. Ed., 49 (2010) 5510;
99. F. M. A. Geilen, B. Engendahl, M. Hölscher, J. Klankermayer, W. Leitner, J. Am. Chem. Soc., 133 (2011) 14349.
100. M. He, D.-Q. Zhou, H.-Li. Ge, M.-Y. Huang, Y.-Y. Jiang. Poly. Adv. Technology, 14 (2003) 273.
101. D. F. Aycock, Org. Proc. Res. Dev., 11 (2007) 156.
102. H. E. Hoydonckx, W. M. Van Rhijn, V. W. an Rhijn, D. E. De Vos, P. A. Jacobs, Furfural and Derivatives; Wiley-VCH Verlag GmbH & Co. KGaA, Weinheim, 2007. doi:10.1002/14356007.a12 119.pub2
103. http://www.osti.gov/bridge/servlets/purl/786842-Nt9Wvz/native/786842.pdf
104. M. Kitano, F. Tanimoto, M. Okabayashi, Chem. Economy & Eng. Rev., 7 (1975) 25.
105. Edwin S. Olson. Conversion or lignocellulose materials into chemcials and fuels,US Department of Energy. http://www.osti.gov/bridge/product.biblio.jsp?osti_id=786842
106. F. Feng, S. Donen, S. Selifonov, B. Mullen, Process for the preparation of alkyl levulinates, WO 2010102203, 2010.
107. R. H. Leonard, Ind. & Eng. Chem., 48 (1956) 1331.
108. W. S. Emerson, R. I. Langley, U.S. Patent 2,581,008, 1952.
109. E. S. Olson, M. R. Kjelden, A. J. Schlag, R. K. Sharma, Levulinate Esters from Biomass Wastes. In Chemicals and Materials from Renewable Resources; J. J. Bozell (Eds.); Amer. Chem. Soc., 2001: p 51.
110. S. I. Beale, Plant Physiology, 93 (1990) 1273.
111. http://en.wikipedia.org/wiki/Material_Safety_Data_Sheet
112. http://ntp.niehs.nih.gov/ntp/htdocs/Chem_Background/ExSumPdf/DiphenolicAcid.pdf
113. J. F. J. Dippy, S. R. C. Hughes, A. Rozanski, J. Chem. Soc., 1959, 2492.
114. T. Ohara, T. Sato, N. Shimizu, G. P. H. Schwind, O. Weiberg, K. Marten, H. Greim (eds.) “Acrylic Acid and Derivatives” in Ullmann's Encyclopedia of Industrial Chemistry 2003, Wiley-VCH, Weinheim. doi: 10.1002/14356007.a01_161.pub2
44
115. NNFCC Renewable Chemicals Factsheet: Succinic Acid: http://www.nnfcc.co.uk/publications/nnfcc-renewable-chemicals-factsheet-succinic-acid
116. http://en.wikipedia.org/wiki/Methylpyrrolidone
117. http://www2.basf.us/diols/bcdiolsnmp.html
118. Production of Organic Chemicals via Bioconversion: A Review of the Potential. Prepared for the US DOE’s Idaho Operations Office. S. A. Leeper, T. E. Ward, G. F. Andrews. EGG-2645, July 1991.
119. The Bioproducts Industry: Today and Tomorrow. Prepared for DOE’s Office of the Biomass Program by Energetics, Incorporated. M. Paster, J. Pellegrino, T. Carole. July, 2003 http://www.bioproducts-bioenergy.gov/default.asp.
120. Odor description: herbal, sweet, warm, cocoa, and woody, Good Sence Company, Parfumery Raw Materials Information Sheet, http://www.thegoodscentscompany.com/data/rw1024031.html.
121. I. T. Horváth, H. Mehdi, V. Fa´bos, L. Boda, L. T. Mika, Green Chem., 10 (2008) 238.
122. K. Nasirzadeh, D. Zimin, R. Neueder, W. Kunz, J. Chem. Eng. Data, 49 (2004) 607.
123. M. K. Kriihenbiihl, J. Gmehling, J. Chem. Eng. Data, 39 (1994) 759.
124. DOE, Alternative Fuel Transportation Program; P-series fuels (Proposed Rules), Federal Register, 1998, 63, 40202.
125. http://en.wikipedia.org/wiki/Octane_rating
126. L. E. Manzer, Appl. Catal. A. 272 (2004) 249.
127. R. A. Bourne, J. G. S., J. Ke, M. Poliakoff, Chem. Commun., 2007, 4632.
128. L. P. Kyrides, W. Groves, J. K. Craver, Process for the production of lactones; US Patent No. 2,368,366; 1945-01-30.
129. L. Deng, Y. Zhao, J. Li, Y. Fu, B. Liao, Q.-X. Guo, ChemSusChem, 3 (2010) 1172.
130. Z.-P. Yan, L. Lin, S. Liu, Energy & Fuels, 23 (2009) 3853.
131. D. Kopetzki, M. Antonietti, Green Chem., 12 (2010) 656.
132. H. A. Schuette, R. W. Thomas, J. Am. Chem. Soc., 52 (1930) 3010.
133. P. P. Upare, J-M. Lee, D. W. Hwang, S. B. Halligudi, Y. K. Hwang, J-S. Chang, J. Ind. Eng. Chem. Res., 17 (2011) 287.
134. K. Osakada, T. Ikariya, A.Yoshikawa, J. Organomet. Chem., 231 (1982) 79.
135. R. V. Jr. Christian, H. D. Brown, R. M. Hixon, J. Am. Chem. Soc., 69 (1947) 1961.
136. L. E. Manzer, K. W. Hutchenson, Production of 5-methyldihydro-furan-2-one from levulinic acid in supercritical media, US Patent No. 0254384A1; 2004
137. R. J. Haan, J. P. Lange, L. Petrus, C. J. Maria, P.H. Legal, Hydrogenation process for the conversion of a carboxylic acid or an ester having a carbonyl group, US Patent No. 0208183A1; 2007.
138. G. Braca, A. M. R. Galletti, G. Sbrana, J. Organom. Chem., 417 (1991) 41.
139. H. Heeres, R. Handana, C. N. Dai, C. B. Rasrendra, B. Girisuta, H. J. Heeres, Green Chem., 11 (2009) 1247
140. C. J. Barrett, J. N. Chheda, G. W. Huber, J. A. Dumesic, Appl. Catal. B 66 (2006) 111.
141. R. D. Cortright, M. Sanchez-Castillo, J. A. Dumesic, Appl. Catal. B 39 (2002) 353.

45
142. R. R. D. J. W. Shabaker, G. W. Huber, R. D. Cortright, J. A. Dumesic, J. Catal., 215 (2003) 2344.
143. D. M. A. Jesse Q. Bond, D. Wang, R. M. West, J. A. Dumesic, Science, 327 (2010) 1110.
144. V. Fábos, Ph D. Thesis, Eötvös Loránd University (Hungary) 2009.
145. M. Renz, Eur. J. Org. Chem., 6 (2005) 979.
146. J. Q. Bond, D. M. Alonso, R. M. West, J. A. Dumesic, Langmuir, 26 (2010) 16291.
147. J. C. Serrano-Ruiz, J. A. Dumesic. Green Chem., 11 (2009) 1101.
148. R. M. West, Renewable fuels and chemicals from biomass derived carbohydrates. Ph. D. thesis. Univ. Wis., Madison, 2009
149. A. I. Cooper, J. Mater. Chem., 10 (2000) 207.
150. Y. F. Zong, Ph.D. thesis, University of Massachusetts, 2005.
151. Handbook of Green Chemistry, Volume 4: Supercritical Fluids (eds. P. G. Jessop, W. Leitner, series editor: P. Anastas) Wiley-VCH, Weinheim, 2010, P31-75.
152. Multiphase Homogeneous Catalysis (eds. B. Cornils, W.A. Herrmann, D. Vogt, I. Horváth, H. Olivier-Bourbigon, W. Leitner, S. Mecking) Wiley-VCH, 2005, P630-643.
153. http://www.kofo.mpg.de/de/forschung/service-abteilungen/technikum
154. A. H. Romang, J. J. Watkins, Chem. Rev., 110 (2010) 459.
155. V. Cimpeanu, M. Kocevar, V. I. Parvulescu, W. Leitner, Angew. Chem. Int. Ed., 48 (2009) 1085.
156. J. M. Blackburn, D. P. Long, J. J. Watkins, Chem. Mater., 12 (2000) 2625.
157. A. Cabanas, X. Shan, J. J. Watkins, Chem. Mater., 15 (2003) 2910.
158. D. P. L. Jason M. Blackburn, A. Cabanas, J. J. Watkins, Science 291 (2001) 141.
159. D. P. Long, J. M. Blackburn, J. J. Watkins, Adv. Mater., 12 (2000) 913.
160. A. O'Nei, J. J. Watkins, Chem. Mater., 18 (2006) 5652.
161. R. A. Pai, J. J. Watkins, Adv. Mater., 18 (2006) 241.
162. X. Shan, D. P. Schmidt, J. J. Watkins, J. Supercrit. Fluids, 40 (2007) 84.
163. J. J. Watkins, J. M. Blackburn, T. J. McCarthy, Chem. Mater., 11 (1999) 213.
164. F. Cansell, C. Aymonier, J. Supercrit. Fluids, 47 (2009) 508.
165. H. Wakayama, N. Setoyama, Y. Fukushima, Adv. Mater., 15 (2003) 742.
166. Y. Zhang, D. Kang, C. Saquing, M. Aindow, Can Erkey, Ind. Eng. Chem. Res., 44 (2005) 4161.
167. Y. Zhang, D. Kang, M. Aindow, C. Erkey, J. Phys. Chem. B 109 (2005) 2617.
168. B. N. Hansen, B. M. Hybertson, R. M. Barkley, R. E. Sievers, Chem. Mater., 4 (1992) 749.
169. N. E. Fernandes, S. M. Fisher, J. C. Poshusta, D. G.Vlachos, M. Tsapatsis, J. J. Watkins, Chem. Mater., 13 (2001) 2023.
170. C. S. Lin, F. L. Y. Lam, X. J. Hu, W. Y. Tam, K. M. Ng, J. Phys. Chem. C 112 (2008) 10068.
171. C. F. Karanikas, J. J. Watkins, Microelectron. Eng., 87 (2010) 566.

46
172. M. Jason Kelly, J. Kim, G. W. Roberts, H. Henry Lamb, Top. Catal., 49 (2008) 178.
173. J. Kim, M. Jason Kelly, H. H. Lamb, G. W. Roberts, D. J. Kiserow, J. Phys. Chem. C, 112 (2008) 10446.
174. J. Kim, G. W. Roberts, D. J. Kiserow, Chem. Mater., 18 (2006) 4710.
175. J. Morère, M. J. Tenorio, M. J. Torralvo, C. Pando, J. A. R. Renuncioa, A. Caba˜nas, J. Supercrit. Fluids 56 (2011) 213.
176. C. H. Yen, K. C. Shimizu, Y.-Y. Lin, F. Bailey, I. F. Cheng, Chien M. Wai., Energy & Fuels, 21 (2007) 2268.
177. C. H. Yen, H. W. Lin, T. D. Phan, C. S. Tan, J. Nanosci. Nanotechnol., 11(2011) 2465.
178. E. Kondoh, Jpn. J. Appl. Phys., Part 143 (2004) 3928.
179. E. Kondoh, J. Fukuda, In 8th International Symposium on Supercritical Fluids, Kyoto, Japan, 2006; p 466.
180. E. Kondoh, K. Shigama, Thin Solid Films., 491 (2005) 228.
181. M. Matsubara, M. Hirose, K. Tamai, Y. Shimogaki, E. Kondoh, J. Electrochem. Soc., 156 (2009) H443.
182. Y. F. Zong, J. J. Watkins, In 21st Advanced Metallization Conference (AMC 2004), San Diego, CA; (D. Erb, P. Ramm, K. Masu, A. Osaki (Eds.)) 2004: p 353.
183. Q. Peng, J. C. Spagnola, G. N. Parsons, J. Electrochem. Soc., 155 (2008) D580.
184. B. Zhao, T. Momose, T. Ohkubo, Y. Shimogaki, Microelectron. Eng., 85 (2008) 675.
185. A. Cabanas, D. P. Long, J. J. Watkins, Chem. Mater., 16 (2004) 2028.
186. T. Gougousi, D. Barua, E. D. Young, G. N. Parsons, Chem. Mater., 17 (2005) 5093.
187. Q. Peng, D. Hojo, K. J. Park, G. N. Parsons, Thin Solid Films, 516 (2008) 4997.
188. A. O’Neil, J. J. Watkins, Chem. Mater., 19 (2007) 5460.
189. T. Gougousi, Z. Y. Chen, Thin Solid Films, 516 (2008) 6197.
190. S. Abate, G. Centi, S. Perathoner, D.-S. Su, G. Weinberg, Appl. Catal. A 391 (2011) 158.
191. J. S. Park, D. W. Park, Surface Coat. Technol., 205 (2010) S79.
192. R. A. Lucky, Y. M. Gonzalez, P. A. Charpentier, Langmuir, 26 (2010) 19014.

47
Chapter 2 Experimental Section
2.1 Chemicals
All following chemicals were purchased from chemical companies and directly used
without any purification. Tetraethylorthosilicate (TEOS, 98+% pure, Sigma-Aldrich),
surfactant poly (ethylene glycol)-blockpoly (propylene glycol)-block-poly (ethylene
glycol) (EO20PO70EO20, Pluronic P123, Aldrich), hydrochloride acid (37-38%, J.T.
Baker), Hexane (97%, Sigma-Aldrich), Allylpalladium chloride dimmer (98% Sigma-
Aldrich), cyclopentadienylnatrium (98%, Sigma–Aldrich), (1,5-cyclooctadiene)-
dimethylplatinum(II) (97%, Sigma-Aldrich), absolute THF (99.9%, Sigma-Aldrich),
anhydrous ethylene glycol (99.8%, Sigma-Aldrich), absolute ethanol (99.9%, Sigma-
Aldrich), γ-valerolactone (GC grade, Sigma-Aldrich), Hexanol (GC grade, Sigma-
Aldrich), Neutral Al2O3 (Sigma-Aldrich), Acetone (99.9%, Sigma-Aldrich), D-
fructose (98%, Alfa-Aesar), Levulinic acid (98%, Alfa-Aesar), D-glucose (99%, Alfa-
Aesar), Na2CO3 (99%, Sigma-Aldrich), 5-hydroxymethylfurfural (HMF, >99%,
Sigma-Aldrich), furfural (98%, Alfa-Aesar), furfural alcohol (98%, Alfa-Aesar), 5-
nonanone (98%, Alfa-Aesar), 2-methyltetrahydrofuran (MTHF, 150-400 ppm water,
Alfa-Aesar), dichlormethane (99%, Riedel-delHäen), diemthylether (Lager), 1,4-
pentandiol (99%, Sigma-Aldrich), NaHCO3 (99%, Alfa-Aesar), AlCl3 (99%, Sigma-
Aldrich), CrCl3 (99%, Sigma-Aldrich), CuCl2 (99%, Sigma-Alrich), CaCl2 (99%,
Sigma-Aldrich), KCl (99%, Sigma-Aldrich), CaCl2 (99%, Sigma-Aldrich), CoCl2
(99%, Sigma-Aldrich), CO2 (purity >99.99%) and H2 (purity >99.99%) were supplied
by Air Liquid.
2.2 SBA-15 and AlSBA-15 synthesis
2.2.1 Preparation of SBA-15
29.35 g of Pluronic 123 were dissolved in 533 mL of water using a polypropylene
bottle (Sigma Aldrich, B8532). Subsequently, 16 g of concentrated HCl were added
to this solution. Except from further additions, the bottle was kept close. The mixture

48
was stirred at 35 °C over night, followed by addition of 57.9 g tetraethylorthosilicate
(TEOS) at 35 °C. The suspension was further stirred at this temperature for 24 h.
Then the stirring plate and the magnetic stirrer were removed and the closed bottle
was placed for 24 h in a drying oven at a temperature level of 90 °C. The solution was
separated with the help of a centrifuge and the remaining solid was washed with
100 mL of water two times using also a centrifuge for phase separation. Afterwards,
the sample was dried at 90 °C over night and calcinated in 10 g fractions at 550 °C for
8 h (heating rate 2 K / min).1-3
2.2.2 Preparation of AlSBA-15
AlSBA-15 with Si/Al ratio of 40 was synthesized as following: 1.08 g of SBA-15 was
dissolved in 100 mL pure ethanol under stirring. After 1 h, 0.07 g AlCl3 was added
into the solution and stirred for further 12 h. The obtained gel was filtrated, washed
with ethanol three times and dried in the oven at 80 °C for 12 h under air. Finally the
sample was calcined at 550 °C for 8 h (heating rate 2 K / min).4-6
2.3 MCM-41, AlMCM-41 and ZrMCM-41 Synthesis
2.3.1 MCM-41 synthesis
12.5 g hexadecyltrimethylammonium bromide (CTAB) were dissolved in 300 mL
water and stirred at 40 °C until a clear solution was obtained. After that, 30 mL TEOS
was added to the solution drop wise, followed by drop wise addition of 100 mL
NaOH (2 M). Then 1-2 mL H2SO4 (96%) was added to adjust the pH to 11. This
solution was transferred into polypropylene bottle (Sigma Aldrich, B8532) and heated
to 100 °C in an oven for 48 h (air environment). The obtained gel was washed for
three times with pure water, then separated by centrifugation and dried at 100 °C for
12 h. Finally, the white solid material was calcined at 550 °C for 12 h (heating rate 2
K / min).7, 8

49
2.3.2 AlMCM-41 synthesis
AlMCM-41 with a Si/Al molar ratio of 10 was synthesized as following: 2.50 g
MCM-41 were dissolved in 100 mL H2O under continuous stirring. After 1 h, 1.40 g
Al (NO3)3·9H2O was added to the solution which was stirred for another 12 h. The
obtained gel was filtrated, washed with ethanol three times and dried in the oven at 80
°C for 12 h (under air environment). Final calcination was performed at 550 °C for 8
h (heating rate 2 K / min).9-11
2.3.3 ZrMCM-41 synthesis
8.1 g CTAB were dissolved in 150 mL water and stirred at 40 °C until a clear solution
was obtained. After that, 20 mL TEOS and 7.5 mL Zirconium n-butyl oxide (20% in
80% butanol) were added into the solution drop wise, followed by drop wise addition
of 50 mL NaOH (2 M). Then, 1-2 mL H2SO4 (96%) was added to adjust the pH to 11.
This solution was then transferred into plastic bottles and heated to 100 °C in an oven
for 48 h (air environment). The obtained gel was washed for three times with pure
water, then separated by centrifugation and dried at 100 °C for 12 h. Finally, the white
solid material was calcined at 550 °C for 12 h (heating rate 2 K / min).12-14
2.4 HY synthesis
The sodium of Zeolite Na-Y (SiO2/Al 2O3-weight ratio = 3) was exchanged with an
aqueous solution of NH4Cl (1 M) at 80 °C for 4 h. The obtained zeolite NH4Y was
washed with distilled water. Subsequently, the powder material was dried in air at 353
K for 12 h and then calcined at 550 °C for 12 h (heating rate 2 K / min). 15-17
2.5 Synthesis of (cyclopentadienyl) allyl-palladium (II)
150 mL dry and deoxygenated THF and 3 mL cyclopentadienylnatrium (CpNa) were
mixed in a Schlenk flask under argon. 1.0 g allylpalladium chloride dimmer ([(η3-
C3H5)PdCl]2) was added into the Schlenk flask under argon and then the resulted
solution was stirred vigorously at room temperature for 3 h. The transparent solution
was stirred for 4 h at room temperature at which the color changed from brown to
dark red. After solvent removal in vacuum, dry and deoxygenated n-pentane

50
(containing 6 ppm water) was added. The obtained solution was filtered through a
celite pad to get rid of the un-dissolved impurities from solution. After the solvent was
removed in vacuum, (cyclopentadienyl) allyl-palladium (II) [CpPd(η3-C3H5)] was
obtained as a brown solid.18-24 This work was done by Mr. Fei Qin.24
Mass-spectrometry (Figure 2.1) and NMR-analysis was used to confirm the structure.
Figure 2.1 Mass spectroscopy of CpPd(η3-C3H5)
Figure 2.2 NMR analysis of CpPd(η3-C3H5). This work was done by Mr. Fei Qin.

51
The mass spectrometry analysis was operated under argon atmosphere. M/Z=147
(C3H5Pd); M/Z=171 (C5H5Pd); M/Z=212 (C3H3PdC5H5). The 1HNMR analysis was
operated 400 MHz and 25 °C using 0.01g substrate plus 0.6 mL CDCl3. The chemical
shift was ascribed as following: δ 2.29 (d, 3JH-H = 10.9 Hz, 2H, CH2), 3.67 (d, 3JH-H =
6.1 Hz, 2H, CH2), 4.95 (m, 1H, CH), 5.80 (s, 5H, C5H5).
2.6 Synthesis of Pd nanoparticle by a modified chemical fluid deposition
The Pd nanoparticles supported on SBA-15 catalyst was preparaed by a modified
chemical fluid deposition method through three steps (infiltration&sorption,
calcination and reduction). A detailed synthesis plan was described in Section 3.3 of
Chapter 3.
The resulted catalysts were characterized by the powder X-ray diffraction (XRD)
and transmission electron microscopy (TEM). The XRD patterns for qualitative phase
analysis were collected on a Stoe STADI P transmission diffract meter in transmission
geometry with a primary monochromatic curved germanium (111) and a linear
position sensitive detector, with CuKα1: 1.54060 Å as a radiation source. The data of
the resulting SBA-15 series (SBA-15 and AlSBA-15) were collected in the range of
0–6° 2θ with a step width of 0.01°/2θ. The data of the resulting MCM-41 series
(MCM-41, ZrMCM-41 and AlMCM-41) were collected in the range of 1–9° 2θ with a
step width of 0.01°/2θ. The data of the resulting Pd nanoparticles supported on SBA-
15 (Section 3.3 of Chapter 3) were collected in the range of 15–80° 2θ with a step
width of 0.02°/2θ. Transmission electron microscopy (TEM) was used to investigate
structural features of the catalysts with a Hitachi HF-2000 instrument. Elemental
chemical analysis for metal was carried out with inductively coupled plasma (ICP)
spectrometry (Australian. Labtam Co. Labtam 8410). The flow rate of gases was 10.5
Ln/min for the cooling one and 1.0 Ln/min for the carrier gas.
2.7 Homo- and bimetallic catalysts synthesis by chemical fluid deposition
The catalyst synthesis and performance analysis were done by design of expert (DOE,
used software: Design Expert 7.1) applying response surface plans with typically
seven factors.25-27 A detailed plan of catalyst synthesis was shown in 3.4 of Chapter 4.

52
A more detailed introduction for Design Expert Software could be found from its
handbook in reference No. 25.
The fresh and spent (after catalytic test reactions) catalysts were characterized by
XRD, X-Ray Photoelectron spectroscopy (XPS), energy-dispersive X-ray analysis
(EDX), Nitrogen sorption isotherms (N2-BET), Ammonia- temperature-programmed
desorption (NH3-TPD) and transmission electron microscopy (TEM).
The powder X-ray diffraction (XRD) patterns for qualitative phase analysis were
collected on a Stoe STADI P transmission diffract meter in transmission geometry
with a primary monochromatic curved germanium (111) and a linear position
sensitive detector, with MoKα1: 0.70930 Å as a radiation source (note that the XRD
radiation source is different from the one used in chaptert 2.6). The data were
collected in the range of 10–55° 2θ with a step width of 0.01°/2θ.
XPS measurements were performed with a Kratos HSi spectrometer with a
hemispherical analyzer and a monochromatized AlKα X-ray source (E = 1486.6 eV),
operated at 15 kV and 15 mA. For the narrow scans, analyzer pass energy of 40 eV
was applied. The hybrid mode was used as lens mode. The base pressure in the
analysis chamber was 6 × 10⁻¹⁰ Torr. To account for charging effects, all spectra are
referred to Si 2p at 103.45 eV.
Nitrogen adsorption data have been measured on an ASAP 2010 sorption
analyzer (Micromeritics) at 77 K. The samples have been activated under a vacuum of
0.01 mbar at 200 °C for 10 h prior to measurements. Data evaluation was performed
with the Autosorb 1.52 software package (Quantachrome). Pore size distributions
have been calculated with the NLDFT method using models for nitrogen adsorption
on silica with cylindrical pores at 77 K, both for the adsorption and desorption branch
of the isotherms. The external surface area, primary mesopore volume (Vp) and
micropore volume (Vmi) were evaluated using the Rs-plot method, as described
elsewhere.28-31 The mesopore size distribution (PSD) was calculated on the basis of
adsorption branches of nitrogen isotherms using the BJH method with the corrected
form of the Kelvin equation and the statistical film thickness curve. The primary
mesopore size, wKJS, was defined as a maximum on the PSD calculated using the
latter method.31

53
NH3-TPD experiments were carried out at the Ruhr-Universität Bochum (AK
Prof. Muhler) on chemisorption unit (Micromeritics; AutoChem II 2920) equipped
with a TCD detector. Prior to the adsorption of NH3, ca. 100 mg sample was first
preheated at 100 °C under flowing He for 0.5 h to remove undesirable physisorbed
species, followed by heating under He environment at 600 °C for 1 h, then cooled to
20 °C. Subsequently, the sample was exposed to flowing ammonia gas mixture (5 %
NH3 in He) for 1 h, then purged by He gas for 40 min to remove excessively
physisorbed ammonia. All NH3-TPD profiles were carried out by rising the
temperature from 100 to 600 °C at a rate of 10 °C /min.
TEM and EDX were used to investigate structural features of the catalysts with a
Hitachi HF-2000 instrument. The particle size was obtained using the Gatan Digital
Micrograph software. The basic steps for analyzing the particles are i) preparation of
the image for particle analysis, ii) particle separation using the ˝Magic Wand tool˝
which display the primary particles in different colors and iii) analyzis of chosen
particles in terms of area, perimeter or mean sizes. Scanning electron microscopy
(SEM) was obtained with Japanese JSM-6360 LV operating at an acceleration voltage
of 10 kV.
2.8 Selective dehydration of D-fructose and D-glucose
2.8.1 Dehydration procedure
The dehydration of D-fructose was generally performed in a 36 mL autoclave. In a
typical experiment, D-fructose (200 mg) was dissolved in deionised H2O (10 mL) or
pure ethanol (10 mL) followed by addition of catalyst (100 mg). After the autoclave
had been purged with argon, the autoclave was heated at an agitation speed of 1000
rpm. The start of the noted reaction time (1 h) was defined as the time at which the
reactor reached the desired temperature of 180 °C (after ~ 25 min). Afterwards the
autoclave was cooled to room temperature using an ice water bath.
For the analysis of dehydration of D-fructose in ethanol or water using the
catalysts of chapter 3, the reaction products were filtrated over neutral aluminum
oxide, and were then analyzed by liquid chromatography as shown in Figure 2.3
(Shimadzu LC10, column: organic acid resin, UV detector for analysis of furfural,

54
HMF, Levulinic acid, Formic acid and ELSD detector for analysis of sugar.). Here,
the absolute peak areas of reaction components were taken into account, which had
been calibrated before.
Figure 2.3 ELSD and UV detector analysis the desired products of dehydration
The conversion of D-fructose or D-glucose was calculated with the following
equation:
( )%100
0
0 ⋅−
=C
CCConversion i .
C0 is the concentration of D-fructose or D-glucose before and Ci is the concentration
of fructose after the reaction in mol/L. The yields of HMF and levulinic acid were
calculated then as follows:
( )( ) %100
0⋅=
substrateC
productCYield i
i
2.8.2 Sample analysis by HPLC
For analysis of the samples obtained in chapter 4, different work-up procedures to
avoid interference of insoluble fractions with the HPLC system were tested in the
beginning. They were evaluated by measuring the original sample vs. the treated
sample. First we checked a centrifugation procedure. As can be observed in Figure 2.4,
an unacceptable large discrepancy between the original (solid circles) and conditioned

55
fructose samples (outline circles) is observed in both directions: over- as well as
underestimation. To test the procedure further, samples were prepared using ethylene
glycol (EG) as internal standard and monitor a similar calibration curve as well. As
can be seen from the rectangle points, sufficient recovery rates were obtained for this
compound.
Figure 2.4 Recovery rates of fructose and ethylene glycol in the work-up procedure
applying centrifugation and filtration over Al2O3
Finally, ethylene glycol was added into reaction solution system to detect the stability
and the loss by centrifugation and filtration over neutral Al2O3. The results are
summarized in Table 2.1 (experiments YAK-YA-023-01 to -03). The recovery rates
of the original D-fructose after centrifugation and filtration lay between 88% and 67%,
those of ethylene glycol between 83% and 93%.
Instead of centrifugation and filtration over neutral Al2O3, a filtration through a
RC4 membrane was applied in the following experiments in which 20 mg ethylene
glycol were added to independent reaction mixtures of 1 mL volume (YAK-YA-023-
04 to -06). The recovery rates for the internal standard ranged between 90% and 97%,
which argued for the application of the RC 4 membrane filtration (Table 2.1).

56
Table 2.1 Recovery rates in different work-up procedures
Note: reaction conditions for experiments YAK-YA-023-04 to -06: 0.2 g D-fructose, 10 mL
ethanol, stirring speed= 1000 rpm, 0.1 g 5% Pd/SBA-15, T = 180 °C, t = 1 h
In order to identify a suitable ratio between the substrate (D-fructose) and the internal
standard (ethylene glycol) we performed different tests using different amounts of D-
fructose (Table 2.2, -03, -05, -07) and ethylene glycol (Table 2.2, -03, -07). Lower
amounts of D-fructose and ethylene glycol turned out to give unreliable results. Best
results were obtained if 25 mg of ethylene glycol were added to the product mixtures
based on a substrate loading of 200 mg D-fructose in 10 ml ethanol (Table 2.2, -03).
In general, the autoclave was quickly cool down by ice water with temperature
controller after reaction. 1 mL reaction products were taken and measured the weight,
and then a constant amount (around 20 µg) of ethylene glycol was added as internal
standard solvent and measured the total weight, followed by filtration using
membrane RC 4, measured the final weight and calculated the exact weight of
reaction mixture and ethylene glycol thereafter. The final samples were sent for
Liquid Chromatography analysis (Shimadzu LC10, column: organic acid resin, a

57
refractive index detector for analysis of sugars, sugar alcohols, Levulinic acid via long
column and UV detector for analysis of furfural, HMF, furfural acid, formic acid via
short column). More details about the analysis operation procedure were shown in
Figure 2.5 and 2.6.
Table 2.2 Results of variations in substrate and internal standard loading.
The analytical HPLC system applied for samples in chapter 4 is depicted in Figure 2.5
and described in the following: The sample is dosed with an autosampler into the
analytical line. There, it first passes a 6-port valve which directed the sample to a
short pre-column (acid resin, 50 x 8 mm), where the lipophilic product fraction, e.g.
humins, are separated. Sugars, acids and furfurals pass this column after 4 minutes
completely, whereas the lipohilic product fraction is backflushed from the column
afterwards by position change of the 6-position valve. Sugars, acids and furfurals are
separating already and for the following 4 min in a second, short column (acid resin,
100 x 8 mm). After a total time of 8 min the sugar fraction and the acids have already
passed the short column and are now separated further on a third long column (acid
resin 100 x 8 mm), whereas furfural, HMF, and furfural acid are still located on the
second column.
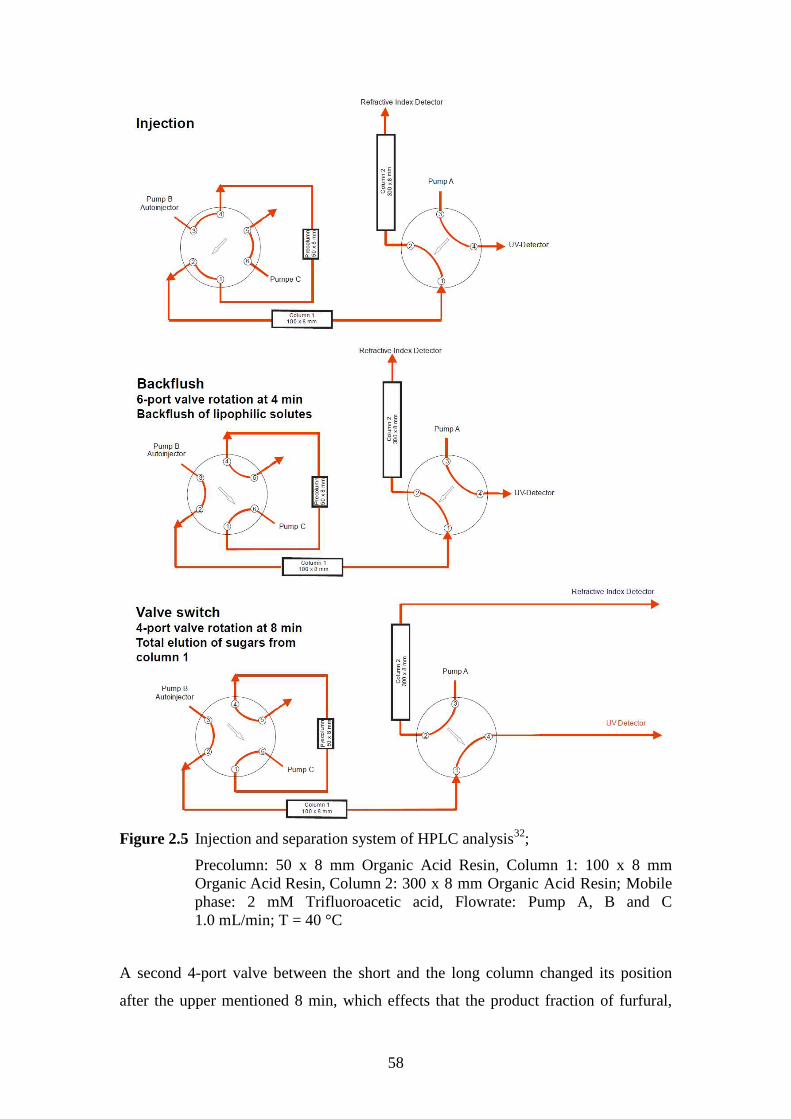
58
Figure 2.5 Injection and separation system of HPLC analysis32;
Precolumn: 50 x 8 mm Organic Acid Resin, Column 1: 100 x 8 mm Organic Acid Resin, Column 2: 300 x 8 mm Organic Acid Resin; Mobile phase: 2 mM Trifluoroacetic acid, Flowrate: Pump A, B and C 1.0 mL/min; T = 40 °C
A second 4-port valve between the short and the long column changed its position
after the upper mentioned 8 min, which effects that the product fraction of furfural,

59
HMF and furfural acid must only passes the second column and is the directly
analyzed with a UV detector at a wavelength of 270 nm. The eluents from the long
column (sugar fraction and the acids) are detected by a RI detector.
Typically obtained chromatograms with and without the column switching
procedure are depicted in Figure 2.6 illustrating an efficient methodology in terms of
separation quality and speed for the latter case. Analytical data of the substances are
given in Table 2.3.
Table 2.3 Overview of passed separation columns, applied detectors and retention times for most important compounds
Separated by acid resin columns Detected by Substance Pre Short long RI UV
tr / min
D-fructose ■ ■ ■ ■ 8.6
D-glucose ■ ■ ■ ■ 8.0
Levulinic acid ■ ■ ■ ■ 15.8
Formic acid ■ ■ ■ ■ 12.2
Ethylene glycol ■ ■ ■ ■ 14.1
Furoic acid ■ ■ ■ 9.1
HMF ■ ■ ■ 11.0
Furfural ■ ■ ■ 17.8

60
Figure 2.6 Obtained chromatograms with and without column switching32

61
2.9 Dehydration of HMF
The dehydration of HMF was performed in a similar manner as the dehydration of D-
fructose. In contrast GC-FID and GC-MS were used for analyzing the product mixture
(SSQ7000; Column: 30 Mdbwax; the column temperature was raised from 30 to 250
°C and was then kept isothermal for 8 min). In some cases, NMR measurements in d6-
DMSO were performed to further confirm the results. δ / ppm = 3.5-3.7 (1H, OH);
δ=4.4 (2H, CH2); δ=6.8 and 7.4 (2H, CH-furan); δ=9.6-10 (1H, CHO).
2.10 Hydrogenation of levulinic acid into γ-valerolactone
The hydrogenation of levulinic acid into γ-valerolactone (GVL) was performed in a
20 mL autoclave. Under continuous stirring (1000 rpm), 5.05 g of levulinic acid were
dissolved in 5 mL deionized water followed by addition of 0.1 g catalyst into the
solution. In order to remove most of the air, the autoclave was flushed with argon
before it was pressurized with hydrogen. t0 was defined for the moment at which the
inner temperature of the autoclave reached 200 °C (this took around 20 minutes).
After reaction, the autoclave was cooled down to room temperature in a controlled
manner using an ice water bath. The product mixture was firstly centrifuged for
30 min, and then filtrated over neutral aluminum oxide. In the end, 1-hexanol was
added as internal standard, followed by a second filtration using membrane RC4 and
dilution by acetone. The subsequent samples were analysis by GC (AT 6890N,
column: 30 m DBWaxetr, FID). The column temperature was raised from 40 to 250
°C with a heating rate 3 °C/min. The injector temperature was set to 350 °C, which
was loaded with a sampling volume of 0.2 µl. GC-MS was used to identify peaks
from unknown products under otherwise identical conditions. Analytical data for the
individual compounds can be found in Table 2.4.
Table 2.4 GC-data of individual compound in LA hydrogenation
Substance tr / min GC-Factor (FID) Reference compound MS data base
levulinic acid 21.6 2.40 Q113266
2MTHF 2.2 1.18 Q103495
γ-valerolactone 13.7 1.66 Q163017

62
1-hexanol 9.9 1.0
pentanoic acid 15.1 Q107585
1,4-pentanediol 16.9
2.11 Statistical Analysis by Design Expert
The quality of the obtained models was evaluated by Analysis of Variance (ANOVA).
33-37 Three statistical significance numbers were chosen to characterize the individual
model quality:
1. p-value: to determine whether the model is highly significant (p < 0.001),
significant (0.001 < p < 0.01), limited significant (0.01 < p < 0.05) or not
significant (p > 0.05).
2. Pred. R-squared: model ability to make predictions; is smaller than R-squared
but should not be substantial smaller; could also be negative in case of a total
unsuitable model.
3. Ade Precision: measures the signal to noise ratio. A ratio greater than 4 is
desirable.
Significant reaction variables including two factors interactions can be identified by
the calculated p-values of the individual model terms. Finally a statement is being
made if the model is able to make predictions and as the case may be if better results
were achieved in controlled experiments.33
2.12 Proving ethyl levulinate formation
Due to the low concentration of ethyl levulinate in HPLC analysis, its potential
existence was proven by the following control experiment: 0.12 g levulinic acid was
dissolved in 10 mL ethanol followed by addition of 100 mg catalyst No. 13 (9% Pd1-
Pt3/SBA-15). After the autoclave (36 mL) had been purged with argon, the autoclave
was heated at an agitation speed of 1000 rpm. The start of the noted reaction time (1 h)
was defined as the time at which the reactor reached the desired temperature of 180
°C (after ~ 25 min). Afterwards the autoclave was cooled to room temperature using
an ice water bath.

63
The product was analyzed by GC (AT 6890N, column: 30 m DBWaxetr, FID).
The column temperature was raised from 40 °C to 250 °C with a heating rate of 3
°C/min. The injector temperature was set to 350 °C, which was loaded with a
sampling volume of 0.2 µl). The product identification was done by comparing the
retention time (13.7 min) with bought ethyl levulinate. Moreover, the product was
verified by the GC-MS data base (Q132656).
2.13 Formic acid as a substrate
0.2 g formic acid was mixed with 0.1 g catalyst No 13 (9% Pd1-Pt3/SBA-15) and
heated in a two-neck flask with a condenser to 180 °C under stirring for 1 h. Several
reactions were also performed in an autoclave with or without the use of the catalyst.
The product mixtures were analyzed by HPLC. Analysis conditions were applied as
described in section 2.8.
2.14 Catalyst recycling
After each dehydration run, catalysts were separated from reaction mixtures by
centrifugation for 30 min and dried at 90 °C for 12 h. The obtained catalysts were
calcined at 350 °C for 8 h (heating rate 2 °C/min) to remove adsorped species from
the surface of the spent catalysts. The charging into the autoclave was similar to the
one described in chapter 2.8.
In comparative experiments, reductions of spent catalyst fractions both
calcinated and non-calcinated ones were performed. The hydrogenations were
performed at 50 °C and 20 bar for 30 min. The recycling of the catalysts from LA
hydrogenation were separated and reduced in a similar manner, albeit without the
calcination step.
The leach of metal issue in the reaction solution was analyzed by Elemental
chemical analysis. After dehydration and hydrogenation, the obtained solution was
measured and carried out with inductively coupled plasma (ICP) spectrometry
(Australian. Labtam Co. Labtam 8410). The flow rate of gases was 10.5 Ln/min for
the cooling one and 1.0 Ln/min for the carrier gas.

64
2.15 References
1. A. Corma, Chem. Rev., 97 (1997) 2373.
2. D. Y. Zhao, J. Feng, Q. Huo, N. Melosh, G. H. Fredrickson, B. F. Chmelka, G. D. Stucky, Science, 279 (1998) 548.
3. Q. Huo, D. I. Margolese, U. Ciesla, P.Feng, T. E. Gier, P. Sieger, R. Leon, P. M. Petroff, F. Schüth, G. D. Stucky, Nature, 368 (1994) 317.
4. G. Muthu Kumaran, S. Garg, K. Soni, M. Kumar, J. K. Gupta, L. D. Sharma, G. Murali Dhar, K. S. Rama Rao,. Micropor. Mesopor. Mater., 114 (2008)103
5. Y. van der Meer, E. J. M. Hensen, J. A. R. van Veen, A. M. van der Kraan, J. Catal., 228 (2004) 433.
6. D. Zhao, Q. Huo, J. Fend, B. F. Chmelka, G. D. Stucky, J. Am. Chem. Soc., 120 (1998) 6024.
7. Q. Huo, D. I. Margolese, G. D. Stucky, Chem. Mater., 8 (1996) 1147.
8. M. Kruk, M. Jaroniec, Langmuir, 15 (1999) 5279.
9. J. S. Beck, J. C. Vartuli, W. J. Roth, M. E. Leonowicz, C. T. Kresge, K. D. Schmitt, C. T. W. Chu, D. H. Olson, E. W. Sheppard, S. B. McCullen, J. B. Higgins, J. L. Schlenker, J. Am. Chem. Soc., 114 (1992)10834.
10. A. Sakthivel, S. E. Dapurkar, N. M. Gupta, S. K. Kulshreshtha, P. Selvam Micropor. Mesopor. Mater., 65 (2003) 177.
11. R. M. Krishna, A. M. Prakash, L. Kevan, J. Phys. Chem. B, 140 (2000) 1796.
12. T. S. Jiang, Y. H. Li, X. P. Zhou, Q. Zhao, H. B. Yin, J. Chem. Sci., 122 (2010) 371.
13. S. E. Park, D. S. Kim, J. S. Chang, W. Y. Kim, Catal. Today 44 (1998) 301.
14. Y. K. Hwang, J. S. Chang, Y. U. Kwon, S. E. Park Micropor. Mesopor. Mater. 68 (2004) 21.
15. D. L. Bhering, A. Ramirez-Solis, C. J. A. Mota, J. Phys. Chem. B. 107 (2003) 4342.
16. C. J. A. Mota, D. L. Bhering, N. Jr. Rosenbach, Angew. Chem. Int. Ed., 43 (2004) 3050.
17. D. Freude, M. Hunger, H. Pfeifer, J. Chem. Soc., Faraday Trans., 87 (1991), 657.
18. A. Leitner, J. Larsen, C. Steffens, J. F Hartwig, 69 (2005) 7552.
19. C. P. Mehnert, D. W. Weaver, J. Y. Ying, J. Am. Chem. Soc., 120 (1998) 12289.
20. X. Mu, U. Bartmann, M. Guraya, G. W. Busser, U. Weckenmann, R. Fischer, M. Muhler, Appl. Catal., A, 248 (2003) 85.
21. Y. Zhang, Z. Yuan, R. Puddephatt, J. Chem. Mater., 10 (1998) 2293.
22. Y. Tatsuno, T. Y. Seiotsuka, Inorg. Synth. 19 (1979) 220.
23. J. C. Hierso, C. Satto, R. Feurer, P. Kalck, Chem. Mater., 8 (1996) 2481.
24. F. Qin, Ph.D Thesis, Design heterogeneous catalyst for utilization of biomass-derived monomers, Institute of Coal Chemistry, Chinese Academy of Sciences, Taiyuan, 2011.
25. Design Expert Software Introduction: http://www.statease.com/software.html
26. Paul Mullenix, Design-Expert Diagnostics Saves Experiment (and Postgrad Student),
http://www.statease.com/pubs/diagnostics_by_Paul_Mullenix.pdf

65
27. N. Theyssen, K. Yan, F. Qin, R. Weiss, W. Leitner. “Synthesis of Nanostructured Catalysts by Chemical Fluid Deposition (CFD)”TMFB International Workshop of the Cluster of Excellence Tailor-Made Fuels from Biomass, 23-24 June 2010, Aachen, Germany.
28. T.-O. Do, A. Nossov, M.-A. Springuel-Huet, C. Schneider, J. L. Bretherton, C. A. Fyfe, S. Kaliaguine, J. Am. Chem. Soc., 126 (2004) 14324.
29. M. Kruk, M. Jaroniec, C. H. Ko, R. Ryoo, Chem. Mater., 12 (2000) 1961.
30. Z. Luan, M. Hartmann, D. Zhao, W. Zhou, L. Kevan, Chem. Mater., 11 (1999) 1621.
31. S. Lowell, J. E. Shields, M. Thomas, M. A. Thommes (Eds), 2006. Characterization of Porous Solids and Podwers: Surface Area, Pore Size and Density, Springer, P347.
32. G. Breitenbruch, A. Deege, H. Hinrichs, D. Klütt, Novel Developments in HPLC, 03-06, March, Evaluation of MAX-Planck-isntitut für Kohlenforschung, Germany.
33. Cluster of Excellence Tailor-Made Fuels from Biomass, year Report 2009.
34. Design Expert software Articles: http://www.statease.com/articles.html
35. M. J. Anderson, P. J. Whitcomb, DOE Simplified: Practical Tools for Effective Experimentation, CRC Press, April, 2004
36. M. J. Anderson, P. J. Whitcomb, RSM Simplified: Optimizing Processes Using Response Surface Methods for Design of Experiments, CRC Press, April, 2004
37. A Primer on Mixture Design: What’s In It for Formulators? http://www.statease.com/pubs/MIXprimer.pdf

66
Chapter 3 – Synthesis of Homo- and
Bimetallic nanoparticles catalysts by
Chemical Fluid Deposition
3.1 Introduction
Today, the world is undertaking a variety of challenges in ˝creating alternative fuels,
reducing harmful by-products in manufacturing, cleaning up the environment and
preventing future pollution, dealing with the causes of global warming, protecting
citizens from the release of toxic substances and creating safe pharmaceuticals˝.1
Among these challenges, catalysis play an important role. For catalysis, nanoparticle
catalyst is often considered as a potential stock and already attracted more and more
attentions, but their complexity and diversity often need a rational design and usage.2-7
A lot of studies have been carried out to investigate the formation and assemble of
nanomaterials.7-10 Reviewing literatures and books,7, 9, 10 a lot of promising methods
have been triggered numerous interests in fabricating supported metal nanoparticles.
Reprentative examples are sol-gel-methods and synthesis in plasma for creating metal
oxides, self-assembly processes on surfaces, and SMAD (solvated metal atom
dispersion to produce metal colloids of high purity).9 Method metal organic chemical
vapor deposition (MOCVD) is also an attractive technology for synthesizing metal
nanoparticles.11 For MOCVD method a high volatile organometallic complex is
evaporated and transported in a carrier gas (under reduced pressure) to the heated
support material (300-500 °C). Here the complex decomposes whereby the metal
parts absorb on the surface and the volatile ligands are carried away in the gas
stream.11-16 Although MOCVD can produce high-quality supported catalysts on
various supports, the deposition on exterior surface, which would need to be carefully
removed later. Another great limit of the utilization of MOCVD is confined by the
requirement for organometallic compounds of high volatility, their toxicity and the
difficulties in upscaling.17-25
67
Another representative method for metallic nanoparticle production is
impregnation of the metal precursor on a suitable support, followed by reduction. The
impregnation is heavily determined by the conjunction of interrelated parameters such
as concentrations, pH, viscosity, choice of support and metal salt precursor as well as
the solvent selection.26-30 Kim and coworkers have done pioneering work using liquid
carbon dioxide (lqCO2) for synthesis of supported metal catalysts.31-34 The much
lower surface tension of liquid CO2 in comparison with water (about factor 70) makes
it an excellent wetting agent, even on very low surface energy substrates.35 ˝Low
surface tension may help to reduce the redistribution of metal compounds caused by
the high surface tension of typical liquid solvents.˝32 In addition, ˝the low surface
tension of lqCO2 facilitates the permeation of organometallic compounds into the
pores or surface of the supports which helps to reduce solute concentration
gradients˝.32 However, one inherent limitation of this method is that the metal
precursor often display low solubility in lqCO2, which is often not the fit for simple
metal salts.33-34
The preparation of supported metal catalysts using supercritical carbon dioxide
(scCO2) has received considerable attention. This process, called chemical fluid
deposition (CFD, also specified in some cases as chemical fluid reactive deposition),
involves the dissolution of a metallic precursor in a supercritical fluid in the presence
of a support. After adsorption of the precursor onto the support, the metallic precursor
is converted to its metal form in situ by addition of molecular hydrogen (H2).36-47 The
unique physical properties of scCO2, including ˝zero surface tension, low viscosity,
and tunable density˝, make it as a promising alternative, with the potential to
˝overcome many of the constraints associated with traditional, water-based catalyst
preparation techniques˝.47
Watinkins and coworkers have done most of the pioneering work using CFD for
formation of thin metal films, thereby focusing on a potential application in
semiconductor processing.48-54 Later, Wai and coworkers employed CFD to synthesize
monometallic Pd and Pt as well as bimetallic Pt-Cu, Pt-Ru, Pt-Au, Pt-Pd and Pt-Ni
nanoparticles on carbon nanotubes (CNT).55-57 The resulting nanoparticles were
employed as catalysts in methanol fuel cells.55-57 Erkey and coworkers also
contributed to this field by employing CFD for preparation of Pd, Pt and Ru
nanoparticles for fuel cell applications as well.58-64 Recently, several groups have been
using these types of nanocatalysts for chemical synthesis. Cabanas et al. have used

68
CFD to prepare Pd nanocatalysts supported on SBA-15 for reduction of 4-nitrophenol
to 4-aminophenol.65 Tan and coworkers synthesized monometallic (Ru, Rh, Pd) and
bimetallic (Ru-Rh, Ru-Pd and Rh-Pd) nanoparticles on MCM-41 and employed them
in the hydrogenation of p-xylene.66 Ikushima and coworkers deposited gold
nanoparticles into the channels of MCM-48 and then applied the resulting gold
nanoparticles into the hydrogenation of crotonaldehyde.67
Noteworthy, supported metal catalysts prepared by other methods were recently
employed in the transformation of biomass such as HMF oxidation68-72 or
hydrogenation of D-glucose.73-75 Quite recently, Huang and coworkers76 prepared
nickel supported on carbon black using classical wet impregnation. The resulting
catalysts (nanostructure not defined) were employed in the dehydration of sorbitol to
isosorbide. To date, we did not find any further reports about the application of
nanoparticles catalysts in dehydration of sugar.
3.2 The choice of suitable supports
As demonstrated by numerous works, the used support often display important
influence on the activity of nanocatalyst.77-79 Therefore, the reasonable choice of a
suitable support is an important factor for catalyst synthesis. We chose SBA-15 as a
standard support, which is crystalline, mesporous silica with parallel hexagonal pores
of sufficient size. This material allows us
1. to embed and stabilize the nano-sized metal particles,
2. to pretend nanoparticles from agglomeration in more than one dimension and
3. to facilitate a good transport of substrates and products through the linear
channels.
SBA-15, synthesized at a temperature below 110 oC, contains mainly mesopores and
only a small amount of micropores.80 One deficiency in the usage of SBA-15 is its
micropore stability, which often hinders propesctive applications in water
environment under high temperature.81 The disappearance of micropores often
occurred under 130 oC, however, such a high temperature would in turn influence the
crystallization and the final pore system.82-84 Jaroniec83 and Gedeon84 et al found the
microporosity of SBA-15, synthesized at a temperature below 110 oC, is lost during
water treatment, leading to a strong decrease in specific surface area. Uniform
mesopores were still observed even after 8 days of boiling in water. Only SBA-15

69
without microporosity, such as the ones synthesized at 130 oC, are stable under water
treatment.
Based on these finding, we performed the two test reactions, one is in ethanol
solvent, one is in water solvent. After reaction, the micropore was found increased. As
will be discussed in Table 4.10 (~P104) of Chapter 4 and Table 5.5 (~ P105) of
Chapter 5, both cases further supported this phenomenon. However, we found the
mesopores relatively keep stable from the Nitrogen curve. On the other hand, in order
to fully get ride of micropre influence on catalytic activity, we choose MCM-41 as
supports for further comparative reactions.
In order to check the performance of more Lewis acidic supports, Al and Zr were
inserted into the framework of SBA-15 and MCM-41. Furthermore HY was
synthesized to characterize the influence of a solid Brönsted acid. Details in this
regard can be found in chapter 4.3.7.
3.2.1 XRD analysis
SBA-15 was firstly characterized by XRD to confirm the structural phases (Figure
3.1). It exhibited three clear peaks which are characteristic for the hexagonally
ordered structure indexed as (100) at 0.8°, (110) at 1.2° and (200) at 1.5°.87-90 In the
case of MCM-41, typical peaks for hexagonally ordered structure were obtained as
well. They were indexed as (100) at 2.5o, (110) at 4.4o, (200) at 5.1o, (210) at 6.7o,
which is consistent with values from former literatures.91-96
Figure 3.1 XRD analyses of SBA-15 and AlSBA-15

70
1 2 3 4 5 6 7 8
(200)(110)
2θ ⁄ °
MCM-41
AlMCM-41
ZrMCM-41
(100)
Figure 3.2 XRD analyses of MCM series
3.2.2 BET analysis
Other key parameters influencing the prosperities of mesoporous materials are surface
area as well as size and shape of the individual pore system.97-99 Thus, SBA-15 and
MCM- 41 were characterized by for BET analysis, too. The BET surface area was
calculated using BJH (Barrett, Joyner & Halenda) method100 and evaluated in a
relative pressure range from 0.03 to 0.2. This was because SBA-15 contains mainly
mesopores and only a small amount of micropores, while MCM-41 possesses meso-
pores only (Figure 3.3).
Figure 3.3 (Simplified) structures of SBA-15 (left)101 and MCM-41 (right)102
The analysis of surface area and pore volume of the chosen SBA-15 and MCM-41
examples were depicted in Figure 3.4. Typical IV curve of mesoporous material was

71
observed in N2-sorption isotherm. It can be seen in Figure 3.4a that the nitrogen
adsorption isotherms for the SBA-15 and MCM-41 featured narrow steps of capillary
condensation in primary mesopores, which indicates high pore size uniformity. For
SBA-15, which exhibited capillary condensation at a relative pressure of about 0.45
(corresponding to a pore size of about 5 nm), the steps on adsorption isotherms were
relatively narrow. In the case of MCM-41, for which a pore size of about 3.5 nm was
measured, the steps on adsorption isotherms were significantly broader. This indicates
a better degree of structural ordering for the MCM-41 materials, which can be
explained by the usage of a template and basic synthesis condition. Similar
observations are well reported in literature.93-96
Higher-pressure parts of as plots (Figure 3.4 b) were used to evaluate surface
areas and mesopore via micropore volumes for the samples. These quantities, along
with the BET specific surface areas and total pore volumes, are listed in Table 3.1.
0,0 0,2 0,4 0,6 0,8 1,0
100
150
200
250
300
350
Relative Pressure, P/P0
Vol
ume
(cc/
g)
SBA-15
0,0 0,1 0,2 0,3 0,4 0,5 0,6 0,7 0,8 0,9 1,050
100
150
200
250
300
350
400
Vol
ume
(cc/
g)
Relative Pressure, P/P0
MCM-41
(a) N2 adsorption and desorption curve of SBA-15 and MCM-41
0,06 0,08 0,10 0,12 0,14 0,16 0,18 0,20 0,22
0,3
0,4
0,5
0,6
0,7
0,8
0,9
1,0
1,1
1,2
Relative Pressure, P/P0
1/[W
((P
0/P
)-1)
]
SBA-15
0,04 0,06 0,08 0,10 0,12 0,14 0,16
0,3
0,4
0,5
0,6
0,7
0,8
0,9
1/[W
((P
0/P
)-1)
]
Relative Pressure, P/P0
MCM-41
(b) Calculated BET areas of SBA-15 and MCM-41
Figure 3.4 Surface area and pore volume analysis of SBA-15 and MCM-41.

72
Table 3.1 BET analysis results of different supports
No. Catalyst BET surface area (m2/g)
Pore diameter (nm)
Mesopore volume (cm3/g)
Micropore volume (cm3/g)
1 SBA-15 643 5.4 0.417 0.088
2 AlSBA-15 621 5.0 0.398 0.072
3 MCM-41 684 3.3 0.518 -----
4 AlMCM-41 570 3.2 0.426 -----
5 ZrMCM-41 400 3.3 0.361 .-----
6 SiO2 200 ± 25 ------ ------- -----
7 Al2O3 300 ------ ------- -----
As can be seen from entries 1 and 2 in Table 3.1 an insertion of Al into the structure
of SBA-15 effected a decrease in i) surface area (643 m2/g to 621 m2/g, ~3%), ii) pore
volume of both mesopores (0.417 cm3/g to 0.398 cm3/g, ~5%) and micropores 0.088
cm3/g to 0.072 cm3/g, ~18%), and iii) pore size (5.4 nm to 5.0 nm, ~8%). These
results clearly reveal that Al was successfully incorporated into the SBA-15
framework. A similar trend is observed for the metal insertion in MCM-41 (entries 3-
5), whereby the decrease of surface area and pore volume is much more pronounced
for the incorporation of both Al and especially Zr. The large gap between those cannot
be explained by the bigger ionic radius of Zr. Instead, the insertion of Zr into the
MCM-41 framework seems to be more preferred.
Based on the need for relatively large pore sizes for embedding nanoparticles
with mean sizes ≥ 3.3 nm (see chapter 3.2, 4.3.3 and 5.3), SBA-15 was chosen as a
standard support. The non-porous materials like SiO2 and Al2O3 were not further
taken into account for particle deposition as both an easy agglomeration of primary
particles and a facilitated metal leaching in comparison with SBA-15 can be expected
under harsh environment of catalytic reactions such as high temperature.
3.2.3 TEM and SEM analysis of SBA-15
In order to gain further evidence for a successful preparation of the highly ordered
pore system of SBA-15, TEM and SEM were applied. TEM images of SBA-15 under
different angles of viewing show the parallel and hexagonal pores in a clear manner

73
(Figure 3.5). An example for the textural morphology of SBA-15 is given in Figure
3.6. The sampled unit contains several crystalline domains of diverse size which
sticks together. The presence of amorphous silica seems to be insignificant.
Figure 3.5 TEM of SBA-15 structure: (a) front view of pores, (b) side view of pores
Figure 3.6 SEM pictures of the resulted SBA-15.
3.3. Synthesis of Pd/SBA-15 by a modified CFD
As the name indicated, supported catalysts consist of a catalytically active phase
dispersed over a support. In order to achieve highly distribution with small sizes, the
reduction should be easy to operate under low temperature on one hand.63, 64, 103On the
other hand, the active metal Pd should be highly distributed inside the channels of
SBA-15, which should increase the concentration of active sites per mass of metal.103
First a defined amount of palladium acetate (depending on the desired loading, hereby
a 100% degree of infiltration efficiency was implied) and 250 mg SBA-15 support
were placed together in an autoclave of 22 mL size. Afterwards, the autoclave was
pressurized with 15 g carbon dioxide. The heterogeneous mixture was then stirred for

74
two days at room temperature. Due to the very low solubility of this metal precursor
in liquid carbon dioxide, the support was infiltrated by the palladium complex in a
slow but controlled fashion. After this step the autoclave was depressurized and the
sample was calcinated for eight hours in a stream of synthetic air at a temperature
level of 550 °C (heating rate 2 K / min). Hereby organic residues were completely
removed. Finally the sample were again pressurized with liquid carbon dioxide and
reduced with molecular hydrogen (50-fold excess) at room temperature. The synthesis
procedure is presented in a descriptive manner in Figure 3.7.
Figure 3.7 Preparation steps using the modified CFD procedure.
As the (major) catalytically active component palladium ensembles were
deposited on SBA-15 by a modified chemical fluid deposition approach. 103 For that
purpose palladium acetate was used as a metal precursor. Due to its poor solubility in
compressed carbon dioxide, the material transport to the surface both inside and
outside of the mesoporous support was achieved by a combined infiltration/sorption
step (Figure 3.7). The low surface tension and low viscosity of liquid carbon dioxide
as the solvent (which is about one order of magnitude lower in comparison with
conventional solvents like THF)35 support these processes in an optimal manner
whereby the infiltration is reached in a slow but controlled fashion. Control

75
experiments in a window equipped autoclave show the disappearance of the Pd
precursor particles in two days.
After this step, the autoclave was depressurized and the sample was calcinated at
550°C for 8 hours under air environment, whereby organic residues were completely
removed. Finally the samples were again pressurized with liquid carbon dioxide and
reduced with molecular hydrogen at room temperature for 12 hours.
10 20 30 40 50 60 70 80100
200
300
400
500
600
700
800
900
1000
1100
1200
1300
B: from Pd(OAc)2
2θ π π
A: from Pd(acac)2
Figure 3.8 XRD analyses of selected catalyst samples from different metal precursor.
To aid our understanding on the relationship between the resulted catalysts and their
catalytic performance, a series of representative fresh catalysts were initially
characterized by different techniques such as XRD and TEM. XRD spectra of the
resulted catalysts are presented in Figure 3.8. The crystal phase of the probed 3%
Pd/SBA-15 catalyst were identified as single hexagonal fcc phase of palladium on the
basis of the following reflections: 2θ = 40o (111), 47o (200) and 68o (220).97-102 The
well-resolved (110) and (200) reflections revealed that incorporation of metal Pd did
not alter the long-range mesoporous ordering of the host SBA-15.
TEM pictures of the resulted catalysts are depicted in Figure 3.9 and 3.10,
respectively. Using Pd(OAc)2 as a precursor, well distributed Pd particles with mean
sizes of 5.3 nm were obtained, which are close to the pore diameter of the host SBA-
15 (6.5 nm). In contrast, the usage of Pd(acac)2 as a precursor resulted in larger and
less homogeneously distributed particles in the range of 4-20 nm which majority is
located on the surface and only rarely inside the channels. Although reasons for such

76
behavior could not be identified and experiments with Pd(acac)2 were not reproduced,
that the positive results with Pd(OAc)2 indicate this to be a more appropriate precursor
and it was therefore chosen for further studies.
Figure 3.9 TEM-pictures of 3% Pd / SBA-15 prepared from Pd(OAc)2 precursors
Figure 3.10 TEM pictures of 3% Pd/SBA-15 prepared from Pd(acac)2 precursors
3.4 Synthesis of homo-and bimetallic catalysts using CFD
3.4.1 The choice of metal precursor
The CFD methodology requires metal precursors which can be dissolved to a
sufficient degree in the supercritical fluid.50, 51 The Pd precursor which is certainly
most often used for this purpose is Pd(hfac)2 (Figure 3.11). However, its deposition
resulted in a material in which the ligand was decomposed resulting in coke formation
and fluorine contamination on the support material. Instead, we tried commercially
available Pd(acac)2 which of course circumvented fluorine contaminations but led to
the formation of rather big and badly dispersed particles. The reason for that is most

77
likely the insufficient solubility of the precursor in scCO2. Switching to CpPd(η3-
C3H5), which was synthesized by Fei Qin,110 eliviated these problems led to the
formation of smaller particles as shown in Figure 3.12.
Figure 3.11 The structures of chosen Pd precursors110
A) 5wt% Pd(acac)2 B) 5wt% Pd(hfac)2 C) 5wt% CpPd(allyl)
Figure 3.12 TEM analysis of Pd/SBA-15 applying different metal precurser110
3.4.2 Synthesis of monometallic Pd catalysts
The first experimental plan concerning the synthesis of homometallic Pd catalyst was
done by design of experiments (DOE, used software: Design Expert 7.1) applying a
response surface plan with seven factors.110,111 The plan contained 35 different
protocols for supported nanoparticle Pd catalysts to investigate the influence of the
following reaction parameters: (i) loading amount of metal (1 - 9 wt %); (ii) molar
ratio of hydrogen to metal (1 - 100); (iii) addition rate of hydrogen (4 - 110 mLn/ min);
(iv) density of carbon dioxide (0.50 - 0.80 g / mL); (v) reaction temperature (40 – 80
°C); (vi) impregnation time (1- 4 h); (vii) reduction time (1-30 min). Several factors
were kept constant such as the stirring speed, the clearing procedure and the amount
of SBA-15 (300 mg) used for the deposition. Thereby the influence of different
reaction parameters towards the performance of the obtained catalysts is investigated

78
in both test reactions (Scheme 3.1). The experimental plan, catalysts characterization,
more details of catalytic performance and recyclability will be discussed in Chapter 4
and 5.
Scheme 3.1 The two tests reaction for evaluation of the first experimental plan
3.4.3 Homo- and bimetallic metal catalysts synthesis
Based on an uniform design, an initially explored plan with 35 different protocols for
palladium catalysts and a further experimental plan with 32 different protocols for
supported nanoparticles homo- and/or bimetallic Pd and/or Pt catalysts were
processed to investigate the influence of the following reaction parameters: (i) loading
amount of palladium (1 - 9 wt %); (ii) molar ratio of hydrogen to palladium (1 - 100);
(iii) addition rate of hydrogen (4 - 110 mLn / min); (iv) reaction temperature (40 - 80
°C); (v) density of carbon dioxide (0.50 - 0.80 g / mL); (vi) molar ratio of Pd toward
Pt (second plan) and (vii) impregnation time (1 - 4 h). The time for reduction was kept
constant (30 min) in the second plan and varied in the first plan (1-30 min).
The typical procedure for catalyst synthesis was operated as follow: homo- and
bi-metallic Pd and/or Pt were deposited into SBA-15 by hydrogenolysis of the metal
precursors allyl (cyclopentadienyl)-palladium (II) [CpPd(η3-C3H5)] and (1, 5-
cyclooctadiene)-dimethylplatinum (II) [(1,5-cod)Pt(CH3)2] under different conditions
(as shown in Figure 3.13). All depositions from scCO2 were conducted in a 40 mL
high-pressure stainless steel autoclave. A constant amount of SBA-15 support (300
mg) and a known amount of palladium and/or platinum precursor (10-60 mg) were
filled in the autoclave and purged with argon and vacuum in three consecutive runs.
After this process, the vessel was loaded with a defined amount of CO2 (>99.99%, Air
Liquid, dosed by weighting) and placed in a circulating constant-temperature bath

79
(40-70 °C), where it equilibrates to the desired temperature for a certain time (=
impregnation time). The hydrogen addition was done with the help of a mass flow
controller by which both the hydrogen amount and its addition rate were controlled.
The reaction mixture was then further stirred for 30 min in order to assure a complete
reduction. Finally, the autoclave was cooled down to room temperature with ice water
and depressurized in a controlled manner for about 30 min. Comparative supported Pd
nanoparticles catalysts were also prepared using other supports such as SiO2, Al2O3, C,
AlSBA-15, MCM-41, AlMCM-41, ZrMCM-41 and HY.
Figure 3.13 Synthesis of homo- and bimetallic nano-structured catalysts
The experimental plan concerning the synthesis of mono- and bimetallic Pd and/or Pt
catalysts deposited on SBA-15 catalyst was elaborated by Design Expert applying a
response surface plan with seven factors.110 32 different protocols were thereby
defined to investigate the influence of the following reaction parameters: (i) loading
amount of metal (1 - 9 wt %); (ii) molar ratio of hydrogen to metal (1 - 100); (iii)
addition rate of hydrogen (4 - 110 mLn/ min); (iv) density of carbon dioxide (0.50 -
0.80 g / mL); (v) reaction temperature (40 – 80 °C); (vi) molar ratio of Pt toward Pd;
(vii) impregnation time (1-4 h). Meanwhile, several factors were kept constant such as
the stirring speed, the clearing procedure, the amount of support (300 mg) used for the
deposition and reduction time (30 min). The experimental plan, catalysts
characterization, more details of catalytic performance and recyclability will be
discussed in Chapter 4 and 5.
3.5 References 1. National Science Foundation Workshop Report on Catalysis for Biorenewables
Conversion, April 13-14, 2004, www.egr.msu.edu/apps/nsfworkshop
2. Subcommittee on Nanoscale Science, Engineering and Technology, and the U.S. Department of Energy Office of Basic Energy Sciences. National Science Foundation

80
(2003). Future Directions in Catalysis: Structures That Function at theNanoscale. Report of a workshop sponsored by the National Science Foundation, June 19-20, 2003. Workshop Chairs: M.E. Davis, California Institute of Technology, and T.D. Tilley, University of California, Berkeley.
3. U.S. Department of Energy Office of Science (2003). Basic Research Needs to Assure a Secure Energy Future. Report of a workshop sponsored by the U.S. Department of Energy Office of Science, Basic Energy Sciences Advisory Committee (BESAC), October 2002. Workshop Chair, John Stringer, Electric Power Research Institute; Co-Chair, Linda Horton, Oak Ridge National Laboratory.
4. U.S. Department of Energy Office of Science (2002). Opportunities for Catalysis Science in the 21st Century. Report of a workshop sponsored by the U.S. Department of Energy Office of Science, Basic Energy Sciences Advisory Committee (BESAC), May 14-16, 2002. Workshop Chair, J.M. White,
5. C. H. Bartholomew, R. J. Farrauto (eds). 2005. Fundamentals of Industrial Catalytic Processes, 2nd Edition.Wiley, New York.
6. I. Chorkendorff, J. W. Niemantsverdriet (eds). 2003. Concepts of Modern Catalysis and Kinetics. Wiley-VCH, Weinheim.
7. Didier Astruc (eds). 2008. Nanoparticles and Catalysis. WILEY-VCH Verlag GmbH & Co. KGaA, Weinheim
8. R. A. Sheldon, I. Arends, U. Hanefeld (eds). 2007. Green Chemistry and Catalysis, WILEY-VCH Verlag GmbH & Co. KGaA, Weinheim
9. R. Nagarjan, T. A. Hatton (eds.), 2008, Nanoparticles: synthesis, stabilization, passivation and functionalization, Oxford University Press, USA.
10. R. Ferrando, J. Jellinek, R. L. Johnston, Chem. Rev., 108 (2008) 846.
11. K. P. Reddy, T. L. Brown, J. Am. Chem. Soc., 117 (1995) 2845.
12. G. J. Gajda, R. H. Grubbs, W. H. Weinberg, J. Am. Chem. Soc., 109 (1987) 66.
13. S. B. Desu, D. B. Beach, P. C. Van Buskirk, Metal-organic chemical vapor deposition of electronic ceramics II: symposium held on November 27-29 1995, Boston, Massachusetts, U.S.A.
14. P. Serp, P. Kalck , R. Feurer, Chemical Vapor Deposition Methods for the Controlled Preparation of Supported Catalytic Materials, Chem. Rev., 102 (2002) 3085.
15. A. Kazusaka, R. F. Howe, J. Mol. Catal., 9 (1980) 183.
16. M. Kaltchev, W. T. Tysoe, J. Catal., 193 (2000) 29.
17. T. H. Walter, A. Thompson, M. Keniry, S. Shinoda, T. L. Brown, H. S. Gutowsky, E. Oldfield, J. Am. Chem. Soc., 110 (1988) 1065.
18. M. Ritala, M. Leskela: Handbook of Thin Film Materials (Ed. H. S. Nawa) p. 103, Academic, San Diego, CA 2001.
19. J. L. Bilhou, A. Theolier, A. K. Smith, J. M. Basset, J. Mol. Catal., 3 (1977/78) 245.
20. M. Suvanto, T. A. Pakkanen, J. Mol. Catal., 138 (1999) 211.
21. S. Myllyoja, T. A. Pakkanen, J. Mol. Catal., 136 (1998) 153.
22. A. Brenner, D. A. Hucul, J. Catal., 61 (1980) 216.
23. M. Suvanto, T. A. Pakkanen, Appl. Catal. A, 166 (1998) 105.
24. R. L. A. Brenner, Jr. Burwell, J. Catal., 52 (1978) 353.
25. J. Goldwasser, S. M. Fang, M. Houalla, W. K. Hall, J. Catal., 115 (1989) 34.

81
26. A. P. Kozlova, A. I. Kozlov, S. Sugiyama, Y. Matsui, K. Asakura, Y. Iwasawa, J. Catal., 181 (1999) 37.
27. T. Ritzdorf, In Advanced Metallization Conference 2006, San Diego, CA; S. W. Russell, M. E. Mills, A. Osaki, T.Yoda (Eds.), 2006, p69.
28. K. P. de Jong (eds), 2009, Synthesis of Solid Catalysts. WILEY-VCH Verlag GmbH & Co. KGaA, Weinheim.
29. J. E. Naber , K. P. de Jong, W. H. J. Stork, H. P. C. E. Kuipers, M. F. M. Post, Stud. Surf. Sci. Catal., 84 (1994) 2197.
30. G. Ertl, H. Knözinger, J. Weitkamp (eds), 1999, Preparation of Solid Catalysts, Wiley-VCHVerlag GmbH, Weinheim.
31. J. Kim, G. W. Roberts, D. J. Kiserow, Chem. Mater., 18 (2006) 4710.
32. Y.-J. Han, J. M. Kim, G. D. Stucky, Chem. Mater., 12 (2000) 2068.
33. M. Kelly, J. Kim, G. Roberts, H. Lamb, Top. Catal., 49 (2008) 178.
34. J. Kim, M. J. Kelly, H. H. Lamb, G. W. Roberts, D. J. Kiserow, J. Phys. Chem. C 112 (2008) 10446.
35. http://webbook.nist.gov
36. E. N. Hoggan, K. Wang, D. Flowers, J. M. DeSimone, R. G. Carbonell, IEEE Trans. Semicond. Manuf., 17 (2004) 510.
37. C. A. Jones, A. Zweber, J. P. DeYoung, J. B. McClain, R. Carbonell, J. M. Crit. ReV. DeSimone, Solid State Mater. Sci., 29 (2009) 97.
38. J. W. King, L. L. Williams, Curr. Opin. Solid State Mater. Sci., 7 (2003) 413.
39. E. Kondoh, J. Fukuda, In 8th International Symposium on Supercritical Fluids, Kyoto, Japan, 2006; p 466.
40. Y. F. Zong, J. J. Watkins, In 21st AdVanced Metallization Conference (AMC 2004), San Diego, CA; D. Erb, P. Ramm, K. Masu, A. Osaki (eds), 2004; p 353.
41. E. Reverchon, R. Adami, J. Supercrit. Fluids, 37 (2006) 1.
42. F. Cansell, C. Aymonier, A. Loppinet-Serani, Curr. Opin. Solid State Mater. Sci., 7 (2003) 331.
43. A. I. Cooper, J. Mater. Chem., 10 (2000) 207.
44. J. A. Darr, M. Poliakoff, Chem. Rev., 99 (1999) 495.
45. A. I. Cooper, J. M. DeSimone, Curr. Opin. Solid State Mater. Sci., 1 (1996) 761.
46. A. I. Cooper, Adv. Mater., 15 (2003) 1049.
47. J. A. Dahl, B. L. S. Maddux, J. E. Hutchison, Chem. Rev., 107 (2007) 2228.
48. A. Cabanas, X. Y. Shan, J. J. Watkins, Chem. Mater., 15 (2003) 2910.
49. J. M. Blackburn, D. P. Long, J. J. Watkins, Chem. Mater., 12 (2000) 2625.
50. E. T. Hunde, J. J. Watkins, Chem. Mater., 16 (2004) 498.
51. D. P. Long, J. M. Blackburn, J. J. Watkins, Adv. Mater., 12 (2000) 913.
52. J. J. Watkins, J. M. Blackburn, T. J. McCarthy, Chem. Mater., 11 (1999) 213.
53. A. Cabanas, D. P. Long, J. J. Watkins, Chem. Mater., 16 (2004) 2028.
54. A. O’Neil, J. J. Watkins, Chem. Mater., 18 (2006) 5652.

82
55. C. H. Yen, K. Shimizu, Y-Y. Lin, F. Bailey, I. F. Cheng, Chien M. Wai, Energy & Fuels, 21 (2007) 2268.
56. X-Rong Ye, Y. H. Lin, C. M. Wang, M. H. Engelhard, Y. Wang, Chien M. Wai, J. Mater. Chem., 14 (2004) 908.
57. X. R. Ye, Y. H. Lin, Chien M. Wai, Chem. Commun., 2003, 642
58. S. E. Bozbag, N. S. Yasar, L. C. Zhang, M. Aindow, C. Erkey, J. Supercrit. Fluids 56 (2011) 105.
59. R. C. Jiang, Y. Zhang, S. Swier, X. Z. Wei, C. Erkey, H. Russell Kunz, J. M. Fenton, Electrochem. Solid-State Letters, 8 (2005) A611.
60. Y. Zhang, D. F. Kang, C. Saquing, M. Aindow, C. Erkey, Ind. Eng. Chem. Res., 44 (2005) 4161.
61. Y. Zhang, D. F. Kang, M. Aindow, C. Erkey, J. Phys. Chem. B 109 (2005) 2617.
62. Y. Zhang, C. Erkey, J. Supercrit. Fluids 38 (2006) 252.
63. Y. Zhang , B. Cangul , Y. Garrabos , C. Erkey, J. Supercrit. Fluids 44 (2008) 71.
64. B. Cangul, L.C. Zhang, M. Aindow, C. Erkey, J. Supercrit. Fluids 50 (2009) 82.
65. J. Morère, M.J. Tenorio, M.J. Torralvo, C. Pando, J.A.R. Renuncioa, A. Caba˜nas, J. Supercritical Fluids 56 (2011) 213.
66. C.H. Yen, H.W. Lin, T.D. Phan, C.S. Tan, J. Nanosci. Nanotechnol., 11(2011) 2465.
67. M. Chatterjee, Y. Ikushima, Y. Hakuta, H. Kawanami, Adv. Synth. Catal., 348 (2006) 1580.
68. O. Casanova, S. Iborra, A. Corma, ChemSusChem, 2 (2009) 1138.
69. T. Pasini, M. Piccinini, M. Blosi, R. Bonelli, S.Albonetti, N. Dimitratos, J. A. Lopez-Sanchez, M. Sankar, Q. He, C. J. Kiely, G. J. Hutchings, F. Cavani, Green Chem., 13 (2011) 2091
70. O. Casanova, S. Iborra, A. Corma, J. Catal., 265 (2009)109.
71. E. Taarning, I. S. Nielsen, K. Egeblad, R. Madsen, C. H.Christensen, ChemSusChem, 1 (2008) 75.
72. S. E. Davis, L. R. Houk, E. C. Tamargo, A. K. Datye, R. J. Davis, Catal. Today, 160 (2011) 55.
73. J. J. Liu, X. N. Tian, X. S. Zhao, Aust. J. Chem., 62 (2009) 1020.
74. P. Gallezot, N. Nicolaus, G. Fl`eche, P. Fuertes, A. Perrard, J. Catal., 180 (1998) 51.
75. B. W. Hoffer, E. Crezee, P. R. M. Mooijman, A. D. van Langeveld, F. Kapteijn, J. A. Moulijn, Catal. Today, 79-80(2003) 35.
76. H. Li, D. H. Yu, Y. Hu, P. Sun, J. J. Xia, H. Huang, Carbon, 48 (2010) 4547.
77. A. Y. Khodakov, W. Chu, P. Fongarland, Chem. Rev., 107 (2007) 1692.
78. T. Ishida, N. Kinoshita, H. Okatsu, T. Akita, T. Takei, M. Haruta, Angew. Chem. Int. Ed., 47 (2008) 9265.
79. J. M. Fraile, J. I. Garcı´a, J. A. Mayoral, Chem. Rev., 109 (2009) 360.
80. C. S. Cundy, P. A. Cox, Chem. Rev., 103 (2003) 663.
81. A. Corma., Chem. Rev., 97 (1997) 2373.
82. A. Navrotsky, O. Trofymluk, A. A. Levchenko, Chem. Rev., 109 (2009) 3885.

83
83. E. B. Celer, M. Kruk, Y. Zuzek, M. Jaroniec, J. Mater. Chem., 16 (2006) 2824.
84. A. Galarneau, M. Nader, F. Guenneau, F. D. Renzo, A. Gedeon, J. Phys. Chem. C 11(2007) 8268.
85. Y. Wan, D. Y. Zhao, Chem. Rev., 107 (2007) 2821.
86. J. M. Kim, Y. Sakamoto, Y. K. Hwang, Y. U. Kwon, O. Terasaki, S. E. Park, G. D. Stucky, J. Phys. Chem. B, 106 (2002) 2552.
87. S.-S. Lee, B.-K. Park, S.-H. Byeon, F. Chang, H. Kim, Chem. Mater., 18 (2006) 5631.
88. D. Kumar, S. Varma, N. M. Gupta, Catal. Today, 93 (2004) 541.
89. Y. Zhao, J. Feng, Q. S. Huo, N. Melosh, G. H. Fredrickson, B. F. Chmelka, G. D. Stucky, Science, 279 (1998) 548.
90. F. Kang, Q. Wang, S. Xiang , Mater. Lett., 59 (2005) 1426.
91. P. Kumar, N. Mal , Y. Oumi, K. Yamana, T. Sano, J. Mater. Chem., 11 (2001) 3285.
92. T. S. Jiang, Y. H. Li, X. P. Zhou, Q. Zhao, H. B. Yin, J. Chem. Sci., 122 (2010) 371.
93. Q. S. Huo, D. I. Margolese, U. Ciesla, P. Feng, T. E. Gier, P. Sieger, R. Leon, P. M. Petroff, F. Schüth, G. D. Stucky, Nature, 368 (1994) 317.
94. G. Muthu Kumaran, S. Garg, K. Soni, M. Kumar, J. K.Gupta, L. D. Sharma, G. Murali Dhar, K. S. Rama Rao,. Micropor. Mesopor. Mater. 114 (2008) 103
95. D. Y. Zhao, Q. S. Huo, J. Fend, B. F. Chmelka, G. D. Stucky, J. Am. Chem. Soc., 120 (1998) 6024.
96. Q. S. Huo, D. I. Margolese, G. D. Stucky, Chem. Mater., 8 (1996) 1147.
97. H. Shimada, S. Yoshitomi, T. Sato, N. Matsubayashi, M. Imamura, Y. Yoshimura, A. Nishijima, Stud. Surf. Sci. Catal., 106 (1997) 115.
98. K. Sato, Y. Nishimura, K. Honna, N. Matsubayashi, H Shimada, J. Catal., 200 (2001) 288.
99. T.-O. Do, A. Nossov, M.-A. Springuel-Huet, C. Schneider, J. L. Bretherton, C. A. Fyfe, S. Kaliaguine, J. Am. Chem. Soc., 126 (2004) 14324.
100. S. Lowell, J. E. Shields, M. Thomas, M. A. Thommes, 2006. Characterization of Porous Solids and Podwers: Surface Area, Pore Size and Density (Ed,), Springer, 347.
101. http://supriyo.net/research1_files/image020.jpg
102. http://www.chemistry.wustl.edu/files/chemistry/Clipboard06.jpg
103. The Cluster of Excellence ‘Tailor-Made Fuels from Biomass’, year Report 2009.
104. J. Kim, G. W. Roberts, D. J. Kiserow, Chem. Mater., 18 (2006) 4710.
105. Y.-J. Han, J. M. Kim, G. D. Stucky, Chem. Mater., 12 (2000) 2068.
106. M. Kelly, J. Kim, G. Roberts, H. Lamb, Top. Catal., 49 (2008)178.
107. J. Kim, M. J. Kelly, H. H. Lamb, G. W. Roberts, D. J. Kiserow, J. Phys. Chem. C 112 (2008) 10446.
108. A. Cabanas, X. Y. Shan, J. J. Watkins, Chem. Mater., 15 (2003) 2910.
109. J. M. Blackburn, D. P. Long, J. J. Watkins, Chem. Mater., 12 (2000) 2625.
110. N. Theyssen, K. Yan, F. Qin, W. Leitner, Synthesis of nano-catalysts by chemical fluid deposition and their application in the transformation of biomass-monomers. Cluster of Excellence Tailor-Made Fuels from Biomass, year Report 2010.

84
Chapter 4 – Dehydration of Sugar using
supported Metal Nanoparticles Catalysts
4.1 Introduction
Biomass is considered a very promising feedstock for production of biofuel and bio-
based chemicals.1-4 New processes based on lignocellulosic biomass may open a new
route to produce biofuel and chemicals instead of diminishing non-renewable
petroleum resources. Along this line a major focus has been on development of
catalytic methods for transformation of lignocellulose such as selective dehydration
and efficient reductions of biomass-derived acids5, esters6 and lactones7. It has been
demonstrated that selective conversion of the available and cheap fructose and
glucose to platform molecules 5-hydroxymethylfurfural (HMF)8-11 and levulinic acid
(LA)12-16 is a promising and encouraging strategy to achieve the goal. A variety of
structurally divergent furans as potential fuels, fuel additives or solvents have been
established derived from HMF and LA.17 Moreover, HMF and LA were already
identified among top 12 valued chemicals that commonly regarded as a promising
building block for sustainable production of biofuel and value-added chemicals.17-20
HMF and LA are traditionally formed by treatment of 6-carbon sugar from
starch or lignocelluloses with strong mineral acid such as HCl. In the presence of
acidic species, the produced key intermediate fructose is dehydrated, producing a
number of compounds such as HMF, furfural, LA, formic acid and others.10, 18
Published work for the formation of LA and HMF was already summarized in Table
1.1 and 1.2 of Chapter 1, respectively.
Although great developments have been achieved in improvement of levulinic
acid and HMF yields (Table 1.1 and 1.2 in Chapter 1), more efficient methods for
production of levulinic acid and HMF are still needed. Especially for LA production,
both activity as well as selectivity issues has to be improved. For example reported
TONs do not exceed 20 in nearly all cases! But also the many side-products including

85
humins formation is problematic - not only for the reasons of lower yields but also for
complicating isolation procedures for the platform chemicals substantially. In this
study, we try to further better understand these issues, identify important parameters
to improve the levulinic acid yield.
To date, a lot of researchers have reported nanocatalysts are fit for hydrolysis of
cellulose9-12 and dehydration of alcohol.10, 16 However, to the best of our knowledge,
the present study is the first one in which CFD is used to synthesize supported metal
nanoparticles catalysts for selective dehydration of sugar-derived monomers (D-
fructose or D-glucose).
4.2 Catalytic performance of Pd/SBA-15 prepared by a modified CFD
4.2.1 Solvent effect and metal influence on dehydration of D-fructose
When we applied the resulting catalysts (3% Pd/SBA-15, prepared in section 3.3 of
Chapter 3) for the dehydration of D-fructose, a strong solvent effect could be
observed (Scheme 4.1): If water was used as a solvent, HMF was primarily produced
with 35% yield (Table 4.1, entry 1). In contrast, ethanol as a reaction media under
otherwise identical reaction conditions resulted in the highly preferred formation of
levulinic acid (40% yield, entry 2). Consistently, if mixture of water and ethanol were
used, a more balanced (but unwanted) product distribution of HMF (12.4%) and LA
(23.5%) was obtained (entry 3).
Scheme 4.1 Dehydration of D-fructose into HMF or LA

86
Table 4.1 Metal and solvent effect towards the catalytic dehydration of D-fructose a
Product Yields Entry Catalyst Solvent Conversion HMF LA
1 3% Pd/SBA-15 H2O 83.7% 35.0% 0.2%
2 3% Pd/SBA-15 EtOH 68.1% 4.7% 40.4%
3 3% Pd/SBA-15 EtOH + H2O
(7/3)b 55.7% 12.4% 23.5%
4 3% Pd/SBA-15 THF 85.5% 1.0% 43.6%
5 3% Pd/SBA-15 2-MTHF >99% 4.5% 0%
6 SBA-15 H2O 86.9% 15.9% 1.9%
7 SBA-15 EtOH 78.8% 12.6% 3.4%
8 None H2O 69.6% 3.1% 1.2%
9 None EtOH 60% 1.0% 0.7%
a m (D-fructose) = 0.2 g, m (catalyst) = 0.1 g, N (Pd): N (SiO2) : N (D-fructose) = 1 : 57 : 39, V (solvent) = 10 mL, T = 180°C, t = 1 h, stirring speed = 900 rpm, V (autoclave) = 36 mL, samples are analyzed by ELSD and RI detectors, conversion and yield were calculated based on HPLC analysis, the used method was as described in chapter 2.8.
b The given ratio is chosen in form of Vol-%
Choosing THF as a solvent still increases the conversion and the yield towards LA
(44% yield, entry 4). Surprisingly, 2-MTHF as a promising biofuel led also to a
complete conversion but switches the selectivity to HMF again (4.5% yield, entry 5).
Notably, no formation of levulinic acid was observed in this case. Instead, furfural
was produced in 10.3% yield, which was possibly produced in a parallel reaction path
to HMF demonstrated by Moreau et al.21 Besides, high amounts of non detectable side
products were produced (around 85%) – most likely humines or other deposited solid
polymers.22-24
Although the current data set does not allow an evidence-based explanation for
the highly pronounced solvent effect, the presence (or the formation of an additional
water phase as in case of 2-MTHF) might reduce LA production: Ethanol and THF
are completely miscible with the built water whereas 2-MTHF has a limited water
solubility (~13 wt% at 25 °C).25 Only for this solvent, significant amounts of furfural
(around 10% yield) as a by-product could be detected.

87
Besides, the colors of the reaction mixtures differ significantly: Nearly colorless
solutions were obtained in ethanol (Figure 4.1, left), while yellow to brown solutions
were observed in water (Figure 4.1, right).
Figure 4.1 Typical color of dehydration products distribution in ethanol (left) and water (right)
The catalytic contributions of SBA-15 and the deposited metal fraction were also
investigated. The transformation into HMF seems to be almost independent from the
presence or absence of palladium ensembles as pure SBA-15 led to comparable HMF
yields both in water (Table 4.1, entry 6 vs. 1) and ethanol (entry 7 vs. 2) as a solvent.
A blind experiment in ethanol without the use of Pd and SBA-15 resulted in a lower
conversion and a product mixture, whereby furfural, HMF (1.0% yield) and LA (0.7%
yield) are produced in rather similar amounts with low yield (entry 9).
If LA was produced, formic acid should be produced in the same molar
according to reaction network, however, the observation of the by-product formic acid
could only be detected in a few cases by HPLC-analysis. This was possible due to the
decomposition of formic acid on metal surface. Therefor further experiments were
performed in which formic acid was used as a substrate under the standardized
conditions. Its decomposition into the possible products CO and H2O or CO2 and H2
(Figure 4.2) became apparent by an increase of the reactor pressure during the
reaction from 1.5 MPa to 2.0 MPa in case of SBA-15 respective 1.5 MPa to 3.0 MPa
for Pd/SBA-15. Since the left amount of formic acid is lower in the latter case and an
analytical method is impossible to determine, we are currently not able to discriminate
between a higher degree of conversion, a preferred formation of CO2 and H2 or a
mixed phenomenon as reasons for the more pronounced pressure increase in the case

88
for the metal containing catalyst system.82 A possible reaction pathway and more
details will be discussed in section 4.3.
Figure 4.2 Possible pathways for formic acid decomposition including a reasonable explanation for the higher pressure increase in case of the Pd-assisted reaction.30
In summary, these observations argue for SBA-15 being the crucial catalyst for
HMF formation and Pd being the crucial catalyst component for LA formation in
“water absorbing solvents” like ethanol and THF. Notably, the formation of ethyl
esters, neither levulinates nor formates, could be detected by HPLC analysis which
makes the presence of a support with a pronounced acidity less likely and argues
again for a strong influence of metal catalysis.
4.2.2 Rehydration of HMF
To get some further insights in these reaction cascades, HMF was also used as a
starting material. Consistent with reports from the literature,26-29 we thought initially
that HMF is the intermediate for the formation of levulinic acid (Scheme 4.2). But this
turned out to be quite unlikely during our study.
Scheme 4.2 Traditionally regarded mechanisms for formation of LA from HMF.28
HCOOH
CO + H2O (↓)
CO2 + H2
(I)
(II) Pathway (II) is maybe preferred
1.5 → 3.0 MPa Pd@SBA-15
Pathway (I) is maybe preferred
1.5 → 2.0 MPa SBA-15
Hypothesis Pressure increase Catalyst

89
Table 4.2 Rehydration of HMF using different solvent and catalysts a
Product yield / % Entry Solvent Catalyst Conv. / % LA Furfural
1 3% Pd / SBA-15 86.2 0 5.4
2 EtOH
SBA-15 20.9 2.1 7.8
3 3% Pd / SBA-15 72.2 0 3.7
4 EtOH + H2O (10/1)
SBA-15 16.5 8.5 6.9
5 EtOH 5% Pd / SBA-15 12.0 0 0
6 EtOH + H2O (10/1) 5% Pd / SBA-15 7.3 0 0
a m (HMF) = 0.14 g, m (catalyst) = 0.1 g, N (Pd) : N (SiO2) : N (HMF) = 1 : 57 : 56; V (solvent) = 10 mL, T = 180°C, t = 1 h, stirring speed = 1000 rpm, V (autoclave) = 36 mL, conversion and yield were calculated based on HPLC analysis, the used method was as described in chapter 2.8.
As can be seen from the reaction equation in Scheme 4.2, water must be present for
LA formation, that’s why we added small amounts of water when ethanol was used as
a solvent for the desired LA formation. We performed several reactions using ethanol
and a mixture of ethanol and water to investigate the products distribution (Table 4.2).
In the absence of water the sole formation of black particles (most likely humins)
were observed (entry 1, 2 and 5). An analysis of humins could not be done with the
applied analytical method.
Dependent from the presence or absence of a palladium phase, LA could be
detected with no or only very low yield (entry 1 vs. 2 and 3 vs. 4 in Table 4.2). So
also in the presence of small amounts of water, absolutely no formation of levulinic
acid was observered if a palladium phase was present. This can be explained in two
directions: One possibility is that HMF is not an intermediate in the formation of
levulinic acid under our reaction conditions (Table 4.1 and 4.2). The other possibility
is that the produced LA reacts with present HMF to form humins or other products of
higher molecular weight that are insoluble and thereby not detectable in LC analysis.
When we increased the palladium loading from 3 to 5 wt-%, still no formation of
LA could be observed (Table 4.2, entry 5 vs. 1 and 6 vs. 2). Compared with pure
SBA-15, the palladium phase works even as an inhibitor of the reaction, as the
conversion decreased with increasing loading (entry 5 vs. 2 and 6 vs. 4).

90
4.2.3 Fructose dehydration in water – changes of pH, pressure and weight
Stimulated by the results from formic acid decomposition, several comparative
reactions in the dehydration reaction of D-fructose were designed to elucidate the
building reaction pressure more closely (Table 4.3). The vapor pressure of water was
determined to be 5.7 bar at 180 °C (entry 1). The addition of D-Fructose resulted in a
sharp pressure increase (entry 3 vs. entry 4). This is certainly the result of LA
formation cascade which is accompanied by the formation of one molecule water and
one molecule formic acid. As the critical temperatures of LA, water and formic acid
are substantially higher than the applied 180 °C, it can be expected that all these
reaction products will be condensed. Therefore, the strong pressure increase is
believed to be (at least partially) the consequence of further HCOOH decomposition
into CO2 and H2.
Having a look at the weight change before and after reaction at room temperature,
nearly no gasification of fructose occurred. The decrease in pH value after reaction
can be associated with the formation of levulinic and formic acid (entries 3 and 4).
Table 4.3 Comparative reactions of fructose dehydration in water – characterization of pH value, system pressure and mass balance (condensed phase)
No. Catalyst Fructose H2O t / min
m0
/ g m1
/ g p
/ bar pH0 pH1
1 ---- ---- 10 mL 0 340.9 340.6 5.7 ---- ----
2 3%
Pd/SBA-15 ---- 10 mL 0 340.3 339.6 6.5 2.7 2.83
3 3%
Pd/SBA-15 0.204 10 mL 1 341.2 341.0 10.8 2.5 2.4
4 3%
Pd/SBA-15 0.202 10 mL 60 340.8 340.3 12.3 2.5 2.37
Note: m0 is the weight of the autoclave inlet before reaction and m1 is the weight after reaction. pH0 is the value before reaction and pH1 is the value after reaction. p is the system pressure at 180 °C. Slide differences of pressure in the range of ±0.6 bar were obtained in different reactions. The pH meter was used in the high pressure laboratory in MPI. pH value should have slide difference.
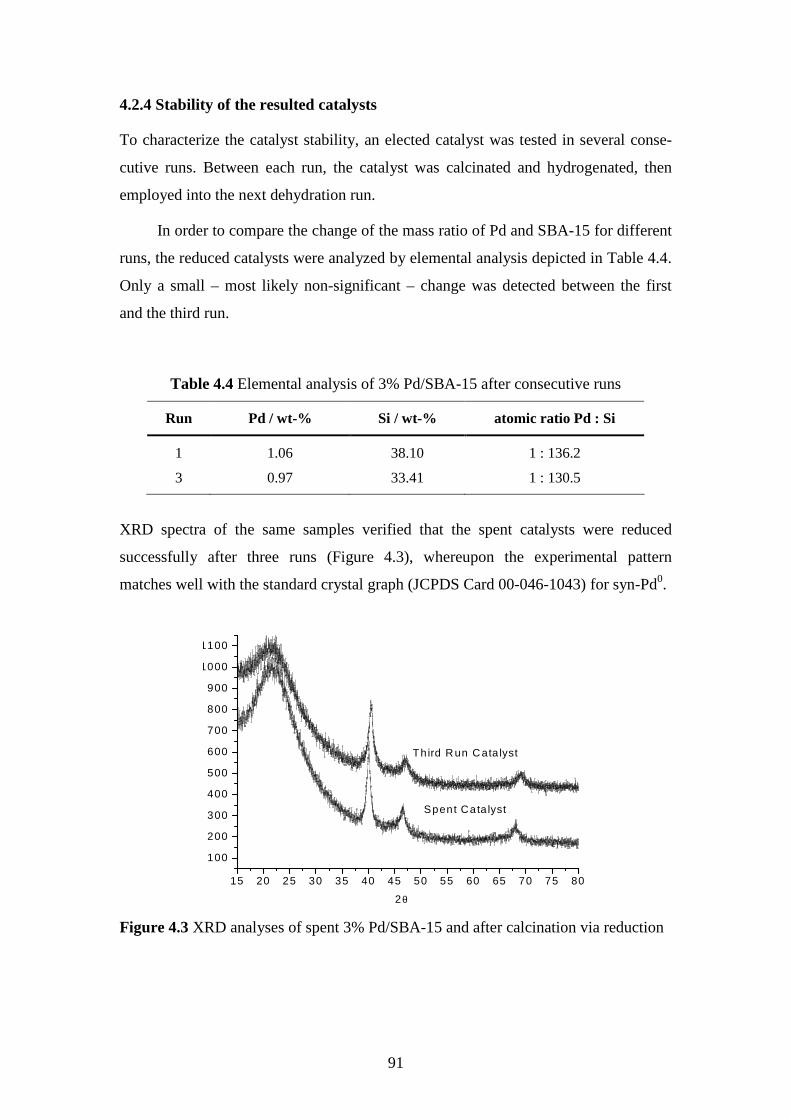
91
4.2.4 Stability of the resulted catalysts
To characterize the catalyst stability, an elected catalyst was tested in several conse-
cutive runs. Between each run, the catalyst was calcinated and hydrogenated, then
employed into the next dehydration run.
In order to compare the change of the mass ratio of Pd and SBA-15 for different
runs, the reduced catalysts were analyzed by elemental analysis depicted in Table 4.4.
Only a small – most likely non-significant – change was detected between the first
and the third run.
Table 4.4 Elemental analysis of 3% Pd/SBA-15 after consecutive runs
Run Pd / wt-% Si / wt-% atomic ratio Pd : Si
1 1.06 38.10 1 : 136.2
3 0.97 33.41 1 : 130.5
XRD spectra of the same samples verified that the spent catalysts were reduced
successfully after three runs (Figure 4.3), whereupon the experimental pattern
matches well with the standard crystal graph (JCPDS Card 00-046-1043) for syn-Pd0.
15 20 25 30 35 40 45 50 55 60 65 70 75 80
100
200
300
400
500
600
700
800
900
1000
1100
Third R un C ata lyst
2θ � �
Spent Cata lyst
Figure 4.3 XRD analyses of spent 3% Pd/SBA-15 and after calcination via reduction

92
4.2.5 Short summary
1. Pd nanoparticles supported on SBA-15 were prepared by a modified chemical
fluid deposition method. XRD, XPS, TEM and EDX show the successful
preparation with nice distribution of particle sizes using Pd(OAc)2 as a
precursor.
2. A quite pronounced solvent and metal influence were observed in the
dehydration of D-fructose. It was clearly shown that the used solvents play a
key role in transformation of D-fructose to HMF or Levulinic acid. When we
employ water as a solvent, HMF was the main product obtained. Under
otherwise similar conditions the usage of ethanol as a solvent resulted in the
highly preferred formation of levulinic acid.
3. Based on a variety of reactions in which HMF was used as a substrate, no
levulinic acid was found in water or ethanol as a solvent. More details and
information will be discussed in section 4.3.
4.3 Dehydration of D-fructose using homo-and bimetallic nanocatalysts by CFD
4.3.1 Evaluation of supported homo-Pd nanoparticles catalysts
The catalytic activity of the obtained homo-Pd nanoparticle catalyst was tested in the
dehydration of D-fructose to LA (Scheme 4.3). As evaluation criteria conversion and
yield were chosen. Table 4.5 gave an overview of the synthesis protocols for the
obtained catalysts and their resulting performance in dehydration.
Scheme 4.3 Dehydration of D-fructose to levulinic acid using supported homo-Pd
nanoparticle catalysts in the first experimental plan
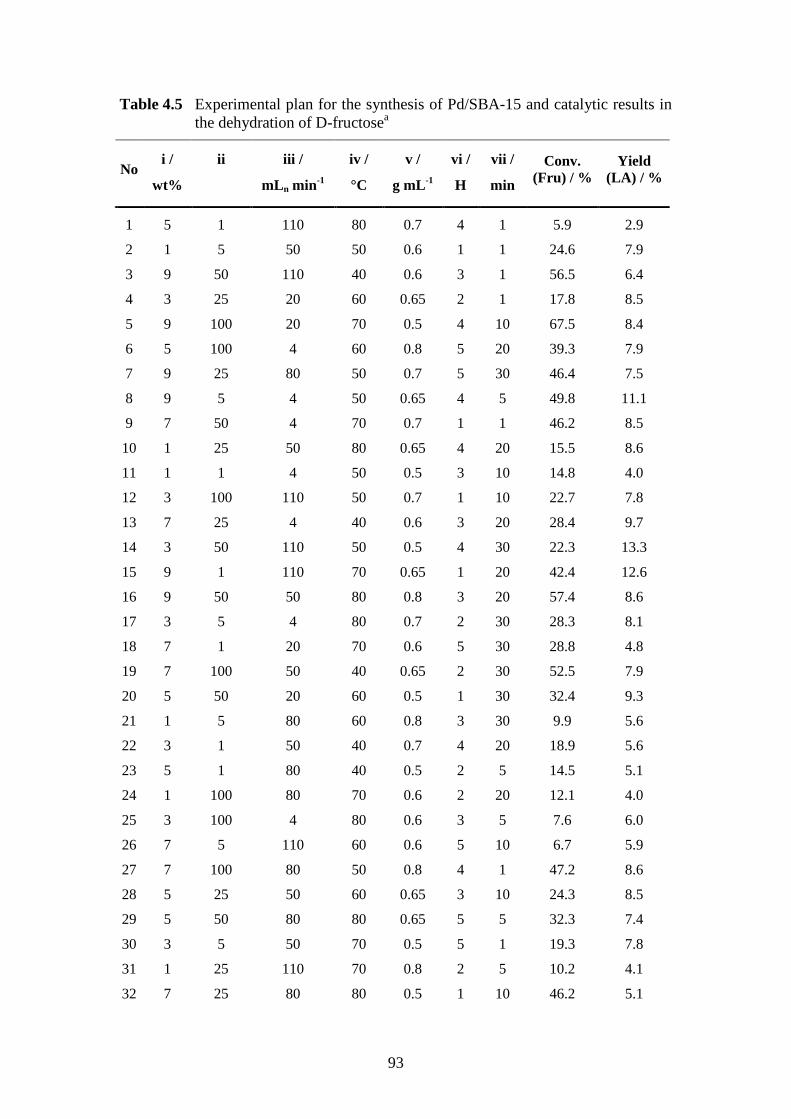
93
Table 4.5 Experimental plan for the synthesis of Pd/SBA-15 and catalytic results in the dehydration of D-fructosea
i / ii iii / iv / v / vi / vii / No
wt% mL n min-1 °C g mL-1 H min
Conv. (Fru) / %
Yield (LA) / %
1 5 1 110 80 0.7 4 1 5.9 2.9
2 1 5 50 50 0.6 1 1 24.6 7.9
3 9 50 110 40 0.6 3 1 56.5 6.4
4 3 25 20 60 0.65 2 1 17.8 8.5
5 9 100 20 70 0.5 4 10 67.5 8.4
6 5 100 4 60 0.8 5 20 39.3 7.9
7 9 25 80 50 0.7 5 30 46.4 7.5
8 9 5 4 50 0.65 4 5 49.8 11.1
9 7 50 4 70 0.7 1 1 46.2 8.5
10 1 25 50 80 0.65 4 20 15.5 8.6
11 1 1 4 50 0.5 3 10 14.8 4.0
12 3 100 110 50 0.7 1 10 22.7 7.8
13 7 25 4 40 0.6 3 20 28.4 9.7
14 3 50 110 50 0.5 4 30 22.3 13.3
15 9 1 110 70 0.65 1 20 42.4 12.6
16 9 50 50 80 0.8 3 20 57.4 8.6
17 3 5 4 80 0.7 2 30 28.3 8.1
18 7 1 20 70 0.6 5 30 28.8 4.8
19 7 100 50 40 0.65 2 30 52.5 7.9
20 5 50 20 60 0.5 1 30 32.4 9.3
21 1 5 80 60 0.8 3 30 9.9 5.6
22 3 1 50 40 0.7 4 20 18.9 5.6
23 5 1 80 40 0.5 2 5 14.5 5.1
24 1 100 80 70 0.6 2 20 12.1 4.0
25 3 100 4 80 0.6 3 5 7.6 6.0
26 7 5 110 60 0.6 5 10 6.7 5.9
27 7 100 80 50 0.8 4 1 47.2 8.6
28 5 25 50 60 0.65 3 10 24.3 8.5
29 5 50 80 80 0.65 5 5 32.3 7.4
30 3 5 50 70 0.5 5 1 19.3 7.8
31 1 25 110 70 0.8 2 5 10.2 4.1
32 7 25 80 80 0.5 1 10 46.2 5.1

94
33 1 50 20 40 0.7 5 5 35.6 3.7
34 5 5 20 40 0.8 1 10 9.8 4.5
35 9 1 20 60 0.8 2 5 16.8 3.0
a reaction conditions: m (D-fructose) = 202 mg, m (Pd/SBA-15) = 104 mg, V (ethanol) = 10 mL, T = 180 °C, t = 1 h, stirring speed = 1000 rpm, V (autoclave) = 36 mL; analysis by HPLC using a UV and RI detector. The conversion and yield were calculated based on HPLC analysis, the used method was as described in chapter 2.8.
For the dehydration of D-fructose to levulinic acid (LA), significant catalytic activity
and selectivity could be obtained for selected catalysts. The most effective catalyst
3%Pd/SBA-15 resulting in a LA yield of 13% (Table 4.5, No. 14).
The application of DOE indentified the most important factors for catalyst
synthesis: The yield is significantly influenced by loading amount (p = 0.0446, ↓) and
a two factor interaction of ratio of H2 to Pd and H2 addition rate (p = 0.0423, ↓↓). A
suitable model (p = 0.3823) which describes the selectivity behavior could not be
obtained. The model for D-Fructose conversion was significant (p = 0.0004), whereby
loading amount (p < 0.0001, ↑, Figure 4.5) and the ratio of H2 to Pd (p = 0.0069, ↑)
were found to be the discriminating reaction parameters.
1 3 5 7 9
5
20.75
36.5
52.25
68
A: loading amount
conv
ersi
on
One Factor
Figure 4.4 Pd-loading amount was proven to be a decisive reaction parameter in the conversion of D-fructose.

95
4.3.2 Evaluation of homo-and bimetallic nanoparticles catalysts
Based on the experience from the first experimental plan (chapter 4.3.1), the influence
of Pt as a second catalytically active metal was investigated. To keep the experimental
effort in manageable limits, the amount of independent factors were kept to seven.
Therefore the reduction time of the catalyst was kept constant to the former maximum
value of 30 min which was expected to behave only little detrimental for synthesizing
potent catalysts. A series of homo- and bimetallic catalysts were synthesized which
were prepared by chemical fluid deposition according to the experimental plan (see
chapter 3.3.3 and Table 4.6 for further details. The resulting catalysts were used for
dehydration of D-fructose to LA (Scheme 4.4).
As can be seen in Table 4.6, a large variety in catalytic activity was obtained as a
result of the variation in the synthesizing conditions of the catalyst. Attempts to fit
these results in suitable models for describing conversion, selectivity, yield and TON
failed. As a consequence, an optimization by prediction of best synthesizing
conditions was not possible as well.
Scheme 4.4 Dehydration of D-fructose to levulinic acid using homo- and bimetallic catalysts synthesized in the second experimental plan
Table 4.6 Catalyst design and their catalytic performances in fructose dehydrationa
i / ii / iii / iv / v / vi / vii / No
wt% 1 mL n min-1 °C g
mL -1 H 1
Conv. (Fru.) /
%
S (LA)
/ %
Y(LA) /
%
TON
(LA)
1 3 10 100 50 0.7 2 1/3 64.6 37.0 23.9 9.4
2 5 20 60 50 0.6 2 1/3 53.5 62.4 33.4 7.9
3 5 20 60 50 0.6 2 1/3 64.3 46.3 29.8 7.1
4 7 40 140 50 0.6 2 1/3 79.6 37.6 29.9 5.1
5 7 20 140 60 0.6 3 1/0 93.9 25.5 23.9 4.0
6 3 10 100 40 0.5 1 0/1 72.8 48.4 35.2 13.9
7 5 80 140 40 0.7 4 0/1 62.6 13.4 8.4 2.0

96
8 3 10 20 40 0.5 3 0/1 61.6 14.7 9.1 3.6
9 5 40 140 70 0.8 4 1/0 >99 51.4 51.4 12.1
10 7 80 60 50 0.7 4 1/0 >99 37.9 37.9 6.4
11 3 10 20 40 0.5 1 1/3 64.9 22.0 14.3 5.6
12 5 20 20 70 0.5 1 3/1 92.3 52.5 48.5 11.4
13 9 40 140 50 0.7 2 3/1 72.1 85.9 61.9 8.1
14 9 80 60 60 0.6 1 3/1 76.8 40.9 31.4 4.1
15 5 80 140 70 0.6 3 3/1 58.4 37.2 21.7 5.1
16 9 20 100 50 0.8 4 3/1 76.8 45.7 35.1 4.6
17 9 10 20 40 0.5 1 0/1 66.1 11.1 7.32 1.0
18 9 40 60 50 0.8 3 1/3 83.7 33.0 27.6 3.6
19 7 40 100 60 0.7 3 3/1 64.5 82.9 53.5 9.1
20 5 80 100 60 0.6 2 1/0 81.2 32.9 26.7 6.3
21 3 10 20 60 0.5 1 0/1 63.2 63.6 40.2 16.5
22 3 10 20 40 0.8 1 0/1 66.7 14.5 9.7 3.9
23 5 20 100 70 0.7 3 1/1 79.2 33.6 26.6 6.3
24 9 20 60 60 0.7 4 1/3 90.3 41.6 37.6 4.9
25 3 80 20 40 0.5 1 0/1 65.1 13.7 8.9 3.5
26 7 40 100 60 0.7 3 3/1 74.6 68.6 51.2 8.9
27 7 80 60 70 0.8 2 3/1 75.0 55.3 41.5 7.0
28 7 20 100 60 0.8 2 1/3 56.1 16.9 9.5 1.6
29 7 80 60 50 0.7 4 1/0 85.2 45.1 38.4 6.5
30 3 10 20 40 0.5 3 0/1 61.4 16.0 7.6 3.9
31 5 40 140 70 0.8 4 1/0 95.5 35.8 34.2 8.1
32 9 40 60 70 0.6 4 1/0 85.8 63.1 54.1 7.1
(i) loading amount of metal (1 - 9 wt %); (ii) molar ratio of H2 to metal (1 - 100); (iii) addition rate of H2 (4 - 110 mLn/ min); (iv) density of carbon dioxide (0.50 - 0.80 g / mL); (v) reaction temperature (40 - 80 °C); (vi) molar ratio of Pt toward Pd; (vii) impregnation time (1 - 4 h). The conversion and yield were calculated based on HPLC analysis, the used method was described in chapter 2.8. TON was calculated on the total amount of the metals in the used Pd and Pt precursor.
a dehydration conditions: m (D-fructose) = 0.204 g, m (catalyst) = 0.104 g, V (ethanol) = 10 mL, T = 180 °C, t = 1 h, stirring speed = 1000 rpm, V (autoclave) = 36 mL; analysis system as reference 31.
In general, all synthesized homo- and/or bi-metallic catalysts display activity in
dehydration, although quite different performances can be identified. Good yields
were achieved for a variety of catalysts (Tabele 4.6, entries 12, 13, 26 and 32). The
highest yield obtained was 62% at 86% conversion. This is quite remarkable result
compared to the best ones from literatures and patents as shown in Table 1.1 of
Chapter 1. The biggest differences can be seen in the variety of LA selectivity ranging

97
from 11% to 86% (Table 4.6, entry 17 vs. 13). For the dehydration of D-fructose to
LA, the catalytic performances are influenced most by the metal composition, which
can be divided into four groups: Pd/SBA-15, Pd3-Pt1/SBA-15 (Pd-Pt ratio = 3:1), Pd1-
Pt3/SBA-15 (Pd-Pt ratio = 1:3) and Pt/SBA-15.
It is apparent to note that the catalytic performances of the bimetallic catalysts
show superior performances in comparison with both classes of synthesized homo-
metallic catalysts, whereby the metallic ratios of Pt toward Pd seems to be the most
deciding factor for the catalytic performance. It can be stated that the presence of
homo- and/or bi-metallic palladium and platinum ensembles triggers clearly the
formation to levulinic acid as comparative experiments using SBA-15 alone (Table
4.7, Entry 5) led to a more pronounced formation of HMF (Y = 20.5%). LA is only
obtained with 2.5% yield then. A blind experiment without the use of Pd, Pt and SBA-
15 resulted in a lower conversion of 52% and, again, in a different product
composition (Entry 6), whereby furfural (Y = 7.3%) and HMF (Y = 9%) were
observed as the main detectable components.32
Table 4.7 Dehydration of D-Fructose to LA – best results achieved in comparison with literature reported ones.
Entry CatRef T / °C t / h solvent Yield (LA)
1 Pd@SBA-15 (Table 4.6, No.21) 180 1 ethanol 40.2%
2 Pt@SBA-15 (Table 4.6, No.32) 180 1 ethanol 54.1%
3 Pd3-Pt1@SBA-15 (Table 4.6, No.24) 180 1 ethanol 37.6%
4 Pd1-Pt3@SBA-15 (Table 4.6, No.13) 180 1 ethanol 61.9%
5 SBA-15 180 1 ethanol 2.0 ± 0.5%
6 None 180 1 ethanol < 0.5%
7 LZY Zeolite26 140 15 neat 67%
8 mineral acids33 98 1 water 75 ± 5%
9 HCl34 162 1 water 39%
10 Amberlite IR-12035 R.T. 27 water 36%
11 HCl36 100 24 water 80%
12 Lewatit SPC 108 resin37 80 0.5
Water,MIBK
79%
Noteworthy, the absence of esters such as ethyl levulinate or ethyl formate in the
reaction mixtures argues against a pronounced contribution of acid catalysis, which

98
further supports the made claim for metal catalysis. In combination with the good
recyclability (discussed in chapter 4.3.5), the obtained results in LA formation
compare favorably with the best studies from literature.26, 33-38
The application of Experimental Design ´Software allows in principle the
identification of suitable models and the identification of crucial reaction parameters.
This might allow a straightforward optimization procedure by prediction.
Unfortunately, no suitable models could be gained from the data set which is most
likely the result of too many screened reaction parameters in combination with a too
large experimental range for each factor. The only usable result of DOE is that the
ratio between Pd and Pt is a significant reaction parameter for conversion of D-
fructose (Pt↑, Table 4.8). However, the variation in the synthesizing conditions
(initiated by the experimental plan) led to remarkable results in terms of LA
conversion and selectivity.32
Table 4.8 Statistical analysis for dehydration using Design Expert Software
Target Value Model Quality Significant parameter
(trend, p-value) Optimization
Conversion (D-Fructose)
F-value = 3.27 (not significant)
Predicted R-Squared = 0.121 (prediction not possible)
Adequate Precision = 5.69 (the signal to noise ratio is ok)
Pd-Pt ratio, Pt↑,
p = 0.0164 Not possible
Selectivity (Levulinic acid)
No model could be obtained None Not possible
TON No model could be obtained None Not possible
4.3.3 Catalyst characterization of fresh and spent catalysts
To aid our understanding in the relationship between the catalysts and their
performance, a series of representative fresh and spent catalysts were characterized by
different techniques. Diffraction patterns from XRD analysis of the elected fresh and

99
directly spent catalysts (after the first experiment) for dehydration of D-fructose to LA
are depicted in Figure 4.4.
Figure 4.4 XRD diffraction patterns from fresh (I) and spent (II) catalysts:
(a) Table 4.6, No. 17; (b) No. 13; (c) No. 19; (d) No. 29
The XRD analysis of the fresh catalyst No. 17 (Figure 4.4, I a) show four weak peaks,
indexed as 2θ= 18o (111), 22o (200), 30o (220) and 34.5o (311) indentified as the signal
hexagonal fcc phase of palladium (JCPDS Card 00-046-1043). Fresh samples of the
bimetallic catalysts (I b and c), can be ascribed in an analogues manner to the single
hexagonal fcc phase of palladium (JCPDS Card 01-071-3757) and platinum (JCPDS
Card 01-070-2057). Especially for sample (c) the peaks became clearly stronger after
reaction which might be a consequence of the temperature and solvent initiated
reordering of the primary crystallites during the reaction. The monometallic Pt
samples displays five strong peaks both in the fresh (Id) and spent catalyst (IId). The
crystal phases indexed as 18o (111), 22o (200), 30o (220), 34.5o (311) and 47o (222)
identified as single hexagonal fcc phase of platinum (JCPDS Card 00-004-0802).
Overall, XRD analyses show that all elected loading results in the presence of
particulate metal catalysts which behave stable in the course of reaction.
I: fresh catalyst II: spent catalyst

100
In order to characterize the oxidation state of the metallic ensembles more precisely at
the surface, a catalyst of intermediate activity (9% Pd1-Pt3/SBA-15, Table 4.8, No. 24)
was further characterized by XPS (Figure 4.5).
(a) Pd (b) Pt
Figure 4.5 XPS analysis of fresh catalyst No. 24 (9% Pd1-Pt3/SBA-15)
As expected, the presence of two prominent sets of Pd 3d and Pt 4f peaks, corres-
ponding to the 3d3/2 and 3d5/2 respective 4f7/2 and 4f5/2, demonstrated that Pd and Pt are
present on the surface of SBA-15. The peaks regions of Pd (Figure 4.5 a) can be fitted
with two sets of peaks at 340.6 eV (3d3/2) and 335.3 eV (3d5/2). In the case of Pt
(Figure 4.5 b), two sets of peaks at 69.6 eV (4f7/2) and 73.9 eV (4f5/2) were detected.
All these signal positions confirmed the exclusive presence of Pd0 and Pt0 atoms on
the surface.39-46
To determine the amount of deposited metal during the preparation, energy
dispersive x-ray (EDX) was employed. Elements in an EDX spectrum are identified
based on the energy content of the X-rays emitted by excited electrons if they transfer
from a higher-energy shell to a lower-energy one.47, 48 EDX spectra of the fresh and
spent catalyst No. 24 (9% Pd3-Pt1/SBA-15) are shown in Figure 4.8, the results of
numeric analysis are given in Table 4.9. Around 4.7 wt-% Pd and 1.6 wt-% Pt were
detected in the fresh catalyst. The atomic Pd: Si ratio was 1: 27.0 for the fresh and 1 :
24.5 for the spent catalyst.

101
Figure 4.6 EDX analysis of fresh (top) and spent (bottom) catalyst No. 24
Table 4.9 EDX analysis of fresh and spent catalyst 9% Pd3-Pt1/SBA-15
Fresh catalyst Spent catalyst
Elementa Mass/% Atom/% Elementb Mass/% Atom/%
C 10.20 16.25 C 10.15 16.43
O 50.23 60.08 O 48.25 58.63
Si 33.29 22.68 Si 34.34 23.77
Pd 4.65 0.84 Pd 5.32 0.97
Pt 1.63 0.16 Pt 1.94 0.19
Total 100.00 Total 100.00
TEM images of fresh and spent catalyst No. 24 are shown in Figure 4.9. Particle size
distributions and mean sizes were calculated from TEM images as well which results

102
are given in Figure 4.8. The mean particle size of fresh catalyst No. 24 (9% Pd1-
Pt3/SBA-15) was determined to be 3.8 nm (Figure 4.8a).
A clear increase in mean nanoparticle size was observed after the catalyst was
applied in the dehydration reaction: The rise to 6.1 nm (Figure 4.10b) is most likely
the result of exposing the sample to 180 °C for 1 h in ethanol as a solvent in which D-
fructose is dissolved. In general, however, TEM graphs show no strong particles
aggregation of the fresh and spent material.
Figure 4.7 TEM images of fresh (a) and spent (b) catalyst No 24.
Figure 4.8 Size distribution of fresh (a) and spent (b) catalyst No 24.
Moreover, surface analysis based on gas sorption measurements have been performed
for pure SBA-15 as well as for the fresh and spent catalyst No. 24 (9% Pd3-Pt1/SBA-
15). BET surfaces areas, pore sizes and the volume of the meso-and micropores are
given in Table 4.10. The N2 sorption isotherms, BET plots, NLDFT Pore Size
Distribution plot and Pore Volume plot are shown in Figure 4.9.
(a) (b)
1-2 2-3 3-4 4-5 5-6 6-7 7-8 8-9 9-10 >100
6
12
18
24
30
36
42
N=437d(middle)=3.78 nm
Per
cent
age
of P
artic
les
Particle Size/nm
1-2 2-3 3-4 4-5 5-6 6-7 7-8 8-9 9-10 >100
6
12
18
24
30
36
42
Per
cent
age
of P
artic
les
Particle Size/nm
N=295d(middle)=6.05 nm
a b

103
Table 4.10 Catalytic properties of the used catalysts in dehydration
Catalyst BET surface area / m2 g-1
Pore dia-meter / nm
Mesopore volume / cm3 g-1
Micropore volume / cm3 g-1
SBA-15 643 5.4 0.417 0.088
Catalyst No. 24, fresh 399 5.3 0.306 0.042
Catalyst No. 24, spent 609 5.3 0.381 0.080
0.0 0.1 0.2 0.3 0.4 0.5 0.6 0.7 0.8 0.9 1.0 1.1
60
80
100
120
140
160
180
200
220
240
260
280
300
320
Vol
ume(
cc/g
)
P/P0
spent fresh
(a) N2 Sorption Isotherm
0,06 0,08 0,10 0,12 0,14 0,16 0,18 0,20 0,220,3
0,4
0,5
0,6
0,7
0,8
0,9
1,0
1,1
1,2
1,3
1,4
P/P0
Fresh catalyst
0,06 0,08 0,10 0,12 0,14 0,16 0,18 0,20 0,22
0,3
0,4
0,5
0,6
0,7
0,8
0,9
1,0
1,1
1,2
1,3
P/P0
Spent catalyst
(b) BET Plots
Figure 4.9 Surface area and pore volume analysis of catalyst No. 24

104
As already mentioned in Chapter 3, pure SBA-15 showed a surface area of 643 m2/g
and a pore size diameter of 5.4 nm. Except from the pore sizes, the surface area and
the volumes of mesopores and micropores of the sampled catalysts are significantly
lower, which is also extensively reported in literature.49-52 For catalyst No. 24, the
surface area was 399 m2/g before dehydration, while it increased to 609 m2/g after
dehydration. Similarly, the micropore volume increased from 0.042 to 0.088 cm3/g
and mesopore volume from 0.306 to 0.381cm3/g. This value increase might be again a
consequence of the temperature and solvent initiated reordering of primary crystallites
during the reaction. Thereby a better distribution with a lower degree of pore-blocking
is conceivable.
4.3.4 Optimization of D-fructose dehydration
In order to screen many factors to discover the vital few and perhaps how these
factors interact, two-level factorial design was applied, which is based on the initial
screening.32 During the two-level factorial design, we chose one upper and one lower
value for the following factors: reaction temperature, catalyst amount and solvent
volume. This creates a design structure named split-plot, which would specify how
model terms to be treated in the analysis of variance (ANOVA).53, 54 Here we can see
for example the gap between predicted and practical values. Or – if the obtained
model is significant – we can also use the model to predict or simulate the actual
behavior of our reaction.54 The main goal of this approach was to maximize the
conversion and selectivity in D-fructose dehydration and a systematic attempt to find
one or more significant factor(s) and maybe even interaction that would allow us to
better understand the chosen test reaction.
Table 4.11 shows the results of the two-level factorial design. It became clear
that the reaction temperature was the factor which influences conversion and
selectivity most. When the reaction was operated at low temperature 124 °C (Table
4.11; Entry 1, 2, 3 and 6), constantly lower conversions and yields were achieved.
When the reactions were operated under the same temperature, an increased catalyst
amount by a factor of four resulted in a significant rise in conversion (entries 6 vs. 1, 3
vs. 2, 5 vs. 4 and 8 vs. 7). However, the yield of levulinic acid was either comparable
or much worse in this comparison. Best performance obtained in this series was

105
observed at the higher temperature level and the lower catalyst and solvent amount
(38% yield at 86% conversion; Table 4.11, Entry 7). Compared with the catalytic
activity of a similarly produced catalyst (No. 24) in Table 4.6 (38% yield, 90%
conversion) nearly the same values were achieved, supporting the good reproducibili-
ty in the catalyst synthesis procedure.
Table 4.11 Optimization of D-fructose dehydration by two-level factorial design
Entry T / °C m (cat.) / g V (EtOH) / mL Conv. / % Y (LA) / %
1 124 0.04 8 28.3 12.2
2 124 0.04 12 31.2 17.5
3 124 0.16 12 47.9 4.8
4 196 0.04 12 70.1 21.0
5 196 0.16 12 92.2 22.6
6 124 0.16 8 54.6 13.6
7 196 0.04 8 86.1 37.6
8 196 0.16 8 96.6 22.2
Reaction Condition: m (D-fructose) = 0.204 g, t = 1 h, stirring speed = 1000 rpm, V (autoclave) = 36 mL, catalyst = catalysts No. 24 (9% Pd3-Pt1/SBA-15). The conversion and yield were calculated based on HPLC analysis, the method was described in chapter 2.8. The obtained model of DOE allows no straightforward optimization concerning
conversion and/or yield by extrapolation. Therefore, the condition as given in entry 7
was chosen for further experiments.
4.3.5 Catalysts stability and recyclability
One basic requirement for an efficient heterogeneous catalyst is its good stability and
recyclability. This necessity is dependent from the chemical, mechanical and thermal
stability. For nano-structured catalysts, even small changes of the catalytically active
surface results in a quite substantial change in catalytic activity. In a fundamental
review on catalyst deactivation by Bartholomew,55 the main factors were summarized
into six types: (i) fouling,56 (ii) vapor-solid and/or solid-solid reaction57 (iii) thermal
degradation, (iv) poisoning,58and (vi) attrition/crushing.59, 60 These six aspects of
catalyst deactivation have well been demonstrated and investigated also by several
other groups.61-65

106
In order to characterize the catalyst stability in the present study, product
separation and catalyst recycling procedures were also investigated here. For this
purpose, catalyst No. 24 (Table 4.6) was tested in consecutive runs under the
standardized reaction conditions. After each run, the spent catalyst was treated with
the procedure described in experimental section 2.15.
To determine whether the spent catalysts were reduced successfully in sub-
procedure, it has been analyzed by XPS, as shown in Figure 4.10. As expected, the
probed sample after the third recycle contained exclusively Pd0 and Pt0 centers at the
surface indicating a successful reduction.39, 41
Figure 4.10 XPS analysis of a recycled catalyst fraction (No 24, Table 4.8)
In order to further clarify the particles size and their distribution, TEM was applied.
To our delight, no large aggregation was observed for our sample (Figure 4.11).
Besides, a high degree of dispersion was also observed in all other generated TEM
pictures (not shown here). The mean particle size of the reduced catalyst after third
recycle was determined to be 4.7 nm. In comparison with the mean size of the fresh
catalyst (3.8 nm) a little increase was observed. This unavoidable increase is most
probably the result of the high reaction temperature (180 °C) in the presence of metal
coordinating substances.

107
Figure 4.11 TEM analysis of the reduced 9% Pd3-Pt1/SBA-15 catalyst
Figure 4.12 shows the individual catalytic performance of the recycled catalyst
fraction after different runs. An untreated spent catalyst fraction was employed and
displayed only 13% LA selectivity at 93% conversion (Figure 4.12, Run 1’). In
comparison with the performance of the fresh catalyst (42% selectivity at 90%
conversion), this was rather disappointing and most likely the result of unwanted
substance adsorption at the metal surface.
Fresh Run1' Run1 Run2 Run30
20
40
60
80
100
Con
vers
ion&
Sel
ectiv
ity/%
Conversion/% Selectivity/%
Figure 4.12 Catalytic performances of the recycled catalysts
Checking the catalytic reaction procedure, the spent catalyst was washed with pure
ethanol which took on a weak brownish color during this procedure. This observation
argued for the unwanted deposition of humins. EDX and TEM were endeavored to
determine the potential morphology and amount of coke or humins deposits.

108
Unfortunately, it was not possible to get meaningful results from this due to the
difficulty to identify carbon atoms with the applied methods. Later, we try to employ
ATR-IR to investigate the surface adsorption during the reaction. Three samples were
chosen for this approach: SBA-15, fresh 9% Pd1-Pt3/SBA-15 (Table 4.6, No. 13) and
spent 9% Pd1-Pt3/SBA-15. The spectra are shown in Figure 4.13. Whereas additional
C-H bonds cannot be seen, a brought but flat O-H and C-O absorption is detectable.
3 9 0 0 3 6 0 0 3 3 0 0 3 0 0 0 2 7 0 0 2 4 0 0 2 1 0 0 1 8 0 0 1 5 0 0 1 2 0 0 9 0 0 6 0 0
W a v e n u m b e r/cm -1
S B A -1 5
F re s h 9 % P d1-P t
3/S B A -1 5
S p e n t 9 % P d1-P t
3/S B A -1 5
Figure 4.13 ATR-IR analysis to identify organic residues on the catalyst surface.
In order to get rid of deposits negative influences, spent catalyst fractions were
calcined at 350 °C for 4 h and then reduced by H2 for 0.5 h. And indeed, a usage of
these materials resulted in a similar dehydration performance as the fresh catalyst.
85% conversion and 43% selectivity after the first recycling run and comparable
values in subsequent runs (80% and 82% conversion, respectively 42% and 40%
selectivity) justify the applied work-up procedure.
Furthermore, analysis of the aqueous reaction solutions (take 1.2 ml) by ICP
after reaction showed no detectable leaching of Pd (~4 ppm was found in the solution).
4.3.6 Fructose dehydration in ethanol – changes of pH, pressure and mass
To obtain some additional knowledge about the catalytic transformation, several
comparative reactions were performed to see the change of weight, pH and reaction
pressure (Table 4.14). Firstly, having a look at the weight balance before and after
reaction, we found an almost constant material loss of around 0.6 g after reaction –

109
most likely the result of substrate and solvent evaporation in the flushing and work-up
procedure. As this material loss behaves stable under the different conditions, a samll
gasification or pyrolysis process could be possible. In contrast, a clear lowering of the
pH value is measured after reaction (Table 4.12, No 3 and 4), which is certainly the
result of the formation of levulinic and formic acid.
Table 4.12 Changes in pH value, pressure and mass balance in D-fructose
dehydration
No. Catalyst Fructose/g t / min m0 / g m1 / g p / bar pH0 pH1
1 ---- ---- 0 336.98 335.25 13.9 ---- ----
2 No. 24 ---- 60 338.05 337.41 15.2 2.9 2.62
3 No. 24 0.204 1 338.35 337.77 15.6 ± 0.6 2.6 2.2
4 No. 24 0.202 60 338.24 337.50 20.1 ± 0.6 2.7 1.8
T = 180 °C, 1000 rpm, m (catalyst) = 0.1g, 10 mL EtOH was added in each run
Note: m0 is the weight of the lower autoclave part before and m1 after reaction. pH0 is the value before and pH1 after reaction. p is the system pressure at 180 °C.
Finally, having a look at the detected pressure values at 180 °C, a substantial
decomposition of formic acid can be expected for the standard reaction conditions
(entry 4) as a significant pressure increase is exclusively observed here. A similar
pressure increase was detected when formic acid was used as substrate in the presence
of the metal catalyst (Figure 4.1).
4.3.7 Performance using other support materials
Apart from the standard catalyst support material SBA-15, a variety of other support
materials and their corresponding palladium deposited counterparts were also
employed in fructose dehydration under standardized reaction conditions. The results
of the catalytic transformations are listed in Table 4.13. It is particularly noticeable
that supports with a pronounced acidity such as HY, AlSBA-15, AlMCM-41 and
ZrMCM-41 led to higher conversions of D-fructose than the neutral ones (SBA-15,
entry 1 and MCMC-41, entry 3). This is consistent with our expectation, as acidity is
known to trigger sugar dehydration. However, the increased acidity also promotes
side reactions: In spite of the high conversions, the yields of HMF or LA are relative
poor. Most importantly, the results show that all Pd deposited support materials

110
display a much higher LA yield than the unloaded materials. HMF and furfural are in
no case the main monomers in the product mixture if Pd is present. This confirms the
crucial influence of Pd in LA formation again. These results convinced us also that the
early made selection of SBA-15 as a standard support material was a good choice:
This metal doped support shows by far the best yield towards LA (entry 2 vs. 4, 6, 8,
10 and 12).
As well demonstrated in the works from references66, 67 and discussed in section 3.2 of
Chapter 3 (~Page 68), the micropores of the synthesized SBA-15 would increase at
high temperature in water enviroment. Our BET analysis (Table 4.10, ~Page 103)
between the fresh and spent catalyst further confirmed this conclusion. However, to
our delight, the micropores in the resulting metal catalysts (Entry 2, 4, 10 and 12)
display weak influence on catalytic activity (Table 4.13), although slide difference
existed.
Table 4.13 Results in D-fructose dehydration using a variety of pure and Pd deposited support materials*
Run Catalyst Conv. (Fruc.) / %
Y (HMF) / %
Y (LA) / %
Y (furfural) / %
1 SBA-15 7.9 1.5 2.5 0.6
2 5% Pd/SBA-15 12.2 1.0 8.8 2.7
3 MCM-41 77.1 1.5 6.3 0.3
4 5% Pd/MCM-41 81.4 0.1 10.5 0
5 5% Pd/C 57.1 0.2 3.0 0.4
6 5% Pd/Al2O3 85.1 0.1 7.9 0.1
7 AlSBA-15 99.6 0.9 2.5 5.5
8 5% Pd/AlSBA-15 99.5 1.0 3.7 2.3
9 AlMCM-41 76.5 22.6 0 3.9
10 5% Pd/AlMCM-41 93.1 6.8 10.1 2.6
11 ZrMCM-41 86.8 1.4 5.9 0.4
12 5% Pd/ZrMCM-41 90.1 0.1 9.5 0.2
13 HY 100 0.8 4.7 3.9
14 5% Pd/HY 99.5 1.6 12.4 4.1
*: The conversion and yield were calculated based on HPLC analysis, the used method was described
in chapter 2.8.

111
4.3.8 Network of dehydration of D-fructose
Parts of the reaction network of D-fructose conversion are depicted in Scheme 4.5.
Regarding the studies from Berry,68 Stewart69 and Moreau22 the reaction pathway for
HMF formation begins with a ketone-enol tautomerism of D-fructose (or D-glucose)
to compound 1 which is then dehydrated first into 3-deoxy-hexosulose 2 and later into
compound 3. A ring closure by nucleophilic addition and further dehydration gives
HMF. Alternatively, 3 converts into 4 by counterintuitive terminal formaldehyde
elimination. Nucleophilic ring closure and further dehydration gives furfural. Beside
furfural, its oxidation product, furoic acid, is generally found in the reaction mixture
which may happen during the work up procedure.
In addition, three side reactions were observed in total, whereupon the formation of
humins by coupling of hexoses with HMF is the dominating one. Decomposition of
formic acid to CO and H2O or to CO2 and H2 is a second important side reaction
because in most cases, the produced formic acid could not be detected in HPLC
analysis. Only in few cases similar amounts of formic and levulinic acid were
identified together. It is likely that formic acid may act as an acidic catalyst in the
dehydration step. The third side reaction, namely the formation of 5-
ethoxymethylfurfural and the fourth one, i.e. formation of ethyl levulinate, could in
principle occur under the applied reaction conditions. However, ethyl levulinate was
not observed under the standardized reaction conditions and 5-ethoxymethylfurfural
only in a very few cases in which it was tried to isolate the humin fraction.

112
Scheme 4.5 Possible side reactions in fructose dehydration
4.3.9 Proposed reaction pathways in the dehydration of D-fructose to LA
The catalytic dehydration of C6-sugars into levulinic acid has been extensively studied;
however, only a limited amount of information is available on the underlying reaction
mechanism.70, 28, 71-77 The available information implies that C6-sugars were initially

113
dehydrated under acidic conditions to form the intermediate product 5-
hydroxymethylfurfural (HMF), which was subsequently hydrated to give the final
product levulinic acid together with formic acid.
In general, a number of mechanistic studies have been undertaken on acid-
catalyzed conversion of hexose sugars to HMF and subsequently to levulinic acid
using nuclear magnetic resonance spectroscopy to elucidate intermediate products and
to determine reaction pathways.72-76 The elaborated routes might be the preferred ones
for pure acid catalysis, but fail to explain our observed metal influence on LA or HMF
formation at all (Scheme 4.6). Proposals for metal involving pathways are still
unprecedented in literatures so far.
Scheme 4.6 Dehydration of D-fructose to HMF and LA
To gain some knowledge about possible intermediates in the course of D-fructose
dehydration, the reaction was quenched after decent reaction times shown in Figure
4.14. For this purpose, the catalyst synthesis protocol which gave the highest LA yield
in Table 4.8 was reproduced several times. Up to a reaction time of 60 min (the
standard reaction time) a continuous increase in LA yield to 62% is observed. Longer
reaction times led to higher conversions but drastically reduced LA yields (34% after
90 min and 39% after 120 min). Humins or insolubly condensed polymer formation
might be an important reaction channel then, although it was not clear whether LA
would combine with sugar or HMF during the reaction procedure.

114
0 10 20 30 40 50 60 70 80 90 100 110 1200
10
20
30
40
50
60
70
80
90
20
40
50
80
Yie
ld/%
10
30
60
70
Con
vers
ion/
%
Con./% Y(HMF)/% Y(LA)/%
time influence / min
90
Figure 4.14 Influence of reaction time on the products distribution in fructose dehydration
Reaction conditions: m (D-fructose) = 0.204 g, m (catalyst No. 13, Table 4.6) = 0.1g, V (EtOH) = 10 mL, stirring speed = 1000 rpm, T = 180 °C, V (autoclave) = 36 mL. The conversion and yield were calculated based on HPLC analysis, the used method was as described in chapter 2.8.
One might wonder why at a reaction time of “0 min”, around 8% LA and 7% HMF
were already obtained at 35% conversion. This is simply a consequence of the applied
method as t0 was defined for the moment when the temperature inside the autoclave
reached 180 °C for the first time (the desired reaction temperature), which needed
about 25 min starting from room temperature.
Additionally it is interesting to note that the amount of HMF built possess
anything but a regular trend in comparison with LA formation. The highest measured
HMF concentrations at 0 min and 60 min do not “relocate” in a pronounced LA
formation during the next reaction period (at 5 or 90 min reaction time). Consistent
with observations made in chapter 4.1.2 these results argue against the role of HMF
being an intermediate in LA formation or the formation of insolubly condensed
polymer from the combination of LA with other compounds under the present
reaction conditions. Instead, a parallel reaction channel for HMF production is
expected.
Moreover, the data in Figure 4.14 make the existence of another, but undetected,
intermediate likely: After ten minutes already 48% of D-fructose is transformed, but
the sum of HMF and LA yield are considerable lower (15%). After 1 h, the
summarized HMF and LA selectivity reaches not less than 99% which clearly argues
for a LA production out of this postulated but undefined intermediate. Restrictively, it

115
should be pointed out here again that the different data points in Figure 4.14 are based
on separate batches with independent but similar produced catalyst fractions.
Noteworthy, no formation of ethyl formate could be observed at any time which can
be explained by a fast decomposition of formic acid under the reaction conditions
applied.
The reactivity of HMF as a starting material was also investigated with the most
active catalyst No. 13 (Table 4.14). Consistent with the results obtained in chapter
4.1.3, no (in wet ethanol, entry 2) or only very little amount of LA (in pure ethanol,
entry 1) was formed.
In contrast, HCl as a sole catalyst gave 10.5% LA in water as a reaction medium
and only 1.2% in ethanol under otherwise similar reaction conditions (both at
complete conversion, entry 3 and 4). A similar conclusion also argued against HMF
being an intermediate in LA production claimed most recently by Carniti and
coworkers.77 They perform dehydration of fructose and the conversion of HMF in
water on niobic acid and did not find levulinic acid at all.
Table 4.14 Rehydration of HMF using different solvents and catalysts a
Product yields / % Entry Solvent Catalyst Conv. / %
LA Furfural
1 EtOH No. 13 65.7 2.7 0
2 EtOH + H2O (10/1) No. 13 52.0 0 0
3b H2O 37% HCl >99 10.5 0
4b EtOH 37% HCl 98 1.2 <1
5b EtOH 37% HCl +
No. 13 99 0.8 <1
a m (HMF) = 0.14 g, m (catalyst) = 0.1 g, m (HCl) = 0.1 g, V (solvent) = 10 mL, T = 180 °C, t = 1 h, stirring speed = 1000 rpm, V (autoclave) = 36 mL. The conversion and yield were calculated based on HPLC analysis, the used method was as described in chapter 2.8.
b To reduce corrosion by wet HCl, a Teflon inlet was applied. An unknown product was produced in large amount in entries 4 and 5.
We further try to measure the acidity of nano-metal catalysts and the SBA-15
using NH3-TPD (Figures not shown here). Not such surprising any more, acidity
could not be detected for both the support itself and the nano-metal catalysts. So the

116
applied metal catalyst was either neutral or basic. Stimulated by this result, we
performed D-fructose dehydrations in the presence of NaHCO3 (Table 4.15, entry 1)
as a weak and Na2CO3 (entry 2) as a strong base. LA yields of 20% respective 17%
under otherwise identical reaction conditions speaks for a deactivation of the potent
catalyst No 13, which is less pronounced if HCOOH is added as a “co-catalyst” (53%
conversion and 45% LA yield, entry 5). HCOOH alone gives 11% HMF as the main
product, which is certainly a result of the well-known acid-catalyzed mechanism.21
Table 4.15 Dehydration of D-fructose in the presence of bases and formic acida
Product yields / % Entry Catalyst Conv. /
% HMF LA Furfural
1 NaHCO3 >99 N.D. 3.1 <1
2 NaHCO3 + No. 13 >99 N.D. 20 2.5
3b Na2CO3 + No. 13 >99 N.D. 16.9 6.3
4c HCOOH 64.8 11.2 1.7 0.5
5c HCOOH + No. 13 52.7 4.1 45.5 0.5
a m (Fructose) = 0.2 g, m (catalyst) = 0.1 g, m (base) = 0.1 g, V (EtOH) = 10 mL, T = 180 °C, t = 1 h, stirring speed = 1000 rpm, V (autoclave) = 36 mL, yield is calculated based on HPLC analysis.
b one unknown product was produced in large amounts
c m (HCOOH) = 0.06 g (corresponds to the maximum amount of built formic acid)
N.D.: not detectable (peak of HMF is overlapped by an unknown compound)
Typical HPLC chromatograms of the obtained product mixtures are shown in Figure
4.16. For separation, a switchable column system was used which was described in
the experimental part.31 The product distribution was detected by two detectors (RI
and UV), which are – in combination – suitable for analysis of D-fructose
transformation (except humin formation).

117
Figure 4.16 Typical LC chromatogram of a product mixture of dehydration. EG: ethylene glycol (internal standard); FA: 2-furancarboxylic acid; ethanol was the used reaction medium.
Finally an attempt is being made to propose a simplified reaction pathway which is
able to explain our observations in D-Fructose dehydration to LA (Scheme 4.5). The
following results have to be included in this proposal:
1. The deposited metal is crucial for a high LA selectivity.
2. HMF is possibly not the intermediate for LA formation.
3. LA formation is not catalyzed through Brönsted acids or bases.
4. High LA selectivity is obtained if ethanol, THF and acetone are used as
solvents whereas 2-MTHF and water inhibits LA formation.
Analogous to studies from Berry,68 Stewart69 and Moreau43 for acid-catalyzed D-
fructose dehydration the reaction pathway is believed to begin with two ketone-enol
tautomerism and one dehydration step resulting in the 1,2-dicarbonyl compound 4
(Scheme 4.7). This is also a frequently discussed intermediate for HMF formation.
In contrast to ring closure by nucleophilic addition as in the case of HMF
formation (4a) or further dehydration and terminal abstraction of formaldehyde to
finally generate furfural (Scheme 4.7), 4 should be accessible for α-dicarbonyl
splitting.78-82
In the present study this step is believed to be metal induced. Speier and
Tyeklár83 published the oxidative C-C bond scission of different 1,2-dicarbonyl

118
compounds on a metallic copper surface at room temperature under argon. They
postulated an electron transfer via the copper center forming a radical anion in the
presence of additional amine ligands. The addition of oxygen results then in C-C-bond
cleavage and sole formation of CuII carboxylate complexes.83 Xue and coworker
postulated an electron transfer from co-adsorbed oxygen to benzil on a Cu0 surface
whereby a CuII carboxylate complex is built as well.84
Reactions of 1,2-dicarbonyl compounds are not yet published for Pd or Pt. To
explain the observed metal key influence in LA formation (Scheme 4.7), it is believed
that the particulate metal causes a C-C bond cleavage of 4 which results in the
formation of two acyl fragments on the metal surface (5). These species could react
with the present hydroxy groups on the metal surface to one molecule of formic acid
and 2-deoxy-D-erythro-pentonic acid (7), respectively. 7 would then undergo terminal
dehydration, ketone-enol-tautomerism, a second dehydration and finally metal
catalyzed hydrogenation to LA (11).
In this pathway both the necessary hydroxy and hydrogen equivalents originate
from eliminated water by the multiple dehydration reactions. Alternatively, a metal
catalyzed decomposition of formic acid into carbon dioxide and hydrogen might also
be a hydrogen source in 4-oxo-2-penteonic acid (10) reduction. The built water
molecules (one H2O per LA) are expected to easily adsorb and (at least partially)
dissociate on the metal surface,85 thereby reducing the amount of accessible
catalytically active metal centers. This might be the reason why LA formation is not
preferred in water as a solvent but in water dissolving solvents like ethanol and THF.

119
Scheme 4.7 A postulated reaction pathway to explain the metal influence in LA formation.

120
4.4 Dehydration of D-glucose to Levulinic acid
4.4.1 Solvent effect and metal influence
The usage of D-glucose instead of D-fructose as a feedstock for the production of 5-
HMF or LA is highly attractive, because glucose is the monomer of cellulose which is
the most abundant organic compound on earth. Until now large capacities of this
biopolymer are actually treated as waste streams which avoid a competitive situation
with food production. However, the dehydration of glucose has been reported to have
lower reaction rate and lower selectivity to 5-HMF or levulinic acid compared to that
of fructose. 86-94 In order to test the versatility of our catalysts, we performed initial
experiments in D-glucose transformation to characterize their performance in this
respect. For this purpose a protocol for synthesizing a catalyst of intermediate activity
was chosen (9% Pd3-Pt1/SBA-15; Table 4.5, No. 24).
Several groups have investigated the influence of metal salts on the
transformation of carbohydrates into platform chemicals. Zhang and coworkers
elucidated different metal chlorides in the conversion of sugars into HMF in ionic
liquids. Chromium (III) chloride (CrCl3) was found to be uniquely effective, leading
to the conversion of glucose to HMF in nearly 70% yield. 95-97 Li and coworkers
presented an efficient strategy for CrCl3-mediated conversion of cellulose and glucose
to HMF in ionic liquids under microwave irradiation.98
Apart from above mentioned HMF yielding transformations, reactions in
aqueous solution and sub-critical water are reported that chiefly produce LA. Efremov
and coworkers studied the conversion of cellulose into LA in water using sulphates
such as CoSO4, Fe2(SO4)3 and Al2(SO4)3 as catalysts. The optimal catalyst, Al2(SO4)3,
produced LA in 18% yield at 250 °C.99 Rasrendra and coworkers reported the
catalytic effect of a wide range of chloride and sulphate salts that were shown to affect
the chemo-selectivity in the conversion of D-glucose considerably in aqueous
solutions at 140 °C. The main water-soluble product was lactic acid for Al(III) salts,
while HMF was formed preferentially in the presence of Zn(II) salts.100 Lu and
coworkers investigated the decomposition kinetics of glucose as a starting material
and HMF as the detectable intermediate with some metal chlorides in liquid water at
high temperatures.101 The dominating product in the metal salts catalyzed conversion
of carbohydrates in sub-critical water (T = 200 - 360 °C) appears to be lactic acid,
according to the groups of Bicker102 and Kong103. Considering also the low TONs

121
obtained yet, there is a tremendous need for further studies dealing with the design of
new catalytic systems for conversion of glucose into platform chemicals such as HMF
or LA.
Based on initial exploration of different metal salts in combination with our
homo and bimetallic catalysts (Table 4.16), the combination of CoCl2 and 9% Pd3-
Pt1/SBA-15 (No. 24, Table 4.6) was found to be especially suitable for LA production
( entry 7).
Table 4.16 Metal effect towards the catalytic dehydration of D-glucose in ethanola
Product Yield / % Entry Salt Catalyst Conv. / %
HMF Levulinic Acid
1 KCl 9% Pd/SBA-15 >99 0.6 0.9
2 CuCl2 9% Pd/SBA-15 >99 0.9 6.9
3 CrCl3 9% Pd/SBA-15 >99 2.5 5.3
4 AlCl3 9% Pd/SBA-15 >99 2.6 5.3
5b CoCl2 3% Pd/SBA-15 >99 6.9 10.5
6 CoCl2 9% Pd/SBA-15 >99 8.9 5.2
7 CoCl2 9% Pd3-Pt1/SBA-15 >99 0.07 51.2
8 CaCl2 9% Pd3-Pt1/SBA-15 >99 0.14 7.2
a m (D-glucose) = 0.2 g, m (catal.) = 0.1 g, m (salt) = 0.05 g, V (ethanol) = 10.3 mL, T = 180 °C, t = 1 h, stirring speed = 1000 rpm, V (autoclave) = 36 mL, catalyst 9% Pd3-Pt1/SBA-15 was synthesized using the conditions given in No. 24 of Table 4.6, likewise catalyst 9% Pd/SBA-15 corresponds to No. 17 in Table 4.6. The conversion and yield were calculated based on HPLC analysis, the used method was described in chapter 2.8.
b 3% Pd/SBA-15 was prepared by former CFD method through the PdO route.
When we further employed this potent catalyst system, a clear solvent effect could be
observed for the dehydration of D-glucose as well: If water was used as a solvent,
HMF was primarily produced (Table 4.17, entry 1). In contrast, ethanol as a reaction
media under otherwise identical reaction conditions resulted in the highly preferred
formation of levulinic acid (entry 2). The catalytic contributions of the single
components CoCl2 (entries 5 and 6), pure SBA-15 (entries 7 and 8) and the deposited
metal catalysts alone (entries 3 and 4) were also investigated. The transformation into
HMF seems to be disfavored from the presence of palladium and/or platinum
ensembles as pure SBA-15 led to much higher HMF yields both in water (entry 7 vs.
3) and ethanol (entry 8 vs. 4) as a solvent. Maximizing the HMF yield can be best

122
done just with CoCl2 and water as a solvent (entry 5, 26.2% yield). This can be
explained by the in situ formation of Co(OH)2 and HCl, which trigger both the
enolisation and dehydration cascade shown in Scheme 4.5: Enolisation of D-glucose
give 2 as well, but this process is less favored than for D-Fructose. Noteworthy, the
obtained results are comparable high and can be compared with the best studies from
literatures (Table 4.18). 18, 29, 33, 70, 104-109
Table 4.17 Metal and solvent effect towards the catalytic dehydration of D-glucosea
Product Yield /% Entry Salt Catalyst Solvent
Conv. /
% Fructose HMF LA
1 CoCl2 9% Pd3-Pt1/SBA-15 H2O 75.9 2.8 18.8 2.7
2 CoCl2 9% Pd3-Pt1/SBA-15 EtOH >99 10.4 0.07 51.2
3 ---- 9% Pd3-Pt1/SBA-15 H2O 7.3 4.0 1.7 0
4 ----- 9% Pd3-Pt1/SBA-15 EtOH 81.7 40.7 0.1 6.7
5 CoCl2 ------- H2O 72.9 3.8 26.2 4.4
6 CoCl2 ------- EtOH >99 16.5 9.4 0
7 ---- SBA-15 H2O 11.2 3.5 11 0
8 ---- SBA-15 EtOH 16.9 21.7 1.6 0
a similar reaction conditions as in Table 4.14 were applied. The conversion and yield were calculated based on HPLC analysis, the used method was described in chapter 2.8.
Table 4.18 Dehydration of D-glucose to LA – best results achieved in comparison with literature reported ones.
Entry CatRef T / °C t / h solvent Yield (LA)
1 CoCl2 + Pd3-Pt1@SBA-15
(Table 4.17, No.2) 180 1 ethanol 51.2%
2 HCl-C2H4Cl2 104 80-100 3 ---- 79%
3 CrCl3 105 180 2 H2O 60%
4 AlCl3 105 180 2 H2O ~71%
5 HCl106 R.T. 24 H2O 15%
6 H2SO4 107 160-240 N.D. H2O 35.4%
7 HCl 29 160 0.25 H2O 41.4%
8 Clay 108 150 24 H2O 12%
9 MFI zeolite 109 180 8 H2O 35.8%

123
10 H2SO4 70 170-210 1 ---- 80.7%
11 H2SO4 33 98 12 ---- 38%
12 HCl 18 220 1 ---- 57.7%
R.T.: room temperature, N.D: not defined.
4.4.2 Optimization D-glucose dehydration
In order to understand the influence of a variety of reaction parameters on the
catalytic transformation, DOE was employed in form of a Taguchi Design.110, 111 Here,
reaction temperature, reaction time, amount of CoCl2 and amount of nanocatalyst
were chosen as experimental factors. If the experimental space is properly chosen and
an interaction of factors can be excluded, Taguchi’s orthogonal arrays could provide
an alternative to standard factorial designs, thereby reducing the amount of necessary
experiments.110
The catalytic design is depicted in Table 4.19. The suitability of the predicted
models was also statistically confirmed by analysis of variance.111 Relationships
between the catalytic activity and parameters are complicated but deciding the
catalytic activities. The results show in general that the reaction largely depends on
the amount of salt and catalyst used. Unfortunately, the design plan was not successful
to obtain better yields of LA in comparison with the preliminary results in Table 4.17
(entry 7) and no model could be obtained to predict better reaction conditions for
maximizing the LA yield. As can be seen Figure 4.17 the reaction mixtures after
reaction differ substantially in color and absorbance intensity.
Table 4.19 Optimization of D-glucose dehydration
No. i ii Iii Iv Conv. / % Y (HMF) / % Y (LA) / %
1 0.5 180 4 0.01 >99 4.0 2.5
2 1 180 1 0.02 >99 0.0 38.7
3 0.5 140 1 0.05 77.3 3.5 4.2
4* 1 140 2 0.01 60.4 0.9 0.0
5 2 160 1 0.01 >99 0.0 21.7
6 2 140 4 0.02 77.6 3.7 0.0
7 1 160 4 0.05 >99 9.7 1.4

124
8 0.5 160 2 0.02 89.6 3.7 3.0
9 2 180 2 0.05 >99 1.4 19.8
Note: i: reaction time / h, ii: reaction temperature / °C, iii: weight percent / %, iv: amount of salt / g; V (EtOH) = 10 mL; *exact quantification not possible. The conversion and yield were calculated based on HPLC analysis, the used method was as described in chapter 2.8. This work was mainly done by Susanna Früh and Kai Yan together.
Figure 4.17 Different colors of the samples ranged from No.1 (left) to No. 9
4.5 Conclusion
1. A series of homo- and bimetallic Pd and/or Pt catalysts supported on SBA-15
display good activities in dehydration of D-fructose to levulinic acid. Based on
an initial screening procedure, a certain protocol of a bimetallic catalyst (9%
Pd1-Pt3/SBA-15; No. 13 in Table 4.6) displays the best performance giving
72% conversion and 86% selectivity corresponding to 62% yield (TON = 8).
In general, the catalyst synthesis protocol has a great influence on the catalytic
activity, whereby the reproducibility is remarkably high.
2. It could be shown for the first time that metal-nano particles catalyst can be
highly efficient for LA formation. Conversely, this means that sugar
dehydration is not restricted towards acid catalysis.
3. Large amounts of data were collected in a variety of test reactions which argue
consistently against HMF being an intermediate in LA formation if our most
potent metal nanoparticle catalysts were applied

125
4. The optimization of dehydration reaction showed that the reaction temperature
and the amount of catalyst had the biggest influence on the observed
conversion and yield. In spent catalysts, a small amount of carbon is deposited
on the surface of the catalyst which decreases the catalytic activity in further
runs in a dramatic manner. This deactivation can be overcome efficiently by
an intermediate calcination and reduction procedure, which allow maintenance
of catalytic activity over multiple cycles.
5. In comparison with published work, our results of dehydration are slightly
lower in comparison with the best established catalysts. However, the
recyclability, easy handling and easy separation of products from our catalyst
class show considerable advantages over reported systems in which mineral
acids and/or ionic liquids were applied.
6. A new reaction pathway for levulinic acid formation is briefly proposed,
which is able to explain the crucial influence of the deposited metal fraction.
Here, a metal induced C-C bond cleavage of a 1,2-dicarbonyl intermediate
resulting in two molecules carbonic acid is believed to be the key step.
7. A selected catalyst (9% Pd3-Pt1/SBA-15, Table 4.6, No. 24) further display
good activity for dehydration of D-glucose under the additional presence of
CoCl2. A maximum LA yield of 51% could be obtained in ethanol as a
solvent. Our results of dehydration are among the top in comparison with the
best established catalysts in comparison with published work. Using water
instead, HMF was the detected main component in 19% yield.
4.6 References
1. A. Corma, S. Iborra, A. Velty, Chem. Rev., 107 (2007) 2411.
2. S. Bower, R. Wickramasinghe, N. J. Nagle, D. J. Schell, Bioresour. Technol., 99 (2008) 7354.
3. J. N. Chheda, J. A. Dumesic, Catal. Today 123 (2007) 59.
4. A. Corma, S. Iborra, A. Velty, Chem. Rev., 107 (2007) 2411.
5. M. Toba, S.-i. Tanaka, S.-i. Niwa, F. Mizukami, Z. Koppány, L. Guczi, K.-Y. Cheah, T.-S. Tang, Appl. Catal. A 189 (1999) 243.
6. J. H. Schlander, T. Turek, Ind. Eng. Chem. Res., 38 (1999) 1264.
7. V. FÁBOS, Ph. D. Thesis, Eötvös Loránd University (Hungary) (2009).

126
8. Y. Roman-Leshkov, C. J. Barrett, Z.Y. Liu, J. A. Dumesic, Nature 447 (2007) 982.
9. G. W. Huber, S. Iborra, A. Corma, Chem. Rev., 106 (2006) 4044.
10. K. M. Rapp (1987) US Patent, 4,740,605
11. G. W. Huber, J. N. Chheda, C. J. Barrett, J. A. Dumesic, Science 308 (2005) 1446.
12. J. J. Bozell, L. Moens, D. C. Elliott, Y. Wang, G. G. Neuenscwander, S. W. Fitzpatrick, R. J. Bilski, J. L. Jarnefeld, Resour. Conservat. Recycl., 28 (2000) 227.
13. A. Efremov, G. Pervyshina, B. Kuznetsov, Chem. Nat. Compd., 34 (1998) 182.
14. R. Leonard, Ind. Eng. Chem., 48 (2002) 1330.
15. R. TEVENS, J. Am. Chem. Soc., 2 (1958) 301.
16. D. M. Alonso, J. Q. Bond, J. C. Serrano-ruiz, J. A. Dumesic, Green Chem., 12 (2010) 992.
17. R. V. Christian, H. D. Brown, R. M. Hixon, J. Am. Chem. Soc., 69 (2002) 1961.
18. L. Deng, J. Li, D.-M. Lai, Y. Fu, Q.-X. Guo, Angew. Chem. Int. Ed. 48 (2009) 6529.
19. D. M.Alonso, J. Q. Bond, D. Wang, R. M. West, J. A. Dumesic. Science 327 (2010) 1110.
20. T. A. Werpy, J. E. Holladay, J. F. White. 2004. Top Value Added Chemicals From Biomass: I. Results of Screening for Potential Candidates from Sugars and Synthesis Gas. US Department of Energy. http://www.eere.energy.gov/biomass/pdfs/35523.pdf.
21. Y. R. -Leshkov, J. N. Chheda, J. A. Dumesic, Science, 312 (2006) 1933.
22. C. Moreau, R. Durand, S. Razigade, J. Duhamet, P. Faugeras, P. Rivalier, P. Ros, G. Avignon, Appl. Catal. A 145 (1996) 211.
23. B. Girisuta, L. P. B. M. Janssen, H. J. Heeres, Green Chem., 8 (2006) 701.
24. Y. R. -Leshkov, J. A. Dumesic, Top. Catal., 52 (2009) 297.
25. http://www.polysciences.com/Catalog/Department/Product/98/categoryId__8/
productId__1904/
26. J. Jow, G. L. Rorrer, M. C. Hawley, D. T. A. Lamport, Biomass, 14 (1987) 185.
27. Buana Girisuta, Ph.D Thesis, Levulinic Acid from Lignocellulosic Biomass, University of Groningen, 2007
28. J. Horvat, B. Klaic, B. Metelko, V. Sunjic, Tetrahedron Lett., 26 (1985) 2111.
29. L. J. Carlson, Process for the manufacture of levulinic acid. 1962, US patent 3065263.
30. N. Theyssen, K. Yan, F. Qin, R. Weiss, W. Leitner. “Synthesis of Nanostructured Catalysts by Chemical Fluid Deposition (CFD)”. TMFB International Workshop of the Cluster of Excellence Tailor-Made Fuels from Biomass, 23-24 June 2010, Aachen, Germany.
31. G. Breitenbruch, A. Deege, H. Hinrichs, D. Klütt, Novel Developments in HPLC, 03-06, March, Evaluation of MAX-Planck-isntitut für Kohlenforschung, Germany.
32. N. Theyssen, K. Yan, F. Qin, W. Leitner, Synthesis of homo-and bimetallic Nano-Catalysts by Chemical Fluid Deposition (CFD) and their Application in the highly efficient Conversion of D-fructose and levulinic acicd. The Cluster of Excellence’ Tailor Made Fuels From Biomass’ Year Report, 2010.
33. V. E. Tarabanko, M. Yu, S. V. Aralova, B. N. Kuznetsov, React. Kinet. Catal. Lett., 75 (2002) 117.

127
34. R. W. Thomas, H.A. Schütte, J. Am. Chem. Soc., 53 (1931) 2324.
35. B. C. Redmon, Process for the production of levulinic acid, US Patent 2,738,367, 1956.
36. B. F. M. Kuster, H. S. van der Bann, Carbohydr. Res., 54 (1977) 165.
37. M. Kröger, U. Prüße, K. D. Vorlop, Top. Catal., 13 (2000) 237.
38. F. S. Asghari, H. Yoshida, Ind. Eng. Chem. Res., 46 (2007) 7703.
39. Z. Hou, N. Theyssen, A. Brinkmann, K.V. Klementiev, W. Grünert, M. Bühl, W. Schmidt, B. Spliethoff, B. Tesche, C. Weidenthaler, W. Leitner, J. Catal., 258 (2008) 315.
40. D. P. L. Jason, M. Blackburn, A. Cabanas, J. J. Watkins, Science, 294 (2001) 141.
41. D. P. Long, J. M. Blackburn, J. J. Watkins, Adv. Mater., 12 (2000) 913.
42. A. H. Romang, J. J. Watkins, Chem. Rev., 110 (2010) 459.
43. J. J. Watkins, J. M. Blackburn, T. J. McCarthy, Chem. Mater., 11 (1999) 213.
44. C. P. Mehnert, D. W. Weaver, J. Y. Ying, J. Am. Chem. Soc. 120 (1998) 12289.
45. P. Selvam, S. K. Mohapatra, S. U. Sonavane, R. V. Jayaram, Appl. Catal. B Environ. 49 (2004) 251.
46. P. Krawiec, E. Kockrick, P. Simon, G. Auffermann, S. Kaskel, Chem. Mater. 18 (2006) 2663.
47. G. Ertl, F. Schüth, K. S. W. Sing, J. Weitkamp (Eds), 2008, Handbook of Heterogeneous Catalysis, V8, 2nd Edition, Wiley-VCH, Weinheim.
48. N. Zhang, S. Q. Liu, X. Z. Fu, Y.-J.Xu, J. Phys. Chem. C, 115 (2011) 9136
49. K. S. W. Sing, D. H. Everett, R. A. Haul, L. Moscou, R. A. Pierotti, J. Rouquerol, T. Siemienieuska, Pure Appl. Chem., 57 (1985) 603.
50. J. C. Groen, L. A. A. Peffer, J. Perez-Ramirez, Micropor. Mesopor. Mater., 60 (2003) 1.
51. K. Bendahou, L. Cherif, S. Siffert, H. L. Tidahy, H. Benaissa, A. Aboukais, Appl. Catal. A 351 (2008) 82.
52. I. Yuranov, L. Kiwi-Minsker, P. Buffat, A. Renken, Chem. Mater., 16 (2004) 760.
53. Design Expert Software Introduction: http://www.statease.com/software.html
54. M. J. Anderson, P. J. Whitcomb, DOE Simplified: Practical Tools for Effective Experimentation, CRC Press, April, 2004
55. C. H. Bartholomew, Appl. Catal. A 212 (2001) 17.
56. L. L. Hegedus, R. W. McCabe, in: B. Delmon, G.F. Froment (Eds.), Catalyst Deactivation 1980, Stud. Surf. Sci. Catal., Vol. 6, Elsevier, Amsterdam, 1980.
57. L. L. Hegedus, R. W. McCabe, Catalyst Poisoning, Marcel Dekker, New York, 1984.
58. J. B. Butt, in: J. L. Figuerido (Ed.), Progress in Catalyst Deactivation, NATO Advanced Study Institute Series E, Marunus Nijhoff, Boston, 1982, p. 153.
59. J. Barbier, in: J. Oudar, H. Wise (Eds.), Deactivation and Poisoning of Catalysts, Marcel Dekker, New York, 1985, p. 109.
60. C. H. Bartholomew, in: B. Delmon, G.F. Froment (Eds.), Catalyst Deactivation 1987, Stud. Surf. Sci. Catal., Vol. 34, Elsevier, Amsterdam, 1987.
61. J. R. Rostrup-Nielsen, in: C.H. Bartholomew, J.B. Butt (Eds.), Catalyst deactivation 1991, Stud. Surf. Sci. Catal., Vol. 68, Elsevier, Amsterdam, 1991, p. 85.

128
62. G. F. Froment, Catal. Rev., 50 (2008) 1.
63. A. N. Parvulescu, D. Mores, E. Stavitski, C. M. Teodorescu, P. C. A. Bruijnincx, R. J. M. Klein Gebbink, B. M. Weckhuysen, J. Am. Chem. Soc., 132 (2010) 10429.
64. M. Guisnet, P. Magnoux, Appl. Catal., A, 212 (2001) 83.
65. M. Guisnet, J. Mol. Catal. A: Chem., 182-183 (2002) 367.
66. E. B. Celer, M. Kruk, Y. Zuzek, M. Jaroniec, J. Mater. Chem., 16 (2006) 2824.
67. A. Galarneau, M. Nader, F. Guenneau, F. D. Renzo, A. Gedeon, J. Phys. Chem. C 11(2007) 8268.
68. P. E. Shaw, J. H. Tatum, R. E. Berry, Carbohydr. Res., 5 (1967) 266.
69. R. K. M. R. Kallury, C. Ambidge, T. T. Tidwell, D. G. B. Boocock, F. A. Agblevor, D. J. Stewart, Carbohydr. Res., 158 (1986) 253.
70. C. Chang, X. J. Ma, P. L. Cen, Chinese J. Chem. Eng., 14 (2006) 708.
71. B. F. M. Kuster, Starch – Stärke, 42 (1990) 314.
72. M. J. Antal, W. S. L. Mok, G. N. Richards, Carbohydr. Res., 199 (1990) 91.
73. R. S. Assary, P. C.Redfern, J.R. Hammond, J. Greeley, L.A. Curtiss, J. Phys. Chem. B, 114 (2010) 9002.
74. Z. Wang, W. G. Lin, W. L. Song, BioResources, 6 (2011) 1858.
75. Darryn W. Rackemann, William O. S. Doherty, Biofuels, Bioprod. Bioref., 5(2011) 198.
76. M. Otsuka, Y. Hirose, T. Kinoshita, T. Masawa, Manufacture of levulinic acid.
US patent 37552849 (1973).
77. P. Carniti, A. Gervasini, M. Marzo, Catal. Commun., 12 (2011) 1122.
78. G. Machell, G. N. Richards, J. Chem. Soc., (1960), 1932.
79. G. Machell, G. N. Richards, J. Chem. Soc., (1960), 1938.
80. T. Davidek, F. Robert, S. Devaud, F. A. Vera, I. Blank, J. Angric. Food Chem., 54 (2006) 6677.
81. J. Yan, B. R. Travis, B. Borhan, J. Org. Chem., 69 (2004) 9299.
82. O. Novotny, K. Cejpek, J. Velisek, Czech. J. Food. Sci., 26 (2008) 117.
83. G. Speier, Z. Tyeklar, J. Chem. Soc. Dalton Trans., (1988) 2663.
84. G. Xue, Q. Shen, J. Dong, J. Chem. Soc. Faraday Trans., 87(1991) 1021.
85. M. Tatarkhanov, D. Frank Ogletree, F. Rose, T. Mitsui, E. Fonmin, S. Maier, M. Rose, J. I. Cerd, M. Salmeron, J. Am. Chem. Soc., 131 (2009) 18425.
86. H. H. Szmant, D. D. Chundury, J. Chem. Technol. Biotechnol. 31 (1981) 135.
87. J. E. Stone, M. J. Blundell, Can. J. Res., 28 (1950) 676.
88. R. Huang, W. Qi, R. Su, Z. He, Chem. Commun., 46 (2010) 1115.
89. C. Y. Fan, H. Y. Guan, H. Zhang, J. H. Wang, S. T. Wang, X. H. Wang, Biomass and Bioenergy, 35(2011) 2659.
90. Q. Cao, X. C. Guo, S. Y. Yao, J. Guan, X. Y. Wang, X. D. Mu, D. K. Zhang, Carbohydr. Res., 346 (2011) 956.
91. F. Jiang, Q. J. Zhu, D. Ma, X. M. Liu, X. W. Han, J. Molecular Catal. A: Chemical, 334 (2011) 8.

129
92. K. I. Seri, T. Sakski, M. Shibata, Y. Inoue, H. Ishida, Bioresour. Technol., 81 (2002) 257.
93. Z. C. Zhang, Adv. Catal., 49 (2006) 153–237.
94. Y. Su, H. M. Brown, X. W. Huang, X. D. Zhou, J. E. Amonette, Z. C. Zhang, Appl. Catal. A: General 361 (2009) 117.
95. H. B. Zhao, J. E. Holladay, J. H. Kwak, Z. C. Zhang, J. Physic. Chem. B 111 (2007) 5295.
96. H. Zhao, J. E. Holladay, H. Brown, Z. C. Zhang, Science, 316 (2007) 1597.
97. H. Zhao, J. E. Holladay, Z. C. Zhang, WO Patent 2008/019219A1, 2008.
98. X. L. Tong, Y. Ma, Y. D. Li, Appl. Catal. A 385 (2010) 1.
99. A. A. Efremov, G. G. Pervyshina, B. N. Kuznetsov, Chem. Nat. Compd., 34 (1998) 182.
100. C. B. Rasrendra, I. G. B. N. Makertihartha, S. Adisasmito, H. J. Heeres, Top. Catal., 53 (2010) 1241–1247.
101. C. B. Lu, X. Y. Lü, CIESC J., 60 (2009) 3035.
102. M. Bicker, S. Endres, L. Ott, H. Vogel, J. Mol. Catal. A: Chem., 239 (2005) 151.
103. L. Z. Kong, G. M. Li, H. Wang, W. Z. He, F. Ling, Chem. Technol. Biotechnol., 83 (2008) 383.
104. M. Mascal, E. B. Nikitin, Green Chem., 12 (2010) 370.
105. L. C. Peng, L. Lin, J. H. Zhang, J. P. Zhuang, B. X. Zhang, Y. Gong, Molecules, 15 (2010) 5258.
106. P. P. T. Sah, S.-Y. Ma, J. Am. Chem. Soc., 52 (1930) 4880.
107. S. McKibbins, J. F. Harris, J. F. Saeman, W. K. Neill, Forest Prod. J. 12 (1962) 17.
108. K. Lourvanij, G. L. Rorrer, Appl. Catal. A 109 (1994) 147.
109. W. Zeng, D. G. Cheng, H. Zhang, F. Q. Chen, X. L. Zhan, React. Kinet. Mech. Catal., 100 (2010) 377.
110. M. J. Anderson, P. J. Whitcomb, RSM Simplified: Optimizing Processes Using Response Surface Methods for Design of Experiments, CRC Press, April, 2004
111. A Primer on Mixture Design: What is In It for Formulations? http://www.statease.com/pubs/MIXprimer.pdf

130
Chapter 5 - Hydrogenation of Levulinic
Acid using Homo- and Bimetallic Catalysts
5.1 Evaluation of supported Pd nanoparticles
The series of the obtained 35 monometallic Pd/SBA-15 nanoparticles catalysts were
initially evaluated in a second tested reaction, namely the hydrogenation of LA to γ-
valerolactone (GVL) which is depicted in Scheme 5.1. The influence of different
parameters in catalyst synthesis on the catalytic performance was investigated in
detail (Table 5.1).
Scheme 5.1 Catalytic hydrogenation of LA to γ-valerolactone (GVL) using supported
Pd-nanoparticles
Table 5.1 Experimental plan for the synthesis of Pd/SBA-15 and catalytic results in the transformation of levulinic acid.a
i / ii / iii / iv / v / vi / vii / No.
wt% 1 mL n min-1 °C g mL-1 h min
Conv. (LA) /%
Yield (GVL) /%
1 5 1 110 80 0.7 4 1 48.9 48.7
2 1 5 50 50 0.6 1 1 42.3 42.2
3 9 50 110 40 0.6 3 1 57.2 57.0
4 3 25 20 60 0.65 2 1 42.7 42.3
5 9 100 20 70 0.5 4 10 56.5 56.4
6 5 100 4 60 0.8 5 20 47.4 47.3
7 9 25 80 50 0.7 5 30 57.8 57.6
8 9 5 4 50 0.65 4 5 53.7 53.3
9 7 50 4 70 0.7 1 1 58.2 57.6
10 1 25 50 80 0.65 4 20 22.6 22.6

131
11 1 1 4 50 0.5 3 10 13.2 13.0
12 3 100 110 50 0.7 1 10 43.5 43.3
13 7 25 4 40 0.6 3 20 60.1 59.8
14 3 50 110 50 0.5 4 30 55.0 54.5
15 9 1 110 70 0.65 1 20 65.0 64.4
16 9 50 50 80 0.8 3 20 63.0 62.6
17 3 5 4 80 0.7 2 30 57.8 57.3
18 7 1 20 70 0.6 5 30 63.5 62.9
19 7 100 50 40 0.65 2 30 55.7 55.3
20 5 50 20 60 0.5 1 30 59.4 58.8
21 1 5 80 60 0.8 3 30 47.0 46.7
22 3 1 50 40 0.7 4 20 56.1 55.8
23 5 1 80 40 0.5 2 5 64.0 63.4
24 1 100 80 70 0.6 2 20 24.3 24.3
25 3 100 4 80 0.6 3 5 60.3 60.3
26 7 5 110 60 0.6 5 10 63.3 63.3
27 7 100 80 50 0.8 4 1 62.4 62.4
28 5 25 50 60 0.65 3 10 61.8 61.8
29 5 50 80 80 0.65 5 5 58.6 58.5
30 3 5 50 70 0.5 5 1 55.7 55.5
31 1 25 110 70 0.8 2 5 21.8 21.3
32 7 25 80 80 0.5 1 10 66.2 66.0
33 1 50 20 40 0.7 5 5 58.1 58.0
34 5 5 20 40 0.8 1 10 60.1 59.8
35 9 1 20 60 0.8 2 5 65.2 65.0
a m (LA) = 5.0 g, m (catal.) = 100 mg, p (H2) = 45 bar, V (H2O) = 5 mL, T = 200 °C, t = 6 h, stirring speed = 1000 rpm, V (autoclave) = 20 mL. The yield wacalculated based on GC analysis.
The hydrogenation of LA into GVL gave promising results if the parameters in the
catalyst synthesis procedure were carefully adjusted. Conversions up to 66% and yield
66% could be reached (Table 5.1, No. 32).
The model which describes the conversion of LA hydrogenation was significant
(p = 0.0152). A variety of relevant reaction parameters could be identified: Pd
loading amount (p = 0.0115, ↑), ratio of H2 to Pd (p = 0.0069,↓) and deposition
temperature (p = 0.0148,↓). Moreover the following two-factor interactions were
identified as significant: Pd loading amount / H2 addition rate (p = 0.0175, ↑↓), Pd

132
loading amount / reduction time (p = 0.0128, ↑↑; Figure 5.1, top), ratio of H2 to Pd /
reduction time (p = 0.0140, ↑↓ or ↓↑; Figure 5.1, middle), H2 addition rate / CO2
density (p = 0.0428, ↑↓ or ↓↑) and impregnation time / reduction time (p = 0.0103, ↑↓
or ↓↑; Figure 5.1, bottom).
1 3 5 7 9
1
8
16
23
30conversion
A: loading amount
G: r
educ
tion
time
32.04
39.34
46.65
53.95
61.26
1 25.75 50.5 75.25 100
1
8
16
23
30conversion
B: mol ratio of hydrogen to palladium
G: r
educ
tion
time
26.13
36.39
46.65
46.65
56.91
56.91
67.17
67.17
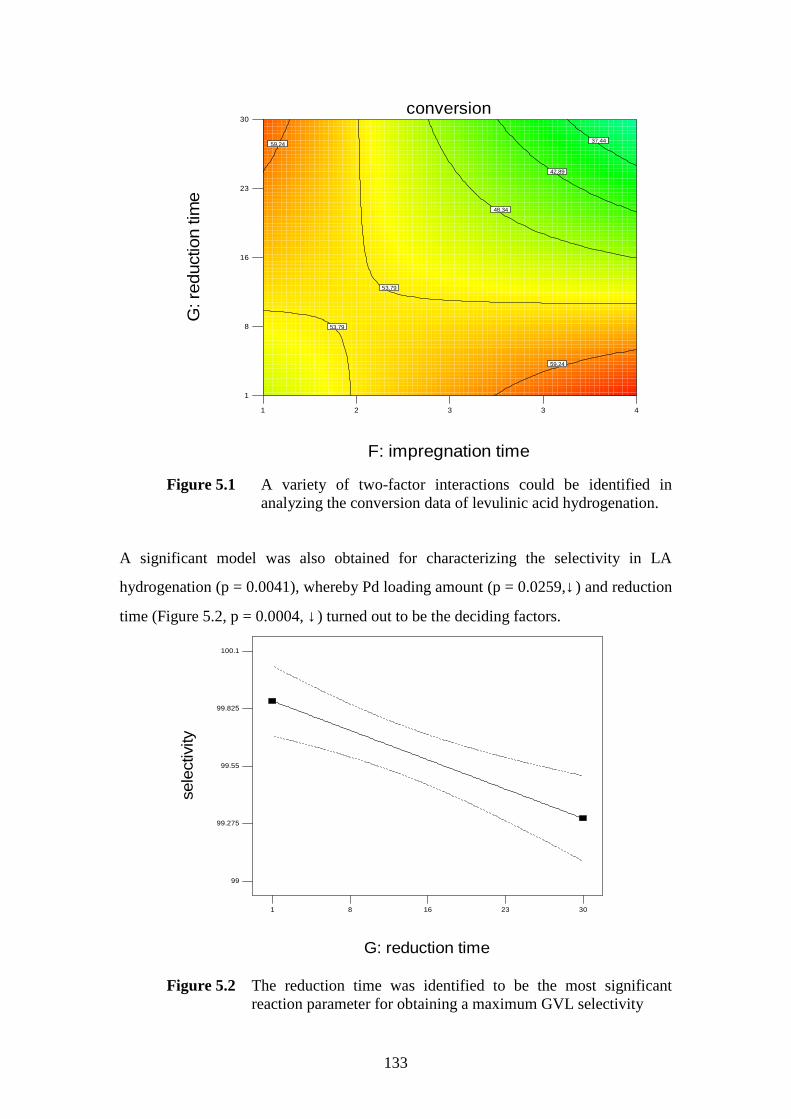
133
1 2 3 3 4
1
8
16
23
30conversion
F: impregnation time
G: r
educ
tion
time
37.44
42.89
48.34
53.79
53.79
59.24
59.24
Figure 5.1 A variety of two-factor interactions could be identified in analyzing the conversion data of levulinic acid hydrogenation.
A significant model was also obtained for characterizing the selectivity in LA
hydrogenation (p = 0.0041), whereby Pd loading amount (p = 0.0259,↓) and reduction
time (Figure 5.2, p = 0.0004, ↓) turned out to be the deciding factors.
1 8 16 23 30
99
99.275
99.55
99.825
100.1
G: reduction time
sele
ctiv
ity
One Factor
Figure 5.2 The reduction time was identified to be the most significant reaction parameter for obtaining a maximum GVL selectivity

134
5.2 Evaluation of homo- and bimetallic nanoparticles catalysts
The series of the obtained homo- and bimetallic catalysts obtained in the second
experimental plan were also evaluated in the hydrogenation of LA to γ-valerolactone
(GVL) which is depicted in Scheme 5.2. Thereby the influence of different parameters
in catalyst synthesis on the catalytic performance was characterized additionally
(Table 5.2).
Scheme 5.2 Catalytic hydrogenation of LA to γ-valerolactone (GVL) using supported
homo- and bimetallic Pd-Pt nanoparticles
Table 5.2 Catalyst synthesizing conditionsa and their performances in the hydrogenation of LA to GVLb
i / ii / iii / iv / V / vi / vii /
No wt-% 1 mL n
min-1 °C
G mL -
1 H 1
Conv. (LA) /
%
Sel. (GVL)
/ %
Yield (GVL)
/ %
TON (GVL)
1 3 10 100 50 0.7 2 1/3 66.8 98.9 64.9 1151
2 5 20 60 50 0.6 2 1/3 62.0 96.4 59.8 636
3 5 20 60 50 0.6 2 1/3 65.2 97.9 63.8 680
4 7 40 140 50 0.6 2 1/3 62.9 97.5 61.3 466
5 7 20 140 60 0.6 3 1/0 43.0 99.7 42.9 495
6 3 10 100 40 0.5 1 0/1 55.5 99.8 55.4 813
7 5 80 140 40 0.7 4 0/1 58.8 99.9 58.7 518
8 3 10 20 40 0.5 3 0/1 56.2 99.1 55.7 818
9 5 40 140 70 0.8 4 1/0 52.0 99.8 51.9 838
10 7 80 60 50 0.7 4 1/0 53.9 99.5 53.6 619
11 3 10 20 40 0.5 1 1/3 52.7 98.7 52.0 923
12 5 20 20 70 0.5 1 3/1 49.4 96.8 47.8 685
13 9 40 140 50 0.7 2 3/1 60.1 87.9 52.8 420
14 9 80 60 60 0.6 1 3/1 59.4 88.3 52.5 417
15 5 80 140 70 0.6 3 3/1 65.1 97.8 63.7 912
16 9 20 100 50 0.8 4 3/1 63.6 98.0 62.3 496

135
17 9 10 20 40 0.5 1 0/1 60.0 99.7 59.8 293
18 9 40 60 50 0.8 3 1/3 63.0 95.1 59.9 354
19 7 40 100 60 0.7 3 3/1 59.5 87.4 52.0 532
20 5 80 100 60 0.6 2 1/0 38.6 99.7 38.5 622
21 3 10 20 60 0.5 1 0/1 32.6 98.8 32.2 832
22 3 10 20 40 0.8 1 0/1 49.1 99.7 49.0 719
23 5 20 100 70 0.7 3 1/1 48.3 99.6 48.1 777
24 9 20 60 60 0.7 4 1/3 57.7 96.2 55.5 328
25 3 80 20 40 0.5 1 0/1 52.8 99.8 52.7 774
26 7 40 100 60 0.7 3 3/1 59.9 86.7 51.9 531
27 7 80 60 70 0.8 2 3/1 61.1 81.4 49.7 509
28 7 20 100 60 0.8 2 1/3 62.7 95.7 60.0 456
29 7 80 60 50 0.7 4 1/0 56.0 99.5 55.7 643
30 3 10 20 40 0.5 3 0/1 49.8 99.8 49.7 730
31 5 40 140 70 0.8 4 1/0 47.6 99.8 47.5 767
32 9 40 60 70 0.6 4 1/0 58.9 99.6 58.7 526
a catalyst synthesizing conditions: (i) loading amount of metal (1 - 9 wt %); (ii) molar ratio of H2 to metal (1 - 100); (iii) addition rate of H2 (4 - 110 mLn / min); (iv) density of carbon dioxide (0.50 - 0.80 g / mL); (v) reaction temperature (40 - 80 °C); (vi) molar ratio of Pt toward Pd; (vii) impregnation time (1 - 4 h); reduction time = 30 min.
b reaction conditions: m (LA) = 5.07 g, m (catalyst) = 100 mg, T = 200 °C, V (H2O) = 5 mL, t = 6 h, stirring speed = 1000 rpm, V (autoclave) = 20 mL, p (H2) = 45 bar. TON is calculated on the total amount of the metals in the used Pd and Pt precursor.
As shown in Table 5.2, LA was efficiently hydrogenated to GVL with close to perfect
selectivity and about 68% conversion using the bimetallic, Pd-dominated catalyst
No.1 (3% Pt1-Pd3/SBA-15). This material, giving a TON of 1151, showed the best
screening result among 32 catalysts. The worst performance was observed also for a
bimetallic, but Pt-dominated catalysts (Table 5.2, No. 14: 9% Pd3-Pt1/SBA-15)
resulting in 53% yield, 88% selectivity and a TON of 417 at 59% conversion. The
best monometallic catalyst is a palladium based one (Table 5.2, No.17: 9% Pd/SBA-
15) which produced 59.8% yield, 99% selectivity and a TON of 293 at 60%
conversion. The resulting homo- and bimetallic catalysts display distinct influence on
conversion and moderate influence on selectivity. In general, bimetallic Pd-Pt
catalysts show much better performance toward conversion in comparison with the
monometallic counterparts. Compared with former results from literatures,2-9 we were

136
glad to find that results from catalyst screening – without optimizing the
hydrogenation reaction itself – were already very promising.
5.3 Statistical Analysis using Design Expert
As already shown in Table 5.2, it was possible to employ a screening approach to
preselect high performance catalysts for hydrogenation of LA to GVL using the same
design plan as for dehydration. These input variables combined with several output
data were analyzed by Design Expert, which allowed the identification of individual,
crucial reaction parameters. The results from the analysis of variance (ANOVA) were
given in Table 5.3 showing that a suitable model could be only obtained for the
description of the TON performance.10,12 A DOE based optimization for any of the
screened responses (conversion, selectivity and TON) was not possible with the data
set. However the identification of significant reaction parameters could be done for
conversion (Pd/Pt loading ↑; Pd-Pt ratio ↓), selectivity (impregnation time ↑) and
TON (Pd/Pt loading ↓).
Table 5.3 Statistical Analysis for hydrogenation using Design Expert1, 10, 11
Target value Model quality Significant parameter
(trend, p-value)
DOE based Optimization
LA Conversion
F-value = 2.32 (not significant)
Predicted R-Squared = -0.107 (prediction not possible)
Adequate Precision = 5.31 (the signal to noise ratio is ok)
Pd/Pt loading (↑, 0.0160)
Pd-Pt ratio (↓, 0.0033)
not possible
Selectivity (GVL)
F-value = 2.29 (not significant)
Predicted R-Squared = -0.051(prediction not possible)
Adequate Precision = 6.48 (the signal to noise ratio is ok)
Impregnation time (↑, 0.033)
not possible
TON
F-value = 14.80 (significant)
Predicted R-Squared = 0.656 (prediction not possible)
Adequate Precision = 12.01 (the signal to noise ratio is ok)
Pd/Pt loading (↓, <0.0001)
not possible

137
Predicted versus actual plots for the screened responses are shown in Figure 5.3
making the limited degree of prediction by the models visible.
LA conversion / % GVL selectivity / %
TON
Figure 5.3 Predicted vs. Actual evaluation plots for LA hydrogenation
5.4 Catalyst Characterization
To understand the relationship between the properties of the synthesized catalysts and
their catalytic performance, a series of representative fresh and spent catalysts were
characterized by different techniques. The spent catalysts were separated by
centrifugation for 30 min, reactivated by hydrogenation and dried in an oven at 90 °C
for 12 h. Crystal phases of selected fresh and spent catalysts were analyzed by XRD
as shown in Figure 5.4.

138
Figure 5.4 XRD diffract grams of fresh (I) and spent (II) catalysts for hydrogena-tion of levulinic acid: (a) Table 5.2, No. 8; (b) Table 5.2, No. 1; (c) Table 5.2, No. 15; (d) Table 5.2, No. 32
The XRD analysis show very weak peaks of the fresh 3% Pd/SBA-15 (Figure 5.4, Ia),
indexed as 2θ = 18° (111) and 35.6o (311) indentified as signal hexagonal fcc phase of
palladium (JCPDS Card 00-046-1043). By comparison, we could see that the peak
became more pronounced after reaction (Figure 5.4 IIa). This might be possible as a
consequence of the treatment in ethanol at 200 °C for 6 h in the course of reaction,
which might result in an additional aggregation of Pd particles.
A similar trend of peak intensification can be seen in case of the bimetallic
catalyst with the low loading of 3 wt-% (Ib and IIb). A loading of 5 wt-% resulted in
much stronger reflections already before reaction (Ic and IIc). The obtained crystal
phase, indexed as 18o (111), 21o (200), 29.5o (220), 35.7o (311) and 470 (222), is
ascribed to single hexagonal fcc phase of palladium (JCPDS Card 01-071-3757) and
platinum (JCPDS Card 01-070-2057).
In the case of the probed monometallic Pt samples of maximum loading (9%),
seven strong peaks are displayed both in the fresh and spent catalyst (Id and IId). The
crystal phases, indexed as 18° (111), 22° (200), 30° (220), 34.5° (311) and 47° (222)
are identified as a single hexagonal fcc phase of platinum (JCPDS Card 00-004-0802).
For a successful preparation of the supported catalysts, the oxidation state of the
surface metal is very sensitive towards the catalytic activity. Such atoms might be
easily oxidized under synthesis conditions or by handling in air. Thus XPS
I II

139
measurements were applied to characterize the oxidation state of Pd and/or Pt on the
surface (Figure 5.5).
Figure 5.5 XPS analysis of fresh catalyst 3% Pt1-Pd3/SBA-15 (Table 5.1, No. 1).
Based on the catalytic performance of hydrogenation of LA, 3% Pd3-Pt1/SBA-15
(Table 5.2, No.1) was further chosen for XPS analysis. As expected, the presence of
two prominent sets of Pd (3d) and Pt (4f) peaks, corresponding to the 3d3/2 via 3d5/2
and 4f7/2 via 4f5/2 orbital states, demonstrated that Pd and Pt were present on the
surface in the reduced form. The peak regions of Pd can be fitted with two sets of
peaks at 340.6 eV (3d3/2) and 335.3 eV (3d5/2), those of Pt at 69.6 eV (4f7/2) and
73.2 eV (4f5/2). No visible Pd (II) or Pt (II) oxidation states were observed by XPS
indicating that the fresh catalysts contained exclusively Pd0 and Pt0 centers on the
surface of SBA-15.13-20
To determine the amount of deposited metal during the preparation, energy
dispersive x-ray (EDX) was employed. EDX measurements of the fresh and spent
catalysts No. 1 (Figure 5.6 and Table 5.4) show that the Pd and Pt fraction is well
distributed and the measured compositions were close to the chosen loading.

140
Figure 5.6 EDX analyses of fresh (top) and spent (bottom) catalyst No.1.
Table 5.4 EDX analysis of fresh and spent catalyst No.1
Fresh catalyst Spent catalyst Element Weight-% Atom-% Element Weight-% Atom-%
C 8.68 13.51 C 11.22 16.98
O 53.38 62.39 O 54.36 61.76
Si 35.67 23.75 Si 32.39 20.96
Pd 1.63 0.29 Pd 1.41 0.24
Pt 0.65 0.06 Pt 0.62 0.06
Total 100.00 Total 100.00
The EDX analysis revealed an overall metal loading of 2.3% for the fresh and 2.0%
for the spent catalyst which is a little bit less than the theoretical amount in the depo-

141
sition process (3.0%). The molar composition of Pd versus Pt was 4.8 for the fresh
catalyst and the ratio of Pd versus Pt was 4.0 for the spent catalyst. The two values
argue for a better deposition of Pd on SBA-15 as the chosen Pd/Pt ratio was 3:1 in
metal precursor dosing.
TEM images of the fresh and spent catalysts for hydrogenation are shown in
Figure 5.7. The particle size distributions and mean sizes were calculated by taking
335 respective 300 particles into account. The mean particle size of the fresh catalyst
No. 1 was determined to be 3.3 nm (Figure 5.8a), while 3.4 nm was measured for the
spent fraction (Figure 5.8b). This demonstrates that no significant agglomeration or
particle growth occured in the course of the reaction, indicating high stability of the
metal particles.
Figure 5.7 TEM analysis of fresh (left) and spent (right) catalyst No. 1.
Figure 5.8 Particle size distributions and mean sizes of fresh (a) and spent (b) catalyst No. 1.
1-2 2-3 3-4 4-5 5-6 6-7 7-8 8-90
6
12
18
24
30
36
42
Per
cent
age
of P
artic
les
Particle Size/nm
d(middle) =3.34 nmN=335
1-2 2-3 3-4 4-5 5-6 6-7 7-8 8-90
6
12
18
24
30
36
42
Per
cent
age
of P
artic
les
Particle Size/nm
N=300d(middle)=3.42 nm
(a) (b)

142
In order to check a potential surface area-, pore diameter- and pore volume change
during the hydrogenation reaction, BET analysis were performed. The obtained values
for pure SBA-15 and fresh as well as spent catalyst No. 1 (3% Pd3-Pt1/SBA-15) are
listed in Table 5.5. Corresponding sorption isotherms and BET plots are shown in
Figure 5.9.
Table 5.5 Catalytic properties of catalysts used in two tested reactions
Catalyst BET surface area / m2 g-1
Pore diameter / nm
Mesopore volume / cm3 g-1
Micropore volume / cm3 g-1
SBA-15 643 5.4 0.417 0.088
catalyst No 1, fresh 565 5.1 0.323 0.079
catalyst No 1, spent 542 5.1 0.318 0.069
0 ,0 0 ,1 0 ,2 0 ,3 0 ,4 0 ,5 0 ,6 0 ,7 0 ,8 0 ,9 1 ,0 1 ,1
8 0
1 2 0
1 6 0
2 0 0
2 4 0
2 8 0
0 . 0 0 . 1 0 . 2 0 . 3 0 . 4 0 . 5 0 . 6 0 . 7 0 . 8 0 . 9 1 . 0 1 . 15 0
1 0 0
1 5 0
2 0 0
2 5 0
3 0 0
Vo
lum
e(c
c/g
)
P / P0
Vou
me(
cc/g
)
P /P0
F r e s h
S p e n t
(a) N2 Sorption Isotherm

143
0 ,06 0 ,08 0 ,10 0 ,12 0 ,14 0 ,16 0 ,18 0 ,20 0 ,220 ,3
0 ,4
0 ,5
0 ,6
0 ,7
0 ,8
0 ,9
1 ,0
1 ,1
1 ,2
1 ,3
1 ,4
1/(W
((P
0/P)-
1))
0 . 0 6 0 . 0 8 0 . 1 0 0 . 1 2 0 . 1 4 0 . 1 6 0 . 1 8 0 . 2 0 0 . 2 20 . 3
0 . 4
0 . 5
0 . 6
0 . 7
0 . 8
0 . 9
1 . 0
1 . 1
1 . 2
1 . 3
1/(
W((
P0/P
)-1
))
P / P0
P /P0
F resh
S p e n t
(b) BET Plot
Figure 5.9 Surface areas, pore diameter and pore volume analysis
As can be seen from the values obtained by the sorption measurements (Table 5.5),
the deposition of already 3 wt-% metal decreased the surface area by 14% and the
average pore size by 0.3 nm. The pore volume of the mesopores is reduced by 29%,
those of the micropores by 11%. The usage of the material as a catalyst reduces most
of the values even further, but less pronounced. Such behavior is well matched with
literature results.21-23
5.5 Optimization of hydrogenation
Reaction parameters like reaction temperature, hydrogen pressure, and reaction time
are crucial variables to optimize hydrogenation reactions in general. In order to
determine favorable reaction conditions for the current system in an efficient manner,
a two-level factorial experimental design was applied.24 The experimental plan and
the results are given in Table 5.6.

144
Table 5.6 Two-level factorial design for optimization of LA-hydrogenation
Run T / oC Time / h p (H2) / bar Conv. / % S (GVL) / % TON
1 220 4 20 32.2 96.0 614
2 120 12 100 49.2 99.1 968
3 220 12 20 29.4 96.8 565
4 120 4 100 24.1 98.9 473
5 220 12 100 99.8 98.5 1756
6 120 4 20 15.0 98.1 292
7 220 4 100 99.8 98.7 1760
8 120 12 20 27.5 98.1 536
Reaction conditions: m (LA) = 5.07 g, m (catalyst) = 0.1 g, V (water) = 5 mL, stirring speed = 1000 rpm, V (autoclave) = 20 mL, catalyst synthesizing conditions = No. 1 in Table 5.1, TON is calculated on the total amount of the metals in the used Pd and Pt precursor.
As can be seen from the results in Table 5.5, the reaction temperature and the
hydrogen pressure are deciding parameters in the tested range. If both are
simultaneously maximised, nearly complete LA conversion is achieved (run 5 and 7).
A longer reaction time is only beneficial if lower reaction temperatures are used (run
2 vs. 4). If the lower hydrogen pressure is applied (run 1 and 3), the total hydrogen
amount (~ 12 mmol) is simply not enough to reduce the LA amount (~ 43 mmol)
completely.
In order to characterize the limits of catalyst No. 1 under these favored reaction
conditions, experiments were performed in which the catalyst amount was reduced
stepwise (Table 5.7). 33%, 18% and 11% of the original catalyst loading resulted in
TONs of 5200 (entry 5, yield = 97%), 7980 (entry 6, yield = 83%) and 10921 (entry 7,
yield = 66%). To the best of our knowledge these values are unprecedentedly high
compared with values from literature2-9 (Figure 5.9).
Table 5.7 Characterizing the TON potential of catalyst No. 1 (3% Pd3-Pt1/SBA-15)
Entry Catalyst amount / g
T / oC
t / h
p (H2) / bar
Conv. / %
Sel. (GVL) / % TON
1 a 0.1037 200 6 40 66.8 98.9 1150
2 b 0.1040 220 4 100 99.8 98.5 1756

145
3 c 0.1036 220 12 100 99.8 98.7 1760
4 0.0556 220 12 100 99.6 98.6 3635
5 0.0345 220 12 100 98.9 98.3 5200
6 0.0193 220 12 100 86.1 96.9 7980
7 0.0112 220 12 100 68.6 96.6 10920
Reaction conditions: m (LA) = 5.07 g, V (water) = 5 mL, stirring speed = 1000 rpm, V (autoclave) = 20 mL, catalyst synthesizing conditions = No. 1 in Table 5.1. TON is calculated on the total amount of the metals in the used Pd and Pt precursor.
a: as referred in Table 5.2, No. 1; b: as referred No. 5; c :as referred No 7 from Table 5.6
Figure 5.9 Obtained TONs (No. 1 to No. 5 from Table 5.7) in comparison with results from literatures (reference numbers are given).
5.6 Catalyst recycling
To date, literature reports on hydrogenation of levulinic acid to γ-valerolactone
provide only little information on catalyst stability.25-32 This aspect has been
addressed in this study using the preferred catalyst synthesizing protocol No. 1 (Table
5.2) and the preferred reaction conditions defined in Run 7 of Table 5.6 for repetitive
runs. After each cycle, the catalyst fraction was separated by centrifugation for 30 min,
1000 350 40
630 810 750 200 230
838 832 1150 1750
5200
7980
10920
0
2000
4000
6000
8000
10000
12000
Pd Pt [2] [3] [4] [7] [8] [9]
Screening
[5]
TON
[6] No.1 No.2 No.3 No.4 No.5
Results from literature Optimization

146
then dried in an oven at 90 oC for 12 h and finally reduced with molecular hydrogen
for 30 min at 50 oC before re-use.
To determine the successful reduction of spent catalysts in this procedure, an
elected sample was analyzed by XPS (Figure 5.10). Two distinct signals of Pd at
340.9 eV (3d3/2) and 335.6eV (3d5/2) demonstrated exclusively Pd0 centers existed in
the catalyst surface after the third recycling and reduction. Correspondingly, two
distinct signals of Pt at 70.5 eV (4f7/2) and 74.5 eV show a similar behavior for the Pt
centers. No visible Pd and Pt oxides were observed by XPS, indicating a successful
reduction achieved.13, 20
Figure 5.10 XPS analysis of the reduced catalyst No. 1 after third recycling
The reduction of the recycled Pd and/or Pt particles could in principle result in an
additional agglomeration of the primary particles. In order to prove this possibility
TEM was applied (Figure 5.11). The mean particle size of a reduced catalyst fraction
No. 1 was determined to be 5.5 ± 0.2 nm. In comparison with the spent catalyst (3.4
nm, Figure 5.8), this value argues for a certain degree of agglomeration.
Figure 5.11 TEM analysis of the recycled and reduced catalyst No. 1

147
The catalytic performances of the recycled catalyst fractions with and without
intermediate catalyst hydrogenation are shown in Figure 5.12. Fortunately, the
selectivity behaves rather stable under standardized conditions. Also the conversion
drops only marginal from 97% to 90%. This small decrease is most likely the result of
an incomplete material recovery which is almost unavoidable in this batch-wise
procedure. Furthermore, it can be clearly seen that a treatment of the catalyst fraction
with hydrogen behaves beneficial on the catalytic performance.20 Furthermore,
analysis of the aqueous reaction solutions (take 1.2 ml) by ICP after reaction showed
nearly no detectable leaching of Pd (~7 ppm was found in the solution).
Fresh Run1' Run1 Run2 Run30
20
40
60
80
100
Con
vers
ion&
Sel
ectiv
ity/%
Conversion/% Selectivity/%
Figure 5.12 Catalytic performances of recycled catalysts in LA hydrogenation. Run 1’ indicate the first run of a recycled catalyst which was not reduced in advance.
5.8 Transformation of LA to pentanoic acid
Pentanoic acid (PA), also named valeric acid, is a straight-chain alkyl carboxylic acid
with the chemical formula C5H10O2. Like other low-molecular-weight carboxylic
acids, it has a very unpleasant odor. It is found naturally in the perennial flowering
plant valerian (Valeriana officinalis), from which it got its name. It is primarily used
for the synthesis of esters which found application in the perfume, food and cosmetic

148
industry. PA is also frequently used as an chemical intermediate, e.g. for the synthesis
of synthetic lubricants or agrochemicals and pharmaceuticals.35, 36
As PA was often observed as a by-product in the hydrogenation of LA to GVL
(Scheme 5.3),2, 35, 36 special attempts have been made to increase the PA selectivity.
As can be seen from the results in Table 5.8 a solvent switch to hexane and higher
reaction temperatures (300 °C) led to a quite high PA selectivity of 70%, whereby 2-
MTHF (20%) and GVL (9%) are the dominating side-products (entry 9).
Table 5.8 Solvent and temperature influence on the products distribution a
Entry Solvent T / °C
t / h
Conv. (LA) / %
S (GVL) / %
S (PA) / %
S (MTHF) / %
1 H2O 200 6 66.8 98.9 0.3 0.2
2 H2O 200 8 92.2 99.2 0.2 0.1
3 H2O 250 8 98.5 90.5 4.9 3.5
4 H2O 270 8 >99 55.6 37.2 3.9
5 H2O 300 6 93.4 77.1 21.4 0.8
6b Cyclohexane 300 6 95.2 73.9 14.5 0.5
7c Hexane 300 6 >99 15.9 51.7 15.3
8d diethyl ether 300 6 92.6 82.3% 7.8% 5.2%
9 Hexane 300 10 >99 9.0% 70.1% 20.3%
a m (LA) = 1.6 g, V (solvent) = 5 mL, stirring speed = 1000 rpm, V (autoclave) = 20 mL. p (H2) = 50 bar, catalyst synthesizing conditions = No. 1 in Table 5.2. Only liquid phase was analyzed. The results were calculated based on GC analysis.
b The results are less exact because the product mixture was biphasic and a homogenization by an additional solvent was not done after reaction.
c 1,4-pentanediol (6.5%) and unkown compounds (~10%) were produced in this case.
d The results are less exact because significant amounts of diethyl ether evaporated during the applied procedure.
5.8 Possible pathways of levulinic acid hydrogenation
Figure 5.13 shows a representative GC chromatogram of the product mixture of LA
hydrogenation. For the products detected, a reaction network for GVL and side
product formation is proposed in Scheme 5.4. Levulinic acid was firstly hydrogenated
to 4-hydroxypentanoic acid, which lactonisation to GVL is preferred. Alternatively, a
dehydration of 4-hydroxypentanoic acid gives pentenoic acid, which C-C double bond
is easily hydrogenated to pentanoic acid. 37-39

149
Figure 5.11 Typical GC spectra of LA hydrogenation (PA: pentanoic acid, MTHF: 2-methyltetrahydrofuran, 1-hexanol: internal standard, acetone: diluting and homogenizing solvent for GC measurement).
Scheme 5.3 Hydrogenation of levulinic acid to γ-valerolactone and pentanoic acid
5.9 Conclusion
1. A series of homo- and bimetallic Pd and/or Pt nanoparticles catalysts
supported on SBA-15 display good activities in hydrogenation of LA to GVL.
The application of DOE allowed the identification of individual, crucial
reaction parameters. Based on the initial screening procedure a bimetallic
catalyst was identified as the most promising one.

150
2. In an optimization procedure an increase in both hydrogen pressure (100 bar)
and reaction temperature (220 °C) led to complete conversion at a still very
high level of GVL selectivity, providing a maximum of 98% yield. The chosen
catalyst maintained high activity over multiple cycles and could easily be
regenerated by reduction with molecular hydrogen between each run. In
comparison with published work from other groups, our results compare
highly favorably in terms of achieved turnover number (e.g. 5200 at 97% yield,
and up to 10920).
3. 4-hydroxypentanoic acid is side product in GVL formation. Higher reaction
temperatures (300 °C) and using hexane instead of water as a solvent prefer
the formation of pentanoic acid with 70% selectivity at conversion of 100%.
5.10 References
1. N. Theyssen, K. Yan, F. Qin, W. Leitner, ‘Synthesis of homo-and bimetallic Nano Catalysts by Chemical Fluid Deposition (CFD) and their Application in the highly efficient Conversion of D-fructose and levulinic acicd’. The Cluster of Excellence’ Tailor Made Fuels from Biomass’ Year Report, 2010.
2. F. M. A. Geilen, B. Engendahl, A. Harwardt, W. Marquardt, J. Klankermayer, W. Leitner, Angew. Chem. Int. Ed., 49 (2010) 5510.
3. R. A. Bourne, J. G. Stevens, J. Ke, M. Poliakoff, Chem. Commun., 2007, 4632.
4. Z.-P. Yan, L. Lin, S. Liu, Energy & Fuels, 23 (2009) 3853.
5. R. V. Christian, H. D. Brown, R. M. Hixon, J. Am. Chem. Soc., 69 (1947) 1961.
6. H. Mehdi, V. Fábos, R. Tuba, A. Bodor, L. T. Mika, I. T. Horváth, Top. Catal., 48 (2008) 49.
7. L. Deng, J. Li, D. M. Lai, Y. Fu, Q.-X. Guo, Angew. Chem. Int. Ed., 48 (2009) 6529.
8. K. Osakada, T. Ikariya, S. Yoshikawa, J. Organomet. Chem., 231 (1982) 79.
9. H. A. Schutte, R. W. Thomas, J. Am. Chem. Soc., 52 (1930) 3010.
10. Design expert analysis: http://www.statease.com/
11. M. J. Anderson, P. J. Whitcomb, RSM Simplified: Optimizing Processes Using Res-ponse Surface Methods for Design of Experiments, CRC Press, April, 2004
12. N. Theyssen, K. Yan, F. Qin, W. Leitner, “Synthesis of Nanostructured Catalysts by Chemical Fluid Deposition (CFD)”TMFB International Workshop of the Cluster of Excellence Tailor-Made Fuels from Biomass, 23-24 June 2010, Aachen, Germany.
13. Z. Hou, N. Theyssen, A. Brinkmann, K.V. Klementiev, W. Grünert, M. Bühl, W. Schmidt, B. Spliethoff, B. Tesche, C. Weidenthaler, W. Leitner, J. Catal., 258 (2008) 315.
14. J. M. Blackburn, D. P. Long, J. J. Watkins, Chem. Mater., 12 (2000) 2625.
15. D. P. L. Jason M. Blackburn, A. Cabanas, J. J. Watkins, Science, 294 (2001)141.
151
16. D. P. Long, J. M. Blackburn, J. J. Watkins, Adv. Mater., 12 (2000) 913.
17. A. H. Romang, J. J. Watkins, Chem. Rev., 110 (2010) 459.
18. J. J. Watkins, J. M. Blackburn, T. J. McCarthy, Chem. Mater., 11 (1999) 213
19. H. Wakayama, N. Setoyama, Y. Fukushima, Adv. Mater., 15 (2003) 742
20. A. Corma, A. Mart´ınez, V. Mart´ınez-Soriay, J. Catal., 169 (1997) 480.
21. K. S. W. Sing, D. H. Everett, R. A. Haul, L. Moscou, R. A. Pierotti, J. Rouquerol, T. Siemienieuska, Pure Appl. Chem., 57 (1985) 603.
22. J. C. Groen, L. A. A. Peffer, J. Perez-Ramirez, Micropor. Mesopor. Mater., 60 (2003) 1.
23. K. Bendahou, L. Cherif, S. Siffert, H.L. Tidahy, H. Benaissa, A. Aboukais, Appl. Catal. A 351 (2008) 82.
24. A Primer on Mixture Design: What’s In It for Formulators? http://www.statease.com/ pubs/MIXprimer.pdf
25. R. H. Leonard, Ind. Eng. Chem., 48 (1956) 1330.
26. L. E. Manzer (Dupont de Nemours), WO-A-02/072760, 2002.
27. L. E. Manzer, Appl. Catal. A, 272 (2004) 249.
28. E. V. Starodubtseva, O. V. Turova, M. G. Vinogradov, L. S. Gorshkova, V. A. Ferapontov, Russ. Chem. Bull., 54 (2005) 2374.
29. J.-P. Lange, J. Z. Vestering, R. J. Haan, Chem. Commun. 2007, 3488.
30. D. M. Alonso, J. Q. Bond, J. C. Serrano-ruiz, J. A. Dumesic, Green Chem., 12 (2010) 992.
31. R. V. Christian, H. D. Brown, R. M. Hixon, J. Am. Chem. Soc., 69 (2002) 1961.
32. L. Deng, Y. Zhao, J. Li, Y. Fu, B. Liao, Q-X. Guo, ChemSusChem, 3 (2010) 1172.
33. http://en.wikipedia.org/wiki/Valeric_acid
34. http://pubchem.ncbi.nlm.nih.gov/summary/summary.cgi?loc=ec_rcs&cid=7991
35. J.-P. Lange, R. Price, P. M. Ayoub, J. Louis, L. Petrus, L. Clarke, H. Gosselink, Angew. Chem. Int. Ed., 49 (2010) 4479.
36. R. Palkovits, Angew. Chem. Int. Ed., 49 (2010) 4336.
37. C. J. Barrett, J. N. Chheda, G.W. Huber, J. A. Dumesic, Appl. Catal. B 66 (2006) 111.
38. R. D. Cortright, M. Sanchez-Castillo, J. A. Dumesic, Appl. Catal. B 39 (2002) 353.
39. J. Q. Bond, D. M. Alonso, R. M. West, J. A. Dumesic, Langmuir, 26 (2010) 16291.

152
Summary 1. Nanoparticle Pd catalysts supported on SBA-15 were successfully prepared in
liquid CO2 by a modified chemical fluid deposition. Selected catalysts display
efficient performance in dehydration of D-fructose. The used solvents were
found to have a deciding effect on product distributions. When dehydration is
operated in water or 2-MTHF, the obtained main product is HMF. In contrast,
ethanol or THF led to the preferred production of levulinic acid. This solvent
regulated switch in product selectivity is only observable if deposited Pd is
present on the SBA-15 surface.
Scheme 1 Solvent and metal effect on dehydration of D-fructose
2. Highly dispersed and uniform homo- and bimetallic Pd and/or Pt nano-
particles supported on SBA-15 were synthesized using chemical fluid
deposition with scCO2. (cyclopentadienyl) allyl-palladium (II) [CpPd(η3-C3H5)]
and (1,5-cyclooctadiene)-dimethylplatinum(II) [(1,5-cod)Pt(CH3)2] were
identified as suitable precursors. The variation in synthesizing conditions
(initiated by the experimental plan) led to remarkable and highly reproducible
results in terms of D-fructose conversion, LA selectivity and catalyst stability
for the new catalysts (Scheme 2). An optimized synthesis protocol for a
bimetallic catalyst with a Pt/Pd ratio of 3:1 display the best performance
leading to 72% conversion and 86% selectivity. In comparison with the
published works from other groups, our results compare favourably in terms of
turnover number (TON) and/or selectivity.
CH2OH
OH
HOO CH2OH
OH
D-fructose
Pd-Pt/SBA-15
COOH
O
HMF
OHO O
+
EtOH
Levulinic acid
62% Yield
72% Con.Levulinic acid
Scheme 2 Dehydration of D-fructose based on homo- and bimetallic catalysts.

153
3. Our experiments show that the tested catalysts behave stable and can be reused
efficiently in multiple cycles. For this purpose an interjectional calcination and
reduction step is necessary which removes deactivating carbon-based layers
from the surface. In general, this recyclability in combination with the easy
handling and product separations are highly attractive features as compared to
conventional mineral acid based catalyst systems.
4. The experimental data of the present study are not consistent with the
assumption that HMF is an intermediate in the formation of levulinic acid if
the present catalyst system is applied. An alternative reaction pathway is
proposed in this work which is based on metal induced C-C bond cleavage at
the α-position of a 1,2-dicarbonyl compound as the key intermediate.
5. The above mentioned catalyst display also good activity for dehydration of D-
glucose if CoCl2 is added additionally (Scheme 3). LA was obtained with 51%
yield in ethanol as a reaction medium. If the reaction is performed in water
under otherwise identical conditions, HMF is again the dominating monomeric
product (obtained in 18% yield).
Scheme 3 Dehydration of D-glucose using CoCl2 and 9% Pd3-Pt1/SBA-15.
6. The homo- and bimetallic catalysts display also excellent activities in
hydrogenation of LA to γ-valerolactone (GVL, Scheme 4). The application of
DOE allowed the identification of individual, crucial reaction parameters in
catalyst synthesis. Based on initial screening according to the experimental
plan, a bimetallic catalyst with a Pt/Pd ratio of 1:3 showed the best
performance.

154
7. Further optimization of the reaction conditions led to a very efficient catalytic
procedure for the hydrogenation of LA to GVL: Choosing 220 oC, 4 h reaction
time and a hydrogen pressure of 100 bar (at room temperature) full LA
conversion and almost perfect GVL selectivity were obtained (Scheme 4). In
comparison with published work from other groups, our results are very
competitive – especially in terms of achieved turnover numbers (5200 at 97%
yield, and exceeding 10 000 at lower catalyst loadings).
Scheme 4 Hydrogenation of levulinic acid to γ-valerolactone
8. The catalysts resulting from the most suited synthesizing procedure maintain
high activity over multiple cycles and could be easily regenerated by treatment
with molecular hydrogen. 92% conversion and 96% GVL selectivity were
obtained in the fourth run.
9. The formation of GVL occurs via ring-closure (lactonisation) of 4-
hydroxypentanoic acid as an intermediate (Scheme 5). A higher reaction
temperature (300 °C) and the usage of hexane instead of water as a solvent
resulted in the preferred dehydration and reduction of 4-hydroxypentanoic acid
to pentanoic acid (selectivity = 70%).
Scheme 5 Formation of pentanoic acid from hydrogenation of levulinic acid.

155
10. The following general trends can be identified for both main studied test
reactions:
(a) The best bimetallic catalysts displayed a better performance than the
best monometallic ones.
(b) Whereas a higher Pt/Pd ratio is beneficial for the dehydration
reaction of D-fructose to LA, Pd dominated compositions are the
preferred ones for hydrogenation of LA to GVL.
(c) Beyond the metal compositions of the bimetallic catalysts, other
catalyst synthesis parameters like impregnation time and metal
loading are individually decisive for obtaining high conversion,
selectivity and TON. Thus the synthesis protocols for the best
catalysts for both test reactions differ significantly from each other.
11. The strong interaction of the metal catalysts and the solvents observed in the
present study deserve further attention. Future work is necessary to elucidate the exact
role of the metal in the dehydration reactions. Much work needs to be done to clarify
the role of the metal. It was observed that the used solvents have a strong influence
toward product distributions. More effort is necessary to explain this behavior.
Furthermore, development of continuous processes capitalizing on the heterogeneous
nature of the catalysts seems promising for the dehydration as well as the
hydrogenation processes. Hydrogenation of levulinic acid to pentanoic acid is a
promising reaction cascade to produce alkane-based fuels from renewable recourses.
To improve the yields further, optimization both from the catalyst and the reaction
perspective is necessary. Finally, one step conversions of sugar or directly available
feedstocks to biofuels such as MTHF are not reported here but deserve much more
attention in catalyst development.

156
Publications originating from the present study
Publication Lists
1. K. Yan, F. Qin, N. Theyssen and W. Leitner*. Preparation of homo- and
bimetallic nano-catalysts of Palladium and Platinum on SBA-15 support by
chemical fluid deposition. In Preparation, 2011.
2. K. Yan, R. Weiss, F. Qin, L. Winkel, N. Theyssen and W. Leitner*. Metal-
doped solid acid catalyst for the conversion of fructose and glucose to HMF
and levulinic acid. In Preparation, 2011.
3. K. Yan, N. Theyssen, F. Qin and W. Leitner*. Hydrogenation of levulinic acid
to gamma-valerolactone over homo- and bimetallic nano-catalysts. In
Preparation, 2011.
Conference contributions
1. K. Yan, F. Qin, N. Theyssen, W. Leitner. “Efficient transformation of sugar-
derived biomass into platform chemicals using homo- and bimetallic catalysts”.
2nd Indo-German Catalysis for Renewable Energy, 19-22 June 2011, Rostock,
Germany.
2. K. Yan, F. Qin, N. Theyssen, W. Leitner. “Synthesis of supported catalysts by
chemical fluid deposition and their application in transformation of sugar-
derived biomass into platform chemicals”. 2nd International Conference on
Multifunctional, Hybrid and Nanomaterials, 6-10 March 2011, Strasbourg,
France.
3. N. Theyssen, K. Yan, F. Qin, R. Weiss, W. Leitner. “Synthesis of
Nanostructured Catalysts by Chemical Fluid Deposition (CFD)”TMFB
International Workshop of the Cluster of Excellence Tailor-Made Fuels from
Biomass, 23-24 June 2010, Aachen, Germany.
157
4. N. Theyssen, K. Yan, F. Qin, R. Weiss, W. Leitner. “Synthesis of Nano-
Catalysts by Chemical Fluid Deposition and their Application in the
Transformation of Biomass-Derived Monomers”. IRF1 / IRF2 Project
Meeting, 21 May 2010, Hörsaal A1, ITMC, RWTH Aachen, Germany.
Poster Presentations
1. K. Yan, F. Qin, N. Theyssen, W. Leitner. Selective dehydration of D-fructose
into HMF or levulinic acid. No. 43rd. German Catalysis Meeting, 10-12
March, 2010, Weimar, Germany.
2. F. Qin, K. Yan, N. Theyssen, W. Leitner. Synthesis of nanostructured
catalysts by CFD. No. 43rd. German Catalysis Meeting, 10-12 March, 2010,
Weimar, Germany.
3. N. Theyssen, K. Yan, F. Qin, W. Leitner, Synthesis of nano-catalysts by
chemical fluid deposition and their application in the transformation of
biomass-derived monomers. Green Solvents Conference, 10-13 October, 2010,
Berchtesgaden, Germany.
4. L. Orzechowski, K. Yan, F. Qin, N. Theyssen, W. Leitner. “Synthesis of
supported catalysts by chemical fluid deposition and their application in
transformation of sugar-derived biomass into platform chemicals”. 2nd Indo-
German Catalysis for Renewable Energy, 19-22 June 2011, Rostock, Germany.
5. K. Yan, F. Qin, L. Orzechowski, N. Theyssen, W. Leitner, Efficient
transformation of biomass-derived monomers using nanocatalysts by chemical
fluid deposition, 23-25 June, 2011, Aachen, Germany.

158
Lebenslauf
Persönliche Daten:
Name: Kai Yan
Geburtstag: 28.10.1982
Geburtsort: Liu An
Familienstand: Single
Staatsangehörigkeit: Chinese Studium
09/2001 Begin diploma study in Anhui University of Technology and Science, China
07/2005 Bachelor Degree from Anhui University of Technology and Science, China
09/2005 Begin Master study in Taiyuan University of Technology, China under
supervisor Prof. Dr. Xianmei Xie.
06/2008 Master Degree from Taiyuan University of Technology, China. Master
thesis: Synthesis of benzoin ether compounds using hydrotalcite materials
10/2008 Begin Doctor study in Max-Planck-Institut für Kohlenforschung (Mülheim a.
d. Ruhr) under Prof. Dr. Walter Leitner and Dr. Nils Theyssen
Promotion 10/2008 Max-Planck-Institut für Kohlenforschung (Mülheim an der Ruhr),
Registered in RWTH Aachen University. Ph.D thesis: Transformation of
Biogenic Carbohydrates into Levulinic Acid and further Hydrogenation
using Supported Nanoparticle Catalysts Synthesized by Chemical Fluid
Deposition


![Brot, Kuchen und Bäckerei: Kai Degenhardt zum 50. Geburtstag [Bread, Cake, and the Bakery: In Celebration of Kai Degenhardt's 50th Birthday]](https://static.fdokumen.com/doc/165x107/631feebf962ed4ca8e03ed9f/brot-kuchen-und-baeckerei-kai-degenhardt-zum-50-geburtstag-bread-cake-and.jpg)