
Capacity Enhancement and Voltage Stability Improvement of ...
Upload
khangminh22Category
view
3download
0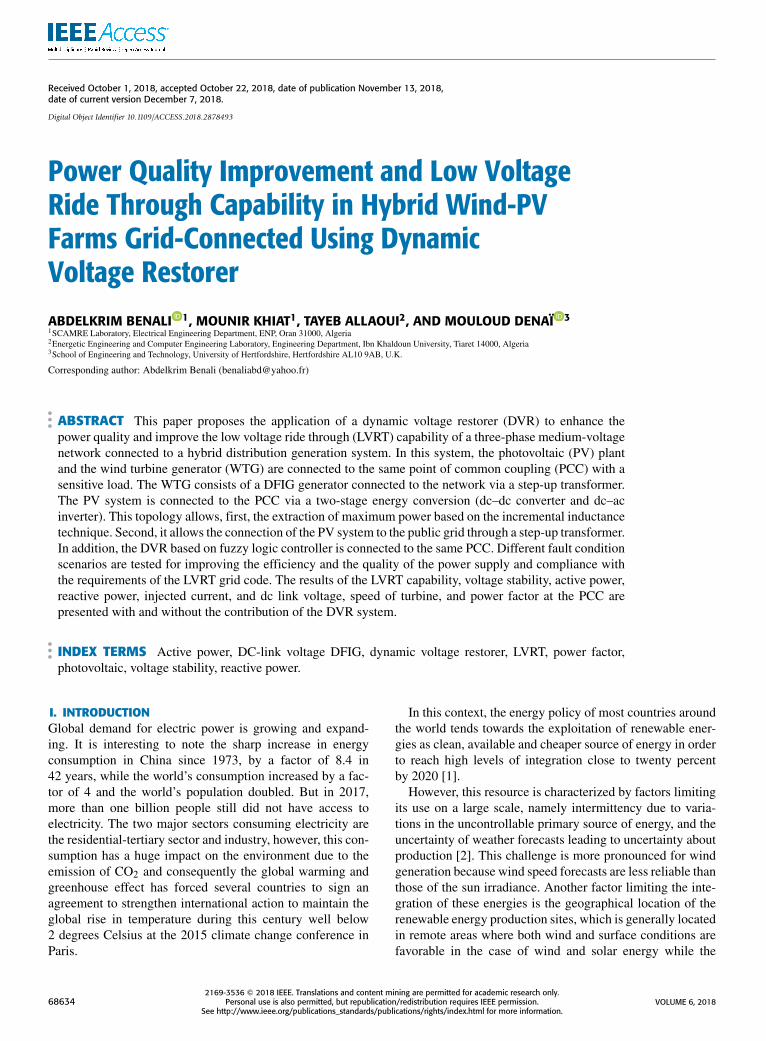
Received October 1, 2018, accepted October 22, 2018, date of publication November 13, 2018,date of current version December 7, 2018.
Digital Object Identifier 10.1109/ACCESS.2018.2878493
Power Quality Improvement and Low VoltageRide Through Capability in Hybrid Wind-PVFarms Grid-Connected Using DynamicVoltage RestorerABDELKRIM BENALI 1, MOUNIR KHIAT1, TAYEB ALLAOUI2, AND MOULOUD DENAÏ 31SCAMRE Laboratory, Electrical Engineering Department, ENP, Oran 31000, Algeria2Energetic Engineering and Computer Engineering Laboratory, Engineering Department, Ibn Khaldoun University, Tiaret 14000, Algeria3School of Engineering and Technology, University of Hertfordshire, Hertfordshire AL10 9AB, U.K.
Corresponding author: Abdelkrim Benali ([email protected])
ABSTRACT This paper proposes the application of a dynamic voltage restorer (DVR) to enhance thepower quality and improve the low voltage ride through (LVRT) capability of a three-phase medium-voltagenetwork connected to a hybrid distribution generation system. In this system, the photovoltaic (PV) plantand the wind turbine generator (WTG) are connected to the same point of common coupling (PCC) with asensitive load. The WTG consists of a DFIG generator connected to the network via a step-up transformer.The PV system is connected to the PCC via a two-stage energy conversion (dc–dc converter and dc–acinverter). This topology allows, first, the extraction of maximum power based on the incremental inductancetechnique. Second, it allows the connection of the PV system to the public grid through a step-up transformer.In addition, the DVR based on fuzzy logic controller is connected to the same PCC. Different fault conditionscenarios are tested for improving the efficiency and the quality of the power supply and compliance withthe requirements of the LVRT grid code. The results of the LVRT capability, voltage stability, active power,reactive power, injected current, and dc link voltage, speed of turbine, and power factor at the PCC arepresented with and without the contribution of the DVR system.
INDEX TERMS Active power, DC-link voltage DFIG, dynamic voltage restorer, LVRT, power factor,photovoltaic, voltage stability, reactive power.
I. INTRODUCTIONGlobal demand for electric power is growing and expand-ing. It is interesting to note the sharp increase in energyconsumption in China since 1973, by a factor of 8.4 in42 years, while the world’s consumption increased by a fac-tor of 4 and the world’s population doubled. But in 2017,more than one billion people still did not have access toelectricity. The two major sectors consuming electricity arethe residential-tertiary sector and industry, however, this con-sumption has a huge impact on the environment due to theemission of CO2 and consequently the global warming andgreenhouse effect has forced several countries to sign anagreement to strengthen international action to maintain theglobal rise in temperature during this century well below2 degrees Celsius at the 2015 climate change conference inParis.
In this context, the energy policy of most countries aroundthe world tends towards the exploitation of renewable ener-gies as clean, available and cheaper source of energy in orderto reach high levels of integration close to twenty percentby 2020 [1].
However, this resource is characterized by factors limitingits use on a large scale, namely intermittency due to varia-tions in the uncontrollable primary source of energy, and theuncertainty of weather forecasts leading to uncertainty aboutproduction [2]. This challenge is more pronounced for windgeneration because wind speed forecasts are less reliable thanthose of the sun irradiance. Another factor limiting the inte-gration of these energies is the geographical location of therenewable energy production sites, which is generally locatedin remote areas where both wind and surface conditions arefavorable in the case of wind and solar energy while the
686342169-3536 2018 IEEE. Translations and content mining are permitted for academic research only.
Personal use is also permitted, but republication/redistribution requires IEEE permission.See http://www.ieee.org/publications_standards/publications/rights/index.html for more information.
VOLUME 6, 2018
A. Benali et al.: Power Quality Improvement and LVRT Capability
transmission systems are relatively weak which causes newchallenges for the control of the voltage and the compensationof reactive power.
The stochastic nature of these renewable energy sourcescan have an impact on the dynamic behavior of the grid and itsstability during sudden and significant variations in the powerdelivered by one or more units of high power [2].
Similarly, if a renewable energy power plant operatingat full power is suddenly disconnected due to a fault inthe internal grid of the installation, the grid should remainstable and the voltage and frequency of the grid must bemaintained within their admissible ranges [1]–[3]. Anotherfactor that negatively impacts the power quality comes fromthe presence of modern power electronics technology as theoutput interface of power plants. These devices not onlyproduce harmonics in the system, but are also very sensitiveto distorted voltage signals [4].
To overcome these constraints and ensure the stability ofthe electric power system connected to large amounts ofvariable energy resources, the operators of energy systemshave resorted to explore multiple technical solutions.
The proposed solutions have two components; one is regu-latory where the technical grid code, directives and conditionsdedicated to the integration of renewable energy sources intothe grid required by the grid operators and the other solutionsare technical ones.
One of the most important grid code requirements is theLow Voltage Ride Through (LVRT) capability, which meansthat the renewable energy conversion system must remainconnected during grid faults and supply reactive power tosupport the grid [5]. These requirements have been applied towind turbines only so far, but recently photovoltaic generatorsare also required to fulfill these grid codes.
The prospects of power generation from hybrid energysystems are proving to be very promising and reliable [6].Muyeen [7] proposed a static synchronous compen-sator (STATCOM) combined with a small series dynamicbraking resistor (SDBR) to enhance the stability of a grid-connected wind farm composed of a fixed-speed wind turbinegenerator system (WTGS). A DFIG and flywheel energystorage system was studied in [8] and the proposed con-trol scheme was designed to ensure that the grid power isisolated from wind power output fluctuations. Rashid andAli [9] applied a nonlinear control based on a modifiedbridge type fault current limiter (NCMBFCL) to improvethe LVRT performance of a DFIG based wind farm sub-jected to symmetrical and unsymmetrical faults. Dosoglu andArsoy [10] and Dosoglu [11] analyzed a system consistingof a supercapacitor energy storage coupled to the DFIG for agrid integrated wind generator DFIG and studied the transientbehavior and LVRT capability of the systemwith and withoutenergy storage system (ESS).
To enhance the LVRT capability of a grid-integratedDFIG-based wind farm, a STATCOM and supercapacitorenergy storage system have been proposed in [12]. In [13],a new stator damping resistor unit (SDRU) and rotor current
control (RCC) for grid-connected DFIG-based wind turbinehas been studied. Other devices commonly used in distribu-tion networks to protect critical loads against voltage distur-bances are known as D-FACTS and include: D-STATCOM(Static Dispensing Compensator), DVR (Dynamic VoltageRestorer) and UPQC (Unified Power Quality Conditioner).
The DVR has the ability to attenuate voltage disturbances.It is generally installed between the load and the source in thedistribution system to provide rapid support of the voltage byinjecting the required voltage in series with the mains voltagethrough an injection transformer [14].
This paper presents a simulation study to demonstrate theeffectiveness of the DVR to mitigate voltage disturbances,minimize their impact on the overall stability of the trans-mission and distribution network, and improve the LVRTcapability when the network is connected to a hybrid PV-windsystem.
A DVR based on fuzzy logic control and phase compensa-tion technique is designed and evaluated under various faultconditions such as short-circuits and voltage sags.
It is well known that active power recovery and noexcessive reactive power absorption are essential for systemsecurity and sufficiently quick active power recovery is essen-tial for frequency stability in the overall grid whereas largereactive power absorption could have a negative impact onvoltage recovery or even drive the system into a local voltagecollapse. This contribution is aimed to demonstrate that theDVR with the proposed control scheme is able to providethese features for the hybrid PV-Wind generators coupled togrid system.
The remaining of the paper is organized as follows:Section 2 describes the configuration of the hybrid distributedgeneration system which consists of photovoltaic and windpower plants and develops a detailed simulation model ofthe DC/DC and DC/AC converters. Section 3 describes thetopology of the DVR and its basic scheme. Section 4 reit-erates the need to introduce new grid codes related to thepenetration of renewable energy power plants into the grid.Section 5 presents the simulation results, including the assess-ment of the LVRT capability under various disturbances.Finally, Section 6 concludes this work.
II. PROPOSED SIMULATED SCENAROS ANDSYSTEM DESCRIPTIONThe choice of photovoltaic energy or wind turbine or bothdepends on the availability of the renewable resource overtime and also is abundance at the site of installation. Cur-rently, solar and wind are the most commonly adopted andmost easily exploitable renewable energy sources.
Several studies have shown that solar radiation and windspeed distributions often have complementary behavior, andconsequently in many cases a hybrid configuration combin-ing photovoltaic and wind generators is adopted [4].
Particularly, PV and wind energy technologies haveenhanced their integration in hybrid power system con-figurations. This combination is considered as one of the
VOLUME 6, 2018 68635
A. Benali et al.: Power Quality Improvement and LVRT Capability
most efficient configurations which can be used either ingrid-connected or standalone modes. Solar and wind energiesare complementary in nature [4], [15], [16] and therefore canbe utilized to overcome the problem of intermittency andprovide a more reliable power with better quality to theelectricity grid and remote areas [17], [18].
In recent years, several research studies have been carriedout on PV-wind hybrid systems [17]. This study summarizesseveral research articles in the literature on PV-wind hybridpower system. Among these, a few studies proposed theintegration of PV and DFIG-based wind power in a hybridconfiguration to supply sustainable power to remote loadcenters. This configuration has several advantages includingsimple design, decoupling control of the active and reactivepowers, partially rated converters, andmaximumwind energyextraction form the turbine [17].
FIGURE 1. PV-WTG hybrid system with DVR and a load connected to grid.
The proposed topology is illustrated in Fig. 1. It consistsof a 500 kW PV plant interconnected to a distribution systemvia a three phase PWM inverter with a three phase AC throttlefilter and a step-up transformer.
The DFIG has a nominal output power of 500 kW and isconnected to the grid at the PCC via a step-up transformer andsupplying the load. Thus, the estimated total power deliveredby the hybrid system is 1 MW.
This is a typical connection of a hybrid PV-WTG howeverthere are other topologies of connections. The comparativestudy presented in [19] concludes that: (i) In terms of powerefficiency, the single stage topology is better, (ii) For the DClink voltage stability and reduced total harmonic distortionin the AC side voltage, the two-stage topology is preferred,(iii) With regard to the maximum power tracking precision,within an acceptable error range of controller oscillation andpower losses in the AC-side filter, both topologies can satisfythese requirements.
In [20], transformer-less inverters are employed to enhancethe efficiency, reduce the size and lower the cost of thecircuit. Because of their high efficiency, transformer-less PV
systems, are becoming more popular than conventional PVsystems, especially in European markets [20].
The simulation scenarios presented in this paper are carriedout as follows:
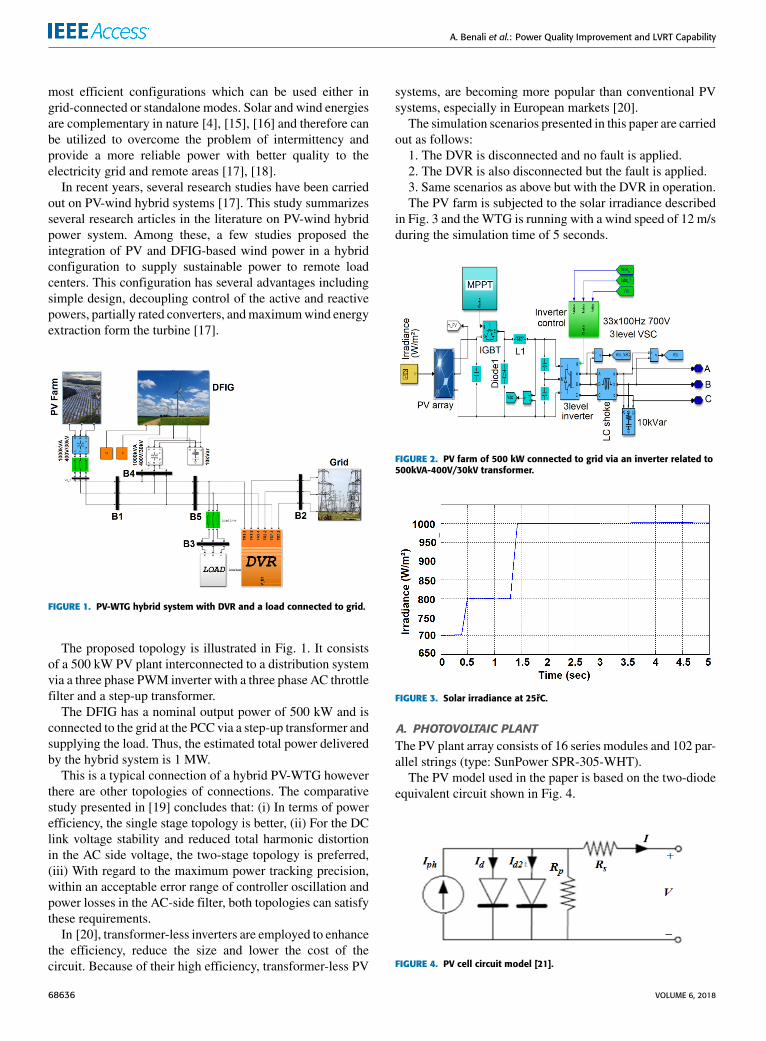
1. The DVR is disconnected and no fault is applied.2. The DVR is also disconnected but the fault is applied.3. Same scenarios as above but with the DVR in operation.The PV farm is subjected to the solar irradiance described
in Fig. 3 and theWTG is running with a wind speed of 12 m/sduring the simulation time of 5 seconds.
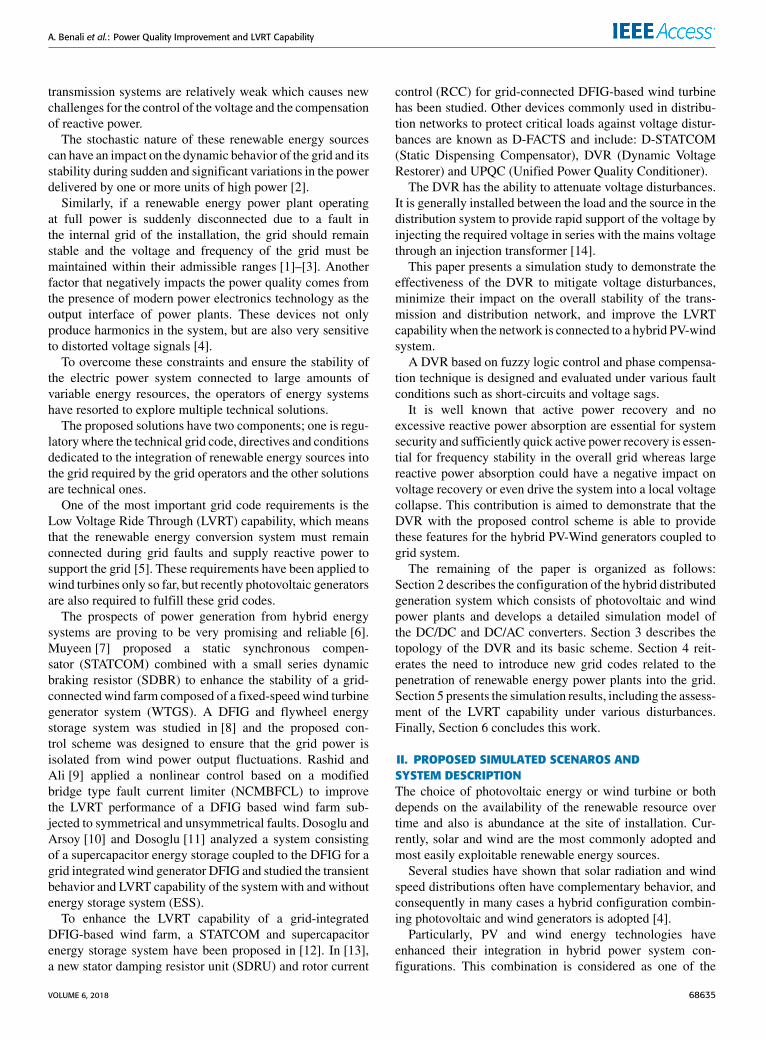
FIGURE 2. PV farm of 500 kW connected to grid via an inverter related to500kVA-400V/30kV transformer.
FIGURE 3. Solar irradiance at 25řC.
A. PHOTOVOLTAIC PLANTThe PV plant array consists of 16 series modules and 102 par-allel strings (type: SunPower SPR-305-WHT).
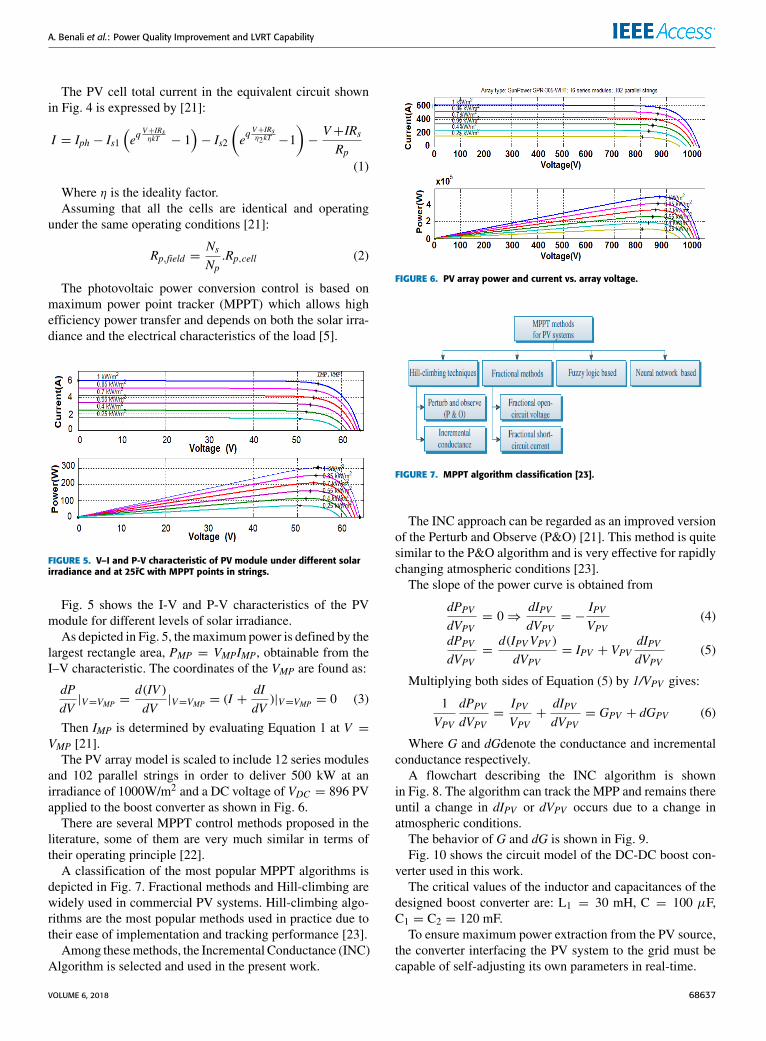
The PV model used in the paper is based on the two-diodeequivalent circuit shown in Fig. 4.
FIGURE 4. PV cell circuit model [21].
68636 VOLUME 6, 2018
A. Benali et al.: Power Quality Improvement and LVRT Capability
The PV cell total current in the equivalent circuit shownin Fig. 4 is expressed by [21]:
I = Iph − Is1(eq
V+IRsηkT − 1
)− Is2
(eq
V+IRsη2kT −1
)−V+IRsRp
(1)
Where η is the ideality factor.Assuming that all the cells are identical and operating
under the same operating conditions [21]:
Rp,field =NsNp.Rp,cell (2)
The photovoltaic power conversion control is based onmaximum power point tracker (MPPT) which allows highefficiency power transfer and depends on both the solar irra-diance and the electrical characteristics of the load [5].
FIGURE 5. V–I and P-V characteristic of PV module under different solarirradiance and at 25řC with MPPT points in strings.
Fig. 5 shows the I-V and P-V characteristics of the PVmodule for different levels of solar irradiance.
As depicted in Fig. 5, themaximum power is defined by thelargest rectangle area, PMP = VMPIMP, obtainable from theI–V characteristic. The coordinates of the VMP are found as:
dPdV|V=VMP =
d(IV )dV|V=VMP = (I +
dIdV
)|V=VMP = 0 (3)
Then IMP is determined by evaluating Equation 1 at V =VMP [21].The PV array model is scaled to include 12 series modules
and 102 parallel strings in order to deliver 500 kW at anirradiance of 1000W/m2 and a DC voltage of VDC = 896 PVapplied to the boost converter as shown in Fig. 6.
There are several MPPT control methods proposed in theliterature, some of them are very much similar in terms oftheir operating principle [22].
A classification of the most popular MPPT algorithms isdepicted in Fig. 7. Fractional methods and Hill-climbing arewidely used in commercial PV systems. Hill-climbing algo-rithms are the most popular methods used in practice due totheir ease of implementation and tracking performance [23].
Among thesemethods, the Incremental Conductance (INC)Algorithm is selected and used in the present work.
FIGURE 6. PV array power and current vs. array voltage.
FIGURE 7. MPPT algorithm classification [23].
The INC approach can be regarded as an improved versionof the Perturb and Observe (P&O) [21]. This method is quitesimilar to the P&O algorithm and is very effective for rapidlychanging atmospheric conditions [23].
The slope of the power curve is obtained from
dPPVdVPV
= 0⇒dIPVdVPV
= −IPVVPV
(4)
dPPVdVPV
=d(IPVVPV )dVPV
= IPV + VPVdIPVdVPV
(5)
Multiplying both sides of Equation (5) by 1/VPV gives:
1VPV
dPPVdVPV
=IPVVPV+
dIPVdVPV
= GPV + dGPV (6)
Where G and dGdenote the conductance and incrementalconductance respectively.
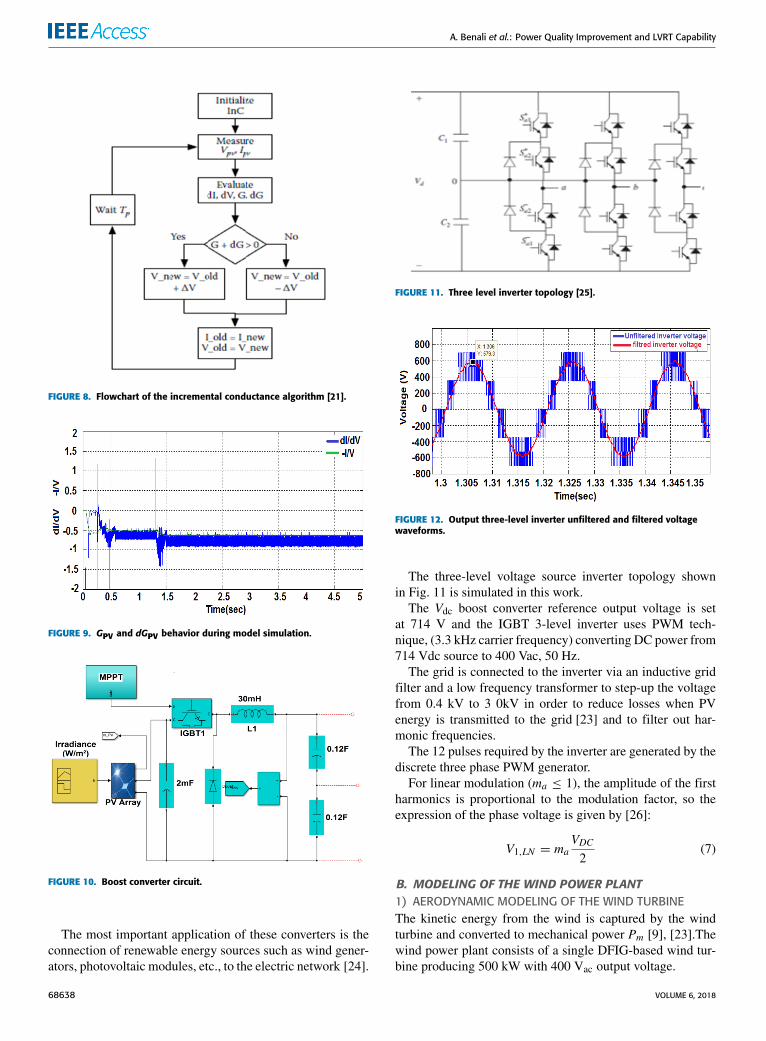
A flowchart describing the INC algorithm is shownin Fig. 8. The algorithm can track the MPP and remains thereuntil a change in dIPV or dVPV occurs due to a change inatmospheric conditions.
The behavior of G and dG is shown in Fig. 9.Fig. 10 shows the circuit model of the DC-DC boost con-
verter used in this work.The critical values of the inductor and capacitances of the
designed boost converter are: L1 = 30 mH, C = 100 µF,C1 = C2 = 120 mF.To ensure maximum power extraction from the PV source,
the converter interfacing the PV system to the grid must becapable of self-adjusting its own parameters in real-time.
VOLUME 6, 2018 68637
A. Benali et al.: Power Quality Improvement and LVRT Capability
FIGURE 8. Flowchart of the incremental conductance algorithm [21].
FIGURE 9. GPV and dGPV behavior during model simulation.
FIGURE 10. Boost converter circuit.
The most important application of these converters is theconnection of renewable energy sources such as wind gener-ators, photovoltaic modules, etc., to the electric network [24].
FIGURE 11. Three level inverter topology [25].
FIGURE 12. Output three-level inverter unfiltered and filtered voltagewaveforms.
The three-level voltage source inverter topology shownin Fig. 11 is simulated in this work.
The Vdc boost converter reference output voltage is setat 714 V and the IGBT 3-level inverter uses PWM tech-nique, (3.3 kHz carrier frequency) converting DC power from714 Vdc source to 400 Vac, 50 Hz.
The grid is connected to the inverter via an inductive gridfilter and a low frequency transformer to step-up the voltagefrom 0.4 kV to 3 0kV in order to reduce losses when PVenergy is transmitted to the grid [23] and to filter out har-monic frequencies.
The 12 pulses required by the inverter are generated by thediscrete three phase PWM generator.
For linear modulation (ma ≤ 1), the amplitude of the firstharmonics is proportional to the modulation factor, so theexpression of the phase voltage is given by [26]:
V1,LN = maVDC2
(7)
B. MODELING OF THE WIND POWER PLANT1) AERODYNAMIC MODELING OF THE WIND TURBINEThe kinetic energy from the wind is captured by the windturbine and converted to mechanical power Pm [9], [23].Thewind power plant consists of a single DFIG-based wind tur-bine producing 500 kW with 400 Vac output voltage.
68638 VOLUME 6, 2018
A. Benali et al.: Power Quality Improvement and LVRT Capability
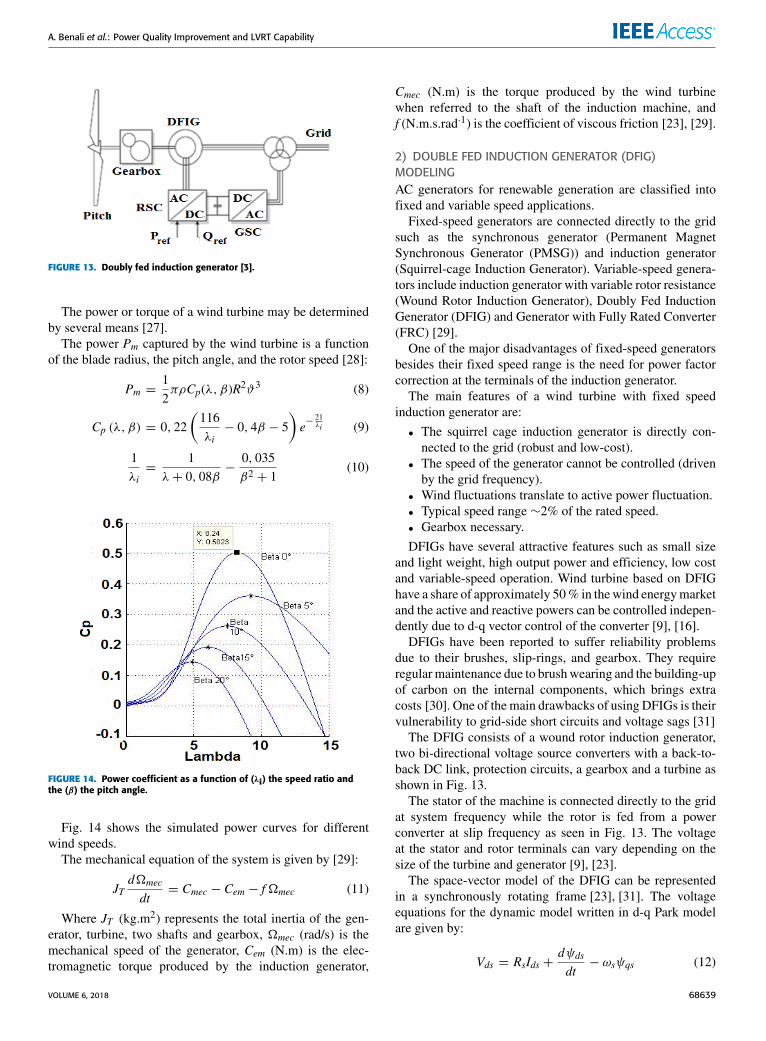
FIGURE 13. Doubly fed induction generator [3].
The power or torque of a wind turbine may be determinedby several means [27].
The power Pm captured by the wind turbine is a functionof the blade radius, the pitch angle, and the rotor speed [28]:
Pm =12πρCp(λ, β)R2ϑ3 (8)
Cp (λ, β) = 0, 22(116λi− 0, 4β − 5
)e−
21λi (9)
1λi=
1λ+ 0, 08β
−0, 035β2 + 1
(10)
FIGURE 14. Power coefficient as a function of (λi) the speed ratio andthe (β) the pitch angle.
Fig. 14 shows the simulated power curves for differentwind speeds.
The mechanical equation of the system is given by [29]:
JTd�mec
dt= Cmec − Cem − f�mec (11)
Where JT (kg.m2) represents the total inertia of the gen-erator, turbine, two shafts and gearbox, �mec (rad/s) is themechanical speed of the generator, Cem (N.m) is the elec-tromagnetic torque produced by the induction generator,
Cmec (N.m) is the torque produced by the wind turbinewhen referred to the shaft of the induction machine, andf (N.m.s.rad·1) is the coefficient of viscous friction [23], [29].
2) DOUBLE FED INDUCTION GENERATOR (DFIG)MODELINGAC generators for renewable generation are classified intofixed and variable speed applications.
Fixed-speed generators are connected directly to the gridsuch as the synchronous generator (Permanent MagnetSynchronous Generator (PMSG)) and induction generator(Squirrel-cage Induction Generator). Variable-speed genera-tors include induction generator with variable rotor resistance(Wound Rotor Induction Generator), Doubly Fed InductionGenerator (DFIG) and Generator with Fully Rated Converter(FRC) [29].
One of the major disadvantages of fixed-speed generatorsbesides their fixed speed range is the need for power factorcorrection at the terminals of the induction generator.
The main features of a wind turbine with fixed speedinduction generator are:
• The squirrel cage induction generator is directly con-nected to the grid (robust and low-cost).
• The speed of the generator cannot be controlled (drivenby the grid frequency).
• Wind fluctuations translate to active power fluctuation.• Typical speed range ∼2% of the rated speed.• Gearbox necessary.
DFIGs have several attractive features such as small sizeand light weight, high output power and efficiency, low costand variable-speed operation. Wind turbine based on DFIGhave a share of approximately 50% in thewind energymarketand the active and reactive powers can be controlled indepen-dently due to d-q vector control of the converter [9], [16].
DFIGs have been reported to suffer reliability problemsdue to their brushes, slip-rings, and gearbox. They requireregularmaintenance due to brushwearing and the building-upof carbon on the internal components, which brings extracosts [30]. One of the main drawbacks of using DFIGs is theirvulnerability to grid-side short circuits and voltage sags [31]
The DFIG consists of a wound rotor induction generator,two bi-directional voltage source converters with a back-to-back DC link, protection circuits, a gearbox and a turbine asshown in Fig. 13.
The stator of the machine is connected directly to the gridat system frequency while the rotor is fed from a powerconverter at slip frequency as seen in Fig. 13. The voltageat the stator and rotor terminals can vary depending on thesize of the turbine and generator [9], [23].
The space-vector model of the DFIG can be representedin a synchronously rotating frame [23], [31]. The voltageequations for the dynamic model written in d-q Park modelare given by:
Vds = RsIds +dψdsdt− ωsψqs (12)
VOLUME 6, 2018 68639
A. Benali et al.: Power Quality Improvement and LVRT Capability
Vqs = RsIqs +dψqsdt+ ωsψds (13)
The rotor equations:
Vdr = Rr Idr +dψdrdt− ωrψqr (14)
Vqr = Rr Iqr +dψqrdt+ ωrψdr (15)
The stator flux linkage equations are given by:
ψds = LsIds + LmIdr (16)
ψqs = LsIqs + LmIqr (17)
And the rotor flux linkages are:
ψdr = Lr Idr + LmIdr (18)
ψqr = Lr Iqr + LmIqr (19)
The stator active and reactive powers are expressedby [32]:
Ps =32
(VdsIds + VqsIqs
)(20)
Qs =32
(VqsIds − VdsIqs
)(21)
Where V , I , ψ , are the voltage, current and flux respec-tively. R and L denote the resistance and inductance respec-tively.
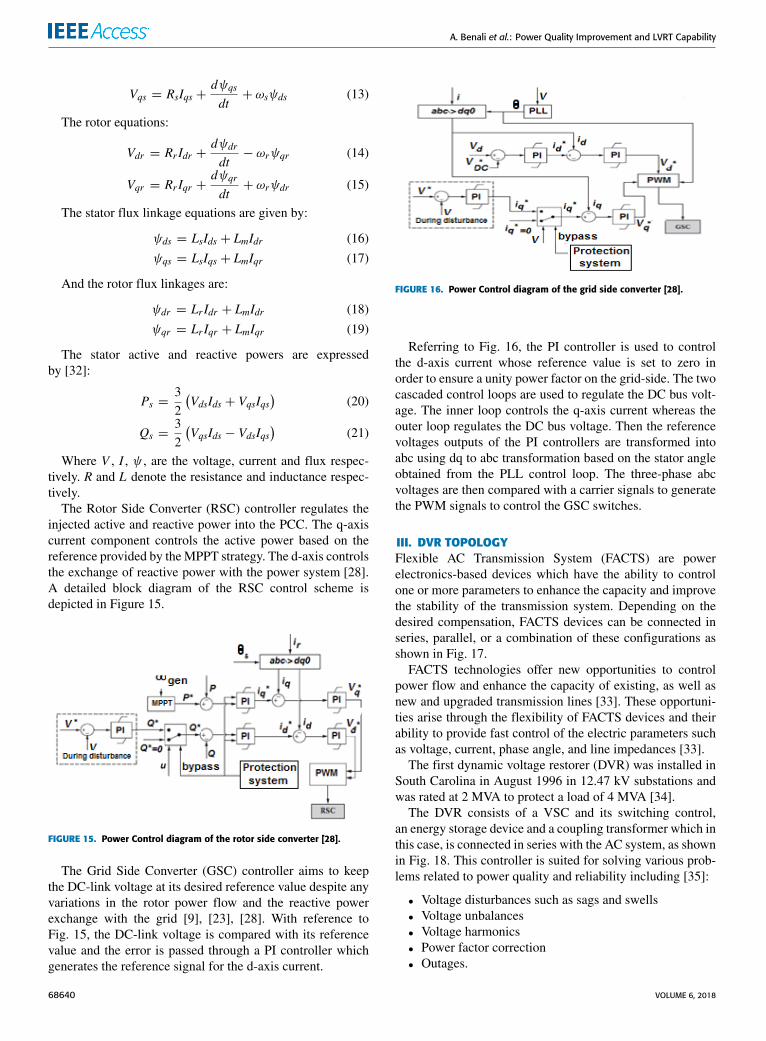
The Rotor Side Converter (RSC) controller regulates theinjected active and reactive power into the PCC. The q-axiscurrent component controls the active power based on thereference provided by theMPPT strategy. The d-axis controlsthe exchange of reactive power with the power system [28].A detailed block diagram of the RSC control scheme isdepicted in Figure 15.
FIGURE 15. Power Control diagram of the rotor side converter [28].
The Grid Side Converter (GSC) controller aims to keepthe DC-link voltage at its desired reference value despite anyvariations in the rotor power flow and the reactive powerexchange with the grid [9], [23], [28]. With reference toFig. 15, the DC-link voltage is compared with its referencevalue and the error is passed through a PI controller whichgenerates the reference signal for the d-axis current.
FIGURE 16. Power Control diagram of the grid side converter [28].
Referring to Fig. 16, the PI controller is used to controlthe d-axis current whose reference value is set to zero inorder to ensure a unity power factor on the grid-side. The twocascaded control loops are used to regulate the DC bus volt-age. The inner loop controls the q-axis current whereas theouter loop regulates the DC bus voltage. Then the referencevoltages outputs of the PI controllers are transformed intoabc using dq to abc transformation based on the stator angleobtained from the PLL control loop. The three-phase abcvoltages are then compared with a carrier signals to generatethe PWM signals to control the GSC switches.
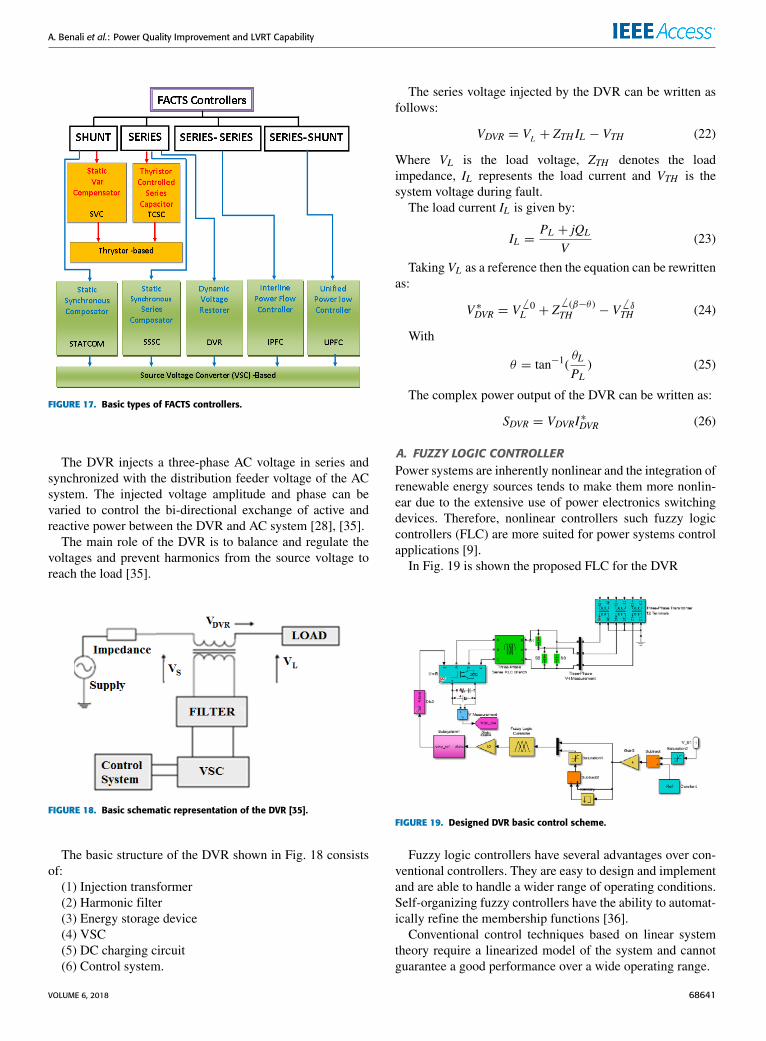
III. DVR TOPOLOGYFlexible AC Transmission System (FACTS) are powerelectronics-based devices which have the ability to controlone or more parameters to enhance the capacity and improvethe stability of the transmission system. Depending on thedesired compensation, FACTS devices can be connected inseries, parallel, or a combination of these configurations asshown in Fig. 17.
FACTS technologies offer new opportunities to controlpower flow and enhance the capacity of existing, as well asnew and upgraded transmission lines [33]. These opportuni-ties arise through the flexibility of FACTS devices and theirability to provide fast control of the electric parameters suchas voltage, current, phase angle, and line impedances [33].
The first dynamic voltage restorer (DVR) was installed inSouth Carolina in August 1996 in 12.47 kV substations andwas rated at 2 MVA to protect a load of 4 MVA [34].
The DVR consists of a VSC and its switching control,an energy storage device and a coupling transformer which inthis case, is connected in series with the AC system, as shownin Fig. 18. This controller is suited for solving various prob-lems related to power quality and reliability including [35]:
• Voltage disturbances such as sags and swells• Voltage unbalances• Voltage harmonics• Power factor correction• Outages.
68640 VOLUME 6, 2018
A. Benali et al.: Power Quality Improvement and LVRT Capability
FIGURE 17. Basic types of FACTS controllers.
The DVR injects a three-phase AC voltage in series andsynchronized with the distribution feeder voltage of the ACsystem. The injected voltage amplitude and phase can bevaried to control the bi-directional exchange of active andreactive power between the DVR and AC system [28], [35].
The main role of the DVR is to balance and regulate thevoltages and prevent harmonics from the source voltage toreach the load [35].
FIGURE 18. Basic schematic representation of the DVR [35].
The basic structure of the DVR shown in Fig. 18 consistsof:
(1) Injection transformer(2) Harmonic filter(3) Energy storage device(4) VSC(5) DC charging circuit(6) Control system.
The series voltage injected by the DVR can be written asfollows:
VDVR = VL + ZTH IL − VTH (22)
Where VL is the load voltage, ZTH denotes the loadimpedance, IL represents the load current and VTH is thesystem voltage during fault.
The load current IL is given by:
IL =PL + jQL
V(23)
Taking VL as a reference then the equation can be rewrittenas:
V ∗DVR = V6 0L + Z
6 (β−θ )TH − V
6 δTH (24)
With
θ = tan−1(θL
PL) (25)
The complex power output of the DVR can be written as:
SDVR = VDVRI∗DVR (26)
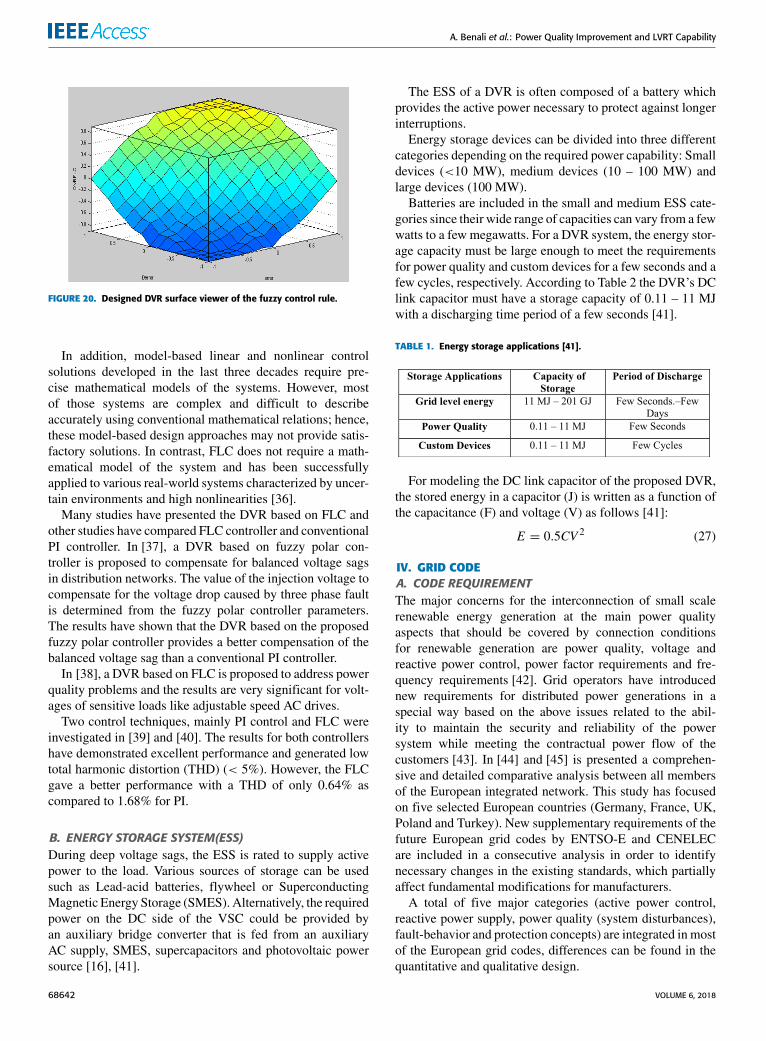
A. FUZZY LOGIC CONTROLLERPower systems are inherently nonlinear and the integration ofrenewable energy sources tends to make them more nonlin-ear due to the extensive use of power electronics switchingdevices. Therefore, nonlinear controllers such fuzzy logiccontrollers (FLC) are more suited for power systems controlapplications [9].
In Fig. 19 is shown the proposed FLC for the DVR
FIGURE 19. Designed DVR basic control scheme.
Fuzzy logic controllers have several advantages over con-ventional controllers. They are easy to design and implementand are able to handle a wider range of operating conditions.Self-organizing fuzzy controllers have the ability to automat-ically refine the membership functions [36].
Conventional control techniques based on linear systemtheory require a linearized model of the system and cannotguarantee a good performance over a wide operating range.
VOLUME 6, 2018 68641
A. Benali et al.: Power Quality Improvement and LVRT Capability
FIGURE 20. Designed DVR surface viewer of the fuzzy control rule.
In addition, model-based linear and nonlinear controlsolutions developed in the last three decades require pre-cise mathematical models of the systems. However, mostof those systems are complex and difficult to describeaccurately using conventional mathematical relations; hence,these model-based design approaches may not provide satis-factory solutions. In contrast, FLC does not require a math-ematical model of the system and has been successfullyapplied to various real-world systems characterized by uncer-tain environments and high nonlinearities [36].
Many studies have presented the DVR based on FLC andother studies have compared FLC controller and conventionalPI controller. In [37], a DVR based on fuzzy polar con-troller is proposed to compensate for balanced voltage sagsin distribution networks. The value of the injection voltage tocompensate for the voltage drop caused by three phase faultis determined from the fuzzy polar controller parameters.The results have shown that the DVR based on the proposedfuzzy polar controller provides a better compensation of thebalanced voltage sag than a conventional PI controller.
In [38], a DVR based on FLC is proposed to address powerquality problems and the results are very significant for volt-ages of sensitive loads like adjustable speed AC drives.
Two control techniques, mainly PI control and FLC wereinvestigated in [39] and [40]. The results for both controllershave demonstrated excellent performance and generated lowtotal harmonic distortion (THD) (< 5%). However, the FLCgave a better performance with a THD of only 0.64% ascompared to 1.68% for PI.
B. ENERGY STORAGE SYSTEM(ESS)During deep voltage sags, the ESS is rated to supply activepower to the load. Various sources of storage can be usedsuch as Lead-acid batteries, flywheel or SuperconductingMagnetic Energy Storage (SMES). Alternatively, the requiredpower on the DC side of the VSC could be provided byan auxiliary bridge converter that is fed from an auxiliaryAC supply, SMES, supercapacitors and photovoltaic powersource [16], [41].
The ESS of a DVR is often composed of a battery whichprovides the active power necessary to protect against longerinterruptions.
Energy storage devices can be divided into three differentcategories depending on the required power capability: Smalldevices (<10 MW), medium devices (10 – 100 MW) andlarge devices (100 MW).
Batteries are included in the small and medium ESS cate-gories since their wide range of capacities can vary from a fewwatts to a few megawatts. For a DVR system, the energy stor-age capacity must be large enough to meet the requirementsfor power quality and custom devices for a few seconds and afew cycles, respectively. According to Table 2 the DVR’s DClink capacitor must have a storage capacity of 0.11 – 11 MJwith a discharging time period of a few seconds [41].
TABLE 1. Energy storage applications [41].
For modeling the DC link capacitor of the proposed DVR,the stored energy in a capacitor (J) is written as a function ofthe capacitance (F) and voltage (V) as follows [41]:
E = 0.5CV 2 (27)
IV. GRID CODEA. CODE REQUIREMENTThe major concerns for the interconnection of small scalerenewable energy generation at the main power qualityaspects that should be covered by connection conditionsfor renewable generation are power quality, voltage andreactive power control, power factor requirements and fre-quency requirements [42]. Grid operators have introducednew requirements for distributed power generations in aspecial way based on the above issues related to the abil-ity to maintain the security and reliability of the powersystem while meeting the contractual power flow of thecustomers [43]. In [44] and [45] is presented a comprehen-sive and detailed comparative analysis between all membersof the European integrated network. This study has focusedon five selected European countries (Germany, France, UK,Poland and Turkey). New supplementary requirements of thefuture European grid codes by ENTSO-E and CENELECare included in a consecutive analysis in order to identifynecessary changes in the existing standards, which partiallyaffect fundamental modifications for manufacturers.
A total of five major categories (active power control,reactive power supply, power quality (system disturbances),fault-behavior and protection concepts) are integrated in mostof the European grid codes, differences can be found in thequantitative and qualitative design.
68642 VOLUME 6, 2018
A. Benali et al.: Power Quality Improvement and LVRT Capability
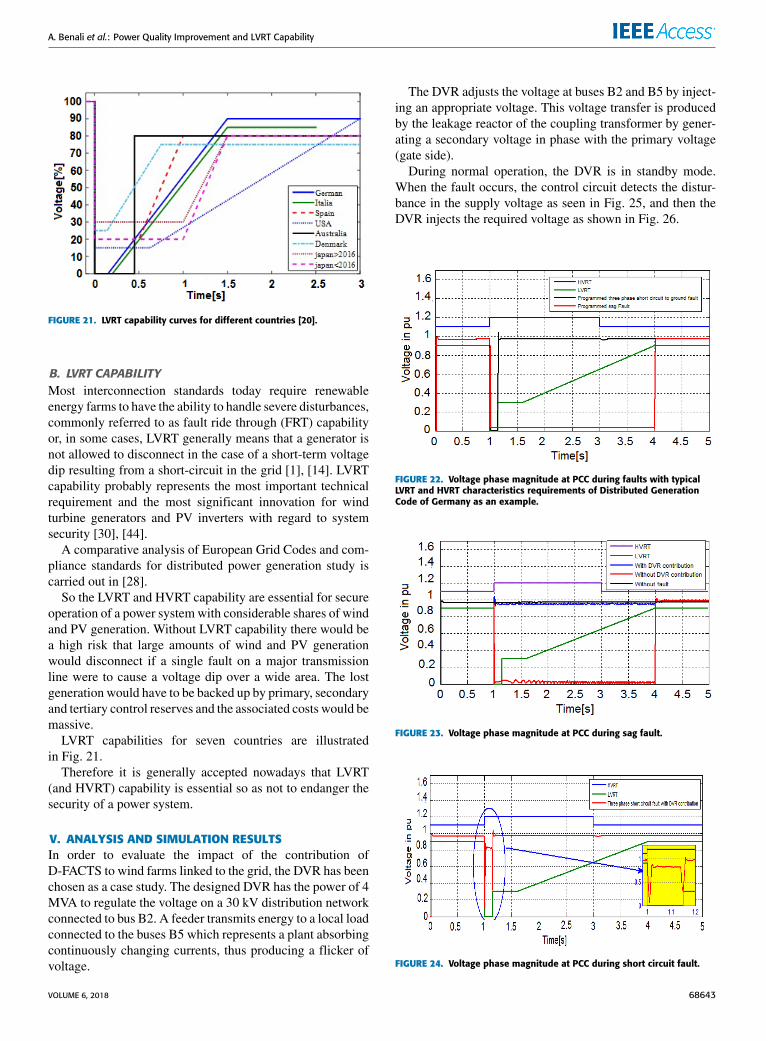
FIGURE 21. LVRT capability curves for different countries [20].
B. LVRT CAPABILITYMost interconnection standards today require renewableenergy farms to have the ability to handle severe disturbances,commonly referred to as fault ride through (FRT) capabilityor, in some cases, LVRT generally means that a generator isnot allowed to disconnect in the case of a short-term voltagedip resulting from a short-circuit in the grid [1], [14]. LVRTcapability probably represents the most important technicalrequirement and the most significant innovation for windturbine generators and PV inverters with regard to systemsecurity [30], [44].
A comparative analysis of European Grid Codes and com-pliance standards for distributed power generation study iscarried out in [28].
So the LVRT and HVRT capability are essential for secureoperation of a power systemwith considerable shares of windand PV generation. Without LVRT capability there would bea high risk that large amounts of wind and PV generationwould disconnect if a single fault on a major transmissionline were to cause a voltage dip over a wide area. The lostgeneration would have to be backed up by primary, secondaryand tertiary control reserves and the associated costs would bemassive.
LVRT capabilities for seven countries are illustratedin Fig. 21.
Therefore it is generally accepted nowadays that LVRT(and HVRT) capability is essential so as not to endanger thesecurity of a power system.
V. ANALYSIS AND SIMULATION RESULTSIn order to evaluate the impact of the contribution ofD-FACTS to wind farms linked to the grid, the DVR has beenchosen as a case study. The designed DVR has the power of 4MVA to regulate the voltage on a 30 kV distribution networkconnected to bus B2. A feeder transmits energy to a local loadconnected to the buses B5 which represents a plant absorbingcontinuously changing currents, thus producing a flicker ofvoltage.
The DVR adjusts the voltage at buses B2 and B5 by inject-ing an appropriate voltage. This voltage transfer is producedby the leakage reactor of the coupling transformer by gener-ating a secondary voltage in phase with the primary voltage(gate side).
During normal operation, the DVR is in standby mode.When the fault occurs, the control circuit detects the distur-bance in the supply voltage as seen in Fig. 25, and then theDVR injects the required voltage as shown in Fig. 26.
FIGURE 22. Voltage phase magnitude at PCC during faults with typicalLVRT and HVRT characteristics requirements of Distributed GenerationCode of Germany as an example.
FIGURE 23. Voltage phase magnitude at PCC during sag fault.
FIGURE 24. Voltage phase magnitude at PCC during short circuit fault.
VOLUME 6, 2018 68643
A. Benali et al.: Power Quality Improvement and LVRT Capability
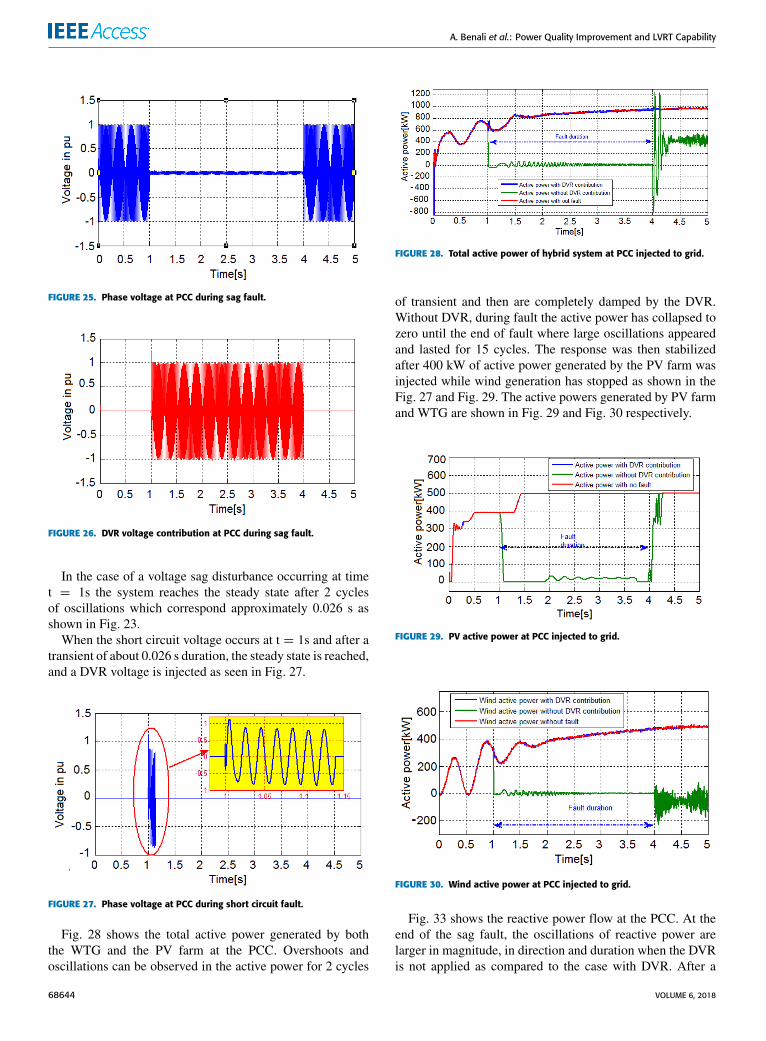
FIGURE 25. Phase voltage at PCC during sag fault.
FIGURE 26. DVR voltage contribution at PCC during sag fault.
In the case of a voltage sag disturbance occurring at timet = 1s the system reaches the steady state after 2 cyclesof oscillations which correspond approximately 0.026 s asshown in Fig. 23.
When the short circuit voltage occurs at t = 1s and after atransient of about 0.026 s duration, the steady state is reached,and a DVR voltage is injected as seen in Fig. 27.
FIGURE 27. Phase voltage at PCC during short circuit fault.
Fig. 28 shows the total active power generated by boththe WTG and the PV farm at the PCC. Overshoots andoscillations can be observed in the active power for 2 cycles
FIGURE 28. Total active power of hybrid system at PCC injected to grid.
of transient and then are completely damped by the DVR.Without DVR, during fault the active power has collapsed tozero until the end of fault where large oscillations appearedand lasted for 15 cycles. The response was then stabilizedafter 400 kW of active power generated by the PV farm wasinjected while wind generation has stopped as shown in theFig. 27 and Fig. 29. The active powers generated by PV farmand WTG are shown in Fig. 29 and Fig. 30 respectively.
FIGURE 29. PV active power at PCC injected to grid.
FIGURE 30. Wind active power at PCC injected to grid.
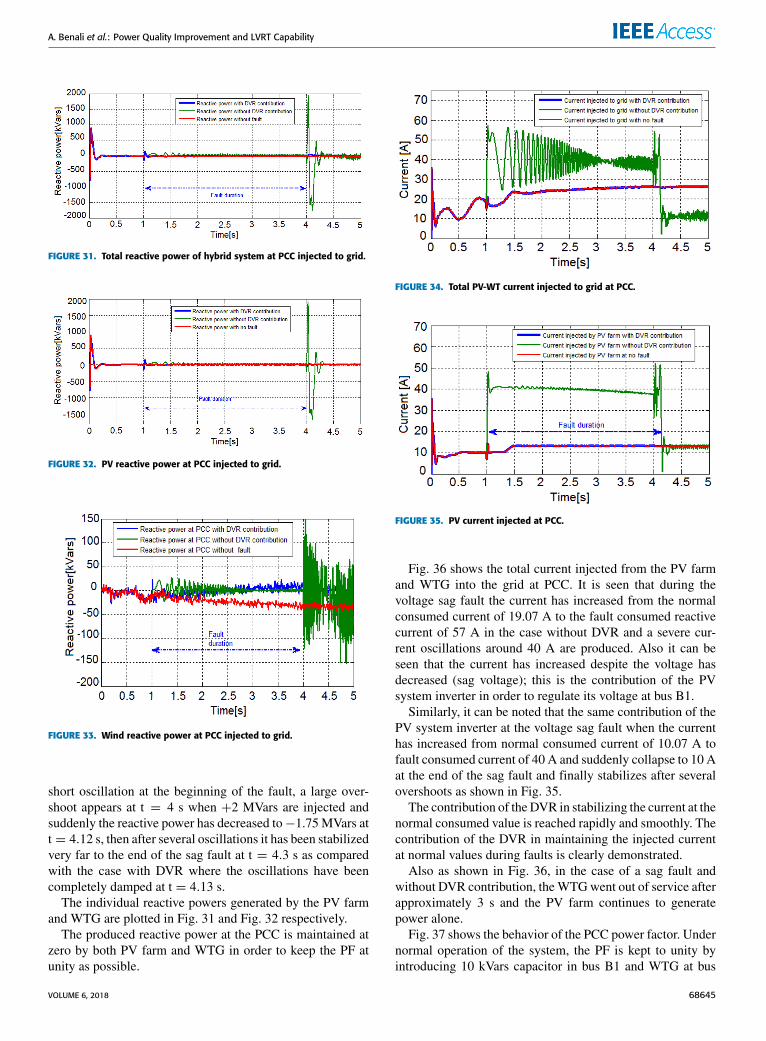
Fig. 33 shows the reactive power flow at the PCC. At theend of the sag fault, the oscillations of reactive power arelarger in magnitude, in direction and duration when the DVRis not applied as compared to the case with DVR. After a
68644 VOLUME 6, 2018
A. Benali et al.: Power Quality Improvement and LVRT Capability
FIGURE 31. Total reactive power of hybrid system at PCC injected to grid.
FIGURE 32. PV reactive power at PCC injected to grid.
FIGURE 33. Wind reactive power at PCC injected to grid.
short oscillation at the beginning of the fault, a large over-shoot appears at t = 4 s when +2 MVars are injected andsuddenly the reactive power has decreased to−1.75MVars att = 4.12 s, then after several oscillations it has been stabilizedvery far to the end of the sag fault at t = 4.3 s as comparedwith the case with DVR where the oscillations have beencompletely damped at t = 4.13 s.
The individual reactive powers generated by the PV farmand WTG are plotted in Fig. 31 and Fig. 32 respectively.
The produced reactive power at the PCC is maintained atzero by both PV farm and WTG in order to keep the PF atunity as possible.
FIGURE 34. Total PV-WT current injected to grid at PCC.
FIGURE 35. PV current injected at PCC.
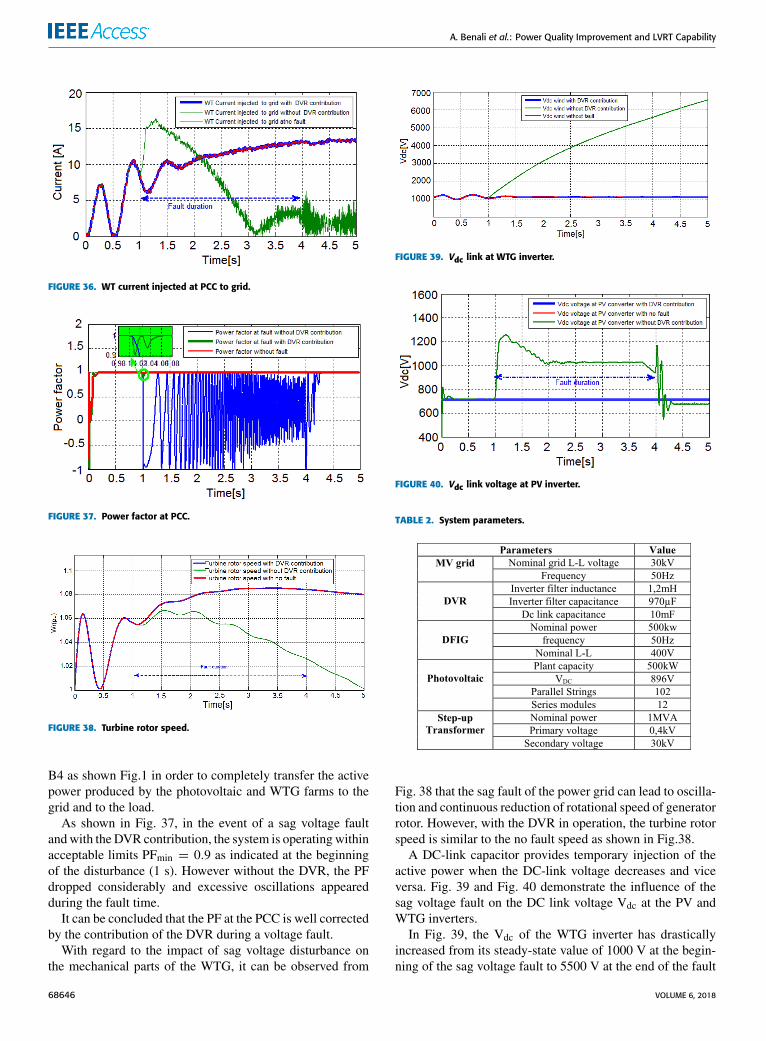
Fig. 36 shows the total current injected from the PV farmand WTG into the grid at PCC. It is seen that during thevoltage sag fault the current has increased from the normalconsumed current of 19.07 A to the fault consumed reactivecurrent of 57 A in the case without DVR and a severe cur-rent oscillations around 40 A are produced. Also it can beseen that the current has increased despite the voltage hasdecreased (sag voltage); this is the contribution of the PVsystem inverter in order to regulate its voltage at bus B1.
Similarly, it can be noted that the same contribution of thePV system inverter at the voltage sag fault when the currenthas increased from normal consumed current of 10.07 A tofault consumed current of 40 A and suddenly collapse to 10 Aat the end of the sag fault and finally stabilizes after severalovershoots as shown in Fig. 35.
The contribution of theDVR in stabilizing the current at thenormal consumed value is reached rapidly and smoothly. Thecontribution of the DVR in maintaining the injected currentat normal values during faults is clearly demonstrated.
Also as shown in Fig. 36, in the case of a sag fault andwithout DVR contribution, theWTGwent out of service afterapproximately 3 s and the PV farm continues to generatepower alone.
Fig. 37 shows the behavior of the PCC power factor. Undernormal operation of the system, the PF is kept to unity byintroducing 10 kVars capacitor in bus B1 and WTG at bus
VOLUME 6, 2018 68645
A. Benali et al.: Power Quality Improvement and LVRT Capability
FIGURE 36. WT current injected at PCC to grid.
FIGURE 37. Power factor at PCC.
FIGURE 38. Turbine rotor speed.
B4 as shown Fig.1 in order to completely transfer the activepower produced by the photovoltaic and WTG farms to thegrid and to the load.
As shown in Fig. 37, in the event of a sag voltage faultandwith the DVR contribution, the system is operatingwithinacceptable limits PFmin = 0.9 as indicated at the beginningof the disturbance (1 s). However without the DVR, the PFdropped considerably and excessive oscillations appearedduring the fault time.
It can be concluded that the PF at the PCC is well correctedby the contribution of the DVR during a voltage fault.
With regard to the impact of sag voltage disturbance onthe mechanical parts of the WTG, it can be observed from
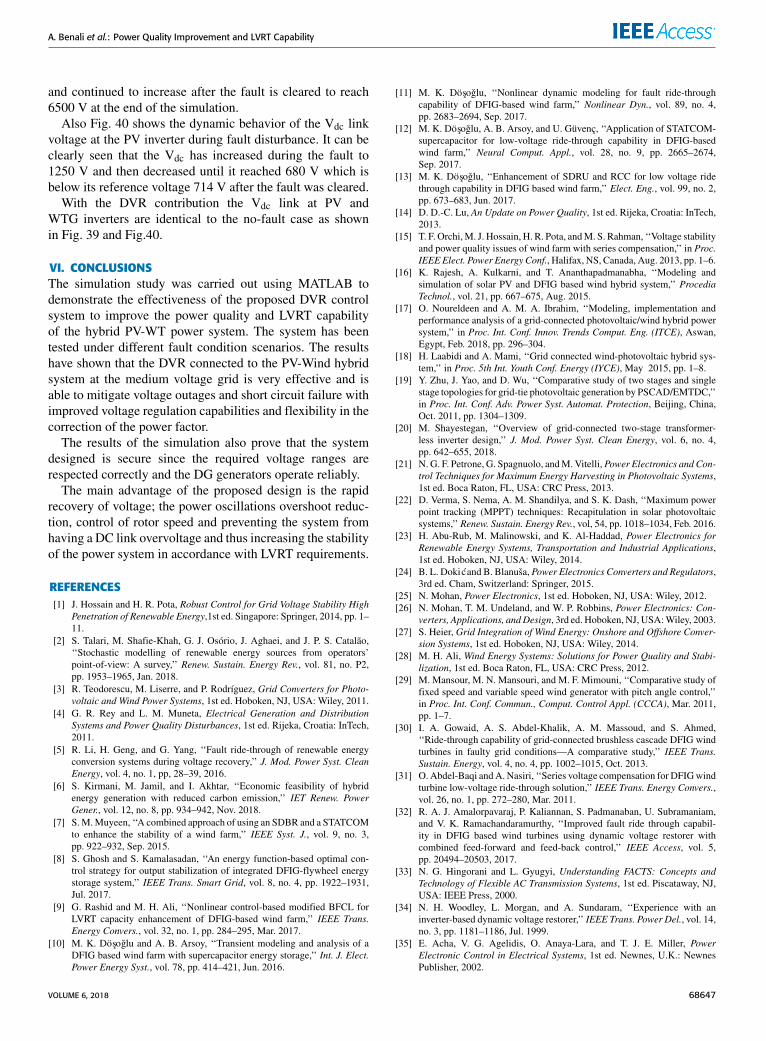
FIGURE 39. Vdc link at WTG inverter.
FIGURE 40. Vdc link voltage at PV inverter.
TABLE 2. System parameters.
Fig. 38 that the sag fault of the power grid can lead to oscilla-tion and continuous reduction of rotational speed of generatorrotor. However, with the DVR in operation, the turbine rotorspeed is similar to the no fault speed as shown in Fig.38.
A DC-link capacitor provides temporary injection of theactive power when the DC-link voltage decreases and viceversa. Fig. 39 and Fig. 40 demonstrate the influence of thesag voltage fault on the DC link voltage Vdc at the PV andWTG inverters.
In Fig. 39, the Vdc of the WTG inverter has drasticallyincreased from its steady-state value of 1000 V at the begin-ning of the sag voltage fault to 5500 V at the end of the fault
68646 VOLUME 6, 2018
A. Benali et al.: Power Quality Improvement and LVRT Capability
and continued to increase after the fault is cleared to reach6500 V at the end of the simulation.
Also Fig. 40 shows the dynamic behavior of the Vdc linkvoltage at the PV inverter during fault disturbance. It can beclearly seen that the Vdc has increased during the fault to1250 V and then decreased until it reached 680 V which isbelow its reference voltage 714 V after the fault was cleared.
With the DVR contribution the Vdc link at PV andWTG inverters are identical to the no-fault case as shownin Fig. 39 and Fig.40.
VI. CONCLUSIONSThe simulation study was carried out using MATLAB todemonstrate the effectiveness of the proposed DVR controlsystem to improve the power quality and LVRT capabilityof the hybrid PV-WT power system. The system has beentested under different fault condition scenarios. The resultshave shown that the DVR connected to the PV-Wind hybridsystem at the medium voltage grid is very effective and isable to mitigate voltage outages and short circuit failure withimproved voltage regulation capabilities and flexibility in thecorrection of the power factor.
The results of the simulation also prove that the systemdesigned is secure since the required voltage ranges arerespected correctly and the DG generators operate reliably.
The main advantage of the proposed design is the rapidrecovery of voltage; the power oscillations overshoot reduc-tion, control of rotor speed and preventing the system fromhaving a DC link overvoltage and thus increasing the stabilityof the power system in accordance with LVRT requirements.
REFERENCES[1] J. Hossain and H. R. Pota, Robust Control for Grid Voltage Stability High
Penetration of Renewable Energy,1st ed. Singapore: Springer, 2014, pp. 1–11.
[2] S. Talari, M. Shafie-Khah, G. J. Osório, J. Aghaei, and J. P. S. Catalão,‘‘Stochastic modelling of renewable energy sources from operators’point-of-view: A survey,’’ Renew. Sustain. Energy Rev., vol. 81, no. P2,pp. 1953–1965, Jan. 2018.
[3] R. Teodorescu, M. Liserre, and P. Rodríguez, Grid Converters for Photo-voltaic and Wind Power Systems, 1st ed. Hoboken, NJ, USA: Wiley, 2011.
[4] G. R. Rey and L. M. Muneta, Electrical Generation and DistributionSystems and Power Quality Disturbances, 1st ed. Rijeka, Croatia: InTech,2011.
[5] R. Li, H. Geng, and G. Yang, ‘‘Fault ride-through of renewable energyconversion systems during voltage recovery,’’ J. Mod. Power Syst. CleanEnergy, vol. 4, no. 1, pp, 28–39, 2016.
[6] S. Kirmani, M. Jamil, and I. Akhtar, ‘‘Economic feasibility of hybridenergy generation with reduced carbon emission,’’ IET Renew. PowerGener., vol. 12, no. 8, pp. 934–942, Nov. 2018.
[7] S.M.Muyeen, ‘‘A combined approach of using an SDBR and a STATCOMto enhance the stability of a wind farm,’’ IEEE Syst. J., vol. 9, no. 3,pp. 922–932, Sep. 2015.
[8] S. Ghosh and S. Kamalasadan, ‘‘An energy function-based optimal con-trol strategy for output stabilization of integrated DFIG-flywheel energystorage system,’’ IEEE Trans. Smart Grid, vol. 8, no. 4, pp. 1922–1931,Jul. 2017.
[9] G. Rashid and M. H. Ali, ‘‘Nonlinear control-based modified BFCL forLVRT capacity enhancement of DFIG-based wind farm,’’ IEEE Trans.Energy Convers., vol. 32, no. 1, pp. 284–295, Mar. 2017.
[10] M. K. Döşoğlu and A. B. Arsoy, ‘‘Transient modeling and analysis of aDFIG based wind farm with supercapacitor energy storage,’’ Int. J. Elect.Power Energy Syst., vol. 78, pp. 414–421, Jun. 2016.
[11] M. K. Döşoglu, ‘‘Nonlinear dynamic modeling for fault ride-throughcapability of DFIG-based wind farm,’’ Nonlinear Dyn., vol. 89, no. 4,pp. 2683–2694, Sep. 2017.
[12] M. K. Döşoglu, A. B. Arsoy, and U. Güvenç, ‘‘Application of STATCOM-supercapacitor for low-voltage ride-through capability in DFIG-basedwind farm,’’ Neural Comput. Appl., vol. 28, no. 9, pp. 2665–2674,Sep. 2017.
[13] M. K. Döşoglu, ‘‘Enhancement of SDRU and RCC for low voltage ridethrough capability in DFIG based wind farm,’’ Elect. Eng., vol. 99, no. 2,pp. 673–683, Jun. 2017.
[14] D. D.-C. Lu, An Update on Power Quality, 1st ed. Rijeka, Croatia: InTech,2013.
[15] T. F. Orchi,M. J. Hossain, H. R. Pota, andM. S. Rahman, ‘‘Voltage stabilityand power quality issues of wind farm with series compensation,’’ in Proc.IEEE Elect. Power Energy Conf., Halifax, NS, Canada, Aug. 2013, pp. 1–6.
[16] K. Rajesh, A. Kulkarni, and T. Ananthapadmanabha, ‘‘Modeling andsimulation of solar PV and DFIG based wind hybrid system,’’ ProcediaTechnol., vol. 21, pp. 667–675, Aug. 2015.
[17] O. Noureldeen and A. M. A. Ibrahim, ‘‘Modeling, implementation andperformance analysis of a grid-connected photovoltaic/wind hybrid powersystem,’’ in Proc. Int. Conf. Innov. Trends Comput. Eng. (ITCE), Aswan,Egypt, Feb. 2018, pp. 296–304.
[18] H. Laabidi and A. Mami, ‘‘Grid connected wind-photovoltaic hybrid sys-tem,’’ in Proc. 5th Int. Youth Conf. Energy (IYCE), May 2015, pp. 1–8.
[19] Y. Zhu, J. Yao, and D. Wu, ‘‘Comparative study of two stages and singlestage topologies for grid-tie photovoltaic generation by PSCAD/EMTDC,’’in Proc. Int. Conf. Adv. Power Syst. Automat. Protection, Beijing, China,Oct. 2011, pp. 1304–1309.
[20] M. Shayestegan, ‘‘Overview of grid-connected two-stage transformer-less inverter design,’’ J. Mod. Power Syst. Clean Energy, vol. 6, no. 4,pp. 642–655, 2018.
[21] N. G. F. Petrone, G. Spagnuolo, andM. Vitelli,Power Electronics and Con-trol Techniques for Maximum Energy Harvesting in Photovoltaic Systems,1st ed. Boca Raton, FL, USA: CRC Press, 2013.
[22] D. Verma, S. Nema, A. M. Shandilya, and S. K. Dash, ‘‘Maximum powerpoint tracking (MPPT) techniques: Recapitulation in solar photovoltaicsystems,’’ Renew. Sustain. Energy Rev., vol, 54, pp. 1018–1034, Feb. 2016.
[23] H. Abu-Rub, M. Malinowski, and K. Al-Haddad, Power Electronics forRenewable Energy Systems, Transportation and Industrial Applications,1st ed. Hoboken, NJ, USA: Wiley, 2014.
[24] B. L. Dokić and B. Blanuša, Power Electronics Converters and Regulators,3rd ed. Cham, Switzerland: Springer, 2015.
[25] N. Mohan, Power Electronics, 1st ed. Hoboken, NJ, USA: Wiley, 2012.[26] N. Mohan, T. M. Undeland, and W. P. Robbins, Power Electronics: Con-
verters, Applications, andDesign, 3rd ed. Hoboken, NJ, USA:Wiley, 2003.[27] S. Heier, Grid Integration of Wind Energy: Onshore and Offshore Conver-
sion Systems, 1st ed. Hoboken, NJ, USA: Wiley, 2014.[28] M. H. Ali, Wind Energy Systems: Solutions for Power Quality and Stabi-
lization, 1st ed. Boca Raton, FL, USA: CRC Press, 2012.[29] M. Mansour, M. N. Mansouri, and M. F. Mimouni, ‘‘Comparative study of
fixed speed and variable speed wind generator with pitch angle control,’’in Proc. Int. Conf. Commun., Comput. Control Appl. (CCCA), Mar. 2011,pp. 1–7.
[30] I. A. Gowaid, A. S. Abdel-Khalik, A. M. Massoud, and S. Ahmed,‘‘Ride-through capability of grid-connected brushless cascade DFIG windturbines in faulty grid conditions—A comparative study,’’ IEEE Trans.Sustain. Energy, vol. 4, no. 4, pp. 1002–1015, Oct. 2013.
[31] O. Abdel-Baqi andA. Nasiri, ‘‘Series voltage compensation for DFIGwindturbine low-voltage ride-through solution,’’ IEEE Trans. Energy Convers.,vol. 26, no. 1, pp. 272–280, Mar. 2011.
[32] R. A. J. Amalorpavaraj, P. Kaliannan, S. Padmanaban, U. Subramaniam,and V. K. Ramachandaramurthy, ‘‘Improved fault ride through capabil-ity in DFIG based wind turbines using dynamic voltage restorer withcombined feed-forward and feed-back control,’’ IEEE Access, vol. 5,pp. 20494–20503, 2017.
[33] N. G. Hingorani and L. Gyugyi, Understanding FACTS: Concepts andTechnology of Flexible AC Transmission Systems, 1st ed. Piscataway, NJ,USA: IEEE Press, 2000.
[34] N. H. Woodley, L. Morgan, and A. Sundaram, ‘‘Experience with aninverter-based dynamic voltage restorer,’’ IEEE Trans. Power Del., vol. 14,no. 3, pp. 1181–1186, Jul. 1999.
[35] E. Acha, V. G. Agelidis, O. Anaya-Lara, and T. J. E. Miller, PowerElectronic Control in Electrical Systems, 1st ed. Newnes, U.K.: NewnesPublisher, 2002.
VOLUME 6, 2018 68647
A. Benali et al.: Power Quality Improvement and LVRT Capability
[36] A. I. Al-Odienat and A. A. Al-Lawama, ‘‘The advantages of PID fuzzycontrollers over the conventional types,’’ Amer. J. Appl. Sci., vol. 5, no. 6,pp. 653–658, 2008.
[37] P. Margo, M. P. Heri, M. Ashari, and T. Hiyama, ‘‘Balanced voltage sagcorrection using dynamic voltage restorer based fuzzy polar controller,’’in Proc. 2nd Int. Conf. Innov. Comput., Inf. Control (ICICIC), Kumamoto,Japan, Jan. 2007, p. 93.
[38] S. P. Singh, A. H. Bhat, andA. Kumar, ‘‘Fuzzy logic based dynamic voltagerestorer for addressing various power quality problems,’’ in Proc. IEEE 7thPower India Int. Conf. (PIICON), Bikaner, India, Nov. 2016, pp. 1–5.
[39] R. H. Salimin and M. S. A. Rahim, ‘‘Simulation analysis of DVR perfor-mance for Voltage sag mitigation,’’ in Proc. 5th Int. Power Eng. Optim.Conf., Selangor, Malaysia, Jun. 2011, pp. 261–266.
[40] R. Rajeswari, N. Karpagam, and S. Dhanalakshmi, ‘‘Analysis of dq0 basedfuzzy logic controller in DVR for voltage sag and harmonic mitigation,’’in Proc. Int. Conf. Green Comput. Commun. Elect. Eng. (ICGCCEE),Mar. 2014, pp. 1–6.
[41] H. P. Tiwari and S. K.Gupta, ‘‘DC energy storage schemes forDVRvoltagesag mitigation system,’’ Int. J. Comput. Theory Eng., vol. 2, no. 3, p. 313,Jun. 2010.
[42] J. Hossain and A. Mahmud, Large Scale Renewable Power Generation, 1sted. Singapore: Springer, 2014.
[43] F. Shahnia, S. Rajakaruna, and A. Ghosh, Static Compensators(STATCOMs) in Power Systems, 1st ed. Singapore: Springer,2015.
[44] F. Kalverkamp, B. Schowe-von der Brelie, T.-D. Nguyen, T. Mertens, andM.Meuser, ‘‘Comparative analysis of European grid codes and compliancestandards for distributed power generation plants with respect to futurerequirements of ENTSO-E and CENELEC,’’ in Proc. Int. ETG Congr., DieEnergiewende-Blueprints New Energy Age, Nov. 2015, pp. 1–6.
[45] A. Q. Al-Shetwi, M. Z. Sujod, and N. L. Ramli, ‘‘A review of the fault ridethrough requirements in different grid codes concerning penetration of PVsystem to the electric power network,’’ ARPN J. Eng. Appl. Sci., vol. 10,no. 21, pp. 9906–9912, 2015.
ABDELKRIM BENALI received the M.A. degreein electrotechnics from the Polytechnic NationalSchool of Oran, Algeria. He is currently aProfessor with the Department of ElectricalEngineering, NOUR Bachir university Center,El Bayadh, Algeria. He is a member of theSCAMRE Laboratory, ENP. His research activi-ties include FACTS devices, renewable energy anddistributed energy resourcesmodeling and concep-tion, and renewable energy grid integration.
MOUNIR KHIAT received the Ph.D. degree inelectrotechnics from the University of USTO,Oran. He is currently a Professor with theDepartment of Electrical Engineering, Polytech-nic National School of Oran, Algeria. He is amember of the SCAMRE Laboratory, ENPO. Hisresearch activities include the control of large elec-tric power systems, multi machine, multi convertersystems, FACTS devices, HVDC systems, renew-able energy and distributed energy resources, mod-
eling and conception, real-time simulation of power systems, smart grids,neural process control, and real-time simulation of power systems.
TAYEB ALLAOUI received the bachelor’s (Engi-neering) degree in electrical engineering from theIbn Khaldoun University of Tiaret in 1996 andthe master’s degree from the University of Scienceand Technology of Oran in 2002. He is a mem-ber of the Energetic Engineering and ComputerEngineering Laboratory, Ibn Khaldoun University.His research interests include intelligent controlof power systems and FACTS, active filter, andrenewable energies.
MOULOUD DENAÏ graduated from the Univer-sity of Science and Technology of Algiers andthe École Nationale Polythechnique of Algiers,Algeria, in electrical engineering, and received thePh.D. degree in control engineering from The Uni-versity of Sheffield, U.K. He was with the Univer-sity of Science and Technology of Oran, Algeria,until 2004. From 2004 to 2010, he was with TheUniversity of Sheffield. From 2010 to 2014, hewaswith the University of Teesside, U.K. Since 2014,
he has been with the University of Hertfordshire, U.K. His main fields ofexpertise are in modeling, optimization, and control of engineering and lifescience (biological and biomedical) systems. His current research interestsin energy include intelligent control design and computational intelligenceapplications to efficiency optimization in renewable energy systems withparticular focus in the management of smart homes and dynamic schedul-ing, optimization and control of future smart grids, condition monitoringand asset management in electric power networks; energy storage systemsintegration into the grid; smart meter data analytics using machine learningtechniques for efficient energymanagement; electric vehicles integration intothe distribution grid; and V2G/G2V management.
68648 VOLUME 6, 2018
Copyright © 2022 FDOKUMEN