Power Distribution for an Am/Cm Bushing Melter
32
WSRC-MS-96-0590 Power Distribution for an Am/Cm Bushing Melter by C. Gong Westinghouse Savannah River Company Savannah River Site Aiken, South Carolina 29808 B. J, Hardy ttff mON OF THfS DOCUMENT IS UNLIMITED A document prepared for 1997 ASME PRESSURE VESSEL AND PIPING CONFERENCE at Orlando, FL, USA from 7/27/97 - 7/31/97. DOE Contract No. DE-AC09-89SR18035& DE-AC09-96SR18500 This paper was prepared in connection with work done under the above contract numberwith the U. S. Department of Energy. By acceptance of this paper, the publisher and/or recipient acknowledges the U. S. Government's right to retain a nonexclusive, royalty-free license in and to any copyright covering this paper, along with the right to reproduce and to authorize others to reproduce all or part of the copyrighted paper.
-
Upload
khangminh22 -
Category
Documents
-
view
4 -
download
0
Transcript of Power Distribution for an Am/Cm Bushing Melter
WSRC-MS-96-0590
Power Distribution for an Am/Cm Bushing Melter
by
C. Gong
Westinghouse Savannah River CompanySavannah River SiteAiken, South Carolina 29808
B. J, Hardy
ttffmON OF THfS DOCUMENT IS UNLIMITED
A document prepared for 1997 ASME PRESSURE VESSEL AND PIPING CONFERENCE at Orlando, FL, USAfrom 7/27/97 - 7/31/97.
DOE Contract No. DE-AC09-89SR18035& DE-AC09-96SR18500
This paper was prepared in connection with work done under the above contract numberwith the U. S.Department of Energy. By acceptance of this paper, the publisher and/or recipient acknowledges the U. S.Government's right to retain a nonexclusive, royalty-free license in and to any copyright covering this paper,along with the right to reproduce and to authorize others to reproduce all or part of the copyrighted paper.
DISCLAIMER
Portions of this document may be illegiblein electronic image products. Images areproduced from the best available originaldocument*
DISCLAIMER
This report was prepared as an account of work sponsored by an agency of the United StatesGovernment. Neither the United States Government nor any agency thereof, nor any of theiremployees, makes any warranty, express or implied, or assumes any legal liability orresponsibility for the accuracy, completeness, or usefulness of any information, apparatus,product, or process disclosed, or represents that its use would not infringe privately owned rights.Reference herein to any specific commercial product, process, or service by trade name,trademark, manufacturer, or otherwise does not necessarily constitute or imply its endorsement,recommendation, or favoring by the United States Government or any agency thereof. Theviews and opinions of authors expressed herein do not necessarily state or reflect those of theUnited States Government or any agency thereof.
This report has been reproduced directly from the best available copy.
Available to DOE and DOE contractors from the Office of Scientific and Technical Information,P.O. Box 62, Oak Ridge, TN 37831; prices available from (615) 576-8401.
Available to the public from the National Technical Information Service, U.S. Department ofCommerce,. 5285 Port Royal Road, Springfield, VA 22161.
POWER DISTRIBUTION FOR ANAM/CM BUSHING MELTER
Chung GongSavannah River Technology Center
Westinghouse Savannah River Company773-42A, Room 154
Aiken, South Carolina 29808
Telephone: (803) 725-3167Fax: (803) 725-8829
e-mail: [email protected]
Bruce J. HardySavannah River Technology CenterWestinghouse Savannah River Company704-1T, Room 232Aiken, South Carolina 29808
Telephone: (803) 557-7113Fax: (803) 557-7008e-mail: [email protected]
Decades of nuclear material production at the Savannah River Site (SRS)
has resulted in the generation of large quantities of the isotopes A m r " and
Cmr . Currently, the Am and Cm isotopes are stored as a nitric acidsolution in a tank. The Am and Cm isotopes have great commercial valuebut must be transferred to the Oak Ridge National Laboratory (ORNL) forprocessing. The nitric acid solution contains other isotopes and is intenselyradioactive, which makes storage a problem and precludes shipment in theliquid form. In order to stabilize the material for onsite storage and to permittransport the material from SRS to ORNL, it has been proposed that the Amand Cm be separated from other isotopes in the solution and vitrified.
Vitrification will be effected by depositing a liquid feed stream containingthe isotopes in solution, together with a stream of glass frit, onto the top of amolten glass pool in a melter. The glass is non-conducting and the melter isa Platinum/Rhodium alloy vessel which is heated by passing an electriccurrent through it. Because most of the power is required to evaporate theliquid feed at the top of the glass pool, power demands differ for the upperand lower parts of the melter. In addition, the melter is batch fed so that thelocal power requirements vary with time. In order to design a unique splitpower supply, which ensures adequate local power delivery, an analysis ofthe melter power distribution was performed with the ABAQUS finiteelement code. ABAQUS was used to calculate the electric potential andcurrent density distributions in the melter for a variety of current andpotential boundary conditions. The results of the calculation were comparedwith test data and will be used to compute power densities for input to acomputational fluid dynamics model for the melter.
Page 1
POWER DISTRIBUTION FOR AN AM/CM BUSHING MELTER
Chung Gong
Savannah River Technology Center
Westinghouse Savannah River Company
773-42A, Room 154
Aiken, South Carolina 29808
Bruce J. Hardy
Savannah River Technology Center
Westinghouse Savannah River Company
704-IT, Room 232
Aiken, South Carolina 29808
1. INTRODUCTIONDecades of nuclear material production at the Savannah River Site (SRS) has resulted in the
generation of kilogram quantities of the isotopes Am243 and Cm244. Currently, the Am and
Cm isotopes are stored in a tank as a nitric acid solution. The solution contains other
isotopes and is intensely radioactive, which makes long term storage a problem and
precludes shipment in the liquid form. The Am and Cm isotopes are not merely waste
material, the isotopes have great commercial value but must be transferred to the Oak Ridge
National Laboratory (ORNL) for processing. In order to stabilize the material for onsite
storage and to transport the material from SRS to ORNL, it has been proposed that the Am
and Cm be separated from the majority of the other isotopes in the solution and vitrified.
Vitrification will be effected by depositing a liquid feed stream containing the isotopes in
solution, together with a stream of glass frit, onto the top of a molten glass pool in a melter.
The glass is non-conducting and the melter is a rectangular vessel composed of
platinum/rhodium alloy and which is resistively heated. The majority of the evaporation of
water in the liquid feed occurs in the frit bed formed on the surface of the glass pool. The
wetted frit bed is called a "cold cap". Because most of the power is required to evaporate
the liquid, power demands differ for the upper and lower parts of the melter. In addition,
the melter is batch fed so that the power requirements at the top and bottom of the melter
vary with time. To vary the fraction of the total power delivered to the upper and lower
parts of the melter, pairs of upper and lower electrodes were placed on the melter and
connected to variable power supplies.
In order to ensure that the electrode configuration could effectively vary power between the
top and bottom of the melter, and to identify regions of high power density, an analysis of
the melter power distribution was performed with the ABAQUS® finite element code.
AB AQUS was used to calculate the electric potential and current density distributions in the
Page 2
melter for a variety of current and potential boundary conditions. The results of the
calculation were compared with test data and were used to compute power densities for
input to a computational fluid dynamics model for the melter.
During melter heat-up, thermal expansion may cause permanent deformation. Further, the
melter will operate at temperatures near 1400°C. At these temperatures the melter is entirely
in the regime of plastic deformation and the structural integrity and stability of the melter
was questioned. The stress and strain in the melter during heat-up and at the operating
temperature was estimated from a model based on the AB AQUS code .
This report documents the power distribution and stress calculations performed for Melters
2A and 2B which are to be used in the Am/Cm vitrification program.
2. BACKGROUNDThe design of Melters 2 A and 2B, is based on operating experience with Melter 1.
Melter 1 was a rectangular box with a bottom which sloped toward a central drain tube.
Melter 1 was approximately 11 in. tall, 10 in. wide and 2.5 in. deep. The top of the melter
had a 2.5 in. by 10 in. rectangular opening. One pair of electrodes was attached on
opposite sides of the melter.
Initially, it was believed that Melter 1 could be run as a continuous process. However,
operating experience dictated that it was necessary to run in batch mode. During tests with
Melter 1, it soon became obvious that the operation of the melter must be divided into three
phases; feeding, heating and a pouring. In the feeding phase, inventory is accumulated by
depositing nitric acid solution and glass frit on the surface of the glass pool. The majority
of the power is used to evaporate the nitric acid solution. Therefore, most of the power
must be applied to the top of the melter during the feeding phase . After sufficient
inventory is accumulated in the melter, the heating phase begins. In this phase the feed is
stopped and the remaining liquid evaporates from the cold cap. The remaining layer of
dried frit and crust is heated until it is melted into the glass pool, which is heated until an
equilibrium state is reached within the melter. It is believed that the melter may be allowed
to idle indefinitely at this state without adversely affecting the product or system. During
the heating phase it is believed that it will be necessary to shift power toward the bottom of
the melter. After equilibrium has been reached in the heating phase, the glass is ready to
pour. This is the pouring phase. Glass pour is initiated by melting the solid glass in the
Page 3
drain tube with the drain tube heater. It is believed that the power distribution during the
pouring phase will need to be uniform or shifted slightly toward the bottom of the melter.
In the Melter 1 tests it was found that radiative losses from the top were sufficiently high
that the glass in this region was not completely melted when the plenum was in place.
Because of this behavior, Melters 2A and 2B were designed with a partially covered top to
direct thermal radiation onto the cold cap rather than allowing it to escape into the plenum.
In addition, two pairs of electrodes were attached to Melters 2A and 2B and connected to
variable power supplies. The pairs of electrodes are attached to the narrow sides of the
melters at the top and bottom, see Figures 1-1 and 1-2. This electrode geometry allows the
power to be varied between the top and bottom of the melter as needed for the particular
phase of operation.
Excessive thermally induced strain was also a problem with Melter 1. Melter 1 was
encased in cast refractory with no allowance for thermal expansion. Further, both the top
and bottom of Melter 1 were rigidly fixed, allowing for no vertical expansion. When the
melter was heated it expanded against the refractory material, which had a substantially
lower coefficient of thermal expansion. In addition, the melter expanded against the rigid
top and bottom members. The walls of Melter 1 experienced substantial buckling and a tear
was observed. It must be noted however, that the tear may have occurred during attempts
to force glassy deposits into the glass pool by pushing against them with a mullite rod. In
order to allow for vertical thermal expansion in Melters 2A and 2B, the bottom of the melter
was supported on springs. Lateral expansion against the refractory material was
accommodated by using fiberfrax (ceramic papers) as a spacer.
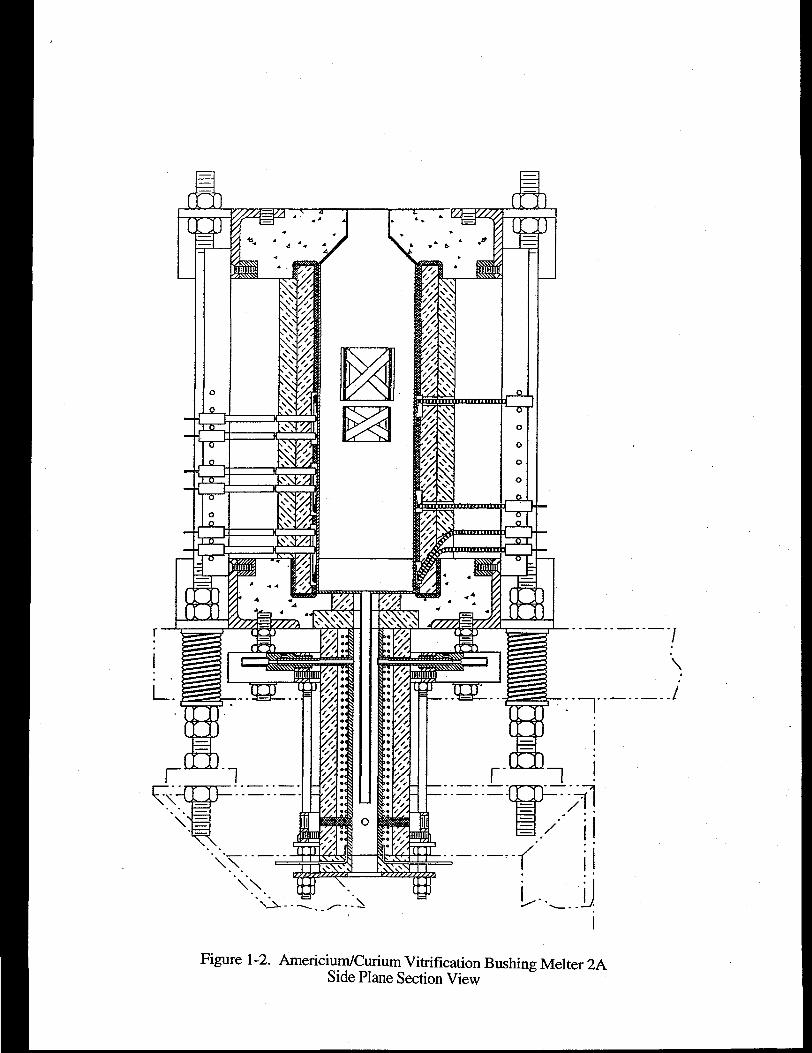
3. MELTER GEOMETRY
Melters 2A and 2B are flat, tall rectangular boxes made of platinum-rhodium alloys and
were fabricated by GAFtech, Inc. of Nashville, TN. Because differences in the melter
configurations are insignificant with regards to power and stress distributions, only one
melter model was used for both Melters 2A and 2B . The height of both melters is 11
inches, the width is 10 inches and the depth is 2.75 inches, see Figures 1-1 and 1-2.
There are two pairs of flat electrodes, referred to as "ears", on the narrow sides of the
melter. One pair of ears primarily delivers power to the upper part of the melter while the
other pair of ears primarily supplies power to the bottom. Inside the melter there are two
Page 4
pairs of vertical screens welded to the narrow side walls with the longitudinal axis of the
screens traversing the width of the melter. In order to relieve thermal buckling stresses,
each of the screens has a cusp like bend at approximately one inch from each end.
Additionally, two cross braces (in the form of an X) are attached between the two top
screens at a distance of three inches from ends. The middle screens are also cross braced.
A flange plate is attached at the top of the melter. The melter is constructed with 0.06
inches thick platinum-rhodium alloys plates except the top flange (including the drain wall)
which are made of 0.03 inch thick plates. The ears are 0.188 inches thick.
4. NUMERICAL METHODS4.1. Method of AnalysisThe finite element method was used to numerically model the electrical and mechanical
behavior of Melters 2A and 2B. The mesh was generated with the pre-processor,
MSC/PATRAN and the analysis was performed with the ABAQUS code. The
ABAQUS POST post-processor was used to facilitate the post-processing of the results.
4.2. Description of the Pre- and Post-processor
MSC/PATRAN [MSC/PATRAN, 1996] is a versatile geometric and graphic modeling
code developed by PDA Engineering which was acquired by the MacNeal-Schwendler
Corporation. The MSC/PATRAN system's ability to interface with a large array of
applications is provided by the PATRAN Neutral File, the PATRAN Results File, and the
Application Interface. Post-processing of the results was accomplished using ABAQUS
POST.
4.3. Main Processor
ABAQUS® [ABAQUS, 1995], is a general purpose finite element analysis program with
special emphasis on advanced linear and nonlinear structural engineering, heat transfer as
well as coupled thermal-electrical applications. Hibbitt, Karlsson & Sorensen, Inc. (HKS)
developed and support this computer code. The ABAQUS version presently in use at SRS
(5.5-IN) is marketed by HKS as a "Nuclear QA Grade" code that complies with the
NQA-1 quality assurance standard. Details of the Quality Assurance controls for the
ABAQUS code may be found in the Technical and QA Plan for ABAQUS.
4.4. Finite Element Modeling
Page 5
Melters 2A and 2B possess symmetry with respect to two orthogonal planes. In the case of
symmetrically applied loads arising from a uniform temperature distribution, a quarter
model cut out along the symmetry planes of the melter was sufficient for the analysis.
However, in the analysis of the power distribution, the electrical currents flow from the
ears on one side of the melter to those on the other side. The current density distribution
then reduces the problem to reflective symmetry about the plane through the long cross-
section of the melter which contains the four ears.
For the power distribution analysis, ABAQUS requires solid continuum elements in the
model. This model will also be used for thermal stress analysis. The melter is constructed
with thin plates.
The thinnest plate in the melter is only 0.03 inches thick. In order to maintain a
mathematically tolerable aspect ratio, the other dimensions of the elements were less than
0.12 inches (for double elements in the thickness of the plate) so that the aspect ratio was
kept below 8. Attempts to maintain a low aspect ratio in the model resulted in an excessive
increase in the number of elements. However, through several trial runs, a workable finite
element model was developed The average aspect ratio of the elements in the melter was
7.35. Whereas in the top flange, the aspect ratios were higher than 8, and the maximum
aspect ratio reached 32. At the normal intersections of the melter plates and screens the
elements became smaller. In these dense regions the aspect ratios of the elements were on
the order of 56. The total number of solid continuum elements in this model was 12,568
with 20,428 nodes (total number of variables is 40,856).
There were twelve circular holes on each of the top screens. Two sets of double cross-bars
were installed to connect each pair of the top and middle screens. The cusps on both ends
of each of the screens were also modeled.
The melter was meshed with 3-D solid continuum elements DC3D8E (8-node linear brick)
in the coupled thermal-electrical analysis with ABAQUS. In a small transition region
where the geometry precludes the use of DC3D8E, twelve DC3D6E (6-node linear
triangular prism) elements were implemented.
5. MATERIAL PROPERTIES
Page 6
Melters 2A and 2B are to be manufactured with platinum-rhodium alloys. Two
compositions have been chosen as the primary materials for the melter: 90% platinum 10%
rhodium alloy and 80% platinum 20% rhodium alloy.
There is a paucity of material data for platinum-rhodium alloys at the operating temperatures
for the melter. The temperature dependent properties of platinum-rhodium alloys are not
readily available from usual material handbooks. Material properties of the platinum-
rhodium alloys in this study were mostly obtained from two sources, viz., a reference book
[Vines, 1941] published by the International Nickel Company and scattered pieces of
information obtained from Dr. Louis Toth of Engelhard-Clal [Toth, 1996], who assisted us
with our literature search. Many of the high temperature physical properties of the
platinum-rhodium alloys were selectively chosen from conflicting data or extrapolated from
the limited data available. All the material properties data obtained are converted into the SI
system, which constitutes the system of units for this analysis.
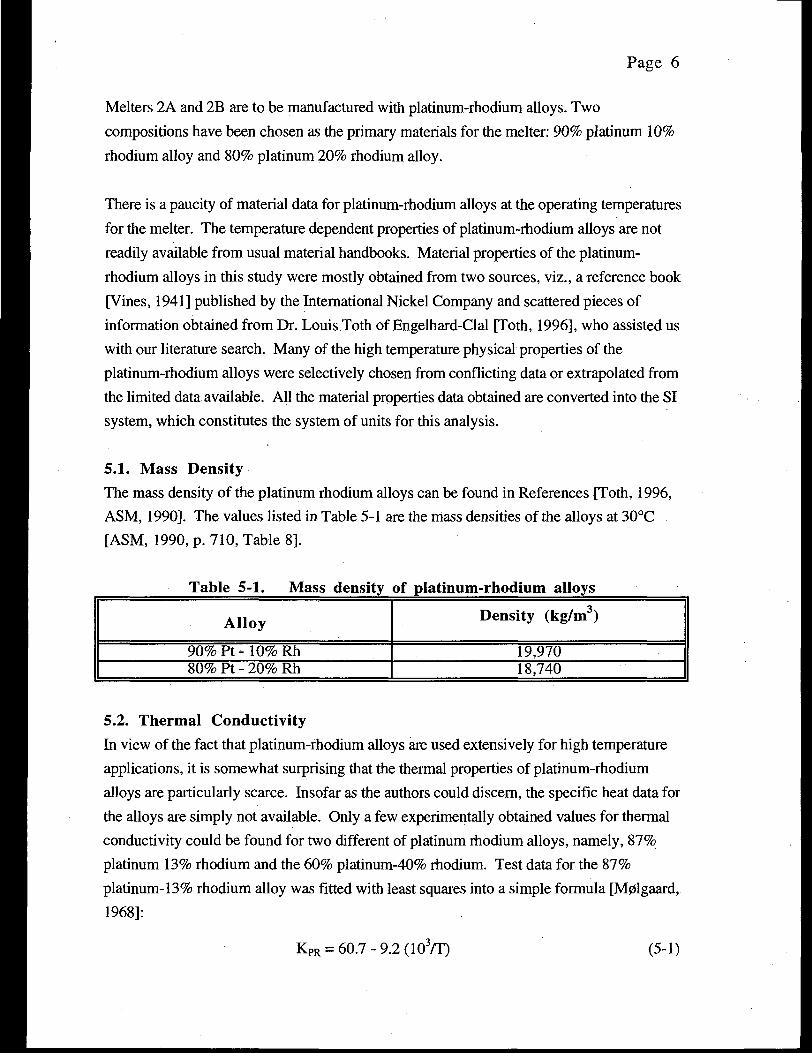
5.1. Mass Density
The mass density of the platinum rhodium alloys can be found in References [Toth, 1996,
ASM, 1990]. The values listed in Table 5-1 are the mass densities of the alloys at 30°C
[ASM, 1990, p. 710, Table 8].
Table 5-1. Mass density of platinum-rhodium alloys
Alloy
90% Pt - 10% Rh1 80% Pt - 20% Rh
Density (kg/m3)
19,97018,740
5.2. Thermal Conductivity
In view of the fact that platinum-rhodium alloys are used extensively for high temperature
applications, it is somewhat surprising that the thermal properties of platinum-rhodium
alloys are particularly scarce. Insofar as the authors could discern, the specific heat data for
the alloys are simply not available. Only a few experimentally obtained values for thermal
conductivity could be found for two different of platinum rhodium alloys, namely, 87%
platinum 13% rhodium and the 60% platinum-40% rhodium. Test data for the 87%
platinum-13% rhodium alloy was fitted with least squares into a simple formula [M0lgaard,
1968]:
KPR = 60.7 - 9.2 (107T) (5-D
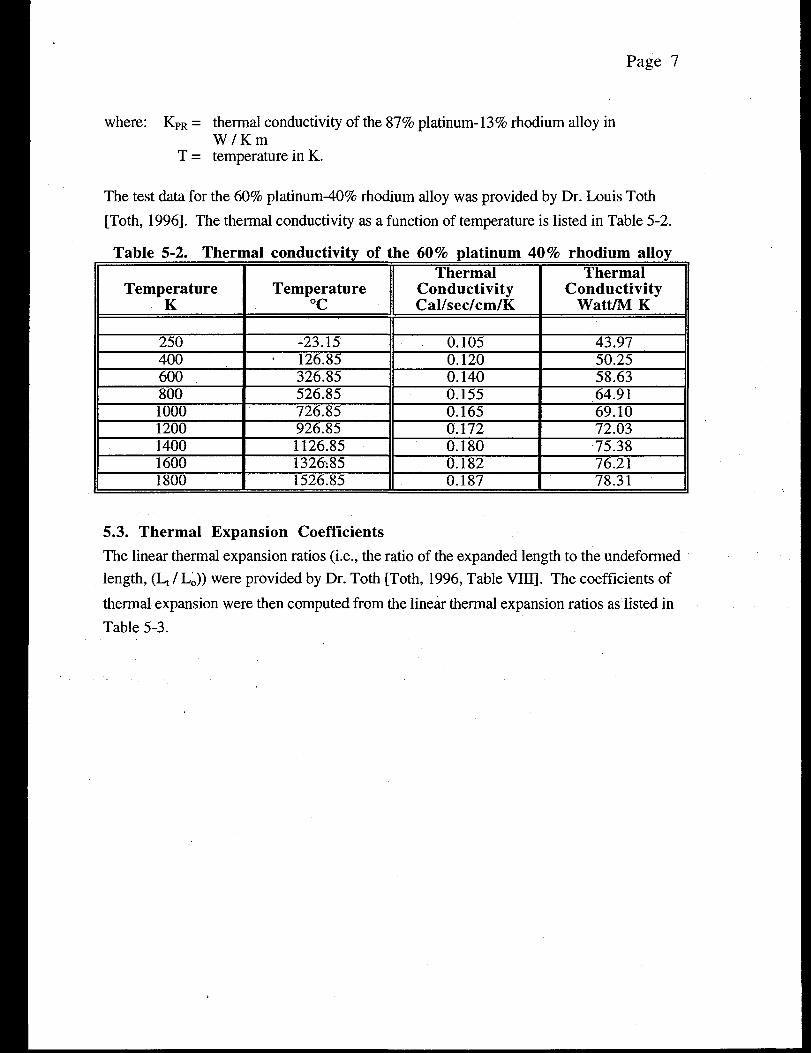
Page 7
where: KPR = thermal conductivity of the 87% platinum-13% rhodium alloy inW / K m
T = temperature in K.
The test data for the 60% platinum-40% rhodium alloy was provided by Dr. Louis Toth
[Toth, 1996]. The thermal conductivity as a function of temperature is listed in Table 5-2.
Table 5-2. Thermal conductivity of the 60% platinum 40% rhodium alloy
TemperatureK
25040060080010001200140016001800
Temperature°C
-23.15• 126.85
326.85526.85726.85926.851126.851326:851526.85
ThermalConductivityCal/sec/cm/K
0.1050.1200.1400.1550.1650.1720.1800.1820.187
ThermalConductivity
Watt/MK
43.9750.2558.6364.9169.1072.0375.3876.2178.31
5.3. Thermal Expansion Coefficients
The linear thermal expansion ratios (i.e., the ratio of the expanded length to the undeformed
length, (Lj / Lo)) were provided by Dr. Toth [Toth, 1996, Table VIII]. The coefficients of
thermal expansion were then computed from the linear thermal expansion ratios as listed in
Table 5-3.
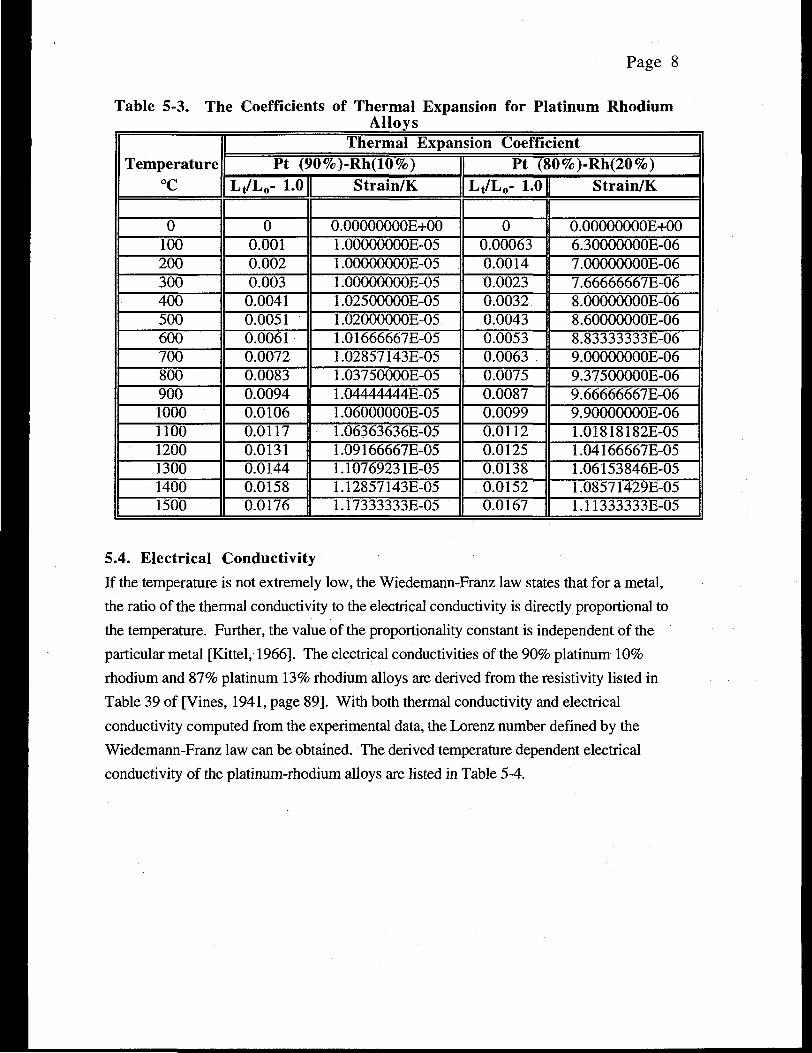
Table 5-3.
Page 8
The Coefficients of Thermal Expansion for Platinum RhodiumAlloys
Temperature
°C j
0100200300400500600700800900100011001200130014001500
I Thermal Expansion CoefficientPt (90%)-Rh(10%)
Lt/L0- 1.0
00.0010.0020.0030.00410.00510.00610.00720.00830.00940.01060.01170.01310.01440.01580.0176
Strain/K
0.00000000E+001.00000000E-051.00000000E-051.00000000E-051.02500000E-051.02000000E-051.01666667E-051.02857143E-051.O37500O0E-O51.04444444E-051.06000000E-051.06363636E-051.09166667E-051.10769231E-051.12857143E-051.17333333E-05
Pt (80%)-Rh(20%)Lt/L0- 1.0
00.000630.00140.00230.00320.00430.00530.00630.00750.00870.00990.01120.01250.01380.01520.0167
Strain/K
0.00000000E+006.30000000E-067.00000000E-067.66666667E-068.OOOOOOOOE-O68.60000000E-068.83333333E-069.00000000E-069.37500000E-069.66666667E-069.900O0000E-061.01818182E-051.04166667E-051.06153846E-051.08571429E-051.11333333E-05
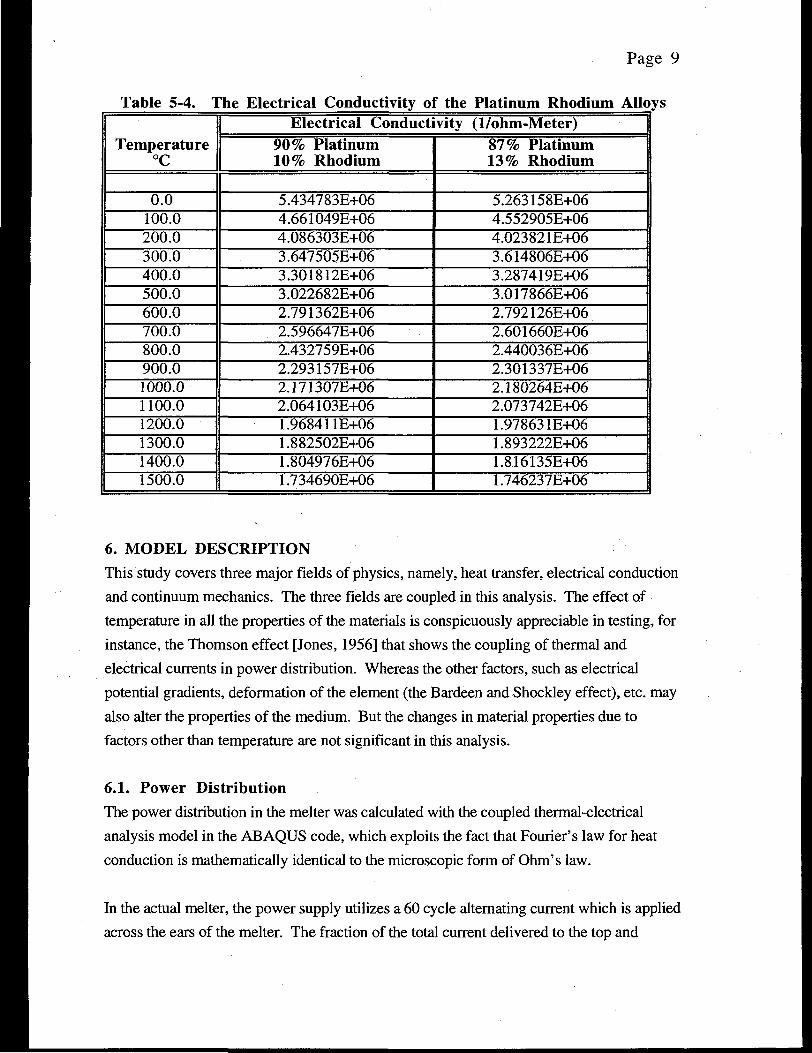
5.4. Electrical ConductivityIf the temperature is not extremely low, the Wiedemann-Franz law states that for a metal,
the ratio of the thermal conductivity to the electrical conductivity is directly proportional to
the temperature. Further, the value of the proportionality constant is independent of the
particular metal [Kittel, 1966]. The electrical conductivities of the 90% platinum 10%
rhodium and 87% platinum 13% rhodium alloys are derived from the resistivity listed in
Table 39 of [Vines, 1941, page 89]. With both thermal conductivity and electrical
conductivity computed from the experimental data, the Lorenz number defined by the
Wiedemann-Franz law can be obtained. The derived temperature dependent electrical
conductivity of the platinum-rhodium alloys are listed in Table 5-4.
Page 9
Table 5-4. The Electrical Conductivity of the Platinum Rhodium Alloys
Temperature°C
0.0100.0200.0300.0400.0500.0600.0700.0800.0900.01000.01100.01200.01300.01400.01500.0
Electrical Conductivity (i/ohm-Meter)90% Platinum10% Rhodium
5.434783E+064.661049E+064.086303E+063.647505E+063.301812E+063.022682E+062.791362E+062.596647E+062.432759E+062.293157E+062.171307E+062.064103E+061.968411E+061.882502E+061.804976E+061.734690E+06
87% Platinum13% Rhodium
5.263158E+064.552905E+064.023821E+063.614806E+063.287419E+063.017866E+062.792126E+062.601660E+062.440036E+062.301337E+062.180264E+062.073742E+061.978631E+061.893222E+061.816135E+061.746237E+06
6. MODEL DESCRIPTION
This study covers three major fields of physics, namely, heat transfer, electrical conduction
and continuum mechanics. The three fields are coupled in this analysis. The effect of
temperature in all the properties of the materials is conspicuously appreciable in testing, for
instance, the Thomson effect [Jones, 1956] that shows the coupling of thermal and
electrical currents in power distribution. Whereas the other factors, such as electrical
potential gradients, deformation of the element (the Bardeen and Shockley effect), etc. may
also alter the properties of the medium. But the changes in material properties due to
factors other than temperature are not significant in this analysis.
6.1. Power Distribution
The power distribution in the melter was calculated with the coupled thermal-electrical
analysis model in the ABAQUS code, which exploits the fact that Fourier's law for heat
conduction is mathematically identical to the microscopic form of Ohm's law.
In the actual melter, the power supply utilizes a 60 cycle alternating current which is applied
across the ears of the melter. The fraction of the total current delivered to the top and
Page 10
bottom ears is based on the power demands during the particular phase of melter operation.
Resistance heating occurs as the current flows through the platinum-rhodium alloy
comprising the body of the melter. Because the ABAQUS code can only provide
calculations for direct current, the numerical model of the power distribution describes a
DC power source operating at the RMS power of the actual AC power supply. At the
frequency of the actual AC power supply, it is believed that the DC model will provide an
accurate estimate of the actual AC power distribution.
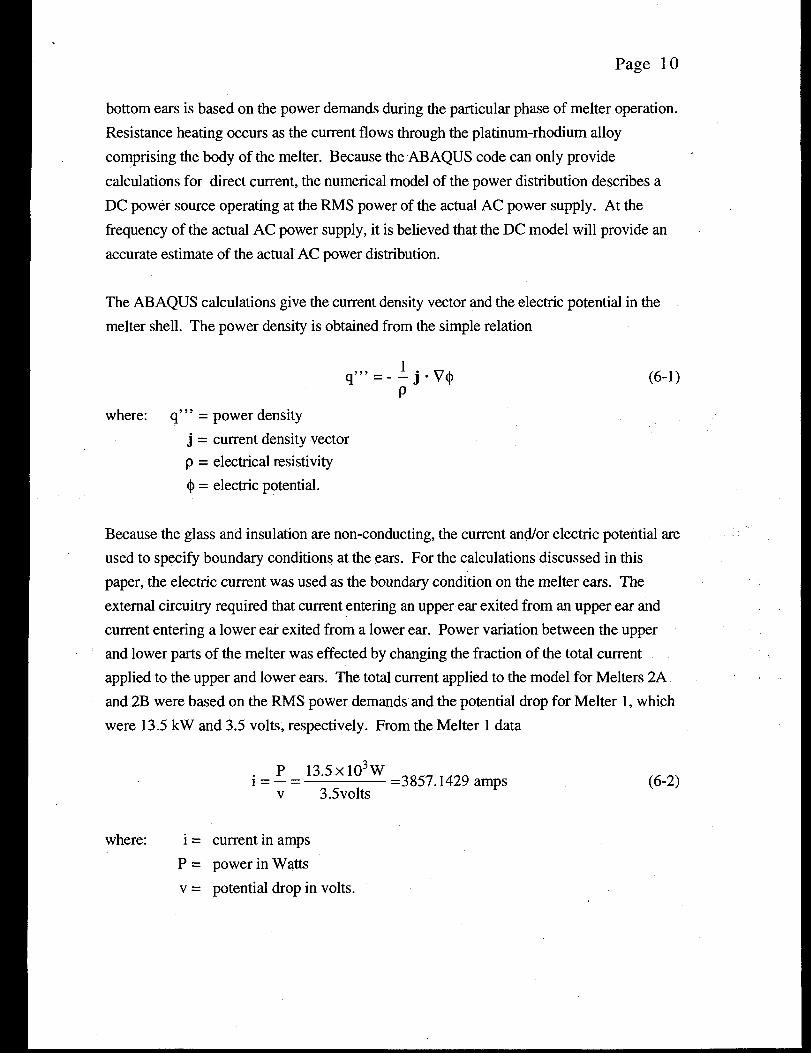
The AB AQUS calculations give the current density vector and the electric potential in the
melter shell. The power density is obtained from the simple relation
q"' = _ 1 j . V4»P
(6-1)
where: q"' = power density
j = current density vector
p = electrical resistivity
§ = electric potential.
Because the glass and insulation are non-conducting, the current and/or electric potential are
used to specify boundary conditions at the ears. For the calculations discussed in this
paper, the electric current was used as the boundary condition on the melter ears. The
external circuitry required that current entering an upper ear exited from an upper ear and
current entering a lower ear exited from a lower ear. Power variation between the upper
and lower parts of the melter was effected by changing the fraction of the total current
applied to the upper and lower ears. The total current applied to the model for Melters 2A
and 2B were based on the RMS power demands and the potential drop for Melter 1, which
were 13.5 kW and 3.5 volts, respectively. From the Melter 1 data
P 13i = - = l±
v 3.5volts
WW= 3 8 57.1429 amps (6-2)
where: i = current in amps
P = power in Watts
v = potential drop in volts.
Page 11
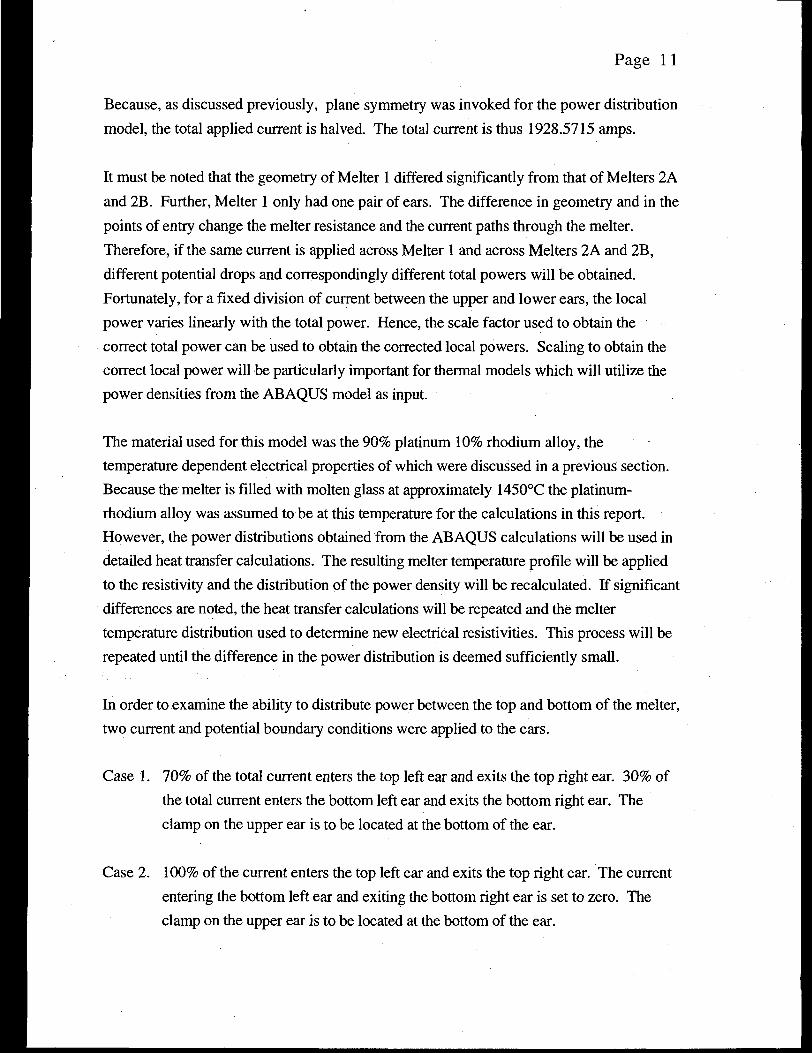
Because, as discussed previously, plane symmetry was invoked for the power distribution
model, the total applied current is halved. The total current is thus 1928.5715 amps.
It must be noted that the geometry of Melter 1 differed significantly from that of Melters 2A
and 2B. Further, Melter 1 only had one pair of ears. The difference in geometry and in the
points of entry change the melter resistance and the current paths through the melter.
Therefore, if the same current is applied across Melter 1 and across Melters 2A and 2B,
different potential drops and correspondingly different total powers will be obtained.
Fortunately, for a fixed division of current between the upper and lower ears, the local
power varies linearly with the total power. Hence, the scale factor used to obtain the
correct total power can be used to obtain the corrected local powers. Scaling to obtain the
correct local power will be particularly important for thermal models which will utilize the
power densities from the AB AQUS model as input.
The material used for this model was the 90% platinum 10% rhodium alloy, the
temperature dependent electrical properties of which were discussed in a previous section.
Because the melter is filled with molten glass at approximately 1450°C the platinum-
rhodium alloy was assumed to be at this temperature for the calculations in this report.
However, the power distributions obtained from the AB AQUS calculations will be used in
detailed heat transfer calculations. The resulting melter temperature profile will be applied
to the resistivity and the distribution of the power density will be recalculated. If significant
differences are noted, the heat transfer calculations will be repeated and the melter
temperature distribution used to determine new electrical resistivities. This process will be
repeated until the difference in the power distribution is deemed sufficiently small.
In order to examine the ability to distribute power between the top and bottom of the melter,
two current and potential boundary conditions were applied to the ears.
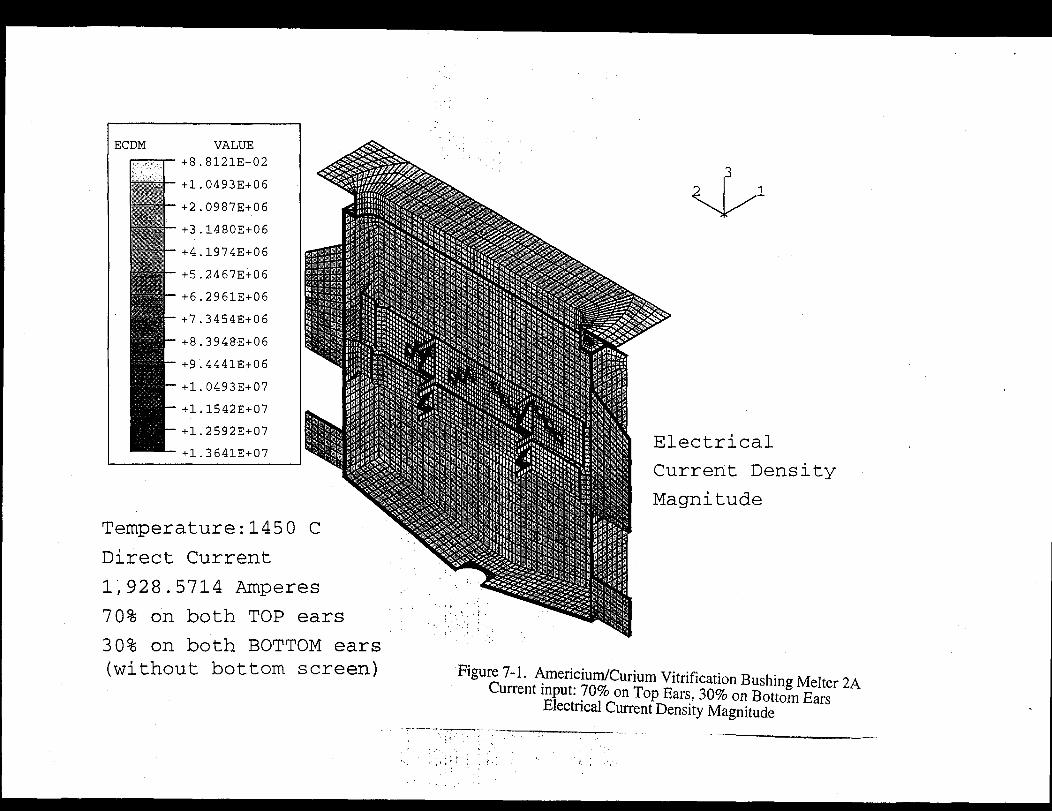
Case 1. 70% of the total current enters the top left ear and exits the top right ear. 30% of
the total current enters the bottom left ear and exits the bottom right ear. The
clamp on the upper ear is to be located at the bottom of the ear.
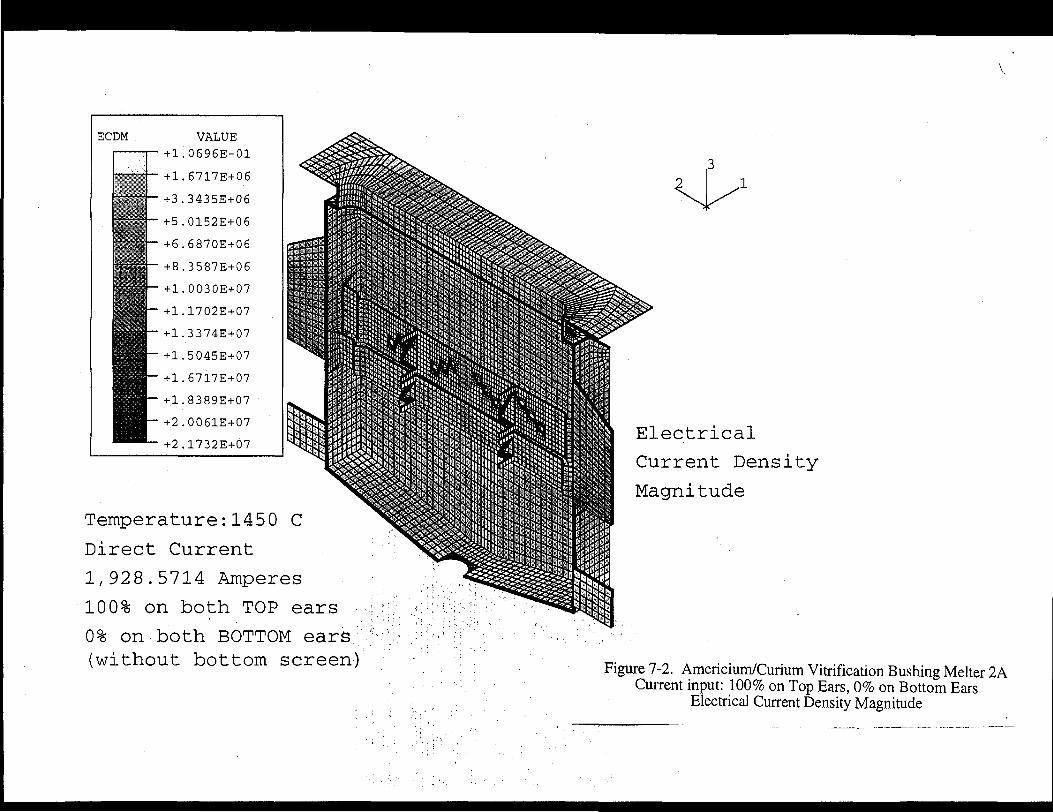
Case 2. 100% of the current enters the top left ear and exits the top right ear. The current
entering the bottom left ear and exiting the bottom right ear is set to zero. The
clamp on the upper ear is to be located at the bottom of the ear.
Page 12
The current in the lower ears is to be controlled by a saturable core reactor. If the reactor
were to lose power, the only resistance to current flow in the external circuit for the lower
ears would be the loop impedance. The loop impedance is much lower than that across the
melter. Therefore, if all the current were sent to the upper ears and the reactor in the lower
circuit lost power, the path of least resistance would be from the top ear to the adjacent
bottom ear through the lower current loop into the bottom ear on the opposite side of the
melter and out through the top ear of the melter. The transmission of the total current
through the melter body between the top and bottom ears might result in excessive heating
and burn through. The power density for this accident scenario was calculated by
considering another case.
Case 3. 100% of the total current enters the top left ear. The bottom ears were connected
by loop of low resistance.
7. RESULTS AND CONCLUSIONS
7.1. Power Distribution Analysis
The current density and potential distributions for Cases 1 and 2 are shown in Figures
7-1 ~ 7-4 and the power distribution, calculated from Eq. 6-2 is shown in Figures 7-5 ~ 7-
8. The magnitude of current density heaves around the ears of current incidence and exit,
in both cases considered. The current density magnitude is significantly high at the
junctions of the screens and the narrow side walls. The maximum and minimum values of
the current density magnitudes in Case 1 and 2 may show an order of magnitude apart,
however, overall the current density magnitude is about 4.0E+06 amps per square meter in
the melter. Further the contours show that the electrical potential (Figure 7-3 and 7-4) and
the current density vector (Figures 7-9 and 7-10) are symmetrical about the midplane of the
melter. The electrical potential distribution (Figure 7-3) in the case of 70-30% current split
is almost parallel to the vertical edges of the melter. It connotes that with the 70-30%
current split, the electrical power distribution in the melter is also uniform in the vertical
direction.
In the whole melter plots (Figure 7-5 and 7-6), the detail of electrical power density
distribution is not perceptible. The distributions of the electrical energy dissipated in the
power ears are different in the two cases. The energy dissipated in Case 1 (with 70% of
current on the top ears and 30% on the bottom ears) is slightly lower than that in the second
Page 13
case (with 100% of current on the top ears and no current on the bottom ears). The energy
density distribution in the large side plate alone (in Figures 7-7 and 7-8) provides better
resolution. The distribution of the dissipated energy in the first case (Figure 7-7) is
essentially uniform and the average value is about 7.0E+06 joules per cubic meter. In the
second case (with 100% of current on the top ears and no current on the bottom ears), the
energy dissipated in the vicinities of the top power ears is about an order of magnitude
higher than that in the bottom third of the plate. The energy dissipated in the top ear area is
about 1.85E+07 joules per cubic meter. In the region between the top ears, the average
energy dissipated is in the neighborhood of 8.8E+06 joules per cubic meter. For the
bottom one third of the plate the mean value of the dissipated energy is only 3.0E+06 joules
per cubic meter.
From the plots of the current density vector in Figures 7-9 and 7-10, it can be seen that the
current enters through the left ear, fans out across the back of the melter, then contracts to
flow out the right ear. These figures also show the obvious effect of input current
distribution. In the 70-30% split case, the major component (along the width of the melter,
axis 2 in the model) of the current density vector spreads evenly over the large plate.
Whereas in the case with all the input current concentrated on the top left ear, the major
component of the current density vector flows mostly over the top two third of the large
plate. Nevertheless, except along the left and right edges, the current density difference
between the top and bottom parts of the large plate is less than twofold.
By changing the distribution of input current between the top and bottom power ears, we
can effectively control the power distribution in the melter. In this analysis, the influence
of the molten frit and the liquid feed is not considered; However, in a steady state, the
power supply from the ears will determine the temperature distribution in the melter. The
variation due to the motion of the glass and liquid feed is rather transient.
The results obtained in Case 3, confirms the conjecture that the current input into the left
top ear will transmit down through the attached low resistance wire which connects the two
bottom power ears. The current density contour indicates that the path of least resistance is
from the top ear to the adjacent bottom ear through the lower current loop into the bottom
ear on the opposite side of the melter and out through the top ear of the melter. The
transmission of the total current through the melter body between the top and bottom ears
might result in excessive heating and burn through.
Page 14
This thermal-electrical analysis, in essence, provides vital parametric studies and
simulations needed for the temperature-power control of the vitrification process.
The input and result files are saved in the Cray Data Archive. The files are in the directors:
/archive/y6749/noscreen3.
The information contained in this article was developed during the course ofwork under Contract No. DE-AC09-89SR18035 with the U. S. Department ofEnergy. By acceptance of this paper, the publisher and/or recipientacknowledges the U. S. Government's right to retain a non-exclusive, royalty-free license in and to any copyright covering this paper along with the r ightto reproduce, and to authorize others to reproduce all or part of thecopyrighted paper.
REFERENCES
ABAQUS® (version 5.5-1N), 1995, ABAQUS Theory Manual, Hibbitt, Karlsson &Sorensen, Inc. 1080 Main Street, Pawtucket, RI02860-4847.
APGreen, 1992, KAST-O-LITE® 30, A. P. Green, Industries, Inc., Mexico, Missouri,65265, Tel., 314-473-3626, Fax, 314-473-3330.
ASM, 1990, Metals Handbook, tenth edition, volume 2, ASM International HandbookCommittee.
Jones, H., 1956, "Theory of Electrical and Thermal Conductivity in Metals", in Handbuchder Physik (Encyclopedia of Physics), vol. XIX, Electrical Conductivity I, Edited by S.Fliigge, Springer-Verlag, Berlin.
Kittel, C , 1966, Introduction to Solid State Physics, Third edition, John Wiley & Sons,Inc., New York.
M0lgaard, J., and Smeltzer, W. W., 1968, "The thermal conductivity of 87% platinum -13% rhodium alloy", Short Communications, Journal of the Less-Common Metals, 16(1968) pp. 275-278.
MSC/PATRAN® (version 5.0), 1996, Installation & Operations Manual, The MacNeal-Schwendler Corporation, 815 Colorado Boulevard, Los Angeles, CA 90041.
Ozisik, M. N., 1985, HEAT TRANSFER, A Basic Approach, McGraw-Hill BookCompany, New York.
Papadakis, E. P., Fowler, K. A., Lynnworth, L. C , Robertson, A., and Zysk, E. D.,1974, "Ultrasonic measurements of Young's modulus and extensional wave attenuation inrefractory metal wires at elevated temperatures with application to ultrasonic thermometry",Journal of Applied Physics, Vol. 45, No. 6, June 1974. pp. 2409-2420.

Page 15
Toth, Louis, 1996, Private communications ENGELHARD-CLAL, LP, 700 Blair Road,Carteret, New Jersey 07008, Telephone (908) 205-5870, Fax phone (908) 205-7476.
Vines R. F., 1941, The Platinum Metals and Their Alloys, Edited by E. M. Wise, TheInternational Nickel Company, Inc., New York.
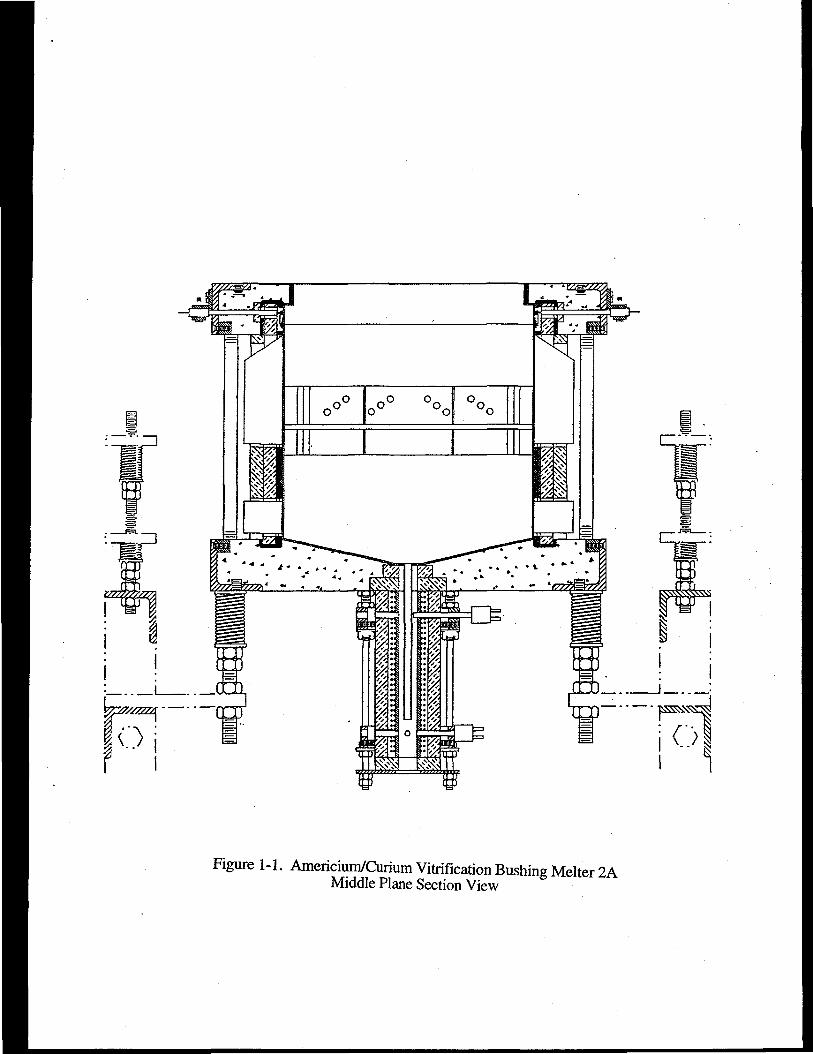
Figure 1-1. Americium/Curium Vitrification Bushing Melter 2AMiddle Plane Section View
7
Figure 1-2. Americiurn/Curium Vitrification Bushing Melter 2ASide Plane Section View
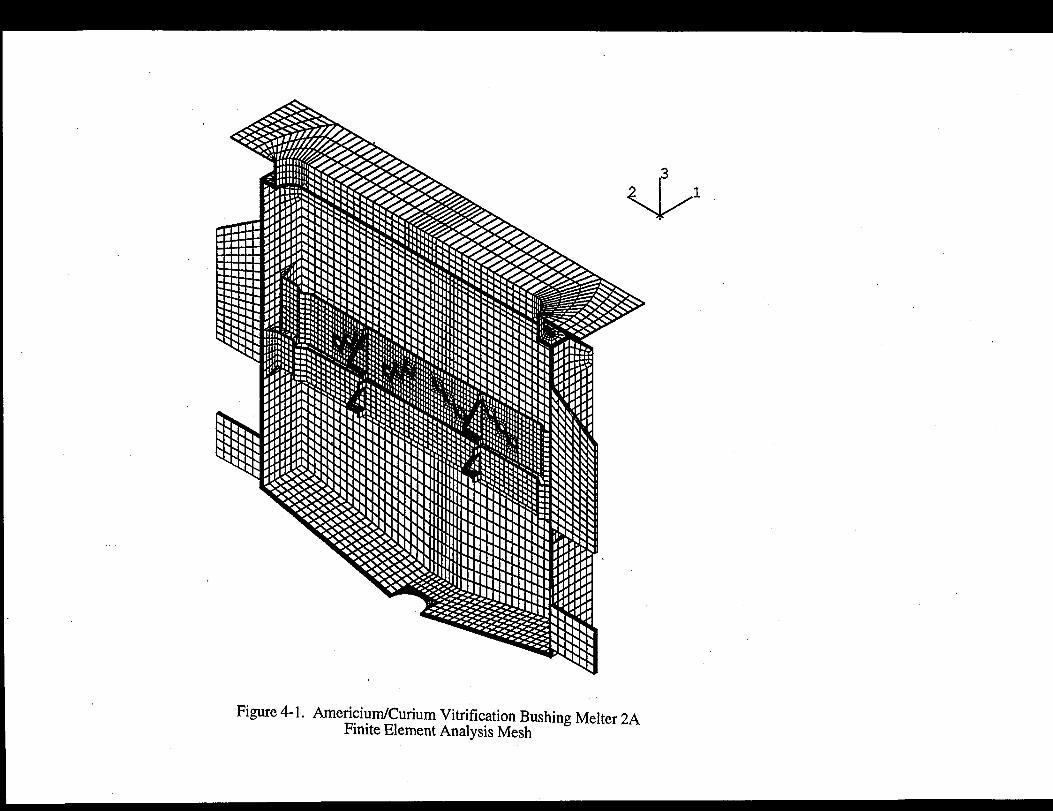
Figure 4-1. Americium/Curium Vitrification Bushing Melter 2AFinite Element Analysis Mesh
ECDM VALUE+8.8121E-02
+1.0493E+06
+2.0987E+06
+3.1480E+06
— +4.1974E+06
+5.2467E+06
- +6.2961E+06
+7.3454E+06
+8.3948E+06
+9.4441E+06
+1.0493E+07
+1.1542E+07
+1.2592E+07
+1.3641E+07
Temperature:1450 C
Direct Current
1,928.5714 Amperes
70% on both TOP ears
3 0% on both BOTTOM ears(without bottom screen)
Electrical
Current Density
Magnitude
Figure 7-1. Americium/Curium Vitrification Bushing Melter 2ACurrent input: 70% on Top Ears, 30% on Bottom E a *
Electrical Current Density Magnitude
ECDM . VALUE+1.0696E-01
h +1.6717E+06
+3.3435E+06
+5.0152E+06
+6.6870E+06
+8.3587E+06
+1.0030E+07
- +1.1702E+07
- +1.3374E+07
+1.5045E+07
+1.6717E+07
+1.8389E+07
+2.0061E+07
+2.1732E+07
Temperature:1450 C
Direct Current
1,928.5714 Amperes
100% on both TOP ears
0% on both BOTTOM ears(without bottom screen)
Electrical
Current Density
Magnitude
Figure 7-2. Americium/Curium Vitrification Bushing Melter 2ACurrent input: 100% on Top Ears, 0% on Bottom Ears
Electrical Current Density Magnitude
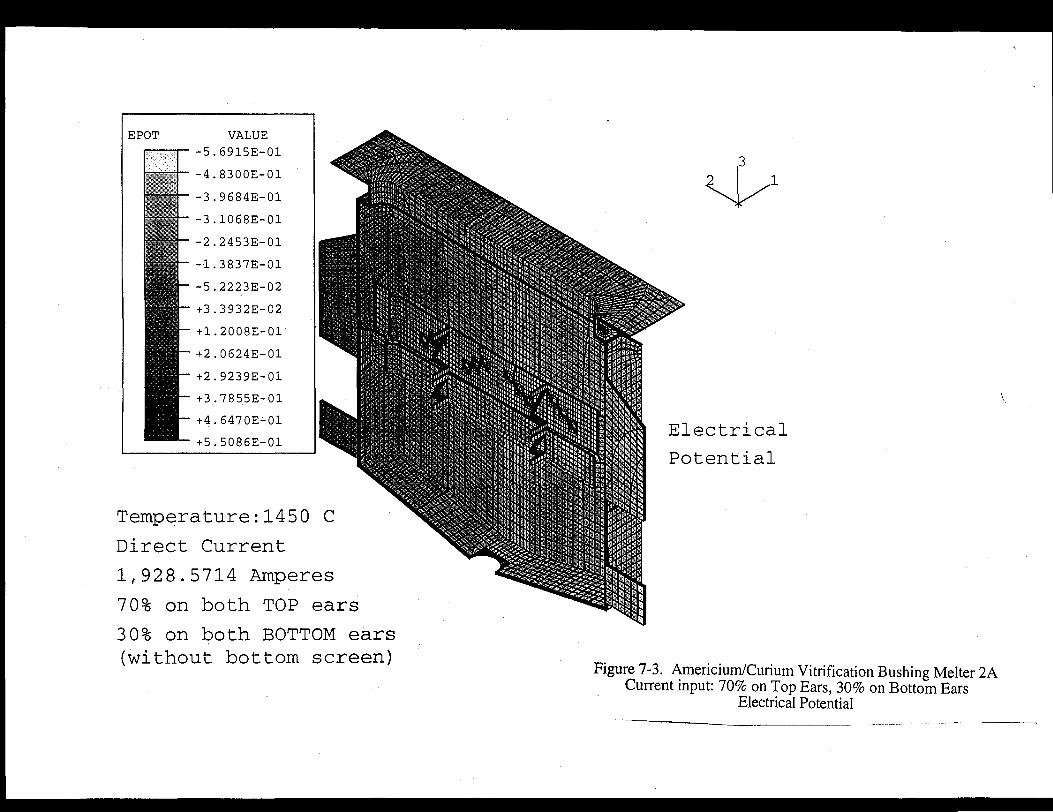
EPOT VALUE-5.6915E-01
-4.8300E-01
-3.9684E-01
-3.1068E-01
-2.2453E-01
-1.3837E-01
- -5.2223E-02
- +3.3932E-02
- +1.2008E-01
+2.0624E-01
+2.9239E-01
+3.7855E-01
+4.6470E-01
+5.5086E-01
Temperature:1450 C
Direct Current
1,928.5714 Amperes
70% on both TOP ears
30% on both BOTTOM ears(without bottom screen)
Electrical
Potential
Figure 7-3. Americium/Curium Vitrification Bushing Melter 2ACurrent input: 70% on Top Ears, 30% on Bottom Ears
Electrical Potential

EPOT VALUE-7.3587E-01
-6.2393E-01
-5.1199E-01
-4.0006E-01
-2.8812E-01
-1.7618E-01
"f- -6.4248E-02
- +4.7688E-02
+1.5962E-01
+2.7156E-01
+3.8349E-01
+4.9543E-01
+6.0737E-01
+7.1931E-01
Temperature:1450 C
Direct Current
1,928.5714 Amperes
100% on both TOP ears
0% on both BOTTOM ears(without bottom screen)
Electrical
Potential
Figure 7-4. Americium/Curium Vitrification Bushing Melter 2ACurrent input: 100% on Top Ears, 0% on Bottom Ears
Electrical Potential
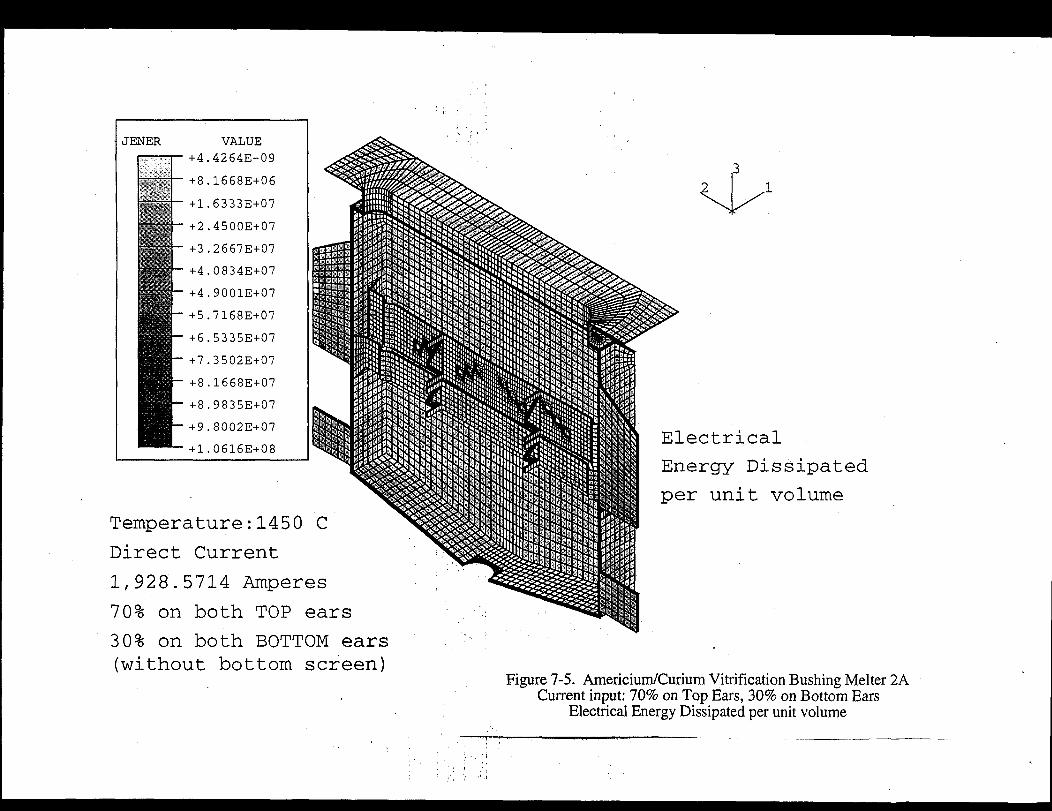
JENER VALUE+4.4264E-09
+8.1668E+06
+1.6333E+07
+2.4500E+07
+3.2667E+07
+4.0834E+07
+4.9001E+07
+5.7168E+07
+6.5335E+07
+7.3502E+07
+8.1668E+07
+8.9835E+07
+9.8002E+07
+1.0616E+08
Temperature:1450 C
Direct Current
1,928.5714 Amperes
70% on both TOP ears
30% on both BOTTOM ears(without bottom screen)
Electrical
Energy Dissipated
per unit volume
Figure 7-5. Americium/Curium Vitrification Bushing Melter 2ACurrent input: 70% on Top Ears, 30% on Bottom Ears
Electrical Energy Dissipated per unit volume
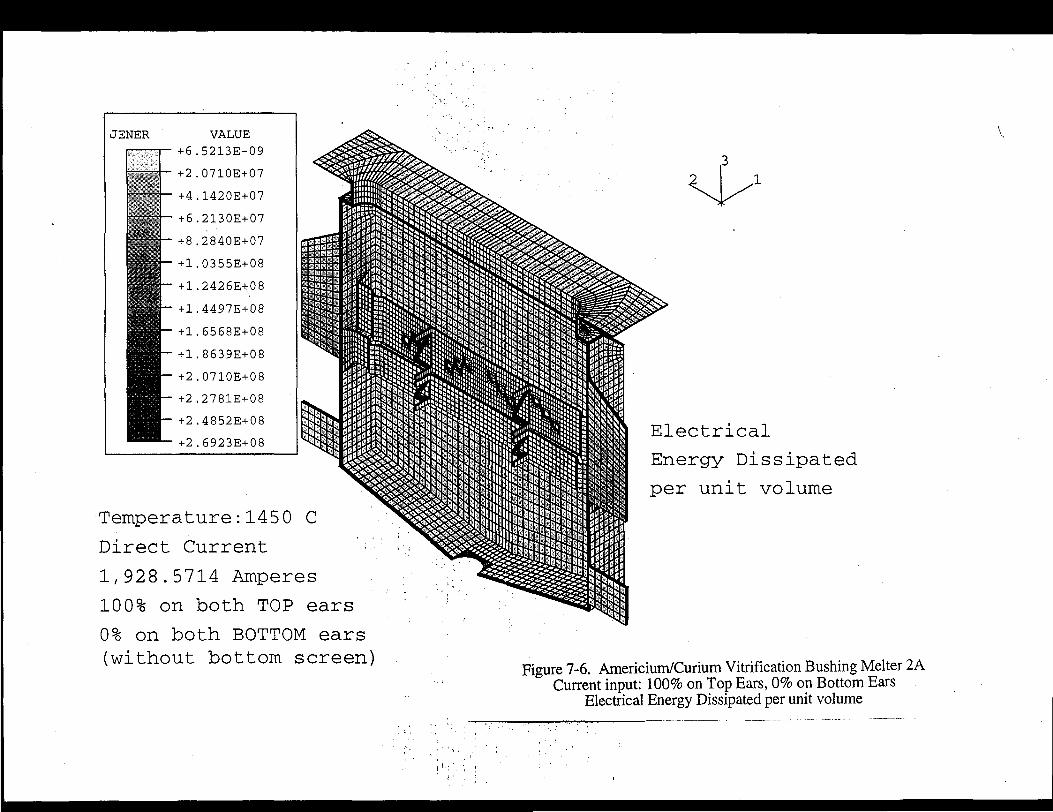
JENER VALUE
+6.5213E-09
+2.0710E+07
+4.1420E+07
h +6.2130E+07
+8.2840E+07
+1.0355E+08
+1.2426E+08
;- +1.4497E+08
+1.6568E+08
+1.8639E+08
+2.0710E+08
+2.2781E+08
+2.4852E+08
+2.6923E+08
Temperature:1450 C
Direct Current
1,928.5714 Amperes
100% on both TOP0% on both BOTTOM ears(without bottom screen)
Electrical
Energy Dissipated
per unit volume
ears
Figure 7-6. Americium/Curium Vitrification Bushing Melter 2ACurrent input: 100% on Top Ears, 0% on Bottom Ears
Electrical Energy Dissipated per unit volume
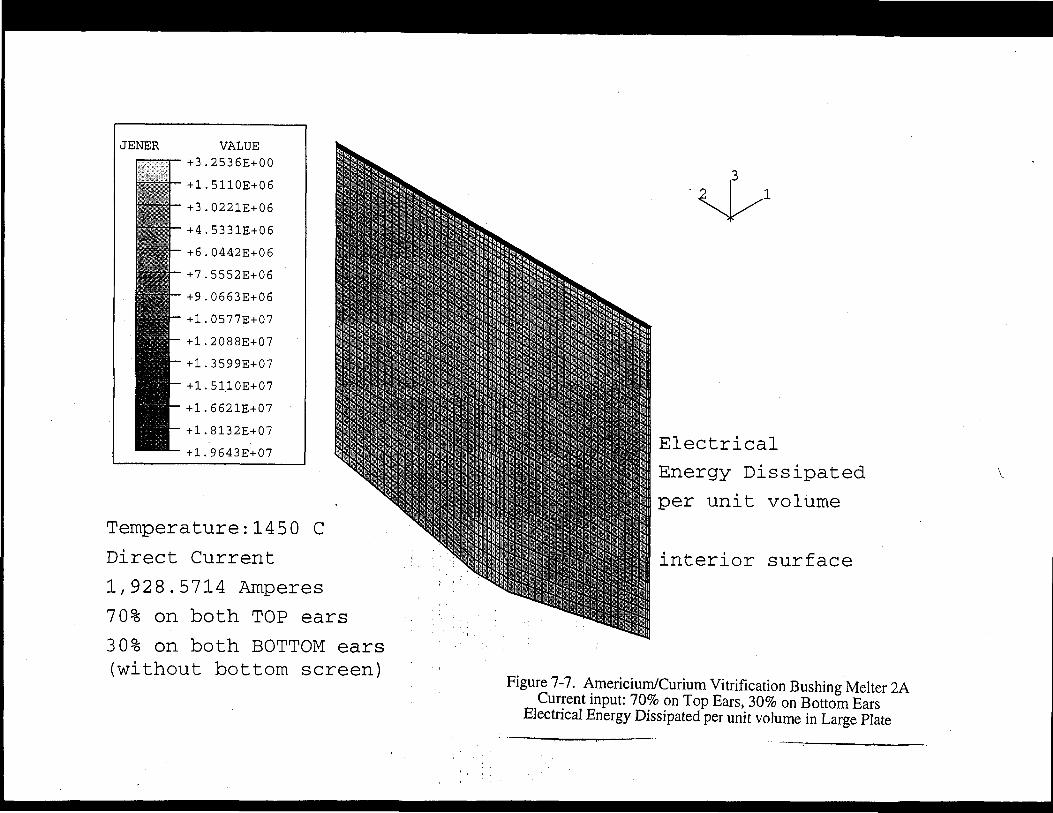
JENER VALUE+3.2536E+00
+1.5110E+06
+3.0221E+06
•+4.5331E+06
+6.0442E+06
+7.5552E+06
+9.0663E+06
+1.0577E+07
+1.2088E+07
+1.3599E+07
+1.5110E+07
+1.6621E+07
+1.8132E+07
+1.9643E+07
Temperature:1450 C
Direct Current
1,928.5714 Amperes
70% on both TOP ears3 0% on both BOTTOM ears(without bottom screen)
Electrical
Energy Dissipated
per unit volume
interior surface
Figure 7-7. Americium/Curium Vitrification Bushing Melter 2ACurrent input: 70% on Top Ears, 30% on Bottom Ears
Electrical Energy Dissipated per unit volume in Large Plate
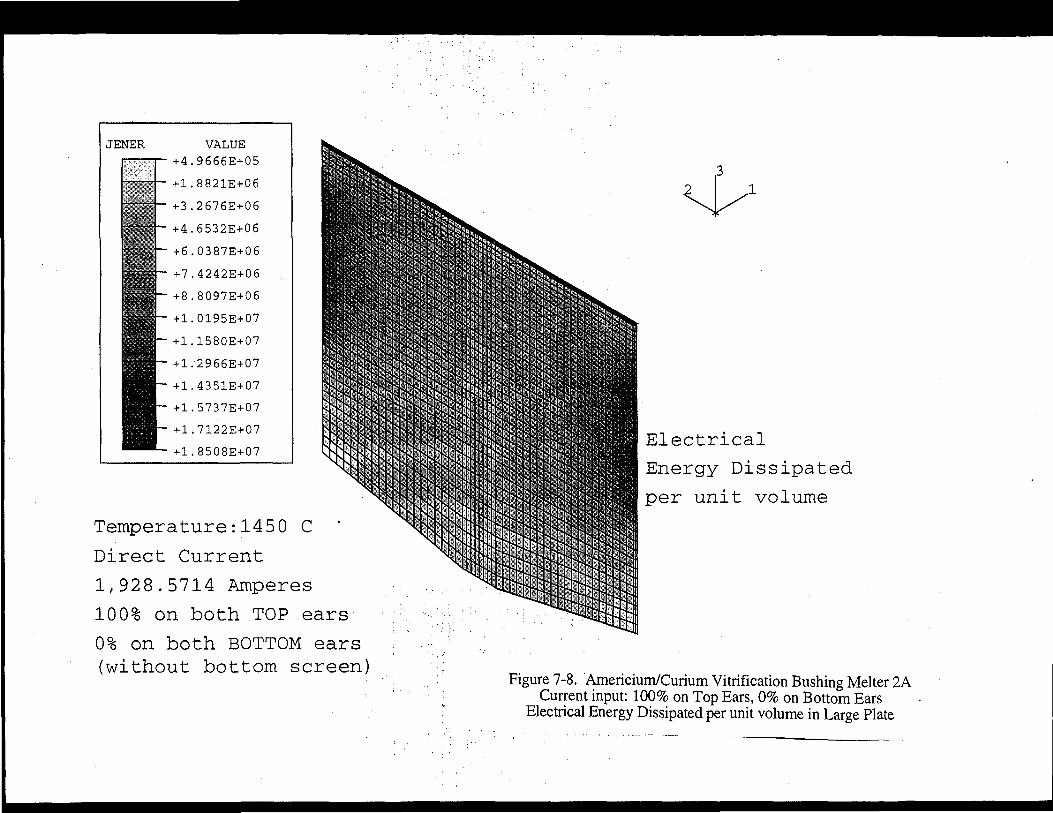
JENER VALUE+4.9666E+05
+1.8821E+06
+3.2676E+06
+4.6532E+06
- +6.0387E+06
+7.4242E+06
+8.8097E+06
- +1.0195E+07
+1.1580E+07
+1.2966E+07
+1.4351E+07
+1.5737E+07
+1.7122E+07
+1.8508E+07
Temperature:1450 C
Direct Current
1,928.5714 Amperes
100% on both TOP ears0% on both BOTTOM ears(without bottom screen)
Electrical
Energy Dissipated
per unit volume
Figure 7-8. Americium/Curium Vitrification Bushing Melter 2ACurrent input: 100% on Top Ears, 0% on Bottom Ears
Electrical Energy Dissipated per unit volume in Large Plate
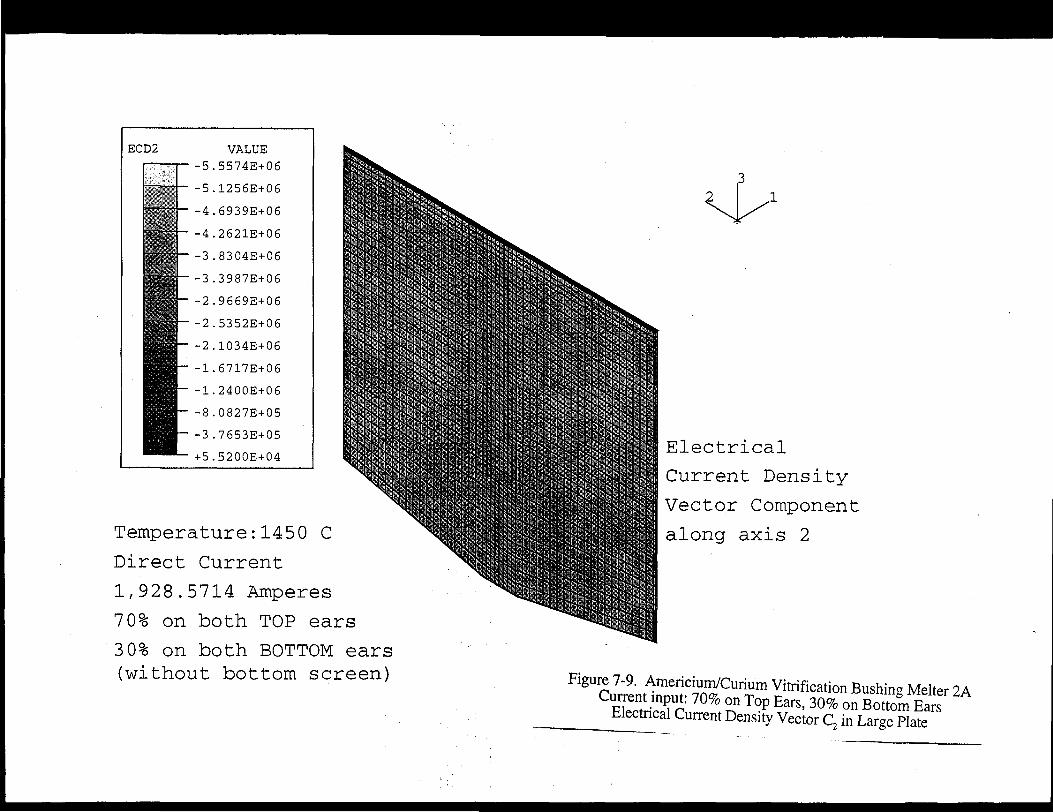
ECD2 VALUE-5.5574E+06
-5.1256E+06
-4.6939E+06
-4.2621E+06
- -3.8304E+06
- -3.3987E+06
-2.9669E+06
-2.5352E+06
-2.1034E+06
-1.6717E+06
-1.2400E+06
-8.0827E+05
-3.7653E+05
+5.5200E+04
Temperature:1450 C
Direct Current
1,928.5714 Amperes
7 0% on both TOP ears
3 0% on both BOTTOM ears(without bottom screen)
Electrical
Current Density
Vector Component
along axis 2
Figure 7-9. Americium/Curium Vitrification Bushing Melter
C T r 7 ° % ?? T ° P EarS' 30% °* BoTom EarsCurrent Density Vector C2 in Large Plate
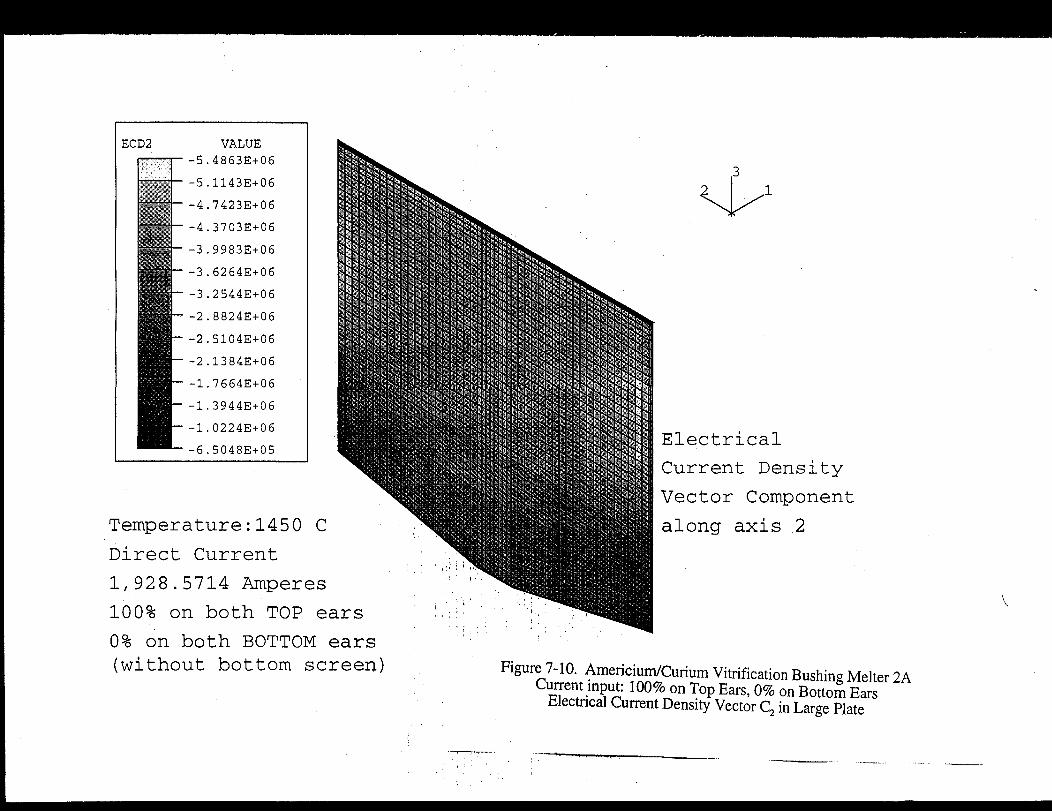
ECD2 VALUE-5.4863E+06
-5.1143E+06
-4.7423E+06
-4.3703E+06
-3.9983E+06
-3.6264E+06
-3.2544E+06
-2.8824E+06
-2.5104E+06
-2.1384E+06
-1.7664E+06
-1.3944E+06
-1.0224E+06
-6.5048E+05
Temperature:1450 C
Direct Current
1,928.5714 Amperes
100% on both TOP ears
0% on both BOTTOM ears(without bottom screen)
Electrical
Current Density
Vector Component
along axis 2
Figure 7-10. Amencmrn/Cunum Vitrification Bushing Melter 2ACurrent input: 100% on Top Ears, 0% on Bottom Ears
Electrical Current Density Vector C2 in Large Plate