Power Characteristics of Industrial Air Compressors
10
University of Dayton eCommons Mechanical and Aerospace Engineering Faculty Publications Department of Mechanical and Aerospace Engineering 2003 Power Characteristics of Industrial Air Compressors Chris Schmidt Energy and Resource Solutions J. Kelly Kissock University of Dayton, [email protected] Follow this and additional works at: hp://ecommons.udayton.edu/mee_fac_pub Part of the Aerodynamics and Fluid Mechanics Commons , Automotive Engineering Commons , Biomechanics and Biotransport Commons , Electro-Mechanical Systems Commons , and the Energy Systems Commons is Conference Paper is brought to you for free and open access by the Department of Mechanical and Aerospace Engineering at eCommons. It has been accepted for inclusion in Mechanical and Aerospace Engineering Faculty Publications by an authorized administrator of eCommons. For more information, please contact [email protected], [email protected]. eCommons Citation Schmidt, Chris and Kissock, J. Kelly, "Power Characteristics of Industrial Air Compressors" (2003). Mechanical and Aerospace Engineering Faculty Publications. Paper 146. hp://ecommons.udayton.edu/mee_fac_pub/146
-
Upload
khangminh22 -
Category
Documents
-
view
0 -
download
0
Transcript of Power Characteristics of Industrial Air Compressors

University of DaytoneCommonsMechanical and Aerospace Engineering FacultyPublications
Department of Mechanical and AerospaceEngineering
2003
Power Characteristics of Industrial AirCompressorsChris SchmidtEnergy and Resource Solutions
J. Kelly KissockUniversity of Dayton, [email protected]
Follow this and additional works at: http://ecommons.udayton.edu/mee_fac_pub
Part of the Aerodynamics and Fluid Mechanics Commons, Automotive Engineering Commons,Biomechanics and Biotransport Commons, Electro-Mechanical Systems Commons, and the EnergySystems Commons
This Conference Paper is brought to you for free and open access by the Department of Mechanical and Aerospace Engineering at eCommons. It hasbeen accepted for inclusion in Mechanical and Aerospace Engineering Faculty Publications by an authorized administrator of eCommons. For moreinformation, please contact [email protected], [email protected].
eCommons CitationSchmidt, Chris and Kissock, J. Kelly, "Power Characteristics of Industrial Air Compressors" (2003). Mechanical and AerospaceEngineering Faculty Publications. Paper 146.http://ecommons.udayton.edu/mee_fac_pub/146

POWER CHARACTERISTICS OF INDUSTRIAL AIR COMPRESSORS
Chris Schmidt Graduate Assistant / Project Engineer
Kelly Kissock, Ph.D., P.E. Associate Professor / Director
Industrial Assesment Center Department of Mechanical and Aerospace Engineering
University of Dayton Dayton, Ohio
ABSTRACT
The power draw characteristics of air compressors are primarily determined by the type of compressor control and the relationship between the compressor’s output capacity and the compressed air demand in the plant. In this paper, we review the most common types of compressor control for small reciprocating and rotary air compressors, and derive relations for estimating compressed air output as a function of the type of control and motor loading. Using these relations, we develop a method to estimate the ratio of compressed air output to energy input, which we call the average operating efficiency, based on input power to the compressor.
The measured power draw signatures of
industrial air compressors operating in different control modes and with different loads are discussed as case studies. The case studies illustrate how to identify the type of control, and potential problems such as inadequate compressed air storage, over-sized compressors, and compressed air leaks from the power signatures. Average operating efficiencies for the case studies are compared to suggested guidelines for energy-efficient air compression. INTRODUCTION
Compressed air is typically one of the most expensive utilities in an industrial facility. Based on energy assessments of mid-sized industries, we found that on average, compressed air typically comprises from about 5% to 20% of a plant’s annual electric costs, and the unit energy cost of compressed air ranges from about $0.15 to $0.35 per thousand standard cubic feet. The wide range in unit energy costs is a function of many factors, including the cost of energy and number of compressors in operation. However, two of the most important factors are the type of compressor control and the relationship between the output capacity of a compressor and the compressed air demand.
Compressor Controls In general, compressor controls seek to maintain
the compressed air discharge pressure within a specified range. There are at least six common types of compressor control modes for small reciprocating and rotary air compressors: start/stop, load/unload, inlet modulation, auto-dual, variable displacement and variable speed control (Compressed Air Challenge, 2002).
Start/stop control is frequently used by small
reciprocating compressors. In this type of control, the compressor turns itself off and draws no power as long as the discharge pressure remains above a specified level. This is the most energy-efficient type of control since the compressor runs at maximum efficiency when compressing air and turns off when not compressing air.
Most rotary compressors are unable to run in
start/stop mode, thus, the compressor continues to run even as the demand for compressed air declines or ends. Most rotary compressors use either load/unload, inlet modulation, auto-dual, or variable displacement control.
With load/unload control, the compressor runs
fully loaded, producing compressed air at maximum efficiency until the discharge pressure reaches the upper activation pressure setting, which causes the compressor to unload. When unloaded, the compressor no longer adds compressed air to the system, but the motor continues to run.
With inlet modulation control, the inlet air valve
to the compression device is continuously adjusted, restricting the inlet air to vary the compressed air output to meet the demand on the system. Auto-dual control is a combination of modulation and load/unload control in which the compressor operates in modulation control down to a specified pressure and switches to load/unload control below this pressure.

With variable displacement control, the effective length of the compressor rotor is varied by valves in the rotor housing.
Recently, rotary compressors with variable speed
motor drives have become available. Variable-speed compressors vary the speed of the compressor motor to meet the compressed air demand. In general, for variable torque loads such as air compression, the load on the motor varies with the cube of the motor speed. Thus, decreasing the speed of the motor during periods of low compressed air demand significantly decreases the load on the motor, and variable-speed compressors operate very efficiently at low loads. Air Compressor Efficiency
"Do not guess, when you can calculate. Do not calculate, when you can measure." Archimedes
The energy efficiency of an air compressor can
be defined as the ratio of compressed air output to input power. In normal operation, this ratio varies over time in response to varying loads and other factors, such as discharge pressure and the temperature of the inlet air. The most accurate method of determining average compressor efficiency is, as Archimedes suggests, to directly measure the input power and compressed air output over time.
For three phase power, power meters measure
the current draw of all phases, I, the voltage, V, and the power factor, PF, to calculate input power, Pin, as: Pin = Iavg x V x PF x 3 (1)
In most applications, the voltage and power
factor remain fairly constant. Thus, the power can be estimated to a reasonable degree of accuracy by measuring or logging the current draw, and estimating the voltage and the power factor. Line voltage to most industrial three phase air compressors is typically 240 V or 480 V and can be read from the compressor motor nameplate. In our experience, the power factor of 50-hp to 150-hp compressors during typical operation is about 85%1.
Compressed air output can be measured by inline
or non-intrusive flow meters. In-line flow
measurement is fairly common in very large plants and in applications where a plant purchases compressed air from a supplier. However, it is uncommon in mid and small-sized plants. In some cases, compressed air specialists install temporary in-line measurement as part as a comprehensive diagnosis of the compressed air system. Non-intrusive flow meters are somewhat expensive and their accuracy is dependent on proper placement and other factors. Thus, in many cases, direct measurement of compressed air output is impractical and gauging compressor efficiency requires estimating compressed air output. While this certainly introduces some error into the diagnostic effort, it can still lead to important conclusions, and is, as Archimedes suggests, better than guessing.
1 In general, power factor increases with motor size and remains fairly constant with motor load until motor loading falls below about 40%.
ESTIMATING COMPRESSED AIR OUTPUT AND EFFICIENCY
Typical relationships between the fraction of full-load brake power, FP, and the fraction of full-load compressed air output, FC, for various types of control are plotted in Figure 1. These relations were derived from Compressed Air Challenge, 2002; Air Master+, Washington State University, 2000; manufacturer’s literature; and our measurements and observations.2
Compressors running in load/unload and
start/stop modes operate at either 0% or 100% of peak capacity; however, the curves are drawn as continuous functions since average fraction of compressed air output, FC, can be derived from the average fraction power, FP, over a time interval.
In all cases, compressed air output is greatest
when the motor is fully loaded. However, as the demand for compressed air declines, the power requirement of the compressor depends on the type of control. Of the control methods shown in Figure 1, inlet-modulation control has the worst efficiency at less than full load, called part load, because it requires the greatest fraction of full-load power per compressed air output. Similarly, start/stop control has the best part-load efficiency because it requires the least fraction of full-load power per compressed air output. Part-load efficiency is important since most air compressors are sized for the peak load,
2 The inlet modulation curve shown in Figure 1 represents compressor performance when the sump does not blow down, since we have never observed a compressor operating in inlet modulation mode with blow down.

which generally occurs infrequently, and thus run at part load most of the time.
The average operating efficiency of the compressor, Effoper, can then be defined as the ratio of the compressed air output, CA, to the measured input power, Pin:
0
25
50
75
100
0 25 50 75 100
FC = Fraction Full-load Compressed Air Output (%)
FP =
Fra
ctio
n Fu
ll-lo
ad B
rake
Po
wer
(%)
Inlet Mod
Load/Unload
Var Disp
Var Speed
Start/Stop
Figure 1. Fraction of full-load brake power versus fraction of full-load compressed air output for typical reciprocating and rotary air compressors based on type of control.
Effoper = CA / Pin (9) The forms of Equations 2-9 are fairly accurate representations of the behavior of reciprocating and rotary air compressors based on control type and loading. However, the values of the coefficients used in these equations are estimates based on the behavior of typical compressors. For a specific compressor, accuracy will be improved if the specific value of a coefficient is measured or known. For example, if measured data indicate that a compressor operating in load/unload control draws 50% of peak power when unloaded, then Equation 3 should be modified to:
Based on the relationships shown in Figure 1,
algebraic relationships for the fraction of full-load compressed air output, FC, as a function of fraction of full-load brake power, FP, can be derived. These relationships are:
FC = (FP – 0.50) / 0.50
Similarly, if the compressor performance data state that the compressor generates 4.0 scfm/hp when fully loaded, then Equation 8 should be modified to:
Inlet modulation: FC = (FP – 0.70) / 0.30 (2) CA(scfm) = 4.0 (scfm/hp) x 1.05 x Prated (hp) x PC Load/unload: FC = (FP – 0.60) / 0.40 (3) Variable displacement: FC = (FP – 0.25) / 0.75 (4) LOAD/UNLOAD CONTROL Variable speed: FC = (FP – 0.10) / 0.90 (5) One of the most common methods of controlling
rotary air compressors is load/unload control. In load/unload control, the compressor runs fully loaded, discharging compressed air at a constant rate until the discharge pressure reaches the upper activation pressure setting, where it unloads. When unloaded, the compressor no longer adds compressed air to the system; however, the motor continues to run unloaded. The compressor runs unloaded until the system pressure falls below the lower activation pressure, at which point the compressor loads again.
Start/stop: FC = FP (6)
Fraction of full-load brake power, FP, is the ratio between the actual and maximum power output from the compressor motor. The actual power output from the motor is the product of the input power, Pin, and motor efficiency, Effmotor. Input power, Pin, can be directly measured or estimated using Equation 1. Air compressors are typically designed such that the motor generates about 105% of rated power when fully loaded; thus, the maximum power output from the motor is generally about 105% of the rated output power, Prated, on the motor nameplate. Using these relationships, fraction of full-load brake power, FP, can be calculated as:
FP = (Pin x Effmotor) / (1.05 x Prated) (7)
Load/unload control is a simple yet effective means of maintaining the system pressure within a desired range to meet the compressed air demand of the plant. However, the pressure variation between the upper and lower activation pressures can cause pressure fluctuations downstream in the plant. Pressure fluctuations in the plant can be minimized by placing sufficient compressed air storage between the compressor and load.
Most reciprocating and rotary air compressors in
the 25-hp to 300-hp range generate about 4.2 scfm of compressed air per horsepower of work delivered by the motor at full load. Thus, the compressed air output, CA, can be calculated as:
The following case studies show measured
power consumption from compressors operating in load/unload control, and discuss how to estimate compressed air output and the average operating
CA(scfm) = 4.2(scfm/hp) x 1.05 x Prated (hp) x FC (8)

efficiency of the compressor from the power consumption data.
Case 1 Input Data Prated (hp) 100 I (A) 107 V (V) 480 PF 0.85 Effmotor 0.90 Output Pin (hp) (Eqn. 1) 101 FP (Eqn. 3) 0.86 FC (Eqn. 7) 0.66 CA (scfm) (Eqn. 8) 291 Effoper (scf/kWh) (Eqn. 9) 231
Case 1
In this case study, the current draw of all three phases of a 100-hp rotary compressor operating with load/unload control was logged during typical plant operation. The average current draw of the three phases over about 20 minutes is plotted in Figure 1. The loaded and unloaded modes of the compressor are clearly evident. The upper dashed line represents the current draw at 105% of rated power and the lower dashed line represents the current draw at 60% of rated power. The consistent cycle times indicate a steady demand for compressed air in the plant. The compressor is loaded about 71% of the time, indicating that the compressor has the capacity to accommodate increased compressed air demand in the future.
Table 1. Input and output data for a compressor operating in load/unload mode.
As stated above, this estimate of average
operating efficiency could be refined if the coefficients in Equations 1, 3, 7, 8 and 9 were known with more precision. For example, if input power were logged with a power meter instead of a current meter, the actual power factor and voltage would be known and the uncertainty associated with estimating them would be eliminated. In addition, the logged data indicate that the average current draw is 120 A when loaded (Iloaded) and 76 A when unloaded (Iunloaded). Thus, at full load, the percent of rated input power drawn by the compressor is actually 102% rather than our assumption of 105%, and Equations 7 and 8 could be modified to become:
0
20
40
60
80
100
120
140
13:40:00 13:42:00 13:44:00 13:46:00 13:48:00 13:50:00 13:52:00 13:54:00 13:56:00 13:58:00 14:00:00
Cur
rent
Dra
w (A
mps
)
Figure 1. Average of three-phase current draw of a 100-hp rotary compressor over about 20 minutes operating with load/unload control during typical plant operation.
FP = (Pin x Effmotor) / (1.02 x Prated) CA(scfm) = 4.2(scfm/hp) x 1.02 x Prated (hp) x FC
Similarly, the percent of full load power when
unloaded is 65% rather than our assumption of 60%. Thus, Equation 3 could be modified to become:
To estimate the average operating efficiency of this compressor, we recorded the rated output power and voltage of 100 hp and 480 V respectively from the motor nameplate, and assumed that the motor is 90% efficient with an 85% power factor. The average current draw over the interval was measured to be 107 A. Next, we applied Equations 1, 3, 7, 8 and 9. The values of the input and output are shown in Table 1.
FC = (FP – 0.65) / 0.35
With these modifications, the average operating efficiency is calculated to be 238 scf/kWh, compared to 231 scf/kWh with “typical” coefficients. This small change of about 3% is typical of other cases where modified results were calculated. The small change suggests that the method, with the use of typical coefficients, is relatively robust. For brevity and clarity, we will use typical coefficients in the remaining case studies.
Case 2
In this case study, the current draw of a 180-hp rotary compressor operating with load/unload control

over about 20 minutes was logged during typical plant operation (Figure 2). As in Case 1, the load and unloaded modes of the compressor are clearly evident. In this case, the compressor consistently unloads to about 52% of FLP, which is lower than in Case 1. This compressor runs loaded only about 52% of the time, indicating that the compressor is oversized for this load.
Case 3 In this case study, the current draw of a 200-hp
rotary compressor operating with load/unload control was logged for about 20 minutes during typical plant operation (Figure 3). As in the previous cases, the load and unloaded modes of the compressor are clearly evident. The data indicate that this compressor runs loaded about 93% of the time. Thus, this compressor operates near its peak capacity, but has little room to accommodate additional growth in demand.
0
50
100
150
200
250
14:40:00 14:42:00 14:44:00 14:46:00 14:48:00 14:50:00 14:52:00 14:54:00 14:56:00 14:58:00 15:00:00
Cur
rent
Dra
w (A
mps
)
0
50
100
150
200
250
15:10:00 15:12:00 15:14:00 15:16:00 15:18:00 15:20:00 15:22:00 15:24:00 15:26:00 15:28:00 15:30:00
Cur
rent
Dra
w (A
mps
)
Figure 2. Current draw of a 180-hp rotary compressor operating with load/unload control logged for about 20 minutes during typical plant operation. Figure 3. Current draw of a 200-hp rotary compressor
operating with load/unload control logged for about 20 minutes during typical plant operation.
Following the method developed in Case 1, the
input and output data for this compressor, using typical coefficients, are shown in Table 2. The lower operating efficiency than in Case 1 is a result of the compressor being oversized relative to the compressed air demand, which results in the compressor running unloaded for longer periods of time.
Following the method developed in Case 1, the
input and output data for this compressor, using typical coefficients, are shown in Table 3. The relatively high operating efficiency is a result of the compressor being properly sized relative to the demand for compressed air.
Case 2 Input Data Prated (hp) 180 I (A) 167 V (V) 480 PF 0.85 Effmotor 0.9 Output Pin (hp) (Eqn. 1) 157 FP (Eqn. 3) 0.75 FC (Eqn. 7) 0.37 CA (scfm) (Eqn. 8) 296 Effoper (scf/kWh) (Eqn. 9) 151
Case 3
Input Data Prated (hp) 200 I (A) 238 V (V) 480 PF 0.85 Effmotor 0.9 Output Pin (hp) (Eqn. 1) 224 FP (Eqn. 3) 0.96 FC (Eqn. 7) 0.90 CA (scfm) (Eqn. 8) 796 Effoper (scf/kWh) (Eqn. 9) 284
Table 2. Input and output data for a compressor operating in load/unload mode.
Table 3. Input and output data for a compressor operating in load/unload mode.
Summary of Load/Unload Control Load/unload control generates a distinctive
power signature, with a loaded power of about 105% of rated power and an unloaded power of about 60% of full-load power. Power varies like a step function between these extremes; however, compressed air is only produced when the compressor is loaded.
The compressor in Case 3 is fully loaded about
93% of the time and produces 284 scf/kWh. The compressor in Case 2 is fully loaded only about 52% of the time and produces only 151 scf/kWh. Thus, the compressor in Case 3 produces 88% more compressed air per kWh of input energy than the compressor in Case 2. This demonstrates the significant energy penalty for over sizing a compressor relative to the compressed air demand. INLET MODULATION CONTROL
Another common method of controlling rotary air compressors is inlet modulation control. In inlet modulation control, the inlet air valve is continuously adjusted, restricting the inlet air to the compressor to meet the demand on the system.
Inlet modulation control maintains the system
pressure within a smaller pressure range than load/unload control, reducing fluctuations in system pressure. In addition, inlet modulation control responds more quickly to changes in compressed air demand. Quicker response helps avoid large pressure drops in the compressed air supply to the plant. However, operating a compressor in inlet modulation control is less efficient than operating a compressor in load/unload mode during part-load operation.
The current draw of air compressors operating
with inlet modulation control ranges from about 70% of full-load power to about 105% of rated power. At about 70% of full-load power, no compressed air is generated. At full-load power, about 4.2 scfm per brake horsepower of compressed air is generated. The following three case studies show power characteristics of compressors operating with inlet-modulation control. Case 4
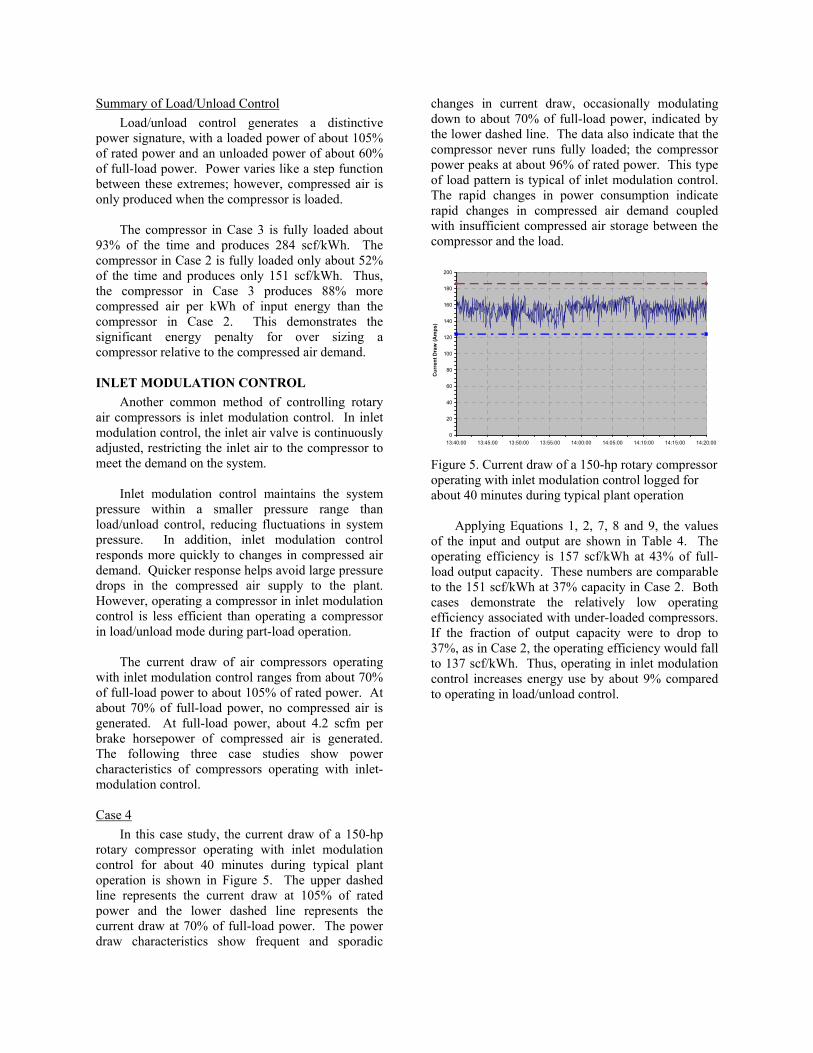
In this case study, the current draw of a 150-hp rotary compressor operating with inlet modulation control for about 40 minutes during typical plant operation is shown in Figure 5. The upper dashed line represents the current draw at 105% of rated power and the lower dashed line represents the current draw at 70% of full-load power. The power draw characteristics show frequent and sporadic
changes in current draw, occasionally modulating down to about 70% of full-load power, indicated by the lower dashed line. The data also indicate that the compressor never runs fully loaded; the compressor power peaks at about 96% of rated power. This type of load pattern is typical of inlet modulation control. The rapid changes in power consumption indicate rapid changes in compressed air demand coupled with insufficient compressed air storage between the compressor and the load.
0
20
40
60
80
100
120
140
160
180
200
13:40:00 13:45:00 13:50:00 13:55:00 14:00:00 14:05:00 14:10:00 14:15:00 14:20:00Cu
rren
t Dra
w (A
mps
)
Figure 5. Current draw of a 150-hp rotary compressor operating with inlet modulation control logged for about 40 minutes during typical plant operation
Applying Equations 1, 2, 7, 8 and 9, the values of the input and output are shown in Table 4. The operating efficiency is 157 scf/kWh at 43% of full-load output capacity. These numbers are comparable to the 151 scf/kWh at 37% capacity in Case 2. Both cases demonstrate the relatively low operating efficiency associated with under-loaded compressors. If the fraction of output capacity were to drop to 37%, as in Case 2, the operating efficiency would fall to 137 scf/kWh. Thus, operating in inlet modulation control increases energy use by about 9% compared to operating in load/unload control.

Case 4 Input Data Prated (hp) 150 I (A) 154 V (V) 480 PF 0.85 Effmotor 0.90 Output Pin (hp) (Eqn. 1) 145 FP (Eqn. 2) 0.83 FC (Eqn. 7) 0.43 CA (scfm) (Eqn. 8) 285 Effoper (scf/kWh) (Eqn. 9) 157
Table 4. Input and output data for a compressor operating with inlet-modulation control. Case 5
In this case study, the current draw of a 75-hp rotary compressor operating with inlet modulation control was logged for 20 minutes during typical plant operation (Figure 6). Unlike the compressor in Case 4, which shows rapid and sporadic fluctuations in current draw, the compressor shown in Figure 6 exhibits a cyclical load pattern, suggesting adequate compressed air storage in the system. The power draw characteristics are indicative of modulation control, occasionally modulating down close to 70% of full-load power and up to about 105% of rated power, indicated by the lower and upper dashed lines respectively
0
10
20
30
40
50
60
70
80
90
100
13:05:45 13:07:45 13:09:45 13:11:45 13:13:45 13:15:45 13:17:45 13:19:45 13:21:45 13:23:45 13:25:45
Curr
ent D
raw
(Am
ps)
Figure 6. Current draw of a 75-hp rotary compressor operating with inlet modulation control logged for 20 minutes during typical plant operation
Following the method in Case 4, the data
indicate that the average current over the logged interval was 80 A, and the input and output data are shown in Table 5. The average operating efficiency
of the compressor is 189 scf/kWh at 54% of output capacity.
Case 5 Input Data Prated (hp) 75 I (A) 80 V (V) 480 PF 0.85 Effmotor 0.90 Output Pin (hp) (Eqn. 1) 75 FP (Eqn. 2) 0.86 FC (Eqn. 7) 0.54 CA (scfm) (Eqn. 8) 178 Effoper (scf/kWh) (Eqn. 9) 189
Table 5. Input and output data for a compressor operating with inlet-modulation control. Case 6
In this case study, the current draw of a 250-hp rotary compressor operating with inlet modulation control was logged for 4.5 hours during typical plant operation (Figure 7). Power consumption is characterized by rapid, low-amplitude fluctuations close to full load power. This compressor operates at 101% of rated power over the interval, indicating that it operates continuously at its peak capacity. During the lunch break from 11:50 am and 12:30 pm, the current draw of the compressor only drops to about 97% of rated power. This suggests that a significant amount of compressed air may be lost to leaks.
0
50
100
150
200
250
300
10:15:00 10:45:00 11:15:00 11:45:00 12:15:00 12:45:00 13:15:00 13:45:00 14:15:00 14:45:00
Cur
rent
Dra
w (A
mps
)
Figure 7. Current draw of a 250-hp rotary compressor operating with inlet modulation control logged for 4.5 hours during typical plant operation.
Following the method developed in Case 4, the input and output data are shown in Table 6. The average operating efficiency of the compressor is 273 scf/kWh and 86% of full load capacity. This

relatively high operating efficiency indicates that compressors operating in inlet modulation mode can produce compressed air efficiently when running at nearly fully load.
Case 6 Input Data Prated (hp) 250 I (A) 297 V (V) 480 PF 0.85 Effmotor 0.90 Output Pin (hp) (Eqn. 1) 280 FP (Eqn. 2) 0.96 FC (Eqn. 7) 0.86 CA (scfm) (Eqn. 8) 954 Effoper (scf/kWh) (Eqn. 9) 273
Table 6. Input and output data for a compressor operating with inlet-modulation control. Summary of Inlet Modulation Control
Inlet modulation control generates a distinctive power draw pattern that varies continuously between about 105% of rated power and 70% of full-load power. Rapid fluctuations in the power draw usually indicate inadequate compressed air storage. As with load/unload compressors, the operating efficiency varies significantly with load. At relatively high loads, the energy penalty for operating with inlet modulation control compared to load/unload control is small; however it increases as the load declines relative to compressor capacity.
AUTO-DUAL CONTROL Case 7
Auto-dual control is a combination of inlet modulation and load/unload control. In this case study, the current draw of a 50-hp rotary compressor operating with auto-dual control was logged for 90 minutes before and during lunch (Figure 8). The plant shut down at 12:00, but the compressor remained on. The plot shows a typical modulation control load pattern up until the plant shuts down for lunch. At this point, a clear shift to a load/unload pattern is evident. This pattern is indicative of auto-dual control in which the compressor automatically switches from inlet modulation mode to load/unload mode when demand drops below a specified level. Interestingly, all air-using equipment in the plant was turned off during lunch; the relatively frequent
loading of the compressor is due to several large leaks in the compressed air system.
0
10
20
30
40
50
60
70
11:15:00 11:30:00 11:45:00 12:00:00 12:15:00 12:30:00 12:45:0
Curr
ent D
raw
(Am
ps)
0
Figure 8. Current draw of a 50-hp rotary compressor operating with auto-dual control logged for 90 minutes during typical plant operation. The upper dashed line represents the current draw at 105% of rated power, the middle line represents the current draw at 82% of rated power and the lower dashed line represents the current draw at 60% of rated power.
The logged data indicate that this compressor
drew an average of 39 kW, about 93% of rated power, while in modulation control up until about 12:05. At 12:05 the compressor went into load/unload control where it drew an average of 27 kW, about 64% of rated power. The average loaded power draw of the compressor in load/unload control was about 33 kW.
Based on the methods shown in Case 4, the compressed air production while the plant was operating is about 168 scfm. Based on the method shown in Case 1, the compressed air production after the plant was shut down is about 100 scfm. Thus, the fraction of compressed air demand that can be attributed to air leaks is about 60%. The average operating efficiency of the compressor during plant operation is 258 scf/kWh and the average operating efficiency after shutdown is 222 scf/kWh. VARIABLE-SPEED COMPRESSORS
Variable-speed compressors vary the speed of the motor to meet plant air demand. Because of their high part-load efficiency, variable-speed compressors are appropriate for plants in which the compressed air demand is highly variable.
Case 8
In this case study, the current draw of all three phases of a 100-hp rotary compressor operating with variable speed control was logged for 20 minutes

during typical plant operation. The average current draw of the three phases is plotted in Figure 9. The logged data indicate that this compressor draws an average of 52 A, which is about 45% of rated input power. The plot shows that the compressor rarely operates above 60% of rated power, represented by the lower dashed line. This type of continually modulating power signature operating well below 60% of full-load power is significantly different than inlet modulation or load/unload control. It indicates that the compressor is able to meet the demand for compressed air while drawing significantly less power than a compressor operating with load/unload or modulation control. However, low average power draw also indicates that the compressor is significantly oversized for the current compressed air demand in the plant.
0.0
20.0
40.0
60.0
80.0
100.0
120.0
14:40:00 14:42:00 14:44:00 14:46:00 14:48:00 14:50:00 14:52:00 14:54:00 14:56:00 14:58:00 15:00:00
Cur
rent
Dra
w (A
mps
)
Figure 9. Current draw of a 100-hp rotary compressor operating with variable speed control logged for 20 minutes during typical plant operation.
Applying Equations 1, 5, 7, 8 and 9, the input
and output data are shown in Table 7. The average operating efficiency of the compressor is 256 scf/kWh at only 36% of full load capacity. This operating efficiency is nearly as high as the 273 scf/kWh in Case 6 for a compressor operating at 86% of full load. This indicates that the variable-speed compressors can operate almost as efficiently at very low load as load/unload or modulation compressors at high load. SUMMARY AND CONCLUSIONS
In this paper, we developed relations for estimating compressed air output as a function of the type of control and input power. Using this method, compressed air output per energy input, which we call the operating efficiency, can be computed. Case studies with logged current draw data from compressors operating with load/unload, inlet modulation, auto-dual and variable-speed control were presented. The case studies illustrate that each type of control setting exhibits a distinct power draw
signature. The case studies also illustrate how to identify potential problems such as inadequate compressed air storage, over-sized compressors, and compressed air leaks based on the power signatures.
Case 8 Input Data Prated (hp) 100 I (A) 52 V (V) 480 PF 0.85 Effmotor 0.90 Output Pin (hp) (Eqn. 1) 49 FP (Eqn. 5) 0.42 FC (Eq. 7) 0.36 CA (scfm) (Eqn. 8) 157 Effoper (scf/kWh) (Eqn. 9) 256
Table 7. Input and output data for a compressor operating with variable-speed control.
The case studies demonstrate that the power
draw and compressed air output of industrial air compressors vary significantly according to the type of control method and the size of the compressor relative to the demand for compressed air. Variable speed compressors have the best part-load performance, followed by compressors operating in load/unload mode and finally inlet-modulation mode. Over-sized compressors are always less efficient than properly sized compressors.
In this selection of case studies, the highest
operating efficiency was 284 scf/kWh for a compressor with load/unload control at 90% of full-load capacity. The lowest operating efficiency was was 151 scf/kWh for a compressor with load/unload control at 37% of full-load capacity. The wide range of operating efficiencies for compressors which are assumed to have the same peak output capacity of 4.2 scfm per brake horsepower points to the importance of matching the size and control method to the plant’s compressed air demand to reduce compressed air energy costs. REFERENCES 1. Compressed Air Challenge, 2002, “Fundamentals
of Compressed Air Systems”, US Department of Energy.
2. Washington State University, 2000, “Air Master+” software.