Potential science-technology spillovers in regions: An insight on geographic co-location of...
15
KATHOLIEKE UNIVERSITEIT LEUVEN DEPARTEMENT TOEGEPASTE ECONOMISCHE WETENSCHAPPEN RESEARCH REPORT 0244 DO SCIENCE-TECHNOLOGY INTERACTIONS PAY OFF WHEN DEVELOPING TECHNOLOGY? AN EXPLORATORY INVESTIGATION OF 10 SCIENCE- INTENSIVE TECHNOLOGY DOMAINS by B. VAN LOOY E. ZIMMERMANN R. VEUGELERS A.VERBEEK K. DEBACKERE 0/2002/2376/39
-
Upload
independent -
Category
Documents
-
view
4 -
download
0
Transcript of Potential science-technology spillovers in regions: An insight on geographic co-location of...

KATHOLIEKE UNIVERSITEIT
LEUVEN
DEPARTEMENT TOEGEPASTE ECONOMISCHE WETENSCHAPPEN
RESEARCH REPORT 0244
DO SCIENCE-TECHNOLOGY INTERACTIONS PAY OFF WHEN DEVELOPING TECHNOLOGY?
AN EXPLORATORY INVESTIGATION OF 10 SCIENCEINTENSIVE TECHNOLOGY DOMAINS
by B. VAN LOOY
E. ZIMMERMANN R. VEUGELERS
A.VERBEEK K. DEBACKERE
0/2002/2376/39
Do science-technology interactions payoff when developing technology?
An exploratory investigation of 10 science-intensive technology domains
Bart Van Looy, Edwin Zimmermann, Reinhilde Veugelers, Arnold Verbeek, and Koenraad
Debackere
Research Division INCENTIM Faculty of Economics and Applied Economics
K.U.Leuven Naamsestraat 69
3000 Leuven Belgium
The authors gratefully acknowledge financial support of the Flemish Community (research project PB099A1511109).
In this paper we investigate the impact of science - technology (S&T) interactions on the effectiveness of technology development. The number of references in patents to scientific articles is considered as an approximation of the intensity of S&T interaction whereas a country's technological performance is measured both in terms of its technological productivity (i.e. number of patents per capita), and its relative technological specialization (i.e. RTA-index). We use USPTO patent-data for eight European countries in ten technological domains. A variance analysis (ANOV A) is applied. Country as an independent variable does not explain a significant portion of the observed variance in science interaction intensity (p=O.25). Technology domain, however, explains a significant portion of the observed variance (p<O.OOl). In science intensive fields we find a positive relation between the science linkage intensity of these fields and the technological productivity of the respective countries involved. These fmdings seem to suggest the relevancy of fostering interaction between knowledge generating actors and technology producers, especially in science intensive areas.

1. Introduction
The last decade one could observe a renewed interest in the determinants of economic growth and the role policy makers could play in order to facilitate and to direct this growth process in the desired directions. In this exercise, innovation has become a focal theme. At the microeconomic level, innovation enables firms to respond to more sophisticated consumer demands and to stay ahead of their competitors, both domestically and internationally. At the macroeconomic level, a country's innovative capacity and its investment in technical development (see Solow, 1957) is a strong driver for (sustained) economic growth. Central to this renewed interest is the role of new growth factors such as knowledge and learning. A country's competitive strength is at least in part the result of its capacity to create but also to trace, to absorb and to assimilate new technological developments - the so-called 'absorptive capacity' (see Cohen & Levinthal, 1990). Research, and specifically basic research, is one of the factors that influence this capacity.
Accordingly, the relationship between science and technology, within the context of pursuing sustained economic development, has received widespread attention. This attention coincides with a renewed interest for phenomena like innovative entrepreneurial activity, often to be found at the crossroads of new and emerging science and technology domains; the entrepreneurial nature of knowledge generating institutions like universities and research centres; and finally the way in which established companies organize themselves in order to deal with a variety of innovative challenges, including venturing and networking. As such, one observes that entrepreneurs, established companies, knowledge generating institutions (like universities and research laboratories), and government agencies appear prominently on the innovation stage today. Over the last decade, there has been a perceptibly increasing consensus on this point of departure in the literature concerning knowledge and technology policy. Important contributions in this regard can be found in the influential work of Michael Porter (1995), and the work on the 'Triple Helix' model, which rose to prominence in the second half of the 1990s (Leydesdorff en Etzkowitz, 1996; Etzkowitz en Leydesdorff, 1997; Leydesdorff en Etzkowitz, 1998; Etzkowitz en Leydesdorff, 1998 and 2000). The 'Triple Helix' model draws our attention to the interaction between the aforementioned institutional actors - industry, academia and government - and its role in the generation, transfer and use of knowledge in a global system.
One way of investigating science-technology interactions consists of looking at citations to scientific publications found in patents!. Pioneered by, amongst others, Narin and his colleagues from Computer Horizons Incorporated in the early eighties, this approach of S&T interaction analysis has gained widespread recognition during the last decades and has consecutively become refined both with respect to analysis and interpretation (Narin & Noma, 1985; Collins & Wyatt, 1988; Narin & Olivastro, 1992; Van Viaenen, Moed & Van Raan, 1990; Schmoch, 1997; Narin, Hamilton & Olivastro, 1997; Meyer, 2000b; Verbeek et aI., 2002a and b). Until now, studies in this field have
1 Alternative approaches relate to examining joint publications between academia and industry, contract research and consulting, collaborative research etc ..
2

been investigating the nature of the science-technology interaction that is implied by a citation link (e.g. Narin & Noma, 1985) the role of public science for developing technology (e.g. Narin et al. 1997), or still the frequency and nature of occurrence of such interactions in new emerging technology domains (Van Viaenen et aI. 1990; Meyer, 2000a, Verbeek et al. 2002b).
Studies addressing the effect of science-technology interactions on the effectiveness of technology development are less frequent. It is in this area that we want to situate our contribution. Basically, the central question in this paper relates to whether or not science-technology interaction pays off when it comes down to developing new technology. Such an analysis might contribute directly to the challenging dilemma policy makers face between 'monitoring' versus 'active steering' of S&T exchange processes, a dilemma in which timeliness and time horizons do playa part.
Investigating the relation between the intensity of science-technology interactions and technological performance implies a number of indicators that grasp both notions. Within this study, the number of references in patents to scientific articles is considered as an approximation of the level of intensity of science-technology interaction, at least in terms of closeness between specific scientific disciplines and technological fields within a particular country. We examine the relationship between this intensity, on the one hand, and a country's technological performance, on the other hand. A country's technological performance is measured both in terms of its technological productivity (number of patents per capita) and its relative technological specialization CRT A-index).
The analysis covers an in-depth investigation of S&T interactions in ten scienceintensive technology domains in relation to the technological productivity of eight EU countries. Data have been used that cover a five year period, ranging from 1992 till 1996.
In the following sections, we first discuss the relevancy of citations for reflecting the degree of interaction between science and technology for particular technology domains. In addition, we extend on the indicators related to technological performance, namely technological productivity and technological specialization. Equipped with this background, in section three we will discuss results obtained so far. In section four we will briefly extend on some first implications and point out areas for future research, some of which are currently being pursued.
2. Methodological approach
Citations as an indicator of S-T interaction
Whether or not the number of references found in patents forms an indication of science-technology interaction has been debated heavily within the literature. This
3

(recent) debate regarding the nature of citation links (patent to scientific literature) as reflecting science-technology interactions (Van Vianen et al. 1990; Schmoch (1993); Grupp & Scmoch (1992); Meyer, 2000a&b), reveals some emerging points of consensus. First, in terms of the direction of the influence, consensus grows that one should abandon the old 'linear' model in which science is seen as influencing technology unidirectional as 'too simplistic and even highly inaccurate' (Narin et aI., 1997). As such, it is more appropriate to conceive the relationship between science and technology as a reciprocal one characterized by an intricate interwovenness. Ideas that are prominent as well in the work of Rip (1992) and de Solla Price (1965). Science and technology are depicted here as separate but closely interacting partners whereby scientific exploration and technological exploitation mutually influence each other. Second, citation links from patents to scientific literature should be looked upon as mediated indicators of the multifaceted interplay between science and technology (Meyer, 2000b). However, such an interpretation does not invalidate the relevance of such indicators for science and technology policies. For instance, Meyer (2000b) indicates the relevance of using non-patent references (NPRs) to illuminate varying intensities of interrelation between science and technology, which seem to be clearly different from one technological domain to another. As such, this kind of analysis might lead to sector-specific technology transfer policies and innovation policies. However, before such policy recommendations can be made, establishing some kind of relationship between citation intensity and technological performance might be useful. This is exactly what we try to do in this paper.
Within this study, a citation is perceived as a bit of information linking two different documents. The presence of scientific research in the 'prior art' description of a patented invention, is seen as a direct and profound form of S&T interaction, which can be grasped through rich, plenty, and directly available and accessible data: patents and publications. Patents and scientific publications are considered to be the 'closest' possible measures of technological and scientific activity (OEeD, 1994), whereas the cross-citations between both activity spheres (references to 'prior art') forms a 'bridge' from one sphere to the other (from technology to science and vice versa).
A method towards the construction of this 'bridge' was designed and implemented previously (see Verbeek et al. 2002a), thereby connecting the landscapes of S&T with each other. The designed method encompasses a complex parsing algorithm, based on a textual analysis approach that identifies and parses the (scientific) journal references to be found in patents, and thus enabling the identification of the 'science intensity' of a certain patent.
Hence, the number of citations retrieved in patent documents to scientific literature is used here as a measure of the intensity of interaction between science and technology (see also Schmoch, 1997). Similar to the majority of studies that investigate the link between science and technology, we make use of so-called front-page references, since these are the only ones available in the database used (United States Patent Trademark Office - USPTO). The U.S. patenting legislation, prescribing that the applicant is obliged to mention any references known to him or her during the patenting procedure (the 'duty of disclosure'), leads to a plentitude of 'prior-art' references
4
suitable for capturing the widest possible web of S&T interactions. While it could be argued that such an analysis might benefit from including examiner-given references (see for instance Meyer, 2000b), their present unavailability within the database does not allow for inc1usion2.
Indicators used in this study: Science Intensity, Technological Productivity and Revealed Technological Advantage.
In order to examine the relationship between the intensity of science-technology interaction, and technological performance, a number of indicators were constructed. First, a technology domain's Science Intensity is measured by the number of references to scientific literature3 per 100 patents (all patents, i.e. including both with and without science references) in that technology domain. A high propensity-to-cite - that is, a high number of references to science in patents belonging to a technology domain - indicates an intensive interaction between science and the technology domain in question (see also Van Viaenen et aI., 1990).
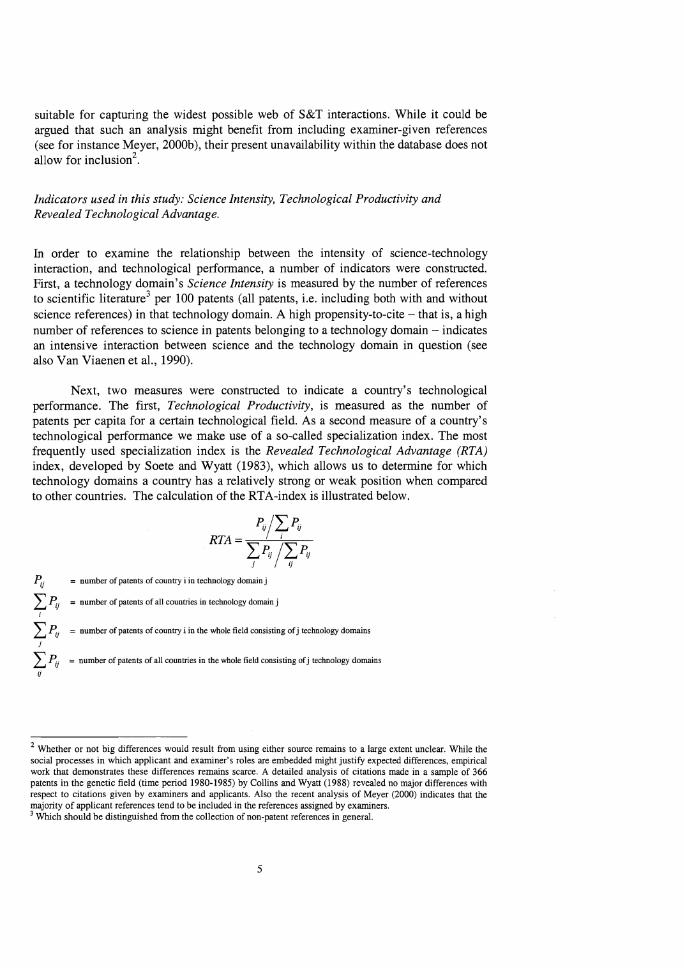
Next, two measures were constructed to indicate a country's technological performance. The first, Technological Productivity, is measured as the number of patents per capita for a certain technological field. As a second measure of a country's technological performance we make use of a so-called specialization index. The most frequently used specialization index is the Revealed Technological Advantage (RTA) index, developed by Soete and Wyatt (1983), which allows us to determine for which technology domains a country has a relatively strong or weak position when compared to other countries. The calculation of the RTA-index is illustrated below.
Pij/L~j RTA= i
~~j /~~j ~j = number of patents of country i in technology domain j
L ~j = number of patents of all countries in technology domain j
L ~j = number of patents of country i in the whole field consisting of j technology domains
L ~j = number of patents of all countries in the whole field consisting of j technology domains
ij
2 Whether or not big differences would result from using either source remains to a large extent unclear. While the social processes in which applicant and examiner's roles are embedded might justify expected differences, empirical work that demonstrates these differences remains scarce. A detailed analysis of citations made in a sample of 366 patents in the genetic field (time period 1980-1985) by Collins and Wyatt (1988) revealed no major differences with respect to citations given by examiners and applicants. Also the recent analysis of Meyer (2000) indicates that the majority of applicant references tend to be included in the references assigned by examiners. 3 Which should be distinguished from the collection of non-patent references in general.
5

The RTA-index consists of the ratio of the number of patents of a country in a particular technology domain, divided by the total number of patents in this domain, and a country's number of patents in the whole field, divided by the total number of patents in the field. In other words, the RTA-index compares the share in terms of patents of a particular country in a particular technology domain with the share of other countries in the same domain. If country X's share is higher than that of the other countries, we can conclude that country X has a "relative technological advantage" for that technology domain. The value of the RTA-index varies from 0 to +00. A value smaller than one reflects that country i has a relative disadvantage in category j. A value of one corresponds to a neutral position, whereas a value exceeding 1 indicates a relative advantage.
The data used in our study relates to the number of patents and the sciencetechnology interactions for eight European countries - Belgium (BE), the Netherlands (NL), Germany (DE), France (PR), the United Kingdom (UK), Denmark (DK), Sweden (SE) and Finland (PI). When patent statistics are used for international comparison, a suitable approach consists of looking at the relative penetration of a third country market, in order to avoid for any "home-advantage" effects (Collins and Wyatt, 1988; McCulloch, 1980). Since in our study we cover eight European countries, we decided to use USPTO data. Hence, the data used in this paper relate to granted USPTO-patents for the time period 1992-1996. Based on these methodological starting points, the data has been collected and analyzed. In the next section we will turn to the results of the analyses.
3. Results
According to Collins and Wyatt (1988), patents will cite substantial numbers of scientific papers when they are in a field that is relatively young, developing rapidly and with a strong scientific component. In addition, Van Viaenen et al. (1990) suggest that the analysis should be limited to fields characterized by a relatively high level of science-technology interaction. If not, we might end up with matrices for which the majority of cells contain only a low number of observations, resulting in unreliable findings. Hence, for the analysis in this paper, we limit ourselves to ten technology domains that can be labeled as relatively young, developing rapidly and with a high scientific orientation. The technology domains are defined according to the Nomenclature developed by the Fraunhofer Gesellschaft-Institute fUr Systemtechnik und Innovationsforschung (FhG-ISI, Germany), where each technology domain is defined by a number of IPC symbols (see Table 1). Table 1 shows the Average Science Intensity -that is, the number of science references per 100 patents - for each of the ten technology domains
Insert Table 1 - Average Science Intensity per Technology Domain
Science-Technology Intensity - A technological field specific phenomenon?
6
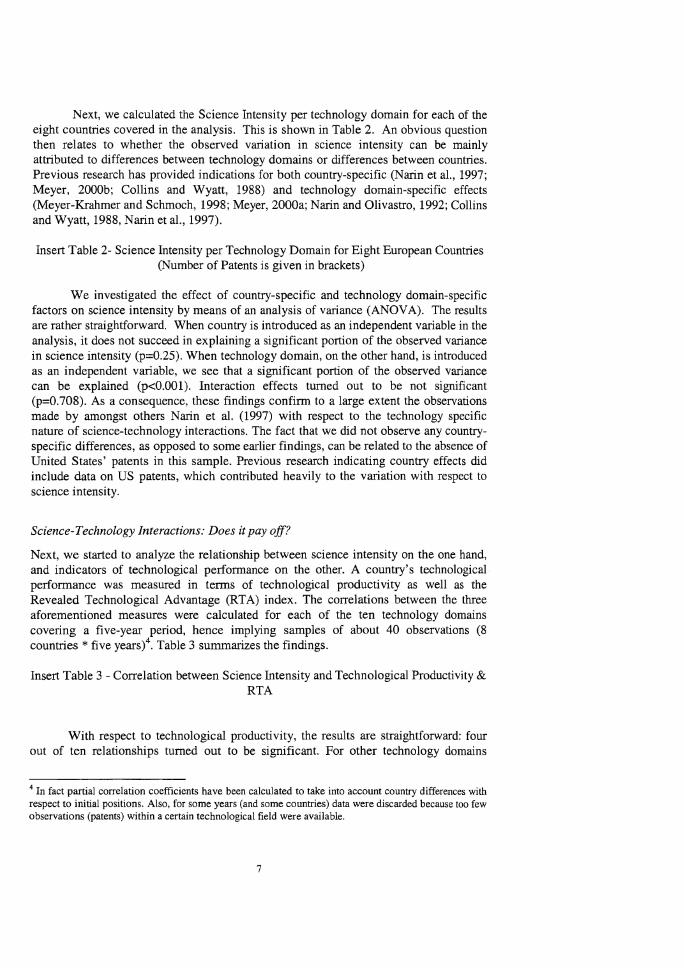
Next, we calculated the Science Intensity per technology domain for each of the eight countries covered in the analysis. This is shown in Table 2. An obvious question then relates to whether the observed variation in science intensity can be mainly attributed to differences between technology domains or differences between countries. Previous research has provided indications for both country-specific (Narin et al., 1997; Meyer, 2000b; Collins and Wyatt, 1988) and technology domain-specific effects (Meyer-Krahmer and Schmoch, 1998; Meyer, 2000a; Narin and Dlivastro, 1992; Collins and Wyatt, 1988, Narin et aI., 1997).
Insert Table 2- Science Intensity per Technology Domain for Eight European Countries (Number of Patents is given in brackets)
We investigated the effect of country-specific and technology domain-specific factors on science intensity by means of an analysis of variance (ANDV A). The results are rather straightforward. When country is introduced as an independent variable in the analysis, it does not succeed in explaining a significant portion of the observed variance in science intensity (p=0.25). When technology domain, on the other hand, is introduced as an independent variable, we see that a significant portion of the observed variance can be explained (p<O.OOI). Interaction effects turned out to be not significant (p=0.708). As a consequence, these findings confirm to a large extent the observations made by amongst others Narin et al. (1997) with respect to the technology specific nature of science-technology interactions. The fact that we did not observe any countryspecific differences, as opposed to some earlier findings, can be related to the absence of United States' patents in this sample. Previous research indicating country effects did include data on US patents, which contributed heavily to the variation with respect to science intensity.
Science-Technology Interactions: Does it payoff?
Next, we started to analyze the relationship between science intensity on the one hand, and indicators of technological performance on the other. A country's technological performance was measured in terms of technological productivity as well as the Revealed Technological Advantage (RTA) index. The correlations between the three aforementioned measures were calculated for each of the ten technology domains covering a five-year period, hence implying samples of about 40 observations (8 countries * five years)4. Table 3 summarizes the findings.
Insert Table 3 - Correlation between Science Intensity and Technological Productivity & RTA
With respect to technological productivity, the results are straightforward: four out of ten relationships turned out to be significant. For other technology domains
4 In fact partial correlation coefficients have been calculated to take into account country differences with respect to initial positions. Also, for some years (and some countries) data were discarded because too few observations (patents) within a certain technological field were available.
7
however, we did not find such a positive relationship; correlations tended to be zero or in a number of cases even negative (although not statistically significant). Examples include basic materials chemistry and telecommunications.
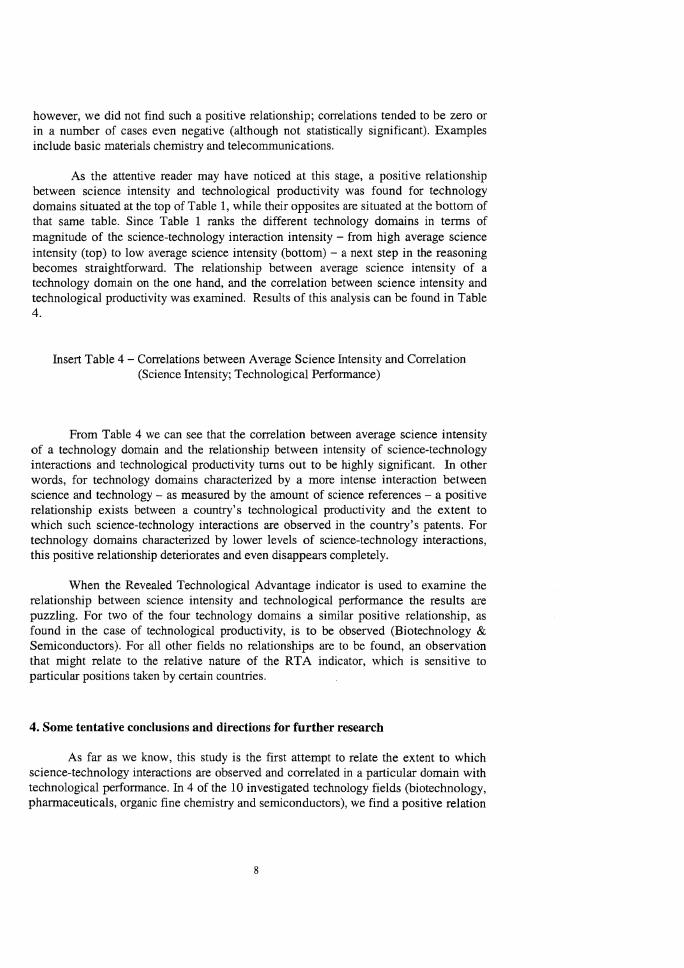
As the attentive reader may have noticed at this stage, a positive relationship between science intensity and technological productivity was found for technology domains situated at the top of Table 1, while their opposites are situated at the bottom of that same table. Since Table 1 ranks the different technology domains in terms of magnitude of the science-technology interaction intensity - from high average science intensity (top) to low average science intensity (bottom) - a next step in the reasoning becomes straightforward. The relationship between average science intensity of a technology domain on the one hand, and the correlation between science intensity and technological productivity was examined. Results of this analysis can be found in Table 4.
Insert Table 4 - Correlations between Average Science Intensity and Correlation (Science Intensity; Technological Performance)
From Table 4 we can see that the correlation between average science intensity of a technology domain and the relationship between intensity of science-technology interactions and technological productivity turns out to be highly significant. In other words, for technology domains characterized by a more intense interaction between science and technology - as measured by the amount of science references - a positive relationship exists between a country's technological productivity and the extent to which such science-technology interactions are observed in the country's patents. For technology domains characterized by lower levels of science-technology interactions, this positive relationship deteriorates and even disappears completely.
When the Revealed Technological Advantage indicator is used to examine the relationship between science intensity and technological performance the results are puzzling. For two of the four technology domains a similar positive relationship, as found in the case of technological productivity, is to be observed (Biotechnology & Semiconductors). For all other fields no relationships are to be found, an observation that might relate to the relative nature of the RTA indicator, which is sensitive to particular positions taken by certain countries.
4. Some tentative conclusions and directions for further research
As far as we know, this study is the first attempt to relate the extent to which science-technology interactions are observed and correlated in a particular domain with technological performance. In 4 of the 10 investigated technology fields (biotechnology, pharmaceuticals, organic fine chemistry and semiconductors), we find a positive relation
8
between the science linkage intensity of these fields and the technological productivity of the respective countries involved. This is not surprising in view of the increasing proximity and interwoveness between scientific and technological activity (efr. supra). Looking closer at these technologies in tenns of innovation trajectories, the impression occurs that they are of an emerging character and/or science intensive as from their origin (e.g. biotechnology). The work of Andersen (2001) indicates for (bio-) pharmaceuticals and biotechnology, 'take off' to be situated in 1992 (Andersen, 2001). If we compare this to a more mature technology like telecommunication, situated at the bottom of our tables, which has taken off in 1926 (Andersen, 2001) we may indeed suggest that a relationship with technology life cycles might exist for some fields. For more mature technology areas (or for technology areas that have developed relatively independently from the science frontier, more intense science interaction is not accompanied by shifts in productivity. These technologies seem to have arrived at a stage where (incremental) innovation and further development is largely based on the existing technological stock available. Hence, as the findings of our analysis point out, science-technology interactions do make a difference, but only for those domains where a certain 'critical' mass of scientific knowledge seems to be needed
The observation that a positive relationship appears for a number of technological domains can have serious implications on the level of science and innovation policy initiatives. Our findings suggest that for technology domains characterized by a high science-technology interaction, a policy framework might be developed that aims at fostering interaction between knowledge/science generating institutions (universities, research centers) and technology producers (companies), which in turn may translate in pay offs on the level of technological performance. This is far less the case for technology domains characterized by a much lesser degree of interaction with science. Here, no relationship between the degree of science-technology interaction and technological performance could be found. As such, a further corroboration of these results might lead to significant innovation policy recommendations, the nature of which will be highly domain specific.
Currently, the authors are engaged in several extensions of the analysis reported here. This should lead to a further validation of our findings. These extensions include enlarging the sample to EU-15 countries, the inclusion of non-European countries in the analysis, and examining the relationship that may exist between the average science intensity of a technology domain, on the one hand, and the technological maturity of the domain, on the other.
9

Table 1 - Average Science Intensity per Technology Domain
Domain
Biotechnology Pharmaceuticals Organic fine chemistry Semiconductors Agriculture & food chemistry Optics Analysis, measurement & control technology Information technology Basic materials chemistry
Telecommunications
IPC-codes
C07G; CI2M,N,P,Q,R,S A6lK C07C,D,F,H,J,K HOIL AOlH; A2lD; A23B,C,D,F,G,J,K,L; CI2C,F,G,H,J; C13D,F,J,K G02; G03B,C,D,F,G,H; HOIS GOlB,C,D,F,G,H,J,K,L,M,N, P,R,S,V, W; G04; G05B,D; G07; GOSB,G; G09B,C,D; G12 G06; GlIC; GIOL AOIN; COS; C07B; COSC; C09B,C,F, G,H,K; ClOB,C,F, G,H,J,K,L,M; CIIB,C,D GOSC; HOIP,Q; H03B,C,D,H,K,L,M; H04B,H,J,K,L,M, N-OOl, -007,-01l,Q
10
Average Science
Intensity
13S.43 S3.71 69.06 56.44 42.39
21.S9 21.S3
20.39 20.20
17.S9
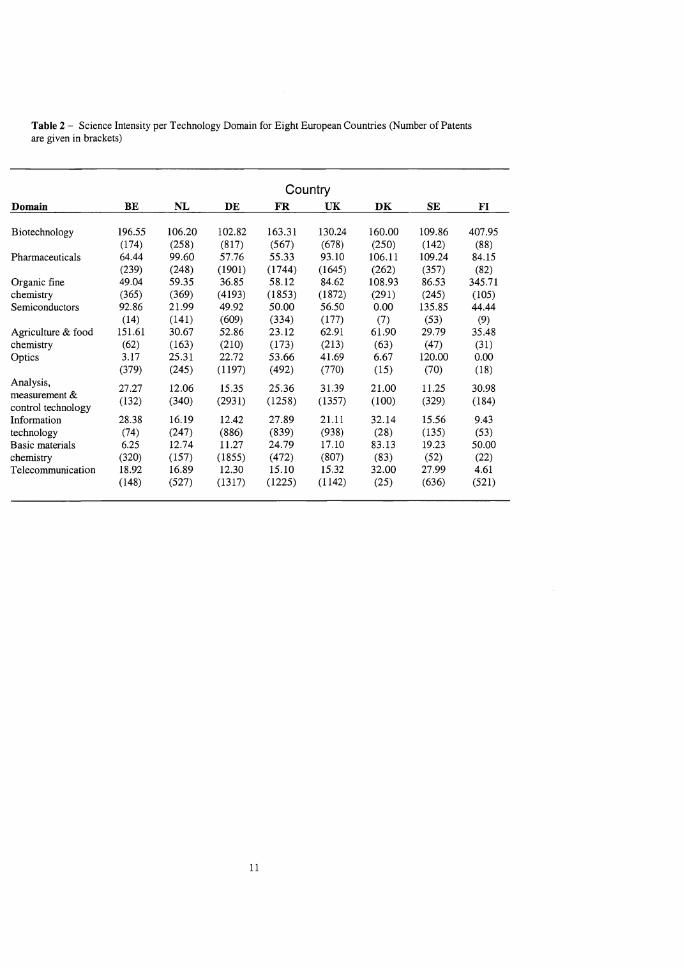
Table 2 - Science Intensity per Technology Domain for Eight European Countries (Number of Patents are given in brackets)
Country Domain BE NL DE FR UK DK SE FI
Biotechnology 196.55 106.20 102.82 163.31 130.24 160.00 109.86 407.95 (174) (258) (817) (567) (678) (250) (142) (88)
Pharmaceuticals 64.44 99.60 57.76 55.33 93.10 106.11 109.24 84.15 (239) (248) (1901) (1744) (1645) (262) (357) (82)
Organic fine 49.04 59.35 36.85 58.12 84.62 108.93 86.53 345.71 chemistry (365) (369) (4193) (1853) (1872) (291) (245) (105) Semiconductors 92.86 21.99 49.92 50.00 56.50 0.00 135.85 44.44
(14) (141) (609) (334) (177) (7) (53) (9) Agriculture & food 151.61 30.67 52.86 23.12 62.91 61.90 29.79 35.48 chemistry (62) (163) (210) (173) (213) (63) (47) (31) Optics 3.17 25.31 22.72 53.66 41.69 6.67 120.00 0.00
(379) (245) (1197) (492) (770) (15) (70) (18) Analysis,
27.27 12.06 15.35 25.36 31.39 21.00 11.25 30.98 measurement &
(132) (340) (2931) (1258) (1357) (100) (329) (184) control technology Information 28.38 16.19 12.42 27.89 21.11 32.14 15.56 9.43 technology (74) (247) (886) (839) (938) (28) (135) (53) Basic materials 6.25 12.74 11.27 24.79 17.10 83.13 19.23 50.00 chemistry (320) (157) (1855) (472) (807) (83) (52) (22) Telecommunication 18.92 16.89 12.30 15.10 15.32 32.00 27.99 4.61
(148) (527) (1317) (1225) (1142) (25) (636) (521)
11

Table 3 - Correlation between Science Intensity and Technological Productivity & RTA (Significance level between brackets) Restrict all to 2 digits
Technological Technological Average
Domain Performance : Performance: Science Productivity RTA Intensity
Biotechnology 0.52**** 0.29* 138.43
Pharmaceuticals 0.41 *** -0.02 83.71
Organic fine chemistry 0.35** 0.10 69.06
Semiconductors 0.43*** 0.38* 56.44
Agriculture & food 0.15 -0.13 42.39 chemistry Optics 0.02 0.08 21.89
Analysis, measurement & -0.15 -0.22 21.83 control technology Information technology -0.13 -0.10 20.39
Basic materials chemistry 0.17 0.07 20.20
Telecommunications -0.01 0.19 17.89
****Correlation significant at the 0,0011evel. *** Correlation significant at the 0,01 level. ** Correlation significant at the 0,05 level. *Correlation significant at the 0,10 level.
12
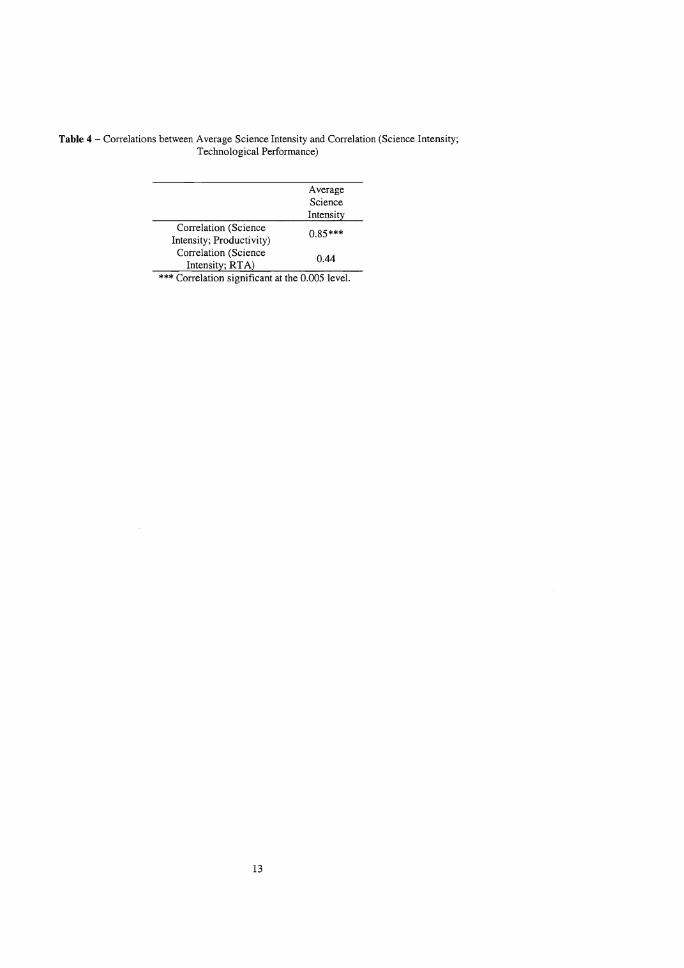
Table 4 - Correlations between Average Science Intensity and Correlation (Science Intensity; Technological Performance)
Correlation (Science Intensity; Productivity) Correlation (Science
Intensity; RT A)
Average Science Intensity
0.85***
0.44
*** Correlation significant at the 0.005 level.
13

References
Andersen, B. (2001) "Technological Change and the evolution of corporate innovation", Edward Elgar Publishing Collins P. and Wyatt S. (1988) "Citations in patents to the basic research literature", Research Policy, 17, 65-74. Cohen, W.M., and Levinthal, D.A. (1990), "Absorptive capacity: A new perspective on learning and innovation",
Administrative Science Quarterly, 35, pp. 128-152. De Solla Price, D. (1965) "Is technology historically independent of Science? A study in statistical historiography",
Journal of Technology and Culture, 6, 553-568. Etzkowitz, H. and Leydesdorff, L. (1997). "Introduction to special issue on science policy dimensions of the Triple
Helix ofuniversity-industry-governrnent relations", Science and Public Policy~ Vol. 24, No. 1,2-5. Etzkowitz, H. and Leydesdorff, L. (1998). "The Endless Transition: A 'Triple Helix' of University-Industry
Government Relations", Minerva, No. 36, 203-208. Etzkowitz H. & Leydesdorff L. (2000) "The dynamics of innovation: from National Systems and 'Mode 2' to a Triple
Helix ofuniversity-industry-governrnent relations", Research Policy, 29, 109-123. Grupp H. and Schmoch U. (1992) "Perception of Scientification of Innovation as Measured by Referencing between
Patents and Papers", In: H. GRUPP (ed.) Dynamics of Science-Based Innovations, Springer Publishers, BerlinlHeidelberg, pp.73-128.
Leydesdorff, L. and Etzkowitz, H. (1996). "Emergence of a Triple Helix of University-Industry-Government Relations", Science and Public Policy Vol. 23, No.5, October 1996, pp. 279-286.
Leydesdorff, L. and Etzkowitz, H. (1998). "Triple Helix of innovation: introduction", Science and Public Policy, Vol. 25, No.6, 358-364.
Meyer M. (2000a) "Patent citations in a novel field of technology - What can they tell about interactions between emerging communities of science and technology", Scientometrics, 48, 2, 151-178.
Meyer M. (2000b) "Does science push technology? Patents citing scientific literature", Research Policy, 29, 409-434. Meyer-Kraluner, F., Schmoch, U. (1998). "Science-based technologies: university-industry interactions in four
fields", Research Policy, 27, 835-851. Narin F. & Noma E. (1985) Is technology becoming science? Scientometrics, 7, 369-381. Narin F. & Olivastro D. (1992) "Status report: Linkage between technology and science", Research Policy, 21, 237-
249. Narin F. & Olivastro D. (1998) "Linkage between patents and papers: an interim EPOIUS comparison",
Scientometrics, 41, pp.51-59. Narin F., Hamilton K. & Olivastro D. (1997) '''The increasing linkage between US technology and public science",
Research Policy, 317-330. OECD (1994), '''The Measurement of scientific and technological activities: Using Patent Data as Science and
Technology Indicators", Patent Manual 1994, Paris. Porter M. (1995) "The Competitive Advantage of Nations", New York, The Free Press. Rip A. (1992) "Science and technology as dancing partners". In Kroes A. & Bakker M. (eds.) Technological
Development and Science in the Industrial Age. Kluwer Publications. Scmoch U. (1993) "Tracing the knowledge transfer from science to technology as reflected in patent indicators",
Scientometrics, 26, I, 193-211. Schmoch, U. (1997), "Indicators and the relations between Science and Technology", Scientometrics, No 38, pp.
103-116. Soete, L.G.,Wyatt, S.M.E. (1983). "The Use of Foreign Patenting as an Internationally Comparable Science and
Technology Output Indicator", Scientometrics, Vol.5, No.1, pp.31-54. Van Viaenen, B., Moed H. & Van Raan A. (1990) "An exploration of the science base of recent technology",
Research Policy, 19, 61-81. Verbeek, A., Debackere, K., Luwel, M., Andries, P., Zimmermann, E., Deleus, F. (2002a). "Linking Science to
technology: Using bibliographic references in patents to build linkage schemes", Scientometrics, Vol. 54, No. 1-2. Verbeek, A., 1. Callaert, P. Andries, K. Debackere, M. Luwel, R. Veugelers (2002b), "Science and Technology
Interplay - A Modelling approach on a regional level", Final Report to the EC DG Research, Brussels (also forthCOming in the EC Indicators report 2002)
14