Potential of Transforming Sodalite from Synthesis Kaolin with ...
18
https://biointerfaceresearch.com/ 7376 Article Volume 12, Issue 6, 2022, 7376 - 7393 https://doi.org/10.33263/BRIAC126.73767393 Potential of Transforming Sodalite from Synthesis Kaolin with a Mild Condition of the Hydrothermal Method Norsuhailizah Sazali 1 , Zawati Harun 1,* , Tijjani Abdullahi 1 , Faiz Hafeez Azhar 1 , Azlinnorazia Ahmad 1 , Nurul Izwanie Rasli 2 , Norazlianie Sazali 3 1 Advanced Materials and Manufacturing Centre (AMMC), Faculty of Mechanical and Manufacturing Engineering, Universiti Tun Hussein Onn Malaysia, 86400, Parit Raja Batu Pahat, Johor, Malaysia; [email protected] (N.S); [email protected] (Z.H); [email protected] (A.T); [email protected] (F.H.A); [email protected] (A.A); 2 Faculty of Applied Sciences and Technology, Universiti Tun Hussein Onn Malaysia, Pagoh Education Hub, 84600, Muar, Johor, Malaysia; [email protected] (W.S.); 3 College of Engineering, Universiti Malaysia Pahang, 26300 Gambang, Pahang, Malaysia; [email protected] (N.S.); * Correspondence: [email protected] (Z.H.); Scopus Author ID 57192717612 Received: 2.10.2021; Revised: 5.11.2021; Accepted: 8.11.2021; Published: 24.11.2021 Abstract: The hydrothermal synthesis method is one of the successful methods for transforming kaolin into sodalite with various parameters considered. The variation of alkalinity source of 2-3 Molarity of sodium hydroxide and crystallization time (12-16 hours) was considered an important parameter that influences the formation of sodalite. It is reported in this research that the process of synthesizing sodalite to transform into an amorphous stage (Metakaolinization phase) began with beneficiation of kaolin to remove the impurities and calcination by 650 0 C for four hours. The synthesis was done through an aging process (40 0 C, 24 hours), and the crystallization temperature was 100 0 C. The kaolin was characterized by XRD, FESEM, FTIR, PSA, TGA, followed with metakaolin by XRD, FESEM, FTIR, and the end-product by XRD, FESEM, FTIR, and PSA. The crystallinity percentage of sodalite slightly increased by increasing the molarity and crystallization time, but quartz remains in the end-product. Keywords: kaolin; metakaolin; sodalite; hydrothermal method; amorphous © 2021 by the authors. This article is an open-access article distributed under the terms and conditions of the Creative Commons Attribution (CC BY) license (https://creativecommons.org/licenses/by/4.0/). 1. Introduction Sodalite [SOD] can be identified as an idealized zeolite framework [1]. Sodalite is a microporous crystalline tectosilicate with a general composition of Na 8 [AlSiO 4 ] 6 [x] 2 , where x is the guest anion monovalent [2]. Sodalite (Na8[(Al6Si6O24)] Cl2) has a three-dimensional structure of a "cage"[3] that can naturally contain halogen salts. Sodalite can be natural or synthetic, much like zeolite. To explore their crystal chemistry and properties, synthetic counterparts are manufactured on an industrial scale for specific uses or prepared in a laboratory [1,2]. For purposes of definition, another part of the zeolite community excludes sodalites from the class of zeolite-type structures. SOD has a framework density of 16.7 T/1000 Å 3 and is thus an open framework since it comprises only 4- and 6-rings. The zeolite group usually finds zeolites only open frameworks with an n-rings aperture of n > 6 [4] as a "semi- condensed" tetrahedral framework structure. Despite the classification problem, sodalite [SOD] belongs to a class of crystalline microporous tetrahedral network structures that span a 3D framework enclosing void of at least 2.5Å diameters [5]. From Linus Pauling's seminal
-
Upload
khangminh22 -
Category
Documents
-
view
0 -
download
0
Transcript of Potential of Transforming Sodalite from Synthesis Kaolin with ...
https://biointerfaceresearch.com/ 7376
Article
Volume 12, Issue 6, 2022, 7376 - 7393
https://doi.org/10.33263/BRIAC126.73767393
Potential of Transforming Sodalite from Synthesis Kaolin
with a Mild Condition of the Hydrothermal Method
Norsuhailizah Sazali 1 , Zawati Harun 1,* , Tijjani Abdullahi 1 , Faiz Hafeez Azhar 1, Azlinnorazia
Ahmad 1, Nurul Izwanie Rasli 2, Norazlianie Sazali 3
1 Advanced Materials and Manufacturing Centre (AMMC), Faculty of Mechanical and Manufacturing Engineering,
Universiti Tun Hussein Onn Malaysia, 86400, Parit Raja Batu Pahat, Johor, Malaysia; [email protected] (N.S);
[email protected] (Z.H); [email protected] (A.T); [email protected] (F.H.A); [email protected]
(A.A); 2 Faculty of Applied Sciences and Technology, Universiti Tun Hussein Onn Malaysia, Pagoh Education Hub, 84600, Muar,
Johor, Malaysia; [email protected] (W.S.); 3 College of Engineering, Universiti Malaysia Pahang, 26300 Gambang, Pahang, Malaysia; [email protected] (N.S.);
* Correspondence: [email protected] (Z.H.);
Scopus Author ID 57192717612
Received: 2.10.2021; Revised: 5.11.2021; Accepted: 8.11.2021; Published: 24.11.2021
Abstract: The hydrothermal synthesis method is one of the successful methods for transforming kaolin
into sodalite with various parameters considered. The variation of alkalinity source of 2-3 Molarity of
sodium hydroxide and crystallization time (12-16 hours) was considered an important parameter that
influences the formation of sodalite. It is reported in this research that the process of synthesizing
sodalite to transform into an amorphous stage (Metakaolinization phase) began with beneficiation of
kaolin to remove the impurities and calcination by 6500C for four hours. The synthesis was done through
an aging process (400C, 24 hours), and the crystallization temperature was 1000C. The kaolin was
characterized by XRD, FESEM, FTIR, PSA, TGA, followed with metakaolin by XRD, FESEM, FTIR,
and the end-product by XRD, FESEM, FTIR, and PSA. The crystallinity percentage of sodalite slightly
increased by increasing the molarity and crystallization time, but quartz remains in the end-product.
Keywords: kaolin; metakaolin; sodalite; hydrothermal method; amorphous
© 2021 by the authors. This article is an open-access article distributed under the terms and conditions of the Creative
Commons Attribution (CC BY) license (https://creativecommons.org/licenses/by/4.0/).
1. Introduction
Sodalite [SOD] can be identified as an idealized zeolite framework [1]. Sodalite is a
microporous crystalline tectosilicate with a general composition of Na8[AlSiO4]6[x]2, where x
is the guest anion monovalent [2]. Sodalite (Na8[(Al6Si6O24)] Cl2) has a three-dimensional
structure of a "cage"[3] that can naturally contain halogen salts. Sodalite can be natural or
synthetic, much like zeolite. To explore their crystal chemistry and properties, synthetic
counterparts are manufactured on an industrial scale for specific uses or prepared in a
laboratory [1,2]. For purposes of definition, another part of the zeolite community excludes
sodalites from the class of zeolite-type structures. SOD has a framework density of 16.7 T/1000
Å3 and is thus an open framework since it comprises only 4- and 6-rings. The zeolite group
usually finds zeolites only open frameworks with an n-rings aperture of n > 6 [4] as a "semi-
condensed" tetrahedral framework structure. Despite the classification problem, sodalite
[SOD] belongs to a class of crystalline microporous tetrahedral network structures that span a
3D framework enclosing void of at least 2.5Å diameters [5]. From Linus Pauling's seminal
https://doi.org/10.33263/BRIAC126.73767393
https://biointerfaceresearch.com/ 7377
work on the X-ray structure determination of the mineral sodalite [6], the structural details of
sodalite have been known for about 75 years.
To produce a range of materials with specific and industrially attractive properties,
sodalites can be modified. Hydrosodalite, Na6[AlSiO4]6.8H2O, [7,8] with anion at the center of
the cage substituted by water molecules is a sodalite alteration. Therefore, only three sodium
ions per cage are required to counterbalance the charge on the aluminosilicate structure. The
cubic structure of hydrosodalite is a =8.9 Å. The structure and properties of various cation-
exchanged hydrosodalites (Li, K, Mg, Ca) prepared with the appropriate metal nitrate by ion
exchange of Na6[AlSiO4]6.8H2O [9] have been investigated. SOD has a cubic structure
containing only β-cages consisting of eight alternating AlO4 and SiO4 tetrahedra 6-membered
rings and six 4-membered rings; the free dimension of the inscribed β-cage sphere is 6.6 Å,
and access to the cage is ~2.2 Å [10] through the 6-membered ring window (channel).
For its potential application, sodalite has attracted considerable attention, such as
optical material [11], waste management [12], hydrogen separation [13], and catalyst support
[14]. Natural sodalite mainly holds chloride anions in the cages, but they can be substituted
with other minerals in the sodalite group representing end-member compositions, such as
sulfate, sulfide, hydroxide, trisulfur, etc. Some natural mineral materials have been used for
sodalite synthesis. For example, by the solid transformation of Al2O3 pillared clay in the
alkaline solution, nano-sized sodalite crystal was obtained [15-16], perlite [17] was
transformed by the alkaline hydrothermal method into a micro-sized sodalite crystal or sphere.
Among other sources of sodalite natural mineral material, kaolin material containing
predominantly kaolinite appears to be a more promising substance for sodalite synthesis
because it consists of high Si, Al as the key sources of zeolite synthesis; is cheap and also easy
to be obtained in Malaysia.
Kaolinite has its chemical formula, Al2Si2O5(OH)4. Other minerals can exist in
kaolinite, such as quartz, illite, mica, feldspar, and other impurities [18]. The bonded SiO4
tetrahedral sheet and bonded Al(OH)4 octahedral sheet construct the structure of kaolinite,
which means that the octahedral and tetrahedral sheets are in repeated stacking orders [19].
Kaolinite has a crystal tri-clinic system and a layer of 7.13 Å units. The bonding is weak
between the units, but the bonding is strong between the repeating units. Kaolin clay is very
easy to spread in [20] since it has a low heat conductivity hydrophilic feature and a pH scale is
between t 4-9. When undergoing the process of metakaolinization, the features of kaolin cause
it to be very reactive. Metakaolinazation is a mechanism where the hydroxyl group is lost, and
a chemical transition occurs while the kaolin is heated at a certain temperature level.
Calcination rearranges the octahedral layer to the tetrahedral layer [21]. The temperature and
time of calcination differ, and this step makes the layer of arrangement very unstable. A
temperature of between 550-600 ° C is normally selected, and the process becomes more stable
before 900 ° C, but at 1050 ° C [22], the mullite process will occur. The factors for checking
the suitability of kaolin to be transformed into zeolite [22] are the location and geological
phenomena of kaolin. Usually, the hydrothermal technique is used for sodalite, hydrosodalite,
and zeolite synthesis.
Hydrothermal synthesis, which is the mild critical reaction and the supercritical
reaction, can be divided into two categories. The temperature from 100 ° C to 240 ° C is used
for the mild critical reaction, while the supercritical reaction can exceed 1000 ° C. Zeolitic
products are typically synthesized by alkali activation of an aluminosilicate, and the phase of
the compound is highly influenced by the processing conditions used. The following processing
https://doi.org/10.33263/BRIAC126.73767393
https://biointerfaceresearch.com/ 7378
conditions have been shown to support hydrosodalite over the formation of other zeolitic
phases: synthesis time between 24 and 72 h [23]; solid: liquid ratios > 5 [24]; NaOH solution
concentrations > 3 M and synthesis temperatures between 150 and 200 ° C [25]. Hydrothermal
synthesis is by far the most commonly used method [25], while more complex methods of two-
step synthesis involving alkaline pre-fusion at elevated temperatures have also been used [26].
It is also normal for calcining kaolinite to form metakaolin by heating above 600 ° C in order
to improve reactivity prior to synthesis [27]. Synthesis routes typically use an excess amount
of NaOH solution, even for hydrosodalite that prefers low solid: liquid ratios [23], which makes
them incompatible for extrusion processing. This technique is often used for ceramic
production. Given that both calcination and mid-temperature synthesis involve an additional
heating step, a low-temperature synthesis route without thermal pre-treatment could be
desirable for energy reduction and practicality. Previously, the proportion of stages of the
kaolinite reaction with sodium hydroxide was investigated in relation to the nature of the
kaolinite used [28] or the addition of different volumes of activating solution at the given pH
[29]. Although proof of concept for non-hydrothermal synthesis has been shown by Heller-
Kallai and Lapides[30], a systematic understanding of the reaction has not previously been
established for these conditions. A lower temperature and atmospheric synthesis path will make
processing cheaper and consume less energy.
In this study, sodalite was synthesized from low-grade Johor kaolin with a Molarity of
NaOH, 2-3, and 12-16 hours of crystallization time at 100°C temperature. They were
characterized from kaolin, metakaolin, and sodalite using XRD, FESEM, FTIR, TGA to see
the transformation from kaolin to sodalite.
2. Materials and Methods
2.1. Material.
At Jemaluang, Mersing, Johor, a Johor kaolin sample was obtained. The raw kaolin
collection site was the venue where the mining operations took place. The raw material of
kaolin needs a pre-treatment process because of the greater lumpy size condition. The lump-
size kaolin must be extracted by crushing and grinding. A ball milling machine is used for
crushing the lump-size kaolin during this process. The beneficiation process will further treat
the crushed kaolin. The primary purpose of the raw material undergoing beneficiation was to
increase and improve kaolin's physical and chemical properties. 3 kg of crushed kaolin was
soaked in a 15-liter container which contained 10 liters of distilled water for one week. The
soaked kaolin was regularly mixed. The positive result of the gain was that, after stirring, the
kaolin would settle. The floating soil was decanted along with the supernatant, and all solid
particles were collected by handpicking during decantation. The continuation of this approach
has ensured that no solid layer at the bottom of the container existed. The fine particles
suspended in water were dried for one day at room temperature and then sifted using a 63-
micron mesh. The sieve particles were then kept for 12 hours in a drying oven. The kaolin raw
material collected from the recipient phase was subsequently analyzed and distinguished by
physical and chemical components. The Qre company was responsible for providing the
sodium hydroxide.
https://doi.org/10.33263/BRIAC126.73767393
https://biointerfaceresearch.com/ 7379
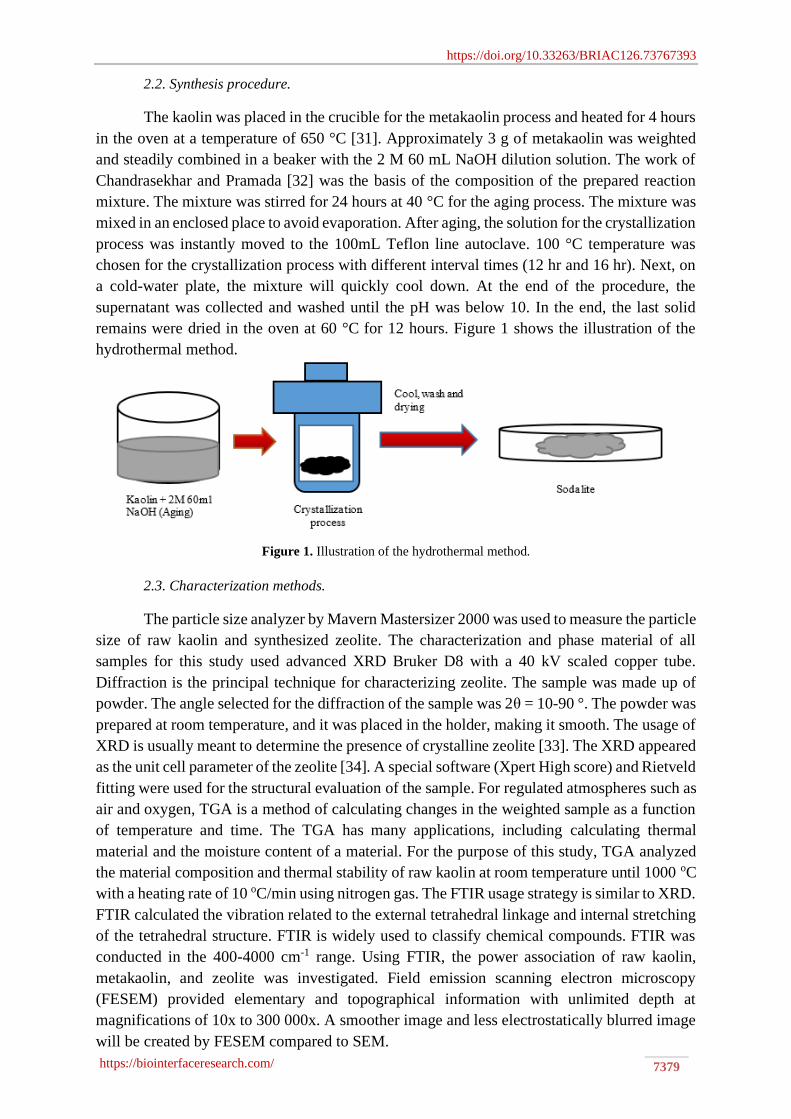
2.2. Synthesis procedure.
The kaolin was placed in the crucible for the metakaolin process and heated for 4 hours
in the oven at a temperature of 650 °C [31]. Approximately 3 g of metakaolin was weighted
and steadily combined in a beaker with the 2 M 60 mL NaOH dilution solution. The work of
Chandrasekhar and Pramada [32] was the basis of the composition of the prepared reaction
mixture. The mixture was stirred for 24 hours at 40 °C for the aging process. The mixture was
mixed in an enclosed place to avoid evaporation. After aging, the solution for the crystallization
process was instantly moved to the 100mL Teflon line autoclave. 100 °C temperature was
chosen for the crystallization process with different interval times (12 hr and 16 hr). Next, on
a cold-water plate, the mixture will quickly cool down. At the end of the procedure, the
supernatant was collected and washed until the pH was below 10. In the end, the last solid
remains were dried in the oven at 60 °C for 12 hours. Figure 1 shows the illustration of the
hydrothermal method.
Figure 1. Illustration of the hydrothermal method.
2.3. Characterization methods.
The particle size analyzer by Mavern Mastersizer 2000 was used to measure the particle
size of raw kaolin and synthesized zeolite. The characterization and phase material of all
samples for this study used advanced XRD Bruker D8 with a 40 kV scaled copper tube.
Diffraction is the principal technique for characterizing zeolite. The sample was made up of
powder. The angle selected for the diffraction of the sample was 2θ = 10-90 °. The powder was
prepared at room temperature, and it was placed in the holder, making it smooth. The usage of
XRD is usually meant to determine the presence of crystalline zeolite [33]. The XRD appeared
as the unit cell parameter of the zeolite [34]. A special software (Xpert High score) and Rietveld
fitting were used for the structural evaluation of the sample. For regulated atmospheres such as
air and oxygen, TGA is a method of calculating changes in the weighted sample as a function
of temperature and time. The TGA has many applications, including calculating thermal
material and the moisture content of a material. For the purpose of this study, TGA analyzed
the material composition and thermal stability of raw kaolin at room temperature until 1000 oC
with a heating rate of 10 oC/min using nitrogen gas. The FTIR usage strategy is similar to XRD.
FTIR calculated the vibration related to the external tetrahedral linkage and internal stretching
of the tetrahedral structure. FTIR is widely used to classify chemical compounds. FTIR was
conducted in the 400-4000 cm-1 range. Using FTIR, the power association of raw kaolin,
metakaolin, and zeolite was investigated. Field emission scanning electron microscopy
(FESEM) provided elementary and topographical information with unlimited depth at
magnifications of 10x to 300 000x. A smoother image and less electrostatically blurred image
will be created by FESEM compared to SEM.
https://doi.org/10.33263/BRIAC126.73767393
https://biointerfaceresearch.com/ 7380
3. Results and Discussion
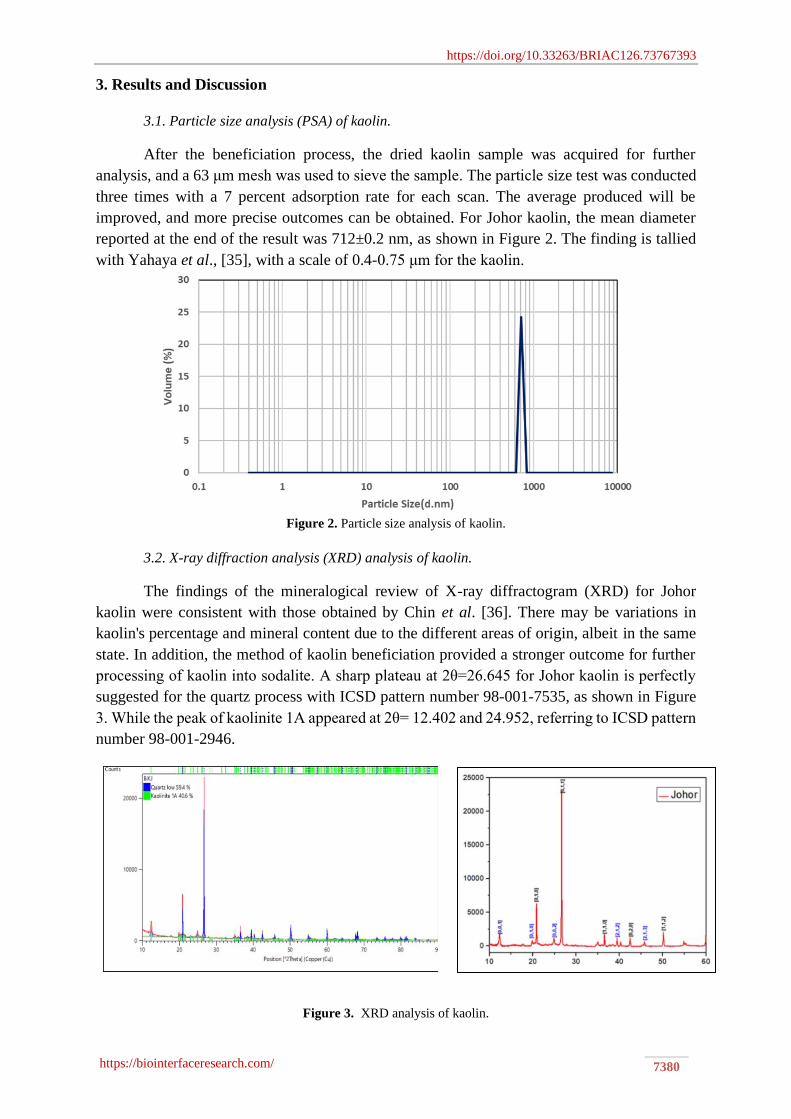
3.1. Particle size analysis (PSA) of kaolin.
After the beneficiation process, the dried kaolin sample was acquired for further
analysis, and a 63 μm mesh was used to sieve the sample. The particle size test was conducted
three times with a 7 percent adsorption rate for each scan. The average produced will be
improved, and more precise outcomes can be obtained. For Johor kaolin, the mean diameter
reported at the end of the result was 712±0.2 nm, as shown in Figure 2. The finding is tallied
with Yahaya et al., [35], with a scale of 0.4-0.75 μm for the kaolin.
Figure 2. Particle size analysis of kaolin.
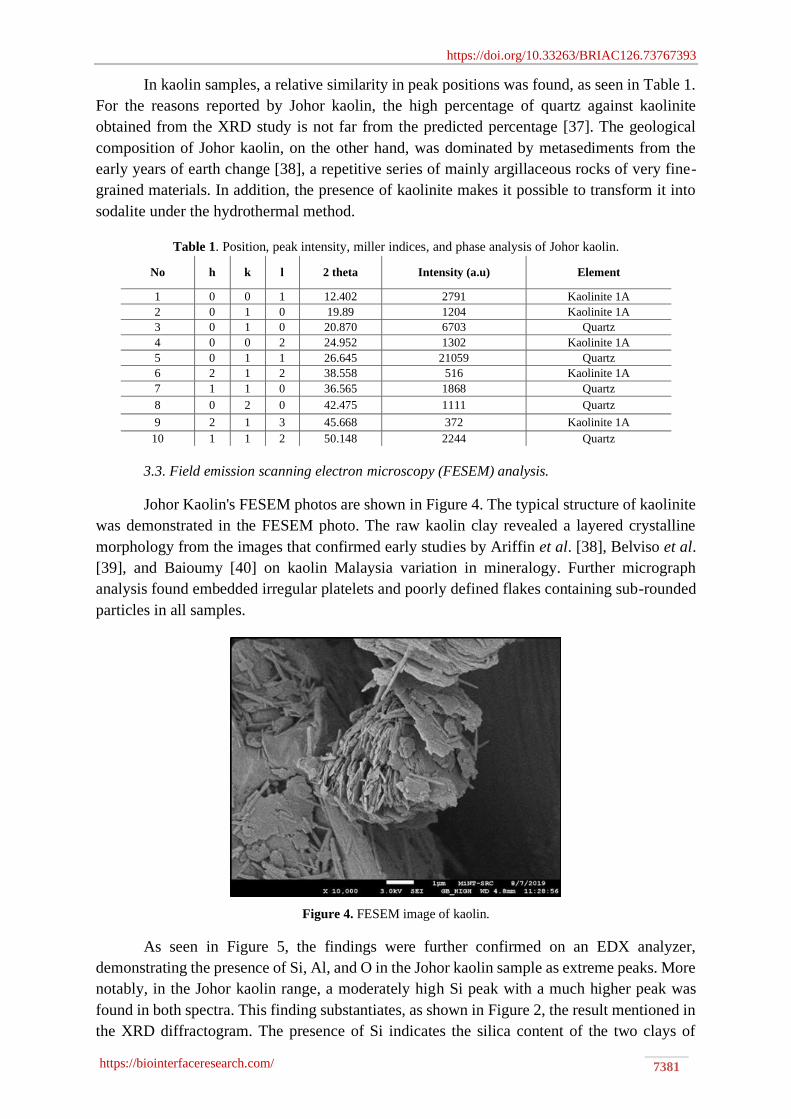
3.2. X-ray diffraction analysis (XRD) analysis of kaolin.
The findings of the mineralogical review of X-ray diffractogram (XRD) for Johor
kaolin were consistent with those obtained by Chin et al. [36]. There may be variations in
kaolin's percentage and mineral content due to the different areas of origin, albeit in the same
state. In addition, the method of kaolin beneficiation provided a stronger outcome for further
processing of kaolin into sodalite. A sharp plateau at 2θ=26.645 for Johor kaolin is perfectly
suggested for the quartz process with ICSD pattern number 98-001-7535, as shown in Figure
3. While the peak of kaolinite 1A appeared at 2θ= 12.402 and 24.952, referring to ICSD pattern
number 98-001-2946.
Figure 3. XRD analysis of kaolin.
https://doi.org/10.33263/BRIAC126.73767393
https://biointerfaceresearch.com/ 7381
In kaolin samples, a relative similarity in peak positions was found, as seen in Table 1.
For the reasons reported by Johor kaolin, the high percentage of quartz against kaolinite
obtained from the XRD study is not far from the predicted percentage [37]. The geological
composition of Johor kaolin, on the other hand, was dominated by metasediments from the
early years of earth change [38], a repetitive series of mainly argillaceous rocks of very fine-
grained materials. In addition, the presence of kaolinite makes it possible to transform it into
sodalite under the hydrothermal method.
Table 1. Position, peak intensity, miller indices, and phase analysis of Johor kaolin.
No h k l 2 theta Intensity (a.u) Element
1 0 0 1 12.402 2791 Kaolinite 1A
2 0 1 0 19.89 1204 Kaolinite 1A
3 0 1 0 20.870 6703 Quartz
4 0 0 2 24.952 1302 Kaolinite 1A
5 0 1 1 26.645 21059 Quartz
6 2 1 2 38.558 516 Kaolinite 1A
7 1 1 0 36.565 1868 Quartz
8 0 2 0 42.475 1111 Quartz
9 2 1 3 45.668 372 Kaolinite 1A
10 1 1 2 50.148 2244 Quartz
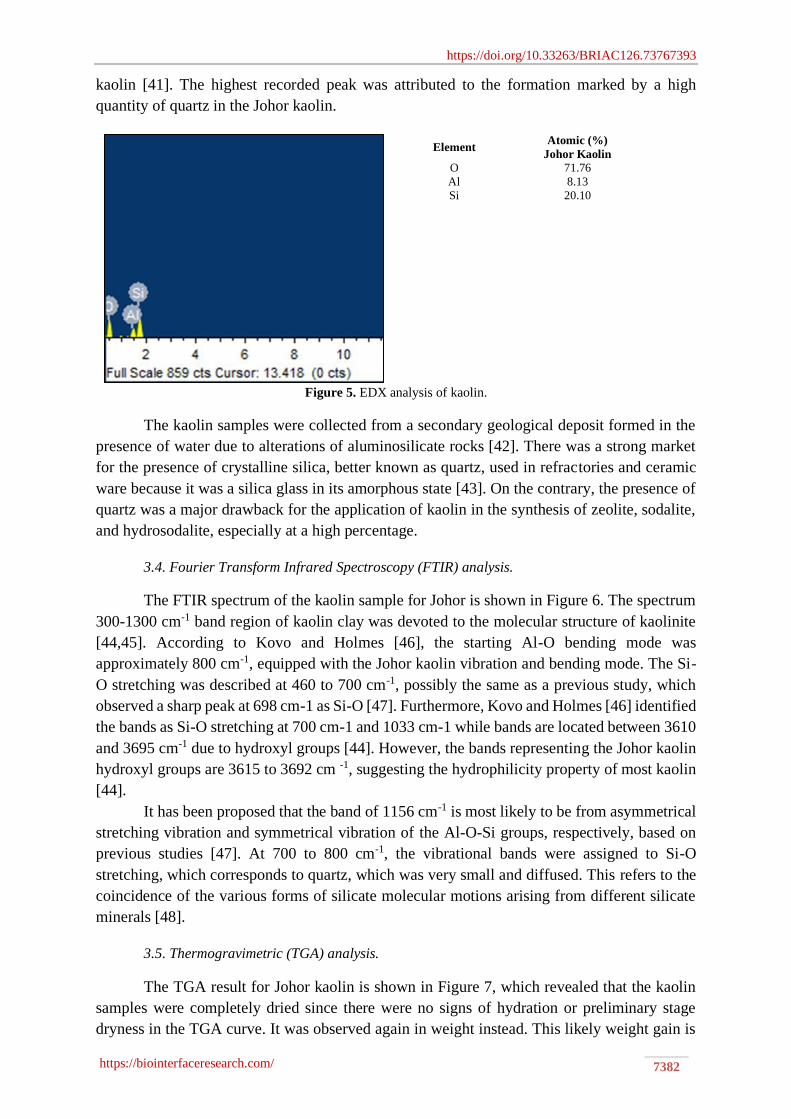
3.3. Field emission scanning electron microscopy (FESEM) analysis.
Johor Kaolin's FESEM photos are shown in Figure 4. The typical structure of kaolinite
was demonstrated in the FESEM photo. The raw kaolin clay revealed a layered crystalline
morphology from the images that confirmed early studies by Ariffin et al. [38], Belviso et al.
[39], and Baioumy [40] on kaolin Malaysia variation in mineralogy. Further micrograph
analysis found embedded irregular platelets and poorly defined flakes containing sub-rounded
particles in all samples.
Figure 4. FESEM image of kaolin.
As seen in Figure 5, the findings were further confirmed on an EDX analyzer,
demonstrating the presence of Si, Al, and O in the Johor kaolin sample as extreme peaks. More
notably, in the Johor kaolin range, a moderately high Si peak with a much higher peak was
found in both spectra. This finding substantiates, as shown in Figure 2, the result mentioned in
the XRD diffractogram. The presence of Si indicates the silica content of the two clays of
https://doi.org/10.33263/BRIAC126.73767393
https://biointerfaceresearch.com/ 7382
kaolin [41]. The highest recorded peak was attributed to the formation marked by a high
quantity of quartz in the Johor kaolin.
Element Atomic (%)
Johor Kaolin
O 71.76
Al 8.13
Si 20.10
Figure 5. EDX analysis of kaolin.
The kaolin samples were collected from a secondary geological deposit formed in the
presence of water due to alterations of aluminosilicate rocks [42]. There was a strong market
for the presence of crystalline silica, better known as quartz, used in refractories and ceramic
ware because it was a silica glass in its amorphous state [43]. On the contrary, the presence of
quartz was a major drawback for the application of kaolin in the synthesis of zeolite, sodalite,
and hydrosodalite, especially at a high percentage.
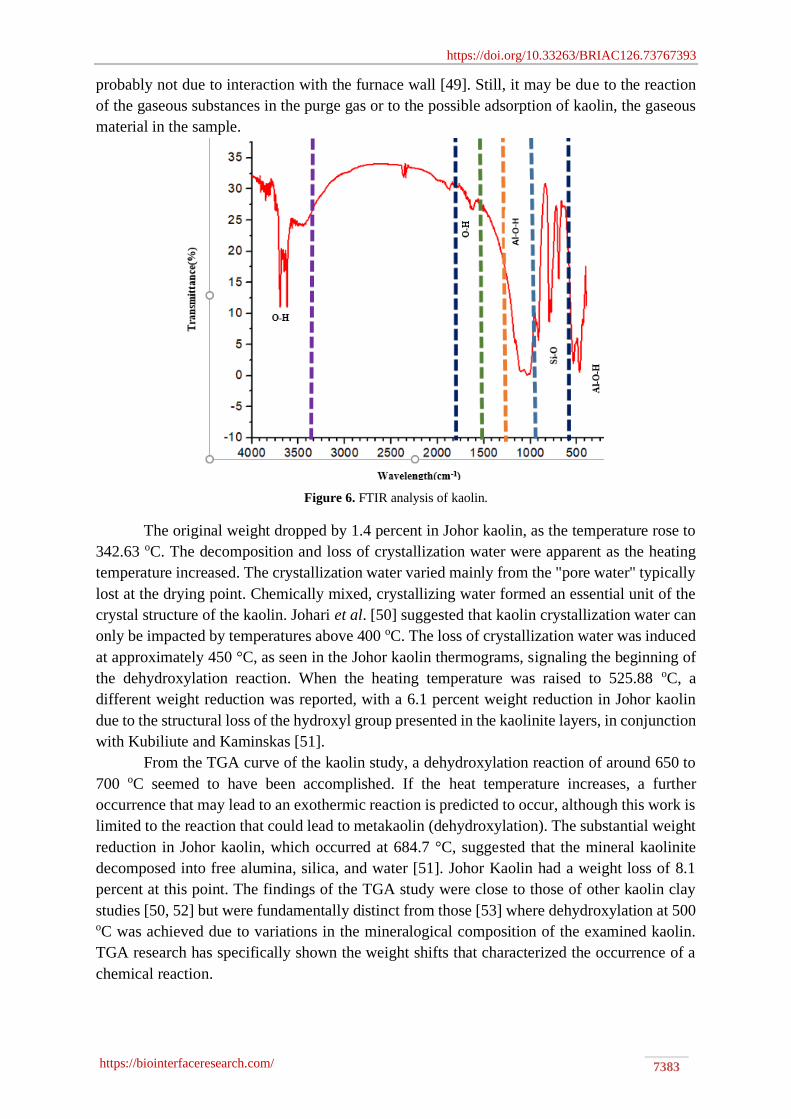
3.4. Fourier Transform Infrared Spectroscopy (FTIR) analysis.
The FTIR spectrum of the kaolin sample for Johor is shown in Figure 6. The spectrum
300-1300 cm-1 band region of kaolin clay was devoted to the molecular structure of kaolinite
[44,45]. According to Kovo and Holmes [46], the starting Al-O bending mode was
approximately 800 cm-1, equipped with the Johor kaolin vibration and bending mode. The Si-
O stretching was described at 460 to 700 cm-1, possibly the same as a previous study, which
observed a sharp peak at 698 cm-1 as Si-O [47]. Furthermore, Kovo and Holmes [46] identified
the bands as Si-O stretching at 700 cm-1 and 1033 cm-1 while bands are located between 3610
and 3695 cm-1 due to hydroxyl groups [44]. However, the bands representing the Johor kaolin
hydroxyl groups are 3615 to 3692 cm -1, suggesting the hydrophilicity property of most kaolin
[44].
It has been proposed that the band of 1156 cm-1 is most likely to be from asymmetrical
stretching vibration and symmetrical vibration of the Al-O-Si groups, respectively, based on
previous studies [47]. At 700 to 800 cm-1, the vibrational bands were assigned to Si-O
stretching, which corresponds to quartz, which was very small and diffused. This refers to the
coincidence of the various forms of silicate molecular motions arising from different silicate
minerals [48].
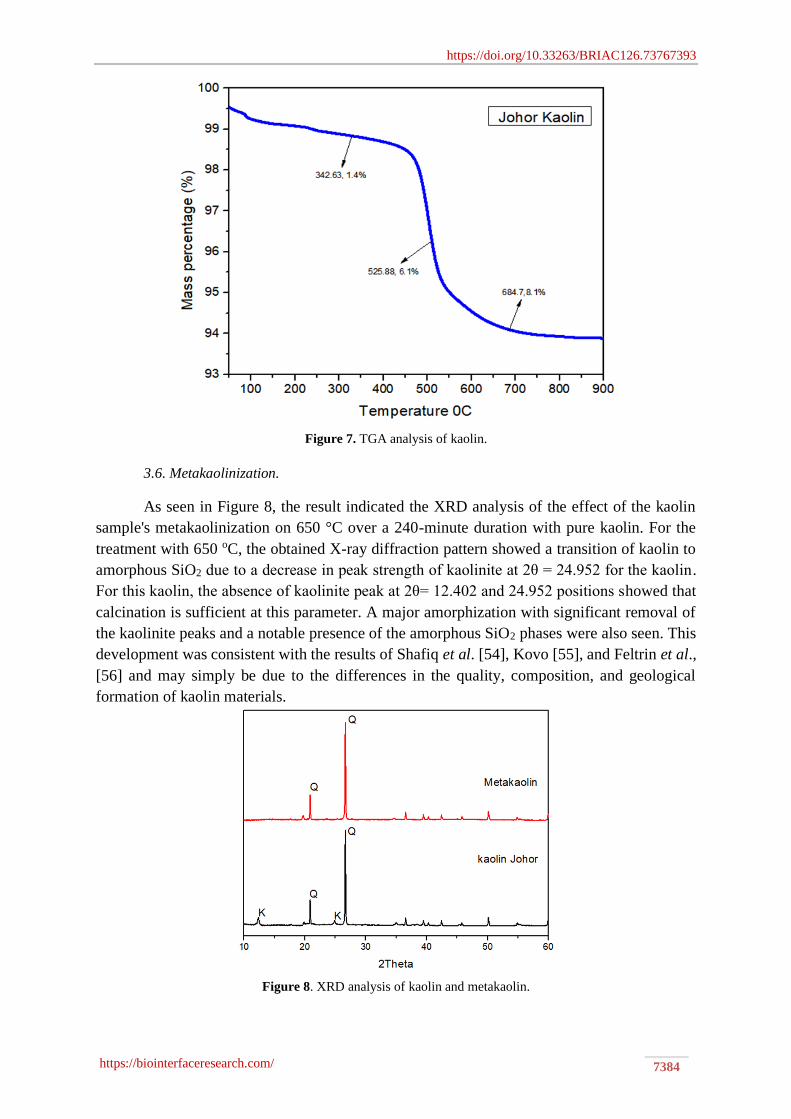
3.5. Thermogravimetric (TGA) analysis.
The TGA result for Johor kaolin is shown in Figure 7, which revealed that the kaolin
samples were completely dried since there were no signs of hydration or preliminary stage
dryness in the TGA curve. It was observed again in weight instead. This likely weight gain is
https://doi.org/10.33263/BRIAC126.73767393
https://biointerfaceresearch.com/ 7383
probably not due to interaction with the furnace wall [49]. Still, it may be due to the reaction
of the gaseous substances in the purge gas or to the possible adsorption of kaolin, the gaseous
material in the sample.
Figure 6. FTIR analysis of kaolin.
The original weight dropped by 1.4 percent in Johor kaolin, as the temperature rose to
342.63 oC. The decomposition and loss of crystallization water were apparent as the heating
temperature increased. The crystallization water varied mainly from the "pore water" typically
lost at the drying point. Chemically mixed, crystallizing water formed an essential unit of the
crystal structure of the kaolin. Johari et al. [50] suggested that kaolin crystallization water can
only be impacted by temperatures above 400 oC. The loss of crystallization water was induced
at approximately 450 °C, as seen in the Johor kaolin thermograms, signaling the beginning of
the dehydroxylation reaction. When the heating temperature was raised to 525.88 oC, a
different weight reduction was reported, with a 6.1 percent weight reduction in Johor kaolin
due to the structural loss of the hydroxyl group presented in the kaolinite layers, in conjunction
with Kubiliute and Kaminskas [51].
From the TGA curve of the kaolin study, a dehydroxylation reaction of around 650 to
700 oC seemed to have been accomplished. If the heat temperature increases, a further
occurrence that may lead to an exothermic reaction is predicted to occur, although this work is
limited to the reaction that could lead to metakaolin (dehydroxylation). The substantial weight
reduction in Johor kaolin, which occurred at 684.7 °C, suggested that the mineral kaolinite
decomposed into free alumina, silica, and water [51]. Johor Kaolin had a weight loss of 8.1
percent at this point. The findings of the TGA study were close to those of other kaolin clay
studies [50, 52] but were fundamentally distinct from those [53] where dehydroxylation at 500 oC was achieved due to variations in the mineralogical composition of the examined kaolin.
TGA research has specifically shown the weight shifts that characterized the occurrence of a
chemical reaction.
https://doi.org/10.33263/BRIAC126.73767393
https://biointerfaceresearch.com/ 7384
Figure 7. TGA analysis of kaolin.
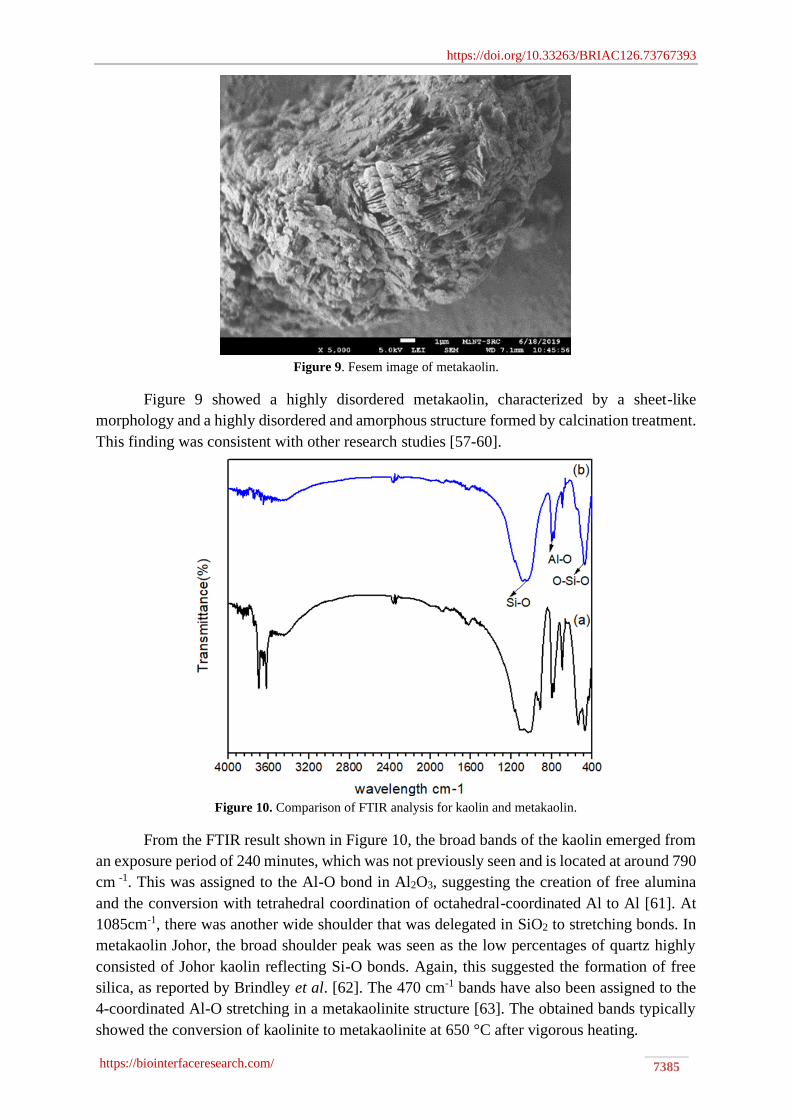
3.6. Metakaolinization.
As seen in Figure 8, the result indicated the XRD analysis of the effect of the kaolin
sample's metakaolinization on 650 °C over a 240-minute duration with pure kaolin. For the
treatment with 650 oC, the obtained X-ray diffraction pattern showed a transition of kaolin to
amorphous SiO2 due to a decrease in peak strength of kaolinite at 2θ = 24.952 for the kaolin.
For this kaolin, the absence of kaolinite peak at 2θ= 12.402 and 24.952 positions showed that
calcination is sufficient at this parameter. A major amorphization with significant removal of
the kaolinite peaks and a notable presence of the amorphous SiO2 phases were also seen. This
development was consistent with the results of Shafiq et al. [54], Kovo [55], and Feltrin et al.,
[56] and may simply be due to the differences in the quality, composition, and geological
formation of kaolin materials.
Figure 8. XRD analysis of kaolin and metakaolin.
https://doi.org/10.33263/BRIAC126.73767393
https://biointerfaceresearch.com/ 7385
Figure 9. Fesem image of metakaolin.
Figure 9 showed a highly disordered metakaolin, characterized by a sheet-like
morphology and a highly disordered and amorphous structure formed by calcination treatment.
This finding was consistent with other research studies [57-60].
Figure 10. Comparison of FTIR analysis for kaolin and metakaolin.
From the FTIR result shown in Figure 10, the broad bands of the kaolin emerged from
an exposure period of 240 minutes, which was not previously seen and is located at around 790
cm -1. This was assigned to the Al-O bond in Al2O3, suggesting the creation of free alumina
and the conversion with tetrahedral coordination of octahedral-coordinated Al to Al [61]. At
1085cm-1, there was another wide shoulder that was delegated in SiO2 to stretching bonds. In
metakaolin Johor, the broad shoulder peak was seen as the low percentages of quartz highly
consisted of Johor kaolin reflecting Si-O bonds. Again, this suggested the formation of free
silica, as reported by Brindley et al. [62]. The 470 cm-1 bands have also been assigned to the
4-coordinated Al-O stretching in a metakaolinite structure [63]. The obtained bands typically
showed the conversion of kaolinite to metakaolinite at 650 °C after vigorous heating.
https://doi.org/10.33263/BRIAC126.73767393
https://biointerfaceresearch.com/ 7386
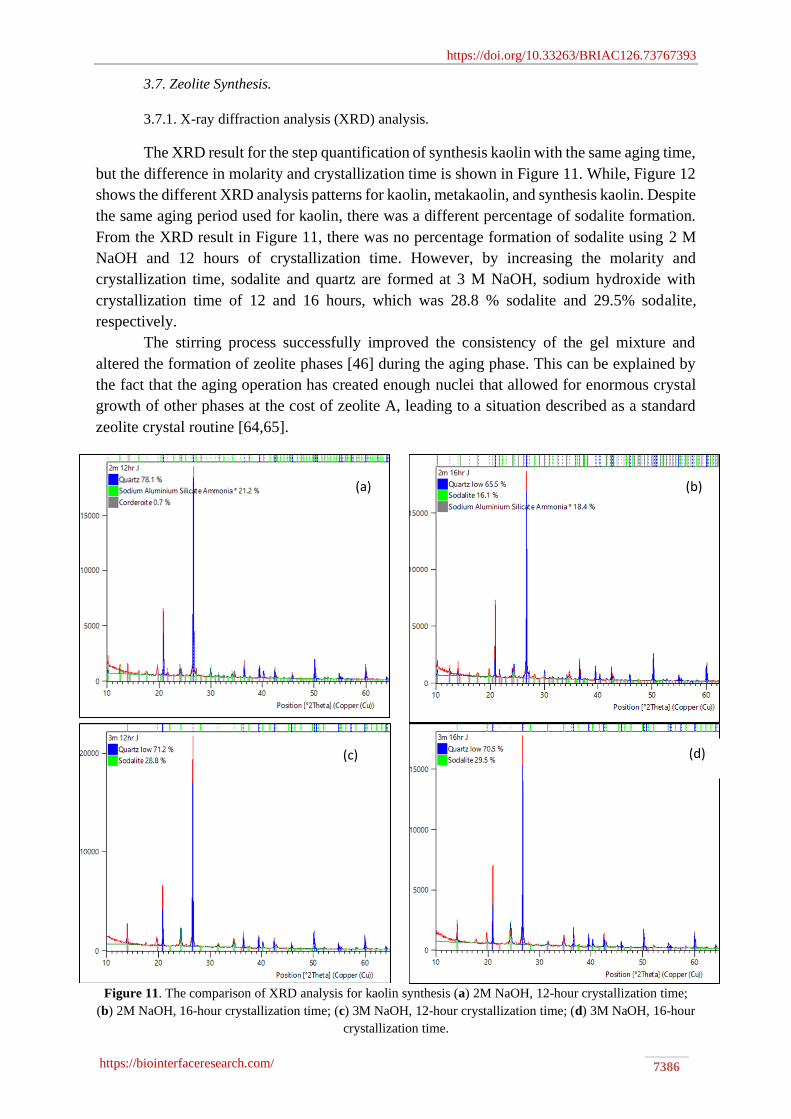
3.7. Zeolite Synthesis.
3.7.1. X-ray diffraction analysis (XRD) analysis.
The XRD result for the step quantification of synthesis kaolin with the same aging time,
but the difference in molarity and crystallization time is shown in Figure 11. While, Figure 12
shows the different XRD analysis patterns for kaolin, metakaolin, and synthesis kaolin. Despite
the same aging period used for kaolin, there was a different percentage of sodalite formation.
From the XRD result in Figure 11, there was no percentage formation of sodalite using 2 M
NaOH and 12 hours of crystallization time. However, by increasing the molarity and
crystallization time, sodalite and quartz are formed at 3 M NaOH, sodium hydroxide with
crystallization time of 12 and 16 hours, which was 28.8 % sodalite and 29.5% sodalite,
respectively.
The stirring process successfully improved the consistency of the gel mixture and
altered the formation of zeolite phases [46] during the aging phase. This can be explained by
the fact that the aging operation has created enough nuclei that allowed for enormous crystal
growth of other phases at the cost of zeolite A, leading to a situation described as a standard
zeolite crystal routine [64,65].
Figure 11. The comparison of XRD analysis for kaolin synthesis (a) 2M NaOH, 12-hour crystallization time;
(b) 2M NaOH, 16-hour crystallization time; (c) 3M NaOH, 12-hour crystallization time; (d) 3M NaOH, 16-hour
crystallization time.
(a) (b)
(c) (d)
https://doi.org/10.33263/BRIAC126.73767393
https://biointerfaceresearch.com/ 7387
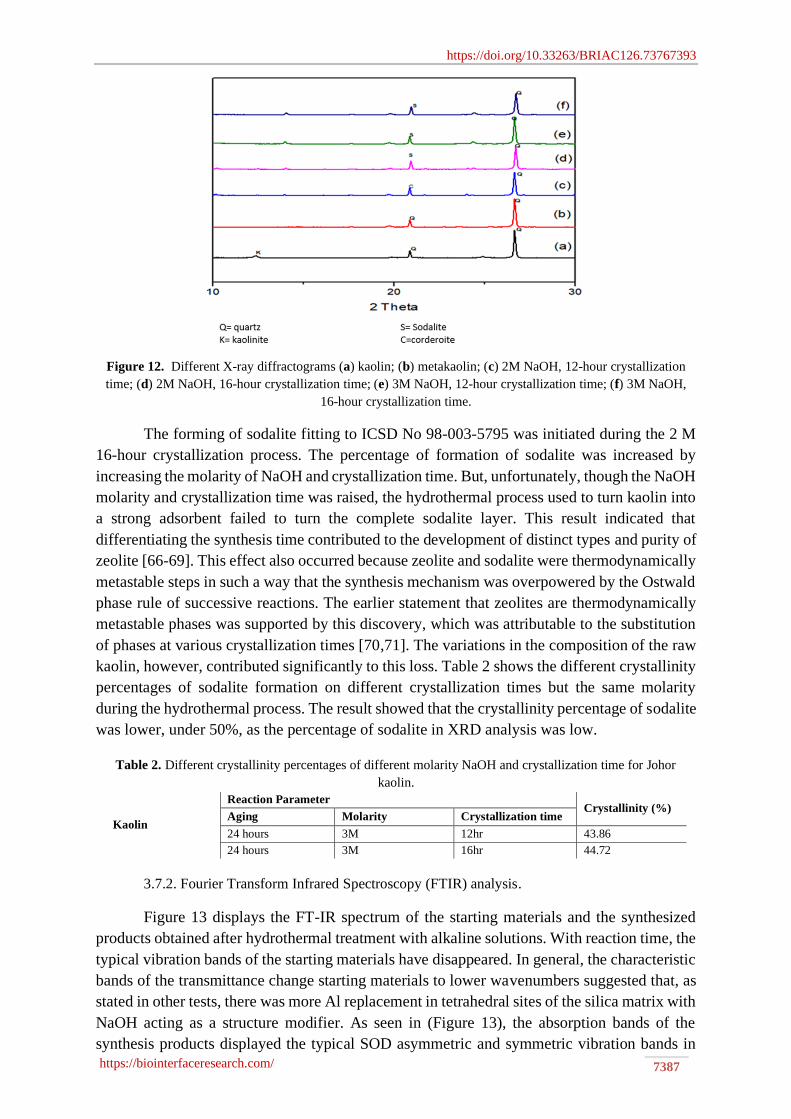
Figure 12. Different X-ray diffractograms (a) kaolin; (b) metakaolin; (c) 2M NaOH, 12-hour crystallization
time; (d) 2M NaOH, 16-hour crystallization time; (e) 3M NaOH, 12-hour crystallization time; (f) 3M NaOH,
16-hour crystallization time.
The forming of sodalite fitting to ICSD No 98-003-5795 was initiated during the 2 M
16-hour crystallization process. The percentage of formation of sodalite was increased by
increasing the molarity of NaOH and crystallization time. But, unfortunately, though the NaOH
molarity and crystallization time was raised, the hydrothermal process used to turn kaolin into
a strong adsorbent failed to turn the complete sodalite layer. This result indicated that
differentiating the synthesis time contributed to the development of distinct types and purity of
zeolite [66-69]. This effect also occurred because zeolite and sodalite were thermodynamically
metastable steps in such a way that the synthesis mechanism was overpowered by the Ostwald
phase rule of successive reactions. The earlier statement that zeolites are thermodynamically
metastable phases was supported by this discovery, which was attributable to the substitution
of phases at various crystallization times [70,71]. The variations in the composition of the raw
kaolin, however, contributed significantly to this loss. Table 2 shows the different crystallinity
percentages of sodalite formation on different crystallization times but the same molarity
during the hydrothermal process. The result showed that the crystallinity percentage of sodalite
was lower, under 50%, as the percentage of sodalite in XRD analysis was low.
Table 2. Different crystallinity percentages of different molarity NaOH and crystallization time for Johor
kaolin.
Kaolin
Reaction Parameter Crystallinity (%)
Aging Molarity Crystallization time
24 hours 3M 12hr 43.86
24 hours 3M 16hr 44.72
3.7.2. Fourier Transform Infrared Spectroscopy (FTIR) analysis.
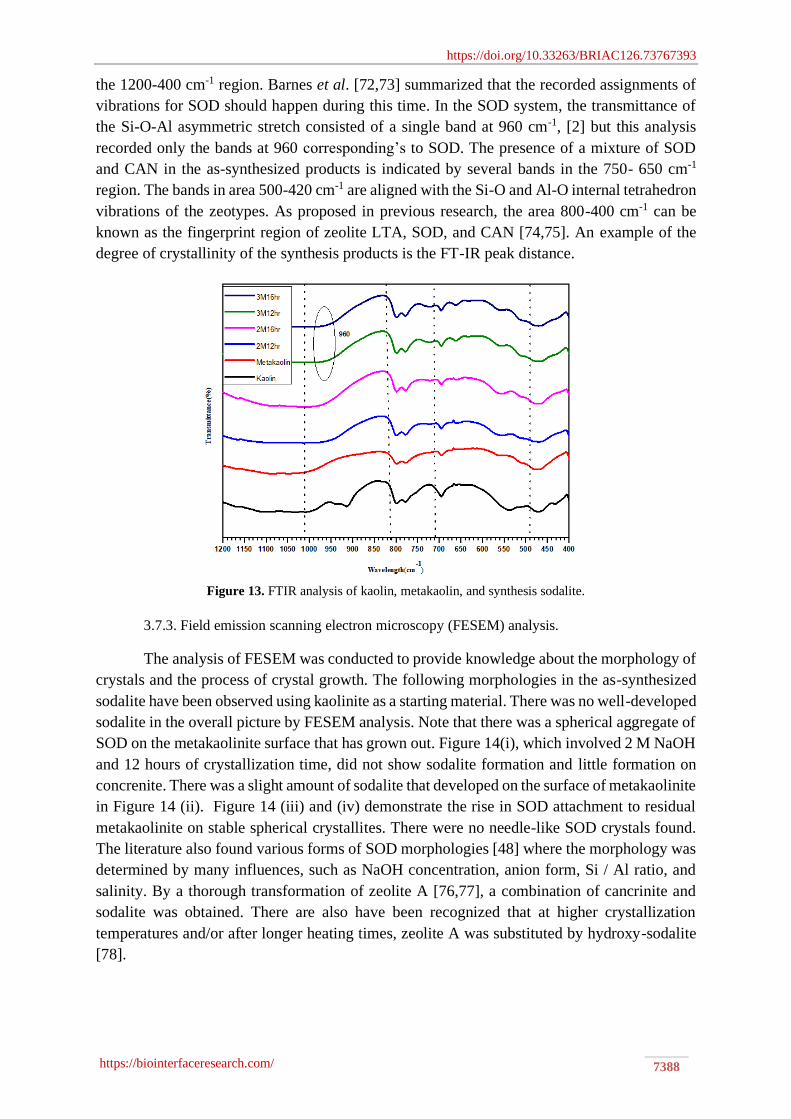
Figure 13 displays the FT-IR spectrum of the starting materials and the synthesized
products obtained after hydrothermal treatment with alkaline solutions. With reaction time, the
typical vibration bands of the starting materials have disappeared. In general, the characteristic
bands of the transmittance change starting materials to lower wavenumbers suggested that, as
stated in other tests, there was more Al replacement in tetrahedral sites of the silica matrix with
NaOH acting as a structure modifier. As seen in (Figure 13), the absorption bands of the
synthesis products displayed the typical SOD asymmetric and symmetric vibration bands in
https://doi.org/10.33263/BRIAC126.73767393
https://biointerfaceresearch.com/ 7388
the 1200-400 cm-1 region. Barnes et al. [72,73] summarized that the recorded assignments of
vibrations for SOD should happen during this time. In the SOD system, the transmittance of
the Si-O-Al asymmetric stretch consisted of a single band at 960 cm-1, [2] but this analysis
recorded only the bands at 960 corresponding’s to SOD. The presence of a mixture of SOD
and CAN in the as-synthesized products is indicated by several bands in the 750- 650 cm-1
region. The bands in area 500-420 cm-1 are aligned with the Si-O and Al-O internal tetrahedron
vibrations of the zeotypes. As proposed in previous research, the area 800-400 cm-1 can be
known as the fingerprint region of zeolite LTA, SOD, and CAN [74,75]. An example of the
degree of crystallinity of the synthesis products is the FT-IR peak distance.
Figure 13. FTIR analysis of kaolin, metakaolin, and synthesis sodalite.
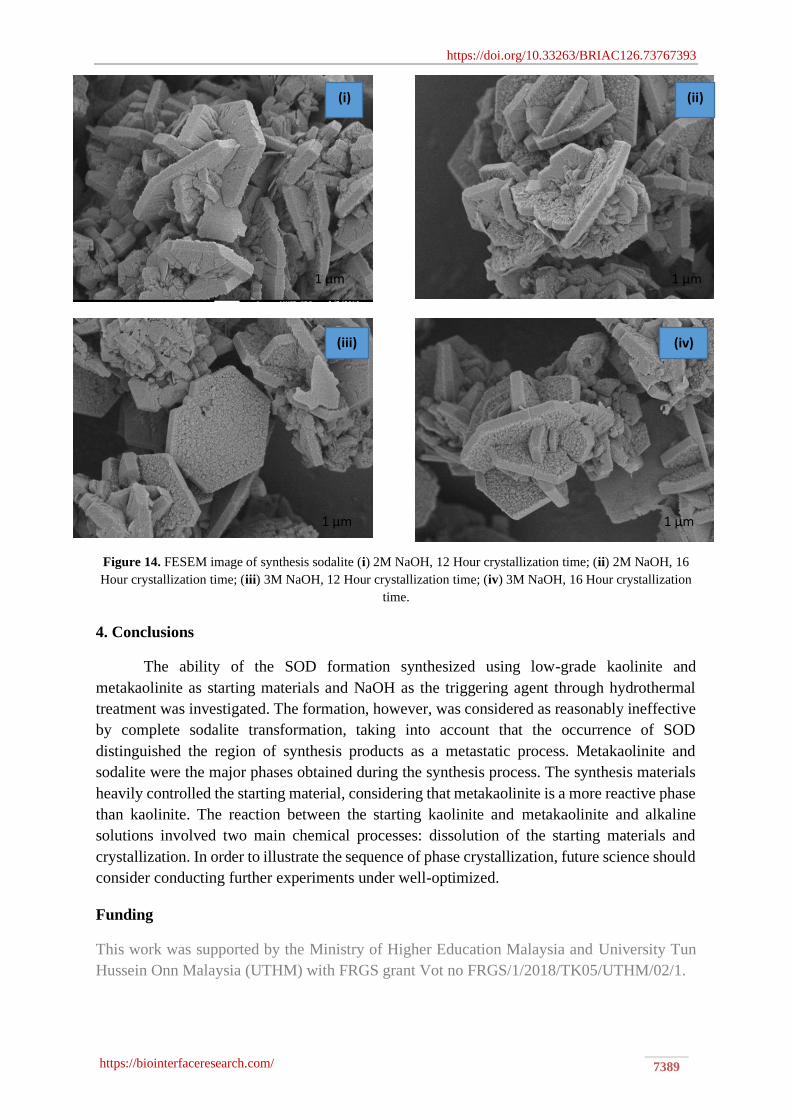
3.7.3. Field emission scanning electron microscopy (FESEM) analysis.
The analysis of FESEM was conducted to provide knowledge about the morphology of
crystals and the process of crystal growth. The following morphologies in the as-synthesized
sodalite have been observed using kaolinite as a starting material. There was no well-developed
sodalite in the overall picture by FESEM analysis. Note that there was a spherical aggregate of
SOD on the metakaolinite surface that has grown out. Figure 14(i), which involved 2 M NaOH
and 12 hours of crystallization time, did not show sodalite formation and little formation on
concrenite. There was a slight amount of sodalite that developed on the surface of metakaolinite
in Figure 14 (ii). Figure 14 (iii) and (iv) demonstrate the rise in SOD attachment to residual
metakaolinite on stable spherical crystallites. There were no needle-like SOD crystals found.
The literature also found various forms of SOD morphologies [48] where the morphology was
determined by many influences, such as NaOH concentration, anion form, Si / Al ratio, and
salinity. By a thorough transformation of zeolite A [76,77], a combination of cancrinite and
sodalite was obtained. There are also have been recognized that at higher crystallization
temperatures and/or after longer heating times, zeolite A was substituted by hydroxy-sodalite
[78].
https://doi.org/10.33263/BRIAC126.73767393
https://biointerfaceresearch.com/ 7389
Figure 14. FESEM image of synthesis sodalite (i) 2M NaOH, 12 Hour crystallization time; (ii) 2M NaOH, 16
Hour crystallization time; (iii) 3M NaOH, 12 Hour crystallization time; (iv) 3M NaOH, 16 Hour crystallization
time.
4. Conclusions
The ability of the SOD formation synthesized using low-grade kaolinite and
metakaolinite as starting materials and NaOH as the triggering agent through hydrothermal
treatment was investigated. The formation, however, was considered as reasonably ineffective
by complete sodalite transformation, taking into account that the occurrence of SOD
distinguished the region of synthesis products as a metastatic process. Metakaolinite and
sodalite were the major phases obtained during the synthesis process. The synthesis materials
heavily controlled the starting material, considering that metakaolinite is a more reactive phase
than kaolinite. The reaction between the starting kaolinite and metakaolinite and alkaline
solutions involved two main chemical processes: dissolution of the starting materials and
crystallization. In order to illustrate the sequence of phase crystallization, future science should
consider conducting further experiments under well-optimized.
Funding
This work was supported by the Ministry of Higher Education Malaysia and University Tun
Hussein Onn Malaysia (UTHM) with FRGS grant Vot no FRGS/1/2018/TK05/UTHM/02/1.
(i) (ii)
(iii) (iv)
1 µm 1 µm
1 µm 1 µm
https://doi.org/10.33263/BRIAC126.73767393
https://biointerfaceresearch.com/ 7390
Acknowledgments
The authors would like to thank the Ministry of Higher Education, University Tun Hussein
Onn Malaysia (UTHM), for the funding of the project.
Conflicts of Interest
The authors declare no conflict of interest.
References
1. Alessandro, F.G.; Paolo, A. The structure of K-hydrosodalite. Microporous and Mesoporous Materials 2006,
96, 276–286, https://doi.org/10.1016/j.micromeso.2006.07.010. 2. Ma, B.; Fernandez-Martinez, A.; Mancini, A.; Lothenbach, B. Spectroscopic investigations on structural
incorporation pathways of FeIII into zeolite frameworks in cement-relevant environments. Cement and
Concrete Research 2021, 140, 106304, https://doi.org/10.1016/j.cemconres.2020.106304.
3. Ferdi, S.; Sing, K.S.W.; Jens, W. Handbook of Porous Solids, Wiley-VCH, Weinheim, 2002, 3, 699.
4. Petersen, H.; Robben, L.; Gesing, T. On the nature of the phase transitions of aluminosilicate perrhenate
sodalite. Zeitschrift für Kristallographie-Crystalline Materials 2020, 235, 213-223,
https://doi.org/10.1515/zkri-2020-0027.
5. Xu, B.; Smith, P.; Wingate, C.; De Silva, L. The effect of calcium and temperature on the transformation of
sodalite to cancrinite in Bayer digestion. Hydrometallurgy 2010, 105, 75-81,
https://doi.org/10.1016/j.hydromet.2010.07.010.
6. Pauling, L. The Structure of Sodalite and Helvite. Zeitschrift fur Kristallographie 1930, 74, 213-225.
7. Chukanov,V.; Aksenov, S.W.; Rastsvetaeva, R.K. Structural chemistry, IR spectroscopy, properties, and
genesis of natural and synthetic microporous cancrinite- and sodalite-related materials: A review. Microporous
and Mesoporous Materials 2021, 323, 111098, https://doi.org/10.1016/j.micromeso.2021.111098.
8. Saehwa, C.; Brian, J, R.; Matthew, A.; Amanda, R. L.; Stephanie, H. B.; Junghune, N.; John, S, M.; Jarrod,
V.C. Iodosodalite synthesis with hot isostatic pressing of precursors produced from aqueous and hydrothermal
processes. Journal of Nuclear Materials 2020, 538, 152222, https://doi.org/10.1016/j.jnucmat.2020.152222.
9. Susan, E. L.; Joseph, S.; Bo B, I.; Jonathan, H.; Galen, D. S. Covalent Guest−Framework Interactions in
Heavy Metal Sodalites: Structure and Properties of Thallium and Silver Sodalite. J. Phys. Chem. B 1999, 103,
7135–7144, https://doi.org/10.1021/jp990898i.
10. Smith, J.; Barrer, R.M. Zeolites and clay minerals as sorbents and molecular sieves. Mineralogical Magazine
1980, 43, 829-830, https://doi.org/10.1180/minmag.1980.043.330.29.
11. Teepakakorn, A.; Yamaguchi, T.; Ogawa, M. The Improved Stability of Molecular Guests by the Confinement
into Nanospaces. Chemistry Letters 2019, 48, 398-409, https://doi.org/10.1246/cl.181026.
12. Yang, J.; Li, T.; Bao, X.;Yue, Y.; Liu, H. Mesoporogen-free synthesis of hierarchical sodalite as a solid base
catalyst from sub-molten salt-activated aluminosilicate. Particuology 2020, 48, 48-54,
https://doi.org/10.1016/j.partic.2018.07.005.
13. Fasolin, S.; Romano, M.; Boldrini, S.; Ferrario, A.; Fabrizio, M.; Armelao, L.; Barison, S. Single-step process
to produce alumina supported hydroxy-sodalite zeolite membranes. Journal of Materials Science 2019, 54,
2049-2058, https://doi.org/10.1007%2Fs10853-018-2952-6.
14. Kamyab, S.M.; Modabberi, S.; Williams, C.; Badiei, A. Synthesis of Sodalite from Sepiolite by Alkali Fusion
Method and Its Application to Remove Fe3+ , Cr3+ , and Cd2+ from Aqueous Solutions. Environmental
Engineering Science 2020, 37, 689-701, https://doi.org/10.1089/ees.2019.0492.
15. Choy, J.H.; Lee, S.R.; Han, Y.S.; Park, M.; Park, G.S. Solid–solid transformation mechanism for
nanocrystalline sodalite from pillared clay. Chem. Commun. 2003, 1922–1923,
https://doi.org/10.1039/B304638A.
16. Lee, S.R.; Park, M.; Han, Y.S.; Choy, J.H. Solid-solid transformation route to nanocrystalline sodalite from
Al-PILC at room temperature. J. Phys. Chem. Solid 2004, 65, 421–424,
https://doi.org/10.1016/j.jpcs.2003.09.013.
17. Baccouche, A.; Srasra, E.; El Maaoui, M. Preparation of Na-P1 and sodalite octahydrate zeolites from
interstratified illite- smectite. Appl. Clay Sci 1998, 13, 255–273, https://doi.org/10.1016/S0169-
1317(98)00028-3.
18. Shackelford, J.F.; Doremus, R.H. Ceramic and Glass Materials: 27 Structure, Properties and Processing.
Springer, 2008, 28.
https://doi.org/10.33263/BRIAC126.73767393
https://biointerfaceresearch.com/ 7391
19. Shackelford, J.F.; Doremus, R.H. Ceramic and glass materials : structure, properties and processing. Material
Science 2008, http://dx.doi.org/10.1007/978-0-387-73362-3, http://dx.doi.org/10.1007/978-0-387-73362-3.
20. Chun, H.Z.; Li, Z.Z.; Ai, Q.W.; Tian, H.C.; Hong, P.H. Current fundamental and applied research into clay
minerals in China. Applied Clay Science 2016, 119, 3-7, https://doi.org/10.1016/j.clay.2015.07.043.
21. Kovo, A. S.; Edoga, M. O. Production and characterisation of zeolite from Ahako clay in Kogi State, Nigeria.
Leonardo Electronic Journal of Practices and Technologies 2005, 7, 31-40.
22. Abdullahi, T.; Harun, Z.; Hafiz, M.; Othman, D. A review on sustainable synthesis of zeolite from kaolinite
resources via hydrothermal process. Adv. Powder Technol. 2017, 28, 1827-1840,
https://doi.org/10.1016/j.apt.2017.04.028.
23. Temuujin, J.; Okada, K.; MacKenzie, K.J.D. Zeolite formation by hydrothermal treatment of waste solution
from selectively leached kaolinite. Mater. Lett 2002, 52, 91–95, https://doi.org/10.1016/S0167-
577X(01)00372-X.
24. Yuan, H.; Shengwei, T.; Shaohua, Y.; Shiwei, L. Research progress on green synthesis of various high-purity
zeolites from natural material-kaolin. Journal of Cleaner Production 2021, 306,
https://doi.org/10.1016/j.jclepro.2021.127248.
25. Murukutti, M.K.; Jena, H. Synthesis of nano-crystalline zeolite-A and zeolite-X from Indian coal fly ash, its
characterization and performance evaluation for the removal of Cs+ and Sr2+ from simulated nuclear waste.
Journal of Hazardous Materials 2022, 423, https://doi.org/10.1016/j.jhazmat.2021.127085.
26. Belviso, C.; Cavalcante, F.; Niceforo, G.; Lettino, A. Sodalite, faujasite and A-type zeolite from 2:1
dioctahedral and 2:1:1 trioctahedral clay minerals. A singular review of synthesis methods through laboratory
trials at a low incubation temperature. Powder Technol 2017, 320, 483–497,
https://doi.org/10.1016/j.powtec.2017.07.039.
27. Passos F.A.C.M., Castro, D.C., Ferreira, K.K., Simões, K.M.A., Bertolino, L.C., Barbato, C.N., Garrido,
F.M.S.,Felix , A.A.S., Silva, F.A.N.G,.Synthesis and characterization of sodalite and cancrinite from kaolin,
In book: Characterization of Minerals, Metals, and Materials 2017, 279-288, https://doi.org/10.1007/978-3-
319-51382-9_31.
28. Noel Essey, N.; Emmanuel, J.; Alexandra, C.; Erwan, P.; Marilyne, S.; Olivier, G.; Valentin, R.; Coelho
Diogo, C.; Delphine, V.; Pascale, L.; Patrice, F.; Sylvie, R.; Nathalie, T.; Xavier, B. Role of cations on the
dissolution mechanism of kaolinite in high alkaline media. Applied Clay Science 2021, 205, 106037,
https://doi.org/10.1016/j.clay.2021.106037.
29. Sruthi, P.L.; Reddy, H.P. Characterization of kaolinitic clays subjected to alkali contamination. Appl. Clay Sci
2017, 146, 535–547, https://doi.org/10.1016/j.clay.2017.07.012.
30. BSI, BS 1377–2, Methods of Test for Soils for Civil Engineering Purposes, British Standards Institution,
Milton Keynes, UK, Classification tests 1990.
31. Johnson, E.B.G.; Arshad, S.E. Hydrothermally synthesized zeolites based on kaolinite: A review. Applied Clay
Science 2014, 97-98, 215-221, https://doi.org/10.1016/j.clay.2014.06.005.
32. Chandrasekhar, S.; Pramada, P. N. Kaolin-based zeolite Y, a precursor for cordierite ceramics. Applied Clay
science 2004, 27, 187-198, https://doi.org/10.1016/j.clay.2004.07.001.
33. Kulprathipanja, S. Zeolite in industrial separation and catalysis, 1st Ed; John Wiley & Son, Inc. 2010.
34. Lutz, W. Zeolite Y: Synthesis, Modification, and Properties- A Case Revisited. Advances in Material Science
and Engineering 2014, 640, 577-581, https://doi.org/10.1155/2014/724248.
35. Yahaya, S.; Jikan, S.S.; Badarulzaman, N. A.; Adamu, A.D. Chemical Composition and Particle Size Analysis
of Kaolin. Path of Science 2017, 3, 1001-1004, https://doi.org/10.22178/pos.27-1.
36. Chee, L. C.; Ahmad, Z. A.; Sew, S. S. Relationship between the thermal behavior of the clays and their
mineralogical and chemical composition: Example of Ipoh, Kuala Rompin and Mersing (Malaysia). Applied
Clay Science 2017, 143, 327-335, https://doi.org/10.1016/j.clay.2017.03.037.
37. Osipov, V.I.; Sergeev, E.M. Crystallochemistry of clay minerals and their properties. Bulletin of the
International Association of Engineering Geology 1972, 5, 9-15.
38. Ariffin, K. S.; Abdul Rahman, H.; Hussin, H.; Abdul hadi, K. A. The genesis and characteristics of primary
kaolinitic clay occurrence at Bukit Lampas, Simpang Pulai, Ipoh. Bulletin of the Geological Society of
Malaysia 2008, 54, 9-16, https://doi.org/10.7186/bgsm54200802.
39. Belviso, C.; Cavalcante, F.; Lettino, A.; Fiore, S. Zeolite synthesised from fused coal fly ash at low temperature
using seawater for crystallization. Coal Combustion and Gasification Products 2009, 1, 8-13.
40. Baioumy, H. & Ibrahim, A. Z. Mineralogical Variations among the Kaolin Deposits in Malaysia. Annual
International Conference on Geological and Earth Science. National University of Singapore 2012, 133–140.
41. Ajala, A. J. A Study on Thermal Conductivity of Six Unexplored Nigerian Clays for Possible Rereactory and
Insulating Materials. PhD. Thesis. Universiti Tun Hussein Onn Malaysia 2017.
https://doi.org/10.33263/BRIAC126.73767393
https://biointerfaceresearch.com/ 7392
42. Andrejkovicova, S.; Madejova, J.; Czímerova, A.; Galko, I.; Dohrmann, R.; Komadel, P. Mineralogy and
chemistry of Fe-rich bentonite from the Lieskovec deposit (Central Slovakia). Geologica Carpathica 2006,
57, 371-378.
43. Gilmore, C. Material Science and Engineering properties. SI Ed. Cengage 2015, 704.
44. Musyoka, N. M.; Missengue, R.; Kusisakana, M.; Petrik, L. F. Conversion of South African clays into high
quality zeolites. Applied Clay Science 2014, 97-87, 182-186, https://doi.org/10.1016/j.clay.2014.05.026.
45. Ni, Y.; Zuo-Cai, Z.; Ning, M.; Huan-Li, L.; Xue-Qing, Z.; Bing, L.; Wei, G.; Fang-Chang, T.; Tao, J.; Chang-
Jung, C.; Tai-Chin, C.; Dean, S. Effect of surface modified kaolin on properties of polypropylene grafted
maleic anhydride. Results in Physics 2017, 7, 969-974, https://doi.org/10.1016/j.rinp.2017.02.030.
46. Kovo, A.S.; Holmes, S.M. Effect of Aging on the Synthesis of Kaolin-Based Zeolite Y from Ahoko Nigeria
Using a Novel Metakaolinization Technique. Journal of Dispersion Science and Technology 2010, 31, 37-41,
https://doi.org/10.1080/01932690903210218.
47. Loiola, A. R.; Andrade, J. D. R. A.; Sasaki, J.M.; Silva, L.R.D. Structural analysis of zeolite NaA synthesized
by a cost-effective hydrothermal method using kaolin and its use as water softener. Journal of Colloid and
Interface Science 2012, 367, 34-39, https://doi.org/10.1016/j.jcis.2010.11.026.
48. Musyoka, N.M.; Petrik, L.F.; Fatoba, O.O.; Hums, E. Synthesis of zeolites from coal fly ash using mine waters.
Minerals Engineering 2013, 53, 9-15, https://doi.org/10.1016/j.mineng.2013.06.019.
49. Bahng, M.; Mukarakate, C.; Robichaud, D. J.; Nimlos, M. R. Current technologies for analysis of biomass
thermochemical processing: A review. Analytica Chimica Acta 2009, 651, 117-138,
https://doi.org/10.1016/j.aca.2009.08.016.
50. Johari, I.; Said, S.; Hisham, B.; Bakar, A.; Ahmad, Z. A. Effect of the change of firing temperature on
microstructure and physical properties of clay bricks from Beruas (Malaysia). Science of Sintering 2010, 42,
245-254, https://doi.org/10.2298/SOS1002245J.
51. Kubiliute, R.; Kaminskas, R. The Pozzolanic Activity of Calcined Clay-Silica Gel Composites. Material
science 2013, 19, 453-460, https://doi.org/10.5755/j01.ms.19.4.2300.
52. Covarrubias, C.; Garcia, R.; Yanez, J.; Garland, M.T. Cr (III) exchange on zeolites obtained from kaolin and
natural mordenite. Microporous mesoporous Material 2006, 88, 220-231,
https://doi.org/10.1016/j.micromeso.2005.09.007.
53. Kovo, A. S.; Edoga, M. O. Production and characterisation of zeolite from Ahako clay in Kogi State, Nigeria.
Leonardo Electronic Journal of Practices and Technologies 2005, 7, 31-40,
https://citeseerx.ist.psu.edu/viewdoc/download?doi=10.1.1.300.3209&rep=rep1&type=pdf.
54. Shafiq, N.; Nuruddin, M. F.; Khan, S. U.; Ayub, T. Calcined kaolin as cement replacing material and its use
in high strength concrete. Construction and Building Material 2015, 81, 313-323,
https://doi.org/10.1016/j.conbuildmat.2015.02.050.
55. Kovo, A. S. Effect of Temperature on the Synthesis of Zeolite X from Ahoko Nigerian kaolin using novel
metakaolinization technique. Chemical Engineering Communication 2012, 199, 786-797,
https://doi.org/10.1080/00986445.2011.625065.
56. Feltrin, A. C.; Souza, H. M.; Aquino, T. F.; Marques, C. R. M.; Angioletto, E. Synthesis and ion exchange of
zeolites produced from kaolin for separation of oxygen from atmospheric air. International Journal of Applied
Ceramic Technology 2021, 18, 1725–1733, https://doi.org/10.1111/ijac.13744.
57. Chandrasekhar, S. Influence of Metakaolinization temperature on the formation of Zeolite 4A from kaolin.
Clay Minerals 1996, 31, 253-261, https://doi.org/10.1180/claymin.1996.031.2.11.
58. Feng, H.; Li, C.; Shan, H. Effect of Calcination Temperature of Kaolin Microspheres on the in situ Synthesis
of ZSM-5. Catalysis Letter 2009, 129, 71-78, https://doi.org/10.1007/s10562-008-9794-9.
59. Padilla, J.; Guzman, A.; Molina-V, D.; Poveda, J. Structural transformation of kaolin as an active matrix for
the in-situ synthesis of zeolite Y. Clay Minerals 2020, 55, 1-28, https://doi.org/10.1180/clm.2020.40.
60. El-Diadamony, H.; Amer, A.; Sokkary, T. M.; El-Hoseny, S. Hydration and characteristics of metakaolin
pozzolanic cement pastes. Housing and Building National Research Center 2016, 14, 1-9,
https://doi.org/10.1016/j.hbrcj.2015.05.005.
61. Murat, M.; Amokrane, A.; Mindrale, D.T. Synthesis of Zeolites from Thermally Activated Kaolinite. Some
Observations on Nucleation and Growth. Clay mineral 1992, 27, 119-130,
https://doi.org/10.1180/claymin.1992.027.1.12.
62. Brindley, G. W.; Nakahira, M. The Kaolinite-MuIIite Reaction Series: II, Metakaolin. Journal of the American
Ceramic Society 1958, 42, 314-318, https://doi.org/10.1111/j.1151-2916.1959.tb14315.x .
63. Granizo, M. L.; Alonso, S.; Blanco-Varela, M. T.; Palomo, A. Alkaline Activation of Metakaolin: Effect of
Calcium Hydroxide in the Products of Reaction. Journal of American Ceramic Society 2004, 85, 225-231,
https://doi.org/10.1111/j.1151-2916.2002.tb00070.x.
https://doi.org/10.33263/BRIAC126.73767393
https://biointerfaceresearch.com/ 7393
64. Ajayi, O. A.; Adefila, S. S.; Ityokumbul, M. T. Monitoring zeolite NaY formation from potassium-rich
Nigerian kaolinite clay. Ain Shams Engineering Journal 2018, 9, 1653-1661,
https://doi.org/10.1016/j.asej.2016.10.008.
65. Bahgaat, A.; Mohamed, M.; Karim, A.; Melegy, A.; Hassan, H. Synthesis and Characterization of Zeolite-Y
from natural clay of Wadi Hagul, Egypt. Egyptian Journal of Chemistry 2020, 63, 3791-3800,
https://doi.org/10.21608/ejchem.2020.23195.2378.
66. Mazur, M.; Wheatley, P. S.; Navarro, M.; Roth, W. J.; Polozij, M. Synthesis of 'unfeasible' zeolites. Nature
Chemistry 2016, 8, 58–62, https://doi.org/10.1038/nchem.2374.
67. Erlebach, A., Nachtigall, P., & Grajciar, L. Accurate large-scale simulations of siliceous zeolites by neural
network potentials. 2021.
68. Petrov, I.; Michalev, T. Synthesis of Zeolite A: A Review. Scientific 2012, 51, 30-35,
http://citeseerx.ist.psu.edu/viewdoc/download?doi=10.1.1.1049.109&rep=rep1&type=pdf.
69. Rozhkovskaya, A.; Rajapakse, J.; Millar, G.J. Synthesis of high-quality zeolite LTA from alum sludge
generated in drinking water treatment plants. Journal of environmental chemical engineering 2021, 9, 104751,
https://doi.org/10.1016/j.jece.2020.104751.
70. Sathupunya, M.; Gulari, E.; Wongkasemjit, S. ANA and GIS zeolite synthesis directly from alumatrane and
silatrane by sol-gel process and microwave technique. Journal of European Ceramic Society 2002, 22, 2305-
2314, https://doi.org/10.1016/S0955-2219(02)00042-0.
71. Khaleque, Md.; Alam, M.; Hoque, M.; Mondal, S.; Haider, J.; Johir, Md. A. b.; Karmakar, A.; Zhou, J.; Moni,
M. A. Zeolite synthesis from low-cost materials and environmental applications: A review. Environmental
Advances 2020, 2, 100019, https://doi.org/10.1016/j.envadv.2020.100019.
72. Barnes, M. C.; Addai-Mensah, J.; Gerson, A.R. The solubility of sodalite and cancrinite in synthetic spent
Bayer liquor. Colloids and Surfaces A: Physicochemical and Engineering Aspects 1999, 157, 106-116,
https://doi.org/10.1016/S0927-7757%2899%2900058-8.
73. Pan, X.; Wu, H.; Yu, H.; Bi, S.W. Precipitation of desilication products in CaO-Na2O-Al2O3-SiO2-H2O
system based on the Bayer process. Hydrometallurgy 2020, 197, 105469.
74. Aronne, A.; Esposito, S.; Pernice. P. FT-IR and DTA study of lanthanum aluminosilicates glasses. Materials
Chemistry and Physics 1997, 51, 163-168.
75. Cui, J.; Cao, X.; Shi, L.; Zhong, Z.; Gao, Q. A study of (71.5-x) SiO2-xAl2O3-11.5R2O-17RO glass system:
Batch reaction process, structure and properties. Materials Chemistry and Physics 2021, 272, 125022,
https://doi.org/10.1016/j.matchemphys.2021.125022.
76. Deng,Y.; Harsh, J.B.; Flury, M.; Young, J.S.; Boyle,J.S. Mineral formation during simulated leaks of Hanford
waste tanks. Applied Geochemistry 2006, 21, 1392-1409, https://doi.org/10.1016/j.apgeochem.2006.05.002.
77. Hums,E., Inayat, A.; Schwieger, W. Presentation, 18th International Zeolite Conference, Rio, Brazil, 2016.
78. Hums, E. Synthesis of Phase-Pure Zeolite Sodalite from Clear Solution Extracted from Coal Fly Ash. J
Thermodyn Catal 2017, 8, 187, https://doi.org/10.4179/2157-7544.1000187.