Potential gas production from landfilling of inorganic wastes
156
Science Report – Production gas production from landfilling of inorganic wastes i Potential gas production from landfilling of inorganic wastes Science Report: SC030144/SR SCHO0306BMCR-E-P
-
Upload
khangminh22 -
Category
Documents
-
view
2 -
download
0
Transcript of Potential gas production from landfilling of inorganic wastes

Science Report – Production gas production from landfilling of inorganic wastes i
Potential gas production from landfillingof inorganic wastesScience Report: SC030144/SR
SCHO0306BMCR-E-P

ii Science Report – Production gas production from landfilling of inorganic wastes
The Environment Agency is the leading public bodyprotecting and improving the environment in England andWales.
It’s our job to make sure that air, land and water are lookedafter by everyone in today’s society, so that tomorrow’sgenerations inherit a cleaner, healthier world.
Our work includes tackling flooding and pollution incidents,reducing industry’s impacts on the environment, cleaning uprivers, coastal waters and contaminated land, andimproving wildlife habitats.
This report is the result of research commissioned andfunded by the Environment Agency’s Science Programme.
Published by:Environment Agency, Rio House, Waterside Drive,Aztec West, Almondsbury, Bristol, BS32 4UDTel: 01454 624400 Fax: 01454 624409www.environment-agency.gov.uk
ISBN: 978-1-84432-682-2
© Environment Agency – March 2007
All rights reserved. This document may be reproducedwith prior permission of the Environment Agency.
The views and statements expressed in this report arethose of the author alone. The views or statementsexpressed in this publication do not necessarilyrepresent the views of the Environment Agency and theEnvironment Agency cannot accept any responsibility forsuch views or statements.
This report is printed on Cyclus Print, a 100% recycledstock, which is 100% post consumer waste and is totallychlorine free. Water used is treated and in most casesreturned to source in better condition than removed.
Further copies of this report are available from:The Environment Agency’s National Customer ContactCentre by emailing:[email protected] by telephoning 08708 506506.
Author(s):M. George, S.J.M. Gore, T.G. Heath and S.J. Williams
Dissemination Status:Publicly available
Keywords:Trace Gases, corrosion, inorganic waste, volatilemetals, hazardous waste, organometallic analysis
Research Contractor:Serco AssuranceB150 Harwell IBC, Didcot, Oxfordshire OX11 0RATel: 01635 280419
Environment Agency’s Project Manager:Alan Rosevear, Kings Meadow House, Kings MeadowRoad, Reading, RG1 8DQ
Science Project Number:Insert project reference number
Product Code:SCHO0306BMCR-E-P

Science Report – Production gas production from landfilling of inorganic wastes iii
Science at theEnvironment AgencyScience underpins the work of the Environment Agency. It provides an up-to-dateunderstanding of the world about us and helps us to develop monitoring tools andtechniques to manage our environment as efficiently and effectively as possible.
The work of the Environment Agency’s Science Group is a key ingredient in thepartnership between research, policy and operations that enables the EnvironmentAgency to protect and restore our environment.
The science programme focuses on five main areas of activity:
• Setting the agenda, by identifying where strategic science can inform ourevidence-based policies, advisory and regulatory roles;
• Funding science, by supporting programmes, projects and people inresponse to long-term strategic needs, medium-term policy priorities andshorter-term operational requirements;
• Managing science, by ensuring that our programmes and projects are fitfor purpose and executed according to international scientific standards;
• Carrying out science, by undertaking research – either by contracting itout to research organisations and consultancies or by doing it ourselves;
• Delivering information, advice, tools and techniques, by makingappropriate products available to our policy and operations staff.
Steve Killeen
Head of Science

iv Science Report – Production gas production from landfilling of inorganic wastes
Executive summaryThe Landfill Directive (1999/31/EC), brought into force in England and Wales as theLandfill (England and Wales) Regulations 2002, has begun to change the way the UKhandles waste. It sets out three classes of waste landfill – inert waste, non-hazardouswaste and hazardous waste.
As the UK seeks to meet the requirements of the Landfill Directive, a substantialproportion of biodegradable waste will be diverted away from landfill. This will increasethe amount of secondary wastes containing a high proportion of inorganic materialgoing to landfill. Gaseous emissions from landfills in the future will be much smaller involume compared with existing landfills and will have a very different composition. Thismay have implications for the management, risk assessment and monitoring of landfillgas. This desk study is the first phase of a programme to better identify and quantifythe gases arising from landfilling of waste streams containing a high proportion ofinorganic material.
The likely composition of these waste streams was estimated to identify the potentialreactions that could occur in current and future wastes. The range, type and relativequantities of any wastes accepted into landfill sites will vary between landfills,depending on the permit conditions and local waste producers. There is no agreed‘typical waste’ for the future sites containing mainly inorganic wastes and so, for thepurposes of this project, national waste data have been used to create model landfillsfrom which to consider potential gas generation. Conceptual model inventories weregenerated for three categories of landfill site – hazardous, non-hazardous and inert. Inaddition, monofilled cells within a non-hazardous site were considered based onasbestos or gypsum wastes as the waste stream. Finally, monofilled cells containing airpollution control (APC) residues were considered for a hazardous waste site.
The evolution of chemical conditions within a landfill was then assessed. There will bea heterogeneous distribution of waste types within the landfill and, the more diverse thetypes of waste, the longer it may take for conditions to approach what could bedescribed as near steady-state or equilibrium.
The presence of a continuous aqueous medium throughout a landfill cannot beassumed. Although the waste may be damp, saturated conditions may exist only at thebase of the landfill or in regions of the waste above impermeable waste deposits. Thedryer the landfill, the slower will be the rate of the general chemical reactions that areexpected to occur.
These types of landfill will contain small amounts of putrescible materials and many ofthe wastes may create hostile local environments. This will restrict microbial actioncompared with a municipal solid waste (MSW) landfill today. However, soil and dustscontaining microorganisms will be blown into the site and carried on some wastes. Thegeneral picture of microbial action in these landfills is one of activity where conditionsare most favourable; these favourable environments will probably increase as thesystem evolves over time. In addition, the microbial populations will be adapting to theimposed conditions. However, the timescale for this and the rates at which microbialprocesses will occur are uncertain.
Most research on the generation of landfill gas has focused on understanding gasproduction from landfills containing a high proportion of putrescible materials, theconsequent need to manage this gas and, if possible, to utilise the methanecomponent. In these circumstances, microbial respiration and the biodegradation oforganic materials to produce methane and carbon dioxide dominate gas evolution.There has been almost no investigation of gas generation from sites containing little or

Science Report – Production gas production from landfilling of inorganic wastes v
no degradable organic material. Chemical reactions, rather than microbial action, arelikely to be important factors in the generation of bulk gas under these conditions.
The main reactions that may generate gaseous products in a landfill with a highproportion of inorganic wastes can be considered in three main classes:
• chemical reactions that result in hydrogen formation (mainly corrosion ofFe, Al, Zn);
• other chemical reactions that could generate gaseous species (mainlyreactions of carbides, reactions with acids, formation of metal hydrides andpossibly metal carbonyls);
• microbial gas generation in environments with low proportions of organicmaterial (ammonia, hydrogen sulphide, hydrogen, carbon dioxide,methane, alkylated metal(loid)s, phosphine).
The bulk gases produced from inorganic landfills (hydrogen, carbon dioxide, methane)are potentially the same as those from existing MSW landfills. However, the quantitiesof gas produced and their rates of production are likely to be different from MSWlandfills due to the different waste inventories and, consequently, different chemicalconditions and microbial environments.
Trace gases arise from chemical or microbial reactions though, in some cases, themechanism of production is not known. They can be conveniently grouped into threeclasses:
• Generated by chemical reaction: H2S (from sulphides), H2Se, HSCN,HCN, SbH3, AsH3, simple hydrocarbons (from carbides), HCl etc., Hg, NH3,NyOx, PH3, H2Se, COCl2 (and potentially, under some circumstances I2, Br2,Cl2, F2, SO2)
• Generated by microbial action: H2S (from sulphate), R2S, SbH3, SbR3,AsH3, AsR3, BiR3, CO, CS2, COS (and possibly the selenium analoguesCSe2 and COSe), simple hydrocarbons, organic acids, PbR4, Hg, HgR2,NH3, NyOx, PH3, H2Se, R2Se, R2Te, SnR4 (R = alkyl groups including methyland, in this context only, partially substituted with R = H in some cases)and, potentially, alkylated species of other metals.
• Generation mechanism uncertain (possibly combination of microbial andchemical): Ni(CO)4, W(CO)6, Mo(CO)6 and, possibly, other transition metalcarbonyls.
Several of these gases (e.g. mercury, carbon disulphide) may also occur as ‘as-disposed’ contaminants in wastes. Organic compounds such as solvents, which arepresent in the waste as deposited, will be volatilised and will appear as tracecomponents in the gas.
Calculations were performed to investigate the effect of metal corrosion on theevolution of the redox conditions of a landfill facility and the potential for hydrogen gasproduction. Calculations were performed for:
• an unsaturated landfill facility filled with waste and initially aerobic;
• a saturated landfill facility filled with waste and initially aerobic.
These calculations showed that it could take about 160 days for anaerobic conditionsto be established in a capped landfill containing the model mixed hazardous wasteunder unsaturated conditions. This is the result of bare metal corrosion. The rate ofcorrosion, and thus the onset of anaerobic conditions, depends on the surface area ofmild steel present. However, the results of the calculations are sensitive to the

vi Science Report – Production gas production from landfilling of inorganic wastes
assumed gas migration properties of the landfill cap. Calculations for a water-saturatedlandfill show conditions could become anaerobic more rapidly, even at shallow depths.
Analytical methods of sufficient sensitivity exist for all the species likely to be of interestin gas emissions from future landfills. Portable monitors offer some possibilities formonitoring species such as hydrogen at levels of interest. However, they may not besensitive enough to measure the concentration of some other trace species.‘Hyphenated’ laboratory analytical techniques (e.g. GC-ICP-MS)* coupled withcryogenic trapping and focusing appear capable of analysing a range of volatile tracespecies at very low concentrations.
Potential methods for treating gas from future landfills are outlined. The two most likelymethods for treating gas from future landfills appear to be either controlled combustionor scrubbing. However, existing designs of landfill gas flares are not likely to beadequate for the first of these and scrubbing techniques may generate significantsecondary wastes.
The study has identified the need for:
• better characterisation of the waste inputs to landfills;
• gas data from the monitoring of sites known to have taken wastes typical ofthose expected to be landfilled in the future.
* gas chromatography-inductively coupled plasma-mass spectrometry

Science Report – Production gas production from landfilling of inorganic wastes vii
AcknowledgementsThe authors wish to thank Adam Chambers (Serco Assurance) and Richard Lucas(Smallbrook Environmental Business Consultancy) for their advice and contributions tothis work.

viii Science Report – Production gas production from landfilling of inorganic wastes
Contents1 Introduction 1
2 Legislation and landfill operation 22.1 Site management and design 22.2 Landfill gas 3
3 Potential waste inputs and resulting environments 73.1 Inputs to different types of landfill 73.2 Waste inputs 73.3 Evolution of waste environments in landfills 13
4 Potential gas production processes 184.1 Hydrogen production from metal corrosion 204.2 Other chemical reactions producing gas 234.3 Microbial action and gas generation 264.4 Volatilisation of ‘as-disposed’ materials (mercury, some inorganic
compounds and organic compounds) and miscellaneous reactions 33
5 Potential volatile products 355.1 Bulk gases 355.2 Trace gases 415.3 Trace gases from ‘as-deposited’ material 53
6 Calculation of hydrogen generation rates and redox evolution 546.1 Unsaturated landfill facility 546.2 Saturated landfill facility 676.3 Discussion 67
7 Possible identification and monitoring methods 707.1 Introduction 707.2 Instrumental methods of analysis 717.3 Monitoring of gases from existing UK landfills 767.4 Elemental analyses of volatile species 797.5 Speciation analyses 817.6 Conclusions 85
8 Assigning priorities to compounds for monitoring 86
9 Potential gas treatment methods 949.1 Combustion (flaring) 949.2 Thermal post-combustion treatment 959.3 Catalytic post-combustion treatment 95

Science Report – Production gas production from landfilling of inorganic wastes ix
9.4 Wet scrubber: acid 969.5 Wet scrubber: alkali 969.6 Wet scrubber: alkali/oxidising 979.7 Wet scrubber: solvent 979.8 Wet scrubber: water 989.9 Adsorption: activated carbon 989.10 Adsorption: specialist zeolite (molecular sieves) 999.11 Operational Issues 99
10 Conclusions 10010.1 Overall nature of gas 10010.2 Information gaps 10010.3 Monitoring and treatment techniques 10110.4 Future needs 101
References 106
List of abbreviations 114
Glossary 116
Appendix A: Methodology for estimating future composition of wastes in mainclasses of landfill 117
Appendix B: Xenobiotic compounds and heavy metals frequently found in MSWand co-disposal leachates with a possible origin in householdhazardous waste 120
Appendix C: Thermodynamic data and susceptibility to oxidation for a number ofmethyl and hydride species 129
Appendix D: Methodology for scoping calculations to estimate oxygenconsumption and hydrogen production in unsaturated and saturatedlandfills 133
Appendix E: Detection of gaseous trace species likely to be present in inorganiclandfill gas by gas indicator tube (Matheson Tri-Gas) 139

x Science Report – Production gas production from landfilling of inorganic wastes
List of tablesTable 2.1 Lining requirements for landfills
Table 2.2 Typical range of bulk compounds in landfill gas
Table 2.3 Example sources of trace components in landfill gas
Table 3.1 Estimated annual notional model inventories for future mixed hazardousand mixed non-hazardous wastes disposed to landfill
Table 3.2 Wastes acceptable in an inert landfill
Table 3.3 Estimates for England and Wales of C&D wastes sent to landfill, 2001
Table 3.4 Indicative metal concentrations in air pollution control residues
Table 3.5 Trace element concentrations in a sample of Bavarian MSWI bottom ash
Table 3.6 Leachate composition from 12,000 m3 test cell of inorganic wastes atpilot demonstration project at Nauernasche Polder Landfill, Netherlands
Table 3.7 Proportions of methane and carbon dioxide in landfill gas from six sitesaccepting demolition and ‘inert’ wastes
Table 4.1 Minor toxic gases that might form in a radioactive waste repository
Table 5.1 Types of waste going to inorganic landfill and potential contaminants
Table 5.2 Potential gases from disposal of inorganic wastes
Table 5.3 Mean total arsenic concentrations in gas samples taken from six types oflandfill in 2003
Table 5.4 Mean concentrations (µg m-3) of hydrogen sulphide, carbon disulphideand dimethyl disulphide in gas samples taken from six types of landfill in2003
Table 5.5 Concentrations of top 16 toxicity priority trace components in landfill gas
Table 5.6 Concentrations of 16 odorous priority trace components in landfill gas
Table 5.7 Gaseous trace species likely to be generated in inorganic landfills
Table 6.1 Example steady state calculation of the partial pressure of oxygenassuming pH 7 unsaturated conditions
Table 6.2 Example calculation of time taken to achieve anaerobic conditionsassuming pH 7 unsaturated conditions
Table 6.3 Example calculation of rates of metal corrosion and time until metalexhaustion assuming pH 7 anaerobic unsaturated conditions
Table 6.4 Summary of results from calculations under unsaturated conditions
Table 6.5 Summary of input parameters for numerical simulation of landfill at pH 7under saturated conditions
Table 7.1 Priority trace components to be monitored in gas from existing mixedlandfills
Table 7.2 Additional components that may be monitored in gas from existing mixedlandfills
Table 7.3 Recommended monitoring methods for trace components in gas fromexisting mixed landfills
Table 7.4 Calculated ion population (%) as a function of plasma temperature forsome elements of interest
Table 7.6 Detection limits for volatile elements using GC-ICP-MS

Science Report – Production gas production from landfilling of inorganic wastes xi
Table 7.5 Some potential isotopic interferences in ICP-MS
Table 8.1 Some typical exposure limits for gaseous trace species likely to begenerated in inorganic landfills.
Table 9.1 Summary of available gas treatment methods and possible application tocomponents of landfill gas
List of figuresFigure 6.1 Predicted hydrogen evolution profiles for pH 7 unsaturated conditions
and a mild steel thickness of 1 mm
Figure 6.2 Predicted hydrogen evolution profiles for pH 7 unsaturated conditionsand a mild steel thickness of 20 mm
Figure 6.3 Predicted hydrogen evolution profiles for pH 9.5 unsaturated conditionsand a mild steel thickness of 1 mm
Figure 6.4 Predicted hydrogen evolution profiles for pH 12 unsaturated conditionsand a mild steel thickness of 1 mm
Figure 6.5 Predicted hydrogen evolution rates for unsaturated conditions and a mildsteel thickness of 1 mm
Figure 6.6 Predicted variation of oxygen concentration with depth and time in asaturated landfill at pH 7 with an aerobic Top layer and corrosionoccurring in all lower layers
Figure 10.1 Regions of a landfill and general generation and consumption processesfor volatile species
Figure 10.2 Principal products and reactions – mixed waste, anaerobic, microbialaction
Figure 10.3 Principal products and reactions – inert waste, aerobic, very limitedmicrobial action


Science Report – Production gas production from landfilling of inorganic wastes 1
1 IntroductionThis desk study is the first phase of a programme to better identify and quantify thegases arising from landfilling of waste streams containing a high proportion of inorganicmaterial. The study aimed to:
• provide a scientific framework for assessing what gases may be produced;
• survey a selection of the published literature;
• review any relevant experience on dealing with gaseous emissions from varioustypes of inorganic waste.
The overall objective of the work described in this report is to identify those gases thatmight be produced by landfilled inorganic waste. Specific objectives are to:
• understand what wastes might generate gas, the chemistry of the processes thatgenerate the gas, and the methods that can be used to monitor and treat the gas;
• identify gaps in the data that might be relevant to gas production from wastes tobe landfilled in the UK.
The study consists of six tasks:
1. Specify potential waste inputs and resulting environments
2. Review the chemistry of gas production
3. Identify all potential volatile products
4. Review the technical literature on gases from inorganic waste
5. Identify potential methods for monitoring gaseous products
6. Identify potential methods for treating the off-gases from inorganic waste.
This report describes work carried out on the six tasks. The legislative frameworkgoverning landfill operation is outlined in Section 2 and estimates of the composition ofpotential waste streams are derived in Section 3. The chemical and microbiallymediated processes that may be involved are reviewed in Section 4 and thisinformation is used in Section 5 to assess likely volatile products from inorganicwastes. Section 6 estimates whether conditions in landfills with predominantly inorganicwastes might be generally anaerobic or aerobic through metal corrosion. Section 7discusses possible methods for monitoring and identifying gaseous products andSection 8 reviews methods that may be applicable to treating off gases with relativelylow methane content. Section 9 summarises the report and draws conclusions.

2 Science Report – Production gas production from landfilling of inorganic wastes
2 Legislation and landfilloperation
2.1 Site management and designThe Landfill Directive (1999/31/EC) has begun to change the way the UK handleswaste. The Directive was brought into force in England and Wales on 15 June 2002 asthe Landfill (England and Wales) Regulations 2002. It is being implemented on agradual basis as allowed by the legislation.
Article 4 of the Landfill Directive sets out three classes of landfill (Envirowise 2005):
• landfill for inert waste;
• landfill for non-hazardous waste;
• landfill for hazardous waste.
Hazardous waste is controlled in the European Union under:
• EU Hazardous Waste Directive (Council Directive 91/689/EC) (EnvironmentAgency 2003a);
• European Waste Catalogue (EWC) (2000/532/EC as amended by Decisions2001/118/EC, 2001/119/EC and 2001/573/EC) (CEU 2002).
Non-hazardous waste is waste that is not defined as hazardous. Inert waste is a subsetof non-hazardous waste that does not undergo significant chemical or biologicalreactions and does not pose a risk of pollution to the environment.
The acceptance of wastes at sites for inert and hazardous wastes are controlled byspecific Waste Acceptance Criteria (WAC), which introduce rigorous waste pre-treatment requirements.
Annex I of the Landfill Directive lays down general requirements for all types oflandfilling and covers (Envirowise 2005):
• choice of location with respect to population, geology, hydrogeology, andecology;
• water ingress and leachate management;
• use of geological and /or synthetic liners (and top liners following closure) forprotection of soil and groundwater. Permeability and thickness criteria are setfor each class of landfill (Table 2.1).
Generally, the landfill must also have an effective leachate collection system andlandfills receiving biodegradable waste must have a collection system for landfill gas –this being either used to produce energy or flared (Envirowise 2005).
The Landfill Directive is implemented in England and Wales through a PollutionPrevention and Control (PPC) permit scheme. Operators wishing to construct andoperate any of the three main types of site – or a cell for stable non-reactive hazardouswaste (SNRHW) within a non-hazardous site – must show through risk assessmentshow they propose to achieve the required standards for the type of site proposed.

Science Report – Production gas production from landfilling of inorganic wastes 3
Table 2.1 Lining requirements for landfills1
Attenuation layer (geological barrier)Landfill type Primary (sealing) liner Thickness (m) Hydraulic permeability2 (m s-1)Inert Not required ≥1 ≥1 × 10⁻⁷
Non-hazardous Required ≥1 ≥1 × 10⁻⁹
Hazardous Required ≥5 ≥1 × 10⁻⁹
Notes: 1 Environment Agency (2004a)2 Colloquial use – strictly hydraulic conductivity
2.2 Landfill gas
2.2.1 Gas management
The management of landfill gas at permitted landfills is covered primarily by the LandfillDirective. The overall aim of the Landfill Directive as expressed in Article 1:
‘by way of stringent operational and technical requirements on the wasteand landfills, to provide for measures, procedures and guidance to preventor reduce as far as possible negative effects on the environment, inparticular the pollution of surface water, groundwater, soil and air, and onthe global environment, including the greenhouse effect, as well as anyresulting risk to human health from landfilling of waste, during the wholelifecycle of the landfill’.1
Item 16 of the preamble to the Landfill Directive intimates that measures should betaken to reduce the production of methane and to control the landfill gas. This will, inpart, be achieved by:
• reducing the amount of biodegradable municipal waste (BMW) disposed ofto landfill;
• banning the deposit of certain wastes in landfills;
• pre-treating most wastes before their disposal to landfill.
Implementation of the Landfill Directive will result in a reduction of the volume of gasgenerated from waste. Changes in the waste composition may also result in asignificant change in the composition of landfill gas.
Appropriate measures must be taken to control the accumulation and migration oflandfill gas in all forms of landfill site. Landfill gas must be collected from all landfillsreceiving biodegradable waste and the landfill gas must be treated and, wherepossible, utilised. Landfill gas must be collected, treated and used in a manner thatminimises damage to, or deterioration of, the environment and risk to human health.
2.2.2 Gas composition
The Landfill Directive defines landfill gas as: ‘all the gases generated from landfilledwaste’.
Based on this definition, landfill gas includes:
1 See http://ec.europa.eu/environment/waste/landfill_index.htm

4 Science Report – Production gas production from landfilling of inorganic wastes
• compounds generated by the biodegradation of waste;
• compounds arising from chemical reactions;
• gases due to the volatilisation of chemicals from the waste.
Methane and carbon dioxide from the biodegradation of organic wastes are theprincipal gases produced by most current landfills in the UK. Typical proportions of thebulk compounds in landfill gas are given in Table 2.2.
Table 2.2 Typical range of bulk compounds in landfill gas1
Bulk landfill gas Typical value (%v/v) Observed maximum (%v/v)Methane 63.8 88.0Carbon dioxide 33.6 89.3Oxygen 0.16 20.92
Nitrogen 2.4 87.02
Hydrogen 0.05 21.1Water vapour (typical %w/w 25°C) 1.8 4.0
Notes: 1 Environment Agency (2004a)2 Close to the composition of air
Trace gases make up approximately 1 per cent by volume of typical landfill gas. Thesetrace components arise from processes such as:
• the volatilisation of organic solvents in the waste;
• biodegradation of certain components of the waste to produce hydrogensulphide or chloroethene (vinyl chloride);
• the corrosion of metals or reduction of inorganic components.
In landfill gas from municipal solid waste (MSW) landfills, the trace components aremixed within the bulk gas phase.
The following issues are of concern when considering minor components of landfill gas(Environment Agency 2002a):
• strong and often unpleasant odour that taints the landfill gas emission;
• contribution to the unpleasant character of condensate from gas lines;
• direct chemical attack on components in the gas management systems;
• generation of corrosive compounds on combustion as part of gas utilisationor management;
• potential harm to health from inhalation of particular compounds in gas;
• generation of potentially harmful substances on incomplete combustionduring gas utilisation or management;
• unusually strong impact as a greenhouse gas;
• unusually strong impact on ozone depletion.
Organic substances constitute the greatest variety of trace components in currentlandfill gas, but some organometallic compounds may be significant. Several inorganiccompounds, notably hydrogen sulphide (H2S) and water, are common tracecomponents (Environment Agency 2002a). The trace components originate from anumber of sources (Table 2.3).

Science Report – Production gas production from landfilling of inorganic wastes 5
Table 2.3 Example sources of trace components in landfill gasType of source ExamplesDirect sources • Out-gassing of waste
• Vaporisation of low boiling point liquids such as volatile organiccompounds (VOCs) in the waste
• Anaerobic respiration by microorganisms• Corrosion of metals• Chemical reactions between organic or inorganic substances• Microbial degradation of organic substances
Indirect sources • Equilibration of substances from the aqueous phase into the gasphase
• Gas stripping of substances from leachate as a result of forced flowthrough the liquid
• Aerosols carrying liquid phase• Dusts carrying material adsorbed on the solid
Approximately 500 trace compounds have been identified in landfill gas (EnvironmentAgency 2002a). Scott et al. (1988) divided the composition of trace landfill gas into 12generic groups:
hydrogen sulphide;
• alkanes (other than methane);
• alkenes;
• cyclic organic compounds (including aromatic compounds);
• halogenated compounds;
• alcohols;
• esters;
• carboxylic acids;
• amines;
• ethers;
• organosulphur compounds;
• other oxygenated compounds (principally ketones and furan derivatives).
2.2.3 Changes in landfill gas
Under the Landfill Directive a substantial proportion of biodegradable waste will bediverted away from landfill. There will be an increase in the disposal of secondarywastes containing a high proportion of inorganic material. These will include incineratorresidues and reject materials from other waste sorting or treatment activities. The resultwill be that;
• the volume of gaseous emissions from landfills in the future will be muchsmaller;
• the gas will have a different composition compared with existing landfills.
The changes in composition and combustibility of the landfill gas will require moredetailed consideration of the hazards from emissions previously disregarded asinsignificant trace components.

6 Science Report – Production gas production from landfilling of inorganic wastes
Sites for waste with low organic contents will require revised landfill gas managementpractices and the assessments of the risk from gas will be different. In particular, themonitoring needs will be unlike those of a site taking biodegradable wastes.
Thus, there is a need to understand:
• which gases may be produced from the landfilling of waste streamscontaining high proportions of inorganic materials;
• how these gases may be treated.

Science Report – Production gas production from landfilling of inorganic wastes 7
3 Potential waste inputs andresulting environments
3.1 Inputs to different types of landfill
Article 6 of the Landfill Directive specifies the waste types that can be assigned to thethree classes of landfill (Envirowise 2005).
• Only hazardous waste that fulfils the criteria set out in accordance withAnnex II of the Landfill Directive can be assigned to a hazardous landfill.
• Inert waste landfill sites can only be used for inert waste (as defined inArticle 2).
• Landfill for non-hazardous waste may be used for:
- municipal waste;
- non-hazardous waste complying with the acceptance criteria given inAnnex II of the Landfill Directive;
- stable, non-reactive hazardous wastes complying with the sameacceptance criteria. These hazardous wastes cannot be deposited incells for biodegradable, non-hazardous waste.
3.2 Waste inputsIn order to identify the reactions that could occur in current and future wastes, it isnecessary to estimate the likely composition of the waste streams. The range, type andrelative quantities of any wastes accepted into landfill sites will vary from one landfill tothe next, depending on the permit conditions and local waste producers.
There is no agreed ‘typical waste’ for the future sites containing mainly inorganicwastes and so, for the purposes of this project, national waste data were taken tocreate model landfill inventories on which to investigate potential gas generation.
Conceptual inventories were generated for three categories of landfill site – hazardous,non-hazardous and inert. In addition, monofilled cells within a non-hazardous site wereconsidered based on asbestos or gypsum wastes as the waste stream. Finally,monofilled cells containing air pollution control (APC) residues were considered for ahazardous waste site.
The methodology for estimating the model inventories for the mixed hazardous andmixed non-hazardous landfills uses data from the Environment Agency’s HazardousWaste Interrogator (Environment Agency 2005a) and is given in Appendix A.
Table 3.1 gives the estimated composition of wastes that may be assigned tohazardous and non-hazardous waste landfills based on this methodology. However,these representative mixed waste inventories are based on an appreciable amount ofexpert judgement rather than detailed information on analyses of the variouscomponent waste steams. Although this is sufficient for this initial scoping exercise,these estimates should be reviewed as actual waste input information becomes

8 Science Report – Production gas production from landfilling of inorganic wastes
available. In addition, if more waste is incinerated, this could have a significant impacton the composition of the residues going to landfill.
Table 3.1 Estimated annual notional model inventories for future mixedhazardous and mixed non-hazardous wastes disposed to landfill
Mixed hazardous landfill Mixed non-hazardous landfillClass of materialTotal estimatedmass (tonnes)
% of totalby mass
Total estimatedmass (tonnes)
% of totalby mass
Iron and steel 1,230 1.1 7,920 5.4Aluminium as metal 560 0.5 2,710 1.8Zinc as metal 450 0.4 120 0.1Cements and alkalinesolids 160 0.1 19,600 13.3
Recalcitrant organicmaterials 750 0.6 17,400 11.8
Oils 5,270 4.6 350 0.3Other non-halogenatedorganics and residues 1,220 1.1 13 0.0
Halogenated solventsand residues 1,430 1.2 11 0
Polyvinyl chloride (PVC) 11 0.0 1,060 0.7Wood and paper 190 0.2 20,700 14.1Other inorganicchemicals and othermaterials
66,300 57.5 12,600 8.6
Inert1 36,300 31.5 64,900 44.0Lead 1380 1.2 23 0.0Total (tonnes/year) 115,251 100 147,407 100.1
Notes: 1 Assumed inert in terms of ability to generate gas; not as defined by WAC.
3.2.1 Hazardous waste
Table 3.1 gives the model inventory for mixed hazardous waste disposed to landfill. Interms of percentage by weight, the composition is dominated by ‘other inorganicchemicals and other materials’ (58 per cent) and ‘inert material’2 (32 per cent).Together these account for approximately 90 per cent of the total landfilled hazardouswaste.
Less abundant constituents include:
• oils (5 per cent);
• lead (1 per cent);
• iron and steel (1 per cent);
• halogenated solvents and residues (1 per cent);
• ‘other’ non-halogenated organic compounds and residues (1 per cent);
• recalcitrant organic materials (0.6 per cent);
• aluminium (0.5 per cent);
• zinc (0.4 per cent).
Paper, cardboard, etc. form only 0.2 per cent of the mass of the waste.
2 Inert in terms of gas generation potential, not in terms of the definition provided by Waste Acceptance Criteria

Science Report – Production gas production from landfilling of inorganic wastes 9
Although cements and alkaline solids only contribute 0.1 per cent of the total, it ispossible that some wastes will be immobilised in cement and that this therefore is anunderestimate.
3.2.2 Non-hazardous waste
Table 3.1 gives the model inventory for mixed non-hazardous waste disposed tolandfill. In terms of percentage by weight, the largest category is ‘inert material’2 (44 percent). Lesser contributions, in decreasing amounts, are provided by:
• wood and paper (14 per cent);
• cements and alkaline solids (13 per cent);
• recalcitrant organic materials (12 per cent);
• other inorganic chemicals and other materials (9 per cent);
• iron and steel as metal (5 per cent).
Together these six categories account for approximately 97 per cent of the totallandfilled non-hazardous waste. Less abundant constituents include aluminium asmetal (2 per cent) and PVC (0.7 per cent).
3.2.3 Inert waste
The types of waste acceptable in an inert waste landfill are given in Table 3.2. Thesecan be broadly classified as:
• uncontaminated glass wastes from various sources;
• uncontaminated concrete, brick, tile and ceramics from construction anddemolition (C&D);
• uncontaminated soil and stones from construction and demolition (C&D)sites, gardens and parks.
As most of these materials are inert (only low levels of plastics, metals, wood, rubberand other organic materials are permitted in these C&D wastes), no attempt was madeto develop an approximate composition for these wastes if mixed in a landfill.
Table 3.3 gives the total amount of C&D wastes disposed to landfill in 2001 in Englandand Wales.
Table 3.2 Wastes acceptable in an inert landfill1
EWC code Description Other information
10 11 03Waste glass-based fibrous materialsfrom manufacture of glass and glassproducts
Only without organic binders
15 01 07 Glass packaging (including separatelycollected municipal packaging waste) –
17 01 01 Concrete (C&D wastes) Low content of plastics, metals,organic, wood, rubber etc.
17 01 02 Bricks (C&D wastes) Low content of plastics, metals,organic, wood, rubber etc.
17 01 03 Tiles and ceramics (C&D wastes) Low content of plastics, metals,organic, wood, rubber etc.
17 01 07 Mixtures of concrete, bricks, tiles andceramics (C&D wastes)
Low content of plastics, metals,organic, wood, rubber etc.

10 Science Report – Production gas production from landfilling of inorganic wastes
EWC code Description Other information
17 02 02 Glass (C&D wastes) Low content of plastics, metals,organic, wood, rubber etc.
17 05 04 Soil and stones (C&D wastes) –
19 12 05 Glass from mechanical treatment(crushing etc.) not otherwise specified –
20 01 02 Glass (separately collected fractionfrom MSW (excluding 15 01) –
20 02 02 Soil and stones (garden and parkwastes) –
Notes: 1 Environment Agency (2002b)
Table 3.3 Estimates for England and Wales of C&D wastes sent to landfill, 20011
Waste description Total (tonnes)2
Clean, unmixed hard C&D waste disposed of at landfills 239,000Mixed and/or contaminated hard C&D waste disposed of at landfills 394,000Clean excavation waste disposed of at landfills 652,000Mixed and/or contaminated excavation waste disposed of at landfills 1,318,000Mixed construction, demolition and excavation waste (CDEW) andunspecified materials disposed of at landfills 1,619,000
Total 4,222,000
Notes: 1 Symonds Group (2005)2 These totals include contaminated waste that would be unsuitable for disposal at an inertlandfill.
3.2.4 Monofilled wastes
Two model cells containing asbestos or gypsum (high sulphate) wastes wereconsidered for a non-hazardous waste site and an APC residues monofill cell wasgenerated for a hazardous waste site. Monofills were assumed to contain single orclosely-related waste streams.
Asbestos wastes
Asbestos waste appears to be dominated by two waste streams from the constructionand demolition industry. As described in the EWC, these are:
• 17 06 01 Insulation materials containing asbestos (M)3 – 88,700 tonnes in2001 (Symonds 2005);
• 17 06 05 Construction materials containing asbestos (M) – 297,400 tonnesin 2001 (Symonds 2005).
Waste stream 17 06 05 was assumed to be 17 per cent white asbestos with theremainder mostly being concrete (e.g. asbestos-cement sheet, etc.) although smallamounts of glass, steel and wood are also likely to be present.
About 50 per cent of waste stream 17 06 01 was assumed to be fibrous asbestosinsulation with the remainder being glass fibre. Plastic material used in bagging andcontainment will also be present.
3 See Appendix A of Technical Guidance WM2 (Environment Agency 2003a) for an explanation ofabsolute (A) and mirror (M) entries in the European Waste Catalogue.

Science Report – Production gas production from landfilling of inorganic wastes 11
In addition, some asbestos wastes could contain the residues of polyvinyl alcohol usedin sprays to suppress dust during asbestos removal and may also include used itemsof clothing and safety equipment. Foams (e.g. urea formaldehyde-based materials)may also be present. These additional materials will make up a very variable proportionof the waste stream but are assumed here to be only a few percent of the total weight.
Gypsum wastes
Gypsum wastes were assumed to consist of plasterboard and similar products. Ingeneral, plasterboard consists of a core of calcium sulphate dihydrate encased inpaper liners. Minor additives include starch, foaming agents and dispersants.Fibreboard is plasterboard with a glass fibre fleece. Moisture-resistant boards and coreboard contain a silicone additive. Fire-resistant boards and core board include smallquantities of glass fibre and vermiculite. Foil-backed boards are backed with ametallised polyester film.
It was assumed that the waste consisted of:
• 97.4 per cent gypsum;
• 1 per cent paper;
• 1 per cent glass fibre;
• 0.1 per cent starch, foaming agents, dispersants, glass fibre, vermiculite;
• 0.5 per cent metallised polyester film.
The most appropriate EWC code for gypsum wastes arising from construction ordemolition work is likely to be 17 09 04 (mixed construction and demolition wastesother than those mentioned in 17 09 01, 17 09 02 and 17 09 03). This is used mostfrequently as describing a mixed load from a typical construction site (SEPA 2004).
Where separate production and collection takes place such that the most appropriatewaste code is 17 08 02 (gypsum-based construction materials other than thosementioned in 17 08 01), subsequent disposal will be required against the criteria of theLandfill Directive, i.e. to a separate cell (SEPA 2004).
The limit for the total organic carbon content of wastes landfilled together with gypsum-based materials is 5 per cent (SEPA 2004).
APC residues
APC residues are obtained from flue gas treatment at MSW incinerators (19 01 07,solid wastes from gas treatment (A) from incineration or pyrolysis of waste)
APC residues have a high alkalinity (pH 12) due to the unreacted lime content of thewaste stream and consist of:
• large amounts of calcium, chlorides, sulphates, carbonates, sodium andpotassium;
• fine fly ash particles;
• dioxins and furans;
• heavy metal salts.
Indicative metal concentrations are given in Table 3.4.

12 Science Report – Production gas production from landfilling of inorganic wastes
Some APC residues were landfilled directly either in dry bagged form or mixed withwater. The latter washes out some of the free lime, reduces the alkalinity and exploitsthe pozzolanic properties of the material to solidify the material into a monolithic waste.There is ongoing research into the properties and treatment of APC residues as currentmethods failed to meet the requirements of the full WAC when these came into force inJuly 2005. One option is to mix with cement to solidify the waste and reduce theleachability of some of the components of the waste.
Table 3.5 shows some elemental concentrations in a sample of MSW incineratorbottom ash from Bavaria, Germany.
A study of the sustainable landfill concept for predominantly inorganic wastes in theNetherlands was reported at the Ninth Sardinia International Waste Management andLandfill Symposium (van der Sloot et al. 2003). The project is an initiative of Alvalzorg,Essent, VBM and Stainkoeln, and involves a combination of laboratory simulations, testwaste lysimeters and a 12,000 m3 demonstration cell of predominantly inorganicwastes. The project is concerned primarily with leachate quality and no measurementof landfill gas generation was reported. The species detected in the leachate from thetest inorganic cell are summarised in Table 3.6.
Table 3.4 Indicative metal concentrations in air pollution control residuesMetal Concentration3 UnitsStudy 11
Zn 6.2 g kg-1
Pb 2.4 g kg-1
Fe 1.7 g kg-1
Mg 7.9 g kg-1
Cu 550 10-3g kg-1
Mn 340 10-3g kg-1
Cr 100 10-3g kg-1
Cd 91 10-3g kg-1
Study 22
Cd 210 10-3g kg-1
Cu 2,500 10-3g kg-1
Mo 82 10-3g kg-1
Pb 3,000 10-3g kg-1
Sb 500 10-3g kg-1
Zn 4,500 10-3g kg-1
As 36 10-3g kg-1
Cr 1,200 10-3g kg-1
Notes: 1 Ferreria et al. (2003)2 van der Sloot et al. (2001)3 Rounded to two significant figures

Science Report – Production gas production from landfilling of inorganic wastes 13
Table 3.5 Trace element concentrations in a sample of Bavarian MSWI bottomash1
Element Concentration2 (10-3g kg-1)As 8.2Cd 8.1Co 15Cr 180Cu 2,800Mn 1,400Ni 130Pb 1,100Sb 53Zn 3,600
Notes: 1 Weigand et al. (2003)2 Rounded to two significant figures
Table 3.6 Leachate composition from 12,000 m3 test cell of inorganic wastes atpilot demonstration project at Nauernasche Polder Landfill, NetherlandsSubstance/parameter mg kg-1 Substance/parameter mg kg-1
pH 7.2 Hg 7.0 x 10⁻⁷
As 0.13 Mo 0.12Ba 0.5 Ni 0.14Cd 0.02 Pb 0.35Cl 3,300 Sulphate 12,0002
Cr 0.019 Sb 0.06Cu 0.038 Se 0.05DOC3 350 Zn 0.8
Notes: 1 van der Sloot et al. (2003)2 Rounded to two significant figures3 DOC= dissolved organic carbon
3.3 Evolution of waste environments in landfills
3.3.1 General issues
A number of general issues arise when considering the evolution of conditions withinthe different types of landfill.
There will be a heterogeneous distribution of waste types within the landfill. This meansthat the chemical conditions in regions of the cells may be quite different for longperiods of time.
Water will provide a reagent by which chemical reactions (e.g. hydrolysis) may occurand a reaction medium through which the chemical conditions within a cell begin toequilibrate. The more diverse the types of waste, the longer it may take for conditionsto approach what could be described as near steady-state or equilibrium. Therefore, itis easier to consider the evolution of conditions within a monofilled cell than in a landfillcontaining mixed waste.
The presence of a continuous aqueous medium throughout a landfill cannot beassumed. Water is expected to enter a landfill from above as rainfall percolatingthrough the surface or cap. Inert landfills need have no liner and so water may alsoenter through the base and the sides of the landfill. Some limited water ingress throughthe liner may occur at engineered landfill sites with hydraulic containment (hazardousand non-hazardous). If parts of the liner fail, water can also enter through the base and

14 Science Report – Production gas production from landfilling of inorganic wastes
sides of these landfills, restricted only by the performance of the attenuation layer(Table 2.1).
During operation of the landfill, leachate would not generally be allowed to accumulateand would be drained via a suitable collection system and treated. Thus, although thewaste may be damp, saturated conditions may exist only at the base of the landfill or inregions of the waste above impermeable waste deposits (perched water).
The amount of water saturation throughout the wastes and the degree of failure of anywaste containment (e.g. metal drums, polythene drums, bottles and sacks) willdetermine how rapidly reactions occur within the waste body. The dryer the landfill, theslower will be the expected rate of the general chemical reactions, and thus the slowerthe evolution of uniform conditions for parameters such as pH, redox potential andleachate composition. The possible evolution of anaerobic conditions due to metalcorrosion and the effect on gas generation from iron and steel are considered in moredetail in Section 6.
After closure of the landfill but while management of the site continues, it is expectedthat leachate would continue to be collected and treated. At some point, however, thisis likely to cease and it is possible that a landfill cell could eventually fill with leachate.This is made more probable since it is likely that the cap to the landfill would fail prior tosignificant failure of the containment provided by the engineered base and sides of alined landfill. At some point, sufficient water would be present to allow conditions in thelandfill to approach steady-state or equilibrium. However, this could be many yearsafter closure of the site.
The small amounts of putrescible materials in the predominantly inorganic wastelandfills mean that microbial action will be restricted. In addition, many of the wasteswithin mixed waste landfills would pose hostile local environments where microbialactivity is unlikely. However, soil and dusts containing microorganisms will be blowninto the site and carried on some wastes. These will create an inoculum for microbialgrowth in favourable locations. The general picture of microbial action in these landfillsis one of activity where conditions are most favourable. These favourable environmentswill probably increase as the system evolves over time. The microbial populations willalso adapt to the imposed conditions. The timescale for this and the rates at whichmicrobial processes occur are currently uncertain.
3.3.2 Hazardous waste environment
The major class of materials in the model mixed hazardous waste inventory (Table 3.1)is ‘other inorganic chemicals and other materials’. It is not possible to conclude whatthe effect of these will be on the chemical conditions in the landfill as there isinsufficient detail on the nature of these wastes.
The mixed hazardous waste inventory also contains a considerable amount of materialthat was assigned as inert waste (32 per cent) in terms of its ability to generate gas orinfluence the chemical conditions. This is considered not to influence the chemicalconditions in the landfill.
Cements and alkaline solids form only 0.1 per cent of the total, but, as noted in Section3.2.1, the use of cements to treat some wastes may be under-represented in the modelinventory. Therefore, it is not possible to comment in detail on how the pH of the landfillmay develop. As acids are excluded from landfill, it can be postulated that the presenceof sufficient cements and alkaline solids would tend to drive the pH towards alkalinity ina well-mixed system. A better definition of the inventory in a landfill or cell would enablethis to be addressed in more detail, although a fully-mixed system would still have to beassumed.

Science Report – Production gas production from landfilling of inorganic wastes 15
The presence of iron and steel (1 per cent), aluminium (0.5 per cent) and zinc (0.4 percent) as metal means there is the potential to generate hydrogen through corrosion.This is discussed in more detail in Section 6.
The small amount of wood and paper (0.2 per cent) could result in the generation ofcarbon dioxide and methane by microorganisms. It is also possible that some of thenon-halogenated organic wastes (1 per cent) may be degraded readily by microbialaction. But widespread microbial activity may be hindered by chemical conditions ifthese are highly alkaline. The initial microbial inoculum would also be low comparedwith an existing MSW landfill.
Amounts of methane and carbon dioxide at four investigated landfills acceptingdemolition and ‘difficult’ wastes show methane concentrations of 0–30 per cent andcarbon dioxide concentrations of 0–20 per cent (Westlake et al.1991), though there isno indication of the flux of these gases from the waste.
3.3.3 Non-hazardous waste environment
Key differences (Table 3.1) between the model non-hazardous waste inventory and themixed hazardous waste inventory are the former’s higher proportions of:
• wood and paper (14 per cent);
• cements and alkaline solids (13 per cent);
• recalcitrant organic material (12 per cent);
• iron and steel (5 per cent);
• aluminium (2 per cent).
The ‘other inorganic chemicals and other materials content’ is 9 per cent – much lowerthan the hazardous waste inventory. The inventory is dominated by inert material (44per cent). There is more potential for bulk gas generation from the non-hazardouswaste than from the hazardous waste due to its higher metal, wood and paper content.
It can be postulated that the presence of larger amount of cements and alkaline solidswould tend to drive the pH towards alkalinity in a well-mixed system. But because ofthe uncertainty about the nature of many of the chemicals and other materials disposedof, it is possible that the alkaline buffering capacity of the cements may be consumed.A better definition of the inventory in a landfill or cell would enable this to be addressedin more detail, though a fully-mixed system would have to be assumed.
3.3.4 Inert waste environment
Conditions in parts of an inert waste landfill are expected to be alkaline (e.g. pH 12.5)due to the significant amounts of cement and concrete in the waste. Carbonation of thesurfaces of cement and concrete may result in the evolution of a slightly less alkalinepH.
Hydrogen may be produced from the small amount of iron and steel present ifconditions become anaerobic.
Where soil is landfilled, it will provide a microbial inoculum and small amounts ofcarbon dioxide (and methane if conditions become anaerobic) may be generated fromany traces of wood and cellulosic materials that are also landfilled. Data given byWestlake et al. (1991) and cited by Williams (2005) show detectable amounts ofmethane and carbon dioxide in landfill gas at some of six investigated landfillsaccepting demolition and ‘inert’ wastes (Table 3.7).

16 Science Report – Production gas production from landfilling of inorganic wastes
No leachate analyses were reported for Sites 24, 25 and 26. However, leachate fromSite 21 had a higher chemical oxygen demand (COD) and total organic carbon (TOC)concentration than Sites 22 or 23. Leachate from all the sites had a pH value of morethan 7.0 (Westlake et al. 1991).
However, sites permitted for inert waste will exclude some of the more degradablematerials that could have been placed in sites classified as inert under the WasteManagement Licensing (WML) scheme. Hence gas generation from permitted sitesshould be extremely low.
Table 3.7 Proportions of methane and carbon dioxide in landfill gas from sixsites accepting demolition and ‘inert’ wastes1
Site Methane (%) Carbon dioxide (%)21 0 322 0 123 0 024 2 1025 4 526 55 35
Notes: 1 Westlake et al. (1991)
3.3.5 Monofilled waste environments
Asbestos and gypsum wastes were considered as they are the two waste streams tobe landfilled in separate cells in a non-hazardous landfill.
The presence of asbestos cement in asbestos wastes will lead to the development ofan alkaline pH as discussed above for inert waste. Again there is the possibility of thegeneration of small amounts of hydrogen, carbon dioxide (and methane) from a cellcontaining these wastes due to traces of iron, steel and wood. However, the initialmicrobial inoculum will be much lower compared with inert waste as no waste soilshould be placed in the cell.
Within gypsum waste, there is the potential for hydrogen sulphide production due to theactivity of sulphate-reducing bacteria (SRB). This potential will be lessened byexcluding other materials (e.g. putrescibles and other organic material) from the cell.
In addition, a separate cell in a non-hazardous waste landfill is required to besufficiently self-contained. The following principles are applied (SEPA 2004):
• no physical contact with any other wastes except suitable inert wastes usedas cover materials;
• the purpose of any engineered barriers is to separate physically the wastetypes;
• the design and location of the cell should minimise the need for leachatemanagement within the cell;
• there should be limited, if any, contact of landfill gas and leachate from thebiodegradable wastes with the gypsum wastes;
• the gypsum waste cell must not compromise the landfill gas and leachatemanagement of the biodegradable waste cells.
However, it may be difficult to minimise the need for leachate management.
In addition, the waste cells will contain some organic material (e.g. paper liners onplasterboard) and it is probable that hydrogen sulphide will be generated from lowlevels of microbial activity. At some point in the future after the failure of the cell cap or

Science Report – Production gas production from landfilling of inorganic wastes 17
liner, it is probable that organic material could enter the cell via surface water orgroundwater. This could lead to the possibility of continued hydrogen sulphideproduction.
A monofilled cell containing untreated APC residues will have a high pH (~12) due tothe presence of unreacted lime. Since July 2005, these wastes have had to be treatedprior to landfilling. Although there should be no bulk degradable organic materials,dioxins and furans may be present in small quantities. The waste also containssulphates and heavy metals.
It is probable that some of the waste would not develop chemically reducing conditionsand microbial action would be restricted by the hostile, highly alkaline conditions.However, it would appear that there is the potential for slow evolution of trace gasesfrom:
• microbial action in protected niches (e.g. H2S from sulphate);
• products from any reactions with finely divided metals and salts;
• VOCs from the organic content of the residues.
Aluminium particles occur in incinerator bottom ash and fly ash and will corrode underalkaline conditions (see Section 4.1.2) to produce hydrogen (Mizutani et al. 2000,Magel et al. 2001).
Hydrogen generation in a Bavarian monofill for bottom ash and gas cleaning residuesfrom a MSW incinerator has occurred since 1977, a year after opening, and isexpected to continue for several decades (Magel et al. 2001). Samples of bottom ashcontained 0.5–4.3 volume per cent total metal, similar to a cited total metal content of2.1 weight per cent (1.1 weight per cent aluminium, 0.6 weight per cent copper and 0.4weight per cent iron) in another study (Burg 1999, cited in Magel et al. 2001).
Peak temperatures of 87°C were measured within a German landfill for MSWincinerator ash three months after disposal (Klein et al. 2001) due to reactionsoccurring within the ash.
Mizutani et al. (2000) describe two accidents involving hydrogen generation from MSWincinerator ash. Their study found that the hydrogen generation potential of fly ash fromfluidised bed incinerators was greater than from stoker incinerators and was correlatedwith reducing potential.

18 Science Report – Production gas production from landfilling of inorganic wastes
4 Potential gas productionprocesses
Most research on the generation of gas from existing landfills has focused on wastescontaining a high proportion of putrescible materials and the consequent need tomanage the biogas they produce. In these circumstances, microbial respiration and thebiodegradation of organic material to produce methane and carbon dioxide dominategas evolution. Very limited investigation has been made of gas generation from sitescontaining little or no degradable organic material. Chemical reactions rather thanmicrobial action are likely to be important factors in the generation of bulk gas underthese conditions.
Gas generation processes in a landfill containing small amounts of degradable organicmaterial may be similar to those that could occur in repositories for radioactive wastewhere putrescible organic materials are excluded. Substantial R&D programmes havebeen conducted in support of the assessments of various repository designs.Therefore, the understanding developed for such repositories (see, for example, Biddleet al. 1987), has some application to shallow landfills provided allowance is made fordifferent chemical and physical environments.
Reports relating to the US Department of Energy Waste Isolation Pilot Plant (WIPP)(USDOE 2000) and the Yucca Mountain Geological Repository (USDOE 2002)consider non-radioactive emissions to air of nitrogen dioxide (NO2), carbon monoxide(CO), particulate matter from vehicle and generator exhaust during repositoryoperation. Consideration of gaseous emissions included small quantities of VOCs,which may accumulate in the headspace of the waste packages.
In general, the principal gases generated from radioactive wastes in undergroundrepositories are judged to be (Rodwell et al. 1999, 2004):
• hydrogen (H2) from the corrosion of metals;
• carbon dioxide (CO2) and methane (CH4) from the microbially mediateddegradation of organic materials.
The production of other gases that might occur in trace quantities was also consideredin these assessments. The most significant radioactive gases produced are tritiatedhydrogen, and carbon-14 substituted methane and carbon dioxide; radioactive gaseousemissions from waste packages may also include radon-222 and radioactive noblegases (principally krypton-85).
As part of the Nirex research programme in the UK into options for the long-termmanagement of intermediate-level and some low-level radioactive wastes, thegeneration of gas in a radioactive waste repository containing such wastes wasconsidered (Biddle and Moreton 1995). In contrast to MSW landfills, putrescible wastesare excluded and the organic material consists mostly of cellulose-containing wastes(paper, cardboard, wood) and a range of synthetic polymers (PVC, polythene, etc).Much of this work focused on the bulk gases arising for the corrosion of metals(hydrogen) and from the microbial degradation of organic materials (methane, carbondioxide) (Nirex 1997, Nirex 2001, Hoch and Rodwell 2003).
This work is particularly relevant to the issue of hydrogen production from landfilledwastes with a relatively low organic content that are in contact with alkaline materials(e.g. concrete and cements from C&D wastes) or wastes that are alkaline (e.g. APCresidues, waste immobilised in cement).

Science Report – Production gas production from landfilling of inorganic wastes 19
Biddle et al. (1998) considered the post-closure evolution of minor active and toxicgases for a radioactive waste repository in the UK. Those identified are given inTable 4.1. They include gases whose most likely mode of generation was considered,in the context of that work, to be due to radiolysis (denoted by an R in the secondcolumn of Table 4.1), with hydrogen atoms and methyl and other organic radicals beingimportant intermediates. Although radiolysis is not applicable to a landfill, these entriesare retained for completeness (alternative routes for their production are identified inthe discussion below).
Typical uses of a number of elements with potential volatile inorganic or organometallic(alkylated or carbonyl) compounds are given in Table 4.2. These examples show thatall these elements are likely to be present in wastes disposed to mixed waste landfills.
The main reactions that might generate gaseous products in a landfill with a highproportion of inorganic wastes are considered in three main classes below.
• The chemical reactions that result in hydrogen formation are dealt with inSection 4.1.
• Other chemical reactions that could generate gas are considered in Section4.2.
• Microbial gas generation in environments with low proportions of organicmaterial are covered in Section 4.3.
Finally, substances that may be volatilised from deposited waste are summarised inSection 4.4.
Table 4.1 Minor toxic gases that might form in a radioactive waste repository1
Gas Method of formation2 Reactive in repository?CH3X (X = halogen) Mainly R (CH4 or CH3 + HX or X2) May be hydrolysed(CH3)2Se R (Se + CH3) May be hydrolysedCl2 R Very reactiveHCl R and C (from organic waste) Very reactiveHI R and C (from organic waste) Very reactiveSnH4 R (Sn + H) UnstablePbH4 R (Pb + H) May not existSbH3 R (Sb + H) UnstableBiH3 R (Bi + H) UnstableNi(CO)4 C (Ni + CO) UnstableH2Se R (Se + H) Forms metal selenidesH2S R (S+ H) Forms metal sulphidesNH3 R (reactions involving NH4, NO3
trapped N2, N-containing polymers)Stable but very soluble
I2 R Unstable (goes to iodide)HSeCH3
3) R (Se, H, CH3) Probably unstableHSCH3
3) R (S, H, CH3) Probably reactiveMeSnH3
4) R (Sn, H, CH3) Probably reactiveMePbH3
4) R (Pb, H, CH3) Probably reactiveCO R and M (organics) Fairly reactiveOrganic gases andvapours other than CH4
R, C and M (organics) Some are reactive
Notes: 1 Adapted from Biddle et al. (1998).2 R = radiolytic; C = chemical; M = microbial.3 And similar compounds containing larger alkyl groups.4 And similar compounds containing additional and/or larger alkyl groups.

20 Science Report – Production gas production from landfilling of inorganic wastes
Table 4.2 Typical uses of elements with common volatile inorganic, alkylated orcarbonyl compounds1
Element Typical uses of the element and its compoundsAntimony Semiconductors, lead alloys, batteries, anti-friction alloys, cable sheathing,
paints, ceramics, glasses, pottery, medicineArsenic Bronzing, pyrotechnics, doping agent for electronics industryBismuth Malleable iron, acrylic catalyst, thermocouples, fire detection, cosmetics,
medicineBromine Fumigants, water purification, dyes, medicines, flame-proofing agents,
photographyChlorine Water industry, paper production, dyestuffs, plastics, insecticides, cleaning
products and many other consumer items, organic solventsFluorine Chemicals and plastics, glass etching, refrigerants, toothpaste, water industryGermanium Electronics, alloys, fluorescent lamps, catalysts, infrared opticsIodine Medicine, photography, food industryLead Batteries, plumbing, radiation shielding, roofing, old paints, glassMercury Thermometers, barometers, diffusion pumps, batteries, lighting, caustic soda
and chlorine production, dentistry, pesticidesMolybdenum High-strength steels, electrodes in glass industry, aviation industry, catalysis,
electrical filaments, lubricants (MoS2)Nickel Stainless steel, nickel steel armour plate, glass production, nickel plating,
catalysts, electroplatingPhosphorus Safety matches, pyrotechnics, fertilizers, glass, steels, water softeners,
pesticidesSelenium Photovoltaics and photoconductors, rectifiers, semiconductors, photocopying,
glass production, stainless steelSilicon Electronics, silicones, glass manufacture (silica), lubricantsSulphur Sulphuric acid, fertilisers, rubber vulcanisation, fungicides and fumigants,
bleaching and preservative in food industry, paper production,Tellurium Semiconductors, alloys with cast iron, copper and stainless steel, lead
additive, ceramic and glassTin Metal coatings (tin cans), alloys (soft solder, pewter, bronze, etc.), electrically
conductive coatings, float glass (molten tin), biocidesTungsten Electrical filaments, glass-metal seals, automobile contact points, X-ray
targets, furnace windings, tool steels, tungsten carbide, fluorescent lighting,chemical and tanning industries, lubricant (WS2), paints
Notes: 1 Data taken from WebElements™ Periodic Table (professional edition), copyright M. Winter,University of Sheffield, 1993–2006 (http://www.webelements.com).
4.1 Hydrogen production from metal corrosion
4.1.1 Iron and steel
The corrosion of iron and steel under alkaline or neutral conditions only leads to thegeneration of hydrogen under anaerobic conditions:
3Fe + 4H2O = Fe3O4 + 4H2
This consists of two stages (Naish et al. 2001):
Fe + 2H2O = Fe(OH)2 + H2, followed by
3Fe(OH)2 = Fe3O4 + 2H2O + H2
Although Fe3O4 (magnetite) is the thermodynamically favoured end product, Fe(OH)2may be formed at temperatures below 60ºC as the conversion reaction to magnetite isinhibited.

Science Report – Production gas production from landfilling of inorganic wastes 21
Under aerobic conditions, corrosion of iron may be represented by:
4Fe + 3O2 = 2Fe2O3; or
4Fe + 6H2O + 3O2 = 4Fe(OH)3
As conditions evolve from aerobic to anaerobic, oxide film reduction occurs:
4Fe2O3 + Fe = 3Fe3O4
2Fe(OH)3 + 4Fe + 2H2O = 2Fe3O4 + 5H2
Under acidic conditions, the corrosion of iron and steel produces hydrogen by thereaction:
Fe + 2H+ = Fe2+ + H2
The rates of corrosion reactions depend on:
• pH
• surface area
• temperature
• iron and steel composition.
The total amount of hydrogen produced depends on the amounts of iron and steel thatcorrode under anaerobic conditions. The rates and chemistry of steel corrosion underneutral and alkaline conditions are reviewed by Smart (2002).
4.1.2 Aluminium
Aluminium corrodes according to the equation:
Al + 3H2O = Al(OH)3 + 1.5H2
The corrosion of aluminium at neutral pH values produces a protective corrosion film ofaluminium oxide and aluminium hydroxide. This explains its resistance to corrosiondespite the fact that aluminium is highly electropositive (Cotton et al. 1999). Aluminiumoxide and hydroxide are amphoteric and dissolve under acidic or alkaline conditions,thereby exposing the aluminium surface to further corrosion and increasing the overallrate of corrosion.
The main constituent of the corrosion film at high rates of corrosion is aluminiumhydroxide, although aluminium oxide may be formed at low rates of corrosion. Thealuminium hydroxide film is porous and the rate of corrosion of the underlying metalsurface depends on the thickness of the film. This is turn is determined by the pH andcomposition of the solution in contact with the metal. For example, the presence ofcalcium in solution leads to the formation of calcium aluminate in the corrosion film,which reduces the rate of corrosion. In contrast, dissolved sodium and potassiuminteract with the corrosion film so as to increase the rate of corrosion.
The rate of alkaline corrosion of aluminium particles in landfilled incinerator bottom ashis reduced by their inclusion in glass formed during combustion or by the formation ofalteration products on the surface of aluminium particles (Magel et al. 2001). Althoughthe presence of chloride in solution does not affect the general corrosion rate ofaluminium in sodium, potassium or calcium hydroxide solutions, or in cementitiousmaterials, it promotes galvanic coupling of aluminium in contact with iron and steel.This leads to an enhanced rate of aluminium corrosion, which is dependent on pH.
These reactions are not affected by redox conditions.

22 Science Report – Production gas production from landfilling of inorganic wastes
4.1.3 Zinc
Zinc reacts readily with non-oxidising acids releasing hydrogen (Cotton and Wilkinson1980):
Zn + 2H+ = Zn2+ + H2
Zinc also dissolves in strong bases to release hydrogen:
Zn + 2OH- = ZnO22- + H2
These reactions are not affected by redox conditions.
4.1.4 Other metals
Lead will dissolve in some acids and is slowly attacked by cold alkali. Cotton et al.(1999) note that lead often appears to be more noble and unreactive than its standardhalf cell potential of -0.13V would suggest. This is attributed to a high overvoltage forhydrogen and, in some cases, to insoluble surface coatings. Lead does not dissolve indilute sulphuric or concentrated hydrochloric acid (Cotton et al. 1999). Its resistance tocorrosion has led to its widespread historic use in roofing, water pipework and thechemical industry.
Tin dissolves in some acids to form tin(II) and hydrogen, and is slowly attacked by coldalkali. It has a similar standard potential to lead.
Metallic copper is stable in water in the absence of oxygen and is unreactive towardsnon-oxidising acids in the absence of air. It readily dissolves in nitric acid and sulphuricacid in the presence of oxygen (Cotton et al. 1999). The standard half cell potential forcopper is +0.34V and it is therefore more resistant to corrosion than lead. In thepresence of sulphide, copper will react to form copper sulphide and hydrogen:
2Cu + H2S = Cu2S + H2
However, sulphide will be scavenged from solution by the precipitation of sulphides ofmany other metals. Therefore, the amount of hydrogen evolved will depend on thewater chemistry at the copper surface. The high resistance of copper to generalcorrosion in the absence of air at near-neutral pH values has led to its proposed use asa container material for the disposal of radioactive spent fuel and vitrified high-levelwaste (see, for example, Sjöblom et al. 1995).
Cadmium is similar in behaviour to zinc, reacting with non-oxidising acids to givehydrogen. However, it does not react with alkali. Mercury is inert to non-oxidising acids.
4.1.5 Galvanic processes
If an electrical circuit is created by the coupling of two dissimilar metals in the presenceof water or other electrolytes, galvanic corrosion can occur. In this form of corrosion anelectrical circuit is formed and a potential difference established. The less noble metal(the anode) is corroded more rapidly than it would in isolation, with a consequentincrease in the rate of generation of hydrogen in the case of the metals consideredhere; the more noble metal (the cathode) corrodes less rapidly than it would inisolation.
Aluminium and zinc will corrode more rapidly if in contact with iron or steel. However,the electrochemical process will not change the amount of gas produced, merely therate of generation.

Science Report – Production gas production from landfilling of inorganic wastes 23
4.2 Other chemical reactions producing gasThere are many possible chemical reactions other than corrosion that may take placein a mixed waste landfill to release gas. The disposal of traces of some reactiveinorganic compounds will lead to their eventual hydrolysis and release of acid.Examples include the disposal of some halides and oxyhalides, e.g. SbF5, and AsF5.However, other halides such as SF6 are unreactive.
4.2.1 Carbides
The reaction of some carbides with water or acid can generate simple hydrocarbons(Cotton et al. 1999).
Carbides containing C4- ions (e.g. Be2C and Al4C3) release methane on hydrolysis. Forexample:
Al4C3 + 12H2O = 4Al(OH)3 + 3CH4
Carbides that can be treated as containing C22- ions [e.g. M(I)2C2 where M(I) is an alkali
metal or copper, silver or gold; M(II)C2 where M(II) is an alkaline earth metal, zinc orcadmium); or M(III)2(C2)2 where M(III) is aluminium, lanthanum or terbium] react withwater to give acetylene (Cotton et al. 1999):
CaC2 + 2H2O = HCCH + Ca(OH)2
The presence of carbides in salt slag wastes from aluminium recovery leads to thegeneration of hydrogen and methane when contacted with water (elemental hydrogenmay also be produced from traces of elemental aluminium).
Some carbides do not fall into the two classes above. These include YC2, TbC2, YbC2,LuC2, UC2, Ce2C2 and Tb2C2. These carbides are hydrolysed by water to give 50–70per cent HCCH, though C2H4, CH4 and H2 are also produced.
Ternary carbides of the general formula A3MC (A = rare earth or transition element, M= metallic or semi-metallic main group element) are hydrolysed by dilute hydrochloricacid to give mainly methane (~84–97 wt per cent) with the remaining products beingsaturated and unsaturated higher hydrocarbons (Cotton et al. 1999).
The carbides of the transition metals chromium (Cr2C3) and manganese, iron, cobalt ornickel (M3C) are reported to be hydrolysed by water and dilute acids to give a mixtureof hydrocarbons (including liquids and solids) and hydrogen (Cotton and Wilkinson1972). However, there is some uncertainty about whether these transition metalcarbides are reactive – essentially dependent upon whether interstitial on non-interstitial carbides are formed (Hoch et al. 2004). Thus, although these first row metalcarbides may be unreactive in steels, it is possible they may be more reactive in slagand dross waste from the metal industries.
4.2.2 Reactions with acids
Carbon dioxide is a bulk constituent of landfill gas and is formed by microbial action,but it may also be formed by the reaction of carbonates with acid. In the laboratory,carbon monoxide may be prepared by the action of concentrated sulphuric acid onformic acid (Cotton and Wilkinson 1980). However, the thermal process described inSection 4.2.5 is likely to be the source of the low concentrations of carbon monoxideseen in gas from current landfills.
Hydrogen cyanide (HCN) is evolved when cyanides are treated with acid. Cyanides arepresent in a range of wastes including:

24 Science Report – Production gas production from landfilling of inorganic wastes
• those from the metallurgical industry such as electroplating wastes andaluminium potliner wastes (Grieshaber et al. 1994);
• in some contaminated soils.
Cyanogen [(CN)2] could potentially be formed by the oxidation of cyanide. Contact ofthiocyanates with acid can generate toxic gas.
Nitric oxide (NO) can be formed by reduction of nitric acid and solutions of nitrites andnitrates. It reacts with oxygen to form NO2. Mixed oxides of nitrogen [NO2 and N2O4(NOX)] are also formed from the reduction of nitric acid and nitrates. All these gases aretoxic and reactive (Cotton et al. 1999).
Hydrogen sulphide is more toxic than hydrogen cyanide and is evolved from thereaction of metal sulphides with acids. Sulphides may be present in waste fromindustrial processes, or as a result of the production of hydrogen sulphide by microbialaction which then reacts with metal ions.
Reactions between sulphuric acid and salts can result in the formation of hydrogenhalides such as HF from reaction with calcium fluoride and HCl from reaction withsodium chloride.
4.2.3 Formation of phosphine, arsine and stibine
Phosphine (PH3) can be generated by the reaction of some phosphides (e.g. those ofalkali, alkaline earth and lanthanide metals) with water or acids. It is poisonous andreadily oxidised by air when ignited, forming explosive mixtures with air when presentat a sufficient concentration. Aluminium and magnesium phosphides are used aspesticides to fumigate grain; aluminium and zinc phosphides are used as rodenticides(DoH 2001).
Arsine (AsH3) is a highly poisonous, colourless gas with an odour of garlic. It may beformed when inorganic arsenic is exposed to nascent (freshly formed) hydrogen or bythe reaction of water with a metallic arsenide (DHHS 1979). Ores containing arseniccan liberate arsine if in contact with acid. Exposure to arsine has occurred duringsmelting and refining of metals. It has also been detected during galvanising, soldering,etching and lead-plating operations, and can also be produced by microbial action (seeSection 4.3.2) in the presence of arsenic (DHHS 1979). Examples of industrialaccidents cited in (DHHS 1979) involving the generation of arsine include:
• spraying of water onto slag to reduce dust hazard – the water reacted withalkali metal arsenide in the slag to generate arsine (Conrad et al. 1976);
• reaction of acidic arsenic liquor with the zinc coating of a galvanised bucket(Hocken and Bradshaw 1970);
• moisture reacting with aluminium arsenide in metal dross during thepurification of lead alloys (Pinto et al. 1970);
• reclamation of metal from blast furnace flue dust by the addition of zinc,water and sulphuric acid (Jenkins et al. 1965);
• reaction of phosphoric acid with aluminium containing arsenic impurities(Elkins and Fahy 1967) and reaction of an aluminium ladder with sodiumarsenic solution (Levinsky et al. 1970);
• washing of aluminium slag to dissolve soluble constituents – the copper inthe mixture was contaminated with arsenic (Kipling and Fothergill 1964).

Science Report – Production gas production from landfilling of inorganic wastes 25
The basic chemistry in all these reactions is similar. Arsine is evolved when hydrogenis freshly formed in the presence of arsenic compounds or by the reaction of a metallicarsenide with water.
Antimony can be converted to stibine (SbH3) by similar reactions. Stibine is at least astoxic as arsine, but is less stable (DHHS 1979).
4.2.4 Formation of metal carbonyls
Nickel tetracarbonyl [Ni(CO)4] is used in the manufacture of catalysts and in nickelrefining and purification. It is produced by passing carbon monoxide over finely dividednickel and is reportedly generated if carbon monoxide comes into contact with nickel ina reactive form (Hetland et al. 1991).
Traces of nickel tetracarbonyl [0.07–0.14 parts per billion (ppb) (v/v)] have beendetected in sampled sewage gas (Feldmann 1999). The same study also foundmolybdenum hexacarbonyl [Mo(CO)6, 0.25–0.30 ppb (v/v)] and tungsten hexacarbonyl[W(CO)6, 0.0006–0.001 ppb (v/v)] in sewage gas. (These two latter compounds havealso been detected in landfill gas at concentrations of 10–310 ng m-3 and 5–230 ng m-3
as molybdenum and tungsten respectively (Feldmann and Cullen 1997). No volatilespecies of iron, chromium, cobalt or manganese were detected.
Tests in a carbon monoxide atmosphere showed that Ni(CO)4 was lost from the gasphase in the presence of deionised water, but not in the presence of nickel bromidesolution, over a period of 11 weeks. The concentration of Mo(CO)6 in carbon monoxideremained unchanged over the same period, whether in contact with deionised water orammonium molybdate solution. Fe(CO)5 was lost from the gas phase in the presenceof both deionised water and a solution of iron sulphate (Feldmann 1999).
The mechanism of the formation of nickel carbonyl (chemical or microbially mediated)in sewage could not be identified (this was not the aim of the work); Feldmann notesthat nickel carbonyl can be synthesised if nickel and sulphide are present in solutionunder a carbon monoxide atmosphere (Behrens and Eisenmann 1955).
Therefore, neither chemical nor microbial reactions can be eliminated as means ofgenerating nickel carbonyl from sewage sludge or, by analogy, from landfills on thebasis of current knowledge. Similarly, neither of these mechanisms for the productionof molybdenum or tungsten hexacarbonyls can be eliminated. It is possible thatFe(CO)5 may be formed in sewage gas but lost by reaction with aqueous solution.
4.2.5 Thermal processes
The carbon monoxide often found as a trace gas in current landfill gas is generally theresult of thermal oxidation of organic material under sub-stoichiometric conditions (i.e.deficient in oxygen). Landfilled waste has a low thermal conductivity and hot spots maydevelop into sub-surface fires if the partial pressure of oxygen is relatively high. Thesource of the carbon may be organic solids, pyrolysis products or methane.
In partially saturated conditions, water gas – an equimolar mixture of carbon monoxideand hydrogen – may be produced by the reaction of steam with hot carbonaceousmaterial. This process does not require oxygen, though air may be necessary for theprocess that generates the hot carbon.
Nitric oxide (NO) can be formed by thermal oxidation of nitrogen gas by the oxygen inair at high temperature (typically above 1000°C). It reacts with more oxygen to formNO2.

26 Science Report – Production gas production from landfilling of inorganic wastes
4.2.6 Other reactions
Thermal and photochemical reactions of PVC result in the degradation of the polymerand the release of hydrogen chloride (Yassin and Sabaa 1990). Hence, stabilisers areincluded in the formulation of the PVC polymer for commercial use (White and Turnbull1994). Vinyl chloride monomer (chloroethene) has been detected in landfill gas (Allenet al. 1997), although this is believed to arise through the biodegradation of chlorinatedsolvents rather than processes involving PVC.
Ammonia may be generated chemically by the reaction of an ammonium salt with base(Cotton and Wilkinson 1980):
NH4X + OH- = NH3 + H2O + X-
or by the reaction of an ionic nitride with water, for example:
Mg3N2 + 6H2O = 3Mg(OH)2 + 2NH3
Contact of water with salt slag wastes from aluminium recovery may generateammonia.
Amines are released from the degradation of anion exchange resins (Baston et al.1995, Biddle et al. 2002).
4.3 Microbial action and gas generation
4.3.1 Respiration
Some organic materials can undergo microbial degradation to produce gas under bothaerobic and anaerobic conditions. The microbial degradation of MSW in landfills can bedescribed by five idealised stages. There is an initial short period of aerobicdegradation where oxygen trapped during waste deposition is utilised by aerobicmicrobes and CO2 is produced. Anaerobic microbial activity then begins with thehydrolysis of organic materials and acetogenesis to release carboxylic acids(potentially decreasing the pH of the leachate) with production of hydrogen, ammoniaand CO2. Methanogenesis is then initiated and utilises carbon dioxide, hydrogen andacetic acid to produce methane. The rate of methanogenesis increases until a balancewith the rates of hydrolysis and acetogenesis is achieved. The system is then at steadystate and anaerobic degradation continues, producing a mixture of methane andcarbon dioxide in the ratio of about 3:2. Finally, the organic substrate required formicrobial activity becomes limited and the gas within the landfill returns gradually toatmospheric composition (Environment Agency 2004a).
Although the waste deposited in hazardous and non-hazardous landfills will containlittle putrescible material, some cellulosic wastes such as paper, wood and cardboardwill be present. Bottom ash from the incineration of MSW may contain traces ofbiodegradable organic material but the amounts are small (e.g. 1 per cent of the totalorganic carbon content of the residue) and it is rapidly degraded (Zhang et al. 2004).Though the microbial inoculum will also be much less than in MSW landfills, it cannotbe assumed that microbial activity will not eventually take place in parts of a hazardousor non-hazardous landfill. However, the timescale over which this occurs and its extentmay be uncertain.
Thus it is to be expected that mixed hazardous and mixed non-hazardous landfills willevolve carbon dioxide and methane to some extent. However, stable methanogenicconditions may not persist and it is probable that this gas will have a lower proportion ofmethane and higher than normal amounts of hydrogen as a result of the co-existence

Science Report – Production gas production from landfilling of inorganic wastes 27
of both methanogenic and acetogenic conditions. Microbial processes may alsogenerate smaller amounts of gases such as ammonia and hydrogen sulphide. Nitrogenoxides are also formed in small amounts from natural microbial processes.
Of the trace gases produced by microbial action, hydrogen sulphide is of particularinterest because it is known to be a component of gas from existing landfills and istoxic. Although the presence of sulphides in waste disposed to future landfills indicatesthat chemical generation of hydrogen sulphide is also possible (see Section 4.2.2),reduction of sulphate by sulphate-reducing bacteria (SRB) is likely to be the majorsource. Hydrogen sulphide dissolves in water to give a ~0.1 mol dm-3 solution under 1atmosphere pressure (Cotton et al. 1999) and behaves as a weak acid. H2S is thedominant dissolved species below ~pH 7 whereas HS– becomes the major speciesunder most alkaline conditions of interest. The sulphides of many trace metals ofenvironmental interest (e.g. mercury) have very low solubility.
The removal of hydrogen sulphide from the gas phase by partitioning into water andsubsequent reaction with dissolved iron offers a route for its removal from landfill gas.The reaction between hydrogen sulphide and ferrous iron in aqueous solution atneutral pH yields amorphous iron sulphide (approximately FeS), although its exactcomposition has been the subject of extensive discussion. Crystalline iron sulphidesgenerally found in nature are mackinawite (Fe0.995-1.023S), greigite (Fe3S4) and pyrite(FeS2). Amorphous FeS may be a mixture of fine-grained mackinawite and greigite. Ithas been suggested that the formation of mackinawite (and probably amorphous ironsulphide) proceeds via the reactions:
Fe2+ + SH- = FeSH+
2 FeSH+ = Fe2S2 + 2 H+
nFe2S2 = mackinawite
The reaction of hydrogen sulphide with goethite over the pH range 7 to 8.5 may giveiron(II) and elemental sulphur and polysulphides as the reaction products (Morse et al.1987). It has been shown that the dissolution rate of iron (II) and iron (III) (hydr)oxidesis increased by about two orders of magnitude in the presence of hydrogen sulphide atpH 7 (Keresztes et al. 2001).
Hydrogen sulphide is known to act as a corrosive contaminant of fluids in a variety ofindustrial situations. In many cases, this arises from microbial action by SRB, althoughthe unpredictability of the occurrence and effect of hydrogen sulphide from microbialprocess can add to the complexity of interpreting observations in experiment or real-lifesituations (Edyvean 1991). Hydrogen sulphide concentrations of between 50 and 200ppm may be typical of the concentration at a metal surface in the presence of activeSRB.
Damage to steels due to SRB results mainly from the generation of hydrogen sulphideand consequent corrosion by sulphide ions. Another influence is the formation of ironsulphide (FeS) films on the metal as thin adherent films tend to protect the metal fromcorrosion. However, corrosion occurs when such films are disrupted (e.g. by microbialaction or the presence of oxygen) or when ferrous iron is present in solution at highenough concentrations to result in the formation of a loose sulphide film. Other solutesalso affect the nature of the sulphide film as the presence of a range of surfacedeposits in mixed systems can increase the rate of corrosion at a particular hydrogensulphide concentration, presumably through disruption to (or discontinuity in) the ironsulphide film (Edyvean 1991).
Mild steel undergoes pitting corrosion under alkaline conditions if the concentration ofHS– is much greater than the concentration of OH– (Salvarezza et al. 1982). Corrosionof carbon steel in oxygen-free deionised water under acidic conditions imposed by highpressures of H2S (1.5 MPa) resulted in the formation of a range of iron sulphides, from

28 Science Report – Production gas production from landfilling of inorganic wastes
mackinawite to pyrite, depending on temperature (308–433K) and exposure time (1–840 hours) (Wikjord et al. 1980). The overall corrosion reaction is:
Fe + 2 H2S = Fe2+ + 2SH- + H2
with the ferrous ions either forming iron sulphide phases or passing into bulk solution.Inhibition of iron corrosion by hydrogen sulphide in acid solution has been found tooccur over a narrow pH range (3–5) at concentrations below 4 × 10⁻⁵ mol dm-3
hydrogen sulphide (Ma et al. 2000).
Thus, as well as reacting with dissolved metal ions to form insoluble sulphides,hydrogen sulphide can be directly involved in the corrosion of metallic iron and steel. Itis likely that iron sulphide films formed under the solution conditions in a landfill cell willnot be protective because of the variety of possible surface deposits. Therefore,metallic iron and steel can act as chemical ‘sinks’ for hydrogen sulphide under bothacidic and alkaline conditions. However, their effectiveness will depend on:
• the partitioning of hydrogen sulphide between the gas and aqueousphases;
• the rate of reaction compared with the rate of the hydrogen sulphidegeneration;
• the distribution of iron and steel relative to sources of hydrogen sulphide.
4.3.2 Biosubstitution
The possibility of the formation of metal carbonyls through microbially-mediatedreactions is mentioned in Section 4.2.4. Biomethylation of a range of metals andmetalloids is also possible.
Feldmann (2003) reports that (CH3)2Se, (CH3)3As, (CH3)2AsH, CH3AsH2, AsH3,(CH3)4Sn, (CH3)2(C2H5)2Sn, (CH3)3Sb, (CH3)2Te, CH3I, (CH3)2Hg, (CH3)4Pb,(C2H5)3CH3Pb and (CH3)3Bi (as well as the carbonyls mention above) can be found inenvironments such as municipal waste deposits or anaerobic digestion of sewagesludge.
Hirner (2003) identifies the most important criteria for a high biomethylation potentialas:
• an anaerobic atmosphere (at least on a microscale), reducing conditionsand slightly acidic pH values in the hydrosphere;
• metal(loid)s in easily accessible forms (e.g. as ions);
• the presence of microorganisms with biomethylation potential (bacteria;fungi, algae, archeae);
• the presence of transferable methyl groups.
Microbial methylation or alkylation of arsenic has been reviewed extensively (Bentleyand Chasteen 2002). The major volatile products formed by biomethylation are:
• CH3AsH2 (monomethylarsine)
• (CH3)2AsH (dimethylarsine)
• (CH3)3As (trimethylarsine).
Non-volatile compounds (methylarsonate and dimethylarsonate) are also formed.

Science Report – Production gas production from landfilling of inorganic wastes 29
Bioalklyation is used to refer to the processes involving alkyl groups other than methyland there is evidence of this process for arsenic. Bentley and Chasteen (2002) notethat As(C2H5)(CH3)2 has been found in landfill and sewage gas, while As(C2H5)3 hasbeen found in landfill gas (Feldman and Hirner 1995). Arsine, monomethylarsine,dimethylarsine and trimethylarsine have been detected in the headspace aboveincubated sewage sludge samples (Michalke et al. 2000) (Table 4.3) and in gas fromanaerobic municipal waste landfills (concentration range of µg m-3) (Feldmann andCullen 1997).
Table 4.3 Metal(loid) content of sewage sludge and volatile metal(loid)s detectedin the headspace of incubated sewage sludge after 1 week at 37ºC1,2
Element Concentration in sludge(10-3 g kg-1 dry weight)
Volatile species Concentration of element inheadspace (10-6 g m-3)
Te 0.2 ± 0.1 (CH3)2Te 1.9 ± 0.15Bi 1.4 ± 0.3 (CH3)3Bi 46.2 ± 6.9Se 1.5 ± 0.5 –3
Sb 1.7 ± 0.3 (CH3)3Sb4 77.5 ± 4.6Hg 3.0 ± 1.2 Hg0 0.29 ± 0.16As 15.2 ± 1.3 AsH3 0.76 ± 0.21
CH3AsH2 0.68 ± 0.45(CH3)2AsH 0.51 ± 0.36(CH3)3As 3.3 ± 1.3
Sn 25.4 ± 0.3 (CH3)4Sn 0.29 ± 0.18
Notes: 1 Michalke et al. (2000)2 The experiments contained 50 cm3 of sludge (2 per cent wt/vol dry matter) in 120 cm3
bottles under a CO2/H2 (20:80 v/v) atmosphere at 200 kPa.3 No volatile Se species detected, although dimethyl selenide and dimethyl diselenide weredetected above pure cultures incubated with 0.1 mol dm-3 Se.4 Stibine, monomethylstibine, dimethylstibine and trimethylstibine detected above pureculture of Methanobacterium formicicum incubated with 0.005 mol dm-3 Sb.
Bentley and Chasteen (2002) cite studies showing evidence for biomethylation ofantimony. For example, trimethylstibine [(CH3)3Sb] was produced by the action of fungion trimethylstibine dihydroxide [(CH3)3Sb(OH)2], demonstrating reduction ofantimony(V) to antimony(III) (Barnard 1947), and trimethylstibine was detected aboveenriched soil cultures under anaerobic conditions (Gürleyük et al. 1997, Jenkins et al.1998). Trimethylstibine has also been detected in the headspace above incubatedsewage sludge samples (Michalke et al. 2000). Stibine, monomethylstibine,dimethylstibine (and trimethylstibine) were also detected in some of these experimentsafter short incubation periods of 15 hours, but appeared to be short-lived; onlytrimethylstibine was detected after incubation for 5 days (Michalke et al. 2000).Trimethylstibine has also been detected in gas from anaerobic municipal waste landfills(concentration range of µg m-3) (Feldmann and Cullen 1997).
Trimethylbismuth has been detected in gas from anaerobic municipal waste landfills(concentration range of ng m-3) (Feldmann and Cullen 1997). Bentley and Chasteen(2002) record that trimethylbismuth has been identified in landfill and sewage gas(Feldman and Hirner 1995, Michalke et al. 2000).
Bentley and Chasteen (2002) noted that triethyllead is a metabolic product oftetraethyllead (Griffiths and Usta 1988) and volatile lead species with methyl and ethylgroups have been detected in sewage gas (Feldman and Hirner 1995).Tetramethyllead and tetraethyllead have been detected in gas from anaerobicmunicipal waste landfills (concentration range of ng m-3) (Feldmann and Cullen 1997).
Dimethyltellurium has been detected in the headspace above incubated sewage sludgesamples (Michalke et al. 2000). Dimethylselenuium and dimethyldiselenium were alsodetected in the same work above pure cultures, though they were absent in sewagegas (Michalke et al. 2000). Dimethylselenide and dimethyltellurium have been detected

30 Science Report – Production gas production from landfilling of inorganic wastes
in gas from anaerobic municipal waste landfills (concentration range of ng m-3)(Feldmann and Cullen 1997).
Tetramethyltin has been detected in the headspace above incubated sewage sludgesamples (Michalke et al. 2000). Five volatile tin species (tetramethyltin and four higheralkylated tin species) have been detected in gas from anaerobic municipal wastelandfills (concentration range of µg m-3) (Feldmann and Cullen 1997).
Work with pure cultures has shown microbially mediated reduction of mercury(II) toelemental mercury (Michalke et al. 2000). Dimethylmercury and elemental mercuryhave been detected in gas from anaerobic municipal waste landfills (concentrationrange of ng m-3) (Feldmann and Cullen 1997). Another study found that total gaseousmercury at several municipal landfill sites in Florida, USA, is present at concentrationsin the range 10 to 12,000 ng m-3 while methylated mercury compounds occur at typicalconcentrations of up to tens of ng m-3 (Lindberg et al. 2005). Dimethylmercury was thepredominant methylated species, at concentrations of 4.5–77 ng m-3, with theconcentrations of monomethyl mercury lower at 1.7 –39 ng m-3. There was no simpledirect relationship between the concentrations of mono- and dimethyl mercury. Inaddition, the proportion of methylated mercury ranged from <0.05 per cent to 50 percent of the total gaseous mercury.
In the same study, gas was sampled from the Hamilton Landfill in California. Althoughtotal gaseous mercury was present in the sampled gas at a concentration of 4700 ±3700 ng m-3 (within the range determined for the Florida landfills), the concentration ofdimethyl mercury was below the detection limit at <0.03 ng m-3. There may be anumber of reasons for the lack of methylated mercury at the Hamilton Landfill. It hadreceived mainly commercial and demolition waste rather then municipal waste, andbeen closed since 1974. Therefore, it was expected to be past the peak rate inmethane production. In addition, the waste was mostly saturated with groundwater andwas deposited in a layer only 5–8 feet (≈1.5–2.5 m) thick.
Measurements at three UK landfills that had accepted wastes with relatively highmercury levels found typical total gaseous mercury concentrations in the range 6 to130 ng m-3 with organic mercury concentrations in these samples below the detectionlimit of 35 ng m-3 (ESART 2003). A comparison of these data with other studies foundthe total gaseous mercury concentration to be within the ranges reported elsewhere,apart from studies by Lindberg et al. (2001) from sites in Florida which are an order ofmagnitude higher. Concentrations of organic mercury below the detection limit of theESART study are not inconsistent with the observations made by Lindberg et al.(2005).
Table 4.4 shows the concentrations of arsine, elemental mercury and variousmethylated and alkylated species in landfill gas sampled from gas wells or abovewetland (through which the gas had percolated) at a municipal waste landfill in Canada.Concentrations ranged from 1 × 101 to 2 × 10⁵ ng m-3 with the most abundant speciesbeing trimethylstibine and tetramethyltin.
The stabilities of SbH3, CH3SbH2, (CH3)2SbH, (CH3)3Sb, AsH3, CH3AsH2, (CH3)2AsH,(CH3)3As, SnH4, (CH3)4Sn, (CH3)2SnH2, (CH3)3SnH and (C4H9)SnH3 at concentrationsof 10 µg m-3 have been measured in air at 20°C and 50°C in the dark, and at 30°Cexposed to ultraviolet (UV) light (Feldmann 2003). The estimated half-lives decreasedwith the increase in temperature or exposure to UV light. For example, the half-life ofstibine was approximately 2,000 hours at 20°C in the dark, 600 hours at 50°C in thedark and 1 hour at 30°C exposed to UV light at 5,000 lux. A full list of the estimated halflives is given in Table 4.5.
Methylated sulphur species detected in landfill gas are methyl mercaptan,dimethylsulphide and dimethyl disulphide (carbon disulphide and hydrogen sulphidewere also found) (Kim et al. 2005).

Science Report – Production gas production from landfilling of inorganic wastes 31
It is possible that a number of other elements may be methylated under appropriateconditions. These include zinc, cadmium, thallium, silicon and germanium. No datahave been found for the presence of these elements in landfill gas but Hirner (2003)notes that many organometalloid species remain to be identified in samples taken fromvarious environments.
Table 4.4 Volatile metal(loid) compounds detected in landfill gas and abovewetlands at a municipal waste landfill in Canada1
Concentration (10-9g m-3)2
Species Landfill gas Above wetlandAsH3 7 × 101 1 × 10²
CH3AsH2 4 × 10² 8 × 10²
(CH3)2AsH 1 × 101 2 × 10²
(CH3)3As 4 × 10³ 5 × 10²
(CH3)2As(C2H5) 4 × 101 -
(CH3)3Sb 1 × 10⁵ 2 × 10⁵
(CH3)4Sn 1 × 10⁵ 3 × 10⁴
Sn(U1) 3) 8 × 10³ 5 × 10³
Sn(U2) 3) 8 × 10³ 4 × 10³
Sn(U3) 3) 9 × 10³ 4 × 10³
Sn(U4) 3) 8 × 10³ 1 × 10³
(CH3)3Bi 1 × 10³ 6 × 10²
Hg(0) 9 × 10² 2 × 10³
Hg(CH3)2 1 × 10² 5 × 101
(CH3)2Te 1 × 10² 1 × 10²
(CH3)2Se 2 × 101 3 × 101
Pb(CH3)(C2H5)3 4 × 101 2 × 101
Pb(C2H5)4 1 × 10³ 7 × 10²
Notes: 1 Feldmann (2003)2 All concentrations estimated from Figure 2 in Feldmann (2003) and quoted to onesignificant figure.3 Sn(U1–U4) = unknown R4Sn species

32 Science Report – Production gas production from landfilling of inorganic wastes
Table 4.5 Estimated atmospheric half-lives of volatile metal(loid) compounds inair in the dark and exposed to ultraviolet light1
Half life (hours)2,3
Species Dark, 20°C Dark, 50°C UV4, 30°CSbH3 2 × 10³ 7 × 10² 1 × 100
(CH3)SbH2 1 × 10³ 3 × 10² 1 × 10⁻¹
(CH3)2SbH 1 × 10² 6 × 101 1 × 10⁻¹
(CH3)3Sb 5 × 101 6 × 100 1 × 10⁻¹
AsH3 2 × 10³ 6 × 10² 2 × 10²
(CH3)AsH2 1 × 10³ 6 × 10² 2 × 100
(CH3)2AsH 5 × 10² 9 × 101 1 × 10⁻¹
(CH3)3As - 3 × 101 1 × 10⁻¹
SnH4 2 × 10³ 8 × 10² 1 × 100
(CH3)2Sn2H2 1 × 10³ 5 × 10² 1 × 101
(CH3)3SnH 8 × 10² 2 × 10² 6 × 100
(C4H9)SnH3 1 × 10³ 6 × 10² 5 × 100
Notes: 1 Feldmann (2003)2 All half lives estimated from Figure 3 in Feldmann (2003) and quoted to one significantfigure.3 In synthetic air atmosphere4 UV radiation at 5,000 lux (5,000 lm m-2). Direct sunlight in summer has an illuminance ofup to 100,000 lux whereas on a cloudy day a value of 1,000 lux may be typical. One lumenat a wavelength of 5,500Å (green light) ≈ 0.0015 W. A typical wavelength for UV light from amercury lamp is ≈ 2,500 Å. Thus 1 lumen of UV light has approximately twice the power of 1lumen of green light. Note that photolytic degradation requires the absorption of energy andthus the wavelength of light may be important.
4.3.3 Bioreduction of phosphorus to phosphine
Phosphine (PH3) is present in biogas from a variety of sources including landfills.Phosphine concentrations of 3–32 µg m-3 (as phosphorus) have been measured inlandfill gas at the Hooge Maey Landfill in Flanders, Belgium (Roels and Verstraete2004) (Table 4.6).
There has been some debate about possible mechanisms for the production ofphosphine; microbial reduction of phosphate to phosphine or release of reducedphosphorus as phosphine have been suggested. The reduction of phosphate tophosphine is thermodynamically unfavourable (Roels and Verstraete 2001). Theirexperiments showed that phosphine can be generated by chemical release from ironand aluminium metals and that microbial process, particularly those enhancingcorrosion, could be instrumental in enhancing such releases of phosphine (Roels andVerstraete 2004). They estimated that the corrosion of 1 kg of metal (aluminium or iron)results in the formation of 1 mg of PH3 and that 160 g of phosphine is released in 1.75× 10⁷ m3 of biogas per year from the Hooge Maey Landfill, corresponding to thecorrosion of 160 tonnes of metal (0.15 per cent of the estimated total metal in thelandfill).
Subsequent work by the same research team has strengthened the view thatrespiratory reduction of phosphate to phosphine is unlikely. Phosphine is generated bychemical acid corrosion and microbial corrosion. Microbial action is apparently capableof reducing phosphorus(zero valent) in the steel to phosphine, as the amount ofphosphine generated in microbial experiments exceeds the amount of iron phosphidein the steel (Roels et al. 2005).

Science Report – Production gas production from landfilling of inorganic wastes 33
Table 4.6 Phosphine concentration in landfill gas extracted from the Hooge MaeyLandfill, Flanders, Belgium1
Well number Phosphine concentration as P (10-6 g m-3)1 4.1 ± 0.62 7.7 ± 1.83 7.0 ± 1.24 6.7 ± 0.75 7.96 8.0 ± 0.47 7.4 ± 1.38 6.4 ± 0.19 9.7 ± 0.510 6.1 ± 2.311 32.4 ± 1.012 9.1 ± 0.813 32.314 13.7 ± 1.215 6.8 ± 0.216 14.7 ± 0.917 8.1 ± 0.518 7.5 ± 0.819 3.220 9.1 ± 0.421 8.4 ± 0.522 6.0 ± 1.023 8.7 ± 0.524 18.5
Notes: 1 Roels and Verstraete (2004)
4.4 Volatilisation of ‘as-disposed’ materials (mercury,some inorganic compounds and organiccompounds) and miscellaneous reactions
There are a large number of species that could be volatilised from waste due to thedisposal of traces of materials with high vapour pressures; the majority of these areorganic compounds.
Methylation of mercury is discussed in Section 4.3.2; inorganic mercury was thedominant component of the total gaseous mercury from many of the landfills sampledin by Lindberg et al. (2005).
Carbon disulphide (CS2) has been reported in the landfill gas from MSW. It is highlyflammable and very reactive. When impure it has a strong odour. At room temperature,it is very volatile and is classified as a VOC. In industry it is used in the production ofcellulose rayon fibres, cellophane and carbon tetrachloride, and is also used as asolvent. Small amounts are generated naturally over marshes. Its source in gas fromMSW landfills is unclear, but it may be an end product of microbial action on sulphurcompounds in the waste. It breaks down rapidly in the environment (EnvironmentAgency 2005b); CSe2 also exists with a stronger odour than CS2 but is not flammableand slowly polymerises (Cotton et al. 1999).
Siloxanes may be present in landfills through the disposal of consumer products,commercial lubricants and wastewater treatment sludges. Some of these species maybe volatile and it is also possible that non-volatile, high molecular weight organic siliconcompounds may be degraded to form lower molecular weight volatile species.Concentrations of >1 to <100 parts per million (ppm) organic silicon have been found in

34 Science Report – Production gas production from landfilling of inorganic wastes
landfill gas. Siloxanes are of interest as a trace component of gas from existing landfillsbecause they are converted to inorganic siliceous deposits in landfill gas engines andreduce engine life (Environment Agency 2004c).
A large number of other trace organic compounds have been detected in gas frommunicipal waste landfill sites (Allen et al. 1997, Environment Agency 2002a,Environment Agency 2003b). Many of these are xenobiotic organic compounds whichare also found in landfill leachates with possible origins in hazardous household waste(Slack et al. 2005); the compounds found in leachates are listed in Appendix B. Manyof them would also be expected in gas released from hazardous and non-hazardouswaste landfills containing wastes from, for example, the organic chemical,pharmaceutical, plastic and paint industries.
The organic chemicals may also react in a landfill to form other substances that may bemore hazardous, for example:
• the formation of phosgene from oxidation or thermal decomposition ofchloroform;
• the reaction of chloroform with acetone in the presence of alkali
• the reaction of chlorinated solvents with some metals.
The likely dominant volatile organic species from wastes disposed to primarilyinorganic landfills in the future could be estimated from knowledge of the organic-containing (e.g. solvent-containing) wastes consigned for disposal.

Science Report – Production gas production from landfilling of inorganic wastes 35
5 Potential volatile products
5.1 Bulk gasesA broad classification of the types of waste going to inorganic landfill and their potentialcontaminants are listed in Table 5.1. Tables 3.4 and 3.5 give typical elementalconcentrations in APC residues and in a sample of MSW incinerator bottom ashrespectively. Table 3.6 gives concentrations of species in leachate from an inorganicwaste test cell. This information together with the discussion in Section 4 allows anumber of likely products from reactions in hazardous and non-hazardous landfills tobe identified (see Table 5.2).
Table 5.1 Types of waste going to inorganic landfill and potential contaminants1
Treated waste going to inorganic landfill May contain:Contaminated soil As, Sb, hydrocarbons, cyanides, organochlorines,
ammonium, Fe, Zn, heavy metalsAsbestosFragmentiser wastes Oils, glass fibre, metal fragments, plasticsIncinerator residues Metals, oxides, hydroxides, residual and part-
combusted organicsAPC residues Lime, calcium sulphate, chloride and sulphate,
contamination with mercury, etc.Scrap from waste electrical items Copper, lead, selenium, plastics, general metalBulky industrial items (filter housings, ducts,process equipment)
Metals plastic composites with organiccontamination
Contaminated demolition rubble As, Sb, hydrocarbons, organochlorines, Fe, Zn,heavy metals
Used lime Lime, calcium sulphate, chloride and sulphate,contamination with organics and other metals
End-of-life vehicle (ELV) residues Mixed plastics, metal, oilsNeutralisation sludges Sulphates, hydroxides, residual organics and
heavy metalsUsed filter media IX resins, activated carbon, inorganic sorbents
with heavy metals and organicsCemented wastes As APC residuesReject products Composite materials with plastics and metalsFurniture and fittings Medium density fibreboard (MDF), organics, metal
fittingsBatteries Cd, Pb, Ni, ZnSwarfs from metal finishing Ferrous metals and oilTins containing solvent based paints andvarnishes
Tin compounds coated iron plus solders plushydrocarbons
Dredgings Metal sulphides, tin, organicsTins contaminated with oils, biocides,pesticides, etc.
Tin compounds coated iron plus solders plus traceorganics
Notes: 1 Professional judgement by A. Rosevear provided as a personal communication.
The bulk gases produced from inorganic landfills (hydrogen, carbon dioxide, methane)are potentially the same as those from existing MSW landfills (see Section 4).However, the quantities of gas produced and their rates of production are likely to be

36 Science Report – Production gas production from landfilling of inorganic wastes
different from MSW landfills due to the different waste inventories and consequentlydifferent chemical conditions and microbial environments.
The amount of hydrogen produced will be determined by the corrosion of three metals(iron present in steels, aluminium and zinc). The rates of corrosion of all three metalsdepend on pH, water availability and surface area and may also be influenced by thepresence of dissolved species in the leachate (e.g. chloride) or physical contact withother metals (galvanic corrosion). In addition, the evolution of hydrogen from ironrequires anaerobic conditions. Illustrative calculations to determine the onset ofanaerobic conditions and the rates of generation of hydrogen from iron, zinc andaluminium corrosion are described in Section 6. The overall amounts of hydrogenproduced from the corrosion of aluminium and zinc are determined by the totalamounts of these metals available in a landfill. The amount of hydrogen produced fromthe corrosion of iron and steel depends on their inventory and the onset of anaerobicconditions at the metal surface.
Although carbon dioxide can be evolved from the reaction of carbonates with acids, theamounts produced will depend on the proximity of acids to carbonate-containingwastes. If wastes are suitably conditioned such that acids are not disposed of directly(as required by the Landfill Directive), then sources of acids would be from degradationof some wastes. Therefore, production of carbon dioxide through reaction of acids withcarbonates is likely to be relatively slow (where it occurs) and will not occur in regionsof a landfill or for particular types of landfill where carbonates are not present. Inaddition, the presence of alkaline solids may prevent acidic solutions reachingcarbonate wastes or may minimise release of carbon dioxide by their carbonation ordissolution of carbon dioxide in alkaline solutions with possible precipitation of calciumcarbonate.
The typical mixed non-hazardous waste inventory estimated in Section 3.2.2 showsthat cellulosic wastes (wood, paper, cardboard) are present at about 14 per cent of thewaste by mass. Thus, for this type of landfill, the production of carbon dioxide frommicrobial degradation is likely but, because putrescible materials are excluded, therates of generation will be lower than from a MSW landfill. In the mixed hazardouswaste inventory, the estimated amount of wood and paper is much lower (0.2 per cent).Some contribution to the amount of carbon dioxide would also be expected frommicrobial action on some of the other waste organic materials (e.g. small organiccompounds, fats, etc.). However, these are only estimated to be present in relativelysmall amounts in the mixed hazardous and non–hazardous waste inventories. Theinert waste, asbestos waste and gypsum waste may also contain a small amounts ofwood, paper and cardboard and therefore generate carbon dioxide slowly from lowrates of microbial action. These latter wastes are all expected to be alkaline andtherefore the release of free carbon dioxide should be minimised by carbonationreactions within the landfill cells.
Similar arguments to those above for carbon dioxide can also be made whenconsidering methane generation. Although the reactions of some carbides with watercan release methane (and other simple hydrocarbons), this should be a relatively smallsource of methane in mixed waste as reactive carbides should not be present in morethan trace amounts (e.g. in metallurgical refining wastes). Thus the main source ofmethane is expected to be from the degradation of organic materials in the waste oncemethanogenesis has occurred and anaerobic microbial degradation established.Microbial reduction of carbon dioxide by hydrogen arising from corrosion could lowerthe relative concentration of carbon dioxide. In the absence of metal corrosion, theonset of anaerobic activity would depend on the rate of oxygen ingress though thelandfill cap compared with the rate of microbial action. Thus, for an inert landfill wherethere is no capping requirement (see Table 2.1) it is unlikely that anaerobic conditionswould be established. As microbial action will be much slower than in a MSW landfill, itis possible that anaerobic activity might not be established in other types of inorganic

Science Report – Production gas production from landfilling of inorganic wastes 37
landfills – or regions of individual landfills – in the absence of metal corrosion. It is alsopossible that, once metal corrosion has ceased, the rate of microbial activity would beinsufficient to maintain anaerobic conditions. Finally, the presence of chemicals suchas nitrate, sulphate and sodium hypochlorite can inhibit or prevent methanogenesis(Environment Agency 2004a) either by acting as electron acceptors or through theirbiocidal action.
Thus it can be expected that:
• the rate of bulk gas generation will be much lower than from MSW landfills;
• the ratio of hydrogen: methane: carbon dioxide will be different with theprobability of the gas having a higher ratio of hydrogen – and possibly alower ratio of methane – compared with carbon dioxide.
The lower rates of gas productions will mean that residence times of reactive gases ininorganic landfills should be longer than in MSW landfills. Therefore, there will be moreopportunity for gases such as hydrogen chloride and other hydrogen halides, hydrogensulphide and carbon disulphide to dissolve in the landfill leachate or react with wastesolids in the landfill (e.g. reaction of acids with metals, cement and concrete or theprecipitation of metal sulphides).
If equilibrium can be assumed, it is possible to calculate the ability of the contents of alandfill to remove acids based on the amounts of metal or cement in the wastescompared with the total acid generation potential of the waste (some simplifyingassumptions may need to be made to deduce the acid yield). Such an approach wouldbe similar, for example, to calculating the amount of cement required to maintain highpH in a radioactive waste repository (Harris 1997, Gould et al. 2001). However, thedistribution of wastes may be highly heterogeneous in many landfills and it may benecessary to consider reactions over a smaller scale (Chambers et al. 2004).
As well as chemical reactions between gases, solids and dissolved species in a landfill,other gases may be adsorbed onto solids in the landfill, for example volatile organicspecies may be sorbed to clays and soils (Biddle 1989). Although such reactions maybe reversible, they would hinder the rate of release of volatile species and may alsoprovide an opportunity for degradation (e.g. by microbial action in soils). The use ofclays in landfill liners and caps will retard the release of some volatile species, as willthe soil in which the landfill cell is located and any soil used above the landfill to restorethe site. In addition, the sorption and relatively low flux will allow a greater degree ofbiological oxidation of VOCs within biofilms that may be present on the cover materials.Other components of the landfill engineering (e.g. synthetic polymer liners) may bedegraded by some inorganic and organic gases and vapours, but this could not beconsidered to offer a useful sink for such gases.

38 Science Report – Production gas production from landfilling of inorganic wastes
Table 5.2 Potential gases from disposal of inorganic wastesElement Gas Melting
point (°C)Boiling
point (°C)Comments
Antimony SbH3 stibine –89 –17 Colourless gas, poisonous. Lessstable than arsine, strong reducingagent. Used as dopant insemiconductor industry. May beformed during battery overchargingor when antimony compounds comeinto contact with acid plus a reducingagent. Possible microbial generation.
Alkylated Sbcompounds
– – Formed by microbial action.
Arsenic AsH3, arsine –114, –117 –55, –62 Colourless gas, poisonous,pyrophoric. Thermally unstable,decomposes on hot surfaces toarsenic (Marsh test). Strong reducingagent. Used in organic synthesis andsemiconductor industry. May beformed from arsenic-containingwastes by chemical or microbialroutes.
Alkylated Ascompounds
Formed by microbial action.
Bismuth BiH3 Very unstable, unlikely to beimportant
Alkylated Bicompounds
Microbial action
Bromine Br2 –7 59 Reactive. Possible presence in wasteHBr From reaction of salts with acid
Carbon CO –199 –192 Poisonous gas, trace in MSW landfillgas from hotspots.
CO2 –57 –79 subl Colourless gas, soluble in water.Generated by aerobic and anaerobicaction in MSW. Also from reaction ofacids with carbonates.
COCl2phosgene
–104 8 Poisonous colourless gas.Decomposes in contact with water.Used in manufacture of intermediatesfor polyurethane, polycarbonate anddyes. May be formed by reactions ofchlorinated solvents.
Simplehydrocarbons
Microbial action on organic wastes,carbides.
Chlorine Cl2 –101 –35 ReactiveHCl From reaction of salts with acid
Fluorine F2 –220 –188 Poisonous. ReactiveHF From reaction of salts with acid
Germanium Germane,GeH4
–165 –89 Colourless gas, pyrophoric. Used insemiconductor industry. No evidencefound on production in naturalsystems.
Alkylated Gecompounds
Ge(CH3)4 used in semiconductorindustry.
Hydrogen H2 –259 –253 Colourless gas. Flammable,produced by metal corrosion andmicrobial action.

Science Report – Production gas production from landfilling of inorganic wastes 39
Table 5.2 (cont’d) Potential gases from disposal of inorganic wastesElement Gas Melting
point (°C)Boiling
point (°C)Comments
HCN –14 26 Colourless gas, highly soluble,poisonous. Used in manufacture ofacrylonitrile, plastics, KCN, NaCNand in electroplating. Liberated byaction of acid on cyanide containingwastes.
Iodine I2 114 184HI
Lead Plumbane,PbH4
Unstable, unlikely to be important
Alkylated Pbcompounds
Disposal and possible microbialaction
Mercury Hg –39 357 Disposal and reduction of mercurycompounds
Alkyl Hgcompounds
From microbial action
Nickel Ni(CO)4 –25 43 Colourless/yellow volatileinflammable liquid or needles,oxidises in air to NiO and CO2.Pyrophoric flashpoint –20°C. Tracesformed by reaction in landfill betweenCO and Ni, possibly via microbialaction.
Nitrogen NH3,Ammonia
–78 –33 Colourless gas, microbial action
(CN)2,cyanogen
–28 –21 Colourless gas pungent odour, verypoisonous, slowly hydrolysed bywater. Used in chemical synthesisand a possible soil fumigant.
NO –164 –152 Unstable, decomposes to N2O andNO2 at high pressures at 30–50°C.Reacts with O2.
N2O –91 –89 Relatively unreactive,. Used asanaesthetic and propellant gas,.Formed by microbial action
NO2 –11 21 Reacts with water to give nitric andnitrous acids.
AminesPhosphorus PH3,
phosphine–134 –87 Colourless, poisonous, inflammable
gas due to traces of P2H4 or P4,strong reducing agent, slightlysoluble. Produced by reaction ofphosphides with water or acid and bymicrobial action coupled with metalcorrosion.
Selenium H2Se 60.4? –42 Colourless gas, poisonous. Solublein water. Reaction of some selenideswith acid and by microbial action (cf.H2S)
CSe2 –46 125 Non-flammable, strong odour.Possibly formed by same route asCS2.
COSe –124 –22 Decomposes in contact with water,colourless gas, very poisonous.Possible trace formed by microbialaction cf. COS?

40 Science Report – Production gas production from landfilling of inorganic wastes
Table 5.2 (cont’d) Potential gases from disposal of inorganic wastesElement Gas Melting
point (°C)Boiling
point (°C)Comments
Alkylatedseleniumcpds
Microbial action
Silicon Silane Flammable explosive mixtures withair, decomposes slowly on contactwith water, odour
Alkylatedsiliconcompounds
Toxic, flammable, explosive mixtureswith air, decompose on contact withwater
Siloxanes – Used in consumer products.Sulphur H2S –86 –61 Colourless gas, inflammable, soluble
in water, poisonous. Formed bymicrobial action on sulphate underanaerobic conditions and acids onsulphides. Prevented from microbialformation by presence of nitrate, etc.
SO2 –10 –76 Gas, quite soluble in water.HSCN(HNCS),thiocyanicacid (iso)
>–110 Polym tosolid –90
Colourless mass or gas, very solublein water. Thiocyanates used in themanufacture of chemicals,pesticides, dyes, electroplating andphotographic industries. Formed byreaction of salts with acids.
Alkylatedsulphurcompounds
Industrial use and also formed bymicrobial action.
CS2 –111 46 Highly flammable, very reactive,strong odour. Flashpoint = –30°C,slightly water soluble. Used asdisinfectant, bactericide,preservative, solvent chemicalreagent. Formed by microbial action.
COS –138 –50 Flammable and toxic, unpleasantodour, corrosive to common metalswhen moisture present. Used insynthesis of thioacids, etc. Plays rolein microbial sulphur cycling.
Tellurium H2Te – –1 Very unstable, unlikely to beimportant, toxic, highly flammable,pungent odour, explosive air mixture
Alkylated Tecompounds
– – Microbial action
Tin Stannane,SnH4Alkylated tincompounds
Disposal and microbial action
Tungsten,molybdenumand possiblysome othertransitionmetals
Metalcarbonyls
From reaction between metal in anactive form and CO, probably viamicrobial action. Nickel carbonylmentioned above. Only Fe, Cr and Vcarbonyls likely to be stable. Noevidence from existing landfills
Indium,Thallium,Cadmium,Zinc
Methylated compounds? Possible forCd. No data yet found for others fromlandfills.

Science Report – Production gas production from landfilling of inorganic wastes 41
5.2 Trace gasesThe trace gases in Table 5.2 can arise from chemical or microbial reactions, althoughin some cases the mechanism of production is not known. They can be convenientlygrouped into three classes:
• Generated by chemical reaction: H2S (from sulphides), H2Se, HSCN,HCN, SbH3, AsH3, simple hydrocarbons (from carbides), HCl etc., Hg, NH3,NyOx, PH3, H2Se, COCl2 (and, potentially, under some circumstances I2,Br2, Cl2, F2, SO2).
• Generated by microbial action: H2S (from sulphate), R2S, SbH3, SbR3,AsH3, AsR3, BiR3, CO, CS2, COS, (and, possibly, the selenium analoguesCSe2 and COSe), simple hydrocarbons, organic acids, PbR4, Hg, HgR2,NH3, NyOx, PH3, H2Se, R2Se, R2Te, SnR4 (R = alkyl groups including methyland, in this context only, partially substituted with R = H in some cases)and, potentially, alkylated species of other metals.
• Generation mechanism uncertain (possibly combination of microbialand chemical): Ni(CO)4, W(CO)6, Mo(CO)6 and, possibly, other transitionmetal carbonyls.
Several of these compounds (e.g. mercury, carbon disulphide) may also occur as ‘as-disposed’ contaminants in wastes. Some volatile inorganic stable species such as NF3,SF6 and siloxanes are only likely to occur if they are present in the wastes at the time ofdisposal. Other species such as the halogens and hydrogen halides are so reactivethat, if traces are formed by reaction in a landfill cell, they are likely to react with otherwaste components (e.g. iron and steel) provided their residence time allows a suitableamount of mixing (i.e. they are not swept out rapidly in bulk gas).
Appendix A of the Guidance on the Management of Landfill Gas (Environment Agency2004a) gives an extensive list of the trace components (about 500) that have beenidentified in landfill gas. The vast majority of these are organic compounds but thefollowing inorganic or organo-metalloid species are listed:
• arsenic
• carbon disulphide
• carbon monoxide
• carbonyl sulphide
• dimethyl disulphide
• dimethyl sulphide (and a number of other alkylated sulphides4)
• hydrogen
• hydrogen chloride
• hydrogen cyanide
4 Dibutyl sulphide, dibutyl trisulphide, diethyl disulphide, diethyl sulphide, dimethyl tetrasulphide, dimethyl trisulphide,dipropyl sulphide, ethyl isopropyl disulphide, ethyl n-propyl disulphide, ethyl isobutyl disulphide, ethylmethyl disulphide,ethylmethyl trisulphide, ethylpropyl disulphide, ethylpropyl trisulphide, methyl butyl disulphide, methyl isopropyldisulphide, methyl propyl disulphide, methyl ethyl sulphide, methyl propyl trisulphide, n-butyl disulphide, propyl butyldisulphide.

42 Science Report – Production gas production from landfilling of inorganic wastes
• hydrogen fluoride
• hydrogen sulphide
• mercury
• sulphur dioxide
• sulphuric acid.
Landfill gas sampling campaigns have been carried out as part of the EnvironmentAgency’s R&D programme (Environment Agency 2002a, 2003b). Gas samples weretaken in 2002 and 2003 from six different types of landfills accepting predominantlyMSW. The chosen sites had either each taken a proportion of other wastes that mayaffect the trace component composition [e.g. fragmentiser waste, co-disposed wastes,ash or commercial & industrial (C&I)] or represented different waste managementregimes.
Samples were taken from the main gas extraction supply at each site. In addition,samples were taken at three sites from different locations:
• recent waste monitoring well;
• leachate well;
• mature waste monitoring well.
Although the work was concerned primarily with trace organic species in landfill gas,analyses were also undertaken for:
• volatile total arsenic (unspeciated);
• hydrogen sulphide;
• carbon disulphide
• dimethyl sulphide (other organosulphur species were also analysed).
These gases are among those identified in Table 5.2 as potentially present as traces ingas from inorganic waste landfills. Although all the sites had taken biodegradablewaste, a comparison of the results provides some information on these gases relevantto inorganic landfills.
The mean arsenic concentrations found in the 2003 sampling campaign were between0.6 and 409.5 µg m-3 (see Table 5.3). The highest arsenic concentrations were found ingas from recent waste (409.5 µg m-3) and leachate (117.2 µg m-3) from a site takingwaste with ‘substantial ash’. This would suggest that the combination of arsenic in anavailable form in the ash, coupled with microbial activity arising from the biodegradablewaste, leads to the volatilisation of arsenic. In contrast, the arsenic concentration in gasfrom mature waste at this site was much lower at 1.6 µg m-3 and this could suggest thatthe peak generation rate of volatile arsenic occurs relatively soon after disposal.
A similar trend is seen for the gas from the C&I site, although the arsenicconcentrations are much lower [5.5 µg m-3 (recent waste), 11 µg m-3 (leachate) and 0.6µg m-3 (mature waste)] and the main gas contains the highest arsenic concentration(34.3 µg m-3). The ‘substantial ash’ site accepts mainly C&I waste in conjunction withthe ash, which was generated by an incinerator plant formerly located on-site.However, it may be unwise to draw firm conclusions from this limited dataset as thehighest arsenic concentration in gas from the ‘mainly domestic with leachate’ site wasfound in mature waste (43.9 µg m-3).

Science Report – Production gas production from landfilling of inorganic wastes 43
Table 5.3 Mean total arsenic concentrations in gas samples taken from six typesof landfill in 20031
Total concentration of arsenic in gas sample (µg m-3)Type of landfill2Main gas Recent waste Leachate Mature waste
Co-disposal 3.1 – – –Mainly domestic (withleachate)
28.7 3.7 4.9 43.9
Mainly domestic (littleleachate)
4.2 – – –
Substantial ash 31.5 409.5 117.2 1.6Substantial fragmentiserwaste
6.8 – – –
Commercial andindustrial (C&I) (non-hazardous)
34.3 5.5 11.0 0.6
Notes: 1 Environment Agency (2003b)2 All sites contain biodegradable waste
Table 5.4 shows that hydrogen sulphide concentrations were in the range 2,400 to580,000 µg m-3. For the three types of landfill where samples were taken from fourlocations (main gas, recent waste, leachate and mature waste), the concentrationswere higher in gas from recent waste than in gas from the mature waste. The hydrogensulphide concentrations in the main gas from all six sites were within a narrower rangeof 31,000 to 110,000 µg m-3 (although the gas from the site taking waste with a‘substantial fragmentiser’ content was quantified at >67,000 µg m-3).
In a similar manner to hydrogen sulphide, the concentrations of carbon disulphide werealways higher in gas from recent waste than in gas from the mature waste for the threetypes of landfill where such samples were taken. Comparison of all the data from thesix sites in Table 5.4 shows the carbon disulphide concentrations to be in the range900 to 170,000 µgm-3.

44 Science Report – Production gas production from landfilling of inorganic wastes
Table 5.4 Mean concentrations (µg m-3) of hydrogen sulphide, carbon disulphideand dimethyl disulphide in gas samples taken from six types of landfill in 20031
Type of landfill2
Species C&I (non-hazardous)
Mainlydomestic
(littleleachate)
Mainlydomestic
(withleachate)
Co-disposalSubstantial
fragmentiserwaste
Substantial ash
Main gasH2S 110,000 49,000 31,000 52,000 >67,000 53,000CS2 59,000 32,000 170,000 1,650 1,400 2,600(CH3)2S2 170 170 70 150 <30 480
Recent wasteH2S 200,000 – 300,000 – – >69,000CS2 18,000 – 87,000 – – 35,000(CH3)2S2 30 – 790 – – 12,000
LeachateH2S 53,000 – 580,000 – – >68,000CS2 7,000 – 68,000 – – 13,000(CH3)2S2 60 – 180 – – 960
Mature wasteH2S 2,400 – 25,000 – – 7,000CS2 1,400 – 12,800 – – 900(CH3)2S2 <30 – 70 – – 170
Notes: 1 Environment Agency (2003b)2 All sites contain biodegradable waste
Dimethyl disulphide (70–480 µg m-3) was detected at every main gas sampling locationapart from the site taking ‘substantial fragmentiser’ waste (<30 µg m-3). Higherconcentrations of dimethyl disulphide were typically sampled from recent waste thanfrom mature waste at the ‘mainly domestic (with leachate)’, ‘substantial ash’ and C&Isites.
Tables 5.5 and 5.6 list important compounds in landfill gas in terms of toxicological andodour importance respectively (Environment Agency 2003b). Inorganic and methylatedspecies of relevance to the discussion above are highlighted in bold. These are:
• arsenic and mercury for toxicity;
• dimethyl disulphide and dimethyl sulphide for odour;
• hydrogen sulphide and carbon disulphide for toxicity and odour.
Table 5.7 summarises the trace compounds likely to be generated by chemical ormicrobial reactions within a mixed hazardous landfill or a mixed non-hazardous landfill.It identifies qualitatively whether the compounds are likely to be hazardous in terms oftheir toxicity, flammability and their ability to form explosive mixtures in air; it also noteswhether the compound could be an issue in terms of odour. These considerations arebased on various sources of data on laboratory hazards and, if no data are available,reasonable judgement where this is possible. Table 5.7 also indicates:
• the likely type of generation (microbial, chemical) and whether anoxicconditions may be required;
• the likely stability within the landfill (thermal stability, reactivity with waterand other materials within the landfill) and whether oxic conditions wouldaffect stability (see Appendix C);
• the likely stability above the landfill (thermal stability, reactivity with water,reactivity in air, photolytic degradation).

Science Report – Production gas production from landfilling of inorganic wastes 45
Hirner (2003) identified that two of the conditions favouring biomethylation weremetal(loid)s in easily accessible forms (e.g. as ions) and the presence ofmicroorganisms with biomethylation potential (see Section 4.3.2). This implies that:
• water must be available (i.e. the wastes must be damp);
• the appropriate microorganisms must be present as an active population.
For the reasons discussed in Section 3.3.1, microbial action is likely to occur in nicheswhere conditions are most favourable. This would tend to spread the generation ofmethylated species over a longer period of time than if microbial action occurredthroughout the landfill. In some waste types, the element of concern may not bereasonably accessible. Thus, as discussed in Section 4.3.3, the generation ofphosphine from steels depends on the rate of corrosion and the inventory ofphosphorus in steel is not instantly available for release as phosphine. Similarly,elements such as arsenic, antimony and selenium in waste electronic components maynot be readily available immediately after landfilling. Conversely, a process such asincineration will increase the concentration of some elements in the ash or pollutioncontrol residues, relative to the initial waste feed, and may also render them moreaccessible.
Table 5.5 Concentrations of top 16 toxicity priority trace components in landfillgas1,2,3
Species Average concentration from sitessampled in R&D Project P1-491 1
(10-6 g m-3)
Average concentration fromEnvironment Agency’s historic
database 2, (10-6 g m-3)Chloroethene 1.02 × 10⁵ 6.63 × 10⁴
Benzene 1.84 × 10⁴ 4.86 × 10³
Chloroethane 4.61 × 10² 7.68 × 10⁴
2-butoxy ethanol ≤2.0 × 10² 2.00 × 10²
Arsenic 5.11 × 101 3.65 × 100
Trichloroethene 8.59 × 10³ 1.50 × 10⁴
1,1-dichloroethene 2.23 × 10³ 1.00 × 10²
Furan 1.43 × 10³ 9.75 × 10²
Hydrogen sulphide 1.33 × 10⁵ 1.34 × 10⁵
1,1-dichloroethane 5.64 × 10² 4.77 × 10⁵
Carbon disulphide 3.40 × 10⁴ 7.66 × 101
1,2-dichloroethene 6.15 × 10³ 1.65 × 10⁴
Tetrachloromethane ≤7.0 × 101 5.26 × 10³
Methanal 5.90 × 101 2.93 × 10³
1,3-butadiene ≤7.0 × 101 1.82 × 10²
Mercury 5.00 × 10⁻¹ 4.09 × 100
Notes: 1 Environment Agency (2003b)2 Environment Agency (2002a)3.Bold entries = inorganic, organometalloid species

46 Science Report – Production gas production from landfilling of inorganic wastes
Table 5.6 Concentrations of top 16 odorous priority trace components in landfillgas1,2,3
Species Average concentration from sitessampled in R&D Project P1-491 1
(10-6 g m-3)
Average concentration fromEnvironment Agency’s historic
database 2, (10-6 g m-3)Hydrogen sulphide 1.33 ×10⁵ 1.34 ×10⁵
Methanethiol ≤1.0 ×10³ 7.26 ×10³
Carbon disulphide 3.40 ×10⁴ 7.66 ×101
Butyric acid 1.75 ×10³ 8.96 ×10³
Dimethyl disulphide 1.19 ×10³ 2.15 ×10²
Ethanal 3.91 ×10² 2.93 ×10³
Ethanethiol ≤3.0 ×10²) 1.45 ×10²
1-pentene 5.49 ×10³ 1.72 ×10³
ethyl butyrate 7.24 ×10³ 3.29 ×10⁴
Dimethyl sulphide ≤1.1 ×10² 4.80 ×10²
1-butanethiol ≤1.1 ×10² 2.00 ×10²
1-propanethiol 6.00 ×100 4.33 ×10²
Notes: 1 Environment Agency (2003b)2 Environment Agency (2002a)3.Bold entries = inorganic, organometalloid species

Science Report – Production gas production from landfilling of inorganic wastes 47
Table 5.7 Gaseous trace species likely to be generated in inorganic landfills1
Species
Toxic?
Flamm
able?
UnpleasantoO
dour?
Explosivem
ixture with
air?
Typical concentration2 ingas from existing landfills
(or other experiments3)(g m-3)
Potentialgeneration
process
Anaerobic
conditionsrequired
4?
Comments onstability within
landfill
Stable ifconditions
oxic?
Comments onstability in
atmosphereabove landfill
Stable in air+ light?
Group VIa
Mo(CO)6 Y N N N 1 × 10⁻⁸ to 3 × 10⁻⁷
(Feldmann and Cullen 1997)
Possiblychemical,probablymicrobial, needsCO
Y Relatively stable Y
Relativelystable, possiblyphotochemicallyunstable
N?
W(CO)6 Y N N N 5 × 10⁻⁹ to 2 × 10⁻⁷
(Feldmann and Cullen 1997)
Possiblychemical,probablymicrobial, needsCO
Y Relatively stable Y
Relativelystable, possiblyphotochemicallyunstable
N?
Group VIII
Ni(CO)4 Y Y Y Y (5 × 10⁻⁷ To 1 × 10⁻⁶)***(Feldmann 1999)
Chemical/microbial, needsCO
Y Highly reactive N Highly reactive N
Group IIb
Hg0 Y N N N9 × 10-7 (Feldmann 2003)1 × 10⁻⁸ to 1 × 10⁻⁵ (Lindberget al. 2005)
‘as disposed’,demethylation N Stable Y Stable Y
Hg(CH3)2 Y Y N N1 × 10-7 (Feldmann 2003)5 × 10⁻⁹ to 8 × 10⁻⁸ (Lindberget al. 2005)
Microbial Y Stable ? Decomposes tomonomethyl Hg N?
(CH3)Hg+X-
(expected X = OHor Cl)
Y Y? N? N? 2 × 10⁻⁹ to 4 × 10⁻⁸ (Lindberget al. 2005) Microbial Y ? ? ? ?

48 Science Report – Production gas production from landfilling of inorganic wastes
Table 5.7 (cont’d) Gaseous trace species likely to be generated in inorganic landfills1
Species
Toxic?
Flamm
able?
Unpleasantodour?
Explosivem
ixture with
air?
Typical concentration2 ingas from existing landfills
(or other experiments3)(g m-3)
Potentialgeneration
process
Anaerobic
conditionsrequired
4?
Comments onstability within
landfill
Stable ifconditions
oxic?
Comments onstability in
atmosphereabove landfill
Stable in air+ light?
Group IVbSimplehydrocarbonsexcluding methane(acetylene used asexample)
N Y N Y Chemical(carbides) N Stable Y Stable Y
CO Y Y N Y 6 × 10⁻³ (median)(Environment Agency 2004a)
Chemical,thermal Y Stable Y Stable Y
COCl2 Y N Y N – Chemical N
Decomposes oncontact withwater to giveCO and HCl
N
Decomposes oncontact withwater to giveCO and HCl
N
HCN Y Y Y Y – Chemical N Stable Y Stable YSi? Ge?
(CH3)4Sn Y Y – – 1 × 10⁻⁴ (Feldmann 2003) Microbial Y Hydrolyses? N? Decomposed bylight in air? N?
Other alkylated tincompounds(unknown)
Y? – – – 3 × 10⁻⁵ (Feldmann 2003) ‘As disposed?’,microbial Y Some relatively
stable? Y? Decomposed bylight in air? N?
Pb(CH3)4 Y Y Y Y ‘ng per m3 range’ (Feldmannand Cullen 1997) Microbial Y Hydrolyses? ? Light sensitive? N?
Pb(CH3)(C2H5)3 Y Y? Y? Y? 4 × 10⁻⁸ (Feldmann 2003) Microbial Y Hydrolyses? ? Light sensitive? N?
Pb(C2H5)4 Y Y Y Y1 × 10–6 (Feldmann 2003)‘ng per m3 range’ (Feldmannand Cullen 1997)
‘As disposed?’,microbial Y Hydrolyses? Y Light sensitive N

Science Report – Production gas production from landfilling of inorganic wastes 49
Table 5.7 (cont’d) Gaseous trace species likely to be generated in inorganic landfills1
Species
Toxic?
Flamm
able?
Unpleasantodour?
Explosivem
ixture with
air?
Typical concentration2 ingas from existing landfills
(or other experiments3)(g m-3)
Potentialgeneration
process
Anaerobic
conditionsrequired
4?
Comments onstability within
landfill
Stable ifconditions
oxic?
Comments onstability in
atmosphereabove landfill
Stable in air+ light?
Group Vb
NOx (for NO2) Y N Y N – Chemical NReactive,dissolves to givenitric acid
Y Reactive Y
NH3 Y Y Y Y – Chemical,microbial Y Highly water
soluble Y Stable Y
Amines (forexample oftrimethylamine)
Y Y Y Y –Chemical,(microbial fromputrescibles)
N Water soluble –Probably notpersistent inenvironment
N
PH3 Y Y Y Y 3 × 10⁻⁶ to 3 × 10⁻⁷ (Roelsand Verstraete 2004)
Microbial,chemical. Odourat lowconcentrationsdue to impurities
Y
Pyrophoric,spontaneouslyflammable in airdue to impurities
N
Pyrophoric,spontaneouslyflammable in airdue to impurities
N
AsH3 Y Y Y Y 7 × 10⁻⁸ (Feldmann 2003) Microbial,chemical Y
Thermallyunstable,pyrophoric
NThermallyunstable,pyrophoric
N
CH3AsH2 Y? Y? 4 × 10⁻⁶ (Feldmann 2003) Microbial Y – – Decomposed bylight in air N
(CH3)2AsH Y? Y? 1 × 10⁻⁸ (Feldmann 2003) Microbial Y – – Decomposed bylight in air N
(CH3)3As Y Y 4 × 10⁻⁶ (Feldmann 2003) Microbial Y – – Decomposed bylight in air N

50 Science Report – Production gas production from landfilling of inorganic wastes
Table 5.7 (cont’d) Gaseous trace species likely to be generated in inorganic landfills1
Species
Toxic?
Flamm
able?
Unpleasantodour?
Explosivem
ixture with
air?
Typical concentration2 ingas from existing landfills
(or other experiments3)(g m-3)
Potentialgeneration
process
Anaerobic
conditionsrequired
4?
Comments onstability within
landfill
Stable ifconditions
oxic?
Comments onstability in
atmosphereabove landfill
Stable in air+ light?
(CH3)2As(C2H5) Y Y? 4 × 10⁻⁸ (Feldmann 2003) Microbial Y – – Decomposed bylight in air? N?
As(C2H5)3 Y Y? – Microbial Y – – Decomposed bylight in air? N?
Total volatilearsenic(unspeciated)
Y? – – – 6 × 10⁻⁷ to 4 × 10⁻⁴
(Environment Agency 2003b) – – – – – –
(CH3)3Sb Y?1 × 10⁻⁴ (Feldmann, 2003) (2
× 10–4)** (Michalke et al.2000)
Microbial Y – – Decomposed bylight in air N
SbH3 Y Y Y Y (2 × 10⁻⁴)** (Michalke et al.2000)
Microbial action,chemical action Y Reacts with
moisture – Decomposed bylight in air N
(CH3)2SbH Y? (2 × 10⁻⁵)** (Michalke et al.2000) Microbial Y
Possiblyintermediate to(CH3)3Sb?
N Decomposed bylight in air N
(CH3)SbH2 Y? (2 × 10⁻⁵)** (Michalke et al.2000) Microbial Y
Possiblyintermediate to(CH3)3Sb?
N Decomposed bylight in air N
(CH3)3Bi1 × 10–6 (Feldmann 2003)
(4 × 10⁻⁵ to 1 × 10⁻⁴)**(Michalke et al. 2000)
Microbial Y – – – –

Science Report – Production gas production from landfilling of inorganic wastes 51
Table 5.7 (cont’d) Gaseous trace species likely to be generated in inorganic landfills1
Species
Toxic?
Flamm
able?
Unpleasantodour?
Explosivem
ixture with
air?
Typical concentration2 ingas from existing landfills
(or other experiments3)(g m-3)
Potentialgeneration
process
Anaerobic
conditionsrequired
4?
Comments onstability within
landfill
Stable ifconditions
oxic?
Comments onstability in
atmosphereabove landfill
Stable in air+ light?
GroupVIb
H2S Y Y Y Y3 × 10-2 to 6 × 10⁻¹
(Environment Agency2003b)*
Microbial,chemical. Y/N Soluble Y – Y
CS2 Y Y Y Y1 × 10-3 to 2 × 10⁻¹
(Environment Agency2003b)*
‘As disposed?’,microbial
Decomposes insunlight N
COS Y Y Y Y – ‘As disposed?’,microbial –
Corrosive tocommon metalswith waterpresent
– – –
(CH3)2S2 Y Y Y N?<3 × 10⁻⁵ to 1 × 10⁻²
(Environment Agency2003b)*
Microbial Y – N? Probablyoxidises N?
CH3SH Y Y Y ? 33 to 22,550 ppb (Kim et al.2005) Microbial Y Soluble Y? Probably
oxidises N?
(CH3)2S Y Y Y Y? 33 to 7,120 ppb (Kim et al.2005) Microbial Y – N? Probably
oxidises N?
(CH3)2Se Y N Y N (6 × 10⁻⁵)** (Michalke et al.2000) Microbial Y Reacts with
water – – –
H2Se Y Y Y Y - Microbial,chemical Y/N Reacts with
water – – –
(CH3)2Se2 Y? Y?2 × 10⁻⁸ (Feldmann 2003)(3 × 10⁻⁴)** (Michalke et al.
2000)Microbial Y – - – –
CSe2 Y N Y? N - Microbial – – – – –
(CH3)2Te Y Y1 × 10-7 (Feldmann 2003)(3 × 10⁻⁶)** (Michalke et al.
2000)Microbial Y
Thermallyunstable, reactswith H2O and air
NThermallyunstable, reactswith H2O and air
N

52 Science Report – Production gas production from landfilling of inorganic wastes
Table 5.7 (cont’d) Gaseous trace species likely to be generated in inorganic landfills1
Species
Toxic?
Flamm
able?
Unpleasantodour?
Explosivem
ixture with
air?
Typical concentration2 ingas from existing landfills
(or other experiments3)(g m-3)
Potentialgeneration
process
Anaerobic
conditionsrequired
4?
Comments onstability within
landfill
Stable ifconditions
oxic?
Comments onstability in
atmosphereabove landfill
Stable in air+ light?
Group VIIb
Hydrogen halidesY
HFHCl
N – N – Chemical N Highly reactive,water soluble Y Highly reactive,
water soluble Y
CH3I Y N Y N – Microbial –Decomposes inpresence ofmoisture
–Decomposes inpresence of lightand moisture
N
Notes: 1 N = No, Y = Yes based on data from various sources, Y? or N? = Yes or No based on judgement by analogy with similar compounds, – = not possible to make ajudgement (or, for mixed species, not applicable).2 Concentrations as the elements unless otherwise noted by * (* = concentration of molecular species)3 (Other experiments) denoted in ( ) are for gas samples taken from above incubated sewage sludge or M. formicicum cultures in laboratory experiments** ,or gassampled from sewage treatment plants***4 Anaerobic conditions may be required on at least the point of generation (e.g. arsine). Some methylation has been detected under aerobic conditions but in generalseems more favoured under anaerobic conditions (i.e. methanogenic conditions).

Science Report – Production gas production from landfilling of inorganic wastes 53
5.3 Trace gases from ‘as-deposited’ materialAny volatile material present in the solid waste when it is deposited is likely to enter thegas phase as a trace component. These substances will be partitioned between theliquid, solid and gas phases; conditions in the landfill will affect the quantity and rate atwhich they are released.
Fugacity models such as MOCLA have been used to model and predict the partitioningof organic molecules in MSW landfill (Kjeldsen and Christensen 2001). Similarprinciples would apply in an inorganic landfill. However, it is likely that pre-treatment willhave lowered the amounts of volatile substances present in predominantly inorganicwastes and so the quantities of trace substances will be low. But since the volume ofbulk gas will be much lower than at an MSW landfill, the concentration of these tracesmay not necessarily be lower.

54 Science Report – Production gas production from landfilling of inorganic wastes
6 Calculation of hydrogengeneration rates and redoxevolution
The redox conditions in a landfill containing metal residues will affect the gasgeneration processes. Hydrogen generation will be an important determinant ofwhether a landfill is anaerobic since hydrogen is the bulk gas most likely to displace theinitial inventory of air from the landfill and will balance the slow ingress of air into thewaste through the engineered barriers.
Scoping calculations were performed in order to investigate the effect of metalcorrosion on the evolution of the redox conditions of a landfill facility and the potentialfor hydrogen gas production. Two types of calculation were performed:
• for an unsaturated landfill facility filled with waste and initially aerobic;
• for a saturated landfill facility filled with waste and initially aerobic.
A number of assumptions were required for each calculation. These and themethodology used are discussed in Appendix D. In all cases, the calculations relate tothe period after emplacement of the waste and capping of the landfill cell. No allowanceis made for displacement of oxygen by any gases produced in the landfill.
6.1 Unsaturated landfill facilityThe first step in the calculations was to predict whether the landfill facility wouldbecome anaerobic based on the assumptions and starting conditions using themethodology described in Appendix D. This will occur when the rate of oxygenconsumption due to the aerobic corrosion of mild steel is much greater than the rate ofoxygen ingress. An example of the values of the parameters used and the calculatedrates and steady state partial pressure of oxygen are given in Table 6.1.
In the second step the rate of hydrogen generation is calculated. An example of the setof parameter values used for the unsaturated calculations is given in Tables 6.2 and6.3. For cases where the oxygen in the landfill is consumed, mild steel corrosion cancontinue anaerobically (at a different rate to aerobic corrosion). This process generateshydrogen. Reaction of other reactive metals in the waste might also lead to hydrogenevolution, even under aerobic conditions.
From an estimation of the masses of steel, aluminium and zinc in the waste andreported corrosion rate data (ASM 1987, Smart 2002), the amount of hydrogengenerated can be calculated. It has been assumed that the corrosion rates ofaluminium and zinc, and the anaerobic corrosion rate of mild steel are not timedependent – except that the latter occurs only once anaerobic conditions have beenestablished. The data are used to calculate:
• the time until anaerobic conditions are established;
• the hydrogen evolution rate;
• the time until metal exhaustion.
These can be used to calculate the cumulative hydrogen evolution profile as shown, forexample, in Figure 6.1.

Science Report – Production gas production from landfilling of inorganic wastes 55
Table 6.1 Example steady state calculation of the partial pressure of oxygen assuming pH 7 unsaturated conditions1
Main calculation (see Section 6.1) Supporting values and calculationsQuantity Value Units Quantity Value Units Quantity Value Units
Oxygen ingressK1 2.5 x 10⁻⁵ kg s-1 Ingress rate 2) 0.001 mg m-2 s-1
10-9 kg m-2 s-1
Depth 2) 40 mVolume waste 2) 106 m3
Horizontal landfill (cross-sectional area) 25,000 m2
Corrosionk 3.17 x 10⁻¹² m s-1 Corrosion rate (Smart 2002) 0.1 mm year-1
z 3,380 kg m-3 Mass per 1 m3 steel 7,850 kg m-3 Density (Sutherland 2004) 7,850 kg m3
Amount Fe 140,700 mol Atomic mass Fe 55.8 g mol-1
Amount O2 3) 105,500 molMass O2 3,376 kg m-3 Molecular mass O2 32 g mol-1
K2 1.07 x10⁻⁸ kg m-2 s-1
Percentage steel in waste 4) 1.1Mass waste 109 kgMass steel 1.1 107 kg
Am 2.81 x10⁶ m2 Assumed specific area of steel 0.255 m2 kg-1
K2 Am 0.0 kg s-1
Steady statepss 1.74 x10⁻⁴ atmosphere patm (Lide 1994) 0.209 atmosphere
Notes: 1 Bold values are main input parameters that may be varied.2 Professional judgement by A. Rosevear provided as a personal communication.3 Assuming conversion of iron to haematite: 4Fe + 3O2 = 2Fe2O3.4 Estimated for hazardous waste landfill (see Section 3.2.1 and Table 3.1)

56 Science Report – Production gas production from landfilling of inorganic wastes
1.00E+06
1.00E+07
1.00E+08
1.00E+09
1 10 100 1,000 10,000 100,000 1,000,000
time/ days (years)
Cumulativeamountofhydrogengasproduced/mol
mild steelZnAlTotal pH 7
(0.00274) (0.0274) (0.274) (2.74) (27.4) (274) (2740)
Calculations were performed using input values indicated in Tables 6.1, 6.2 and D1, and assumptions discussed in Appendix D.
Figure 6.1 Predicted hydrogen evolution profiles for pH 7 unsaturated conditions and a mild steel thickness of 1 mm

Science Report – Production gas production from landfilling of inorganic wastes 57
6.1.1 Results for unsaturated conditions
The details of the calculations are set out in Tables 6.2 and 6.3 using the pH 7 case asan example. The main results for the range of pH values and mild steel thicknessesconsidered are summarised in Table 6.4 and Figures 1–4.
For pH 7 and a steel thickness of 1 mm, the results indicate that under the assumedconditions the rate of oxygen ingress is small compared with the rate of consumptionby mild steel corrosion. Hence the steady-state partial pressure of oxygen is predictedto fall to 1.74 × 10⁻⁴ atmospheres. This value is just below the chosen criterion foranaerobic conditions (partial pressure of oxygen = 0.1 per cent of its initial value, seeAppendix D). The implicit assumption is that anaerobic corrosion can proceed at thispartial pressure of oxygen and that its rate is not reduced by this level of oxygen.
The time to the onset of anaerobic conditions was calculated to be around 159 days. Itshould be noted that this result is dependent on the aerobic corrosion rate valueselected for mild steel at pH 7 (Smart 2002) and the total area of the mild steel.
The corrosion rate could be an over-estimate.5 If there is insufficient water available orif it is largely consumed in corrosion processes or by other processes, then thecorrosion rate will be expected to drop. The corrosion rate could also be an over-estimate if the chloride concentration in the available water is low or if the ambienttemperature is low (the corrosion rate data have generally been determined attemperatures of 20–25°C). Similarly the corrosion rate would be lower if the steelcontains a protective coating (e.g. paint) or if the formation of corrosion products limitsthe rate at which oxygen reaches the corroding surface.
Table 6.2 Example calculation of time taken to achieve anaerobic conditionsassuming pH 7 unsaturated conditions1
Main calculation Supporting values and calculationsQuantity Value Units Quantity Value Units
Initial rate of oxygenconsumption (K2Am) 2)
0.03 kg s-1
Volume of landfill 1,000,000 m3
Volume of gas inlandfill (VLF)
200,000 m3 Porosity of waste 0.2
Molar volume ofO2 at STP4
0.02241 m3 mol-1
Molarconcentration
44.62 mol m-3
Massconcentration
1.428 kg m-3
Mass concentration ofO2 in air (co)
0.298 kg m-3 Fraction of O2 inair
0.209
Time until anaerobic(Tan) 3)
1.374 x 10⁷ s
159 days
Notes: 1 Bold values are main input parameters that may be varied.2 Calculated in Table 6.1.3 Calculated from Equation D6, Appendix D.4 standard temperature and pressure
5 Due to the assumption in Appendix D: Saturated landfill facility, that layers below the top layer containoxygen-saturated leachate initially.
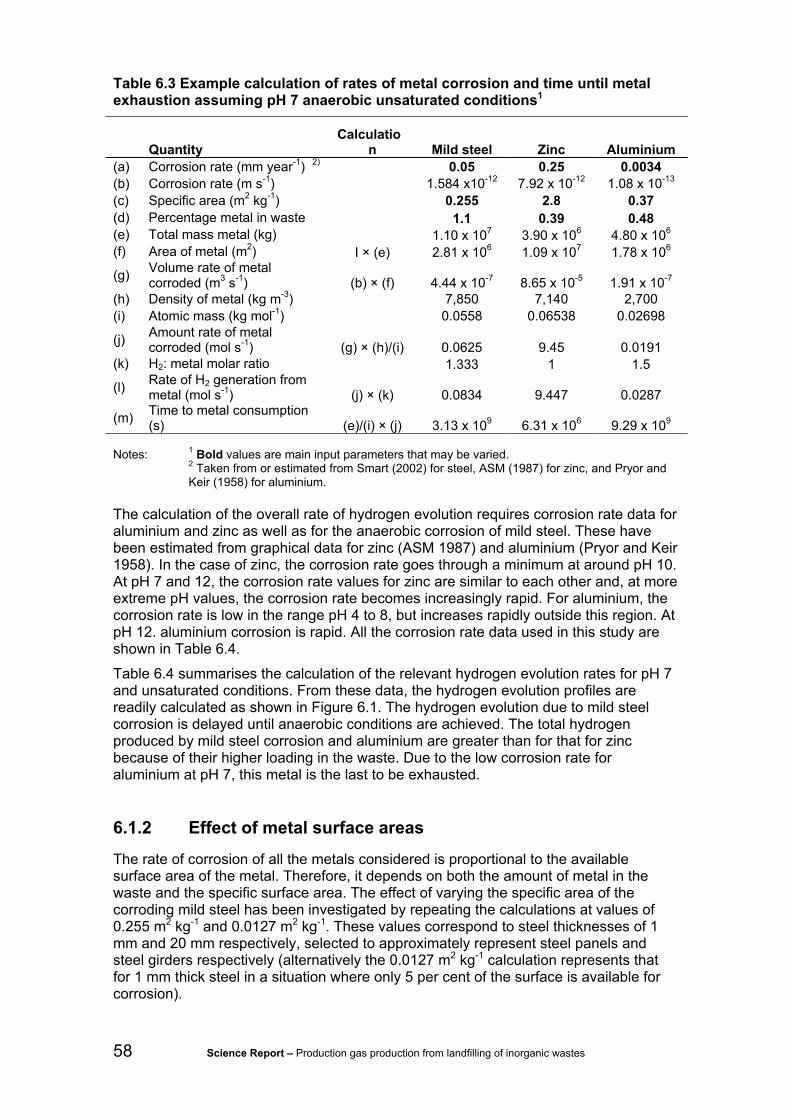
58 Science Report – Production gas production from landfilling of inorganic wastes
Table 6.3 Example calculation of rates of metal corrosion and time until metalexhaustion assuming pH 7 anaerobic unsaturated conditions1
QuantityCalculatio
n Mild steel Zinc Aluminium(a) Corrosion rate (mm year-1) 2) 0.05 0.25 0.0034(b) Corrosion rate (m s-1) 1.584 x10⁻¹² 7.92 x 10⁻¹² 1.08 x 10⁻¹³
(c) Specific area (m2 kg-1) 0.255 2.8 0.37(d) Percentage metal in waste 1.1 0.39 0.48(e) Total mass metal (kg) 1.10 x 10⁷ 3.90 x 10⁶ 4.80 x 10⁶
(f) Area of metal (m2) I × (e) 2.81 x 10⁶ 1.09 x 10⁷ 1.78 x 10⁶
(g) Volume rate of metalcorroded (m3 s-1) (b) × (f) 4.44 x 10⁻⁷ 8.65 x 10⁻⁵ 1.91 x 10⁻⁷
(h) Density of metal (kg m-3) 7,850 7,140 2,700(i) Atomic mass (kg mol-1) 0.0558 0.06538 0.02698
(j) Amount rate of metalcorroded (mol s-1) (g) × (h)/(i) 0.0625 9.45 0.0191
(k) H2: metal molar ratio 1.333 1 1.5
(l) Rate of H2 generation frommetal (mol s-1) (j) × (k) 0.0834 9.447 0.0287
(m) Time to metal consumption(s) (e)/(i) × (j) 3.13 x 10⁹ 6.31 x 10⁶ 9.29 x 10⁹
Notes: 1 Bold values are main input parameters that may be varied.2 Taken from or estimated from Smart (2002) for steel, ASM (1987) for zinc, and Pryor andKeir (1958) for aluminium.
The calculation of the overall rate of hydrogen evolution requires corrosion rate data foraluminium and zinc as well as for the anaerobic corrosion of mild steel. These havebeen estimated from graphical data for zinc (ASM 1987) and aluminium (Pryor and Keir1958). In the case of zinc, the corrosion rate goes through a minimum at around pH 10.At pH 7 and 12, the corrosion rate values for zinc are similar to each other and, at moreextreme pH values, the corrosion rate becomes increasingly rapid. For aluminium, thecorrosion rate is low in the range pH 4 to 8, but increases rapidly outside this region. AtpH 12. aluminium corrosion is rapid. All the corrosion rate data used in this study areshown in Table 6.4.
Table 6.4 summarises the calculation of the relevant hydrogen evolution rates for pH 7and unsaturated conditions. From these data, the hydrogen evolution profiles arereadily calculated as shown in Figure 6.1. The hydrogen evolution due to mild steelcorrosion is delayed until anaerobic conditions are achieved. The total hydrogenproduced by mild steel corrosion and aluminium are greater than for that for zincbecause of their higher loading in the waste. Due to the low corrosion rate foraluminium at pH 7, this metal is the last to be exhausted.
6.1.2 Effect of metal surface areas
The rate of corrosion of all the metals considered is proportional to the availablesurface area of the metal. Therefore, it depends on both the amount of metal in thewaste and the specific surface area. The effect of varying the specific area of thecorroding mild steel has been investigated by repeating the calculations at values of0.255 m2 kg-1 and 0.0127 m2 kg-1. These values correspond to steel thicknesses of 1mm and 20 mm respectively, selected to approximately represent steel panels andsteel girders respectively (alternatively the 0.0127 m2 kg-1 calculation represents thatfor 1 mm thick steel in a situation where only 5 per cent of the surface is available forcorrosion).

Science Report – Production gas production from landfilling of inorganic wastes 59
The effects on the steady state partial pressure of oxygen are shown in Table 6.4. Forthe thick mild steel case (low surface area), the steady-state partial pressure of oxygenis predicted to fall to only 3.44 × 10⁻³ atmospheres and is not considered to beanaerobic by the criteria specified above. Under these conditions, the hydrogenevolution profile is dependent only on the corrosion of aluminium and zinc as shown inFigure 6.2 because the mild steel corrosion is assumed to proceed aerobically (thetotal hydrogen generation curve for the thin mild steel case is shown for comparison).In reality, the steel present in the waste will be characterised by a range of specificsurface areas6 and these are likely to vary as corrosion proceeds. This is likely to resultin the variation of hydrogen evolution rates with time.
6 See the assumption in Appendix D: Unsaturated landfill facility, that the specific area of the mild steel inthe waste can be represented by a single value that remains constant.

60 Science Report – Production gas production from landfilling of inorganic wastes
1.00E+06
1.00E+07
1.00E+08
1.00E+09
1 10 100 1,000 10,000 100,000 1,000,000
time/ days (years)
Cum
ulat
ive
amou
nt o
f hyd
roge
n ga
s pr
oduc
ed/ m
ol
mild steel
Zn
Al
Total
Total (thinsteel calc.)from Fig. 1
(0.00274) (0.0274) (0.274) (2.74) (27.4) (274) (2740)
Calculations were performed using input values indicated in Tables 6.1, 6.2 and D1, and assumptions discussed in Appendix D.
Figure 6.2 Predicted hydrogen evolution profiles for pH 7 unsaturated conditions and a mild steel thickness of 20 mm

Science Report – Production gas production from landfilling of inorganic wastes 61
Table 6.4 Summary of results from calculations under unsaturated conditions
ConditionspH 7 pH 7 pH 9.5 pH 12 pH 7Quantity
(thick steel, good cap) (thin steel, good cap) (thin steel, poor cap)Values of varied input parametersMild steel thickness (mm) 20 1 1 1 1Corrosion rates (mm year-1)
Mild steel (aerobic) 0.1 0.10 0.1 0.1 0.10Mild steel (anaerobic) 0.005 0.005 0.00158 0.0005 0.005Zinc 0.25 0.25 0.05 0.25 0.25Aluminium 0.0034 0.0034 0.021 4.5 0.0034
ResultsSteady state partial pressure of oxygen(atmospheres) 3.44 x 10⁻³ 1.74 x 10⁻⁴ 1.74 x 10⁻⁴ 1.74 x 10⁻⁴ 1.61 x 10⁻²
Time to become anaerobic (days) Aerobic 159 159 159 AerobicRate of hydrogen production (mol s-1)
Mild steel (anaerobic) 0 0.083 0.026 0.0083 0Zinc 9.45 9.45 1.89 9.45 9.45Aluminium 0.029 0.029 0.177 38.02 0.029
Time until metal consumed (days)Mild steel – 36,500 115,000 365,000 –Zinc 73 73 365 73 73Aluminium 108,000 108,000 17,400 81 108,000

62 Science Report – Production gas production from landfilling of inorganic wastes
Table 6.5 Summary of input parameters for numerical simulation of landfill at pH 7 under saturated conditions
Diffusion parameters Corrosion parametersQuantity Value Units Quantity Value Units Quantity Value UnitsD 2) 2 x 10⁻⁹ m2 s-1 K 3) 0.1 mm year-1
L 0.1 m 3.17E-12 m s-1
L2 0.01 m2 Percentage steel in waste 3 1.1Mass of waste 3 1.0 x 10⁹ kg
∆t 10,000 s Mass of steel 1.8 x 10⁷ kgAm 9.0 x 10⁶ m2 Assumed specific area of steel 3 0.255 m2 kg-1
Z 3) 3,380 kg m-3
VLF 4) 200,000 m3
Notes: 1 Bold values are main input parameters that may be varied.2 Taken from Tinsley (1979).3 Taken from Table 6.1.4 Taken from Table 6.2

Science Report – Production gas production from landfilling of inorganic wastes 63
1.00E+06
1.00E+07
1.00E+08
1.00E+09
1 10 100 1,000 10,000 100,000 1,000,000
time/ days (years)
Cum
ulat
ive
amou
nt o
f hyd
roge
n ga
s pr
oduc
ed/ m
ol
mild steel
Zn
Al
Total pH 9.5
(0.00274) (0.0274) (0.274) (2.74) (27.4) (274) (2740)
Calculations were performed using input values indicated in Tables 6.1, 6.2 and D1, and assumptions discussed in Appendix D.
Figure 6.3 Predicted hydrogen evolution profiles for pH 9.5 unsaturated conditions and a mild steel thickness of 1 mm

64 Science Report – Production gas production from landfilling of inorganic wastes
1.00E+06
1.00E+07
1.00E+08
1.00E+09
1 10 100 1,000 10,000 100,000 1,000,000
time/ days (years)
Cum
ulat
ive
amou
nt o
f hyd
roge
n ga
s pr
oduc
ed/ m
ol
mild steel
Zn
Al
Total pH 12
(0.00274) (0.0274) (0.274) (2.74) (27.4) (274) (2740)
Calculations were performed using input values indicated in Tables 6.1, 6.2 and D1, and assumptions discussed in Appendix D.
Figure 6.4 Predicted hydrogen evolution profiles for pH 12 unsaturated conditions and a mild steel thickness of 1 mm

Science Report – Production gas production from landfilling of inorganic wastes 65
1.00E-03
1.00E-02
1.00E-01
1.00E+00
1.00E+01
1.00E+02
1 10 100 1,000 10,000 100,000 1,000,000
time/ days (years)
Rat
e of
hyd
roge
n pr
oduc
tion/
mol
s-1
pH 7
pH 12
mainly Zn + very low Al contributuion
mainly Al + Zn Al
mild steel
mainly mild steel + low Al contributuion
Al
(0.00274) (0.0274) (0.274) (2.74) (27.4) (274) (2740)
Calculations were performed using input values indicated in Tables 6.1, 6.2 and D1, and assumptions discussed in Appendix D.
Figure 6.5 Predicted hydrogen evolution rates for unsaturated conditions and a mild steel thickness of 1 mm

66 Science Report – Production gas production from landfilling of inorganic wastes
6.1.3 Effect of pH
The effect of pH on the landfill environment and hydrogen evolution were alsoinvestigated at pH 9.5 and pH 12.5 for the thin mild steel case. The change in pH in thecalculations was represented only through the corrosion rates of the mild steel, zincand aluminium.
In all cases the steady-state partial pressure of oxygen and the time until the onset ofanaerobic conditions were the same as for the corresponding pH 7 calculation. Thisfinding results from the use of the same value for the aerobic corrosion rate of mildsteel (Smart 2002). The values selected had been used in other modelling work and lienear the centre of the experimental data reviewed by Smart (2002). However, thesedata show a range of values covering some orders of magnitude in some cases.
At pH 9.5, the early rate of hydrogen production is reduced due to the lower rate of zinccorrosion (Figure 6.3). Similarly the rate from mild steel corrosion is slightly reducedcompared with the pH 7 case. The rate of hydrogen production due to aluminiumcorrosion rises, increasing the total rate of hydrogen production at around 10,000 days.
At pH 12, the aluminium corrosion rate is much greater and leads to rapid hydrogenevolution at early times (Figure 6.4). In contrast, the mild steel corrosion rate andconsequent hydrogen evolution rate are significantly slower.
While Figures 6.1–6.4 show the effect of pH on the hydrogen evolution profile, they donot demonstrate clearly the rates of hydrogen production which are shown in Figure6.5. At pH 7, the results show high rates of hydrogen production at early times arisingmainly from the corrosion of zinc (the corrosion of aluminium at pH 7 is very low). Thehigh production rate for hydrogen is dependent on the assumption of unrestricted wateravailability at the corroding surface. The rate of hydrogen production drops rapidly oncethe zinc metal is exhausted but rises again once anaerobic conditions are established.The hydrogen production at this stage results principally from mild steel corrosion andproceeds at this level until the steel is exhausted.
At pH 12, hydrogen production is even higher at early times than for the pH 7 case.This results from the high reactivity of aluminium under alkaline conditions (providingwater availability is unrestricted). This hydrogen production rate for aluminiumcorrosion at pH 12 arises from the (uncoupled) corrosion rate data used (Pryor andKeir 1958). An alternative source (Tabrizi et al. 1991) gives a value at pH 12 that islower by about an order of magnitude, suggesting that the calculated hydrogenproduction rate might be an over-estimate. In contrast to the pH 7 case, the aluminiumis exhausted at an early stage. Once anaerobic conditions are established, hydrogenproduction occurs only from mild steel corrosion. The rate of this corrosion is about anorder of magnitude lower than at pH 7 due to passivation of the steel surface at highpH. Consequently the period of corrosion is extended.
6.1.4 Effect of oxygen ingress rate
The effect of oxygen ingress rate was varied so that the presence of a less effectivecap could be investigated.
The oxygen ingress rate was increased by a factor of 100 from that used in the basecase calculations described above. Under these conditions, for the thin steel (highsurface area) assumption at pH 7, the landfill was not predicted to become anaerobic.Indeed the partial pressure of oxygen was predicted to drop only by about one order ofmagnitude from its value in air (Table 6.4). The predicted hydrogen evolution in thiscase was the same as that calculated for the low oxygen ingress rate and low surface

Science Report – Production gas production from landfilling of inorganic wastes 67
area case shown in Figure 6.2. In both cases the landfill was predicted to remainaerobic and no hydrogen generation from mild steel corrosion was predicted.
In a further calculation in which the oxygen ingress rate was increased by a factor ofjust 10 from that used in the base case calculation, the landfill was again predicted toremain aerobic with a steady-state partial pressure of oxygen of around 1.7 × 10⁻³
atmospheres.
6.2 Saturated landfill facilityCalculations were performed to investigate whether a landfill with a given wastecomposition is likely to become anaerobic if it is saturated with leachate. Thecalculations are relevant to a landfill where water ingress can occur readily filling thewaste voidage or to a lower layer of a facility that is saturated after less water hasentered. The input parameters for the calculations are given in Table 6.5.
6.2.1 Results for saturated conditions
The numerical results representing aerobic corrosion of mild steel in a saturatedsystem at pH are given in Figure 6.6. These results show that, for the selected aerobiccorrosion rate and area of mild steel, the porewater becomes anaerobic relativelyrapidly even at shallow depths. At long times or in layers close to the top layer, asteady state is achieved with the oxygen concentration decreasing rapidly withdistance. At shorter times or in lower layers, the concentration of oxygen depends onlyon the extent of corrosion. Below a depth of 0.4 m, the oxygen concentration isreduced by a factor of one thousand from its initial saturated value within 17 days.
Where the porewater becomes anaerobic, it is expected that at anaerobic corrosion willoccur at the same rate as calculated for the unsaturated case (see Section 6.1). This isdue to the assumption for the unsaturated case calculations that sufficient water isavailable for corrosion to occur. Similarly, the rates and timescales of aluminium andzinc corrosion are expected to be the same as for the unsaturated case. The hydrogenevolution profiles are therefore expected to be similar to those for the equivalentunsaturated case calculation except that the onset of anaerobic conditions and thehydrogen evolution due to anaerobic mild steel corrosion will occur at a different timeand will vary with depth in the upper layers.
6.3 DiscussionThe key parameters in determining whether a landfill facility will become anaerobic (inthe assumed absence of significant microbial activity) are the relative rates of oxygeningress and oxygen consumption due to aerobic corrosion of iron and steel.
For the assumed pH conditions and waste composition, it is predicted that the landfillwill become anaerobic providing:
• the surface area of the corroding steel is sufficiently high (e.g. thin sheetsor particles and lack of protective coatings);
• corrosion is not limited by restricted water availability.
Where these conditions are not met, it is likely that the landfill will remain aerobic.
These results are strongly dependent on the selected aerobic corrosion rates for steel.Reported measurements cover a range of wide values. A further factor that will

68 Science Report – Production gas production from landfilling of inorganic wastes
influence whether anaerobic conditions are established is the hindrance of oxygeningress due to hydrogen evolution and egress under conditions where the corrosion ofzinc and aluminium is rapid.
At early times in a landfill facility, hydrogen production is likely to be high due to zinccorrosion (at pH 7) or aluminium and zinc corrosion (at pH 12), providing water isreadily available. Beyond this period, hydrogen production is expected to fall to verylow levels if the landfill remains aerobic. If anaerobic conditions are established,hydrogen production is expected to continue due to mild steel corrosion. The rate ofhydrogen production by this mechanism decreases significantly at high pH values.
In all the calculations described above, it has been assumed the various metals areuncoupled (i.e. not in physical contact with each other and with water). Where coupling,occurs the rate of corrosion of the more reactive metal can increase dramatically, forexample for zinc (ASM 1987) and aluminium (Pryor and Keir 1958) in contact withsteel.
The total volume of hydrogen that might be generated based on the full corrosion of thecomplete inventory of the mild steel, zinc and aluminium is around 66 times greaterthan the voidage space in the assumed landfill facility. For the given parameters andassumptions, sufficient hydrogen to fill the voidage is predicted to be generated in 11days at pH 7, due principally to the corrosion of zinc. At pH 12, this is expected to occurwithin 2–3 days, due mostly to corrosion of aluminium. Thus at early times the facilitycould become anaerobic due to displacement of oxygen by hydrogen generated fromreactive metal corrosion. Once the zinc (and aluminium at pH 12) are exhausted,aerobic conditions might be re-established if the generation of hydrogen due toanaerobic corrosion of mild steel and/or the consumption of oxygen due to aerobiccorrosion of mild steel is too low to maintain anaerobic conditions.
The results described above consider a single waste composition and landfill design. Inpractice, the results will be strongly dependent on the amounts of corroding metals inthe waste and their form. In addition, an actual landfill facility will not be homogeneous.Varying chemical conditions and metal loadings in different regions may affect theevolution of local conditions. In any locally acidic regions, hydrogen production ratesdue to metal corrosion might be higher than those described above.
The calculations reported have been carried out for a large landfill facility. For a smallerfacility, the establishment of reducing conditions is expected to be less likely becausethe rate of oxygen consumption by corrosion is proportional to the volume of the waste,whereas the rate of oxygen ingress is proportional to the surface area of the cap. Theslow filling of a cell will allow greater access of air to the waste so may also decreasethe chances that anaerobic conditions are established
The calculations described above were based on available data and limited modeldevelopment. Further developments that may potentially be useful include:
• development of the model for oxygen ingress to allow for a pressuregradient across the cap and the effect of hydrogen egress (the currentstudy uses a simple approach for oxygen ingress based on an emission ofmethane for a ‘good cap’ and an assumption that the rate of oxygeningress/egress is dependent on a diffusion mechanism);
• model development and data assessment for the likely water availability asa function of time;
• more detailed review of the range of aqueous chemical conditions likely toexist in the early anaerobic unsaturated phase and of the correspondingcorrosion rates (particularly for mild steel);
• review of the typical unprotected surface area of mild steel likely to bepresent for a given facility.

Science Report – Production gas production from landfilling of inorganic wastes 69
1.00E-06
1.00E-05
1.00E-04
1.00E-03
1.00E-02
1.00E-01
1.00E+00
0.0 0.2 0.4 0.6 0.8 1.0 1.2
L/ m
C(O
2)/ k
g m
-3
5.8 days11.6 days17.4 days23.1 days28.6 days
See Appendix D for assumptions and boundary conditions and Table 6.3 for input parameters.
Figure 6.6 Predicted variation of oxygen concentration with depth and time in a saturated landfill at pH 7 with an aerobic Top layerand corrosion occurring in all lower layers

70 Science Report – Production gas production from landfilling of inorganic wastes
7 Possible identification andmonitoring methods
7.1 IntroductionThe components of landfill gas may be monitored:
• in the field using portable equipment;
• in a sample taken back to a laboratory using more sophisticated equipment.
In general, the portable methods are less costly but are inadequate for quantifyingsmall amounts of a substance or resolving complex mixtures. Since the gas from futurelandfills containing a high proportion of inorganic material is less likely to be dominatedby a few bulk gases, laboratory-based methods of analysis will be more important thanhas been the case for gas from MSW landfills.
A detailed review of analytical techniques in general is given in the 15 volumes of theEncyclopedia of Analytical Chemistry (Meyer 2000). In particular, Volume 3 considersenvironmental trace gas analysis, while Volumes 4 and 5 include a discussion of fieldportable instrumentation. These volumes provide a useful background to the range oftechniques available.
7.1.1 Portable equipment
Field measurements may be appropriate for the screening of some gases. One of thesimplest methods of detecting gaseous species is to use gas detector tubes. Theseutilise chemical reactions to indicate the presence of gaseous species by observing theresulting colour change in the tube packing. A sample of gas is drawn though the tubeby means of a hand-held pump and the length along the tube to which the colourchange reaches can provide an indication of the concentration. They are thus simple touse on-site and offer an inexpensive means of analysis. However, they are prone tointerferences and are only suitable to indicate the potential presence of the species ofinterest in landfill gas (Environment Agency 2004a). Appendix E gives a list of speciesof possible interest in this report that may be detected using tubes from onecommercial source (Matheson Tri-Gas), including the measurement ranges andpotential interferences. More sophisticated techniques are likely to be required todetermine volatile species in gas from future landfills.
Hand-held gas monitoring devices are commonly used for routine measurements atMSW landfills. These instruments generally use:
• infra-red (IR) sensors to measure methane and carbon dioxide;
• an electrochemical sensor to measure oxygen.
They also use selective filters to give an estimate of carbon monoxide and hydrogencyanide and a number of other constituents that may be present in the gas at thepercent level by volume.
Instruments such as those currently supplied by Geotechnical Instruments (UK) Ltd(http://www.geotech.co.uk) and Gas Data Ltd (http://www.gasdata.co.uk) for monitoringbulk gases may be useful to measure methane, carbon dioxide and oxygen in gases

Science Report – Production gas production from landfilling of inorganic wastes 71
from inorganic landfills. The Triple Plus+ monitor from Crowcon(http://www.crowcon.com), for example, can monitor up to four gases including:
• methane (0–100 per cent volume);
• hydrogen sulphide (0–50 ppm);
• carbon monoxide (0–500 ppm);
• nitrogen dioxide (0–10 ppm);
• phosphine (0–5 ppm;)
• ammonia (0–50 ppm;)
• hydrogen (0–2000 ppm ; non flammable levels) ;
• hydrogen cyanide (0–10 and 0–25 ppm).
Although these detection limits may be high compared with the expectedconcentrations for some species (e.g. phosphine), they are sufficient for others such ashydrogen. Sensors for detecting other species are also available (e.g. from Crowcon).
A portable time-of-flight mass spectrometer has been used to detect a range of volatileorganic compounds in landfill gas (Kore Technology 2005). This uses a doublemembrane inlet system so that no sample preparation is needed. It can be used toquantify mixtures where individual organic compounds (e.g. hydrocarbons andchlorocarbons) are present in the mid ppb to low ppm range.
Allowance should be made for the potentially high flammability of the gases emittedfrom predominantly inorganic wastes. Although the flux of gas will be lower than fromexisting MSW waste, the higher proportion of hydrogen may result in a greaterprobability of gas concentrations being within the flammability range. Hence, it isimportant to use instruments with an appropriate ATEX rating when working inpotentially explosive atmospheres (CEC 1994).
7.1.2 Sampling
Where gas has to be taken to a laboratory for instrumental analysis, methods ofrepresentative sampling are required. Several types of gas-tight, inert containers arealready used in monitoring existing landfill gas such as:
• stainless steel containers (Schweigkofler and Niessner 1999);
• Tedlar bags (Environment Agency 2003b).
In general, similar methods may be adapted to sampling from inorganic landfills,though Tedlar bags may not be totally inert with respect to some substances. Thecapture and concentration of minor species on sorption columns (e.g. automatedthermal desorption tubes) may be necessary for some species present in gas frominorganic wastes.
7.2 Instrumental methods of analysisCoupled (or hyphenated) analytical techniques [e.g. gas chromatography–massspectrometry (GC-MS)] involve the linking of a chromatographic front-end separationtechnique to a sensitive element-specific detector – typically atomic absorptionspectroscopy, atomic emission spectroscopy or mass spectrometry (MS) – formeasurement.

72 Science Report – Production gas production from landfilling of inorganic wastes
‘Non-hyphenated’ techniques (e.g. mass spectrometry) cannot generally achieve suchlow limits for organometallic analysis, but are useful for screening and are significantlycheaper to purchase and operate. The following is a brief review of the most common‘hyphenated’ and ‘non-hyphenated’ instrumental techniques available for volatileelemental analysis.
7.2.1 Flame absorption spectroscopy (flame AAS)
Atomic absorption spectroscopy is now rarely used for landfill gas monitoringapplications because of its low sensitivity compared with other methods. The techniqueis therefore limited to screening analysis for mercury after its pre-concentration usingthe cold vapour technique. Cold vapour (CV) involves the use of a gold or an iodatedactive charcoal trap to pre-concentrate mercury prior to measurement by flame AAS(CV-AAS) or atomic fluorescence spectroscopy (CV-AFS).
In atomic absorption spectroscopy, the element in its atomic form is introduced into alight beam of appropriate wavelength causing the atom to absorb light (atomicabsorption) and enter an excited state. The reduction in intensity of the light beam canbe measured and correlated directly with the concentration of the elemental atomicspecies. This is carried out by comparing the light absorbance of the unknown samplewith the light absorbance of known calibration standards.
A typical atomic absorption spectrometer consists of an appropriate light source(usually a hollow cathode lamp containing the element to be measured), an absorptionpath (usually a flame but occasionally an absorption cell), a monochromator (to isolatethe light of appropriate wavelength) and a detector.
The most common form of AAS is called flame atomic absorption. In this technique, asolution of the element of interest is drawn through a flame in order to generate theelement in its atomic form. At the same time, light from a hollow cathode lamp ispassed through the flame and atomic absorption occurs.
Advantages of AAS
• The technology is relatively inexpensive and the equipment is easy to use.
• Sample throughput is high as each measurement can take only seconds(when the instrument is calibrated).
• The technique is applicable over a wide range of concentrations for mostelements.
Limitations of AAS
• AAS is a sequential (only one element at a time) analytical technique. It isbetter suited to the measurement of small suites of elements as largersuites become progressively uneconomic.
• Interferences from other elements or chemical species can reduceatomisation and depress absorbance, thereby reducing sensitivity.
• Sensitivity is poor in comparison to inductively coupled plasma-massspectrometry (ICP-MS) and atomic fluorescence spectroscopy (AFS).

Science Report – Production gas production from landfilling of inorganic wastes 73
7.2.2 Inductively coupled plasma emission spectroscopy (ICP-AES)
Like AAS, poor sensitivity means that ICP-AES is limited in application for landfill gasanalysis, but it is used for screening in association with:
• cold vapour (CV-ICP-AES for mercury determination;
• hydride generation (HG-ICP-AES) for arsenic, mercury, antimony andselenium analysis.
In plasma emission spectroscopy, a sample solution is introduced into the core of aninductively coupled argon plasma at a temperature of approximately 8,000°C. At thistemperature, all elements become thermally excited and emit light at their characteristicwavelengths. This light is collected by the spectrometer and passes through adiffraction grating that serves to resolve the light into a spectrum of its constituentwavelengths. Within the spectrometer, this diffracted light is then collected bywavelength and amplified to yield an intensity measurement that can be converted toan elemental concentration by comparison with calibration standards. Thismeasurement process is a form of AES.
Advantages of ICP-AES
• Up to 70 elements can be determined simultaneously in a single sampleanalysis.
• It offers a useful working range over several orders of magnitude.
Limitations of ICP-AES
• The emission spectra are complex and inter-element interferences arepossible if the wavelength of the element of interest is very close to that ofanother element.
• Sensitivity is similar to that of flame AAS with a sensitivity typically 10–100times less than ICP-MS.
7.2.3 Atomic fluorescence spectroscopy (AFS)
AFS involves measurement of the optical emission from gas-phase atoms that havebeen excited to higher energy levels by absorption of electromagnetic radiation.Mercury, arsenic, selenium, and antimony can be measured by AFS to significantlylower levels than those achieved by AAS or ICP-AES. Specific methods for use of thistechnique for mercury speciation are discussed in Section 7.5.1.
The benefits of AFS are high sensitivity and low detection limits for the elements listedabove. Speciation of organometallic compounds is achievable by the use of gaschromatography separation prior to CV-AFS detection for mercury or HG-AFS for As,Se and Sb.
7.2.4 Inductively coupled plasma-mass spectroscopy (ICP-MS)
In plasma mass spectroscopy, an inductively coupled argon plasma is used as anexcitation source for the elements of interest. But in contrast to ICP-AES, the plasma in

74 Science Report – Production gas production from landfilling of inorganic wastes
ICP-MS is used to generate ions that are then introduced to a mass spectrometer.These ions are separated and collected by the MS according to their mass-to-chargeratios (m/e). The constituents of an unknown sample can then be identified andmeasured. Different types of ICP-MS are available; their advantages anddisadvantages are briefly described below.
Quadrupole ICP-MS (Q-ICP-MS)
This is the most common, and cheapest, ICP-MS. It uses a ‘quadrupole’ comprising offour cylindrical rods through which are applied radio frequency (RF) and direct current(DC) electric fields. The ions created by the plasma enter the quadrupole and, bytuning the fields of the rods, the ions that can pass through the quadrupole can beselected according to their m/e ratio.
Advantages of Q-ICP-MS
• Fast analysis – a mass spectrum of usable data can be acquired in just afew seconds depending on exact instrument settings.
• High sensitivity – modern quadrupoles are able to detect trace levels ofmany elements at levels well below one ppb (ng g-1).
• A large linear working range of several orders of magnitude.
• Robust, well established technology.
Disadvantages of Q-ICP-MS
• Inability to resolve target isotope easily from molecular interferences –commercially available Q-ICP-MS systems are able to resolve a massspectrum only to unit resolution. This means that while the mass analysercan easily tell the difference between 56Fe and 57Fe, it cannot resolve 56Fe(mass 55.935) from the 40Ar 16O molecular species (mass 55.957), which isvery easily formed in an argon plasma.
• High background noise – the ion optics of quadrupole mass analysersmake them susceptible to background noise on the detector, particularlywhen coupled to an ICP source. High-energy photons from the plasmasource can reach the detector sending false pulses into the countingelectronics. This increases background noise and results in increased limitsof detection (LODs).
High-resolution ICP-MS (HR-ICP-MS)
A typical commercially available high-resolution ICP-MS is able to resolve mostisotopes from any molecular species that would otherwise interfere with their analysis.High-resolution systems use a powerful electromagnet with a varying magnetic fieldrather than an RF/DC field used in a quadrupole.
Advantages of HR-ICP-MS
• Very high sensitivity – high-resolution systems have extremely high iontransport efficiency. This efficiency gives rise to very high levels ofsensitivity.
• Low noise – due to the design of the high-resolution mass analyser, there isvirtually no chance of any stray photon making its way all the way throughthe instrument. This results in extremely low background noise, typically

Science Report – Production gas production from landfilling of inorganic wastes 75
less than 0.2 counts per second. Low noise levels, coupled with very highsensitivity, enable HR-ICP-MS to achieve very low LODs.
Disadvantages of HR-ICP-MS
• Slow analysis speed – the high-resolution mass analyser uses anelectromagnet to separate the masses by changing the magnetic fieldstrength between one mass and the next. This takes significantly longerthan changing an electrical field.
• Mass drift – at higher resolutions, peaks are extremely narrow, so itbecomes much more difficult for the magnet to move to exactly the samemass each time an element is measured. For this reason, high-resolutionpeaks are always measured by scanning across the entire peak. While thisensures that no counts are missed, peak scanning takes longer than the‘peak hopping’ used in a quadrupole instrument.
• Price – HR-ICP-MS instruments are expensive and thus may not becommercially viable for landfill gas monitoring purposes.
Time-of-flight ICP-MS (TOF-ICP-MS)
Commercial TOF-ICP-MSs have only been available since 1998, so their use has beenso far more limited than quadrupole mass spectrometers. With quadrupole-MS andHR-ICP-MS, the ions of interest are specifically focused to reach the detector but, withTOF, all ions are measured. The ions are accelerated to attain the same kinetic energy,and then pass through a vacuum tube en-route to the detector. The velocity at whichthe ions pass down the tube is proportional to their m/e ratio, with lighter ions reachingthe detector before heavy ions. Spectra of the ion population are then captured rapidlyand plotted as ion signal versus time calibrated to mass. Thousands of mass spectraper second may be captured, making TOF a very rapid multi-element analyser.
Advantages of TOF-ICP-MS
• Rapid analysis – a mass spectrum of usable data can be acquired in just afew seconds depending on exact instrument settings.
• High sensitivity – similar to that achieved by Q-ICP-MS.
• Simultaneous analysis – multi-element analysis performed simultaneously,with increased resolution from interferences compared with Q-ICP-MS.
Disadvantages of TOF-ICP-MS
• Limited commercial availability.
• High price (though significantly cheaper than HR-ICP-MS).
7.2.5 Hyphenated methods: GC-ICP-MS, GC-CV-AFS, GC-TOF-ICP-MS
The detection systems described above can be linked to a chromatographic front endfor trace analysis of organometallic compounds. Gas chromatography (GC) and, to alesser extent, high performance liquid chromatography (HPLC), are the mainseparation techniques used.
GC involves a gaseous sample being passed through a chromatographic column thatseparates the compounds according to their boiling points. The result is that the lighter

76 Science Report – Production gas production from landfilling of inorganic wastes
lower boiling compounds emerge from the column before the heavier compounds. Theseparated compounds then pass onwards to the elemental analyser for metalsanalysis.
The benefits of GC separation include
• identification of compounds by comparison of their retention time (time topass through the column) to standards;
• quantification and speciation of organometallic compounds to trace levels.
GC-ICP-MS is one of the most powerful tools for analysis of volatile elemental species.
Examples of the techniques that have been applied to landfill gas, sewage gas orsimilar situations to obtain information on trace species of interest are described below.
7.3 Monitoring of gases from existing UK landfillsGas chromatography is used to analyse gas samples for simple hydrocarbons such asmethane, ethane, ethene, etc. as well as for carbon dioxide and hydrogen. The samemethod can also detect acetylene. Although the proportions of these may be differentin gas from inorganic landfilled material, the methodology is still applicable.
Methods for monitoring key trace components of landfill gas from existing MSWlandfills are discussed in a series of Environment Agency reports (Environment Agency2002a, 2003b, 2004b). Guidance for Monitoring Trace Components in Landfill((Environment Agency 2004b) presents current best practice and discusses:
• general monitoring issues;
• recommended approach to monitoring for trace priority components;
• on-site preliminary field measurements;
• protocols for monitoring specific trace components;
It also gives example report formats and recommended detection limits.
Table 7.1 lists the priority trace components to be monitored in gas from existinglandfills and recommended detection limits. This list was derived from existing averageconcentrations found in UK landfill gas and forms the basis of the guidance given inEnvironment Agency (2004b). This cautions that trace components not identified inTable 7.1 should not initially be disregarded in a site-specific assessment.
Table 7.2 gives examples of substances that would require alternative monitoringtechniques.
Table 7.3 summarises the recommended monitoring methods for the classes ofcomponents identified:
• hydrogen sulphide;
• speciated VOCs;
• aldehydes;
• total inorganic arsenic;
• total mercury;
• polychlorinated dibenzo-p-dioxins (PCDDs) and polychlorinateddibenzofurans (PCDFs);

Science Report – Production gas production from landfilling of inorganic wastes 77
• carbon monoxide.
These methods are applicable to monitoring these gases from future landfillscontaining predominantly inorganic wastes. Quantification of Trace Components inLandfill Gas (Environment Agency 2003b) gives more information on samplingtechniques and analyses for these gases.
Environment Agency (2002a) makes the following general points concerning theseanalyses.
• Landfill gas sampling must be carried out with intrinsically safe samplingequipment. This can be achieved with suitable battery-powered equipment.This allows sampling from points where there is insufficient pressure toforce gas through sampling devices.
• In most cases, it is preferable to collect sample directly onto the extractionmedia of choice. Use of a Tedlar bag grab sample and sub-samples takenfrom this should be treated with caution because the stability of a number oftarget analytes within a Tedlar bag has not been thoroughly tested.
• The majority of the target VOCs (including the organohalogens andorganosulphur compounds) can be determined by collection onto a mixed-bed thermal desorption tube followed by analysis using GC-MS. Thistechnique will also detect many VOCs of lower priority.
• A separate technique must be used for determining methanal(formaldehyde). There is an established and rugged technique for methanaldetermination involving in-situ derivatisation, which will also detect othercarbonyl compounds.
• Hydrogen sulphide can be analysed adequately using real-time hand-heldanalysers, although the possibility of interferences must be considered.
• The determination of total gaseous mercury using AAS or ICP isrecommended as an initial step in a landfill gas survey because both thesemethods are straightforward. If significant amounts of mercury aremeasured, then the method described by Lindberg et al. (2001) allows thespeciation of mercury to be determined.
• The determination of total arsenic by CV-AAS/ICP is recommended beforepursuing more complicated techniques that will provide speciation results.

78 Science Report – Production gas production from landfilling of inorganic wastes
Table 7.1 Priority trace components to be monitored in gas from existing mixedlandfills1
Significant trace component Potential impact CategoryRecommendeddetection limit
(µg m-3)1,1-dichlorethane Health Halocarbon 601,1-dichlorethene Health Halocarbon 901,2-dichlorethene Health Halocarbon 701,3-butadiene Health Aliphatic hydrocarbon 701-butanethiol Odour Organosulphur 3001-pentene Odour Aliphatic hydrocarbon 1601-propanethiol Odour Organosulphur 2002-butoxy ethanol Health Alcohol 200Arsenic (as As) Health Inorganic 0.04Benzene Health Aromatic hydrocarbon 30Butyric acid Odour Carboxylic acid 400Carbon disulphide Odour and health Organosulphur 100Chloroethane Health Halocarbon 120Chloroethene (vinyl chloride) Health Halocarbon 300Dimethyl disulphide Odour Organosulphur 100Dimethyl sulphide Odour Organosulphur 110Ethanal (acetaldehyde) Odour Aldehyde 12Ethanethiol Odour Organosulphur 300Ethyl butyrate Odour Ester 90Furan (1,4-epoxy-1,3-butadiene) Health Ether 70Hydrogen sulphide Health and odour Inorganic 150Methanal (formaldehyde) Health Aldehyde 12Methanethiol Odour Organosulphur 1,000Tetrachloromethane Health Halocarbon 70Trichloroethene Health Halocarbon 40
Notes: 1 Environment Agency (2004b)
Table 7.2 Additional components that may be monitored in gas from existingmixed landfills1
Trace component Potential impact Category Recommendeddetection limit
Mercury (as Hg) Health Inorganic 0.5 µg m-3
PCDDs and PCDFs Health Chlorinated aromatic 0.1 ng m-3 I-TEQ 2)
Carbon monoxide Health Inorganic 1 ppmv
Notes: 1 Environment Agency (2004b)2 International Toxic Equivalent

Science Report – Production gas production from landfilling of inorganic wastes 79
Table 7.3 Recommended monitoring methods for trace components in gas fromexisting mixed landfills1
Determinand Sampling method Status/standard2 Analytical methodHydrogen sulphide Direct on-site
measurementGold film portableanalyser in real time
Gresham tube orTedlar bag
In the laboratory. Afterdilution into range ofgold film instrument orby GC-MS with nodilution
Speciated VOCs Dual solid sorbent(ATD tube)
Based on ISO 16017-1 GC-MS using suitablecapillary column
Aldehydes Reactive sorbent(DNPH3 impregnatedsilica)
USEPA TO-11 HPLC with UVdetection
Total inorganicarsenic
Solid sorbent(activated charcoal/cellulose filter)
NIOSH 6001 CV-AAS/ICP-MS
Total mercury Solid sorbent(iodinated charcoal)
NIOSH 6009 CV-AAS/ICP-MS
PCDDs and PCDFs Solid sorbent (XADresin column)
NIOSH 5515 Issue 2 HR GC-MS
Carbon monoxide Gresham tube/Tedlarbag
BS EN 60567:1993 Laboratory GC
Notes: 1 Environment Agency (2004b)2 USEPA = US Environmental Protection Agency; NOISH = National Institute forOccupational Safety and Health (USA)3 Dinitrophenylhydrazine
7.4 Elemental analyses of volatile speciesConcentrations of elements in volatile species may be determined by ICP-MS or ICP-AAS. It is necessary to sample the gas in the field and transport it to the laboratory forsubsequent analysis.
Tedlar bags have been shown to be suitable for sampling volatile metal(loid)compounds species provided analysis can be carried out within a day of sampling(Haas and Feldman 2000). Cryotrapping can be used subsequently to concentratespecies prior to analysis (Feldmann and Cullen 1997, Feldmann et al. 2001); it alsoprovides a means of longer-term storage in the laboratory. Cryotrapping in the field at alandfill site is likely to be more difficult than sampling into a Tedlar bag (Haas andFeldman 2000), though it would offer longer-term sample stability. Cryotrapping hasbeen used to collect samples of ambient air at –175°C (Pécheyran et al. 1998).
In mass spectrometry, the introduction of the sample via a plasma torch (ICP-MS)increases sensitivity but destroys speciation information compared with direct sampleintroduction after GC (or HPLC) separation. However, coupled with such a separationtechnique, it can indirectly yield speciation information from the retention behaviour ofthe unknown on the chromatography column against a known standard. For anelement that has a number of isotopes, the isotopic pattern can be used to confirm itsidentity (Feldmann et al. 1998). Pre-concentration by cryotrapping/cryofocusing ofvolatile species offers useful increases in detection limits (see Section 7.5.3).
The ion population in a plasma depends on its temperature; the higher the temperaturethe greater the ion population, especially for elements with a high first ionisationpotential (McCurdy and Potter 2001). This is illustrated for some elements of interest inTable 7.4.

80 Science Report – Production gas production from landfilling of inorganic wastes
In mass spectrometry, the possibility of interferences from polyatomic ions formed inthe plasma must also be considered; some potential interferences from chlorine andsulphur, both possible common elements in mixed gas samples (e.g. from H2S andorganosulphur species, chlorinated solvents) are shown in Table 7.5.
Other studies on transition metal carbonyls have found it is almost impossible to detect52Cr and 53Cr in landfill gas because of interference from 40Ar12C+ and 40Ar13C+
(Feldmann and Cullen 1997). Iron and manganese detection is hindered by 40Ar14N+
(54Fe+), 40Ar14N1H+ (55Mn+), 40Ar16O+ (56Fe+) and 40Ar16O1H+ (57Fe+). Similarly, nickel andcobalt determination may suffer from interferences from the doubly-charged ionsformed from volatile tin compounds, e.g. 116Sn2+ (58Ni+), 118Sn2+ (59Ni+), 120Sn2+ (60Co+,60Ni+) and 124Sn2+ (62Ni+) (Feldmann and Cullen 1997).
Table 7.4 Calculated ion population (%) as a function of plasma temperature forsome elements of interest1
Plasma temperatureElement Ionisationpotential (eV) 5,000K 6,000K 7,000K 8,000K
Pb 7.42 4.3 51.2 91.1 98.3Sb 8.64 0.3 9.0 57.6 90.9Cd 8.99 0.1 4.8 43.2 85.7Se 9.75 0.0 1.1 17.8 66.6As 9.81 0.0 1.0 16.4 64.6Hg 10.43 0.0 0.3 6.5 42.6
Notes: 1 From McCurdy and Potter (2001)
Table 7.5 Some potential isotopic interferences in ICP-MS1
Element Isotope Potential interferenceTitanium 47 35Cl12CVanadium 51 35Cl16OChromium 52/53 35Cl16O1H / 37Cl16OManganese 55 37Cl18OIron 57 40Ar16O1HCobalt 59 23Na35Cl1HNickel 60 23Na37ClCopper 65 32S32S1H, 32S16O16O1HZinc 66 32S34S, 35Cl16O14N1HArsenic 75 40Ar35ClSelenium 82 34S16O16O16O
Notes: 1 McCurdy and Potter (2001)
Bouyssiere et al. (2001) reported that GC-ICP-MS is a factor of 100–1,000 moresensitive than GC-MIP-AES and GC-MS for arsenic in natural gas condensates. Theycite detection limits of approximately 5 pg for trimethylarsine in natural gas and 0.5 ngfor a range of methylated/alkylated arsines by GC-MS from other studies comparedwith 0.05 pg arsenic by GC-ICP-MS.
A list of absolute detection limits for some elements with volatile compounds using GC-ICP-MS is given in the third column of Table 7.6. Feldmann et al. (1998) successfullyused cryotrapping and GC fractionation to obtain fractions containing species ofinterest in the ng cm-3 concentration range and identified trimethylstibine andtetramethyltin in landfill gas, and trimethylbismuth in sewage gas, directly using MS.
Hetland et al. (1991) trapped Ni(CO)4 and Fe(CO)5 on activated carbon and quotetypical detection limits of 0.0004–0.00008 mg m-3 and 0.15–0.006 mg m-3 respectively,based on sampling volumes of 100 dm3 and detection by AAS/AES.

Science Report – Production gas production from landfilling of inorganic wastes 81
A review of methods for the determination of tin in environmental samples concentratedon analysis of solid and water samples (Leroy et al. 1998). From this review it isapparent that sample work-up by derivatisation to hydride or alkylated species followedby gas chromatography and detection by AAS or flame photometric detection iscommonly employed and that cryogenic pre-concentration may be used to improvesensitivity. Such concentration, separation and detection techniques would beapplicable to the collection and analysis of volatile tin species released from landfill.
Table 7.6 Detection limits for volatile elements using GC-ICP-MS1
Element m/z Absolute LOD2 (pg) LOD for 20 dm3 gas sample3 (pg m-3)Germanium 73 0.03 1.6Arsenic 75 0.54 26Selenium 77 0.42 21Selenium 82 0.66 33Cadmium 113 0.27 14Tin 120 0.29 15Antimony 121 0.15 7.6Tellurium 126 0.13 6.7Iodine 127 0.21 10Mercury 202 0.78 39Lead 208 0.86 43Bismuth 209 0.09 4.7
Notes: 1 Feldmann (1997)2 Calculated based on three times the standard deviation of the blank signal.3 Cryotrapped sample
7.5 Speciation analyses
7.5.1 Mercury speciation
A method for analysing total mercury was identified in Section 7.3. An alternativeapproach (Lindberg et al. 2001) uses a sampling technique that allows the speciation ofmercury compounds – for a summary, see Environment Agency (2002a).
Total gaseous mercury can be collected on gold or iodated active charcoal traps andanalysed by CV-AFS after acid digestion of the traps. Landfill gas is generally saturatedwith water vapour so, to eliminate condensation, the charcoal traps are heated to about50°C (slightly above the landfill gas temperature) and preceded by cold traps. Dimethylmercury compounds can be sampled using Carbotrap™ absorbers and cold trapslocated upstream of separate Carbotraps™ for monomethyl mercury in the landfill gascondensate. Analysis is by thermal desorption (TD) chromatography with atomicfluorescence detection after isolating monomethyl mercury from the matrix bydistillation and conversion of methylethyl mercury by aqueous phase ethylation.
This method has been used subsequently to measure total gaseous mercury, dimethylmercury and monomethyl mercury (Lindberg et al. 2005). Total airborne mercury(organic and inorganic) was trapped using iodated activated charcoal traps in tandem.These traps were then leached with a mixture of hot nitric and sulphuric acids, oxidisedwith BrCl solution and the total recovered mercury measured with CV-AFS. Dimethylmercury was collected on a light-shielded Carbotrap™ and analysed by TD-GC-AFS.The output of the GC was passed through a pyrolytic cracking column at 700°C toconvert organic mercury to elemental mercury prior to entering the CV-AFspectrometer. Dimethyl mercury was identified by retention time. Trapping ofmonomethyl mercury made use of the fact that, in air, it is probably present as a halideor hydroxide, and is stable and soluble in dilute hydrochloric acid. Monomethyl mercury

82 Science Report – Production gas production from landfilling of inorganic wastes
was trapped in a series of three, light-shielded impingers containing 0.001 mol dm-3
hydrochloric acid. Sample work up in the laboratory was by a combination of distillation,ethylation and Carbotrap™ pre-concentration, followed by TD-GC-AFS in a similarmanner to the analyses for dimethyl mercury.
An unknown interference with dimethyl mercury collection and analysis is reported(Lindberg et al. 2005). This can be minimised by reducing the volume of landfill gascollected and using two Carbosorb traps in series to collect dimethyl mercury. Lindberget al. (2005) concluded that the most accurate dimethyl mercury concentrations wouldbe obtained by collecting the smallest sample volume possible.
Using these methods the following approximate ranges were measured:
• total gaseous mercury concentrations (101 to 104 ng m-3);
• dimethyl mercury concentrations (4 to 80 ng m-3);
• monomethyl mercury concentrations (2 to 40 ng m-3).
Lindberg et al. (2005) report a method detection limit of ~5 pg m-3 for dimethyl mercury,although this depends on sample volume and may be compromised by the interferencewith trapping discussed above.
The ESART study used an in-series sample train consisting of a moisture trap(aqueous mercury), iso-octane (gaseous organic mercury), Orbo™ activated carbon(gaseous non-elemental mercury) and gold Amasil (gaseous elemental mercury).Analysis was by AFS after appropriate sample treatments (ESART 2003).
7.5.2 Trapping and analysis of phosphine, arsine and stibine
The use of filters impregnated with silver nitrate to collect phosphine (arsine and stibinemay also be collected simultaneously) is discussed by Demange et al. (2000) in workbased on the method proposed by Hetland et al. (1991).
Sample work-up is by dissolution of the filters in acid with analysis for phosphorus byICP-AES and a detection limit of better than 1 µg of phosphorus per filter wasachieved. Interferences from species that react with silver nitrate are possible.However, a sampling methodology was developed to prevent reaction with H2S andNH3 by using impregnated pre-filters to remove these species (which may also allowtheir determination). Such pre-filters may also prevent interferences from acids (e.g.HCl) and particulates. Hetland et al. (1991) quotes typical detection limits of 0.003 mgm-3 (by ICP-AES) and 0.001 mg m-3 by electrothermal AAS (ETAAS) for phosphine and0.001 mg m-3 (ICP-AES) and 0.0001 mg m-3 (ETAAS) for arsine and stibine, based ona sampled volume of 1 m3 over 8 hours.
In sampling of landfill gas for phosphine (Roels and Verstraete 2004), phosphine wasanalysed by GC (with thermal conductivity and thermionic-specific detection) insamples of landfill gas collected in 1 dm3 glass bottles. The concentrations ofphosphine (~ 3–32 µg m-3) were sufficiently high that the LOD was exceeded when a500 µdm3 sample loop was used. Therefore, cryogenic trapping was not necessary inthis study. However, the method was developed to measure lower phosphineconcentrations and a detection limit of 4 ng m-3 from cryotrapping 100 cm3 of gas isreported (Roels et al. 2002).
7.5.3 Speciation of carbonyls and alkylated elements
The use of ICP-MS to obtain information on elements present in volatile compounds isdiscussed in Section 7.4. It may be coupled with a separation technique to provide

Science Report – Production gas production from landfilling of inorganic wastes 83
speciation information (e.g. using the retention time obtained from gaschromatography). Feldmann and Cullen (1997) describe the use of cryogenic trappingfollowed by cryofocusing to analyse molybdenum and tungsten carbonyls in landfillgas. After collection of gas samples in Tedlar bags (4 dm3 for landfill gas, 80 dm3 forambient air above the landfill), the volatile species were trapped on Chromosorb™ at –78°C (at this temperature condensation of carbon dioxide and methane was avoided).The volatile species were then volatilised from the trap by raising its temperature to150°C and re-trapped in a second Chromosorb™ trap held at -196°C. The volatilespecies were then desorbed from the second trap into helium carrier gas by raising thecolumn temperature from –196 to 150°C over a period of 3 minutes. This providedchromatographic separation of the volatile species prior to passage through the torch ofthe ICP-MS and allowed their potential identification on the basis of retention time orcomparison with known standards.
In addition to the measurement of the molybdenum and tungsten hexacarbonyls atconcentrations of a few ng m-3 to a few hundred ng m-3, it is reported that arsines,trimethylstibine, and tetramethyltin and higher alkylated tin species were found atconcentrations of µg m-3. Dimethylselenide, dimethyltellurium, dimethylmercury,elemental mercury, trimethylbismuthine, tetramethyllead and tetraethyllead were foundat concentrations of ng m-3. Feldmann and Cullen (1997) do not discuss factorscontrolling detection limits for the technique explicitly but detectable concentrations of0.1 ng m-3 in ambient air are suggested in the text, implying a collected mass of 8 pgfrom 80 dm3. The last column of Table 7.6 gives GC-ICP-MS detection limits for someelements in 20 dm-3 of gas after cryotrapping. These range from 1.6 pg m-3 forgermanium to 43 pg m-3 for lead.
A subsequent study by Feldmann (1999) used the same technique to measure nickeltetracarbonyl, iron pentacarbonyl, molybdenum hexacarbonyl and tungstenhexacarbonyl in sewage gas. A detection limit of 0.01 µg m-3 for nickel is estimated if 1dm3 of gas is sampled (equivalent to 10 pg nickel); this can be increased to 0.001 µgm-3 if 10 dm-3 is sampled. This compares with cited detection limits of around 70 µg m-3
for direct mass spectrometry (Campana and Risby 1980) and IR spectrophotometry(McDowell 1971), techniques capable of direct speciation (Feldmann 1999). Thedetection limit is similar to a cited possible detection limit of 0.09 ng nickel for on-linepre-concentration of nickel carbonyl (Erber and Cammann 1995) followed by graphitefurnace-AAS (Filkova and Jäger 1986), although AAS avoids potential ion interferenceproblems that may occur in ICP-MS (Feldmann 1999).
Analysis of stibine, monomethylstibine, dimethylstibine and trimethylstibine in microbiallaboratory experiments by solid phase microextraction followed by GC-MS withcryogenic focusing has been described (Smith et al. 2002). Trimethylstibine has alsobeen determined in microbial laboratory experiments by:
• GC-MS and GC-AAS (Jenkins et al. 1998);
• capillary GC with fluorine-induced chemiluminescence and GC-MS(Gürleyük et al. 1997);
• cryotrapping coupled with GC-ICP-MS (Andrewes et al. 1999).
Trimethylarsine was also found in the latter study.
7.5.4 Reduced sulphur species
Gas chromatography has been used to determine reduced sulphur species in landfillgas (Kim et al. 2005). Sample detection limits (as sulphur) using pulsed flamephotometric detection are reported as 17 pg (hydrogen sulphide), 7 pg (methylmercaptan), 4 pg (dimethylsulphide), 3 pg (carbon disulphide) and 5 pg (dimethyl

84 Science Report – Production gas production from landfilling of inorganic wastes
disulphide). With a direct injection and a sample loop volume of 500 µdm3, this givesdetection limits for sulphur of 6 (CS2) to 34 (H2S) µg m-3 in the gas as collected. Lowerdetection limits may be achieved by cryofocusing prior to gas chromatography.
7.5.5 Hydrogen cyanide
Reported methods for the detection of hydrogen cyanide in air generally involvepumping air samples through a solid or liquid able to trap and/or react with HCN (Juilletet al. 2005). Reaction products may then be analysed by a range of techniquesincluding ion chromatography, spectrophotometry and potentiometry.
Some of these methods may be complex, not specific for cyanide and suffer frominterferences. Juillet et al. (2005) describe an examination of five different adsorbents(Tenax GR, Carbotrap B, Carboxen 563, Carboxen 569 and Cardosieve S-III) fortrapping of hydrogen cyanide prior to analysis by ATD-GC-MS. Their study included theeffect of sample humidity on trapping. They concluded that the molecular sieves(Carboxen 563, Carboxen 569 and Cardosieve S-III) displayed sufficiently robusttrapping qualities to be of use; Carbosieve S-III was the most suitable of the three.Achievable hydrogen cyanide detection limits down to sub-ppm levels are suggestedusing 200 mg of this sorbent.
7.5.6 Siloxanes
A number of methods are available for analysing siloxanes in gas samples and nostandard method has been adopted (Environment Agency 2004c).
The use of GC coupled with MS and AES to obtain speciation information on siliconspecies in landfill and sewage gas has been described (Schweigkofler and Niessner1999). This work also included the analysis of a range of VOCs. Samples werecollected in evacuated 15 dm3 stainless steel containers with electropolished internalsurfaces. They were usually analysed within 36 hours of collection. Recovery of lowermolecular weight siloxanes (and VOCs) was greater than 90 per cent from a standardgas mixture in nitrogen after 2 hours storage.
However, due to sorption losses within the sample container, recovery of low volatilitysiloxanes (e.g. decamethylcyclopentasiloxane, b.p. 210°C, 85-90 per cent recovery;dodecamethylpentasiloxane, b.p. 223°C, 35 per cent recovery) were less than 90 percent and the sample collection method could not be used for quantitative determinationof less volatile siloxanes. Loss to the vessel walls increased with increasing boilingpoint and polarity of the compound. Sample stability was checked by storing a sampleof biogas and a sample of standard gas mixture for 10 days prior to analysis. Sampleswere concentrated by cryotrapping/cryofocusing, then split and injected in parallel totwo GC systems with MS or AE detection capabilities. Column lengths were adjusted totake account of the pressure differences between the two detection techniques andallowed simultaneous detection of the analysed species. Seven silicon species weredetected in samples of landfill gas from two German domestic waste disposal sites:trimethylsilanol, hexamethyldisiloxane, octamethylcyclotetrasiloxane,decamethylcyclopentasiloxane (concentrations typically in 1 to 10 mg m-3 range),hexamethylcyclotrisiloxane, octamethyltrisiloxane and decamethyltetrasiloxane(concentrations typically <0.01 to 0.5 mg m-3) (Schweigkofler and Niessner 1999).

Science Report – Production gas production from landfilling of inorganic wastes 85
7.6 ConclusionsThe following can be concluded from this review of possible methods for monitoringand identifying volatile species in gas from inorganic landfills.
• There are recommended methods for measurement of hydrogen sulphide,total inorganic arsenic, total mercury and carbon monoxide (EnvironmentAgency 2004b).
• Portable monitors offer some possibilities for monitoring species such ashydrogen at levels of interest. However, they may not be sensitive enoughto measure the concentration of some other trace species. Laboratory-based methods (e.g. gas chromatography currently used to monitor simplehydrocarbons) can be applied to analysis of species such as hydrogen,carbon dioxide, methane and acetylene, which may be present in gas frominorganic wastes. Methods of collecting samples in Gresham tubes, forinstance, are similar to those already employed in gas monitoring boreholeson existing MSW sites.
• Cryogenic trapping and focusing, coupled with GC and ICP-MS or ICP-AAS, appear promising techniques capable of analysing for a range oforganic and inorganic trace species (both ICP-MS and ICP-AAS may berequired to resolve uncertainties caused by interferences). GC-MS wouldalso be useful although it is less sensitive. Other mass spectrometrytechniques may also be applied and offer benefits in some circumstances(e.g. HR-ICP-MS offers high sensitivity and resolution, TOF-ICP-MS offersrapid multi-element analysis) but at increased cost.
• Sensitive mercury analysis may be achieved using atomic fluorescencecoupled with appropriate sampling, pre-concentration and sample work-up.
• Monitoring of hydrides by trapping on silver nitrate impregnated filtersfollowed by sample work-up and analysis by ICP-AES or ETAAS would beapplicable to phosphine, arsine and stibine. This is likely to be of use foranalysis of other hydrides, though the potential interference from acetylenemay be a problem.
• Reduced sulphur species may be analysed by GC. Hydrogen cyanide hasbeen measured by ATD-GC-MS. Siloxanes have been determined by GCcoupled with MS and AES, although losses of low volatility species insamples stored in stainless steel containers have been reported.
• Analytical methods of sufficient sensitivity exist for all the species likely tobe of interest in gas emissions from future landfills containing waste thathave higher concentrations of inorganic materials than existing landfills.However, many of the analyses are likely to be laboratory-based ratherthan ‘in-field’ measurements and will require a number of different methodsto be employed to cover the range of compounds likely to be present.

86 Science Report – Production gas production from landfilling of inorganic wastes
8 Assigning priorities tocompounds for monitoring
A range of compounds has been identified in Sections 4 and 5 as possibly beingpresent in gas from future landfills containing a high proportion of inorganic material.Monitoring methods for these compounds are discussed in Section 7.
The need to monitor for a particular compound will depend upon the hazard caused byits presence. For an individual compound, its relative hazard in a gas mixture willdepend upon its concentration and properties such as toxicity, flammability and odour.However, few data are available for the concentrations of the typical species that maybe present in the gas produced. Thus, in order to suggest priority compounds to bemonitored in any initial sampling of gas from inorganic landfills, only simple qualitativescreening can be used at this stage.
Table 8.1 compares the concentrations of trace species in landfill gas (or othersamples), as given in Table 5.7 with the Long-Term Workplace Exposure Limits(LTWELs) (HSE 2005) or other typical exposure limits. Where data are available, theconcentrations of many of the species in gas from existing landfills or in sewage gasare several orders of magnitude below the exposure limits. In these cases, however,dilution by bulk gas may be significant and some species (e.g. alkylated tincompounds, volatile arsenic) have been found at concentrations comparable withexposure limits.
A simple qualitative screening of the possible trace components in gas from landfillscontaining a high proportion of inorganic wastes has been made in order to suggestpriority compounds for initial monitoring. It is assumed that the bulk gas componentsmonitored routinely for existing landfills (methane, carbon dioxide and oxygen)(Environment Agency 2004a) would continue to be monitored. These gases provide anindication of the chemical and microbial conditions within a landfill and thus give somebasis on which trace component data for different sites may be compared. It issuggested that hydrogen should also be monitored routinely as a possible contributorto bulk gas production.
Compounds were screened qualitatively against:
• the possibility of being toxic, flammable, malodorous or explosive in air;
• their detection in existing landfill gas;
• their concentration in gas from existing landfills being ≤1 per cent of theLong-Term Workplace Exposure Limit (or no LTWEL set). (Table 8.1compares the concentrations of trace species in landfill gas – or othersamples – as given in Table 5.7, with the LTWELs or other typical exposurelimits);
• their formation in the absence of microbial action.
The screening against toxicity, flammability, explosive hazard and odour does not takeaccount of the concentrations that may be required to pose a hazard. This preliminaryscreening, based on current understanding and very limited sample data, gives thefollowing groups in terms of priority:
• Highest priority: amines, AsH3, COS, CS2, HCN, H2S, H2Se, NH3,Ni(CO)4, Pb(CH3)4, Pb(C2H5)4, PH3 and SbH3

Science Report – Production gas production from landfilling of inorganic wastes 87
• Medium priority: CO, CH3SH, (CH3)4Sn and other alkylated Sncompounds, (CH3)3As, (CH3)2S2, (CH3)2S, alkylated Pb (other thantetraethyl and tetramethyl), monomethylmercury, (CH3)2Te, (CH3)3Sb,COCl2, NOX, hydrogen halides (HF and HCl), alkylated Ge.
• Lowest priority: (CH3)2Se2, Hg0, Hg(CH3)2, simple hydrocarbons (e.g.acetylene but excluding methane), alkylated arsenic (other than (CH3)3As),CH3I, alkylated silicon, CSe2, metal carbonyls (e.g. Mo(CO)6, W(CO)6 butexcluding Ni(CO)4), alkylated antimony (other than (CH3)3Sb), (CH3)3Bi,(CH3)2Se, siloxanes.
When applying these groupings, it will also be necessary to consider the nature of thedisposed waste in deciding on the trace compounds that are of highest priority formonitoring (remembering that hydrogen is assumed to be monitored as a possible bulkgas). This is especially the case for monofills or for landfills where only a few wastetypes are present. For example, although acetylene is classified above as being of alow priority, it would be a high priority for those landfills receiving significant amounts ofwaste from metal refining processes because of the potential presence of carbides insuch wastes.
Some of the species identified as being of highest priority (e.g. hydrogen sulphide,hydrogen cyanide and ammonia) may be detected at ppm levels using portablemonitors (e.g. those currently available from Crowcon).
Only one of the compounds identified as being of high priority (hydrogen sulphide) hasa recommended method developed for existing landfill gas monitoring, although arsinewould have been collected by the methodology for determining total inorganic arsenic(Environment Agency 2003b, 2004b).
Possible methods for the trace monitoring of the remaining compounds or identifyingthose elements present in a volatile form can be identified from the review in Section 7.
• Arsine, phosphine and stibine may be trapped using filters impregnatedwith silver nitrate and analysed by ICP-AES (Demange et al. 2000) (seeSection 7.5.2).
• Hydrogen cyanide can be trapped on molecular sieves and analysed byATD-GC-MS (Juillet et al. 2005) (see Section 7.5.5).
• Cryotrapping allows species to be concentrated and, coupled withappropriate instrumentation, has provided a means of determining (seeSections 7.5.2, 7.5.3 and 7.5.4):
- phosphine (and potentially arsine and stibine) by GC;
- tetramethyllead, tetraethyllead and nickel carbonyl by ICP-MS;
- carbon disulphide, hydrogen sulphide (and potentially carbonyl sulphideand hydrogen selenide) by GC.

88 Science Report – Production gas production from landfilling of inorganic wastes
Table 8.1 Some typical exposure limits for gaseous trace species likely to be generated in inorganic landfills1.6
Species
Toxic?
Typical concentration2
in gas from existinglandfills (or other
experiments3) (g m-3)
Long-termWEL4 (g m-3) Other information on exposure limits5
Group VIa
Mo(CO)6 Y 1 × 10⁻⁸ to 3 × 10⁻⁷ – Long-term WEL = 5 × 10⁻³ g m-3 (soluble Mocompounds) (HSE 2005)
W(CO)6 Y 5 × 10⁻⁹ to 2 × 10⁻⁷ – Long-term WEL = 1 × 10⁻³ g m-3 (soluble Wcompounds) (HSE 2005)
Group VIII
Ni(CO)4 Y (5 × 10⁻⁷ to 1 × 10⁻⁶)*** – Short-term (15 minute) WEL = 2.4 × 10⁻⁴ g m-3
(HSE 2005)
Group IIb
Hg0 Y 9 × 10⁻⁷
1 × 10⁻⁸ to 1 × 10⁻⁵– Typical TLV/TWA = 5 × 10⁻⁵ g m-3, typical PEL = 1
× 10-4 g m-3
Hg(CH3)2 Y 1 × 10⁻⁷
5 × 10⁻⁹ to 8 × 10⁻⁸– No data
(CH3)HgX Y 2 × 10⁻⁹ to 4 × 10⁻⁸ – No data

Science Report – Production gas production from landfilling of inorganic wastes 89
Table 8.1 (cont’d) Some typical exposure limits for gaseous trace species likely to be generated in inorganic landfills1.6
Species
Toxic?
Typical concentration2
in gas from existinglandfills (or other
experiments3) (g m-3)
Long-termWEL4 (g m-3) Other information on exposure limits5
Group IVb
Simple hydrocarbonsexcl methane(acetylene used asexample)
N
–
No known toxic effects for acetylene
CO Y 6 × 10⁻³ (median) 3.5 × 10⁻² –
CO2 9.15
COCl2 Y – 8 × 10⁻⁵ –
HCN Y – – Short-term WEL = 1.1 × 10⁻² mg m–3 (HSE 2005)
Silane, SiH4 6.7 × 10⁻⁴ –
Germane, GeH4 6.4 × 10⁻⁴ –
(CH3)4Sn Y 1 × 10⁻⁴ – Long-term WEL = 1 × 10⁻⁴ mg m–3 (organic Sn, as Sn)(HSE 2005)
Other alkylated tincompounds(unknown)
Y? 3 × 10⁻⁵– Long-term WEL = 1 × 10⁻⁴ mg m–3 (organic Sn, as Sn)
(HSE 2005)
Pb(CH3)4 Y ‘ng per m3 range’ – “Very toxic”
Pb(CH3)(C2H5)3 Y 4 × 10⁻⁸ – –
Pb(C2H5)4 Y 1 × 10⁻⁶
‘ng per m3 range’– –

90 Science Report – Production gas production from landfilling of inorganic wastes
Table 8.1 (cont’d) Some typical exposure limits for gaseous trace species likely to be generated in inorganic landfills1.6
Species
Toxic?
Typical concentration2
in gas from existinglandfills (or other
experiments3) (g m-3)
Long-termWEL4 (g m-3) Other information on exposure limits5
Group Vb
NOx (for NO2) Y – – For NO2 typical PEL = 5 ppm, Long-term OEL = 3 ppm, 6× 10⁻³ g m-3
NH3 Y – 1.8 × 10⁻²
Amines (for exampleof trimethylamine Y – – Triethylamine long-term WEL = 8 mg m-3, Dimethylamine
long-term WEL = 3.8 mg m-3 (HSE 2005)
PH3 Y 3 × 10⁻⁶ to 3 × 10⁻⁷ – Short-term WEL = 4.2 × 10⁻⁴ g m-3 (HSE 2005)
AsH3 Y 7 × 10⁻⁸ 1.6 × 10⁻⁴ -
CH3AsH2 Y? 4 × 10⁻⁶ – No data
(CH3)2AsH Y? 1 × 10⁻⁸ – No data
(CH3)3As Y 4 × 10⁻⁶ – No data
(CH3)2As(C2H5) Y 4 × 10⁻⁸ – No data
As(C2H5)3 Y – – No data
Total volatile arsenic(unspeciated) Y? 6 × 10⁻⁷ to 4 × 10⁻⁴ – Long-term WEL for arsenic and its compounds except
arsine = 1 × 10⁻⁴ g m-3) (HSE 2005)
(CH3)3Sb Y? 1 × 10⁻⁴ (2 × 10⁻⁴)** – No data
SbH3 Y (2 × 10⁻⁴)** – No data
(CH3)2SbH Y? (2 × 10⁻⁵)** – No data
(CH3)SbH2 Y? (2 × 10⁻⁵)** – Long-term WEL for Sb and its compounds except SbH3 =5 × 10⁻⁴ g m-3(HSE 2005)
(CH3)3Bi 1 × 10⁻⁶
(4 × 10⁻⁵ to 1 × 10⁻⁴)**– No data

Science Report – Production gas production from landfilling of inorganic wastes 91
Table 8.1 (cont’d) Some typical exposure limits for gaseous trace species likely to be generated in inorganic landfills1,6
Species
Toxic?
Typical concentration2
in gas from existinglandfills (or other
experiments3) (g m-3)
Long-termWEL4 (g m-3) Other information on exposure limits5
Group VIb
H2S Y 3 × 10⁻² to 6 × 10–1 * 7 × 10–3
CS2 Y 1 × 10⁻³ to 2 × 10–1 * 3.2 × 10–2
COS Y – – ‘Harmful at levels from 100 ppm upwards’
(CH3)2S2 Y <3 × 10⁻⁵ to 1 × 10⁻² * – No data
CH3SH 33 to 22,550 ppb 1 × 10⁻³ (Long-term WEL ≡ 0.5 ppm (HSE 2005))
(CH3)2S Y 33 to 7,120 ppb – No data
(CH3)2Se Y (6 × 10⁻⁵)** – No data
H2Se Y – 0.02 ppm as Se
(CH3)2Se2 Y? 2 × 10⁻⁸
(3 × 10⁻⁴)**– ‘May be fatal if inhaled’
CSe2 Y – – No data
(CH3)2Te Y 1 × 10⁻⁷
(3 × 10⁻⁶)**– No data
Group VIIb
Hydrogen halides Y (HFHCl) –
HF(as F) = 1.5 ×10⁻³
HCl = 2 × 10⁻³
HBr = –
Short-term WEL HF = 2.5 × 10⁻³ g m-3 (HSE 2005)
Short-term WEL HCl = 8 × 10⁻³ g m-3 (HSE 2005)
Short-term WEL HBr = 1 × 10⁻² g m-3 (HSE 2005)
CH3I Y – 1.2 × 10⁻² -

92 Science Report – Production gas production from landfilling of inorganic wastes
Notes: 1 N =No, Y=Yes based on data from various sources, Y? or N? = Yes or No based on judgement by analogy with similar compounds, - = not possible to make ajudgement (or, for mixed species, not applicable).2 Concentrations as the elements unless otherwise noted by * (* =concentration of molecular species)3 (Other experiments) denoted in ( ) are for gas samples taken from above incubated sewage sludge or M. formicicum cultures in laboratory experiments** , or gassampled from sewage treatment plants***4 HSE (2005)5 Unless referenced otherwise, taken from data on the websites of the School of Chemistry, Bristol University (http://www.chm.bris.ac.uk/safety/Explimits.htm) andthe Physical and Theoretical Chemistry Laboratory, Oxford University (http://physchem.ox.ac.uk/MSDS).6 WEL = Workplace Exposure Limit (long-term = 8-hour time weighted average (TWA) reference period, short-term = 15-minute reference period) (HSE 2005); PEL =Permissible Exposure Limit defined by (TWA) or absolute value; LTEL = Long-term Exposure Limit; OEL = Occupational Exposure Limit; TLV = Threshold LimitValue.

Science Report – Production gas production from landfilling of inorganic wastes 93
Table 9.1 Summary of available gas treatment methods and possible application to components of landfill gas
Combustion Wet scrubbers Absorbers
Com
bustiononly (flaring)
Thermal
(post-com
bustion)
Catalytic(post-
combustion)
Acid scrubber
Alkali scrubber
Oxidising
scrubber
Solventscrubber
Water scrubber
Activatedcarbon
Zeolites
Hydrogen Y Y Y N N Y N N N NHydrogen sulphide Y Y N Y2 Y Y Y Y Y YCarbon dioxide N N N N N Y Y Y Y YCarbon monoxide Y Y Y N N Y N N Y YMethane Y Y Y N N Y N N Y YNOX compounds N N Y Y3 Y Y Y Y Y YHydrogen cyanide N Y1 Y N Y Y N N Y YHydrogen halides N Y1 N N Y Y N N Y YMetal carbonyls N Y1 Y N N Y N N Y YAmmonia N Y1 N Y N N N Y Y YAmines N Y1 N Y N N N Y Y YCarbon disulphide Y Y1 N Y2 Y Y N Y Y YPhosphine N Y1 Y N N N N N N NArsine N Y1 Y N N N N N N NStibine N Y1 Y N N N N N N N
Notes: 1 Dependent on temperature and residence time.2 With sulphuric acid scrubber.3 With nitric acid scrubber.

94 Science Report – Production gas production from landfilling of inorganic wastes
9 Potential gas treatmentmethods
In Section 2.2.2 it was noted that measures should be taken in order to control theaccumulation and migration of landfill gas in all forms of landfill site. This sectionconsiders the potential methods for treating a gas stream with the followingcharacteristics that may be typical of that produced from a predominantly inorganiclandfill:
• main constituent: hydrogen:
• also containing: hydrogen sulphide, carbon dioxide, carbon monoxide,methane and NOx compounds;
• trace gases include: hydrogen cyanide, hydrogen halides, metal carbonyls,ammonia, amines, carbon disulphide, phosphine, arsine and stibine.
Table 9.1 summarises the various treatment methods available, these are consideredin more detail below.
9.1 Combustion (flaring)Flaring is used as a safety measure in the petroleum and chemical industries to quicklyremove large quantities of flammable gases that may be generated or escape in anincident. It is also used to remove biogas generated by anaerobic water treatmentprocesses. In this process, the flammable gases are directed to a torch with anappropriately designed burner incorporating a pilot flame and steam or air injection forgood turbulence and mixing. A support fuel may also be necessary.
Gas from existing landfills may be treated by flaring if the volume or calorific content isnot sufficient for energy utilisation. Systems are available from manufacturers such asHofstetter (http://www.hofstetter.ch) and Marton Geotechnical Services Ltd(http://www.mgs.co.uk). However, these may not be capable of treating low volumes ofgas from inorganic landfills.
Such methods have the advantages of:
• being a relatively cheap way to treat large quantities of solvent-loadedgases;
• can easily handle relatively large fluctuations in volume of gas produced.
But they have the disadvantages of:
• producing of NOX, SOX and other combustion products;
• not breaking down halogenated compounds;
• potentially creating light, noise, heat and odour nuisances;
• some incomplete combustion resulting from cooling at the flame edge.
The enclosed flares currently used to combust surplus landfill gas overcome some ofthese disadvantages by constraining the flame within the shroud. However, thesedevices are designed to use gas with a sustained, high-volumetric flow and relativelyhigh calorific value. Some manufacturers have proposed flares with higher retentiontimes (taller combustion zones), pre-heaters, pre-mixers and supplementary fuels.

Science Report – Production gas production from landfilling of inorganic wastes 95
However, the lower flash point of hydrogen compared with current landfill gas maypresent design problems for their application to future landfills.
9.2 Thermal post-combustion treatmentFollowing combustion, the gases are subjected to high temperatures (typically 750–1,200°C) in the presence of oxygen to encourage oxidisation. Most compounds can bebroken down by this method; the efficiency of the process is dependent on thetemperature, residence time, mixing and availability of oxygen.
Advantages include the high destruction efficiencies possible, but such methods havethe following disadvantages:
• significant fuel costs may be required to maintain temperatures;
• halogenated and sulphur-containing gases will break down to aggressiveacid gases;
• current technology is geared towards treatment of hydrocarbon gasstreams.
Systems based on this technology for treating low calorific value landfill gas areavailable. These pass the residual gas and excess air through a hot ceramic matrix tooxidise the organic compounds. The VocsiBox® supplied by HAASE(http://www.haase-energietechnik.de/en), for example, can treat gas with 1 per centresidual methane using a packed bed of hot ceramic spheres at about 1,000°C. Theunit is designed to operate autothermally but, if auxiliary firing is necessary, a gas suchas propane may be used. In the post-combustion CL.AIR®-system used on Jenbachergas engines, the exhaust gas flows over hot ceramic at approximately 800°C to oxidiseuncombusted components of the exhaust gas (http://www.gepower.com). In bothVocsiBox® and CL.AIR®, self-sustaining thermal oxidation is achieved by regularlyreversing the flow to retain the exothermic reaction zone within the device. Computercontrol increases the complexity of the system.
Plasma arc devices have been used for complete oxidation of hazardous wastes andgases; see, for example, PLASCON™ produced by SRL Plasmal Ltd(http://www.srlplasma.com.au). However, these are expensive and their use may notbe justified.
9.3 Catalytic post-combustion treatmentCatalytic post-combustion works in a similar way to thermal post-combustion but,following combustion, the off-gases are passed over a catalyst allowing oxidation totake place at a much lower temperature (approximately 300–500°C).
The choice of catalyst depends on the nature of the off-gases produced. For example,chromium/alumina or copper oxide/manganese oxide catalysts are selected forchlorinated compounds. For sulphur compounds, a platinum-based catalyst is usuallyselected, but these are quickly deactivated by the presence of chlorine. Other catalystinhibitors include sulphur and zinc. Possible catalyst poisons include phosphorus,bismuth, arsenic, antimony, lead, mercury, iron, tin and silicon.
For catalytic post-combustion treatment to be effective for the treatment of landfill gas,the composition of the gas would have to be well-characterised to allow correctselection of catalyst and avoid deactivation by other compounds. Current experiencewith catalytic converters on landfill gas engines indicates that the trace componentsrapidly deactivate the commonly used catalysts.

96 Science Report – Production gas production from landfilling of inorganic wastes
The advantages of catalytic post-combustion compared with thermal post-combustioninclude:
• less fuel is required to support oxidation so running costs are likely to belower;
• the equipment is more compact;
• reduced NOX production.
However, it has the following disadvantages:
• risk of deactivation of catalyst through inhibitors or poisons;
• the current technology is geared towards disposal of VOC-loaded gasstreams (e.g. from production of organic chemicals or polymers).
9.4 Wet scrubber: acidWet acid scrubbers are used in a variety of industries (e.g. pharmaceuticalmanufacturing, inorganic chemical manufacturing) and in foundries to treat off-gases asa stand-alone process, as a post-combustion treatment or in conjunction with anotherscrubbing method (e.g. an alkali scrubber).
Acid scrubbers work by bringing the gases into intimate contact with an aqueous acidicsolution (e.g. through a packed bed column). Sulphuric acid solution is commonly usedfor economic reasons. Basic (alkali) gases react with the acid to form salts and somewater-soluble gases are also dissolved into the solution.
This process is effective at removing ammonia (usually in a nitric acid scrubber),amines and esters. Sulphuric acid scrubbers can also absorb SOX and nitric acidscrubbers can absorb NOX.
The advantages of wet acid scrubbing include:
• used acid can be recovered, cleaned and reused,
• relatively compact system;
• can be built as modular multi-stage systems.
The disadvantages of wet acid scrubbing include:
• pH-specific contaminant removal;
• safety issues concerning the use of strong acid;
• a reactivity issue if landfill gas contains compounds such asphosphine/stibine/arsine;
• disposal of salts.
9.5 Wet scrubber: alkaliAlkali scrubbers operate in a similar manner to acidic wet scrubbers and are usedacross a variety of industries such as chlorine production and waste incineration. Acidicgases react with the alkali solution (e.g. a solution of sodium hydroxide) to form saltsand some water-soluble gases can dissolve in the solution.

Science Report – Production gas production from landfilling of inorganic wastes 97
The main problem with an alkali scrubber is that insoluble carbonates are liable to form,which accumulate in the scrubber system causing blockages.
The advantages of wet alkali scrubbing include:
• relatively compact system;
• can be built as modular multi-stage systems.
The advantages of wet alkali scrubbing include:
• formation of insoluble carbonates;
• pH-specific contaminant removal;
• safety issues concerning the use of strong alkali;
• a reactivity issue if landfill gas contains compounds such asphosphine/stibine/arsine;
• disposal of salts.
9.6 Wet scrubber: alkali/oxidisingSimilar again to the acidic and alkali wet scrubbers, alkali/oxidising scrubbers are usedin the cosmetics industry, the food industry, in fertiliser production and in the textileindustry for removal of fragrances and odours.
Organic odour compounds are oxidised in an alkaline environment using strongoxidants such as sodium hypochlorite or potassium permanganate. If hypochlorite isused as the scrubber liquor, chlorides are formed as a by-product, making thisinappropriate for use with amine-containing gas streams. Manganese dioxide is formedas a waste by-product from the use of potassium permanganate scrubber liquors.Hydrogen peroxide does not form problematic by-products and is a possible alternativescrubber liquor, but it is a weaker oxidising agent than permanganate.
High removal efficiencies are possible with an alkali/oxidising scrubber; removalefficiencies are dependent on the oxidising strength of the scrubber liquor and theresidence time in the scrubber – the longer the residence time required, the larger (andhence more expensive) scrubber installation is required.
The advantages of wet alkali/oxidising scrubbing include:
• removal efficiencies of up to 95 per cent are possible.
The disadvantages of wet alkali/oxidising scrubbing include:
• safety aspects concerning the use of a strong oxidising agent;
• specialist design of the installation is required.
9.7 Wet scrubber: solventProprietary organic solvents are available to treat raw landfill gas (methane-based)prior to its use in landfill engines (Environment Agency 2004c). These systems havebeen developed to reduce the concentration of carbon dioxide, hydrogen sulphide andsome other contaminants in methane-based landfill gas to improve its use as a fuel inlandfill gas engines. While these particular systems will not be appropriate for use with

98 Science Report – Production gas production from landfilling of inorganic wastes
a hydrogen-based landfill gas stream, the technology could be adapted to reduce someof the contaminants prior to flaring, for example.
The advantages of solvent scrubbing include:
• high affinity for acid gases (particularly carbon dioxide).
The advantages of solvent scrubbing include:
• current technology is unlikely to be appropriate for treatment of projectedfuture landfill gas streams.
9.8 Wet scrubber: waterThe basis of these processes is high pressure scrubbing of the gas streams withpressurised water (Environment Agency 2004c).
The advantages of wet scrubbing with water include:
• removes a significant proportion of acid gas contaminants (including carbondioxide);
• contaminants can be released from wash water allowing recirculation andreuse.
The disadvantages of wet scrubbing with water include:
• high power consumption associated with pumping and handling ofcirculating flows.
9.9 Adsorption: activated carbonActivated carbon is a microporous, inert carbon matrix, with a very large internalsurface which is ideal for adsorption. Specialist treatment of the carbon to producecertain pore structures allow specific adsorptive capabilities to be obtained.
This flexibility in adsorptive capability means activated carbon can be used for gaspurification across a very diverse range of industries from cleansing of process gasesincluding hydrogen and natural gas, to recovery of perchloroethylene vapours in drycleaning, and removal of dioxins and heavy metals from waste incinerator off-gases.
The gas flow is directed through the finely-divided activated carbon and thecontaminants are adsorbed and bound to the activated carbon until it reachessaturation. The carbon can then be regenerated (usually by the supplier) and reused.
Further treatment capabilities for gases that are difficult to capture in a normal activatedcarbon bed are possible through the use of impregnated activated carbon. Here thepollutants are held in the carbon long enough to allow them to react with the chemicalimpregnation.
A variation on activated carbon adsorption treatment is the use of ‘Sorbalite’ (activatedcarbon and lime). This mixture is used for cleaning the off-gases from combustionovens, allowing the removal of dioxins and SOX compounds by one filter.
The advantages of activated carbon adsorption include:
• simple and robust technology;
• easy to put in place;
• easy to maintain;

Science Report – Production gas production from landfilling of inorganic wastes 99
• carbon can be regenerated and reused.
The advantages of activated carbon adsorption include:
• blockage of carbon can occur due to unexpected contaminants;
• not suitable for use with wet gas streams;
• risk of spontaneous combustion (e.g. reaction of ketones with activatedcarbon).
9.10 Adsorption: specialist zeolite (molecular sieves)Zeolite is an aluminium silicate that occurs naturally and is also produced syntheticallyto meet certain specifications. The method of use is similar to that of activated carbon,with contaminants adsorbing into the pores in the three-dimensional structure.However, unlike activated carbon, zeolites are not usually regenerated and reused dueto cost.
Zeolites are good adsorbers of polar substances (e.g. water and water-solublesubstances), but can be synthesised to adsorb non-polar substances such as organicsolvents.
The advantages of zeolite adsorption include:
• simple and robust technology;
• easy to put in place;
• easy to maintain.
The advantages of zeolite adsorption include:
• blockage of the zeolite can occur due to unexpected contaminants
• risk of fire in the bed (e.g. reaction with ketones)
9.11 Operational IssuesTreatment of gases from landfills containing predominantly inorganic residues willinvolve much lower volumes of gas than currently produced at MSW landfills. The flowwill be less predictable and the calorific value may be inadequate to sustain the currentdesign of landfill gas flare.
However, the gas may have a lower flash point and high diffusivity due to the higherconcentration of hydrogen in the gas that is produced. This may require careful designof any gas control and collection system.
The advantage of a thermal treatment is that the main gases – hydrogen and methane– are converted to benign compounds. However, the combustion products will containinorganic residues, which may be harmful if not adequately dispersed or collected.
Scrubbing and sorption systems may be useful to remove minor components, perhapsprior to a thermal treatment. However, the volume and hazard of the secondary wastesarising from scrubbing will be a consideration if these processes are used to sorb allthe gaseous emissions.

100 Science Report – Production gas production from landfilling of inorganic wastes
10 Conclusions
10.1 Overall nature of gasIt is likely that the bulk gases (methane, carbon dioxide, hydrogen) released frominorganic landfills will be similar to those from existing mixed landfills. However, therelative amounts of these are expected to be different.
The main reason for this is that the generation of gases from microbial processes islikely to be slower than from an existing mixed waste landfill because of the smalleramount of degradable material, the absence of putrescibles, smaller microbial inoculaand the more aggressive conditions. Thus hydrogen from corrosion is likely to form agreater percentage of the evolved gas and other trace components may become moreimportant in assessments of gas release from future landfills.
A number of trace inorganic or organometal(loid) species have been identified as beinggenerated from existing landfills or having the potential to be generated from futurelandfill accepting predominantly inorganic wastes.
Species may be generated from chemical or microbial action. The resulting gascomposition will be dependent on:
• the nature of the waste;
• local and overall chemical and microbial conditions within the waste cell.
Interactions with the engineered components of the landfill, the surrounding soil, rockand groundwater, and ultimately the air, can influence the amounts of some gasesreleased to the atmosphere.
Figure 10.1 provides a schematic diagram of the general processes of generation andconsumption of volatile species in and around a landfill cell. Figures 10.2 and 10.3illustrate this for a mixed waste landfill under anaerobic conditions and an aerobic inertwaste landfill respectively. A comparison of the two diagrams shows the potentialcomplexity of overall gas released from mixed waste compared with that from inertwaste.
10.2 Information gapsThe study has highlighted the lack of data necessary to develop a full understanding ofthe evolution of trace gases from inorganic landfills.
Approaches developed for the treatment of gas from radioactive waste repositories canbe applied to the generation of bulk gas from inorganic landfills. However, a betterdescription of the waste inputs in terms of the chemical composition would be required.This is also true of components that may evolve trace gases.
In addition, the mechanisms and rates of trace gas generation need furtherconsideration. Hirner (2003) notes that ‘… contents and emission potentials of specialwastes like industrial or electronic waste have never been analysed fororganometal(loid) compounds’.
The techniques for characterising wastes or contaminated soils do not normallymeasure the amount of available (zero valent) metal, yet this is an importantdeterminant of the potential gas production from some important inorganic waste types.

Science Report – Production gas production from landfilling of inorganic wastes 101
A better characterisation of waste inputs to a landfill (or landfills), coupled withprogrammes to determine evolved gases from a well-characterised landfill where thewaste inputs are known, would be of value.
It is also possible that gas sampling from old mixed sites where significant landfill gasproduction has ceased might provide useful data on trace species. The work ongaseous mercury reported by Lindberg et al. (2005) illustrates the need to take accountof the types of waste disposed of, the physical nature of the landfill and the age of thelandfill when considering the release of alkylated metal(loid) species.
Preliminary calculations have shown that it could take about 160 days for anaerobicconditions to be established in a capped conceptual mixed hazardous waste landfill bybare metal corrosion under unsaturated conditions. The rate of corrosion, and thus theonset of anaerobic conditions, will depend on the surface area of mild steel assumed inthe calculations. For a low surface area (i.e. massive steel rather than thin metal sheetrepresenting the same total amount of iron), anaerobic conditions may not be achieved.Protective coatings (e.g. paint) or encasement in an impermeable matrix (e.g. a silicatemass) could have a similar but unquantifiable effect. The results of the calculations arealso sensitive to the properties of the cap; anaerobic conditions may not be achievedwith a ‘less-tight’ cap. Calculations for a water-saturated landfill show conditions couldbecome anaerobic more rapidly even at shallow depths.
10.3 Monitoring and treatment techniquesAnalytical methods of sufficient sensitivity exist for all the species likely to be of interestin gas emissions from future landfills containing waste with higher concentrations ofinorganic materials than existing landfills. Portable monitors offer some possibilities formonitoring species such as hydrogen at levels of interest. However, they may not besensitive enough to measure the concentration of some other trace species.
‘Hyphenated’ laboratory analytical techniques (e.g. GC-ICP-MS) coupled withcryogenic trapping and cryofocusing appear capable of analysing a range of volatiletrace species at very low concentrations.
It is likely that gas from future landfills containing low amounts of degradable organicmaterials and a high proportion of inorganic material including zero valent metal, willhave the following characteristics.
• The main constituent will be hydrogen.
• It will also contain hydrogen sulphide, carbon dioxide, carbon monoxide,methane and NOX.
• Trace gases will include hydrogen cyanide, hydrogen halides, metalcarbonyls, ammonia, amines, carbon disulphide, phosphine, arsine andstibine.
Potential methods for treating such a landfill gas stream include thermal processes orscrubbing. Existing landfill gas flares are not adequate to deal with the low volumes ofmixed gases likely to be produced by landfilled inorganic waste. Thermal processes willremove the combustible gases but will result in emission of inorganic species.Scrubbing will not treat all the gaseous components and will generate significantsecondary wastes.
10.4 Future needsThe two most important needs that emerge from this study are:

102 Science Report – Production gas production from landfilling of inorganic wastes
• better characterisation of the waste inputs to landfills;
• gas data from the monitoring of sites known to have accepted wastestypical of those expected to be landfilled in the future.
The waste inputs need to be better characterised in terms of the types of materialsbeing sent for disposal and their chemical composition including, for some elements,knowledge of their oxidation state. For instance, it is important to know whether theamounts of iron and aluminium present are in the zero valent state (i.e. as the metal),as corrosion of the metals generates hydrogen.
Monitoring is necessary to identify whether species of concern are being produced.Initially, trace volatile elements should be identified. Once this has been achieved,analysis should focus in more detail on the speciation of these identified elements ofmost concern. In addition, speciation information will give an indication of theprocesses occurring in the landfill. It is important that bulk gas is sampledcontemporaneously for analysis with samples obtained for trace analyses.

Science Report – Production gas production from landfilling of inorganic wastes 103
Figure 10.1 Regions of a landfill and general generation and consumption processes for volatile species
Photolytic degradation
Atmospheric oxidationand hydrolysis
Microbial oxidation anddemethylation,hydrolysis, oxidation,sorption
Hydrolysis
SorptionSorption,hydrolysis
Corrosion, chemical andmicrobial reactions, sorption
Cover soil
Surrounding geology
Leachate
Waste
Cap
Attenuation/liner system (possible physical and/or chemical barrier)

104 Science Report – Production gas production from landfilling of inorganic wastes
Figure 10.2 Principal products and reactions – mixed waste, anaerobic, microbial action
Photolytic degradation/oxidation – M(CO)X,MRX, CH3I,
Hydrolysis,oxidation, someM(CO)X, MHX,MRX
Microbial oxidation anddeethylation (CH4, MRX species(?), hdrolysis, oidation (PH3, AsR3,some M(CO)X etc), sorption
Dissolution/hydrolysis – CO2, HCl, HF, HBr, NH3, H2S
SorptionSorption,hydrolysis
Generation reactions - H2, CO, CO2, CH4,HCl, HF, HBr, HCN, COCl2, NH3, H2S, PH3,AsH3, SbH3, AsR3, SbR3, BiR3, Ni(CO)4,Mo(CO)6, W(CO)6, PbR4, SnR4, HgR2,other hydrocarbons, vinyl chlorideAs disposed - Hg, siloxanes, solvents, etc.
Consumption reactions –carbonation (CO2),precipitate metal sulphides(H2S), neutralisation/corrosion (acids)
CO2, CH4, H2

Science Report – Production gas production from landfilling of inorganic wastes 105
Figure 10.3 Principal products and reactions – inert waste, aerobic, very limited microbial action
Photolytic degradationOxidation,hydrolysis
Microbial oxidation anddemethylation, hydrolysis,oxidation, sorption
Hydrolysis
SorptionSorption,hydrolysis
Generation reactions (some depend on tracecontaminants) – H2, CO2, CH4, HCl, PH3,CO, H2S as possible major species
Consumptionreactions -carbonation(CO2), precipitatemetal sulphides (H2S),neutralisation/corrosion (acids)
Attenuation layer only

106 Science Report – Production gas production from landfilling of inorganic wastes
ReferencesAllen M R, Braithwaite A and Hills C C (1997) Trace organic compounds in landfill gasat seven UK waste disposal sites. Environmental Science and Technology, 31, 1054-1061.
Andrewes P, Cullen W R and Polishchuk E (1999) Confirmation of the aerobicproduction of trimethylstibine by Scopulariopsis brevicaulis. Applied OrganometallicChemistry, 13, 659-664.
American Society for Metals (ASM) (1987) Metals Handbook (9th edn.), Volume 13Corrosion. Materials Park, OH: ASM International.
Barnard D (1947) Studies on the Metabolism of Certain Aspergilli and Penicillia. Ph.D.thesis. University of Leeds.
Baston G M N, Berry J A, Brownsword M, Heath T G, Tweed C J and Williams S J(1995) Sorption of plutonium and americium on repository, backfill and geologicalmaterials relevant to the JNFL low-level radioactive waste repository at Rokkasho-Mura. In Scientific Basis for Nuclear Waste Management XVIII, Part II (ed. T Murukamiand R C Ewing), pp. 957-964. Pittsburgh, PA: Materials Research Society.
Behrens H and Eisenmann E (1955) Über Metallcarbonyle. 66. DieKohlenoxydreaktionen von Nickel- und Kobaltsulfid im wäßrig-alkalischen Medium. 1.Teil. Zeitschrift für Anorganische und Allgemeine Chemie, 278, (3/4), 155-165 [cited inFeldmann 1999] [extra info from http://www3.interscience.wiley.com page for ZAAC]
Bentley R and Chasteen T G (2002) Microbial methylation of metalloids: arsenic,antimony and bismuth. Microbiology and Molecular Biology Reviews, 66, 250-271.
Biddle P (1989) The interaction of volatile, toxic organic species with mineral phases –a literature review. Nirex Report NSS/R205. Harwell, Oxfordshire: Nirex.
Biddle P and Moreton A D (1995) A review of the results and understanding achievedby the Nirex Research Programme to September 1991 on gas generation in arepository for radioactive wastes. Nirex Report NSS/R210. Harwell, Oxfordshire: Nirex.
Biddle P, McGahan D, Rees J H and Rushbrook P E (1987) Gas generation inrepositories. UKAEA Report AERE R12291. Harwell, Oxfordshire: UK Atomic EnergyAuthority.
Biddle P, Davies A A, McGahan D J, Rees J H and Rushbrook P E (1998) Theevolution of minor active and toxic gases in repositories. Nirex Report NSS/R118.Harwell, Oxfordshire: Nirex.
Biddle P, Greenfield B F, Myatt B J, Robertson G P and Spindler M W (2002) Theeffects of the degradation of some organic polymers and ion-exchange resins onplutonium solubility in the near field. AEA Technology Report AEAT/ERRA-0355.Harwell, Oxfordshire: AEA Technology.
Bouyssiere B, Baco F, Savary L, Garroud H, Gallup D L and Lobinski R (2001)Investigation of speciation of arsenic in gas condensates by capillary gaschromatography with ICP-MS detection. Journal of Analytical Atomic Spectrometry, 16,1329-1332.
Burg H (1999) Chemisch – mineralogische Untersuchung vonMüllverbrennungsschlacke: Zusammensetzung. Alterungsverhalten, Bauphysikalische

Science Report – Production gas production from landfilling of inorganic wastes 107
Eigenschaften. Diplomarbeit (not published), Ludwig-Maximilians-Universität [cited inMagel et al. 2001]
Campana J H and Risby T H (1980) Mass spectrometry of nickel carbonyl for modellingof automobile catalysts. Analytical Chemistry, 52, 468-472.
Chambers A V, Holtom G J, Hunter F M I, Ilett D J, Tearle W M and Williams S J(2004) pH evolution in supercompacted waste. Serco Assurance ReportSERCO/ERRA-0444. Harwell, Oxfordshire: Serco.
Conrad M E, Mazey R M and Reed J E (1976) Industrial arsine poisoning: report ofthree cases. Alabama Journal of Medical Sciences, 13, 65-66.
Cotton F A and Wilkinson G (1972) Advanced Inorganic Chemistry (3rd edn.). NewYork: Wiley-Interscience.
Cotton F A and Wilkinson G (1980) Advanced Inorganic Chemistry (4th edn.). NewYork: Wiley-Interscience.
Cotton F A, Wilkinson G, Murillo C A and Bochmann M (1999) Advanced InorganicChemistry (6th edn.) New York: Wiley-Interscience.
Council of the European Communities (CEC) (1994) Equipment and protective systemsintended for use in potentially explosive atmospheres (ATEX) Directive 94/9/EC.Official Journal of the European Communities, L100, 1-29. Available from:http://ec.europa.eu/enterprise/atex/direct/text94-9-en.pdf [Accessed 27 September2006]
Council of the European Union (CEU) (2002) Consolidated European WasteCatalogue. 2000D0532–EN. Luxembourg: Office for Official Publications of theEuropean Communities. Available from: http://europa.eu.int/eur-lex/en/consleg/pdf/2000/en_2000D0532_do_001.pdf [Accessed 27 September 2006]
Demange M, Elcabache J M, Grzebyk M, Peltier A, Proust N, Thénot D, Ducom P andFritsch J (2000) Phosphine sampling and analysis using silver nitrate Impregnatedfilters. Journal of Environmental Monitoring, 2, 476-482.
Department of Health (DoH) (2001) Phosphine use as a pesticide in fumigation of grainand as a rodenticide: update of COM conclusions reached in 1997. COM StatementCOM/01/S1 March 2001. London: DoH. Available from:http://www.advisorybodies.doh.gov.uk/Com/index.htm [Accessed 27 September 2006].
Department of Health and Social Services (DHHS) (1979) Arsine (arsenic hydride)poisoning in the workplace. Current Intelligence Bulletin 32. DHHS (NIOSH) PublicationNo. 79-142, August 3, 1979. Washington DC: DHHS (NOISH). Available from:http://www.cdc.gov/niosh/79142_32.html [Accessed 27 September 2006]].
Edyvean R G J (1991) Hydrogen sulphide – a corrosive metabolite. InternationalBiodeterioration, 27, 109-120.
Elkins H B and Fahy J P (1967) Arsine poisoning from aluminium tank cleaning.Industrial Medicine and Surgery, 36, 747-749.
Environment Agency (2002a) Investigation of the composition and emissions of tracecomponents in landfill gas. R&D Technical Report P1-438/TR. Bristol: EnvironmentAgency.
Environment Agency (2002b) Landfill Directive Regulatory Guidance Note 2: InterimWaste Acceptance Criteria and Procedures (version 4.0, November 2002). Bristol:Environment Agency.

108 Science Report – Production gas production from landfilling of inorganic wastes
Environment Agency (2003a) Hazardous waste. Interpretation of the definition andclassification of hazardous waste. Technical Guidance WM2. Bristol: EnvironmentAgency.
Environment Agency (2003b) Quantification of trace components in landfill gas. R&DTechnical Report/P1-491/TR. Bristol: Environment Agency.
Environment Agency (2004a) Guidance on the management of landfill gas. LFTGN 03.Bristol: Environment Agency.
Environment Agency (2004b) Guidance for monitoring trace components in landfill gas.LFTGN 04, Bristol: Environment Agency.
Environment Agency (2004c) Gas treatment technologies for landfill gas engines.LFTGN 06. Bristol: Environment Agency.
Environment Agency (2005a) Hazardous waste interrogator [online]. Bristol:Environment Agency. Available from: http://www.environment-agency.gov.uk/apps/wastesurvey2/ [Accessed 27 September 2006].
Environment Agency (2005b) What’s in your backyard. Pollution Inventory substances– carbon disulphide [online]. Bristol: Environment Agency. Available from:http://www.environment-agency.gov.uk/pi [Accessed 27 September 2006].
Envirowise (2005) Reference Note: the Landfill Directive and its implementation in theUK [online]. Harwell, Oxfordshire: Envirowise. Available from:http://www.envirowise.gov.uk [Accessed 27 September 2006]
Erber D and Cammann K (1995) On-line preconcentration of nickel by carbonylvaporization with flow injection and continuous flow systems in combination withsensitive determination by electrothermal atomic absorption spectrometry. Analyst,120, 2699-2705.
Environmental Services Association Research Trust (ESART) (2003) Monitoring andspeciating mercury in landfill gas. ESART Research Report D/009. London:Environmental Services Association.
Feldmann J (1997) Summary of a calibration method for the determination of volatilemetal(loid) species in environmental gas samples by using GC-ICP-MS. Journal ofAnalytical Atomic Spectrometry, 12, 1069-1076.
Feldmann J (1999) Determination of Ni(CO)4, Fe(CO)5, Mo(CO)6 and W(CO)6 insewage gas by using cryotrapping gas chromatography inductively coupled plasmamass spectrometry. Journal of Environmental Monitoring, 1, 33-37.
Feldmann J (2003) Volatilization of metals from a landfill site – generation andimmobilization of volatile species of tin, antimony, bismuth, mercury, arsenic andtellurium on a municipal waste deposit in Delta, British Columbia. In Biogeochemistry ofEnvironmentally Important Trace Elements (ed. Y Cai and O C Braids), pp. 128-140.American Chemical Society (ACS) Symposium Series 835. Washington: ACS.
Feldmann J and Cullen W R (1997) Occurrence of volatile transition metal compoundsin landfill gas: synthesis of molybdenum and tungsten carbonyls in the environment.Environmental Science and Technology, 31, 2125-2129.
Feldmann J and Hirner A V (1995) Occurrence of volatile metal and metalloid speciesin landfill and sewage gases. International Journal of Environmental AnalyticalChemistry, 60, 339-359.

Science Report – Production gas production from landfilling of inorganic wastes 109
Feldmann J, Koch I and Cullen W R (1998) Complementary use of capillary gaschromatography-mass spectrometry (ion trap) and gas chromatography-inductivelycoupled plasma mass spectometry for the speciation of volatile antimony, tin andbismuth compounds in landfill and fermentation gases, Analyst, 123, 815-820.
Feldmann J, Näels L and Haas K (2001) Cryotrapping of CO2-rich atmospheres for theanalysis of volatile metal compounds using capillary GC-ICP-MS. Journal of AnalyticalAtomic Spectrometry, 16, 1040-1043.
Ferreira C, Ribeiro A and Ottosen L (2003) Heavy metals in MSW incineration flyashes. Journal de Physique IV, 107, 463-466 [Proceedings of the XIIth InternationalConference on Heavy Metals in the Environment, Volumes I and II, Grenoble].
Filkova L and Jäger J (1986) Determination of Ultratrace Concentrations. of NickelTetracarbonyl in Air. Chemciké Listy, 80, 1207-1213.
Gould L J, Harris A W and Haworth A (2001) Calculation of the volume of backfillrequired in the near field of a repository. AEA Technology Report AEAT/ERRA-2270.Harwell, Oxfordshire: AEA Technology.
Grieshaber K W, Philipp C T and Bennett G F (1994) Process for recycling spentpotliner and electric arc furnace dust into commercial products using oxygenenrichment. Waste Management 14, 3-4
Griffiths D E and Usta J (1988) Effects of trialkyllead compounds in mitochondrialmembrane potential. In The Biological Alkylation of Heavy Elements (ed. P J Craig andF Glockling), pp. 205-210. Special Publication 66. London: Royal Society of Chemistry.
Gürleyük H, Van Fleet-Stadler V and Chasteen T G (1997) Confirmation of thebiomethylation of antimony compounds. Applied Organometallic Chemistry, 11, 471-483.
Haas K and Feldmann J (2000) Sampling of trace volatile metal(loid) compounds inambient air using polymer bags: a convenient method. Analytical Chemistry, 72, 4205-4211.
Harris A W (1997) An assessment of the pH buffering provided by the Nirex vaultbackfill within a radioactive waste repository. Nirex Report NSS/R323. Harwell,Oxfordshire: Nirex.
Health and Safety Executive (HSE) (2005) EH40/2005 Workplace Exposure Limit.Norwich: HSE Books.
Hetland S, Martinsen I, Radziuk B and Thomassen Y (1991) Species analysis ofinorganic compounds in workroom air by atomic spectroscopy. Analytical Science, 7,1029-1302.
Hirner A V (2003) Volatile metal(loid) species associated with waste materials:chemical and toxicological aspects. In Biogeochemistry of Environmentally ImportantTrace Elements (ed. Y Cai and O C Braids), pp. 141-150. American Chemical Society(ACS) Symposium Series 835. Washington, DC: ACS.
Hoch A and Rodwell W R (2003) Gas generation calculations for generic documents.Update 2003. Serco Assurance Report SA/ENV-0154. Harwell, Oxfordshire: Serco.
Hoch A R, Rees J H, RodwelL W R and Tearle W M (2004) Gas generation from Stage3 wastes in a Nirex repository. Serco Assurance Report SA/ENV-0527. Harwell,Oxfordshire: Serco.
Hocken A G and Bradshaw G (1970) Arsine poisoning. British Journal of IndustrialMedicine, 27, 56-60.

110 Science Report – Production gas production from landfilling of inorganic wastes
Jenkins G C, Ind J E, Kazantzis G and Owens R (1965) Arsine poisoning: massivehemolysis with minimal impairment of renal function. British Medical Journal, 2, 78-80.
Jenkins R O, Craig P J, Miller D P, Stoop L C A M, Ostah N and Morris T.-A (1998)Antimony biomethylation by mixed cultures of microorganisms under anaerobicconditions. Applied Organometallic Chemistry, 12, 449-455.
Juillet Y, Le Moullec S, Bégos A and Bellier B (2005) Optimisation of sorbent trappingand thermal desorption-gas chromatography-mass spectrometric conditions forsampling and analysis of hydrogen cyanide in air. Analyst, 130, 977-982.
Keresztes I, Felhősi I and Kálmán E (2001) Role of redox properties of biofilms incorrosion processes. Electrochimica Acta,46, 3841-3849.
Kim K-H, Choi Y J, Jeon E C and Sunwoo Y (2005) Characterization of malodoroussulfur compounds in landfill gas. Atmospheric Environment, 39, 1103-1112.
Kipling M D and Fothergill R (1964) Arsine poisoning in a slag-washing plant. BritishJournal of Industrial Medicine, 21, 74-77.
Kjeldsen P and Christensen T H (2001) A simple model for the distribution and fate oforganic chemicals in a landfill: MOCLA. Waste Management Research, 19, 201-216.
Klein R, Baumann T, Kahapka R and Niessner R (2001) Temperature development ina modern municipal solid waste incineration (MSWI) bottom ash landfill with regard tosustainable waste management. Journal of Hazardous Materials, B83, 265-280.
Kore Technology Ltd (2005) MS200 Application Note, Measurement of volatile organiccompound emissions from a chemical landfill site. Available from:http://www.kore.co.uk/landfill.htm [Accessed 27 September 2006].
Leroy M J F, Quevauviller P, Donard O F X and Astruc M (1998) Determination of tinspecies in environmental samples. Pure and Applied Chemistry, 70, 2051-2064.
Levinsky W J, Smalley R V, Hillyer P N and Shindler R L (1970) Arsine hemolysis.Archives of Environmental Health, 20, 436-440.
Lide D R (editor-in-chief) (1994) CRC Handbook of Chemistry and Physics (75th edn.).Boca Raton, FL: CRC Press.
Lindberg S E, Wallschlager D, Prestbo E M, Bloom N S, Price J and Reinhart D (2001)Methylated mercury species in municipal waste landfill gas sampled in Florida, USA.Atmospheric Environment, 35, 4011-4015.
Lindberg S E, Southworth G, Prestbo E M, Wallschläger D, Bogle M A and Price J(2005) Gaseous methyl- and inorganic mercury in landfill gas from landfills in Florida,Minnesota, Delaware and California. Atmospheric Environment, 39, 249-258.
Ma H, Cheng X, Li G, Chen S, Quan Z, Zhao S and Niu L (2000) The influence ofhydrogen sulfide on corrosion of iron under different conditions. Corrosion Science, 42,1669-1683.
Magel G, Heuss-Assbichler S and Fehr K T (2001) Abiotic H2 generating reactions in aMSWI monofill. In Proceedings of Sardinia 2001, Eighth International WasteManagement and Landfill Symposium (Cagliari, Sardinina, 2001). pp. 489-498.Sardinia: CISA.
Matheson Tri-Gas (2005) Detector tube listing for Matheson-Kitagawa toxic gasdetector system. Matheson Tri-Gas Technical Bulletin 102-1 Issue 3, downloaded asModel 8014 Kitagawa Tube List from Literature Centre/Speciality Gases & Equipment,http://www.matheson-trigas.com [Accessed August 2005].

Science Report – Production gas production from landfilling of inorganic wastes 111
McCurdy E and Potter D (2001) Optimising ICP-MS for the determination of tracemetals in high matrix samples. Spectroscopy Europe, 13, 14-20.
McDowell R S (1971) Metal carbonyl vapors: rapid quantitative analysis by infraredspectrophotometry. American Industrial Hygiene Association Journal, 32, 621-624.
Meyer R A (ed.) (2000) Encyclopaedia of Analytical Chemistry – Applications, Theoryand Instrumentation. Volumes 1–15. Chichester: J Wiley & Sons.
Michalke K, Wickenheiser E B, Mehring M, Hirner A V and Hensel R (2000) Productionof volatile derivatives of metal(loid)s by microflora involved in anaerobic digestion ofsewage sludge. Applied Environmental Microbiology, 66, 2791-2796.
Mizutani S, Sakai S.-I and Takatsuki H (2000) Investigation of hydrogen productionfrom municipal solid waste incineration. Journal of Material Cycles of WasteManagement, 2, 16-23.
Morse J W, Millero F J, Cornwell J C and Rickard D (1987) The chemistry of thehydrogen sulfide and iron sulfide systems in natural waters. Earth Science Reviews,24, 1-42.
Naish C C, Blackwood D J, Thomas M I and Rance A P (2001) The anaerobiccorrosion of carbon steel and stainless steel. AEA Technology ReportAEAT/R/ENV/0224. Harwell, Oxfordshire: AEA Technology.
Nirex (1997) Nirex 97: an assessment of the post-closure performance of a deepradioactive waste repository at Sellafield. Volume 4: The Gas Pathway. Nirex ScienceReport S/97/012. Harwell, Oxfordshire: Nirex.
Nirex (2001) Generic repository studies. Generic post-closure performanceassessment. Nirex Report N/031. Harwell, Oxfordshire: Nirex.
Pécheyran C, Quetel C R, Matin Lecuyer F M and Donard O F X (1998) Simultaneousdetermination of volatile metal (Pb, Hg, Sn, In, Ga) and nonmetal Species (Se, P, As)in different atmospheres by cryofocusing and detection by ICPMS. AnalyticalChemistry, 70, 2639-2645.
Pinto S S, Petronella S J, Johns D R and Arnold M F (1970) Arsine poisoning. Archivesof Industrial Hygiene and Occupational Medicine, 1, 437-451.
Pryor M J and Keir D S (1958) Galvanic corrosion II: effect of pH and oxygenconcentration on the aluminium steel couple. Journal of The Electrochemical Society,105, 629-634.
Rodwell W R, Harris A W, Horseman S T, Lalieux P H, Müller W, Ortiz Amaya L andPruess K (1999) Gas migration through engineered and geological barriers for a deeprepository for radioactive waste. A Joint EC/NEA Status Report published by theEuropean Commission. European Commission Report EUR 19122 EN, Luxembourg:Office for Official Publications of the European Communities.
Rodwell W R, Norris S, Cool W, Cuñado M, Johnson L, Mäntynen M, Müller W, SellinP, Snellman M, Talandier J, Vieno T and Vines S (2004) A thematic network on gasissues in safety assessment of deep repositories for radioactive waste: final report onthe treatment in safety assessments of issues arising from gas generation. EuropeanCommission Report 20620 EN, Luxembourg: Office for Official Publications of theEuropean Communities.
Roels J and Verstraete W (2001) Biological formation of volatile phosphoruscompounds. Bioresource Technology, 79, 243-250.

112 Science Report – Production gas production from landfilling of inorganic wastes
Roels J and Verstraete W (2004) Occurrence and origin of phosphine in landfill gas.Science of the Total Environment, 327, 185-196.
Roels J, Van Langenhove H and Verstraete W (2002) Determination of phosphine inbiogas and sludge at ppt-levels with gas chromatography-thermionic specific detection.Journal of Chromatography A, 952, 229-237.
Roels J, Huyghe G and Verstraete W (2005) Microbially mediated phosphine emission.Science of the Total Environment, 338, 253-265.
Salvarezza R C, Videla H A and Arvía A J (1982) The electrodissolution andpassivation of mild steel in alkaline sulphide solutions. Corrosion Science, 22, 815-829.
Schweigkofler M and Niessner R (1999) Determination of siloxanes and VOC in landfillgas and sewage gas by canister sampling and GC-MS/AEA analysis. EnvironmentalScience and Technology, 33, 3680-3685.
Scott P E, Dent C G and Baldwin G (1988) The composition and environmental impactof household waste derived landfill gas. 2nd Report. Controlled Waste ManagementReport CWM 41/88. London: Department of the Environment, Wastes TechnicalDivision
Scottish Environmental Protection Agency (SEPA) (2004) Technical Guidance Note.The disposal in landfills for non-hazardous waste of gypsum wastes (Version 1).Stirling: SEPA. Available from: http://www.sepa.org.uk/guidance/index.htm#landfill[Accessed 27 September 2006]
Sjöblom R, Hermansson H-P and Amcoff Ö (1995) Chemical durability of coppercanisters under crystalline bedrock repository conditions. In Scientific Basis for NuclearWaste Management XVIII Part 1 (ed. T Murukami and R C Ewing), pp. 687-694.Pittsburgh, PA: Materials Research Society.
Slack R J, Gronow J R and Voulvoulis N (2005) Household hazardous waste inmunicipal landfills: contaminants in leachate. Science of the Total Environment, 337,119-137.
Smart N R (2002) A review of steel corrosion data for use in the GAMMON computerprogram. Serco Assurance Report SERCO/ERRA-0484. Harwell, Oxfordshire: Serco.
Smith L M, Maher W A, Craig P J and Jenkins R O (2002) Speciation of volatileantimony compounds in culture headspace gases of Cryptococcus Humicolus usingsolid phase microextraction and gas chromatography-mass spectrometry. AppliedOrganometallic Chemistry, 16, 287-293.
Sutherland K (2004) Density of steel. In The Physics Fact Book (ed. G Elert) [online]http://hypertextbook.com/facts/2004/KarenSutherland.shtml [Accessed 8 March 2005].
Symonds Group (2005) Survey of arisings and use of construction and demolitionwaste 2001. Executive Summary of the Final Report to the Office of the Deputy PrimeMinister. Symonds Group in association with WRc plc. Available from:http://www.communities.gov.uk/index.asp?id=1143463 [Accessed 27 September 2006]
Tabrizi M R, Lyon S B, Thompson G E and Ferguson J M (1991) The long-termcorrosion of aluminium in alkaline media. Corrosion Science, 32, 733-742.
Tinsley I (1979) Chemical Concepts in Pollutant Behaviour. New York: John Wiley &Sons.

Science Report – Production gas production from landfilling of inorganic wastes 113
US Department of Energy (USDOE) (2000) The waste isolation pilot plant pioneeringnuclear waste disposal. US Department of Energy Report DOE/CAO-00-3124.Carlsbad, NM: USDOE
US Department of Energy (USDOE) (2002) Final environmental impact statement for ageologic repository for the disposal of spent nuclear fuel and high-level radioactivewaste at Yucca Mountain, Nye County, Nevada. US Department of Energy, Office ofCivilian Radioactive Waste Management Report DOE/EIS-0250. North Las Vegas, NV:USDOE.
Van der Sloot H A, Kosson D S and Hjelmar O (2001) Characterization, treatment andutilisation of residues from municipal waste incinerators. Waste Management, 21, 753-765.
Van der Sloot H A, Van Zomeren A, Dijkstra J J, Hoede D, Jacobs J and Scharff H(2003) Prediction of long-term leachate quality and chemical specification for apredominantly inorganic landfill. In Proceedings of Sardinia 2003, Ninth InternationalWaste Management and Landfill Symposium (Cagliari, Sardinia, 2003) Cagliari: CISA.
Weigand H, Müller S and Marb C (2003) Seepage water emission of inorganiccontaminants from MSWI bottom ash: results from lab-, pilot- and field-scaleexperiments. In Proceedings of Sardinia 2003, Ninth International Waste Managementand Landfill Symposium (Cagliari, Sardinia, 2003) Cagliari: CISA
Westlake K, Saye M and Fawcett T (1991) Environmental impacts from landfillsaccepting non-domestic wastes. Controlled Waste Management Report CWM 036/91.London: Department of the Environment Wastes Technical Division
White J R and Turnbull A (1994) Weathering of polymers: mechanisms of degradationand stabilization, testing strategies and modelling. Journal of Materials Science, 29,584-631.
Wikjord A G, Rummery T E, Doern F E and Owen D G (1980) Corrosion and depositionduring the exposure of carbon steel to hydrogen sulphide-water solutions. CorrosionScience, 20, 651-671.
Williams P T (2005) Waste Treatment and Disposal (2nd. edn.). Chichester: John Wiley& Sons.
Yassin A .A and Sabaa M W (1990) Degradation and stabilization of poly(vinylchloride). Journal of Macromolecular Science Pat C – Reviews in MacromolecularChemistry and Physics, 30, 491-558.
Zhang S, Herbell J-D and Birgit G-H (2004) Biodegradable organic matter in municipalsolid waste incineration bottom ash. Waste Management, 24, 673-679.

114 Science Report – Production gas production from landfilling of inorganic wastes
List of abbreviationsAAS atomic absorption spectroscopy
AES atomic emission spectroscopy
AFS atomic fluorescence spectroscopy
APC air pollution control
ASL Approved Supply List
ATD automated thermal desoprtion
C&D construction and demolition
CDEW construction, demolition and excavation waste
C&I commercial and industrial
CV-AAS cold vapour-atomic absorption spectroscopy
CV-AES cold vapour-atomic emission spectroscopy
ELV End of Life Vehicle
ETAAS Electrothermal atomic absorption spectroscopy
EWC European Waste Catalogue
GC gas chromatography
GC-MS gas chromatography-mass spectrometry
HG hydride generation
HHW hazardous household waste
HPLC high performance liquid chromatography
ICP-AES inductively coupled plasma-atomic emission spectroscopy
ICP-MS inductively coupled plasma-mass spectrometry
IR infrared
LOD Limit of Detection
LTWEL Long-Term Workplace Exposure Limit
MS mass spectrometry
MSW municipal solid waste
NIOSH National Institute of Occupational Safety and Health
PCDDs polychlorinated dibenzo-p-dioxins
PCDFs polychlorinated dibenzofurans
ppb parts per billion
ppm parts per million

Science Report – Production gas production from landfilling of inorganic wastes 115
PPC Pollution Prevention and Control
PVC Polyvinylchloride
SNRHW Stable Non-reactive Hazardous Waste
SRB sulphate-reducing bacteria
UV ultraviolet
USEPA US Environmental Protection Agency
VOCs volatile organic compounds
WAC Waste Acceptance Criteria

116 Science Report – Production gas production from landfilling of inorganic wastes
GlossaryATD tubes Automated thermal desorption tubes used for sampling from the
gas phase.
Gresham tube A proprietary design of sampling equipment that can be used tocollect gas samples. It comprises an empty metal tube, valves andhand pump.
Tedlar bag A bag constructed of inert material (polyvinyl fluoride) for takinggaseous grab samples
XAD A proprietary ion exchanger comprising beads of cross-linkedpolystyrene.

Science Report – Production gas production from landfilling of inorganic wastes 117
Appendix A: Methodology forestimating future composition ofwastes in main classes of landfillLandfill data from 2002 in the Environment Agency’s Hazardous Waste Interrogator(Environment Agency 2005a) were used as the starting point in developing theconceptual model landfill inventories. Data on the quantities of waste by EuropeanWaste Catalogue (CEU 2002) chapter/category were gathered and the types of wastescontained within the EWC categorisation assessed.
The next step was to determine the disposal routes and likely quantities of these wastesfrom 2005 onwards. The following were taken into account:
• regulatory changes such as the change from Waste Management Licensingto PPC permitting;
• the effects of the Landfill and Hazardous Waste Directives;
• social/political factors such as the increasing drive towards recycling andreuse of wastes;
• economic factors (e.g. increased disposal charges to waste consignors),particularly in relation to disposal at hazardous waste landfills.
Where an EWC category was marked as an absolute (A) hazardous entry, those wastestreams were generally assumed to go to hazardous landfill.
Where the EWC category was marked as a mirror (M)7 hazardous entry, the wastestreams were split into hazardous and non-hazardous streams with judgement applied tothe relative split.
Where the EWC category carried no marking, those waste streams were assumed to goto non-hazardous landfill.
The exceptions to this general process were the 11 non-hazardous EWC categoriesspecified in the Interim Waste Acceptance Criteria (Environment Agency 2002) whichcan be accepted into inert sites without testing. It was assumed that these wastestreams would go to inert landfill with very little routed to non-hazardous landfill due tothe expected differences in overall costs of disposal. A small amount of these wasteswas assumed to go to other landfill types for use as landfill construction materials. inaddition, hazardous asbestos-containing wastes and gypsum wastes were assumed togo to monofilled cells at non-hazardous sites. Finally, it was assumed that tar wastestreams (e.g. 05 06 03 other tars) would be sent for incineration and that the resultingash would be disposed of as monofill.
The likely change in quantity of each waste category going to landfill disposal wasestimated. These estimates took into account factors such as:
• the unsuitability of certain waste types under the new WAC;
• increased and emergent recycling techniques;
7 Absolute entries – hazardous waste regardless of any threshold concentrations; Mirror entries – hazardous waste only ifdangerous substances are present above threshold concentrations (Environment Agency 2003a).

118 Science Report – Production gas production from landfilling of inorganic wastes
• the requirement to pre-treat and reduce the volume of wastes beforedisposal to landfill.
Account was taken of the efficiency of recycling to recover items from mixed wastestreams. Although aluminium – and to an extent iron – have significant value, forinstance, finely divided, contaminated and occluded material will pass though typicalsorting systems.
Economic considerations were also taken into account by assuming that, in general,landfilling of wastes (particularly hazardous waste) from 2005 onwards would besignificantly more expensive than it had been in 2002, encouraging waste producers tolook to alternative means of disposal. On the whole, the levels of waste disposed atlandfill were judged to fall from the amounts in 2002. However, some waste streams(e.g. fragmentiser wastes from ELV processing) were judged likely to show an increasefrom their 2002 quantities due to the impact of other waste legislation.
An estimate of the overall composition of each model mixed waste landfill inventory isrequired in order to consider its potential for bulk gas generation. An estimate of theproportions of the likely major components in each stream was therefore made. Thetypical composition and per cent weight contribution of any packaging (e.g. steel orplastic drums) were also estimated where relevant.
These estimates of composition were based on knowledge and experience of typicalwaste streams supported by reference to:
• internet resources (Environment Agency 2005b, ESA 2005, NZME 2005);
• the Approved Supply List (ASL) (HSE 2002);
• some discussion with waste organisations.
The estimated masses of the waste stream components were assigned to genericcategories based on:
• their expected gas generating behaviour or potential to produce volatilecompounds of interest;
• their possible effect on the chemical environment within the landfill.
This classification was based on general chemical knowledge. The components of thewastes were assigned to the following categories:
• iron and steel;
• aluminium as metal;
• zinc as metal;
• cements and alkaline solids;
• recalcitrant organic material (e.g. synthetic polymers other than PVC);
• oils;
• other non-halogenated organic compounds and residues;
• halogenated solvents and residues;
• PVC;
• wood, paper and cardboard;
• other inorganic chemicals and other materials;

Science Report – Production gas production from landfilling of inorganic wastes 119
• inert materials (‘inert’ in terms of their potential for gas production only, notinert wastes as defined in interim WAC);
• lead.
ReferencesCouncil of the European Union (CEU) (2002) Consolidated European Waste Catalogue.2000D0532–EN. Luxembourg: Office for Official Publications of the EuropeanCommunities. Available from: http://europa.eu.int/eur-lex/en/consleg/pdf/2000/en_2000D0532_do_001.pdf [Accessed 27 September 2006]
Environment Agency (2002) Landfill Directive Regulatory Guidance Note 2: InterimWaste Acceptance Criteria and Procedures (version 4.0, November 2002). Bristol:Environment Agency.
Environment Agency (2003) Hazardous waste. Interpretation of the definition andclassification of hazardous waste. Technical Guidance WM2. Bristol: EnvironmentAgency.
Environment Agency (2005a) Hazardous waste interrogator [online]. Bristol:Environment Agency. Available from: http://www.environment-agency.gov.uk/apps/wastesurvey2/ [Accessed 27 September 2006].
Environment Agency (2005b) ‘Waste’ web pages [online]. Bristol: Environment Agency.Available from: http://www.environment-agency.gov.uk/subjects/waste [Accessed 27September 2006].
Environmental Services Association (ESA) (2005) ‘Managing Waste’ web pages [online].London: ESA. Available from: http://www.esauk.org/waste [Accessed 27 September2006].
Health and Safety Executive (HSE) (2002) Approved Supply List (7th edn). Informationapproved for the classification and labelling of substances and preparations dangerousfor supply. Norwich: HSE Books.
New Zealand Ministry for the Environment (NZME) (2005) What’s in Your Waste? Aresource for Trade businesses [online]. Wellington: NZME. Available from:http://www.mfe.govt.nz/publications/waste/whats-in-your-waste-mar02 [Accessed 27September 2006].

120 Science Report – Production gas production from landfilling of inorganic wastes
Appendix B: Xenobioticcompounds and heavy metalsfrequently found in MSW and co-disposal leachates with a possibleorigin in household hazardouswasteTables B1 and B2 are taken from Slack et al. (2005) and list:
• xenobiotic compounds found in leachates from MSW and co-disposallandfills that may have a possible origin in household hazardous waste(HHW) from domestic sources;
• ranges of heavy metal concentrations detected in landfill leachates.
Domestic waste represents over two-thirds of MSW and HHW is landfilled with generalhousehold waste. Slack et al. (2005) note other studies have found that, even withoutlandfill co-disposal, leachates from MSW are very similar in composition to those frommixed or hazardous landfills.
ReferencesSlack R J, Gronow J R and Voulvoulis N (2005) Household hazardous waste inmunicipal landfills: contaminants in leachate. Science of the Total Environment, 337,119-137.

Science Report – Production gas production from landfilling of inorganic wastes 121
Table B1 Xenobiotic compounds frequently found in MSW and co-disposal landfillleachates with a possible origin in HHW1
Compound CAS no. Use Presencein HHW2
Landfill typeand reference3
Halogenated hydrocarbonsBromodichloromethane 75-27-4 Chlorinated water, some
as manufacturingsubstrate
X 2
Chlorobenzene 108-90-7 Industrial solvent andsubstrate
X 1,3,5,8,15
1,4-Dichlorobenzene 106-46-7 Toilet deodorisers andmothballs
Y 1,3,5,7,8
1,3-Dichlorobenzene 541-73-1 Insecticide/fumigant;chlorophenol substrate
X 1,7,8
1,2-Dichlorobenzene 95-50-1 Pesticide, manufacturingsubstrate, deodoriser,solvent
Y 1,3,5,7,8,15
1,2,3-Trichlorobenzene 87-61-6 Insecticide, substrate,solvent
X/Y 1,2,7
1,2,4-Trichlorobenzene 120-82-1 Insecticide, substrate,solvent
X/Y 1,2,7,8
1,3,5-Trichlorobenzene 108-70-3 Chemical intermediate,explosives, pesticides
X/Y 2
Hexachlorobenzene 118-74-1 Industrial by-product ofsolvent, pesticide andwood preservation
X 1
Hexachlorobutadiene 87-68-3 Manu. of rubber/lubricantsand industry
X 2
1,1-Dichloroethane 75-34-3 Paint solvent, degreasant,breakdown of 1,1,1-trichloroethane
X/Y 1
1,2-Dichloroethane 107-06-2 Vinyl chloridemanufacture: paint,adhesives, pesticides andcleaning products: solventto remove petrol lead
Y(old) 1,2,7,8
Tribromomethane 75-25-2 Degreasant and substrate– no longer used
X 2
1,1,1-Trichloroethane 71-55-6 Solvent especially paintand adhesive; cleaningproducts and aerosols
Y 1,2,3,5
1,1,2-Trichloroethane 79-00-5 Solvent, unknown use;1,1,2,2-tetrachloroethanebreakdown product
X/Y 1
1,1,2,2-Tetrachloroethane
79-34-5 Industrial solvent andsubstrate; was used inpaint, pesticides anddegreasant
X/Y 1
trans-1,2-Dichloroethylene
156-60-5 Solvent andmanufacturing(pharmaceuticals, etc.)
X/Y 1
cis-1,2-Dichloroethylene 156-59-2 Solvent (perfumes, etc.)and manufacturing.(pharmaceuticals, etc.)
X/Y 1

122 Science Report – Production gas production from landfilling of inorganic wastes
Table B1 (cont’d) Xenobiotic compounds frequently found in MSW and co-disposal landfill leachates with a possible origin in HHW1
Compound CAS no. Use Presencein HHW2
Landfill typeand reference3
Trichloroethylene 79-01-6 Solvent, substrate,degreasant: solvent inTippex, paint removers,adhesives and cleaners
Y(old) 1,2,3,5,8
Tetrachloroethylene 127-18-4 Dry-cleaning anddegreasant
X 1,2,3,5,8
Dichloromethane 75-09-2 Solvent in paint stripper,aerosols, cleaners,photographics, pesticides
Y(old) 1,5,7,8
Trichloromethane 67-66-3 Solvent and substrate:forms from Cl in water
X 1,5,7,8
Carbon tetrachloride 56-23-5 All uses stopped? Nolonger a refrigerant, etc.Used for plastics?
Y 1,2,8
Chloroethene 75-01-4 Plastics and vinylproduction – house, drugs,etc.
Y 8
Aromatic hydrocarbonsBenzene 71-43-2 Multitude of uses –
manufacturing of dyes,pesticides, drugs,lubricants and detergents
Y 1,2,3,5,6,7,8,13,15
Toluene 108-88-3 Solvent in paint, paintthinners, nail varnish, etc.
Y 1,2,3,5,7,8,13,15
Xylenes 1330-20-7 Plastics manufacture:solvent in paints, nailvarnish
Y 1,2,3,5,6,7,8,13,15
Ethylbenzene 100-41-4 Pesticides, varnishes,adhesives and paints
Y 1,2,3,5,8,13,15
Trimethylbenzenes N/A Solvent, substrate (paint,perfume dye), fuel
X/Y 1,3,5,8,13
n-Propylbenzene 103-65-1 Solvent and manufacture X 1,8,13t-Butylbenzene 98-06-6 Solvent and manufacture X 1,8Ethyltoluenes e.g. 622-
96-8Solvent and manufacture X 1,8,13
Naphthalene 91-20-3 Moth repellent, toiletdeodoriser, manufactureof dyes and resins
Y 1,3,5,6,7,8,13,15
2-Methylnaphthalene 91-57-6 Insecticides, chemicalintermediate (dye/vitaminK)
Y 3,7,8,13,15
1-Methylnaphthalene 90-12-0 Insecticides, chemicalintermediate (dye/vitaminK)
Y 3,7,8,13,15
PhenolsPhenol 108-95-2 Slimicide, disinfectant,
drugs and manufactureX/Y 1,2,3,5,6,7,12,1
3, 15

Science Report – Production gas production from landfilling of inorganic wastes 123
Table B1 (cont’d) Xenobiotic compounds frequently found in MSW and co-disposal landfill leachates with a possible origin in HHW1
Compound CAS no. Use Presencein HHW2
Landfill typeand reference3
Ethylphenols 90-00-6 Solvent, naturallyoccurring in some foods
X/Y 1,3,15
Cresols 1319-77-3 Wood preservatives,drugs, disinfectant andmanufacture
Y 1,3,5.6,7,12,13,15
Bisphenol a As phenol Manufacture of epoxyresins, coating on foodcans?
Y 1,6,7,15
Dimethylphenols 105-67-9 Solvent X(Y) 1,12,152-Meth/4-methoxyphenol
90-05-1/50-76-5
Manu. Antioxidants, drugs,plastics, dyes: flavouring
Y 1
Chlorophenols 95-57-8 Pesticides, antiseptics,manufacturing, Cl-treatedwater
X(Y) 1,7,12,13,15
2,4-Dichlorophenol 120-83-2 Manufacture of herbicides,PCP: mothballs,disinfectant
Y 7
3,5-Dichlorophenol 591-35-5 Manu. Herbicides, PCP;mothballs, disinfectant
Y 1
Trichlorophenols N/A PCP and organochlorinepesticide metabolites
X/Y 15
2,3,4,6-Tetrachlorophenol
58-90-2 Pesticides, woodpreservative
X 1,15
Pentachlorophenol 87-86-5 Wood preservative nolonger used in households
Y(old) 2,15
Polychlorinatedbiphenyls
1336-36-3 Transformers andcapacitors: <1970s usedin consumables paint,adhesives, fluorescentlamps, oil, WEE
X 2
AlkylphenolsNonylphenol 104-40-5 Surfactants X/Y 1,15Nonylphenol ethoxylate 9016-40-
9/NA 31Detergents,wetting/dispersing agents,emulsifier
X/Y 15
PesticidesAldrin/dieldrin 309-00-
2/60-57-1Banned insecticides X 2
Ametryn 834-12-8 Herbicide X 1Ampa N/A Glyphosate X 1Atrazine 1912-24-9 Herbicide – US licensed Y 2,7Bentazon 25057-89-
0Herbicide X 1
Chloridazon 1698-60-8 Pyridazinone herbicide X 1Chlorpropham 101-21-3 Carbinilate herbicide X 1DDT (DDD, DDE) 50-29-3
(72-54/55-8/9)
Banned insecticides X 2
Dichlobenil 1194-65-6 Herbicide Y 1

124 Science Report – Production gas production from landfilling of inorganic wastes
Table B1 (cont’d) Xenobiotic compounds frequently found in MSW and co-disposal landfill leachates with a possible origin in HHW1
Compound CAS no. Use Presencein HHW2
Landfill typeand reference3
Dichlorvos 62-73-7 Insecticide (indoor) andveterinary care
Y 2
N,N-Diethyltoluamide 134-62-3 Insecticide (body) Y 6Endosulfan (α/β) 33213-65-
9Insecticide and woodpreservative
X 2
Endrin 72-20-8 No longer used(insect/rodent/avicide)
X 2
Fenpropimorf 67564-91-4
Morpholine fungicide X 1
Glyphosate 1071-83-6 Herbicide Y 1Hexazinon 512-350-
42Non-agricultural herbicide X 1
Hydroxyatrazin 2163-68-0 Atrazine metabolite X 1Hydroxysimazin NA 1063 Simazine metabolite X 1Isoproturon 34123-59-
6Phenylurea herbicide X 1
γ-Hexachlorocyclohexane
581-89-9 Insecticide and licetreatment
Y 1,2
Malathion 121-75-5 Insecticide, flea and licetreatment
Y 2
Mecoprop 7085-18-0 Herbicide Y 1,4,5,6,13,14Methyl parathion 298-00-0 Insecticide – agricultural X 2MCPA 94-74-6 Herbicide Y 1Propoxur 114-26-1 Acaricide/insecticide X 1Simazine 122-34-9 Herbicide Y 2Tridimefon 43121-43-
3Fungicide X 1
4-CCP 3307-39-9 Herbicide X 12,4-D 94-75-7 Herbicide Y 12,4,5-T 93-76-5 Herbicide (Agent Orange) X 12,4-DP 120-36-5 Herbicide (alongside
Mecoprop)Y 1
PhthalatesMonomethyl phthalate - Plastics Y 1Dimethylphthalate - Plastics Y 1,7Diethyl phthalate 84-66-2 All plastic consumables,
insecticides, drugs,cosmetics
Y 1,4,5,6,7,9,15
Methyl-ethyl phthalate - Plastics Y 1,9Mono-(2-ethylhexyl)phthalate
- Plastics Y 1,9
Di-(2-ethylhexyl)phthalate
117-81-7 All plastics includingmedical ware
Y 1,6,7,9,10,15
Mono-butylphthalate - Plastics Y 1,9Di-n-butylphthalate 84-74-2 PVC plastics and
nitrocellulose lacquers(varnish)
Y 1,5,6,7,9,15
Di-isobutylphthalate - Plastics Y 1,6,9Mono-benzylphthalate - Plastics Y 1,9Butylbenzyl phthalate 85-68-7 Plastics Y 1,9,15Dioctylphthalate 117-84-0 All plastics, pesticides and
cosmeticsY 1,6,15

Science Report – Production gas production from landfilling of inorganic wastes 125
Table B1 (cont’d) Xenobiotic compounds frequently found in MSW and co-disposal landfill leachates with a possible origin in HHW1
Compound CAS no. Use Presencein HHW2
Landfill typeand reference3
Phthalic acid N/A Phthalate breakdownproduct
Y 1,6,10
Diheptyl phthalate 3648-21-3 Plastics Y 7Aromatic sulphonatesNaphthalenesulphonates
- Azo dyes, detergents,plasticisers
Y 1
Benzene sulphonates 68411-30-3
Azo dyes, detergents,plasticisers
Y 1
p-Toluenesulphonate 80-4-0 Azo dyes, detergents,plasticisers
Y 1
Sulphones andsulphonamidesDiphenylsulphone 127-63-9 Plasticiser and
intermediatesY 6
N-Butylbenzenesulphonamide
3622-84-2 Plasticiser Y 6,15
PhosphonatesTributylphosphate 126-73-8 Plasticiser, solvent,
antifoaming agentY 1,3,5,6,15
Triethylphosphate 78-40-0 Plasticiser, solvent,antifoaming agent
Y 1,3,6,7,15
TerpenoidsTerpenoids (general) N/A Plant by-product, chemical
intermediateY 11
Borneol 507-70-0 Chemical, perfume,flavouring intermediates
Y 6
Camphor 76-22-2 Perfume and incenseadditive
Y 1,3,5,6,8,13,15
1,8-Cineole 470-82-6 Flavours and fragrance Y 3,6Fenchone e.g.1195-
79-5Flavouring Y 1,3,6,13
Limonene 5989-27-5 Flavouring Y -Menthol 15356-70-
4Flavours and fragrance Y 3
Pinene e.g. 80-56-8
Flavours and fragrance Y 15
α-Terpineol 98-55-5 Flavours and fragrance Y 6,7Tetralins N/A Flavours and fragrance Y 15Thymol 89-83-8 Flavours and fragrance Y 6PharmaceuticalsIbuprofen 15687-27-
1Anti-inflammatory/analgesic –over-the-counter (OTC)
Y 6
PropylphenazonePhenazone 479-92-
5/60-80-0Analgesic – rarely usedtoday
X 6,15
Clofibric acid 882-09-7 Plant growth regulator anddrug intermediate
Y 6
PyridinesMethylpyridine (2-?) 109-06-8 Solvent and substrate for
dyes, resins , drugsX 6
Nicotine 54-11-5 Insecticide, tobacco X/Y 1,6Cotinine 486-56-6 Formed from oxidation of
nicotineX/Y 6

126 Science Report – Production gas production from landfilling of inorganic wastes
Table B1 (cont’d) Xenobiotic compounds frequently found in MSW and co-disposal landfill leachates with a possible origin in HHW1
Compound CAS no. Use Presencein HHW2
Landfill typeand reference3
Carboxylic acidsBenzoic acid 65-85-0 Food preservative,
perfumes, creams/drugs,manufacturing
Y 3,6,15
Phenylacetic acid 103-82-2 Fragrance/flavour, drugs(penicillin)
Y 3,6
Benzenetricarboxylacids
e.g. 528-44-9
Plastic softeners Y 3,6
Palmitic acid 57-10-3 Food, cosmetics andpharmaceuticals
Y 3,6,15
Stearic acid 57-11-4 Food, cosmetics andpharmaceuticals
Y 3,6,15
Linoleic acid 60-33-3 Food and fragrance Y 3,6Aliphaticsn-Tricosane 638-67-5 Plastics and intermediate X 6,7n-Triacontane 638-68-6 Intermediate X 6,7Alcohols and ethersGlycol ethers e.g. 111-
76-2Solvent (paint, varnish,inks, pesticides,antifreeze)
Y 6
General alcohols N/A Solvents Y 1Diphenylethers 101-54-8 Flame retardant,
plasticizer, herbicideY 6
Aldehydes and ketonesAldehydes N/A Solvents (plastics, paints) Y 1,6Ketones N/A Preservative, resin/dye
manufacturingintermediate
Y 1,6
MiscellaneousAcetone 67-64-1 Solvent and in
manufacture of plastics,drugs and fibres
Y 1
Analines N/A Ink/dye, resins, drugs,agrochemical intermediate
X/Y 3,6,7
Benzonitrile 100-47-0 Solvent: dye, drugs,rubber, lacquermanufacture
Y 3,4,7,15
Benzthiazoles N/A Manufacture of drugs,rubber, agrochemicals,etc.
Y 6,7
Dibenzofuran 13-26-49 From fossil fuelcombustion – includingdiesel fuel
X 7
Caffeine 58-08-2 Food additive, drugs Y 1,7Esters 110843-
98-6Many uses duringmanufacture
Y 6,15
Tetrahydrofuran 109-99-9 Food additive, reagent(drugs, perfumes), solvent
Y 1

Science Report – Production gas production from landfilling of inorganic wastes 127
Table B1 (cont’d) Xenobiotic compounds frequently found in MSW and co-disposal landfill leachates with a possible origin in HHW1
Compound CAS no. Use Presencein HHW2
Landfill typeand reference3
Indane 90989-41-6
Fuel and metal cleaning Y 1,6
Indene 95-13-6 Solvent and intermediate Y 8Indoles N/A Intermediates, food
colourant, drugs/hallucinogenics, perfumes,etc.
Y 6,15
MTBE 1634-04-4 Solvent used as additivein unleaded petrol
X(Y) 1
Siloxanes N/A Silicone polymers –varnish, oils/waxes, rubber
Y 6,15
Styrene 100-442-5 Naturally occurring, usedfor plastics/rubbermanufacture
Y 8,15
Trifluralin 158-20-98 Herbicide X 2
Notes: 1 Slack et al. (2005)2 Presence in HHW:
X = non-municipal/household use; Y = municipal/household use;X/Y = either/or but generally non-municipal/household use;X(Y) = non-municipal/household but possibly occurring in MSW;Y(old) = no longer used in municipal/household products but possibly occurring in MSW.
3 Landfill types (as referenced in Slack et al. 2005):1 = co-disposal landfills;2 = MSW landfills although co-disposal likely in all;3 = co-disposal landfills;4 = simulation using household waste;5 = co-disposal landfill;6 = no details supplied;7 = co-disposal landfill;8 = co-disposal landfill;9 = mixed landfills receiving different wastes;10 = simulation using household waste;11 = MSW landfill;12 = co-disposal landfill;13 = co-disposal landfill;14 = co-disposal landfill;15 = co-disposal landfill.

128 Science Report – Production gas production from landfilling of inorganic wastes
Table B2 Heavy metal concentration ranges detected in landfill leachates1
Metal Use Concentration range (mg dm-3)Cadmium Batteries, appliances 0.0001–0.04Nickel Batteries, appliances 0.0036–13Zinc Batteries, packaging 0.003–1000Copper Electrical appliances 0.002–10Lead Batteries, appliances 0.001–5Chromium Electrical appliances 0–1.62Mercury Batteries, appliances 0.00005–0.16Arsenic Appliances 0.01–1Cobalt Appliances 0.005–1.5
Notes: 1 Slack et al. (2005)

Science Report – Production gas production from landfilling of inorganic wastes 129
Appendix C: Thermodynamic dataand susceptibility to oxidation for anumber of methyl and hydridespeciesTable C1 Standard molar enthalpies of formation for (CH3)nM compounds ofenvironmental interest1
Element ∆Hf (kJ mol–1)2
Group III (n = 3)B –122Al –88Ga –39In +172Tl –
Group IV (n = 4)C –167Si –238Ge –71Sn –19Pb +137
Group V (n = 3)N –24P –96As +15Sb +31Bi +192
Group VI (n = 2)O +195S –
Se –573
Te –Po –
Group IIB (n – 2)Zn +55Cd +110Hg +93
Notes: 1 Craig (1986). All the compounds can be isolated and stored at room temperature; somerequire inert atmospheres.2 ∆Hf is for formation from the elements at 298K and 1 atmosphere pressure, endothermic ∆Hf(positive) = exothermic decomposition.3 (C2H5)2Se
Note that entropy plays an effect (i.e. ∆GD = ∆HD – T∆SD), so T∆SD is large andnegative. This renders exothermic compounds of slight stability even less stable thanappears at first sight as ∆GD becomes negative. Note also that kinetic factors may play apart (e.g. Pb(CH3)4 is stable because of kinetics); there is no decomposition route with alow activation energy.

130 Science Report – Production gas production from landfilling of inorganic wastes
Table C2 Mean bond dissociation energies (De) for (CH3)nM compounds ofenvironmental interest1
Element De (kJ mol–1)2
Group III (n = 3)B 364Al 276Ga 247In 163Tl –
Group IV (n = 4)C 347Si 320Ge 247Sn 218Pb 155
Group V (n = 3)N 314P 276As 230Sb 218Bi 141
Group VI (n = 2)O 358S 289
Se 247Te –Po –
Group IIB (n – 2)Zn 176Cd 138Hg 123
Notes: 1 Craig (1986)2 De values are mean values required to break one mole of bonds homolytically at ideal gasstate at 1 atmosphere and 298.15K, i.e. RnM(g) → M(g) + nR·(g); ∑de / n = De
In general, bond strength decreases as a group is descended.
Those organometallic compounds, which are not met in the environment, are oftenunstable for reasons other than thermal instability at normal temperatures.

Science Report – Production gas production from landfilling of inorganic wastes 131
Table C3 Stability of methylmetals to oxygen at room temperature1
Stable2 Unstable(CH3)2Hg (CH3)2Cd(CH3)4Si (CH3)3M (M = B, Al, Ga, In, Tl)(CH3)4Ge (CH3)3M (M = As, Sb, Bi)(CH3)4Sn (CH3)2AsH(CH3)4Pb CH3AsX2(CH3)HgX CH3SbX2
(CH3)4-nSnXn (CH3)4-nSnHn(CH3)3PbX(CH3)2PbX2
(CH3)2S(CH3)2Se
Notes: 1 Craig (1986)2 Stable against rapid oxidation over a timescale of seconds to minutes.
In general, there is an increasing susceptibility to oxidation as a main group isdescended. Assume that ethyl compounds would be less stable than methyl.
General comments on stability against hydrolysis:
• R2Hg, R4Sn, R4Pb = only slightly soluble, stable, diffuse to atmosphere.Higher alkyls less and less volatile
• (CH3)2As+, (CH3)3Pb+, (CH3)As2+ = hydrolyse
Table C4 Standard molar enthalpies of formation for HnM compounds ofenvironmental interest1
Element ∆Hf (kJ mol–1)Group III (n = 3)
B +100.0Al –Ga –In –Tl –
Group IV (n = 4)C –74.4Si +34.3Ge +90.8Sn +162.8Pb –
Group V (n = 3)N –45.9P +5.4As +66.4Sb +145.1Bi –
Group VI (n = 2)O –241.8S –20.6
Se +29.7Te +99.6Po –
Notes: 1 Lide (1994). 298.15K and 100kPa (1 bar); all as gas unless otherwise stated.

132 Science Report – Production gas production from landfilling of inorganic wastes
Table C5 Standard molar enthalpies of formation for some other compounds ofenvironmental interest1
Species ∆Hf (kJ mol-1)Ni(CO)4 –602.9 (g), –633.0 (l)Fe(CO)5 –774(l)Mo(CO)6 –912.1 (l), –982.8 (s)
SF6 –1220.5CH3I +14.7
Notes: 1 Lide (1994)
ReferencesCraig P J (1986) Occurrence and pathways of organometallic compounds in theenvironment – general considerations. In Organometallic Compounds in theEnvironment, Principles and Reactions (ed. P J Craig), pp. 1-58. Harlow: Longman.
Lide D R (editor-in-chief) (1994) CRC Handbook of Chemistry and Physics (75th edn.).Boca Raton, FL: CRC Press.

Science Report – Production gas production from landfilling of inorganic wastes 133
Appendix D: Methodology forscoping calculations to estimateoxygen consumption andhydrogen production inunsaturated and saturated landfillsThe redox conditions in a landfill containing metal residues will affect the gas generationprocesses. Hydrogen generation will be an important determinant of whether a landfill isanaerobic because:
• it is the bulk gas most likely to displace the initial inventory of air from thelandfill;
• it will balance the slow ingress of air into the waste through the engineeredbarriers.
Preliminary calculations were performed to investigate the effect of metal corrosion onthe evolution of the redox conditions of a landfill facility and the potential for hydrogengas production. Calculation were performed for:
• an unsaturated landfill facility filled with waste and initially aerobic;
• a saturated landfill facility filled with waste and initially aerobic.
The results of the calculations are described in Section 6.
The methodology used and the assumptions required for each calculation are describedbelow. In all cases, the calculations relate to the period after emplacement of the wasteand capping of the landfill cell. No allowance is made for displacement of oxygen by anygases produced in the landfill.
Unsaturated landfill facilityAssumptions
• The landfill is initially aerobic and filled with waste.
• Oxygen ingress occurs only through the cap and the rate of ingress can becalculated from typical emission properties for a good permanent capping(10-3 mg m-2s-1) (A. Rosevear, personal communication).
• Oxygen transport through the waste voidage is rapid compared withtransport through the cap and the mild steel corrosion rate.
• There is sufficient moisture present to maintain a film of water on corrodingsurfaces.
• The formation of corrosion products does not affect the rate of corrosion.
• All ferrous metal in the waste is assumed to be present as mild steel andappropriate corrosion rates can be applied.

134 Science Report – Production gas production from landfilling of inorganic wastes
• The aerobic corrosion rate for mild steel is assumed to be proportional to thepartial pressure of oxygen present.
• The specific area of the mild steel in the waste can be represented by asingle value that remains constant.
• The production of hydrogen gas does not impede the ingress of oxygen.
MethodologyFor the above assumptions, the rate of change of oxygen concentration in the wastevoidage is given by:
( )pAKpKpKVpdt
dcmatm
LFatm211
1−−= , D1
where:
c is the gas phase oxygen concentration in the waste voidage;
t is the time;
p is the partial pressure of oxygen in the waste voidage;
patm is the atmospheric partial pressure of oxygen;
VLF is the volume of the landfill voidage;
K1 is the rate of oxygen ingress/egress expressed as the mass of oxygenentering the landfill per unit time (this rate is assumed to be proportional tothe partial pressure of oxygen);
K2 is the corrosion rate of mild steel under aerobic conditions expressed as themass of oxygen consumed per unit area of corroding metal per unit time, atp = patm;
Am is the area of the corroding metal in the waste.
The steady-state partial pressure of oxygen (pss) is derived by assuming that the rate ofchange of oxygen concentration is zero, giving:
atmm
ss pAKK
Kp
21
1
+= . D2
When K1 is much greater than K2Am, oxygen ingress dominates and the landfill remainsaerobic. When K1 is much less than K2Am, corrosion dominates, the partial pressure ofoxygen tends to zero and the landfill becomes anaerobic. When K1 and K2Am arecomparable, the steady-state partial pressure of oxygen can be calculated from equationD2.
The value of K1 has been derived from the second assumption above. The corrosion rateper unit area K2 is given by:
kzK =2 , D3
where:
k is the corrosion rate expressed as the thickness corroded per unit time;
z is the mass of oxygen consumed per unit volume of mild steel corroded.
An example of the values of the parameters used and the calculated rates and steadystate partial pressure of oxygen are given in Table 6.1.

Science Report – Production gas production from landfilling of inorganic wastes 135
Calculation of timescale and hydrogen evolution profilesFor the case where K1 is much less than K2Am, an estimation of the time for the landfill tobe come anaerobic can be made for the assumption that oxygen ingress and egress canbe neglected. Under these conditions equation D1 becomes
atmLF
m
pp
VAK
dtdc 2−= , D4
or:
0
2
cc
VAK
dtdc
LF
m−= , D5
where:
c0 is the initial gas phase oxygen concentration in the waste voidage,corresponding to the atmospheric partial pressure of oxygen.
Integrating gives
−= t
cVAKcc
LF
m
0
20 exp . D6
If it assumed that the landfill facility becomes anaerobic when the partial pressure ofoxygen drops to 0.1 per cent of its initial value (i.e. c/c0 = 0.001), then the time taken foranaerobic conditions to be achieved is given by:
m
LFean AK
cVt
2
0
10001
−= log . D7
Saturated landfill facilityAssumptions
• The landfill is saturated due to water ingress.
• Oxygen transport to corroding surfaces is limited by diffusion through waterand is characterised by the free water oxygen diffusion coefficient. Oxygentransport by mixing due to convection or other process is assumed not tooccur.
• The top layer of the landfill contains oxygen-saturated leachate at all times.
• Layers below the top layer contain oxygen-saturated leachate initially.
• Layers below the top layer contain corroding metal.
• The formation of corrosion products does not affect the rate of corrosion.
• All ferrous metal in the waste is assumed to be present as mild steel andappropriate corrosion rates can be applied.
• The rate of oxygen consumption by aerobic corrosion of mild steel isproportional to the oxygen concentration in the porewater.
• The specific area of the mild steel in the waste can be represented by asingle value which remains constant.

136 Science Report – Production gas production from landfilling of inorganic wastes
MethodologyThe concentration and time dependence of diffusion are characterised by Fick’s SecondLaw. For diffusion in one dimension, this states:
2
2
dxCdD
dtdC
= , D8
where:
C is the aqueous concentration of the diffusing species;
x is the distance;
D is the free water oxygen diffusion coefficient.
Numerically the change in concentration at a given point and time can be calculated for asuitable time interval ∆t and distance L corresponding to the thickness of the layerconsidered. The change in concentration at any time step and position is then given by:
( )t
LCCD
C nn ∆−
=∆ −21 , D9
where:
Cn-1 and Cn represent the aqueous concentrations in adjacent layers.
Similarly the change in concentration due to corrosion can be calculated for a given layerand time interval from:
tCC
VkzAC
satLF
m ∆=∆ . D10
The parameters k, z, Am, and VLF are defined above in the methodology for anunsaturated landfill. The factor C/Csat is required because the corrosion rate constant (k)is assumed to be measured under saturated aerobic conditions (i.e. C = Csat). Theimplicit assumption is that the overall rate of corrosion is proportional to the oxygenconcentration.
A spreadsheet calculation was set up using ten layers, with the boundary conditionsdefined in the second to fifth assumptions above. For each layer and time step, thereduction in concentration due to corrosion was calculated using equation D10. The newconcentrations in each layer were then used to calculate the flux of oxygen betweenlayers due to diffusion using equation D9. This process was repeated for a given numberof time steps.
Verification of numerical procedureThe numerical methodology was verified for diffusion by comparison with an analyticalsolution to the diffusion equation. Corrosion was not represented (except that theconcentration at a bounding surface was fixed at zero representing an idealisedaerobically corroding surface that removes all oxygen that reaches it). The full boundaryconditions were:
C(x,0) = Csat,
C(0,t) = 0,
where:
C(x,t) represent the aqueous concentration of oxygen at distance x and time t.
The analytical solution (de Marsily 1986) is given by:

Science Report – Production gas production from landfilling of inorganic wastes 137
=
DtxCC sat 4
erf . D11
The numerical results gave very good agreement with the analytical solution as shown inFigure D1.
Referencesde Marsily G (1986) Quantitative Hydrology: Groundwater Hydrogeology for Engineers.London: Academic Press.

138 Science Report – Production gas production from landfilling of inorganic wastes
Figure D1 Depletion of oxygen as a function of time and distance – comparison of numerical and analytical results
D = 2 10-9 m2s-1, Boundary conditions: C =0 at L=0, Csat = 0.0408 kg m-3 at t=0 and L>0
0
0.005
0.01
0.015
0.02
0.025
0.03
0.035
0.04
0.045
0 0.02 0.04 0.06 0.08 0.1 0.12 0.14 0.16 0.18 0.2
L/ m
C(O
2)/ k
g m
-3
0200,000400,000600,000800,0001,000,0000200,000400,000600,000800,0001,000,000
Profiles at various time/ secondssymbols: numerical resultscurves: analytical results

Science Report – Production gas production from landfilling of inorganic wastes 139
Appendix E: Detection of gaseoustrace species likely to be presentin inorganic landfill gas by gasindicator tube (Matheson Tri-Gas)Table E1 lists species of possible interest that may be detected using tubes from onecommercial source (Matheson Tri-Gas 2005), the measurement ranges and the potentialinterferences.
ReferencesMatheson Tri-Gas (2005) Detector tube listing for Matheson-Kitagawa toxic gas detectorsystem. Matheson Tri-Gas Technical Bulletin 102-1 Issue 3, downloaded as Model 8014Kitagawa Tube List from Literature Centre/Speciality Gases & Equipment,http://www.matheson-trigas.com [Accessed August 2005].

140 Science Report – Production gas production from landfilling of inorganic wastes
Table E1 Gas indicator tube detection of gaseous trace species likely to be present in inorganic landfill gas1
Species Typical concentration2 in gasfrom existing landfills (orother experiments3 (g m-3)
Measuring range Likely interferences
Group VIIINi(CO)4 (5 × 10⁻⁷ To 1 × 10⁻⁶) 20 ~ 700 ppm Arsine, iron carbonyl, mercury vapour, H2S or SO2 (10), CO
(1,000)Group IIbHg vapour 9 × 10⁻⁷
1 × 10⁻⁸ to 1 × 10⁻⁵ 0.5 ~ 10, 0.1 ~ 2 mg m-3 HCl(0.5), NO2(0.1), Cl2(0.1), H2S (0.5)
Group IIIbDiborane 0.1 ~ 5, 0.05 ~ 2.5, 0.02 ~ 1
ppm Arsine, phosphine, silane, disilane
Group IVbSimplehydrocarbonsexcluding methane(acetylene used asexample)
50 ~ 1000 ppm Olefins(10), H2S(10), CO(50), NH3, butadiene(25), HCN, Cl2,NO2, CS2, benzene,
CO 6 × 10⁻³ (median) 25 ~ 1000, 5 ~ 300 ppm Ethylene (5,000), H2 (5,000), acetylene, SO2 or NO2 (at 0.2×CO)10 ~ 250 ppm Acetylene(5), H2S (20), SO2 (0.2×CO), NO2 (0.1×CO)
20 ~ 1,000, 5 ~ 50 ppm Ethylene or H2 (5,000), acetylene (0.2×CO), SO2 (0.2×CO), NO2(0.2×CO)
1 ~ 50 ppm SO2, NO2 or acetylene (0.02×CO), ethylene (1,000)
0.1 ~ 2% Propane (0.15%), iso-butane (0.2%), hexane (0.1%), acetylene(0.3%), ethylene (0.15%)
30 ~ 500 ppm Acetylene (0.05×CO), SO2 (0.5×CO), NH3 (100×CO), H2S(0.5×CO)
0.1 ~ 10%, 0.2 ~ 20% Propane, iso-butane, acetylene, ethylene, hexaneCOCl2 - 0.5 ~ 20, 0.1 ~ 0.5 ppm Cl2(5), HCl (10), NO2(100) SO2 (0.2%)HCN - 2 ~ 100, 0.5 ~ 25 ppm SO2 (1), H2S (3), NH3 (5)
0.01 ~ 3% Acetone, CS2, SO2 (200), H2S (100) DicyanideSilane - 1 ~ 50, 0.5 ~ 25 ppm PH3 (20) arsine(50), disilane(2), diborane(20)

Science Report – Production gas production from landfilling of inorganic wastes 141
Table E1 (cont’d) Gas indicator tube detection of gaseous trace species likely to be present in inorganic landfill gas1
Species Typical concentration2 in gasfrom existing landfills (orother experiments3 (g m-3)
Measuring range Likely interferences
Group Vb
NO2 - 20 ~ 1000 ppm Cl2, Br2, I2 or ozone(5), NO (10)
0.5 ~ 30 ppm Cl2, Br2, or I2 (2), NO (15)
0.1 ~ 1 ppm Ozone(2), SO2(7), Cl2(3)
Nitrogen oxides 20 ~ 250 ppm SO2(100), HCl(1000)
100 ~ 2500 ppm HCl(500)
0.5 ~ 15, 15 ~ 30 ppm H2S(5), HCl(500)
NH3 - 0.5 ~ 10% Amines
50 ~ 900 ppm SO2 (0.25×NH3), Cl2(2), amines
10 ~ 260, 5 ~ 130 ppm SO2 (0.33×NH3), Cl2(2), amines
1 ~ 20, 0.1 ~ 1 ppm amines
0.5 ~ 30% H2S (3,000)
0.1 ~ 1% Amines
Amines (forexample of N(CH3)3
- 1 ~ 20 ppm NH3, other amines
PH3 3 × 10⁻⁶ to 3 × 10⁻⁷ 20 ~ 700 ppm Arsine(30), hydrogen selenide (50), H2S (40)
1~ 20, 0.5~ 10, 0.25 ~ 0.5ppm NH3(60), arsine, H2Se, nickel carbonyl
0.1 ~ 0.2, 0.05 ~ 0.1 ppm Hydrogen selenide, mercaptans, H2S, HCN, SO2, arsine
AsH3 7 × 10⁻⁸ 5 ~ 160 ppm H2S (≥5 ppm), H2Se (≥5 ppm), PH3 (≥5 ppm)
0.05 ~ 2ppm H2Se, mercaptans, H2S, HCN, SO2

142 Science Report – Production gas production from landfilling of inorganic wastes
Table E1 (cont’d) Gas indicator tube detection of gaseous trace species likely to be present in inorganic landfill gas1
Species Typical concentration2 in gasfrom existing landfills (orother experiments3 (g m-3)
Measuring range Likely interferences
Group VIb
H2S 3 × 10⁻² to 6 × 10-1* 6 ~ 300, 3 ~150, 1 ~ 50, 0.57~ 37.5 ppm SO2 (12), mercaptans (550), NO2 (2)
0.005 ~ 0.16% CO (10), ethylene, propylene, butylene, acetylene or methylmercaptan (5), HCN, NH3
1 ~ 30, 2 ~60 ppm SO2 (10), mercaptans (300), NO2 (2)
2 ~40, 1~ 20, 0.5 ~10 ppm Phosphine, mercaptans, NH3, NO2
50 ~ 1000, 100 ~ 2000 ppm SO2 (5,000), mercaptans
0.1 ~ 4% SO2 (0.5%)
0.05 ~ 0.6 0.1 ~ 1.2% SO2 (0.5%)
0.2 ~ 3, 0.4 ~ 6 ppm Arsine, hydrogen selenide, mercaptans, phosphine, HCN, SO2
2 ~ 20% SO2
5 ~ 40%, 2.5 ~ 5% SO2 (8%)
SO2 - 0.1 ~ 3% H2S (400)
0.02 ~ 0.3% H2S (100)
20 ~300 ppm Cl2 (0.2×SO2), NO2 (100), H2S (100×SO2)
1 ~ 60 ppm NO2 (1×SO2), Cl2 (2×SO2)
0.5 ~ 10, 0.25 ~ 5 ppm NO2, HCl
0.02 ~ 0.3% H2S (100)
H2SO4 - 0.5 ~ 5 mg m-3 HCl, HF, NO2, nitric acid, Cl2

Science Report – Production gas production from landfilling of inorganic wastes 143
Table E1 (cont’d) Gas indicator tube detection of gaseous trace species likely to be present in inorganic landfill gas1
Species Typical concentration2 in gasfrom existing landfills (orother experiments3 (g m-3)
Measuring range Likely interferences
CS2 1 × 10⁻³ to 2 × 10-1* 2 ~ 50, 0.8 ~ 20 ppm H2S (120), SO2, Cl230 ~ 500 ppm H2S (400), SO2, Cl2
COS - 5 ~ 60 ppm SO2 (0.2×COS), CS2 (0.1×COS), H2S (0.5×COS), C4H9 (0.1%)
H2Se - 5 ~ 600, 1 ~100 ppm Arsine (10), H2S, iron carbonyl (10), SO2, Hg, acetylene (3%),CO (0.1%), nickel carbonyl (10)
Group VIIb
Hydrogen chloride - 20 ~ 600, 40 ~1,200 ppm SO2, Cl2- 4 ~ 40, 2 ~ 20, 0.4 ~ 4 ppm Cl2
Hydrogen fluoride - 0.5 ~ 30, 0.25 ~ 15 ppm Cl2, HCl
Bromine - 1 ~ 20 ppm Cl2 (1), ClO2, NO2
Chlorine - 1 ~ 40 ppm Br2 (1), Cl2O (1), NO2 (0.5×Cl2)
- 0.5 ~10, 0.125~ 0.5, 0.1 ~0.5 ppm Br2 (1), Cl2O (1), NO2 (0.25×Cl2), NCl3(5)
- 0.1 ~ 2, 0.05 ~ 1 ppm HCl (20×Cl2), NO2
ClO2 - 1 ~ 20 ppm Br2, Cl2 or NO2 (1)
CH3I - 5 ~ 40 ppm H2S (7), n-hexane (500), acetone (700), benzene (2), toluene(2), xylene (2), halogenated hydrocarbons
Notes: 1 Matheson Tri-Gas (2005)2 Concentrations as the elements unless otherwise noted by * (* =concentration of molecular species)3 (Other experiments) denoted in brackets are for gas samples taken from above incubated sewage sludge or M. formicicum cultures in laboratory experiments**or gas sampled from sewage treatment plants***

144 Science Report – Production gas production from landfilling of inorganic wastes
We are The Environment Agency. It's our job to look afteryour environment and make it a better place – for you, andfor future generations.
Your environment is the air you breathe, the water you drinkand the ground you walk on. Working with business,Government and society as a whole, we are making yourenvironment cleaner and healthier.
The Environment Agency. Out there, making yourenvironment a better place.
Published by:
Environment AgencyRio HouseWaterside Drive, Aztec WestAlmondsbury, Bristol BS32 4UDTel: 0870 8506506Email: [email protected]
© Environment Agency
All rights reserved. This document may be reproduced withprior permission of the Environment Agency.