Potential connections between atmospheric rivers in China ...
18
Potential connections between atmospheric rivers in China and Australia Lin Xu A , Huqiang Zhang B,F , Weiwei He C , Chengzhi Ye A , Aurel Moise B,D and Jose ´ M. Rodrı ´guez E A Hunan Meteorological Service, Changsha, Hunan, China. B Bureau of Meteorology, GPO Box 1289k, Melbourne, Vic. 3001, Australia. C Spic Energy Techonology & Engineering Company, Shanghai, China. D Centre for Climate Research Singapore, Meteorological Service Singapore, Singapore. E Met Office, FitzRoy Road, Exeter, Devon, EX1 3PB, United Kingdom. F Corresponding author. Email: [email protected] Abstract. Results from a collaborative project between the Australian Bureau of Meteorology and China Meteorological Administration found that atmospheric rivers (ARs) can occur simultaneously in East Asia and Australia. Furthermore, ARs and the Northwest Cloud Band in the Australia region tend to reach their peaks during austral cool season (May–August). At the same time that the Asian summer monsoon develops and its meridional moisture transport and AR activities intensify. This has prompted us to explore potential connections of ARs in the two regions. In this study, we firstly analysed two ARs and their mechanism that occurred in China and Australia in June 2016, which caused significant rainfall in both countries. We then explored the atmospheric circulation background for such AR connections. From this case study, we show that ARs originating from the tropical Indian and Pacific oceans can become bifurcated through Indo-Pacific inter-basin interactions. The position of the bifurcation appears to depend on the location and intensity of Western Pacific Subtropical High (WPSH), the subtropical high in the Australian region and the middle-latitude storm track migration in the southern hemisphere. Moreover, by analysing bifurcated AR events from the past two decades, we show that they are more likely to occur during boreal summer months. Most of the bifurcations occurred in the boreal summer following the decaying phase of an El Nin ˜oin its preceding winter, due to a delayed El Nin ˜o Southern Oscillation influence on the WPSH and a subtropical high in the Australian region. Our research further demonstrates the value of applying AR analysis in improving our understanding of the weather and climate in the Australia–Asian monsoon region. Keywords: atmospheric river; bifurcation; atmospheric circulation anomalies, El Nin ˜o, extreme rainfall, Northwest Cloud Band, Western Pacific Subtropical High. Received 30 April 2019, accepted 22 January 2020, published online 17 September 2020 1 Introduction The Australia–Asian (A–A) monsoon is an important part of the global monsoon system and provides a link between climate in the Asian region with that in Australia (Zhang and Zhang 2010; He 2015; Zhang and Moise 2016; Zhang et al. 2017; Yang et al. 2019). Numerous studies have demonstrated that precipitation in the A–A monsoon region is the direct product of moisture transport from tropic warm oceans into the extratropics (Huang et al. 1998; Simmons et al. 1999; Ding 2004; Zhou and Yu 2005; Li and Zeng 2005; Chen and Huang 2007; Zhang 2010; Chen and Guan 2016). In the East Asia region, it is well-known that the Asian summer monsoon (roughly from May to September) has three favorable channels for tropical atmospheric moisture being transported into the region: (i) the southwesterly flow from the Bay of Bengal and tropical Eastern Indian Ocean, (ii) the cross-equatorial flow from the South China Sea, and (iii) the southeasterly flow from the western flank of the Western Pacific Subtropical High (WPSH) (Chen et al. 1991; Chang 2004; Ding 2004; Wang 2006; Chen et al. 2020; Ye et al. 2020). When the Asian monsoon receives its heavy rainfall during the boreal warm season, the Australian region in the southern hemisphere experiences its cool season (austral winter). During this period, tropical Australia also experiences its dry season, with most rainfall occuring in the southwestern and southeastern parts of the continent (Nicholls et al. 2012; Risbey et al. 2013). Understanding the moisture source for supporting rainfall during this period has also drawn significant attention in the last decade. Although the middle-latitude storm track and its variations have played a significant role in explaining rainfall interannual variations and recent rainfall trends in southwest Australia (Frederiksen and Frederiksen 2007), studies have also CSIRO PUBLISHING Journal of Southern Hemisphere Earth Systems Science, 2020, 70, 36–53 https://doi.org/10.1071/ES19027 Journal compilation Ó BoM 2020 Open Access CC BY-NC-ND www.publish.csiro.au/journals/es RESEARCH FRONT
-
Upload
khangminh22 -
Category
Documents
-
view
0 -
download
0
Transcript of Potential connections between atmospheric rivers in China ...

Potential connections between atmospheric rivers inChina and Australia
Lin XuA, Huqiang ZhangB,F, Weiwei HeC, Chengzhi YeA, Aurel MoiseB,D andJose M. RodrıguezE
AHunan Meteorological Service, Changsha, Hunan, China.BBureau of Meteorology, GPO Box 1289k, Melbourne, Vic. 3001, Australia.CSpic Energy Techonology & Engineering Company, Shanghai, China.DCentre for Climate Research Singapore, Meteorological Service Singapore, Singapore.EMet Office, FitzRoy Road, Exeter, Devon, EX1 3PB, United Kingdom.FCorresponding author. Email: [email protected]
Abstract. Results from a collaborative project between the Australian Bureau of Meteorology and China MeteorologicalAdministration found that atmospheric rivers (ARs) can occur simultaneously in East Asia and Australia. Furthermore, ARs
and the Northwest Cloud Band in the Australia region tend to reach their peaks during austral cool season (May–August). Atthe same time that the Asian summer monsoon develops and its meridional moisture transport and AR activities intensify.This has promptedus toexplorepotential connectionsofARs in the two regions. In this study,we firstly analysed twoARsandtheir mechanism that occurred in China and Australia in June 2016, which caused significant rainfall in both countries. We
then explored the atmospheric circulation background for such AR connections. From this case study, we show that ARsoriginating from the tropical Indian and Pacific oceans can become bifurcated through Indo-Pacific inter-basin interactions.The position of the bifurcation appears to depend on the location and intensity ofWestern Pacific Subtropical High (WPSH),
the subtropical high in the Australian region and the middle-latitude storm track migration in the southern hemisphere.Moreover, by analysing bifurcated AR events from the past two decades, we show that they are more likely to occur duringboreal summermonths.Most of the bifurcations occurred in the boreal summer following the decaying phase of anElNino in
its preceding winter, due to a delayed El Nino Southern Oscillation influence on the WPSH and a subtropical high in theAustralian region.Our research further demonstrates the value of applyingARanalysis in improving our understandingof theweather and climate in the Australia–Asian monsoon region.
Keywords: atmospheric river; bifurcation; atmospheric circulation anomalies, El Nino, extreme rainfall, Northwest
Cloud Band, Western Pacific Subtropical High.
Received 30 April 2019, accepted 22 January 2020, published online 17 September 2020
1 Introduction
The Australia–Asian (A–A) monsoon is an important part of theglobal monsoon system and provides a link between climate in theAsian region with that in Australia (Zhang and Zhang 2010; He
2015;ZhangandMoise 2016;Zhang etal.2017;Yang etal.2019).Numerous studies have demonstrated that precipitation in theA–Amonsoon region is the direct product of moisture transport from
tropic warm oceans into the extratropics (Huang et al. 1998;Simmons et al. 1999; Ding 2004; Zhou and Yu 2005; Li and Zeng2005; Chen and Huang 2007; Zhang 2010; Chen and Guan 2016).In the East Asia region, it is well-known that the Asian summer
monsoon (roughly from May to September) has three favorablechannels for tropical atmospheric moisture being transported intothe region: (i) the southwesterly flow from the Bay of Bengal and
tropical Eastern Indian Ocean, (ii) the cross-equatorial flow from
the South China Sea, and (iii) the southeasterly flow from the
western flank of the Western Pacific Subtropical High (WPSH)(Chen et al.1991;Chang2004;Ding2004;Wang2006;Chenet al.2020; Ye et al. 2020).When theAsianmonsoon receives its heavy
rainfall during the borealwarm season, theAustralian region in thesouthern hemisphere experiences its cool season (austral winter).During this period, tropical Australia also experiences its dry
season, with most rainfall occuring in the southwestern andsoutheastern parts of the continent (Nicholls et al. 2012; Risbeyet al. 2013). Understanding the moisture source for supportingrainfall during this period has also drawn significant attention in
the last decade. Although the middle-latitude storm track and itsvariations have played a significant role in explaining rainfallinterannual variations and recent rainfall trends in southwest
Australia (Frederiksen and Frederiksen 2007), studies have also
CSIRO PUBLISHING
Journal of Southern Hemisphere Earth Systems Science, 2020, 70, 36–53
https://doi.org/10.1071/ES19027
Journal compilation � BoM 2020 Open Access CC BY-NC-ND www.publish.csiro.au/journals/es
RESEARCH FRONT

highlighted the importance of tropical sea surface temperatures(SSTs) of the Indian andPacific oceans in generating rainfall either
through wave propagation (Cai et al. 2012) or through watervapour transport (Ummenhofer et al. 2011; Gao and Sun 2016).
Therefore, to better understand theA–Amonsoon systemand its
influence on the rainfall variations in the region, it is of paramountimportance to studydetailedcharacteristicsof atmosphericmoisturetransport associatedwithA–Amonsoondynamics. Thiswas clearly
highlighted in a comprehensive review by Stan et al. (2017) onresearch needed for advancing our understanding and forecasting oftropical–extratropical teleconnections. In particular, they pointedout the challenge for better understanding the role of dynamical
interactions that impact midtropospheric moisture. As reviewed byYe et al. (2020), the atmospheric river (AR) concept has started todraw significant attention in the scientific community in recent
years for diagnosing moisture transport in the A–A region (Hirotaet al. 2016;Yang et al. 2017).AnAR is a long, narrow and transientbelt-shaped channel of strong water vapour transport in the lower
atmosphere, usually originating from tropical oceans and closelyassociated with low level jet ahead of the cold front of anextratropical cyclone (American Meteorological Society 2019).ARs are responsible for most of the atmospheric water vapour
meridional transport (Zhu and Newell 1998; Gimeno et al. 2014);therefore they can play an important role in understanding rainfallvariations in the A–A region, where the climate is renowned for its
significantmeridionalwater vapour transport from the tropics to thesubtropics. Stan et al. (2017) further classified ARs as a category ofhigh-impact weather events, since they are characterised by highly
focused streams of precipitable water that are associated withextremeprecipitationalong theU.S.WestCoast andother locations.Most of the AR studies published so far have focused on North
America and western Europe (Dettinger 2013; Kim et al. 2013;Rivera et al. 2014; Rutz et al. 2014; Lavers and Villarini 2015;Warner et al. 2015; Gao et al. 2016; Brands et al. 2017), with onlylimited studies reporting AR results from the A–A region (Yue and
Li 2015, 2016; Sun et al. 2018; Chen et al. 2020) and theircontribution to strong precipitation in the monsoon climate(Dettinger 2013; Kim et al. 2013; Rutz et al. 2014; Warner et al.
2015).As part of an Australian Bureau of Meteorology (BoM) and
China Meteorological Administration (CMA) bilateral project on
ARanalyses in theA–Amonsoon region (Ye et al. 2020),Wu et al.(2020) reported climatological characteristics of the ARs reachingChina andAustralia based onmanual detections froma30-yearARdatabase. They documented AR mean climatologies, seasonality,
interannual variations and potential drivers in East Asia andAustralia. Results from that dataset showed that ARs in Chinaoccurredmore frequently in boreal summer (May–August). This is
also the peak season of ARs in most of the Australian region, but itis their cool season. SuchanARseasonality in theAustralian regionagrees well with the well-known feature of the Australian North-
west Cloud Band (NWCB), which has its peak in the austral coolseason too (Tapp and Barrell 1984; Wright 1997; Telcik andPattiaratchi 2014). The NWCB is a long and narrow band seen in
satellite weather images (typically extending over 2500km andexisting for two to fourdays), and it has a strong similarity to theARphenomenon. Its formation is attributed to tropical–extratropicalinteractions (Wright 1997). Frederiksen and Balgovind (1994) and
Frederiksen and Frederiksen (1996) further linked it with SSTgradients in the IndianOcean,which produce an enhanced influx of
warm tropical air from the northwest of Australia towards thecontinent. Furthermore, from the AR dataset developed in thisproject (Ye et al. 2020), Wu et al. (2020) found ARs can occur
simultaneously in both regions. All these results raise severalimportant questions: (i) why do the ARs in China and Australiatend to occur during the same period but in different seasons? (ii) is
there any connectionbetweenARs in the two regions? (iii)what arethe underlying processes leading to their potential connections?These questions became the focus of this study.
In this paper, we start with a detailed case study to reveal the
synoptic features of two ARs occurring simultaneously in Chinaand Australia and discuss the characteristics of these ARs.Following that, through statistical analysis of ARs with bifurca-
tion features in the A–A region during the last 20 years, weinvestigate the underlying processes leading to such results.Accordingly, the paper is structured as following. In Section 2
we introduce the analytical method and dataset used in thisanalysis. Section 3 provides results from the analysis of twoARsthat caused strong precipitation in China and Australia during17–22 June 2016. In Section 4, we assess the climatic back-
ground and underlying processes that link the ARs in China andAustralia. Finally, in Section 5, we summarise the main con-clusions from this study and discuss weaknesses in the current
analysis and some potential future work.
2 Data and analytical methods
In this analysis, conventional meteorological variables, includingzonal and meridional wind components, geopotential height,
atmospheric specific humidity and temperature, came from theJapanese 55-year Reanalysis (JRA-55) data (Ebita et al. 2011) forthe period of 1998 to 2017. These are 6-hourly fields with ahorizontal resolution of 1.258� 1.258. In the rainfall analysis, weused global daily precipitation data from the GPCP (Global Pre-cipitation Climatology Project) dataset developed by the ClimatePrediction Center (Xie et al. 2007). The rainfall data are at
0.58� 0.58 resolution (https://water.weather.gov/precip/down-load.php).
In the analysis, to explore the moisture sources of ARs
occurring in the A–A region, we used the backward HybridSingle Particle Lagrangian Integrated Trajectory (HYSPLIT) 4model developed by Air Resources Laboratory of NOAA(Draxler and Hess 1998). The datasets used in driving the
backward trajectory model were from the NCEP 6-hourlyglobal analysis data, with a horizontal resolution of 2.58� 2.58(Saha et al. 2014).
Given the importance of tropical SSTs in modulating theA–A monsoon climate and in determining the distribution andintensity of tropical moisture sources (e.g. Frederiksen and
Frederiksen 1996), the HadISST dataset (Rayner et al. 2003)from the UK Hadley Center at 18� 18 resolution (https://www.metoffice.gov.uk/hadobs/hadisst) was used to study the impacts
of tropical SST anomalies on the characteristics of moisturetransport in the A–A region. We used several key climateindices, including the Nino 3.4 and Indian Ocean Dipole(IOD), provided by the China National Climate Center
Potential connections between ARs in China and Australia Journal of Southern Hemisphere Earth Systems Science 37

(https://cmdp.ncc-cma.net/Monitoring/cn_index_130.php), fordiagnosing underlying drivers governing AR variations in the
region.The definition and detection of ARs in this study were the
same as those introduced by Ye et al. (2020). An AR is defined
in terms of vertically Integrated Vapour Transport (IVT) inkgm�1 s�1:
IVT ¼ 1
g
ðptoppsfc
qVdp ð1Þ
Here, g is gravitational acceleration, q is specific humidity,V is horizontal wind vector, p is atmospheric pressure, and psfcand ptop represent atmospheric pressure values at the surface andtop of the atmosphere, respectively. In practical application, it isgenerally integrated to 300 hPa (close to the tropopause).
Our study focuses on the simultaneous occurrences of ARs inboth Australia and East Asia, which we term ‘AR bifurcation’. Inthese cases, initial atmospheric moisture transport confined
within the tropical Indo-Pacific basin split into two separatebranches, propagating in different directions, with one towardsEast Asia and the other towards Australia. The bifurcating ARevents in this study needed to satisfy three conditions. Firstly, they
needed tomeet theARcriteria (Ye et al.2020),which is a longandnarrow corridor of strong IVT, bound by the positions of IVT¼ 250 kgm�1 s�1, with a maximum IVT$ 500 kgm�1 s�1, a
minimum length$ 1500 km and a length/width ratio$ 2; sec-ondly, the location where AR bifurcation occurred needed to bewithin the Indian–Pacific basin; and thirdly, the bifurcated ARs
needed to land simultaneously in East Asia (mainly China) and inthe Australian continent and produce precipitation over bothregions. There were 21 bifurcated AR events in 1998–2017, and
based on these 21 cases, we have assessed the climatic back-ground for their occurrence, as will be discussed in Section 4.
3 Bifurcated ARs in the A–A region: a case study
In this study, we first conducted a detailed synoptic case anal-ysis. Note that although Chen et al. (2020) already reported an
AR case study under this bilateral project, the focuses are dif-ferent. Chen et al. (2020) mainly compared details of ARstructures and characteristics of moisture transport in the A–A
region associated with ARs, whereas our analysis focused onexploring the connections between ARs in these two regions.We chose the period of 17–23 June 2016 as our case study for a
number of reasons. Firstly, during this period, a pair of ARsoccurred in China and Australia and brought heavy precipitationin both regions. Secondly, as aforementioned in the Introduction
section, results from Wu et al. (2020) found that ARs in Chinatended to peak during the boreal summer season, whereas ARsin Australia tended to peak during the same time but in its coolseason. Therefore, choosing the June 2016 boreal summer
(austral winter) case further allowed us to investigate why ARstend to share the same seasonality in Australia and China.
During 17–23 June 2016, both China and Australia experi-
enced significant precipitation (Fig. 1a). Heavy rainfall in Chinawas mainly concentrated in the middle and lower reaches of theYangtze River. More than 100mm of daily precipitation was
received in western Jiangsu, northeastern Anhui and northwest-ern Hunan provinces. This heavy rainstorm caused severe
flooding and considerable economic losses, with many fatalitiesand injuries (Cao and Zhang 2016). At the same time, heavyrainfall occurred in the western and eastern parts of Australia.During the early period of this event, heavy rainfall occurred in
Brisbane and nearby regions, where over 100mmof rainfall wasreceived on 19 June. This triggered flash floods in the states ofQueensland and New South Wales. Later, significant rainfall
was received in thewestern part of the continent from the Pilbararegion down to the south of the Great Victoria Desert and SouthAustralia. Although the rainfall intensity was weaker in the
western and southern regions than in the eastern part ofAustraliaand in China, the rainfall received from this single eventaccounted for over 1/3 of the whole seasonal rainfall totals forJune-July-August in these dry regions in the states of Western
Australia and South Australia (Fig. 1b).When examining 6-hourly IVT evolution during 17–23 June
2016 in the A–A region throughout this event, we noticed strong
IVTs in both East Asia and Australia (not shown). We furtherseparated their evolution roughly into two stages: (i) from 17 to
45N
Total rainfall (mm) 17–23/06/2016
100
80
50
30
25
20
15
10
5
30N
15N
EQ
15S
30S
45S60E 75E 90E 105E120E 135E150E
(a)
45N
Rainfall percentage to JJA seasonal sum
100
80
50
30
25
20
15
10
5
30N
15N
EQ
15S
30S
45S60E 75E 90E 105E120E 135E150E
(b)
Fig. 1. (a) Accumulated precipitation (mm) from 00 UTC 17 June to 00
UTC 22 June 2016 in the A–A region using the GPCP daily data (Xie et al.
2007). (b) Percentage (%) of the rainfall total for 17–22 June 2016 to the
seasonal total of June-July-August (JJA).
38 Journal of Southern Hemisphere Earth Systems Science L. Xu et al.

19 June and (ii) from 20 to 23 June. Fig. 2 shows the IVT derivedfrom the JRA55 reanalysis for the two stages. The first stage is
characterised by strong IVT through easterly trade winds in thewestern Pacific, which divided into two branches around 1508Eon the 18 June (Fig. 2a). As shown by the red arrows, one branch
bypassed the south side of the WPSH and then moved north-eastward through the SouthChina Sea into theYangtze andHuairivers. It converged with water vapour from the Indian Ocean
through the Indochina Peninsula by onshore monsoonal flow tothen feed over eastern China. The shape and magnitude of thisIVT branch in the East Asian region meet the AR criteria from
Guan and Waliser (2015) and Ye et al. (2020). This inland ARcontributed to heavy precipitation along the Yangtze RiverBasin. The second branch turned southward along the subtropi-cal high in the Coral Sea and Southwest Pacific, forming a
north–south AR over the eastern coast of the Australian conti-nent in Queensland and New SouthWales. The maximum valueof IVT was between 750 and 900 kgm�1 s�1 (Fig. 2a), which
contributed to heavy precipitation in the region during 17–19June. Note that during this first stage, a strong IVT belt wasevident in the southern Indian Ocean (west of the Australian
continent), but it had not yet reached the Australian continent.Meanwhile themoisture transport associated with the Somali jetwas largely confined in the Bay of Bengal region through
a monsoon depression. Therefore, we do not classify thesepatterns in the Indian Ocean as an AR bifurcation at this stage.
The second stage started on 20 June, when meridional watervapour transport in the Indian Ocean was strengthened and
moved eastward. Near 958E, the IVT belt split into two brancheson the 21 June (Fig. 2b). One branch propagated northeastwardthrough the Bay of Bengal and joined water vapour carried over
by theWPSH in the western Pacific Ocean. This strong IVT beltfurther enhanced the inland rainfall over eastern China and
produced heavy precipitation in the Anhui Province on 20 Juneand Jiangsu Province on the 21 June. The other branch propa-
gated southeastward into the west of Western Australia. It wasfurther strengthened during its development and formed anorthwest–southeast AR across the continent. Meanwhile, the
AR along the eastern coast of Australia moved southeastwardinto the Tasman Sea and southwest Pacific (Fig. 2b), and theprecipitation in eastern Australia weakened significantly. The
trans-Australia AR moved out of Australia on 23 June. Duringthis process, significant precipitation was observed for four daysin western and southern parts of Australia from 20 to 23 June
2016.The main differences between these two stages were that at
stage one, ARs in the Indian Ocean and in the Western Pacificwere separate entities, whereas at stage two, the branches of
moisture transport in the Asian region (one in the Bay andBengal and the other in the western Pacific Ocean) merged toform a strong AR in the East Asian region. At the same time, an
AR landed in the Australian continent by strong moisture inputfrom the tropical Indian Ocean. These two stages demonstratethe linkage and interactions between atmospheric moisture
transport in the Indian and Pacific basins, which will bediscussed further.
Fig. 3 further displays detailed synoptic features and large-
scale circulation background causing such AR bifurcations.Fig. 3a shows the results for the first stage at 00 UTC 19 June2016. It includes low tropospheric circulation patterns repre-sented by 850 hPa streamlines and the position of theWPSH and
its southern hemispheric counterpart in the Coral Sea andSouthwest Pacific. Our particular attention to the WPSH in thisanalysis is due to the fact that it plays a critical role in
determining the orientation and intensity of moisture transportin the East Asian summer monsoon (Chen et al. 1991; Chang
30N
IVT: 2016–06–18:1200 UTC
EQ
30S
30N
10001000
EQ
30S
30E 60E 90E 120E
0 100 200 300 400 500 600 700 800 900 1000 1100
150E 180 30E 60E 90E 120E 150E 180
(a) IVT: 2016–06–21:0000 UTC(b)
Fig. 2. Vertical IVT (kgm�1 s�1) on (a) 12 UTC 18 June 2016 and (b) 00 UTC 21 June 2016. Vectors show the zonal and meridional
components of IVT, and the shaded colours show the magnitude of the IVT vectors. The red arrows show the directions of the flow paths
associated with ARs in the region.
Potential connections between ARs in China and Australia Journal of Southern Hemisphere Earth Systems Science 39

2004;Wang et al. 2013), as also found by the case study of Chenet al. (2020) in this project. At stage one, the WPSH was strong,
and its westward ridge point was near 1008E, which is muchmorewestward than its climatological position (around 1308E asshown in Fig. 4a). Meanwhile, its subtropical high counterpart
in the southern hemisphere occurred in the Coral Sea andsouthwest Pacific, with its 500 hPa west edge located around
1308E. As a result, the atmospheric circulation patterns associ-ated with these subtropical highs were favourable for the warmand wet tropical air being transported out of the equatorial
western Pacific towards China and eastern Australia. At850 hPa, the branch transported towards East Asia was furtherenhanced by the southwesterly monsoon flow that led to the
formation of a long and narrow band of moisture transport(meeting the AR criteria) over East Asia, as seen in Fig. 2a.Meanwhile, the northerly flow into the eastern Australian coastassociated with the subtropical high in the Coral Sea region was
further strengthened by a low-pressure system occupying theeastern part of the Australian continent and an anticyclonicsystem located over north Tasman Sea. This helped to produce a
long and narrow band of strong north–south water vapour on theeastern coast of Australia and form the AR shown in Fig. 2a.Considering that both ARs originated from the easterly trade
winds in the equatorial western Pacific, with one branch turningclockwise into East Asia and the other turning anticlockwiseinto the Australian region, we called this an AR bifurcation inwestern Pacific. Note that at that stage, a strong subtropical high
(known as theMascarene High) was centered around 408S, 708Ein the southern Indian Ocean west of the Australian continentand a deep trough approached towards the southwest of the
Australian continent.The circulation patterns for the second stage are illustrated by
results at 00 UTC 21 in Fig. 3b. The 850 hPa streamline and the
area with geopotential height above 588 geopotential decameter(gpdm) at 500 hPa, show that the subtropical WPSH in thenorthern hemisphere slightly weakened, retreated eastward and
was maintained near 1108E, whereas the subtropical high in theCoral Sea and southwest Pacific region extended more westwardto 1208E (Fig. 4b). At this stage, southwesterly monsoon flowedfrom the Indian Ocean to the west of the WPSH strengthened.
This helped to maintain a strong southwest–northeastward mois-ture transport from the tropics to the subtropics inEastAsia. In the
60N
m s–1
30
28
26
24
22
20
18
16
14
12
10
8
6
4
2
0000 UTC 19 June
30N
0
30S
60N
30N
0
30S
30E 60E 90E
0000 UTC 21 June
120E 150E 180
10
30E 60E 90E 120E 150E 180
(a)
(b)
10
Fig. 3. 850 hPa wind field at (a) 00 UTC 19 June 2016 and (b) 00 UTC 21
June 2016, with colours showing the magnitude of the wind speed (m s�1).
60N
(a) (b)0000 UTC 19 June 0000 UTC 21 June
30N
EQ
30S
60N
30N
EQ
30S
30E 60E 90E 120E 150E 180 150W 30E 60E 90E 120E 150E 180 150W
WPSH WPSH
Fig. 4. 588 gpdm area at 500 hPa (black lines with unit of gpdm) at (a) 00UTC 19 June 2016 and (b) 00UTC 21 June 2016, in comparisonwith the
climate mean of 588 gpdm (red lines with unit of gpdm).
40 Journal of Southern Hemisphere Earth Systems Science L. Xu et al.

southern hemisphere, the subtropical high in the southern IndianOcean moved eastward and penetrated the southern part of the
Australian continent. At the same time, a low system waspositioned in the eastern tropical Indian Ocean to the northwestof the Australian continent. This low system, together with the
westward extension of the subtropical ridge (STR) over northeastAustralia and the further inland penetration of themiddle-latitudetrough in the south, helped to form a strong moisture transport
channel from the northwest to southeast across thewestern part ofthe continent (Fig. 2b). The channel’s geometry and intensitysatisfied the AR requirement and was therefore classified as anAR event in the Australian continent. At the second stage, the
low-pressure systemseen at the first stage in the eastern part of theAustralian continent moved southeastward out of the continent,and the anticyclonic system in the Tasman Sea moved further
southeastward. Consequently, the AR in the eastern coast ofAustralia disappeared at stage 2. In summary, this stage wascharacterised by the southeastward penetration of tropical mois-
ture from tropical Indian Ocean into the Australian continentthrough anAR in itswest.Meanwhile, a strongmoisture transportoccurred northeastward from the Bay of Bengal across the Indo-china Peninsula into the East Asian region. We therefore classi-
fied this case as an AR bifurcation in the Indian Ocean.It should be pointed out that ARs appear as a corridor of
strong horizontal water vapour transport, but they do not
necessarily represent true trajectories of water vapour formation(Bao et al. 2006; Knippertz andWernli 2010; Dacre et al. 2015).Nevertheless, different moisture sources supporting ARs are
important for determining the rainfall efficiency of these mois-ture transport belts, with warm and moist air from the tropicsbeing more productive for heavy rainfall generation. Therefore,
we used theHYSPLITmodel developed byNOAA (Draxler andHess 1998) for airmass trajectory analysis of theARs in this casestudy. In the model, the height of airflow trajectory varies withlocation and time and therefore reflects the three-dimensional
variations of airflow in the process of transportation.In this analysis, the initial particle domains used to conduct
such backward tracking were selected over the areas where
heavy rainfall occurred. The trajectory analysis started at 7� 5grid points uniformly distributed across the selected domain(with 68 in longitude and 48 in latitude) and performed at three
initial heights of 500, 1500 and 3000m. Five-day backwardtrajectories are simulated from 00 UTC and 12 UTC for 21 June2019. In total, there were 210 trajectories corresponding to 35starting points at three levels and at two start times. The cluster
analysis method was then used to group these large number oftrajectories into dominant pathways to reflect the main channelsof moisture transport associated with the system.
Thewater vapour contribution rate of different pathways wasfurther calculated by the following formula:
Qa ¼Xm
i¼1Qi=
Xn
j¼1Qj
� �� 100% ð2Þ
whereQa is the contribution rate of each pathway,Qi andQj are
the water vapour flux at each trajectory that belongs to thatpathway,m indicates the number of trajectories contained in thepathway/cluster and n is the total number of trajectories.
The initial particle domain selected for the case in China wasover 30–348N, 116–1228Ewhere heavy rainfall occurred. Three
dominant water vapour pathways were identified by the clusteranalysis of 210 trajectories (Fig. 5a). The first one is the Bay ofBengal pathway (pathway A), where air particles mainly came
from the Somali and Indian Ocean cross-equatorial jets. Theyentered the rainstorm area through the Bay of Bengal andsouthwestern China. The second one is the South China Sea
pathway (pathway B), which carried air masses from the cross-equatorial flow in the eastern IndianOcean and transported themto the rainstorm area via the South China Sea. The third one isthe Pacific pathway (pathway C). It carried air masses though
the northeast trade winds from the western Pacific Ocean andthen turned northeast towards the rainstorm area. These threepathways are similar to the AR pathways found in Chen et al.
(2020) and are consistent with the three moisture channels in theEast Asian monsoon region documented in other studies(Ye et al. 2020). Fig. 5b further shows that the height of the
trajectories was mostly below 850 hPa. After approachingthe inland regions and the region where rainfall occurred, thealtitude of these trajectories increased due to the influence oftopography and interactions with cold air from the north.
Table 1 shows that for the AR over China, the number oftrajectories from pathway A and B was much higher than thatfrom pathway C. Pathways A and B together accounted for
about 90% of the total water vapour flux carried by this AR,whereas the contribution by pathway Cwas only 10%. Note thatthe three channels were all warm and humid (pseudo-equivalent
potential temperature, yse is large) because they all originatedfrom tropical oceans.
The initial particle domain used for of the backward
trajectory analysis for the Australian AR case on 21 June2019 was over 26–228S and 114–1208E where significantrainfall occurred (see ). Again, the trajectory analysis startedat 7�5 grid points uniformly distributed across the selected
domain and performed at three initial heights of 500, 1500 and3000m. Five-day backward trajectories were simulated from00 UTC and 12 UTC for 21 June 2019. The total 210 trajecto-
ries were grouped into three dominant water vapour pathwaysby cluster analysis (Fig. 5c). Air particles in pathway A fromthe eastern Indian Ocean appeared to be one of the dominant
pathways for moisture transport associated with the AR in thisregion. It accounted for over 36% of the total trajectories andcontributed to over 47% of the total water vapour by the AR(Table 1). Although air masses from pathway B originated
from the northwest inland region, they obtained a large amountof moisture when passing over the ocean surface into northwestof Australia. This pathway also played an important role in
feeding moisture into the AR and contributed about 1/3 of thetotal water vapour transport. Pathway C represents the influ-ence of the middle-latitude trough, with much cooler air
particles brought into the AR system, as shown in Fig. 2b.Table 1 further shows that the AR in the Australian region wasless warm and moist than the counterpart in China during the
Asian summer monsoon, with a much lower yse. This partlyexplains why the rainfall intensity associated with AustralianAR is weaker. This was also reported by Chen et al. (2020). Inaddition, Fig. 5d shows that pathway A largely remained at a
Potential connections between ARs in China and Australia Journal of Southern Hemisphere Earth Systems Science 41

height of around 850–800 hPa, whereas pathway B experi-enced a significant uplift from around 900 to 800 hPa when itreached the region with rainfall occurrence through the inter-
action with the middle-latitude front.Combining the trajectory analyses over China and Australia,
as shown in Fig. 3, the eastern part of the Indian Ocean was animportant moisture source for both ARs occurring in East Asia
and thewestern part of the Australian continent. The eastern partof the Indian Ocean was also the region where AR bifurcationoccurred, with one branch travelling northeastward toward East
Asia and the other southeastward across the western part of theAustralian continent. In the following section, we will explainthe likely underlying background processes leading to such ARbifurcations in the Indo-Pacific region.
30N
10S
20S
30S
40S
20N
10N
90E
600
650
700
750
800
850
900
950
1000
600
650
700
750
800
850
900
950
1000
100E
AB
C
Backward trajectories for the AR in China
Vertical variations of the trajectories in (a) Vertical variations of the trajectories in (c)
Backward trajectories for the AR in Australia
110E 120E 130E 100E 110E 120E 130E 140E
–5 –4 –3 –2 –1 0 –5 –4 –3 –2 –1 0
(a) (c)
(b) (d )
A B
C
Fig. 5. (a) Dominant pathways fromcluster analysis of 210 backward trajectory simulations for theAR case inChinawith the initial particle domain
of 30–348N, 116–1228E. The green line is pathway A, the red is pathway B and the blue is pathway C, as discussed in the text. (b) The vertical
variations of eachwater vapour pathway in (a) with the same colour scheme.The x-axis shows the backward tracking days from the time the backward
trajectory simulation started. (c, d) Corresponding results for the case in Australia with the initial particle domain of 26–228S, 114–1208E.
Table 1. Total number of tracks, contribution rate of water vapour flux and equivalent potential temperature (K) of each pathway shown in Fig. 5
Country Pathway Number of tracks Proportion of track
number (%)
Contribution rate of water
vapour flux (%)
Pseudo-equivalent potential
temperature (K)
China A 91 43.33 44.9 350.4
B 92 43.81 45.06 348.6
C 27 12.86 10.04 353.6
Australia A 76 36.19 47.34 328.1
B 55 26.19 33.63 328.6
C 79 37.62 19.03 319.2
42 Journal of Southern Hemisphere Earth Systems Science L. Xu et al.

4 Climatological backgroundof bifurcatedARevents in theA–A region
4.1 Connections between the WPSH and subtropical highin the Australian region
As pointed out in the Introduction, themain purpose of this studywas to explore connections of AR activities in the A–A region.From the case analysis in Section 3, we showed that the positions
and intensities ofWPSH and the subtropical high in the southernhemisphere are important for simultaneous occurrence of ARsin the two regions. Therefore, to investigate the large-scale
climatic background for the occurrence of such bifurcated ARs,we firstly explore connections between these subtropical highsin both hemispheres.
Variations of the WPSH have been extensively investigated
in East Asian monsoon studies (Chen et al. 1991; Chang 2004;Wang 2006; Wang et al. 2013). But, studies on the formationand variations of the subtropical high influencing the Australian
region in the southern hemisphere only started to increase inrecent years (Drosdowsky 2005; Williams and Stone 2009; Caiet al. 2011; Timbal and Drosdowsky 2013), following an early
study by Pittock (1971). Most of these studies showed theinfluence of the location and intensity of the STR in the regionon winter rainfall variations in Australia (e.g. Cai et al. 2011;
Timbal and Drosdowsky 2013). They also discussed the impactsof ENSO, IOD and the Southern Annular Mode (SAM) on theinterannual variations of the STR. Nevertheless, there is a lackof assessment of potential connections between the STR in the
Australian region and variations of the WPSH. Given theimportance of these two systems in shaping AR activities inthe A–A region, as revealed in our case study, we focused on
assessing such connections.Firstly, subtropical highs in the A–A region have remarkable
seasonal cycles. Fig. 6a and b show the averaged positions of a
subtropical high in the region represented by monthly mean sea
level pressure (MSLP) data. Results in March and August were
chosen because Williams and Stone (2009) showed that during
these two months, the ridge of the subtropical high in eastern
Australia has its most southward and northward migration,
respectively. During the austral summer season, the northern
part of the Australian continent is occupied by its summer
monsoon, and the ridge of Australian subtropical high is located
around 38–408S. The middle-latitude storm track is located
further poleward, south of the subtropical high. Due to such a
synoptic setup, a large part of the southern portion of the
Australian continent experiences its dry season of the year,
and the storm track and its weather disturbances find it difficult
to reach the continent. While in the austral winter season, with
the retreat of theAustralianmonsoon and the development of the
Asian summer monsoon in the north, the STR influencing the
Australian region moves equatorward, and the ridge of the high
system is now located around 308S. During this period, its
middle-latitude storm track moves northward and its middle-
latitude weather systems easily penetrate the Australian conti-
nent, interacting with the subtropical and tropical systems and
delivering significant rainfall in the southern part of the conti-
nent. Such a seasonal migration of the subtropical high in the
Australian region is clearly demonstrated by Fig. 6c, which
shows the seasonal cycle of MSLP averaged over the longitudi-nal range of 110–1558E for the Australian continent.
A remarkable feature shown in Fig. 6c and d is that such anorth–south migration of the subtropical high in the Australianregion is not only closely connected with the north–southward
movement of the subtropical high in the Coral Sea and South-west Pacific, but also the WPSH in the northern hemisphere.While we can expect to see such in-phase variations over the
Australian continent and over the Coral Sea and southwestPacific region, it is revealing that the seasonal variations ofthe subtropical high in the Australian region are also closelylinked to the seasonal variations of theWPSH. During the boreal
summer season, the WPSH moves northward along with thedevelopment of the Asian monsoon and the northward move-ment of the Intertropical Convergence Zone in the central
Pacific. This is also the time when the Australian subtropicalhigh moves northward further into the Australian continent. Asdiscussed in Section 3, the formation of ARs in the Asian
monsoon region were very closely linked to the position andintensity of the WPSH. At the same time, the formation of ARsin the Australian region and its NWCB required the interactionsof the middle-latitude cyclonic systems with the subtropical
high in the Australian continent (Frederiksen and Balgovind1994; Wright 1997). Therefore, such a close connectionbetween the subtropical highs in the western Pacific and in the
Australian region appears to be a key factor for the in-phase ARseasonal variations in the two regions.
TheWPSH has remarkable interannual variations in its east–
west and north–south positions (Chen et al. 1991; Wang 2006;Wang et al. 2013). Based on the calculations of standarddeviations of summer WPSH over 1979–2016, we found (not
shown) two regions with significant year-to-year variations: (i)over 35–558N, 150–2008E, and (ii) over 15–258N, 115–1508E.Accordingly, we have created two indices by averaging MSLPover these two regions to represent the WPSH interannual
variations. The north index is the averaged MSLP over 35–558N, 150–2208E and the west index is the averagedMSLP over15–258N, 115–1508E. The former represents variations of the
northward extension of WPSH and the latter representsthe variations of WPSH westward extension. The domain ofthe west index is the same one used inWang et al. (2013) in their
WPSH studies. Fig. 7 shows the correlations between theWPSHnorth andwest indices with theMSLP in theA–A region inMay,June and July. There were two reasons for choosing thesemonths. Firstly, the WPSH influencing the East Asian monsoon
has significant stepwise movement, which lead to its rainfall’snorthward migrations. Therefore, we could better assessmonthly WPSH variations during the course of the Asian
summer monsoon development. Secondly, May–July is alsothe period duringwhich the STR in theAustralian region retreatssharply towards the continent, as shown in Fig. 6c. It is also the
peak season for the NCWB occurrence in the Australian region,as discussed in Ye et al. (2020) and Wu et al. (2020). FromFig. 7a, c, e, we can see some notable correlations between the
northward extension of the WPSH and the pressure patterns inthe Australian region. The signal is particularly strong in Julywhen the WPSH has its northward jump in the western Pacific(Chen et al. 1991; Wang 2006). Results suggest that during the
Potential connections between ARs in China and Australia Journal of Southern Hemisphere Earth Systems Science 43
50N
40N
30N
20N
10N
EQ
10S
20S
30S
40S
50S
DEC
NOV
OCT
SEP
AUG
JUL
JUN
MAY
APR
MAR
FEB
JAN
50N
40N
30N
20N
10N
EQ
1DS
20S
30S
40S
50S60E 70E 80E 90E 100E 110E 120E
1008
50S 45S
1006 1008 1010 1012 1014 1015 1016 1017 1018 1006 1008 1010 1012 1014 1015 1016 1017 1018
40S 35S 30S 25S 20S 15S 10S 5S EQ
DEC
NOV
OCT
SEP
AUG
JUL
JUN
MAY
APR
MAR
FEB
JAN50S 40S 30S 20S 10S EQ 10N 20N 30N 40N 50N
1009 1010 1011 1012
MSLP (110–155°E)
MSLP March(a) (b)
(c) (d )
MSLP August
MSLP (135–200°E)
1014 1016 1018 1008 1009 1010 1011 1012 1014 1016 1018
130E 140E 150E 160E 170E 180E 170E 160W 60E 70E 80E 90E 100E 110E 120E 130E 140E 150E 160E 170E 180E 170E 160W
Fig. 6. Averaged MSLP (hPa) climatology from the ERA-Interim data for 1979–2016 in (a) March and (b) August. Seasonal cycle of averaged
MSLP across the longitudes of (c) the Australian continent (110–1558E) and (d) across the WPSH region (135–2008E).
44 Journal of Southern Hemisphere Earth Systems Science L. Xu et al.

years when the WPSH is located more poleward, the maritimecontinent and warm pool region and tropical Indian Ocean tend
to have low-pressure anomalies, which would favour strongertropical convections. Although discussing the causality betweenthe two is out of the scope of this study, there are studies that
show the influence of tropic deep convections on the northwardmigration of the WPSH (e.g. Liu et al. 2001; Sui et al. 2007; Liet al. 2009; Raghavan et al. 2012; Zheng et al. 2016).
In contrast to the results seen in Fig. 7a, c, e, there is aconsistent signal showing the connection between the westwardextension of the WPSH and the intensity of subtropical high inthe Coral Sea and southwest Pacific region (Fig. 7b, d, f). When
the WPSH is located further westward in the tropical westernPacific, there is also an enhanced subtropical high in the CoralSea to the east of the Australian continent. As shown in
Section 3, and in the analysis of Chen et al. (2020), the westwardextension of the WPSH is favourable for the moisture transportfrom the tropics into the East Asian monsoon region and the
formation of ARs embedded within the monsoonal onshoreflow. In addition, the case study in Section 3 and the analysis ofChen et al. (2020) underlined the importance of the subtropicalhigh in eastern Australia and over the Coral Sea for forming
ARs over the Australian continent. Although the analysis ofChen et al. (2020) already underlined the importance of theWPSH and Australian subtropical high for ARs in these two
regions, Fig. 7 further suggests that the close connectionbetween WPSH positions and the subtropical high over theCoral Sea and southwest Pacific is an important factor in
explaining the AR bifurcation in the A–A region.Based on the results in Fig. 7, we believe the westward
extension of WPSH and its close linkage with its southern
hemispheric counterpart in the Coral Sea and southwest Pacificare critical for the occurrence of AR bifurcations. To furtherexamine such a mechanism, in Fig. 8 we show linear correla-tions between the monthly WPSH west index and the monthly
IVT, calculated from the ERA-Interim data, for 1979–2016 forthe months fromMay to July. From these results, we can clearlysee that when thewest index ofWPSH is high, it corresponds to a
much more enhanced moisture transport through the southwest-erly Asian summermonsoon flow into the East Asian region andan enhanced moisture transport from the west flank of the
WPSH. Both lead to a long and narrow belt of strong moisturetransport with an AR structure in the East Asian region. At thesame time, the penetration of warm and moist air from tropicsinto the Australian continent becomes more evident. This
feature becomes much clearer in June and July as a strengthenedtransport band from the northwest towards the southeast. Thispattern is very similar to the ARs occurring over the Australian
region. Therefore, more westward extension of WPSH andenhanced subtropical high in the Coral Sea and southwestPacific region favour the simultaneous occurrence of ARs in
East Asia and Australia in the boreal summer (austral winter).Nevertheless, such correlation analyses in Figs 7 and 8
cannot answer the causality of the close variations between
the two subtropical highs. In this study, we have analysed a set ofUKMet Office UnifiedModel (UM) ‘‘nudging’’ experiments tohelp us better understand such connections. Nudging, or New-tonian relaxation, is a simple form of data assimilation that
adjusts dynamical variables of free running global climatemodels using meteorological re-analysis data to give a realistic
representation of the atmosphere at a given time (Dalvi 2014).The variables in the UM that can be currently nudged arehorizontal wind components and potential temperature (U and
V). The nudging code in the UM carries out two main opera-tions: (i) bringing the analysis data onto themodel grid as well astime; and (ii) relaxing the model dynamical variables to this
data.Milton (2018) used such experiments to study the source oferrors in the UM simulations through a series of nudgingexperiments over a range of domains (https://code.metoffice.gov.uk/trac/gmed/wiki/PEGs/NudgingGA7). In one of their
nudging experiments, a 20-year (1988–2007) UM version(known as GA7N96) was conducted using a 6-hourly nudgingof the model wind and temperature fields to ERA-Interim over a
large WPSH domain (160–2408E, 15–508N). By contrasting themodel differences between its default run and the nudged run,one can estimate the impacts of the model performance over the
WPSH on the climate outside that domain. Fig. 9 shows theaveraged June-July-August MSLP (colour) and 850 hPa hori-zontal wind (vector) differences between this nudge experimentand its default run for a 20-year model integration. From this
figure one can clearly see that when the model is dynamicallyand thermodynamically constrained over the WPSH throughwind and temperature nudging, there are significant responses
from the subtropical high in the southern hemisphere too. Notonly can the model simulate a much stronger WPSH than itsdefault run (not shown), but it also simulates a much stronger
subtropical high in the Australian region. Although the experi-ment was not particularly designed to explore the influence ofWPSH on the AR bifurcation in the Indo-Pacific region (and
there was not enoughmodel data available to us to diagnoseARsin these experiments), results presented in Fig. 9 do support ournotion that these two high systems are closely connected, and theUM nudging results tend to suggest the WPSH likely plays a
dominant role in affecting atmospheric circulation in the region.
4.2 Possible influence of tropical SSTs on the occurrence ofAR bifurcation
Following the June 2016 case study, we conducted a survey of
the ARs in the A–A region with bifurcation features from thepast 20 years (1998–2017). This allowed us to identify the cli-matic background for the occurrence of AR bifurcation in theIndo-Pacific region. Again, AR bifurcation is defined as such
that two ARs occurred simultaneously in China/East Asia andover the Australia continent and both produced significantrainfall in these regions. As shown in Table 2, for the 20-year
period, we found 21 bifurcated AR events, and there are severalnotable features in these results.
Firstly, the occurrence of such AR bifurcations had a strong
seasonality, and they were more likely to occur in June–July. Ofthe 21 cases, 18 occurred in June and July, two cases in Augustand one case inMay. This is consistent with the results discussed
above that such AR bifurcations were caused by the northwardand westward migrations of the WPSH and the retreat of theAustralian STR into the Australian continent during the borealsummer season.
Potential connections between ARs in China and Australia Journal of Southern Hemisphere Earth Systems Science 45

Cor North_Index Mon = 5(a)
(c)
(e)
(b)
(d )
(f )
70N
60N
50N
40N
30N
20N
10N
EQ
10S
20S
30S
40S
50S
60E 80E
–0.5 –0.4 –0.3 –0.2 –0.1 0.2 0.3 0.4 0.5
–0.5 –0.4 –0.3 –0.2 –0.1 0.2 0.3 0.4 0.5
–0.5 –0.4 –0.3 –0.2 –0.1 0.2 0.3 0.4 0.5 –0.5 –0.4 –0.3 –0.2 –0.1 0.2 0.3 0.4 0.5
–0.5 –0.4 –0.3 –0.2 –0.1 0.2 0.3 0.4 0.5
–0.5 –0.4 –0.3 –0.2 –0.1 0.2 0.3 0.4 0.5
100E 120E 140E 160E 180 160W 140W
60E 80E 100E 120E 140E 160E 180 160W 140W
60E 80E 100E 120E 140E 160E 180 160W 140W 60E 80E 100E 120E 140E 160E 180 160W 140W
60E 80E 100E 120E 140E 160E 180 160W 140W
60E 80E 100E 120E 140E 160E 180 160W 140W
70N
60N
50N
40N
30N
20N
10N
EQ
10S
20S
30S
40S
50S
70N
60N
50N
40N
30N
20N
10N
EQ
10S
20S
30S
40S
50S
70N
60N
50N
40N
30N
20N
10N
EQ
10S
20S
30S
40S
50S
70N
60N
50N
40N
30N
20N
10N
EQ
10S
20S
30S
40S
50S
70N
60N
50N
40N
30N
20N
10N
EQ
10S
20S
30S
40S
50S
Cor North_Index Mon = 6
Cor North_Index Mon = 7 Cor West_Index Mon = 7
Cor West_Index Mon = 6
Cor West_Index Mon = 5
Fig. 7. Linear correlations between the (a, c, e) north index and (b, d, f) west index of theWPSH andMSLP in the
A–A region. The north index is the averaged MSLP over 35–558N, 150–2208E and the west index is the averaged
MSLP over 15–258N, 115–1508E. Stippled areas are statistically significant at 95% confidence level.
46 Journal of Southern Hemisphere Earth Systems Science L. Xu et al.

Secondly, out of the 21 bifurcation cases, 16 ARs in the
Australian region had a northwest–southeast spatial orientation.Meanwhile, 19 of them had a southwest–northeast shape in theEast Asian region. Such an orientation in theAustralian region is
in good agreement with the observational results (Wright 1997)that the frequency of NWCBs has its peak in the austral winter(boreal summer). This is also consistent with the AR climatol-
ogy documented in Wu et al. (2020).Finally, for the 21 AR bifurcation cases, 16 of them occurred
during the boreal summer following an El Nino event peaking in
the boreal winter. Thus, such AR activities are more likely tooccur in the ENSO decaying phase. This prompted us to furtherexamine possible drivers that could play a role in producing ARbifurcations in the A–A region using the ENSO Nino 3.4, IOD
index data fromChinaNational Climate Center webpage https://cmdp.ncc-cma.net/Monitoring/cn_index_130.php and theMadden-Julian Oscillation (MJO) phase index from the BoM
(http://www.bom.gov.au/climate/mjo/). As shown in Table 2, ofall the key drivers, the delayed ENSO impacts stand out: 16 outof the 21 cases occurred in the boreal summer following a peak
El Nino in the preceding winter. Of the 21 cases, 11 occurredduring the IOD negative phases, suggesting only weak influenceof IOD on the AR bifurcation. Furthermore, the results sug-
gested that the MJO had little impact, with no clear phasesfavouring the AR bifurcation in the region. Note that, ashighlighted in the review by Stan et al. (2017), we acknowledgethe importance of MJO in influencing the tropical–extratropical
interactions and modulating the AR activities on intraseasonaltime scales, but this particular AR bifurcation phenomena wasnot affected by MJO, based on our analysis.
(a)
(b)
40N
35N
30N
25N
20N
15N
10N
5N
EQ
5S
10S
15S
20S
25S
30S60E 70E 80E 90E 100E 110E 120E 130E 140E 150E 160E 170E 180E
60E 70E 80E 90E 100E 110E 120E 130E 140E 150E
1.2
1.2
1.2
160E 170E 180E
60E 70E 80E 90E 100E 110E 120E 130E 140E 150E 160E 170E 180E
40N
35N
30N
25N
20N
15N
10N
5N
EQ
5S
10S
15S
20S
25S
30S
40N
35N
30N
25N
20N
15N
10N
5N
EQ
5S
10S
15S
20S
25S
30S
Cor May
Cor June
(c) Cor Jul
Fig. 8. Linear correlations between the WPSH west index (averaged
MSLP over 15–258N, 115–1508E) with the monthly IVT zonal and meridio-
nal component derived from ERA-Interim data for 1979–2016 in (a) May,
(b) June, and (c) July. Shaded areas indicate the correlations are statistically
significant at 90% confidence level.
MSLP, U850 difference JJA 2 ms–1
–4.5 –3.0 –1.5 0 1.5 3.0 4.5
Fig. 9. Averaged June-July-August MSLP (coloured) and 850 hPa hori-
zontal wind (vector in m s�1) differences between the UKMOUMGA7N96
nudge experiment over the WPSH domain (160–2408E, 15–508N) and its
default run for a 20-year model integration. See text for details.
Potential connections between ARs in China and Australia Journal of Southern Hemisphere Earth Systems Science 47

There are sound reasons for such ENSO results, as several
studies have found that theWPSH is stronger during the summerfollowing the peak of an El Nino event in the boreal winter(Wang andWang 2000; Xie et al. 2009; Paek et al. 2016). These
studies proposed several possible mechanisms to understandwhy ENSO, which peaks in boreal winter, can still impact theWPSH activities in the following summer. One of them isattributed to ENSO-induced SST anomalies in the western
North Pacific following an ENSO event (Wang and Wang2000) after which, through local air–sea interactions, theyproduce a delayed impact on the WPSH intensity and locations
during the following summer.To further investigate such delayed ENSO impacts on the
atmospheric moisture transport, we calculated linear correlations
between 850 hPa circulation with ENSO Nino 3.4 and IODindices. There were several reasons for calculating both ENSOand IOD correlations. Firstly, it is widely acknowledged that both
ENSO and IOD act as the main climate drivers influencing theAsian monsoon and Australian climate (Wang 2006; Zhang andMoise 2016). Furthermore, research from Ummenhofer et al.
(2011) emphasised the impacts of IOD on the Australian winter
rainfall through moisture transport from the tropical Indian Oceaninto theAustraliancontinent. To try to separate theENSOand IODimpacts, we applied partial correlation analysis. Suppose pr1 is the
partial correlation coefficient of the ENSO index and zonal windcomponent, the expression of this partial correction calculation is:
pr1 ¼ ðrY1 � r12rY2Þ=ffiffiffiffiffiffiffiffiffiffiffiffiffiffiffiffiffiffiffiffiffiffiffiffiffiffiffiffiffiffiffiffiffiffiffiffið1� r212Þð1� r2Y2Þ
qð3Þ
where rY1 is the correlation coefficient of the ENSO index andzonal wind component, r12 is the correlation coefficient of
ENSO and IOD index, and rY2 is the correlation coefficient of
the IOD index and the zonal wind component.Fig. 10a shows the partial correlation analysis betweenNino 3.4
index in December-January-February (DJF) with 850hPa wind in
June and July when most of the AR bifurcations occurred in ouranalysis. As pointed out by Paek et al. (2016), from the correlationpatternwe can clearly see that during theElNino decaying phase intheboreal summer (withElNino beingmatured inprecedingboreal
winter), the WPSH tended to be stronger and with more westwardextension. This is reflected in Fig. 10a as an anticyclonic circula-tion pattern in the western Pacific Ocean. At the same time, in the
southern hemisphere, anomalous anticyclonic circulation in theCoral Sea, Tasman Sea and eastern Australia was evident. Further-more, therewas an enhanced onshore flow from the tropical eastern
Indian Ocean and Java–Sumatra region into the Australian conti-nent. All these patterns agree well with the correlation analysisbetween the WPSH west index and the circulation patterns shown
in Fig. 8. These results confirm that: (i) the variations of theWPSHand its close connection with the subtropical high in the Australianand nearby region are important factors contributing to the ARbifurcation in the region; and (ii) the strong ENSO signal in theAR
bifurcation cases is due to the delayed ENSO impacts on thesubtropical highs in the A–A region.
In addition, Fig. 10b shows the partial correlations between
June–July IOD and the 850 hPa circulation in June–July. Asfound in Ummenhofer et al. (2011), positive IOD (with warmerSSTs in thewestern IndianOcean and cooler SSTs in the tropical
eastern Indian Ocean northwest of the Australian continent) inthe boreal summer (austral winter) season can lead to muchreduced moisture transport from the Indian Ocean into theAustralian continent. This is represented as anomalous south-
east–northwestward flow across the Australian continent. This
Table 2. Time and characteristics of bifurcated AR events from 1998 to 2017
The ‘/’ symbol indicates a neutral year in terms of ENSO or IOD index
No. Occurrence time Position of AR in China Position of AR in Australia Anomaly of SST in the preceding winter IOD event MJO phase
1 19980617-0621 NE–SW NW–SE El Nino – 1, 2, 3
2 19980629-0630 NE–SW NW–SE El Nino – 3, 4
3 19980719-0721 NE–SW NW–SE El Nino – 1, 2, 3
4 19980730-0731 NE–SW NW–SE El Nino – 5,6
5 20010727-0729 NE–SW NW–SE El Nino / 2
6 20020615-0616 NE–SW NW–SE / / 3, 4
7 20020717-0719 NE–SW NW–SE / / 8
8 20050616-0621 NE–SW NW–SE El Nino / 3
9 20050629-0630 S–N NW–SE El Nino / 2
10 20070620-0623 NE–SW NW–SE El Nino / 4
11 20100818-0820 NE–SW NW–SE El Nino – 2, 3
12 20100822-0825 NE–SW E–W El Nino – 4, 5
13 20120609-0610 NE–SW S–N La Nina þ 6, 7
14 20120712-0714 NE–SW NW–SE La Nina þ 1, 2
15 20130515-0516 E–W E–W / / 5
16 20150719-0721 NE–SW NW–SE El Nino þ 2
17 20160603-0606 NE–SW NW–SE El Nino – 7, 8
18 20160618-0619 NE–SW S–N El Nino – 3
19 20160620-0622 NE–SW NW–SE El Nino – 3, 4
20 20160718-0720 NE–SW S–N El Nino – 1, 2
21 20160721-0724 NE–SW NW–SE El Nino – 2
48 Journal of Southern Hemisphere Earth Systems Science L. Xu et al.

is why, in the negative IOD years with warmer tropical eastern
Indian Ocean, Australia tends to experience more NWCB andmore rainfall in its south (Ummenhofer et al. 2011). However, inthis correlation result, we could not see significant responses
from the subtropical high in the western Pacific, Coral Sea andsouthwest Pacific. Therefore, IOD favours the NWCB and ARoccurrence in the Australian region, but it does not necessarily
result in more ARs in the Asian summer monsoon region.Therefore, for the AR bifurcation analysis, we only see a weakIOD signal as in Table 2.
Finally, we conducted composite analysis of the 21 AR
bifurcation cases for the 20-year period. Fig. 11 shows theaveraged 850 hPa wind circulation anomalies for the 21 cases.
The positions of theWPSH and subtropical highs in the southernhemisphere are represented as the 152 gpdm contour lines of850 hPa geopotential height for these cases and against their
climatological positions. Again, these results demonstrated thatwhen AR bifurcation occurred in the A–A region, the WPSHextended much more westward. At the same time, we saw anenhanced and more westward extension of the subtropical high
in the Coral Sea and southwest Pacific. To the west of theAustralian continent, the south Indian Ocean subtropical high(Mascarenes High) retreated to the west, and there was an
enhancedmiddle-latitude trough intrusion into the southwesternpart of the Australian continent. All of these patterns are in agood agreement with the results from the case analysis, the
analysis of connections between the WPSH and subtropicalhighs in the southern hemisphere and the analysis of ENSOdelayed impacts on these subtropical highs. Such results further
consolidate the process we have identified.
5 Conclusion and discussions
Results from Wu et al. (2020), a collaborative research projecton AR analysis in the A–A region (Ye et al. 2020), showed thatthe peak time of the AR occurrence in the East Asian region was
in its boreal summer, which was also the peak season of ARsoccurring in the Australian region but it was their winter time.This has prompted us to investigate whether there are any
potential connections between the AR activities in these tworegions. In this study, we focused on analysing cases where ARsexist in both Asian and Australian regions at the same time. Wecall this ‘AR bifurcation’, as we have found that such patterns
reflect the split of tropical moisture export towards the extra-tropics in two directions towards both hemispheres.
Firstly, we conducted a detailed synoptic analysis of a case
study in 17–23 June 2016 when strong precipitation occurred in
Cor 850 wind, Niño 3.4 index(a)
30N
EQ
30S
60E 90E 120E 150E 180
60E
1
1
90E 120E 150E 180
30N
EQ
30S
(b) Cor 850 wind, IOD
Fig. 10. Correlation vectors showing the correlation between 850 hPa zonal
and meridional wind component in June and July with the preceding DJF (a)
Nino 3.4 index and (b) IOD, for 1987–2016. The partial correlation between
zonal wind (U) and the index is taken as zonal component of the correlation
vector, and the partial correlation between meridional wind (V) and the index
is taken as the meridional component of the correlation vector.
60N
30N
EQ
30S
30E 60E 90E 120E
2 4 6
150E 180
20
150W
Fig. 11. Composite analysis of 21 AR bifurcation cases. The subtropical
high at 850 hPa is represented by red contour lines at 152 gpdm for the
averaged position of these cases and compared against its multi-year mean
climatology (dark blue contour line). Arrow are the 850 hPa wind anomalies
and shaded areas are averaged wind speed anomalies (m s�1) for the 21
cases relevant to their climatological mean.
Potential connections between ARs in China and Australia Journal of Southern Hemisphere Earth Systems Science 49

China and Australia that linked to an AR in each region. In thiscase study,we demonstrated that ARbifurcation can occur in the
equatorial western Pacific region and in the tropical IndianOcean, depending on the synoptic patterns dominating theregion. During the first stage of the event, theWPSHwas strong
and extended more westward than its climatological position. Inthe meanwhile, the subtropical high in the southern hemisphereover the Coral Sea and southwest Pacific was strong too. Such a
setup was favourable for tropical moisture being transportedinto the East Asia monsoon region through is the anticyclonicflow in the west flank of WPSH and lead to the formation of anAR within the southwesterly Asian monsoon flow. At the same
time, the enhanced subtropical high on the Coral Sea region wasmet by a low-pressure system over the eastern part of theAustralian continent. Their combined effect was a long and
narrow band of moisture transport into the east coast of theAustralian continent that formed anAR in this region. These twoARs represented the bifurcation of the AR in the western Pacific
Ocean. During the second stage, associated with eastwardmovement of a tropical convection system in the maritimecontinent, the southwesterly monsoon flow from the Bay ofBengal was enhanced, and theWPSH retreated slightly eastward
but maintained its strength. The combined effect of these twoprocesses was that the AR that developed during the first stagewas retained in the region. For the southern hemisphere, the low-
pressure system in the Australian region moved out of thecontinent, and therewas an enhanced subtropical high extendingfurther westward toward the eastern part of the Australian
continent. At the same time, a deep trough in its middle latitudespenetrated the southern part of the continent and interacted withthe subtropical high in its east. This setup helped to form a
northwest–southeast band of strong moisture transport in thewestern part of Australia. Consequently, during the secondstage, the AR bifurcation appeared to occur in the Indian Ocean,where one AR formed northeastward into the Asian region and
the other southeastward into the Australian region.In the case analysis, we used the HYSPLIT model developed
by NOAA (Draxler and Hess 1998) to do the backward trajec-
tory analysis of the air mass forming the two ARs in China andAustralia. Results showed that the eastern part of the IndianOcean was an important moisture source for both ARs in East
Asia and the western part of the Australian continent. It was alsothe region where AR bifurcation occurred, with one branchtravelling northeastward towards East Asia and the other south-eastward across the western part of the Australian continent.
Following the case study, we further conducted a survey ofAR activities in the A–A region for 1998–2017. For the 20-yearperiod, we identified 21ARbifurcation cases in the region.Most
of them occurred in June–July, and most of them occurred in theboreal summer following anElNino event in its previouswinter.
Based on the case study, we further studied the underlying
reasons for such AR bifurcation. We found that the closeconnection between theWPSH and subtropical high in the CoralSea and Australian continent was the key process leading to the
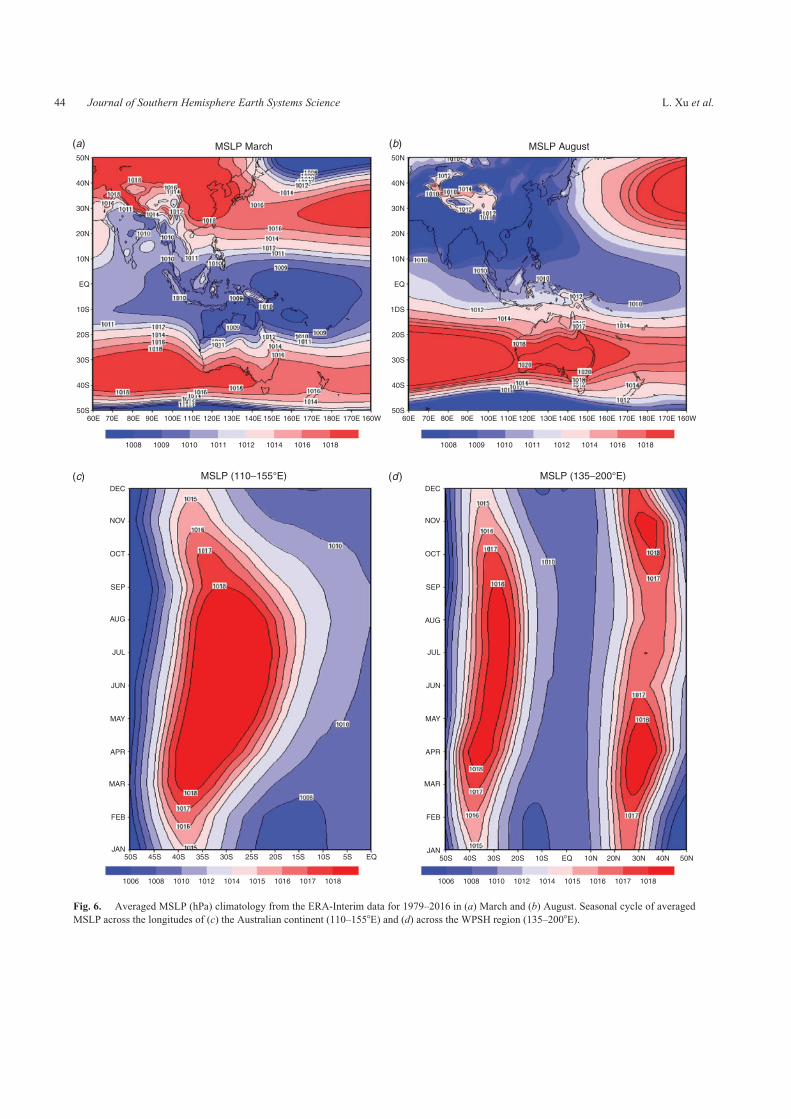
AR bifurcations and the in-phase AR seasonal variations in thetwo regions. As illustrated by a schematic diagram in Fig. 12, inthe boreal winter and austral summer, the WPSH is weak,located more eastward and at lower latitudes in the Pacific
Ocean. The weather in East Asia is dominated by the AleutianLow and Siberian High, and the prevailing northerly wind does
not favour AR formation in the East Asian region. At the sametime, tropical Australia is dominated by its summer monsoonand the subtropical high influencing the region is located further
poleward, and the averaged ridge location is around 38–408S.This is not favourable for the middle-latitude storm track and itsweather systems reaching the Australian continent. With such a
circulation pattern, it is difficult to form ARs within theAustralian continent. In contrast, during the boreal summer,an enhanced WPSH is located more westward and moves morenorthward too. The WPSH position is critical for the formation
of the East Asian summer monsoon and its moisture transport(Chen et al. 1991; Chang 2004; Wang 2006). At the same time,the subtropical high in the Australian region moves northward
and the ridge of the high system retreats to around 308S.Meanwhile, the storm track moves northward towards thecontinent. As a result, more middle-latitude weather systems
can penetrate further into the southern part of the continent,interact with subtropical high system in its northeast and arefavourable for the formation of a long and narrow band ofmoisture transport band over the continent. Such a mechanism
not only explains why the ARs in the A–A region tend to peak inthe same period but different seasons, but also helps to under-stand the AR bifurcations in the regions.
We then analysed a set of UK Met Office UM nudgingexperiments by relaxing the model horizontal wind and airtemperature towards ERA-Interim reanalysis (with 6-hourly
nudging) over a large WPSH domain. A strengthened WPSHin the model nudging experiment was accompanied by anenhanced subtropical high in the Australian region. Therefore,
results from the nudging experiments supported the mechanismwe proposed in this study by using the close connection betweenthe two high systems in explaining the same peak period of ARsin both Australia and East Asia during the boreal summer
(austral winter). In addition, the nudging experiment suggestedthe WPSH likely played a dominant role in shaping the atmo-spheric circulation in the Indo-Pacific region.
We investigated howENSO produced a delayed influence onthe AR bifurcation in the A–A region. Using simple partialcorrelation analysis, we demonstrated that ENSO-delayed
impacts on the AR bifurcation in the region was due to itsimpacts on the WPSH and subtropical high in the southernhemisphere during the boreal summer period. Several previousstudies (Wang and Wang 2000; Paek et al. 2016) showed that
WPSH tends to be stronger in the boreal summer following an ElNino peaking in the previous winter. Our analysis showed thatpositive SSTwarning in the central-east Pacific (Nino 3.4) in the
preceding winter is beneficial to the westward extension andstrengthening of the two subtropical high-pressure systems inthe northern and southern hemispheres. Under such a circulation
pattern, the ARs in the A–A region are prone to bifurcation.We must acknowledge that there are several significant
weaknesses in this analysis. Firstly, we used the close connec-
tions between WPSH and subtropical high influencing theAustralian region to explain why AR bifurcated in the A–Aregion and the peak period of the AR occurrence in the EastAsian andAustralian region is always in the boreal summertime.
50 Journal of Southern Hemisphere Earth Systems Science L. Xu et al.
We used the UM nudging experiments to support our claims.However, due to limited model data availability for the ARanalysis, we have not been able to directly analyse ARs in thesemodel nudging experiments to examine the mechanism pro-
posed in this study. In a future study, we plan to conduct morespecific model experiments to address this issue. Secondly, assummarised by Frederiksen and Lin (2013) and Stan et al.
(2017), there are many important factors that have a stronginfluence on tropical–extratropical weather and climate throughits global teleconnections. Subtropical highs over the western
Pacific and Australian regions could also be influenced bymanyother factors, such as the SAM (Hendon et al. 2007; Lim et al.
2016), Arctic Oscillation (Qin et al. 2017), the SSTs over
tropical Atlantic or local areas (Wang et al. 2005; Chen et al.
2015) and the Indian Ocean (Xie et al. 2009; Huang et al. 2010;Kosaka et al. 2013). These were not considered in our analysisbut need to be considered in our future studies. Furthermore,
although the factorsmentioned abovemay affect AR bifurcationevents, the relationship between these factors is not clear and
needs further research. Thirdly, our study only showed thatENSO and the subtropical highs provide suitable climatologicalbackgrounds of bifurcated AR events, but there is still a lack of
good understanding of what other factors are contributing tothese events listed in our study. While our results suggestedlimited impacts from the MJO, we need to explore other
important factors, as highlighted in Stan et al. (2017), whichgovern the tropical–extratropical teleconnections. Finally, dueto a number of reasons, we were only able to conduct a detailedAR bifurcation survey for a 20-year period in this two-year
project. Results would have been further strengthened if a longerperiod dataset was analysed. This will be further pursued in ourfuture collaborations.
Conflicts of interest
The authors declare that they have no conflicts of interest.
Acknowledgements
This study is part of the collaborative project between the Australian Bureau
of Meteorology (BoM) and China Meteorological Administrations (CMA)
on atmospheric rivers. We acknowledge discussions with Dr Ruping Mo
(Environment and Climate Change Canada), Drs Gill Martin and Penli Wu
(UKMetOffice) on this study. The authors thank the constructive comments
from Dr Lixin Qi and Ms Jingjing Chen during the internal review process.
Further comments from Dr Tony Hirst and two anonymous reviewers are
fully acknowledged for helping us further improve the quality of this study.
This research is supported by a BoM–CMA collaborative project (JWG–16
4.1), National Key R and D Program of China (2018YFC1507200) and
Key Scientific Research Project of Hunan Meteorological Bureau
(XQKJ16A001, XQKJ17D001).
References
American Meteorological Society (2019). Atmospheric River. In ‘Glossary
of Meteorology’. Available at http://glossary.ametsoc.org/wiki/
Atmospheric_river.
Bao, J.-W.,Michelson, S. A., Neiman, P. J., Ralph, F.M., andWilczak, J.M.
(2006). Interpretation of enhanced integrated water vapour bands asso-
ciated with extratropical cyclones: Their formation and connection to
tropical moisture. Mon. Wea. Rev. 134, 1063–1080. doi:10.1175/
MWR3123.1
Brands, S., Gutierrez, J. M., and San-Martın, D. (2017). Twentieth-century
atmospheric river activity along the west coasts of Europe and North
America: algorithm formulation, reanalysis uncertainty and links to
atmospheric circulation patterns. Climate Dyn. 48, 2771–2795.
doi:10.1007/S00382-016-3095-6
Cai, W., Van Rensch, P., and Cowan, T. (2011). Influence of global-scale
variability on the subtropical ridge over southeast Australia. J. Climate
24(23), 6035–6053. doi:10.1175/2011JCLI4149.1
Cai, W., Van Rensch, P., Cowan, T., and Hendon, H. H. (2012). An
asymmetry in the IOD and ENSO teleconnection pathway and its impact
onAustralian climate. J. Climate 25(18), 6318–6329. doi:10.1175/JCLI-
D-11-00501.1
Cao, Y. C., and Zhang, T. (2016). Analysis of the June 2016 Atmospheric
Circulation and Weather. Meteorol. Mon. 42(9), 1154–1160.
doi:10.7519/J.ISSN.1000-0526.2016.09.013
Chang, C. P. (2004). East Asian Monsoon. (World Scientific Publishing:
Singapore.) 564pp. doi:10.1142/5482
Boreal winter (austral summer)
Boreal summer (austral winter)
(a)50N
40N
30N
20N
10N
EQ
10S
20S
30S
40S
50S40E 60E 80E 100E 120E 140E 160E 180 160W
40E 60E 80E 100E 120E 140E 160E 180 160W
50N
40N
30N
20N
10N
EQ
10S
20S
30S
40S
50S
(b)
Fig. 12. Schematic diagram showing the dominating weather patterns in
theA–A region for (a) borealwinter (austral summer) and (b) boreal summer
(austral winter). It illustrates the connections between the seasonal migra-
tions of theWPSH and in the southern hemisphere, with theMascareneHigh
(Mas. High) and the Australian subtropical high (Aus. High) over the
Australian continent and Coral Sea region. Green arrows indicate ARs in
the region under such a synoptic setup.
Potential connections between ARs in China and Australia Journal of Southern Hemisphere Earth Systems Science 51

Chen, J. L., and Huang, R. H. (2007). The Comparison of Climatological
Characteristics among Asian and Australian Monsoon Subsystems. Part
II: Water Vapour Transport by Summer Monsoon. Chin. J. Atmos. Sci.
31(5), 766–778. doi:10.3878/J.ISSN.1006-9895.2007.05.02
Chen, W., and Guan, Z. Y. (2016). Impacts of the super El Nino event in
2015/16 on Australian summer monsoon circulation and precipitation
anomalies. Trans. Atmos. Sci. 39(6), 801–812. doi:10.13878/J.CNKI.
DQKXXB.20160908001 [In Chinese]
Chen L. X., Zhu Q. G., and Luo H. B. (1991). East Asian Monsoon. (China
Meteorological Press: Beijing.) 362pp. [In Chinese.]
Chen, W., Lee, J.-Y., Lu, R., Dong, B., and Ha, K.-J. (2015). Intensified
impact of tropical Atlantic SST on the western North Pacific summer
climate under a weakened Atlantic thermohaline circulation. Climate
Dyn. 45(7), 2033–2046. doi:10.1007/S00382-014-2454-4
Chen, J., Zhang, H., Ye, C., Chen, H., and Mo, R. (2020). Case studies of
atmospheric rivers over China and Australia: new insight into their
rainfall generation. J. South. Hemisph. Earth Syst. Sci. doi:10.1071/
ES19026
Dacre, H. F., Clark, P. A., Martinez-Alvarado, O., Stringer, M. A., and
Lavers, D. A. (2015). How do atmospheric rivers form? Bull. Amer.
Meteor. Soc. 96, 1243–1255. doi:10.1175/BAMS-D-14-00031.1
Dalvi, M. (2014) Nudging the Unified Model. Unified Model Documenta-
tion Paper 083. Met Office, United Kingdom. Available at https://www.
ukca.ac.uk/images/1/16/Umdp_083_Nudging_um92.pdf
Dettinger, M. D. (2013). Atmospheric rivers as drought busters on the U.S.
West Coast. J. Hydrometeor. 14, 1721–1732. doi:10.1175/JHM-D-13-
02.1
Ding, Y. (2004). Seasonal march of the East-Asian summer monsoon. In
‘East Asian Monsoon’. (Ed. C.-P. Chang.) pp. 3–53. (World Scientific
Publishing: Singapore.)
Draxler, R. R., and Hess, G. D. (1998). An overview of the HYSPLIT_4
modeling system for trajectories, dispersion and deposition. Aust.
Meteorol. Mag. 47, 295–308.
Drosdowsky, W. (2005). The latitude of the subtropical ridge over eastern
Australia: the l index revisited. J. Climatol. 25(10), 1291–1299.
doi:10.1002/JOC.1196
Ebita, A., Kobayashi, S., Ota, Y., Moriya, M., Kumabe, R., and Onogi, K.
(2011). The Japanese 55-year reanalysis ‘‘JRA-55’’: an interim report.
SOLA 7, 149–152. doi:10.2151/SOLA.2011-038
Frederiksen, C. S., and Balgovind, R. C. (1994). The influence of the Indian
Ocean/Indonesian SST gradient on the Australian winter rainfall and
circulation in an atmospheric GCM. Quart. J. Roy. Meteor. Soc. 120,
923–952. doi:10.1002/QJ.49712051808
Frederiksen, C. S., and Frederiksen, J. S. (1996). A theoretical model of
Australian Northwest Cloudband disturbances and Southern Hemi-
sphere storm tracks: The role of SST anomalies. J. Atmos. Sci. 53,
1410–1432. doi:10.1175/1520-0469(1996)053,1410:ATMOAN.2.0.
CO;2
Frederiksen, J. S., and Frederiksen, C. S. (2007). Interdecadal changes in
southern hemisphere winter storm track modes. Tellus A 59(5), 19.
doi:10.1111/J.1600-0870.2007.00264.X
Frederiksen, J. S., and Lin, H. (2013). Tropical-Extratropical Interactions of
Intraseasonal Oscillations. J. Atmos. Sci. 70(10), 3180–3197.
doi:10.1175/JAS-D-12-0302.1
Gao, Q., and Sun, Y. (2016). Changes in water vapour transport during the
meiyu season after 2000 and their relationship with the Indian Ocean
SST and Pacific-Japan pattern. Dynam. Atmos. Ocean 76, 141–153.
doi:10.1016/J.DYNATMOCE.2016.10.006
Gao, Y., Lu, J., and Leung, L. R. (2016). Uncertainties in projecting future
changes in atmospheric rivers and their impacts on heavy precipitation
over Europe. J. Climate 29(18), 1–38. doi:10.1175/JCLI-D-16-0088.1
Gimeno, L., Nieto, R., Vazquez, M., et al. (2014). Atmospheric rivers: a
mini-review. Front. Earth Sci. 2, 1–6. doi:10.3389/FEART.2014.00002
Guan, B., and Waliser, D. E. (2015). Detection of atmospheric rivers:
Evaluation and application of an algorithm for global studies.
J. Geophys. Res. Atmos. 120, 12514–12535. doi:10.1002/2015JD024257
He, S. P. (2015). Potential connection between the Australian summer
monsoon circulation and summer precipitation over central China.Atmos.
Ocean. Sci. Lett. 8(3), 120–126. doi:10.3878/AOSL20140091
Hendon, H. H., Thompson, D. J., and Wheeler, M. C. (2007). Australian
Rainfall and Surface Temperature Variations Associated with the
Southern Hemisphere Annular Mode. J. Climate 20, 2452–2467.
doi:10.1175/JCLI4134.1
Hirota, N., Takayabu, Y. N., Kato, M., and Arakane, S. (2016). Roles of an
atmospheric river and a cutoff low in the extreme precipitation event
in Hiroshima on 19 August 2014. Mon. Wea. Rev. 144, 1145–1160.
doi:10.1175/MWR-D-15-0299.1
Huang, R. H., Zhang, Z. Z., Huang, G., and Ren, B. H. (1998). Character-
istics of theWater Vapour Transport in East AsianMonsoon Region and
its Difference from that in South Asian Monsoon Region in Summer.
Chin. J. Atmos. Sci. 22(4), 460–469.
Huang, G., Hu, K.M., andXie, S. P. (2010). Strengthening of tropical Indian
Ocean teleconnection to the northwest Pacific since the mid–1970s: An
atmospheric GCM study. J. Climate 23, 5294–5304. doi:10.1175/
2010JCLI3577.1
Kim, J.,Waliser, D. E., Neiman, P. J., Guan, B., Ryoo, J.M., andWick, G. A.
(2013). Effects of atmospheric river landfalls on the cold season
precipitation in California. Climate Dyn. 40, 465–474. doi:10.1007/
S00382-012-1322-3
Knippertz, P., and Wernli, H. (2010). A Lagrangian climatology of tropical
moisture exports to the Northern Hemispheric extratropics. J. Climate
23, 987–1003. doi:10.1175/2009JCLI3333.1
Kosaka, Y., Xie, S. P., Lau, N. -C., et al. (2013). Origin of seasonal
predictability for summer climate over the northwestern Pacific. Proc.
Natl. Acad. Sci. U.S.A. 110, 7574–7579. doi:10.1073/PNAS.1215582110
Lavers, D., and Villarini, G. (2015). The contributions of atmospheric rivers
to precipitation in Europe and the United States. J. Hydrol. 522,
382–390. doi:10.1016/J.JHYDROL.2014.12.010
Li, J. P., and Zeng, Q. C. (2005). A New Monsoon Index-Its Interannual
Variability and Relation with Monsoon Precipitation. Climatic and
Environmental Research 31(5), 766–778. doi:10.3969/J.ISSN.1006-
9585.2005.03.009 [In Chinese]
Li, Y. Y., Yu, R. C., Fu, Y. F., and Ye, C. Z. (2009). A case study on the
triggering of thermal convective precipitation.ActaMeteorol. Sin. 23(4),
455–467. doi:10.1016/J.AGRFORMET.2009.02.014
Lim, E.-P., Hendon, H. H., Arblaster, J. M., Chung, C., Moise, A. F., Hope,
P., Young,G., and Zhao,M. (2016). Interaction of the recent 50 year SST
trend and La Nina 2010: amplification of the Southern Annular Mode
and Australian springtime rainfall. Climate Dyn. 47, 2273–2291.
doi:10.1007/S00382-015-2963-9
Liu, Y. M., Wu, G. X., Liu, H., and Liu, P. (2001). Condensation heating of
the Asian summer monsoon and the subtropical anticyclone in the
eastern hemisphere. Climate Dyn. 17(4), 327–338. doi:10.1007/
S003820000117
Milton S. (2018). Seamless Tropical Evaluation in the UM. Global Model-
ling Science Workshop, Melbourne, 21–23 February 2018.
Nicholls, N., Drosdowsky, W., and Lavery, B. (2012). Australian rainfall
variability and change. Weather 52(3), 66–72. doi:10.1002/J.1477-
8696.1997.TB06274.X
Paek, H., Yu, J. Y., Zheng, F., and Lu, M. M. (2016). Impacts of ENSO
diversity on the western pacific and north pacific subtropical highs
during boreal summer. Climate Dyn. 52, 7153–7172. doi:10.1007/
S00382-016-3288-Z
Pittock A. B. (1971). Rainfall and the general circulation. In ‘International
Conference in Weather Modification’, Canberra, 6–11 September 1971.
pp. 330–338. American Meteorological Society.
52 Journal of Southern Hemisphere Earth Systems Science L. Xu et al.

Qin, Z. J., Hou, S. G., Wang, Y. T., and Pang, H. X. (2017). Spatio-temporal
variability of winter snow cover over the Tibetan Plateau and its relation
to Arctic Oscillation. Geograph. Res. 36(4), 743–754. doi:10.11821/
dlyj201704012
RaghavanK.,SabinT.P.,MujumdarM., andPriya,P. (2012).Extrememonsoon
precipitation events over South Asia in a warming world. Egu General
Assembly Conference. EGU General Assembly Conference Abstracts.
Rayner, N. A., Parker, D. E., Horton, E. B., Folland, C. K., Alexander, L. V.,
Rowell, D. P., Kent, E. C., and Kaplan, A. (2003). Global analyses of sea
surface temperature, sea ice, and night marine air temperature since the
late nineteenth century. J. Geophys. Res. 108(D14), 4407. doi:10.1029/
2002JD002670
Risbey, J. S., Pook, M. J., and McIntosh, P. C. (2013). Spatial trends
in synoptic rainfall in southern Australia. Geophys. Res. Lett. 40(14),
3781–3785. doi:10.1002/GRL.50739
Rivera, E. R., Dominguez, F., and Castro, C. L. (2014). Atmospheric rivers and
cool seasonextremeprecipitation events in theVerde river basin ofArizona.
J. Hydrometeor. 15(2), 813–829. doi:10.1175/JHM-D-12-0189.1
Rutz, J. J., Steenburgh, W. J., and Ralph, F. M. (2014). Climatological
characteristics of atmospheric rivers and their inland penetration over the
western United States. Mon. Wea. Rev. 142, 905–921. doi:10.1175/
MWR-D-13-00168.1
Saha, S., Moorthi, S., Pan, H.L., et al. (2014). The NCEP climate forecast
system versions 2 reanalysis. J. Climate 27, 2186–2208. doi:10.1175/
JCLI-D-12-00823.1
Simmons, I., Bi, D. H., and Hope, P. (1999). Atmospheric Water Vapour
Flux and its Association with Rainfall over China in Summer. J. Climate
12, 1353–1367. doi:10.1175/1520-0442(1999)012,1353:AWVFAI.2.0.
CO;2
Stan, C., Straus, D. M., Frederiksen, J. S., Lin, H., Maloney, E. D., and
Schumacher, C. (2017). Review of Tropical-Extratropical Teleconnec-
tions on Intraseasonal Time Scales. Rev. Geophys. 55, 902–937.
doi:10.1002/2016RG000538
Sui, C. H., Chung, P. H., and Li, T. (2007). Interannual and interdecadal
variability of the summertime western north pacific subtropical high.
Geophys. Res. Lett. 34(11), L11701. doi:10.1029/2006GL029204
Sun, Y. S., Wang, Y. Q., Shen, X. Y., Zhou, Y. S., and Deng, G. (2018).
Diagnostic analysis on a heavy rainfall associated with the Northeast
cold vortex and atmospheric river. Plateau Meteorol. 37(4), 970–980.
doi:10.7522/j.issn.1000-0534.2018.00005
Tapp, R. G., andBarrell, S. L. (1984). The north-west Australian cloud band:
climatology, characteristics and factors associated with development. J.
Climatol. 4, 411–424. doi:10.1002/JOC.3370040406
Telcik, N., and Pattiaratchi, C. (2014). Influence of Northwest Cloudbands
on Southwest Australian Rainfall. J. Climate 2014, 1–11. doi:10.1155/
2014/671394
Timbal, B., and Drosdowsky, W. (2013). The relationship between the
decline of southeastern Australian rainfall and the strengthening of the
subtropical ridge. J. Climatol. 33(4), 1021–1034. doi:10.1002/JOC.3492
Ummenhofer, C. C., Sen, G. A., Briggs, P. R., England, M. H., Mcintosh,
P. C., Meyers, G. A.,Michael, P., Michael, R. R., and James, S. R. (2011).
Indian and Pacific Ocean influences on southeast Australian drought and
soil moisture. J Climate 24(5), 1313–1336. doi:10.1175/2010JCLI3475.1
Wang, B. (2006). The Asian monsoon. (Praxis Publishing: Chichester.) 787pp.
Wang, R., and Wang, B. (2000). Phase space representation and character-
istics of El Nino–La Nina. J. Atmos. Sci. 57(19), 3315–3333.
doi:10.1175/1520-0469(2000)057,3315:PSRACO.2.0.CO;2
Wang, B., Jiao, Z.-H., and Chao, J. (2005). The relationship between the
surface temperature on tropical seas and the western end of the ridge of
the subtropical high of Atlantic. Journal of Yunnan University: Natural
Sciences Edition 27(4), 332–336,342.
Wang, B., Xiang, B., and Lee, J. Y. (2013). Subtropical high predictability
establishes a promising way for monsoon and tropical storm predictions.
Proc. Natl. Acad. Sci. U.S.A. 110(8), 2718–2722. doi:10.1073/
PNAS.1214626110
Warner, M. D., Mass, C. F., and Salathe, E. P. (2015). Changes in winter
atmospheric rivers along theNorthAmericanwest coast inCMIP5 climate
models. J. Hydrometeor. 16, 118–128. doi:10.1175/JHM-D-14-0080.1
Williams, A. A. J., and Stone, R. C. (2009). An assessment of relationships
between the Australian subtropical ridge, rainfall variability, and high-
latitude circulation patterns. Int. J. Climatol. 29(5), 691–709.
doi:10.1002/JOC.1732
Wright, W. J. (1997). Tropical-extratropical cloudbands and Australian rain-
fall: I. Climatology. J. Climatol. 17, 807–829. doi:10.1002/(SICI)1097-
0088(19970630)17:8,807::AID-JOC162.3.0.CO;2-J
Wu, X., Ye, C., He, W., Chen, J., Xu, L., and Zhang, H. (2020). Atmospheric
rivers impacting mainland China and Australia: climatology and interan-
nual variations. J. South. Hemisph. Earth Syst. Sci. doi:10.1071/ES19029
Xie, P., Yatagai, A., Chen, M., Hayasaka, T., Fukushima, Y, Liu, C., and
Yang, S. (2007). A gauge-based analysis of daily precipitation over East
Asia. J. Hydrometeor. 8, 607–626. doi:10.1175/JHM583.1
Xie, S. P., Hu, K. M., Hafner, J., Tokinaga, H., Du, Y., Huang, G., and
Takeaki, S. (2009). Indian Ocean capacitor effect on Indo-Western
Pacific climate during the summer following El Nino. J. Climate 22,
730–747. doi:10.1175/2008JCLI2544.1
Yang, Y., Zhao, T., Ni, G., and Sun, T. (2017). Atmospheric rivers over the
Bay of Bengal lead to northern Indian extreme rainfall. Int. J. Climatol.
38, 1010–1021. doi:10.1002/JOC.5229
Yang, R., Wang, J., Zhang, T., and He, S. (2019). Change in the relationship
between the Australian summermonsoon circulation and boreal summer
precipitation over central china in the late 1990s.Meteorol. Atmos. Phys.
131(1), 105–113. doi:10.1007/S00703-017-0556-3
Ye, C. Z., Zhang, H. Q., Moise, A., and Mo, R. P. (2020). Atmospheric
Rivers in the Australia-Asian Region: A BoM-CMA Collaborative
Study. J. South. Hemisph. Earth Syst. Sci. doi:10.1071/ES19025
Yue, J., and Li, G. P. (2015). Diagnostic Analysis of the impact of
atmospheric river in a persistent heavy rainfall in Sichuan Basin. Journal
of Chengdu University of Information Technology 30(1), 72–80.
doi:10.16836/J.CNKI.JCUIT.2015.01.014
Yue, J., and Li, G. P. (2016). Study on the moisture source of rainstorms in
Sichuanbasinby theLagrangianmethod.J.Trop.Meteorol.32(2), 256–264.
Zhang, H. (2010). Diagnosing Australia-Asian monsoon onset/retreat using
large-scale wind and moisture indices. Climate Dyn. 35, 601–618.
doi:10.1007/S00382-009-0620-X
Zhang, C., and Zhang, H. (2010). Potential impacts of East Asian winter
monsoon on climate variability and predictability in the Australian
summer monsoon region. Theor. Appl. Climatol. 101(1–2), 161–177.
doi:10.1007/S00704-009-0246-2
Zhang H., and Moise A. (2017). The Australian Summer Monsoon in
Current and Future Climate. In ‘The Monsoons and Climate Change’.
(Eds L. de Carvalho, C. Jones) pp. 67–120. (Springer International
Publishing: Cham). doi:10.1007/978-3-319-21650-8_5
Zhang, H., Wen, Z., Wu, R., Chen, Z., and Guo, Y. (2017). Inter-decadal
changes in the East Asian summer monsoon and associations with sea
surface temperature anomaly in the South Indian Ocean. Climate Dyn.
48(3), 1125–1139. doi:10.1007/s00382-016-3131-6
Zheng, B., Chen, Y., and Li, C. Z. (2016). Characteristic of precursor
environment of mesoscale convective system during summer in central-
eastern China. Plateau Meteorol. 35(2), 460–468. doi:10.7522/j.
issn.1000-0534.2015.00003
Zhou, T. J., and Yu, R. C. (2005). Atmospheric water vapour transport
associated with typical anomalous summer rainfall patterns in China.
J. Geophys. Res. Atmos. 110(D8), 1–10. doi:10.1029/2004JD005413
Zhu, Y., and Newell, R. (1998). A proposed algorithm for moisture fluxes
from atmospheric rivers. Mon. Wea. Rev. 126, 725–735. doi:10.1175/
1520-0493(1998)126,0725:APAFMF.2.0.CO;2
www.publish.csiro.au/journals/es
Potential connections between ARs in China and Australia Journal of Southern Hemisphere Earth Systems Science 53