Post-fire Management and Restoration of Southern European Forests: Managing Forest Ecosystems
24
2 Land cover change and fire regime in the European Mediterranean region. Jesús San-Miguel-Ayanz 1 , Marcos Rodrigues 1,2 , Sandra Santos de Oliveira 1,3 , Claudia Kemper Pacheco 4,7 , Francisco Moreira 5 , Beatriz Duguy 6 , Andrea Camia 1 1. Institute for Environment and Sustainability, Joint Research Centre, European Commission 2. Grupo GEOFOREST, Departamento de Geografía y Ordenación del Territorio, Universidad de Zaragoza 3. Centre of Forestry Studies, Institute of Agronomy, Technical University of Lisbon 4. DIBAF, University of Tuscia 5. Centre of Applied Ecology, Institute of Agronomy, Technical University of Lisbon 6. Departament de Biologia Vegetal, Facultat de Biologia, Universitat de Barcelona 7. Institute of agro-envinronmental and forest biology (IBAF), National Research Council (CNR) 2 Land cover change and fire regime in the European Mediterranean region.1 2.1 Introduction ................................................................................................. 2 2.2 Overview of land cover changes in Europe ................................................. 3 2.3 Overview of changes in number of fires and burned area in the European Mediterranean countries. ................................................................................... 4 2.3.1 Overall trends for the EUMed region ................................................... 5 2.3.2 Overall trends by country ..................................................................... 7 2.3.3 Overall trends by province (NUTS3) ................................................. 10 2.3.4 Seasonal trends ................................................................................... 12 2.4 Land cover changes in burned areas .......................................................... 15 2.4.1 Main land cover types affected by wildfires ...................................... 16 2.4.2 Land cover changes in burned areas ................................................... 16 2.5 Fire effects on land cover change dynamics in the period 2000-2006 ....... 19 2.6 Key findings .............................................................................................. 22 References ....................................................................................................... 23
-
Upload
unitusdistu -
Category
Documents
-
view
1 -
download
0
Transcript of Post-fire Management and Restoration of Southern European Forests: Managing Forest Ecosystems

2 Land cover change and fire regime in the
European Mediterranean region.
Jesús San-Miguel-Ayanz1, Marcos Rodrigues
1,2, Sandra Santos de Oliveira
1,3,
Claudia Kemper Pacheco4,7
, Francisco Moreira5, Beatriz Duguy
6, Andrea
Camia1
1. Institute for Environment and Sustainability, Joint Research Centre, European Commission
2. Grupo GEOFOREST, Departamento de Geografía y Ordenación del Territorio,
Universidad de Zaragoza
3. Centre of Forestry Studies, Institute of Agronomy, Technical University of Lisbon
4. DIBAF, University of Tuscia
5. Centre of Applied Ecology, Institute of Agronomy, Technical University of Lisbon
6. Departament de Biologia Vegetal, Facultat de Biologia, Universitat de Barcelona
7. Institute of agro-envinronmental and forest biology (IBAF), National Research Council
(CNR)
2 Land cover change and fire regime in the European Mediterranean region.1 2.1 Introduction ................................................................................................. 2 2.2 Overview of land cover changes in Europe ................................................. 3 2.3 Overview of changes in number of fires and burned area in the European
Mediterranean countries. ................................................................................... 4 2.3.1 Overall trends for the EUMed region ................................................... 5 2.3.2 Overall trends by country ..................................................................... 7 2.3.3 Overall trends by province (NUTS3) ................................................. 10 2.3.4 Seasonal trends ................................................................................... 12
2.4 Land cover changes in burned areas .......................................................... 15 2.4.1 Main land cover types affected by wildfires ...................................... 16 2.4.2 Land cover changes in burned areas ................................................... 16
2.5 Fire effects on land cover change dynamics in the period 2000-2006 ....... 19 2.6 Key findings .............................................................................................. 22 References ....................................................................................................... 23

2
Abstract This chapter presents an analysis of land cover and land cover changes
in Southern Europe and its relation to fire regimes. The influence of land cover
and land cover changes in fire hazard is presented in the first section. This is fol-
lowed by a detailed analysis of fire regimes in the study region. Two main param-
eters, number of wildfires and burned area, are used to study the temporal and spa-
tial variability of forest fires in southern Europe during the last decades. This sets
the scene to an in depth analysis of changes in land cover in the areas affected by
forest fires. Since the European Mediterranean region is influenced by intense de-
mography and pressure on wildland areas, this section analyzes which areas are
most affected by fires, and which are the land cover transitions they lead to. The
chapter ends with a comparative analysis of differences in land cover dynamics in
fire-affected areas in comparison to the surrounding non-burned areas.
2.1 Introduction
Although fire is an integral ecological component of Mediterranean ecosystems,
the dynamics of fire regimes in Southern Europe is driven mainly by human fac-
tors. In fact, humans are responsible for over 95% percent of the fires taking place
in this region (San-Miguel-Ayanz and Camia 2009). Traditional usage of fire in
agricultural and cattle raising practices in the region is one of the main causes of
forest fires. Demographic changes related to the abandonment of rural areas are
also related to increased fire hazard. Fuel accumulation due to the lack of forest
management practices in the region lead to uncontrolled forest fires. Although,
overall, the rural population in Southern Europe has decreased, peaks of high pop-
ulation density in recreational wildland areas during holiday periods lead to in-
creased fire ignition in summer months. This is further enhanced by the expansion
of urban areas into wildland areas. This effect, which is due to either the expan-
sion of cities or the construction of secondary houses in rural areas, lead to an ex-
tended Wildland Urban Interface (WUI) in the region. The difficult fire manage-
ment of the extensive WUI in Southern Europe can lead to catastrophic fires such
as those in Portugal in 2003 or Greece in 2007.
Land cover is a fundamental component of fire dynamics. It influences all the
phases of the fire, from ignition to fire behavior and post-fire restoration. The
analysis of land cover changes in the last decades is tackled in the first section of
this chapter. This is followed by the analysis of fire regimes in the region, both in
terms of number of fires and burned areas. The last two sections of the chapter are
dedicated to an in depth analysis of land cover changes in areas affected by fires
and the effects of fire on land cover dynamics.

3
2.2 Overview of land cover changes in Europe
Land cover changes are related to fire hazard through changes in fuel load which,
along with topography and weather, are the main drivers of fire intensity and rate
of spread (Fernandes 2009, Moreira et al. 2009, Rothermel 1983). Thus, increased
fire hazard is expected where land cover changes promote an increase in plant bi-
omass (fuel load) while decreased fire hazard is linked to changes associated with
the removal of biomass. The CORINE Land Cover database
(http://www.eea.europa.eu/data-and-maps) was used to analyze the changes in
land cover in southern Europe between 1990 and 2006. The analysis was carried
out in 4 out of the 5 European Mediterranean countries that are most significantly
affected by forest fires, i.e. Portugal, Spain, France and Italy. Greece was excluded
from this analysis due to the lack of CORINE 2006 data for this country.
CORINE provides a thematic legend of 44 land cover classes grouped in three
hierarchical levels. These land cover classes were grouped into 6 general catego-
ries: Urban, Artificial, Agriculture, Forest, Shrubland, and No-vegetation. The
analysis of transition of areas among these categories was carried out.
The largest land cover change observed in area was the transition from forests
to shrublands (over 3 million ha) (Table 2.1), which could be interpreted as forest
degradation due to several causes (e.g. logging, fire, drought). Forests have also
been replaced by urban, agricultural, artificial areas and areas with no vegetation.
There were also significant areas of shrublands that have been replaced by agricul-
tural areas (over 1 million hectares), areas with no vegetation, artificial and urban
areas. All these changes contributed to decrease fire hazard.
Table 2.1 Changes (in hectares) among land cover classes from 1990 to 2006 in Mediterranean
Europe (Portugal, Spain, France and Italy). Changes associated to significant increases in fire
hazard are signaled in dark grey, whereas changes leading to major decreases in fire hazard are in
light grey
To 2006 Urban Artificial Agricultural Forest Shrubland No vegetation
Fro
m 1
99
0
Urban 11012514 75795 197427 11957 5897 723
Artificial 70972 2826169 107870 21353 62476 7292
Agricultural 1220019 765940 180616767 815487 1188775 25636
Forest 43099 101413 583320 85029222 3192178 82721
Shrubland 44331 99291 1071732 2299768 26980642 199171
No vegetation 3362 12183 57788 43162 468750 4120242
On the other hand, a significant proportion of shrublands have become forests
(over 2 million hectares) and the transition of former agricultural areas to forests
(over 800,000 ha) and shrublands (over 1 million hectares) has also been signifi-

4
cant. The transition of areas with no vegetation to shrublands was also relevant
(over 450,000 ha). These changes are probably the consequence of secondary suc-
cession in shrublands and abandoned agricultural fields, along with afforestation
programs promoted by EU agricultural and forest policies during the study period.
A large number of regional studies have also provided evidence of increased
fire hazard in the Mediterranean areas in the last decades, mainly due to the in-
creased cover of forests and shrublands in areas with former lower fuel loads. For
example, Van Doorn and Baker (2007), in a region of southern Portugal, regis-
tered a 75% decline in the area of agricultural fields during the period 1985-2000,
and an increase in shrublands and forest plantations. Similarly, Falcucci et al.
(2007) measured a 74% increase in forest cover in Italy during the period 1960-
2000, and a 20% decrease in agricultural areas.
The balance between land cover changes promoting an increase in fire hazard
(summing 4.9 million ha) and the ones decreasing it (5.4 million ha) would sug-
gest that southern Europe has become less fire prone in the period 1990-2006.
These results are in line with those presented in the analysis of land cover changes
during the period 1990-2000 in 24 European countries by Feranec et al. (2010).
These authors also found that the establishment of forests by planting or natural
regeneration had a significant proportion of land cover transitions corresponding
to an increased fire hazard, as they express an increase in fuel load at the land-
scape level. The authors concluded that afforestation was the most prominent land
cover flow across all Europe, during this time period, particularly in Portugal,
Spain and France. In contrast, 3 flow types - deforestation, intensification of agri-
culture and urbanization/ industrialization - included several transitions associated
to decreased fire hazard. The greatest losses in forest have been observed in Spain,
France and Portugal, mainly because of disturbances such as fire and wind. In the
countries of Southern Europe, intensification of agriculture was more prevalent in
Spain, whereas urbanization processes were more extensive in Spain, France, Italy
and Portugal (Feranec et al. 2010).
2.3 Overview of changes in number of fires and burned area in
the European Mediterranean countries.
The Mediterranean region of Europe is strongly affected by forest fires. According
to European Statistics (EC 2010), from 1980 until 2009 fires have burned an aver-
age of circa 478,900 ha of land per year in the 5 Southern European countries
most affected by fire (Portugal, Spain, France, Italy and Greece). Data on the
number of fires and burned area in this region have been collected since the 80’s
by each country and compiled in the European Fire Database (Camia et al. 2010).
The analysis of the spatial and temporal trends of fires is crucial to understand the
underlying causes of the fires and their environmental and socio-economic im-

5
pacts, assuming a key role in fire prevention and management. The purpose of this
section is to analyze the spatial and temporal trends of fire frequency (number of
fires) and burned area size, two essential components of the fire regime of an area.
The analysis of the number of fires, total burned area and average fire size was
carried out at different spatial levels:
At regional (supranational) level, considering the Euro-Mediterranean region as
a whole, with the purpose of characterizing its fire regimes, known to be mark-
edly different from the rest of Europe. The region under study, shortly referred
to as EUMed in what follows, comprises Portugal, Spain, France, Italy and
Greece;
At country level, by analyzing the data of each country individually in order to
assess differences between countries that may depend on national settings and
policies;
At province level (NUTS3), to investigate the potential influence of local envi-
ronmental and socio-economic conditions.
Temporal trends were analyzed separately for the whole study period (1980 –
2009) and for the last 10 years (2000 – 2009). These trends were compared using
the Mann-Kendall test, a non-parametric statistical test used to identify trends in
time series data (Kendall 1975). In addition, seasonal trends were also character-
ized both at regional and country levels, by examining separately the months cor-
responding to the main fire season (June to October) and the other months.
2.3.1 Overall trends for the EUMed region
The general trend for the whole study period was a slight increase in the number
of fires (Fig. 2.1), even though annual fluctuations are evident. In the 90’s a sub-
stantial increase was observed, while in the last 10 years (since 2000), the number
of fires decreased, except for the years 2003 and 2005. The increase observed in
the 90’s can be partly due to the changes in the reporting systems in the countries,
mostly driven by EC regulations. Other reasons for the rise in the number of fires
during this period may be associated with fuel accumulation related to land cover
changes such as the expansion of shrublands and abandonment of agricultural
lands (Carmo et al. 2011, Lloret et al. 2002, Romero-Calcerrada et al. 2010). The
results of the Mann-Kendall test showed that, for the entire study period, the gen-
eral trend is an increase, but not significant (S=64, P=0.14). For the last 10 years,
on the contrary, a significant decreasing trend was observed (S=-25, P=0.032).
The burned area, on the other hand, showed a decreasing trend since 1980, with
strong annual fluctuations (Fig. 2.2). The results of the Mann-Kendall test show
that, for both periods, the general trend was a decrease, but significant only when
considering the entire time series (S=-88, P=0.042). Besides the influence of
weather conditions in fire spread and burned area annually, this decrease is also

6
likely related to the implementation of fire prevention strategies and to the im-
provement in fire detection and fire-fighting techniques observed during the last
years.
-
10,000
20,000
30,000
40,000
50,000
60,000
70,000
80,000
nu
mb
er o
f fi
res
Years
Fig. 2.1 Total annual number of fires in the EUMed region from 1985 until 2009, and resulting
trend line
-
200,000
400,000
600,000
800,000
1,000,000
Bu
rned
are
a (
ha)
Years
Fig. 2.2 Total annual burned area (ha) in the EUMed region from 1985 until 2009, and resulting
trend line

7
2.3.2 Overall trends by country
The countries of the EUMed region showed different trends concerning the num-
ber of fires (Fig. 2.3).
-
10,000
20,000
30,000
40,000
nu
mb
er o
f fi
res
Years
Portugal
Spain
France
Italy
Greece
Fig. 2.3 Annual number of fires in the countries of the EUMed region from 1985 until 2009
Comparing the entire time series with the last 10 years, different trends can be ob-
served depending on the country (Table 2.2). Portugal, Spain and Greece showed
an increasing trend for the whole study period, while France and Italy had a gen-
eral decrease. Both the increasing trend observed for Portugal and the decreasing
trend of Italy are significant. In the last decade, a decrease was observed for all the
countries, significant only for Portugal, which had a median decrease of over 1500
fires per year (Sen slope).
In relation to the total burned area, the differences among the countries were
also evident (Fig. 2.4). Until the end of the 90’s, Spain usually had the highest
burned area, but since 2001 Portugal recorded the highest values, particularly in
2003 and 2005, decreasing considerably afterwards. France and Greece showed, in
general, the lowest values of area burned for the whole period, but in Greece the
years 2000 and 2007 showed a substantial increase in area burned, in the latter
case exceeding all the other countries.

8
Table 2.2 Results of the Mann-Kendall test (S), associated probabilities (P), and Sen slope for
the number of fires by country in both periods. Negative values mean a decrease and positive
values mean an increase. Significant values are signaled in bold
Time period Portugal Spain France Italy Greece
1985-2009
S
P
110
0.011
82
0.058
-28
0.528
-164
<0.001
22
0.623
Sen slope 801.9
396.9 -33.0 -346.2 5.97
2000-2009
S
P
Sen slope
-27
0.020
-1554.0
-21
0.073
-1134.0
-7
0.592
-157.5
-7
0.592
-201.2
-17
0.152
-118.0
-
100,000
200,000
300,000
400,000
500,000
Bu
rned
are
a (
ha
)
Years
Portugal
Spain
France
Italy
Greece
Fig. 2.4 Annual burned area (ha) in the countries of the EUMed region from 1985 until 2009
Results of the Mann-Kendall test suggests a decreasing trend in all countries dur-
ing both periods (Table 2.3), with the exception of Greece, where an increasing
trend was observed for the last decade. However, a significant trend was observed
only for Spain and Italy, which showed a median annual decrease in area burned
of 5175 ha for Spain and 3243 ha for Italy, for the whole period. The test was not
significant for Portugal and France. It must be noted that the Mann-Kendall test,
as a non-parametric test, does not consider the absolute change in magnitude from
year to year, but just the tendency in a rank ordering of the burnt areas for sequen-
tial years.

9
Table 2.3 Results of the Mann-Kendall test (S), associated probabilities (P), and Sen slope for
the burned area by country in both periods. Negative values mean a decrease and positive values
mean an increase. Significant values are signaled in bold
Time period Portugal Spain France Italy Greece
1985-2009
S
P
-6
0.907
-100
0.020
-52
0.233
-96
0.026
-68
0.117
Sen slope -101.6
-5175.0 -473.5 -3243 -1703
2000-2009
S
P
Sen slope
-19
0.107
-14016.0
-9
0.474
-6232.0
-21
0.074
-2215.0
-5
0.720
-1443.0
11
0.371
2127.0
The average fire size showed a dissimilar spatial trend in relation to the number of
fires and burned area, with Greece showing the highest values for nearly all the
years, with particular incidence in 2007 (Fig. 2.5). For all the other countries, the
average fire size decreased continuously since the 80’s, with annual oscillations
more evident in Spain in 1994, in Portugal in 2003 and in Italy in 2007.
0
20
40
60
80
100
120
Av
era
ge
fire
siz
e (h
a)
Years
Portugal
Spain
France
Italy
Greece
Fig. 2.5 Annual average fire size (ha) in the countries of the EUMed region from 1985 until 2009

10
2.3.3 Overall trends by province (NUTS3)
The overall trend in the number of fires is very irregular depending on the prov-
ince, although general patterns can be observed by country (Fig. 2.6). Portugal and
Spain have the majority of provinces with a significant increasing trend, while Ita-
ly and Greece have more provinces with a significant decreasing trend. However it
should be noted that the Greek data at NUTS3 level after 1998 are incomplete, be-
cause of changes in the reporting system in the country. In the case of Italy, an ex-
ception occurs in Sicily, where all provinces showed increasing trend or no trend,
while in Sardinia almost all the provinces had a decreasing trend. In France, most
of the provinces with available data indicated no trend or decreasing. The situation
changed when considering only the data between 2000 and 2009. There are just
few provinces in the whole study area with a significant trend, either increasing or
decreasing, possibly because the time series is too short at this scale of analysis.
The burned area, on the other hand, evidenced a general significant decreasing
trend for most provinces both between 1985 and 2009 and in recent years (Fig.
2.7).

11
Fig. 2.6 Trend in the number of fires by province in the EUMed region between 1985 - 2009
(top) and between 2000-2009 (bottom) obtained with the Mann-Kendall test.

12
Fig. 2.7 Trend in the burned area (ha) by province in the EUMed region between 1985 – 2009
(top) and between 2000 – 2009 (bottom), obtained from the Mann-Kendall test.
2.3.4 Seasonal trends
Seasonal trends were analyzed at country and regional levels. The average number
of fires and average burned area per month between 1985 and 2009 for the
EUMed region (Table 2.4) showed that the months with higher number of fires
and burned area were August, July and September, respectively. Nearly 73% of
the number of fires and nearly 85% of the burned area occurred between June and

13
October. March showed a higher number of fires and burned area in comparison
with the other spring months.
Table 2.4 Annual average (1985–2009) number of fires and burned area per month in the five
countries of the EUMed region
Month Number of fires % of total
number of fires
Burned area
(ha)
% of total
burned area
January 196 2.0 1396 1.6
February 484 4.9 2918 3.3
March 892 9.1 4730 5.3
April 509 5.2 2270 2.6
May 318 3.2 1085 1.2
June 729 7.4 4307 4.8
July 1754 17.8 23198 26.1
August 2548 25.9 31451 35.4
September 1618 16.4 12790 14.4
October 498 5.1 3055 3.4
November 176 1.8 683 0.8
December 134 1.4 1028 1.2
At country level, the average trend across months is similar for all countries, even
though the absolute number of fires and burned area is highly variable (Figs. 2.8
and 2.9).
0
1000
2000
3000
4000
5000
6000
1 2 3 4 5 6 7 8 9 10 11 12
An
nu
al
av
era
ge
nu
mb
er o
f fi
res
Months
Portugal
Spain
France
Italy
Greece
Fig. 2.8 Average number of fires per month in the EUMed countries
14
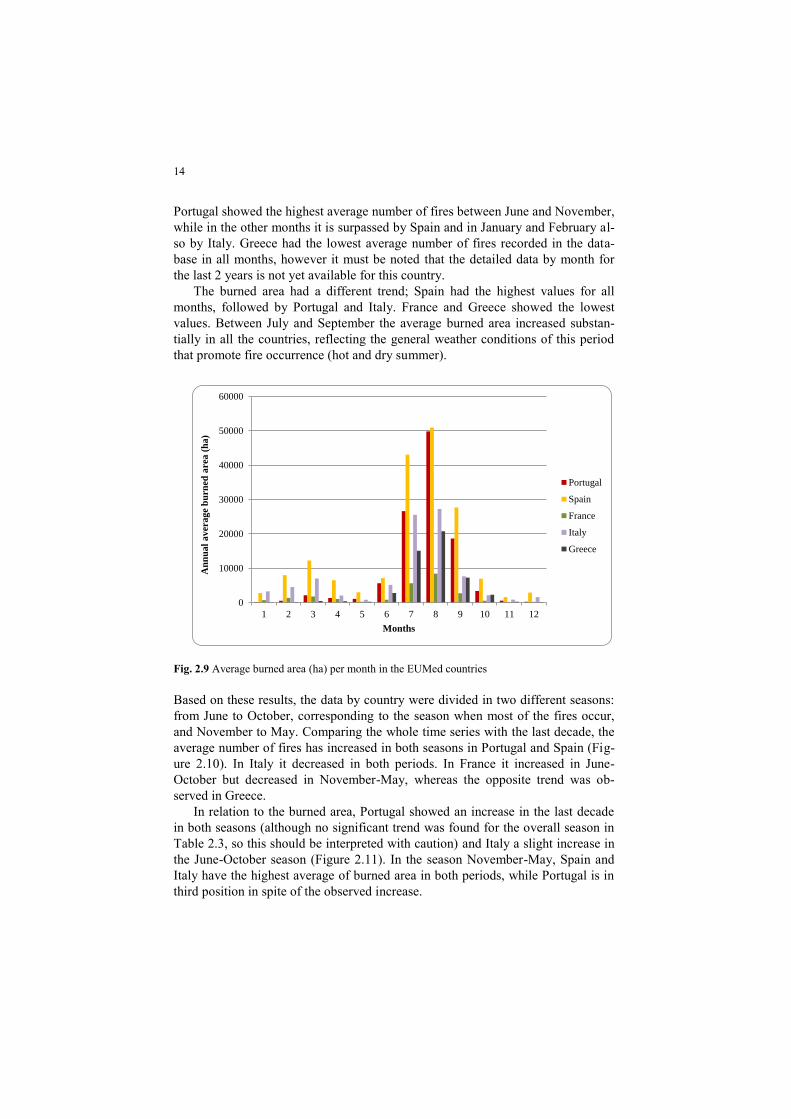
Portugal showed the highest average number of fires between June and November,
while in the other months it is surpassed by Spain and in January and February al-
so by Italy. Greece had the lowest average number of fires recorded in the data-
base in all months, however it must be noted that the detailed data by month for
the last 2 years is not yet available for this country.
The burned area had a different trend; Spain had the highest values for all
months, followed by Portugal and Italy. France and Greece showed the lowest
values. Between July and September the average burned area increased substan-
tially in all the countries, reflecting the general weather conditions of this period
that promote fire occurrence (hot and dry summer).
0
10000
20000
30000
40000
50000
60000
1 2 3 4 5 6 7 8 9 10 11 12
An
nu
al
av
era
ge
bu
rned
are
a (
ha
)
Months
Portugal
Spain
France
Italy
Greece
Fig. 2.9 Average burned area (ha) per month in the EUMed countries
Based on these results, the data by country were divided in two different seasons:
from June to October, corresponding to the season when most of the fires occur,
and November to May. Comparing the whole time series with the last decade, the
average number of fires has increased in both seasons in Portugal and Spain (Fig-
ure 2.10). In Italy it decreased in both periods. In France it increased in June-
October but decreased in November-May, whereas the opposite trend was ob-
served in Greece.
In relation to the burned area, Portugal showed an increase in the last decade
in both seasons (although no significant trend was found for the overall season in
Table 2.3, so this should be interpreted with caution) and Italy a slight increase in
the June-October season (Figure 2.11). In the season November-May, Spain and
Italy have the highest average of burned area in both periods, while Portugal is in
third position in spite of the observed increase.

15
0
1000
2000
3000
4000
5000
Portugal Spain France Italy Greece
Aver
ag
e n
um
ber
of
fire
s
June - October
1985-2009 2000-2009
0
400
800
1200
Portugal Spain France Italy Greece
Aver
ag
e n
um
ber
of
fires
November - May
1985-2009 2000-2009
Fig. 2.10 Comparison of the average number of fires for 1985-2009 and 2000-2009 in both sea-
sons
0
10000
20000
30000
Portugal Spain France Italy Greece
Av
era
ge
bu
rned
are
a (
ha
)
June - October
1985-2009 2000-2009
0
2000
4000
6000
Portugal Spain France Italy Greece
Av
era
ge
bu
rned
are
a (
ha
) November - May
1985-2009 2000-2009
Fig. 2.11 Comparison of the average burned area for 1985-2009 and 2000-2009 in both seasons
2.4 Land cover changes in burned areas
In this section we aimed to carry out a detailed analysis of land cover changes that
occurred in areas affected by fires during the period 2000-2006 in several South-
ern Europe countries. This was done using the CORINE land cover maps (CLC
maps, hereafter) available for 2000 and 2006, and the European Fire Database
(EFFIS) containing the annual forest fire information compiled by EU Member
States and other European countries (http://effis.jrc.ec.europa.eu). EFFIS database
was used for the period 2000-2006. The countries studied included Portugal,
Spain, France and Italy. Greece was excluded because the 2006 CLC map was not
available for that country.
We worked with the second level of CORINE land cover data and when the
results of the analysis indicated the occurrence of a major type of transition at a
country level, the third level was used. The areas that were burned in each country
and for each year throughout the studied period were obtained after the annual fire

16
maps of the EFFIS database. For each country, a set of seven masks (ArcGIS
shape layers) was derived from these fire maps; i.e. one mask for each year from
2000 to 2006. All fires smaller than 50 ha were discarded for the creation of the
mask.
Each year the mask was used for extracting two new raster layers from the two
CLC maps of each country. The raster layer derived from the CLC 2000 map
would represent the land cover pre-fire situation in the areas burned that year,
whereas the raster layer derived from the CLC 2006 map would represent the land
cover post-fire situation in those same areas. Then, all these raster layers were
converted into shape files in ArcGIS. For each year, we combined the two corre-
sponding layers, obtaining a final shape file in which each polygon would corre-
spond to a given transition of land covers between CLC2000 and CLC2006 and
would reflect this information in its attribute table. Based on these data, we gener-
ated seven transitional matrices for each country (one per year) and selected, in
each case, the major transitional classes to be analyzed at the second CLC data
level. An overall transition matrix was also calculated by pooling the data from all
countries. Land cover transitions representing less than 50 ha were excluded.
2.4.1 Main land cover types affected by wildfires
During the study period (2000-2006), the total burned area in the four considered
countries was 1,395,119 ha (only considering fires larger than 50 ha). Half of this
area (51%) consisted of CLC Level 2 class 32 (“Scrub and/or herbaceous associa-
tions”), followed by class 31 (“Forests”) (34%). At CLC Level 3 fires affected
mainly class 324 (“Transitional woodland-scrub”), corresponding to 23% of the
total, class 312 (“Coniferous forest”) (15%), followed by classes 311 (“Broad-
leaved forest”) (12%) and classes 313 (“Mixed forest”), 321 (“Natural grassland”),
322 (“Moors and heathland”) and 323 (“Sclerophyllous vegetation”), representing
each ca. 9% of the total burned area.
2.4.2 Land cover changes in burned areas
Overall, a total of 1,016,055 ha of burned areas (72.8% of the total) did not change
their land cover after fire. The land covers with less persistence in burned areas
were Forests, Open spaces with little or no vegetation, and Inland wetlands (Table
2.5). Caution should be taken in interpreting the finding for the latter land cover,
as the area with this land cover was very small (150 ha) and thus prone to signifi-
cant proportional changes even with small variations in polygon boundaries. From
the remaining 379,064 ha in which changes occurred, 76.9% became class 32
(“Scrub and/or herbaceous associations”) and 19.6% became class 33 (“Open
spaces with little or no vegetation”).

17
The transition matrix for the overall burned area (Table 2.5) showed that the
main changes driven by fire were the transition from forests to open spaces with
little or no vegetation (over 50% of the forests in 2000 suffered this transition).
The transition from Open spaces with little or no vegetation to Scrub and/or her-
baceous vegetation was also relevant (45%), as well as Inland wetlands to Inland
waters (46%) Other important transitions were from Arable land to Artificial, non-
agricultural vegetated areas (15%). Of these transitions, only the former can be
clearly attributed to fire effects.
Table 2.5 Transition matrix for the period 2000-2006 in the burned areas in Portugal, Spain,
France and Italy. Each row provides the proportion of the initial land cover (in 2000) that persist-
ed or changed to other land cover in 2006. Light grey cells indicate the persistence values (diag-
onal) and dark grey cells indicate the main transitions (over 5%). Codes for land cover are: Ur-
ban fabric (11); Industrial, commercial and transport units (12); Mine, dump and construction
sites (13); Artificial, non-agricultural vegetated areas (14); Arable land (21); Permanent crops
(22); Pastures (23); Heterogeneous agricultural areas (24); Forest (31); Scrub and/or herbaceous
associations (32); Open spaces with little or no vegetation (33); Inland wetlands (41); Inland wa-
ters (51)
CLC2006
11 12 13 14 21 22 23 24 31 32 33 41 51
CL
C2
000
11 1.00 0.00 0.00 0.00 0.00 0.00 0.00 0.00 0.00 0.00 0.00 0.00 0.00
12 0.00 1.00 0.00 0.00 0.00 0.00 0.00 0.00 0.00 0.00 0.00 0.00 0.00
13 0.00 0.00 1.00 0.00 0.00 0.00 0.00 0.00 0.00 0.00 0.00 0.00 0.00
14 0.00 0.00 0.00 1.00 0.00 0.00 0.00 0.00 0.00 0.00 0.00 0.00 0.00
21 0.00 0.00 0.00 0.15 0.82 0.00 0.00 0.01 0.00 0.01 0.00 0.00 0.00
22 0.00 0.00 0.00 0.00 0.00 0.87 0.01 0.05 0.00 0.07 0.01 0.00 0.00
23 0.00 0.00 0.00 0.00 0.00 0.00 1.00 0.00 0.00 0.00 0.00 0.00 0.00
24 0.00 0.00 0.00 0.00 0.01 0.00 0.00 0.96 0.00 0.02 0.01 0.00 0.00
31 0.00 0.00 0.00 0.00 0.00 0.00 0.00 0.00 0.41 0.51 0.07 0.00 0.00
32 0.00 0.00 0.00 0.00 0.00 0.00 0.00 0.00 0.00 0.94 0.05 0.00 0.00
33 0.00 0.00 0.00 0.00 0.00 0.00 0.00 0.00 0.00 0.45 0.54 0.00 0.00
41 0.00 0.00 0.00 0.00 0.00 0.00 0.00 0.00 0.00 0.00 0.00 0.54 0.46
51 0.00 0.00 0.00 0.00 0.00 0.00 0.00 0.00 0.00 0.00 0.00 0.00 1.00
In Italy, the total area burned during the study period was 79,118 ha (5.7% of the
total burned area in the four countries). Fires affected mainly class 211 “Non-
irrigated arable land” (22% of the total area burned in the country), class 321
(“Natural grassland”) and class 323 (“Sclerophyllous vegetation”) representing
each one ca. 19% of the total area burned, and class 311 (“Broad-leaved forest”)
(15%). 68,621 ha of burned areas (86.7% of the total) did not change land cover
after fire. From the 10,497 ha that suffered land cover changes, 31% became class

18
323 (“Sclerophyllous vegetation”), 19% became class 321 (“Natural grassland”),
11% became class 333 (“Sparsely vegetated areas”), 10% became class 243
(“Land principally occupied by agriculture with significant areas of natural vege-
tation”) and 8% became class 334 (“Burned areas”).
In France, the total area burned during the study period was 67.727 ha (4.8%
of the total area burned in the four countries). Fires affected mainly classes 323
(“Sclerophyllous vegetation”) and 321 (“Natural grassland”), corresponding to
31% and 17%, respectively, of the total area burned in the country. In addition,
fires affected also classes 313 (“Mixed forest”) and 312 (“Coniferous forest”) rep-
resenting each one ca. 10%. 41,740 ha of the burned areas (61.6% of the total) did
not change land cover after fire. From the 25,987 ha that changed land cover
trype, 41% became class 334 (“Burned areas”), 30% became class 324 (“Transi-
tional woodland scrub”) and 20% became class 323 (“Sclerophyllous vegetation”).
In Spain, the total area burned during the study period was 492,243 ha (35.3%
of the total area burned in the four countries). Fires affected mainly class 324
(“Transitional woodland scrub”), corresponding to 27% of the total area burned in
the country, and class 323 (“Sclerophyllous vegetation”) (14%). Classes 321
(“Natural grassland”), 312 (“Coniferous forest”) and 313 (“Mixed forest”) were
also strongly subjected to fires (12%, 11% and 10%, respectively, of the total
burned area). 381,982 ha of the burned areas (77.6% of the total) did not change
land cover after fire, whereas 110,261 ha did. Among the latter, 47% became class
324 (“Transitional woodland scrub”) and 29% became class 334 (“Burned areas”).
In Portugal, the total area burned during the study period was 756,031 ha. This
country had, therefore, the largest proportion (54.2%) over the total area burned in
the four countries. Fires affected mainly class 324 (“Transitional woodland
scrub”), corresponding to 24% of the burned area, class 312 (“Coniferous forest”)
(19%), class 311 (“Broad-leaved forest”) (15%) and class 322 (“Moors and heath-
land”) (11%). 469,533 ha of burned areas (62.1% of the total) did not change land
cover after fire, whereas 286,498 ha did, of which 81% became class 324 (“Tran-
sitional woodland scrub”), 7% class 334 (“Burned areas”) and 3% class 322
(“Moors and heathland”).
Classifying all the CLC transition classes into agradative (any transition result-
ing in an increase of the vegetation cover or leading to a more advanced succes-
sional stage), degradative or stable categories, we found clear differences among
the considered countries in the distribution of the total burned area among these
three types (Table 2.5). In Portugal, Spain and France, the post-fire land cover
changes occurred in areas burned between 2000 and 2006 mostly favoured
degradative transitions. This degradation trend was particularly strong in Portugal
and Spain. In France, agradative transitions represented a slightly larger area than
degradative ones.

19
Table 2.5 Distribution of the total burned area per country between agradative, degradative and
stable land cover transitions.
Italy France Spain Portugal
ha % ha % ha % ha %
Agradative transitions 4187 5.3 13331 19.7 36736 7.5 42717 5.7
Degradative transitions 6308 8.0 12667 18.7 73524 14.9 243774 32.2
Stable transitions 68621 86.7 41740 61.6 381982 77.6 469533 62.1
These results suggest a slow post-fire vegetation dynamics in most of the countries
studied. In all of them, except France, degradative transitions accounted for the
largest part of the land cover changes that occurred on burned areas. Moreover, a
large part of the areas classified as 33 (“Open spaces with little or no vegetation”)
in CLC 2000 had remained in that same class in CLC 2006, not evolving to clas-
ses with increased vegetation cover or towards more mature successional stages.
This slow dynamics may be due to various factors. First of all, in Spain and Portu-
gal (the two countries with the smallest proportion of agradative transitions), more
adverse climatic conditions (i.e. dryer conditions) in many of the areas affected by
fires may have caused lower rates of post-fire vegetation recovery. Secondly, in
those two countries, a large part of the fires occurred in the last two years of the
studied period (2005 and 2006). In Spain and Portugal, these fires accounted for
38% and 33 %, respectively, of the total burned area in each case, whereas in Italy
and France, these values were much lower (26% and 11%, respectively). In the
two former countries, thus, a larger extent of burned areas had a very short time to
recover, which, obviously, influenced the results.
In general, the length of the study period was short, as the maximum post-fire
period that could be monitored was 6 years. We have to highlight, therefore, that
in most cases our results are documenting post-fire land cover dynamics on the
short (or sometimes medium) term.
2.5 Fire effects on land cover change dynamics in the period
2000-2006
In this section our aim was to evaluate the role of fire in the observed landscape
dynamics at European level. The land cover dynamics analysis consisted in the
comparison of the observed land cover change and transitions in burned and un-
burned areas. This analysis was carried out using CORINE Land Cover (CLC) da-
ta for 2000 and 2006 and the fire perimeters for fires larger than 500 hectares ob-
tained from the EFFIS database.
The results obtained for land cover dynamics analysis are presented in this sec-
tion as transition matrices. For each of a total of 702 fire perimeters, we consid-
ered a paired unburned area with a similar shape, and surrounding the burned
20
patch. To characterize land cover change, the thematic legend (third level) of the
CLC layer has been aggregated into a new one composed by six main categories
(urban, artificial, agricultural, forest, shrubland and no vegetation areas) in order
to simplify the land cover dynamics analysis. This has been done both for CLC
2000 and 2006, and as result two new land use layers were obtained. A transition
matrix was computed separately for each burned - unburned patch pair. The dif-
ferences between these 2 matrices were then summarized in a new matrix called
change-intensity matrix which represented the rates of land cover change in
burned versus unburned areas.
In unburned areas (Table 2.6), persistence of the land covers (diagonal values of
the matrix) were always larger than 90% with the exception of forests and areas
with no vegetation, where it decreased to ca. 70%. The main transitions were from
forests to shrublands (26%) and no vegetation to shrublands (30%). The latter
transition seems to reflect the process of secondary succession and scrub en-
croachment, probably in former burned areas, sparsely vegetation areas or even
bare ground. The former is probably a consequence of forest logging. In burned
areas, the persistence pattern of the different land cover types was similar to the
one of unburned areas: also always larger than 90% with the exception of forests
and areas with no vegetation, but is this case it was even lower, ca. 35-50% (Table
2.6). Here the main transitions were also from forests to shrublands (57%) but also
to areas with no vegetation (6%), from areas with no vegetation to shrublands
(49%), and, to a lesser extent, from shrublands to areas with no vegetation (6%).
The transition of forests to shrublands and areas with no vegetation could be ex-
plained mainly by wildfires. After fires, in a period of six years (from 2000 to
2006) areas may not be able to have a significant vegetation development, or only
shrublands are able to grow in the early stages of succession. Even if there is for-
est recovery it will be in an earlier stage of development and would have a
shrubland-like physiognomy, or would consist of a transition category between
forest and shrub which in this work is categorized as shrubland (see proposed leg-
end). The same driver (fire) can explain the transition from shrublands to areas
with no vegetation. In contrast, the significant transition from areas with no vege-
tation to shrublands may be an evidence of post-fire vegetation recovery, mainly
in situations where the areas were burned in the beginning of the study period
(2000). It must be taken into account that this land cover class includes also
burned areas and sparsely vegetated areas, thus the succession to shrubland-type
vegetation is a possible explanation. Alternatively, misclassification of the land
cover types in the 2 different time periods could explain this result, if many areas
with no vegetation in 2000 had been classified as shrublands in 2006 (but if that is
the case this mistake must have been made also in unburned areas).
The intensity change matrix shows that wildfires have caused changes in land
cover dynamics (Table 2.6). In terms of persistence, fire decreased the persistence
for all land cover types except shrublands. So, fire promoted faster land cover
changes.

21
Table 2.6 Transition matrices (expressed as percentages) for burned and unburned areas in the
2000-2006 period. Each value in the matrices represents the average value for a sample of 702
wildfires and respective unburned pairs, and each row represents the proportion of the land cover
in 2000 that was kept or changed in 2006. The change intensity matrix (Difference matrix, on the
top) represents the difference between burned (middle) and unburned (bottom) areas matrices
DIFFERENCE
To 2006 Urban Artificial Agricultural Forest Shrubland
No vegeta-
tion
Fro
m 2
00
0
Urban -0.5 0.0 -0.1 -0.2 0.7 0.0
Artificial -0.7 -1.2 0.7 0.9 0.0 0.3
Agricultural -0.8 0.0 -0.9 -0.3 1.4 0.6
Forest -0.1 -0.1 -0.2 -35.3 30.7 4.9
Shrubland 0.0 -0.1 -0.3 -3.6 0.9 3.2
No vegetation 0.0 -0.8 -0.8 -0.1 18.7 -17.1
BURNED
To 2006 Urban Artificial Agricultural Forest Shrubland
No vegeta-
tion
Fro
m 2
00
0
Urban 98.5 0.0 0.6 0.0 0.9 0.0
Artificial 0.1 96.2 1.1 1.3 0.8 0.5
Agricultural 0.2 0.1 95.2 0.3 3.5 0.7
Forest 0.0 0.1 0.4 36.3 57.1 6.2
Shrubland 0.0 0.1 0.9 1.1 92.3 5.6
No vegetation 0.0 0.3 0.3 0.2 48.6 50.6
UNBURNED
To 2006 Urban Artificial Agricultural Forest Shrubland
No vegeta-
tion
Fro
m 2
00
0
Urban 99.0 0.0 0.6 0.2 0.2 0.0
Artificial 0.8 97.4 0.4 0.4 0.7 0.2
Agricultural 1.0 0.1 96.1 0.6 2.0 0.2
Forest 0.1 0.2 0.6 71.6 26.4 1.2
Shrubland 0.0 0.2 1.2 4.7 91.4 2.4
No vegetation 0.0 1.1 1.1 0.3 30.0 67.6
The more notorious decrease in persistence was for forests and areas with no
vegetation. It is logical that forests are the land cover more easily changed by fire,
and thus less persistent. The trend for areas with no vegetation might again be ex-
plained by different criteria in classifying the same land cover in the 2 time peri-

22
ods. The major land cover transitions promoted by fire were the forest to both
shrubland cover (+30%) and to areas with no vegetation (+5%). So, as expected,
fire causes a much faster change from forests to areas with shrublands or no vege-
tation in the short term, compared to unburned areas. A similar trend was observed
by for specific regions of Portugal and Spain (Lloret et al. 2002, Viedma et al.
2006, Silva et al. 2011). The other significant transition was from shrublands to
areas with no vegetation (+19%), although this could be interpreted as a simple
maintenance of the same land cover in case the hypothesis of misclassification is
confirmed. Other land cover transitions favored by fire included shrublands to no
vegetation (+3%) and agricultural areas to shrublands (+1.5%), the latter either re-
flecting a trend for the abandonment of agriculture in burned areas, as hypothe-
sized by Silva et al (2011) for three regions in Portugal, or the assignment of dif-
ferent categories to the same land cover (e.g. pastures versus natural grasslands).
Land cover transitions promoted by the absence of fire were less notorious.
Larger differences were registered for the transition from shrublands to forest (-
4%), reflecting secondary succession in the vegetation, from areas with no vegeta-
tion to artificial and agricultural areas (-0.8%), and from agricultural to urban are-
as (-0.8%). The latter transitions suggest that urbanization processes are more
common in unburned areas, compared to the burned ones.
2.6 Key findings
Land cover changes in Southern Europe in the period 1990-2006 suggest a de-
crease in fire hazard in this region, as landscape changes corresponding to in-
creased fire hazard occur in a smaller geographic area (4.9 million ha) than
transitions corresponding to decreased fire hazard (5.4 million ha). This might
be explained by disturbances such as logging, drought, wildfires, as well as ur-
banization;
Compared with the overall period 1985 – 2009, changes in the fire regime have
been observed in the last 10 years (2000 – 2009) in Southern Europe. The long-
term trend for the number of fires was an increase, but in the last 10 years the
trend was the opposite, a high decrease. In relation to the total burned area, the
general trend is for a decrease, lower when considering the entire time series
and more pronounced in the last 10 years. For the period 1980-2009, the prov-
inces with a high increase in both number of fires and burned area, were locat-
ed in Portugal, Central Spain, Southern Sicily and Southeast France. The de-
creasing trends were found mostly in the Northern provinces of Spain and in
Central Greece. The majority of the provinces of Italy and Greece showed no
trend. For the period 2000-2008, the majority of provinces in all the countries
show a decreasing trend, with a few exceptions in France and Italy;

23
The average number of fires has substantially increased in Portugal and Spain
in both the “fire season” (June to October) and the rest of the year, while for the
other countries the trend is more constant;
In the period 2000-2006, fires burned mainly areas of forest and shrublands.
The main CORINE land cover categories affected were “Transitional wood-
land-scrub” (23% of the total burned areas, “Coniferous forest” (15%), fol-
lowed by “Broad-leaved forest”, “Mixed forest”, “Natural grassland”, “Moors
and heathland” and “Sclerophyllous vegetation” (ca. 10% each). Almost 97%
of the areas burned during 2000-2006 changed their land cover to “Scrub
and/or herbaceous associations” or “Open spaces with little or no vegetation”;
Wildfires affected landscape change dynamics. Fire decreased the persistence
for all land cover types except shrublands. The major land cover transitions
promoted by fire were the forest to both shrublands (+30%) and to areas with
no vegetation (+5%). The other significant transition was from shrublands to
areas with no vegetation (+19%), although this could be interpreted as a simple
maintenance of the same land cover that was classified differently. Land cover
transitions promoted by the absence of fire were less obvious. Larger differ-
ences were registered for the transition from shrublands to forest (-4%), reflect-
ing secondary succession in the vegetation.
References
Camia, A., Durrant Houston, T., San-Miguel-Ayanz, J., 2010 The European Fire Database: De-
velopment, Structure and Implementation. In: D.X. Viegas (Ed.) Proceedings of the VI Inter-
national Conference on Forest Fire Research, Coimbra, Portugal.
Carmo, M., Moreira, F., Casimiro, P., Vaz, P. 2011. Land use and topography influences on
wildfire occurrence in northern Portugal. Landscape and Urban Planning 100: 169–176
EC, European Commission (2010). Forest Fires in Europe 2009, Report nr. 10. EUR 24502 EN –
Joint Research Centre, Institute for Environment and Sustainability, 84 pp. Office for Official
Publications of the European Communities, Luxembourg. ISSN 1018-5593
Falcucci, A., Maiorano, L., Boitani, L., 2007. Changes in land-use/land-cover patterns in Italy
and their implications for biodiversity conservation. Landscape Ecology 22, 617-631.
Feranec J, Jaffrain G, Soukup T, Hazeu G (2010) Determining changes and flows in European
landscapes 1990-2000 using CORINE land cover data. Applied Geography 30: 19-35.
Fernandes, P., 2009. Combining forest structure data and fuel modelling to classify fire hazard in
Portugal. Annals of Forest Science, 66.
Kendall, M.G. (1975). Rank correlation methods, 4th ed. Charles Griffin, London.
Lloret, F., Calvo, E., Pons, X., Diaz-Delgado, R. 2002. Wildfires and landscape patterns in the
Eastern Iberian Peninsula. Landscape Ecology 17: 745-759
Mann, H.B. ,1945. Non-parametric tests against trend, Econometrica 13, 245–259.

24
Moreira, F., Vaz, P., Catry, F., Silva, J.S., 2009. Regional variations in wildfire susceptibility of
land-cover types in Portugal: implications for landscape management to minimize fire hazard.
International Journal of Wildland Fire 18, 563-574.
Río, S.D., Herrero, L., Fraile, R., Penas, A. ,2011. Spatial distribution of recent rainfall trends in
Spain (1961-2006), International Journal of Climatology, Vol. 31 (5), 656-667.
Romero-Calcerrada, R., Novillo, C.J., Millington, J.D.A., Gomez-Jimenez, I. 2008. GIS analysis
of spatial patterns of human-caused wildfire ignition risk in the SW of Madrid (Central
Spain), Landscape Ecology 23, pp. 341–354
Rothermel, R., 1983. How to predict the spread and intensity of forest and range fires. USDA,
Forest Service, Intermountain Forest and Range Experiment Station, General Technical Re-
port INT-143, Ogden, UT.
San-Miguel Ayanz, J., Camia, A. 2009. Forest fires at a glance: facts, figures and trends in the
EU. In Birot, Y. (ed): Living with wildfires: what science can tell us. A contribution to the
Science-Policy dialogue. European Forest Institute, Discussion paper 15, 11-18.
Sen, P.K., 1968. Estimates of the regression coefficient based on Kendall’s tau, Journal of the
American Statistical Association 63, 1379–1389.
Silva, J.S., Moreira, F. Vaz, P., Catry, F., Godinho-Ferreira, P., 2009. Assessing the relative fire-
proneness of different forest types in Portugal. Plant Biosystems 143 (3), 597-608
Todeschini, S., 2011. Trends in long daily rainfall series of Lombardia (northern Italy) affecting
urban stormwater control. International Journal of Climatology, DOI: 10.1002/joc.2313
Van Doorn, A., Bakker, M., 2007. The destination of arable land in a marginal agricultural land-
scape in South Portugal: an exploration of land use change determinants. Landscape Ecology
22, 1073-1087.
Viedma, O., J. M. Moreno, and I. Rieiro. 2006. Interactions between land use/land cover change,
forest fires and landscape structure in Sierra de Gredos (Central Spain). Environmental Con-
servation 33:212–222.
A abandonment, 23
afforestation, 4
agradative, 19
agradative transitions, 20
agricultural areas, 4
average fire size, 10
B burned area, 6, 7, 11, 15
C CORINE Land Cover, 3
cover dynamics, 21
D deforestation, 4
degradative, 19
degradative transitions, 20
F fire hazard, 3
L Land cover, 2
land cover changes, 16, 21
Land cover changes, 3, 17
land cover dynamics, 20
N number of fires, 5, 7, 11
P persistence, 24
province, 11
S Seasonal trends, 13
shrublands, 3
T transition matrices, 20
transition matrix, 17, 18
U unburned areas, 20, 21
urbanization, 23
W Wildland Urban Interface, 2