Possible ways for improvement of the competitiveness of the ...
62
Wageningen University and Research Centre MSc Thesis in Business Economics Group Possible ways for improvement of the competitiveness of the Ukrainian dairy chain Author: Iryna Kulyk Registration number: 880702-488-120 Date: September 2010 – January 2011 University: Wageningen University Business Economics Group Examinator: Prof. Dr. Ir. A.G.J.M Oude Lansink Business Economics Group, Wageningen University Supervisor: Dr. Grigorios Emvalomatis Business Economics Group, Wageningen University Course code: BEC – 80433 ECTS: 33
-
Upload
khangminh22 -
Category
Documents
-
view
3 -
download
0
Transcript of Possible ways for improvement of the competitiveness of the ...

Wageningen University and Research Centre
MSc Thesis in Business Economics Group
Possible ways for improvement of the competitivenes s
of the Ukrainian dairy chain
Author: Iryna Kulyk
Registration number: 880702-488-120
Date: September 2010 – January 2011
University: Wageningen University
Business Economics Group
Examinator: Prof. Dr. Ir. A.G.J.M Oude Lansink
Business Economics Group, Wageningen University
Supervisor: Dr. Grigorios Emvalomatis
Business Economics Group, Wageningen University
Course code: BEC – 80433
ECTS: 33

ii

iii
Table of Content
List of Figures ............................................................................................................................. v
List of Tables .............................................................................................................................. v
Preface ..................................................................................................................................... vii
Summary ................................................................................................................................... ix
1. Introduction ................................... ....................................................................................... 2
2. Current situation in the Ukrainian dairy sector .................................................................. 6
2.1 Ukrainian dairy chain profile.............................................................................................. 6
2.2 Bottlenecks ....................................................................................................................... 7
2.3 Opportunities and perspectives ........................................................................................ 9
3. Materials and Methods........................... .............................................................................12
3.1 Porter’s Diamond .............................................................................................................12
3.2 SWOT analysis ................................................................................................................13
3.3 Stochastic Simulation ......................................................................................................14
3.3.1 ‘Do not change’ scenario ...........................................................................................14
3.3.2 Contract farming scenario .........................................................................................16
3.3.3 Dairy cooperative scenario ........................................................................................19
3.3.4 Own dairy farm scenario ...........................................................................................21
3.3.5 Data ..........................................................................................................................23
3.3.5.1 Data for the “Do not change” scenario ..............................................................23
3.3.5.2 Data for the contract farming scenario ..............................................................27
3.3.5.3 Data for the dairy cooperative scenario ............................................................28
3.3.5.4 Data for the own dairy farm scenario ................................................................29
4. Analysis of competitiveness of the Ukrainian dai ry chain. Results from Porter’s Diamond and SWOT analysis ......................... ........................................................................30
4.1 Application of Porter’s diamond of competitive advantage ...............................................30
4.2 SWOT analysis of the Ukrainian dairy chain ....................................................................32
5. Stochastic Simulation Results .................. .........................................................................36
5.1 “Do not change” scenario ................................................................................................36
5.2 Contract farming scenario ................................................................................................38
5.3 Dairy cooperative scenario ..............................................................................................39
5.4 Own dairy farm scenario ..................................................................................................40
5.5 Summary of the stochastic simulation results ..................................................................42
6. Conclusions and Discussions .................... .......................................................................44
6.1 Conclusions .....................................................................................................................44

iv
6.2 Discussions .....................................................................................................................45
7. Recommendations ................................ ..............................................................................48
References ...............................................................................................................................50
Appendix ...................................................................................................................................53
v
List of Figures
Figure 1. Dairy sector map, 2005 4
Figure 2. Trend of buying price for milk (February 2009 – December 2010) 20
Figure 3. Relative frequency function for the “Do not change” scenario 33
Figure 4. Relative frequency function for the “Do not change” scenario (negative NPV probability) 34
Figure 5. Cumulative distribution function for the “Do not change” scenario 34
Figure 6. Relative frequency function for the contract farming scenario 35
Figure 7. Cumulative distribution function for the contract farming scenario 36
Figure 8. Relative frequency for the dairy cooperative scenario 36
Figure 9. Cumulative distribution function for the dairy cooperative scenario 37
Figure 10. Relative frequency for the own dairy farm scenario 38
Figure 11. Cumulative distribution function for the own dairy farm scenario 38
Figure 12. The cumulative distribution functions for NPVs for all scenarios 39
List of Tables
Table 1. Overview of the input variables for the “Do not change” scenario 12
Table 2. Overview of the input variables for the contract farming scenario 15
Table 3. Overview of the input variables for the dairy cooperative scenario 17
Table 4. Overview of the input variables for the own dairy farm scenario 19
Table 5. Model summary of the buying price regression analysis 21
Table 6. Coefficients in the regression model on the buying prices of milk 21
Table 7. Projected buying and selling prices and costs of transformation 22
Table 8. Advantages and disadvantages for the Ukrainian dairy chain 27
Table 9. SWOT analysis of the Ukrainian dairy chain 31

vi

vii
Preface
This report is a result of the research conducted for the Master thesis at the chair group Business Economics of Wageningen University, the Netherlands.
First, I am grateful to my supervisor, Dr. Grigorios Emvalomatis, for his support, encouragement, always objective and valuable insights and suggestions during the whole process. I am thankful for his co-operation, involvement and help.
I also want to express my gratitude to my family for their support and belief in my capabilities from the very beginning to the final phase.
Iryna Kulyk
Wageningen, January 2011

viii
ix
Summary
According to FAO dairy consumption is growing all over the world, in particular in the developing countries. Furthermore the global demand for dairy products exceeds the supply. Consequently, Ukrainian dairy producers have an opportunity to get a larger share of the world dairy market. Currently Ukrainian dairy chain faces several obstacles which prevents it from being competitive on the world market.
In this regard, the objective of this research is to find out and assess the ways how the dairy processing company can make an impact on the competitiveness of the dairy chain. Particularly the insights to the state of the Ukrainian dairy supply chain are given and there is an assessment of several scenarios for the improvement of the Ukrainian dairy supply chain from the dairy-processing perspective. It is expected that the dairy processors can gain good results because they have an interest, power, capacities and influence to make a progress in the current situation.
Toward the reaching the goal both qualitative and quantitative analyses were conducted. The SWOT analysis and Porter’s diamond of competitive advantage were used to estimate the competitiveness of the Ukrainian dairy chain and expose possible perspectives. Next to the qualitative analysis, the stochastic simulation model using @Risk, a simulation add-inn for Excel, was developed and applied. In the model different scenarios which can be implemented by the dairy processor in order to improve the competitiveness of the Ukrainian dairy chain were assessed. The scenarios describe four options for the processor: do not change anything, establish own dairy farm, invest into creation of the dairy cooperatives or introduce contract farming. Net Present Value (NPV) was used as a criterion for the evaluation of the scenarios.
Data in the thesis, both historical and up-to-date, came from the different sources and was used for the predictions of the prices and costs involved as an input for the stochastic model.
The results obtained in the model show that the NPV under the contract farming scenario stochastically dominates over other NPVs. It’s a first-degree stochastic dominance. The results are driven mainly by the following factors in the model: buying price of milk (or production costs for the own dairy farm scenario), selling price of milk and different level of capacity utilization.
Based on the results it can be concluded that the contract farming scenario is the most beneficial for the processors. The results can work as guidelines for the Ukrainian dairy processors who face the problem of insufficient supply of high-quality raw materials given that the assumptions made in the thesis are true. It should be considered that the model includes only the major factors and should be adjusted when applied to the real situation. It should be also remembered that these results are only comparative between the scenarios, because we excluded from the analysis the part of fixed costs that was common to all scenarios.
In order to get more accurate results it is recommended to consider additional factors in the model and run the model with the up-to-date data, including all fixed costs of the processor into the calculation.

1
2
1. Introduction
Dairy consumption is growing all over the world, in particular in the developing countries (FAO, 2010). Additionally the global demand for dairy products today is much larger than supply (Nivyevskyi, Ilienko and Ryzhkova, 2008). Therefore, Ukrainian dairy producers have an opportunity to get a larger share of the world dairy market. However, today the Ukrainian dairy sector faces several problems. The supply of the raw milk has a seasonal pattern. The productivity of Ukrainian dairy farms and processing companies is rather low when compared to foreign counterparts. One of the main problems is the quality of the products. It is needed to mention here that a ban on the dairy products from Ukraine was introduced by Russia in 2006, because of non-compliance with Russia’s quality standards (Hess, Voget and Ryzhkova, 2008). Nivyevskyi and von Cramon-Taubadel (2008) argue that the further development of the dairy sector depends on the competitiveness and efficiency through the whole dairy supply chain.
The term competitiveness means the ability of firms and industries to stay competitive on the market. That means to protect or get better position at the market comparing to the competitors (Drescher, Maurer, 1999). In this thesis the competitiveness of the Ukrainian dairy supply chain on the world market and the possible ways for improving it will be described and assessed.
Beamon (1998) defines a supply chain is an integrated manufacturing process aimed to fulfil the customers’ demand. During this process raw materials are transformed into final products, and then delivered to customers. This implies a forward flow of materials and a backward flow of information.
The Ukrainian dairy chain consists of the following key participants: dairy farms, dairy processing enterprises and consumers (retailers, export, and new markets). In this thesis possible ways for improving the competitiveness of the dairy chain will be studied from the processing enterprise view, as this actor of the chain interacts in both directions of the chain: at the supply level and consumption level, and correspondingly can have more power to change the chain. But the interaction between dairy-processing companies and farms will be stressed out more.
Though the participants of the Ukrainian dairy sector should not only pursue the goal of better quality of dairy products, but they also should look for the optimization through the entire supply chain. This can bring considerable competitive advantages both on the local and global market (Nivyevskyi, Ilienko and Ryzhkova, 2008).
Nivyevskyi and von Cramon-Taubadel (2008) show in their research that the factors, namely average cow yield and the size of the farm have a significant influence on the competitiveness of dairy farming, where the competitiveness of the whole supply chain begins. But the impact of the herd size is much weaker than the impact of productivity increases. They also find that labor intensity has a negative effect on the competitiveness of dairy farming. This can be explained by the assumption that the farm that requires higher labor intensity has lower level of technological equipment. Their study also shows that subsidies received by dairy farmers also have a

3
negative impact on the competitiveness. It is also mentioned that only 20% of the dairy farms produce at the competitive level.
High costs and low quality products of dairy farming have a negative effect on dairy processors and competitiveness of the dairy chain. As dairy farms supply raw milk of low quality, it causes one of the main obstacles for processors on the way to the expansion on the world market. Low quality raw milk can cause high losses for the dairy processor (Velthuis, van Asseldonk, 2010). It brings additional costs to the value chain and makes the products of the dairy processors less competitive (Nivyevskyi, von Cramon-Taubadel, 2008).
Therefore it is important to look for ways to improve the processes through the whole supply chain and improve interaction between participants. Therefore, the objective of this thesis is to find out and assess the ways the ways in which a dairy processing company can make an impact on the improvement of the competitiveness of the dairy chain. These ways will be envisioned in several scenarios, namely:
• own dairy farm scenario;
• dairy cooperative scenario;
• contract farming scenario;
• ‘do not change’ scenario.
These scenarios were chosen because there is an experience of applying these scenarios in different countries all over the world. For example, dairy cooperatives work well in the Netherlands, contract farming brings benefits to both the farmers and processors in India, and ‘do not change’ scenario is used as a basis for a comparison. But in different environments the results of following the same scenario can be different. Therefore it is important to investigate what risks or uncertainties can be specific for each of them in the Ukrainian environment. That’s why it is decided to compare them in relation to the Ukrainian dairy chain. Each scenario will depict the costs and benefits of the possible future along with the risks and uncertainties involved. The success of different scenarios will be assessed by developing and applying the stochastic simulation model. NPV (net present value) will be used as the main criterion in the model to answer the question, what is the best way for the processors to improve the competitiveness of the Ukrainian dairy chain on the world market. The stochastic simulation model is an appropriate tool to quantify the economic effect of the possible different decisions of the processors under the unstable environment (unknown price level for milk, initial investments required). The outcome of the model will show the best option for the processors due to the investments required and estimated results.
To accomplish the objective of the thesis the following research questions were raised:
1. What are the bottlenecks and perspectives of the Ukrainian dairy chain?
2. What is the competitive advantage of the Ukrainian dairy chain?

4
3. What are the ways to improve the Ukrainian dairy chain?
4. What are the cost, benefits and risks within different scenarios?
To answer these questions the data from the literature review and interviews will be used. This data will be then analyzed and used in the SWOT (Strengths-Weaknesses-Opportunities-Threats) analysis of the dairy chain and Porter’s diamond of competitive advantage to assess the international competitiveness of the Ukrainian dairy chain and it will be also applied in the stochastic model. The results can work as guidelines for the Ukrainian dairy processors who face the problem of insufficient supply of high-quality raw materials.
The results of the research can be contrary with real outcomes of the launching the project. Because the problem is looked from the processors’ point of view and a social impact on the small suppliers will not be included. But due to a higher competition between the dairy suppliers within some of the scenarios, the small householders will not be able to correspond to higher requirements of the processors and compete at the market and therefore will have to leave the market. And then the government can intervene to protect small householders. Sometimes there is a contradiction between the market profitable and socially ethical decisions.
The structure of the thesis is organized as follows: after the introduction there will be an insight to the current state in the Ukrainian dairy chain, methods and data used during the research will be described and justified, the competitiveness of the Ukrainian dairy chain will be assessed and the ways to improve it will be presented, analyzed and discussed. At the end of the thesis the conclusions will be drawn and the recommendations will be given.

5
6
2. Current situation in the Ukrainian dairy sector
2.1 Ukrainian dairy chain profile
The Ukrainian dairy sector is one of the most important and fast growing branches of the agro-food sector, standing for 4% of the total national output. Dairy farming is one of the main sources of income for the rural population, and of raw milk for processing (Nivyevskyi, von Cramon-Taubadel, 2008). However, milk production declined strongly in the first years of transition from the planned to market economy due to a combination of price liberalization and privatization. These changes caused the decline in the number of dairy cows and cow milk output (Dries et al., 2009). The number of dairy herd declined in Ukraine from 8, 527 mln cows in 1990 to 3, 347 mln cows in 2007. The milk output has dropped by 15,8 % during the period from 1996 to 2006 from 15,8 mln tons in 1996 to 13,3 mln tons in 2006 (UCAB, 2008).
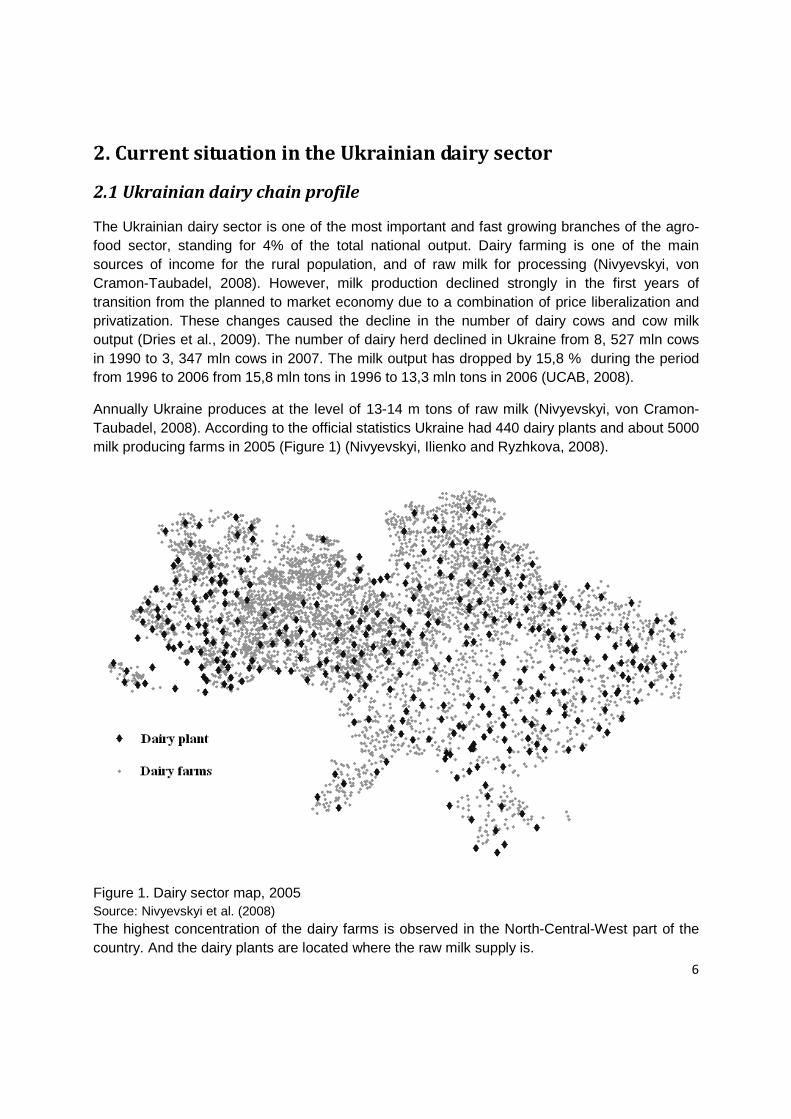
Annually Ukraine produces at the level of 13-14 m tons of raw milk (Nivyevskyi, von Cramon-Taubadel, 2008). According to the official statistics Ukraine had 440 dairy plants and about 5000 milk producing farms in 2005 (Figure 1) (Nivyevskyi, Ilienko and Ryzhkova, 2008).
Figure 1. Dairy sector map, 2005 Source: Nivyevskyi et al. (2008) The highest concentration of the dairy farms is observed in the North-Central-West part of the country. And the dairy plants are located where the raw milk supply is.
7
80% of raw milk comes from the private households (Nivyevskyi, von Cramon-Taubadel, 2008) or small dairy farms, where the cows are milked manually. While in the EU the milk is mainly produced by commercial dairy farms with automated milking equipment and following a strict total quality management (Hess, Voget and Ryzhkova, 2008).
According to official statistics in 2006 21,5% of all dairy farms in Ukraine had less than 10 cows. The share of the farms with 11 to 20 cows was 8,5%, 21-49 cows – 14,4%, 50-99 cows – 16,0%, 100-199 cows - 18,5%, 200-299 cows – 8,7%, 300-399 cows – 5,4%, 400 – 499 cows – 2,7%, 500 – 999 cows – 3,8% and only 0,5% of the dairy farms had more than 1000 cows (UCAB, 2008). While in the years of planned economy the large scale raw milk production was prevailing. So, the average herd at the dairy farm in Ukraine in 2005 was 1,4 cows per farm while in the Netherlands this was 61 cows per farm, in Germany – 37,6 cows per farm (UCAB, 2008). In Ukraine only big farms can afford introduction of modern technologies of keeping the cows, milk production and herd management. But still the share of these farms remains very low.
Therefore, the problem of low degree of mechanization and poor farming equipment remains one of the biggest obstacles on the way to better quality of the raw milk and higher competitiveness of the dairy farming. Milk of such quality is not used for processing for human consumption in the EU and the USA. Low quality of the domestic milk can be explained by a neglect of the cattle breeding schemes, poor herd management, low level of mechanization of the processes in the private households and poor equipment at the dairy farms. The low quality of the milk was always the major obstacle on the way to the expansion on the world market.
Ukrainian dairy products are mainly sold on the domestic market. The structure of the export of dairy products is as following: cheese, butter, skimmed milk powder etc.
The further development of the dairy chain depends on the availability of sufficient supply of relatively inexpensive and high-quality raw milk for processing (Nivyevskyi, von Cramon-Taubadel, 2008).
2.2 Bottlenecks
The great majority of milk in Ukraine is produced by households. The share of households in the total raw milk production increased from 24% in 1990 to 81% in 2006. This transformation from state and collective farms to household dairy production doesn’t allow for exploitation of economies of scale, bringing extra costs to the value chain and making the sector less competitive at the world market (Nivyevskiy, Strubenhoff, 2006).
The production of raw milk by the households has a seasonal pattern, it is lower during the winter time and the volume of production is higher during the summer time. This happens because the households usually use the grazing system and cannot apply herd planning due to the small number of cows. Therefore, the processors suffer from unstable supply; there is a lack of the raw milk during the wintertime. And that brings additional costs to the processors: fixed costs per liter of processed milk increase, if the machinery is not used at its full capacity.

8
Therefore, the processors are even willing to buy lower quality milk for the higher price just to get enough raw materials. That’s why the prices for the raw milk also follow a seasonal pattern. Due to the correlation between supply and demand on the market, they are higher during the autumn-winter season, and they usually drop down during the spring-summer period.
The standards for the raw milk in Ukraine are different from the Western standards, they are less demanding. The raw material from the households is usually of the second grade due to the Ukrainian system and not used for the food production in the EU and the USA. While big commercial dairy farms in Ukraine produce the milk of the 1st grade and of the extra class mainly.
Because of the non-compliance of the Ukrainian milk with the Western standards, the Ukrainian export of the dairy products was mainly aimed at the former soviet republics, mainly Russian Federation. But after the ban on the import of dairy products from Ukraine in 2006 this share dropped down rapidly. The non-compliance with the quality standards and safety certificates limits the opportunities to export and get a larger share on the international market. Ukraine exports mainly non-fat and skimmed milk powder for non-human consumption (Nivyevskyi, von Cramon-Taubadel, 2008).
The productivity of the cows is also very low when compared with those in the Western countries. The average yield per cow per lactation in Ukraine is about 4 tons/year while in Germany it is 6-7 tons/year (Nivyevskyi, Ilienko and Ryzhkova, 2008).
One more reason for the bad quality of raw milk is the underdeveloped infrastructure. Logistics (milk collection, storing and distribution) is underdeveloped and rather expensive. Milk collection from the households is usually provided by milk processors. And the trucks that are used for collection are old, so it is difficult to ensure the quality of the collected milk.
High production costs are the other obstacle for competitiveness of Ukrainian dairy products on the world market. Feed costs constitute a large part of the dairy farmers’ expenditures. As the grazing system of feeding prevails in Ukraine, it requires the area for grazing. Optimizing feed production for dairy cows could reduce land requirements by 30-50% and decrease feed costs correspondingly. Due to the lack of capital equipment, dairy farming at the small dairy farms and households are very labor intensive. Dairy farmers have to employ these labor-intensive technologies because capital resources are more expensive. They can’t afford introduction of new modern and cost-effective technologies because of a limited access to a credit market due to a high interest rate on the loan. The capital resources are expensive, but using manual labor has a negative effect on the quality of the product. These bottlenecks do not allow farmers to increase productivity and decrease production costs.
Nivyevskiy and Strubenhoff (2006) argue that subsidies to dairy farms have a negative effect on the competitiveness of the Ukrainian dairy chain, as they limit the ability of the farmers to adjust their behavior and operate more efficiently. This is because with the subsidies the farmers are not motivated to improve their production system and employ advanced technologies.

9
Lack of qualified personnel in Ukrainian agriculture and agribusiness starting from the farm level (milkmaid and agronomist) and ending with agricultural economists with relevant skills to manage farms and agribusinesses and to develop the sector is the other reason for the low competitiveness of the Ukrainian dairy sector. Therefore education of the qualified specialists in the industry should become one of the highest priorities (Nivyevskiy, Strubenhoff, 2006).
The other bottleneck of the Ukrainian dairy chain is that it has not diversified export structure and the largest share of it constitutes of the export to Russian Federation. And as the experience shows it can be bad for the dairy processors. Because if something goes wrong on that market, then the export drops down heavily and the processors suffer from the drop of sales, because they have no alternative market to supply their products to (Hess, Voget and Ryzhkova, 2008).
Hess, Voget and Ryzhkova (2008) conclude that if the Ukrainian dairy sector can prevail over the problems within the sector and increase productivity by rising investments, it has an opportunity to get a larger share on foreign markets.
2.3 Opportunities and perspectives
Ukraine has potential opportunities to become an exporter of dairy products. This is because the world demand for dairy products is projected to grow faster than supply, especially in developing countries. Therefore, Ukraine can be a potential global player on the world market for the dairy products. At the same time, the Ukrainian dairy sector has currently no access to the EU market and the export is limited because of the shortcomings of the dairy chain described earlier (Hess, Voget and Ryzhkova, 2008). Therefore, the processes through the dairy chain in Ukraine should be restructured in order to increase the competitiveness, to be able to match quality criteria and be ready to face severe competition on foreign export destinations.
If Ukraine produces and sells only raw products which comply with the foreign quality standards and satisfy customers abroad, it will lose a large share of the value which is added during the processing stage to the ready for use dairy products of a high level of processing (Hess, Voget and Ryzhkova, 2008). Therefore, the Ukrainian dairy chain should strive to improve its position in the world market and sell processed products there and not only be a supplier of raw materials.
To improve the competitiveness of the dairy chain the competitiveness of the dairy farming of Ukraine should be increased. It was proven by Nivyevskyi and von Cramon-Taubadel (2008) that an increase in the average cow yield can have a positive effect on the competitiveness of dairy farming. To increase the average cow yield a new ration for cows should be applied. New breed composition of the herd and management of calving can be crucial for the improvement of the average cow yield. From their research they also made a conclusion that the average size of the farm (size of the herd) is also a significant factor that influences the competitiveness (under the condition that the farm doesn’t receive any subsidy). Higher level of technological equipment will improve the milk quality which is important for the competitiveness in the world market. The
10
other factor that can also increase the competitiveness is a decrease of amount of land for feed crops per cow because it implies lower feed costs (Nivyevskyi, von Cramon-Taubadel, 2008).
To improve the situation in the dairy farming the implementation of the coordination mechanisms can be helpful. As argued in Szabo and Popovics (2009) different coordination mechanisms can improve welfare of the customer and bring positive effects not only to the industry but to the whole society because of the stabilization of prices and supply and cheaper food because of the more effective organization. Apart from the economic effects there can also be an important effect of strengthening trust and social capital.
Therefore in the following chapters different scenarios of the processor-initiated vertical coordination will be discussed. The processors are considered to initiate changes because they have a big interest in the high-quality raw milk; and they have more capacities, power and influence to make a change in the situation in the dairy chain.

11

12
3. Materials and Methods
To answer the research question “What is the competitive advantage of the Ukrainian dairy chain?” two complementary methods were found in the literature to assess the competitiveness of the Ukrainian dairy chain, namely Porter’s Diamond and SWOT analysis.
Porter’s Diamond describes international competitiveness as a result of the following home-based conditions: factor conditions, home demand conditions, related and supporting industry, firm strategy, industry structure and rivalry. Besides these factors there are also two separate factors: the government and chance.
SWOT analysis stands for the analysis of strengths, weaknesses, opportunities and threats. Considering SWOT analysis of the dairy chain, it will be only helpful if it is conducted in relation to competitors. Because not all factors that are the source of the competitive advantage within the country can be the source of competitive advantage on the international scale, when compared with other countries.
Porter’s Diamond gives an insight into the surrounding where the industry has to compete. While SWOT analysis includes both external and internal environment analysis. We use both of them to understand how home-based factors can bring opportunities for the Ukrainian dairy chain comparing to its competitors. What factors can be turned into the strengths. And what factors have to be considered as threats on the way to higher competitiveness of the Ukrainian dairy chain in the world market.
3.1 Porter’s Diamond
Porter’s Diamond suggests that there are essential reasons why some nations are more competitive than others, and why some industries within nations are more competitive than others. It suggests that there are four interacting determinants of national advantage in particular industries. They are:
• factor conditions; • home demand conditions; • related and supporting industries; • firm strategy, industry structure and rivalry.
These four elements form the diamond of competitive advantage and the effect of one of the elements always depends on the state of the others.
Factor conditions: competitive advantage of nations or sectors is associated with basic production factor availability such as land and natural resources, labor, human capital, physical capital, and infrastructure. Besides the availability of these production factors it is very important to use them efficiently.

13
The impact of demand conditions on competitiveness is related to the ability to respond to consumer preferences and needs. Consumer preferences and needs can create an incentive for a higher level of innovation and thus for the development of competitive advantage.
The existence of related and supporting industries is important for economic efficiency and competitive advantage. Domestic supplier industries are important for efficient and on time access to high quality inputs at internationally competitive price conditions due to transport cost advantage against foreign suppliers. Besides the supply of raw materials and packaging, competitiveness depends also on related and supporting efficient institutions such as banking and credit institutions.
The firm strategy and structure of firm markets and rivalry: firm market structures in terms of quality and price competitiveness, barriers to entry and intensity of competition between firms in the market or number of rivalries firm is facing in the market, and extent of vertical integration are important for competitiveness and competitive advantage for firms, sectors and nations.
These four above-mentioned elements are connected in the system with two other elements, namely: government, and chances.
The government policies can influence significantly the situation in the dairy chain. That implies it can influence each of the four elements and international competitiveness correspondingly. Government price, trade, competition and other policies have important role on domestic markets and on international competitiveness.
The chances are in interaction with the four basic elements and represent opportunity and threats for enterprises, sectors, and nations for competitive advantage and development (Bojnec, 2003).
3.2 SWOT analysis
SWOT analysis stands for the analysis of strengths, weaknesses, opportunities and threats. “SWOT summarizes the key issues from the business environment and the strategic capability of an organization that are most likely to impact on strategy development” (Johnson, Scholes, Whittington, 2009). SWOT analysis is conducted to monitor an external and internal environment. External environment analysis shows threats and opportunities. Good managers find, develop and gain profits from these opportunities and will find the way to decrease the probability of occurrence of the threats and prevent damages from their occurrence. Besides finding the opportunities it’s also important to be able to use them. Therefore, it’s essential for each business to evaluate its strengths and weaknesses during internal environment analysis (Kotler, Keller, 2009). If the strategic capability of the sector is to be understood, then SWOT analysis would be useful if it is comparative. It will be only valuable if it analyses strengths, weaknesses, opportunities and threats of the Ukrainian dairy chain in relation to competitors.

14
3.3 Stochastic Simulation
In this master thesis we consider different processor-initiated ways of improvement of the competitiveness of the dairy chain. Four different scenarios will be modeled by constructing stochastic simulation models. We apply Monte Carlo Simulation because processors should make decision in the stochastic environment. Because of high degree of uncertainty by constructing a Monte Carlo simulation model we will incorporate risks related to the milk selling price change, prices for raw materials etc.
“The purpose of stochastic simulation in decision analysis is to determine the probability distributions of consequences for alternative decisions to enable the decision maker to make a good and well-informed choice” (Clemen, Reilly, 2004).
Considering analysis of the investment decision of the processor, we will use NPV (Net Present Value) method to evaluate the investment attractiveness of different scenarios.
(1)
where I represents the investment expenses and CF represents the future cash flows in years 1 to T and r is the discount rate.
We consider four different scenarios because they show different levels of interference of the processor into the chain coordination process. The decision-making process in all the scenarios is delegated to the players at different levels of the supply chain. Different scenarios imply different initial investments, further inputs and different risks involved. We will model all the scenarios for the period of 20 years. The planning period of 5 years is relatively short, because usually investments into dairy farming in Ukraine have a long payback period of about 10 years (Hess, Voget and Ryzhkova, 2008). And a model for more than 20 years will not be accurate and trustful, because market conditions and industry dynamics are changing very fast nowadays.
Below we will describe the stochastic simulation models for each scenario in detail.
3.3.1 ‘Do not change’ scenario
This scenario can be used as a base line to build the other scenarios on it and compare other scenarios with.
This scenario can be implemented easily because it doesn’t require initial investments or any structural changes. Regarding the Net Present Value of this project we can say that initial investments in this case will be equal to 0. That means that the processor doesn’t invest into any mechanization or know-how development to improve the current situation with the milk supply and quality.
15
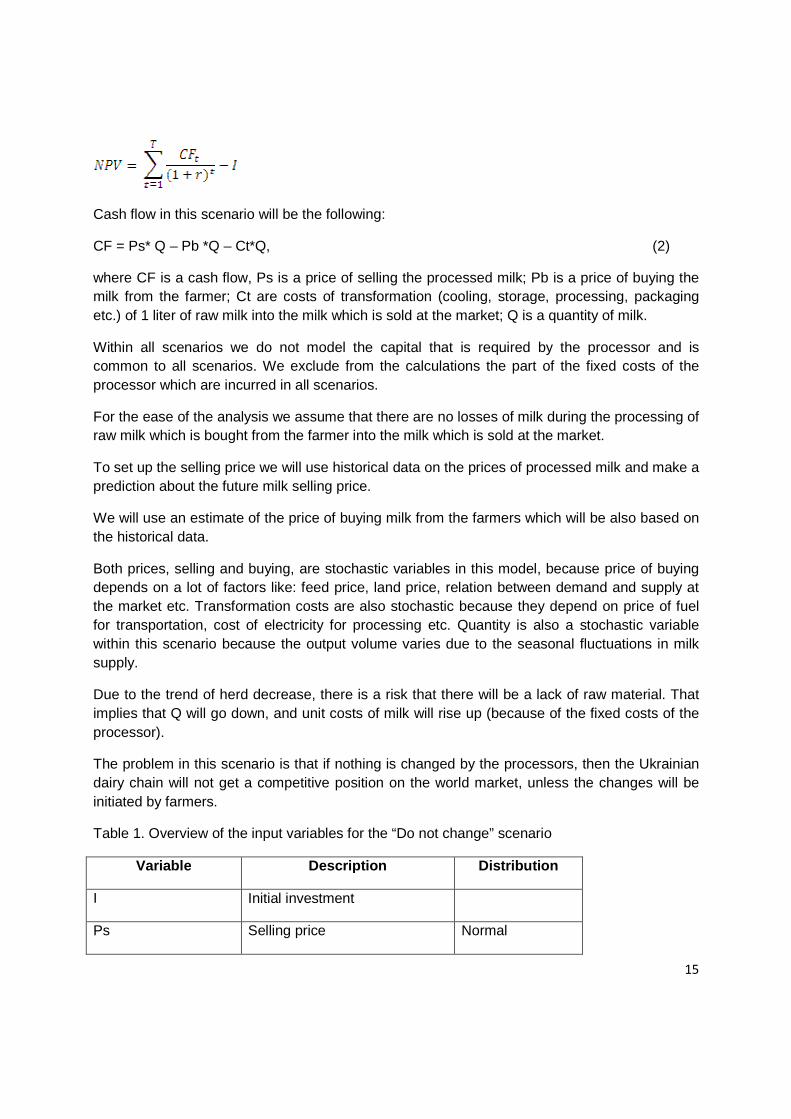
Cash flow in this scenario will be the following:
CF = Ps* Q – Pb *Q – Ct*Q, (2)
where CF is a cash flow, Ps is a price of selling the processed milk; Pb is a price of buying the milk from the farmer; Ct are costs of transformation (cooling, storage, processing, packaging etc.) of 1 liter of raw milk into the milk which is sold at the market; Q is a quantity of milk.
Within all scenarios we do not model the capital that is required by the processor and is common to all scenarios. We exclude from the calculations the part of the fixed costs of the processor which are incurred in all scenarios.
For the ease of the analysis we assume that there are no losses of milk during the processing of raw milk which is bought from the farmer into the milk which is sold at the market.
To set up the selling price we will use historical data on the prices of processed milk and make a prediction about the future milk selling price.
We will use an estimate of the price of buying milk from the farmers which will be also based on the historical data.
Both prices, selling and buying, are stochastic variables in this model, because price of buying depends on a lot of factors like: feed price, land price, relation between demand and supply at the market etc. Transformation costs are also stochastic because they depend on price of fuel for transportation, cost of electricity for processing etc. Quantity is also a stochastic variable within this scenario because the output volume varies due to the seasonal fluctuations in milk supply.
Due to the trend of herd decrease, there is a risk that there will be a lack of raw material. That implies that Q will go down, and unit costs of milk will rise up (because of the fixed costs of the processor).
The problem in this scenario is that if nothing is changed by the processors, then the Ukrainian dairy chain will not get a competitive position on the world market, unless the changes will be initiated by farmers.
Table 1. Overview of the input variables for the “Do not change” scenario
Variable Description Distribution
I Initial investment
Ps Selling price Normal

16
Pb Price of buying from the farmer Normal
Ct Transformation costs Normal
Q Milk amount Normal
r Discount rate Normal
Source: Own table based on the literature review
3.3.2 Contract farming scenario
This scenario was chosen because contract farming has a long history all over the world. This is a common practice in many countries, for example Hungary, India etc.
Contract farming is a way of market coordination where relationships between the farmer and producer are bound by the specific conditions agreed in the contract. These conditions are quality, price, and quantity of milk, payment procedures, sharing of costs and risks, moral hazards, and dispute settlement (Birthal et al., 2008).
According to this scenario there is vertical coordination between processors and farms. It assures that farms supply the type and standard of milk processors are interested in, leading to improvements in quality and productivity of farms. Vertical coordination also appeared because small-scale farms can not easily afford large capital investments required for the perishable products, like milk. Dries et al. (2009) researched that successful vertical contracting usually includes conditions for product delivery and payments as well as farm assistance programs for suppliers. It was also found that farm assistance programs can take many forms, like input supply programs, investment assistance programs, trade credit, bank loan guarantee programs, extension services, and management advisory services.
For the processor buying from the distant suppliers can be costly, therefore it’s better to sign the contracts with farmers to get a constant supply of fresh raw materials, especially in the case of perishable products like milk. Such products need immediate transportation or cold storage and processing, and good infrastructure. Otherwise, it can lead to the losses of product quality and money, and losses at the processor’s side due to unstable supply of raw materials. Thus we can see that one of the advantages of the contract farming scenario is secure milk supplies for the processor and decreased transaction costs.
Still there will be the problems left which can’t be solved by the processor within this scenario. Because of the small amount of dairy cows in the herd, it is not possible to implement the management of the herd calving. Therefore seasonality still remains a problem. But the processor can reduce the seasonality effect by improvements in the feeding system.
According to this scenario the processor helps the farmers with a decision-making on the feeding, herd management, cattle breeding and quality control. The processor provides farmers with the know-how and their competency, as well as financial and training services. The processor can also provide farmers with credit, technology, inputs (feed, medicine, and
17
vaccine), information, and extension services. The processor also buys or rents the equipment (milking and cooling equipment) for farmers.
Apart from the assistance the farmers receive, they also benefit from the reduced price risk (as the price will be agreed in the contract). Contract farming can improve farm profitability by reducing transaction costs. It may happen that the price agreed in the contract will be lower than at the open market. But milk producers can get compensation due to reduction of the transaction costs. Because they gain from selling directly to processors, escaping the intermediaries. And this compensation can be bigger than the price difference between the price specified in the contract and price at the open market. Farmers can also decrease their unit cost of production due to the gains from the inputs and services, feed at a lower price provided by the processors (Birthal et al., 2008).
The imperfection of the contract farming is that it can limit the rights of small households (for example, with 1 cow) to participate in it. Because establishing the contacts, signing the agreement and monitoring their fulfillment with a large number of small farms can be very costly and takes a lot of time. Small farms usually require more assistance from the processor per unit of output, because they may lack essential management capacity or investments. That’s why the processor may prefer fewer larger farms.
There are also risks involved in this scenario. If the processor lends money to the farmer, there can be a chance that the farmer will go bankrupt and will not give the money back. The other risk is that some farmers (producers) will not comply with the agreed quality requirements. In both cases penalties should be foreseen in the contract.
Regarding the Net Present Value of this project we can say that I (initial investment) in this scenario will include costs of buying equipment (Cequip), costs of arranging contracts (Ccontract) with farmers and credit to farmers. These costs are easier to quantify per farmer, therefore we multiply them by the number of farmers (N) participating in the contract farming.
I = [Cequip + Ccontract + credit to farmers] * N (3)
The investor has to spend money on the new milking and cooling equipment for farmers, because it will assure higher quality of the milk. Because cow hygiene, hygiene of the milking parlour, maintanence of milking and cooling equipment are correlated with the somatic cell count and other factors which influence the product quality (Velthuis, van Asseldonk, 2010).
Cash flow for this scenario is as following:
CF = Ps* (Q-Q losses) – Pb*Q – Ct*Q + penalties*Q losses + i - Ces - Cv – Cm – Ci, (4)
Where: Ct: cost of transformation (cooling, storage, processing, maintenance costs, packaging etc.).

18
Q losses: is the amount of milk supplied to the processor, which doesn’t meet the quality requirements.
Penalty: payment for inability to meet quality requirements. It was proved that payment schemes motivate controlling of raw milk quality parameters (Velthuis, van Asseldonk, 2010). “Quality penalties were found to be more effective in motivating farmers than quality premiums” (Valeeva et al., 2007).
Ces: costs of extension service provided by the processor to the farmers to improve their productivity and quality of their products.
i: payback loan and interest rate on the credit provided by the processor to the farmer at a favorable interest rate.
Cv: costs of veterinary check and vaccine. Veterinary check can be an important part of the mastitis management at the farm.
Cm: costs of quality monitoring.
Ci: costs of inputs like feed and medicine.
According to this scenario the price of buying milk from the farmers, quantity and quality of milk is prescribed by the agreement between the processor and farmer. Thus, these variables will not be stochastic.
Table 2. Overview of the input variables for the contract farming scenario
Variable Description Distribution
I Initial investment
N Number of farmers Fixed value
Cequip Costs of equipment Normal
Ccontracts Costs of contracts Normal
Credit to farmers Amount of credit to farmers Normal
Ps Selling price Normal
Pb Price of buying from the farmer
Fixed value
Ct Transformation costs Normal
Q Milk amount Fixed value

19
r Discount rate Normal
Q losses Losses of milk due to the quality loss
Normal
Penalty Fixed value
i Payback loan + Interest rate on the credit
Fixed value
Cv Costs of veterinary check and vaccine
Normal
Cm Costs of quality monitoring Normal
Ces Costs of extension services Normal
Ci Costs of inputs (feed, medicine etc.)
Normal
Source: Own table based on the literature review
3.3.3 Dairy cooperative scenario
Processor-initiated dairy cooperative establishment scenario was selected for the research as one of the options because such project is currently in the process of implementation in Ukraine. It is also a common practice in many countries, but in most case the establishment of the dairy cooperative is initiated by the farmers, not the processor. Danone Ukraine launched the project together with the NGO Heifer-Ukraine, called “Ukraine Milk Communities”. They “help to create 20 agricultural cooperatives, each including between 60 and 80 smallholders”. The objective of the project is to strengthen small dairy producers and add value to the output while assuring the supply of high-quality milk (Danone Ecosystem Fund, 2010).
The advantages of the processor-initiated cooperative are experienced management, the processor takes part in ensuring the current assets of farmers through pre-financing, bad quality products are excluded by the system, “financial power, quality consciousness and professional management” (Szabó, Popovics, 2009).
The other advantages of this scenario are reasonably stable prices for the producers and a stable volume of milk for the processor. Considering the advantages of this scenario, we can say that it is better than the contract farming scenario because it can manage that cows are evenly distributed throughout the herd by stage of lactation. It will help to avoid seasonal calving periods. Herd calving is assumed to be evenly distributed throughout the year.
A disadvantage of this scenario is that it gives more bargaining power to the farmers as the suppliers of raw materials. And after the expiration day of the contract, the farmers may decide to increase the price at which they sell the raw milk to the processors or change to the
20
processor that will offer a higher price. That will mean that the current processor will lose the supply of raw materials and will not work in its full capacity. It will lead to higher unit costs and lower competitiveness. That’s why, it is necessary to consider possible threats and risks in the contract and set up relevant penalties in different situations, when establishing the cooperative. When establishing the cooperative it should be agreed that the processor and the cooperative will not act against each other.
The cooperative will act as a mediator between milk producers and processors of milk. Under this scenario we assume that the decision-making is left to the cooperative. Then the processor doesn’t need to deal directly with the farmers, think about transportation and quality control on the farms.
According to this scenario, the processor will provide the credit to the cooperative, some training and extension services, transportation of the milk from the cooperative to the processor, but decisions about equipment, feeding, quality check and control will be made by the cooperative.
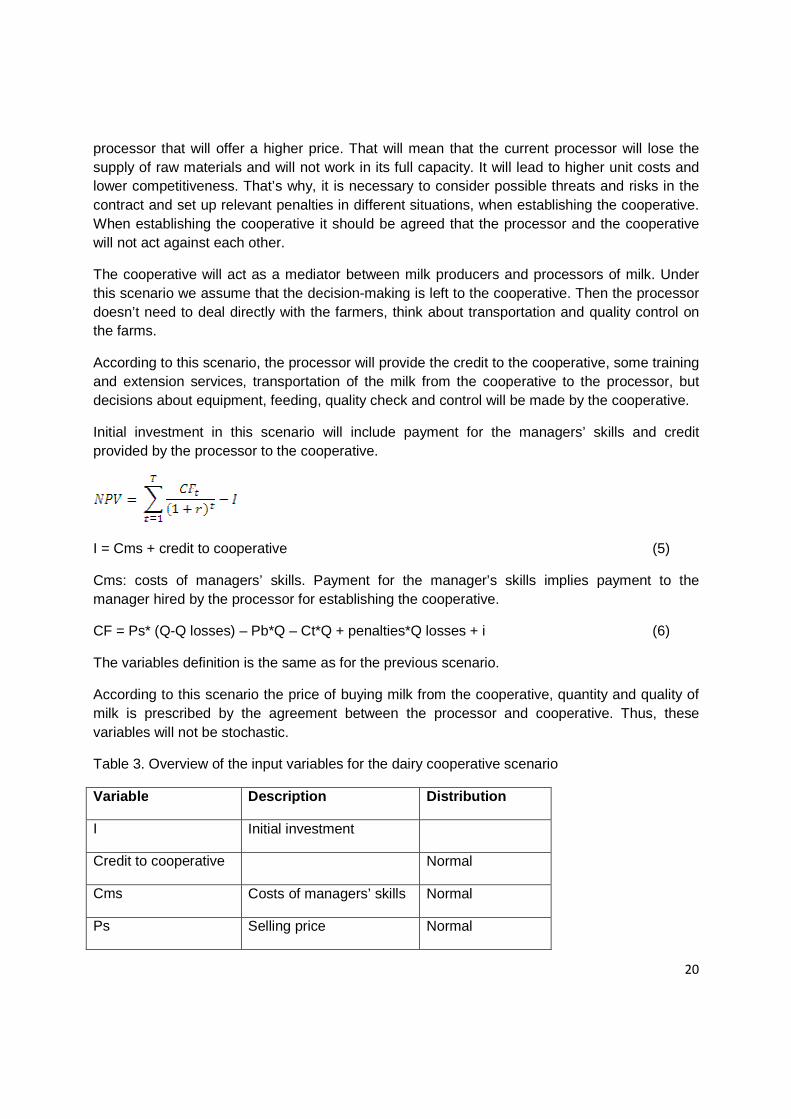
Initial investment in this scenario will include payment for the managers’ skills and credit provided by the processor to the cooperative.
I = Cms + credit to cooperative (5)
Cms: costs of managers’ skills. Payment for the manager’s skills implies payment to the manager hired by the processor for establishing the cooperative.
CF = Ps* (Q-Q losses) – Pb*Q – Ct*Q + penalties*Q losses + i (6)
The variables definition is the same as for the previous scenario.
According to this scenario the price of buying milk from the cooperative, quantity and quality of milk is prescribed by the agreement between the processor and cooperative. Thus, these variables will not be stochastic.
Table 3. Overview of the input variables for the dairy cooperative scenario
Variable Description Distribution
I Initial investment
Credit to cooperative Normal
Cms Costs of managers’ skills Normal
Ps Selling price Normal

21
Pb Price of buying from the farmer
Fixed value
Ct Transformation costs Normal
Q Milk amount Fixed value
r Discount rate Normal
Q losses Losses of milk due to the quality loss
Normal
Penalty Penalty payments Fixed value
i Payback loan and interest rate on the credit
Fixed value
Source: Own table based on the literature review
3.3.4 Own dairy farm scenario
Milkiland N.V. (Ukraine) owns its dairy farms, but they bought them, they didn’t build their own farms. They have in plans to actively develop their own farming business and to increase their own milk production (Milkiland N.V., 2010).
Own dairy farm scenario was developed as the one where the processors can control everything. The advantage of this scenario is that the processor can apply new technologies, new breeds, new feeding system, herd management to get high-quality and stable milk supply.
The threat of this scenario is that it can be hard for the manager to have a good overview of what is happening at different levels and to take reasonable decisions. Because with a centralised power and centralised decision-making the information flow can be slow. That can lead to slower reaction on the market changes.
This scenario requires the largest initial investments. According to this scenario the processor will buy or rent the building and all the equipment, the dairy herd and will hire employees.
I in this scenario will include costs of renting or buying the building, buying equipment and dairy herd and arranging contracts with employees.
I = Cbuilding + Cequip + C herd + C employment contracts (7)
Cbuilding: costs of a new building for the dairy farm.
Cherd: costs of buying the herd with high milk productivity.

22
C employment contracts: these are the costs of hiring and training employees.
CF = Ps*Q – PC *Q – Ct*Q - MS- Cv – Cm – Ci (8)
PC: costs of milk production at the own dairy farm.
MS: managers’ salary, they will be responsible for running the farm and organization of work there.
The other variables definition can be found in the previous scenarios.
Table 4. Overview of the input variables for the own dairy farm scenario
Variable Description Distribution
I Initial investment
Cbuilding Cost of a new building Normal
Cequip Costs of equipment Normal
C herd Costs of herd Normal
Ps Selling price Normal
PC Production costs Normal
Ct Transformation costs Normal
Q Milk amount Fixed value
r Discount rate Normal
MS Managers’ salary Normal
Cv Costs of veterinary check and vaccine
Normal
Cm Costs of quality monitoring Normal
Ci Costs of inputs (feed, medicine)
Normal
Source: Own table based on the literature review
Milk amount processed is assumed to be constant because the processor will work on its full capacity being supplied by the own dairy farm. Other variables are stochastic.
23
3.3.5 Data
3.3.5.1 Data for the “Do not change” scenario
For the “Do not change” scenario we should estimate the buying price for milk from the farmers, selling price for milk at the processor’s stage for the 20 year planning horizon. We also have to decide upon the transformation costs at the processing plant, capacity of the processor and discount rate.
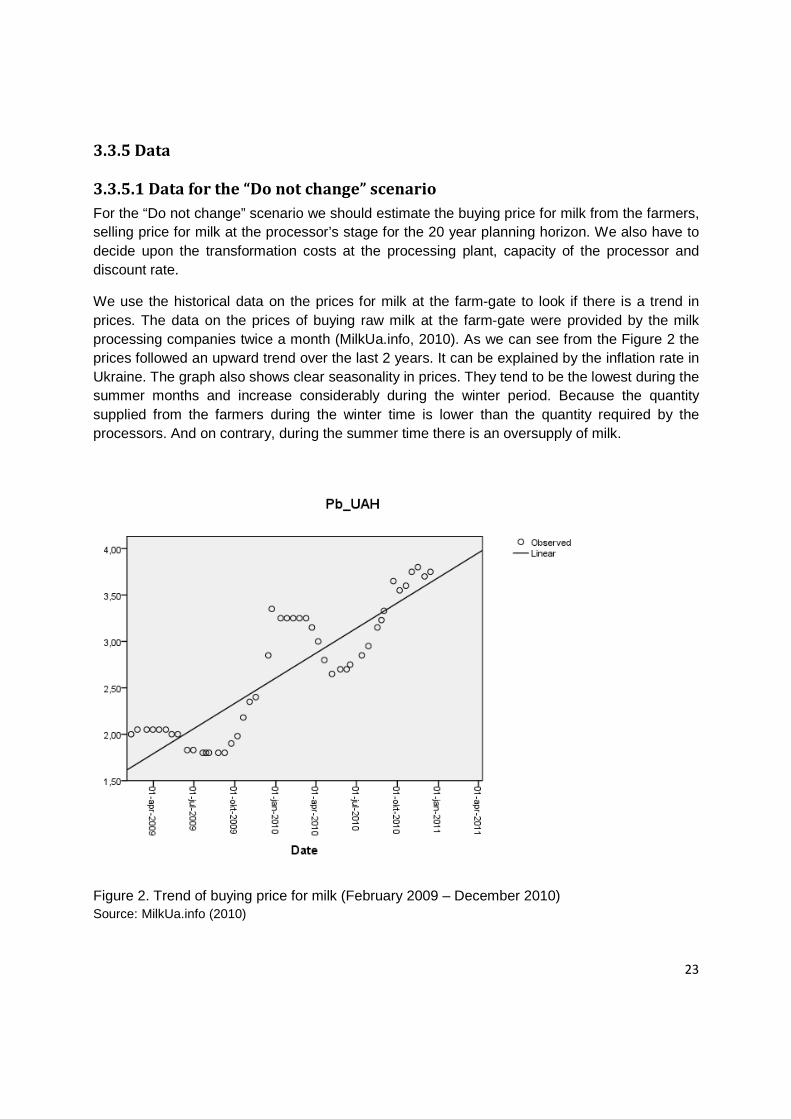
We use the historical data on the prices for milk at the farm-gate to look if there is a trend in prices. The data on the prices of buying raw milk at the farm-gate were provided by the milk processing companies twice a month (MilkUa.info, 2010). As we can see from the Figure 2 the prices followed an upward trend over the last 2 years. It can be explained by the inflation rate in Ukraine. The graph also shows clear seasonality in prices. They tend to be the lowest during the summer months and increase considerably during the winter period. Because the quantity supplied from the farmers during the winter time is lower than the quantity required by the processors. And on contrary, during the summer time there is an oversupply of milk.
Figure 2. Trend of buying price for milk (February 2009 – December 2010) Source: MilkUa.info (2010)

24
To predict the yearly prices of buying the milk from farmers for the next 20 years for the “Do not change” scenario we ran the linear regression on historical prices. Because the monthly data for the last 2 years may not be representative for the 20 years prediction, we use the yearly milk prices for the period 1996-2008 (FAOSTAT, 2010). They are available in Ukrainian hryvnias (UAH) for this period (see Appendix). The yearly prices for the years 2009 and 2010 were found as the averages of the monthly prices during those periods.
To quantify the buying price of milk for the next years we will use the equation:
Y= b0 + b1*year + e (9)
Where b0 shows the intercept, b1 represents the change in the price of milk associated with yearly change of time and e is an error term (Field, 2005).
We can see from the Model Summary table that our model can explain 82,5 % of the variation in the outcome (R2 = 0,825). That means that the yearly time change can explain 82,5 % variation in the buying price for milk.
Table 5. Model summary of the buying price regression analysis
Model Summary
Model R R Square
Adjusted R
Square
Std. Error of the
Estimate
1 ,908a ,825 ,811 377.21554
a. Predictors: (Constant), Year Source: Own calculations based on the FAOSTAT data (2010)
Our model to predict future buying prices for milk will be:
Pb = -351858,326 + 176,182 * year (10)
Table 6. Coefficients in the regression model on the buying prices of milk
Coefficients a
Model
Unstandardized Coefficients
Standardized
Coefficients
t Sig. B Std. Error Beta
1 (Constant) -351858,326 45153,615 -7,792 ,000
Year 176,182 22,543 ,908 7,815 ,000
a. Dependent Variable: Pb_per_tonn_UAH
Source: Own calculations based on the FAOSTAT data (2010)

25
As we can see from the Table 6 the correlation between the price for milk and time is positive and significant. This can be explained by the inflation.
To estimate the selling prices at the processors level we use information that the selling price was on average 28.85% higher than the buying price during the period from May to December 2010 (according to Taras Gagalyuk, Adviser on Agricultural Markets (Animal Production), Association “Ukrainian Agribusiness Club”). Based on this data we make an assumption that this trend will continue to the next years. The results of the yearly predictions for the milk prices for the next 20 years can be found in the Table 7.
To decide about the standard deviation of prices each year for the prices of buying we used the standard error of the estimate from the Model Summary. For the selling prices we calculated standard deviation using monthly data for 2 years, and it consisted on average 15% of the selling price. Therefore we assume that standard deviation of selling prices within the “do not change scenario” will be at the level 15 % of the mean value.
Table 7. Projected buying and selling prices and costs of transformation
Year Pb, UAH/t Ps, UAH/t Ct, UAH/t
2011 2443.68 3148.68 418.76
2012 2619.86 3375.69 448.95
2013 2796.04 3602.70 479.14
2014 2972.22 3829.71 509.33
2015 3148.40 4056.72 539.52
2016 3324.59 4283.73 569.71
2017 3500.77 4510.74 599.90
2018 3676.95 4737.75 630.10
2019 3853.13 4964.76 660.29
2020 4029.31 5191.77 690.48
2021 4205.50 5418.78 720.67
2022 4381.68 5645.79 750.86
2023 4557.86 5872.80 781.05
2024 4734.04 6099.81 811.24

26
2025 4910.22 6326.82 841.43
2026 5086.41 6553.83 871.63
2027 5262.59 6780.84 901.82
2028 5438.77 7007.86 932.01
2029 5614.95 7234.87 962.20
2030 5791.13 7461.88 992.39
Source: Own calculations based on different databases
To find out the costs of processing for our model we used an assumption based on the communication with Taras Gagalyuk. According to him the processing firms operate with low levels of profitability and low margins. We make an assumption that the profit margin set up by the processor was at the level of 10%. Therefore an estimate of the transformation costs will be as following:
Pb + Ct + 0,1 * (Pb + Ct) = Ps, (11)
Where Pb: price of buying milk, Ct: transformation costs, Ps: selling price for milk.
We can derive that:
Ct = (Ps -1,1 * Pb) / 1,1 (12)
The results of the calculation are presented in the Table 7.
The next stochastic variable is quantity of the milk processed. The quantity we decided for our model is the average capacity processing plant in Ukraine. The biggest players at the market have around 8% market share each, the average players have around 2 % of the total volume of the market for milk: 0,02* 586 000 ton (volume of the market) = 11 720 t (annually)
For the discount rate we use the annual discount rate of the National Bank of Ukraine (NBU). It is set up at the level 7.75% (NBU, 2010). As it is important to account for the inflation, we will add the correction on the inflation to the discount rate. The estimated inflation rate in Ukraine in 2010 is 12.30% (Indexmundi, 2010). The average inflation rate during the years 2003 – 2010 is 11.43 %. That’s why we will make a correction on the discount rate +11%. So the new discount rate will incorporate the inflation rate and will be 18.75%.
To adjust prices for inflation we can either deflate them and do not correct the discount rate, or we can use current prices and consider inflation rate within the discounting process. It was decided to use current prices and correct the discount rate for inflation because it was simpler to forecast milk prices in the current terms.

27
We don’t include fixed costs in our calculations. We make an assumption that fixed costs in all scenarios are going to be the same for the next 20 years, so we just drop them. Under fixed costs we imply a common part of the fixed costs that will occur in all the scenarios.
3.3.5.2 Data for the contract farming scenario
For the contract farming scenario we need to decide upon the price of buying milk from the farmers. The price of buying milk from the farmers will be agreed in the contract, it will be revised every year and adjusted to the market conditions, but it can not change within the year. According to the research conducted by Birthal et al. (2008) in India the output price in the open market was 6% higher than the price offered in the contract and 9% higher than that offered by the vendors. Therefore we make an assumption that prices of buying of milk from the farmers will be 6 % lower than those in the “do not change” scenario.
Because it was decided to assess these scenarios as a possibility to enter the European market for the contract farming, dairy cooperative and own dairy farm scenarios we will use current processors’ prices for milk in Europe for the selling price of milk. These prices will be the same for three scenarios: contract farming, dairy cooperative and own dairy farm.
Average producer milk price in Europe for October was 32.98 euro/100 kg (LTO Nederland, 2010), it is 42 % of the price, as reported by the Euromonitor. It follows that the average price of the retailers is 78.52 euro/100 kg, supermarkets have 24 % of this price (Dairy Reporter, 2010). Then we can conclude that supermarkets get milk from the processors at the price 59.68 euro/100kg or 596.80 euro/t. It is projected that the share of the retailers in the milk price will remain almost the same, and then the price of selling at the processor’s level will mainly depend on the consumer price of milk.
Harmonised index of consumer prices for food in EU dated on October 2010 was 115.34% (2005=100%), we will assume that the prices will continue growing with the same trend nearly 15% during each 5 years or 3% each year.
We calculate these selling prices first in EUR and then transform them into UAH. To account for the inflation in the currency exchange rate, the regression analysis on historical exchange rates was conducted and these rates were used to get the selling prices in UAH for the next 20 years.
For the transformation costs we make an assumption that they will remain the same for all scenarios. The reason is that we consider the investment decision making of the same processor with the same facilities and capacities. Therefore a mean milk quantity is also stable for all four scenarios.
For the contract farming scenario we need to decide about the number of farmers. Taking into account that milk quantity is 11 720 ton per year and the average milk yield per cow per year is 4, 0508 t (FAOSTAT, 2010), we need approximately 2 900 cows. We assume that each farmer has 3 cows, so we need around 970 farmers.

28
We assume that losses of milk due to incompliance with the quality requirements will be up to 8% of the whole amount of milk obtained from the farmers. Penalties for the losses were established according to the study of Velthuis and van Asseldonk (2010) at the level 0,1587 UAH per kg or 158,7 UAH per tonn.
The rough estimate of the initial investments required for this scenario was found for the similar project in Ukraine. The data indicate that the budget for this project is 1 million euro (= 10 573 138 UAH). The project is considered to include 1000 households. The budget covers: “institutional support and equipment, including large refrigerator baths, and milk quality analyzers, modern milking units provided to 250 families, training in animal care, organic agriculture and the fundamentals of business planning” (Kyivpost, 2010). But within our scenario the processor provides all the farmers with the milking equipment. That’s why we will include the costs of equipment for 720 farmers (=970-250). Each bucket milking installation costs 4 650 UAH (Agrosystema Ltd., 2010). Moreover the investment will also include 0.5 million euro (5 286 569 UAH) credit for farmers at a favorable interest rate 5% (Heifer International, 2010).
Therefore the initial investment will be:
I = 10 573 138 (project budget) + 4 650 * 720 (equipment) + 5 286 569 (credit to farmers)
Ilchuk and Radko (2008) made an estimation of the costs required for 400 herd farm. We will use their estimates for the costs of the veterinary check and vaccine, feed costs and costs of quality monitoring. As we have 2900 cows we will multiply the costs found in Ilchuk and Radko (2008) by 7,25. There is a possibility that there is some economies of scale effect which we overlook by simple multiplication. But it is not known about its extent.
3.3.5.3 Data for the dairy cooperative scenario
For the dairy cooperative scenario we have to decide which price will be paid to the cooperative for the milk. Because we want to enter the foreign market we also want Friesland Campina, which is a dairy cooperative, paid in 2009 EUR 26.22 per 100 kg of standard milk. IFCN report says that the milk price change during the period 2005-2008 was + 6,5% per year in the Netherlands. We assume it will be the same for the next 20 years. We calculated this price in EUR with the milk price nominal growth +6.5% and then calculated these prices in UAH using the forecasted exchange rate, based on the regression analysis of the historical data on currency exchange rates. These prices are not stochastic and do not change over the year because they are agreed in the contract.
The selling price of milk at the processor’s level will be the same as calculated for the contract farming scenario. It implies selling at the EU prices, because the quality requirements are to be met within this scenario.
Transformation costs remain the same for all four scenarios.
Amount of the milk for processing also does not differ between different scenarios. Several researches (Valeeva et al., 2007) showed that the payment incentives work as the motivators

29
for better quality of the bulk milk and mastitis management are effective. Therefore we apply penalties for the incompliance with the quality standards. They are at the same level as within the contract farming scenario.
The reward for the managerial skills required to set up the cooperative is established at the level UAH 100 000. Besides the payment for the managerial skills initial investments also include the credit to the cooperative (1 million euro = 10 573 138 UAH) with the interest rate 5%.
3.3.5.4 Data for the own dairy farm scenario
For the own dairy farm scenario the selling price is established at the same level as for the contract farming and dairy cooperative scenarios. The other variable in this scenario is the cost of milk production. Cost of milk production only at the farm (size 380) in 2008 was $19 (102,03 UAH) per 100 kg or 1020,30 UAH per ton (Hemme et al., 2009). And these costs are projected to grow on average by 15 % each year according to our scenario (Ministry of Agrarian Policy of Ukraine, 2010).
Transformation costs and amount of the milk for processing are the same as in the other scenarios.
Within this scenario we should invest into the herd buying. It was found that the average price for the milk cow imported in Ukraine in 2010 was around UAH 22 000 (MilkUa.info, 2010). For the contract farming scenarios we calculated that we need around 2900 cows, but in this case we import cows with the higher milk yield per year (for ex. based on the average milk yield per cow per year in the Netherlands 7,3422 t/year). Therefore to meet the demand for milk we need around 1600 cows.
Therefore costs of the herd buying will be: 1600*22000 = 35200000
We have to buy the equipment for milking and cooling. Side-by-side parlour for 200 cows costs around EUR 27 000 (UAH 285 390), we need 8 parlours. It will cost UAH 2 283 120 + UAH 600 000 for the cooling tanks = UAH 2 883 120.
Dries et al. found that it was proved by the research of Dries and Noev (2006) and White and Gorton (2006) that specialist storage in the form of new collection centers or on-farm cooling tanks is important for raising yields and quality in the dairy sector.
There are also estimates of the costs needed for the manure cleaning system, electricity and water supply system based on the findings of Ilchuk and Radko (2008). They provide data for the 400 cows farm. We will have 4 farms of 400 cows each within this scenario, that’s why we multiply the costs by 4.
UAH 600 000 * 4 (farms) = 2 400 000 (for the manure cleaning + electricity+ water)
The other costs like costs of veterinary check and vaccine, costs of feed, costs of quality monitoring, costs of employment contracts and costs of the building are also estimated according to their investigations.

30
4. Analysis of competitiveness of the Ukrainian dairy chain.
Results from Porter’s Diamond and SWOT analysis
There is no single definition of the competitiveness of the industry. But one of the most common definitions is given by Freebairn (1986): “Competitiveness is an indicator of the ability to supply goods and services in the location and form and at the time they are sought by buyers, at prices that are as good as or better than those of other potential suppliers, while earning at least the opportunity cost of returns on resources employed.” Drescher and Maurer (1999) argue that the term competitiveness means the ability of firms and industries to stay competitive on the market. That means to protect or get better position at the market comparing to the competitors.
Competitiveness can be viewed at different levels: competitiveness of the companies (microeconomic level), competitiveness of the industry (mesoeconomic level), and competitiveness of the country (macroeconomic level) (Drescher, Maurer, 1999). Hereafter the competitiveness at the mesoeconomic level will be discussed.
“Competitiveness can be defined as the ability of a farm/firm to compete with others in the marketplace. It can be measured in terms of productivity, cost, and profitability. However, apart from cost, quality is an important factor in determining competitiveness. It influences the output price, which means that profitability is a more relevant measure of competitiveness in such a situation” (Birthal et al., 2008).
4.1 Application of Porter’s diamond of competitive advantage
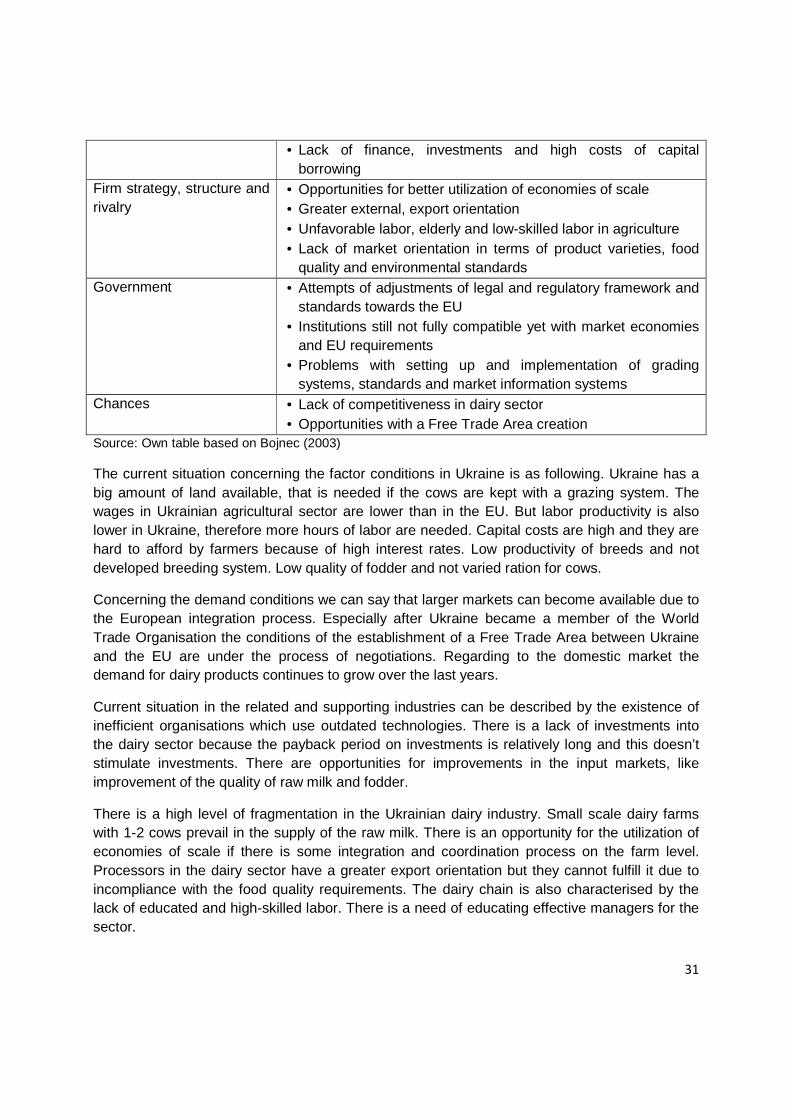
Based on the developments of Bojnec (2003) for the agriculture in Central and Eastern European countries some facts of the Porter’s Diamond of competitive advantage that are relevant to the Ukrainian dairy chain are presented in Table 8.
Table 8. Advantages and disadvantages for the Ukrainian dairy chain
Porter’s Diamond of Competitive Advantage
Existing situation
Factor conditions • Availability of agricultural land or arable land per capita • Lower wages • Higher capital costs • Lower labor productivity • Lower productivity of breeds • Lower quality of fodder
Demand conditions • Larger markets with European integration processes • Low purchasing power of the population
Related and supporting industries
• Opportunities for improvements in input markets • Persistence of inefficient organizations and outdated
technology
31
• Lack of finance, investments and high costs of capital borrowing
Firm strategy, structure and rivalry
• Opportunities for better utilization of economies of scale • Greater external, export orientation • Unfavorable labor, elderly and low-skilled labor in agriculture • Lack of market orientation in terms of product varieties, food
quality and environmental standards Government • Attempts of adjustments of legal and regulatory framework and
standards towards the EU • Institutions still not fully compatible yet with market economies
and EU requirements • Problems with setting up and implementation of grading
systems, standards and market information systems Chances • Lack of competitiveness in dairy sector
• Opportunities with a Free Trade Area creation Source: Own table based on Bojnec (2003)
The current situation concerning the factor conditions in Ukraine is as following. Ukraine has a big amount of land available, that is needed if the cows are kept with a grazing system. The wages in Ukrainian agricultural sector are lower than in the EU. But labor productivity is also lower in Ukraine, therefore more hours of labor are needed. Capital costs are high and they are hard to afford by farmers because of high interest rates. Low productivity of breeds and not developed breeding system. Low quality of fodder and not varied ration for cows.
Concerning the demand conditions we can say that larger markets can become available due to the European integration process. Especially after Ukraine became a member of the World Trade Organisation the conditions of the establishment of a Free Trade Area between Ukraine and the EU are under the process of negotiations. Regarding to the domestic market the demand for dairy products continues to grow over the last years.
Current situation in the related and supporting industries can be described by the existence of inefficient organisations which use outdated technologies. There is a lack of investments into the dairy sector because the payback period on investments is relatively long and this doesn’t stimulate investments. There are opportunities for improvements in the input markets, like improvement of the quality of raw milk and fodder.
There is a high level of fragmentation in the Ukrainian dairy industry. Small scale dairy farms with 1-2 cows prevail in the supply of the raw milk. There is an opportunity for the utilization of economies of scale if there is some integration and coordination process on the farm level. Processors in the dairy sector have a greater export orientation but they cannot fulfill it due to incompliance with the food quality requirements. The dairy chain is also characterised by the lack of educated and high-skilled labor. There is a need of educating effective managers for the sector.
32
With regards to the government factor we can say that there are attempts to adjust Ukrainian food standards to European standards. But still problems exist with setting up and implementation of the regulations which will comply with the EU requirements. Government also strives to motivate a development of the livestock sector which, if successful, will lead to more stable milk supply.
Concerning to the chances that are present in the Ukrainian dairy chain we can say that new markets can become available with the Free Trade Agreement. But to gain the benefits out of this situation Ukrainian dairy sector has to increase its competitiveness and quality and safety of its products.
Ramanovich and Hemme (2006) argue that in order to realize advantages in competitiveness, the enterprise can use cost leadership or product differentiation strategy or both. For milk production as a homogenous product, the cost leadership strategy is more common. It means that the farms which produce milk at lower costs and have a higher profit are more competitive. That implies that the enterprises that have higher costs will leave the market in the long term. Therefore the authors conclude that on a global scale milk production will relocate from less competitive regions to more competitive ones. Therefore Ukrainian dairy chain has to undergo structural changes and decrease the production costs in order to increase its competitiveness.
4.2 SWOT analysis of the Ukrainian dairy chain
To summarize the information that was found in the literature it might be useful to group the data in the form of the SWOT analysis. It would help then to answer the question about the competitive advantage of the Ukrainian dairy chain.
The elements of the Porter’s diamond can be included in the SWOT analysis of the Ukrainian dairy chain in comparison to the other dairy chains. Depending on the level of development, price and other conditions these elements can be strengths or weaknesses of the Ukrainian dairy chain, bring opportunities or threats to the chain on the world market.
First we’ll start with the factor conditions from the home-based determinants of international competitiveness within Porter’s Diamond.
Such factor conditions as labor, infrastructure, natural resources, capital available, knowledge resources will be assessed comparing to European competitors.
There is a lack of skilled labor in the Ukrainian dairy sector at different levels. There is a need to educate both milkmaids and agricultural economists. But the price for labor is lower in Ukraine than in the EU countries. Especially if we take into account that the milk from the small households come from the rural areas mainly, so the price of the labor can be considered as the price paid by the processors for the milk, excluding the costs of milk production. The workers at these small-scale dairy farms are mainly farmers, the owners of the households. Low price for the labor can reveal a competitive advantage for the Ukrainian dairy chain. Although higher use

33
of the manual labor can lower the quality of the dairy products due to bacteria and somatic cells content in milk.
There is a poor infrastructure in the industry. The equipment for the milk collection is old; therefore there is a loss of quality because of the old trucks which are collecting milk. And there is no a separation system in trucks which collect the milk from the households. That’s why all the milk that is coming from the households is directly considered as the second grade milk. There are no special milk cooling and storage systems at the milk producers’ places; they are mainly located at the processors’ places. Because of these reasons the shelf-life of the products becomes shorter. Roads in Ukraine, especially in the rural areas, are of very bad quality comparing to European ones. So, we can conclude that the infrastructure is superior in the EU countries.
With regards to natural resources, Ukraine has a good position due to availability of fertile land necessary for the grazing system. Weather conditions do not limit the silage. There is no water shortage in the regions where milk-producing farms and processing plants are located. Daily light length which can influence silage doesn’t differ very much from the daily light length in European countries –main producers of dairy products.
Regarding capital availability, it is more available in the European countries as the interest rate is lower there comparing with the interest rate in Ukraine.
Knowledge resources are highly concentrated in the European countries. The level of knowledge of specialist food processing is higher in the EU. Knowledge of food exporting is also widely found in European countries comparing to Ukraine. Therefore European countries are known for their export of high value-added products, while for Ukraine the export consists mostly of the skimmed milk powder export.
According to the Porter’s Diamond next factor is firm strategy, industry structure and rivalry conditions. The dairy industry in Ukraine consists of a high number of small-scale dairy farms. While in the EU it tends to follow a large-scale production pattern with the mainly cooperative governing system. The structure of the industry in Ukraine makes it harder to implement any coordination system while there will be a need to approach each farmer separately. It can be also harder to implement the quality control system in the whole industry due to its high fragmentation. There is also a threat of low ability to adapt to the market changes from the small-producers side, because it can involve high investments and high fixed costs.
Demand for dairy products remains high in European countries. The average consumption of dairy products per person in European countries is much higher than in Ukraine. Although there is a rise in dairy consumption per capita in Ukraine, it still didn’t reach a recommended level. Though the consumption of dairy products is growing over the last years in Ukraine, the structure of consumption in Ukraine is less variable than in the EU. But the changes in structure of dairy consumption follow the same pattern both in the EU and Ukraine. Consumption of liquid milk is decreasing as well as butter consumption, while cheese consumption is growing. Customers’ requirements in the EU are higher and more sophisticated than those in Ukraine,
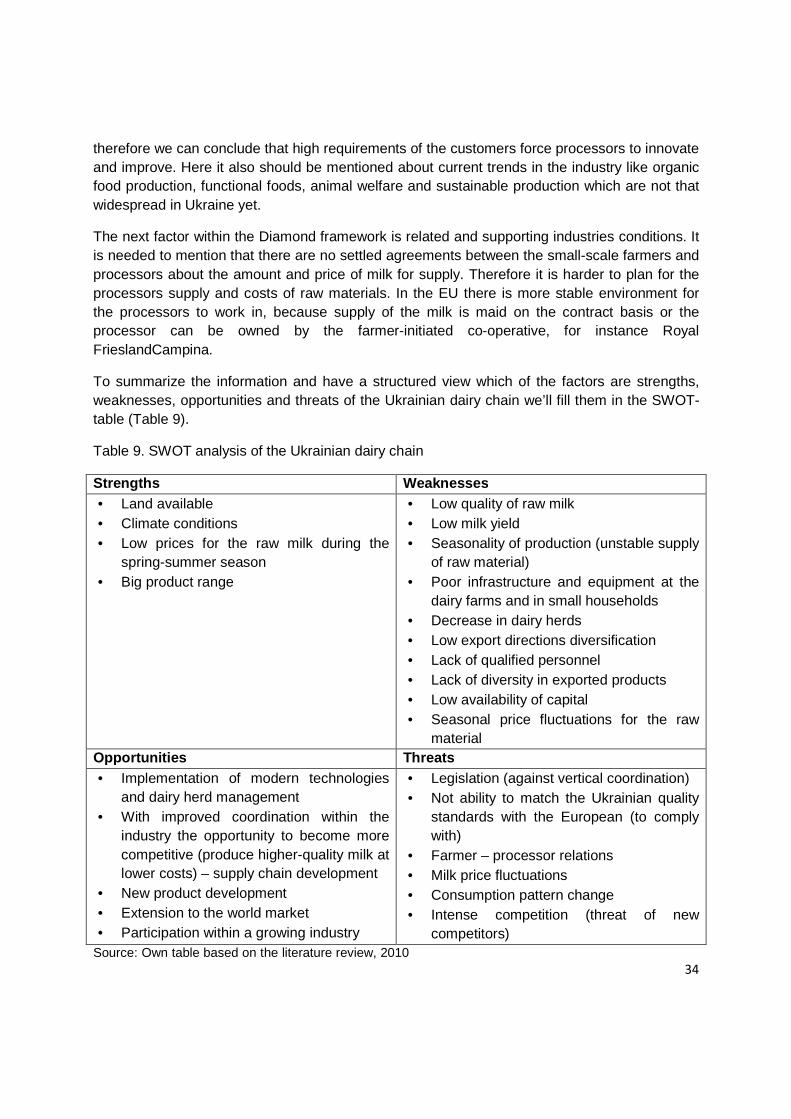
34
therefore we can conclude that high requirements of the customers force processors to innovate and improve. Here it also should be mentioned about current trends in the industry like organic food production, functional foods, animal welfare and sustainable production which are not that widespread in Ukraine yet.
The next factor within the Diamond framework is related and supporting industries conditions. It is needed to mention that there are no settled agreements between the small-scale farmers and processors about the amount and price of milk for supply. Therefore it is harder to plan for the processors supply and costs of raw materials. In the EU there is more stable environment for the processors to work in, because supply of the milk is maid on the contract basis or the processor can be owned by the farmer-initiated co-operative, for instance Royal FrieslandCampina.
To summarize the information and have a structured view which of the factors are strengths, weaknesses, opportunities and threats of the Ukrainian dairy chain we’ll fill them in the SWOT-table (Table 9).
Table 9. SWOT analysis of the Ukrainian dairy chain
Strengths Weaknesses • Land available • Climate conditions • Low prices for the raw milk during the
spring-summer season • Big product range
• Low quality of raw milk • Low milk yield • Seasonality of production (unstable supply
of raw material) • Poor infrastructure and equipment at the
dairy farms and in small households • Decrease in dairy herds • Low export directions diversification • Lack of qualified personnel • Lack of diversity in exported products • Low availability of capital • Seasonal price fluctuations for the raw
material Opportunities Threats • Implementation of modern technologies
and dairy herd management • With improved coordination within the
industry the opportunity to become more competitive (produce higher-quality milk at lower costs) – supply chain development
• New product development • Extension to the world market • Participation within a growing industry
• Legislation (against vertical coordination) • Not ability to match the Ukrainian quality
standards with the European (to comply with)
• Farmer – processor relations • Milk price fluctuations • Consumption pattern change • Intense competition (threat of new
competitors) Source: Own table based on the literature review, 2010
35
SWOT analysis conducted on the basis of empirical data leads to the following conclusions:
Strengths of the Ukrainian dairy chain include: low milk prices in the spring-summer season, availability of land for grazing feeding system, favorable climate conditions for grass silage, wide product range.
Weaknesses consist of the following: low quality of raw milk, low milk yield, seasonality of production (unstable supply of raw material), poor infrastructure and equipment at the dairy farms and in small households, decrease in dairy herds, low export directions diversification, lack of qualified personnel, lack of diversity in exported products, low availability of capital and price fluctuations for the raw material.
Opportunities for development of the Ukrainian dairy chain are seen in the following: further development of exports, promotion of milk and dairy products consumption on the local market, promotion of Ukrainian dairy products on foreign markets, implementation of modern technologies, dairy herd management, vertical coordination within the industry brings the opportunity to become more competitive (produce higher-quality milk at lower costs) – supply chain development and new product development.
Threats for the Ukrainian dairy chain are formulated as the following: low consumption levels of milk and processed dairy products in Ukraine, governmental interference against vertical coordination, no ability to match the Ukrainian quality standards with the European, tense and not officially established farmer – processor relations, milk price fluctuations and intense competition on the world market.
Ukrainian dairy producers should continue working on further improvement of the quality and safety of offered products and actively undertake promotional initiatives both on the local and world market. They should also seek to increase labor efficiency and to reduce operating costs. The purpose of such measures is further increase of competitiveness of the sector and the consolidation of the position of Ukrainian producers on international markets. They also should review consumer preferences on the constant basis because it can also bring a competitive advantage and increase competitiveness. Apart from the mentioned issues, innovation can also increase competitiveness. Investments into new capital equipment, new production facilities, and modernized infrastructure are significant for the competitiveness increase as well.
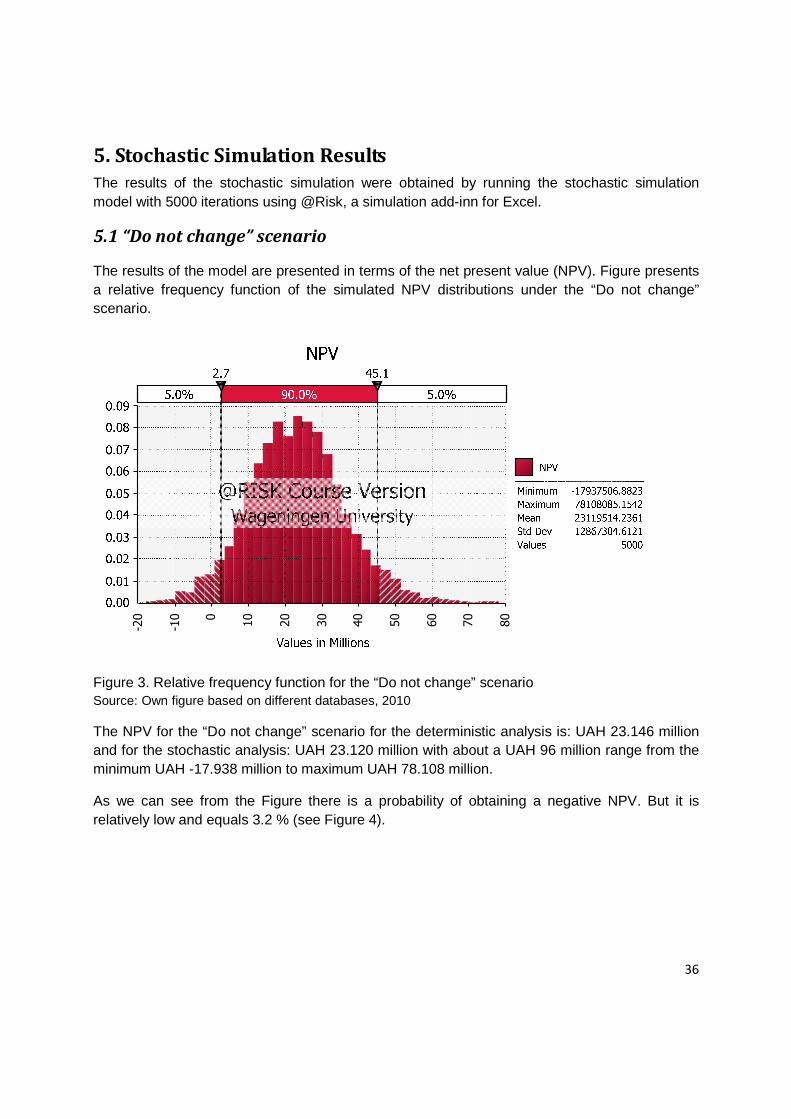
36
5. Stochastic Simulation Results
The results of the stochastic simulation were obtained by running the stochastic simulation model with 5000 iterations using @Risk, a simulation add-inn for Excel.
5.1 “Do not change” scenario
The results of the model are presented in terms of the net present value (NPV). Figure presents a relative frequency function of the simulated NPV distributions under the “Do not change” scenario.
-20
-10 0
10
20
30
40
50
60
70
80
Figure 3. Relative frequency function for the “Do not change” scenario Source: Own figure based on different databases, 2010
The NPV for the “Do not change” scenario for the deterministic analysis is: UAH 23.146 million and for the stochastic analysis: UAH 23.120 million with about a UAH 96 million range from the minimum UAH -17.938 million to maximum UAH 78.108 million.
As we can see from the Figure there is a probability of obtaining a negative NPV. But it is relatively low and equals 3.2 % (see Figure 4).

37
Figure 4. Relative frequency function for the “Do not change” scenario (negative NPV probability) Source: Own figure based on different databases, 2010
Figure 5 depicts the cumulative distribution function of the “Do not change” scenario. From this Figure we can see that in 90 % of the cases the NPV will fall into the range from UAH 2.7 million to UAH 45.1 million.
Figure 5. Cumulative distribution function for the “Do not change” scenario Source: Own figure based on different databases, 2010
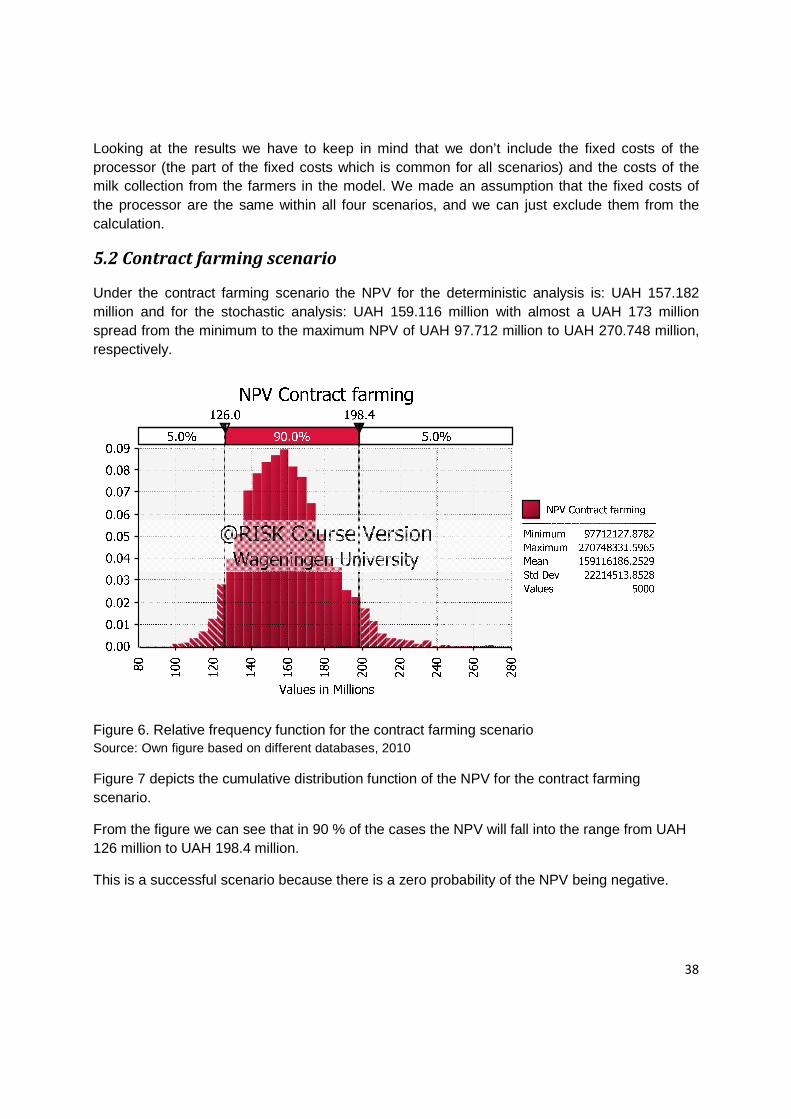
38
Looking at the results we have to keep in mind that we don’t include the fixed costs of the processor (the part of the fixed costs which is common for all scenarios) and the costs of the milk collection from the farmers in the model. We made an assumption that the fixed costs of the processor are the same within all four scenarios, and we can just exclude them from the calculation.
5.2 Contract farming scenario
Under the contract farming scenario the NPV for the deterministic analysis is: UAH 157.182 million and for the stochastic analysis: UAH 159.116 million with almost a UAH 173 million spread from the minimum to the maximum NPV of UAH 97.712 million to UAH 270.748 million, respectively.
Figure 6. Relative frequency function for the contract farming scenario Source: Own figure based on different databases, 2010
Figure 7 depicts the cumulative distribution function of the NPV for the contract farming scenario.
From the figure we can see that in 90 % of the cases the NPV will fall into the range from UAH 126 million to UAH 198.4 million.
This is a successful scenario because there is a zero probability of the NPV being negative.

39
Figure 7. Cumulative distribution function for the contract farming scenario Source: Own figure based on different databases, 2010
5.3 Dairy cooperative scenario
The NPV for the deterministic and stochastic analysis were UAH 120.840 and UAH 121.570 million, respectively, for dairy cooperative scenario. The stochastic analysis projected NPV has a minimum and maximum of UAH 84.370 million and UAH 175.520 million, respectively, with a UAH 91 million range.
80
90
100
110
120
130
140
150
160
170
180
Figure 8. Relative frequency for the dairy cooperative scenario Source: Own figure based on different databases, 2010

40
By only analyzing the deterministic NPV we would miss a wide range of possible outcomes and could make a bad decision.
Figure 9 presents a cumulative distribution function of the simulated NPV distributions under the dairy cooperative scenario. It shows that in 90 % of the cases the NPV will be in the range from UAH 101.8 million to UAH 144.1 million.
The same like under the contract farming scenario, in the dairy cooperative scenario there is no chance that the NPV will be less than zero.
5.0% 90.0% 5.0%
101.8 144.1
80
90
100
110
120
130
140
150
160
170
180
Values in Millions
0.0
0.2
0.4
0.6
0.8
1.0
NPV Dairy cooperative
NPV Dairy cooperative
Minimum 84370412.8079
Maximum 175519789.5448
Mean 121569754.8734
Std Dev 12956852.6968
Values 5000
Figure 9. Cumulative distribution function for the dairy cooperative scenario Source: Own figure based on different databases, 2010
5.4 Own dairy farm scenario
Under the own dairy farm scenario the NPV for the deterministic results is UAH 149.845 million and UAH 150.519 million for the stochastic model with the stochastic minimum and maximum NPVs UAH 96.025 million and UAH 212.055 million, respectively, with a UAH 116 million spread.

41
5.0% 90.0% 5.0%
124.3 178.8
80
100
120
140
160
180
200
220
Values in Millions
0.00
0.01
0.02
0.03
0.04
0.05
0.06
0.07
0.08
NPV Own dairy farm
NPV Own dairy farm
Minimum 96025152.4727
Maximum 212054790.2512
Mean 150519382.5450
Std Dev 16688087.9488
Values 5000
Figure 10. Relative frequency for the own dairy farm scenario Source: Own figure based on different databases, 2010
The cumulative distribution function for the own dairy farm scenario (see Figure 11) tells us that there is a 90% probability that the NPV for this scenario will be within the range from UAH 124.3 million to UAH 178.8 milion.
Figure 11. Cumulative distribution function for the own dairy farm scenario Source: Own figure based on different databases, 2010

42
Again like in two previous scenarios the NPV has only positive values and this investment is successful.
5.5 Summary of the stochastic simulation results
Figure 12 presents the cumulative distribution functions of the simulated NPV distributions under the four scenarios.
As we can see almost all cumulative distribution functions of the simulated NPV distributions have similar shape, only cumulative distribution function under the contract farming scenario is flatter than others. It implies that there is a larger range between the minimum and maximum NPVs for this scenario compared to other scenarios.
-50 0
50
100
150
200
250
300
Figure 12. The cumulative distribution functions for NPVs for all scenarios Source: Own figure based on different databases, 2010
Looking at the figure we can conclude that the NPV under the contract farming scenario stochastically dominates over other NPVs. It’s a first-degree stochastic dominance. This implies that the contract farming scenario is the most beneficial for the investors.
Levy (1992) provides a rule of the first-degree stochastic dominance. Let A and B be the cumulative distribution functions of two different uncertain options, X and Y. A dominates B by the first-degree stochastic dominance, if and only if,
A (X) ≤ B (Y) for all X (first degree stochastic dominance).

43
As we can see from the figure, this rule is satisfied for the contract farming scenario dominating over other scenarios.
Our results show that at every value of the NPV the probability to obtain larger NPV is higher under the contract farming scenario compared with the probabilities under the other scenarios.

44
6. Conclusions and Discussions
6.1 Conclusions
The purpose of this thesis was to find out and assess the ways how the dairy processing company can improve the competitiveness of the dairy chain. For this goal both qualitative and quantitative analyses were conducted. The results of both analyses showed that the changes are needed in order to improve the competitiveness of the Ukrainian dairy chain.
The literature study showed that the further development of the dairy chain depends on the availability of sufficient supply of relatively inexpensive and high-quality raw milk for processing (Nivyevskyi, von Cramon-Taubadel, 2008).
Unstable supply, high production costs and low-quality of raw milk proved to be the major obstacles for competitiveness of Ukrainian dairy products on the world market. And if the Ukrainian dairy sector can prevail over the problems within the sector and increase productivity by rising investments, it has an opportunity to get a larger share on foreign markets.
To find out the competitive advantage of the Ukrainian dairy chain the Porter’s Diamond and SWOT analyses were conducted. The results show that cheap labor and natural resources are the superior factors for the Ukrainian dairy chain. Although higher use of the manual labor can lower the quality of the dairy products due to bacteria and somatic cells content in milk. With regards to natural resources, Ukraine has a good position due to availability of fertile land, good weather conditions and water availability in the regions where milk-producing farms and processing plants are located.
To improve the situation in the dairy farming and employ the competitive advantages the implementation of the coordination mechanisms can be helpful. Vertical coordination within the industry brings the opportunity to become more competitive and produce higher-quality milk at lower costs. In this thesis we considered four different options of the processor-initiated vertical coordination: “do not change” scenario, contract farming, dairy cooperative and own dairy farm scenarios. The processors are considered to initiate changes because they are interested in the high-quality raw milk; and they have more capacities, power and influence than dairy farmers to start changing the current situation in the Ukrainian dairy chain.
The stochastic simulation model was developed to assess all 4 scenarios. The results of this research have demonstrated that there is a need to make changes in the current situation and that all vertical coordination scenarios that were compared to the “Do not change” scenario proved to bring better financial results than the base scenario.
According to our results under the contract farming scenario the NPV will be the highest. Therefore, the dairy processor should invest in this scenario to get the best financial outcomes. Given that our assumptions are true and taking into consideration that our model accounts for the uncertainty in the environment we interpret our outcome as the most appropriate way to improve the competitiveness of the Ukrainian dairy chain.

45
The outcomes of the stochastic simulation model can be explained by the differences in profits within different scenarios. Although the scenario with the higher profit doesn’t ultimately mean that it is the best scenario, because the initial investments for all scenarios are different.
The major driving forces of the results obtained are buying price of milk (or production costs for the own dairy farm scenario), selling price of milk and different level of capacity utilization.
The level of capacity utilization and the selling price of milk can explain a huge difference between the base scenario and the export-oriented scenarios (the contract farming, the dairy cooperative and the own dairy farm scenarios). Under the base scenario the amount of milk processed annually is stochastic, because there can be a lack of the raw milk due to the current trend of the herd decrease. On contrary, under the export – oriented scenarios the amount of milk for processing is a fixed value, assuming that the processor will run at full capacity.
The other factor which drives the results is the selling price of milk. It is the same within the export-oriented scenarios but it makes a considerable difference when comparing the contract farming, the dairy cooperative and the own dairy farm scenarios with the “do not change” scenario.
When considering the results obtained under the export-oriented scenarios, it can be concluded that they are mainly driven by the differences in the buying price for milk (or production costs under the own farm scenario).
Besides the financial benefits for the processor, vertical integration in the dairy chain improve welfare of the customer and bring positive effects not only to the industry but to the whole society because of the stabilization of prices and supply and cheaper food because of the more effective organization. Apart from the economic effects there can also be an important effect of strengthening trust and social capital.
6.2 Discussions
The scenarios which were considered in the thesis required historical data on the milk prices, as well as costs of milk transformation. Lack of data is the limitation of this research. Because we try to predict the situation with prices for the next 20 years using the data only for 15 years. Lack of historical data can cause that the prediction for the next years is not very accurate. Using the monthly data instead of the yearly data could provide better outcomes. Other costs used in the scenarios are also not precise but the estimates. If better data was used, then the results would be more certain.
The input values we used in our model are based on different data sources. And the data was found in different currencies and transformed into UAH using the average exchange rates, because there was no data available in one currency. Therefore it is assumed that the applied data is comparable.
Apart from the data availability, the next limitation is that the results are interpretable only comparatively between the scenarios. This is because we exclude from the analysis the part of

46
fixed costs that are common to all scenarios. Therefore, the values we obtained for the NPV in this research can not be compared with the NPV of the projects not considered within this thesis.
Within this research we considered four main scenarios, although more scenarios can be modeled with more than 2 parties involved. For example, the scenario with a triangular structure: dairy farmers - a dairy processor – a dairy equipment seller. This scenario is implemented in Russia where the dairy processor Wimm Bill Dann Company collaborates with the dairy equipment seller De Laval.
Next limitation is that decisions about the inclusion of different factors in the model are subjective to the researcher. The model, as a reduction of the reality, displays only the major factors. All the scenarios will need some adjustments and corrections when we apply them to real processing companies and dairy farmers. The results wouldn’t be applicable for all the processors and farmers, because additional data might be required; specific to particular participants, but it gives us a general overview which of the scenarios work out better than others in the Ukrainian dairy chain.

47

48
7. Recommendations
As a recommendation for the dairy processor it is suggested to collect more data before investing into any of the scenarios and then apply the model developed in this thesis. Moreover, the model should be adjusted to the specific conditions, existing experience and practice and current situation of every particular processor. Therefore more variables may be added to the model. More specific data and more accurate model will provide the processor with a better result.
Considering the international experience it is also recommended for the dairy processors to pay not for the total mass of milk delivered from the dairy farms but for the protein and fat content.
The other suggestion is to implement quality assurance programs or certification schemes for the dairy farms. This will help to reach the required quality level of milk as stated by Velthuis and van Asseldonk (2010) referring to the findings of Meuwissen et al.
For the further research it is recommended to collect additional and more precise data from the primary sources and include the fixed costs into the calculation. In order to make the results comparable with the outcomes of other models and scenarios not considered in this thesis. It is also suggested to develop a model with more than 2 parties involved.

49

50
References
Association Ukrainian Agribusiness Club (UCAB), 2008. Dairy industry: Ukraine – 2007. Logos, Kyiv
Beamon B.M., 1998. Supply chain design and analysis: Models and methods. Int. J. Production Economics 55, Elsevier
Birthal P. S., Jha A.K., Tiongco M.M., Narrod C., 2008. Improving Farm-to-Market Linkages through Contract Farming: A Case Study of Smallholder Dairying in India. IFPRI Discussion Paper 00814
Bojnec S., 2003. Three Concepts of Competitiveness Measures for Livestock Production in Central and Eastern Europe. Agric. conspec. sci. Vol. 68(3)
Cini V., Nater N., 2009. Porter’s Diamond Model of Osijek-Baranja County Industry. Interdisciplinary Management Research V, p.761-770
Clemen R.T., Reilly T., 2004. Making Hard Decisions with Decision Tools. Cengage Learning Inc.
Drescher K., Maurer O., 1999. Competitiveness in the European dairy industries. Agribusiness, Vol. 15, No. 2, p.163–177
Dries L. et al., 2009. Farmers, Vertical Coordination, and the Restructuring of Dairy Supply Chains in Central and Eastern Europe. World Development Vol. 37, No. 11, p. 1742–1758
Field A., 2005. Discovering Statistics Using SPSS, 2nd edition. SAGE publications
Freebairn J., 1986: Implications of Wages and Industrial Policies on Competitiveness of Agricultural Export Industries. Paper presented at the Australian Agricultural Economic Society Policy Forum, Canberra
Hemme et al., 2009. IFCN Dairy Report 2009, International Farm Comparison Network. Dairy Research Center, Kiel, Germany
Hess S., Voget B. and Ryzhkova M., 2008. The EU Dairy Market – Real Opportunities for Ukraine? Policy Paper Series [AgPP No 19], Kyiv
Ilchuk M., Radko V., 2008. Strategic Tasks of Dairy Farming. Dairy industry: Ukraine – 2007. Logos, Kyiv, p.44-48
Johnson G., Scholes K., Whittington R., 2009. Fundamentals of strategy. FT Prentice Hall, Harlow
Kotler P., Keller K.L., 2009. Marketing Management, 13th edition. Pearson Education International

51
Levy H., 1992. Stochastic Dominance and Expected Utility: Survey and Analysis. Management Science, Vol. 38, No. 4, p. 555-593
Nivyevskyi O., Ilienko I. and Ryzhkova M., 2008. Dairy Supply Chain in Ukraine: Bottlenecks and Directions For Development. Poster Paper presented at IAMO Forum 2008, Halle, Germany
Nivyevskyi O., von Cramon-Taubadel S., 2008. The Determinants of Dairy Farming Competitiveness in Ukraine. Policy Paper Series [AgPP No 23], Kyiv
Ramanovich M., Hemme T., 2006. Is the milk production in the CEEC competitive? IFCN Dairy Research Center, Braunschweig, Germany
Richardson J.W. et al., 2006. Risk Assessment in Economic Feasibility Analysis: The Case of Ethanol Production in Texas. AFPC Research Report 06-3
Szabó G.G., Popovics P., 2009. Possible ways of market coordination and integration in the Hungarian dairy sector
Valeeva N., T. J. G. M. Lam, and H. Hogeveen, 2007. Motivation of dairy farmers to improve mastitis management. J. Dairy Sci. 90(9): p.4466-4477.
Velthuis A.G.J. and M.A.P.M. van Asseldonk, 2010. Process audits versus product quality monitoring of bulk milk
Agrosystema Ltd., 2010. Available online at: http://agrosystem.com.ua/index.php?page=shop.product_details&flypage=flypage.tpl&product_id=805&category_id=26&option=com_virtuemart&Itemid=1&vmcchk=1&Itemid=1
FAO, 2010. Food Outlook. Global Market Analysis. June 2010. Available online at: http://www.fao.org/docrep/012/ak349e/ak349e00.pdf
FAOSTAT, 2010. Available online at: http://faostat.fao.org/site/569/DesktopDefault.aspx?PageID=569#ancor
Kyivpost, 2010. Available online at: http://www.kyivpost.com/news/business/business-sense/detail/87131/
MilkUa.info, 2010. Available online at: http://milkua.info/index.php?news2=1783
Milkiland N.V., 2010. Available online at: http://www.milkiland.nl/en/O_kompanii/Organizational_Structure,
NBU (National Bank of Ukraine), 2010. Available online at: http://www.bank.gov.ua/engl/Statist/Stat_data/discount_rate_e.htm
LTO Nederland, 2010. Available online at: http://www.milkprices.nl/
52
Danone Ecosystem Fund, 2010. Available online at: http://ecosysteme.danone.com/project/ukraine-milk-communities/
Indexmundi, 2010. Available online at: http://www.indexmundi.com/ukraine/inflation_rate_(consumer_prices).html
Dairy Reporter, 2010. Available online at: http://www.dairyreporter.com/Markets/Producer-share-of-milk-pie-to-decline-further-says-Euromonitor
Heifer International, 2010. Available online at: http://www.heifer.org.ua/eng/Learn/Coop%20meeting%20Oct%202010.htm
Ministry of Agrarian Policy of Ukraine, 2010. Available online at: http://www.minagro.kiev.ua/page/?10948

Appendix
Producer Price (Local Currency/tonne) (LCU)
item 1996 1997 1998 1999 2000 2001 2002 2003 2004 2005 2006 2007 2008
Ukraine Cow milk, whole, fresh 192.0 240.0 284.0 360.0 536.0 604.0 541.0 697.0 835.0 1127.0 1070.0 1661.0 2065.0
[ ] = Official data
Source: FAOSTAT, 2010