Port evolution and performance in changing logistics environments
28
AUTHOR COPY Original Article Port evolution and performance in changing logistics environments Su-Han Woo, Stephen Pettit and Anthony K.C. Beresford Transport and Shipping Research Group, Logistics and Operations Management Section, Cardiff Business School, Cardiff University, Aberconway Building, Colum Road, Cardiff CF10 3EU, UK. E-mail: [email protected] Abstract In recent years there have been significant changes to the logistics environment in which ports operate, which is now focused on supply chain management, global networking and customer orientation practices. Furthermore, ports have adopted different strategies concerning their level and form of integration into supply chains, service quality and provision of value-added activities. Traditional port performance indicators focus on specific ‘efficiency’ measures, whereas contemporary indicators are expected to be in- clusive of all aspects of operations and to be consistent with the strategies of the organisation. In this regard, this article analyses the changes currently taking place in the port industry and develops a port performance framework that reflects these changes. The framework was designed based on exploratory study, and the validity and reliability of the framework were confirmed using Confirmatory Factor Analysis. It is concluded that port performance is multifaceted, not limited to internal processes and also related to external service aspects such as service quality and logistical elements such as value-added services. In addition, it is shown that port operating companies and port authorities should strive to maintain a balanced focus on both effectiveness and efficiency aspects of performance management and improvement, aiming to meet the requirements of customers and other supply chain actors. Maritime Economics & Logistics (2011) 13, 250–277. doi:10.1057/mel.2011.12 Keywords: port evolution; port performance; performance measurement; Confirmatory Factor Analysis; effectiveness; efficiency Introduction Performance measurement plays an important role in all areas of business management in both the private and public sectors because it explains the r 2011 Macmillan Publishers Ltd. 1479-2931 Maritime Economics & Logistics Vol. 13, 3, 250–277 www.palgrave-journals.com/mel/
Transcript of Port evolution and performance in changing logistics environments
AUTHOR COPY
Original Article
Port evolution and performance in changing
logistics environments
S u - H a n Wo o , S t e p h e n Pe t t i t a n d A n t h o n y K . C . B e r e s f o r d
Transport and Shipping Research Group, Logist ics and OperationsManagement Section, Cardiff Business School, Cardiff University,Aberconway Building, Colum Road, Cardiff CF10 3EU, UK.E-mail: [email protected]
Abst ract In recent years there have been significant changes to the logistics
environment in which ports operate, which is now focused on supply chain management,
global networking and customer orientation practices. Furthermore, ports have adopted
different strategies concerning their level and form of integration into supply chains, service
quality and provision of value-added activities. Traditional port performance indicators focus
on specific ‘efficiency’ measures, whereas contemporary indicators are expected to be in-
clusive of all aspects of operations and to be consistent with the strategies of the organisation.
In this regard, this article analyses the changes currently taking place in the port industry and
develops a port performance framework that reflects these changes. The framework was
designed based on exploratory study, and the validity and reliability of the framework were
confirmed using Confirmatory Factor Analysis. It is concluded that port performance is
multifaceted, not limited to internal processes and also related to external service aspects
such as service quality and logistical elements such as value-added services. In addition, it is
shown that port operating companies and port authorities should strive to maintain a
balanced focus on both effectiveness and efficiency aspects of performance management and
improvement, aiming to meet the requirements of customers and other supply chain actors.
Maritime Economics & Logistics (2011) 13, 250–277. doi:10.1057/mel.2011.12
Keywords: port evolution; port performance; performance measurement;
Confirmatory Factor Analysis; effectiveness; efficiency
Int roduct ion
Performance measurement plays an important role in all areas of business
management in both the private and public sectors because it explains the
r 2011 Macmillan Publishers Ltd. 1479-2931 Maritime Economics & Logistics Vol. 13, 3, 250–277www.palgrave-journals.com/mel/
AUTHOR COPY
extent to which companies and organisations have achieved their goals and
objectives, and gives guidance on how they can make improvements. Therefore,
companies and organisations are making an effort to measure their perfor-
mance in a proper way and researchers have been endeavoring to develop
performance measurement frameworks, or metrics, which are appropriate
for individual industries. In the port operations and management research
field, performance measurement has been one of the main issues. Most cases
compare performance or efficiency of international container ports (for
example, Tongzon and Ganesalingam, 1994; Tongzon, 2001; Cullinane et al,
2004). Some researchers have evaluated ports in a particular country (for
example, Sachish, 1996). Attempts to identify indicators (for example, Tongzon,
1995) or methods (for example, Talley, 1988, 1994) that are appropriate for port
performance evaluation have also been made.
However, it has been argued recently that most studies on port performance
measurement are biased and out of date (Marlow and Paixao-Casaca, 2003;
Bichou, 2004; Brooks, 2007). This argument is closely related to parallel views
on the rapidly changing logistics environment and the evolution of ports. Owing
to the trend towards globalising operations and management, the logistics
industry has not only become more competitive, but now also has to meet the
more complicated and diverse demands of customers. In response to this
challenge, port operators and port authorities are adopting new strategies for
improving service quality. As well as improving efficiency, approaches include
developing strategic integration along the supply chain and adopting customer-
oriented practices and value-added activities. However, despite the evolution
of ports, port performance measurement studies still focus on traditional
efficiency metrics while the new strategies that ports are adopting are associated
with effectiveness rather than efficiency.
The arguments for extending port performance beyond those considered in
traditional studies of port performance measurement can be represented as fol-
lows. First, traditional measures cover the efficiency of internal operations rather
than the effectiveness of ports or terminals in delivering what customers want.
Brooks (2007) argues that port literature has focused more narrowly on mea-
suring efficiency whereas other transport modes such as air, road and rail put
a greater emphasis on external perspectives such as customer orientation, relia-
bility and service. Bichou (2007) demonstrates that port performance measure-
ment systems are hardly ever used to capture both efficiency and external
effectiveness, and a single focus on either efficiency or effectiveness does not
seem to be the only way to increase performance. Panayides (2006) also suggests
that ports in the supply chain era, apart from cargo throughput, may have other
valid and useful measures of performance, such as leanness, agility and time
compression as well as the performance of other parties in the supply chains.
Port evolution and performance in changing logistics environments
251r 2011 Macmillan Publishers Ltd. 1479-2931 Maritime Economics & Logistics Vol. 13, 3, 250–277
AUTHOR COPY
Second, traditional measures are fragmented and biased towards measures
related to throughput derived from sea transport, for example ship turnaround
time. For example, Bichou (2007) indicates that most port performance litera-
ture focuses solely on this type of measure, overlooks other port operating
system processes and ignores the interests of other members of the port’s
supply chain network. Third, efficiency studies using Data Envelopment
Analysis (DEA) generally evaluate or compare port performance by focusing on
the operational efficiency of container terminals (Bichou, 2007; Cochrane, 2007).
As DEA results are sensitive to the choice of, and weights attributed to, input-
output variables (Cullinane et al, 2004) it is important that the variables used are
not selected subjectively or arbitrarily and without thorough empirical analysis.
A number of studies suggest that performance evaluation systems should
be inclusive of all aspects of operations, and should also be consistent with
organisational goals (see, for example, Talley, 1994; Beamon, 1999). Otherwise,
performance evaluation is not able to provide policy makers, port authorities
and port operating companies with valid information, and could mislead them
into making wrong decisions. The primary objective of this article is to develop a
port performance measurement framework and instruments for the changing
logistics environment using Confirmatory Factor Analysis (CFA). In this study,
port performance measurement is assumed to be multifaceted and multi-
dimensional so that it can reflect all the significant factors affecting port evo-
lution. Measurement instruments, or scales, are developed when phenomena
that are believed to exist because of our theoretical understanding of the world,
but which cannot be assessed directly, need to be measured (DeVellis, 1991).
This study develops measurement instruments for port performance that cover
significant port evolution aspects and that need to be included in port perfor-
mance metrics. It also examines the validity and reliability of the instruments
with CFA. The following section identifies the key port evolution aspects from
the relevant literature and proposes a new port performance measurement
model. Subsequently, the research process and methodology that is applied in
this study is discussed. The results of an exploratory study and the adjusted
measurement model based on the results of the exploratory study are then
presented, followed by validation of the adjusted model through an empirical
study. The final section presents the research findings and the implications of the
research, discusses its limitations and suggests further possible research to build
on this study.
Port Evo lut ion and Performance Measurement Framework
Port management and strategies are both directly and indirectly influenced by
prevailing logistics trends, as the demand for port services is a double-derived
Woo et al
252 r 2011 Macmillan Publishers Ltd. 1479-2931 Maritime Economics & Logistics Vol. 13, 3, 250–277
AUTHOR COPY
demand (Marlow and Paixao-Casaca, 2003). Changing logistics strategies and
the demand patterns of manufacturing companies create many challenges to
which the logistics and transport industries have to respond. From the port
industry’s point of view the shipping industry’s response to change creates
major challenges and it is this industry that has the most direct impact upon it.
Specifically, this means that port operators and port authorities have to carefully
consider their reaction to change and act appropriately.
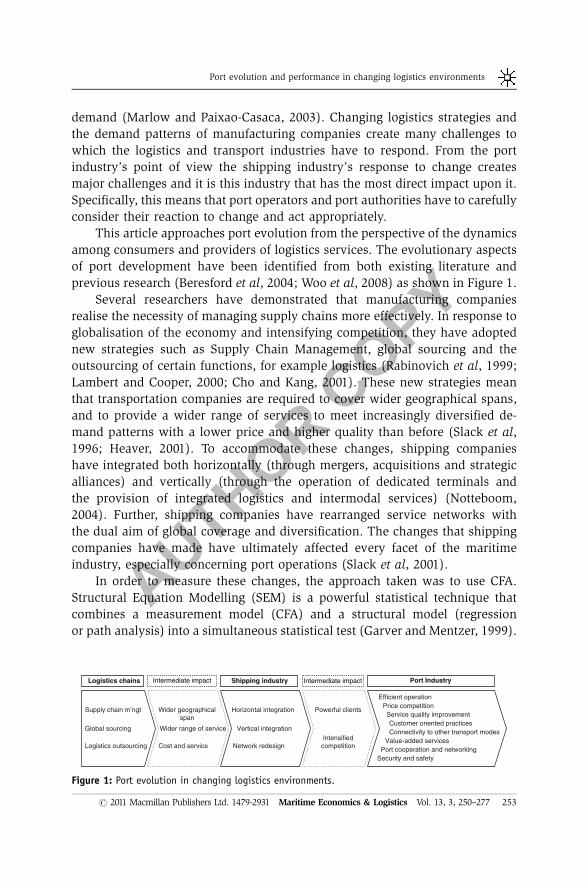
This article approaches port evolution from the perspective of the dynamics
among consumers and providers of logistics services. The evolutionary aspects
of port development have been identified from both existing literature and
previous research (Beresford et al, 2004; Woo et al, 2008) as shown in Figure 1.
Several researchers have demonstrated that manufacturing companies
realise the necessity of managing supply chains more effectively. In response to
globalisation of the economy and intensifying competition, they have adopted
new strategies such as Supply Chain Management, global sourcing and the
outsourcing of certain functions, for example logistics (Rabinovich et al, 1999;
Lambert and Cooper, 2000; Cho and Kang, 2001). These new strategies mean
that transportation companies are required to cover wider geographical spans,
and to provide a wider range of services to meet increasingly diversified de-
mand patterns with a lower price and higher quality than before (Slack et al,
1996; Heaver, 2001). To accommodate these changes, shipping companies
have integrated both horizontally (through mergers, acquisitions and strategic
alliances) and vertically (through the operation of dedicated terminals and
the provision of integrated logistics and intermodal services) (Notteboom,
2004). Further, shipping companies have rearranged service networks with
the dual aim of global coverage and diversification. The changes that shipping
companies have made have ultimately affected every facet of the maritime
industry, especially concerning port operations (Slack et al, 2001).
In order to measure these changes, the approach taken was to use CFA.
Structural Equation Modelling (SEM) is a powerful statistical technique that
combines a measurement model (CFA) and a structural model (regression
or path analysis) into a simultaneous statistical test (Garver and Mentzer, 1999).
Horizontal integration
Vertical integration
Network redesign
Efficient operationPrice competitionService quality improvementCustomer oriented practicesConnectivity to other transport modes
Value-added servicesPort cooperation and networking
Security and safety
Powerful clients
Intensifiedcompetition
Wider geographicalspan
Wider range of service
Cost and service
Shipping industryShipping industryLogistics chainsLogistics chains Intermediate impactIntermediate impact Intermediate impactIntermediate impact Port IndustryPort Industry
Supply chain m’ngt
Global sourcing
Logistics outsourcing
Figure 1: Port evolution in changing logistics environments.
Port evolution and performance in changing logistics environments
253r 2011 Macmillan Publishers Ltd. 1479-2931 Maritime Economics & Logistics Vol. 13, 3, 250–277
AUTHOR COPY
The measurement model specifies the relationships between the observed and
the unobserved variables. Latent variables represent theoretical constructs that
cannot be observed directly and observed variables represent the scores from
the measurement instruments. The structural model specifies the hypothesised
causal relationships among the latent variables.
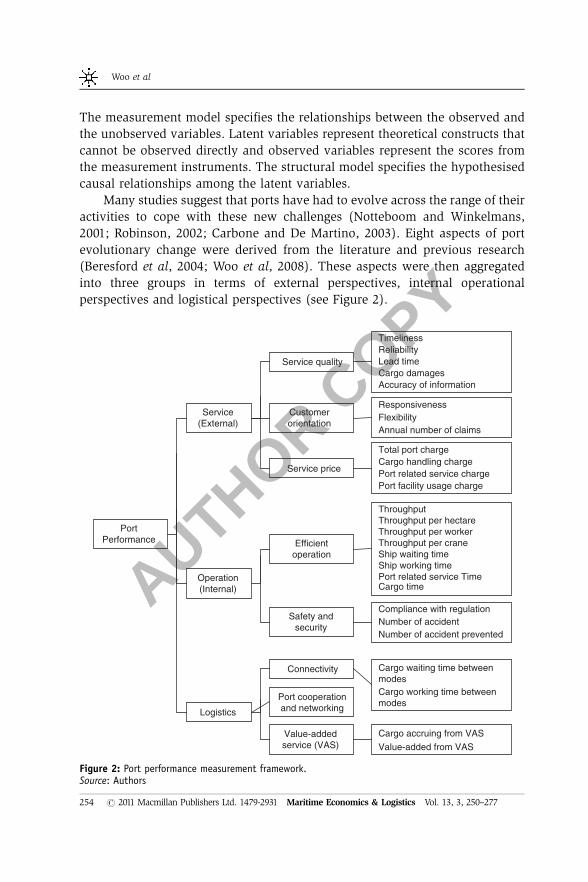
Many studies suggest that ports have had to evolve across the range of their
activities to cope with these new challenges (Notteboom and Winkelmans,
2001; Robinson, 2002; Carbone and De Martino, 2003). Eight aspects of port
evolutionary change were derived from the literature and previous research
(Beresford et al, 2004; Woo et al, 2008). These aspects were then aggregated
into three groups in terms of external perspectives, internal operational
perspectives and logistical perspectives (see Figure 2).
PortPerformance
Service(External)
Operation(Internal)
Logistics
Service quality
Customerorientation
Service price
TimelinessReliabilityLead timeCargo damagesAccuracy of information
ResponsivenessFlexibilityAnnual number of claims
Total port chargeCargo handling chargePort related service chargePort facility usage charge
Efficientoperation
ThroughputThroughput per hectareThroughput per workerThroughput per craneShip waiting timeShip working timePort related service TimeCargo time
Safety andsecurity
Compliance with regulationNumber of accidentNumber of accident prevented
Connectivity
Value-addedservice (VAS)
Cargo waiting time betweenmodesCargo working time betweenmodes
Cargo accruing from VAS
Value-added from VAS
Port cooperationand networking
Figure 2: Port performance measurement framework.Source: Authors
Woo et al
254 r 2011 Macmillan Publishers Ltd. 1479-2931 Maritime Economics & Logistics Vol. 13, 3, 250–277
AUTHOR COPY
The majority of indicators were derived from existing port performance
literature. However, some aspects such as Service Quality and Customer
Orientation were derived from supply chain performance literature and other
transport mode performance literature. In addition, indicators for ‘Port
Cooperation’ were not identified from the literature, and therefore are not
specified in Figure 2. When it comes to empirical analysis using CFA,
port evolution aspects are the constructs (the latent variables) and the
indicators are measures or scales (the observed variables). Thus ‘Service’,
‘Operation’ and ‘Logistics’ in Figure 2 are the second-order factors that com-
prise two or three sub-dimensions, respectively, and Port Performance is the
third-order factor comprising three second-order factors.
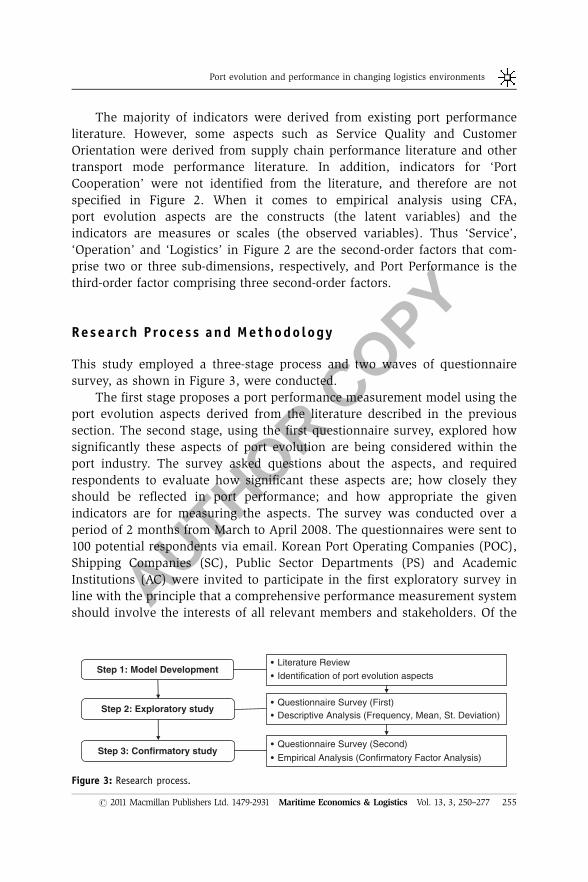
Research Process and Methodology
This study employed a three-stage process and two waves of questionnaire
survey, as shown in Figure 3, were conducted.
The first stage proposes a port performance measurement model using the
port evolution aspects derived from the literature described in the previous
section. The second stage, using the first questionnaire survey, explored how
significantly these aspects of port evolution are being considered within the
port industry. The survey asked questions about the aspects, and required
respondents to evaluate how significant these aspects are; how closely they
should be reflected in port performance; and how appropriate the given
indicators are for measuring the aspects. The survey was conducted over a
period of 2 months from March to April 2008. The questionnaires were sent to
100 potential respondents via email. Korean Port Operating Companies (POC),
Shipping Companies (SC), Public Sector Departments (PS) and Academic
Institutions (AC) were invited to participate in the first exploratory survey in
line with the principle that a comprehensive performance measurement system
should involve the interests of all relevant members and stakeholders. Of the
Step 1: Model Development
Step 2: Exploratory studyQuestionnaire Survey (First)Descriptive Analysis (Frequency, Mean, St. Deviation)
Questionnaire Survey (Second)
Empirical Analysis (Confirmatory Factor Analysis)
Literature ReviewIdentification of port evolution aspects
Step 3: Confirmatory study
••
••
•
•
Figure 3: Research process.
Port evolution and performance in changing logistics environments
255r 2011 Macmillan Publishers Ltd. 1479-2931 Maritime Economics & Logistics Vol. 13, 3, 250–277
AUTHOR COPY
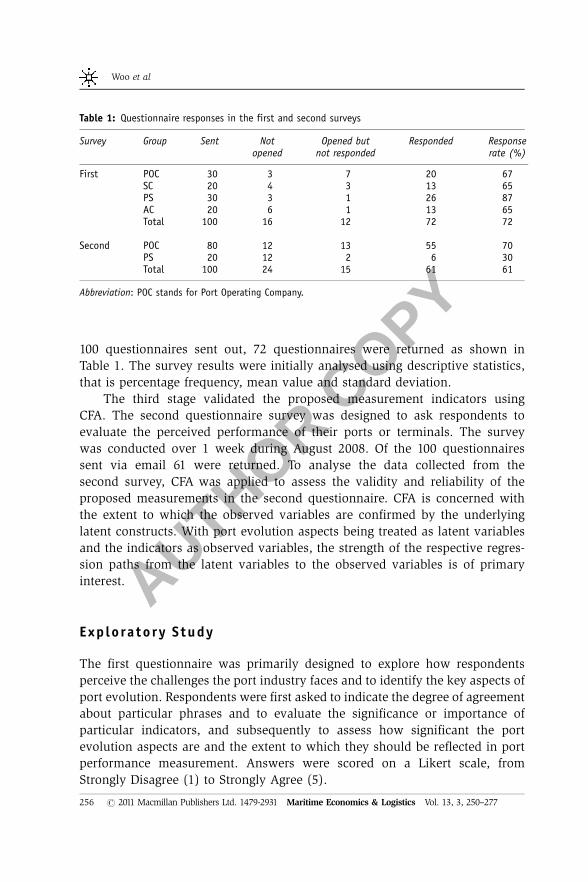
100 questionnaires sent out, 72 questionnaires were returned as shown in
Table 1. The survey results were initially analysed using descriptive statistics,
that is percentage frequency, mean value and standard deviation.
The third stage validated the proposed measurement indicators using
CFA. The second questionnaire survey was designed to ask respondents to
evaluate the perceived performance of their ports or terminals. The survey
was conducted over 1 week during August 2008. Of the 100 questionnaires
sent via email 61 were returned. To analyse the data collected from the
second survey, CFA was applied to assess the validity and reliability of the
proposed measurements in the second questionnaire. CFA is concerned with
the extent to which the observed variables are confirmed by the underlying
latent constructs. With port evolution aspects being treated as latent variables
and the indicators as observed variables, the strength of the respective regres-
sion paths from the latent variables to the observed variables is of primary
interest.
Exploratory Study
The first questionnaire was primarily designed to explore how respondents
perceive the challenges the port industry faces and to identify the key aspects of
port evolution. Respondents were first asked to indicate the degree of agreement
about particular phrases and to evaluate the significance or importance of
particular indicators, and subsequently to assess how significant the port
evolution aspects are and the extent to which they should be reflected in port
performance measurement. Answers were scored on a Likert scale, from
Strongly Disagree (1) to Strongly Agree (5).
Table 1: Questionnaire responses in the first and second surveys
Survey Group Sent Notopened
Opened butnot responded
Responded Responserate (%)
First POC 30 3 7 20 67SC 20 4 3 13 65PS 30 3 1 26 87AC 20 6 1 13 65Total 100 16 12 72 72
Second POC 80 12 13 55 70PS 20 12 2 6 30Total 100 24 15 61 61
Abbreviation: POC stands for Port Operating Company.
Woo et al
256 r 2011 Macmillan Publishers Ltd. 1479-2931 Maritime Economics & Logistics Vol. 13, 3, 250–277
AUTHOR COPY
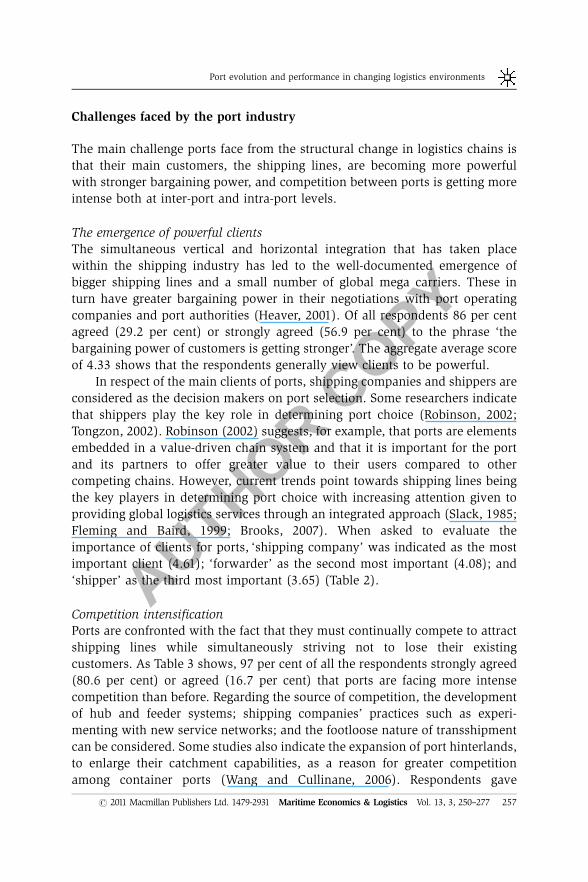
Challenges faced by the port industry
The main challenge ports face from the structural change in logistics chains is
that their main customers, the shipping lines, are becoming more powerful
with stronger bargaining power, and competition between ports is getting more
intense both at inter-port and intra-port levels.
The emergence of powerful clients
The simultaneous vertical and horizontal integration that has taken place
within the shipping industry has led to the well-documented emergence of
bigger shipping lines and a small number of global mega carriers. These in
turn have greater bargaining power in their negotiations with port operating
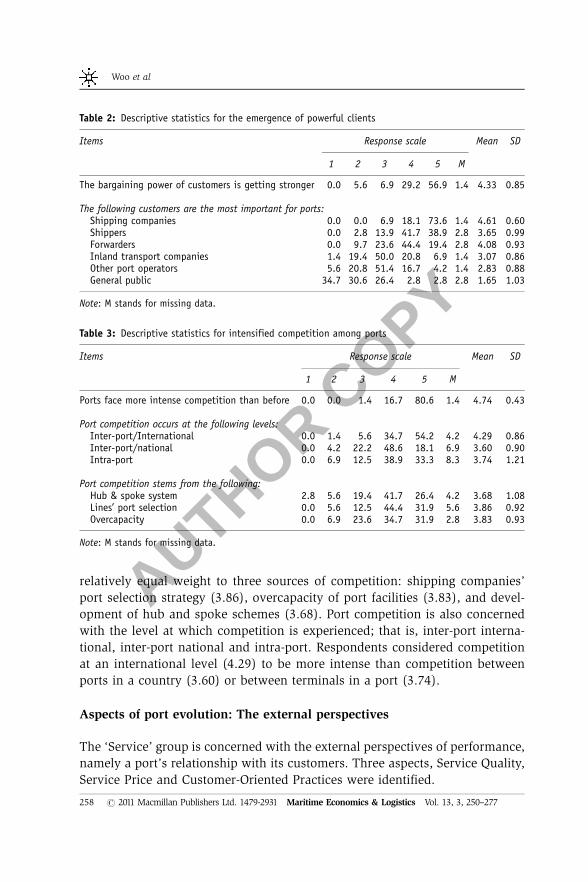
companies and port authorities (Heaver, 2001). Of all respondents 86 per cent
agreed (29.2 per cent) or strongly agreed (56.9 per cent) to the phrase ‘the
bargaining power of customers is getting stronger’. The aggregate average score
of 4.33 shows that the respondents generally view clients to be powerful.
In respect of the main clients of ports, shipping companies and shippers are
considered as the decision makers on port selection. Some researchers indicate
that shippers play the key role in determining port choice (Robinson, 2002;
Tongzon, 2002). Robinson (2002) suggests, for example, that ports are elements
embedded in a value-driven chain system and that it is important for the port
and its partners to offer greater value to their users compared to other
competing chains. However, current trends point towards shipping lines being
the key players in determining port choice with increasing attention given to
providing global logistics services through an integrated approach (Slack, 1985;
Fleming and Baird, 1999; Brooks, 2007). When asked to evaluate the
importance of clients for ports, ‘shipping company’ was indicated as the most
important client (4.61); ‘forwarder’ as the second most important (4.08); and
‘shipper’ as the third most important (3.65) (Table 2).
Competition intensification
Ports are confronted with the fact that they must continually compete to attract
shipping lines while simultaneously striving not to lose their existing
customers. As Table 3 shows, 97 per cent of all the respondents strongly agreed
(80.6 per cent) or agreed (16.7 per cent) that ports are facing more intense
competition than before. Regarding the source of competition, the development
of hub and feeder systems; shipping companies’ practices such as experi-
menting with new service networks; and the footloose nature of transshipment
can be considered. Some studies also indicate the expansion of port hinterlands,
to enlarge their catchment capabilities, as a reason for greater competition
among container ports (Wang and Cullinane, 2006). Respondents gave
Port evolution and performance in changing logistics environments
257r 2011 Macmillan Publishers Ltd. 1479-2931 Maritime Economics & Logistics Vol. 13, 3, 250–277
AUTHOR COPY
relatively equal weight to three sources of competition: shipping companies’
port selection strategy (3.86), overcapacity of port facilities (3.83), and devel-
opment of hub and spoke schemes (3.68). Port competition is also concerned
with the level at which competition is experienced; that is, inter-port interna-
tional, inter-port national and intra-port. Respondents considered competition
at an international level (4.29) to be more intense than competition between
ports in a country (3.60) or between terminals in a port (3.74).
Aspects of port evolution: The external perspectives
The ‘Service’ group is concerned with the external perspectives of performance,
namely a port’s relationship with its customers. Three aspects, Service Quality,
Service Price and Customer-Oriented Practices were identified.
Table 2: Descriptive statistics for the emergence of powerful clients
Items Response scale Mean SD
1 2 3 4 5 M
The bargaining power of customers is getting stronger 0.0 5.6 6.9 29.2 56.9 1.4 4.33 0.85
The following customers are the most important for ports:Shipping companies 0.0 0.0 6.9 18.1 73.6 1.4 4.61 0.60Shippers 0.0 2.8 13.9 41.7 38.9 2.8 3.65 0.99Forwarders 0.0 9.7 23.6 44.4 19.4 2.8 4.08 0.93Inland transport companies 1.4 19.4 50.0 20.8 6.9 1.4 3.07 0.86Other port operators 5.6 20.8 51.4 16.7 4.2 1.4 2.83 0.88General public 34.7 30.6 26.4 2.8 2.8 2.8 1.65 1.03
Note: M stands for missing data.
Table 3: Descriptive statistics for intensified competition among ports
Items Response scale Mean SD
1 2 3 4 5 M
Ports face more intense competition than before 0.0 0.0 1.4 16.7 80.6 1.4 4.74 0.43
Port competition occurs at the following levels:Inter-port/International 0.0 1.4 5.6 34.7 54.2 4.2 4.29 0.86Inter-port/national 0.0 4.2 22.2 48.6 18.1 6.9 3.60 0.90Intra-port 0.0 6.9 12.5 38.9 33.3 8.3 3.74 1.21
Port competition stems from the following:Hub & spoke system 2.8 5.6 19.4 41.7 26.4 4.2 3.68 1.08Lines’ port selection 0.0 5.6 12.5 44.4 31.9 5.6 3.86 0.92Overcapacity 0.0 6.9 23.6 34.7 31.9 2.8 3.83 0.93
Note: M stands for missing data.
Woo et al
258 r 2011 Macmillan Publishers Ltd. 1479-2931 Maritime Economics & Logistics Vol. 13, 3, 250–277
AUTHOR COPY
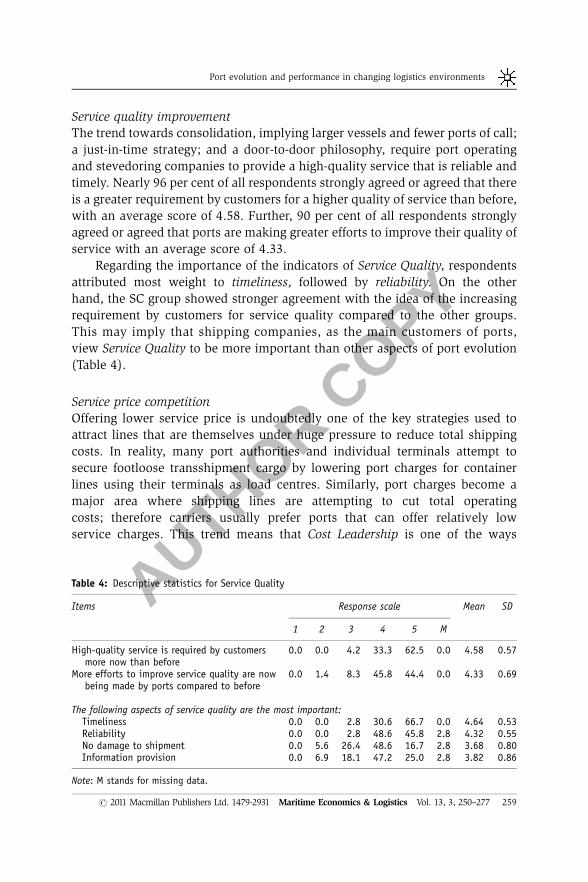
Service quality improvement
The trend towards consolidation, implying larger vessels and fewer ports of call;
a just-in-time strategy; and a door-to-door philosophy, require port operating
and stevedoring companies to provide a high-quality service that is reliable and
timely. Nearly 96 per cent of all respondents strongly agreed or agreed that there
is a greater requirement by customers for a higher quality of service than before,
with an average score of 4.58. Further, 90 per cent of all respondents strongly
agreed or agreed that ports are making greater efforts to improve their quality of
service with an average score of 4.33.
Regarding the importance of the indicators of Service Quality, respondents
attributed most weight to timeliness, followed by reliability. On the other
hand, the SC group showed stronger agreement with the idea of the increasing
requirement by customers for service quality compared to the other groups.
This may imply that shipping companies, as the main customers of ports,
view Service Quality to be more important than other aspects of port evolution
(Table 4).
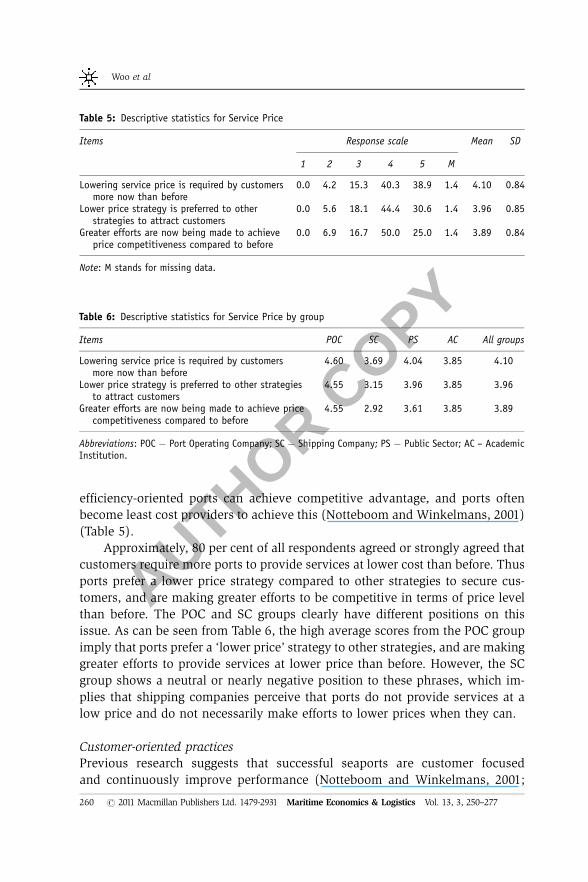
Service price competition
Offering lower service price is undoubtedly one of the key strategies used to
attract lines that are themselves under huge pressure to reduce total shipping
costs. In reality, many port authorities and individual terminals attempt to
secure footloose transshipment cargo by lowering port charges for container
lines using their terminals as load centres. Similarly, port charges become a
major area where shipping lines are attempting to cut total operating
costs; therefore carriers usually prefer ports that can offer relatively low
service charges. This trend means that Cost Leadership is one of the ways
Table 4: Descriptive statistics for Service Quality
Items Response scale Mean SD
1 2 3 4 5 M
High-quality service is required by customersmore now than before
0.0 0.0 4.2 33.3 62.5 0.0 4.58 0.57
More efforts to improve service quality are nowbeing made by ports compared to before
0.0 1.4 8.3 45.8 44.4 0.0 4.33 0.69
The following aspects of service quality are the most important:Timeliness 0.0 0.0 2.8 30.6 66.7 0.0 4.64 0.53Reliability 0.0 0.0 2.8 48.6 45.8 2.8 4.32 0.55No damage to shipment 0.0 5.6 26.4 48.6 16.7 2.8 3.68 0.80Information provision 0.0 6.9 18.1 47.2 25.0 2.8 3.82 0.86
Note: M stands for missing data.
Port evolution and performance in changing logistics environments
259r 2011 Macmillan Publishers Ltd. 1479-2931 Maritime Economics & Logistics Vol. 13, 3, 250–277
AUTHOR COPY
efficiency-oriented ports can achieve competitive advantage, and ports often
become least cost providers to achieve this (Notteboom and Winkelmans, 2001)
(Table 5).
Approximately, 80 per cent of all respondents agreed or strongly agreed that
customers require more ports to provide services at lower cost than before. Thus
ports prefer a lower price strategy compared to other strategies to secure cus-
tomers, and are making greater efforts to be competitive in terms of price level
than before. The POC and SC groups clearly have different positions on this
issue. As can be seen from Table 6, the high average scores from the POC group
imply that ports prefer a ‘lower price’ strategy to other strategies, and are making
greater efforts to provide services at lower price than before. However, the SC
group shows a neutral or nearly negative position to these phrases, which im-
plies that shipping companies perceive that ports do not provide services at a
low price and do not necessarily make efforts to lower prices when they can.
Customer-oriented practices
Previous research suggests that successful seaports are customer focused
and continuously improve performance (Notteboom and Winkelmans, 2001;
Table 5: Descriptive statistics for Service Price
Items Response scale Mean SD
1 2 3 4 5 M
Lowering service price is required by customersmore now than before
0.0 4.2 15.3 40.3 38.9 1.4 4.10 0.84
Lower price strategy is preferred to otherstrategies to attract customers
0.0 5.6 18.1 44.4 30.6 1.4 3.96 0.85
Greater efforts are now being made to achieveprice competitiveness compared to before
0.0 6.9 16.7 50.0 25.0 1.4 3.89 0.84
Note: M stands for missing data.
Table 6: Descriptive statistics for Service Price by group
Items POC SC PS AC All groups
Lowering service price is required by customersmore now than before
4.60 3.69 4.04 3.85 4.10
Lower price strategy is preferred to other strategiesto attract customers
4.55 3.15 3.96 3.85 3.96
Greater efforts are now being made to achieve pricecompetitiveness compared to before
4.55 2.92 3.61 3.85 3.89
Abbreviations: POC � Port Operating Company; SC � Shipping Company; PS � Public Sector; AC – AcademicInstitution.
Woo et al
260 r 2011 Macmillan Publishers Ltd. 1479-2931 Maritime Economics & Logistics Vol. 13, 3, 250–277
AUTHOR COPY
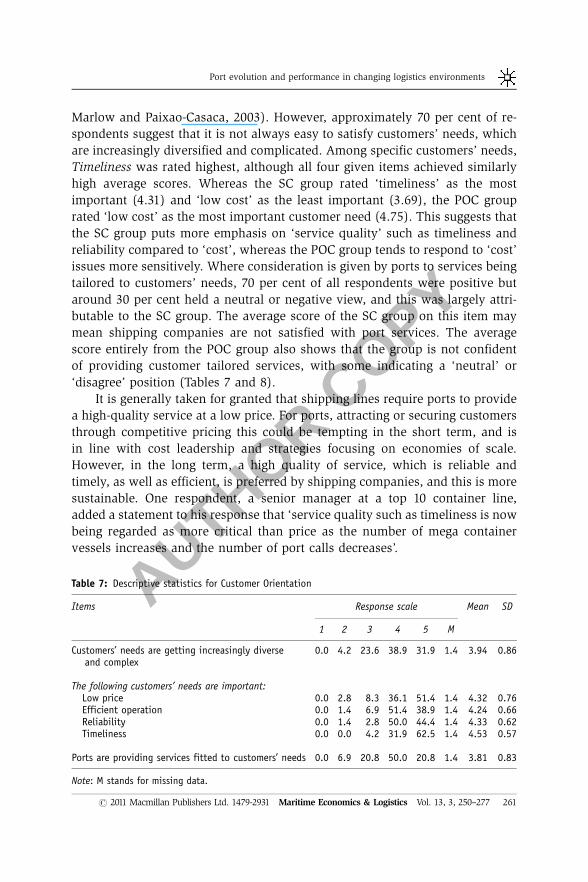
Marlow and Paixao-Casaca, 2003). However, approximately 70 per cent of re-
spondents suggest that it is not always easy to satisfy customers’ needs, which
are increasingly diversified and complicated. Among specific customers’ needs,
Timeliness was rated highest, although all four given items achieved similarly
high average scores. Whereas the SC group rated ‘timeliness’ as the most
important (4.31) and ‘low cost’ as the least important (3.69), the POC group
rated ‘low cost’ as the most important customer need (4.75). This suggests that
the SC group puts more emphasis on ‘service quality’ such as timeliness and
reliability compared to ‘cost’, whereas the POC group tends to respond to ‘cost’
issues more sensitively. Where consideration is given by ports to services being
tailored to customers’ needs, 70 per cent of all respondents were positive but
around 30 per cent held a neutral or negative view, and this was largely attri-
butable to the SC group. The average score of the SC group on this item may
mean shipping companies are not satisfied with port services. The average
score entirely from the POC group also shows that the group is not confident
of providing customer tailored services, with some indicating a ‘neutral’ or
‘disagree’ position (Tables 7 and 8).
It is generally taken for granted that shipping lines require ports to provide
a high-quality service at a low price. For ports, attracting or securing customers
through competitive pricing this could be tempting in the short term, and is
in line with cost leadership and strategies focusing on economies of scale.
However, in the long term, a high quality of service, which is reliable and
timely, as well as efficient, is preferred by shipping companies, and this is more
sustainable. One respondent, a senior manager at a top 10 container line,
added a statement to his response that ‘service quality such as timeliness is now
being regarded as more critical than price as the number of mega container
vessels increases and the number of port calls decreases’.
Table 7: Descriptive statistics for Customer Orientation
Items Response scale Mean SD
1 2 3 4 5 M
Customers’ needs are getting increasingly diverseand complex
0.0 4.2 23.6 38.9 31.9 1.4 3.94 0.86
The following customers’ needs are important:Low price 0.0 2.8 8.3 36.1 51.4 1.4 4.32 0.76Efficient operation 0.0 1.4 6.9 51.4 38.9 1.4 4.24 0.66Reliability 0.0 1.4 2.8 50.0 44.4 1.4 4.33 0.62Timeliness 0.0 0.0 4.2 31.9 62.5 1.4 4.53 0.57
Ports are providing services fitted to customers’ needs 0.0 6.9 20.8 50.0 20.8 1.4 3.81 0.83
Note: M stands for missing data.
Port evolution and performance in changing logistics environments
261r 2011 Macmillan Publishers Ltd. 1479-2931 Maritime Economics & Logistics Vol. 13, 3, 250–277
AUTHOR COPY
Aspects of port evolution: The internal perspectives
Operational efficiency
Port efficiency and productivity have been greatly improved since liner shipping
companies and container ports, respectively, began to deploy dedicated con-
tainer ships and efficient container handling systems (Cullinane et al, 2004).
Specialisation and automation have increased, but at different rates according
to need, and increasing vessel size has led to the requirement for large-scale
investments in infrastructure, superstructure and channel dredging as well as
significant investment in information technology systems. However, there is
still wide variation in terminal size, design detail and equipment specifications
(Beresford et al, 2004).
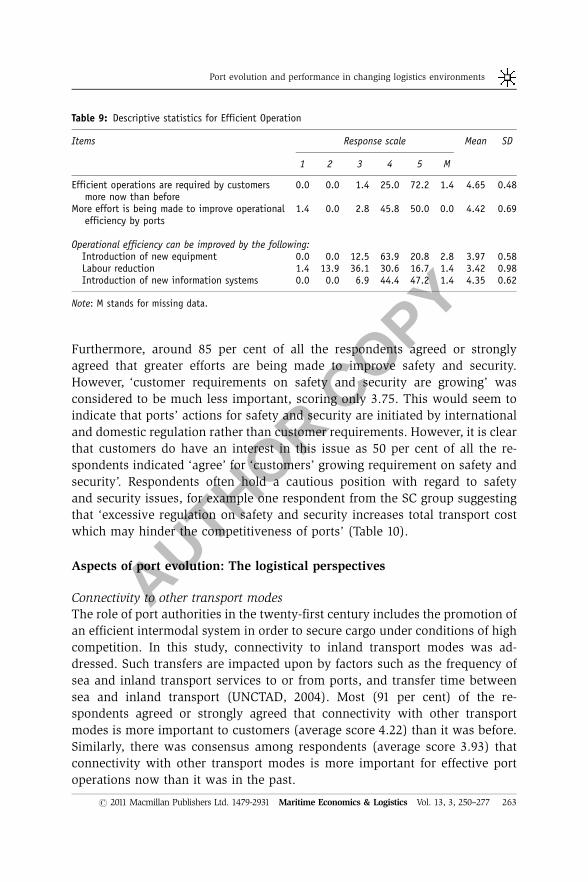
Most respondents (97.2 per cent) agreed or strongly agreed that efficient
operation is now more necessary than before, with an average score of 4.65.
Furthermore, 95.8 per cent agreed or strongly agreed that greater efforts are now
being made to improve efficiency. As Table 9 shows, there was no major
difference between the sample groups on this issue. With regard to how to
improve efficiency, respondents indicated that the ‘introduction of new in-
formation systems’ was the most important issue.
Security and safety
Safety and security issues have, more recently, become linked to efficiency and
competitiveness, as safety and security has grown in importance as an issue
both internationally and domestically. Beresford et al (2004) point out that
‘a poor safety culture in the long run will obstruct an individual port’s com-
petitiveness’. Other literature suggests that if security is dealt with correctly, it
will have a huge impact on port efficiency and competitiveness in the long term,
regardless of how ports address this issue (Clark et al, 2004; Banomyong, 2005;
Lee and Chang, 2007).
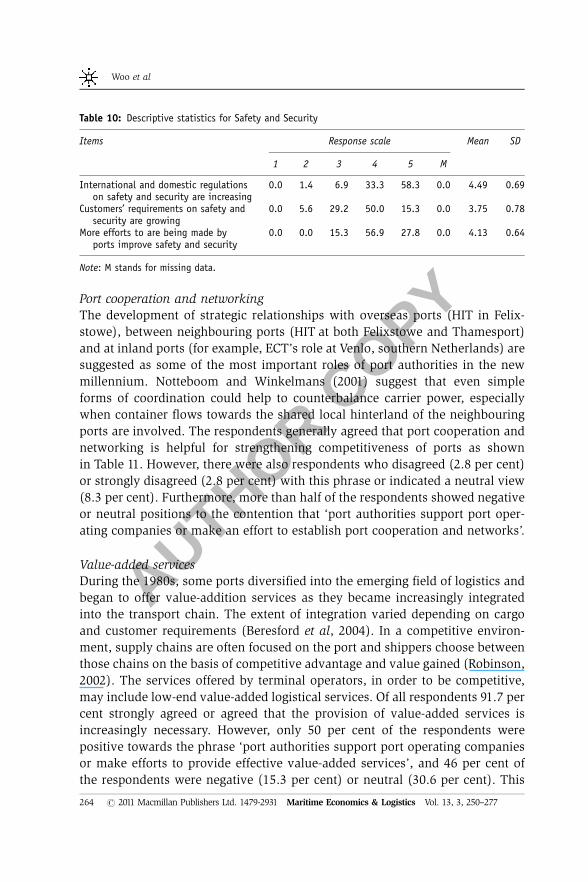
More than 90 per cent of all respondents agreed or strongly agreed that
international and domestic regulation about safety and security is increasing.
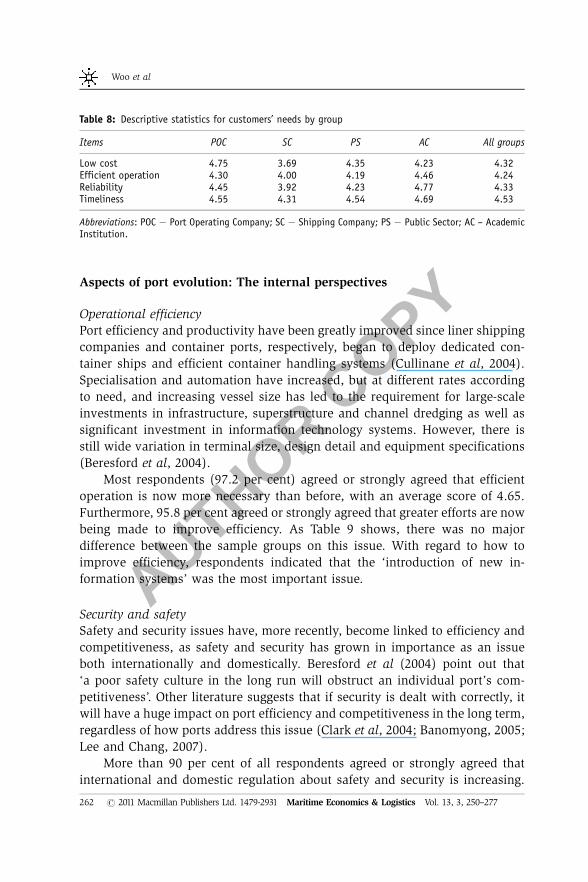
Table 8: Descriptive statistics for customers’ needs by group
Items POC SC PS AC All groups
Low cost 4.75 3.69 4.35 4.23 4.32Efficient operation 4.30 4.00 4.19 4.46 4.24Reliability 4.45 3.92 4.23 4.77 4.33Timeliness 4.55 4.31 4.54 4.69 4.53
Abbreviations: POC � Port Operating Company; SC � Shipping Company; PS � Public Sector; AC – AcademicInstitution.
Woo et al
262 r 2011 Macmillan Publishers Ltd. 1479-2931 Maritime Economics & Logistics Vol. 13, 3, 250–277
AUTHOR COPY
Furthermore, around 85 per cent of all the respondents agreed or strongly
agreed that greater efforts are being made to improve safety and security.
However, ‘customer requirements on safety and security are growing’ was
considered to be much less important, scoring only 3.75. This would seem to
indicate that ports’ actions for safety and security are initiated by international
and domestic regulation rather than customer requirements. However, it is clear
that customers do have an interest in this issue as 50 per cent of all the re-
spondents indicated ‘agree’ for ‘customers’ growing requirement on safety and
security’. Respondents often hold a cautious position with regard to safety
and security issues, for example one respondent from the SC group suggesting
that ‘excessive regulation on safety and security increases total transport cost
which may hinder the competitiveness of ports’ (Table 10).
Aspects of port evolution: The logistical perspectives
Connectivity to other transport modes
The role of port authorities in the twenty-first century includes the promotion of
an efficient intermodal system in order to secure cargo under conditions of high
competition. In this study, connectivity to inland transport modes was ad-
dressed. Such transfers are impacted upon by factors such as the frequency of
sea and inland transport services to or from ports, and transfer time between
sea and inland transport (UNCTAD, 2004). Most (91 per cent) of the re-
spondents agreed or strongly agreed that connectivity with other transport
modes is more important to customers (average score 4.22) than it was before.
Similarly, there was consensus among respondents (average score 3.93) that
connectivity with other transport modes is more important for effective port
operations now than it was in the past.
Table 9: Descriptive statistics for Efficient Operation
Items Response scale Mean SD
1 2 3 4 5 M
Efficient operations are required by customersmore now than before
0.0 0.0 1.4 25.0 72.2 1.4 4.65 0.48
More effort is being made to improve operationalefficiency by ports
1.4 0.0 2.8 45.8 50.0 0.0 4.42 0.69
Operational efficiency can be improved by the following:Introduction of new equipment 0.0 0.0 12.5 63.9 20.8 2.8 3.97 0.58Labour reduction 1.4 13.9 36.1 30.6 16.7 1.4 3.42 0.98Introduction of new information systems 0.0 0.0 6.9 44.4 47.2 1.4 4.35 0.62
Note: M stands for missing data.
Port evolution and performance in changing logistics environments
263r 2011 Macmillan Publishers Ltd. 1479-2931 Maritime Economics & Logistics Vol. 13, 3, 250–277
AUTHOR COPYPort cooperation and networking
The development of strategic relationships with overseas ports (HIT in Felix-
stowe), between neighbouring ports (HIT at both Felixstowe and Thamesport)
and at inland ports (for example, ECT’s role at Venlo, southern Netherlands) are
suggested as some of the most important roles of port authorities in the new
millennium. Notteboom and Winkelmans (2001) suggest that even simple
forms of coordination could help to counterbalance carrier power, especially
when container flows towards the shared local hinterland of the neighbouring
ports are involved. The respondents generally agreed that port cooperation and
networking is helpful for strengthening competitiveness of ports as shown
in Table 11. However, there were also respondents who disagreed (2.8 per cent)
or strongly disagreed (2.8 per cent) with this phrase or indicated a neutral view
(8.3 per cent). Furthermore, more than half of the respondents showed negative
or neutral positions to the contention that ‘port authorities support port oper-
ating companies or make an effort to establish port cooperation and networks’.
Value-added services
During the 1980s, some ports diversified into the emerging field of logistics and
began to offer value-addition services as they became increasingly integrated
into the transport chain. The extent of integration varied depending on cargo
and customer requirements (Beresford et al, 2004). In a competitive environ-
ment, supply chains are often focused on the port and shippers choose between
those chains on the basis of competitive advantage and value gained (Robinson,
2002). The services offered by terminal operators, in order to be competitive,
may include low-end value-added logistical services. Of all respondents 91.7 per
cent strongly agreed or agreed that the provision of value-added services is
increasingly necessary. However, only 50 per cent of the respondents were
positive towards the phrase ‘port authorities support port operating companies
or make efforts to provide effective value-added services’, and 46 per cent of
the respondents were negative (15.3 per cent) or neutral (30.6 per cent). This
Table 10: Descriptive statistics for Safety and Security
Items Response scale Mean SD
1 2 3 4 5 M
International and domestic regulationson safety and security are increasing
0.0 1.4 6.9 33.3 58.3 0.0 4.49 0.69
Customers’ requirements on safety andsecurity are growing
0.0 5.6 29.2 50.0 15.3 0.0 3.75 0.78
More efforts to are being made byports improve safety and security
0.0 0.0 15.3 56.9 27.8 0.0 4.13 0.64
Note: M stands for missing data.
Woo et al
264 r 2011 Macmillan Publishers Ltd. 1479-2931 Maritime Economics & Logistics Vol. 13, 3, 250–277
AUTHOR COPY
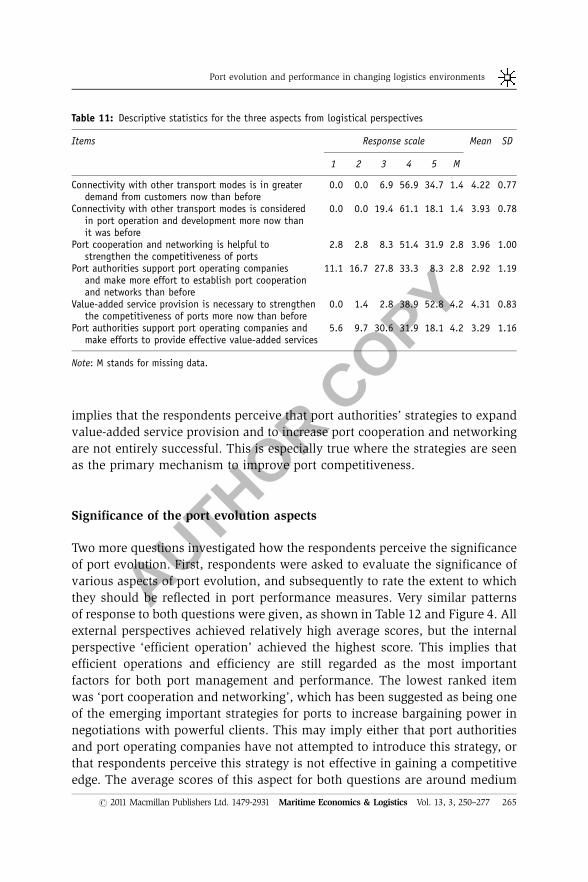
implies that the respondents perceive that port authorities’ strategies to expand
value-added service provision and to increase port cooperation and networking
are not entirely successful. This is especially true where the strategies are seen
as the primary mechanism to improve port competitiveness.
Significance of the port evolution aspects
Two more questions investigated how the respondents perceive the significance
of port evolution. First, respondents were asked to evaluate the significance of
various aspects of port evolution, and subsequently to rate the extent to which
they should be reflected in port performance measures. Very similar patterns
of response to both questions were given, as shown in Table 12 and Figure 4. All
external perspectives achieved relatively high average scores, but the internal
perspective ‘efficient operation’ achieved the highest score. This implies that
efficient operations and efficiency are still regarded as the most important
factors for both port management and performance. The lowest ranked item
was ‘port cooperation and networking’, which has been suggested as being one
of the emerging important strategies for ports to increase bargaining power in
negotiations with powerful clients. This may imply either that port authorities
and port operating companies have not attempted to introduce this strategy, or
that respondents perceive this strategy is not effective in gaining a competitive
edge. The average scores of this aspect for both questions are around medium
Table 11: Descriptive statistics for the three aspects from logistical perspectives
Items Response scale Mean SD
1 2 3 4 5 M
Connectivity with other transport modes is in greaterdemand from customers now than before
0.0 0.0 6.9 56.9 34.7 1.4 4.22 0.77
Connectivity with other transport modes is consideredin port operation and development more now thanit was before
0.0 0.0 19.4 61.1 18.1 1.4 3.93 0.78
Port cooperation and networking is helpful tostrengthen the competitiveness of ports
2.8 2.8 8.3 51.4 31.9 2.8 3.96 1.00
Port authorities support port operating companiesand make more effort to establish port cooperationand networks than before
11.1 16.7 27.8 33.3 8.3 2.8 2.92 1.19
Value-added service provision is necessary to strengthenthe competitiveness of ports more now than before
0.0 1.4 2.8 38.9 52.8 4.2 4.31 0.83
Port authorities support port operating companies andmake efforts to provide effective value-added services
5.6 9.7 30.6 31.9 18.1 4.2 3.29 1.16
Note: M stands for missing data.
Port evolution and performance in changing logistics environments
265r 2011 Macmillan Publishers Ltd. 1479-2931 Maritime Economics & Logistics Vol. 13, 3, 250–277
AUTHOR COPY
level (¼ 3), and therefore it is suggested that it should be excluded from the list
of the port evolution aspects.
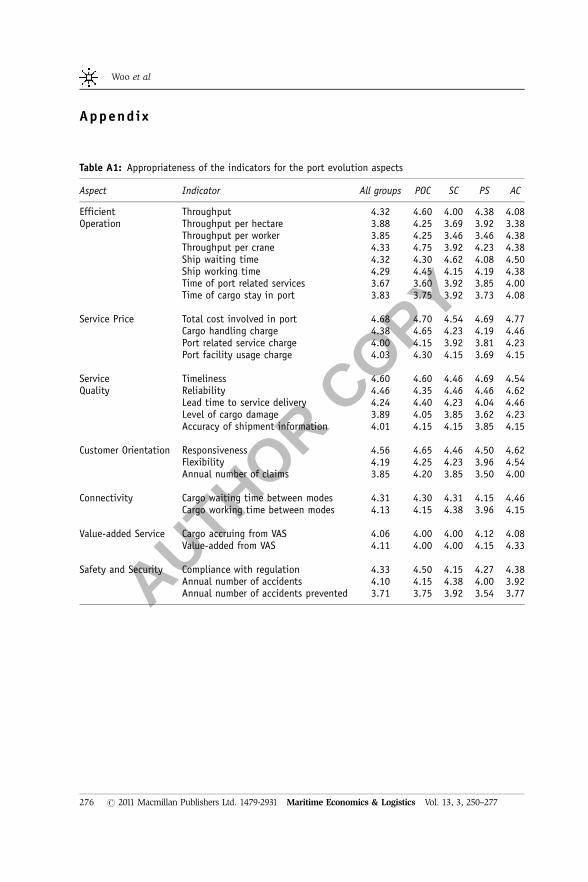
Second, respondents rated the appropriateness of the indicators for each
aspect of port evolution, which were derived from the relevant literature as
presented in Appendix Table A1 and Figure 2. The results show that there was
strong agreement among respondents on the appropriateness of the indicators
for measuring aspects of port evolution. In order to simplify the measurement,
model indicators where the mean value was lower than 4.0 were excluded.
Although this could be considered an arbitrary division, this allowed the Con-
firmatory Questionnaire to be simplified, which was thus based on the retained
port evolution aspects and indicators.
2.5
3
3.5
4
4.5
5
Port Evolution Aspects
Sca
le
SQ CO SP VASOE SS CON PCN
Figure 4: Average scores of the port evolution aspects.Note: SQ � Service Quality; CO � Customer Orientation; SP � Service Price; OE � Operation Efficiency;SS � Safety and Security; CON � Connectivity; PCN � Port Cooperation and Networking; VAS � Value-added Service.
Table 12: Descriptive statistics for significance of port evolution aspects
Items Significance Reflection
Mean SD Mean SD
External perspectivesService Quality (SQ) 4.33 0.73 4.49 1.00Customer Orientation (CO) 4.22 0.74 4.47 0.84Service Price (SP) 4.19 0.80 4.22 0.81
Internal perspectivesEfficient Operation (EO) 4.35 0.72 4.65 0.53Safety and Security (SS) 3.75 0.85 3.75 0.94
Logistical perspectivesConnectivity (CON) 3.72 0.61 3.96 0.76Port Cooperation and Networking (PCN) 3.40 0.86 3.49 0.84Value-added Service provision (VAS) 3.75 0.87 4.03 0.71
Woo et al
266 r 2011 Macmillan Publishers Ltd. 1479-2931 Maritime Economics & Logistics Vol. 13, 3, 250–277
AUTHOR COPY
Conf i rmatory Study
For empirical analysis, the second questionnaire was designed based on the
results of the exploratory study described above. The questionnaire and
the results are provided in Appendix Table A2. The collected data were analysed
with the AMOS software package (version 6.0). The sample size of 61 can be
categorised as ‘small’. As for normality, bootstrapping was applied to remedy
the non-normality problems, as the data set was generally negatively skewed
(Byrne, 2001). Table 13 provides a summary of the measurement results in-
cluding means and standard deviations.
Sub-dimensional measurement models
In this study, port performance is composed of three sub-groups: Service,
Operations and Logistics. First, the sub-dimensional measurement models and
subsequently the port performance measurement model are assessed in terms
of validity and reliability (Garver and Mentzer, 1999). Validity consists of
content validity, unidimensionality, convergent and discriminant validity. This
study assesses the proposed measurement model in order of content validity,
unidimensionality, reliability and construct validity as reliability can be
assessed only when unidimensionality is verified (Garver and Mentzer, 1999).
The measurement model was devised through a literature review and
modified through the exploratory study. Therefore content validity is confirmed
Table 13: Summary of measurement results
Construct No. ofitems
Mean SD Cronbach’sa
Compositereliability
Average varianceextracted
ServiceService Quality 5 3.96 0.74 0.80 0.81 0.52CustomerOrientation
4 4.03 0.83 0.88 0.88 0.65
Service Price 4 3.55 0.98 0.90 0.90 0.76
OperationEfficientOperation
4 4.08 0.8 0.77 0.79 0.60
Safety andSecurity
2 4.00 0.9 0.84 0.84 0.72
LogisticsConnectivity 2 3.65 0.95 0.88 0.88 0.78Value-addedService
3 3.43 0.93 0.89 0.89 0.72
Port evolution and performance in changing logistics environments
267r 2011 Macmillan Publishers Ltd. 1479-2931 Maritime Economics & Logistics Vol. 13, 3, 250–277
AUTHOR COPY
because content validity can be certified whenever the constructs are derived
from a comprehensive analysis of the relevant literature (Gerbing and
Anderson, 1988). For unidimensionality, Goodness-of-fit indices of CFA, which
are the adjusted maximum likelihood w2 statistic (w2/dfo2.0), GFI (40.9),
CFI (40.9), TLI (40.9) and RMR (o0.05) (Hair et al, 1998; Tabachnick and
Fidell, 2001), were applied, as it has been argued that traditional techniques
such as Cronbach’s a and Exploratory Factor Analysis cannot truly assess
unidimensionality (Garver and Mentzer, 1999).
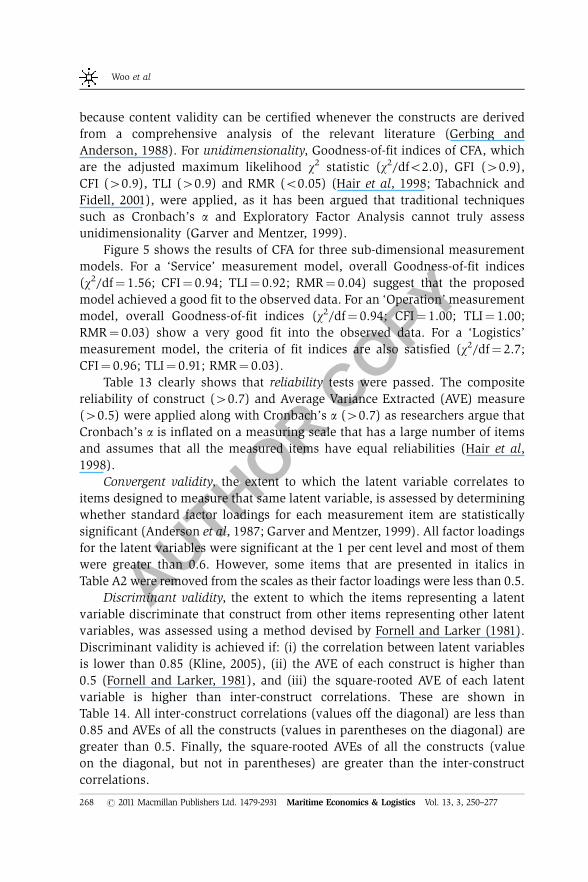
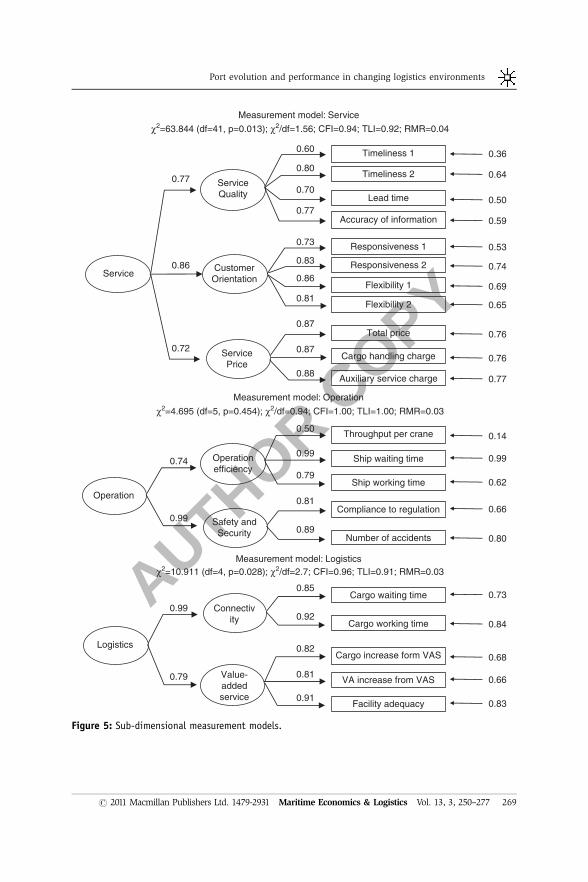
Figure 5 shows the results of CFA for three sub-dimensional measurement
models. For a ‘Service’ measurement model, overall Goodness-of-fit indices
(w2/df¼ 1.56; CFI¼ 0.94; TLI¼ 0.92; RMR¼ 0.04) suggest that the proposed
model achieved a good fit to the observed data. For an ‘Operation’ measurement
model, overall Goodness-of-fit indices (w2/df¼ 0.94; CFI¼ 1.00; TLI¼ 1.00;
RMR¼ 0.03) show a very good fit into the observed data. For a ‘Logistics’
measurement model, the criteria of fit indices are also satisfied (w2/df¼ 2.7;
CFI¼ 0.96; TLI¼ 0.91; RMR¼ 0.03).
Table 13 clearly shows that reliability tests were passed. The composite
reliability of construct (40.7) and Average Variance Extracted (AVE) measure
(40.5) were applied along with Cronbach’s a (40.7) as researchers argue that
Cronbach’s a is inflated on a measuring scale that has a large number of items
and assumes that all the measured items have equal reliabilities (Hair et al,
1998).
Convergent validity, the extent to which the latent variable correlates to
items designed to measure that same latent variable, is assessed by determining
whether standard factor loadings for each measurement item are statistically
significant (Anderson et al, 1987; Garver and Mentzer, 1999). All factor loadings
for the latent variables were significant at the 1 per cent level and most of them
were greater than 0.6. However, some items that are presented in italics in
Table A2 were removed from the scales as their factor loadings were less than 0.5.
Discriminant validity, the extent to which the items representing a latent
variable discriminate that construct from other items representing other latent
variables, was assessed using a method devised by Fornell and Larker (1981).
Discriminant validity is achieved if: (i) the correlation between latent variables
is lower than 0.85 (Kline, 2005), (ii) the AVE of each construct is higher than
0.5 (Fornell and Larker, 1981), and (iii) the square-rooted AVE of each latent
variable is higher than inter-construct correlations. These are shown in
Table 14. All inter-construct correlations (values off the diagonal) are less than
0.85 and AVEs of all the constructs (values in parentheses on the diagonal) are
greater than 0.5. Finally, the square-rooted AVEs of all the constructs (value
on the diagonal, but not in parentheses) are greater than the inter-construct
correlations.
Woo et al
268 r 2011 Macmillan Publishers Ltd. 1479-2931 Maritime Economics & Logistics Vol. 13, 3, 250–277
AUTHOR COPY
Service
ServiceQuality
CustomerOrientation
ServicePrice
0.36
0.77
0.86
0.72
0.60 Timeliness 1
Timeliness 2
Lead time
Accuracy of information
Responsiveness 1
Responsiveness 2
Flexibility 1
Flexibility 2
Total price
Auxiliary service charge
Cargo handling charge
0.80
0.73
0.70
0.77
0.87
0.87
0.88
0.83
0.86
0.81
0.64
0.50
0.59
0.69
0.65
0.76
0.76
0.77
0.74
0.53
χ2=63.844 (df=41, p=0.013); χ2/df=1.56; CFI=0.94; TLI=0.92; RMR=0.04
Operation
Operationefficiency
0.14
0.74
0.50 Throughput per crane
Ship waiting time
Ship working time
0.99
0.79
0.99
0.62
Safety andSecurity
0.99Compliance to regulation
Number of accidents
0.81
0.89
0.66
0.80
χ2=4.695 (df=5, p=0.454); χ2/df=0.94; CFI=1.00; TLI=1.00; RMR=0.03
Logistics
Value-addedservice
0.68
0.79
0.82Cargo increase form VAS
VA increase from VAS
Facility adequacy
0.81
0.91
0.66
0.83
Connectivity
0.99Cargo waiting time
Cargo working time
0.85
0.92
0.73
0.84
χ2=10.911 (df=4, p=0.028); χ2/df=2.7; CFI=0.96; TLI=0.91; RMR=0.03
Measurement model: Service
Measurement model: Operation
Measurement model: Logistics
Figure 5: Sub-dimensional measurement models.
Port evolution and performance in changing logistics environments
269r 2011 Macmillan Publishers Ltd. 1479-2931 Maritime Economics & Logistics Vol. 13, 3, 250–277
AUTHOR COPY
Table
14:
Inte
r-co
nst
ruct
corr
elat
ion,
AVE
and
squa
rero
ot
ofAVE
Serv
ice
qual
ity
Cust
omer
orie
nta
tion
Serv
ice
pric
eEf
fici
ent
oper
atio
nSa
fety
and
secu
rity
Connec
tivi
tyVa
lue-
adde
dse
rvic
e
Serv
ice
Qua
lity
0.7
2(0
.52)
Cust
om
erOrien
tati
on
0.5
7**
0.8
1(0
.65)
Serv
ice
Price
0.4
6**
0.5
4**
0.8
7(0
.76)
Effici
ent
Oper
atio
n0.3
3**
0.4
4**
0.4
6**
0.7
7(0
.60)
Safe
tyan
dSe
curi
ty0.2
8*
0.5
7**
0.6
5**
0.5
5**
0.8
5(0
.72)
Connec
tivi
ty0.2
40.4
9**
0.6
5**
0.6
5**
0.5
6**
0.8
8(0
.78)
Valu
e-ad
ded
Serv
ice
0.3
7**
0.5
1**
0.6
2**
0.5
5**
0.4
5**
0.6
9**
0.8
5(0
.72)
Not
e:**Po
0.0
1;
*Po
0.0
5.
Woo et al
270 r 2011 Macmillan Publishers Ltd. 1479-2931 Maritime Economics & Logistics Vol. 13, 3, 250–277
AUTHOR COPY
Discriminant validity is therefore confirmed among the latent variables
examined in this analysis.
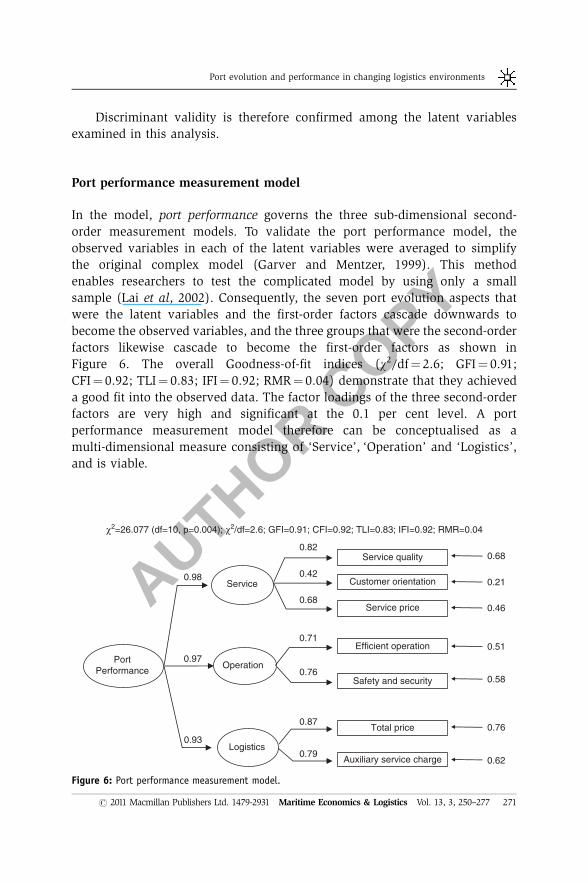
Port performance measurement model
In the model, port performance governs the three sub-dimensional second-
order measurement models. To validate the port performance model, the
observed variables in each of the latent variables were averaged to simplify
the original complex model (Garver and Mentzer, 1999). This method
enables researchers to test the complicated model by using only a small
sample (Lai et al, 2002). Consequently, the seven port evolution aspects that
were the latent variables and the first-order factors cascade downwards to
become the observed variables, and the three groups that were the second-order
factors likewise cascade to become the first-order factors as shown in
Figure 6. The overall Goodness-of-fit indices (w2/df¼ 2.6; GFI¼ 0.91;
CFI¼ 0.92; TLI¼ 0.83; IFI¼ 0.92; RMR¼ 0.04) demonstrate that they achieved
a good fit into the observed data. The factor loadings of the three second-order
factors are very high and significant at the 0.1 per cent level. A port
performance measurement model therefore can be conceptualised as a
multi-dimensional measure consisting of ‘Service’, ‘Operation’ and ‘Logistics’,
and is viable.
PortPerformance
Service
Operation
Logistics
0.68
0.98
0.97
0.93
0.82Service quality
Customer orientation
Service price
Efficient operation
Safety and security
Total price
Auxiliary service charge
0.42
0.68
0.87
0.79
0.71
0.76
0.21
0.46
0.58
0.76
0.62
0.51
χ2=26.077 (df=10, p=0.004); χ2/df=2.6; GFI=0.91; CFI=0.92; TLI=0.83; IFI=0.92; RMR=0.04
Figure 6: Port performance measurement model.
Port evolution and performance in changing logistics environments
271r 2011 Macmillan Publishers Ltd. 1479-2931 Maritime Economics & Logistics Vol. 13, 3, 250–277
AUTHOR COPY
Conc lus ion
This article has explored the changes taking place in ports through a two-stage
research process using exploratory and confirmatory studies. This led to the
development of a multi-dimensional port performance measurement frame-
work that reflects the changes taking place in ports. From the exploratory study,
it was found that efforts to be externally effective as well as to be internally
efficient are made by ports in order to cope with the challenges stemming from
a changing logistics environment. In other words, ports are striving to meet
customers’ requirements such as high service quality with low service price
and customer-oriented service, and to provide value-added services and high
connectivity with other transportation modes. In addition, the study demon-
strated that the effectiveness aspects of port evolution should be reflected in
the port performance measurement framework. It was also inferred that ‘Port
Cooperation’ is not overtly considered or adopted as an effective strategy by
either port operating companies or port authorities. The different evaluation of
‘Service Price’ and ‘Service Quality’ between the POC and SC groups was
revealed in the study. Port operating companies assert that low price rather than
high service quality is most strongly required by shipping companies, and
lowering price is the most preferred strategy by ports. However, shipping
companies believe that ‘Service Quality’ is the most important requirement
and this aspect should be reflected in port performance measurement frame-
works. This implies that in the long term, port operating companies and port
authorities should seek to acquire competitive advantage from improving
service quality and by providing differentiated services rather than from low-
ering price.
The confirmatory study validated the multi-dimensional port performance
measurement framework that simultaneously incorporates internal efficiency
aspects, external effectiveness aspects and logistical aspects of ports using the
typical standards of scale development. This implies that respondents believe
that port performance is multi-faceted. Specifically, port performance is shown
not to be limited to internal processes but is also concerned with external
service aspects such as ‘Service Quality’, ‘Customer Orientation’ and ‘Service
Price’, and logistical aspects such as ‘Connectivity to other transport modes’
and ‘Value-added Service’. The managerial implication is that managers in port
operating companies and port authorities should strive to maintain a balanced
focus embracing both effectiveness and efficiency aspects of performance
management and improvement, aiming to meet the expectations of customers
and other parties such as inland transport service providers. The multi-
conceptualisation provides insights into the constructs of port performance and
its relationships with the underlying dimensions. At item and sub-dimension
Woo et al
272 r 2011 Macmillan Publishers Ltd. 1479-2931 Maritime Economics & Logistics Vol. 13, 3, 250–277
AUTHOR COPY
levels, the constructs provide direct and actionable information on port
performance. At a higher level, managers are provided with an opportunity to
look at port performance at a more detailed level of abstraction beyond the
individual item and sub-dimension tiers.
However, there are also some limitations that should be considered when
discussing the conclusions of this study. Both surveys in this research were
conducted on sample groups in South Korea, which means that generalising the
results and implications to other countries would require careful consideration
as there may, for example, be cultural pressures and working practices that may
be different to other countries. Further, the empirical analysis was conducted
with a relatively small sample size of only 61 respondents. In order to improve
model fit statistics, and to provide more precise and reliable results, the
sample size needs to be larger. A questionnaire survey method was used to
explore the internal changes taking place in ports, which can be termed ‘port
evolution’; this evaluation necessarily involves quantitative research methods.
Qualitative research methodologies such as interviewing would need to be
adopted for the exploratory stage of a study. This study employed only
measurement models (that is, CFA) from the overall SEM approach. For further
research, it would be both interesting and useful to identify any additional
relationships that may exist between the constructs in the validated measure-
ment model or between other variables. The present study discarded one
port evolution aspect, ‘Port Cooperation’, from the descriptive analysis.
Therefore the relationship of this aspect to port performance was not evaluated
and could be included in future research.
References
Anderson, J.C., Gerbing, D.W. and Hunter, J.E. (1987) On the assessment of unidimensional
measurement: Internal and external consistency, and overall consistency criteria. Journal of
Marketing Research 24: 432–437.
Banomyong, R. (2005) The impact of port and trade security initiatives on maritime supply-chain
management. Maritime Policy and Management 32: 3–13.
Beamon, B.M. (1999) Measuring supply chain performance. International Journal of Operations and
Production Management 19: 275–292.
Beresford, A.K.C., Gardner, B.M., Pettit, S.J., Naniopoulos, A. and Wooldridge, C.F. (2004) The
UNCTAD and WORKPORT models of port development: Evolution or revolution? Maritime Policy
& Management 31: 93–107.
Bichou, K. (2004) The ISPS code and the cost of port compliance: An initial logistics and supply
chain framework for port security assessment and management. Maritime Economics and
Logistics 6: 322–348.
Bichou, K. (2007) Review of port performance approaches and a supply chain framework to port
performance benchmarking. In: M.R. Brooks and K. Cullinane (eds.) Devolution, Port Governance
and Port Performance. Amsterdam: Elsevier.
Port evolution and performance in changing logistics environments
273r 2011 Macmillan Publishers Ltd. 1479-2931 Maritime Economics & Logistics Vol. 13, 3, 250–277
AUTHOR COPY
Brooks, M.R. (2007) Issues in measuring port devolution program performance: A managerial
perspective. In: M.R. Brooks and K. Cullinane (eds.) Devolution, Port Governance and Port
Performance. Amsterdam: Elsevier JAI.
Byrne, B.M. (2001) Structural Equation Modelling with AMOS Basic Concepts, Applications, and
Programming. Mahwah, NJ: Lawrence Erlbaum Associates.
Carbone, V. and De Martino, M. (2003) The changing role of ports in supply-chain management:
An empirical analysis. Maritime Policy & Management 30: 305–320.
Cho, J. and Kang, J. (2001) Benefits of challenges of global sourcing: Perceptions of US apparel retail
firms. International Marketing Review 18: 542–560.
Clark, X., Dollar, D. and Micco, A. (2004) Port efficiency, maritime transport costs, and bilateral
trade. Journal of Development Economics 75: 417–450.
Cochrane, R.A. (2007) The Effects of Market Differences on the Throughput of Large Container
Terminals with Similar Levels of Efficiency, Proceeding of the IAME 2007 Conference, Athens,
Greece. IAME.
Cullinane, K., Song, D.-W., Ji, P. and Wang, T.-F. (2004) An application of DEA windows analysis to
container port production efficiency. Review of Network Economics 3: 184–206.
Devellis, R.F. (1991) Scale Development: Theory and Application. Newbury Park, CA: Sage
Publications.
Fleming, D.K. and Baird, A.J. (1999) Some reflections on port competition in the United States and
Western Europe. Maritime Policy & Management 26: 383–394.
Fornell, C. and Larker, D.F. (1981) Evaluating structural equation models with unobservable
variables and measurement error. Journal of Marketing Research 18: 39–50.
Garver, M.S. and Mentzer, J.T. (1999) Logistics research methods: Employing structural equation
modelling to test for construct validity. Journal of Business Logistics 20: 33–57.
Gerbing, D.W. and Anderson, J.C. (1988) An updated paradigm for scale development incorporating
unidimensionality and its assessment. Journal of Marketing Research 25: 186–192.
Hair, J.F., Anderson, R.E., Tatham, R.L. and Black, W.C. (1998) Multivariate Data Analysis. Upper
Saddle River, NJ: Prentice Hall.
Heaver, T. (2001) The evolving roles of shipping lines in international logistics. International Journal
of Maritime Economics 3: 210–230.
Kline, R.B. (2005) Principles and Practices of Structural Equation Modelling. New York: The Guilford
Press.
Lai, K.H., Ngai, E.W. and Cheng, T.C. (2002) Measures for evaluating supply chain performance in
transport logistics. Transportation Research Part E 38: 439–456.
Lambert, D.M. and Cooper, M.C. (2000) Issues in supply chain management – Don’t automate,
obliterate. Industrial Marketing Management 29: 65–83.
Lee, P.T.-W. and Chang, Y.-T. (2007) Impact of Port Security on LNG and Container Cargo Movements,
Proceedings of the IAME 2007 Conference, Greece Athens. IAME.
Marlow, P.B. and Paixao-Casaca, A.C. (2003) Measuring lean ports performance. International
Journal of Transport Management 1: 189–202.
Notteboom, T.E. (2004) Container shipping and ports: An overview. Review of Network Economics 3:
86–106.
Notteboom, T.E. and Winkelmans, W. (2001) Structural changes in logistics: How will port
authorities face the challenge? Maritime Policy and Management 28: 71–89.
Panayides, P.M. (2006) Maritime logistics and global supply chains: Towards a research agenda.
Maritime Economics & Logistics 8: 3–18.
Rabinovich, E., Windle, R., Dresner, M. and Corsi, T. (1999) Outsourcing of integrated logistics
functions: An examination of industry practices. International Journal of Physical Distribution &
Logistics Management 29: 353–373.
Robinson, R. (2002) Ports as elements in value-driven chain systems: The new paradigm. Maritime
Policy & Management 29: 241–255.
Woo et al
274 r 2011 Macmillan Publishers Ltd. 1479-2931 Maritime Economics & Logistics Vol. 13, 3, 250–277
AUTHOR COPY
Sachish, A. (1996) Productivity functions as a managerial tool in Israeli ports. Maritime Economics &
Logistics 23: 341–369.
Slack, B. (1985) Containerization, inter-port competition and port selection. Maritime Policy &
Management 12: 293–303.
Slack, B., Comtois, C. and Sletmo, G. (1996) Shipping lines as agents of change in the port industry.
Maritime Policy and Management 23: 289–300.
Slack, B., Comtois, C., Mccalla, R.J. and Guy, E. (2001) Global Reach: The Evolving Pattern of
Container Shipping Networks, Proceedings of World Conference on Transport Research. Seoul,
South Korea. Oxford: Pergamon Press.
Tabachnick, B.G. and Fidell, L.S. (2001) Using Multivariate Statistics. Boston, MA: Allyn and Bacon.
Talley, W.K. (1988) Optimum throughput and performance evaluation of marine terminals. Maritime
Policy & Management 15: 327–331.
Talley, W.K. (1994) Performance indicators and port performance evaluation. Logistics and
Transportation Review 30: 339–352.
Tongzon, J. (2001) Efficiency measurement of selected Australian and other international ports using
data envelopment analysis. Transportation Research Part A: Policy and Practice 35: 107–122.
Tongzon, J. (2002) Port Choice Determinants in a Competitive Environment. Panama: IAME.
Tongzon, J.L. (1995) Determinants of port performance and efficiency. Transportation Research Part
A: Policy and Practice 29: 245–252.
Tongzon, J. and Ganesalingam, S. (1994) An evaluation of ASEAN port performance and efficiency.
Asian Economic Journal 8: 317–330.
UNCTAD. (2004) Efficient Transport and Trade Facilitation to Improve Participation by Developing
Countries in International Trade (TD/B.COM.3/67). Geneva: UNCTAD.
Wang, T.-F. and Cullinane, K. (2006) The efficiency of European container terminals and
implications for supply chain management. Maritime Economics & Logistics 8: 82–99.
Woo, S.-H., Pettit, S.J. and Beresford, A.K.C. (2008) A New Port Performance Measurement
Framework in a Changing Logistics Environment, Proceedings of the LRN 2008 Annual
Conference; 10–12 September. Liverpool, UK: CILT, pp. 141–146.
Port evolution and performance in changing logistics environments
275r 2011 Macmillan Publishers Ltd. 1479-2931 Maritime Economics & Logistics Vol. 13, 3, 250–277
AUTHOR COPY
Appendix
Table A1: Appropriateness of the indicators for the port evolution aspects
Aspect Indicator All groups POC SC PS AC
Efficient Throughput 4.32 4.60 4.00 4.38 4.08Operation Throughput per hectare 3.88 4.25 3.69 3.92 3.38
Throughput per worker 3.85 4.25 3.46 3.46 4.38Throughput per crane 4.33 4.75 3.92 4.23 4.38Ship waiting time 4.32 4.30 4.62 4.08 4.50Ship working time 4.29 4.45 4.15 4.19 4.38Time of port related services 3.67 3.60 3.92 3.85 4.00Time of cargo stay in port 3.83 3.75 3.92 3.73 4.08
Service Price Total cost involved in port 4.68 4.70 4.54 4.69 4.77Cargo handling charge 4.38 4.65 4.23 4.19 4.46Port related service charge 4.00 4.15 3.92 3.81 4.23Port facility usage charge 4.03 4.30 4.15 3.69 4.15
Service Timeliness 4.60 4.60 4.46 4.69 4.54Quality Reliability 4.46 4.35 4.46 4.46 4.62
Lead time to service delivery 4.24 4.40 4.23 4.04 4.46Level of cargo damage 3.89 4.05 3.85 3.62 4.23Accuracy of shipment information 4.01 4.15 4.15 3.85 4.15
Customer Orientation Responsiveness 4.56 4.65 4.46 4.50 4.62Flexibility 4.19 4.25 4.23 3.96 4.54Annual number of claims 3.85 4.20 3.85 3.50 4.00
Connectivity Cargo waiting time between modes 4.31 4.30 4.31 4.15 4.46Cargo working time between modes 4.13 4.15 4.38 3.96 4.15
Value-added Service Cargo accruing from VAS 4.06 4.00 4.00 4.12 4.08Value-added from VAS 4.11 4.00 4.00 4.15 4.33
Safety and Security Compliance with regulation 4.33 4.50 4.15 4.27 4.38Annual number of accidents 4.10 4.15 4.38 4.00 3.92Annual number of accidents prevented 3.71 3.75 3.92 3.54 3.77
Woo et al
276 r 2011 Macmillan Publishers Ltd. 1479-2931 Maritime Economics & Logistics Vol. 13, 3, 250–277
AUTHOR COPY
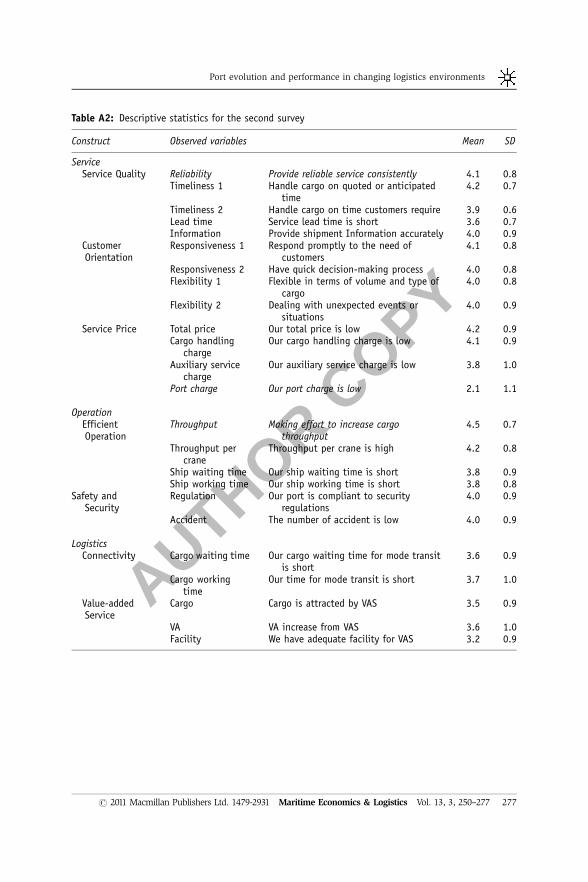
Table A2: Descriptive statistics for the second survey
Construct Observed variables Mean SD
ServiceService Quality Reliability Provide reliable service consistently 4.1 0.8
Timeliness 1 Handle cargo on quoted or anticipatedtime
4.2 0.7
Timeliness 2 Handle cargo on time customers require 3.9 0.6Lead time Service lead time is short 3.6 0.7Information Provide shipment Information accurately 4.0 0.9
CustomerOrientation
Responsiveness 1 Respond promptly to the need ofcustomers
4.1 0.8
Responsiveness 2 Have quick decision-making process 4.0 0.8Flexibility 1 Flexible in terms of volume and type of
cargo4.0 0.8
Flexibility 2 Dealing with unexpected events orsituations
4.0 0.9
Service Price Total price Our total price is low 4.2 0.9Cargo handling
chargeOur cargo handling charge is low 4.1 0.9
Auxiliary servicecharge
Our auxiliary service charge is low 3.8 1.0
Port charge Our port charge is low 2.1 1.1
OperationEfficientOperation
Throughput Making effort to increase cargothroughput
4.5 0.7
Throughput percrane
Throughput per crane is high 4.2 0.8
Ship waiting time Our ship waiting time is short 3.8 0.9Ship working time Our ship working time is short 3.8 0.8
Safety andSecurity
Regulation Our port is compliant to securityregulations
4.0 0.9
Accident The number of accident is low 4.0 0.9
LogisticsConnectivity Cargo waiting time Our cargo waiting time for mode transit
is short3.6 0.9
Cargo workingtime
Our time for mode transit is short 3.7 1.0
Value-addedService
Cargo Cargo is attracted by VAS 3.5 0.9
VA VA increase from VAS 3.6 1.0Facility We have adequate facility for VAS 3.2 0.9
Port evolution and performance in changing logistics environments
277r 2011 Macmillan Publishers Ltd. 1479-2931 Maritime Economics & Logistics Vol. 13, 3, 250–277