Population Variation of the Fall Armyworm, Spodoptera frugiperda, in the Western Hemisphere
10
Population variation of the fall armyworm, Spodoptera frugiperda, in the Western Hemisphere Pete L. Clark 1 , Jaime Molina-Ochoa 2 , Samuel Martinelli 3 , Steven R. Skoda 4 , David J. Isenhour 5 , Donald J. Lee 6 , Jeffrey T. Krumm 1 and John E. Foster 1 1 University of Nebraska Department of Entomology, 312 F Plant Industry Building, Lincoln, NE, 68583 0816, USA 2 Facultad de Ciencas Biológicas y Agropecuarias, Universidad de Colima Apartado postal no. 36, Tecomán, Colima 28100, Mexico 3 Laboratório de Resistência de Artrópodes a Pesticidas (ESALQ/USP), Av. Pádua Dias, 11 Caixa Postal 09, CEP:13418-900, Piracicaba-SP, Brazil 4 USDA-ARS-SPASRU Screwworm Research Unit, Panama City, Republic of Panamá 5 Monsanto Company 800 North Lindbergh Blvd., St. Louis, MO, 63167, USA 6 University of Nebraska Department of Agronomy, Lincoln, NE 68583 – 0915, USA Abstract Spodoptera frugiperda (J.E. Smith) (Lepidoptera: Noctuidae), the fall armyworm is the most economically important maize pest in the western hemisphere. This research focused on the genetic variability of the maize host strain because there is a lack of information in this area of S. frugiperda research. Amplified fragment length polymorphism (AFLP) was used to assess the genetic variability of S. frugiperda over a large geographic area. Twenty populations were collected from the maize, one population was collected from princess tree, one population was collected from lemon tree, and one population was collected from bermudagrass. The 23 populations were from Mexico, the continental United States, Puerto Rico, Brazil, and Argentina. The objective of this research was to evaluate whether the majority of genetic variability was within populations or between populations. The AFLP results showed that the majority of the genetic variability is within populations and not between populations, indicating minor gene flow and suggesting that S. frugiperda in the Western Hemisphere are an interbreeding population. Keywords: fall armyworm, molecular genetics, AFLP, AMOVA Correspondence: [email protected], [email protected], [email protected], [email protected], [email protected], [email protected], [email protected], [email protected] Received: 19.11.2005 | Accepted: 20.5.2006 | Published: 25.1.2007 Copyright: Creative Commons Attribution 2.5 ISSN: 1536-2442 | Volume 7, Number 5 Cite this paper as: Clark PL, Molina-Ochoa J, Martinelli S, Skoda SR, Isenhour DJ, Lee DJ, Krumm JT, Foster JE. 2007. Population variation of the fall armyworm, Spodoptera frugiperda, in the Western Hemisphere. 10pp. Journal of Insect Science 7.05, available online: insectscience.org/7.05 Journal of Insect Science | www.insectscience.org ISSN: 1536-2442 Journal of Insect Science: Vol. 7 | Article 5 1
-
Upload
un-lincoln -
Category
Documents
-
view
0 -
download
0
Transcript of Population Variation of the Fall Armyworm, Spodoptera frugiperda, in the Western Hemisphere
Population variation of the fall armyworm,Spodoptera frugiperda, in the Western Hemisphere
Pete L. Clark1, Jaime Molina-Ochoa2, Samuel Martinelli3, Steven R.Skoda4, David J. Isenhour5, Donald J. Lee6, Jeffrey T. Krumm1 and JohnE. Foster1
1 University of Nebraska Department of Entomology, 312 F Plant Industry Building, Lincoln, NE, 685830816, USA2 Facultad de Ciencas Biológicas y Agropecuarias, Universidad de Colima Apartado postal no. 36,Tecomán, Colima 28100, Mexico3 Laboratório de Resistência de Artrópodes a Pesticidas (ESALQ/USP), Av. Pádua Dias, 11 Caixa Postal09, CEP:13418-900, Piracicaba-SP, Brazil4 USDA-ARS-SPASRU Screwworm Research Unit, Panama City, Republic of Panamá5 Monsanto Company 800 North Lindbergh Blvd., St. Louis, MO, 63167, USA6 University of Nebraska Department of Agronomy, Lincoln, NE 68583 – 0915, USA
AbstractSpodoptera frugiperda (J.E. Smith) (Lepidoptera: Noctuidae), the fall armyworm is the mosteconomically important maize pest in the western hemisphere. This research focused on the geneticvariability of the maize host strain because there is a lack of information in this area of S. frugiperdaresearch. Amplified fragment length polymorphism (AFLP) was used to assess the genetic variability ofS. frugiperda over a large geographic area. Twenty populations were collected from the maize, onepopulation was collected from princess tree, one population was collected from lemon tree, and onepopulation was collected from bermudagrass. The 23 populations were from Mexico, the continentalUnited States, Puerto Rico, Brazil, and Argentina. The objective of this research was to evaluate whetherthe majority of genetic variability was within populations or between populations. The AFLP resultsshowed that the majority of the genetic variability is within populations and not between populations,indicating minor gene flow and suggesting that S. frugiperda in the Western Hemisphere are aninterbreeding population.
Keywords: fall armyworm, molecular genetics, AFLP, AMOVACorrespondence: [email protected], [email protected], [email protected], [email protected],[email protected], [email protected], [email protected], [email protected]: 19.11.2005 | Accepted: 20.5.2006 | Published: 25.1.2007Copyright: Creative Commons Attribution 2.5ISSN: 1536-2442 | Volume 7, Number 5
Cite this paper as:Clark PL, Molina-Ochoa J, Martinelli S, Skoda SR, Isenhour DJ, Lee DJ, Krumm JT, Foster JE. 2007. Populationvariation of the fall armyworm, Spodoptera frugiperda, in the Western Hemisphere. 10pp. Journal of InsectScience 7.05, available online: insectscience.org/7.05
Journal of Insect Science | www.insectscience.org ISSN: 1536-2442
Journal of Insect Science: Vol. 7 | Article 5 1
IntroductionThe fall armyworm, Spodoptera frugiperda (J.E.Smith) (Lepidoptera: Noctuidae) is a migratorypest endemic to the Western Hemisphere thatoccurs from Southern Canada to Argentina(Johnson 1987). S. frugiperda is phytophagousand causes considerable economic losses inseveral important crops such as maize, sorghum,rice, cotton, alfalfa, forage grasses, andoccasionally other crops in most of the countriesof its range (Sparks 1986). S. frugiperda wasconsidered a single species but, since about twodecades ago, two morphologicallyindistinguishable host strains have been identified(Pashley 1986); one strain feeds primarily onmaize and sorghum (corn strain), and the otherstrain feeds on rice and bermudagrass (ricestrain) (Pashley et al. 1985; Pashley 1986). Thefact that no consistent morphological differenceshave been found between the two strains, suggeststhat the strains are very closely related andprobably of recent origin (Veenstra et al. 1995).Host strains also exhibit differences indevelopment and survivorship when fed onvarieties of bermudagrass (Pashley et al. 1987).They also show reproductive incompatibility(Pashley & Martin 1987), reproductive isolatingmechanisms (Pashley et al. 1992), behavioral andphysiological factors such as food consumption,utilization, and detoxification enzyme activities(Veenstra et al. 1995), and developmental andreproductive traits when fed on different hostplants (Pashley et al. 1995), suggesting that therice strain larvae were more specialized andaffected by their host plant than larvae in the cornhost strain.
A rapid PCR based method has been described fordetecting large tandem repeat clusters of the S.frugiperda rice strain sequences from individualadult moths (Nagoshi and Meagher 2003), andmitochondrial markers have been described foridentifying S. frugiperda host strains (Meagher &Gallo-Meagher 2003). Most of these studies havebeen carried out with S. frugiperda populationsfrom the Caribbean basin and the SoutheasternUnited States collected from rice and maize, butthere is a lack of knowledge of the geneticvariation in large-scale geographic populations ofS. frugiperda collected from maize. Pashley et al.1985 used four Mexican geographic populationscollected from maize. Three of the fourpopulations were collected in proximity to theGulf of Mexico: Tampico Tamulipas, TuxpanVeracruze, and Campeche Campeche; and one
population collected at Arriaga Chiapas located atthe southeastern coast of the Pacific Ocean. OtherS. frugiperda populations were from southernFlorida, Louisiana, Texas and Puerto Rico. Theyfound that the genetic differences were largelydue to a highly divergent Puerto Rican populationcollected from rice, all other collections were frommaize. Additionally, geographic populations of S.frugiperda from Mexico collected from maizeexhibited biological differences such asdevelopmental rate, reproductive compatibility,and susceptibility to chemical and biologicalpesticides according to Lopez-Edwards et al.1999.
AFLP markers were originally developed forplants with small genomes but also became highlyeffective for plants with larger genomes. AFLP is atool that generates highly polymorphic molecularmarkers that aid in building linkage maps andassessing genetic variation. AFLP has beensuccessfully used for the study of insects(Hawthorne 2001; Parsons & Shaw 2002; Reinekeet al. 1999; Takami et al. 2004; Tan et al. 2001;Timmermans et al. 2005), including S. frugiperda(McMichael & Prowell 1999; Busato et al. 2005).
AFLP is based on selective PCR amplification ofrestriction fragments from a total digest ofgenomic DNA. The amplification is achieved byusing adapted and restriction site sequences astarget sites for primer annealing. Selectiveamplification is achieved by amplifying fragmentsthat have primer extensions that matchnucleotides flanking the restriction sites, whichallows sets of restriction fragments to bevisualized by PCR without prior knowledge of thenucleotide sequence (Vos et al. 1995). A drawbackof AFLP is that the procedure may require largeamounts of DNA and the process requiresmultiple operations (Hoy 2003). In the specificcase of this research, S. frugiperda are relativelylarge and provided the amounts of DNA needed.AFLP products are sorted according to size usinggel electrophoresis. Two types of gels are used:agarose gels may be used to separate fragmentsfrom 300 base pairs (bp) to 1 kilobase (kb) pairsin size; and polyacrylamide are the best choice forsmaller fragments (10 bp to 20 kb) (Dowling et al.1996).
The objective of this research was to assess thegenetic variability of S. frugiperda populationsover a large geographic area. AFLP markers wereselected to measure genetic variability between 20S. frugiperda populations collected from maize
Journal of Insect Science | www.insectscience.org ISSN: 1536-2442
Journal of Insect Science: Vol. 7 | Article 5 2
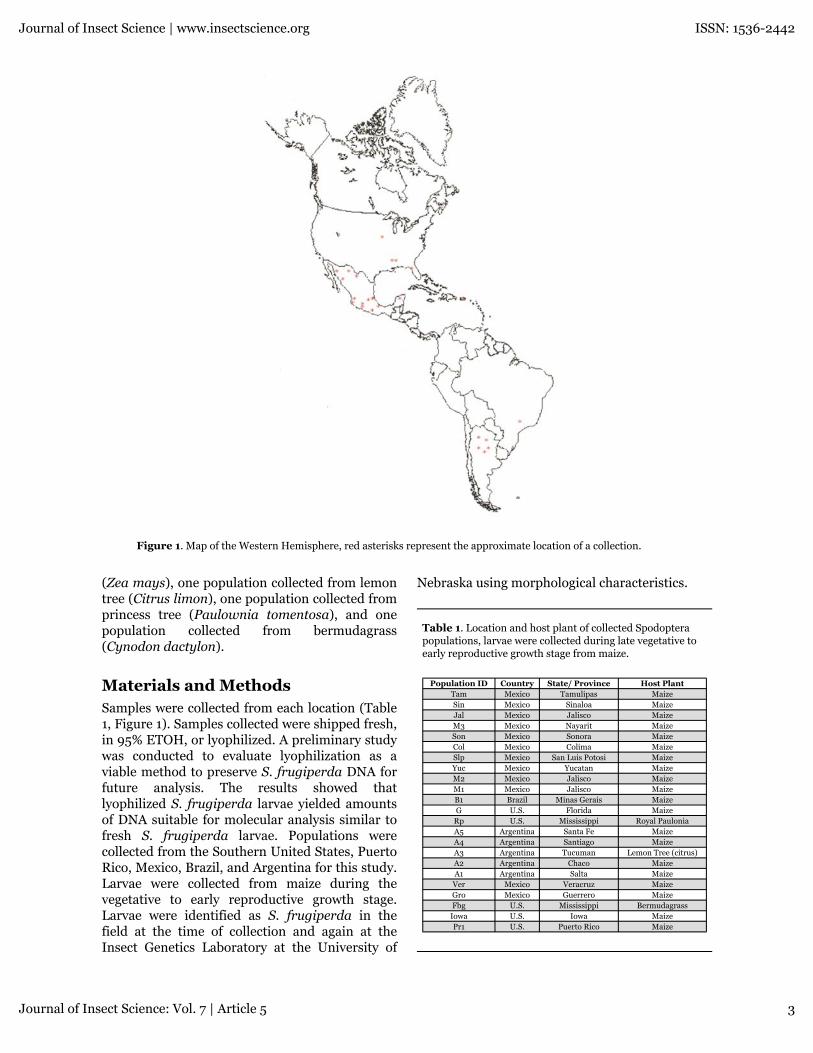
Figure 1. Map of the Western Hemisphere, red asterisks represent the approximate location of a collection.
(Zea mays), one population collected from lemontree (Citrus limon), one population collected fromprincess tree (Paulownia tomentosa), and onepopulation collected from bermudagrass(Cynodon dactylon).
Materials and MethodsSamples were collected from each location (Table1, Figure 1). Samples collected were shipped fresh,in 95% ETOH, or lyophilized. A preliminary studywas conducted to evaluate lyophilization as aviable method to preserve S. frugiperda DNA forfuture analysis. The results showed thatlyophilized S. frugiperda larvae yielded amountsof DNA suitable for molecular analysis similar tofresh S. frugiperda larvae. Populations werecollected from the Southern United States, PuertoRico, Mexico, Brazil, and Argentina for this study.Larvae were collected from maize during thevegetative to early reproductive growth stage.Larvae were identified as S. frugiperda in thefield at the time of collection and again at theInsect Genetics Laboratory at the University of
Nebraska using morphological characteristics.
Table 1. Location and host plant of collected Spodopterapopulations, larvae were collected during late vegetative toearly reproductive growth stage from maize.
Population ID Country State/ Province Host PlantTam Mexico Tamulipas MaizeSin Mexico Sinaloa MaizeJal Mexico Jalisco MaizeM3 Mexico Nayarit MaizeSon Mexico Sonora MaizeCol Mexico Colima MaizeSlp Mexico San Luis Potosi MaizeYuc Mexico Yucatan MaizeM2 Mexico Jalisco MaizeM1 Mexico Jalisco MaizeB1 Brazil Minas Gerais MaizeG U.S. Florida Maize
Rp U.S. Mississippi Royal PauloniaA5 Argentina Santa Fe MaizeA4 Argentina Santiago MaizeA3 Argentina Tucuman Lemon Tree (citrus)A2 Argentina Chaco MaizeA1 Argentina Salta MaizeVer Mexico Veracruz MaizeGro Mexico Guerrero MaizeFbg U.S. Mississippi Bermudagrass
Iowa U.S. Iowa MaizePr1 U.S. Puerto Rico Maize
Journal of Insect Science | www.insectscience.org ISSN: 1536-2442
Journal of Insect Science: Vol. 7 | Article 5 3
DNA was isolated from seven larvae (7 larvaewere used because it was the maximum numberof successful extractions for two populations fromArgentina, making all populations consistent) perpopulation using a modification of Black &Duteau’s (1997) CTAB extraction protocol. Larvaewere collected/preserved using three methods: 1)Fresh and then frozen at −80° C; 2) Larvaecollected and placed in vials containing 95%ETOH, then triple rinsed in double distilled H20and stored at −80° C and; 3) Larvae werelyophilized in the country of collection thenshipped at ambient temperature and stored dry at−80° C. Larvae were homogenized in 500 μlextraction buffer (100 mM Tris-HCL pH 8.0, 1.4MNaCl, 0.02m EDTA, 2% CTAB, and 0.2%β-mercaptoethanol). Proteinase K (concentrationof 200 μg/ml extraction buffer) was added to thehomogenate for 2 hrs at 65oC. RNase A (500μg/ml) was added to the homogenate and held for3 hrs at 37oC. After RNA and protein wereremoved from each sample, the homogenate wascentrifuged at 13,000 rpm for 5 min at roomtemperature. The supernatant was extracted with500 μl of chloroform: isoamyl alcohol (24:1) bycentrifugation at 14,000 rpm for 20 min. toseparate the phases. The aqueous phase wastransferred into an autoclaved 1.5ml microcentrifuge tube and the chloroform: isoamyl stepwas repeated. DNA was precipitated by adding400 μl chilled (−20o C) isopropanol to theaqueous phase and incubated at 4oC for 8 h. Afterincubation the precipitate was centrifuged at13,000 rpm at 4oC for 30 min. The isopropanolwas decanted off; the DNA pellet was rinsed with500 μl 100% ETOH and centrifuged at 13,000rpm at 4o C for 5 min and repeated a second time.The ETOH was decanted off and the pellet was airdried at 24°C for 45 min. 50 μl 1X TE buffer(10mM Tris-HCL pH 8.0; 0.1 mM EDTA) waspoured onto the DNA pellet and stored at 4oC for8 hours. After the DNA was re-suspended in 1XTE buffer, each sample was quantified by runninga 1% agarose gel with a λ DNA marker (22.2ng/μl). TE buffer (1X) was added to DNA samplesuntil they reached a concentration of 22.2 ng/μlconcentration of genomic DNA. The agarose gelswere visualized using Genomics Solutionssoftware.
A modified AFLP (Vos et al. 1995) procedure wasused as a molecular marker tool to assess thegenetic variability of S. frugiperda populations.The AFLP procedure was carried out in 3 steps: 1)
DNA template preparation; 2) DNA templatepreamplification and; 3) AFLP Selectiveamplification
DNA Template Preparation. Restriction digestionwas completed using 7 μl of quantifiedgenomic DNA (155.5 ng) that was incubatedwith EcoRI and MseI restrictionendonucleases (New England Biolabs,www.neb.com) for 2.5 hrs at 37oC in solutioncontaining 1.25 μl of 10X One-Phor-All buffer(Amersham Pharmacia biotech,www.apbiotech.com), 0.125 μl of 10 U/μlMseI enzyme (1.25U/reaction), 0.0625 μl of20 U/μl EcoRI enzyme (1.25 U/reaction),0.125 μl of 10 ng/ml BSA (bovine serumalbumin) (New England Biolabs), andautoclaved nanopure H20. Five μl of ligationmixture containing 0.15 μl of T4 DNA ligaseand 0.5 μl of 10X T4 ligase buffer (NewEngland Biolabs), 0.5 μl of 5 pmoles/μl EcoRIadapter, 0.5 μl of 5 pmoles/μl MseI adapter(Operon Technologies, www.operon.com),and 3.35 μl autoclaved nanopure water wasadded to the restriction digestion productand was incubated for 10 hrs at 25oC using anMJ Research (www.operon.com) PTC-200Peltier Thermo Cycler (used for all PCRreactions); the ligation mixture was dilutedby adding 135 μl of 1X TE buffer to eachsample.
Preamplification of DNA Template. A master mixof 8 μl pre-amp primer mix II containing twooligonucleotide primers, EcoRI adapted endsand MseI ends (Life technologies,www.operon.com), 1.0 μl of 10X PCR buffercontaining 15mM MgCl2 and 0.20 μl of 5U/μl AmpliTaq DNA polymerase (1.25U/reaction) (Applied Biosystems,www.appliedbiosystems.com) were added toeach reaction tube containing 1 μl of dilutedligation product and amplified using 20 PCRcycles of 30s at 94oC, 1 min at 56oC, and 1min 72oC. The oligonucleotide primers in thepre-amp primer mix II are complementary tothe adapter/restriction site with MseI primercontaining one selective nucleotide (M+1primer) and EcoRI primer containing noselective nucleotide (E+0 primer). Eachpreamplification product was diluted with190 μl of nanopure H20.
Journal of Insect Science | www.insectscience.org ISSN: 1536-2442
Journal of Insect Science: Vol. 7 | Article 5 4
AFLP Selective Amplification. Five primers wereselected, in four primer pair combinations forselective amplification (Table 2). A selectiveamplification master mix was made using 2μl of diluted preamplification product 4.2 μlof autoclaved nanopure water, 1.2 μl of 10XPCR buffer, 0.72 μl 25 mM MgCl2, 0.08 μl of5 U/μl AmpliTaq polymerase (AppliedBiosystems), 2.0 μl of MseI primer(Invitrogen, www.invitrogen.com) and 0.3 μlof 1.0 pmol/μl IRD-700 labeled EcoRI primer(LI-COR, www.licor.com). The “Touchdown”PCR program: 1 cycle of 30s at 94o C, 30s at65o C, and 1 min at 72o C; 12 cycles of 30s at94o C, 30s at 65° C (lowering the annealingtemperature by 0.7° C) and 1 min at 72oC; 23cycles of 30s at 94oC, 30s at 56oC, 1 min at72oC; then hold at 4oC was used for selectiveamplification. Reactions were stopped priorto loading the selective amplification producton polyacrylamide gels by adding 2.5 μl stopsolution (LI-COR) to each reaction tube, thenholding at 95oC for 3 min., then cooling to 4°C prior to loading the PAGE gel. 42 sampleswere run per gel (6 populations of 7 sampleseach), and IRD-labeled 50-700 bp sizemarker (LI-COR) in two lanes. 1 μl of markerwas loaded into lanes 1 and 44, lanes 2through 43 contained 1 μl of selectiveamplification product. Electrophoresisthrough KBplus 6.5% ready-to-use gel matrix(LI-COR) was used to separate the DNA andthe bands were detected by a LI-COR GeneRead IR 4200 sequencer.
Table 2. Primers used for selective amplification for AFLP.
Primer Primer Type Sequence (5’ to 3’)E (N+0+3) EcoRI IR 700labeled Primer GAC TGC GTA CCA ATT C ACTM(N+1+2) MseI Unlabeled Primer GAT GAG TCC TGA GTA A CACM(N+1+2) MseI Unlabeled Primer GAT GAG TCC TGA GTA A CAGM(N+1+2) MseI Unlabeled Primer GAT GAG TCC TGA GTA A CTAM(N+1+2) MseI Unlabeled Primer GAT GAG TCC TGA GTA A CTC
AFLP bands were evaluated using an IRD-700labeled 50-700bp marker as a reference andscored using SAGA Generation 2 SoftwareVersion 3.2 (LI-COR, Lincoln, NE). The data setconsisted of 1’s and 0’s (presence or absencerespectively) as analyzed from each AFLP gel.
Coefficient of variation is a tool used to assesswhether enough data were used (i.e. enough loci,enough primer pair combinations, or both) forproper genetic analysis. DBOOT version 1.1
(Coelho 2001) was used for bootstrap analysis(10,000 iterations) of selected loci, to assessprecision for genetic variation and gene flowanalysis.
Popgene version 1.32 (Yeh & Boyle 1997) was usedto assess the degree of polymorphisms bothwithin and between populations of S. frugiperda.Genetic variation (h) between populations wasmeasured using Nei’s gene diversity index.Popgene considered a locus polymorphic if thefrequency of the most common allele fell below a0.95 threshold. Genetic variation betweenpopulations was assessed using GST. GST isexpressed as the heterozygosity (H) of a singlepopulation subtracted from the heterozygosity ofthe total population, divided by the heterozygosityof the total population (GST = HTotal – HSingle/HTotal. Gene flow was estimated from GST,expressed as (Nm) = 0.5 (1- GST) (McDermott andMcDonald 1993). Popgene assesses heterozygosityas differences in banding patterns orpolymorphisms between individuals orpopulations.
A binary data matrix was used to estimate geneticsimilarity using the Jaccard index through theSIMQUAL procedure using NTSYSpc (Rohlf2000). The similarity coefficient among allpopulations was estimated using Jaccard:
Where:
a = number of cases where a band occurssimultaneously in both individuals
b = number of cases when a band occurs only inthe ith individual
c = number of cases where the band occurs on inthe jth individual
The Jaccard index was chosen because thecoefficient of similarity considers only shared 1sas contributing to the similarity of individuals anddisregards shared 0s. However, there is nogeneral consensus between the variouscoefficients (Dice, Jaccard, or simple mismatch)for analyzing AFLP fingerprints (Kosman &Leonard 2005).
Journal of Insect Science | www.insectscience.org ISSN: 1536-2442
Journal of Insect Science: Vol. 7 | Article 5 5
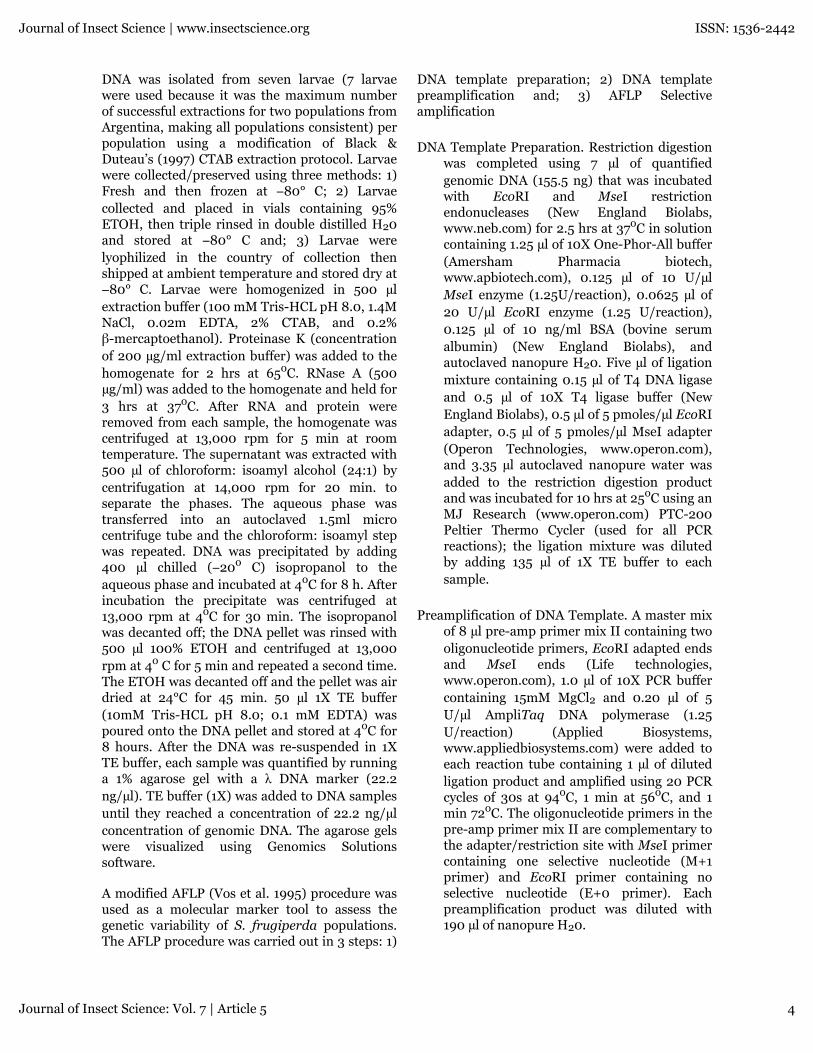
Figure 2. Screen shot of an AFLP gel with markers and lane labels from Saga Generation 2 Software (LI-COR,Lincoln, NE). Note: picture does not represent the length of the full gel, actual gels are 700bp.
Dendrograms were constructed to illustrategenetic similarity, following the methodologydescribed by Sneath & Sokal (1973). Bootstrapanalysis was used as a way of testing the reliabilityof the dataset, by the creation of a pseudoreplicatewhich re-sampled the data 10,000 times usingBOOD-P software ver. 3.1 (Coelho 2001). Thegoodness of fit of the population dendrogram wasmeasured using COPH and MAXCOMP fromNTSYSpc (Rohlf 2000). Analysis of molecularvariance (AMOVA) was performed to assess thegenetic structure and genetic variability betweenand among the populations. AMOVA analysisworked by partitioning the total variation betweenand within populations of S. frugiperda and wasrun using the Arlequin program (Schneider et al.2000). A two-part AMOVA analysis wasperformed by testing the genetic structure as afactor of variation among individuals within agiven population and between populations.Pairwise comparisons were conducted using theArlequin program (Schneider et al. 2000) to testgenetic divergence (FST). Genetic isolation wastested using the Mantel test with 1000permutations (Mantel 1967) using NTSYSpc andcomparing geographic distance and geneticdissimilarity.
Principle component analysis was run to testgenetic isolation using NTSYSpc, and creating anEigen plot. The principle component analysis is atwo-dimensional test that can separate groupsinto quadrants based on the data. In this analysis,the principal component analysis would give us
information regarding genetic isolation amongthe various populations.
Results and DiscussionAFLP provided a large number of useable andreproducible markers (Figure 2) to study S.frugiperda population genetics. The four primerpair combinations selected to analyze the 23populations yielded 833 AFLP (56–394 base pairsin size) markers per population (based onpopulation consensus). The primer paircombinations were chosen for their consistency ofscorable bands over all populations,polymorphisms, and reproducible bandingpatterns. Bootstrap analysis of markers indicatedthat the coefficient of variation of the data(Jaccard index) was 12% explaining 88% of thetotal variation of the populations, indicating highprecision. The coefficient of variation programindicated that the minimum AFLP markersneeded per population was 733. Therefore the 833AFLP markers per population used for theanalysis were sufficient for the stability of theUPGMA (unweighted pair group method witharithmetic mean) (Sneath & Snokal 1973)dendrogram. The coefficient of variation test wasvaluable because the results of the analysisindicated that enough markers were chosen andthat primer pair combinations no longer neededto be screened.
The mean genetic diversity (Table 3) within anindividual population was at a level that would
Journal of Insect Science | www.insectscience.org ISSN: 1536-2442
Journal of Insect Science: Vol. 7 | Article 5 6

Figure 3. Dendrogram of populations based on similarity coefficient using Jaccard. Bootstrap values are at eachnode.
Table 3. Gene diversity statistics estimated from AFLPdata. The individual heterozygosity (HS) indicates a lack ofhomogeneity; the total heterozygosity (HT) indicates highgenetic diversity of all populations; the gene flow (NM)indicates a low level of gene flow; and the majority of geneticvariation is within a given population (GST).
Population Polymorphic Loci (%) HSA HT
B NMC GST
D
Tam 106 (89.08) 0.3359Sin 81 (68.07) 0.2437Jal 84 (70.59) 0.2912M3 77 (64.71) 0.2595Son 74 (62.18) 0.2683Col 80 (67.23) 0.2842Slp 111 (93.28) 0.3336Yuc 91 (76.47) 0.3087M2 93 (78.15) 0.2215M1 37 (31.09) 0.1378B1 92 (77.31) 0.2253G 98 (82.35) 0.3162
Rp 80 (67.23) 0.2663A5 62 (52.10) 0.1224A4 86 (72.27) 0.1698A3 106 (89.08) 0.2911A2 58 (48.74) 0.1995A1 65 (54.62) 0.2256Ver 102 (85.71) 0.2221Gro 86 (72.27) 0.1888Fbg 84 (70.59) 0.2771
Iowa 91 (76.47) 0.2207Pr1 97 (81.51) 0.2943
Entire Pop 119 (100%) 0.2471 0.4379 0.6476 0.4357
A HS: within population gene diversity estimatesB HT: total gene diversity estimatesC NM: gene flow estimateD GST: magnitude of gene differentiation among populations
indicate a lack of homogeneity (HS = 0.2669),which assures more heterozygosity betweenindividuals within a given population resulting inhigher diversity needed for physiological andbehavioral strength of a population. The totalmean genetic diversity over all populations washigh (HT = 0.4580) indicating that the entirepopulation has higher genetic diversity than thatof individual populations. Both HS and HT valuesindicate that the level of genetic variability is highbetween individuals and populations.
GST measures whether the majority of the geneticvariation is within the S. frugiperda populationsor between the S. frugiperda populations. S.frugiperda with GST values approaching 1.0 havea majority of genetic variability betweenpopulations. Conversely, a lower GST value (< 0.5)infers a majority of the genetic variability iswithin a given population. The GST value of0.4172 (Table 3) would indicate that the majorityof genetic variability is within given populationsof S. frugiperda in this study.
Gene flow was measured by using GST valueswhere NM = 0.5(1- GST)/GST (McDermott &McDonald 1993). N is the number of individualsin a population and M is the proportion ofindividuals that have immigrated into the
Journal of Insect Science | www.insectscience.org ISSN: 1536-2442
Journal of Insect Science: Vol. 7 | Article 5 7
population. Populations that have an NM valuegreater than 1, an inference of high gene flow canbe assumed. The NM value of 0.6984 (Table 3)shows a low level of migratory gene flow into agiven population.
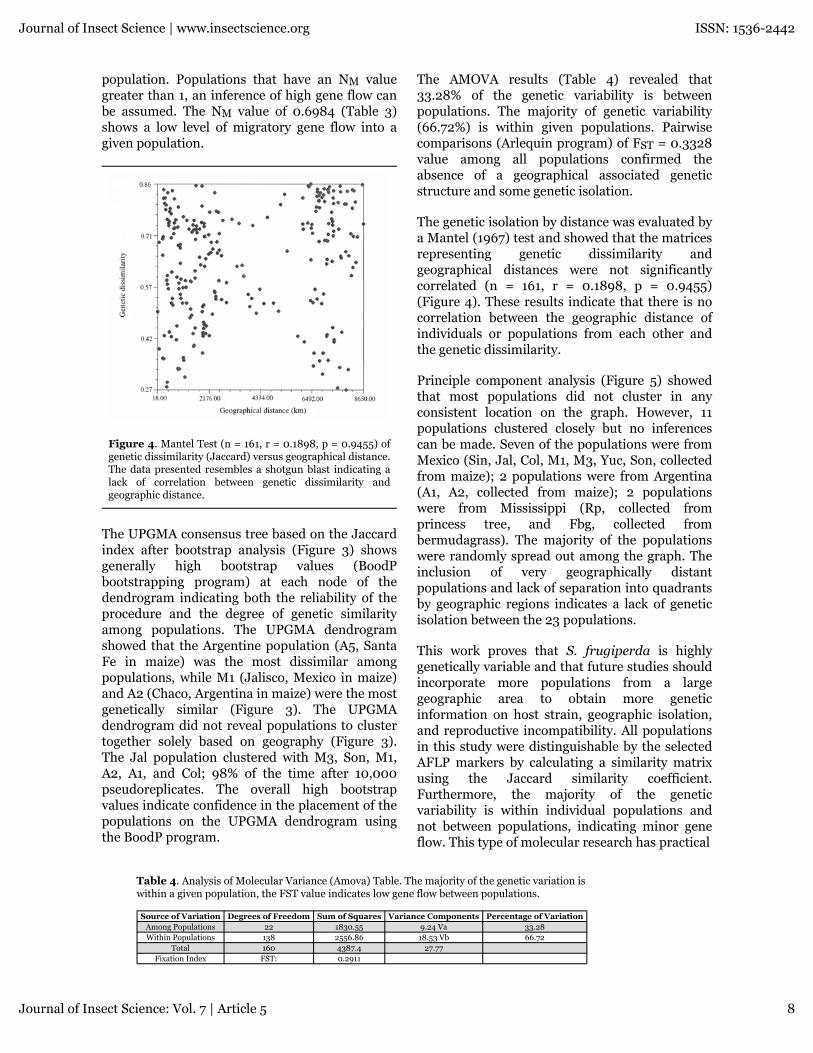
Figure 4. Mantel Test (n = 161, r = 0.1898, p = 0.9455) ofgenetic dissimilarity (Jaccard) versus geographical distance.The data presented resembles a shotgun blast indicating alack of correlation between genetic dissimilarity andgeographic distance.
The UPGMA consensus tree based on the Jaccardindex after bootstrap analysis (Figure 3) showsgenerally high bootstrap values (BoodPbootstrapping program) at each node of thedendrogram indicating both the reliability of theprocedure and the degree of genetic similarityamong populations. The UPGMA dendrogramshowed that the Argentine population (A5, SantaFe in maize) was the most dissimilar amongpopulations, while M1 (Jalisco, Mexico in maize)and A2 (Chaco, Argentina in maize) were the mostgenetically similar (Figure 3). The UPGMAdendrogram did not reveal populations to clustertogether solely based on geography (Figure 3).The Jal population clustered with M3, Son, M1,A2, A1, and Col; 98% of the time after 10,000pseudoreplicates. The overall high bootstrapvalues indicate confidence in the placement of thepopulations on the UPGMA dendrogram usingthe BoodP program.
The AMOVA results (Table 4) revealed that33.28% of the genetic variability is betweenpopulations. The majority of genetic variability(66.72%) is within given populations. Pairwisecomparisons (Arlequin program) of FST = 0.3328value among all populations confirmed theabsence of a geographical associated geneticstructure and some genetic isolation.
The genetic isolation by distance was evaluated bya Mantel (1967) test and showed that the matricesrepresenting genetic dissimilarity andgeographical distances were not significantlycorrelated (n = 161, r = 0.1898, p = 0.9455)(Figure 4). These results indicate that there is nocorrelation between the geographic distance ofindividuals or populations from each other andthe genetic dissimilarity.
Principle component analysis (Figure 5) showedthat most populations did not cluster in anyconsistent location on the graph. However, 11populations clustered closely but no inferencescan be made. Seven of the populations were fromMexico (Sin, Jal, Col, M1, M3, Yuc, Son, collectedfrom maize); 2 populations were from Argentina(A1, A2, collected from maize); 2 populationswere from Mississippi (Rp, collected fromprincess tree, and Fbg, collected frombermudagrass). The majority of the populationswere randomly spread out among the graph. Theinclusion of very geographically distantpopulations and lack of separation into quadrantsby geographic regions indicates a lack of geneticisolation between the 23 populations.
This work proves that S. frugiperda is highlygenetically variable and that future studies shouldincorporate more populations from a largegeographic area to obtain more geneticinformation on host strain, geographic isolation,and reproductive incompatibility. All populationsin this study were distinguishable by the selectedAFLP markers by calculating a similarity matrixusing the Jaccard similarity coefficient.Furthermore, the majority of the geneticvariability is within individual populations andnot between populations, indicating minor geneflow. This type of molecular research has practical
Table 4. Analysis of Molecular Variance (Amova) Table. The majority of the genetic variation iswithin a given population, the FST value indicates low gene flow between populations.
Source of Variation Degrees of Freedom Sum of Squares Variance Components Percentage of VariationAmong Populations 22 1830.55 9.24 Va 33.28Within Populations 138 2556.86 18.53 Vb 66.72
Total 160 4387.4 27.77Fixation Index FST: 0.2911
Journal of Insect Science | www.insectscience.org ISSN: 1536-2442
Journal of Insect Science: Vol. 7 | Article 5 8
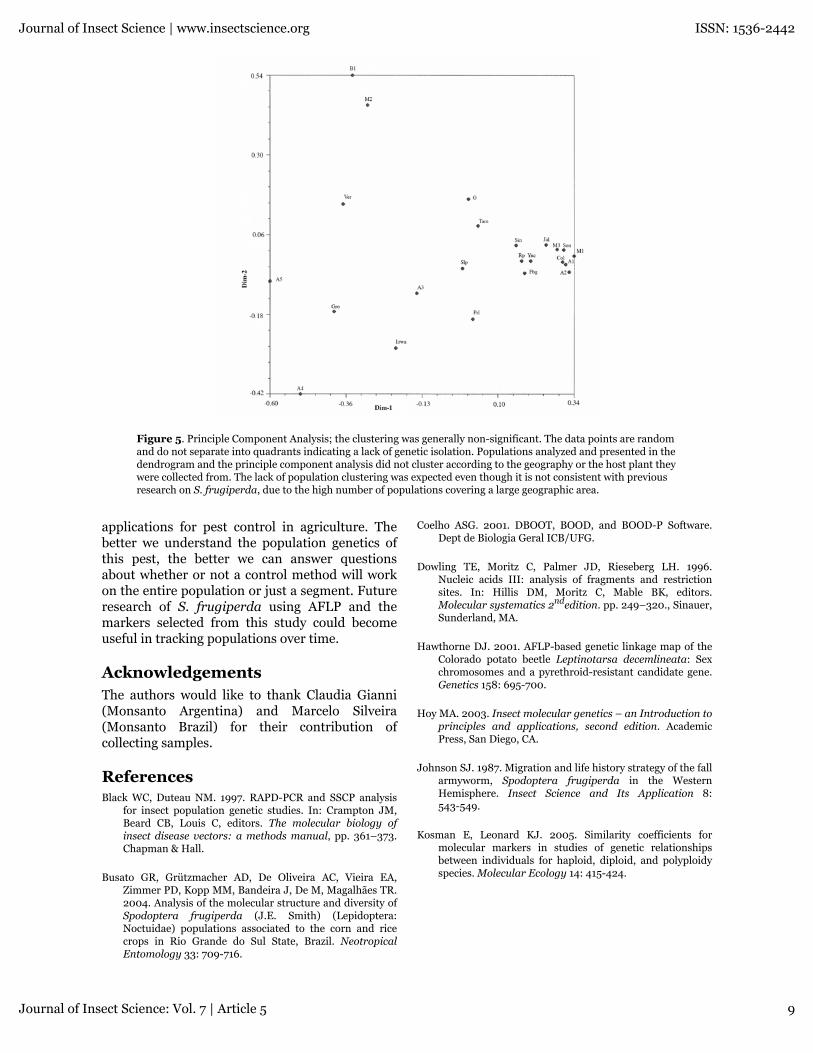
Figure 5. Principle Component Analysis; the clustering was generally non-significant. The data points are randomand do not separate into quadrants indicating a lack of genetic isolation. Populations analyzed and presented in thedendrogram and the principle component analysis did not cluster according to the geography or the host plant theywere collected from. The lack of population clustering was expected even though it is not consistent with previousresearch on S. frugiperda, due to the high number of populations covering a large geographic area.
applications for pest control in agriculture. Thebetter we understand the population genetics ofthis pest, the better we can answer questionsabout whether or not a control method will workon the entire population or just a segment. Futureresearch of S. frugiperda using AFLP and themarkers selected from this study could becomeuseful in tracking populations over time.
AcknowledgementsThe authors would like to thank Claudia Gianni(Monsanto Argentina) and Marcelo Silveira(Monsanto Brazil) for their contribution ofcollecting samples.
ReferencesBlack WC, Duteau NM. 1997. RAPD-PCR and SSCP analysis
for insect population genetic studies. In: Crampton JM,Beard CB, Louis C, editors. The molecular biology ofinsect disease vectors: a methods manual, pp. 361–373.Chapman & Hall.
Busato GR, Grützmacher AD, De Oliveira AC, Vieira EA,Zimmer PD, Kopp MM, Bandeira J, De M, Magalhães TR.2004. Analysis of the molecular structure and diversity ofSpodoptera frugiperda (J.E. Smith) (Lepidoptera:Noctuidae) populations associated to the corn and ricecrops in Rio Grande do Sul State, Brazil. NeotropicalEntomology 33: 709-716.
Coelho ASG. 2001. DBOOT, BOOD, and BOOD-P Software.Dept de Biologia Geral ICB/UFG.
Dowling TE, Moritz C, Palmer JD, Rieseberg LH. 1996.Nucleic acids III: analysis of fragments and restrictionsites. In: Hillis DM, Moritz C, Mable BK, editors.Molecular systematics 2ndedition. pp. 249–320., Sinauer,Sunderland, MA.
Hawthorne DJ. 2001. AFLP-based genetic linkage map of theColorado potato beetle Leptinotarsa decemlineata: Sexchromosomes and a pyrethroid-resistant candidate gene.Genetics 158: 695-700.
Hoy MA. 2003. Insect molecular genetics – an Introduction toprinciples and applications, second edition. AcademicPress, San Diego, CA.
Johnson SJ. 1987. Migration and life history strategy of the fallarmyworm, Spodoptera frugiperda in the WesternHemisphere. Insect Science and Its Application 8:543-549.
Kosman E, Leonard KJ. 2005. Similarity coefficients formolecular markers in studies of genetic relationshipsbetween individuals for haploid, diploid, and polyploidyspecies. Molecular Ecology 14: 415-424.
Journal of Insect Science | www.insectscience.org ISSN: 1536-2442
Journal of Insect Science: Vol. 7 | Article 5 9
Lopez-Edwards M, Hernandez-Mendoza JL, Pescador-RubioA, Molina-Ochoa J, Lezama-Gutiérrez R, Hamm JJ,Wiseman BR. 1999. Biological differences between fivepopulations of fall armyworm (Lepidoptera: Noctuidae)collected from corn in Mexico. Florida Entomologist 82:254-262.
Mantel N. 1967. The detection of disease clustering and ageneralized regression approach. Cancer Research 27:209-220.
Mcdermott JM, Mcdonald BA. 1993. Gene flow in plantpathosystems. Annual Review of Phytopathology 31:353-373.
McMichael M, Prowell DP. 1999. Differences in amplifiedfragment-length polymorphisms in fall armyworm(Lepidoptera: Noctuidae) host strains. Annals of theEntomological Society of America 92: 175-181.
Meagher RL, Gallo-Meagher M. 2003. Identifying host strainsof fall armyworm (Lepidoptera: Noctuidae) in Floridausing mitochondrial markers. Florida Entomologist 86:450-455.
Nagoshi RN, Meagher RL. 2003. FR tandem-repeat sequencein fall armyworm (Lepidoptera: Noctuidae) host strains.Annals of the Entomological Society of America 96:329-335.
Parsons YM, Shaw KL. 2002. Mapping unexplored genomes: agenetic linkage map of the Hawaiian cricketet Laupala.Genetics 162: 1275-1282.
Pashley DP. 1986. Host-associated genetic differentiation infall armyworm (Lepidoptera: Noctuidae): a sibling speciescomplex?. Annals of the Entomological Society ofAmerica 79: 898-904.
Pashley DP, Johnson SJ, Sparks AN. 1985. Genetic populationstructure of migratory moths: the fall armyworm(Lepidoptera: Noctuidae). Annals of the EntomologicalSociety of America 78: 756-762.
Pashley DP, Martin JA. 1987. Reproductive incompatibilitybetween host strains of the fall armyworm (Lepidoptera:Noctuidae). Annals of the Entomological Society ofAmerica 80: 731-733.
Pashley DP, Quisenberry SS, Jamjanya T. 1987. Impact of fallarmyworm (Lepidoptera: Noctuidae) host strains on theevaluation of Bermuda grass resistance. Journal ofEconomic Entomology 80: 1127-1130.
Pashley DP, Hammond AN, Hardy TN. 1992. Reproductiveisolating mechanisms in fall armyworm host strains(Lepidoptera: Noctuidae). Annals of the EntomologicalSociety of America 80: 400-405.
Pashley DP, Hardy TN, Hammond AM. 1995. Host effects ondevelopmental and reproductive traits in fall armywormstrains. (Lepidoptera: Noctuidae). Annals of theEntomological Society of America 88: 748-755.
Reineke A, Karlovsky P, Zebitz CPW. 1999. Amplifiedfragment length polymorphism analysis of differentgeographic populations of the gypsy moth, Lymanthriadispar (Lepidoptera: Lymantriidae). Bulletin ofEntomological Research 89: 79-88.
Rohlf FJ. 2000. NTSYS-pc numerical taxonomy andmultivariate analysis system version 2.1 manual. AppliedBiostatistics, New York.
Schneider S, Roessli D, Excoffier L. 2000. Arlequin: a softwarefor population genetics data analysis. Version 2.000.Genetics and Biometry Laboratory, Department ofAnthropology, University of Geneva, Switzerland.
Sneath PHA, Sokal RR. 1973. Numerical Taxonomy. Freeman,San Francisco.
Sparks AN. 1986. Fall armyworm (Lepidoptera: Noctuidae)potential for area-wide management. FloridaEntomologist 69: 603-614.
Takami Y, Koshio C, Ishii M, Fujii H, Hidaka T, Shimizu I.2004. Genetic diversity and structure of urbanpopulations of Pieris butterflies assessed using amplifiedfragment length polymorphism. Molecular Ecology 13:245-258.
Tan YD, C. Wan C, Zhu Y, Lu C, Xiang Z, Deng HW. 2001. Anamplified fragment length polymorphism map of thesilkworm. Genetics 157: 1277-1284.
Timmermans MJTN, Ellers J, Marien J, Verhoef SC, FerwedaEB, Van Straalen NM. 2005. Genetic structure inOrchesella cincta (Collembola): strong subdivision ofEuropean populations inferred from mtDNA and AFLPmarkers. Molecular Ecology 14: 2017-2024.
Veenstra KH, Pashley DP, Ottea JA. 1995. Host-plantadaptation in fall armyworm, host strains: comparison offood consumption, utilization, and detoxification enzymeactivities. Annals of the Entomological Society of America88: 80-91.
Vos P, Hogers R, Bleeker M, Reijans M, Van De Lee T, HornesM, Frijters A, Pot J, Peleman J, Kuiper M, Zabeau M.1995. AFLP: a new technique for DNA fingerprinting.Nucleic Acids Research 23: 4407-4414.
Yeh FC, Boyle TBJ. 1997. POPGENE MicrosoftWindows-based software for population genetic analysis.A joint project development by Francis C. Yeh, Universityof Alberta and Tim Boyle, Center for InternationalForestry Research, Bogor, Indonesia. 29p.
Journal of Insect Science | www.insectscience.org ISSN: 1536-2442
Journal of Insect Science: Vol. 7 | Article 5 10