Population structure in copy number variation and SNPs in the CCL4L chemokine gene
10
ORIGINAL ARTICLE Population structure in copy number variation and SNPs in the CCL4L chemokine gene R Colobran 1,2 , D Comas 3 , R Faner 1,2 , E Pedrosa 1,2 , R Anglada 4 , R Pujol-Borrell 1,2 , J Bertranpetit 3 and M Juan 1,2,5 1 Laboratori d’Immunobiologia per a la Recerca i Aplicacions Diagno `stiques (LIRAD), Banc de Sang i Teixits (BST), Institut d’Investigacio ´ en Cie `ncies de la Salut Germans Trias i Pujol (IGTP), Badalona, Barcelona, Spain; 2 Departament de Biologia Cellular, Fisiologia i Immunologia, Universitat Auto `noma de Barcelona (UAB), Bellaterra, Barcelona, Spain; 3 Unitat de Biologia Evolutiva, Departament de Cie `ncies Experimetals i de la Salut, Universitat Pompeu Fabra (UPF), Barcelona, Spain; 4 Servei de Geno `mica, Departament de Cie `ncies Experimentals i de la Salut, Universitat Pompeu Fabra (UPF), Barcelona, Spain and 5 Servei d’Immunologia, CDB-Hospital Clinic, Barcelona, Spain The recent description of a large amount of copy number variation (CNV) in the human genome has extended the concept of genome diversity. In this study we integrate the analysis of CNV and single nucleotide polymorphisms (SNPs) in the human CCL4L chemokine gene. CCL4L is a nonallelic copy of CCL4/MIP-1b chemokine and displays a CNV that also includes the CCL3L gene, a nonallelic copy of CCL3/MIP-1a. This CNV and two functionally relevant CCL4L SNPs (rs4796195 and rs3744595) have been recently associated to HIV pathology in three independent studies. We have quantified the CCL4L copy number and genotyped both SNPs in samples from HGDP-CEPH Diversity Panel. A strong correlation between CCL4L CNV and one of the SNPs analyzed is found, whereas no significant linkage disequilibrium is found between the two SNPs despite their close distance (647 bp), suggesting a recent appearance of the second SNP when the diversity in the first one and CNV had already been generated. The present study points out that in genes with CNV, it may be a key issue to combine the assessment of gene copy number with the genotyping of relevant SNPs to understand the phenotypic impact of genome variation in the immune response. Genes and Immunity advance online publication, 27 March 2008; doi:10.1038/gene.2008.15 Keywords: human; chemokines; genomics; copy number variation Introduction Human diversity at the DNA level ranges from structural variation (such as duplications, deletions, insertions and inversions) to single nucleotide poly- morphisms (SNPs). Until recently, SNPs have been the dominating type of variation explored in the human genome since it had been thought that SNPs account for much of the normal phenotypic diversity. However, the presence of copy number variation (CNV) in normal individuals has been recently reported as the major type of genetic diversity among humans, 1,2 accounting for 12% of the genome. 3,4 CNV involves DNA fragments about 1 kb or larger and, despite their heterogeneous distribution throughout the genome, there are no large stretches of the genome exempt from CNV. 5 Nonetheless, fine sequence analyses among the members of a CNV have only been reported for very specific cases known before the CNV concept, such as color vision or immunologic functions. 6,7 Several examples of CNV affecting genes of the immune system have been previously described (for example, a/b-defensins and FcgrIII). 7–9 From the broad HLA polymorphisms to antigen receptor diversity by recombination, molecular differences form the basis for the efficiency of the immune response. In fact, the diversity of some gene families in the immune system has become a model of molecular diversity. One of these families is the chemokine superfamily, small structurally related cytokines that have evolved to form, in humans, a complex network of proteins able to carry out many diverse immune/nonimmune and inflammatory/ homeostatic functions. 10,11 Most, if not all, chemokines probably arose by gene duplication from a single ancestral gene and this fact is clearly reflected in the genomic organization of inflammatory chemokines: these genes are grouped in discrete chromosomal locations forming clusters and miniclusters that are considered single entities based on their overall func- tion. 12,13 CCL3 (MIP-1a) and CCL4 (MIP-1b) constitute, together with CCL18 (PARC), an interesting minicluster model of chemokine evolution located on chromosome 17q12. CCL3 and CCL4 genes were formed by duplication of an ancestral gene and CCL18 is an unusual large Received 28 November 2007; revised 5 February 2008; accepted 19 February 2008 Correspondence: Dr M Juan, LIRAD/Departament de Biologia Cel lular, Fisiologia i Immunologia, Banc de Sang i Teixits (BST)/ Universitat Auto `noma de Barcelona (UAB), Hospital Germans Trias i Pujol, Edifici de Recerca, Carretera de Can Ruti, camı ´ de les escoles, s/n, Badalona, Barcelona 08916, Spain. E-mail: [email protected] Genes and Immunity (2008), 1–10 & 2008 Nature Publishing Group All rights reserved 1466-4879/08 $30.00 www.nature.com/gene
-
Upload
independent -
Category
Documents
-
view
0 -
download
0
Transcript of Population structure in copy number variation and SNPs in the CCL4L chemokine gene

ORIGINAL ARTICLE
Population structure in copy number variation and SNPsin the CCL4L chemokine gene
R Colobran1,2, D Comas3, R Faner1,2, E Pedrosa1,2, R Anglada4, R Pujol-Borrell1,2, J Bertranpetit3
and M Juan1,2,5
1Laboratori d’Immunobiologia per a la Recerca i Aplicacions Diagnostiques (LIRAD), Banc de Sang i Teixits (BST), Institutd’Investigacio en Ciencies de la Salut Germans Trias i Pujol (IGTP), Badalona, Barcelona, Spain; 2Departament de Biologia Cellular,Fisiologia i Immunologia, Universitat Autonoma de Barcelona (UAB), Bellaterra, Barcelona, Spain; 3Unitat de Biologia Evolutiva,Departament de Ciencies Experimetals i de la Salut, Universitat Pompeu Fabra (UPF), Barcelona, Spain; 4Servei de Genomica,Departament de Ciencies Experimentals i de la Salut, Universitat Pompeu Fabra (UPF), Barcelona, Spain and 5Servei d’Immunologia,CDB-Hospital Clinic, Barcelona, Spain
The recent description of a large amount of copy number variation (CNV) in the human genome has extended the concept ofgenome diversity. In this study we integrate the analysis of CNV and single nucleotide polymorphisms (SNPs) in the humanCCL4L chemokine gene. CCL4L is a nonallelic copy of CCL4/MIP-1b chemokine and displays a CNV that also includes theCCL3L gene, a nonallelic copy of CCL3/MIP-1a. This CNV and two functionally relevant CCL4L SNPs (rs4796195 andrs3744595) have been recently associated to HIV pathology in three independent studies. We have quantified the CCL4L copynumber and genotyped both SNPs in samples from HGDP-CEPH Diversity Panel. A strong correlation between CCL4L CNVand one of the SNPs analyzed is found, whereas no significant linkage disequilibrium is found between the two SNPs despitetheir close distance (647 bp), suggesting a recent appearance of the second SNP when the diversity in the first one and CNVhad already been generated. The present study points out that in genes with CNV, it may be a key issue to combine theassessment of gene copy number with the genotyping of relevant SNPs to understand the phenotypic impact of genomevariation in the immune response.Genes and Immunity advance online publication, 27 March 2008; doi:10.1038/gene.2008.15
Keywords: human; chemokines; genomics; copy number variation
Introduction
Human diversity at the DNA level ranges fromstructural variation (such as duplications, deletions,insertions and inversions) to single nucleotide poly-morphisms (SNPs). Until recently, SNPs have been thedominating type of variation explored in the humangenome since it had been thought that SNPs account formuch of the normal phenotypic diversity. However, thepresence of copy number variation (CNV) in normalindividuals has been recently reported as the major typeof genetic diversity among humans,1,2 accounting for12% of the genome.3,4 CNV involves DNA fragmentsabout 1 kb or larger and, despite their heterogeneousdistribution throughout the genome, there are no largestretches of the genome exempt from CNV.5 Nonetheless,fine sequence analyses among the members of a CNVhave only been reported for very specific cases known
before the CNV concept, such as color vision orimmunologic functions.6,7
Several examples of CNV affecting genes of theimmune system have been previously described (forexample, a/b-defensins and FcgrIII).7–9 From the broadHLA polymorphisms to antigen receptor diversity byrecombination, molecular differences form the basis forthe efficiency of the immune response. In fact, thediversity of some gene families in the immune systemhas become a model of molecular diversity. One of thesefamilies is the chemokine superfamily, small structurallyrelated cytokines that have evolved to form, in humans, acomplex network of proteins able to carry out manydiverse immune/nonimmune and inflammatory/homeostatic functions.10,11 Most, if not all, chemokinesprobably arose by gene duplication from a singleancestral gene and this fact is clearly reflected in thegenomic organization of inflammatory chemokines:these genes are grouped in discrete chromosomallocations forming clusters and miniclusters that areconsidered single entities based on their overall func-tion.12,13
CCL3 (MIP-1a) and CCL4 (MIP-1b) constitute, togetherwith CCL18 (PARC), an interesting minicluster model ofchemokine evolution located on chromosome 17q12.CCL3 and CCL4 genes were formed by duplication ofan ancestral gene and CCL18 is an unusual large
Received 28 November 2007; revised 5 February 2008; accepted 19February 2008
Correspondence: Dr M Juan, LIRAD/Departament de BiologiaCel � lular, Fisiologia i Immunologia, Banc de Sang i Teixits (BST)/Universitat Autonoma de Barcelona (UAB), Hospital Germans Triasi Pujol, Edifici de Recerca, Carretera de Can Ruti, camı de lesescoles, s/n, Badalona, Barcelona 08916, Spain.E-mail: [email protected]
Genes and Immunity (2008), 1–10& 2008 Nature Publishing Group All rights reserved 1466-4879/08 $30.00
www.nature.com/gene
chemokine gene generated by fusion of two CCL3-likegenes.14,15 Additionally, CCL3 and CCL4 both have asecond nonallelic copy, CCL3L (LD78b) and CCL4L(LAG-1), that code for two highly similar proteins(490% identity between CCL3 and CCL3L proteins,and 495% between CCL4 and CCL4L proteins).16,17
CCL3L and CCL4L exhibit CNV, meaning that thesegenes are present in variable copy number in the humangenome.18 Regarding the CNV found in the CCL3L andCCL4L genes, it seems to have been generatedby duplications of a 120 kb stretch in this region ofchromosome 17 (including CCL3L, CCL4L and othernonrelated loci).19,20 However, two key points should beemphasized: (i) there are some individuals that lack theCCL3L-CCL4L tandem and (ii) there are haplotypes withdifferent gene copy number (meaning that the gene copynumber of both genes can be different in a singlechromosome).18 Evidence of a functional significancefor the CCL3L CNV has been described by Gonzalezet al.21 demonstrating their influence on HIV suscept-ibility. According to Gonzalez et al., the strength of theimmune response based on CCL3L activity depends onthe relative gene copy number of the individual inrelation to the mean copy number of the ethnic group towhich the individual belongs. This fact has two relevantimplications: (i) there is a complex ethnic-specificadaptation of different factors in the immune response,and (ii) the knowledge of the population-specific variationand the worldwide distribution of copy number should beapproached in order to unravel individual susceptibility andresponse to pathogens.
In the case of CCL4L, and in addition to the CNV, arecently described SNP (rs4796195) in the acceptor splicesite of intron-2 generates a new complex splicingpattern.19 This polymorphism creates two allelic variants:CCL4L*1, the original variant (that will be called L1) andthe new described variant, CCL4L*2 (or L2 allele) whichhas been associated with HIV susceptibility in a case-
control study.19 Additionally, another SNP in the exon-2of CCL4L gene (rs3744595) leads to a nonconservativeamino-acid change (Arg22His), likely to have functionalimplications. These two alleles will be called R forarginine and H for histidine. Initial evidence suggest thatthis polymorphism can influence the survival of HIVþpatients.22 These previous studies do not take intoaccount the CCL4L CNV and, in fact, despite the growinginterest in the identification of these CNVs and theirphenotype implications to the individual structuralvariation found in humans,3,23 no data combining bothtypes of polymorphisms is available, and the extent ofindependence between both types of variation (CNVsand SNPs) is still unknown.
The main aim of this study is to combine and correlatethe information provided by the CNV and the SNPs inthe CCL4L gene, analyzing their population structureand variation, a key factor in understanding individualimmune response. We have analyzed the worldwidedistribution of CCL4L copy number and genotyped tworelevant SNPs determining the distribution of alleles inheterozygous multicopy samples, showing their inde-pendent structure and complexity, that cannot be ignoredwhen analyzing the impact of chemokines in theresponse to pathogens.
Results
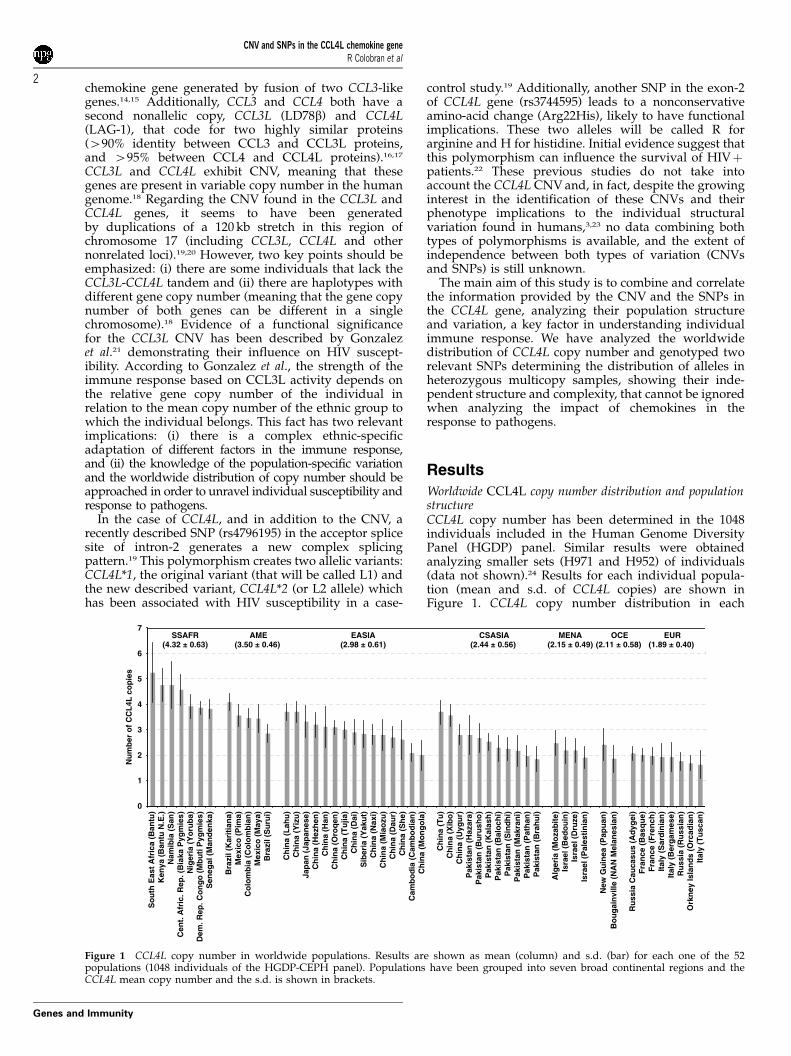
Worldwide CCL4L copy number distribution and populationstructureCCL4L copy number has been determined in the 1048individuals included in the Human Genome DiversityPanel (HGDP) panel. Similar results were obtainedanalyzing smaller sets (H971 and H952) of individuals(data not shown).24 Results for each individual popula-tion (mean and s.d. of CCL4L copies) are shown inFigure 1. CCL4L copy number distribution in each
0
1
2
3
4
5
6
7
So
uth
Eas
t A
fric
a (B
antu
)K
enya
(B
antu
N.E
.)
Sen
egal
(M
and
enka
)
Cen
t. A
fric
. Rep
. (B
iaka
Pyg
mie
s)N
iger
ia (
Yo
rub
a)D
em. R
ep. C
on
go
(M
bu
ti P
ygm
ies)
Nam
ibia
(S
an)
Bra
zil (
Kar
itia
na)
Bra
zil (
Su
rui)
Mex
ico
(M
aya)
Co
lom
bia
(C
olo
mb
ian
)M
exic
o (
Pim
a)
Ch
ina
(Dai
)
Ch
ina
(Mo
ng
ola
)
Jap
an (
Jap
anes
e)
Ch
ina
(Dau
r)C
hin
a (M
iao
zu)
Ch
ina
(Han
)
Ch
ina
(Yiz
u)
Ch
ina
(Sh
e)
Ch
ina
(Hez
hen
)
Ch
ina
(Tu
jia)
Cam
bo
dia
(C
amb
od
ian
)
Ch
ina
(Lah
u)
Sib
eria
(Y
aku
t)C
hin
a (N
axi)
Ch
ina
(Oro
qen
)
Pak
ista
n (
Bu
rush
o)
Ch
ina
(Uyg
ur)
Pak
ista
n (
Bra
hu
i)
Pak
ista
n (
Haz
ara)
Ch
ina
(Xib
o)
Pak
ista
n (
Mak
ran
i)P
akis
tan
(S
ind
hi)
Pak
ista
n (
Pat
han
)
Ch
ina
(Tu
)
Pak
ista
n (
Kal
ash
)P
akis
tan
(B
alo
chi)
Isra
el (
Dru
ze)
Alg
eria
(M
oza
bit
e)Is
rael
(B
edo
uin
)
Isra
el (
Pal
esti
nia
n)
Bo
ug
ain
ville
(N
AN
Mel
anes
ian
)N
ew G
uin
ea (
Pap
uan
)
Ru
ssia
Cau
casu
s (A
dyg
ei)
Fra
nce
(B
asq
ue)
Ork
ney
Isla
nd
s (O
rcad
ian
)
Ital
y (S
ard
inia
n)
Ru
ssia
(R
uss
ian
)
Ital
y (T
usc
an)
Ital
y (B
erg
ames
e)
Fra
nce
(F
ren
ch)
SSAFR (4.32 ± 0.63)
AME (3.50 ± 0.46)
EASIA (2.98 ± 0.61)
CSASIA (2.44 ± 0.56)
MENA (2.15 ± 0.49)
EUR (1.89 ± 0.40)
OCE (2.11 ± 0.58)
Nu
mb
er o
f C
CL
4L c
op
ies
Figure 1 CCL4L copy number in worldwide populations. Results are shown as mean (column) and s.d. (bar) for each one of the 52populations (1048 individuals of the HGDP-CEPH panel). Populations have been grouped into seven broad continental regions and theCCL4L mean copy number and the s.d. is shown in brackets.
CNV and SNPs in the CCL4L chemokine geneR Colobran et al
2
Genes and Immunity

population has also been determined (see Supplemen-tary Figure 1). The similarity of the population CNVdistribution between CCL4L and CCL3L performed inthe same set of individuals is noteworthy.21 To give amore general view of the worldwide distribution ofCCL4L copy number, individuals were pooled into sevenbroad continental regions and the mean of CCL4Lcopy number was calculated. Sub-Saharan Africanpopulations display the highest number of CCL4L copies(mean¼ 4.32±0.63, including individuals with 8, 9 or 10copies), whereas Europe present the lowest copy number(1.89±0.40), including a 25% of individuals withonly one CCL4L copy. The number of individualswithout CCL4L gene was always below 5% in allcontinental regions (sub-Saharan Africa 0%, America0%, East Asia 1.82%, Europe 2.50%, Central/South Asia2.62%, Oceania 2.63% and Middle-East/North Africa3.41%). CCL4L copy number distribution in eachcontinental region has also been calculated (seeSupplementary Figure 2).
In order to test the population differentiation concern-ing the CCL4L copy number, the FST statistic wascalculated for the whole set of populations. A significant0.12 (Po0.001) FST value was found, a value very similarto the average for 67 autosomal CNVs (0.11) previouslydescribed in the four HapMap populations.4 When ananalysis of the molecular variance (AMOVA) wasperformed grouping the populations within the sevenbroad continental regions, 9.26% (Po0.001) of thevariation found in the copy number was the resultof differences between continental groups, and only3.43% (Po0.001) were due to differences within conti-nental groups. This general heterogeneity foundwithin continental groups was significant in Asian(East Asia¼ 4.63%, Po0.001; Central/South Asia¼ 4.32%, P¼ 0.004) and American (8.75%, P¼ 0.002)populations, whereas no significant differences werefound between populations within the rest of continentalgroups including Africa, which is noteworthy as mostother genetic markers show strong heterogeneity withinthe African continent.
Population distribution of SNPs allelic and genotypicfrequenciesOne of the technical challenges in analyzing SNPs withingenes with CNV is the need to establish the exact numberof copies for each individual, then perform the SNPgenotyping and finally determine the numeric distribu-tion of the allelic variants. The melting curves character-istic for each of the two SNPs genotyped allowed us toquantify the number of copies of each allelic variant foreach individual. Figures 2a and b show the allelicdiscrimination in copy number for L1 and L2 variants.Analyzing the melting curve profiles in differentindividuals with the same ratio of allelic copies weprovided evidence of the procedure reliability(Figure 2c). The same rationale was used to distinguishR and H variants (data not shown).
L1/L2 and R/H allelic distributions are shown inFigure 3. L2 frequencies (Figure 3a) range from 13% inOceania to 43% in the Americas, being polymorphic in allthe populations analyzed. On the other hand, the Hfrequency is very low in most of the populationsanalyzed, the R allele being fixed in some of the samples,and almost not present in sub-Saharan Africa and
America. Concerning the population structure of theseSNPs in the dataset, an FST value of 0.04 was found forboth polymorphisms (Po0.001), a smaller value thanthe one found for the CCL4L CNV (0.12). When thepopulations were grouped according to continentalareas, 3.82% (Po0.001) and 3.39% (Po0.001) ofthe genetic variation for the L1/L2 and the R/Halleles, respectively, was due to differences betweencontinental regions. Nevertheless, the genetic heteroge-neity within continents was very low and only signifi-cant in sub-Saharan Africa (3.51%, P¼ 0.002) andOceania (8.29%, P¼ 0.043) for the L1/L2 polymorphism,and in America (1.94%, P¼ 0.029) for the R/Hpolymorphism.
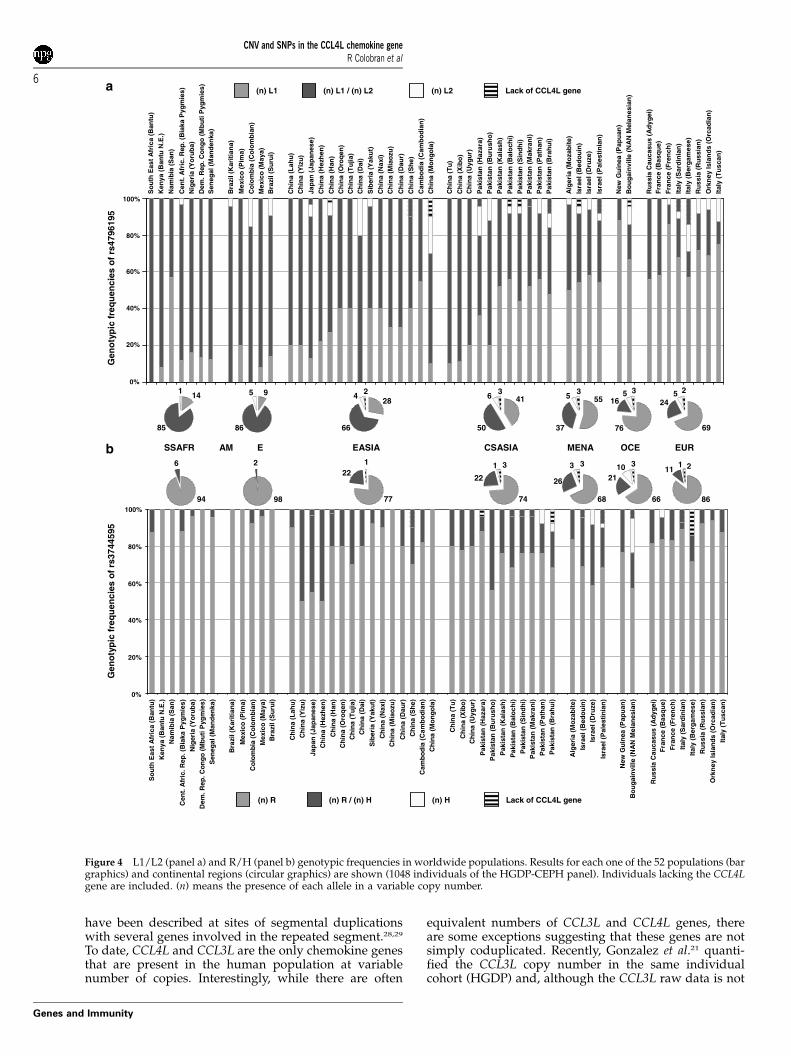
The genotypic frequencies were also calculated con-sidering that, in the case of genes with CNV, what isusually called ‘heterozygous’ are those that present thetwo allelic variants in their genome regardless of theircopy number (Figure 4). A relevant aspect is that in geneswith CNV the relationship between allelic and genotypicfrequencies do not necessarily maintain the Hardy–Weinberg equilibrium (HWE) due to the unbalanceddistribution of SNP variants among different copies ofthe gene in the same chromosome. For L1/L2 genotypes,the detailed frequencies for each genotype in individualpopulations and continental regions are shown inFigure 4a. Interestingly, whereas the maximum hetero-zygosity frequency expected following the HWE is 50%,there are three continental regions that show a frequencyover 50%: East Asia (66%), sub-Saharan Africa (85%) andAmerica (86%), including specific populations of sub-Saharan Africa and America with heterozygosity valuesover 90%. On the other hand, R/H genotypes forcontinental regions follow the HWE except for theOceanic populations (Figure 4b).
Correlation between CNV and SNPs in the CCL4L geneTo better define the relationship between CNV and SNPsin the CCL4L gene, we analyzed the correlation betweenthe CCL4L copy number and the frequencies of the twoanalyzed SNPs using two different approaches: (a)CCL4L copy number versus minor allele frequency and(b) CCL4L copy number versus heterozygous frequency(Figure 5). For the L1/L2 copies, there is a strongcorrelation between CCL4L copy number and allelic andheterozygous frequency (R¼ 0.731, Po0.0001 andR¼ 0.890, Po0.0001, respectively), pointing to a commonevolutionary history of these polymorphisms. For theR/H copies, a small negative correlation between CCL4Lcopy number and allelic frequency (R¼�0.491,P¼ 0.0002) and a lack of correlation between CNV andheterozygous frequency (R¼�0.186, P¼ 0.190) werefound, suggesting that these two kinds of polymorph-isms arose independently.
The opposite results of the two analyzed SNPsregarding to CCL4L CNV are in agreement with thelack of linkage disequilibrium (LD) between them(r2¼ 0.0185; P¼ 0.097), which has been calculated usingdata of individuals with one CCL4L copy (n¼ 149). Thehaplotypes found in these set of individuals consisted of111 L1/R copies, 26 L2/R copies and 12 L1/H copies. NoL2/H copies were found in the set analyzed. The lack ofLD between both SNPs, which are at 647 bp distance, andthe lack of correlation between CNV and R/H copies arenoteworthy.
CNV and SNPs in the CCL4L chemokine geneR Colobran et al
3
Genes and Immunity

Discussion
The study of the functional implications of geneticdiversity has generated a large amount of data involvingSNPs in many pathologies as well as in nonpathologicalprocesses.25–27 Recently, the widespread presence ofCNVs in the genomes of healthy individuals with noobvious genetic disorders has been described in a fewpopulations,1,2 but relatively few data has been reportedregarding CNVs and disease resistance or susceptibil-ity.9,21 Regarding this point, the main aim of our workwas to link the analysis of SNPs and CNVs within aworldwide framework to achieve a more powerful tool
in the future determination of genetic basis of suscept-ibility or resistance to disease. It seems clear that geneswith CNV require a nonconventional method to studytheir SNPs, and this is the reason why we established aclear and precise approach to solve this problem. Wefocused on the CCL4L gene, which provides one of thebest examples of CNV in the human immune system(CCL4L copies in our population set range from 0 to 10)combined with the presence of interesting SNPs(rs4796195 and rs3744595 both related with HIV pathol-ogy) and the study was carried out in a large set ofpopulations to provide a global idea of the contributionof each element and to detect the possible interactions
0.251:4
0.52:4
0.753:4
1.334:3
24:2
44:1
0.662:3
0.331:3
1.53:2
33:1
0.51:2
22:1
1N:N
Ratio L1 Area / L2 area
L1 copies vs
L2 copies
N : N 2 : 1 1 : 2 2 : 3
3 : 2 3 : 1 1 : 3 2 : 4
1 : 44 : 2 4 : 1 2 : 5
7 : 1 5 : 3 3 : 54 : 3
-(d
/dT
) F
luo
resc
ence
(70
5)
Temperature
L1 L1 L1 L1L2 L2 L2 L2
53°C 62°C 53°C 62°C 53°C 62°C 53°C 62°C
2 + 12 + 12 + 1
1 + 21 + 21 + 2
1 + 21 + 2
2 + 12 + 1
1 + 3 1 + 3
3 + 13 + 1
4 + 13 + 12 + 1
1 + 3 1 + 3
2 + 32 + 3
4 + 34 + 3
4 + 2
1 + 12 + 23 + 3
L1 L2 L1 L2 L1 L2 L1 L2
Figure 2 L1 and L2 allelic discrimination in heterozygous individuals. (a) Melting curve profiles for rs4796195 genotyping. The first negativederivative of the sample fluorescent curves is represented. Each allelic variant (L1 and L2) shows a peak with a characteristic meltingtemperature. The size of each peak is related to the number of copies of CCL4L that display each allelic variant. Samples with the same copynumber of each allelic variant (N:N) show equivalent peaks. Additional examples of different observed combinations are shown.(b) Numerical calculation to ascribe the exact number of CCL4L copies to each allelic variant using the ratio between the areas’ peaks. Sampleswith the same copy number of each allelic variant (N:N) have a ratio of 1. Additional examples of different combinations are shown.(c) Reliability and reproducibility of allelic copy number determination for L1 and L2 allelic variants. Different examples of same ratios fromdifferent heterozygous individuals are shown as overlapped curves. Each curve represents an individual and the total number of CCL4Lcopies of each individual is given as the sum of L1 plus L2 copies.
CNV and SNPs in the CCL4L chemokine geneR Colobran et al
4
Genes and Immunity

between them. The knowledge of the intra- and inter-population variation seems to be the key parameter inunderstanding the individual chemokine immune re-sponse, beyond the knowledge of the individual geneticcomposition.21
The CNV analyzed in this study belongs to the multi-allelic CNVs (see CNV classification in Redon et al.4) and
extends across a 120 kb stretch in the q12 region ofchromosome 17 that includes CCL4L and CCL3L genes.The high level of similarity between them, common genestrand orientations, comparable intergenic distances andamino-acid similarities strongly argue for nonallelicrecombination as a mechanism responsible for the originof one of these gene pairs.20 Complex patterns of CNV
So
uth
Eas
t A
fric
a (B
antu
)
Ken
ya (
Ban
tu N
.E.)
Sen
egal
(M
and
enka
)
Cen
t. A
fric
. Rep
.
Nig
eria
(Y
oru
ba)
Dem
. Rep
. Co
ng
o
Nam
ibia
(S
an)
Bra
zil (
Kar
itia
na)
Bra
zil (
Su
rui)
Mex
ico
(M
aya)
Co
lom
bia
(C
olo
mb
ian
)
Mex
ico
(P
ima)
Ch
ina
(Dai
)
Ch
ina
(Mo
ng
ola
)
Jap
an (
Jap
anes
e)
Ch
ina
(Dau
r)
Ch
ina
(Mia
ozu
)
Ch
ina
(Han
)
Ch
ina
(Yiz
u)
Ch
ina
(Sh
e)
Ch
ina
(Hez
hen
)
Ch
ina
(Tu
jia)
Cam
bo
dia
(C
amb
od
ian
)
Ch
ina
(Lah
u)
Sib
eria
(Y
aku
t)
Ch
ina
(Nax
i)
Ch
ina
(Oro
qen
)
Pak
ista
n (
Bu
rush
o)
Ch
ina
(Uyg
ur)
Pak
ista
n (
Bra
hu
i)
Pak
ista
n (
Haz
ara)
Ch
ina
(Xib
o)
Pak
ista
n (
Mak
ran
i)P
akis
tan
(S
ind
hi)
Pak
ista
n (
Pat
han
)
Ch
ina
(Tu
)
Pak
ista
n (
Kal
ash
)
Pak
ista
n (
Bal
och
i)
Isra
el (
Dru
ze)
Alg
eria
(M
oza
bit
e)
Isra
el (
Bed
ou
in)
Isra
el (
Pal
esti
nia
n)
Bo
ug
ain
ville
(N
AN
Mel
anes
ian
)
New
Gu
inea
(P
apu
an)
Ru
ssia
Cau
casu
s (A
dyg
ei)
Fra
nce
(B
asq
ue)
Ork
ney
Isla
nd
s (O
rcad
ian
)
Ital
y (S
ard
inia
n)
Ru
ssia
(R
uss
ian
)
Ital
y (T
usc
an)
Ital
y (B
erg
ames
e)
Fra
nce
(F
ren
ch)
SSAFR AM E EASIA CSASIA MENA EUROCE
41
59
43
57
32
68
27
73
25
75
17
83
1
99
1
99
9
91
11
89
14
86
8
92
So
uth
Eas
t A
fric
a (B
antu
)
Ken
ya (
Ban
tu N
.E.)
Sen
egal
(M
and
enka
)
Cen
t. A
fric
. Rep
.
Nig
eria
(Y
oru
ba)
Dem
. Rep
. Co
ng
o
Nam
ibia
(S
an)
Bra
zil (
Kar
itia
na)
Bra
zil (
Su
rui)
Mex
ico
(M
aya)
Co
lom
bia
(C
olo
mb
ian
)
Mex
ico
(P
ima)
Ch
ina
(Dai
)
Ch
ina
(Mo
ng
ola
)
Jap
an (
Jap
anes
e)
Ch
ina
(Dau
r)
Ch
ina
(Mia
ozu
)
Ch
ina
(Han
)
Ch
ina
(Yiz
u)
Ch
ina
(Sh
e)
Ch
ina
(Hez
hen
)
Ch
ina
(Tu
jia)
Cam
bo
dia
(C
amb
od
ian
)
Ch
ina
(Lah
u)
Sib
eria
(Y
aku
t)
Ch
ina
(Nax
i)
Ch
ina
(Oro
qen
)
Pak
ista
n (
Bu
rush
o)
Ch
ina
(Uyg
ur)
Pak
ista
n (
Bra
hu
i)
Pak
ista
n (
Haz
ara)
Ch
ina
(Xib
o)
Pak
ista
n (
Mak
ran
i)P
akis
tan
(S
ind
hi)
Pak
ista
n (
Pat
han
)
Ch
ina
(Tu
)
Pak
ista
n (
Kal
ash
)
Pak
ista
n (
Bal
och
i)
Isra
el (
Dru
ze)
Alg
eria
(M
oza
bit
e)
Isra
el (
Bed
ou
in)
Isra
el (
Pal
esti
nia
n)
Bo
ug
ain
ville
(N
AN
Mel
anes
ian
)
New
Gu
inea
(P
apu
an)
Ru
ssia
Cau
casu
s (A
dyg
ei)
Fra
nce
(B
asq
ue)
Ork
ney
Isla
nd
s (O
rcad
ian
)
Ital
y (S
ard
inia
n)
Ru
ssia
(R
uss
ian
)
Ital
y (T
usc
an)
Ital
y (B
erg
ames
e)
Fra
nce
(F
ren
ch)
20%
40%
60%
80%
100%
0%
20%
40%
60%
80%
100%
0%
Alle
lic f
req
uen
cies
of
rs47
9619
5A
llelic
fre
qu
enci
es o
f rs
3744
595
13
87
16
84
L1 allele L2 allele
R allele H allele
Figure 3 L1/L2 (panel a) and R/H (panel b) allelic frequencies in worldwide populations. Results for each one of 52 populations (bargraphics) and continental regions (circular graphics) are shown (1048 individuals of the HGDP-CEPH panel).
CNV and SNPs in the CCL4L chemokine geneR Colobran et al
5
Genes and Immunity
have been described at sites of segmental duplicationswith several genes involved in the repeated segment.28,29
To date, CCL4L and CCL3L are the only chemokine genesthat are present in the human population at variablenumber of copies. Interestingly, while there are often
equivalent numbers of CCL3L and CCL4L genes, thereare some exceptions suggesting that these genes are notsimply coduplicated. Recently, Gonzalez et al.21 quanti-fied the CCL3L copy number in the same individualcohort (HGDP) and, although the CCL3L raw data is not
11
86
1 221
66
310
26
68
3 31
22
322
77
16
94
2
98
So
uth
Eas
t A
fric
a (B
antu
)
Ken
ya (
Ban
tu N
.E.)
Sen
egal
(M
and
enka
)
Cen
t. A
fric
. Rep
. (B
iaka
Pyg
mie
s)
Nig
eria
(Y
oru
ba)
Dem
. Rep
. Co
ng
o (
Mb
uti
Pyg
mie
s)
Nam
ibia
(S
an)
Bra
zil (
Kar
itia
na)
Bra
zil (
Su
rui)
Mex
ico
(M
aya)
Co
lom
bia
(C
olo
mb
ian
)
Mex
ico
(P
ima)
Ch
ina
(Dai
)
Ch
ina
(Mo
ng
ola
)
Jap
an (
Jap
anes
e)
Ch
ina
(Dau
r)
Ch
ina
(Mia
ozu
)
Ch
ina
(Han
)
Ch
ina
(Yiz
u)
Ch
ina
(Sh
e)
Ch
ina
(Hez
hen
)
Ch
ina
(Tu
jia)
Cam
bo
dia
(C
amb
od
ian
)
Ch
ina
(Lah
u)
Sib
eria
(Y
aku
t)
Ch
ina
(Nax
i)
Ch
ina
(Oro
qen
)
Pak
ista
n (
Bu
rush
o)
Ch
ina
(Uyg
ur)
Pak
ista
n (
Bra
hu
i)
Pak
ista
n (
Haz
ara)
Ch
ina
(Xib
o)
Pak
ista
n (
Mak
ran
i)P
akis
tan
(S
ind
hi)
Pak
ista
n (
Pat
han
)
Ch
ina
(Tu
)
Pak
ista
n (
Kal
ash
)
Pak
ista
n (
Bal
och
i)
Isra
el (
Dru
ze)
Alg
eria
(M
oza
bit
e)
Isra
el (
Bed
ou
in)
Isra
el (
Pal
esti
nia
n)
Bo
ug
ain
ville
(N
AN
Mel
anes
ian
)
New
Gu
inea
(P
apu
an)
Ru
ssia
Cau
casu
s (A
dyg
ei)
Fra
nce
(B
asq
ue)
Ork
ney
Isla
nd
s (O
rcad
ian
)
Ital
y (S
ard
inia
n)
Ru
ssia
(R
uss
ian
)
Ital
y (T
usc
an)
Ital
y (B
erg
ames
e)
Fra
nce
(F
ren
ch)
SSAFR AM E EASIA CSASIA MENA EUR OCE
37
35 55
74
So
uth
Eas
t A
fric
a (B
antu
)
Ken
ya (
Ban
tu N
.E.)
Sen
egal
(M
and
enka
)
Cen
t. A
fric
. Rep
. (B
iaka
Pyg
mie
s)N
iger
ia (
Yo
rub
a)
Dem
. Rep
. Co
ng
o (
Mb
uti
Pyg
mie
s)
Nam
ibia
(S
an)
Bra
zil (
Kar
itia
na)
Bra
zil (
Su
rui)
Mex
ico
(M
aya)
Co
lom
bia
(C
olo
mb
ian
)
Mex
ico
(P
ima)
Ch
ina
(Dai
)
Ch
ina
(Mo
ng
ola
)
Jap
an (
Jap
anes
e)
Ch
ina
(Dau
r)
Ch
ina
(Mia
ozu
)
Ch
ina
(Han
)
Ch
ina
(Yiz
u)
Ch
ina
(Sh
e)
Ch
ina
(Hez
hen
)
Ch
ina
(Tu
jia)
Cam
bo
dia
(C
amb
od
ian
)
Ch
ina
(Lah
u)
Sib
eria
(Y
aku
t)
Ch
ina
(Nax
i)
Ch
ina
(Oro
qen
)
Pak
ista
n (
Bu
rush
o)
Ch
ina
(Uyg
ur)
Pak
ista
n (
Bra
hu
i)
Pak
ista
n (
Haz
ara)
Ch
ina
(Xib
o)
Pak
ista
n (
Mak
ran
i)P
akis
tan
(S
ind
hi)
Pak
ista
n (
Pat
han
)
Ch
ina
(Tu
)
Pak
ista
n (
Kal
ash
)
Pak
ista
n (
Bal
och
i)
Isra
el (
Dru
ze)
Alg
eria
(M
oza
bit
e)
Isra
el (
Bed
ou
in)
Isra
el (
Pal
esti
nia
n)
Bo
ug
ain
ville
(N
AN
Mel
anes
ian
)
New
Gu
inea
(P
apu
an)
Ru
ssia
Cau
casu
s (A
dyg
ei)
Fra
nce
(B
asq
ue)
Ork
ney
Isla
nd
s (O
rcad
ian
)
Ital
y (S
ard
inia
n)
Ru
ssia
(R
uss
ian
)
Ital
y (T
usc
an)
Ital
y (B
erg
ames
e)
Fra
nce
(F
ren
ch)
100%
0%
20%
40%
60%
80%
0%
Gen
oty
pic
freq
uen
cies
of
rs47
9619
5
20%
40%
60%
80%
100%
Gen
oty
pic
freq
uen
cies
of
rs37
4459
5
14
85
1 9
86
5 2
66
284 41
50
6 3 3
76
516
2
69
245
(n) L1 (n) L1 / (n) L2 (n) L2 Lack of CCL4L gene
(n) R (n) R / (n) H (n) H Lack of CCL4L gene
Figure 4 L1/L2 (panel a) and R/H (panel b) genotypic frequencies in worldwide populations. Results for each one of the 52 populations (bargraphics) and continental regions (circular graphics) are shown (1048 individuals of the HGDP-CEPH panel). Individuals lacking the CCL4Lgene are included. (n) means the presence of each allele in a variable copy number.
CNV and SNPs in the CCL4L chemokine geneR Colobran et al
6
Genes and Immunity

available for comparison, CCL4L results are highlyconcordant, although a slight lower copy average ofCCL4L gene is found compared to CCL3L in allpopulations and continental regions. This correlationbetween CCL4L and CCL3L copies suggests the involve-ment of both genes in HIV susceptibility. The loweraverage of CCL4L copies found in the present analysis isin agreement with the results of Towson et al.,18 whoquantified the CCL3L and CCL4L gene copies in 100individuals of European ancestry, showing 60% ofsamples with equal number of CCL3L and CCL4L genes,33% having more CCL3L copies compared with CCL4L(generally one or two copies more) and only a 7% ofsamples having more CCL4L copies. All these resultssupport the presence of a single unit containing only oneof these genes and also being susceptible to duplication.Thus, the consideration of both genes as a single repeatunit is an oversimplification, as it is also the considera-tion of the raw number of repeats in the CCL4L region.This additional complexity found in the CCL3L-CCL4LCNV implies that it is necessary to check if all the genesspread through a region with CNV are the result of asingle duplication/deletion process.
The CCL4L CNV described shows a clear populationdifferentiation, similar to that previously found on 67autosomal CNVs with the HapMap samples. Besides thiscontinental differentiation in CNV, Asian and Amerin-dian populations exhibit a genetic heterogeneity in copynumber whereas the rest of the continental groupsare genetically homogeneous, including Africans. Itis noteworthy that the CCL4L genetic differentiationbetween populations is three times larger in
CNV (FST¼ 0.12) than in the SNPs analyzed (FST ¼ 0.04).Thus, the population differentiation in relation to SNPfrequencies within the CCL4L copies is more homoge-neous between and within continental regions than CNV.This result suggests that the analysis of CNV might bemore informative in unraveling population geneticrelationships than SNP variation but it does not allow adirect functional correlation. Moreover, it suggestscomplex dynamics in the region as it cannot be explainedas a variation in the number of copies of pre-existingdifferent units defined by their nucleotide composition.
With regard to the SNP analysis, despite the relativelyshort distance between them (647 bp), they are not in LDand their worldwide distribution is very different. Thelow frequency of the H allele worldwide, the absence ofL2/H haplotypes, and the lack of correlation betweenR/H polymorphism and CNV suggests that the H alleleappeared recently in a L1 copy background. Our resultsare compatible with the appearance of the allele H oncethe L1/L2 diversity was already established. This wouldimply that the H variant is completely associated withthe L1 copy where it was generated, splitting L1 into twolineages: L1H and L1R. This fact would explain why theH variant does not correlate either with CNV or with theL1/L2 variation despite the short distance between bothSNPs. It is also interesting to note the near absence ofthe H variant in sub-Saharan African samples, whichreinforces the idea of the recent appearance of the Hallele in human populations.
Association studies have focused primarily on SNPgenotyping. However, it is important to determinewhether CNVs are in LD with common SNPs, and thus
rs47
9619
5 L
2 fr
equ
ency
1 1.5 2 2.5 3 3.5 4.5 54
10
20
30
40
50
60
01 1.5 2 2.5 3 3.5 4.5 54
0
5
10
15
20
25
1 1.5 2 2.5 3 3.5 4.5 54
20
40
60
80
100
0
120
1 1.5 2 2.5 3 3.5 4.5 54
10
20
30
40
50
60
0
rs37
4459
5 H
fre
qu
ency
CCL4L copies CCL4L copies
rs47
9619
5 h
eter
ozy
go
us
freq
uen
cy
rs37
4459
5 h
eter
ozy
go
us
fr
equ
ency
R = 0.731
p < 0.0001
R = -0.491
p = 0.0002
R = 0.890
p < 0.0001
R = -0.186
p = 0.190
Figure 5 Correlation between CCL4L copies and L1/L2 and R/H polymorphisms. Each dot represents an individual population(52 populations including 1048 individuals of the HGDP-CEPH panel). Two types of correlations are shown: (a and b) CCL4L copies versusminor allele frequencies for L1/L2 and R/H, respectively and (c and d) CCL4L copies versus heterozygous frequencies for L1/L2 and R/H,respectively. Two populations (Namibia and New Guinea) have been excluded of this analysis due to their outlier positions.
CNV and SNPs in the CCL4L chemokine geneR Colobran et al
7
Genes and Immunity

if CNV could be assessed indirectly in SNP-basedstudies. Regarding this question, although it has beenshown that small indels and surrounding SNPs are in LDin the human genome,30 Redon et al.4 found that diploidcopy number of multi-allelic CNVs is poorly predictedby neighboring SNPs. Interestingly, among the popula-tions included in this study the L1/L2 variants (locatedinside the CNV) have a high correlation with the CCL4Lcopy number, and, therefore, these variants could beused as a proxy of CCL4L copies of a given population.The possibility to determine the copy number of a geneor group of genes through the genotyping of a SNP is anattractive approach since, to date, SNP genotyping is aneasier and simpler methodology than copy numberdetermination.
As previously mentioned, the three CCL4L geneticvariation elements (the CCL4L CNV and both the SNPsanalyzed) are involved in HIV pathology. However, eachof them was analyzed independently in previous studiesand it would be relevant to determine the specificcontribution of each one in susceptibility/resistance toHIV. Data of our study revealed that sub-Saharan Africanand Amerindian populations display the highest numberof CCL4L (and CCL3L) copies (described as a HIVresistance factor)21 but, at the same time, showed alsothe highest frequency of the L2 allele (described as a HIVsusceptibility factor).19 Conversely, the European popu-lations display the lowest number of CCL4L-CCL3Lcopies and also a low frequency of L2 allele. Addition-ally, the lack of correlation of the R/H variants withCCL4L copy number increases the complexity in theinterpretation of the role of these three elements. Next tothe competing effects reported, the balance betweenpresenting a high or low number of CCL4L-CCL3L copies(compared to the population distribution) and the L1/L2allele frequencies, together with all the other HIVsusceptibility/resistance described factors (includingthe rs3744595 SNP role in survival of HIVþ patients),could determine the final genetic background related tothe disease susceptibility.
In genes with CNV it is important to combine theassessment of gene copy number with the genotyping ofrelevant SNPs and it should now become standard in thedesign of all studies of the genetic basis of phenotypicvariation, in particular in studies of resistance/suscept-ibility to disease. Moreover, the population variation is,in some cases, a key factor to understand the individualsusceptibility. We envisage that this integrated analysiswill result in a better comprehension of these two mostimportant genetic variability generating mechanisms.
Materials and methods
SamplesA total of 1064 individuals from 52 worldwide popula-tions included in HGDP31 were analyzed for the CCL4Lcopy number determination and genotyped for the SNPsselected. From the original panel, several duplicatedsamples were used as internal controls and some atypicalindividuals were ignored. The panel used is the H1048according to Rosenberg et al.24 which includes 1048individuals. For some of the analyses, individuals werepooled into seven broad continental regions: sub-Saharan Africa (SSAFR), Middle East/North Africa
(MENA), Europe (EUR), Central/South Asia (CSASIA),East Asia (EASIA), Oceania (OCE) and America (AME).
CCL4L copy number determinationCCL4L copy number determination was performed byusing real-time PCR in an ABI PRISM Sequence Detec-tion System 7900 Instrument (Applied Biosystems, FosterCity, USA). Using the Custom Taqman Gene ExpressionAssay Service (Applied Biosystems), a mix of unlabeledPCR primers and a TaqMan MGB probe, FAM dyelabeled was designed to amplify specifically CCL4Land clearly discriminate CCL4L from CCL4. Primersand probe sequences are as follows: sense primer(located at intron 2) 50-CATGGTCAGGCAGAGGAA-GATG-30; antisense primer (located at exon 3) 50-GCTTGCCTCTTTTGGTTTGGAAT-30; probe (located atintron 2, in a region that is deleted in CCL4) 50-TACCACAGGCAAGGGAT-30 (FAM labeled). As a con-trol, TaqMan RNaseP Control (Applied Biosystems) wasused following the supplier’s recommendations. Theamplification protocol for this reaction was 10 min ofinitial setup at 95 1C, followed by 40 amplification cycles(15 s of denaturation at 95 1C and 60 s of annealing/extension at 60 1C). For each sample, amplification of thetarget gene (CCL4L) and a control gene (RNaseP, that hastwo copies per diploid human genome) was performedin the same well (multiplex format) and by duplicate. Togenerate standard curves, we used six serial 1:2 dilutions(146.4–4.57 ng) of genomic DNA from CEM cells (knownto have two copies of CCL4L per diploid genome asproved by Southern blot densitometry).18 Each standardcurve dilution was run in triplicate in each PCR plate(384 wells) for CCL4L and RNaseP using the primers andprobes described above (multiplex). The square of thePearson’s correlation coefficient (R2) for a standard curvewas 40.97 (in case of lower value, samples would havebeen repeated, although in our hands this situation wasnot encountered). Threshold cycle (CT), the cycle numberat which the fluorescence reaches a fixed threshold,of each sample was determined and converted intotemplate quantity using the standard curves. Copynumber was established as the ratio of the templatequantity for CCL4L to the template quantity for RNaseP,multiplied by two. Average copy number of duplicateswas calculated based on the ratio between the sampleand the RNaseP single locus control. We also calculatedthe s.d. and what percentage represented the s.d. withreference to the average, accepting only values o10% (incase of greater differences, quantification of samples wasrepeated). Once all these steps were successfully done,we assigned a real number of copies to each sample (seeSupplementary Figure 3 showing examples of thequantification procedure). We established a differenceof ±0.25 as the threshold to consider a result as a realnumber of copies (for example, a final number of 2.20 or1.80 copies is considered as two real copies). This value,according to the distribution found, is very conservative,with a negligible number of cases out of the establishedrange. When the final number exceeded the establishedthreshold, the quantification of the sample was repeated.
CCL4L SNPs genotypingCCL4L genotyping for rs4796195 and rs3744595 SNPswas performed using real-time PCR with fluorescenceresonance energy transfer (FRET) probes in a LightCycler
CNV and SNPs in the CCL4L chemokine geneR Colobran et al
8
Genes and Immunity

Instrument (Roche, Mannheim, Germany). For each SNPwe used a pair of specific primers for the CCL4L regionwhere the SNP is located and a pair of FRET probes.Primers and probes sequences for rs4796195 SNP are asfollows: sense primer (located at intron 2) 50-GCAGAGGAAGATGCCTACCAC-30; antisense primer (located atexon 3) 50-CTGAGTATGGAGGAGATGCGG-30; anchorfluorescein-labeled probe (located at exon 3) 50-AGCGCAGACTTGCTTGCCTCTTTT-30; sensor LC-Red705-la-beled probe (located at intron 2/exon 3 junction) 50-TTTGGAATCCGTAGAACAAGG-30. Primers and probessequences for rs3744595 SNP are as follows: sense primer(located at intron 1) 50-GGAATGGATACAAGGGACCA-30;antisense primer (located at intron 2) 50-CAGCCAGGGGTTGATACTC-30; anchor fluorescein-labeledprobe (located at exon 2) 50-CAGAGGCTGCTGGTCTCATAGTAATCT-30; sensor LC-Red610-labeled probe(located at exon 2) 50-CCACAAAGTTGCGAGGAA-30.PCR reaction was performed in a final volume of 10 ml;the reaction mixture contained 1 ml of LightCyclerFastStart DNA Master HybProbe, 1 mM primer sense,0.2 mM primer antisense and 0.2 mM each of hybridiza-tion probe (anchor and sensor), 2 mM of MgCl2 and 2 ml oftemplate DNA (the amount of DNA added to each PCRreaction was between 10 and 20 ng). The amplificationprotocol for these reactions was: 10 min of initialdenaturation and activation of the FastStart enzyme at95 1C, followed by 45 amplification cycles (5 s ofdenaturation at 95 1C, 6 s of annealing at 55 1C and 10 sof extension at 72 1C). Melting curves were generatedfollowing these steps: 95 1C for 0 s, 65 1C for 15 s, 42 1C for270 s (all at a ramp rate of 20 1C s�1) and 80 1C for 0 s(ramp rate of 0.05 1C s�1; acquisition mode: continuous),followed by a cooling step of 30 s at 40 1C.
Numerical allelic discrimination in heterozygous individualsfor rs4796195 and rs3744595 SNPsWhen two allelic variants are detected during the SNPgenotyping process, it is not straightforward, except incases of two CCL4L copies, to determine how manyCCL4L copies present each allelic variant. To assess theexact number of CCL4L copies to each allelic variant inheterozygous samples with more than two CCL4L copies,we used the melting curves produced by FRET probes.Using the chart that plots the first negative derivative ofthe sample fluorescent curves, the melting temperatureof each sample appears as a peak. Displaying the meltingtemperatures as peaks makes it easier to distinguish eachsample’s characteristic melting profile and to discerndifferences between samples. Our genotyping analysisresult data included each sample’s melting temperatureand also the size of the area under each sample’s meltingpeak. For each SNP, each allelic variant showed acharacteristic Tm: for SNP rs4796195, the L1 and L2variants show a Tm of 53±0.5 and 62±0.5 1C, respec-tively, whereas for the SNP rs3744595, the R (arginine)and H (histidine) variants showed a Tm of 55.5±0.5 and48±0.5 1C, respectively. In case of heterozygous samples,after total CCL4L copy number quantification, the ratiobetween the areas’ peaks allowed us to ascribe the exactnumber of CCL4L copies to each allelic variant.
Statistical analysisDatasets were analyzed using Sigmastats software.When necessary, the results were expressed as the mean
value±s.d. A Pearson correlation test was applied to thedatasets to determine statistically significant correlationdifferences.
In order to assess the population structure, FST valuesbased on the individual CNV were calculated with theARLEQUIN package version 2.000.32 In order to appor-tion the fraction of the genetic variance due to differencesbetween and within continental groups, several AMO-VA33 were performed also using Arlequin. AMOVA wasperformed both for the whole population set and foreach of the seven continental groups previously defined.
LD between rs4796195 and rs3744595 SNPs wasmeasured with D0 and R2 parameters with the Haplo-view software. Since CNV did not allow us to phaseunambiguously the alleles of both SNPs, LD wascalculated taking into account the 149 individuals whoexhibit a single copy of CCL4L.
Acknowledgements
We thank Maria del Pilar Armengol and MichelleGardner for critical reading of the manuscript. We thankHoward Cann (CEPH, Paris) for providing the HGDP-CEPH panel. We also thank Monica Valles (UPF) andStephanie Plaza (Servei de Genomica, UPF) for technicalassistance. This work was supported by grants fromFondo de Investigaciones Sanitarias (Project 02/0104 and07/0329), Fundacion para la Investigacion y la Preven-cion del SIDA en Espana (FIPSE, Project 36487/05) andDireccio General de Recerca, Generalitat de Catalunya(SGR2005/00608).
Disclosures
The authors declare no conflict of interest or financialinterests.
References
1 Iafrate AJ, Feuk L, Rivera MN, Listewnik ML, Donahoe PK, QiY et al. Detection of large-scale variation in the human genome.Nat Genet 2004; 36: 949–951.
2 Sebat J, Lakshmi B, Troge J, Alexander J, Young J, Lundin Pet al. Large-scale copy number polymorphism in the humangenome. Science 2004; 305: 525–528.
3 Freeman JL, Perry GH, Feuk L, Redon R, McCarroll SA,Altshuler DM et al. Copy number variation: new insights ingenome diversity. Genome Res 2006; 16: 949–961.
4 Redon R, Ishikawa S, Fitch KR, Feuk L, Perry GH, AndrewsTD et al. Global variation in copy number in the humangenome. Nature 2006; 444: 444–454.
5 Wong KK, deLeeuw RJ, Dosanjh NS, Kimm LR, Cheng Z,Horsman DE et al. A comprehensive analysis of commoncopy-number variations in the human genome. Am J HumGenet 2007; 80: 91–104.
6 Vollrath D, Nathans J, Davis RW. Tandem array of humanvisual pigment genes at Xq28. Science 1988; 240: 1669–1672.
7 Fellermann K, Stange DE, Schaeffeler E, Schmalzl H,Wehkamp J, Bevins CL et al. A chromosome 8 gene-clusterpolymorphism with low human beta-defensin 2 gene copynumber predisposes to Crohn disease of the colon. Am J HumGenet 2006; 79: 439–448.
8 Linzmeier RM, Ganz T. Human defensin gene copy numberpolymorphisms: comprehensive analysis of independent
CNV and SNPs in the CCL4L chemokine geneR Colobran et al
9
Genes and Immunity

variation in alpha- and beta-defensin regions at 8p22–p23.Genomics 2005; 86: 423–430.
9 Aitman TJ, Dong R, Vyse TJ, Norsworthy PJ, Johnson MD,Smith J et al. Copy number polymorphism in Fcgr3 predis-poses to glomerulonephritis in rats and humans. Nature 2006;439: 851–855.
10 Baggiolini M. Chemokines and leukocyte traffic. Nature 1998;392: 565–568.
11 Luster AD. Chemokines—chemotactic cytokines that mediateinflammation. N Engl J Med 1998; 338: 436–445.
12 Zlotnik A, Yoshie O. Chemokines: a new classification systemand their role in immunity. Immunity 2000; 12: 121–127.
13 Colobran R, Pujol-Borrell R, Armengol MP, Juan M. Thechemokine network. I. How the genomic organization ofchemokines contains clues for deciphering their functionalcomplexity. Clin Exp Immunol 2007; 148: 208–217.
14 Menten P, Wuyts A, Van Damme J. Macrophage inflammatoryprotein-1. Cytokine Growth Factor Rev 2002; 13: 455–481.
15 Tasaki Y, Fukuda S, Iio M, Miura R, Imai T, Sugano S et al.Chemokine PARC gene (SCYA18) generated by fusion of twoMIP-1alpha/LD78alpha-like genes. Genomics 1999; 55: 353–357.
16 Menten P, Struyf S, Schutyser E, Wuyts A, De Clercq E, ScholsD et al. The LD78beta isoform of MIP-1alpha is the most potentCCR5 agonist and HIV-1-inhibiting chemokine. J Clin Invest1999; 104: R1–R5.
17 Modi WS, Bergeron J, Sanford M. The human MIP-1betachemokine is encoded by two paralogous genes, ACT-2 andLAG-1. Immunogenetics 2001; 53: 543–549.
18 Townson JR, Barcellos LF, Nibbs RJ. Gene copy numberregulates the production of the human chemokine CCL3-L1.Eur J Immunol 2002; 32: 3016–3026.
19 Colobran R, Adreani P, Ashhab Y, Llano A, Este JA,Dominguez O et al. Multiple products derived from twoCCL4 loci: high incidence of a new polymorphism in HIV+patients. J Immunol 2005; 174: 5655–5664.
20 Modi WS. CCL3L1 and CCL4L1 chemokine genes are locatedin a segmental duplication at chromosome 17q12. Genomics2004; 83: 735–738.
21 Gonzalez E, Kulkarni H, Bolivar H, Mangano A, Sanchez R,Catano G et al. The influence of CCL3L1 gene-containingsegmental duplications on HIV-1/AIDS susceptibility. Science2005; 307: 1434–1440.
22 Capoulade-Metay C, Meyer L, Tran T, Persoz A, Bourdais A,Dudoit Y et al. Influence of the R22H variant of macrophageinflammatory protein 1beta/Lag-1 in HIV-1 survival. AIDS2005; 19: 831–833.
23 Sharp AJ, Cheng Z, Eichler EE. Structural variation ofthe human genome. Annu Rev Genomics Hum Genet 2006; 7:407–442.
24 Rosenberg NA. Standardized subsets of the HGDP-CEPHHuman Genome Diversity Cell Line Panel, accounting foratypical and duplicated samples and pairs of close relatives.Ann Hum Genet 2006; 70: 841–847.
25 Engle LJ, Simpson CL, Landers JE. Using high-throughputSNP technologies to study cancer. Oncogene 2006; 25:1594–1601.
26 Fan JB, Chee MS, Gunderson KL. Highly parallel genomicassays. Nat Rev Genet 2006; 7: 632–644.
27 Eichler EE, Nickerson DA, Altshuler D, Bowcock AM, BrooksLD, Carter NP et al. Completing the map of human geneticvariation. Nature 2007; 447: 161–165.
28 Goidts V, Cooper DN, Armengol L, Schempp W, Conroy J,Estivill X et al. Complex patterns of copy number variation atsites of segmental duplications: an important category ofstructural variation in the human genome. Hum Genet 2006;120: 270–284.
29 Sharp AJ, Locke DP, McGrath SD, Cheng Z, Bailey JA,Vallente RU et al. Segmental duplications and copy-numbervariation in the human genome. Am J Hum Genet 2005; 77:78–88.
30 Hinds DA, Kloek AP, Jen M, Chen X, Frazer KA. Commondeletions and SNPs are in linkage disequilibrium in thehuman genome. Nat Genet 2006; 38: 82–85.
31 Cann HM, de Toma C, Cazes L, Legrand MF, Morel V, PiouffreL et al. A human genome diversity cell line panel. Science 2002;296: 261–262.
32 Schneider S KJ-M, Roessli D, Excoffier L. Arlequin Version 1.1:A Software for Population Genetic Data Analysis. Genetics andBiometry Laboratory, University of Geneva. Genetics and Bio-metry Laboratory, University of Geneva: Geneva, 1997.
33 Excoffier L, Smouse PE, Quattro JM. Analysis of molecularvariance inferred from metric distances among DNA haplo-types: application to human mitochondrial DNA restrictiondata. Genetics 1992; 131: 479–491.
Supplementary Information accompanies the paper on Genes and Immunity website (http://www.nature.com/gene)
CNV and SNPs in the CCL4L chemokine geneR Colobran et al
10
Genes and Immunity