Population bottlenecks, genetic diversity and breeding ability of the three-spined stickleback...
8
Aquatic Toxicology 142–143 (2013) 264–271 Contents lists available at ScienceDirect Aquatic Toxicology jou rn al hom epage: www.elsevier.com/locate/aquatox Population bottlenecks, genetic diversity and breeding ability of the three-spined stickleback (Gasterosteus aculeatus) from three polluted English Rivers Eduarda M. Santos a,∗,1 , Patrick B. Hamilton a,1 , Tobias S. Coe a,1 , Jonathan S. Ball a , Alastair C. Cook b , Ioanna Katsiadaki b , Charles R. Tyler a a Biosciences, College of Life and Environmental Sciences, University of Exeter, Exeter, UK b Centre for Environment, Fisheries and Aquaculture Science (Cefas), Weymouth, Dorset, UK a r t i c l e i n f o Article history: Received 7 September 2012 Received in revised form 2 July 2013 Accepted 15 August 2013 Keywords: Fish populations Polluted rivers Mesocosm Reproductive competitiveness a b s t r a c t Pollution is a significant environmental pressure on fish populations in both freshwater and marine environments. Populations subjected to chronic exposure to pollutants can experience impacts ranging from altered reproductive capacity to changes in population genetic structure. Few studies, however, have examined the reproductive vigor of individuals within populations inhabiting environments char- acterized by chronic pollution. In this study we undertook an analysis of populations of three-spined sticklebacks (Gasterosteus aculeatus) from polluted sites, to determine levels of genetic diversity, assess for evidence of historic population genetic bottlenecks and determine the reproductive competitiveness of males from these locations. The sites chosen included locations in the River Aire, the River Tees and the River Birket, English rivers that have been impacted by pollution from industrial and/or domestic effluents for over 100 years. Male reproductive competitiveness was determined via competitive breed- ing experiments with males and females derived from a clean water site, employing DNA microsatellites to determine parentage outcome. Populations of stickleback collected from the three historically pol- luted sites showed evidence of recent population bottlenecks, although only the River Aire population showed low genetic diversity. In contrast, fish collected from two relatively unpolluted sites within the River Gowy and Houghton Springs showed weak, or no evidence of such bottlenecks. Nevertheless, males derived from polluted sites were able to reproduce successfully in competition with males derived from clean water exposures, indicating that these bottlenecks have not resulted in any substantial loss of reproductive fitness in males. © 2013 Elsevier B.V. All rights reserved. 1. Introduction The consequences of exposure to pollutants on wildlife range from adverse effects in individuals to changes in whole popu- lations, and this is largely dependent on the type of pollutant, and the magnitude and duration of the exposure. The impacts of chronic pollution on wildlife populations include reduced survivor- ship and fecundity (Oaks et al., 2004), increased incidence of disease (Arkoosh et al., 1998), developmental abnormalities (Hamlin and Guillette, 2011), decreased reproductive ability (Jobling et al., 2002; ∗ Corresponding author at: Biosciences, College of Life and Environmental Sci- ences, Geoffrey Pope Building, University of Exeter, Exeter EX4 4QD, UK. Tel.: +44 01392 264607; fax: +44 01392 263700. E-mail address: [email protected] (E.M. Santos). 1 These authors contributed equally to this study and are to be identified as joint first authors. Harris et al., 2011) and changes in the genetic structure of popula- tions (Belfiore and Anderson, 2001). Genetic diversity can be lost if populations are reduced in size for several generations (genetic bottlenecks). Reduced genetic diversity has been observed in wild and experimental populations of invertebrates (Gardestrom et al., 2008; Coors et al., 2009) and fish (Murdoch and Hebert, 1994; Maes et al., 2005) as a result of exposure to pollutants, potentially result- ing from genetic bottlenecks. Genetic bottlenecks can be detected in the absence of histor- ical records of a species using molecular markers such as DNA microsatellites and have occasionally been detected in popula- tions of fish species living in freshwater river systems that have been impacted by pollution (Jensen et al., 2005; Dominguez- Dominguez et al., 2007). For instance, a study on brown trout (Salmo trutta) in small Danish rivers found strong evidence of recent bottlenecks that were attributed to organic pollution occur- ring in the 1970–1980s (Jensen et al., 2005). Many other studies have not found evidence of reduced genetic diversity or genetic 0166-445X/$ – see front matter © 2013 Elsevier B.V. All rights reserved. http://dx.doi.org/10.1016/j.aquatox.2013.08.008
Transcript of Population bottlenecks, genetic diversity and breeding ability of the three-spined stickleback...
PtE
EAa
b
a
ARRA
KFPMR
1
flacs(G
eT
fi
0h
Aquatic Toxicology 142– 143 (2013) 264– 271
Contents lists available at ScienceDirect
Aquatic Toxicology
jou rn al hom epage: www.elsev ier .com/ locate /aquatox
opulation bottlenecks, genetic diversity and breeding ability of thehree-spined stickleback (Gasterosteus aculeatus) from three pollutednglish Rivers
duarda M. Santosa,∗,1, Patrick B. Hamiltona,1, Tobias S. Coea,1, Jonathan S. Ball a,lastair C. Cookb, Ioanna Katsiadakib, Charles R. Tylera
Biosciences, College of Life and Environmental Sciences, University of Exeter, Exeter, UKCentre for Environment, Fisheries and Aquaculture Science (Cefas), Weymouth, Dorset, UK
r t i c l e i n f o
rticle history:eceived 7 September 2012eceived in revised form 2 July 2013ccepted 15 August 2013
eywords:ish populationsolluted riversesocosm
eproductive competitiveness
a b s t r a c t
Pollution is a significant environmental pressure on fish populations in both freshwater and marineenvironments. Populations subjected to chronic exposure to pollutants can experience impacts rangingfrom altered reproductive capacity to changes in population genetic structure. Few studies, however,have examined the reproductive vigor of individuals within populations inhabiting environments char-acterized by chronic pollution. In this study we undertook an analysis of populations of three-spinedsticklebacks (Gasterosteus aculeatus) from polluted sites, to determine levels of genetic diversity, assessfor evidence of historic population genetic bottlenecks and determine the reproductive competitivenessof males from these locations. The sites chosen included locations in the River Aire, the River Tees andthe River Birket, English rivers that have been impacted by pollution from industrial and/or domesticeffluents for over 100 years. Male reproductive competitiveness was determined via competitive breed-ing experiments with males and females derived from a clean water site, employing DNA microsatellitesto determine parentage outcome. Populations of stickleback collected from the three historically pol-
luted sites showed evidence of recent population bottlenecks, although only the River Aire populationshowed low genetic diversity. In contrast, fish collected from two relatively unpolluted sites within theRiver Gowy and Houghton Springs showed weak, or no evidence of such bottlenecks. Nevertheless, malesderived from polluted sites were able to reproduce successfully in competition with males derived fromclean water exposures, indicating that these bottlenecks have not resulted in any substantial loss ofreproductive fitness in males.. Introduction
The consequences of exposure to pollutants on wildlife rangerom adverse effects in individuals to changes in whole popu-ations, and this is largely dependent on the type of pollutant,nd the magnitude and duration of the exposure. The impacts ofhronic pollution on wildlife populations include reduced survivor-
hip and fecundity (Oaks et al., 2004), increased incidence of diseaseArkoosh et al., 1998), developmental abnormalities (Hamlin anduillette, 2011), decreased reproductive ability (Jobling et al., 2002;∗ Corresponding author at: Biosciences, College of Life and Environmental Sci-nces, Geoffrey Pope Building, University of Exeter, Exeter EX4 4QD, UK.el.: +44 01392 264607; fax: +44 01392 263700.
E-mail address: [email protected] (E.M. Santos).1 These authors contributed equally to this study and are to be identified as jointrst authors.
166-445X/$ – see front matter © 2013 Elsevier B.V. All rights reserved.ttp://dx.doi.org/10.1016/j.aquatox.2013.08.008
© 2013 Elsevier B.V. All rights reserved.
Harris et al., 2011) and changes in the genetic structure of popula-tions (Belfiore and Anderson, 2001). Genetic diversity can be lostif populations are reduced in size for several generations (geneticbottlenecks). Reduced genetic diversity has been observed in wildand experimental populations of invertebrates (Gardestrom et al.,2008; Coors et al., 2009) and fish (Murdoch and Hebert, 1994; Maeset al., 2005) as a result of exposure to pollutants, potentially result-ing from genetic bottlenecks.
Genetic bottlenecks can be detected in the absence of histor-ical records of a species using molecular markers such as DNAmicrosatellites and have occasionally been detected in popula-tions of fish species living in freshwater river systems that havebeen impacted by pollution (Jensen et al., 2005; Dominguez-Dominguez et al., 2007). For instance, a study on brown trout
(Salmo trutta) in small Danish rivers found strong evidence ofrecent bottlenecks that were attributed to organic pollution occur-ring in the 1970–1980s (Jensen et al., 2005). Many other studieshave not found evidence of reduced genetic diversity or genetic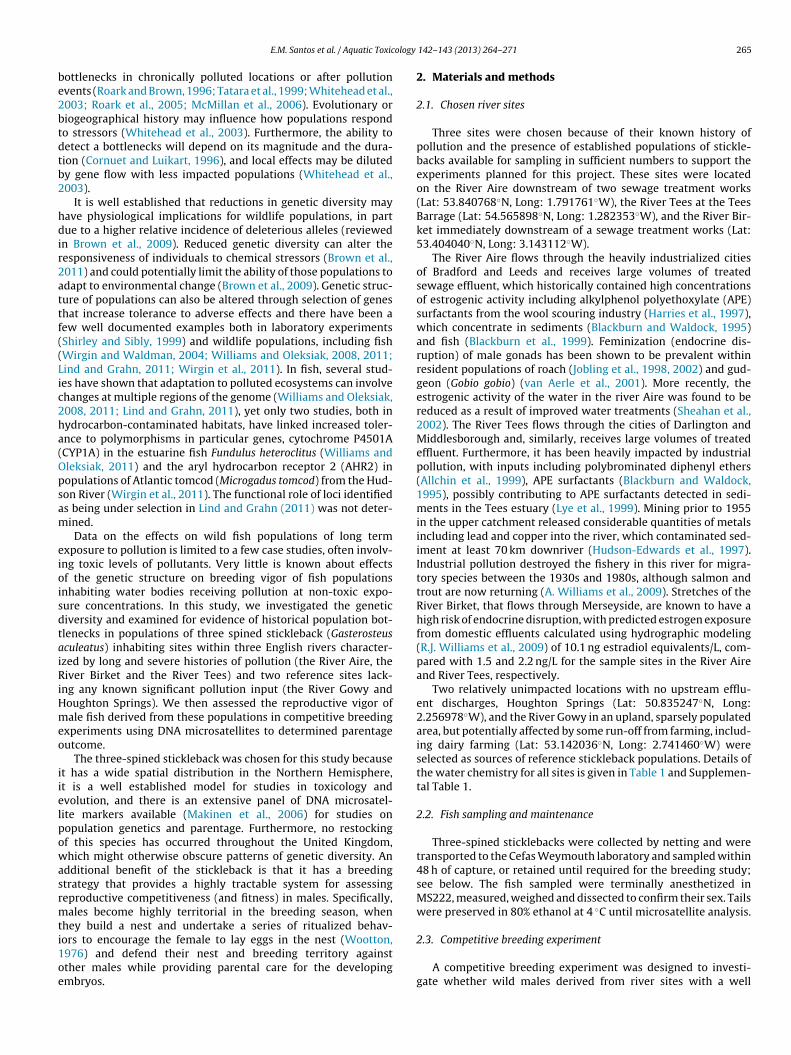
ology
be2btdtb2
hdir2attf((Lic2ha(Opsam
eioisdtaiRiHmeo
iielpowasrmti1oe
E.M. Santos et al. / Aquatic Toxic
ottlenecks in chronically polluted locations or after pollutionvents (Roark and Brown, 1996; Tatara et al., 1999; Whitehead et al.,003; Roark et al., 2005; McMillan et al., 2006). Evolutionary oriogeographical history may influence how populations respondo stressors (Whitehead et al., 2003). Furthermore, the ability toetect a bottlenecks will depend on its magnitude and the dura-ion (Cornuet and Luikart, 1996), and local effects may be dilutedy gene flow with less impacted populations (Whitehead et al.,003).
It is well established that reductions in genetic diversity mayave physiological implications for wildlife populations, in partue to a higher relative incidence of deleterious alleles (reviewed
n Brown et al., 2009). Reduced genetic diversity can alter theesponsiveness of individuals to chemical stressors (Brown et al.,011) and could potentially limit the ability of those populations todapt to environmental change (Brown et al., 2009). Genetic struc-ure of populations can also be altered through selection of geneshat increase tolerance to adverse effects and there have been aew well documented examples both in laboratory experimentsShirley and Sibly, 1999) and wildlife populations, including fishWirgin and Waldman, 2004; Williams and Oleksiak, 2008, 2011;ind and Grahn, 2011; Wirgin et al., 2011). In fish, several stud-es have shown that adaptation to polluted ecosystems can involvehanges at multiple regions of the genome (Williams and Oleksiak,008, 2011; Lind and Grahn, 2011), yet only two studies, both inydrocarbon-contaminated habitats, have linked increased toler-nce to polymorphisms in particular genes, cytochrome P4501ACYP1A) in the estuarine fish Fundulus heteroclitus (Williams andleksiak, 2011) and the aryl hydrocarbon receptor 2 (AHR2) inopulations of Atlantic tomcod (Microgadus tomcod) from the Hud-on River (Wirgin et al., 2011). The functional role of loci identifieds being under selection in Lind and Grahn (2011) was not deter-ined.Data on the effects on wild fish populations of long term
xposure to pollution is limited to a few case studies, often involv-ng toxic levels of pollutants. Very little is known about effectsf the genetic structure on breeding vigor of fish populationsnhabiting water bodies receiving pollution at non-toxic expo-ure concentrations. In this study, we investigated the geneticiversity and examined for evidence of historical population bot-lenecks in populations of three spined stickleback (Gasterosteusculeatus) inhabiting sites within three English rivers character-zed by long and severe histories of pollution (the River Aire, theiver Birket and the River Tees) and two reference sites lack-
ng any known significant pollution input (the River Gowy andoughton Springs). We then assessed the reproductive vigor ofale fish derived from these populations in competitive breeding
xperiments using DNA microsatellites to determined parentageutcome.
The three-spined stickleback was chosen for this study becauset has a wide spatial distribution in the Northern Hemisphere,t is a well established model for studies in toxicology andvolution, and there is an extensive panel of DNA microsatel-ite markers available (Makinen et al., 2006) for studies onopulation genetics and parentage. Furthermore, no restockingf this species has occurred throughout the United Kingdom,hich might otherwise obscure patterns of genetic diversity. An
dditional benefit of the stickleback is that it has a breedingtrategy that provides a highly tractable system for assessingeproductive competitiveness (and fitness) in males. Specifically,ales become highly territorial in the breeding season, when
hey build a nest and undertake a series of ritualized behav-
ors to encourage the female to lay eggs in the nest (Wootton,976) and defend their nest and breeding territory againstther males while providing parental care for the developingmbryos.142– 143 (2013) 264– 271 265
2. Materials and methods
2.1. Chosen river sites
Three sites were chosen because of their known history ofpollution and the presence of established populations of stickle-backs available for sampling in sufficient numbers to support theexperiments planned for this project. These sites were locatedon the River Aire downstream of two sewage treatment works(Lat: 53.840768◦N, Long: 1.791761◦W), the River Tees at the TeesBarrage (Lat: 54.565898◦N, Long: 1.282353◦W), and the River Bir-ket immediately downstream of a sewage treatment works (Lat:53.404040◦N, Long: 3.143112◦W).
The River Aire flows through the heavily industrialized citiesof Bradford and Leeds and receives large volumes of treatedsewage effluent, which historically contained high concentrationsof estrogenic activity including alkylphenol polyethoxylate (APE)surfactants from the wool scouring industry (Harries et al., 1997),which concentrate in sediments (Blackburn and Waldock, 1995)and fish (Blackburn et al., 1999). Feminization (endocrine dis-ruption) of male gonads has been shown to be prevalent withinresident populations of roach (Jobling et al., 1998, 2002) and gud-geon (Gobio gobio) (van Aerle et al., 2001). More recently, theestrogenic activity of the water in the river Aire was found to bereduced as a result of improved water treatments (Sheahan et al.,2002). The River Tees flows through the cities of Darlington andMiddlesborough and, similarly, receives large volumes of treatedeffluent. Furthermore, it has been heavily impacted by industrialpollution, with inputs including polybrominated diphenyl ethers(Allchin et al., 1999), APE surfactants (Blackburn and Waldock,1995), possibly contributing to APE surfactants detected in sedi-ments in the Tees estuary (Lye et al., 1999). Mining prior to 1955in the upper catchment released considerable quantities of metalsincluding lead and copper into the river, which contaminated sed-iment at least 70 km downriver (Hudson-Edwards et al., 1997).Industrial pollution destroyed the fishery in this river for migra-tory species between the 1930s and 1980s, although salmon andtrout are now returning (A. Williams et al., 2009). Stretches of theRiver Birket, that flows through Merseyside, are known to have ahigh risk of endocrine disruption, with predicted estrogen exposurefrom domestic effluents calculated using hydrographic modeling(R.J. Williams et al., 2009) of 10.1 ng estradiol equivalents/L, com-pared with 1.5 and 2.2 ng/L for the sample sites in the River Aireand River Tees, respectively.
Two relatively unimpacted locations with no upstream efflu-ent discharges, Houghton Springs (Lat: 50.835247◦N, Long:2.256978◦W), and the River Gowy in an upland, sparsely populatedarea, but potentially affected by some run-off from farming, includ-ing dairy farming (Lat: 53.142036◦N, Long: 2.741460◦W) wereselected as sources of reference stickleback populations. Details ofthe water chemistry for all sites is given in Table 1 and Supplemen-tal Table 1.
2.2. Fish sampling and maintenance
Three-spined sticklebacks were collected by netting and weretransported to the Cefas Weymouth laboratory and sampled within48 h of capture, or retained until required for the breeding study;see below. The fish sampled were terminally anesthetized inMS222, measured, weighed and dissected to confirm their sex. Tailswere preserved in 80% ethanol at 4 ◦C until microsatellite analysis.
2.3. Competitive breeding experiment
A competitive breeding experiment was designed to investi-gate whether wild males derived from river sites with a well

266 E.M. Santos et al. / Aquatic Toxicology
Tab
le
1Su
mm
ary
of
wat
er
qual
ity
dat
a
for
the
rive
r
site
s
inve
stig
ated
in
this
stu
dy.
Dat
a
pro
vid
ed
are
mea
ns
of
mea
sure
men
ts
coll
ecte
d
betw
een
1971
and
2013
by
the
UK
Envi
ron
men
t
Age
ncy
and
rep
rese
nt
the
loca
tion
for
wh
ich
dat
aw
as
avai
labl
e
mos
t
rep
rese
nta
tive
of
the
sam
pli
ng
site
s
for
this
pro
ject
. For
the
Riv
er
Tees
, dat
a
pre
sen
ted
was
coll
ecte
d
from
the
mid
dle
of
the
wat
er
colu
mn
. A
com
pre
hen
sive
tabl
e
for
each
site
is
give
n
in
Sup
ple
men
tal T
able
1.
Mea
sure
men
t
Un
its
Mea
n
±
sd
Hou
ghto
n
Spri
ngs
Riv
er
Gow
y
Riv
er
Bir
ket
Riv
er
Air
e
Tees
Bar
rage
Riv
er
From
e
BO
D:
5
day
ATU
mg/
L
1.10
±
0.51
3.32
±
2.22
6.08
±
12.7
7
6.79
±
4.42
1.97
±
0.82
1.63
±
1.02
Ch
emic
al
oxyg
en
dem
and
:
CO
D
mg/
L
–
32.3
6
±
17.5
2
50.1
1
±
26.6
7
74.0
6
±
140.
75
–
–C
ond
uct
ivit
y
at
20◦ C
�S/
cm
405.
60
±
17.4
6
–
–
454.
00
±
128.
36
–
484.
24
±
40.2
5C
ond
uct
ivit
y
at
25◦ C
�S/
cm
–
792.
15
±
105.
47
961.
39
±
181.
76
595.
44
±
180.
38
– –
Har
dn
ess,
tota
l as
CaC
O3
mg/
L
215.
60
±
13.0
5
277.
00
±
53.3
6
368.
61
±
74.3
5
171.
40
±
28.7
8
285.
55
± 34
0.07
244.
37
±
23.3
0N
itra
te
as
Nm
g/L
3.74
±
0.58
9.24
±
3.38
2.44
±
1.60
3.67
±
1.70
3.48
±
1.71
4.73
±
1.05
Nit
rite
as
N
mg/
L
0.01
±
0.01
0.21
±
0.16
0.05
±
0.05
0.17
±
0.18
0.05
±
0.03
0.04
±
0.05
Nit
roge
n, t
otal
oxid
ized
as
N
mg/
L
3.69
±
0.64
–
2.49
±
1.61
4.00
±
1.65
3.35
±
1.73
4.72
±
1.06
Oxy
gen
, dis
solv
ed:
(lab
orat
ory)
as
O2
mg/
L
–
9.07
±
2.56
–
8.06
±
2.97
–
–O
xyge
n, d
isso
lved
as
O2
mg/
L
10.3
3
±
8.58
–
8.51
±
3.37
9.55
±
1.99
8.59
±
2.35
10.9
6
±
1.25
Oxy
gen
, dis
solv
ed, %
satu
rati
on
%
85.9
1
±
10.6
3
–
70.7
2
±
26.4
3
84.2
8
±
14.2
1 80
.42
±
15.9
6
99.4
9
±
10.2
6O
xyge
n, d
isso
lved
, %
satu
rati
on:
(lab
orat
ory)
%
–
79.7
7
±
20.2
0
–
71.2
3
±
22.5
0 –
–p
H
7.53
±
0.25
7.81
±
0.27
7.67
±
0.12
7.51
± 0.
27
7.82
±
0.37
8.01
±
0.34
Tem
per
atu
re
of
wat
er◦ C
10.4
4
±
1.58
10.4
7
±
4.05
8.43
±
5.00
10.7
7 ±
4.81
11.6
7
±
5.44
11.1
7
±
3.96
142– 143 (2013) 264– 271
established history of contamination differed in their ability tobreed (sire offspring), compared with wild males originating fromthe reference sites, when competing with laboratory-bred malesoriginating from a reference site (see Fig. 1 for a schematic of theexperimental setup). The breeding trial was performed during Mayand June, to coincide with the natural breeding season for stickle-backs and was set up in mesocosms in an open field at the Centrefor Ecology and Hydrology, Dorset. Mesocosms (fiberglass outdoortanks; 2.5 m diameter, 0.6 m height) were supplied with river water(River Frome, see Table 1 and Supplemental Table 1 for details onwater chemistry), sand, gravel and aquatic plants to provide therequired substrate and natural nesting material, and plants alsoprovided areas of refuge for fish. The water level was maintained ata height of approximately 30 cm, but with variations due to rainfalland evaporation. During periods of dry weather, the mesocosmswere topped up with river water to maintain the water level rel-atively constant. Each mesocosm contained 10 laboratory-rearedfemales and 5 laboratory-reared males (control fish; the parentsof the Cefas Weymouth laboratory population originated from theHoughton Spring population) and 5 males originating from either ofthe wild populations (Houghton Springs, River Gowy, Tees Barrage,River Birket, River Aire). Two replicate mesocosms were set up foreach wild population. For control fish, all males and females origi-nated from families of siblings (to minimize the variation betweenthese fish) but within each mesocosm, control males and femalesoriginated from different families as it is known that sticklebacksavoid breeding with siblings (Milinski, 2003). During the courseof the experiment, fish were fed daily with frozen bloodworms adlibitum and any fish mortalities were removed and recorded. Allmesocosms were covered with net to avoid bird predation. Theground area of the mesocosms was thought to be sufficient for allmales to build their nests and this was the case in some, but not all,mesocosms.
During the experiment, nests were sampled 4 times over a 4week period at 7 day intervals and eggs (or larvae) were collectedand preserved in 80% ethanol at 4 ◦C until processed for parentageanalysis (Fig. 1). At the end of the experiment, all adult fish weresacrificed and any remaining juveniles in the mesocosms were col-lected and preserved in 80% ethanol. Adult fish were terminallyanesthetized in MS222, measured, weighed and dissected to con-firm their sex. Tails were preserved in 80% ethanol at 4 ◦C untilanalysis of parentage of the offspring.
For paternity assignment, adult fish that were alive at the end ofthe experiment (147) were genotyped using microsatellite markers(see below). For every nest removed during the first three samplingtime points (i.e. the first three weeks of the experiment) and con-taining offspring, three embryos were genotyped. If the paternityfor any nest was unclear, a further four embryos were genotypedfrom that nest. Thus the offspring in each nest were recorded aseither being sired by a wild or control male. In total, 159 embryoswere genotyped from a total of 49 nests.
2.4. Microsatellite genotyping
DNA was extracted from the tails, or from embryos (in thecompetitive breeding experiment) using ammonium acetate pre-cipitation (adapted from Bruford et al., 1998). Each fish wasgenotyped using nine microsatellite markers [Gac4160, Gac5161,Gac7010, Gac7080, Gac7148 and Gac8110 (Heckel et al., 2002);Gac1097, Gac2111 and Gac7033 (Largiader et al., 1999)]. PCRs wereperformed in 10 �L reactions with 5 �L template DNA, 1 �L HPLCwater, 0.5 �L REDTaq DNA Polymerase (Sigma, UK), 1 �L of RED-
Taq buffer, 1 �L of 10 mM dNTP, 0.3 �L of 50 mM MgCl2 and 1 �Mof each primer.The following PCR program was used for all microsatellite mark-ers: incubation at 94 ◦C for 5 min; 32 cycles of amplification at

E.M. Santos et al. / Aquatic Toxicology 142– 143 (2013) 264– 271 267
HS RG TB RB RA
10 control females
5 control males
5 wild males
0 7 14 21 28
Fish introduced to
mesocosms
Sampling of all nests and
embryos
Sampling of all nests and
embryos
Sampling of all nests and
embryos
Sampling of all nests,
embryos and
adult fish
TIME (DAYS)
Fig. 1. Experimental setup of the competitive breeding experiment designed to investigate whether male sticklebacks derived from different field sites differed in theirreproductive vigor. Males from the 5 populations derived from field sites with different pollution histories are represented by the black fish symbol; males bred in thelaboratory and originating from a control site (Houghton Springs) are represented by the light-gray fish symbol; females (bred in the laboratory and originating froma control site (Houghton Springs)) are represented by dark gray fish symbol. Each breeding scenario included 5 males originating from the test population, 5 control,l s werG
9c5fw(itS
2
flfGAOnde2
me(RGapoe
prfL
aboratory-bred males and 10 control, laboratory-bred females. Duplicate mesocosmowy; TB, Tees Barrage; RB, River Birket; RA, River Aire.
4 ◦C for 30 s, stepped down annealing temperatures for 30 s (2ycles at 62 ◦C, 5 cycles at 58 ◦C, 5 cycles at 55 ◦C, 10 cycles at3 ◦C, 5 cycles at 51 ◦C and 5 cycles at 48 ◦C) followed by 72 ◦Cor 1 min; and a final extension step at 72 ◦C for 10 min. Productsere pooled in a suitable ratio for analysis on the DNA sequencer
CEQTM 8000 Genetic Analysis System, Beckman Coulter) follow-ng standard procedures. Fragment sizes were determined usinghe Fragment Analysis program of CEQTM 8000 Genetic Analysisystem, Version 9.0 (Beckman Coulter).
.5. Population genetic analyses
For population genetic analysis, between 29 and 41 individualsrom each population were genotyped using the 9 microsatel-ite loci described above. For each location, all loci were testedor conformity to Hardy Weinberg equilibrium (HWE), usingENEPOP version 4.0 (Raymond and Rousset, 1995; Rousset, 2008).ny deviations were further investigated with Microchecker (Vanosterhout et al., 2004). Critical levels of significance for simulta-eous tests were adjusted using the sequential Bonferroni proce-ure adjusting for the number of tests (45, one for each locus forach population) (Rice, 1989). The program LOSITAN (Antao et al.,008) was used to identify loci that show signatures of selection.
Three measures of genetic diversity were calculated from theicrosatellite data. These were observed heterozygosity (HO),
xpected heterozygosity (HE) and allelic richness (AR) using FstatGoudet, 1995, 2001) and GENEPOP (Raymond and Rousset, 1995;ousset, 2008). These were first calculated using all loci. Sinceac7030 showed the signature of selection and Gac7148, Gac7080nd Gac7030 showed evidence for departure from HWE and theresence of null alleles or stutter in a minimum of 2 populationsf the 5 populations, genetic diversity measures were recalculatedxcluding these loci.
The microsatellite data were used to test for evidence of recent
opulation bottlenecks. This was first done using all loci and thenepeated excluding any locus that showed significant departurerom HWE in that population, using BOTTLENECK (Cornuet anduikart, 1996; Piry et al., 1999). This program tests for a relativee included for each competitive breeding scenario. HS, Houghton Springs; RG, River
excess in heterozygosity that is apparent for a few generations aftera bottleneck which develops because allelic diversity declines fasterthan heterozygosity due to loss of rare alleles. Allele frequency dis-tributions were compared to that of populations in mutation-driftequilibrium using the two phase model (TPM, with 70% stepwisemutation model) and the stepwise mutation model (SMM). Devia-tions between observed and expected frequent distributions weretested using Wilcoxon’s signed rank test. BOTTLENECK was run for10,000 iterations.
2.6. Statistical analysis
All data and analyses performed were checked for conformitywith the assumptions of normality. If these were not met, then thedata were either transformed such that the assumptions of nor-mality were met, or a non-parametric test was used. Proportionalpaternity success was analyzed using a GLM with binomial errors.Details of all other tests are given with the relevant results. All anal-yses were performed using R (version 2.8.1) or Minitab (version15).
3. Results
3.1. Measures of genetic diversity in the study populations
Levels of genetic variability varied considerably between sites(Table 2). Allelic richness varied from 4.6 (Houghton Springs) to10.2 (Tees Barrage). There were significant differences betweensites (2 way ANOVA, F4,32 = 8.0718, p = 0.00013). Post hoc analy-sis demonstrated that genetic diversity was significantly lower atthe Houghton Springs site compared with at all other sites, andthere was no overall difference between the other sites. Likewise,expected heterozygosity ranged from 0.57 (Houghton Springs) to0.76 (River Gowy), and was significantly lower in Houghton Springs,
compared with the other sites which did not significantly differfrom each other. Of the polluted river sites examined, heterozygos-ity was lowest in the Aire (HE = 0.60 and HO = 0.54), but this was notstatistically significant compared to the other sites. A similar trend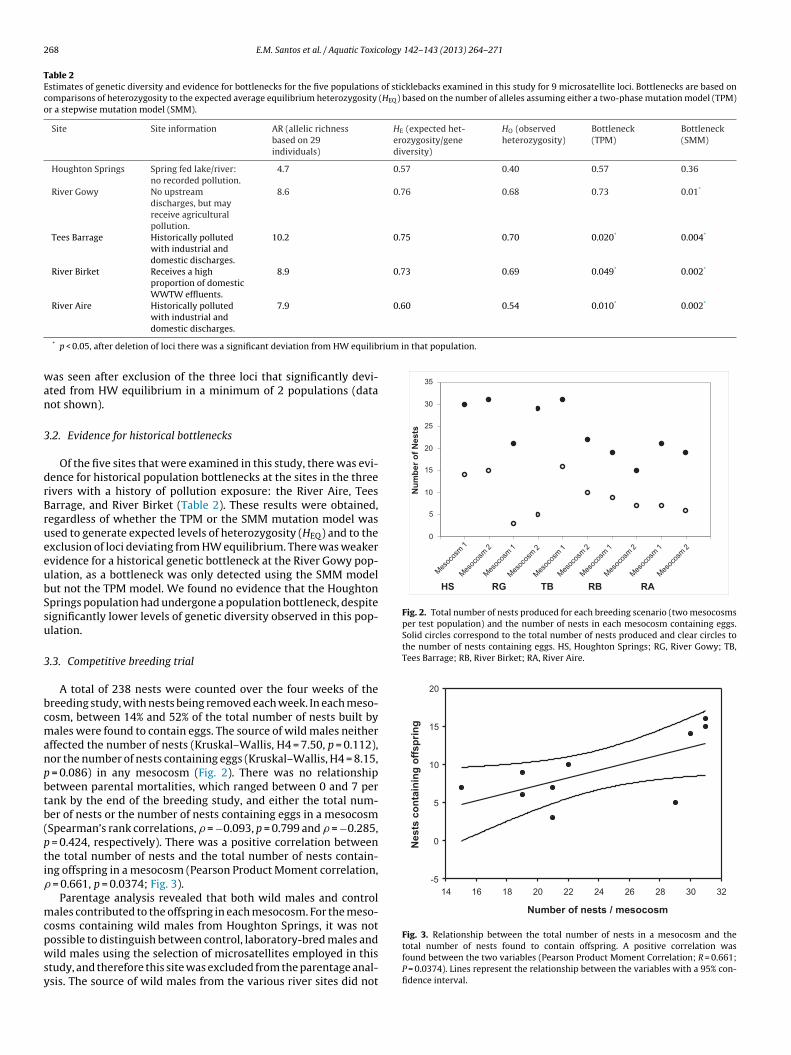
268 E.M. Santos et al. / Aquatic Toxicology 142– 143 (2013) 264– 271
Table 2Estimates of genetic diversity and evidence for bottlenecks for the five populations of sticklebacks examined in this study for 9 microsatellite loci. Bottlenecks are based oncomparisons of heterozygosity to the expected average equilibrium heterozygosity (HEQ) based on the number of alleles assuming either a two-phase mutation model (TPM)or a stepwise mutation model (SMM).
Site Site information AR (allelic richnessbased on 29individuals)
HE (expected het-erozygosity/genediversity)
HO (observedheterozygosity)
Bottleneck(TPM)
Bottleneck(SMM)
Houghton Springs Spring fed lake/river:no recorded pollution.
4.7 0.57 0.40 0.57 0.36
River Gowy No upstreamdischarges, but mayreceive agriculturalpollution.
8.6 0.76 0.68 0.73 0.01*
Tees Barrage Historically pollutedwith industrial anddomestic discharges.
10.2 0.75 0.70 0.020* 0.004*
River Birket Receives a highproportion of domesticWWTW effluents.
8.9 0.73 0.69 0.049* 0.002*
River Aire Historically pollutedwith industrial and
7.9 0.60 0.54 0.010* 0.002*
rium in that population.
wan
3
drBrueeubSsu
3
bcmanpbtb(pti�
mcpwsy
0
5
10
15
20
25
30
35
Nu
mb
er
of
Ne
sts
HS RG TB RB RA
0
5
10
15
20
25
30
35
Nu
mb
er
of
Ne
sts
HS RG TB RB RA
Fig. 2. Total number of nests produced for each breeding scenario (two mesocosmsper test population) and the number of nests in each mesocosm containing eggs.Solid circles correspond to the total number of nests produced and clear circles tothe number of nests containing eggs. HS, Houghton Springs; RG, River Gowy; TB,Tees Barrage; RB, River Birket; RA, River Aire.
Number of nes ts / mesocosm
14 16 18 20 22 24 26 28 30 32
Ne
sts
co
nta
inin
g o
ffs
pri
ng
-5
0
5
10
15
20
domestic discharges.
* p < 0.05, after deletion of loci there was a significant deviation from HW equilib
as seen after exclusion of the three loci that significantly devi-ted from HW equilibrium in a minimum of 2 populations (dataot shown).
.2. Evidence for historical bottlenecks
Of the five sites that were examined in this study, there was evi-ence for historical population bottlenecks at the sites in the threeivers with a history of pollution exposure: the River Aire, Teesarrage, and River Birket (Table 2). These results were obtained,egardless of whether the TPM or the SMM mutation model wassed to generate expected levels of heterozygosity (HEQ) and to thexclusion of loci deviating from HW equilibrium. There was weakervidence for a historical genetic bottleneck at the River Gowy pop-lation, as a bottleneck was only detected using the SMM modelut not the TPM model. We found no evidence that the Houghtonprings population had undergone a population bottleneck, despiteignificantly lower levels of genetic diversity observed in this pop-lation.
.3. Competitive breeding trial
A total of 238 nests were counted over the four weeks of thereeding study, with nests being removed each week. In each meso-osm, between 14% and 52% of the total number of nests built byales were found to contain eggs. The source of wild males neither
ffected the number of nests (Kruskal–Wallis, H4 = 7.50, p = 0.112),or the number of nests containing eggs (Kruskal–Wallis, H4 = 8.15,
= 0.086) in any mesocosm (Fig. 2). There was no relationshipetween parental mortalities, which ranged between 0 and 7 perank by the end of the breeding study, and either the total num-er of nests or the number of nests containing eggs in a mesocosmSpearman’s rank correlations, � = −0.093, p = 0.799 and � = −0.285,
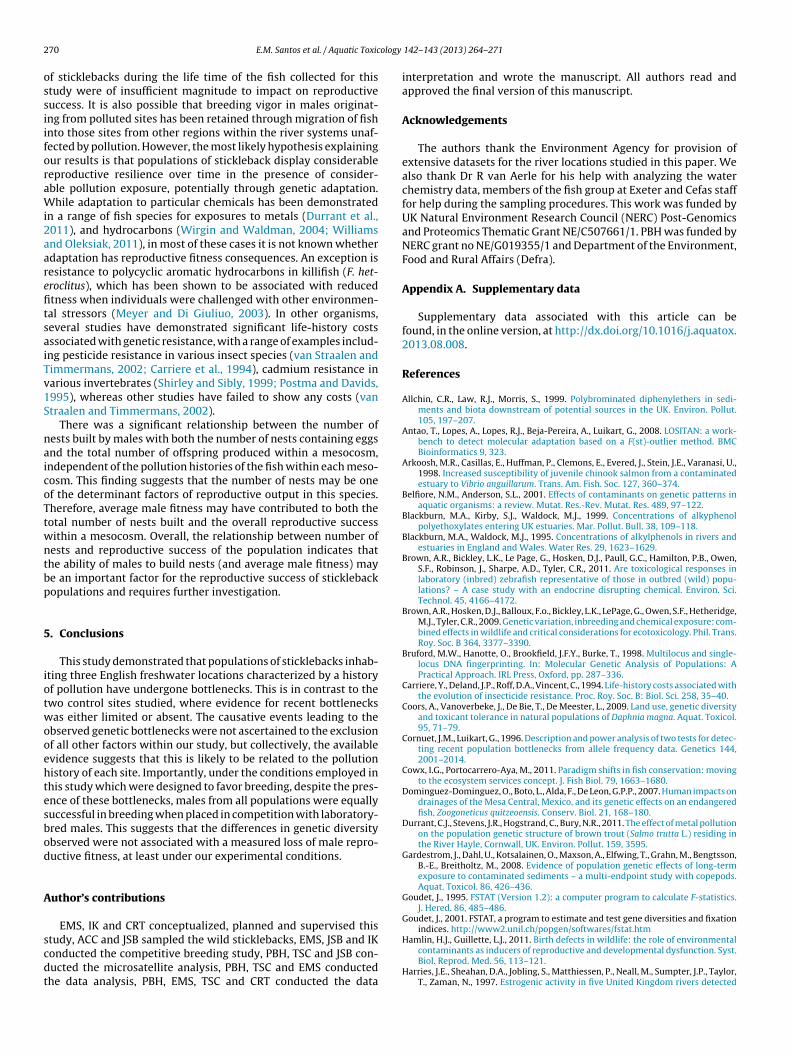
= 0.424, respectively). There was a positive correlation betweenhe total number of nests and the total number of nests contain-ng offspring in a mesocosm (Pearson Product Moment correlation,
= 0.661, p = 0.0374; Fig. 3).Parentage analysis revealed that both wild males and control
ales contributed to the offspring in each mesocosm. For the meso-osms containing wild males from Houghton Springs, it was not
ossible to distinguish between control, laboratory-bred males andild males using the selection of microsatellites employed in thistudy, and therefore this site was excluded from the parentage anal-sis. The source of wild males from the various river sites did not
Fig. 3. Relationship between the total number of nests in a mesocosm and thetotal number of nests found to contain offspring. A positive correlation wasfound between the two variables (Pearson Product Moment Correlation; R = 0.661;P = 0.0374). Lines represent the relationship between the variables with a 95% con-fidence interval.

E.M. Santos et al. / Aquatic Toxicology
0%
20%
40%
60%
80%
100%
RG TB RB RA
Pro
po
rtio
n o
f n
ests
4
1
8
10
7
7
7
5
Fig. 4. Proportion of nests containing eggs sired by control and wild males for eachwild population (data for two replicate mesocosms was combined for each popu-lation). Numbers on the bars are the number of nests for that breeding tank. RG,River Gowy; TB, Tees Barrage; RB, River Birket; RA, River Aire. Clear bars representto
ampedc(tp
4
4
deitoHslerce(sptoass(spt
many generations, and where we have evidence for population
he number of nests sired by control males and dotted bars represent the numberf nests sired by wild males.
ffect the proportion of nests containing offspring sired by controlales within a mesocosm (GLM with binomial errors, X2
3 = −0.973, = 0.808) (see Fig. 4). Furthermore, the ratio of nests containingggs produced by control and wild males did not significantlyiffer from a 1:1 for each wild population after combining nestounts from the two mesocosms from each population (see Fig. 1)
Bonferroni-corrected to account for multiple testing and seto 0.0125; River Gowy, X2 = 1.8, p = 0.180; Tess Barrack, X2 = 0.222,
= 0.637; River Birket, X2 = 0, p = 1; River Aire, X2 = 0.333, p = 0.564).
. Discussion
.1. Genetic diversity in wild populations
Estimates of genetic diversity obtained from the analysis con-ucted on wild stickleback populations (allelic richness 4.6–10.2,xpected heterozygosity 0.57–0.76) are similar to those reportedn other studies. For example, a study of 33 stickleback popula-ions from across Europe found an average expected heterozygosityf 0.64 (Makinen et al., 2006). The genetic diversity was low atoughton Springs, and this might be expected given that this is a
mall isolated population. Various other studies on wild fish popu-ations have not found impacts of pollution on genetic diversity. Forxample, two studies on an estuarine fish, the mummichog (F. hete-oclitus) found that genetic diversity did not differ between heavilyontaminated and moderately contaminated sites, despite strongvidence for adaptation to pollutants at the contaminated sitesRoark and Brown, 1996; McMillan et al., 2006). High genetic diver-ity at polluted sites may have been maintained by large effectiveopulation sizes; the mechanism for adaptation to contaminants (ifhey have indeed adapted) may have affected only a small numberf loci, or any loss in diversity may have been restored with moder-te levels of migration; and relatively short generation time for thepecies (Roark and Brown, 1996; McMillan et al., 2006). Anothertudy in the US of twelve populations of the Sacramento suckerCatostomus occidentalis) across six river systems found that down-
tream populations had higher genetic diversity than upstreamopulations, regardless of long term history of exposure to pes-icides (Whitehead et al., 2003).142– 143 (2013) 264– 271 269
4.2. Evidence for genetic bottlenecks in rivers with historicalpollution
Our results using microsatellite analysis provide evidence thatstickleback populations at the three polluted sites (River Birket,River Tees and River Aire) have undergone recent population bot-tlenecks. There was some evidence, albeit much weaker, of a geneticbottleneck at one of the reference sites (River Gowy), but not forthe other reference site (Houghton Springs). The presence of bot-tlenecks in this study may indicate a relationship with pollutionhistory, but also other factors (for which we do not have suffi-cient data to critically assess), including habitat degradation (e.g.eutrophication), invasive species, predators, disease and flow con-ditions could all have contributed to these population bottlenecks(Nunn et al., 2007; Cowx and Portocarrero-Aya, 2011). Neverthe-less, published studies on stickleback populations living in a widerange of habitats suggest that bottlenecks are relatively rare. As anexample, a study on the European nine-spined stickleback (Pungi-tius pungitius) at 51 relatively unpolluted European sites, including8 river, 19 lake and 14 pond sites found no evidence for bottle-necks (Shikano et al., 2010). Similarly, a study of the three-spinedstickleback using neutral microsatellite loci, as were used in thisstudy, found no evidence for bottlenecks at 4 freshwater sites inSweden, Finland and Bosnia, in contrast to loci linked to candidateregions for selection for quantitative trait loci for morphologicaltraits (Makinen et al., 2008). Our data, together with evidence fromthe literature, would suggest that bottlenecks in the populationsof stickleback inhabiting contaminated habitats were likely to berelated to the pollution exposure histories of those sites.
We do not know, however, if the bottlenecks observed in thethree polluted rivers were associated with a decrease in populationnumbers followed by recovery of those populations or if all thepopulation was lost and was followed by recolonization from otherless polluted tributaries or marine populations, or a combination ofboth.
Effects on heterozygosity after a population crash will only per-sist for (2–4) Ne generations before a new equilibrium is set (Luikartet al., 1998). Therefore, it is difficult to compare the size of bottle-necks as Ne will differ between these populations and in this studywe have insufficient data to calculate this parameter with con-fidence. Furthermore, as the signals of bottlenecks will decreasegradually, our analysis would be unable to differentiate betweenrecent, but small bottlenecks from larger, older bottlenecks. Ratesof immigration into any of these rivers following a population crash,which may dilute the signatures of bottlenecks are also likely todiffer between sites, further confounding the interpretation of thedata.
4.3. Reproductive ability of males originating from sites with ahistory of pollution exposure
Analysis of the reproductive success of the males originatingfrom wild populations showed that males from all sites, includ-ing the three polluted sites, were able to breed. Importantly, therewas no difference in the reproductive success of wild males fromany of the polluted sites when they were placed into mesocosmswith laboratory-reared males originating from a reference site(competitive breeding). Assuming that females do not preferen-tially select wild males, for example based on their divergent MHCpeptide ligands (Milinski, 2003) this finding suggests that malesfrom the populations of sticklebacks studied that are likely tohave been subject to continuous chronic pollution exposure over
bottlenecks, have maintained their competitive breeding capabil-ity (physiological, behavioral and otherwise). It is possible thatthe exposures to pollutants experienced by these wild populations
2 ology
ossiiforaWi2aarefitsaiTv1S
naicoTtwntbp
5
iotwooehtesbod
A
scdt
70 E.M. Santos et al. / Aquatic Toxic
f sticklebacks during the life time of the fish collected for thistudy were of insufficient magnitude to impact on reproductiveuccess. It is also possible that breeding vigor in males originat-ng from polluted sites has been retained through migration of fishnto those sites from other regions within the river systems unaf-ected by pollution. However, the most likely hypothesis explainingur results is that populations of stickleback display considerableeproductive resilience over time in the presence of consider-ble pollution exposure, potentially through genetic adaptation.hile adaptation to particular chemicals has been demonstrated
n a range of fish species for exposures to metals (Durrant et al.,011), and hydrocarbons (Wirgin and Waldman, 2004; Williamsnd Oleksiak, 2011), in most of these cases it is not known whetherdaptation has reproductive fitness consequences. An exception isesistance to polycyclic aromatic hydrocarbons in killifish (F. het-roclitus), which has been shown to be associated with reducedtness when individuals were challenged with other environmen-al stressors (Meyer and Di Giuliuo, 2003). In other organisms,everal studies have demonstrated significant life-history costsssociated with genetic resistance, with a range of examples includ-ng pesticide resistance in various insect species (van Straalen andimmermans, 2002; Carriere et al., 1994), cadmium resistance inarious invertebrates (Shirley and Sibly, 1999; Postma and Davids,995), whereas other studies have failed to show any costs (vantraalen and Timmermans, 2002).
There was a significant relationship between the number ofests built by males with both the number of nests containing eggsnd the total number of offspring produced within a mesocosm,ndependent of the pollution histories of the fish within each meso-osm. This finding suggests that the number of nests may be onef the determinant factors of reproductive output in this species.herefore, average male fitness may have contributed to both theotal number of nests built and the overall reproductive successithin a mesocosm. Overall, the relationship between number ofests and reproductive success of the population indicates thathe ability of males to build nests (and average male fitness) maye an important factor for the reproductive success of sticklebackopulations and requires further investigation.
. Conclusions
This study demonstrated that populations of sticklebacks inhab-ting three English freshwater locations characterized by a historyf pollution have undergone bottlenecks. This is in contrast to thewo control sites studied, where evidence for recent bottlenecksas either limited or absent. The causative events leading to the
bserved genetic bottlenecks were not ascertained to the exclusionf all other factors within our study, but collectively, the availablevidence suggests that this is likely to be related to the pollutionistory of each site. Importantly, under the conditions employed inhis study which were designed to favor breeding, despite the pres-nce of these bottlenecks, males from all populations were equallyuccessful in breeding when placed in competition with laboratory-red males. This suggests that the differences in genetic diversitybserved were not associated with a measured loss of male repro-uctive fitness, at least under our experimental conditions.
uthor’s contributions
EMS, IK and CRT conceptualized, planned and supervised this
tudy, ACC and JSB sampled the wild sticklebacks, EMS, JSB and IKonducted the competitive breeding study, PBH, TSC and JSB con-ucted the microsatellite analysis, PBH, TSC and EMS conductedhe data analysis, PBH, EMS, TSC and CRT conducted the data142– 143 (2013) 264– 271
interpretation and wrote the manuscript. All authors read andapproved the final version of this manuscript.
Acknowledgements
The authors thank the Environment Agency for provision ofextensive datasets for the river locations studied in this paper. Wealso thank Dr R van Aerle for his help with analyzing the waterchemistry data, members of the fish group at Exeter and Cefas stafffor help during the sampling procedures. This work was funded byUK Natural Environment Research Council (NERC) Post-Genomicsand Proteomics Thematic Grant NE/C507661/1. PBH was funded byNERC grant no NE/G019355/1 and Department of the Environment,Food and Rural Affairs (Defra).
Appendix A. Supplementary data
Supplementary data associated with this article can befound, in the online version, at http://dx.doi.org/10.1016/j.aquatox.2013.08.008.
References
Allchin, C.R., Law, R.J., Morris, S., 1999. Polybrominated diphenylethers in sedi-ments and biota downstream of potential sources in the UK. Environ. Pollut.105, 197–207.
Antao, T., Lopes, A., Lopes, R.J., Beja-Pereira, A., Luikart, G., 2008. LOSITAN: a work-bench to detect molecular adaptation based on a F(st)-outlier method. BMCBioinformatics 9, 323.
Arkoosh, M.R., Casillas, E., Huffman, P., Clemons, E., Evered, J., Stein, J.E., Varanasi, U.,1998. Increased susceptibility of juvenile chinook salmon from a contaminatedestuary to Vibrio anguillarum. Trans. Am. Fish. Soc. 127, 360–374.
Belfiore, N.M., Anderson, S.L., 2001. Effects of contaminants on genetic patterns inaquatic organisms: a review. Mutat. Res.-Rev. Mutat. Res. 489, 97–122.
Blackburn, M.A., Kirby, S.J., Waldock, M.J., 1999. Concentrations of alkyphenolpolyethoxylates entering UK estuaries. Mar. Pollut. Bull. 38, 109–118.
Blackburn, M.A., Waldock, M.J., 1995. Concentrations of alkylphenols in rivers andestuaries in England and Wales. Water Res. 29, 1623–1629.
Brown, A.R., Bickley, L.K., Le Page, G., Hosken, D.J., Paull, G.C., Hamilton, P.B., Owen,S.F., Robinson, J., Sharpe, A.D., Tyler, C.R., 2011. Are toxicological responses inlaboratory (inbred) zebrafish representative of those in outbred (wild) popu-lations? – A case study with an endocrine disrupting chemical. Environ. Sci.Technol. 45, 4166–4172.
Brown, A.R., Hosken, D.J., Balloux, F.o., Bickley, L.K., LePage, G., Owen, S.F., Hetheridge,M.J., Tyler, C.R., 2009. Genetic variation, inbreeding and chemical exposure: com-bined effects in wildlife and critical considerations for ecotoxicology. Phil. Trans.Roy. Soc. B 364, 3377–3390.
Bruford, M.W., Hanotte, O., Brookfield, J.F.Y., Burke, T., 1998. Multilocus and single-locus DNA fingerprinting. In: Molecular Genetic Analysis of Populations: APractical Approach. IRL Press, Oxford, pp. 287–336.
Carriere, Y., Deland, J.P., Roff, D.A., Vincent, C., 1994. Life-history costs associated withthe evolution of insecticide resistance. Proc. Roy. Soc. B: Biol. Sci. 258, 35–40.
Coors, A., Vanoverbeke, J., De Bie, T., De Meester, L., 2009. Land use, genetic diversityand toxicant tolerance in natural populations of Daphnia magna. Aquat. Toxicol.95, 71–79.
Cornuet, J.M., Luikart, G., 1996. Description and power analysis of two tests for detec-ting recent population bottlenecks from allele frequency data. Genetics 144,2001–2014.
Cowx, I.G., Portocarrero-Aya, M., 2011. Paradigm shifts in fish conservation: movingto the ecosystem services concept. J. Fish Biol. 79, 1663–1680.
Dominguez-Dominguez, O., Boto, L., Alda, F., De Leon, G.P.P., 2007. Human impacts ondrainages of the Mesa Central, Mexico, and its genetic effects on an endangeredfish, Zoogoneticus quitzeoensis. Conserv. Biol. 21, 168–180.
Durrant, C.J., Stevens, J.R., Hogstrand, C., Bury, N.R., 2011. The effect of metal pollutionon the population genetic structure of brown trout (Salmo trutta L.) residing inthe River Hayle, Cornwall, UK. Environ. Pollut. 159, 3595.
Gardestrom, J., Dahl, U., Kotsalainen, O., Maxson, A., Elfwing, T., Grahn, M., Bengtsson,B.-E., Breitholtz, M., 2008. Evidence of population genetic effects of long-termexposure to contaminated sediments – a multi-endpoint study with copepods.Aquat. Toxicol. 86, 426–436.
Goudet, J., 1995. FSTAT (Version 1.2): a computer program to calculate F-statistics.J. Hered. 86, 485–486.
Goudet, J., 2001. FSTAT, a program to estimate and test gene diversities and fixationindices. http://www2.unil.ch/popgen/softwares/fstat.htm
Hamlin, H.J., Guillette, L.J., 2011. Birth defects in wildlife: the role of environmentalcontaminants as inducers of reproductive and developmental dysfunction. Syst.Biol. Reprod. Med. 56, 113–121.
Harries, J.E., Sheahan, D.A., Jobling, S., Matthiessen, P., Neall, M., Sumpter, J.P., Taylor,T., Zaman, N., 1997. Estrogenic activity in five United Kingdom rivers detected

ology
H
H
H
J
J
J
L
L
L
L
M
M
M
M
M
M
M
N
O
E.M. Santos et al. / Aquatic Toxic
by measurement of vitellogenesis in caged male trout. Environ. Toxicol. Chem.16, 534–542.
arris, C.A., Hamilton, P.B., Runnalls, T.J., Vinciotti, V., Henshaw, A., Hodgson, D., Coe,T.S., Jobling, S., Tyler, C.R., Sumpter, J.P., 2011. The consequences of feminizationin breeding groups of wild fish. Environ. Health Perspect. 119, 306–311.
eckel, G., Zbinden, M., Mazzi, D., Kohler, A., Reckeweg, G., Bakker, T.C.M., Largiader,C.R., 2002. Microsatellite markers for the three-spined stickleback (Gasteros-teus aculeatus L.) and their applicability in a freshwater and an anadromouspopulation. Conserv. Genet. 3, 79–81.
udson-Edwards, K., Macklin, M., Taylor, M., 1997. Historic metal mining inputs toTees river sediment. Sci. Total Environ. 194, 437–445.
ensen, L.F., Hansen, M.M., Carlsson, J., Loeschcke, V., Mensberg, K.L.D., 2005. Spatialand temporal genetic differentiation and effective population size of brown trout(Salmo trutta, L.) in small Danish rivers. Conserv. Genet. 6, 615–621.
obling, S., Coey, S., Whitmore, J.G., Kime, D.E., Van Look, K.J.W., McAllister,B.G., Beresford, N., Henshaw, A.C., Brighty, G., Tyler, C.R., Sumpter, J.P., 2002.Wild intersex roach (Rutilus rutilus) have reduced fertility. Biol. Reprod. 67,515–524.
obling, S., Nolan, M., Tyler, C.R., Brighty, G., Sumpter, J.P., 1998. Widespread sexualdisruption in wild fish. Environ. Sci. Technol. 32, 2498–2506.
argiader, C.R., Fries, V., Kobler, B., Bakker, T.C.M., 1999. Isolation and character-ization of microsatellite loci from the three-spined stickleback (Gasterosteusaculeatus L.). Mol. Ecol. 8, 342–344.
ind, E.E., Grahn, M., 2011. Directional genetic selection by pulp mill effluent on mul-tiple natural populations of three-spined stickleback (Gasterosteus aculeatus).Ecotoxicology 20, 503–512.
uikart, G., Allendorf, F.W., Cornuet, J.M., Sherwin, W.B., 1998. Distortion of allele fre-quency distributions provides a test for recent population bottlenecks. J. Hered.89, 238–247.
ye, C.M., Frid, C.L.J., Gill, M.E., Cooper, D.W., Jones, D.M., 1999. Estrogenic alkylphe-nols in fish tissues, sediments, and waters from the UK Tyne and Tees estuaries.Environ. Sci. Technol. 33, 1009–1014.
aes, G.E., Raeymaekers, J.A.M., Pampoulie, C., Seynaeve, A., Goemans, G., Belpaire,C., Volckaert, F.A.M., 2005. The catadromous European eel Anguilla anguilla (L.) asa model for freshwater evolutionary ecotoxicology: relationship between heavymetal bioaccumulation, condition and genetic variability. Aquat. Toxicol. 73,99–114.
akinen, H.S., Cano, J.M., Merila, J., 2006. Genetic relationships among marine andfreshwater populations of the European three-spined stickleback (Gasterosteusaculeatus) revealed by microsatellites. Mol. Ecol. 15, 1519–1534.
akinen, H.S., Cano, M., Merila, J., 2008. Identifying footprints of directional andbalancing selection in marine and freshwater three-spined stickleback (Gas-terosteus aculeatus) populations. Mol. Ecol. 17, 3565–3582.
cMillan, A.M., Bagley, M.J., Jackson, S.A., Nacci, D.E., 2006. Genetic diver-sity and structure of an estuarine fish (Fundulus heteroclitus) indigenous tosites associated with a highly contaminated urban harbor. Ecotoxicology 15,539–548.
eyer, J.N., Di Giuliuo, R.T., 2003. Heritable adaptation and fitness costs in killifish(Fundulus heteroclitus) inhabiting a polluted estuary. Ecol. Appl. 13, 490–503.
ilinski, M., 2003. The function of mate choice in sticklebacks: optimizing MHCgenetics. J. Fish Biol. 63, 1–16.
urdoch, M.H., Hebert, P.D.N., 1994. Mitochondrial-DNA diversity of brown bull-head from contaminated and relatively pristine sites in the Great Lakes. Environ.Toxicol. Chem. 13, 1281–1289.
unn, A.D., Harvey, J.P., Britton, J.R., Frear, P.A., Cowx, I.G., 2007. Fish, climate andthe Gulf Stream: the influence of abiotic factors on the recruitment success of
cyprinid fishes in lowland rivers. Freshwater Biol. 52, 1576–1586.aks, J.L., Gilbert, M., Virani, M.Z., Watson, R.T., Meteyer, C.U., Rideout, B.A., Shiv-aprasad, H.L., Ahmed, S., Chaudhry, M.J.I., Arshad, M., Mahmood, S., Ali, A., Khan,A.A., 2004. Diclofenac residues as the cause of vulture population decline inPakistan. Nature 427, 630–633.
142– 143 (2013) 264– 271 271
Piry, S., Luikart, G., Cornuet, J.M., 1999. BOTTLENECK: a computer program for detec-ting recent reductions in the effective population size using allele frequencydata. J. Hered. 90, 502–503.
Postma, J.F., Davids, C., 1995. Tolerance induction and life-cycle changes incadmium-exposed Chironomus riparius (Diptera) during consecutive genera-tions. Ecotoxicol. Environ. Saf. 30, 195–202.
Raymond, M., Rousset, F., 1995. Genepop (Version-1.2) – population-genetics soft-ware for exact tests and ecumenicism. J. Hered. 86, 248–249.
Rice, W.R., 1989. Analyzing tables of statistical tests. Evolution 43, 223–225.Roark, S., Brown, K., 1996. Effects of metal contamination from mine tailings on
allozyme distributions of populations of great plains fishes. Environ. Toxicol.Chem. 15, 921–927.
Roark, S.A., Nacci, D., Coiro, L., Champlin, D., Guttman, S.I., 2005. Population geneticstructure of a nonmigratory estuarine fish (Fundulus heteroclitus) across a stronggradient of polychlorinated biphenyl contamination. Environ. Toxicol. Chem. 24,717–725.
Rousset, F., 2008. GENEPOP’007: a complete re-implementation of the GENEPOPsoftware for Windows and Linux. Mol. Ecol. Resour. 8, 103–106.
Sheahan, D.A., Brighty, G.C., Daniel, M., Jobling, S., Harries, J.E., Hurst, M.R., Kennedy,J., Kirby, S.J., Morris, S., Routledge, E.J., Sumpter, J.P., Waldock, M.J., 2002. Reduc-tion in the estrogenic activity of a treated sewage effluent discharge to an Englishriver as a result of a decrease in the concentration of industrially derived sur-factants. Environ. Toxicol. Chem. 21, 515–519.
Shikano, T., Shimada, Y., Herczeg, G., Merila, J., 2010. History vs. habitat type:explaining the genetic structure of European nine-spined stickleback (Pungitiuspungitius) populations. Mol. Ecol. 19, 1147–1161.
Shirley, M.D.F., Sibly, R.M., 1999. Genetic basis of a between-environment trade-off involving resistance to cadmium in Drosophila melanogaster. Evolution 53,826–836.
Tatara, C.P., Mulvey, M., Newman, M.C., 1999. Genetic and demographic responses ofmosquitofish (Gambusia holbrooki) populations exposed to mercury for multiplegenerations. Environ. Toxicol. Chem. 18, 2840–2845.
van Aerle, R., Nolan, M., Jobling, S., Christiansen, L.B., Sumpter, J.P., Tyler, C.R., 2001.Sexual disruption in a second species of wild cyprinid fish (the gudgeon, Gobiogobio) in United Kingdom freshwaters. Environ. Toxicol. Chem. 20, 2841–2847.
Van Oosterhout, C., Hutchinson, W.F., Wills, D.P.M., Shipley, P., 2004. MICRO-CHECKER: software for identifying and correcting genotyping errors inmicrosatellite data. Mol. Ecol. Notes 4, 535–538.
van Straalen, N.M., Timmermans, M., 2002. Genetic variation in toxicant-stressedpopulations: an evaluation of the “genetic erosion” hypothesis. Hum Ecol. RiskAssess. 8, 983–1002.
Whitehead, A., Anderson, S.L., Kuivila, K.M., Roach, J.L., May, B., 2003. Genetic varia-tion among interconnected populations of Catostomus occidentalis: implicationsfor distinguishing impacts of contaminants from biogeographical structuring.Mol. Ecol. 12, 2817–2833.
Williams, A., Milner, N., O’Keeffe, N., Clarke, A., Webb, H., 2009. Environment Agency:River Tees Salmon Action Plan Review.
Williams, L.M., Oleksiak, M.F., 2008. Signatures of selection in natural populationsadapted to chronic pollution. BMC Evol. Biol. 8, 282.
Williams, L.M., Oleksiak, M.F., 2011. Ecologically and evolutionarily important SNPsidentified in natural populations. Mol. Biol. Evol. 28, 1817–1826.
Williams, R.J., Keller, V.D.J., Johnson, A.C., Young, A.R., Holmes, M.G.R., Wells, C.,Gross-Sorokin, M., Benstead, R., 2009. A national risk assessment for intersexin fish arising from steroid estrogens. Environ. Toxicol. Chem. 28, 220–230.
Wirgin, I., Roy, N.K., Loftus, M., Chambers, R.C., Franks, D.G., Hahn, M.E., 2011. Mech-anistic basis of resistance to PCBs in Atlantic tomcod from the Hudson River.
Science 331, 1322–1325.Wirgin, I., Waldman, J.R., 2004. Resistance to contaminants in North American fishpopulations. Mutat. Res.-Fund. Mol. Mutagen. 552, 73–100.
Wootton, R.J., 1976. The Biology of Sticklebacks. Academic Press, London andNew York.