Population assessment and habitat use by marine otter Lontra felina in southern Chile
9
191 © WILDLIFE BIOLOGY · 12:2 (2006) Population assessment and habitat use by marine otter Lontra felina in southern Chile Gonzalo Medina-Vogel, José Luis Bartheld, Ricardo Alvarez Pacheco & Claudio Delgado Rodríguez Medina-Vogel, G., Bartheld, J.L., Pacheco, R.A. & Delgado, R. 2006: Population assessment and habitat use by marine otter Lontra felina in southern Chile. - Wildl. Biol. 12: 191-199. The marine otter Lontra felina lives along the Pacific coast of South America from 6°S to 56°S. A method for estimating marine otter abundance is described and a comparison of the characteristics of the terrestrial habitat of this species in southern Chile is made. From June 1999 to June 2000, we conducted eight hours of observations on one day each month at four study sites. An average of 3.8 observable otters/km were recorded, with significant differences between sites but no systematic trends with regard to season. Observable pups were recorded year-round. Otters spent 80% of their time out of view, engaged in behaviours other than feeding; observable otters were mostly seen feeding. The methodology described is effective for indexing abundances at small geograph- ic scales. The marine otter needs both an aquatic habitat for foraging and a ter- restrial habitat with an abundance of safe shelters, which, in turn, could limit the distribution of the species when human settlers and domestic dogs utilise the terrestrial habitats. Key words: abundance, observable otters, shelters, terrestrial and aquatic habi- tat Gonzalo Medina-Vogel*, José Luis Bartheld**, Ricardo Alvarez Pacheco*** & Claudio Delgado Rodríguez***, Instituto de Ecología y Evolución, Universi- dad Austral de Chile, Casilla 567, Valdivia, Chile - e-mail addresses: gmedina@ unab.cl (Gonzalo Medina-Vogel); [email protected] (José Luis Bartheld); [email protected] (Ricardo Alvarez Pacheco); cdelgado@con servacionmarina.cl (Claudio Delgado Rodríguez) Present addresses: *Escuela de Medicina Veterinaria, Facultad de Ecología y Recursos Naturales, Universidad Nacional Andrés Bello, República 252, Santiago, Chile **Comité Nacional pro Defensa de la Fauna y Flora, Carlos Anwandter 849, Valdivia, Chile ***Irlanda 1802, Valdivia, Chile Corresponing author: Gonzalo Medina-Vogel Received 17 August 2004, accepted 23 December 2004 Associate Editor: Paolo Cavallini Data on distribution, abundance, habitat selection and population trends are an important tool for animal con- servation and management of species of interest. These data can aid species protection and habitat conservation programmes, which are dependent on information and evidence at regional, national and international levels.
-
Upload
independent -
Category
Documents
-
view
1 -
download
0
Transcript of Population assessment and habitat use by marine otter Lontra felina in southern Chile
191© WILDLIFE BIOLOGY · 12:2 (2006)
Population assessment and habitat use by marine otter Lontra felina in southern Chile
Gonzalo Medina-Vogel, José Luis Bartheld, Ricardo Alvarez Pacheco & Claudio Delgado Rodríguez
Medina-Vogel, G., Bartheld, J.L., Pacheco, R.A. & Delgado, R. 2006: Population assessment and habitat use by marine otter Lontra felina in southern Chile. - Wildl. Biol. 12: 191-199.
The marine otter Lontra felina lives along the Pacific coast of South America from 6°S to 56°S. A method for estimating marine otter abundance is described and a comparison of the characteristics of the terrestrial habitat of this species in southern Chile is made. From June 1999 to June 2000, we conducted eight hours of observations on one day each month at four study sites. An average of 3.8 observable otters/km were recorded, with significant differences between sites but no systematic trends with regard to season. Observable pups were recorded year-round. Otters spent 80% of their time out of view, engaged in behaviours other than feeding; observable otters were mostly seen feeding. The methodology described is effective for indexing abundances at small geograph-ic scales. The marine otter needs both an aquatic habitat for foraging and a ter-restrial habitat with an abundance of safe shelters, which, in turn, could limit the distribution of the species when human settlers and domestic dogs utilise the terrestrial habitats.
Key words: abundance, observable otters, shelters, terrestrial and aquatic habi-tat
Gonzalo Medina-Vogel*, José Luis Bartheld**, Ricardo Alvarez Pacheco*** & Claudio Delgado Rodríguez***, Instituto de Ecología y Evolución, Universi-dad Austral de Chile, Casilla 567, Valdivia, Chile - e-mail addresses: [email protected] (Gonzalo Medina-Vogel); [email protected] (José Luis Bartheld); [email protected] (Ricardo Alvarez Pacheco); cdelgado@con servacionmarina.cl (Claudio Delgado Rodríguez)
Present addresses:*Escuela de Medicina Veterinaria, Facultad de Ecología y Recursos Naturales, Universidad Nacional Andrés Bello, República 252, Santiago, Chile**Comité Nacional pro Defensa de la Fauna y Flora, Carlos Anwandter 849, Valdivia, Chile***Irlanda 1802, Valdivia, Chile
Corresponing author: Gonzalo Medina-Vogel
Received 17 August 2004, accepted 23 December 2004
Associate Editor: Paolo Cavallini
Data on distribution, abundance, habitat selection and population trends are an important tool for animal con-servation and management of species of interest. These
data can aid species protection and habitat conservation programmes, which are dependent on information and evidence at regional, national and international levels.
14368 WB2_2006-v3.indd 191 13/06/06 10:32:13
192 © WILDLIFE BIOLOGY · 12:2 (2006)
Such data are also essential for research programmes, either to provide a safeguard against projects that threat-en important species or to evaluate the impact of mea-sures taken (Reuther et al. 2000, Gese 2001). In order to make the most efficient use of such information, data should be obtained in a standardised and optimal form following a scientific assessment. The benefits of stan-dardised collection include increased efficiency, where information on species distribution, abundance and be-haviour can be made available together with other rele-vant ecological and biological information, thereby pro-viding a more holistic perspective for management. Furthermore, efficiency could be improved if data were prepared in a comparable and transformable form, since personnel and financial resources in nature conservation are limited (Reuther et al. 2000).
Among carnivores, Mustelidae (otters), Phocidae (true seals), Otariidae (fur seals and sea lions) and Odobenidae (walruses) are the only species which are exclusively as- sociated with aquatic habitats. Two species of otters have an obligatory marine existence: the sea otter Enhydra lutris and the marine otter Lontra felina (Estes 1989). Of these, the marine otter has most recently adapted to marine living conditions; it is also the smallest otter in its genus (Estes 1989). However, it is poorly known along virtually all imaginable ecological dimensions (see Larivière 1998 for a review) and, therefore the develop-ment of appropriate management or conservation poli-cies is difficult. Marine otters typically inhabit coasts with exposed rocky shores, covering areas approximate-ly 30 m inland and 150 m offshore along the Pacific coast (Castilla & Bahamondes 1979, Ostfeld et al. 1989). Their distribution ranges from 6°S (near Chimbote, Peru) to 56°S (at Cape Horn and Isla de los Estados, Argentina; Larivière 1998, Parera 2002). In Chile, latitudinal dif-ferences in marine otter population abundance have been documented, ranging from 0.04 otter/km in the Beagle Channel (55°S) to 6.9 otter/km on Chiloe Island (42°S), and 1.0-4.4 otter/km north of 29°S (Castilla 1982, Rozzi & Torres-Mura 1990, Ebensperger & Castilla 1991, Siel-feld 1992, Medina 1995b). However, previous studies have encountered problems in assessing animal distri-bution, abundance, behaviour and the relative impor-tance of aquatic and terrestrial habitats due to difficul-ties in recognising individual animals, the lack of sexu-al dimorphism, and the long time that otters are obscured by caves, rocks and other terrestrial structures (Eben-sperger & Castilla 1991, Sielfeld 1992, Ostfeld et al. 1989, Medina 1995b, Larivière 1998). Our study there-fore had two objectives: 1) to develop a method for esti-mating the abundance of the marine otter within a region, and 2) to assess its use of terrestrial habitat.
Material and methods
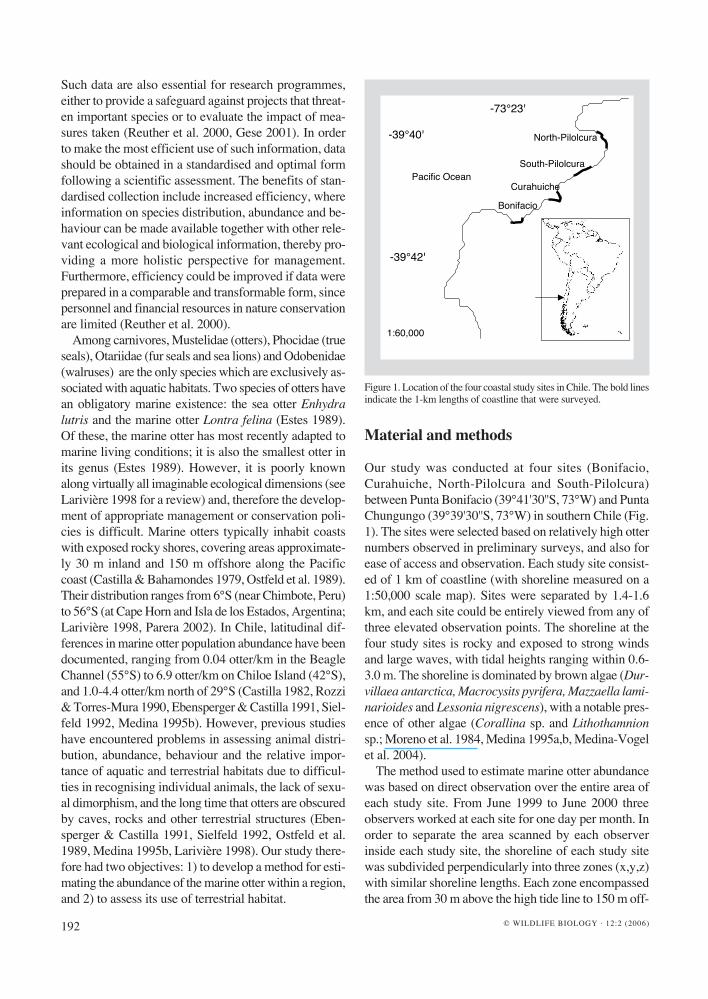
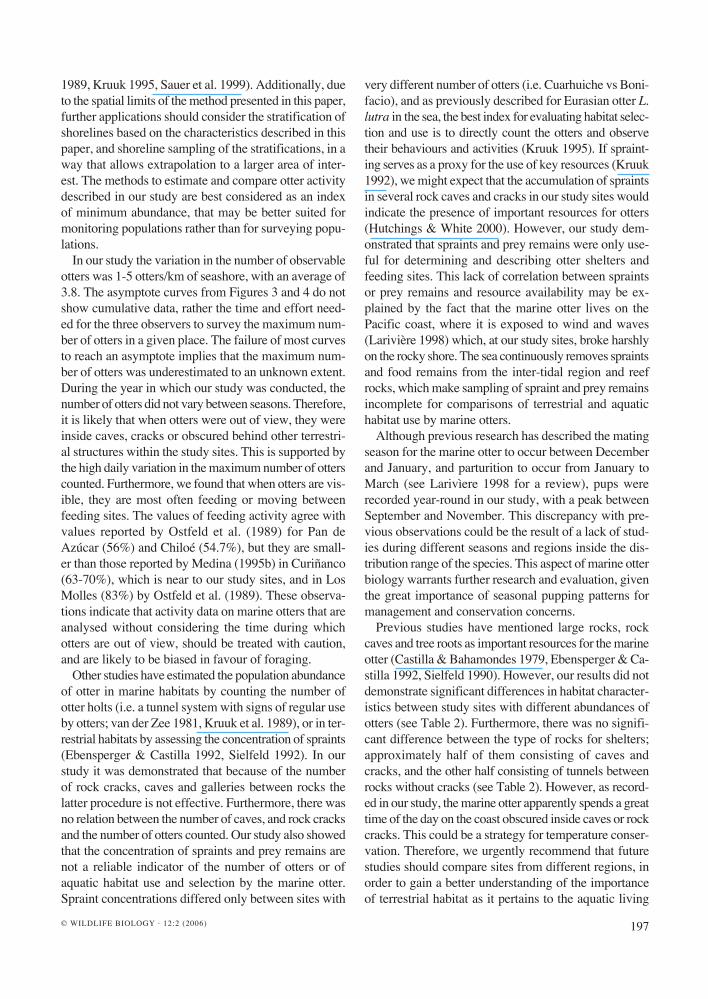
Our study was conducted at four sites (Bonifacio, Curahuiche, North-Pilolcura and South-Pilolcura) between Punta Bonifacio (39°41'30''S, 73°W) and Punta Chungungo (39°39'30''S, 73°W) in southern Chile (Fig. 1). The sites were selected based on relatively high otter numbers observed in preliminary surveys, and also for ease of access and observation. Each study site consist-ed of 1 km of coastline (with shoreline measured on a 1:50,000 scale map). Sites were separated by 1.4-1.6 km, and each site could be entirely viewed from any of three elevated observation points. The shoreline at the four study sites is rocky and exposed to strong winds and large waves, with tidal heights ranging within 0.6-3.0 m. The shoreline is dominated by brown algae (Dur-villaea antarctica, Macrocysits pyrifera, Mazzaella lami-narioides and Lessonia nigrescens), with a notable pres-ence of other algae (Corallina sp. and Lithothamnion sp.; Moreno et al. 1984, Medina 1995a,b, Medina-Vogel et al. 2004).
The method used to estimate marine otter abundance was based on direct observation over the entire area of each study site. From June 1999 to June 2000 three observers worked at each site for one day per month. In order to separate the area scanned by each observer inside each study site, the shoreline of each study site was subdivided perpendicularly into three zones (x,y,z) with similar shoreline lengths. Each zone encompassed the area from 30 m above the high tide line to 150 m off-
-39°42'
-39°40'
-73°23'
Pacific Ocean
North-Pilolcura
South-Pilolcura
Bonifacio
Curahuiche
1:60,000
Figure 1. Location of the four coastal study sites in Chile. The bold lines indicate the 1-km lengths of coastline that were surveyed.
14368 WB2_2006-v3.indd 192 13/06/06 10:32:14
193© WILDLIFE BIOLOGY · 12:2 (2006)
shore and was delineated using natural markers (i.e. reef rocks, rocks or cracks), so that each observer counted and registered the otters and their activities only inside his observation zone. Observations using 10 × 50 bin-oculars were made simultaneously in each zone, during 2-minute surveys with an interval of eight minutes, over two continuous 4-hour periods (i.e. morning and after-noon) per day (method adapted from Estes et al. 1982, Ostfeld et al. 1989). Because of weather conditions, this procedure was conducted every 28-45 days on 10 occa-sions, by the same three observers, resulting in a total of four days of observation per field trip. At the study sites, observers hid in the vegetation above the rocky shore-line. The otters did not display any avoidance or fear behaviours related to the presence of observers. Any observation which involved walking along the coast (e.g. measurements of habitat characteristics and collection of spraints and prey remains) were made after the obser-vation days. As marine otters have no discernible body markings or sexual dimorphism, and can not be count-ed at night or during the time they are inside caves or rock cracks (Castilla 1982, Ebensperger & Castilla 1991, Sielfeld 1992, Medina 1995b Larivière 1998), our meth-od could not assess total otter numbers at any one time. Estimates and comparisons of otters were therefore deter-mined by counting otters seen in the water or on rocks during daylight hours only. The otters that were count-ed and observed were termed 'observable otters'. There-fore, our study compared the maximum number of ob-servable otters seen by the three observers during one simultaneous scanning (i.e. two minutes of simultane-ous scanning during the 8-hour observation period). It did not correspond to the cumulative number of otters counted. As otters below the surface were not recorded, a small bias could be inherent in our scanning technique. To reduce this bias we scanned the ocean surface at a rate slow enough for every point within the observed zones to be observed, for a period longer than the dura-tion of the longest described dive (about 65 seconds), and 2-4 times the duration of an average dive (25-44 seconds; Ostfeld et al. 1989, Medina 1995b). Otters observed dur-ing the scanning of the sea surface were classified as adults or pups, and their activity was described as grooming, feeding, travelling, resting or socialising (i.e. two or more otters interacting; Shimek & Monk 1977). As only one case was recorded, otters feeding together were classified as feeding, and an otter was considered to be resting when it was observed to be stationary on a rock.
The habitat characteristics of each study site were eval-uated using 10-m wide transects perpendicular to the shore from 30 m above the high tide line to the sea sur-face, with a distance between transects of 100 m, mak-
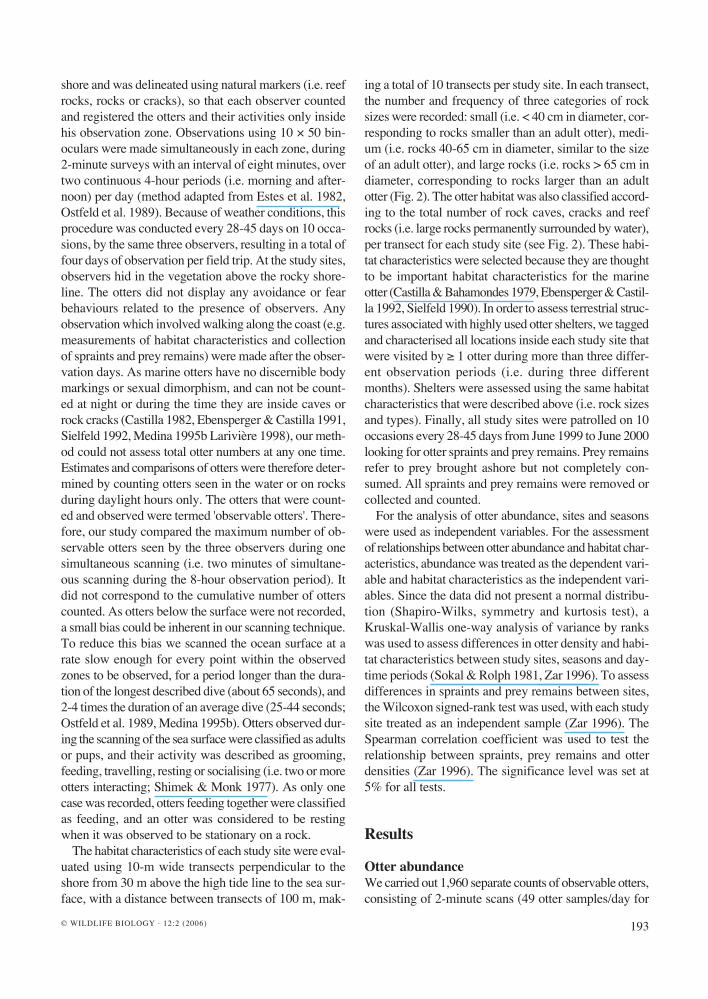
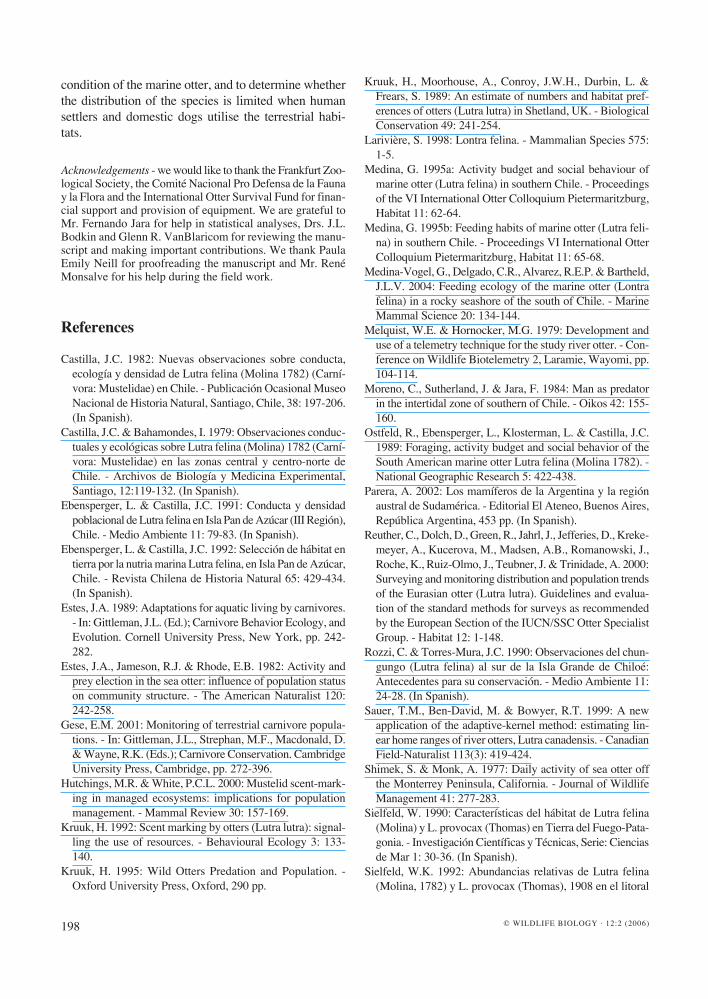
ing a total of 10 transects per study site. In each transect, the number and frequency of three categories of rock sizes were recorded: small (i.e. < 40 cm in diameter, cor-responding to rocks smaller than an adult otter), medi-um (i.e. rocks 40-65 cm in diameter, similar to the size of an adult otter), and large rocks (i.e. rocks > 65 cm in diameter, corresponding to rocks larger than an adult otter (Fig. 2). The otter habitat was also classified accord-ing to the total number of rock caves, cracks and reef rocks (i.e. large rocks permanently surrounded by water), per transect for each study site (see Fig. 2). These habi-tat characteristics were selected because they are thought to be important habitat characteristics for the marine otter (Castilla & Bahamondes 1979, Ebensperger & Castil-la 1992, Sielfeld 1990). In order to assess terrestrial struc-tures associated with highly used otter shelters, we tagged and characterised all locations inside each study site that were visited by ≥ 1 otter during more than three differ-ent observation periods (i.e. during three different months). Shelters were assessed using the same habitat characteristics that were described above (i.e. rock sizes and types). Finally, all study sites were patrolled on 10 occasions every 28-45 days from June 1999 to June 2000 looking for otter spraints and prey remains. Prey remains refer to prey brought ashore but not completely con-sumed. All spraints and prey remains were removed or collected and counted.
For the analysis of otter abundance, sites and seasons were used as independent variables. For the assessment of relationships between otter abundance and habitat char-acteristics, abundance was treated as the dependent vari-able and habitat characteristics as the independent vari-ables. Since the data did not present a normal distribu-tion (Shapiro-Wilks, symmetry and kurtosis test), a Kruskal-Wallis one-way analysis of variance by ranks was used to assess differences in otter density and habi-tat characteristics between study sites, seasons and day-time periods (Sokal & Rolph 1981, Zar 1996). To assess differences in spraints and prey remains between sites, the Wilcoxon signed-rank test was used, with each study site treated as an independent sample (Zar 1996). The Spearman correlation coefficient was used to test the relationship between spraints, prey remains and otter densities (Zar 1996). The significance level was set at 5% for all tests.
Results
Otter abundanceWe carried out 1,960 separate counts of observable otters, consisting of 2-minute scans (49 otter samples/day for
14368 WB2_2006-v3.indd 193 13/06/06 10:32:14
194 © WILDLIFE BIOLOGY · 12:2 (2006)
10 months) during eight hours of daytime with a total of 320 hours of observation. One or more otters were recorded 1,764 (90%) times. The otter’s activity sched-ule was 54% feeding, 28% traveling, 8% grooming, 6% socialising and 4% resting with no differences between seasons (H3 = 2.6, P = 0.5). In summer more otters were recorded during the first four hours of observation (morn-ing) than during the ensuing four hours (afternoon; H3 = 5.3, P = 0.02). The mean distribution was 3.8 otters/km, of which 18% were pups born during the year (Table 1).
Table 1. Estimated mean maximum abundance of the marine otter during 10 months of observation at the four study sites in Chile.
Study site
Range (otters/km)
Mean maximum (otters/km) Total
meanmaximumAdults Cubs Adults (SD) Pups (SD)
Bonifacio 1-5 0-2 2.4 (0.5) 0.4 (0.7) 2.8Curahuiche 2-5 0-4 3.4 (0.4) 1.5 (1.4) 4.8South-Pilolcura 2-4 0-1 2.7 (0.2) 0.4 (0.5) 3.1North-Pilolcura 2-5 0-2 3.7 (0.2) 0.5 (0.7) 4.2Total 1-5 0-4 3.1 (0.2) 0.7 (1.0) 3.8
Large rocks with cracks Reef rocks
Large, medium and small rocks without cracks Cave with otter spraints
Figure 2. Rock sizes and types (i.e. with or without cracks), and a cave with otter spraints. (See 'Material and methods').
14368 WB2_2006-v3.indd 194 13/06/06 10:32:15
195© WILDLIFE BIOLOGY · 12:2 (2006)
0 1 2 3 4 5 6 7 8 90123456
DAILY OBSERVATION TIME (HOURS)
0 1 2 3 4 5 6 7 8 90123456
0 1 2 3 4 5 6 7 8 90123456
0 1 2 3 4 5 6 7 8 90123456
A)
B)
C)
D)
OTT
ERS
/ KM
0 1 2 3 4 5 6 7 8 90123456
0 1 2 3 4 5 6 7 8 901234
56
0 1 2 3 4 5 6 7 8 90123456
0 1 2 3 4 5 6 7 8 90123456 A)
B)
C)
D)
DAILY OBSERVATION TIME (HOURS)
OTT
ERS
/ KM
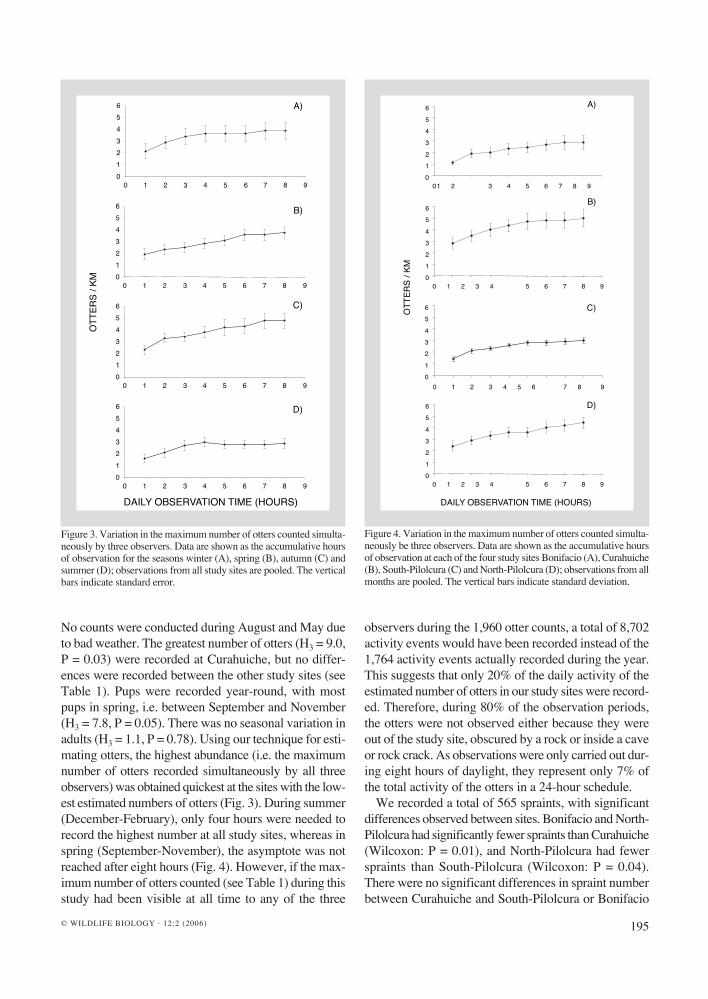
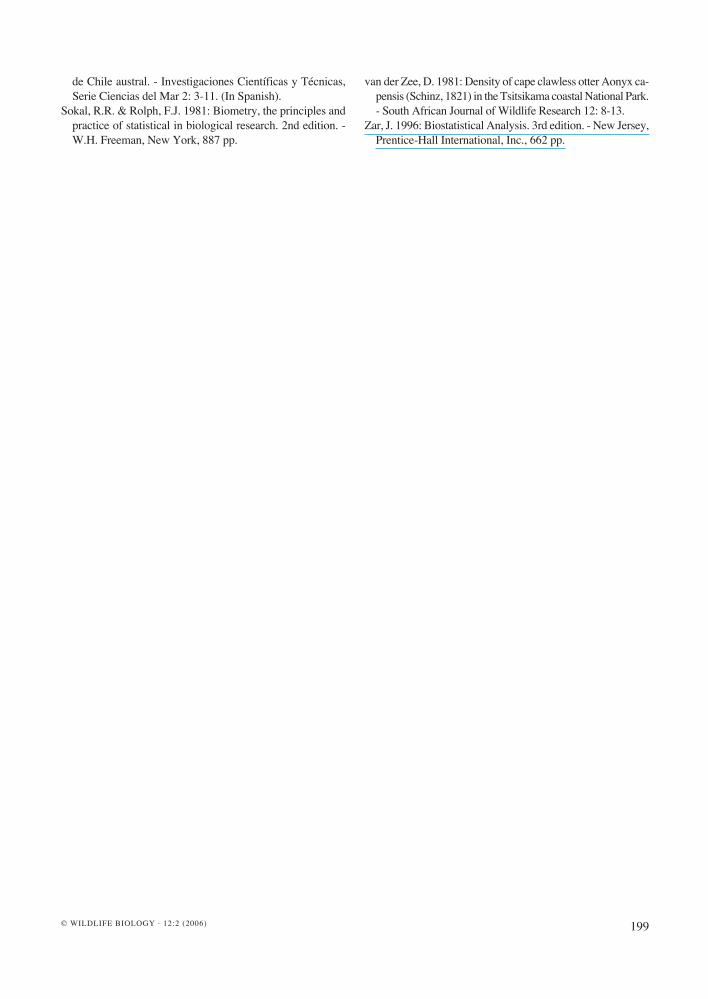
Figure 4. Variation in the maximum number of otters counted simulta-neously be three observers. Data are shown as the accumulative hours of observation at each of the four study sites Bonifacio (A), Curahuiche (B), South-Pilolcura (C) and North-Pilolcura (D); observations from all months are pooled. The vertical bars indicate standard deviation.
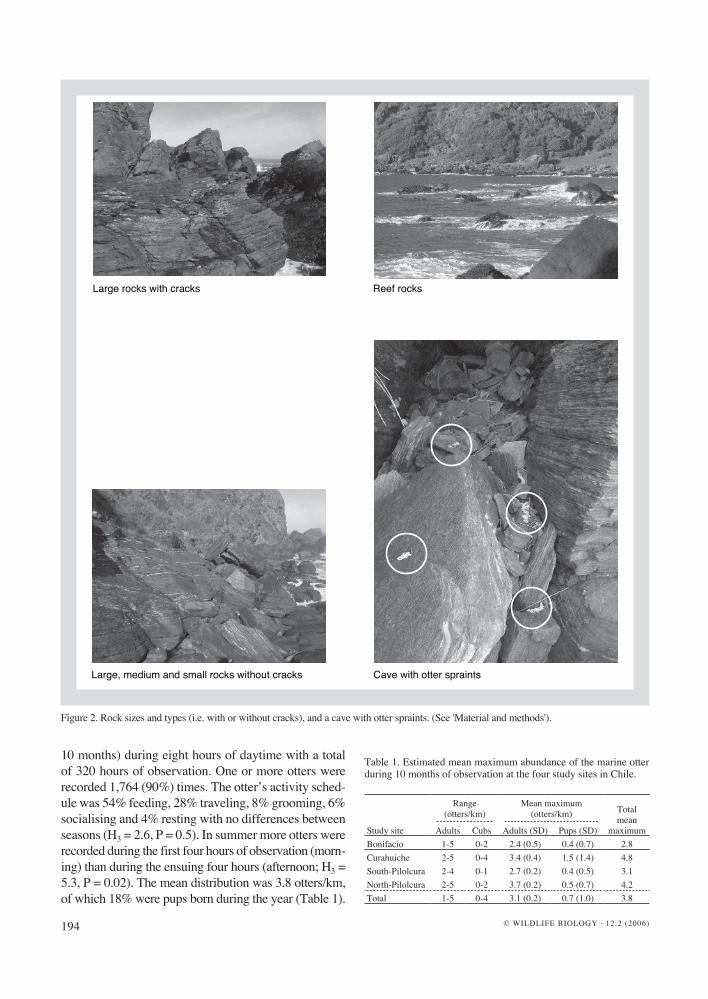
Figure 3. Variation in the maximum number of otters counted simulta-neously by three observers. Data are shown as the accumulative hours of observation for the seasons winter (A), spring (B), autumn (C) and summer (D); observations from all study sites are pooled. The vertical bars indicate standard error.
No counts were conducted during August and May due to bad weather. The greatest number of otters (H3 = 9.0, P = 0.03) were recorded at Curahuiche, but no differ-ences were recorded between the other study sites (see Table 1). Pups were recorded year-round, with most pups in spring, i.e. between September and November (H3 = 7.8, P = 0.05). There was no seasonal variation in adults (H3 = 1.1, P = 0.78). Using our technique for esti-mating otters, the highest abundance (i.e. the maximum number of otters recorded simultaneously by all three observers) was obtained quickest at the sites with the low-est estimated numbers of otters (Fig. 3). During summer (December-February), only four hours were needed to record the highest number at all study sites, whereas in spring (September-November), the asymptote was not reached after eight hours (Fig. 4). However, if the max-imum number of otters counted (see Table 1) during this study had been visible at all time to any of the three
observers during the 1,960 otter counts, a total of 8,702 activity events would have been recorded instead of the 1,764 activity events actually recorded during the year. This suggests that only 20% of the daily activity of the estimated number of otters in our study sites were record-ed. Therefore, during 80% of the observation periods, the otters were not observed either because they were out of the study site, obscured by a rock or inside a cave or rock crack. As observations were only carried out dur-ing eight hours of daylight, they represent only 7% of the total activity of the otters in a 24-hour schedule.
We recorded a total of 565 spraints, with significant differences observed between sites. Bonifacio and North-Pilolcura had significantly fewer spraints than Curahuiche (Wilcoxon: P = 0.01), and North-Pilolcura had fewer spraints than South-Pilolcura (Wilcoxon: P = 0.04). There were no significant differences in spraint number between Curahuiche and South-Pilolcura or Bonifacio
14368 WB2_2006-v3.indd 195 13/06/06 10:32:16
196 © WILDLIFE BIOLOGY · 12:2 (2006)
and North-Pilolcura. Data pooled from all sites did not show a significant difference between seasons. However, there were significant differences in numbers of prey remains found between study sites: South-Pilolcura had the highest amount of prey remains (425 ± 44.9; SD) and North-Pilolcura the lowest (30 ± 4; SD). Both of these sites were significantly different to all the other sites (Wilcoxon: P < 0.01). Additionally, Curahuiche and Bonifacio had significantly fewer prey remains than South-Pilolcura (Wilcoxon: P = 0.02). There was no cor-relation between either the estimated number of otters or pups versus the amount of spraints and prey remains.
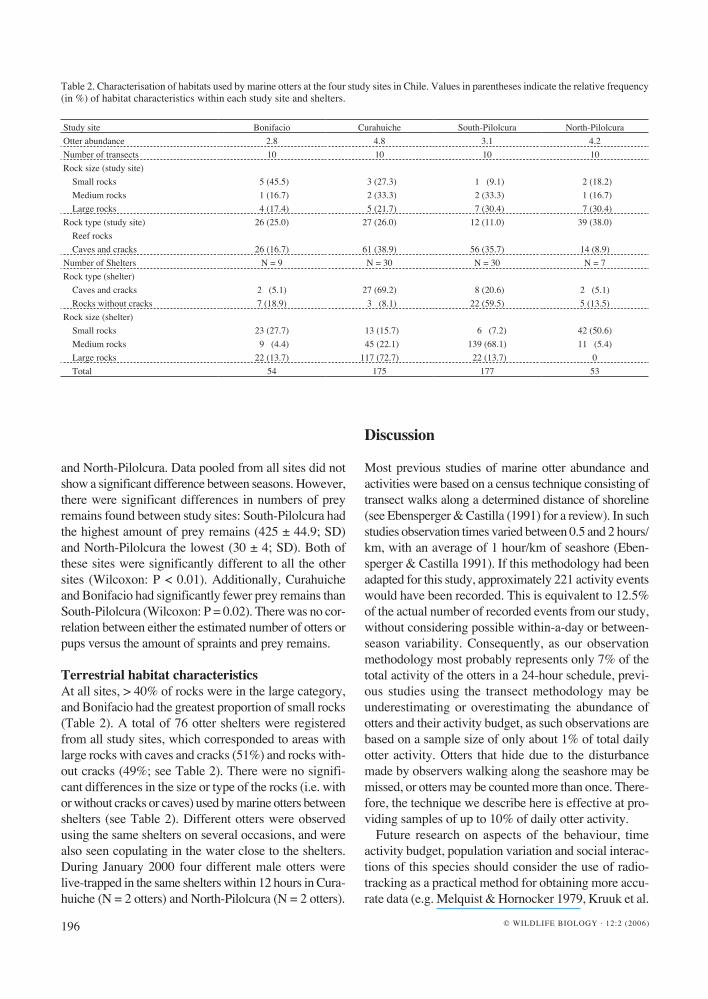
Terrestrial habitat characteristics At all sites, > 40% of rocks were in the large category, and Bonifacio had the greatest proportion of small rocks (Table 2). A total of 76 otter shelters were registered from all study sites, which corresponded to areas with large rocks with caves and cracks (51%) and rocks with-out cracks (49%; see Table 2). There were no signifi-cant differences in the size or type of the rocks (i.e. with or without cracks or caves) used by marine otters between shelters (see Table 2). Different otters were observed using the same shelters on several occasions, and were also seen copulating in the water close to the shelters. During January 2000 four different male otters were live-trapped in the same shelters within 12 hours in Cura-huiche (N = 2 otters) and North-Pilolcura (N = 2 otters).
Discussion
Most previous studies of marine otter abundance and activities were based on a census technique consisting of transect walks along a determined distance of shoreline (see Ebensperger & Castilla (1991) for a review). In such studies observation times varied between 0.5 and 2 hours/km, with an average of 1 hour/km of seashore (Eben-sperger & Castilla 1991). If this methodology had been adapted for this study, approximately 221 activity events would have been recorded. This is equivalent to 12.5% of the actual number of recorded events from our study, without considering possible within-a-day or between-season variability. Consequently, as our observation methodology most probably represents only 7% of the total activity of the otters in a 24-hour schedule, previ-ous studies using the transect methodology may be underestimating or overestimating the abundance of otters and their activity budget, as such observations are based on a sample size of only about 1% of total daily otter activity. Otters that hide due to the disturbance made by observers walking along the seashore may be missed, or otters may be counted more than once. There-fore, the technique we describe here is effective at pro-viding samples of up to 10% of daily otter activity.
Future research on aspects of the behaviour, time activity budget, population variation and social interac-tions of this species should consider the use of radio-tracking as a practical method for obtaining more accu-rate data (e.g. Melquist & Hornocker 1979, Kruuk et al.
Table 2. Characterisation of habitats used by marine otters at the four study sites in Chile. Values in parentheses indicate the relative frequency (in %) of habitat characteristics within each study site and shelters.
Study site Bonifacio Curahuiche South-Pilolcura North-PilolcuraOtter abundance 2.8 4.8 3.1 4.2Number of transects 10 10 10 10Rock size (study site)
Small rocks 5 (45.5) 3 (27.3) 1 (9.1) 2 (18.2)Medium rocks 1 (16.7) 2 (33.3) 2 (33.3) 1 (16.7)Large rocks 4 (17.4) 5 (21.7) 7 (30.4) 7 (30.4)
Rock type (study site) 26 (25.0) 27 (26.0) 12 (11.0) 39 (38.0)Reef rocksCaves and cracks 26 (16.7) 61 (38.9) 56 (35.7) 14 (8.9)
Number of Shelters N = 9 N = 30 N = 30 N = 7Rock type (shelter)
Caves and cracks 2 (5.1) 27 (69.2) 8 (20.6) 2 (5.1)Rocks without cracks 7 (18.9) 3 (8.1) 22 (59.5) 5 (13.5)
Rock size (shelter)Small rocks 23 (27.7) 13 (15.7) 6 (7.2) 42 (50.6)Medium rocks 9 (4.4) 45 (22.1) 139 (68.1) 11 (5.4)Large rocks 22 (13.7) 117 (72.7) 22 (13.7) 0Total 54 175 177 53
14368 WB2_2006-v3.indd 196 13/06/06 10:32:16
197© WILDLIFE BIOLOGY · 12:2 (2006)
1989, Kruuk 1995, Sauer et al. 1999). Additionally, due to the spatial limits of the method presented in this paper, further applications should consider the stratification of shorelines based on the characteristics described in this paper, and shoreline sampling of the stratifications, in a way that allows extrapolation to a larger area of inter-est. The methods to estimate and compare otter activity described in our study are best considered as an index of minimum abundance, that may be better suited for monitoring populations rather than for surveying popu-lations.
In our study the variation in the number of observable otters was 1-5 otters/km of seashore, with an average of 3.8. The asymptote curves from Figures 3 and 4 do not show cumulative data, rather the time and effort need-ed for the three observers to survey the maximum num-ber of otters in a given place. The failure of most curves to reach an asymptote implies that the maximum num-ber of otters was underestimated to an unknown extent. During the year in which our study was conducted, the number of otters did not vary between seasons. Therefore, it is likely that when otters were out of view, they were inside caves, cracks or obscured behind other terrestri-al structures within the study sites. This is supported by the high daily variation in the maximum number of otters counted. Furthermore, we found that when otters are vis-ible, they are most often feeding or moving between feeding sites. The values of feeding activity agree with values reported by Ostfeld et al. (1989) for Pan de Azúcar (56%) and Chiloé (54.7%), but they are small-er than those reported by Medina (1995b) in Curiñanco (63-70%), which is near to our study sites, and in Los Molles (83%) by Ostfeld et al. (1989). These observa-tions indicate that activity data on marine otters that are analysed without considering the time during which otters are out of view, should be treated with caution, and are likely to be biased in favour of foraging.
Other studies have estimated the population abundance of otter in marine habitats by counting the number of otter holts (i.e. a tunnel system with signs of regular use by otters; van der Zee 1981, Kruuk et al. 1989), or in ter-restrial habitats by assessing the concentration of spraints (Ebensperger & Castilla 1992, Sielfeld 1992). In our study it was demonstrated that because of the number of rock cracks, caves and galleries between rocks the latter procedure is not effective. Furthermore, there was no relation between the number of caves, and rock cracks and the number of otters counted. Our study also showed that the concentration of spraints and prey remains are not a reliable indicator of the number of otters or of aquatic habitat use and selection by the marine otter. Spraint concentrations differed only between sites with
very different number of otters (i.e. Cuarhuiche vs Boni-facio), and as previously described for Eurasian otter L. lutra in the sea, the best index for evaluating habitat selec-tion and use is to directly count the otters and observe their behaviours and activities (Kruuk 1995). If spraint-ing serves as a proxy for the use of key resources (Kruuk 1992), we might expect that the accumulation of spraints in several rock caves and cracks in our study sites would indicate the presence of important resources for otters (Hutchings & White 2000). However, our study dem-onstrated that spraints and prey remains were only use-ful for determining and describing otter shelters and feeding sites. This lack of correlation between spraints or prey remains and resource availability may be ex-plained by the fact that the marine otter lives on the Pacific coast, where it is exposed to wind and waves (Larivière 1998) which, at our study sites, broke harshly on the rocky shore. The sea continuously removes spraints and food remains from the inter-tidal region and reef rocks, which make sampling of spraint and prey remains incomplete for comparisons of terrestrial and aquatic habitat use by marine otters.
Although previous research has described the mating season for the marine otter to occur between December and January, and parturition to occur from January to March (see Larivìere 1998 for a review), pups were recorded year-round in our study, with a peak between September and November. This discrepancy with pre-vious observations could be the result of a lack of stud-ies during different seasons and regions inside the dis-tribution range of the species. This aspect of marine otter biology warrants further research and evaluation, given the great importance of seasonal pupping patterns for management and conservation concerns.
Previous studies have mentioned large rocks, rock caves and tree roots as important resources for the marine otter (Castilla & Bahamondes 1979, Ebensperger & Ca-stilla 1992, Sielfeld 1990). However, our results did not demonstrate significant differences in habitat character-istics between study sites with different abundances of otters (see Table 2). Furthermore, there was no signifi-cant difference between the type of rocks for shelters; approximately half of them consisting of caves and cracks, and the other half consisting of tunnels between rocks without cracks (see Table 2). However, as record-ed in our study, the marine otter apparently spends a great time of the day on the coast obscured inside caves or rock cracks. This could be a strategy for temperature conser-vation. Therefore, we urgently recommend that future studies should compare sites from different regions, in order to gain a better understanding of the importance of terrestrial habitat as it pertains to the aquatic living
14368 WB2_2006-v3.indd 197 13/06/06 10:32:17
198 © WILDLIFE BIOLOGY · 12:2 (2006)
condition of the marine otter, and to determine whether the distribution of the species is limited when human settlers and domestic dogs utilise the terrestrial habi-tats.
Acknowledgements - we would like to thank the Frankfurt Zoo-logical Society, the Comité Nacional Pro Defensa de la Fauna y la Flora and the International Otter Survival Fund for finan-cial support and provision of equipment. We are grateful to Mr. Fernando Jara for help in statistical analyses, Drs. J.L. Bodkin and Glenn R. VanBlaricom for reviewing the manu-script and making important contributions. We thank Paula Emily Neill for proofreading the manuscript and Mr. René Monsalve for his help during the field work.
References
Castilla, J.C. 1982: Nuevas observaciones sobre conducta, ecología y densidad de Lutra felina (Molina 1782) (Carnívora: Mustelidae) en Chile. - Publicación Ocasional Museo Nacional de Historia Natural, Santiago, Chile, 38: 197-206. (In Spanish).
Castilla, J.C. & Bahamondes, I. 1979: Observaciones conduc-tuales y ecológicas sobre Lutra felina (Molina) 1782 (Carnívora: Mustelidae) en las zonas central y centro-norte de Chile. Archivos de Biología y Medicina Experimental, Santiago, 12:119-132. (In Spanish).
Ebensperger, L. & Castilla, J.C. 1991: Conducta y densidad poblacional de Lutra felina en Isla Pan de Azúcar (III Región), Chile. - Medio Ambiente 11: 79-83. (In Spanish).
Ebensperger, L. & Castilla, J.C. 1992: Selección de hábitat en tierra por la nutria marina Lutra felina, en Isla Pan de Azúcar, Chile. - Revista Chilena de Historia Natural 65: 429-434. (In Spanish).
Estes, J.A. 1989: Adaptations for aquatic living by carnivores. - In: Gittleman, J.L. (Ed.); Carnivore Behavior Ecology, and Evolution. Cornell University Press, New York, pp. 242-282.
Estes, J.A., Jameson, R.J. & Rhode, E.B. 1982: Activity and prey election in the sea otter: influence of population status on community structure. - The American Naturalist 120: 242-258.
Gese, E.M. 2001: Monitoring of terrestrial carnivore popula-tions. - In: Gittleman, J.L., Strephan, M.F., Macdonald, D. & Wayne, R.K. (Eds.); Carnivore Conservation. Cambridge University Press, Cambridge, pp. 272-396.
Hutchings, M.R. & White, P.C.L. 2000: Mustelid scent-mark-ing in managed ecosystems: implications for population management. - Mammal Review 30: 157-169.
Kruuk, H. 1992: Scent marking by otters (Lutra lutra): signal-ling the use of resources. - Behavioural Ecology 3: 133-140.
Kruuk, H. 1995: Wild Otters Predation and Population. - Oxford University Press, Oxford, 290 pp.
Kruuk, H., Moorhouse, A., Conroy, J.W.H., Durbin, L. & Frears, S. 1989: An estimate of numbers and habitat pref-erences of otters (Lutra lutra) in Shetland, UK. - Biological Conservation 49: 241-254.
Larivière, S. 1998: Lontra felina. - Mammalian Species 575: 1-5.
Medina, G. 1995a: Activity budget and social behaviour of marine otter (Lutra felina) in southern Chile. - Proceedings of the VI International Otter Colloquium Pietermaritzburg, Habitat 11: 62-64.
Medina, G. 1995b: Feeding habits of marine otter (Lutra feli-na) in southern Chile. - Proceedings VI International Otter Colloquium Pietermaritzburg, Habitat 11: 65-68.
Medina-Vogel, G., Delgado, C.R., Alvarez, R.E.P. & Bartheld, J.L.V. 2004: Feeding ecology of the marine otter (Lontra felina) in a rocky seashore of the south of Chile. - Marine Mammal Science 20: 134-144.
Melquist, W.E. & Hornocker, M.G. 1979: Development and use of a telemetry technique for the study river otter. - Con-ference on Wildlife Biotelemetry 2, Laramie, Wayomi, pp. 104-114.
Moreno, C., Sutherland, J. & Jara, F. 1984: Man as predator in the intertidal zone of southern of Chile. - Oikos 42: 155-160.
Ostfeld, R., Ebensperger, L., Klosterman, L. & Castilla, J.C. 1989: Foraging, activity budget and social behavior of the South American marine otter Lutra felina (Molina 1782). - National Geographic Research 5: 422-438.
Parera, A. 2002: Los mamíferos de la Argentina y la región austral de Sudamérica. - Editorial El Ateneo, Buenos Aires, República Argentina, 453 pp. (In Spanish).
Reuther, C., Dolch, D., Green, R., Jahrl, J., Jefferies, D., Kreke-meyer, A., Kucerova, M., Madsen, A.B., Romanowski, J., Roche, K., Ruiz-Olmo, J., Teubner, J. & Trinidade, A. 2000: Surveying and monitoring distribution and population trends of the Eurasian otter (Lutra lutra). Guidelines and evalua-tion of the standard methods for surveys as recommended by the European Section of the IUCN/SSC Otter Specialist Group. - Habitat 12: 1-148.
Rozzi, C. & Torres-Mura, J.C. 1990: Observaciones del chun-gungo (Lutra felina) al sur de la Isla Grande de Chiloé: Antecedentes para su conservación. - Medio Ambiente 11: 24-28. (In Spanish).
Sauer, T.M., Ben-David, M. & Bowyer, R.T. 1999: A new application of the adaptive-kernel method: estimating lin-ear home ranges of river otters, Lutra canadensis. - Canadian Field-Naturalist 113(3): 419-424.
Shimek, S. & Monk, A. 1977: Daily activity of sea otter off the Monterrey Peninsula, California. - Journal of Wildlife Management 41: 277-283.
Sielfeld, W. 1990: Características del hábitat de Lutra felina (Molina) y L. provocax (Thomas) en Tierra del Fuego-Pata-gonia. Investigación Científicas y Técnicas, Serie: Ciencias de Mar 1: 30-36. (In Spanish).
Sielfeld, W.K. 1992: Abundancias relativas de Lutra felina (Molina, 1782) y L. provocax (Thomas), 1908 en el litoral
14368 WB2_2006-v3.indd 198 13/06/06 10:32:17
199© WILDLIFE BIOLOGY · 12:2 (2006)
de Chile austral. Investigaciones Científicas y Técnicas, Serie Ciencias del Mar 2: 3-11. (In Spanish).
Sokal, R.R. & Rolph, F.J. 1981: Biometry, the principles and practice of statistical in biological research. 2nd edition. - W.H. Freeman, New York, 887 pp.
van der Zee, D. 1981: Density of cape clawless otter Aonyx ca-pensis (Schinz, 1821) in the Tsitsikama coastal National Park. - South African Journal of Wildlife Research 12: 8-13.
Zar, J. 1996: Biostatistical Analysis. 3rd edition. - New Jersey, Prentice-Hall International, Inc., 662 pp.
14368 WB2_2006-v3.indd 199 13/06/06 10:32:17