Pomegranate (Punica granatum) supplements: Authenticity, antioxidant and polyphenol composition
Upload
khangminh22Category
view
2download
0
molecules
Article
Pomegranate Seed Oil and Bitter Melon Extract AffectFatty Acids Composition and Metabolism in HepaticTissue in Rats
Agnieszka Stawarska *, Tomasz Lepionka , Agnieszka Białek , Martyna Gawryjołek andBarbara Bobrowska-Korczak
Department of Bromatology, Faculty of Pharmacy, Medical University of Warsaw, Banacha 1, 02-097 Warsaw, Poland;[email protected] (T.L.); [email protected] (A.B.); [email protected] (M.G.);[email protected] (B.B.-K.)* Correspondence: [email protected]; Tel.: +48-22-5720785
Academic Editors: Ryszard Amarowicz and Adriano Costa de CamargoReceived: 15 October 2020; Accepted: 9 November 2020; Published: 10 November 2020
�����������������
Abstract: Pomegranate seed oil (PSO) and bitter melon dried fruits (BME) are used as naturalremedies in folk medicine and as dietary supplements. However, the exact mechanism of theirbeneficial action is not known. The aim of study was to assess how the diet supplementation with PSOand/or with an aqueous solution of Momordica charantia affects the metabolism of fatty acids, fatty acidscomposition and the level of prostaglandin E2 (PGE2) in rat liver. Animals (Sprague-Dawley femalerats, n = 48) were divide into four equinumerous groups and fed as a control diet or experimentaldiets supplemented with PSO, BME or both PSO and BME for 21 weeks. Fatty acids were determinedusing gas chromatography with flame ionization detection. PSO added to the diet increased therumenic acid content (p < 0.0001) and increased accumulation of n-6 fatty acids (p = 0.0001) in hepatictissue. Enrichment of the diet either with PSO or with BME reduced the activity of ∆6-desaturase(D6D) (p = 0.0019), whereas the combination of those dietary factors only slightly increased theeffect. Applied dietary supplements significantly reduced the PGE2 level (p = 0.0021). No significantintensification of the influence on the investigated parameters resulted from combined application ofPSO and BME. PSO and BME have potential health-promoting properties because they influencefatty acids composition and exhibit an inhibiting effect on the activity of desaturases and thus theycontribute to the reduction in the metabolites of arachidonic acid (especially PGE2).
Keywords: pomegranate seed oil; bitter melon; fatty acids; prostaglandin E2; ∆6 and ∆5-desaturase
1. Introduction
It is widely known that plant products being the components of varied diet can play a role in theprevention and treatment of many diseases. They contain various bioactive compounds which possessenormous medicinal value. However, the exact mechanisms of their action are often unknown.
Punica granatum L. (Lythraceae) is one of the oldest edible fruits which has a long history as amedicinal fruit. Since antiquity, pomegranate has been known for its numerous therapeutic propertiesthat influence health. It has been used in traditional folk medicine in Asia, South America and EastAfrica [1]. Recently, results of studies indicate the beneficial properties of pomegranate seed oil (PSO),which has been linked with treatment and prevention of cancer, cardiovascular disease, Alzheimer’sdisease and diabetes [2–7]. Current research indicates that the most therapeutical PSO constituent isthe beneficial fatty acids (FA) composition. Low concentrations of saturated and monounsaturated FA(SFA and MUFA, respectively) and high content of polyunsaturated FA (PUFA) make it desirable in thehuman diet [8,9]. PSO exerts a hypoglycemic effect, which may result from the presence of punicic acid
Molecules 2020, 25, 5232; doi:10.3390/molecules25225232 www.mdpi.com/journal/molecules

Molecules 2020, 25, 5232 2 of 19
(PA)—one of the conjugated linolenic acids (CLnA) [3,4]. PSO as a rich source of PUFA is especiallysusceptible for lipid peroxidation, as previously indicated [9], which justifies the need of its couplingwith antioxidant agents in diet.
Momordica charantia L. (Cucurbitaceae) is commonly known as bitter melon, bitter apple, bittercucumber, bitter gourd, balsam pear or karela and is widely cultivated in tropical areas including partsof Asia, Africa, South America and Caribbean [10,11]. Compounds isolated from the fruit and seedsof bitter melon plant that are believed to contribute to its hypoglycemic activity include charantin(a steroid glycoside) and polypeptide “p” or plant insulin (a 166-residue insulin mimetic peptide).Bitter melon is also known to contain additional glycosides such as mormordin, vitamin C, carotenoids,flavanoids, polyphenols and α-eleostearic acid [11–13]. Bitter melon is extensively used in Chineseand Indian medicine as anti-diabetic, anti-inflammatory, anti-microbial, anti-tumor, anti-leukemic [10]but fruits are also consumed as a foodstuff. Dried fruits of bitter melon are available as bitter melon‘tea’ ready to prepare the bitter melon fruits aqueous extract. This is the most common manner of bittermelon fruits consumption.
PSO and bitter melon fruits are used not only in traditional folk medicine but also as popular dietarysupplements, which are recommended as anti-atherogenic and anti-carcinogenic agents. In presentexperiment combined use of PSO and bitter melon extract (BME) is be justified by the antioxidantproperties of BME which has been shown previously [14] and also is to reflect the multi-supplementationof diet with PSO and bitter melon. The exact mechanism of their action is under our investigation butone of the proposed pathways is their modulation of fatty acids hepatic metabolism.
Liver plays an essential role in lipid metabolism. Bile, which facilitates the digestion and intestinalabsorption of lipids, is produced by the liver. Moreover, this organ integrates the synthesis andmetabolism of plasma lipoproteins. Moreover, the fatty acid synthesis and oxidation take place in liver,as well as the formation of ketone bodies from fatty acids. Transformation of fatty acids in hepatictissue depends, among others, from the activity of desaturases, which are pivotal enzymes involved infatty acids hepatic metabolism. Desaturases can insert double bonds into different positions of carbonchain, but not higher than ∆9. Their action is fundamental for metabolic routes of n-3 and n-6 fattyacids, but also for metabolic transformations of conjugated linoleic acids (CLA). Our previous resultsrevealed that the neoplastic process has a stimulating effect on the activity of ∆6-desaturase, whereaspresence of CLA in the animals’ diet decreased ∆6-desaturase activity, which is one of mechanisms ofanticarcinogenic activity of CLA [15]. Many studies demonstrated relationship between desaturaseactivity and certain diseases such as insulin resistance, coronary artery disease and obesity. The resultsare often inconclusive and require further research. However, new components of the diet thatwill positively affect the metabolism of fatty acids are still being sought. We previously indicated,that dietary supplementation with PSO and/or BME increased the CLA concentration in serum of ratsin physiological conditions [14]. The obtained results lead us to in-depth research on the influence ofPSO and BME on fatty acid liver metabolism.
The exact aim of this study was to assess how the dietary supplementation with PSO and/or BMEaffects the fatty acids composition in the liver and its microsomal fraction (fraction responsible for fattyacids metabolism). The levels of PGE2 and the activity of key enzymes catalyzing lipids metabolism(desaturases) were measured. It was also examined whether or not a joint supplementation intensifiedthe effect.
2. Results
2.1. Fatty Acids Profile and Characteristics of Applied Dietary Supplements
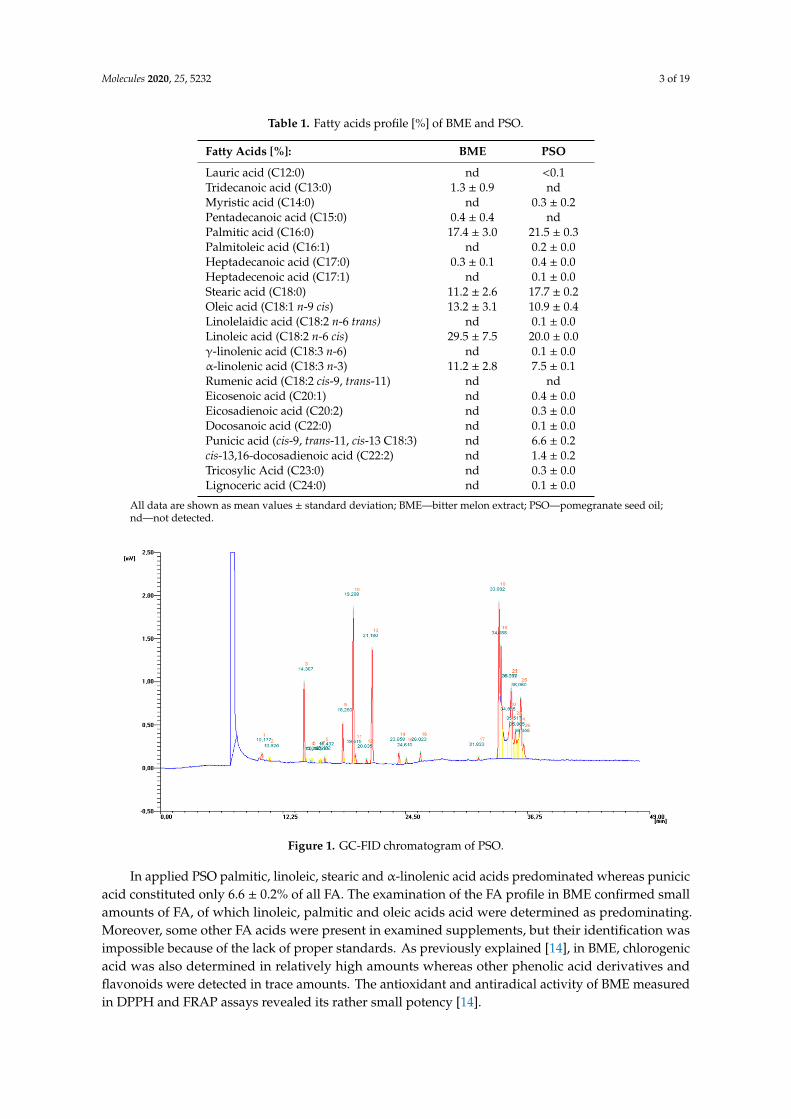
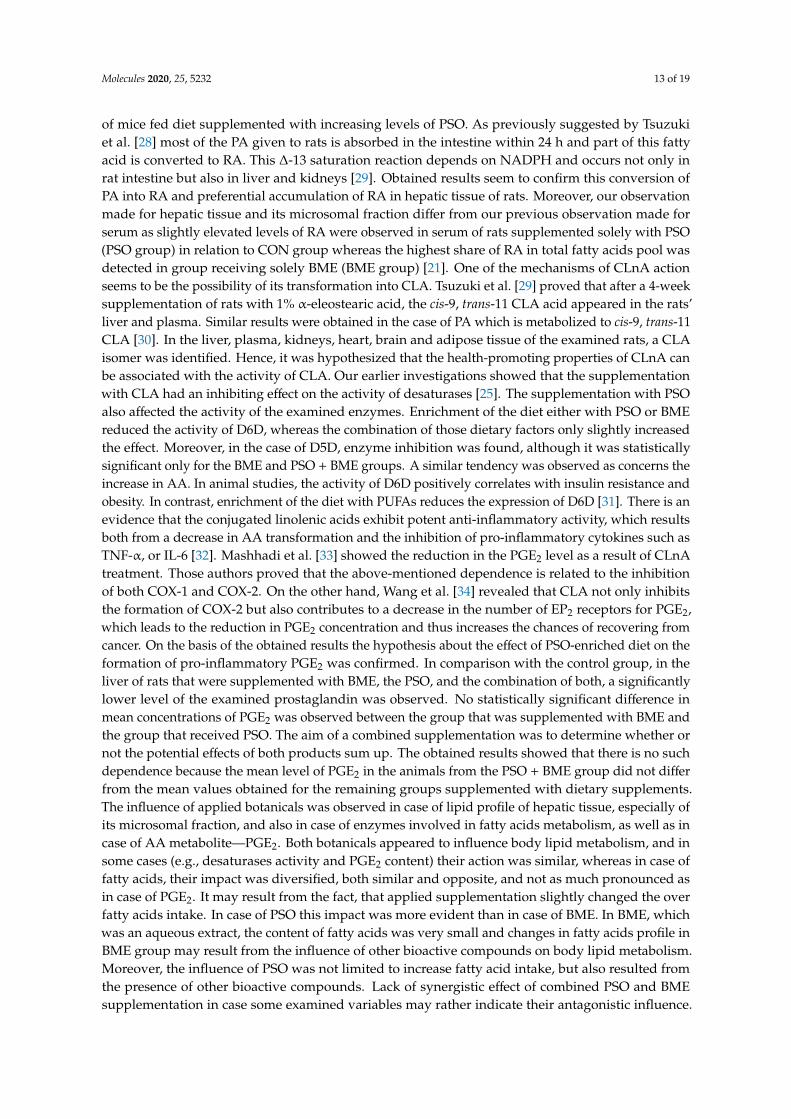
Fatty acids profiles [%] of applied dietary supplements administrated to rats are given in Table 1.Fatty acids profile were determined using gas chromatography with flame ionization detection.Exemplary GC-FID chromatogram of PSO is given in Figure 1.
Molecules 2020, 25, 5232 3 of 19
Table 1. Fatty acids profile [%] of BME and PSO.
Fatty Acids [%]: BME PSO
Lauric acid (C12:0) nd <0.1Tridecanoic acid (C13:0) 1.3 ± 0.9 ndMyristic acid (C14:0) nd 0.3 ± 0.2Pentadecanoic acid (C15:0) 0.4 ± 0.4 ndPalmitic acid (C16:0) 17.4 ± 3.0 21.5 ± 0.3Palmitoleic acid (C16:1) nd 0.2 ± 0.0Heptadecanoic acid (C17:0) 0.3 ± 0.1 0.4 ± 0.0Heptadecenoic acid (C17:1) nd 0.1 ± 0.0Stearic acid (C18:0) 11.2 ± 2.6 17.7 ± 0.2Oleic acid (C18:1 n-9 cis) 13.2 ± 3.1 10.9 ± 0.4Linolelaidic acid (C18:2 n-6 trans) nd 0.1 ± 0.0Linoleic acid (C18:2 n-6 cis) 29.5 ± 7.5 20.0 ± 0.0γ-linolenic acid (C18:3 n-6) nd 0.1 ± 0.0α-linolenic acid (C18:3 n-3) 11.2 ± 2.8 7.5 ± 0.1Rumenic acid (C18:2 cis-9, trans-11) nd ndEicosenoic acid (C20:1) nd 0.4 ± 0.0Eicosadienoic acid (C20:2) nd 0.3 ± 0.0Docosanoic acid (C22:0) nd 0.1 ± 0.0Punicic acid (cis-9, trans-11, cis-13 C18:3) nd 6.6 ± 0.2cis-13,16-docosadienoic acid (C22:2) nd 1.4 ± 0.2Tricosylic Acid (C23:0) nd 0.3 ± 0.0Lignoceric acid (C24:0) nd 0.1 ± 0.0
All data are shown as mean values ± standard deviation; BME—bitter melon extract; PSO—pomegranate seed oil;nd—not detected.
Molecules 2020, 25, x FOR PEER REVIEW 3 of 18
Figure 1. GC-FID chromatogram of PSO.
Table 1. Fatty acids profile [%] of BME and PSO.
Fatty Acids [%]: BME PSO Lauric acid (C12:0) nd <0.1 Tridecanoic acid (C13:0) 1.3 ± 0.9 nd Myristic acid (C14:0) nd 0.3 ± 0.2 Pentadecanoic acid (C15:0) 0.4 ± 0.4 nd Palmitic acid (C16:0) 17.4 ± 3.0 21.5 ± 0.3 Palmitoleic acid (C16:1) nd 0.2 ± 0.0 Heptadecanoic acid (C17:0) 0.3 ± 0.1 0.4 ± 0.0 Heptadecenoic acid (C17:1) nd 0.1 ± 0.0 Stearic acid (C18:0) 11.2 ± 2.6 17.7 ± 0.2 Oleic acid (C18:1 n-9 cis) 13.2 ± 3.1 10.9 ± 0.4 Linolelaidic acid (C18:2 n-6 trans) nd 0.1 ± 0.0 Linoleic acid (C18:2 n-6 cis) 29.5 ± 7.5 20.0 ± 0.0 γ-linolenic acid (C18:3 n-6) nd 0.1 ± 0.0 α-linolenic acid (C18:3 n-3) 11.2 ± 2.8 7.5 ± 0.1 Rumenic acid (C18:2 cis-9, trans-11) nd nd Eicosenoic acid (C20:1) nd 0.4 ± 0.0 Eicosadienoic acid (C20:2) nd 0.3 ± 0.0 Docosanoic acid (C22:0) nd 0.1 ± 0.0 Punicic acid (cis-9, trans-11, cis-13 C18:3) nd 6.6 ± 0.2 cis-13,16-docosadienoic acid (C22:2) nd 1.4 ± 0.2 Tricosylic Acid (C23:0) nd 0.3 ± 0.0 Lignoceric acid (C24:0) nd 0.1 ± 0.0
All data are shown as mean values ± standard deviation; BME—bitter melon extract; PSO—pomegranate seed oil; nd—not detected.
In applied PSO palmitic, linoleic, stearic and α-linolenic acid acids predominated whereas punicic acid constituted only 6.6 ± 0.2% of all FA. The examination of the FA profile in BME confirmed small amounts of FA, of which linoleic, palmitic and oleic acids acid were determined as predominating. Moreover, some other FA acids were present in examined supplements, but their identification was impossible because of the lack of proper standards. As previously explained [14], in BME, chlorogenic acid was also determined in relatively high amounts whereas other phenolic
Figure 1. GC-FID chromatogram of PSO.
In applied PSO palmitic, linoleic, stearic and α-linolenic acid acids predominated whereas punicicacid constituted only 6.6 ± 0.2% of all FA. The examination of the FA profile in BME confirmed smallamounts of FA, of which linoleic, palmitic and oleic acids acid were determined as predominating.Moreover, some other FA acids were present in examined supplements, but their identification wasimpossible because of the lack of proper standards. As previously explained [14], in BME, chlorogenicacid was also determined in relatively high amounts whereas other phenolic acid derivatives andflavonoids were detected in trace amounts. The antioxidant and antiradical activity of BME measuredin DPPH and FRAP assays revealed its rather small potency [14].

Molecules 2020, 25, 5232 4 of 19
2.2. Liver Weight and Fat Content in Experimental Groups
No differences in food and fluid intake were observed among the investigated groups (data notshown) but applied dietary modification influenced liver mass and fat content, without any impact onrelative liver mass (Figure 2). PSO supplementation decreased liver mass, as mean liver mass in thePSO group was significantly (p = 0.0042) lower than in CON and BME groups (Figure 2A). However,this dependence was not reflected in relative liver mass (p > 0.05) (Figure 2B). Results concerning bodyweight have been given previously [14]. The introduction of BME into the diet of rats significantlyincreased fat content in the livers of the BME group (p = 0.0069), and in case of PSO, which wasan additional dietary fat source incorporated into the diet of PSO and PSO + BME groups, similartendency was observed (Figure 2C).
Molecules 2020, 25, x FOR PEER REVIEW 4 of 19
acid derivatives and flavonoids were detected in trace amounts. The antioxidant and antiradical activity of BME measured in DPPH and FRAP assays revealed its rather small potency [14].
2.2. Liver Weight and Fat Content in Experimental Groups
No differences in food and fluid intake were observed among the investigated groups (data not shown) but applied dietary modification influenced liver mass and fat content, without any impact on relative liver mass (Figure 2). PSO supplementation decreased liver mass, as mean liver mass in the PSO group was significantly (p = 0.0042) lower than in CON and BME groups (Figure 2A). However, this dependence was not reflected in relative liver mass (p > 0.05) (Figure 2B). Results concerning body weight have been given previously [14]. The introduction of BME into the diet of rats significantly increased fat content in the livers of the BME group (p = 0.0069), and in case of PSO, which was an additional dietary fat source incorporated into the diet of PSO and PSO + BME groups, similar tendency was observed (Figure 2C).
(A)
(B)
ba
ba,b
0.00
1.00
2.00
3.00
4.00
5.00
6.00
7.00
8.00
CON PSO BME PSO+BME
liver
mas
s[g]
0.00
0.50
1.00
1.50
2.00
2.50
3.00
3.50
CON PSO BME PSO+BME
rela
tive
liver
mas
s[%
]
Figure 2. Cont.

Molecules 2020, 25, 5232 5 of 19Molecules 2020, 25, x FOR PEER REVIEW 5 of 19
(C)
Figure 2. Liver mass (A), relative liver mass (B) and fat content [%] (C) in rats of experimental groups. CON—control group; PSO—group receiving PSO in the amount of 0.15 mL/day; BME—group receiving BME ad libitum; PSO + BME—group receiving PSO in the amount of 0.15 mL/day and BME ad libitum. All data are shown as mean values ± standard deviation of data obtained from all animals (n = 12) in each group. Values with a different letter index are significantly different from each other (p ≤ 0.05) in post-hoc RIR Tukey test.
2.3. Fatty Acids Profile in Liver
In the lipid fraction extracted from the liver samples, we have detected and identified 30 FA (Figure 3), and we estimated the percentage share of each fatty acid in the total fatty acids’ pool (Table 2). The fatty acid profile in liver of experimental animals, diversified according to applied dietary supplementation, is shown in Table 2. The saturated fatty acids (SFA) share in the total fatty acids pool was significant, as it constituted more than 40% of all fatty acids in each dietary group. Among all SFA, palmitic and stearic acids were present in the highest amount, and we did not observe any difference in their share between groups (Table 2). Dietary supplementation with PSO resulted in a decrease in the content of pentadecanoic (C15:0), heptadecanoic (C17:0) and heneicosanoic (C21:0) fatty acids in the PSO group in comparison to the CON group. We observed similar effects in the PSO + BME group. In the BME group effects were predominantly opposed, as the contents of lauric (C12:0) and myristic (C14:0) acids were lower, and heptadecanoic (C17:0) share was higher in comparison to the PSO group. Despite some differences in the SFA profile, there was no difference in the total SFA content among the groups. As far as monounsaturated fatty acids (MUFA) are concerned, except oleic acid (C18:1 n-9 cis), they were present in liver of the experimental animals in rather small amounts (Table 2). MUFA constituted about 8% of the total fatty acid pool in the all groups, and we did not observe any difference in their share among groups. Dietary supplementation with PSO resulted in the lowest level of elaidic acid (C18:1 n-9 trans) in the PSO group. PSO administration resulted in the lowering share of heptadecenoic acid (C17:1), but significant difference was observed only in the PSO + BME group. The polyunsaturated fatty acid (PUFA) share in the total fatty acids profile was significant, as they constituted 43.5–45.5% of all fatty acids, depending on the experimental group. We observed significantly higher levels of the total PUFA content in the groups PSO and PSO + BME in comparison with the CON group (Table 2). As far as n-3 PUFA are concerned, simultaneous administration of PSO and BME resulted in the elevation of eicosatrienoic acid (C20:3 n-3) in relation to the PSO and CON group. On the contrary, applied dietary supplementation resulted in lower docosahexaenoic (C22:6 n-3) levels in all experimental groups compared with the CON group, but only PSO effect was statistically significant. As far as n-6 PUFA are concerned, we did not observe
a
a,b ba,b
0.00
0.50
1.00
1.50
2.00
2.50
3.00
3.50
4.00
4.50
CON PSO BME PSO+BME
fat c
onte
nt [%
]
Figure 2. Liver mass (A), relative liver mass (B) and fat content [%] (C) in rats of experimental groups.CON—control group; PSO—group receiving PSO in the amount of 0.15 mL/day; BME—group receivingBME ad libitum; PSO + BME—group receiving PSO in the amount of 0.15 mL/day and BME ad libitum.All data are shown as mean values ± standard deviation of data obtained from all animals (n = 12)in each group. Values with a different letter index are significantly different from each other (p ≤ 0.05)in post-hoc RIR Tukey test.
2.3. Fatty Acids Profile in Liver
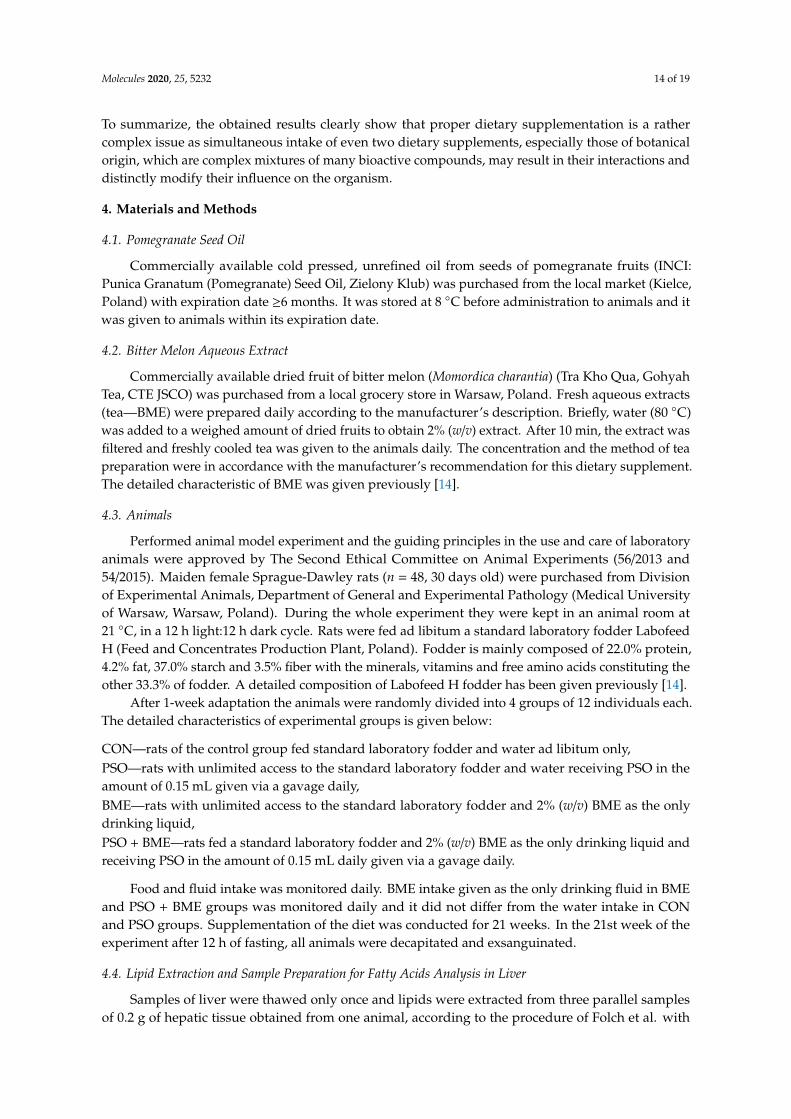
In the lipid fraction extracted from the liver samples, we have detected and identified 30 FA(Figure 3), and we estimated the percentage share of each fatty acid in the total fatty acids’ pool(Table 2). The fatty acid profile in liver of experimental animals, diversified according to applieddietary supplementation, is shown in Table 2. The saturated fatty acids (SFA) share in the total fattyacids pool was significant, as it constituted more than 40% of all fatty acids in each dietary group.Among all SFA, palmitic and stearic acids were present in the highest amount, and we did not observeany difference in their share between groups (Table 2). Dietary supplementation with PSO resulted ina decrease in the content of pentadecanoic (C15:0), heptadecanoic (C17:0) and heneicosanoic (C21:0)fatty acids in the PSO group in comparison to the CON group. We observed similar effects in the PSO+ BME group. In the BME group effects were predominantly opposed, as the contents of lauric (C12:0)and myristic (C14:0) acids were lower, and heptadecanoic (C17:0) share was higher in comparison tothe PSO group. Despite some differences in the SFA profile, there was no difference in the total SFAcontent among the groups. As far as monounsaturated fatty acids (MUFA) are concerned, except oleicacid (C18:1 n-9 cis), they were present in liver of the experimental animals in rather small amounts(Table 2). MUFA constituted about 8% of the total fatty acid pool in the all groups, and we did notobserve any difference in their share among groups. Dietary supplementation with PSO resulted inthe lowest level of elaidic acid (C18:1 n-9 trans) in the PSO group. PSO administration resulted in thelowering share of heptadecenoic acid (C17:1), but significant difference was observed only in the PSO +
BME group. The polyunsaturated fatty acid (PUFA) share in the total fatty acids profile was significant,as they constituted 43.5–45.5% of all fatty acids, depending on the experimental group. We observedsignificantly higher levels of the total PUFA content in the groups PSO and PSO + BME in comparisonwith the CON group (Table 2). As far as n-3 PUFA are concerned, simultaneous administration of PSOand BME resulted in the elevation of eicosatrienoic acid (C20:3 n-3) in relation to the PSO and CONgroup. On the contrary, applied dietary supplementation resulted in lower docosahexaenoic (C22:6 n-3)levels in all experimental groups compared with the CON group, but only PSO effect was statisticallysignificant. As far as n-6 PUFA are concerned, we did not observe one tendency for all examinedfatty acids. PSO significantly increased GLA (C18:3 n-6) in the total fatty acids pool. On the contrary,dietary supplementation with BME resulted in considerably higher levels of C20:3 n-6 fatty acid, but itdecreased levels of C18:2 n-6 trans in the PSO + BME group (statistically significant). Regarding AA

Molecules 2020, 25, 5232 6 of 19
(C20:4 n-6), we observed a statistically significant elevated share in the livers of all experimental groupsin relation to the CON group (Table 1). We did not observe any differences in the levels of linolenic acidamong the experimental groups. Regarding conjugated fatty acids, no CLnA isomers were detectedin any of the experimental groups, while one of the CLA isomers—rumenic acid (RA), was detectedin liver of all groups. RA content in the groups supplemented with PSO, which did not contain anyCLA isomers, significantly exceeded its content in both CON and BME group, where its share wasvestigial. What is more, the RA content tends to increase in the group PSO + BME compared with thePSO group. As far as a total percentage share of n-3 PUFA, we observed that applied supplementationtends to reduce the n-3 content in the all experimental groups in relation to CON, but only in the PSOgroup was this difference statistically significant. Conversely, both PSO and BME seem to significantlyincrease the total share of n-6 PUFA in comparison with the CON group. The n-6/n-3 ratio was alsodetermined; we observed, that applied supplementation resulted in a statistically significant increasein the n-6/n-3 ratio in all experimental groups.
Molecules 2020, 25, x FOR PEER REVIEW 6 of 19
one tendency for all examined fatty acids. PSO significantly increased GLA (C18:3 n-6) in the total fatty acids pool. On the contrary, dietary supplementation with BME resulted in considerably higher levels of C20:3 n-6 fatty acid, but it decreased levels of C18:2 n-6 trans in the PSO + BME group (statistically significant). Regarding AA (C20:4 n-6), we observed a statistically significant elevated share in the livers of all experimental groups in relation to the CON group (Table 1). We did not observe any differences in the levels of linolenic acid among the experimental groups. Regarding conjugated fatty acids, no CLnA isomers were detected in any of the experimental groups, while one of the CLA isomers—rumenic acid (RA), was detected in liver of all groups. RA content in the groups supplemented with PSO, which did not contain any CLA isomers, significantly exceeded its content in both CON and BME group, where its share was vestigial. What is more, the RA content tends to increase in the group PSO + BME compared with the PSO group. As far as a total percentage share of n-3 PUFA, we observed that applied supplementation tends to reduce the n-3 content in the all experimental groups in relation to CON, but only in the PSO group was this difference statistically significant. Conversely, both PSO and BME seem to significantly increase the total share of n-6 PUFA in comparison with the CON group. The n-6/n-3 ratio was also determined; we observed, that applied supplementation resulted in a statistically significant increase in the n-6/n-3 ratio in all experimental groups.
Figure 3. Exemplary GC-FID chromatogram of fatty acid profile in liver.
Table 2. Fatty acids profile in liver of experimental groups.
Fatty Acids [%] CON (n = 12) PSO (n = 12) BME (n = 12) PSO + BME(n = 12) p Value SFA Lauric acid (C12:0) 0.10 ± 0.10 a,b 0.09 ± 0.06 b 0.03 ± 0.01 a 0.04 ± 0.01 a,b 0.0052 #
Tridecanoic acid (C13:0) 0.01 ± 0.01 0.05 ± 0.05 0.03 ± 0.03 0.01 ± 0.00 n.s. Myristic acid (C14:0) 0.21 ± 0.11 b 0.20 ± 0.07 b 0.13 ± 0.02 a 0.13 ± 0.01 a 0.0017 # Pentadecanoic acid (C15:0) 0.22 ± 0.06 c 0.15 ± 0.02 a 0.17 ± 0.01 a,b,c 0.17 ± 0.02 a,b 0.0003 # Palmitic acid (C16:0) 17.8 ± 0.8 17.7 ± 0.9 17.6 ± 0.7 18.1 ± 0.8 n.s. Heptadecanoic acid (C17:0) 0.70 ± 0.07 c 0.56 ± 0.06 a 0.64 ± 0.05 b,c 0.61 ± 0.07 a,b <0.0001 * Stearic acid (C18:0) 22.0 ± 1.7 22.7 ± 1.3 22.6 ± 1.4 23.0 ± 1.3 n.s. Heneicosanoic acid (C21:0) 0.16 ± 0.03 c 0.14 ± 0.02 a 0.14 ± 0.01 a,b 0.15 ± 0.03 a,b,c 0.0133 # Docosanoic acid (C22:0) 0.02 ± 0.01 0.02 ± 0.01 0.02 ± 0.01 0.02 ± 0.01 n.s. Tricosylic Acid (C23:0) 0.05 ± 0.03 0.04 ± 0.01 0.03 ± 0.01 0.03 ± 0.02 n.s. Lignoceric acid (C24:0) 0.15 ± 0.03 0.09 ± 0.07 0.17 ± 0.03 0.16 ± 0.02 n.s. Σ SFA 41.3 ± 1.2 41.8 ± 0.7 41.6 ± 1.3 42.4 ± 0.9 n.s. MUFA Pentadecenoic acid (C15:1) 0.02 ± 0.01 0.02 ± 0.01 0.02 ± 0.00 0.02 ± 0.00 n.s. Palmitoleic acid (C16:1) 0.72 ± 0.23 0.68 ± 0.10 0.69 ± 0.17 0.64 ± 0.13 n.s. Heptadecenoic acid (C17:1) 0.13 ± 0.01 b 0.11 ± 0.01 a,b 0.12 ± 0.02 a,b 0.11 ± 0.02 a 0.0242 *
Figure 3. Exemplary GC-FID chromatogram of fatty acid profile in liver.
Table 2. Fatty acids profile in liver of experimental groups.
Fatty Acids [%] CON (n = 12) PSO (n = 12) BME (n = 12) PSO + BME (n = 12) p Value
SFALauric acid (C12:0) 0.10 ± 0.10 a,b 0.09 ± 0.06 b 0.03 ± 0.01 a 0.04 ± 0.01 a,b 0.0052 #
Tridecanoic acid (C13:0) 0.01 ± 0.01 0.05 ± 0.05 0.03 ± 0.03 0.01 ± 0.00 n.s.Myristic acid (C14:0) 0.21 ± 0.11 b 0.20 ± 0.07 b 0.13 ± 0.02 a 0.13 ± 0.01 a 0.0017 #
Pentadecanoic acid (C15:0) 0.22 ± 0.06 c 0.15 ± 0.02 a 0.17 ± 0.01 a,b,c 0.17 ± 0.02 a,b 0.0003 #
Palmitic acid (C16:0) 17.8 ± 0.8 17.7 ± 0.9 17.6 ± 0.7 18.1 ± 0.8 n.s.Heptadecanoic acid (C17:0) 0.70 ± 0.07 c 0.56 ± 0.06 a 0.64 ± 0.05 b,c 0.61 ± 0.07 a,b <0.0001 *Stearic acid (C18:0) 22.0 ± 1.7 22.7 ± 1.3 22.6 ± 1.4 23.0 ± 1.3 n.s.Heneicosanoic acid (C21:0) 0.16 ± 0.03 c 0.14 ± 0.02 a 0.14 ± 0.01 a,b 0.15 ± 0.03 a,b,c 0.0133 #
Docosanoic acid (C22:0) 0.02 ± 0.01 0.02 ± 0.01 0.02 ± 0.01 0.02 ± 0.01 n.s.Tricosylic Acid (C23:0) 0.05 ± 0.03 0.04 ± 0.01 0.03 ± 0.01 0.03 ± 0.02 n.s.Lignoceric acid (C24:0) 0.15 ± 0.03 0.09 ± 0.07 0.17 ± 0.03 0.16 ± 0.02 n.s.Σ SFA 41.3 ± 1.2 41.8 ± 0.7 41.6 ± 1.3 42.4 ± 0.9 n.s.
Molecules 2020, 25, 5232 7 of 19
Table 2. Cont.
Fatty Acids [%] CON (n = 12) PSO (n = 12) BME (n = 12) PSO + BME (n = 12) p Value
MUFAPentadecenoic acid (C15:1) 0.02 ± 0.01 0.02 ± 0.01 0.02 ± 0.00 0.02 ± 0.00 n.s.Palmitoleic acid (C16:1) 0.72 ± 0.23 0.68 ± 0.10 0.69 ± 0.17 0.64 ± 0.13 n.s.Heptadecenoic acid (C17:1) 0.13 ± 0.01 b 0.11 ± 0.01 a,b 0.12 ± 0.02 a,b 0.11 ± 0.02 a 0.0242 *Elaidic acid (C18:1 n-9 trans) 0.20 ± 0.07 b 0.10 ± 0.00 a 0.18 ± 0.05 b 0.18 ± 0.04 b 0.0156 #
Oleic acid (C18:1 n-9 cis) 7.75 ± 2.05 6.65 ± 0.69 7.17 ± 1.24 6.1 ± 1.0 n.s.Eicosenoic acid (C20:1) 0.08 ± 0.01 0.09 ± 0.02 0.08 ± 0.03 0.07 ± 0.04 n.s.Docosenoic acid (C22:1) 0.01 ± 0.00 0.01 ± 0.00 0.02 ± 0.00 0.02 ± 0.01 n.s.Σ MUFA 8.88 ± 2.25 7.59 ± 0.76 8.27 ± 1.43 7.08 ± 1.16 n.s.
PUFALinolelaidic acid (C18:2 n-6 trans) 0.15 ± 0.08 c 0.11 ± 0.06 a,b,c 0.07 ± 0.02 a,b 0.06 ± 0.02 a 0.0228 #
Linoleic acid (C18:2 n-6 cis) 15.0 ± 1.3 15.5 ± 0.9 15.5 ± 0.9 15.0 ± 1.4 n.s.γ-linolenic acid (C18:3 n-6) 0.22 ± 0.06 a 0.31 ± 0.06 c 0.28 ± 0.09 a,b,c 0.23 ± 0.04 a,b 0.0013 *α-linolenic acid (C18:3 n-3) 1.16 ± 0.24 1.24 ± 0.18 1.17 ± 0.22 1.09 ± 0.22 n.s.Rumenic acid (C18:2 cis-9, trans-11) 0.037 ± 0.007 a 0.34 ± 0.08 b 0.041 ± 0.008 a 0.41 ± 0.14 b <0.0001 #
Eicosadienoic acid (C20:2) 0.11 ± 0.06 b 0.07 ± 0.03 a,b 0.07 ± 0.02 a,b 0.05 ± 0.02 a 0.0224 #
Dihomo-γ-linolenic acid (C20:3 n-6) 0.47 ± 0.04 a,b 0.32 ± 0.22 a 0.52 ± 0.08 b 0.53 ± 0.09 b 0.0188 #
Arachidonic acid (C20:4 n-6) 16.2 ± 1.4 a 18.5 ± 0.8 b 17.8 ± 1.4 b 18.3 ± 1.1 b <0.0001 *Eicosatrienoic Acid (C20:3 n-3) 0.16 ± 0.03 a 0.16 ± 0.02 a,b 0.18 ± 0.04 a,b,c 0.21 ± 0.07 c 0.0066 #
Eicosapentaenoic acid (C20:5 n-3) 0.82 ± 0.14 0.87 ± 0.15 0.89 ± 0.17 0.84 ± 0.19 n.s.cis-13,16-docosadienoic acid (C22:2) 0.03 ± 0.00 0.04 ± 0.01 0.03 ± 0.02 0.05 ± 0.02 n.s.Docosahexaenoic acid (C22:6 n-3) 9.41 ± 1.29 b 8.08 ± 0.88 a 8.35 ± 1.04 a,b 8.85 ± 0.84 a,b 0.0152 *Σ PUFA 43.5 ± 2.1 a 45.5 ± 1.0 b 44.9 ± 0.9 a,b 45.5 ± 0.62 b 0.0072 #
n-3 11.5 ± 1.1 b 10.3 ± 0.8 a 10.6 ± 0.9 a,b 11.0 ± 0.6 a,b 0.0102 *n-6 31.8 ± 1.5 a 34.7 ± 0.8 b 34.2 ± 1.2 b 34.0 ± 0.6 b 0.0001 #
n-6/n-3 2.78 ± 0.25 a 3.37 ± 0.28 b 3.26 ± 0.39 b 3.10 ± 0.2 b <0.0001 *(MUFA + PUFA)/SFA 1.27 ± 0.07 1.27 ± 0.04 1.28 ± 0.06 1.24 ± 0.05 n.s.PUFA/SFA 1.05 ± 0.06 1.09 ± 0.03 1.08 ± 0.03 1.07 ± 0.03 n.s.PI 163.9 ± 13.8 164.1 ± 6.8 163.6 ± 7.9 168.7 ± 7.3 n.s.
All data are shown as mean values± standard deviation. Three parallel samples were prepared from the experimentalmaterial obtained from each of twelve animals in each experimental group. p value ≤ 0.05—significant differencesamong groups in one-way ANOVA (*) or Kruskal–Wallis test (#). Values with a different index in one roware significantly different from each other (p ≤ 0.05) in post-hoc RIR Tukey test or multiple comparison test.n.s.—not significant (p > 0.05); CON—control group; PSO—group receiving PSO in the amount of 0.15 mL/day;BME—group receiving BME ad libitum; PSO + BME—group receiving PSO in the amount of 0.15 mL/day and BMEad libitum; MUFA—monounsaturated fatty acids; PUFA—polyunsaturated fatty acids; SFA—saturated fatty acids;PI—peroxidability index; Σ—sum of SFA, MUFA or PUFA, respectively.
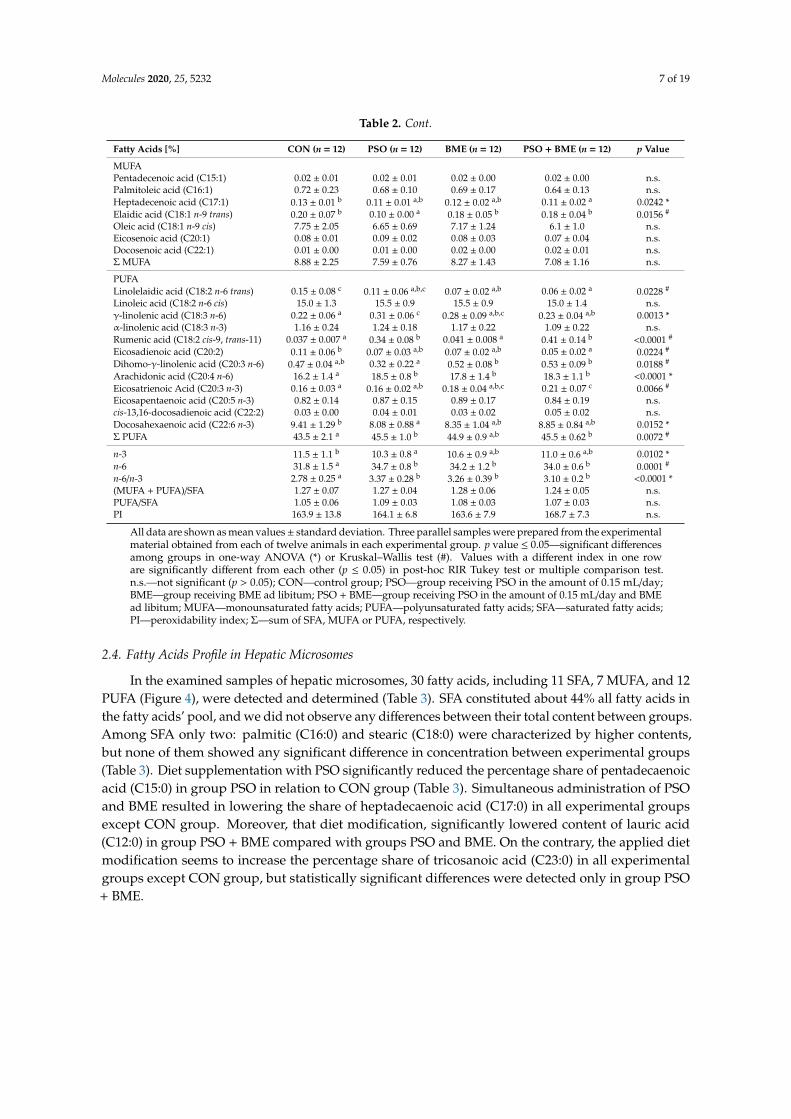
2.4. Fatty Acids Profile in Hepatic Microsomes
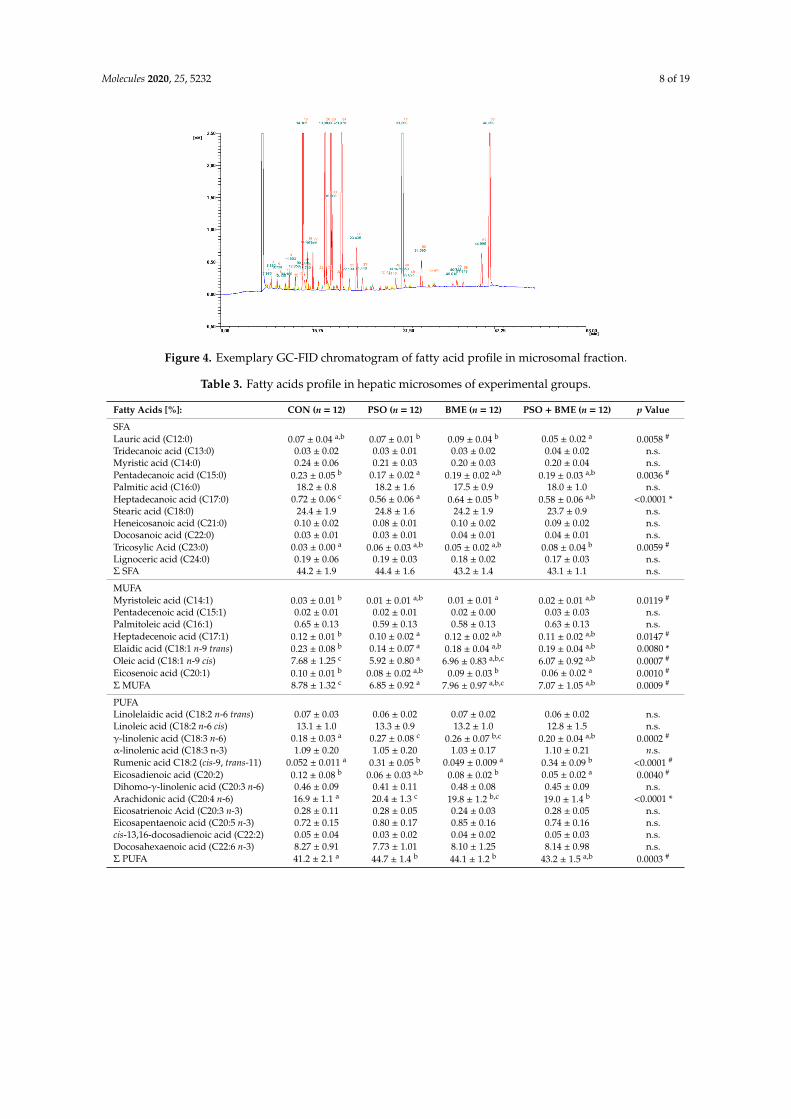
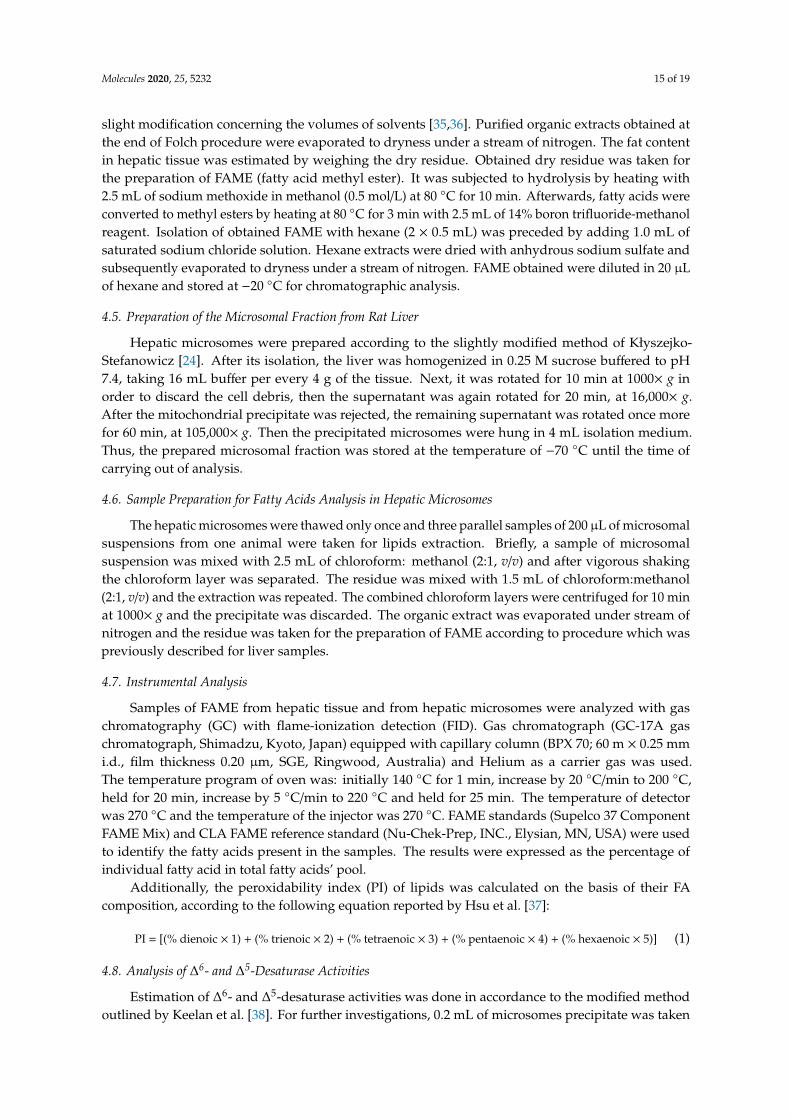
In the examined samples of hepatic microsomes, 30 fatty acids, including 11 SFA, 7 MUFA, and 12PUFA (Figure 4), were detected and determined (Table 3). SFA constituted about 44% all fatty acids inthe fatty acids’ pool, and we did not observe any differences between their total content between groups.Among SFA only two: palmitic (C16:0) and stearic (C18:0) were characterized by higher contents,but none of them showed any significant difference in concentration between experimental groups(Table 3). Diet supplementation with PSO significantly reduced the percentage share of pentadecaenoicacid (C15:0) in group PSO in relation to CON group (Table 3). Simultaneous administration of PSOand BME resulted in lowering the share of heptadecaenoic acid (C17:0) in all experimental groupsexcept CON group. Moreover, that diet modification, significantly lowered content of lauric acid(C12:0) in group PSO + BME compared with groups PSO and BME. On the contrary, the applied dietmodification seems to increase the percentage share of tricosanoic acid (C23:0) in all experimentalgroups except CON group, but statistically significant differences were detected only in group PSO+ BME.
Molecules 2020, 25, 5232 8 of 19
Molecules 2020, 25, x FOR PEER REVIEW 8 of 19
Figure 4. Exemplary GC-FID chromatogram of fatty acid profile in microsomal fraction.
As MUFA are concerned, their content ranged from 6 to 8% of the total fatty acids’ pool. We observed that introduction of the PSO in diet resulted in a statistically significant decrease in the overall content of MUFA in PSO and PSO + BME groups. Moreover, the diet modification resulted in lowering the share heptadecenoic acid (C17:1), elaidic acid (C18:1 n-9 trans) and oleic acid (C18:1 n-9 cis) in comparison to CON group (Table 2). Simultaneous administration of both diet supplements seems to reduce the content of C20:1 fatty acid in group PSO + BME compared to CON and BME group. Moreover, diet supplementation with PSO and BME seems to result in lowering share of C14:1 in all experimental groups in comparison with CON group.
PUFA constituted from 41 to 44% of the total fatty acids’ pool. The lowest total amount of PUFA was observed in CON group, which was significantly lower than PUFA content in the PSO and BME groups. We observed differences in concentrations for four fatty acids. Diet supplementation with PSO and BME significantly increased the share of n-6 PUFA, as the concentrations of GLA (C18:3 n-6) and AA (C20:4 n-6) in groups PSO, BME and PSO + BME were higher in comparison to CON group (Table 3). On the contrary, diet modification resulted in lowering of the share of C20:2 in all supplemented groups in relation to CON. As far as conjugated fatty acids are concerned, we did not detect any isomer of CLnA in any experimental group. Furthermore, one of the CLA isomers—RA—was detected in all experimental groups. Addition of PSO to the animals’ diet resulted in a significantly higher concentration of RA in groups PSO and PSO + BME referring to CON and BME group.
Concerning the total percentage share of n-3 PUFA, we did not observe any statistically significant difference between groups. Conversely, both PSO and BME seem to significantly increase total share of n-6 PUFA in relation to the CON group. As far as the n-6/n-3 ratio is concerned, we observed, that diet supplementation in groups PSO and BME resulted in a statistically significant increase in the ratio in comparison to CON group. Moreover, the PUFA/SFA ratio and peroxidability index were determined; diet supplementation with PSO and bitter melon aqueous extract significantly increased the PUFA/SFA ratio in all supplemented groups, as well as it increased the PI in groups PSO and BME in relation to CON group.
Table 3. Fatty acids profile in hepatic microsomes of experimental groups.
Fatty Acids [%]: CON (n = 12) PSO (n = 12) BME (n = 12) PSO + BME (n = 12) p Value SFA Lauric acid (C12:0) 0.07 ± 0.04 a,b 0.07 ± 0.01 b 0.09 ± 0.04 b 0.05 ± 0.02 a 0.0058 # Tridecanoic acid (C13:0) 0.03 ± 0.02 0.03 ± 0.01 0.03 ± 0.02 0.04 ± 0.02 n.s. Myristic acid (C14:0) 0.24 ± 0.06 0.21 ± 0.03 0.20 ± 0.03 0.20 ± 0.04 n.s.
Figure 4. Exemplary GC-FID chromatogram of fatty acid profile in microsomal fraction.
Table 3. Fatty acids profile in hepatic microsomes of experimental groups.
Fatty Acids [%]: CON (n = 12) PSO (n = 12) BME (n = 12) PSO + BME (n = 12) p Value
SFALauric acid (C12:0) 0.07 ± 0.04 a,b 0.07 ± 0.01 b 0.09 ± 0.04 b 0.05 ± 0.02 a 0.0058 #
Tridecanoic acid (C13:0) 0.03 ± 0.02 0.03 ± 0.01 0.03 ± 0.02 0.04 ± 0.02 n.s.Myristic acid (C14:0) 0.24 ± 0.06 0.21 ± 0.03 0.20 ± 0.03 0.20 ± 0.04 n.s.Pentadecanoic acid (C15:0) 0.23 ± 0.05 b 0.17 ± 0.02 a 0.19 ± 0.02 a,b 0.19 ± 0.03 a,b 0.0036 #
Palmitic acid (C16:0) 18.2 ± 0.8 18.2 ± 1.6 17.5 ± 0.9 18.0 ± 1.0 n.s.Heptadecanoic acid (C17:0) 0.72 ± 0.06 c 0.56 ± 0.06 a 0.64 ± 0.05 b 0.58 ± 0.06 a,b <0.0001 *Stearic acid (C18:0) 24.4 ± 1.9 24.8 ± 1.6 24.2 ± 1.9 23.7 ± 0.9 n.s.Heneicosanoic acid (C21:0) 0.10 ± 0.02 0.08 ± 0.01 0.10 ± 0.02 0.09 ± 0.02 n.s.Docosanoic acid (C22:0) 0.03 ± 0.01 0.03 ± 0.01 0.04 ± 0.01 0.04 ± 0.01 n.s.Tricosylic Acid (C23:0) 0.03 ± 0.00 a 0.06 ± 0.03 a,b 0.05 ± 0.02 a,b 0.08 ± 0.04 b 0.0059 #
Lignoceric acid (C24:0) 0.19 ± 0.06 0.19 ± 0.03 0.18 ± 0.02 0.17 ± 0.03 n.s.Σ SFA 44.2 ± 1.9 44.4 ± 1.6 43.2 ± 1.4 43.1 ± 1.1 n.s.
MUFAMyristoleic acid (C14:1) 0.03 ± 0.01 b 0.01 ± 0.01 a,b 0.01 ± 0.01 a 0.02 ± 0.01 a,b 0.0119 #
Pentadecenoic acid (C15:1) 0.02 ± 0.01 0.02 ± 0.01 0.02 ± 0.00 0.03 ± 0.03 n.s.Palmitoleic acid (C16:1) 0.65 ± 0.13 0.59 ± 0.13 0.58 ± 0.13 0.63 ± 0.13 n.s.Heptadecenoic acid (C17:1) 0.12 ± 0.01 b 0.10 ± 0.02 a 0.12 ± 0.02 a,b 0.11 ± 0.02 a,b 0.0147 #
Elaidic acid (C18:1 n-9 trans) 0.23 ± 0.08 b 0.14 ± 0.07 a 0.18 ± 0.04 a,b 0.19 ± 0.04 a,b 0.0080 *Oleic acid (C18:1 n-9 cis) 7.68 ± 1.25 c 5.92 ± 0.80 a 6.96 ± 0.83 a,b,c 6.07 ± 0.92 a,b 0.0007 #
Eicosenoic acid (C20:1) 0.10 ± 0.01 b 0.08 ± 0.02 a,b 0.09 ± 0.03 b 0.06 ± 0.02 a 0.0010 #
Σ MUFA 8.78 ± 1.32 c 6.85 ± 0.92 a 7.96 ± 0.97 a,b,c 7.07 ± 1.05 a,b 0.0009 #
PUFALinolelaidic acid (C18:2 n-6 trans) 0.07 ± 0.03 0.06 ± 0.02 0.07 ± 0.02 0.06 ± 0.02 n.s.Linoleic acid (C18:2 n-6 cis) 13.1 ± 1.0 13.3 ± 0.9 13.2 ± 1.0 12.8 ± 1.5 n.s.γ-linolenic acid (C18:3 n-6) 0.18 ± 0.03 a 0.27 ± 0.08 c 0.26 ± 0.07 b,c 0.20 ± 0.04 a,b 0.0002 #
α-linolenic acid (C18:3 n-3) 1.09 ± 0.20 1.05 ± 0.20 1.03 ± 0.17 1.10 ± 0.21 n.s.Rumenic acid C18:2 (cis-9, trans-11) 0.052 ± 0.011 a 0.31 ± 0.05 b 0.049 ± 0.009 a 0.34 ± 0.09 b <0.0001 #
Eicosadienoic acid (C20:2) 0.12 ± 0.08 b 0.06 ± 0.03 a,b 0.08 ± 0.02 b 0.05 ± 0.02 a 0.0040 #
Dihomo-γ-linolenic acid (C20:3 n-6) 0.46 ± 0.09 0.41 ± 0.11 0.48 ± 0.08 0.45 ± 0.09 n.s.Arachidonic acid (C20:4 n-6) 16.9 ± 1.1 a 20.4 ± 1.3 c 19.8 ± 1.2 b,c 19.0 ± 1.4 b <0.0001 *Eicosatrienoic Acid (C20:3 n-3) 0.28 ± 0.11 0.28 ± 0.05 0.24 ± 0.03 0.28 ± 0.05 n.s.Eicosapentaenoic acid (C20:5 n-3) 0.72 ± 0.15 0.80 ± 0.17 0.85 ± 0.16 0.74 ± 0.16 n.s.cis-13,16-docosadienoic acid (C22:2) 0.05 ± 0.04 0.03 ± 0.02 0.04 ± 0.02 0.05 ± 0.03 n.s.Docosahexaenoic acid (C22:6 n-3) 8.27 ± 0.91 7.73 ± 1.01 8.10 ± 1.25 8.14 ± 0.98 n.s.Σ PUFA 41.2 ± 2.1 a 44.7 ± 1.4 b 44.1 ± 1.2 b 43.2 ± 1.5 a,b 0.0003 #
Molecules 2020, 25, 5232 9 of 19
Table 3. Cont.
Fatty Acids [%]: CON (n = 12) PSO (n = 12) BME (n = 12) PSO + BME (n = 12) p Value
n-3 10.3 ± 1.0 9.85 ± 0.86 10.2 ± 1.2 10.2 ± 0.7 n.s.n-6 30.6 ± 1.5 a 34.4 ± 1.3 c 33.7 ± 0.9 b,c 32.6 ± 1.2 b <0.0001 *n-6/n-3 2.98 ± 0.23 a 3.52 ± 0.34 b 3.35 ± 0.47 b 3.19 ± 0.23 a,b 0.0023 *(MUFA + PUFA)/SFA 1.13 ± 0.09 1.16 ± 0.08 1.21 ± 0.07 1.17 ± 0.05 n.s.PUFA/SFA 0.93 ± 0.08 a 1.01 ± 0.07 b 1.02 ± 0.05 b 1.00 ± 0.05 b 0.0055 *PI 155.5 ± 10.1 a 166.2 ± 9.2 b 166.6 ± 8.9 b 163.1 ± 10.7 a,b 0.0271 *
All data are shown as mean values ± standard deviation. Three parallel samples were prepared from experimentalmaterial obtained from each of twelve animals in each experimental group. p value ≤ 0.05 - significant differencesamong groups in one-way ANOVA (*) or Kruskal–Wallis test (#). Values with a different letter index in onerow are significantly different from each other (p ≤ 0.05) in post-hoc RIR Tukey test or multiple comparison test.n.s.—not significant (p > 0.05); CON—control group; PSO—group receiving PSO in the amount of 0.15 mL/day;BME—group receiving BME ad libitum; PSO + BME—group receiving PSO in the amount of 0.15 mL/day and BMEad libitum; MUFA—monounsaturated fatty acids; PUFA—polyunsaturated fatty acids; SFA—saturated fatty acids;PI—peroxidability index; Σ—sum of SFA, MUFA or PUFA, respectively.
As MUFA are concerned, their content ranged from 6 to 8% of the total fatty acids’ pool.We observed that introduction of the PSO in diet resulted in a statistically significant decrease in theoverall content of MUFA in PSO and PSO + BME groups. Moreover, the diet modification resulted inlowering the share heptadecenoic acid (C17:1), elaidic acid (C18:1 n-9 trans) and oleic acid (C18:1 n-9cis) in comparison to CON group (Table 2). Simultaneous administration of both diet supplementsseems to reduce the content of C20:1 fatty acid in group PSO + BME compared to CON and BMEgroup. Moreover, diet supplementation with PSO and BME seems to result in lowering share of C14:1in all experimental groups in comparison with CON group.
PUFA constituted from 41 to 44% of the total fatty acids’ pool. The lowest total amount of PUFAwas observed in CON group, which was significantly lower than PUFA content in the PSO and BMEgroups. We observed differences in concentrations for four fatty acids. Diet supplementation with PSOand BME significantly increased the share of n-6 PUFA, as the concentrations of GLA (C18:3 n-6) and AA(C20:4 n-6) in groups PSO, BME and PSO + BME were higher in comparison to CON group (Table 3).On the contrary, diet modification resulted in lowering of the share of C20:2 in all supplementedgroups in relation to CON. As far as conjugated fatty acids are concerned, we did not detect anyisomer of CLnA in any experimental group. Furthermore, one of the CLA isomers—RA—was detectedin all experimental groups. Addition of PSO to the animals’ diet resulted in a significantly higherconcentration of RA in groups PSO and PSO + BME referring to CON and BME group.
Concerning the total percentage share of n-3 PUFA, we did not observe any statistically significantdifference between groups. Conversely, both PSO and BME seem to significantly increase total share ofn-6 PUFA in relation to the CON group. As far as the n-6/n-3 ratio is concerned, we observed, that dietsupplementation in groups PSO and BME resulted in a statistically significant increase in the ratio incomparison to CON group. Moreover, the PUFA/SFA ratio and peroxidability index were determined;diet supplementation with PSO and bitter melon aqueous extract significantly increased the PUFA/SFAratio in all supplemented groups, as well as it increased the PI in groups PSO and BME in relation toCON group.
2.5. Analysis of ∆6- (D6D) and ∆5-Desaturase (D5D) Activities
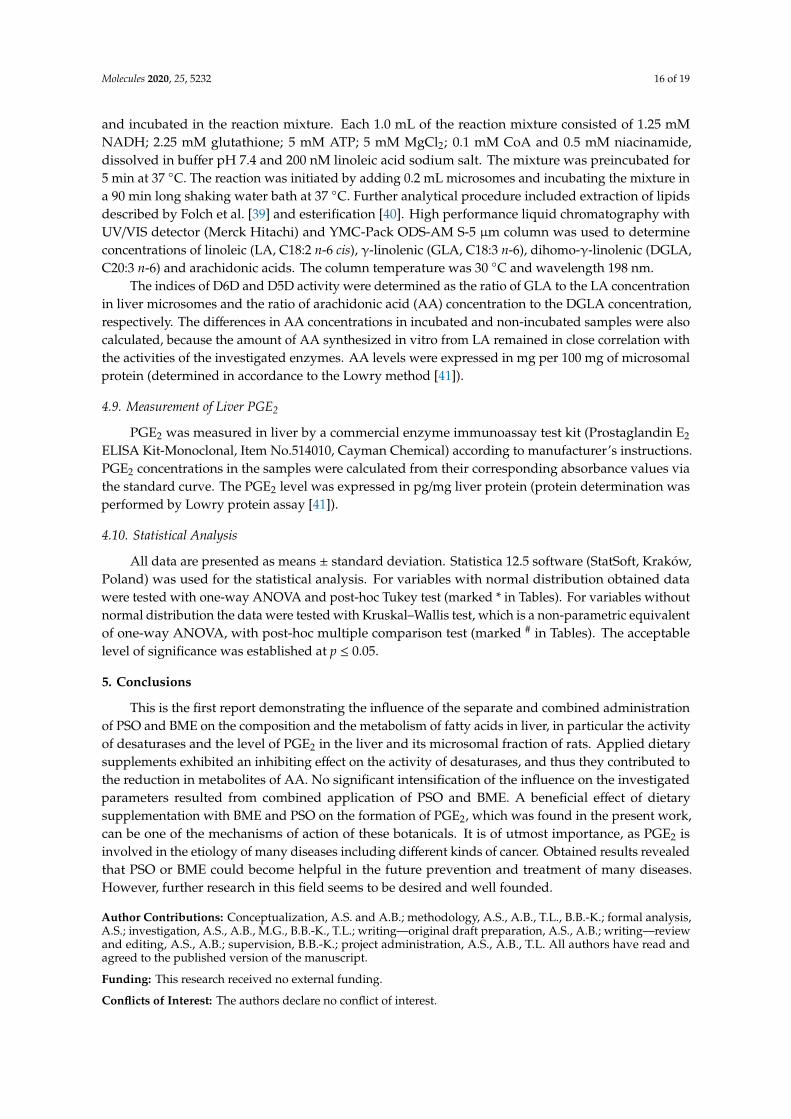
Desaturase activities were determined indirectly and expressed as an increase in AA concentrationafter incubation in conditions similar to those observed in vivo. D6D and D5D indices were alsocalculated: D6D index as GLA/LA concentration ratio and D5D index as AA/DGLA concentrationratio (Figure 5).
Molecules 2020, 25, 5232 10 of 19
Molecules 2020, 25, x FOR PEER REVIEW 10 of 19
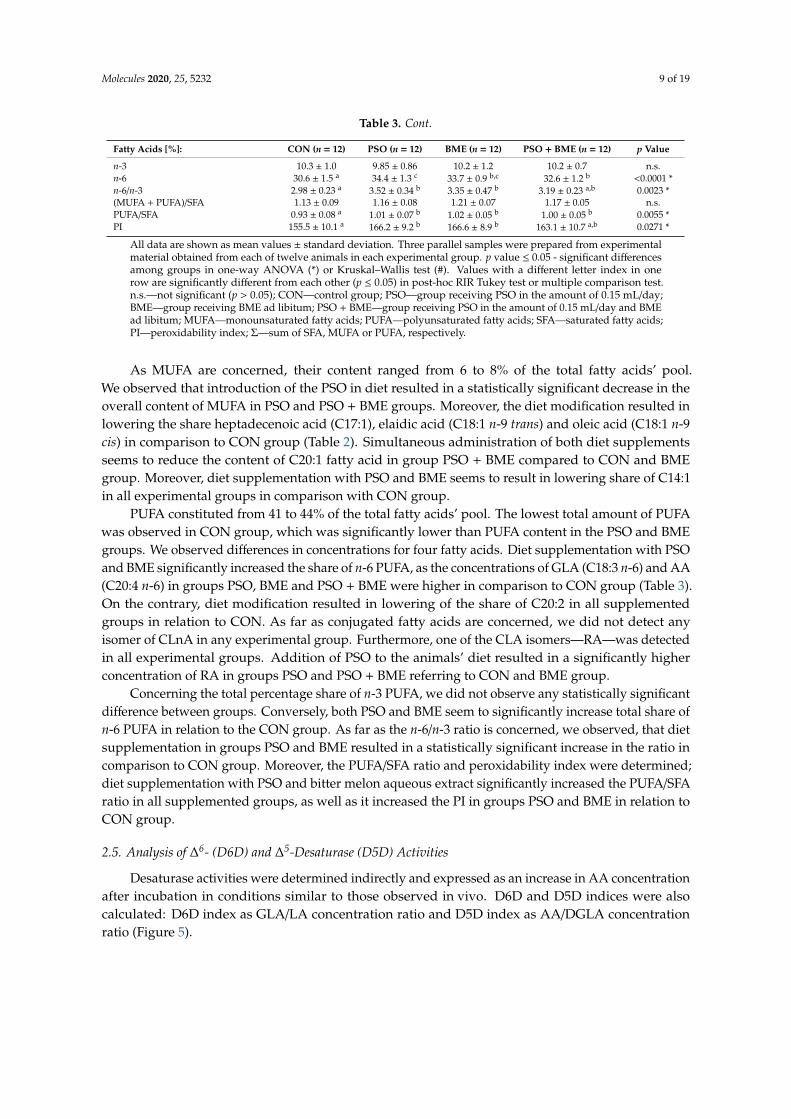
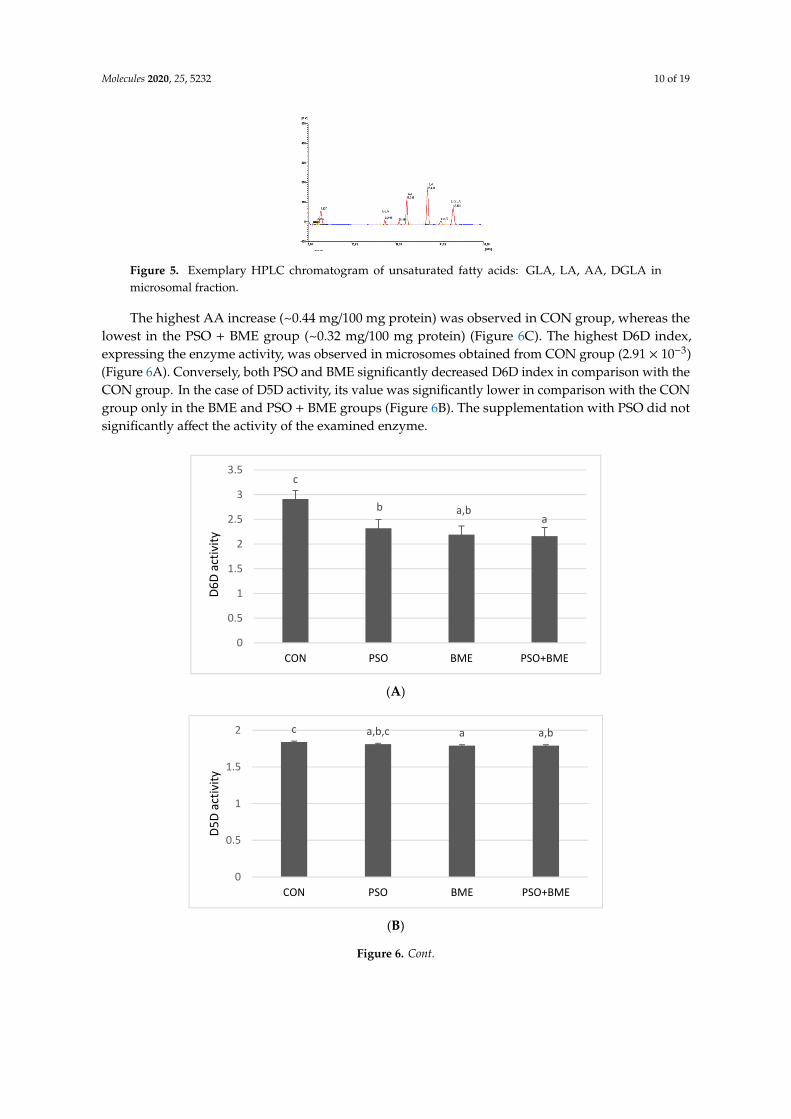
Figure 5. Exemplary HPLC chromatogram of unsaturated fatty acids: GLA, LA, AA, DGLA in microsomal fraction.
The highest AA increase (~0.44 mg/100 mg protein) was observed in CON group, whereas the lowest in the PSO + BME group (~0.32 mg/100 mg protein) (Figure 6C). The highest D6D index, expressing the enzyme activity, was observed in microsomes obtained from CON group (2.91 × 10⁻³) (Figure 6A). Conversely, both PSO and BME significantly decreased D6D index in comparison with the CON group. In the case of D5D activity, its value was significantly lower in comparison with the CON group only in the BME and PSO + BME groups (Figure 6B). The supplementation with PSO did not significantly affect the activity of the examined enzyme.
(A)
(B)
c
b a,ba
0
0.5
1
1.5
2
2.5
3
3.5
CON PSO BME PSO+BME
D6D
activ
ity
c a,b,c a a,b
0
0.5
1
1.5
2
CON PSO BME PSO+BME
D5D
activ
ityFigure 5. Exemplary HPLC chromatogram of unsaturated fatty acids: GLA, LA, AA, DGLA inmicrosomal fraction.
The highest AA increase (~0.44 mg/100 mg protein) was observed in CON group, whereas thelowest in the PSO + BME group (~0.32 mg/100 mg protein) (Figure 6C). The highest D6D index,expressing the enzyme activity, was observed in microsomes obtained from CON group (2.91 × 10⁻³)(Figure 6A). Conversely, both PSO and BME significantly decreased D6D index in comparison with theCON group. In the case of D5D activity, its value was significantly lower in comparison with the CONgroup only in the BME and PSO + BME groups (Figure 6B). The supplementation with PSO did notsignificantly affect the activity of the examined enzyme.
Molecules 2020, 25, x FOR PEER REVIEW 10 of 18
The highest AA increase (~0.44 mg/100 mg protein) was observed in CON group, whereas the lowest in the PSO + BME group (~0.32 mg/100 mg protein) (Figure 6C). The highest D6D index, expressing the enzyme activity, was observed in microsomes obtained from CON group (2.91 × 10⁻³) (Figure 6A). Conversely, both PSO and BME significantly decreased D6D index in comparison with the CON group. In the case of D5D activity, its value was significantly lower in comparison with the CON group only in the BME and PSO + BME groups (Figure 6B). The supplementation with PSO did not significantly affect the activity of the examined enzyme.
(A)
(B)
(C)
Figure 6. Activities of D6D (A) and D5D (B) in hepatic microsomes of experimental groups. AA concentration increase (mg/100 mg protein) in rat hepatic microsomes (C). CON—control group;
c
b a,ba
0
0.5
1
1.5
2
2.5
3
3.5
CON PSO BME PSO+BME
D6D
activ
ity
c a,b,c a a,b
0
0.5
1
1.5
2
CON PSO BME PSO+BME
D5D
activ
ity
cb,c
a,b a
00.05
0.10.15
0.20.25
0.30.35
0.40.45
0.5
CON PSO BME PSO+BME
AA [m
g/10
0 m
g of
pro
tein
]
Figure 6. Cont.

Molecules 2020, 25, 5232 11 of 19
Molecules 2020, 25, x FOR PEER REVIEW 10 of 18
The highest AA increase (~0.44 mg/100 mg protein) was observed in CON group, whereas the lowest in the PSO + BME group (~0.32 mg/100 mg protein) (Figure 6C). The highest D6D index, expressing the enzyme activity, was observed in microsomes obtained from CON group (2.91 × 10⁻³) (Figure 6A). Conversely, both PSO and BME significantly decreased D6D index in comparison with the CON group. In the case of D5D activity, its value was significantly lower in comparison with the CON group only in the BME and PSO + BME groups (Figure 6B). The supplementation with PSO did not significantly affect the activity of the examined enzyme.
(A)
(B)
(C)
Figure 6. Activities of D6D (A) and D5D (B) in hepatic microsomes of experimental groups. AA concentration increase (mg/100 mg protein) in rat hepatic microsomes (C). CON—control group;
c
b a,ba
0
0.5
1
1.5
2
2.5
3
3.5
CON PSO BME PSO+BME
D6D
activ
ity
c a,b,c a a,b
0
0.5
1
1.5
2
CON PSO BME PSO+BME
D5D
activ
ity
cb,c
a,b a
00.05
0.10.15
0.20.25
0.30.35
0.40.45
0.5
CON PSO BME PSO+BME
AA [m
g/10
0 m
g of
pro
tein
]
Figure 6. Activities of D6D (A) and D5D (B) in hepatic microsomes of experimental groups.AA concentration increase (mg/100 mg protein) in rat hepatic microsomes (C). CON—control group;PSO—group receiving PSO in the amount of 0.15 mL/day; BME—group receiving BME ad libitum;PSO + BME—group receiving PSO in the amount of 0.15 mL/day and BME ad libitum. All dataare shown as mean values ± standard deviation of data obtained from all animals (n = 12) in eachgroup. Values with a different letter index in one row are significantly different from each other (p ≤0.05) in post-hoc RIR Tukey test or multiple comparison test. D6D—∆6-desaturase index (×10−3),D5D—∆5-desaturase index.
2.6. Liver PGE2 Levels
The level of PGE2 as expressed in pg/mg protein is presented in Figure 7. On the basis of thepresented results it was found that there is a statistically significant difference in the concentration ofPGE2 between particular groups (p = 0.0021). The highest level of PGE2 was obtained in the CONgroup (105.55 ± 27.42 pg/mg protein) whereas the lowest concentration was obtained in the PSO+ BME group (52.62 ± 13.86 pg/mg protein). The results obtained from a single supplementation,either with PSO or with BME, did not differ significantly from those obtained in the PSO + BME group;but, each time, they were much lower than the concentrations obtained in the CON group.
Molecules 2020, 25, x FOR PEER REVIEW 11 of 18
PSO—group receiving PSO in the amount of 0.15 mL/day; BME—group receiving BME ad libitum; PSO + BME—group receiving PSO in the amount of 0.15 mL/day and BME ad libitum. All data are shown as mean values ± standard deviation of data obtained from all animals (n = 12) in each group. Values with a different letter index in one row are significantly different from each other (p ≤ 0.05) in post-hoc RIR Tukey test or multiple comparison test. D6D—Δ6-desaturase index (×10−3), D5D—Δ5-desaturase index.
2.6. Liver PGE2 Levels
The level of PGE2 as expressed in pg/mg protein is presented in Figure 7. On the basis of the presented results it was found that there is a statistically significant difference in the concentration of PGE2 between particular groups (p = 0.0021). The highest level of PGE2 was obtained in the CON group (105.55 ± 27.42 pg/mg protein) whereas the lowest concentration was obtained in the PSO + BME group (52.62 ± 13.86 pg/mg protein). The results obtained from a single supplementation, either with PSO or with BME, did not differ significantly from those obtained in the PSO + BME group; but, each time, they were much lower than the concentrations obtained in the CON group.
Figure 7. PGE2 (pg/mg protein) content in liver of experimental groups. CON—control group; PSO—group receiving PSO in the amount of 0.15 mL/day; BME—group receiving BME ad libitum; PSO + BME—group receiving PSO in the amount of 0.15 mL/day and BME ad libitum. All data are shown as mean values ± standard deviation of data obtained from all animals (n = 12) in each group. Values with a different letter index in one row are significantly different from each other (p ≤ 0.05) in post-hoc RIR Tukey test.
3. Discussion
Results obtained revealed that PSO decreased liver mass (Figure 2A) and tend to increase the fat content in liver (Figure 2C), whereas BME appeared to increase the fat content in liver in the most potent way (Figure 2C).
Total SFA and MUFA content did not differ among dietary groups whereas significant differences concerning individual SFA or MUFA levels were observed. PSO increase PUFA and decreased n-3 PUFA in liver whereas both dietary supplements increased n-6 PUFA share. However, changes observed in individual fatty acids share did not influence PI (Table 2).
In the case of the microsomal fraction of hepatic tissue, PSO decreased MUFA share, whereas both applied supplements increased n-6 PUFA content without any impact on n-3 PUFA, which resulted in increase in PI in all supplemented groups (Table 3).
The nature of hepatocyte cell membranes and their microsomal fraction is slightly different. Microsomes are concerned as vesicles of the hepatocyte endoplasmic reticulum and they are heterogenous vesicle-like artifacts (~20–200 nm diameter) re-formed from pieces of the endoplasmic reticulum when eukaryotic cells are broken-up in the laboratory. They contain several microsomal enzymes, including flavin monooxygenases, cytochrome P450, NADPH cytochrome c reductase,
b
aa
a
0
20
40
60
80
100
120
140
CON PSO BME PSO+BME
PGE 2
[pg/
mg
prot
ein]
Figure 7. PGE2 (pg/mg protein) content in liver of experimental groups. CON—control group;PSO—group receiving PSO in the amount of 0.15 mL/day; BME—group receiving BME ad libitum;PSO + BME—group receiving PSO in the amount of 0.15 mL/day and BME ad libitum. All data areshown as mean values ± standard deviation of data obtained from all animals (n = 12) in each group.Values with a different letter index in one row are significantly different from each other (p ≤ 0.05)in post-hoc RIR Tukey test.
Molecules 2020, 25, 5232 12 of 19
3. Discussion
Results obtained revealed that PSO decreased liver mass (Figure 2A) and tend to increase the fatcontent in liver (Figure 2C), whereas BME appeared to increase the fat content in liver in the mostpotent way (Figure 2C).
Total SFA and MUFA content did not differ among dietary groups whereas significant differencesconcerning individual SFA or MUFA levels were observed. PSO increase PUFA and decreased n-3PUFA in liver whereas both dietary supplements increased n-6 PUFA share. However, changesobserved in individual fatty acids share did not influence PI (Table 2).
In the case of the microsomal fraction of hepatic tissue, PSO decreased MUFA share, whereas bothapplied supplements increased n-6 PUFA content without any impact on n-3 PUFA, which resulted inincrease in PI in all supplemented groups (Table 3).
The nature of hepatocyte cell membranes and their microsomal fraction is slightly different.Microsomes are concerned as vesicles of the hepatocyte endoplasmic reticulum and they are heterogenousvesicle-like artifacts (~20–200 nm diameter) re-formed from pieces of the endoplasmic reticulumwhen eukaryotic cells are broken-up in the laboratory. They contain several microsomal enzymes,including flavin monooxygenases, cytochrome P450, NADPH cytochrome c reductase, UDP glucoronosyltransferases, glutathione-S-transferases, epoxide hydrolases and desaturases. The fatty acids compositionof endoplasmic reticulum is different than the fatty acids composition of hepatocytes cell membranes.It can also be modified by the diet, which, in turn, can influence the activity of microsomal enzymes,which was evaluated in present paper.
The applied supplementation causes decrease in the activity of D6D (Figure 6A), which correspondedwith the decrease in PGE2 content in all experimental groups receiving diet supplementation (Figure 7).
Investigated botanicals gain increasing interest worldwide, not only as folk medicines but also asdietary supplements of no harmful effects. Different in vitro and in vivo toxicity test revealed PSO asrather non-toxic and safe [16]. As far as bitter melon is concerned, the potential use of these fruits wassummarized and evidenced that in most of the experimental models their consumption is safe with noadverse effects [16–18].
PSO gained special attention as being health-promoting, due to the beneficial fatty acidscomposition. The low contents of SFA and MUFA and the high content of PUFA, among which thepresence of PA—one of conjugated linolenic acids (CLnA) isomers made it interesting as potentialdietary supplement [19]. However, as revealed before, the quality of PSO offered as dietary supplementsdiffer [9]. In PSO applied to animals in the present experiment, SFA constituted ~40% of FA whereasMUFA hare was 11% and identified PUFA constituted only, e.g., 36%, with some of the FA beingunidentified. Thorough analysis of chromatograms may us to assume that they may be other CLnAisomers, which identification was impossible because of the lack of proper analytical standards.Results of numerous studies reveal beneficial preventive properties of PSO in different pathologicalstates, e.g., diabetes, cancer, hyperlipidemia [20]. Conjugated fatty acids are widely investigatedas main bioactive components of PSO and many possible mechanisms of their action are proposed,among which competition with PUFA in metabolic pathways is of great interest. We previously revealedthat CLA can compete with PUFA and influence their concentration and the concentration of theirmetabolites in serum and in mammary tumors [21–23] and in liver as well as the activity of enzymesparticipating in PUFA metabolism [24,25]. As a natural continuation of these findings, we investigatedwhether PSO, as a rich source of CLnA, can also act in similar way.
Results obtained in the present study did not confirm competition of CLnA from PSO with PUFA.Applied supplementation can influence oxidation processes as we observed elevated values of PI inliver microsomes of all examined groups. We did not detect PA, neither in the microsomal fraction norin the whole hepatic tissues of any examined group of rats, although in the serum of the PSO group,PA was previously detected [26]. RA was present in all examined samples and its share was elevatedin two groups supplemented with PSO. Our observations are in accordance with those of Yamasakiet al. [27] as they detected dose-dependent accumulation of RA in serum, liver and adipose tissue
Molecules 2020, 25, 5232 13 of 19
of mice fed diet supplemented with increasing levels of PSO. As previously suggested by Tsuzukiet al. [28] most of the PA given to rats is absorbed in the intestine within 24 h and part of this fattyacid is converted to RA. This ∆-13 saturation reaction depends on NADPH and occurs not only inrat intestine but also in liver and kidneys [29]. Obtained results seem to confirm this conversion ofPA into RA and preferential accumulation of RA in hepatic tissue of rats. Moreover, our observationmade for hepatic tissue and its microsomal fraction differ from our previous observation made forserum as slightly elevated levels of RA were observed in serum of rats supplemented solely with PSO(PSO group) in relation to CON group whereas the highest share of RA in total fatty acids pool wasdetected in group receiving solely BME (BME group) [21]. One of the mechanisms of CLnA actionseems to be the possibility of its transformation into CLA. Tsuzuki et al. [29] proved that after a 4-weeksupplementation of rats with 1% α-eleostearic acid, the cis-9, trans-11 CLA acid appeared in the rats’liver and plasma. Similar results were obtained in the case of PA which is metabolized to cis-9, trans-11CLA [30]. In the liver, plasma, kidneys, heart, brain and adipose tissue of the examined rats, a CLAisomer was identified. Hence, it was hypothesized that the health-promoting properties of CLnA canbe associated with the activity of CLA. Our earlier investigations showed that the supplementationwith CLA had an inhibiting effect on the activity of desaturases [25]. The supplementation with PSOalso affected the activity of the examined enzymes. Enrichment of the diet either with PSO or BMEreduced the activity of D6D, whereas the combination of those dietary factors only slightly increasedthe effect. Moreover, in the case of D5D, enzyme inhibition was found, although it was statisticallysignificant only for the BME and PSO + BME groups. A similar tendency was observed as concerns theincrease in AA. In animal studies, the activity of D6D positively correlates with insulin resistance andobesity. In contrast, enrichment of the diet with PUFAs reduces the expression of D6D [31]. There is anevidence that the conjugated linolenic acids exhibit potent anti-inflammatory activity, which resultsboth from a decrease in AA transformation and the inhibition of pro-inflammatory cytokines such asTNF-α, or IL-6 [32]. Mashhadi et al. [33] showed the reduction in the PGE2 level as a result of CLnAtreatment. Those authors proved that the above-mentioned dependence is related to the inhibitionof both COX-1 and COX-2. On the other hand, Wang et al. [34] revealed that CLA not only inhibitsthe formation of COX-2 but also contributes to a decrease in the number of EP2 receptors for PGE2,which leads to the reduction in PGE2 concentration and thus increases the chances of recovering fromcancer. On the basis of the obtained results the hypothesis about the effect of PSO-enriched diet on theformation of pro-inflammatory PGE2 was confirmed. In comparison with the control group, in theliver of rats that were supplemented with BME, the PSO, and the combination of both, a significantlylower level of the examined prostaglandin was observed. No statistically significant difference inmean concentrations of PGE2 was observed between the group that was supplemented with BME andthe group that received PSO. The aim of a combined supplementation was to determine whether ornot the potential effects of both products sum up. The obtained results showed that there is no suchdependence because the mean level of PGE2 in the animals from the PSO + BME group did not differfrom the mean values obtained for the remaining groups supplemented with dietary supplements.The influence of applied botanicals was observed in case of lipid profile of hepatic tissue, especially ofits microsomal fraction, and also in case of enzymes involved in fatty acids metabolism, as well as incase of AA metabolite—PGE2. Both botanicals appeared to influence body lipid metabolism, and insome cases (e.g., desaturases activity and PGE2 content) their action was similar, whereas in case offatty acids, their impact was diversified, both similar and opposite, and not as much pronounced asin case of PGE2. It may result from the fact, that applied supplementation slightly changed the overfatty acids intake. In case of PSO this impact was more evident than in case of BME. In BME, whichwas an aqueous extract, the content of fatty acids was very small and changes in fatty acids profile inBME group may result from the influence of other bioactive compounds on body lipid metabolism.Moreover, the influence of PSO was not limited to increase fatty acid intake, but also resulted fromthe presence of other bioactive compounds. Lack of synergistic effect of combined PSO and BMEsupplementation in case some examined variables may rather indicate their antagonistic influence.
Molecules 2020, 25, 5232 14 of 19
To summarize, the obtained results clearly show that proper dietary supplementation is a rathercomplex issue as simultaneous intake of even two dietary supplements, especially those of botanicalorigin, which are complex mixtures of many bioactive compounds, may result in their interactions anddistinctly modify their influence on the organism.
4. Materials and Methods
4.1. Pomegranate Seed Oil
Commercially available cold pressed, unrefined oil from seeds of pomegranate fruits (INCI:Punica Granatum (Pomegranate) Seed Oil, Zielony Klub) was purchased from the local market (Kielce,Poland) with expiration date ≥6 months. It was stored at 8 ◦C before administration to animals and itwas given to animals within its expiration date.
4.2. Bitter Melon Aqueous Extract
Commercially available dried fruit of bitter melon (Momordica charantia) (Tra Kho Qua, GohyahTea, CTE JSCO) was purchased from a local grocery store in Warsaw, Poland. Fresh aqueous extracts(tea—BME) were prepared daily according to the manufacturer’s description. Briefly, water (80 ◦C)was added to a weighed amount of dried fruits to obtain 2% (w/v) extract. After 10 min, the extract wasfiltered and freshly cooled tea was given to the animals daily. The concentration and the method of teapreparation were in accordance with the manufacturer’s recommendation for this dietary supplement.The detailed characteristic of BME was given previously [14].
4.3. Animals
Performed animal model experiment and the guiding principles in the use and care of laboratoryanimals were approved by The Second Ethical Committee on Animal Experiments (56/2013 and54/2015). Maiden female Sprague-Dawley rats (n = 48, 30 days old) were purchased from Divisionof Experimental Animals, Department of General and Experimental Pathology (Medical Universityof Warsaw, Warsaw, Poland). During the whole experiment they were kept in an animal room at21 ◦C, in a 12 h light:12 h dark cycle. Rats were fed ad libitum a standard laboratory fodder LabofeedH (Feed and Concentrates Production Plant, Poland). Fodder is mainly composed of 22.0% protein,4.2% fat, 37.0% starch and 3.5% fiber with the minerals, vitamins and free amino acids constituting theother 33.3% of fodder. A detailed composition of Labofeed H fodder has been given previously [14].
After 1-week adaptation the animals were randomly divided into 4 groups of 12 individuals each.The detailed characteristics of experimental groups is given below:
CON—rats of the control group fed standard laboratory fodder and water ad libitum only,PSO—rats with unlimited access to the standard laboratory fodder and water receiving PSO in theamount of 0.15 mL given via a gavage daily,BME—rats with unlimited access to the standard laboratory fodder and 2% (w/v) BME as the onlydrinking liquid,PSO + BME—rats fed a standard laboratory fodder and 2% (w/v) BME as the only drinking liquid andreceiving PSO in the amount of 0.15 mL daily given via a gavage daily.
Food and fluid intake was monitored daily. BME intake given as the only drinking fluid in BMEand PSO + BME groups was monitored daily and it did not differ from the water intake in CONand PSO groups. Supplementation of the diet was conducted for 21 weeks. In the 21st week of theexperiment after 12 h of fasting, all animals were decapitated and exsanguinated.
4.4. Lipid Extraction and Sample Preparation for Fatty Acids Analysis in Liver
Samples of liver were thawed only once and lipids were extracted from three parallel samplesof 0.2 g of hepatic tissue obtained from one animal, according to the procedure of Folch et al. with
Molecules 2020, 25, 5232 15 of 19
slight modification concerning the volumes of solvents [35,36]. Purified organic extracts obtained atthe end of Folch procedure were evaporated to dryness under a stream of nitrogen. The fat contentin hepatic tissue was estimated by weighing the dry residue. Obtained dry residue was taken forthe preparation of FAME (fatty acid methyl ester). It was subjected to hydrolysis by heating with2.5 mL of sodium methoxide in methanol (0.5 mol/L) at 80 ◦C for 10 min. Afterwards, fatty acids wereconverted to methyl esters by heating at 80 ◦C for 3 min with 2.5 mL of 14% boron trifluoride-methanolreagent. Isolation of obtained FAME with hexane (2 × 0.5 mL) was preceded by adding 1.0 mL ofsaturated sodium chloride solution. Hexane extracts were dried with anhydrous sodium sulfate andsubsequently evaporated to dryness under a stream of nitrogen. FAME obtained were diluted in 20 µLof hexane and stored at −20 ◦C for chromatographic analysis.
4.5. Preparation of the Microsomal Fraction from Rat Liver
Hepatic microsomes were prepared according to the slightly modified method of Kłyszejko-Stefanowicz [24]. After its isolation, the liver was homogenized in 0.25 M sucrose buffered to pH7.4, taking 16 mL buffer per every 4 g of the tissue. Next, it was rotated for 10 min at 1000× g inorder to discard the cell debris, then the supernatant was again rotated for 20 min, at 16,000× g.After the mitochondrial precipitate was rejected, the remaining supernatant was rotated once morefor 60 min, at 105,000× g. Then the precipitated microsomes were hung in 4 mL isolation medium.Thus, the prepared microsomal fraction was stored at the temperature of −70 ◦C until the time ofcarrying out of analysis.
4.6. Sample Preparation for Fatty Acids Analysis in Hepatic Microsomes
The hepatic microsomes were thawed only once and three parallel samples of 200µL of microsomalsuspensions from one animal were taken for lipids extraction. Briefly, a sample of microsomalsuspension was mixed with 2.5 mL of chloroform: methanol (2:1, v/v) and after vigorous shakingthe chloroform layer was separated. The residue was mixed with 1.5 mL of chloroform:methanol(2:1, v/v) and the extraction was repeated. The combined chloroform layers were centrifuged for 10 minat 1000× g and the precipitate was discarded. The organic extract was evaporated under stream ofnitrogen and the residue was taken for the preparation of FAME according to procedure which waspreviously described for liver samples.
4.7. Instrumental Analysis
Samples of FAME from hepatic tissue and from hepatic microsomes were analyzed with gaschromatography (GC) with flame-ionization detection (FID). Gas chromatograph (GC-17A gaschromatograph, Shimadzu, Kyoto, Japan) equipped with capillary column (BPX 70; 60 m × 0.25 mmi.d., film thickness 0.20 µm, SGE, Ringwood, Australia) and Helium as a carrier gas was used.The temperature program of oven was: initially 140 ◦C for 1 min, increase by 20 ◦C/min to 200 ◦C,held for 20 min, increase by 5 ◦C/min to 220 ◦C and held for 25 min. The temperature of detectorwas 270 ◦C and the temperature of the injector was 270 ◦C. FAME standards (Supelco 37 ComponentFAME Mix) and CLA FAME reference standard (Nu-Chek-Prep, INC., Elysian, MN, USA) were usedto identify the fatty acids present in the samples. The results were expressed as the percentage ofindividual fatty acid in total fatty acids’ pool.
Additionally, the peroxidability index (PI) of lipids was calculated on the basis of their FAcomposition, according to the following equation reported by Hsu et al. [37]:
PI = [(% dienoic × 1) + (% trienoic × 2) + (% tetraenoic × 3) + (% pentaenoic × 4) + (% hexaenoic × 5)] (1)
4.8. Analysis of ∆6- and ∆5-Desaturase Activities
Estimation of ∆6- and ∆5-desaturase activities was done in accordance to the modified methodoutlined by Keelan et al. [38]. For further investigations, 0.2 mL of microsomes precipitate was taken
Molecules 2020, 25, 5232 16 of 19
and incubated in the reaction mixture. Each 1.0 mL of the reaction mixture consisted of 1.25 mMNADH; 2.25 mM glutathione; 5 mM ATP; 5 mM MgCl2; 0.1 mM CoA and 0.5 mM niacinamide,dissolved in buffer pH 7.4 and 200 nM linoleic acid sodium salt. The mixture was preincubated for5 min at 37 ◦C. The reaction was initiated by adding 0.2 mL microsomes and incubating the mixture ina 90 min long shaking water bath at 37 ◦C. Further analytical procedure included extraction of lipidsdescribed by Folch et al. [39] and esterification [40]. High performance liquid chromatography withUV/VIS detector (Merck Hitachi) and YMC-Pack ODS-AM S-5 µm column was used to determineconcentrations of linoleic (LA, C18:2 n-6 cis), γ-linolenic (GLA, C18:3 n-6), dihomo-γ-linolenic (DGLA,C20:3 n-6) and arachidonic acids. The column temperature was 30 ◦C and wavelength 198 nm.
The indices of D6D and D5D activity were determined as the ratio of GLA to the LA concentrationin liver microsomes and the ratio of arachidonic acid (AA) concentration to the DGLA concentration,respectively. The differences in AA concentrations in incubated and non-incubated samples were alsocalculated, because the amount of AA synthesized in vitro from LA remained in close correlation withthe activities of the investigated enzymes. AA levels were expressed in mg per 100 mg of microsomalprotein (determined in accordance to the Lowry method [41]).
4.9. Measurement of Liver PGE2
PGE2 was measured in liver by a commercial enzyme immunoassay test kit (Prostaglandin E2
ELISA Kit-Monoclonal, Item No.514010, Cayman Chemical) according to manufacturer’s instructions.PGE2 concentrations in the samples were calculated from their corresponding absorbance values viathe standard curve. The PGE2 level was expressed in pg/mg liver protein (protein determination wasperformed by Lowry protein assay [41]).
4.10. Statistical Analysis
All data are presented as means ± standard deviation. Statistica 12.5 software (StatSoft, Kraków,Poland) was used for the statistical analysis. For variables with normal distribution obtained datawere tested with one-way ANOVA and post-hoc Tukey test (marked * in Tables). For variables withoutnormal distribution the data were tested with Kruskal–Wallis test, which is a non-parametric equivalentof one-way ANOVA, with post-hoc multiple comparison test (marked # in Tables). The acceptablelevel of significance was established at p ≤ 0.05.
5. Conclusions
This is the first report demonstrating the influence of the separate and combined administrationof PSO and BME on the composition and the metabolism of fatty acids in liver, in particular the activityof desaturases and the level of PGE2 in the liver and its microsomal fraction of rats. Applied dietarysupplements exhibited an inhibiting effect on the activity of desaturases, and thus they contributed tothe reduction in metabolites of AA. No significant intensification of the influence on the investigatedparameters resulted from combined application of PSO and BME. A beneficial effect of dietarysupplementation with BME and PSO on the formation of PGE2, which was found in the present work,can be one of the mechanisms of action of these botanicals. It is of utmost importance, as PGE2 isinvolved in the etiology of many diseases including different kinds of cancer. Obtained results revealedthat PSO or BME could become helpful in the future prevention and treatment of many diseases.However, further research in this field seems to be desired and well founded.
Author Contributions: Conceptualization, A.S. and A.B.; methodology, A.S., A.B., T.L., B.B.-K.; formal analysis,A.S.; investigation, A.S., A.B., M.G., B.B.-K., T.L.; writing—original draft preparation, A.S., A.B.; writing—reviewand editing, A.S., A.B.; supervision, B.B.-K.; project administration, A.S., A.B., T.L. All authors have read andagreed to the published version of the manuscript.
Funding: This research received no external funding.
Conflicts of Interest: The authors declare no conflict of interest.
Molecules 2020, 25, 5232 17 of 19
References
1. Jurenka, J. Therapeutic applications of pomegranate (Punica granatum L.): A review. Altern. Med. Rev.2008, 13, 128–144.
2. Banihani, S.; Swedan, S.; Alguraan, Z. Pomegranate and type 2 diabetes. Nutr. Res. 2013, 33, 341–348.[CrossRef]
3. Estrada-Luna, D.; Martinez-Hinojosa, E.; Cancino-Diaz, J.C.; Belefant-Miller, H.; Lopez-Rodriguez, G.;Betanzos-Cabrera, G. Daily supplementation with fresh pomegranate juice increases paraoxonase 1 expressionand activity in mice fed a high-fat diet. Eur. J. Nutr. 2018, 57, 383–389. [CrossRef]
4. Lansky, E.P.; Newman, R.A. Punica granatum (pomegranate) and its potential for prevention and treatment ofinflammation and cancer. J. Ethnopharmacol. 2007, 109, 177–206. [CrossRef]
5. Aviram, M.; Dornfeld, L.; Kaplan, M.; Coleman, R.; Gaitini, D.; Nitecki, S.; Hofman, A.; Rosenblat, M.;Volkova, N.; Presser, D.; et al. Pomegranate juice flavonoids inhibit LDL oxidation and cardiovasculardisease: Studies in atherosclerotic mice and in humans. Drugs Exp. Clin. Res. 2002, 28, 49–62.
6. Borowczyk, K.; Shih, D.M.; Jakubowski, H. Metabolism and neurotoxicity of homocysteine thiolactone inmice: Evidence for a protective role of paraoxonase 1. J. Alzheimers. Dis. 2012, 30, 225–231. [CrossRef][PubMed]
7. Rosenblat, M.; Hayek, T.; Aviram, M. Anti-oxidative effects of pomegranate juice (PJ) consumption bydiabetic patients on serum and on macrophages. Atherosclerosis 2006, 187, 363–371. [CrossRef] [PubMed]
8. Orgil, O.; Spector, L.; Holland, D.; Mahajna, J.; Amir, R. The anti-proliferative and anti-androgenic activity ofdifferent pomegranate accessions. J. Funct. Foods 2016, 26, 517–528. [CrossRef]
9. Białek, A.; Białek, M.; Lepionka, T.; Tober, E.; Czuderna, M. The quality determination of selected commercialonline purchased edible pomegranate seed oils with new argentometric liquid chromatography method.J. Diet. Suppl. 2020. [CrossRef]
10. Krawinkel, M.B.; Keding, G.B. Bitter gourd (Momordica charantia): A dietary approach to hyperglycemia.Nutr. Rev. 2006, 64, 331–337. [CrossRef]
11. Ray, R.B.; Raychoudhuri, A.; Steele, R.; Nerurkar, P. Bitter melon (Momordica charantia) extract inhibits breastcancer cell proliferation by modulating cell cycle regulatory genes and promotes apoptosis. Cancer Res.2010, 70, 1925–1931. [CrossRef] [PubMed]
12. Anila, L.; Vijayalakshmi, N.R. Beneficial effects of flavonoids from Sesamum indicum, Emblica officinalisand Momordica charantia. Phytother. Res. 2000, 14, 592–595. [CrossRef]
13. Raj, S.K.; Khan, M.S.; Singh, R.; Kumari, N.; Prakash, D. Occurrence of yellow mosaic geminiviral diseaseon bitter gourd (Momordica charantia) and its impact on phytochemical contents. Int. J. Food Sci. Nutr.2005, 56, 185–192. [CrossRef] [PubMed]
14. Lepionka, T.; Białek, A.; Białek, M.; Czauderna, M.; Stawarska, A.; Wrzesien, R.; Bielecki, W.; Pasko, P.;Galanty, A.; Bobrowska-Korczak, B. Mammary cancer risk and serum lipid profile of rats supplemented withpomegranate seed oil and bitter melon extract. Prostaglandins Other Lipid Mediat. 2019, 142, 33–45. [CrossRef]
15. Białek, A.; Stawarska, A.; Bodecka, J.; Białek, M.; Tokarz, A. Pomegranate seed oil influences the fattyacids profile and reduces the activity of desaturases in livers of Sprague-Dawley rats. Prostaglandins OtherLipid Mediat. 2017, 131, 9–16. [CrossRef]
16. Meerts, I.A.T.M.; Verspeek-Rip, C.M.; Buskens, C.A.F.; Keizer, H.G.; Bassaganya-Riera, J.; Jouni, Z.E.;van Huygevoort, A.H.B.M.; van Otterdijk, F.M.; van de Waart, E.J. Toxicological evaluation of pomegranateseed oil. Food Chem. Toxicol. 2009, 47, 1085–1092. [CrossRef]
17. Yoshime, L.T.; Melo, I.L.P.; Sattler, J.A.G.; Torres, R.P.; Mancini-Filho, J. Bioactive compounds and theantioxidant capacities of seed oils from pomegranate (Punica granatum L.) and bitter gourd (Momordicacharantia L.). Food Sci. Technol. 2019, 39 (Suppl. 2), 571–580. [CrossRef]
18. Enwerem, N.; Okunji, P.; Oyonumo, N.; Samson, A. Momordica Charantia (Bitter Melon): Safety and EfficacyDuring Pregnancy and Lactation. Int. J. Stud. Nurs. 2018, 3, 140–145. [CrossRef]
19. Verardo, V.; Garcia-Salas, P.; Baldi, E.; Segura-Carretero, A.; Fernandez-Gutierrez, A.; Caboni, M.F. Pomegranateseeds as a source of nutraceutical oil naturally rich in bioactive lipids. Food Res. Int. 2014, 65, 445–452. [CrossRef]
20. Sreekumar, S.; Sithul, H.; Muraleedharan, P.; Azeez, J.M.; Sreeharshan, S. Pomegranate fruit as a rich sourceof biologically active compounds. BioMed. Res. Int. 2014. [CrossRef]
Molecules 2020, 25, 5232 18 of 19
21. Białek, A.; Jelinska, M.; Tokarz, A. Influence of maternal diet enrichment with conjugated linoleicacids on lipoxygenase metabolites of polyunsaturated fatty acids in serum of their offspring with 7,12-dimethylbenz[a]anthracene induced mammary tumors. Prostaglandins Other Lipid Mediat. 2015, 116–117, 10–18.
22. Jelinska, M.; Białek, A.; Mojska, H.; Gielecinska, I.; Tokarz, A. Effect of conjugated linoleic acid mixturesupplemented daily after carcinogen application on linoleic and arachidonic acid metabolites in rat serumand induced tumours. Biochim. Biophy. Acta 2014, 1842, 2230–2236. [CrossRef] [PubMed]
23. Białek, A.; Tokarz, A.; Zagrodzki, P. Conjugated linoleic acids in diet of female rats inhibit the breats cancerformation in their offspring. J. Food Nutr. Res. 2014, 53, 39–50.
24. Stawarska, A.; Białek, A.; Tokarz, A. Heating of vegetable oils influences the activity of enzymes participatingin arachidonic acid formation in Wistar rats. Nutr. Res. 2015, 35, 930–938. [CrossRef]
25. Stawarska, A.; Białek, A.; Stanimirova, I.; Stawarski, T.; Tokarz, A. The effect of conjugated linoleic acids(CLA) supplementation on the activity of enzymes participating in the formation of arachidonic acid inliver microsomes of rats—Probable mechanism of CLA anticancer activity. Nutr. Cancer 2015, 67, 145–155.[PubMed]
26. Białek, A.; Jelinska, M.; Tokarz, A.; Pergół, A.; Pinkiewicz, K. Influence of pomegranate seed oil and bittermelon aqueous extract on polyunsaturated fatty acids and their lipoxygenase metabolites concentration inserum of rats. Prostaglandins Other Lipid Mediat. 2016, 126, 29–37. [CrossRef]
27. Yamasaki, M.; Kitagawa, T.; Koyanagi, N.; Chujo, H.; Maeda, H.; Kohno-Murase, J.; Imamura, J.; Tachibana, H.;Yamada, K. Dietary effect of pomegranate seed oil on immune function and lipid metabolism in mice. Nutrition2006, 22, 54–59. [CrossRef]
28. Tsuzuki, T.; Kawakami, Y.; Abe, R.; Nakagawa, K.; Koba, K.; Imamura, J.; Iwata, T.; Ikeda, I.; Miyazawa, T.Conjugated linolenic acid is slowly absorbed in rat intestine, but quickly converted to conjugated linoleicacid. J. Nutr. 2006, 136, 2153–2159. [CrossRef]
29. Tsuzuki, T.; Tokuyama, Y.; Igarashi, M.; Nakagawa, K.; Ohsaki, Y.; Komai, M. Alpha-eleostearic acid(9Z11E13E-18:3) is quickly converted to conjugated linoleic acid (9Z11E-18:2) in rats. J. Nutr. 2004, 134, 2634–2639.[CrossRef]
30. Pereira de Melo, I.L.; de Oliveira e Silva, A.M.; Teixeira de Carvalho, E.B.; Yoshime, L.T.; Sattler, J.A.G.;Mancini-Filho, J. Incorporation and effects of punicic acid on muscle and adipose tissues of rats. Lipids Health Dis.2016, 15, 40. [CrossRef] [PubMed]
31. Czumaj, A.; Sledzinski, T. Biological Role of Unsaturated Fatty Acid Desaturases in Health and Disease.Nutrients 2020, 12, 356. [CrossRef] [PubMed]
32. Miranda, J.; Arias, N.; Fernández-Quintela, A.; del Puy Portillo, M. Are conjugated linolenic acid isomers analternative to conjugated linoleic acid isomers in obesity prevention? Endocrinol. Nutr. 2014, 61, 209–219.[CrossRef]
33. Mashhadi, Z.; Boeglin, W.E.; Brash, A.R. Robust inhibitory effects of conjugated linolenic acids on acyclooxygenase-related linoleate 10S-dioxygenase: Comparison with COX-1 and COX-2. Biochim. Biophys. Acta2015, 1851, 1346–1352. [CrossRef] [PubMed]
34. Wang, L.S.; Huang, Y.W.; Liu, S.; Chang, H.L.; Ye, W.; Shu, S.; Sugimoto, Y.; Funk, J.A.; Smeak, D.D.; Hill, L.;et al. Conjugated Linoleic Acid (CLA) Modulates Prostaglandin E2 (PGE2) Signaling in Canine MammaryCells. Anticancer Res. 2006, 26, 889–898.
35. Białek, A.; Stawarska, A.; Tokarz, A.; Czuba, K.; Konarska, A.; Mazurkiewicz., M. Enrichment of maternaldiet with conjugated linoleic acids influences desaturases activity and fatty acids profile in livers andhepatic microsomes of the offspring with 7,12-dimethylbenz[a]anthracene-induced mammary tumors.Acta Pol. Pharm. 2014, 71, 747–761.
36. Bondia-Pons, I.; Molto-Puigmarti, C.; Castellote, A.I.; Lopez-Sabater, M.C. Determination of conjugatedlinoleic acid in human plasma by gas chromatography. J. Chromat. A 2007, 1157, 422–429. [CrossRef][PubMed]
37. Hsu, H.C.; Lee, Y.T.; Chen, M.F. Effects of fish oil and vitamin E on the antioxidant defense system indiet-induced hypercholesterolemic rabbits. Prostaglandins Other Lipid Mediat 2001, 66, 99–108. [CrossRef]
38. Keelan, M.; Clandinin, M.T.; Thomson, A.B.R. Dietary lipids influence the activity of ∆5-desaturase andphospholipid fatty acids in rat enterocyte microsomal membranes. Can. J. Physiol. Pharm. 1997, 75, 1009–1014.[CrossRef]
Molecules 2020, 25, 5232 19 of 19
39. Folch, J.; Lees, M.; Sloane Stanley, G.H. A simple method for the isolation and purification of total lipidsfrom animals. J. Biol. Chem. 1957, 226, 497–509.
40. Raclot, T.; Groscolas, R. Differential mobilization of white adipose tissue fatty acids according to chain length,unsaturation, and positional isomerism. J. Lipid Res. 1993, 34, 1515–1526. [PubMed]
41. Lowry, D.H.; Rosenbrough, J.J.; Farr, A.A.; Randal, R.J. Protein measurement with the Folin phenol reagent.J. Biol. Chem. 1951, 193, 265–275. [PubMed]
Sample Availability: Samples of the compounds are not available from the authors.
Publisher’s Note: MDPI stays neutral with regard to jurisdictional claims in published maps and institutionalaffiliations.
© 2020 by the authors. Licensee MDPI, Basel, Switzerland. This article is an open accessarticle distributed under the terms and conditions of the Creative Commons Attribution(CC BY) license (http://creativecommons.org/licenses/by/4.0/).
Copyright © 2022 FDOKUMEN