POLITYKI EUROPEJSKIE, FINANSE i MARKETING - Wydział ...
182
ZESZYTY NAUKOWE Szkoły Głównej Gospodarstwa Wiejskiego w Warszawie SCIENTIFIC JOURNALS Warsaw University of Life Sciences – SGGW POLITYKI EUROPEJSKIE, FINANSE i MARKETING NR 15 (64) 2016 EUROPEAN POLICIES, FINANCE AND MARKETING NO 15 (64) 2016 Wydawnictwo SGGW Warszawa 2016 Warsaw University of Life Sciences – SGGW Press Warsaw 2016
-
Upload
khangminh22 -
Category
Documents
-
view
2 -
download
0
Transcript of POLITYKI EUROPEJSKIE, FINANSE i MARKETING - Wydział ...
ZESZYTY NAUKOWE
Szkoły Głównej Gospodarstwa Wiejskiego w Warszawie
SCIENTIFIC JOURNALS
Warsaw University of Life Sciences – SGGW
POLITYKI EUROPEJSKIE, FINANSE i MARKETING
NR 15 (64) 2016
EUROPEAN POLICIES, FINANCE AND MARKETING
NO 15 (64) 2016
Wydawnictwo SGGW
Warszawa 2016
Warsaw University of Life Sciences – SGGW Press Warsaw 2016

RADA PROGRAMOWA Bogdan Klepacki (SGGW) – prof. dr hab., Szkoła Główna Gospodarstwa Wiejskiego w Warszawie – Przewodniczący Mieczysław Adamowicz – prof. dr hab. dr h.c., Szkoła Główna Gospodarstwa Wiejskiego w Warszawie – Wiceprzewodniczący Marian Podstawka – prof. dr hab., Szkoła Główna Gospodarstwa Wiejskiego w Warszawie Janusz Żmija – prof. dr hab. dr h.c., Uniwersytet Rolniczy w Krakowie Andrzej P. Wiatrak – prof. dr hab., Uniwersytet Warszawski Lubica Bartova – prof., Slovak Agricultural University in Nitra, Słowacja Julian Briz – prof., Universidad Politecnica de Madrid, Hiszpania Francęsco Sotte – prof., Universita Politecnica delle Marche Ancona, Włochy Sandra Krtalic, Full Professor – Academic Unit for Finance, Department of Economics and Tourism, Juraj Dobrali University of Pula, Chorwacja KOMITET REDAKCYJNY Marian Podstawka, prof. dr hab. – Redaktor Naczelny Aleksandra Wicka, dr inż. – Redaktor Prowadzący Janina Sawicka, prof. dr hab. Agnieszka Biernat-Jarka, dr Marzena Lemanowicz, dr Halina Powęska, dr Eugeniusz Pudełkiewicz, prof. SGGW dr hab., redaktor tematyczny (marketing) Aleksandra Wicka, dr inż. – redaktor tematyczny (ubezpieczenia) Agnieszka Parlińska, dr inż. – redaktor tematyczny (finanse) Agata Kropiwiec, mgr – redaktor językowy, język polski Christian Richter, dr – redaktor językowy, język angielski Wiesław Szczesny – prof. SGGW dr hab., redaktor statystyczny Katarzyna Idźkowska, mgr – sekretarz redakcji PROJEKT OKŁADKI – Tomasz Tabor REDAKCJA TECHNICZNA – Krystyna Piotrowska ADRES KORESPONDENCYJNY Szkoła Głowna Gospodarstwa Wiejskiego w Warszawie Wydział Nauk Ekonomicznych Katedra Polityki Europejskiej, Finansów Publicznych i Marketingu ul. Nowoursynowska 166, 02-787 Warszawa tel./fax: 22 593 40 77; e-mail: [email protected] ISSN 2081-3430 Wydawnictwo SGGW ul. Nowoursynowska 166, 02-787 Warszawa tel. (22) 593 55 20 (-22, -25 – sprzedaż), fax (22) 593 55 21 e-mail: [email protected], www.wydawnictwosggw.pl Druk: Agencja Reklamowo-Wydawnicza A. Grzegorczyk, www.grzeg.com.pl
SPIS TREŚCI
Adam Andrzejuk Stopy zwrotu na rynku kapitałowym w kontekście fuzji i przejęć – studium przypadku RATE OF RETURN FROM CAPITAL MARKETS IN THE CONTEXT OF MERGERS AND ACQUISITIONS – CASE STUDY .......................................................................................... 5 Lechosław Garbarski Edukacja w zakresie marketingu a jego wizerunek w Polsce MARKETING EDUCATION AND IMAGE OF MARKETING IN POLAND ............................. 18 Zbigniew Gołaś Zróżnicowanie opóźnień płatniczych w przedsiębiorstwach sektora B2B krajów Europy Wschodniej DIFFERENTIATION OF PAYMENT DELAYS IN THE B2B SECTOR ENTERPRISES IN EASTERN EUROPE .................................................................................................................. 29 Bogdan Gregor, Magdalena Kalińska-Kula MARKET INTELLIGENCE – A CONCEPTUAL APPROACH ................................................... 42 Mariusz Grębowiec Rola marki w procesie podejmowania decyzji zakupu produktów mleczarskich na przykładzie rynku jogurtów THE ROLE OF BRAND IN THE PURCHASE DECISION MAKING OF DAIRY PRODUCTS FOR EXAMPLE YOGHURT MARKET ........................................................................................ 55 Wojciech Grzegorczyk THE PROBLEMS OF MARKETING PERFORMANCE MEASUREMENT ................................ 68 Witold Kowal VARYING LEVELS OF IMPORTANCE ATTRIBUTED TO MARKETING OUTCOMES FOR THE PURPOSES OF EVALUATIONS OF ORGANIZATIONAL EFFECTIVENESS IN THE LIGHT OF A STUDY INVOLVING COMPANY MANAGERS .................................... 75 Eugeniusz Michalski MARKETING MANAGEMENT OF ENTERPRISE ..................................................................... 84 Bogdan Mróz CONSUMER SOVEREIGNTY AT A TIME OF GLOBALIZATION AND ICT EXPANSION ................................................................................................................... 96 Agata Niemczyk FREE TIME AS A DETERMINANT OF ECONOMIC DEVELOPMENT CULTURAL CONTEXT ..................................................................................................................................... 104

Emilia Głowacka, Wojciech Pizło Oszczędności gospodarstw domowych emerytów zamieszkujących tereny wiejskie – studium przypadku HOUSEHOLD SAVINGS OF PENSIONERS LIVING IN RURAL AREAS- STUDIUM CASE .......................................................................................................................... 116 Edyta Rudawska, Ewa Frąckiewicz, Małgorzata Wiścicka SUSTAINABLE MARKETING MIX – THE BASIC ASSUMPTIONS ...................................... 130 Łukasz Satoła Wykorzystanie funduszy Unii Europejskiej na inwestycje komunalne a ograniczanie zadłużenia samorządów THE USE OF EUROPEAN UNION FUNDS FOR MUNICIPAL INVESTMENTS AND LIMITING DEBT OF LOCAL GOVERNMENTS ............................................................. 139 Maria Sławińska CHANGES TO RETAIL BUSINESS MODELS - OVERVIEW OF THE DETERMINING FACTORS ..................................................................................................................................... 149 Andrzej Szromnik CITY PLACEMENT – INNOVATIONAL MEANS OF PROMOTING CITIES ........................ 161 Jan W. Wiktor Próba analizy bibliometrycznej publikacji 25. Zjazdu katedr marketingu, handlu i konsumpcji - Doświadczenia przeszłości i wyzwania przyszłości AN ATTEMPT OF BIBLIOMETRIC ANALYSIS OF THE PUBLICATIONS FROM THE 25TH CONGRESS OF MARKETING, COMMERCE AND CONSUMPTION DEPARTMENTS - EXPERIENCES OF THE PAST AND CHALLENGES OF THE FUTURE .... 170

5
15 (64) 2016
Adam Andrzejuk Szkoła Główna Gospodarstwa Wiejskiego w Warszawie
Stopy zwrotu na rynku kapitałowym w kontekście fuzji i przejęć – studium przypadku
RATE OF RETURN FROM CAPITAL MARKETS IN THE CONTEXT OF MERGERS AND ACQUISITIONS – CASE
STUDY
W artykule została przedstawiona analiza wpływu przejęcia spółki TVN SA przez Scripps Networks Interactive Inc na zyski inwestorów trzymających akcje w różnych okresach czasowych. Z uwagi na fakt, że obie spółki reprezentują branżę dóbr informacyjnych, na początku została zaprezentowana definicja oraz główne cechy tej branży. Dobra informacyjne często charakteryzują się krótkim cyklem życia produktu. Z tego powodu spółki działające w tej branży często stoją przed dylematem czy samodzielnie tworzyć produkt czy też przejąć już gotową firmę posiadająca taki produkt. Samodzielne tworzenie dobra informacyjnego pociąga za sobą wysokie ryzyko kosztów bezpowrotnie utraconych jeśli produkt okaże się klapą. Przejęcie spółki z gotowym produktem często wiąże się z zapłaceniem premii za przejęcie. Głównym założeniem jest hipoteza efektywności rynków. Celem artykułu było zbadanie jak wezwanie do sprzedaży akcji spółki branży dóbr informacyjnych notowanej na giełdzie papierów wartościowych, wpłynęło na zyski inwestorów trzymających akcje w różnych okresach czasowych, oraz jaką premię za przejęcie musiała zapłacić spółka przejmująca. Posłużono się metodą średnich skumulowanych nadzwyczajnych stóp zwrotu.
Słowa kluczowe: dobra informacyjne, fuzje, przejęcia, koncentracja przedsiębiorstw, stopy zwrotu
Wstęp Rozwój Internetu jako medium dystrybucji danych i informacji w postaci oprogramowania, zdjęć, muzyki, filmów stworzył całkowicie nowe szanse dla branży dóbr informacyjnych. Ale czym właściwie są dobra informacyjne? Nad tym problemem pochylili się Varian i Shapiro definiując dobra informacyjne jako wszystko to co można zapisać w wersji cyfrowej. Nie ma wymogu, że informacja ta musi już być zapisane na jakimś nośniku, chodzi przede wszystkim o możliwość zapisu [Varian, 1998]. Dobra informacyjne posiadają także swoistą charakterystykę. Varian wyróżnia trzy główne cechy dóbr informacyjnych:
1. Dobra doświadczeniowe (experience goods) – nie da się bezpośrednio dotknąć dobra informacyjnego, aby je poznać trzeba je doświadczyć. Nabywając dobra
6
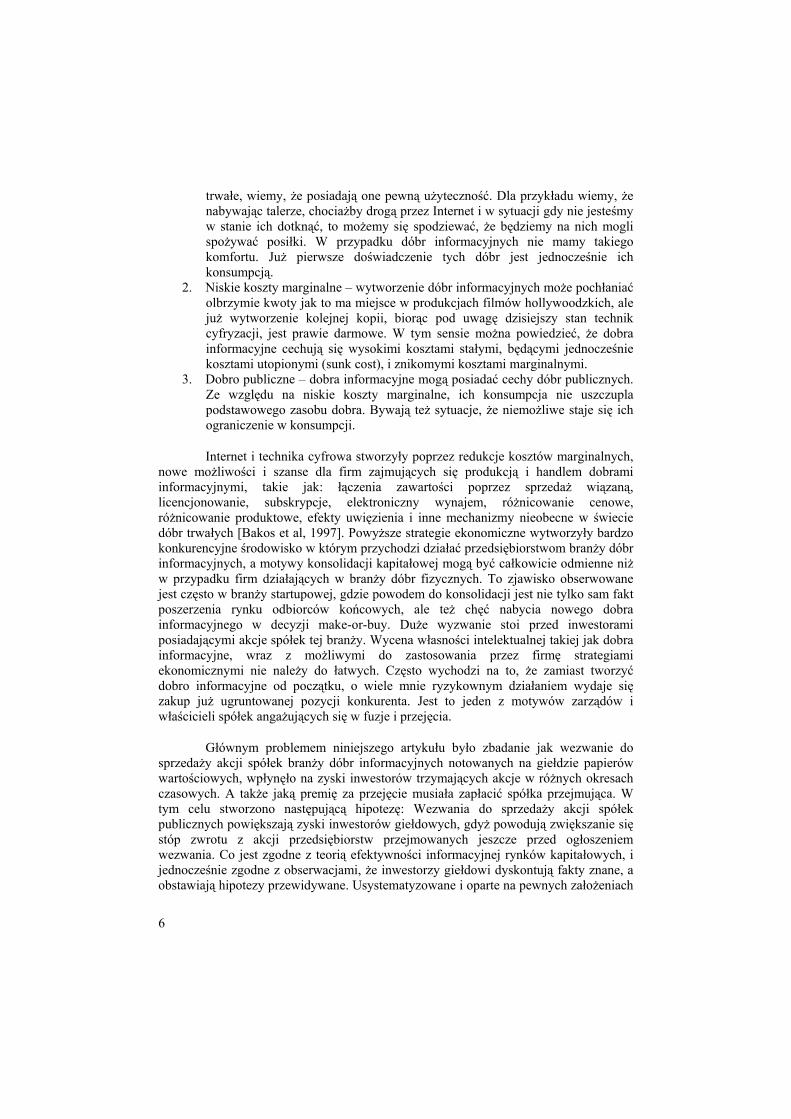
trwałe, wiemy, że posiadają one pewną użyteczność. Dla przykładu wiemy, że nabywając talerze, chociażby drogą przez Internet i w sytuacji gdy nie jesteśmy w stanie ich dotknąć, to możemy się spodziewać, że będziemy na nich mogli spożywać posiłki. W przypadku dóbr informacyjnych nie mamy takiego komfortu. Już pierwsze doświadczenie tych dóbr jest jednocześnie ich konsumpcją.
2. Niskie koszty marginalne – wytworzenie dóbr informacyjnych może pochłaniać olbrzymie kwoty jak to ma miejsce w produkcjach filmów hollywoodzkich, ale już wytworzenie kolejnej kopii, biorąc pod uwagę dzisiejszy stan technik cyfryzacji, jest prawie darmowe. W tym sensie można powiedzieć, że dobra informacyjne cechują się wysokimi kosztami stałymi, będącymi jednocześnie kosztami utopionymi (sunk cost), i znikomymi kosztami marginalnymi.
3. Dobro publiczne – dobra informacyjne mogą posiadać cechy dóbr publicznych. Ze względu na niskie koszty marginalne, ich konsumpcja nie uszczupla podstawowego zasobu dobra. Bywają też sytuacje, że niemożliwe staje się ich ograniczenie w konsumpcji.
Internet i technika cyfrowa stworzyły poprzez redukcje kosztów marginalnych, nowe możliwości i szanse dla firm zajmujących się produkcją i handlem dobrami informacyjnymi, takie jak: łączenia zawartości poprzez sprzedaż wiązaną, licencjonowanie, subskrypcje, elektroniczny wynajem, różnicowanie cenowe, różnicowanie produktowe, efekty uwięzienia i inne mechanizmy nieobecne w świecie dóbr trwałych [Bakos et al, 1997]. Powyższe strategie ekonomiczne wytworzyły bardzo konkurencyjne środowisko w którym przychodzi działać przedsiębiorstwom branży dóbr informacyjnych, a motywy konsolidacji kapitałowej mogą być całkowicie odmienne niż w przypadku firm działających w branży dóbr fizycznych. To zjawisko obserwowane jest często w branży startupowej, gdzie powodem do konsolidacji jest nie tylko sam fakt poszerzenia rynku odbiorców końcowych, ale też chęć nabycia nowego dobra informacyjnego w decyzji make-or-buy. Duże wyzwanie stoi przed inwestorami posiadającymi akcje spółek tej branży. Wycena własności intelektualnej takiej jak dobra informacyjne, wraz z możliwymi do zastosowania przez firmę strategiami ekonomicznymi nie należy do łatwych. Często wychodzi na to, że zamiast tworzyć dobro informacyjne od początku, o wiele mnie ryzykownym działaniem wydaje się zakup już ugruntowanej pozycji konkurenta. Jest to jeden z motywów zarządów i właścicieli spółek angażujących się w fuzje i przejęcia.
Głównym problemem niniejszego artykułu było zbadanie jak wezwanie do sprzedaży akcji spółek branży dóbr informacyjnych notowanych na giełdzie papierów wartościowych, wpłynęło na zyski inwestorów trzymających akcje w różnych okresach czasowych. A także jaką premię za przejęcie musiała zapłacić spółka przejmująca. W tym celu stworzono następującą hipotezę: Wezwania do sprzedaży akcji spółek publicznych powiększają zyski inwestorów giełdowych, gdyż powodują zwiększanie się stóp zwrotu z akcji przedsiębiorstw przejmowanych jeszcze przed ogłoszeniem wezwania. Co jest zgodne z teorią efektywności informacyjnej rynków kapitałowych, i jednocześnie zgodne z obserwacjami, że inwestorzy giełdowi dyskontują fakty znane, a obstawiają hipotezy przewidywane. Usystematyzowane i oparte na pewnych założeniach
7
rozwiązanie teoretyczne, przybliżające do odpowiedzi na pytania, czy i w jakim stopniu rynki są efektywne, zaproponował w 1970 roku E. F. Fama [Kamiński et al., 2010]. W myśl teorii efektywności, spółki notowane na efektywnych rykach giełdowych są wyceniane z uwzględnieniem wszystkich publicznie dostępnych informacji o charakterze zarówno technicznym, jak i fundamentalnym [Kamiński et al. za Gabryś, 2010]. Teoretycznie inwestorzy kupujący lub sprzedający walory na efektywnym rynku nie powinni móc osiągnąć ponadprzeciętnych stóp zwrotu, ponieważ papiery wartościowe są zawsze wycenione na właściwym poziomie [Kamiński et al. za Cunningham, 2010].
Analiza W celu zweryfikowania powyższej hipotezy należało obliczyć stopy zwrotu dla inwestorów w różnych odstępach czasowych. W tym celu określono grupę badawczą. Zdecydowano się na wyszukanie spółek publicznych sektora dóbr informacyjnych zgodnych z wyżej omówioną definicją, z amerykańskiego indeksu S&P500, oraz polskiego indeksu WIG. Z uwagi na fakt, że żaden z wyżej wymienionych indeksów nie określa oficjalnie branży dóbr informacyjnych, spółek zajmujących się handlem lub produkcją takich dóbr poszukiwano w sektorach mediów oraz informatyki. W przypadku indeksu S&P500 wyodrębniono 44 spółki działające w branży dóbr informacyjnych. W przypadku indeksu WIG wyodrębniono 37 spółek w tej samej branży. Jak wynika z analizy charakterystyki działalności poszczególnych spółek z rynku amerykańskiego i polskiego, oba sektory stanowią najbardziej przybliżony odpowiednik spółek zajmujących się produkcją i handlem dobrami informacyjnymi.

8
Tabela 1. Spółki sektora mediów oraz informatyki z indeksu S&P500
Lp S&P500 Sektor GiełdaKapitalizacja
15.10.20151 Adobe Systems Inc Application Software NASDAQ 41,80B2 Autodesk Inc Application Software NASDAQ 11,62B3 Oracle Corporation Application Software NYSE 158,90B4 Symantec Corporation Application Software NASDAQ 13,99B5 Teradata Corporation Application Software NYSE 4,02B6 CBS Corporation Broadcasting & Cable TV NYSE 20,65B7 Comcast Corporation Broadcasting & Cable TV NASDAQ 150,44B8 Discovery Communications Broadcasting & Cable TV NASDAQ 11,70B9 Scripps Networks Interactive Inc. Broadcasting & Cable TV NYSE 7,10B
10 Time Warner Inc. Broadcasting & Cable TV NYSE 57,93B11 Viacom Inc. Broadcasting & Cable TV NASDAQ 18,85B12 The Walt Disney Company Broadcasting & Cable TV NYSE 178,46B13 Activision Blizzard Home Entertainment SoftwNASDAQ 24,07B14 Electronic Arts Home Entertainment SoftwNASDAQ 22,00B15 News Corporation Publishing NASDAQ 8,17B16 Tegna Publishing NYSE 5,67B17 Twenty-First Century Fox Publishing NASDAQ 56,75B18 CA Inc. Systems Software NASDAQ 12,64B19 Microsoft Corporation Systems Software NASDAQ 373,35B20 Red Hat Inc. Systems Software NYSE 13,73B21 Interpublic Group Advertising NYSE 8,56B22 Omnicom Group Advertising NYSE 17,22B23 Amazon.com Inc Internet Retail NASDAQ 254,82B24 TripAdvisor Internet Retail NASDAQ 12,06B25 Akamai Technologies Inc Internet Software & ServiceNASDAQ 12,55B26 Automatic Data Processing Internet Software & ServiceNASDAQ 39,61B27 Citrix Systems Internet Software & ServiceNASDAQ 11,82B28 eBay Inc. Internet Software & ServiceNASDAQ 29,23B29 Equinix Internet Software & ServiceNASDAQ 16,13B30 Facebook Internet Software & ServiceNASDAQ 265,05B31 Fidelity National Information Services Internet Software & ServiceNYSE 19,54B32 Fiserv Inc Internet Software & ServiceNASDAQ 21,33B33 Alphabet Inc Internet Software & ServiceNASDAQ 456,39B34 Intuit Inc. Internet Software & ServiceNASDAQ 25,07B35 Mastercard Inc. Internet Software & ServiceNYSE 107,58B36 NetApp Internet Software & ServiceNASDAQ 9,99B37 Netflix Inc. Internet Software & ServiceNASDAQ 46,96B38 Paychex Inc. Internet Software & ServiceNASDAQ 17,86B39 Salesforce.com Internet Software & ServiceNYSE 50,34B40 Total System Services Internet Software & ServiceNYSE 8,83B41 Verisign Inc. Internet Software & ServiceNASDAQ 8,44B42 Visa Inc. Internet Software & ServiceNYSE 180,52B43 Western Union Co Internet Software & ServiceNYSE 9,57B44 Yahoo Inc. Internet Software & ServiceNASDAQ 30,21B Źródło: opracowanie własne na podstawie danych z Morningstar, Inc.

9
Tabela 2. Spółki sektora mediów oraz informatyki z indeksu WIG
Lp WIG Sektor GiełdaKapitalizacja
15.10.20151 CYFRPLSAT Media Warsaw 15,99B2 AGORA Media Warsaw 517,17M3 WIRTUALNA Media Warsaw 1,11B4 SMT Media Warsaw 192,47M5 ATMGRUPA Media Warsaw 289,99M6 KINOPOL Media Warsaw 272,54M7 K2INTERNT Media Warsaw 32,68M8 4FUNMEDIA Media Warsaw 20,76M9 MUZA Media Warsaw 9,01M
10 ASSECOPOL Informatyka Warsaw 4,56B11 CDPROJEKT Informatyka Warsaw 2,54B12 COMARCH Informatyka Warsaw 980,07M13 MEDICALG Informatyka Warsaw 715,29M14 ASSECOBS Informatyka Warsaw 484,56M15 COMP Informatyka Warsaw 334,38M16 ATM Informatyka Warsaw 336,90M17 LIVECHAT Informatyka Warsaw 897,39M18 CIGAMES Informatyka Warsaw 324,92M19 ASSECOSEE Informatyka Warsaw 513,23M20 SYGNITY Informatyka Warsaw 110,54M21 QUMAK Informatyka Warsaw 109,35M22 ATENDE Informatyka Warsaw 92,31M23 ELZAB Informatyka Warsaw 244,96M24 WINDMOBIL Informatyka Warsaw 98,65M25 WASKO Informatyka Warsaw 175,99M26 MCLOGIC Informatyka Warsaw 75,36M27 CUBEITG Informatyka Warsaw 45,21M28 IVMX Informatyka Warsaw 74,36M29 INDATA Informatyka Warsaw 52,01M30 SIMPLE Informatyka Warsaw 40,34M31 OPTEAM Informatyka Warsaw 72,27M32 TALEX Informatyka Warsaw 53,70M33 NTTSYSTEM Informatyka Warsaw 33,24M34 BETACOM Informatyka Warsaw 21,15M35 LSISOFT Informatyka Warsaw 14,93M36 PROCAD Informatyka Warsaw 14,97M37 TVN Media Warsaw 6,78B Źródło: opracowanie własne na podstawie danych z gpw.pl
Kolejnym etapem poszukiwania było znalezienie spółek uczestniczących w transakcji fuzji lub przejęcia. Tu z pomocą przyszła niedawna transakcja nabycia akcji polskiej spółki TVN SA, notowanej na warszawskiej giełdzie papierów wartościowych, przez Scripps Networks Interactive Inc ze Stanów Zjednoczonych notowanej na NYSE, która odbiła się głośnym echem w świecie finansów. Wezwanie do zapisów na sprzedaż akcji spółki TVN SA zostało ogłoszone dnia 6 lipca 2015 roku. Akcje objęte wezwaniem

10
były nabywane po cenie w wysokości 20,00 zł za jedną Akcję. Cena ta była jednakowa dla wszystkich Akcji Spółki.
Wykres 1. Wpływ ogłoszenia wezwania na kurs akcji spółki TVN SA Źródło: opracowanie własne na podstawie danych z gpw.pl
Na wykresie 1 ukazano kształtowanie się kursu akcji spółki TVN SA w okresie od lipca 2014 roku do lipca 2015 roku. Za pomocą strzałki wskazany został czas ogłoszenia wezwania do zapisów na sprzedaż akcji spółki TVN SA. W dalszych badaniach przeprowadzono dogłębną analizę wpływu przejęcia spółki TVN SA na stopy zwrotu dla inwestorów giełdowych. W celu realizacji tego zadania podjęto następujące działania:
1. Zdefiniowano okres badań. 2. Obliczono normalne oczekiwane stopy zwrotu z akcji. 3. Obliczono nadzwyczajne stopy zwrotu z akcji. 4. Obliczono nadzwyczajne skumulowane stopy zwrotu z akcji .
Ad 1. Dzień ogłoszenia wezwania określony jest jako dzień zerowy w tym przypadku jest to 6 lipca 2015 roku. Różni autorzy w swoich badaniach przyjmują różne okresy. M. Firth przyjmuje w swoich badaniach okres ±40 dni, C.Loderer i H. Zimmermann przyjmują natomiast okres ±10 miesięcy [Kraciuk za Neumann, 1994]. Jak ukazano na rysunku 1, długość badanego okresu została przyjęta na 30 dni przed i po ogłoszeniu wezwania do sprzedaży akcji, jak również okresy 10 dni i 5 dni.
Ogłoszenie wezwania

11
Rysunek 1. Okresy czasu przyjęte do obliczania normalnych i nadzwyczajnych stóp zwrotu Źródło: J.Kraciuk na podstawie [Neuman 1994].
Ad 2. W celu obliczenia normalnej stopy zwrotu, przyjęto za Neumanem okres (-230) – (-30) dni od dnia zerowego [Kraciuk za Neuman 1994]. Ponadto, posłużono się wzorem na tzw. logarytmiczną stopę zwrotu, ma to na celu wykorzystanie m.in. właściwości addytywnych funkcji wykładniczych. Jednocześnie, zastosowano model średnich skorygowanych polegający na obliczeniu rzeczywistych logarytmicznych stóp zwrotu dla okresu 200 dni poprzedzających okres 30 dni przed wezwaniem do sprzedaży akcji.
= ln( )
Gdzie – stanowi cenę waloru w dniu t, a cenę tego waloru w dniu poprzednim.
Wykres 2. Normalna stopa zwrotu dla akcji spółki TVN SA Źródło: opracowanie własne na podstawie danych z gpw.pl
-30 -230 +30 -10 +10 -5 +5
Obliczanie normalnych stóp zwrotu Obliczanie nadzwyczajnych stóp zwrotu
Wezwanie do sprzedaży akcji

12
Staystyka opisowa dla normalnych logarytmicznych stóp zwrotu akcji spółki
TVN SA
Średnia 0,001185915Błąd standardowy 0,001052403Odchylenie standardowe 0,014883226Wariancja próbki 0,00022151Kurtoza 0,05290322Skośność 0,275459219Zakres 0,074820883Maksimum 0,041382497Suma 0,237183058Licznik 200Źródło: opracowanie własne na podstawie danych z gpw.pl
Następnie dokonano obliczenia średniej logarytmicznej stopy zwrotu dla spółki TVN SA dla okresu poprzedzającego okres 30 dni przed wezwaniem do sprzedaży.
= *
Gdzie – stanowi średnią logarytmiczną stopę zwrotu j-tej spółki w okresie 200 dni poprzedzających badany okres obliczoną według modelu średnich skorygowanych. Średnia logarytmiczna stopa zwrotu TVN w okresie 200 dni poprzedzających badany okres wyniosła 0,001185915.
Ad 3. W kolejnym kroku obliczono nadzwyczajne stopy zwrotu dla akcji TVN SA w każdym analizowanym dniu. Stanowi ją różnica między stopą zwrotu rzeczywiście zaobserwowaną w danym dniu a normalną stopą zwrotu obliczona przy zastosowaniu modelu średnich skorygowanych.
= -
Gdzie – stanowi nadzwyczajna stopę zwrotu z akcji j w czasie t

13
Wykres 3. Nadzwyczajne stopy zwrotu dla akcji spółki TVN SA Źródło: opracowanie własne na podstawie danych z gpw.pl
Na wykresie 3 przedstawiono obliczenia nadzwyczajnych stóp zwrotu dla każdego dnia z przedziału ±30 dni względem daty ogłoszenia wezwania. Największy wzrost nadzwyczajnych stóp zwrotu można zaobserwować jeszcze przed ogłoszeniem wezwania. Po ogłoszeniu wezwania zakres wahań kursów akcji ulega znacznemu spłaszczeniu.
Staystyka opisowa dla nadzwyczajnych stóp zwrotu dla akcji
TVN SA
Średnia 0,000176Błąd standardowy 0,000878Odchylenie standardowe 0,014179Wariancja próbki 0,000201Kurtoza 3,687345Skośność 0,898695Zakres 0,114053Maksimum 0,079429Suma 0,045862Licznik 260Źródło: opracowanie własne na podstawie danych z gpw.pl
Ad 4. Finalnym etapem badań było obliczenie skumulowanych nadzwyczajnych stóp zwrotu dla okresu od t = -30 do t = 30, od t = -10 do t = 10 oraz od t = -5 do t = 5.
= = =

14
Wykres 4. Skumulowane nadzwyczajne stopy zwrotu dla akcji spółki TVN SA w okresie 5 dni Źródło: opracowanie własne na podstawie danych z gpw.pl
Analizując wykres 4 oraz dane za okres od t=-5 do t=5, uzyskano skumulowaną nadzwyczajną stopę zwrotu w wysokości 2,3%. Wynika z tego, że inwestorzy którzy dokonali transakcji kupna walorów spółki TVN SA tuż przed ogłoszeniem wezwania, mogli liczyć na zysk nadzwyczajny.
Wykres 5. Skumulowane nadzwyczajne stopy zwrotu dla akcji spółki TVN SA w okresie 10 dni Źródło: opracowanie własne na podstawie danych z gpw.pl Analizując wykres 5 oraz dane za okres od t=-10 do t=10, uzyskano
skumulowaną nadzwyczajną stopę zwrotu w wysokości 0,9%. W tym przypadku stopa
Ogłoszenie wezwania
Ogłoszenie wezwania

15
zysku nadzwyczajnego jest niższa niż stopa zysku nadzwyczajnego z okresu ±5 dni. Wpływ na to miał wcześniejszy spadek cen akcji spółki TVN SA w oczekiwaniu na ogłoszenie wezwania.
Wykres 6. Skumulowane nadzwyczajne stopy zwrotu dla akcji spółki TVN SA w okresie 30 dni Źródło: opracowanie własne na podstawie danych z gpw.pl
Analizując wykres 6 oraz dane za okres od t=-30 do t=30, uzyskano skumulowaną nadzwyczajną stopę zwrotu w wysokości 4,6%. Była to najwyższa skumulowana stopa zwrotu spośród analizowanych okresów. Według badań Lewandowskiego, który przytacza m.in. wyniki nadzwyczajnych stóp zwrotu dla firm nabywanych na rynku amerykańskim, stopy te w przypadku fuzji i przejęć wynoszą od 20% do 35% [Lewandowski, 2001]. Zatem nadzwyczajna stopa zwrotu w wysokości 4,6% dla inwestorów trzymających akcje TVN SA przez okres t=±30 dni na rynku polskim nie jest wygórowana w stosunku do rynku amerykańskiego. Jednocześnie w tym kontekście premia jaką musiała zapłacić spółka Scripps Networks Interactive za przejęcie TVN SA również nie wydaje się być zbyt wygórowana. Trzeba jednak zaznaczyć, że badania Lewandowskiego przeprowadzone były dla rynku amerykańskiego.
Podsumowanie Przeprowadzone badania wykazały, że inwestorzy posiadający akcje spółki TVN SA mieli okazję do uzyskania nadzwyczajnych stóp zwrotu w wyniku wezwania do sprzedaży akcji ogłoszonego przez spółkę Scripps Networks Interactive. Jednocześnie spółka przejmująca chcąc pozyskać aktywa spółki TVN SA, które można zaliczyć do kategorii dóbr informacyjnych, musiała zapłacić premię dotychczasowym inwestorom, ponad kurs akcji z okresu sprzed wezwania. Nawet z obecna premia za przejęcie, spółka
Ogłoszenie wezwania
16
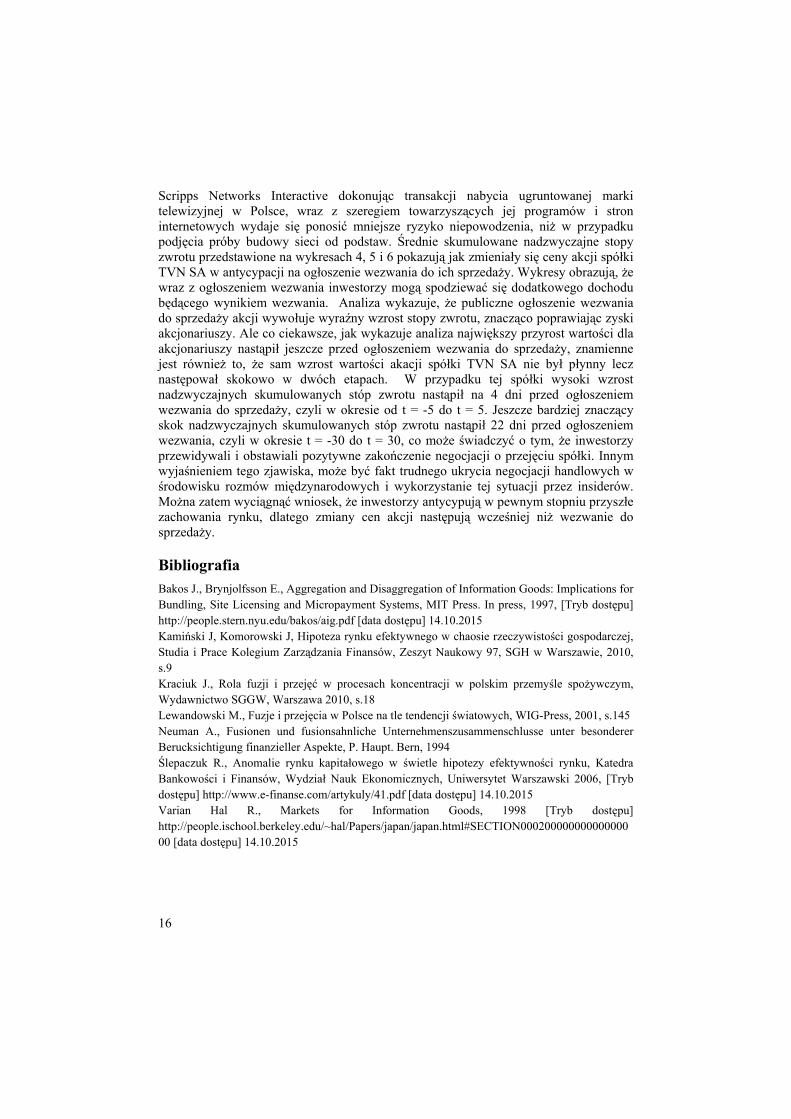
Scripps Networks Interactive dokonując transakcji nabycia ugruntowanej marki telewizyjnej w Polsce, wraz z szeregiem towarzyszących jej programów i stron internetowych wydaje się ponosić mniejsze ryzyko niepowodzenia, niż w przypadku podjęcia próby budowy sieci od podstaw. Średnie skumulowane nadzwyczajne stopy zwrotu przedstawione na wykresach 4, 5 i 6 pokazują jak zmieniały się ceny akcji spółki TVN SA w antycypacji na ogłoszenie wezwania do ich sprzedaży. Wykresy obrazują, że wraz z ogłoszeniem wezwania inwestorzy mogą spodziewać się dodatkowego dochodu będącego wynikiem wezwania. Analiza wykazuje, że publiczne ogłoszenie wezwania do sprzedaży akcji wywołuje wyraźny wzrost stopy zwrotu, znacząco poprawiając zyski akcjonariuszy. Ale co ciekawsze, jak wykazuje analiza największy przyrost wartości dla akcjonariuszy nastąpił jeszcze przed ogłoszeniem wezwania do sprzedaży, znamienne jest również to, że sam wzrost wartości akacji spółki TVN SA nie był płynny lecz następował skokowo w dwóch etapach. W przypadku tej spółki wysoki wzrost nadzwyczajnych skumulowanych stóp zwrotu nastąpił na 4 dni przed ogłoszeniem wezwania do sprzedaży, czyli w okresie od t = -5 do t = 5. Jeszcze bardziej znaczący skok nadzwyczajnych skumulowanych stóp zwrotu nastąpił 22 dni przed ogłoszeniem wezwania, czyli w okresie t = -30 do t = 30, co może świadczyć o tym, że inwestorzy przewidywali i obstawiali pozytywne zakończenie negocjacji o przejęciu spółki. Innym wyjaśnieniem tego zjawiska, może być fakt trudnego ukrycia negocjacji handlowych w środowisku rozmów międzynarodowych i wykorzystanie tej sytuacji przez insiderów. Można zatem wyciągnąć wniosek, że inwestorzy antycypują w pewnym stopniu przyszłe zachowania rynku, dlatego zmiany cen akcji następują wcześniej niż wezwanie do sprzedaży.
Bibliografia Bakos J., Brynjolfsson E., Aggregation and Disaggregation of Information Goods: Implications for Bundling, Site Licensing and Micropayment Systems, MIT Press. In press, 1997, [Tryb dostępu] http://people.stern.nyu.edu/bakos/aig.pdf [data dostępu] 14.10.2015 Kamiński J, Komorowski J, Hipoteza rynku efektywnego w chaosie rzeczywistości gospodarczej, Studia i Prace Kolegium Zarządzania Finansów, Zeszyt Naukowy 97, SGH w Warszawie, 2010, s.9 Kraciuk J., Rola fuzji i przejęć w procesach koncentracji w polskim przemyśle spożywczym, Wydawnictwo SGGW, Warszawa 2010, s.18 Lewandowski M., Fuzje i przejęcia w Polsce na tle tendencji światowych, WIG-Press, 2001, s.145 Neuman A., Fusionen und fusionsahnliche Unternehmenszusammenschlusse unter besonderer Berucksichtigung finanzieller Aspekte, P. Haupt. Bern, 1994 Ślepaczuk R., Anomalie rynku kapitałowego w świetle hipotezy efektywności rynku, Katedra Bankowości i Finansów, Wydział Nauk Ekonomicznych, Uniwersytet Warszawski 2006, [Tryb dostępu] http://www.e-finanse.com/artykuly/41.pdf [data dostępu] 14.10.2015 Varian Hal R., Markets for Information Goods, 1998 [Tryb dostępu] http://people.ischool.berkeley.edu/~hal/Papers/japan/japan.html#SECTION00020000000000000000 [data dostępu] 14.10.2015
17
Summary This paper investigates through a case study, the acquisition of TVN SA company by Scripps Networks Interactive Inc. The material presented discusses the impact of the acquisition on profits of investors who held shares of the company in different periods of time. Since both companies represent the sector of information economy, the article starts with the definition of information goods, and the main characteristics of the industry. Information goods are often characterized by short product life cycle. For this reason, companies operating in this sector often face the dilemma of make/buy decision for a product. Due to the nature of information goods and the role that sunk costs play in the development of such goods, organic growth in the information goods sector, especially in new geographic location entails a high risk of failure. On the other hand, the acquisition of a company with a finished product often involves paying a premium. The aim of the article was to examine how a call for take-over in the information goods industry impacts the profits of investors holding shares in different periods of time, and what premium for the acquisition has to be paid by the acquiring company.
Key words: information goods, mergers, acquisitions, industry concentration, rate of return
Informacja o autorze:
Adam Andrzejuk Szkoła Główna Gospodarstwa Wiejskiego w Warszawie Katedra Ekonomiki Rolnictwa i Międzynarodowych Stosunków Gospodarczych ul. Nowoursynowska 166, 02-787 Warszawa e-mail: [email protected]
18
15 (64) 2016
Lechosław Garbarski Akademia Leona Koźmińskiego w Warszawie
Edukacja w zakresie marketingu a jego wizerunek w Polsce
MARKETING EDUCATION AND IMAGE
OF MARKETING IN POLAND
Edukacja akademicka w zakresie marketingu oraz powszechna edukacja ekonomiczna społeczeństwa mają wpływ na kształtowanie wizerunku marketingu w Polsce. Artykuł przedstawia porównanie badań dotyczących opinii na temat marketingu przeprowadzonych w roku 2007 i 2014. Dodatkowo włączono analizę wykorzystującą tzw. Indeks Zaufania do Marketingu. Ukazano zakres i kierunki zmian „świadomości marketingowej”. Ogólnie rzecz biorąc, po okresie dużego krytycyzmu wobec marketingu, obecnie powoli następuje proces pozytywnej zmiany w opiniach. Słowa kluczowe: wizerunek marketingu, edukacja ekonomiczna w Polsce
Wprowadzenie Historia edukacji w zakresie marketingu pokrywa się w zasadzie z historią samego marketingu jako dyscypliny zainteresowania w Polsce i sięga lat 70. ubiegłego wieku. W tym czasie pojawiły się pierwsze wykłady na ten temat na polskich uczelniach, ukazały pierwsze podręczniki, rozpoczęto dyskusje na konferencjach naukowych. W ciągu kolejnych blisko 50 lat, marketing przeżywał wzrost i spadek zainteresowania, ale w tym czasie ewoluowały także jego szczegółowe koncepcje. Koncepcje te oraz praktyczne działania spowodowały wykształcanie się różnych postaw wobec marketingu i przyczyniły się do ukształtowania zróżnicowanego wizerunku. Wśród nich można odnaleźć koncepcje, które można by określić jako pożądane, rzeczywiste i niechciane1. Wielu publikacjom, a także licznym dyskusjom na konferencjach naukowych towarzyszyła często obawa o „rozmywanie” tożsamości marketingu i obniżanie standardów merytorycznych i metodycznych podejść. Występujące niekiedy skupianie się na „poboczach” marketingu, przemijających modach, atrakcyjnych jedynie werbalnie pojęciach wywoływało sprzeciw części środowiska badaczy problematyki marketingowej. Niektóre publikacje zostały w pewnym zakresie dostrzeżone; trudno jednak z całą stanowczością stwierdzić, że zostały w pełni zaakceptowane i uwzględnione w praktycznym działaniu. 1 Garbarski L., Pożądane, rzeczywiste i niechciane oblicza marketingu. W: Marketing – aktualne problemy
i kierunki ewolucji. Pod redakcją M. Gębarowskiego, L. Witek, B. Zatwarnickiej-Madury. Oficyna Wydawnicza Politechniki Rzeszowskiej. Rzeszów 2012, s. 91-99.
19
W latach 70 XX wieku podstawowe zagadnienia marketingowe były przedstawiane w wykładach i ćwiczeniach odbywających się często pod innym tytułem. Autorzy pojawiających się wtedy pierwszych w Polsce podręczników marketingu byli często zmuszeni do poszukiwania różnych odpowiedników tej nazwy, aby podręczniki te mogły się w ogóle ukazać. Dla studentów w tamtych czasach „marketing” stał się koncepcją bardzo atrakcyjną, do studiowania której nie trzeba było nikogo zmuszać. Co więcej, wydawał się koncepcją logiczną, pożądaną, choć dość trudną do praktycznego wykorzystania w ówczesnej polskiej rzeczywistości gospodarczej. W latach 80 edukacyjna aktywność nadal była na stosunkowo dużym poziomie, natomiast praktyczne zastosowania mogły ograniczać się jedynie do działań na rynkach zagranicznych. Zmiany polityczne i gospodarcze w latach 90 z całą mocą wzmogły zainteresowanie marketingiem. Z punktu widzenia edukacyjnego zasadnicza zmiana dokonała się w kierunkach studiów. Dawne kierunki, nie przystające do nowej rzeczywistości zaczęły ulegać przekształceniom, a wyrósł dość powszechnie kierunek „Zarządzanie i Marketing”. Wprawdzie nazwa ta była pewnym uproszczeniem i niedokładnością, jednak uruchamianie tego kierunku studiów stało się dość powszechne.
W pierwszej dekadzie XXI wieku nastąpiło najpierw spowolnienie tempa akceptacji marketingu, a później wręcz odwrócenie trendu zainteresowania i narastanie coraz ostrzejszego krytycyzmu wobec niego. W mediach coraz częściej podawano liczne przykłady wątpliwych, wręcz manipulatorskich działań firm. Szeroko rozpowszechniony kierunek studiów z lat 90. „Zarządzanie i Marketing” został pozbawiony swojego drugiego członu i pozostał jako „Zarządzanie”. I wreszcie lata 10. XXI wieku przyniosły powtórny wzrost zainteresowania marketingiem, ale w różnych jego wymiarach i w coraz większej złożoności procesów konkurencyjnych.
Na tle powyższych procesów powstają istotne pytania o kondycję marketingu jako przedmiotu studiów oraz jego dalsze perspektywy. Celem opracowania jest udzielenie odpowiedzi na dwa pytania:
1) Jak zmienia się wizerunek marketingu w Polsce w wyniku wieloletniej edukacji akademickiej i społecznej?
2) Jaka jest zależność pomiędzy opiniami na temat marketingu, a indeksem zaufania do marketingu?
Analiza wizerunku marketingu Dobrym punktem wyjścia dla analizy wizerunku marketingu w Polsce są wyniki badań przeprowadzonych w latach 2005-2008 przez Katedrę Marketingu Uniwersytetu Ekonomicznego w Krakowie. Wyniki tych badań zostały opublikowane w książce „Wizerunek marketingu w Polsce (pod redakcją Romana Niestroja)” wydanej przez Wydawnictwo Uniwersytetu Ekonomicznego w Krakowie w 2009 roku. Badania te rozpoczęte sondażem w 2005 roku, były kontynuowane w latach 2007-2008 i objęły cztery oddzielne badania zmierzające do rozpoznania opinii studentów, nauczycieli akademickich, przedstawicieli biznesu oraz społeczeństwa na temat marketingu jako
20
przedmiotu nauczania, obiektu badań naukowych oraz obszaru aktywności zawodowej i działalności praktycznej2.
Podstawą wspomnianych powyżej badań był kwestionariusz składający się z 30 pytań. Wśród nich były pytania dotyczące różnych aspektów wizerunku marketingu, cech osobowych oraz przygotowania zawodowego specjalistów ds. marketingu, a także form nauczania adekwatnych dla grupy przedmiotów marketingowych. Badania zostały przeprowadzone w grudniu 2007 roku przez agencję badań rynkowych wśród użytkowników Internetu. Ostatecznie zakwalifikowano do analizy odpowiedzi 1909 respondentów, którzy w tym czasie studiowali lub w ciągu ostatnich pięciu lat ukończyli studia licencjackie, inżynierskie, magisterskie lub lekarskie. Jak już wcześniej wskazano, przeprowadzono także badania wśród innych grup respondentów, ale analiza ich wyników jest poza kręgiem zainteresowania niniejszego opracowania3.
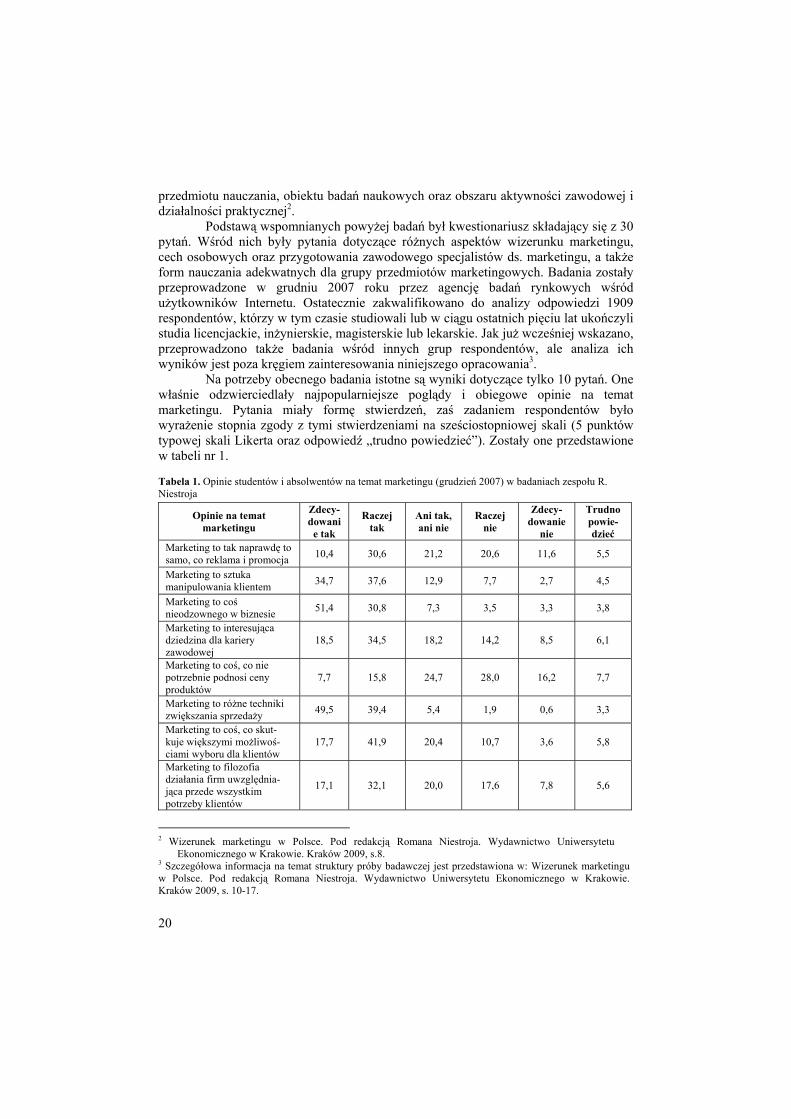
Na potrzeby obecnego badania istotne są wyniki dotyczące tylko 10 pytań. One właśnie odzwierciedlały najpopularniejsze poglądy i obiegowe opinie na temat marketingu. Pytania miały formę stwierdzeń, zaś zadaniem respondentów było wyrażenie stopnia zgody z tymi stwierdzeniami na sześciostopniowej skali (5 punktów typowej skali Likerta oraz odpowiedź „trudno powiedzieć”). Zostały one przedstawione w tabeli nr 1. Tabela 1. Opinie studentów i absolwentów na temat marketingu (grudzień 2007) w badaniach zespołu R. Niestroja
Opinie na temat marketingu
Zdecy-dowani
e tak
Raczej tak
Ani tak, ani nie
Raczej nie
Zdecy-dowanie
nie
Trudno powie-dzieć
Marketing to tak naprawdę to samo, co reklama i promocja 10,4 30,6 21,2 20,6 11,6 5,5
Marketing to sztuka manipulowania klientem 34,7 37,6 12,9 7,7 2,7 4,5
Marketing to coś nieodzownego w biznesie 51,4 30,8 7,3 3,5 3,3 3,8
Marketing to interesująca dziedzina dla kariery zawodowej
18,5 34,5 18,2 14,2 8,5 6,1
Marketing to coś, co nie potrzebnie podnosi ceny produktów
7,7 15,8 24,7 28,0 16,2 7,7
Marketing to różne techniki zwiększania sprzedaży 49,5 39,4 5,4 1,9 0,6 3,3
Marketing to coś, co skut-kuje większymi możliwoś-ciami wyboru dla klientów
17,7 41,9 20,4 10,7 3,6 5,8
Marketing to filozofia działania firm uwzględnia-jąca przede wszystkim potrzeby klientów
17,1 32,1 20,0 17,6 7,8 5,6
2 Wizerunek marketingu w Polsce. Pod redakcją Romana Niestroja. Wydawnictwo Uniwersytetu
Ekonomicznego w Krakowie. Kraków 2009, s.8. 3 Szczegółowa informacja na temat struktury próby badawczej jest przedstawiona w: Wizerunek marketingu w Polsce. Pod redakcją Romana Niestroja. Wydawnictwo Uniwersytetu Ekonomicznego w Krakowie. Kraków 2009, s. 10-17.
21
Marketing to dziedzina wiedzy oparta na solidnych naukowych podstawach
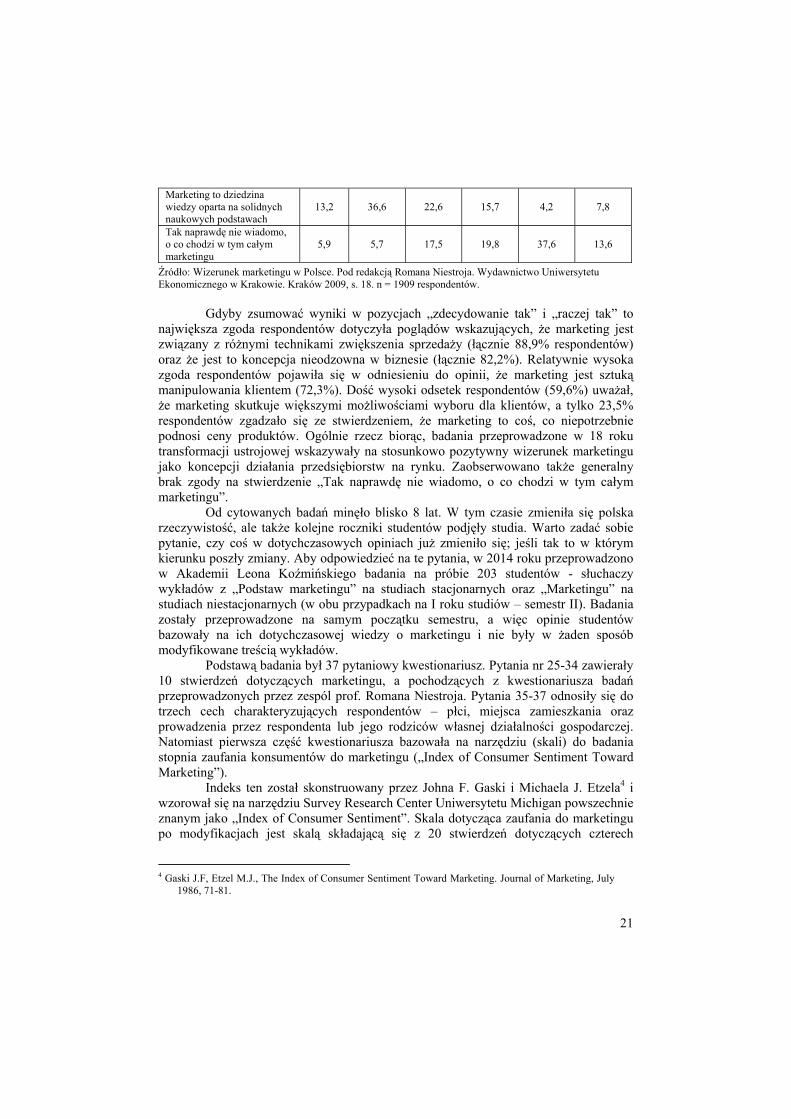
13,2 36,6 22,6 15,7 4,2 7,8
Tak naprawdę nie wiadomo, o co chodzi w tym całym marketingu
5,9 5,7 17,5 19,8 37,6 13,6
Źródło: Wizerunek marketingu w Polsce. Pod redakcją Romana Niestroja. Wydawnictwo Uniwersytetu Ekonomicznego w Krakowie. Kraków 2009, s. 18. n = 1909 respondentów.
Gdyby zsumować wyniki w pozycjach „zdecydowanie tak” i „raczej tak” to
największa zgoda respondentów dotyczyła poglądów wskazujących, że marketing jest związany z różnymi technikami zwiększenia sprzedaży (łącznie 88,9% respondentów) oraz że jest to koncepcja nieodzowna w biznesie (łącznie 82,2%). Relatywnie wysoka zgoda respondentów pojawiła się w odniesieniu do opinii, że marketing jest sztuką manipulowania klientem (72,3%). Dość wysoki odsetek respondentów (59,6%) uważał, że marketing skutkuje większymi możliwościami wyboru dla klientów, a tylko 23,5% respondentów zgadzało się ze stwierdzeniem, że marketing to coś, co niepotrzebnie podnosi ceny produktów. Ogólnie rzecz biorąc, badania przeprowadzone w 18 roku transformacji ustrojowej wskazywały na stosunkowo pozytywny wizerunek marketingu jako koncepcji działania przedsiębiorstw na rynku. Zaobserwowano także generalny brak zgody na stwierdzenie „Tak naprawdę nie wiadomo, o co chodzi w tym całym marketingu”.
Od cytowanych badań minęło blisko 8 lat. W tym czasie zmieniła się polska rzeczywistość, ale także kolejne roczniki studentów podjęły studia. Warto zadać sobie pytanie, czy coś w dotychczasowych opiniach już zmieniło się; jeśli tak to w którym kierunku poszły zmiany. Aby odpowiedzieć na te pytania, w 2014 roku przeprowadzono w Akademii Leona Koźmińskiego badania na próbie 203 studentów - słuchaczy wykładów z „Podstaw marketingu” na studiach stacjonarnych oraz „Marketingu” na studiach niestacjonarnych (w obu przypadkach na I roku studiów – semestr II). Badania zostały przeprowadzone na samym początku semestru, a więc opinie studentów bazowały na ich dotychczasowej wiedzy o marketingu i nie były w żaden sposób modyfikowane treścią wykładów.
Podstawą badania był 37 pytaniowy kwestionariusz. Pytania nr 25-34 zawierały 10 stwierdzeń dotyczących marketingu, a pochodzących z kwestionariusza badań przeprowadzonych przez zespól prof. Romana Niestroja. Pytania 35-37 odnosiły się do trzech cech charakteryzujących respondentów – płci, miejsca zamieszkania oraz prowadzenia przez respondenta lub jego rodziców własnej działalności gospodarczej. Natomiast pierwsza część kwestionariusza bazowała na narzędziu (skali) do badania stopnia zaufania konsumentów do marketingu („Index of Consumer Sentiment Toward Marketing”).
Indeks ten został skonstruowany przez Johna F. Gaski i Michaela J. Etzela4 i wzorował się na narzędziu Survey Research Center Uniwersytetu Michigan powszechnie znanym jako „Index of Consumer Sentiment”. Skala dotycząca zaufania do marketingu po modyfikacjach jest skalą składającą się z 20 stwierdzeń dotyczących czterech
4 Gaski J.F, Etzel M.J., The Index of Consumer Sentiment Toward Marketing. Journal of Marketing, July
1986, 71-81.

22
głównych komponentów marketingowych, a więc produktu, ceny, dystrybucji i promocji. Każde stwierdzenie jest oceniane przez respondenta na 5-cio stopniowej skali Likerta (całkowicie się zgadzam, zgadzam się, ani zgadzam się, ani nie zgadzam się, nie zgadzam się, całkowicie się nie zgadzam). Dodatkowo skala zawiera ocenę ważności każdego z komponentów marketingowych także na 5-cio stopniowej skali (bardzo ważna, ważna, średnio ważna, niezbyt ważna, nieważna).
W kwestionariuszu badań prowadzonych w Akademii Leona Koźmińskiego, pozycje od 1 do 20 zawierały stwierdzenia dotyczące poszczególnych komponentów marketingu, a stopień zgody na dane stwierdzenie odzwierciedlało pięć opinii na skali Likerta (punkty od 1 do 5 były przyznawane adekwatnie do sformułowania stwierdzenia, które w pewnej części miały korelację dodatnią, a w pewnej części ujemną z wartością indeksu). Pozycje od 21 do 24 zawierały ocenę ważności każdego z komponentów marketingowych dla respondenta (także na skali 5-cio stopniowej, a więc odpowiednie punkty stanowiły rangi dla ważenia opinii zawartych w pozycjach 1-20). Dwadzieścia opinii dotyczących różnych działań marketingowych (ocenianych od 1 do 5) zważonych znaczeniem dla respondenta danego komponentu marketin-gowego (także ocenianych od 1 do 5) mogło dać końcową wartość indeksu na skali od 100 do 500.
Wyniki badań W badaniach przeprowadzonych na dwóch grupach studenckich (studia
stacjonarne i studia niestacjonarne) wzięło udział 203 respondentów. W procesie stratyfikacji wzięto pod uwagę trzy kryteria: płeć, miejsce zamieszkania (wyodrębniając grupę respondentów z Warszawy, grupę zamieszkującą w odległości mniejszej niż 50 km od Warszawy i grupę mieszkającą w odległości większej niż 50 kilometrów) oraz prowadzenie lub nie przez respondenta lub jego rodziców działalności gospodarczej. Strukturę próby do badań ukazuje tabela nr 2. Tabela 2. Struktura próby do badań w Akademii Leona Koźmińskiego.
Kryterium Kategoria Udział w próbie
Płeć Mężczyzna 46,8% Kobieta 53,2%
Miejsce zamieszkania Warszawa 13,9% < 50 km od Warszawy 56,2% > 50 km od Warszawy 29,9%
Działalność gospodarcza rodziców lub respondenta
Tak 72,0% Nie 28,0%
Źródło: badania własne. N = 203 respondentów.
Przyglądając się strukturze próby, warto zwrócić uwagę na stosunkowo duży udział (72%) osób deklarujących prowadzenie własnej działalności gospodarczej lub pochodzenie z rodziny przedsiębiorców. Opinie wyrażone w badaniach przeprowadzonych w Akademii Leona Koźmińskiego dotyczące poglądów i obiegowych stwierdzeń na temat marketingu przedstawia tabela nr 3.

23
Tabela 3. Opinie studentów na temat marketingu w badaniach ALK (2014).
Opinie na temat marketingu
Zdecy-dowa-nie tak
Raczej tak
Ani tak, ani nie
Raczej nie
Zdecy-dowa-nie nie
Trudno powie-dzieć
Śred-nia
Odchy-lenie stan-dardowe
Marketing to tak naprawdę to samo, co reklama i promocja
5,8 47,8 21,9 16,9 7,0 1,0 2,75 0,09
Marketing to sztuka manipulowania klientem
14,9 50,2 22,9 9,5 2,0 0,5 2,35 0,95
Marketing to coś nieod-zownego w biznesie (2)
50,2 27,4 15,4 2,0 2,5 2,5 1,87 0,16
Marketing to interesu-jąca dziedzina dla kariery zawodowej (3)
34,3 35,8 14,9 9,5 3,0 2,5 2,18 0,23
Marketing to coś, co niepotrzebnie podnosi ceny produktów (2)
5,5 11,9 26,9 33,3 19,9 2,5 3,58 0,17
Marketing to różne techniki zwiększania sprzedaży (1)
34,8 52,7 5,5 3,5 2,0 1,5 1,90 0,98
Marketing to coś, co skutkuje większymi możliwościami wyboru dla klientów
12,9 34,3 31,3 10,4 5,0 6,0 2,78 0,29
Marketing to filozofia działania firm uwzglę-dniająca przede wszys-tkim potrzeby klientów
14,4 32,8 25,4 17,9 6,0 3,5 2,79 0,26
Marketing to dziedzina wiedzy oparta na solid-nych naukowych podstawach
10,4 36,8 28,4 19,9 1,5 3,0 2,74 0,12
Tak naprawdę nie wia-domo,o co chodzi w tym całym marketingu (1)
2,5 4,5 18,4 27,4 37,8 9,5 4,21 0,14
Źródło: badania własne. N = 203 respondentów.
W tabeli zaznaczono tłustym drukiem trzy opinie (oraz wskazano ich kolejność), które uzyskały największą akceptację respondentów (suma opinii

24
zdecydowanie tak i raczej tak). Na pierwszym miejscu znalazło się stwierdzenie, że „marketing to różne techniki zwiększania sprzedaży” (97,5%), „koncepcja niezbędna w biznesie” (77,6%) i wreszcie „interesująca dziedzina dla kariery zawodowej” (70,1%). Z kolei kursywą zaznaczono te opinie, z którymi w największym stopni respondenci nie zgodzili się. Na pierwszym miejscu znalazło się stwierdzenie, że „tak naprawdę nie wiadomo o co chodzi w tym całym marketingu” (65,2% wskazań zdecydowanie nie i raczej nie) oraz „marketing to coś co niepotrzebnie podnosi ceny produktów” (53,2%). Porównanie wyników z badań w roku 2007 i 2014 przedstawia tabela nr 4. Pokazuje ona równocześnie różnice (przyrosty lub spadki) w odsetku respondentów wyrażających daną opinię. Tabela 4. Porównanie wyników badań z 2007 i 2014 roku dotyczących opinii na temat marketingu.
Opinie na temat marketingu Zdecydowanie tak i raczej tak Różnica Badania zespołu
R. Niestroja (2007) Badania
ALK (2014) Marketing to tak naprawdę to samo, co reklama i promocja 41,0 53,6 +12,6
Marketing to sztuka manipulowania klientem 72,3 65,1 -7,2 Marketing to coś nieodzownego w biznesie 82,2 77,6 -4,6 Marketing to interesująca dziedzina dla kariery zawodowej 53,0 70,1 +17,1
Marketing to coś, co niepotrzebnie podnosi ceny produktów 23,5 17,4 -6,1
Marketing to różne techniki zwiększa-nia sprzedaży 88,9 87,5 -1,4
Marketing to coś, co skutkuje większy-mi możliwościami wyboru dla klientów 59,6 47,2 -12,4
Marketing to filozofia działania firm uwzględniająca przede wszystkim po-trzeby klientów
49,2 47,2 -2,0
Marketing to dziedzina wiedzy oparta na solidnych naukowych podstawach 49,8 47,2 -2,6
Tak naprawdę nie wiadomo, o co chodzi w tym całym marketingu 11,6 7,0 -4,6
Źródło: tabela 1 oraz 3.
Najpoważniejsze różnice pomiędzy opiniami z 2007 roku i 2014 roku (oczywiście przy świadomości nieco innej grupy respondentów) zaobserwowano w trzech przypadkach. O ponad 17% więcej respondentów uważa, że marketing jest interesującą dziedziną dla kariery zawodowej. Jest to fakt pocieszający po wspomnianym wcześniej narastającym krytycyzmie do marketingu. Ponad 12% więcej studentów utożsamia marketing z reklamą i promocją. Świadczy to o wzroście skali i znaczenia różnorodnych działań informacyjno-promocyjnych. Z kolei ponad 12% mniej respondentów stwierdza, że marketing skutkuje większymi możliwościami wyboru dla klientów. Wynika to prawdopodobnie o zmniejszaniu się stopnia przejrzystości rynku. Warto także dodać, że nieco mniej (o 7,2%) studentów widzi w marketingu narzędzie manipulowania klientami oraz jako coś, co niepotrzebnie podnosi ceny produktów (mniej o 6,1%). W przypadku pozostałych stwierdzeń, opinie pozostały na podobnym poziomie.
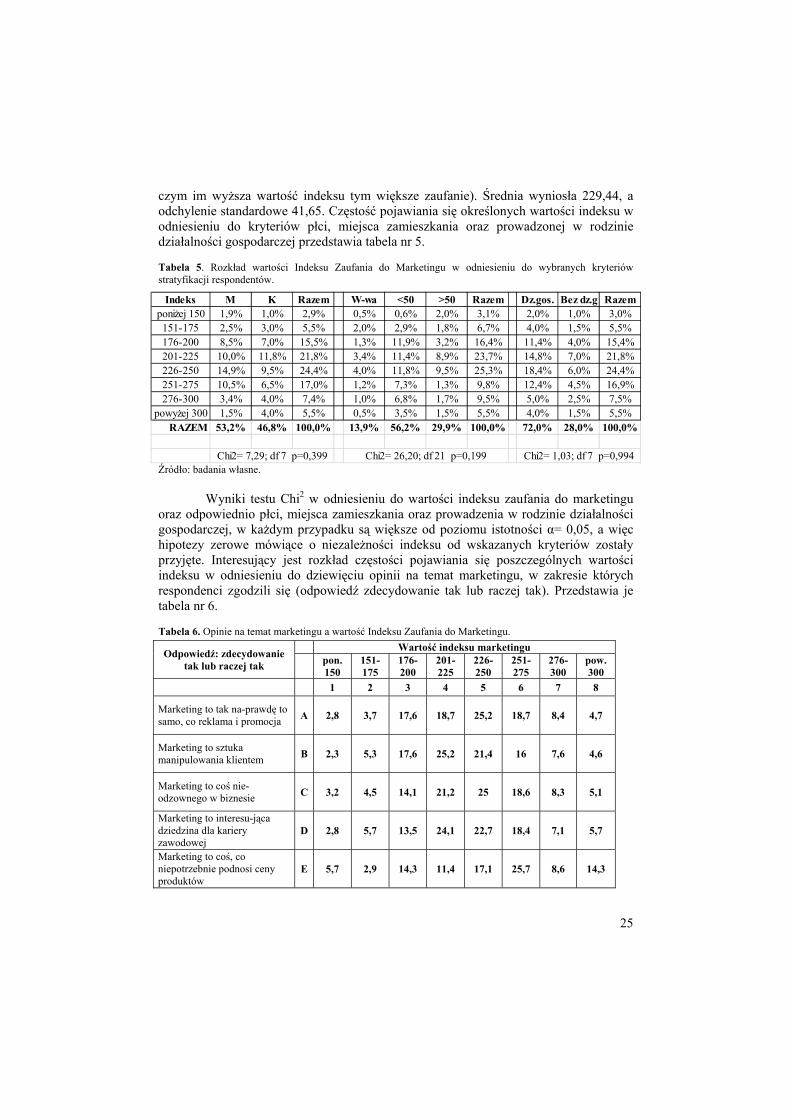
Interesujące są wyniki odnoszące się do Indeksu Zaufania Konsumentów do Marketingu. Najniższa zaobserwowana wartość indeksu to 126, a największa 360 (przy
25
czym im wyższa wartość indeksu tym większe zaufanie). Średnia wyniosła 229,44, a odchylenie standardowe 41,65. Częstość pojawiania się określonych wartości indeksu w odniesieniu do kryteriów płci, miejsca zamieszkania oraz prowadzonej w rodzinie działalności gospodarczej przedstawia tabela nr 5. Tabela 5. Rozkład wartości Indeksu Zaufania do Marketingu w odniesieniu do wybranych kryteriów stratyfikacji respondentów.
Źródło: badania własne.
Wyniki testu Chi2 w odniesieniu do wartości indeksu zaufania do marketingu oraz odpowiednio płci, miejsca zamieszkania oraz prowadzenia w rodzinie działalności gospodarczej, w każdym przypadku są większe od poziomu istotności α= 0,05, a więc hipotezy zerowe mówiące o niezależności indeksu od wskazanych kryteriów zostały przyjęte. Interesujący jest rozkład częstości pojawiania się poszczególnych wartości indeksu w odniesieniu do dziewięciu opinii na temat marketingu, w zakresie których respondenci zgodzili się (odpowiedź zdecydowanie tak lub raczej tak). Przedstawia je tabela nr 6. Tabela 6. Opinie na temat marketingu a wartość Indeksu Zaufania do Marketingu.
Odpowiedź: zdecydowanie tak lub raczej tak
Wartość indeksu marketingu
pon. 150
151-175
176-200
201-225
226-250
251-275
276-300
pow. 300
1 2 3 4 5 6 7 8
Marketing to tak na-prawdę to samo, co reklama i promocja A 2,8 3,7 17,6 18,7 25,2 18,7 8,4 4,7
Marketing to sztuka manipulowania klientem B 2,3 5,3 17,6 25,2 21,4 16 7,6 4,6
Marketing to coś nie-odzownego w biznesie C 3,2 4,5 14,1 21,2 25 18,6 8,3 5,1
Marketing to interesu-jąca dziedzina dla kariery zawodowej
D 2,8 5,7 13,5 24,1 22,7 18,4 7,1 5,7
Marketing to coś, co niepotrzebnie podnosi ceny produktów
E 5,7 2,9 14,3 11,4 17,1 25,7 8,6 14,3
Indeks M K Razem W-wa <50 >50 Razem Dz.gos. Bez dz.g Razemponiżej 150 1,9% 1,0% 2,9% 0,5% 0,6% 2,0% 3,1% 2,0% 1,0% 3,0%
151-175 2,5% 3,0% 5,5% 2,0% 2,9% 1,8% 6,7% 4,0% 1,5% 5,5%176-200 8,5% 7,0% 15,5% 1,3% 11,9% 3,2% 16,4% 11,4% 4,0% 15,4%201-225 10,0% 11,8% 21,8% 3,4% 11,4% 8,9% 23,7% 14,8% 7,0% 21,8%226-250 14,9% 9,5% 24,4% 4,0% 11,8% 9,5% 25,3% 18,4% 6,0% 24,4%251-275 10,5% 6,5% 17,0% 1,2% 7,3% 1,3% 9,8% 12,4% 4,5% 16,9%276-300 3,4% 4,0% 7,4% 1,0% 6,8% 1,7% 9,5% 5,0% 2,5% 7,5%
powyżej 300 1,5% 4,0% 5,5% 0,5% 3,5% 1,5% 5,5% 4,0% 1,5% 5,5%RAZEM 53,2% 46,8% 100,0% 13,9% 56,2% 29,9% 100,0% 72,0% 28,0% 100,0%
Chi2= 1,03; df 7 p=0,994Chi2= 26,20; df 21 p=0,199Chi2= 7,29; df 7 p=0,399

26
Marketing to różne techniki zwiększania sprzedaży F 2,3 4,5 15,9 22,2 22,7 18,6 8,5 5,1
Marketing to coś, co skutkuje większymi możliwościami wyboru dla klientów
G 3,2 6,3 8,4 13,7 26,3 22,1 12,6 7,4
Marketing to filozofia działania firm uwzglę-dniająca przede wszys-tkim potrzeby klientów
H 2,1 2,1 10,5 18,9 25,3 23,2 9,5 8,4
Marketing to dziedzina wiedzy oparta na solidnych naukowych podstawach
I 3,2 3,2 15,8 18,9 28,4 15,8 9,5 5,3
Źródło: badania własne.
W niektórych przypadkach mamy do czynienia z rozkładem zbliżonym do rozkładu normalnego, w innych mamy do czynienia z lewo lub prawoskośnością. Zależności w tym zakresie obrazuje rysunek nr 1, na którym litery A, B, …,H, I w legendzie odpowiadają rożnym opiniom wskazanym w tabeli nr 6.
Rysunek 1. Rozkłady częstości wartości Indeksu Zaufania do Marketingu w odniesieniu do poszczególnych opinii na temat marketingu Źródło: badania własne.

27
Rozkład zbliżony do rozkładu normalnego występuje w odniesieniu do stwierdzeń B, C i F, rozkład jest lekko lewoskośny w przypadku stwierdzenia D, lekko prawoskośny przy stwierdzeniu A, natomiast silnie prawoskośny w odniesieniu do stwierdzenia E, G, H, I. Jeśli odnieść się jedynie do silnej prawoskośnosci w rozkładach to oznacza to, że osoby, których zaufanie do marketingu jest większe, także w większym stopniu uważają, że marketing skutkuje większymi możliwościami wyboru dla klienta, że jest to filozofia działania firm uwzględniająca przede wszystkim potrzeby klientów oraz dziedzina oparta na solidnych naukowych podstawach, ale jednocześnie marketing niepotrzebnie podnosi ceny towarów.
Wnioski i podsumowanie Przeprowadzone badania pokazały, że obecnie marketing jest w największym stopniu postrzegany jako sposób na zwiększanie wielkości sprzedaży, jako koncepcja nieodzowna w biznesie oraz jako interesująca dziedzina dla kariery zawodowej. Warto przy tym podkreślić, że największe przyrosty w odsetku respondentów zgadzających się z danym stwierdzeniem wystąpiły w przypadku uznania marketingu jako interesującej dziedziny kariery zawodowej oraz upatrywania w marketingu działań reklamowych i promocyjnych. Z kolei największy spadek zgody respondentów zanotowano w odniesieniu do poglądu, iż marketing skutkuje większymi możliwościami wyboru dla klientów. Co można było przewidzieć, wzrost pozytywnych opinii na temat marketingu rośnie wraz ze wzrostem wartości Indeksu Zaufania do Marketingu. Jednak nieco zastanawiające jest, że ci którzy w dużym stopniu ufają marketingowi, uważają, że niepotrzebnie przyczynia się on do podnoszenia cen towarów.
Jeśli wziąć pod uwagę fakt, że badania w roku 2014 były prowadzone na grupie, których poziom edukacji marketingowej można uznać za niższy w stosunku do grupy badanej w 2007 roku, to oznacza to, że różne formy edukacji ekonomicznej (np. w środkach masowego przekazu) oraz obserwowane przez respondentów przez lata – działania praktyczne zmieniają powoli wizerunek marketingu na bardziej pozytywny.
Literatura Bearden W.O., Netemeyer R.G., Haws K.L., Handbook of Marketing Scales. Sage, Los
Angeles 2001. Garbarski L., Pożądane, rzeczywiste i niechciane oblicza marketingu. W: Marketing –
aktualne problemy i kierunki ewolucji. Pod redakcją M. Gębarowskiego, L. Witek, B. Zatwarnickiej-Madury. Oficyna Wydawnicza Politechniki Rzeszowskiej. Rzeszów 2012, s. 91-99.
Gaski J.F, Etzel M.J., The Index of Consumer Sentiment Toward Marketing. „Journal of Marketing”, July 1986, 71-81.
Wizerunek Marketingu w Polsce. Pod redakcją Romana Niestroja. Wydawnictwo Uniwersytetu Ekonomicznego w Krakowie. Kraków 2009.
Summary Academic education in marketing and economic education of society have influence on image of marketing in Poland. The article presents an comparison of researches provided at 2007 and 2014 on opinion about marketing. Additionally, analysis of Index of Marketing Sentiment is included.

28
The scope and directions of changes in “marketing awareness” trends is presented. Generally, after the period of significant criticism towards marketing concept, the process of positive change in opinion on marketing could be observed. Key words: marketing image, economic education in Poland
Informacja o Autorze:
Prof. dr hab. Lechosław Garbarski, Katedra Marketingu Akademia Leona Koźmińskiego, 03-301 Warszawa, ul. Jagiellońska 57/59 [email protected]

29
15 (64) 2016
Zbigniew Gołaś Uniwersytet Przyrodniczy w Poznaniu Zróżnicowanie opóźnień płatniczych w przedsiębiorstwach
sektora B2B krajów Europy Wschodniej
DIFFERENTIATION OF PAYMENT DELAYS IN THE B2B SECTOR ENTERPRISES IN EASTERN EUROPE
W artykule przedstawiono wyniki wieloaspektowej analizy zróżnicowania
terminów płatności w transakcjach handlowych między przedsiębiorstwami sektora B2B w wybranych krajach Europy Wschodniej. Analizę oparto na danych pochodzących z raportów międzynarodowej wywiadowni gospodarczej Atriadus dotyczących przedsiębiorstw w Polsce, Słowacji, Czechach, na Węgrzech oraz w Turcji. Badania wykazały, że średnio około 41% sprzedaży w badanych przedsiębiorstw sektora B2B Europy Wschodniej realizowano przy zastosowaniu kredytu kupieckiego, w tym głównie w transakcjach zagranicznych, a kontrakty zawierano głównie na termin do 30 dni (ponad 80%), poza Turcją gdzie należności zakontraktowane stanowiły około 54 % umów. Ponadto stwierdzono, że najmniejsze opóźnienia płatności cechowały przedsiębiorstwa na Słowacji i Węgrzech (10-17 dni), natomiast największe w Turcji (76 dni). Z badań wynika również, że główne przyczyny opóźnień płatniczych przedsiębiorcy z sektora B2B upatrują w ograniczonym dostępie kontrahentów do środków finansowych, w praktyce traktowania zaległych zobowiązań jako źródła finansowania bieżącej działalności, formalnej niewypłacalności kontrahentów oraz w złożonych procedurach płatności.
Słowa kluczowe: opóźnienia płatnicze, sektor B2B, Europa Wschodnia
Wstęp Kryzys finansowy, który wystąpił pod koniec 2008 roku, spowodował znaczące osłabienie dynamiki gospodarczej i pogorszenie kondycji finansowej przedsiębiorstw. Jednak niestabilna koniunktura związana ze słabą dynamiką wygaszania kryzysu finansowego nadal negatywnie oddziałuje na dynamikę gospodarczą oraz sytuację finansową przedsiębiorstw. Intensywność występowania problemów z terminowym regulowaniem zobowiązań wprawdzie maleje, ale tempo zmian w tym zakresie jest na tyle słabe1, że pogorszenie płynności finansowej i związane z nim zjawiska wzrostu
1 Gołaś J.: Prawne i ekonomiczne uwarunkowania opóźnień płatniczych w transakcjach handlowych przedsiębiorstw w Polsce, Ekonomika i Organizacja Przedsiębiorstw, nr 2/2016.
30
kosztów, strat2 oraz redukcji przychodów i zysków dotyczą wciąż dużej liczby podmiotów gospodarczych.
Problem nieterminowego regulowania zobowiązań przyczynia się do powstawania zatorów płatniczych, tj. kumulacji długów i ich przechodzenie na kolejnych powiązanych ze sobą kontrahentów3, co w skrajnym przypadku mogą prowadzić do upadłości przedsiębiorstw4,5.
Duża skala problemów płatniczych europejskich przedsiębiorstw przyczyniła się do prawnej regulacji terminów płatności w transakcjach handlowych między organami publicznymi i przedsiębiorstwami oraz między przedsiębiorstwami. Wyrazem tej regulacji jest Dyrektywa Parlamentu Europejskiego i Rady z 2011 roku6 oraz obowiązkowa jej transpozycja na kraje członkowskie do marca 2013 roku. Jednak aktualne statystyki wskazują wyraźnie, że postęp w zakresie opóźnień płatniczych jest generalnie w krajach europejskich bardzo słaby, a w znacznej ich części problem opóźnień płatniczych narasta.
Cel i metodyka badań oraz materiał źródłowy Głównym celem opracowania jest wieloaspektowa ocena zróżnicowania terminów płatności w transakcjach handlowych między przedsiębiorstwami sektora B2B w wybranych krajach Europy Wschodniej. W realizacji tak sformułowanego celu wykorzystano informacje dotyczące skłonności do udzielania kredytu kupieckiego, struktury czasowej należności zakontraktowanych i przeterminowanych, długości zakontraktowanego i faktycznego terminu płatności, czasu opóźnienia płatności, odsetka płatności przeterminowanych i nieściągalnych oraz przyczyn opóźnienia płatności.
Dane do analizy pochodziły z raportów firmy Atriadus, znaczącego na rynku europejskim podmiotu rynku ubezpieczeń finansowych i windykacji. Głównym obszarem działalności tej firmy są ubezpieczenia kredytu kupieckiego oraz usługi windykacyjne, a jej jednym z ważnych celów jest wzmacnianie polityki zarządzania należnościami klientów7. Analizę zróżnicowania i uwarunkowań opóźnień płatniczych przeprowadzono na podstawie danych z 2015 roku publikowanych w specjalistycznych raportach – Barometr Praktyk Płatniczych - dotyczących wybranych krajów Europy
2 Według wywiadowni gospodarczej Intrum Justitia w 2015 roku straty przedsiębiorstw z tytułu utraconych należności wynosiły od 1,0% w Dani do 10,4% wartości przychodów, przy średniej na poziomie około 3,1%. Łączne straty w Europie z tego tytułu szacuje się na kwotę 289 mld euro [European …2015]. 3 Cicirko T.: Możliwości ograniczania zatorów płatniczych poprzez system podatkowy. Zeszyty Naukowe Politechniki Rzeszowskiej, Zarządzanie i Marketing, nr 272(17)/2010. 4 Czepukojć K.: Zatory płatnicze mogą prowadzić do upadłości, http://www.egospodarka.pl. 5 Gołaś Z., Bieniasz A.: Zróżnicowanie terminów płatności w wybranych krajach Europy, Zeszyty Naukowe SGGW, Polityki Europejskie, Finanse i Marketing, nr 12(61)/2014. 6 Dyrektywa Parlamentu Europejskiego i Rady 2011/7/UE z dnia 16 lutego 2011 r. w sprawie zwalczania opóźnień w płatnościach w transakcjach handlowych, www.http://eur-lex.europa.eu/, dostęp: 10.04.2016. 7 www.atriadus.pl.

31
Wschodniej8,9. W 2015 roku badaniami tymi objęto przedsiębiorstwa sektora B2B w Polsce10, Czechach11, Słowacji12, na Węgrzech13 oraz w Turcji14.
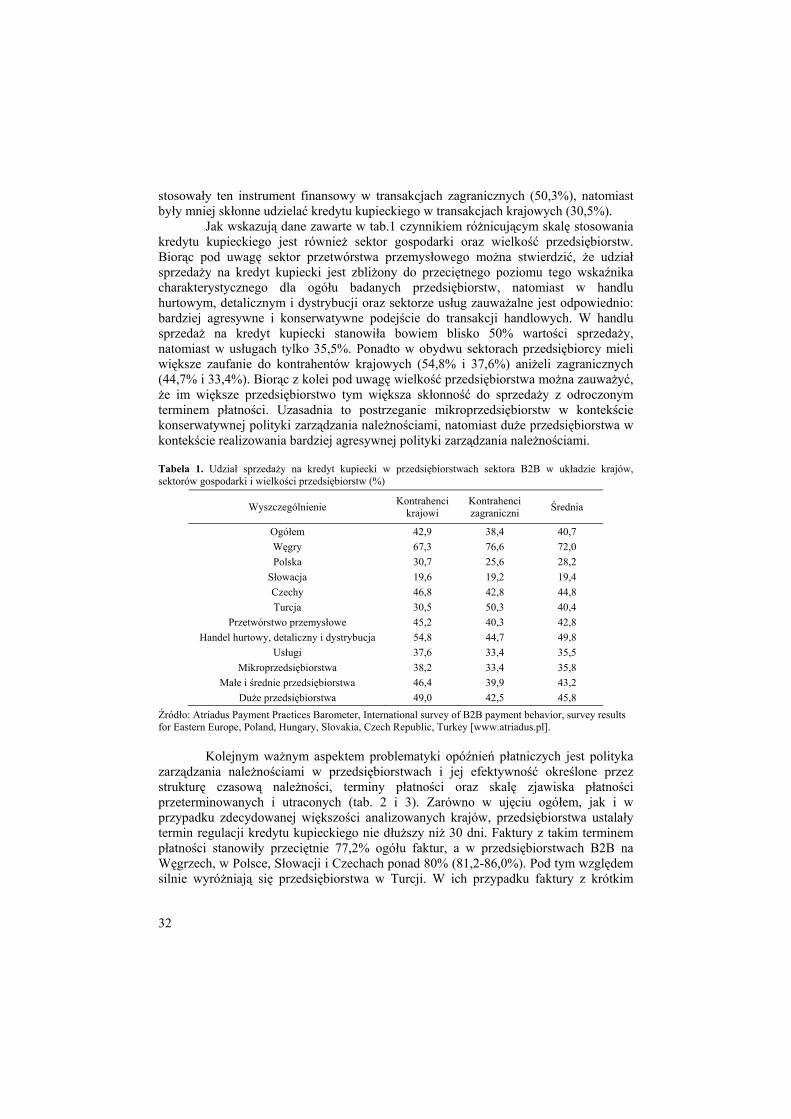
Wyniki badań Jednym z wielu źródeł finansowania bieżącej działalności, zwłaszcza w małych i średnich przedsiębiorstwach, jest kredyt kupiecki. Uważany jest on za jedną z najstarszych form finansowania i ważną alternatywę wobec innych instrumentów oferowanych przez rynek usług finansowych15,16. Kredyt kupiecki jest powszechnie stosowaną formą rozliczeń między partnerami biznesowymi umożliwiającą szybszą sprzedaż towarów i usług, jednak udzielany niesprawdzonym odbiorcom może doprowadzić do utraty płynności finansowej. Z danych zawartych w tab.1 wynika, że średnio około 41% sprzedaży w badanych przedsiębiorstw sektora B2B Europy Wschodniej realizowano przy zastosowaniu kredytu kupieckiego, przy czym ten instrument finansowy chętniej stosowano w transakcjach zagranicznych (42,9%) niż krajowych (38,4%). Jednak skłonność do udzielania kredytu kupieckiego jest w uwzględnionych krajach silnie zróżnicowana. Na Słowacji sprzedaż z odroczonym terminem płatności stanowiła tylko niecałe 20% wartości sprzedaży i to zarówno w transakcjach krajowych, jak i zagranicznych. Relatywnie niska skłonność, a tym samym konserwatywne podejście do transakcji handlowych cechowała również przedsiębiorstwa w Polsce, gdzie transakcje te stanowiły średnio 28,2% wartości sprzedaży ogółem oraz 30,7% wartości sprzedaży krajowej i 25,6% sprzedaży zagranicznej.
Z kolei agresywną politykę w tym zakresie stosowały przedsiębiorstwa na Węgrzech. Przeciętnie udział wartości sprzedaży na kredyt w sprzedaży ogółem wynosił w nich aż 72% i wynikał zarówno z wysokiego poziomu tego wskaźnika dla transakcji zagranicznych (76,6%), jak i krajowych (67,3%). W pozostałych krajach (Czechy, Turcja) średni poziom udziału sprzedaży na kredyt kupiecki (44,8% i 40,4%) nie odbiegał istotnie od średniego poziomu charakterystycznego dla Europy Wschodniej. Można jednak zauważyć, że przedsiębiorstwa w Turcji w relatywnie większym stopniu
8 Atriadus Payment Practices Barometer – International survey of B2B payment behavior, survey results for Eastern Europe, May 2015 Spring, www.atriadus.pl. 9 Statistical appendix Atriadus Payment Practices Barometer, survey results for Eastern Europe, May 2015, www.atriadus.pl. 10 Atriadus Payment Practices Barometer, International survey of B2B payment behavior, survey results for Poland, May 2015, www.atriadus.pl. 11 Atriadus Payment Practices Barometer, International survey of B2B payment behavior, survey results for Czech Republic, May 2015, www.atriadus.pl. 12 Atriadus Payment Practices Barometer, International survey of B2B payment behavior, survey results for Slovakia, May 2015 Spring, www.atriadus.pl. 13 Atriadus Payment Practices Barometer, International survey of B2B payment behavior, survey results for Hungary, May 2015, www.atriadus.pl. 14 Atriadus Payment Practices Barometer, International survey of B2B payment behavior, survey results for Turkey, May 2015, www.atriadus.pl. 15 Nowak D.: Rola i znaczenie kredytu kupieckiego. Zeszyty Naukowe Uniwersytetu Szczecińskiego, Finanse, Rynki Finansowe, Ubezpieczenia, nr 65/2014. 16 Łuczka T.: Kapitał obcy w małym i średnim przedsiębiorstwie. Wybrane aspekty mikro i akroekonomiczne,, PWE, Warszawa – Poznań, 2001, s. 134.
32
stosowały ten instrument finansowy w transakcjach zagranicznych (50,3%), natomiast były mniej skłonne udzielać kredytu kupieckiego w transakcjach krajowych (30,5%).
Jak wskazują dane zawarte w tab.1 czynnikiem różnicującym skalę stosowania kredytu kupieckiego jest również sektor gospodarki oraz wielkość przedsiębiorstw. Biorąc pod uwagę sektor przetwórstwa przemysłowego można stwierdzić, że udział sprzedaży na kredyt kupiecki jest zbliżony do przeciętnego poziomu tego wskaźnika charakterystycznego dla ogółu badanych przedsiębiorstw, natomiast w handlu hurtowym, detalicznym i dystrybucji oraz sektorze usług zauważalne jest odpowiednio: bardziej agresywne i konserwatywne podejście do transakcji handlowych. W handlu sprzedaż na kredyt kupiecki stanowiła bowiem blisko 50% wartości sprzedaży, natomiast w usługach tylko 35,5%. Ponadto w obydwu sektorach przedsiębiorcy mieli większe zaufanie do kontrahentów krajowych (54,8% i 37,6%) aniżeli zagranicznych (44,7% i 33,4%). Biorąc z kolei pod uwagę wielkość przedsiębiorstwa można zauważyć, że im większe przedsiębiorstwo tym większa skłonność do sprzedaży z odroczonym terminem płatności. Uzasadnia to postrzeganie mikroprzedsiębiorstw w kontekście konserwatywnej polityki zarządzania należnościami, natomiast duże przedsiębiorstwa w kontekście realizowania bardziej agresywnej polityki zarządzania należnościami. Tabela 1. Udział sprzedaży na kredyt kupiecki w przedsiębiorstwach sektora B2B w układzie krajów, sektorów gospodarki i wielkości przedsiębiorstw (%)
Wyszczególnienie Kontrahenci krajowi
Kontrahenci zagraniczni Średnia
Ogółem 42,9 38,4 40,7 Węgry 67,3 76,6 72,0 Polska 30,7 25,6 28,2
Słowacja 19,6 19,2 19,4 Czechy 46,8 42,8 44,8 Turcja 30,5 50,3 40,4
Przetwórstwo przemysłowe 45,2 40,3 42,8 Handel hurtowy, detaliczny i dystrybucja 54,8 44,7 49,8
Usługi 37,6 33,4 35,5 Mikroprzedsiębiorstwa 38,2 33,4 35,8
Małe i średnie przedsiębiorstwa 46,4 39,9 43,2 Duże przedsiębiorstwa 49,0 42,5 45,8
Źródło: Atriadus Payment Practices Barometer, International survey of B2B payment behavior, survey results for Eastern Europe, Poland, Hungary, Slovakia, Czech Republic, Turkey [www.atriadus.pl].
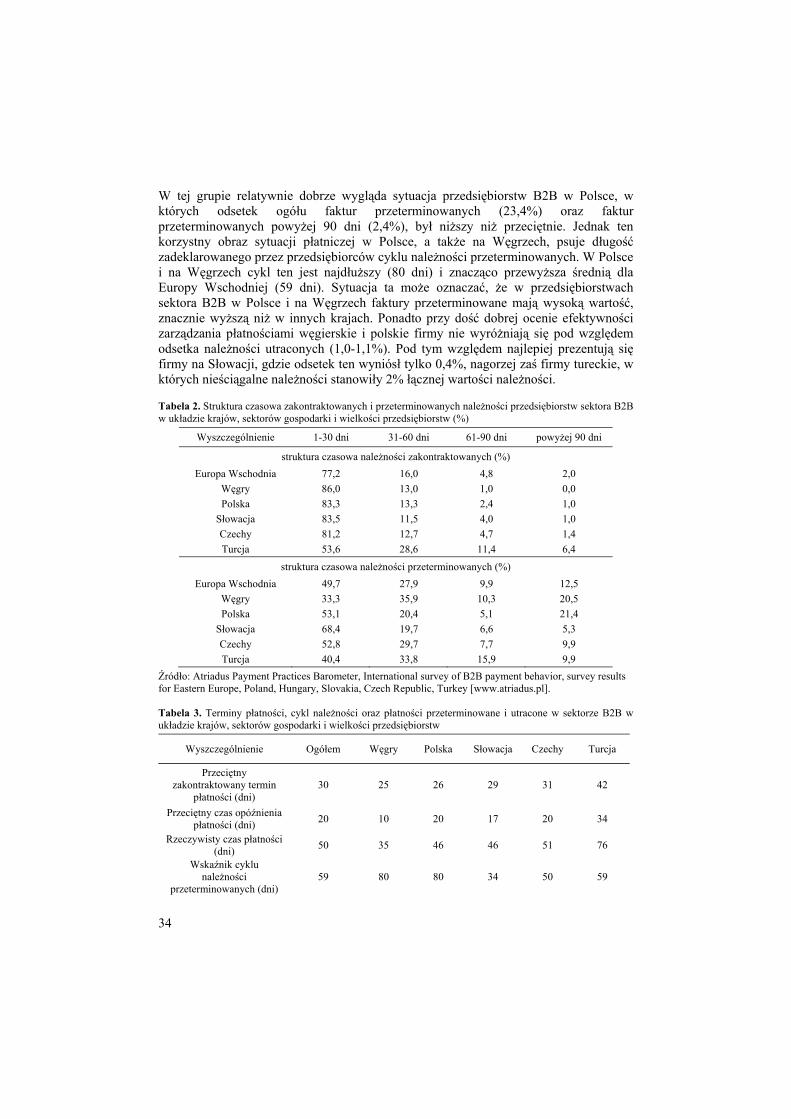
Kolejnym ważnym aspektem problematyki opóźnień płatniczych jest polityka zarządzania należnościami w przedsiębiorstwach i jej efektywność określone przez strukturę czasową należności, terminy płatności oraz skalę zjawiska płatności przeterminowanych i utraconych (tab. 2 i 3). Zarówno w ujęciu ogółem, jak i w przypadku zdecydowanej większości analizowanych krajów, przedsiębiorstwa ustalały termin regulacji kredytu kupieckiego nie dłuższy niż 30 dni. Faktury z takim terminem płatności stanowiły przeciętnie 77,2% ogółu faktur, a w przedsiębiorstwach B2B na Węgrzech, w Polsce, Słowacji i Czechach ponad 80% (81,2-86,0%). Pod tym względem silnie wyróżniają się przedsiębiorstwa w Turcji. W ich przypadku faktury z krótkim

33
terminem płatności (1-30 dni) stanowiły bowiem tylko 53,6% w następstwie częstszego udzielania kredytu kupieckiego na 31-60 dni (28,6%), 61-90 dni (11,4%), a także kredytu powyżej 90 dni (6,4%). Konsekwencją takiego kształtu struktury należności zakontraktowanych jest zróżnicowany przeciętny czas zakontraktowanego terminu płatności (tab. 3). Na Węgrzech, w Polsce, Słowacji i Czechach jest on porównywalny oraz relatywnie krótki i wynosi 25-31 dni, natomiast w Turcji relatywnie długi, wiąże się bowiem z 42-dniowym cyklem płatności.
W znacząco większym stopniu różnicuje przedsiębiorstwa B2B analizowanych krajów struktura czasowa należności przeterminowanych, która ponadto wielu przypadkach jest rozbieżna ze strukturą czasową należności zakontraktowanych. W największym natężeniu zjawisko przeterminowanych faktur o 1-30 dni występuje w przedsiębiorstwach słowackich (68,4%), w najmniejszym zaś na Węgrzech (33,3%). Z kolei przeterminowane faktury od 31 do 60 dni relatywnie częściej dotyczyły przedsiębiorstw węgierskich (35,9%) i tureckich (33,8%), natomiast rzadziej występowały na Słowacji (19,7%) i w Polsce (20,4%). Jeszcze inaczej wygląda ta klasyfikacja w przypadku faktur przeterminowanych o 61-90 dni. W tym przypadku największe problemy miały przedsiębiorstwa w Turcji (15,9%), najmniejsze zaś w Polsce (tylko 5.1%). W wybranych krajach w dość dużym natężeniu występuje również zjawisko opóźnień płatniczych przekraczających 90 dni. Przeciętnie, faktury z tak długim opóźnieniem płatności stanowiły 12,5% ogółu faktur przeterminowanych, jednak na Węgrzech i w Polsce odsetek ten w sektorze B2B wynosił aż około 21%.
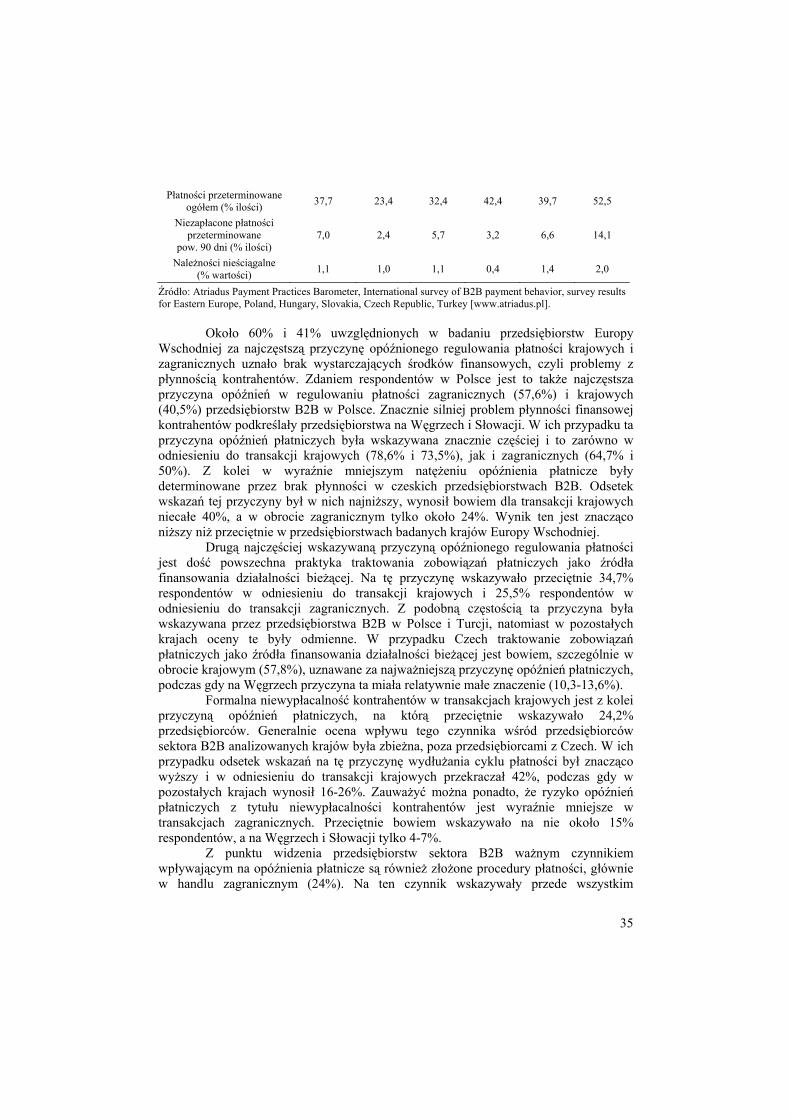
Przedstawione wyżej struktury należności przekładają się na skalę opóźnień płatniczych oraz rzeczywisty czas płatności (tab. 3). W Polsce i Czechach opóźnienie płatności wynosiło 20 dni, a wynik ten był zbieżny z przeciętnym czasem opóźnienia płatności w zbiorowości ogółem. W znacznie mniejszym stopniu opóźnienia płatnicze oddziaływały na gospodarkę finansową w przedsiębiorstwach słowackich (17 dni), a szczególnie na Węgrzech, gdzie regulacja faktur opóźniona była tylko o 10 dni. Na tle przedsiębiorstw wymienionych krajów zdecydowanie najgorzej w tym zakresie wygląda sytuacja w Turcji. Opóźnienie płatności wynosiło w nich bowiem ponad 1 miesiąc (34 dni) i skutkowało 76 dniowym czasem rzeczywistej zapłaty. Jednak trudno uznać, że rzeczywisty czas płatności był w pozostałych krajach krótki. Z danych zawartych w tab. 3 wynika, że w przedsiębiorstwach sektora B2B w tych krajach rzeczywisty czas płatności mieścił się na ogół w dość wąskim przedziale 46-51 dni, wskazującym, że faktury regulowano w nich w cyklu przekraczającym 1,5 miesiąca. Na ich tle szczególnie korzystnie wyróżniają się przedsiębiorstwa na Węgrzech, gdzie rzeczywisty czas płatności wynosił przeciętnie 35 dni. Te stan przedsiębiorstw B2B na Węgrzech koresponduje również z korzystną sytuacją wynikającą z relatywnie niskiego odsetka ogółu faktur przeterminowanych (23,4%) oraz faktur przeterminowanych powyżej 90 dni (2,4%). Można zatem stwierdzić, że mimo największej sprzedaży na kredyt kupiecki (72%) przedsiębiorstwa węgierskie zarządzają należnościami najbardziej efektywnie. Ich przeciwieństwem są przedsiębiorstwa funkcjonujące w Turcji. Najdłuższemu czasowi opóźnienia płatności i najdłuższemu czasowi rzeczywistemu zapłaty odpowiadały bowiem najwyższy odsetek ogółu faktur przeterminowanych (52,5%) oraz najwyższy odsetek faktur przeterminowanych powyżej 90 dni (14,1%).
W pozostałych krajach objętych badaniem (Polska, Czechy, Słowacja) problem przeterminowanych faktur występował wprawdzie w mniejszej ale nie marginalnej skali.
34
W tej grupie relatywnie dobrze wygląda sytuacja przedsiębiorstw B2B w Polsce, w których odsetek ogółu faktur przeterminowanych (23,4%) oraz faktur przeterminowanych powyżej 90 dni (2,4%), był niższy niż przeciętnie. Jednak ten korzystny obraz sytuacji płatniczej w Polsce, a także na Węgrzech, psuje długość zadeklarowanego przez przedsiębiorców cyklu należności przeterminowanych. W Polsce i na Węgrzech cykl ten jest najdłuższy (80 dni) i znacząco przewyższa średnią dla Europy Wschodniej (59 dni). Sytuacja ta może oznaczać, że w przedsiębiorstwach sektora B2B w Polsce i na Węgrzech faktury przeterminowane mają wysoką wartość, znacznie wyższą niż w innych krajach. Ponadto przy dość dobrej ocenie efektywności zarządzania płatnościami węgierskie i polskie firmy nie wyróżniają się pod względem odsetka należności utraconych (1,0-1,1%). Pod tym względem najlepiej prezentują się firmy na Słowacji, gdzie odsetek ten wyniósł tylko 0,4%, nagorzej zaś firmy tureckie, w których nieściągalne należności stanowiły 2% łącznej wartości należności. Tabela 2. Struktura czasowa zakontraktowanych i przeterminowanych należności przedsiębiorstw sektora B2B w układzie krajów, sektorów gospodarki i wielkości przedsiębiorstw (%)
Wyszczególnienie 1-30 dni 31-60 dni 61-90 dni powyżej 90 dni
struktura czasowa należności zakontraktowanych (%) Europa Wschodnia 77,2 16,0 4,8 2,0
Węgry 86,0 13,0 1,0 0,0 Polska 83,3 13,3 2,4 1,0
Słowacja 83,5 11,5 4,0 1,0 Czechy 81,2 12,7 4,7 1,4 Turcja 53,6 28,6 11,4 6,4
struktura czasowa należności przeterminowanych (%) Europa Wschodnia 49,7 27,9 9,9 12,5
Węgry 33,3 35,9 10,3 20,5 Polska 53,1 20,4 5,1 21,4
Słowacja 68,4 19,7 6,6 5,3 Czechy 52,8 29,7 7,7 9,9 Turcja 40,4 33,8 15,9 9,9
Źródło: Atriadus Payment Practices Barometer, International survey of B2B payment behavior, survey results for Eastern Europe, Poland, Hungary, Slovakia, Czech Republic, Turkey [www.atriadus.pl]. Tabela 3. Terminy płatności, cykl należności oraz płatności przeterminowane i utracone w sektorze B2B w układzie krajów, sektorów gospodarki i wielkości przedsiębiorstw
Wyszczególnienie Ogółem Węgry Polska Słowacja Czechy Turcja
Przeciętny zakontraktowany termin
płatności (dni) 30 25 26 29 31 42
Przeciętny czas opóźnienia płatności (dni) 20 10 20 17 20 34
Rzeczywisty czas płatności (dni) 50 35 46 46 51 76
Wskaźnik cyklu należności
przeterminowanych (dni) 59 80 80 34 50 59
35
Płatności przeterminowane ogółem (% ilości) 37,7 23,4 32,4 42,4 39,7 52,5
Niezapłacone płatności przeterminowane
pow. 90 dni (% ilości) 7,0 2,4 5,7 3,2 6,6 14,1
Należności nieściągalne (% wartości) 1,1 1,0 1,1 0,4 1,4 2,0
Źródło: Atriadus Payment Practices Barometer, International survey of B2B payment behavior, survey results for Eastern Europe, Poland, Hungary, Slovakia, Czech Republic, Turkey [www.atriadus.pl].
Około 60% i 41% uwzględnionych w badaniu przedsiębiorstw Europy
Wschodniej za najczęstszą przyczynę opóźnionego regulowania płatności krajowych i zagranicznych uznało brak wystarczających środków finansowych, czyli problemy z płynnością kontrahentów. Zdaniem respondentów w Polsce jest to także najczęstsza przyczyna opóźnień w regulowaniu płatności zagranicznych (57,6%) i krajowych (40,5%) przedsiębiorstw B2B w Polsce. Znacznie silniej problem płynności finansowej kontrahentów podkreślały przedsiębiorstwa na Węgrzech i Słowacji. W ich przypadku ta przyczyna opóźnień płatniczych była wskazywana znacznie częściej i to zarówno w odniesieniu do transakcji krajowych (78,6% i 73,5%), jak i zagranicznych (64,7% i 50%). Z kolei w wyraźnie mniejszym natężeniu opóźnienia płatnicze były determinowane przez brak płynności w czeskich przedsiębiorstwach B2B. Odsetek wskazań tej przyczyny był w nich najniższy, wynosił bowiem dla transakcji krajowych niecałe 40%, a w obrocie zagranicznym tylko około 24%. Wynik ten jest znacząco niższy niż przeciętnie w przedsiębiorstwach badanych krajów Europy Wschodniej.
Drugą najczęściej wskazywaną przyczyną opóźnionego regulowania płatności jest dość powszechna praktyka traktowania zobowiązań płatniczych jako źródła finansowania działalności bieżącej. Na tę przyczynę wskazywało przeciętnie 34,7% respondentów w odniesieniu do transakcji krajowych i 25,5% respondentów w odniesieniu do transakcji zagranicznych. Z podobną częstością ta przyczyna była wskazywana przez przedsiębiorstwa B2B w Polsce i Turcji, natomiast w pozostałych krajach oceny te były odmienne. W przypadku Czech traktowanie zobowiązań płatniczych jako źródła finansowania działalności bieżącej jest bowiem, szczególnie w obrocie krajowym (57,8%), uznawane za najważniejszą przyczynę opóźnień płatniczych, podczas gdy na Węgrzech przyczyna ta miała relatywnie małe znaczenie (10,3-13,6%).
Formalna niewypłacalność kontrahentów w transakcjach krajowych jest z kolei przyczyną opóźnień płatniczych, na którą przeciętnie wskazywało 24,2% przedsiębiorców. Generalnie ocena wpływu tego czynnika wśród przedsiębiorców sektora B2B analizowanych krajów była zbieżna, poza przedsiębiorcami z Czech. W ich przypadku odsetek wskazań na tę przyczynę wydłużania cyklu płatności był znacząco wyższy i w odniesieniu do transakcji krajowych przekraczał 42%, podczas gdy w pozostałych krajach wynosił 16-26%. Zauważyć można ponadto, że ryzyko opóźnień płatniczych z tytułu niewypłacalności kontrahentów jest wyraźnie mniejsze w transakcjach zagranicznych. Przeciętnie bowiem wskazywało na nie około 15% respondentów, a na Węgrzech i Słowacji tylko 4-7%.
Z punktu widzenia przedsiębiorstw sektora B2B ważnym czynnikiem wpływającym na opóźnienia płatnicze są również złożone procedury płatności, głównie w handlu zagranicznym (24%). Na ten czynnik wskazywały przede wszystkim

36
przedsiębiorstwa w Czechach (35%) oraz w Turcji (28%), nie mniej analizując dane zawarte w tab. 4 można zauważyć, że opinie w tym zakresie są dość zróżnicowane. Przykładowo, na Węgrzech problem procedur płatniczych w transakcjach zagranicznych nie jest często wskazywany (16%) ale w transakcjach krajowych uznawany jest za bardzo ważny czynnik opóźnień płatniczych, wskazało go bowiem aż ponad 90% przedsiębiorców. Z kolei biorąc pod uwagę przedsiębiorstwa B2B na Słowacji, zauważyć można, że w opinii przedsiębiorców z tego kraju procedury płatnicze w marginalnym stopniu wpływają na wydłużanie cyklu zobowiązań. Zarówno w odniesieniu do transakcji krajowych (6,8%), jak i zagranicznych (3,6%) na tę przyczynę wskazywało relatywnie bardzo mało przedsiębiorstw.
Pozostałe przyczyny opóźnienia płatności były wskazywane ze znacznie mniejszą częstością. Wśród nich można jedynie wskazać na relatywnie większe negatywne oddziaływanie nieefektywności systemu bankowego w krajowych i zagranicznych transakcjach handlowych charakterystyczną dla Turcji (25,9% i 36,6%), spory o jakość towarów i usług w transakcjach zagranicznych w Czechach (33,3%), błędy na fakturach w transakcjach zagranicznych wskazywane przez polskich (21,4%) i tureckich (20,4%) przedsiębiorców oraz niezgodność towarów lub usług z treścią zagranicznych umów handlowych w Turcji (18,3%).
Generalnie dość podobnie wygląda ranking przyczyn opóźnień płatniczych postrzeganych w perspektywie sektorowej oraz wielkości przedsiębiorstw, przy czym podobnie jak w układzie krajów pewne różnice są zauważalne, w tym szczególnie przy uwzględnieniu typu geograficznego zawieranych transakcji (tab. 5). Biorąc pod uwagę sektory gospodarki można zauważyć, że najczęściej wymieniana przyczyna opóźnień płatniczych, jaką jest niewystarczająca dostępność środków finansowych, wskazywana jest generalnie z podobną i największą częstością w trzech rozpatrywanych sektorach, a niewielkie różnice zauważalne są jedynie w odniesieniu do handlu hurtowego, detalicznego i dystrybucji. W przypadku tego sektora gospodarki można mówić o relatywnie silniejszym oddziaływaniu analizowanej przyczyny w transakcjach krajowych, wskazywało na nią bowiem ponad 64% przedsiębiorstw. Ponadto, podobnie jak w układzie krajów, problemy z dostępnością środków finansowych były w rozpatrywanych sektorach w przypadku transakcji zagranicznych (41,1-41,7%) wskazywane znacznie rzadziej niż w transakcjach krajowych (58,8-64,1%).
Na finansowanie działalności bieżącej długiem, jako przyczynę opóźnień płatniczych, wskazywał dość podobny odsetek przedsiębiorców z poszczególnych sektorów gospodarki, a o relatywnie silniejszym oddziaływaniu tej przyczyny na terminy płatności można mówić tylko w odniesieniu do transakcji zagranicznych w przetwórstwie przemysłowym. W tym sektorze i w odniesieniu do handlu zagranicznego ponad 30% przedsiębiorców wskazywało na tę przyczynę, podczas gdy w pozostałych sektorach około 22%.
Trzecia najczęściej wymienia przyczyna opóźnień płatniczych – formalna niewypłacalność kupującego – w bardzo niskim stopniu różnicuje wyniki w układzie sektorowym. Wyniki zawarte w tab. 5 wskazują bowiem, że zarówno w transakcjach krajowych (23,7-25,6%), jak i zagranicznych (13,5-16,7%), częstość wskazań jest generalnie bardzo podobna. Również złożone procedury płatnicze w transakcjach zagranicznych są dość często wymieniane jako istotne przyczyny opóźnień regulowania faktur. Na tę przyczynę wskazuje bowiem ponad 20% przedsiębiorców, w tym
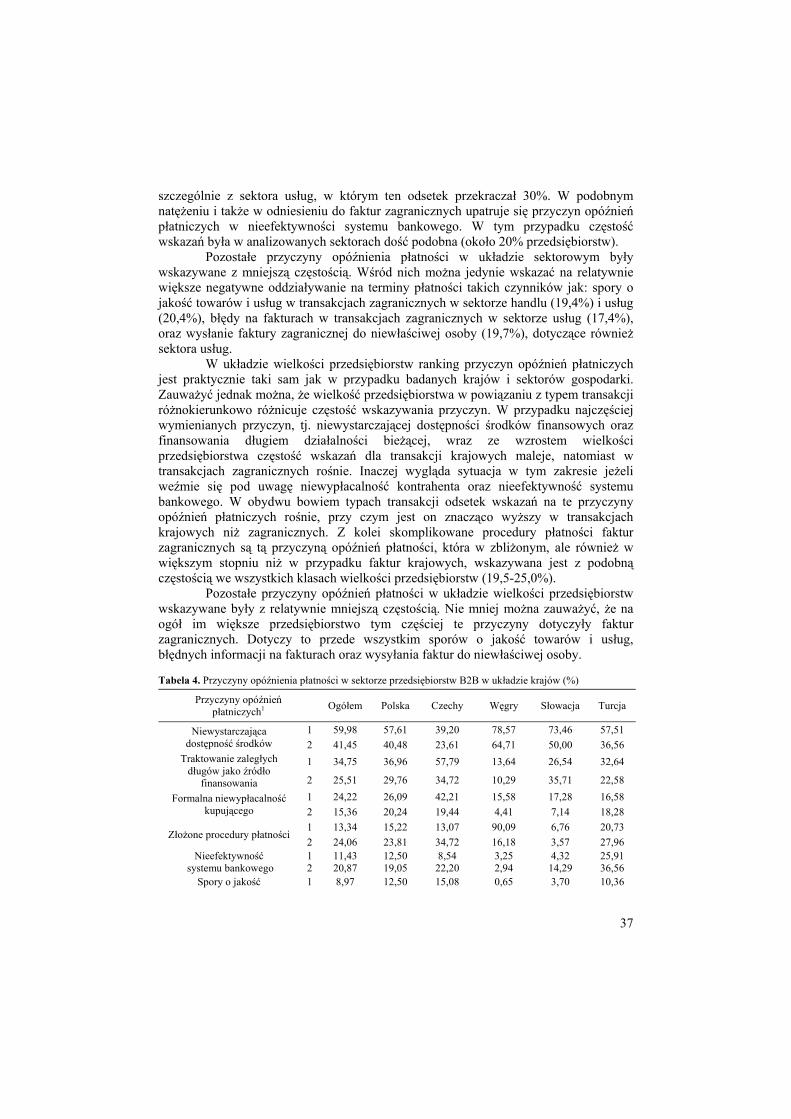
37
szczególnie z sektora usług, w którym ten odsetek przekraczał 30%. W podobnym natężeniu i także w odniesieniu do faktur zagranicznych upatruje się przyczyn opóźnień płatniczych w nieefektywności systemu bankowego. W tym przypadku częstość wskazań była w analizowanych sektorach dość podobna (około 20% przedsiębiorstw).
Pozostałe przyczyny opóźnienia płatności w układzie sektorowym były wskazywane z mniejszą częstością. Wśród nich można jedynie wskazać na relatywnie większe negatywne oddziaływanie na terminy płatności takich czynników jak: spory o jakość towarów i usług w transakcjach zagranicznych w sektorze handlu (19,4%) i usług (20,4%), błędy na fakturach w transakcjach zagranicznych w sektorze usług (17,4%), oraz wysłanie faktury zagranicznej do niewłaściwej osoby (19,7%), dotyczące również sektora usług.
W układzie wielkości przedsiębiorstw ranking przyczyn opóźnień płatniczych jest praktycznie taki sam jak w przypadku badanych krajów i sektorów gospodarki. Zauważyć jednak można, że wielkość przedsiębiorstwa w powiązaniu z typem transakcji różnokierunkowo różnicuje częstość wskazywania przyczyn. W przypadku najczęściej wymienianych przyczyn, tj. niewystarczającej dostępności środków finansowych oraz finansowania długiem działalności bieżącej, wraz ze wzrostem wielkości przedsiębiorstwa częstość wskazań dla transakcji krajowych maleje, natomiast w transakcjach zagranicznych rośnie. Inaczej wygląda sytuacja w tym zakresie jeżeli weźmie się pod uwagę niewypłacalność kontrahenta oraz nieefektywność systemu bankowego. W obydwu bowiem typach transakcji odsetek wskazań na te przyczyny opóźnień płatniczych rośnie, przy czym jest on znacząco wyższy w transakcjach krajowych niż zagranicznych. Z kolei skomplikowane procedury płatności faktur zagranicznych są tą przyczyną opóźnień płatności, która w zbliżonym, ale również w większym stopniu niż w przypadku faktur krajowych, wskazywana jest z podobną częstością we wszystkich klasach wielkości przedsiębiorstw (19,5-25,0%).
Pozostałe przyczyny opóźnień płatności w układzie wielkości przedsiębiorstw wskazywane były z relatywnie mniejszą częstością. Nie mniej można zauważyć, że na ogół im większe przedsiębiorstwo tym częściej te przyczyny dotyczyły faktur zagranicznych. Dotyczy to przede wszystkim sporów o jakość towarów i usług, błędnych informacji na fakturach oraz wysyłania faktur do niewłaściwej osoby.
Tabela 4. Przyczyny opóźnienia płatności w sektorze przedsiębiorstw B2B w układzie krajów (%)
Przyczyny opóźnień płatniczych1 Ogółem Polska Czechy Węgry Słowacja Turcja
Niewystarczająca dostępność środków
1 59,98 57,61 39,20 78,57 73,46 57,51 2 41,45 40,48 23,61 64,71 50,00 36,56
Traktowanie zaległych długów jako źródło
finansowania
1 34,75 36,96 57,79 13,64 26,54 32,64
2 25,51 29,76 34,72 10,29 35,71 22,58
Formalna niewypłacalność kupującego
1 24,22 26,09 42,21 15,58 17,28 16,58 2 15,36 20,24 19,44 4,41 7,14 18,28
Złożone procedury płatności 1 13,34 15,22 13,07 90,09 6,76 20,73 2 24,06 23,81 34,72 16,18 3,57 27,96
Nieefektywność systemu bankowego
1 11,43 12,50 8,54 3,25 4,32 25,91 2 20,87 19,05 22,20 2,94 14,29 36,56
Spory o jakość 1 8,97 12,50 15,08 0,65 3,70 10,36
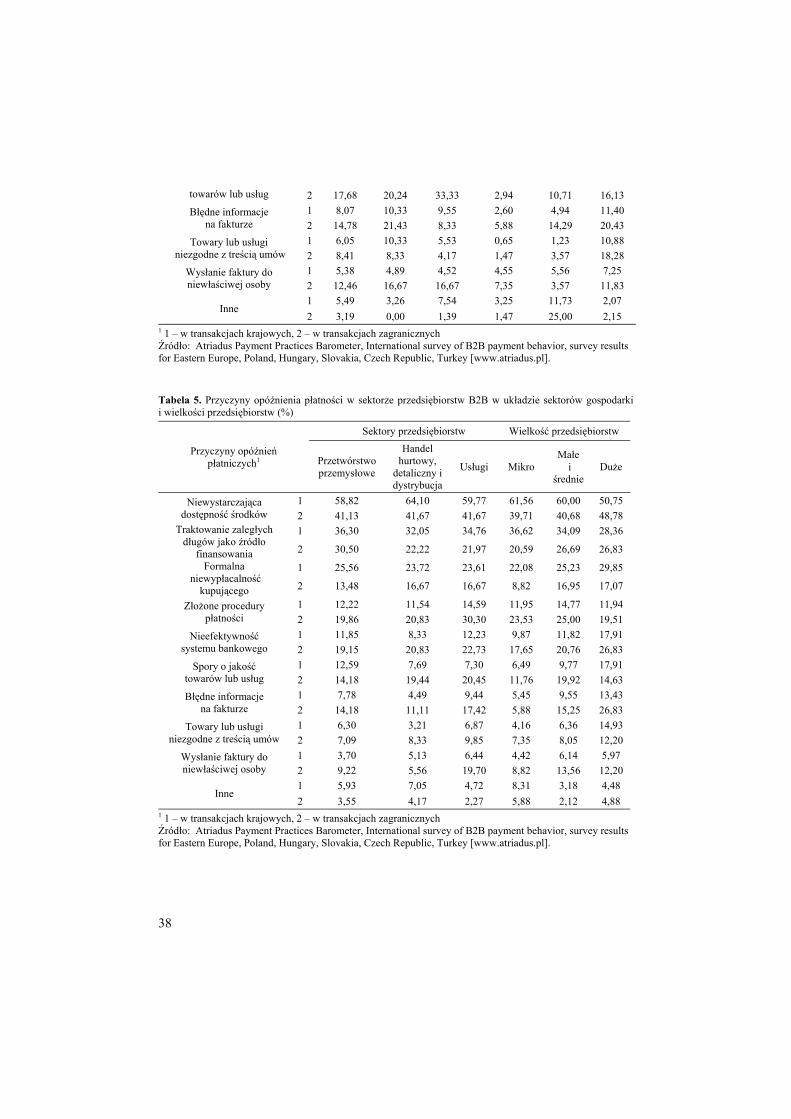
38
towarów lub usług 2 17,68 20,24 33,33 2,94 10,71 16,13 Błędne informacje
na fakturze 1 8,07 10,33 9,55 2,60 4,94 11,40 2 14,78 21,43 8,33 5,88 14,29 20,43
Towary lub usługi niezgodne z treścią umów
1 6,05 10,33 5,53 0,65 1,23 10,88 2 8,41 8,33 4,17 1,47 3,57 18,28
Wysłanie faktury do niewłaściwej osoby
1 5,38 4,89 4,52 4,55 5,56 7,25 2 12,46 16,67 16,67 7,35 3,57 11,83
Inne 1 5,49 3,26 7,54 3,25 11,73 2,07 2 3,19 0,00 1,39 1,47 25,00 2,15
1 1 – w transakcjach krajowych, 2 – w transakcjach zagranicznych Źródło: Atriadus Payment Practices Barometer, International survey of B2B payment behavior, survey results for Eastern Europe, Poland, Hungary, Slovakia, Czech Republic, Turkey [www.atriadus.pl]. Tabela 5. Przyczyny opóźnienia płatności w sektorze przedsiębiorstw B2B w układzie sektorów gospodarki i wielkości przedsiębiorstw (%)
Przyczyny opóźnień płatniczych1
Sektory przedsiębiorstw Wielkość przedsiębiorstw
Przetwórstwo przemysłowe
Handel hurtowy,
detaliczny i dystrybucja
Usługi Mikro Małe
i średnie
Duże
Niewystarczająca dostępność środków
1 58,82 64,10 59,77 61,56 60,00 50,75 2 41,13 41,67 41,67 39,71 40,68 48,78
Traktowanie zaległych długów jako źródło
finansowania
1 36,30 32,05 34,76 36,62 34,09 28,36
2 30,50 22,22 21,97 20,59 26,69 26,83 Formalna
niewypłacalność kupującego
1 25,56 23,72 23,61 22,08 25,23 29,85
2 13,48 16,67 16,67 8,82 16,95 17,07
Złożone procedury płatności
1 12,22 11,54 14,59 11,95 14,77 11,94 2 19,86 20,83 30,30 23,53 25,00 19,51
Nieefektywność systemu bankowego
1 11,85 8,33 12,23 9,87 11,82 17,91 2 19,15 20,83 22,73 17,65 20,76 26,83
Spory o jakość towarów lub usług
1 12,59 7,69 7,30 6,49 9,77 17,91 2 14,18 19,44 20,45 11,76 19,92 14,63
Błędne informacje na fakturze
1 7,78 4,49 9,44 5,45 9,55 13,43 2 14,18 11,11 17,42 5,88 15,25 26,83
Towary lub usługi niezgodne z treścią umów
1 6,30 3,21 6,87 4,16 6,36 14,93 2 7,09 8,33 9,85 7,35 8,05 12,20
Wysłanie faktury do niewłaściwej osoby
1 3,70 5,13 6,44 4,42 6,14 5,97 2 9,22 5,56 19,70 8,82 13,56 12,20
Inne 1 5,93 7,05 4,72 8,31 3,18 4,48 2 3,55 4,17 2,27 5,88 2,12 4,88
1 1 – w transakcjach krajowych, 2 – w transakcjach zagranicznych Źródło: Atriadus Payment Practices Barometer, International survey of B2B payment behavior, survey results for Eastern Europe, Poland, Hungary, Slovakia, Czech Republic, Turkey [www.atriadus.pl].
39
Podsumowanie Opóźnienia terminów płatności w transakcjach handlowych stanowią poważne zagrożenie dla stabilności prowadzenia działalności gospodarczej, skutkują bowiem narastaniem problemów związanych z utrzymaniem płynności finansowej, generują dodatkowe koszty, redukują zyski oraz bardzo często prowadzą do utraty wiarygodności kredytowej a nawet bankructwa. Przeprowadzone w artykule analizy uzasadniają sformułowanie następujących uwag końcowych:
- Mimo wprowadzenia na szczeblu unijnym i narodowym regulacji prawnych dotyczących terminów zapłaty w transakcjach handlowych, problem opóźnień płatniczych występuje nadal w dużej skali, i tym samym wskazuje na słabą skuteczność opracowanych instrumentów.
- Średnio około 41% sprzedaży w badanych przedsiębiorstw sektora B2B Europy Wschodniej realizowano przy zastosowaniu kredytu kupieckiego, przy czym ten instrument finansowy chętniej stosowano w transakcjach zagranicznych niż krajowych. Skłonność do udzielania kredytu kupieckiego jest w uwzględnionych krajach silnie zróżnicowana. Na Słowacji i w Polsce sprzedaż z odroczonym terminem płatności stanowiła tylko 20-30% wartości sprzedaży, podczas gdy na Węgrzech aż około 70%.
- Struktura terminowa należności zakontraktowanych w przedsiębiorstwach sektora B2B porównywanych krajów Europy Wschodniej jest, poza Turcją, bardzo podobna. Kontrakty zawierano bowiem głównie na termin do 30 dni (ponad 80%), poza Turcją gdzie należności zakontraktowane w tym przedziale czasowym stanowiły około 54 % umów z odroczonym terminem płatności. Z kolei zasadnicze różnice stwierdzono w przypadku struktury należności przeterminowanych. Wprawdzie dominowały w nich głównie faktury płatne do 30 dni (około 50%), jednak nie mały udział miały również faktury przeterminowane z dłuższymi terminami płatności. W Polsce i na Węgrzech faktury przeterminowane powyżej 90 dni stanowiły w przedsiębiorstwach sektora B2B aż ponad 20% faktur przeterminowanych ogółem.
- Dysproporcje między strukturą należności zakontraktowanych i przeterminowanych przekładają się na skalę opóźnień płatniczych oraz rzeczywisty czas płatności. W najmniejszym stopniu opóźnienia płatnicze oddziaływały na gospodarkę finansową przedsiębiorstw słowackich (17 dni) i węgierskich, gdzie regulacja faktur opóźniona była tylko o 10 dni. Na ich tle zdecydowanie najgorzej wygląda sytuacja w Turcji, gdzie opóźnienie płatności wynosiło średnio ponad 1 miesiąc i skutkowało 76 dniowym czasem rzeczywistej zapłaty. Jednak rzeczywisty czas płatności nie był w pozostałych krajach krótki, mieścił się na ogół w dość wąskim przedziale 46-51 dni. Generalnie jednak najkorzystniej wyróżniały się przedsiębiorstwa na Węgrzech, gdzie rzeczywisty czas płatności wynosił przeciętnie 35 dni.
- Główne przyczyny opóźnień płatniczych przedsiębiorcy z sektora B2B upatrują w ograniczonym dostępie kontrahentów do środków finansowych, w nagminnej praktyce traktowania zaległych zobowiązań jako źródła finansowania bieżącej działalności, formalnej niewypłacalności kontrahentów oraz w złożonych procedurach płatności. Na ogół te przyczyny były przez przedsiębiorców B2B najczęściej wymieniane, przy czym częstość ta była w wybranych przekrojach (kraj, sektor gospodarki, wielkość przedsiębiorstwa) silniej powiązana z krajowymi lub zagranicznymi transakcjami handlowymi.

40
Literatura Atriadus Payment Practices Barometer – International survey of B2B payment behavior, survey results for Eastern Europe, May 2015 Spring, www.atriadus.pl, dostęp: 16.04.2016. Atriadus Payment Practices Barometer, International survey of B2B payment behavior, survey results for Poland, May 2015, www.atriadus.pl, dostęp: 16.04.2016. Atriadus Payment Practices Barometer, International survey of B2B payment behavior, survey results for Czech Republic, May 2015, www.atriadus.pl, dostęp: 16.04.2016. Atriadus Payment Practices Barometer, International survey of B2B payment behavior, survey results for Slovakia, May 2015 Spring, www.atriadus.pl, dostęp: 16.04.2016. Atriadus Payment Practices Barometer, International survey of B2B payment behavior, survey results for Hungary, May 2015, www.atriadus.pl, dostęp: 16.04.2016. Atriadus Payment Practices Barometer, International survey of B2B payment behavior, survey results for Turkey, May 2015, www.atriadus.pl, dostęp: 16.04.2016. Cicirko T.: Możliwości ograniczania zatorów płatniczych poprzez system podatkowy. Zeszyty Naukowe Politechniki Rzeszowskiej, Zarządzanie i Marketing, nr 272(17)/2010. Czepukojć K.: Zatory płatnicze mogą prowadzić do upadłości, http://www.egospodarka.pl, dostęp: 10.04.2016. Dyrektywa Parlamentu Europejskiego i Rady 2011/7/UE z dnia 16 lutego 2011 r. w sprawie zwalczania opóźnień w płatnościach w transakcjach handlowych. European Payment Report 2015, www.intrum.com, dostęp: 20.04.2016. Gołaś J.: Prawne i ekonomiczne uwarunkowania opóźnień płatniczych w transakcjach handlowych przedsiębiorstw w Polsce, Ekonomika i Organizacja Przedsiębiorstw, nr 2/2016. Gołaś Z., Bieniasz A.: Zróżnicowanie terminów płatności w wybranych krajach Europy, Zeszyty Naukowe SGGW, Polityki Europejskie, Finanse i Marketing, nr 12(61)/2014. Nowak D.: Rola i znaczenie kredytu kupieckiego. Zeszyty Naukowe Uniwersytetu Szczecińskiego, Finanse, Rynki Finansowe, Ubezpieczenia, nr 65/2014. Łuczka T.: Kapitał obcy w małym i średnim przedsiębiorstwie. Wybrane aspekty mikro i makroekonomiczne, PWE, Warszawa – Poznań, 2001. Statistical appendix Atriadus Payment Practices Barometer, survey results for Eastern Europe, May 2015, www.atriadus.pl, dostęp: 16.04.2016. www.atriadus.pl – strona internetowa firmy Atriadus, dostęp: 16.04.2016.
Summary The article presents results of multi-faceted analysis of differentiation of payments delays in commercial transactions of B2B sector enterprises located in chosen eastern Europe countries. The analysis was based on data coming from reports of the international business information agency Atriadus regarding enterprises in Poland, Slovakia, Czech Republic, Hungary and Turkey. The research proved that average of approx. 41% of sales in surveyed B2B sector enterprises were carried with use of the trade credit, mostly in foreign transactions. The research also proved that most contracts were concluded for payment period of 30 days (over 80%), with exception of Turkey where contracted liabilities equaled to approx. 54% of all contracts. Furthermore, it was proved that the smallest payments delay rate was observed in case of enterprises located in Slovakia and Hungary (10-17 days), whereas the biggest delay rate was observed in case of Turkey (76 days). According to the research, contractors’ limited access to financial resources, practice of treating outstanding debts as financial sources for current operations, formal insolvency of contractors and complex payments procedures should be considered as four main causes of payment delays in the B2B sector enterprises.
Key words: payment delays, B2B sector, Eastern Europe

41
Informacja o autorze:
dr hab. Zbigniew Gołaś Wydział Ekonomiczno-Społeczny Katedra Ekonomiki Przedsiębiorstw Agrobiznesu Uniwersytet Przyrodniczy w Poznaniu ul. Wojska Polskiego 28 60-637 Poznań e-mail: [email protected]
42
15 (64) 2016
Bogdan Gregor Magdalena Kalińska-Kula University of Lodz
MARKET INTELLIGENCE – A CONCEPTUAL APPROACH
Nowadays the biggest challenge for managers is obtaining business information
that should support decision-making processes. The main task of decision makers is to understand the operating environment in order to compete effectively and as a result, to achieve success and development. Market intelligence as a practical program collects information about the market and its players through constant monitoring of the environment and ongoing changes that are observed, as well as in a form of ad hoc projects. Nowadays market intelligence in many companies has reached a position that compares to other professional management support functions, such as risk management or public relations.
The aim of the article was to provide an explanation of the essence of market intelligence as a concept that plays a crucial role in generating valuable knowledge about the market, building competitiveness of enterprises and achieving growth in a specific market. The authors present the results of introductory research on functioning of programs used for obtaining knowledge about the market in regional enterprises. The research was conducted in big and medium-sized enterprises in Lodz province by means of a personal interview and a measurement tool was a questionnaire. Key words: market intelligence, marketing research, market research, knowledge on the market
Introduction To understand the market, to undertake a successful competitive struggle and to develop – these are the challenges that managers face today. Business environment is getting more and more complex, complicated and multidimensional. Every organization is an element of a chain of values including customers, intermediaries, suppliers and various competitors. An enterprise cooperates with specific groups such as government institutions or trade associations. All these entities create industries whose dynamics must be understood by enterprises. Apart from that the macroeconomic environment must be taken into consideration, including economic, demographic, cultural factors as well new technologies which, similarly to business models, can be easily transferred to adjacent industries. Trends and megatrends that appear in the environment initiate creating new business opportunities and threats, both now and in the future. In order to create a strategy of development every organization should understand current and expected changes that are observed in the market.
In the global survey concerning market research conducted in 2009 by Global Intelligence Alliance 724 managers and specialists indicated opportunities and threats

43
that must be taken into account.1 The issues that were most often mentioned among opportunities included mergers and acquisitions, taking over competitors’ market share, expansion to new markets, discovery of innovative business models, a proper recognition of customers’ expectations and new needs as well as generating a new partnership. As far as the problems that managers face are concerned, they indicated such threats as a fall of prices, new rivals in the market, new business models, consolidation or fragmentation of a value chain, lack of understanding of current trends, changes in consumers’ behaviour.
Taking into account how complex the environment in which modern organizations act is, it must be assumed that competitiveness and enterprise development to a large extent are conditioned by a careful examination and understanding of business environment. That task may seem difficult because together with a growth of complexity of global market, an amount and range of available market information increase dramatically. Lots of managers feel some symptoms of information paralysis and every additional item of information only hinders finding and recognition of correct data that might be used in decision-making processes.
Management of business information in such circumstances boils down to an ability to obtain proper data from organisation environment and to transform it into knowledge that can help in managerial decisions. Another challenge is also the management of a growing amount of information that already is inside an organization in the form of knowledge and experience of employees at different levels. Decision makers should skillfully use these resources and do it in a methodical way. While taking an aspect of time into consideration, it must be added that it is crucial to obtain appropriate business information at the right time – when it is exactly needed to make a decision. Against the background of such conditions it is clearly observed that there is a need to find effective solutions for managers. Market intelligence can be such a solution as it is understood as a program of specific actions and a function of supporting decision making processes occurring within enterprise management.
The aim of the article was an attempt to explain the essence of market intelligence as a concept that plays a crucial role in generating valuable knowledge about the market. Apart from a theoretical discussion that was based on studies of literature, the paper presents introductory results of the research concerning functioning of programs for obtaining knowledge about the market in regional enterprises. The research was conducted on the sample of big and medium-sized enterprises from Lodzkie province by means of a personal interview. The research was financed from statutory funds of the Department of Marketing of the University of Łódź.
The essence of market intelligence and related concepts It can be assumed that market intelligence is at the same time a kind of old and new area. The conception was born when the first entrepreneur decided to implement the idea of systematical gathering information on the structure of its organization. But it was at the
1 H. Hedin, I. Hivensalo, M. Vaarnas: The Handbook of Market Intelligence, John Willey & Sons Ltd, Chichester 2011, p. 4.

44
turn of the previous century’s last years when the development of Market Intelligence accelerated rapidly, and this concept began to appear in the literature.
All organizations functioning in a competitive environment need and have always needed information what the market wants, what products and services consumers expect as well as what competition offers. Their objective is to strive to gain a competitive advantage. However, activities in the area of market intelligence are sometimes perceived in a narrow sense and are limited to „keeping an eye” on the competition and activities are undertaken haphazardly by individual people in various departments of organisation. Nowadays, the conditions of the global economy impose a necessity to implement systematic programs of collecting information. Information must be adjusted to a functional area of organization (finance, marketing, human resources management, etc.) as well as to a function and level of management. Every decision making level in an enterprise requires an inflow of specific information at the right moment.2 Due to an increasing need for precise and adequate business information that is reported not only at the level of head office, but virtually at every level of enterprise, market intelligence plays an important role in organisation development. It must be stressed that for the last years there has been a considerable change in information supply and decision makers today have to struggle with a risk of information disconnection caused not by the lack of information, but by the lack of time to order and differentiate available information. Managers function in the plethora of information and often have problems to identify what is really important3 and so-called „information gap” that has been observed until recently has been transformed into overabundance of often irrelevant information, that bring information pollution.4 What proves crucial in this situation is not only an information resource but an ability to select, assess and use – it is estimated that only 20% of information that reaches managers concerns key issues and in 80% it decides about the results of activities.5 That is why, among others, market intelligence today occupies a position comparable to other professional supportive functions in organizations such as risk management, public relations or outsourcing. According to the findings of the global survey conducted in 2009 by Global Intelligence Alliance in enterprises where market intelligence actions were systematically implemented, making decisions is more effective in comparison to companies where MI program does not function. 82% of respondents using market intelligence program claimed that appropriate information, necessary to support decision making processes is usually available at once or with a slight delay, whereas only 53% of respondents without this program claimed the same.6
Enterprises are market entities that dynamically try to shape their environment through operational, tactical and strategic decisions. In many organizations millions of
2 T. Domański, P. Kowalski: Marketing dla menedżerów, Wydawnictwo Naukowe PWN, Warszawa-Łódż 1998, s. 71. 3 A. K. Koźmiński.: Zarządzanie w warunkach niepewności, Wydawnictwo Naukowe PWN Warszawa 2004, s. 8. 4 J. Sosnowski: Systemy elektroniczne w marketingu, Wydawnictwo Uniwersytetu Łódzkiego Łódź 1999, s.95. 5 Z. Martyniak: Metody organizowania procesów pracy, Państwowe Wydawnictwo Ekonomiczne, Warszawa 1996, s.30. 6 H. Hedin, I. Hivensalo, M. Vaarnas: The Handbook of Market Intelligence, John Willey & Sons Ltd, Chichester 2011, p. 9.

45
such decisions are made every day and simplicity in making them to a great extent depends on the method of organization, cohesion and complexity of information policy implemented in a company.7 Market intelligence in its essence is a process of continuous obtaining information from various sources, their evaluation, and then using it while making business decisions. It can be defined as a program of activities targeted at collecting information about market players and strategic problems and subsequently, processing it into observations and knowledge supporting decision-making processes in an enterprise. These activities play a key role in generating knowledge about the market, building competitiveness and company development while helping an organisation to understand the environment in which it functions, to compete successfully in this environment and as a result, to achieve growth.8
Information grounds of market intelligence are formed by four basic areas: information about a product, about competition, about the market and information about consumers.9 Information about a product refers to knowledge about products available on the market that an enterprise supports and concerns tactical marketing activities such as a pricing policy or a promotional action applied for the products (both, its own and rival products). The area of information about competition comprises understanding of competitors’ strategy, investments and development plans, organizational structure, portfolio of current and future products. In turn, information concerning the market comprises its picture at a macroeconomic level as well as determination of the market size and its segments, trends concerning market shares, development trends and forecasts for the market growth.
The area of information about consumers is associated with understanding preferences of buyers and reasons for their behaviour and opinions that can influence their actions and an attitude to products or services of a company as well as studies on brand awareness, level of satisfaction and customer loyalty and dynamics of sales. Each of the mentioned areas could be a separate area for analysis, however, the essence of market intelligence is rooted in combining information so that a complete picture of the market could be created.
In order to present a complex picture of the market where an enterprise functions, which comprises first of all its clients and competition as well as conditions for a growth potential for new products and services, market intelligence takes advantage of many sources of information. Sources of data for this type of analysis include sales journals, findings of conducted surveys, social media research and many others. Information can be collected from business and industry associations, state institutions or by visiting a website or competitors’ shops, finding information published in the press about a number and type of potential customers. Market intelligence also comprises checking commentaries made by customers that are passed on via the Internet and collecting information that could help a company to improve its offer. While gathering knowledge about the market many companies applied advanced analyses forgetting that a potential source of valuable data are customers. Even small companies can create 7 M. Callingham: Market Intelligence, Kogan Page Ltd, London 2004, p. 9. 8 H. Hedin, I. Hivensalo, M. Vaarnas: The Handbook of Market Intelligence, John Willey & Sons Ltd, Chichester 2011, p. 9. 9 E. Crowley: Market intelligence versus marketing research, Quirk’s. Marketing Research Review 12/2004, p. 64.
46
customers’ databases and implement programs for collecting customers’ opinions creating resources of knowledge about buyers in an efficient and cheap way (customer intelligence).10 A potential source of valuable information are also analytical e-commerce systems that allow to track buyers’ behaviour on an enterprise website e.g. to obtain information about how many people visit a website, where they come from, what the subsequent steps after entering a website are, how many of them reach a basket of shopping and how many leave a website without making a transaction. In order to create the most complete picture of the market, specialists of market intelligence should also collect data while communicating with producers, distributors and all intermediaries engaged in a process of creating products and making them available. This kind of dialogue and statistical data and results of marketing research constitute a crucial part of market intelligence system.
While building key competencies in the area of market intelligence a key role is assigned to outsourcing, sometimes referred to as „lean management”11, e.g. in the range of using external suppliers of technologies of information distribution used for collecting, analyzing and spreading data about current market changes (regarding prices of competition or promotional actions). It is also possible to use a marketing research agency to implement all side aspects of research projects (including collecting empirical data, project management and conducting basic and cross statistical analyses). On the other hand, analysts in an enterprise can concentrate on preparing an initial research project based on thorough understanding of information needs of managerial staff, and then transferring research results into recommendations towards specific business decisions. Application of appropriate rules, techniques and solutions enable to create a structure of market intelligence but not only those present an integral part of a process of making a decision, but also the ones that play a key role in shaping strategic directions of enterprise development.12
The notion of market intelligence is related to other activities and is often identified with them. The term is frequently used interchangeably with the notion of marketing research, which is a mistake.13 Marketing research comprises various forms and methods of activities whose aim is to increase understanding of market and customers and they constitute an explicitly defined discipline with the grounds in business practice. Market intelligence presents much a broader notion – a continuous process of acquiring holistic knowledge to obtain a comprehensive picture of all aspects of the market. The basic differences between marketing research and market intelligence include:14
10 K. Arline: What is Market Intelligence? Business News Daily, http://www.businessnewsdaily.com, data dostępu: l0.02.2015 11 G. Probst, S. Raub, K. Romhardt: Zarządzanie wiedzą w organizacji, Oficyna Ekonomiczna Kraków 2002 12 E. Crowley: Market intelligence versus marketing research, Quirk’s. Marketing Research Review 12/2004, p. 66. 13 J. Weber, J. Spitzner, M. Staffels: Erfolgreich steuern mit Market Intelligence. Marktentscheidungen fundiert treffen, Wiley-VC Verlag, Weinheim 2008, p.5. 14 E. Crowley: Market intelligence versus marketing research, Quirk’s. Marketing Research Review 12/2004, p. 64.

47
• market intelligence is an all-embracing activity and collecting data is only one of the aspects of this activity. Research can be a fundamental element of building „information pyramid” but not the only one;
• analyses conducted within the framework of market intelligence require greater analytical and business skills than in the case of traditional marketing research. What is indispensable is integration of data concerning the market, key competitors, financial dynamics of industry as well as the whole chain of enterprise value. To carry out such extensive analyses people with appropriate skills and competences are needed – managerial, financial, mathematical, sociological ones as well as knowledge of product management of consumer behaviour;
• market intelligence requires integration of all areas of enterprise activity and comprises the overall picture of the market whereas marketing research strictly focuses on specific problems;
• marketing research usually concentrates on providing answers to specific questions or to solve specific problems and it presents a completed „task”, whereas market intelligence is a continuous, interactive process that is a closed system and encompasses feedback from managerial staff for a market intelligence team. These teams constantly monitor the environment, detect and synthesize information, thanks to which managerial team is not astonished with the development of market situation or actions of competition.
As it has been already mentioned, market intelligence enables to gain permanent and full understanding of the market. Each area of collected knowledge – about competition (competitor intelligence), a product (product intelligence), market (market understanding) and customers (customer insight) – is indispensable to fully understand the environment in which an enterprise functions. Strategies of every market participant influence activities undertaken in a product area. Trends of market development and reactions of segments subsequently determine strategies of competing enterprises and behaviour and attitudes of customers drive the dynamics of the market, its pace of development and acceptance of a product. Therefore, the integration of all indicated areas of knowledge is of crucial importance. Marketing research plays a significant role in obtaining information, however, it does not integrate all information areas, which are encompassed by market intelligence. If a company narrows activities only to marketing research, its view on the market is limited to specific problem areas. This is the range of information covered by the analysis that is one of the key differences between marketing research and market intelligence.
The notion of market intelligence is sometimes used interchangeably with the notion of business intelligence although BI refers more often to computer systems and techniques of processing of figures. Systems of business intelligence enable an analysis of data concerning mostly customers and lines of products, amount of distributed goods or volume of sales in a specific period of time. On the other hand, market intelligence concentrates on specific categories of customers, taking into the account their segmentation by demographic and geographical criteria as well as habits and purchasing
48
behaviour and it also takes into consideration what happens with competition, which is an area omitted by business intelligence.15
As it has been observed, tracking competition and a condition of industry is an integral element of activity of each company. Traditionally, obtaining this type of information was described as market research. Considering their essence these two notions are to a great extent convergent. Market research aims to decrease entropy and disorder of a market entity, is orientated at the inside of an organization and serves to recognize a market situation and to determine an enterprise’s own share.16 It constitutes a complex process that consists of subsequent steps of groups of activities for collecting information, processing gathered data, analysis and interpretation of obtained findings.17
Within the framework of market research two areas can be distinguished – market analysis and forecasting. The first of them serves to learn about current phenomena and market processes and it comprises an analysis of market balance, market capacity and absorption. Forecasting, on the other hand, through capturing dynamic changes observed in demand, which depend on various economic and non-economic factors, allows predicting a future market condition.18 In case of market intelligence the practice of collecting information presented above, has been extended by a range of analyses directed at improvement of enterprise business model and its development perspectives. On the basis of collected information it can be stated that these phenomena coexist and cause and effect interdependencies can be determined and that knowledge creates the grounds for building a model that enables the quantification of market reality. Based on the created model one can make forecasts of development of market phenomena in the future, which becomes a crucial element of the decision support system.19
The practice of international research can also seem convergent with the concept of market intelligence. Plenty of companies place international marketing research within the framework of their market intelligence systems and processes, however, these notions are not identical. Enterprises undertake international research in order to collect information about a local target market. The objective of this research is to provide crucial data for enterprises that concern specific needs of buyers, market size and competition. Global market research is to provide information that serves to determine profitability of a venture or a product before they invest bigger resources and enter a specific market. Such research can obviously be conducted both, before and after launching a product to a new market, yet, it is especially important before making international expansion because it shows companies a correct direction of strategy. Contrary to international research, market intelligence puts emphasis on information that is adequate for current markets where an enterprise functions and processes it into knowledge that serves to support managerial decisions.20
15 K. Arline: What is Market Intelligence? Business News Daily, http://www.businessnewsdaily.com, data dostępu: l0.02.2015 16 S. Mynarski: Przesłanki badań rynkowych i marketingowych, Marketing i Rynek 12/1998, s. 4. 17 Z. Kędzior [red.]: Badania rynku, Polskie Wydawnictwo Ekonomiczne, Warszawa 2005, s. 7. 18 S. Mynarski: Przesłanki badań rynkowych i marketingowych, Marketing i Rynek 12/1998, s. 5. 19 H. Mruk [red.]: Analiza rynku, Polskie Wydawnictwo Ekonomiczne, Warszawa 2003, s. 13. 20 K. Pham: International Market Research versus International Market Intelligence, http://internationalmarketintelligence.com, data dostępu: 10.06.2015

49
Material and methods
In light of studies on the literature market intelligence is a concept that plays a critical role in generating valuable knowledge about the market, building enterprise competitiveness as well as achieving growth in a current market. A fundamental question that was raised against this background concerned a degree and range of functioning of market intelligence and application of practices serving to build this type of systems among local enterprises. In order to gain an answer to this question a research project was designed and its first stage were literature studies. Then, the introductory research was prepared and conducted by means of personal interviews with managers and managerial staff of big and medium-sized enterprises located in the Łódź Province. The measurement tool was a questionnaire that comprised both open and closed questions and the interviewer was able to modify questions and to ask some additional ones. The research was conducted in the period between October 1 and November 15, 2015 and it included 45 business entities. Due to a relatively small size of the sample the generalizing value of the research findings is limited, nonetheless, they served to prepare a research instrument that will be used in the subsequent stage of the quantitative research.
The enterprises included purposefully in the research sample were big and medium-sized enterprises, taking an assumption that only such entities can possess information indispensable to realize the research objectives. Nearly three quarters of the sample were companies that employ between 50 to 249 workers – 33 enterprises. The sample comprised also 7 entities employing from 250 to 500 workers and 5 entities with more than 500 employees. More than a half of the surveyed enterprises were manufacturers (26 entities), a quarter ran trading activity (7 wholesalers and 4 retailers), whereas 7 – ran service activities. Nearly 60% of respondents (27 entities) are companies active in B2B sector, more than a quarter – in B2C sector (13 companies), and 5 enterprises indicated public administration sector as their target market (B2G). The vast majority (nearly two thirds) of enterprises, which participated in the research, conduct activities on an international scale, one fifth (10 entities) function in the domestic market and only 7 – in a regional market. More than a half of respondents are companies exclusively with Polish capital, slightly above one quarter indicated mixed capital and 7 entities were companies exclusively with foreign capital.
Results and discussion In the course of conducted studies respondents were asked to what extent information about the market obtained by means of market research can be helpful in such issues as sales increase, reduction of risk connected with making decisions, obtaining competitive advantage, extension of target market, improvement of enterprise image, building permanent relations with buyers, creating ideas and development of new product as well as launching a product. According to the surveyed, knowledge about the market can prove useful to achieve growth of sales – such opinions were mentioned by over 80% of enterprises (among which nearly half of respondents said it was „very helpful”). Three quarters stated that market research was helpful or very helpful in gaining a competitive advantage as well as in creating ideas for a new product. Two out of three respondents
50
expressed such opinions about their extending target market and improvement of enterprise image, and over 60% indicated reduction of risk and launching a new product to a market. Over a half of respondents also expressed opinions that market knowledge is helpful or very helpful in building permanent relations with buyers.
Subsequently, the respondents were asked about facts concerning the practice of gaining knowledge about the market. In light of the research findings the information that was collected most often concerned competition (more than nine out of ten surveyed companies). A high proportion i.e. over 80% of respondents collected also information about buyers to support managerial processes, three quarters collected information concerning their target market and slightly over two thirds (68.9%) – information concerning products. Only in case of information regarding promotional activities the proportion of indications was lower than 42.2%.
In case of studies on competition the most frequent actions included activities meant to monitor current activities of competition (more than a half of respondents conduct such studies regularly – every month or every quarter at the latest) including activities connected with launching new competitive products to the market (nearly 40% of respondents). Every third of surveyed enterprises conduct studies on consumer strategy regularly and every fifth – the analysis of a subjective structure of competition in a current market. Studies on a market share as well as organizational structures of competitors are conducted by the majority (more than a half) of respondents ad hoc or once a year.
As far as knowledge about buyers is concerned, enterprises most often conduct research of needs and preferences as well as customer satisfaction - above 40% collect this type of information regularly every month or every quarter. However, studies on loyalty are conducted regularly only by every fourth enterprise, whereas nearly two thirds conduct measurements in this area only once a year or ad hoc. Research on consumer behaviour in the process of buying is carried out by every fifth company and every third do not conduct this type of studies at all. Nearly half of respondents never examine consumers’ features and their sensitivity to changes in income and prices and more than a half do not conduct motivational research.
As far as the recognition of enterprise target market is concerned, the most frequent studies concern market trends which are conducted regularly by more than a half of companies. On the other hand, market forecasts are prepared regularly by nearly half of respondents, similarly to the analysis of their own market shares. Slightly over one third of respondents conduct research on a territorial range of the market and analyse opportunities and threats emerging in the market environment of an organization. Three quarters of enterprises examine ad hoc or regularly the market size and potential, and more than a half conduct segmentation research with a similar frequency. Analysis of market in space is conducted ad hoc by nearly half of companies and the same number does not carry out such research at all.
The vast majority of surveyed enterprises – nearly two thirds – regularly conduct research connected with shaping a product price and dynamics of sales. Nearly a half of companies equally often conduct research on perception of a product and its quality as well as on the level of provided services. Analyses in the area of distribution and logistics as well as the research on brand awareness and recognition are carried out regularly by more than 40% of respondents. Studies that are conducted the most rarely

51
concern brand preferences and are realized by nearly a half of enterprises, whereas one third do not conduct such measurements at all.
As far as promotional activities are concerned nearly 60% of enterprises regularly conduct analyses of efficiency and effectiveness of their activities and studies on communication are realized by more than a half of respondents. At the same time, nearly half of companies undertake research on consumers’ sensitivity to instruments of promotion ad hoc, whereas studies on media are not conducted by more than a half of companies at all.
In the course of conducted studies there was an attempt to determine who in the surveyed enterprises (organizational unit or a specific person) is responsible for coordinating and conducting market research and analyses. Respondents most often pointed at marketing department (nearly half of the surveyed) and sales department (nearly one quarter), more seldom they indicated heads of departments and directors (only every fifth enterprise), and even more seldom they indicated the board, auditors or ISO department and IT department. It must be observed that in light of the literature studies, organizationally market intelligence is usually placed in the area of strategic planning, business development or marketing, which was also confirmed in quoted results of the research.21
As far as the number of people involved in collecting market information is concerned, in majority of enterprises there were 3 – 4 people (it was indicated by more than 60%), one fifth of organizations delegate a dozen workers for these tasks (usually 14 – 15 people). It must be noted that there are companies that have a team of 20, 30, or even 50 people, who deal with obtaining knowledge of the market. According to the results of the research cited before i.e. the one conducted by Global Intelligence Alliance, an average size of market intelligence team was 13 people.22 It is worth mentioning that only one third of examined enterprises used external companies to obtain market information, and the others conducted that research on their own.
In order to create a full picture of the market in which an enterprise functions, of their customers and competition, a system of market intelligence should use a lot of sources of information. The surveyed enterprises indicated using secondary sources, such as own records (i.e. sales journals, reports), which were evaluated as very useful by the vast majority of companies (80%). Websites were also mentioned – they were considered useful by nearly a half of respondents as well as social media and institutional sources of data that are available in various offices, institutions, yet, the two last categories were evaluated as the least useful by nearly half of respondents.
Respondents also collected information from primary sources, such as customers (this source was considered useful by more than nine out of ten surveyed), business partners, including suppliers and intermediaries (a very useful source according to three out of four surveyed), distributors (two thirds of respondents expressed very positive opinions) as well as consultants and specialists in a specific industry including producers (evaluated as a very useful source of data by one third of respondents). It must
21 H. Hedin, I. Hivensalo, M. Vaarnas: The Handbook oh Market Intelligence, John Willey & Sons Ltd, Chichester 2011, p. 12. 22 H. Hedin, I. Hivensalo, M. Vaarnas, The Handbook oh Market Intelligence, John Willey & Sons Ltd, Chichester 2011, p. 14.

52
be emphasized that all enterprises included in the research stressed that in order to obtain necessary information they conducted empirical research. Among methods used by them the dominant ones were observations (90%), individual interviews (more than two thirds of respondents), and questionnaires (more than a half). Focus group interviews were used very rarely.
The vast majority of respondents (nearly two thirds) expressed an opinion that obtained market information satisfies information needs in their company. Collected information about the market enabled – according to 80% of enterprises – to satisfy customers’ needs better, to expand a market as well as to specify or modify the plans of enterprise. Nearly three quarters of respondents claimed that this information helped them to achieve such objectives as growth and development of an enterprise or to gain a competitive advantage. Two thirds of enterprises stated that it was useful in building a company image as well as in reducing the risk of investment decisions.
At the same time nearly half of respondents confirmed that collected knowledge was definitely more helpful in making decisions, and more than a half claimed that conducting market research in order to obtain market information is profitable for a company (i.e. achieved benefits exceed incurred costs). Managers were asked about costs that an enterprise must pay in a year to collect market information (taking into account total costs of conducted research, purchase of information, purchase or usage of analytical software and tools as well as services of specialists and analysts, etc.). One quarter of respondents refused to answer this question, whereas every third of the surveyed mentioned the amount of up to 10 000 zloty and a similar proportion indicated the amount between 10 000 zloty to 100 000 zloty. Only two of examined entities spend more than 250 000 zloty on obtaining market information.
As the basic objective of gathering knowledge about the market is to facilitate making proper decisions supported by adequate information for an enterprise, at the end of the research respondents were asked to evaluate decision-making processes in their companies. The vast majority of respondents (nearly 90%) claimed that making managerial decisions in their organizations is very effective, and more than three quarters – that all managerial decisions are supported by appropriate market information. Nearly half of respondents claimed that too much information is not a problem for a company and decisions are never delayed because of a lack of data. On average, every third company confirmed that information about business environment is always easily available in a company and that the problem of inaccurate or insufficient information does not exist.
Conclusion As it has been already observed, the presented findings are the effect of introductory measurement which served to recognize the topic of the presented discussion as well as to prepare a tool for a subsequent stage of quantitative research that will be conducted on a bigger sample. The introductory research was purely of a descriptive character and due to a relatively small size of the sample it was impossible to conduct the analysis of cause and effect dependencies. That is why it is not possible to state unequivocally to what extent conducting systematic market research and implementation of complex market

53
intelligence programs translate into a more effective decision-making. Therefore, this problem will be the subject of further studies.
References Arline K.: What is Market Intelligence? Business News Daily, http://www.businessnewsdaily.com, data dostępu: l0.02.2015 Callingham M.: Market Intelligence, Kogan Page Ltd, London 2004 Crowley E.: Market intelligence versus marketing research, Quirk’s. Marketing Research Review 12/2004 Domański T., Kowalski P.: Marketing dla menedżerów, Wydawnictwo Naukowe PWN, Warszawa-Łódż 1998 Hedin H., Hivensalo I., Vaarnas M.: The Handbook of Market Intelligence, John Willey & Sons Ltd, Chichester 2011 Kędzior Z. [red.], Badania rynku, Polskie Wydawnictwo Ekonomiczne, Warszawa 2005 Koźmiński A. K.: Zarządzanie w warunkach niepewności, Wydawnictwo Naukowe PWN Warszawa 2004 Martyniak Z.: Metody organizowania procesów pracy, Państwowe Wydawnictwo Ekonomiczne, Warszawa 1996 Mruk H. [red.]: Analiza rynku, Polskie Wydawnictwo Ekonomiczne, Warszawa 2003 Mynarski S.: Przesłanki badań rynkowych i marketingowych, Marketing i Rynek 12/1998 Pham K.: International Market Research versus International Market Intelligence, http://internationalmarketintelligence.com, data dostępu: 10.06.2015 Probst G., Raub S., Romhardt K.: Zarządzanie wiedzą w organizacji, Oficyna Ekonomiczna Kraków 2002 Sosnowski J.: Systemy elektroniczne w marketing, Wydawnictwo Uniwersytetu Łódzkiego Łódź 1999 Weber J., Spitzner J., Staffels M.: Erfolgreich steuern mit Market Intelligence. Marktentscheidungen fundiert treffen, Wiley-VC Verlag, Weinheim 2008
Market Intelligence – ujęcie konceptualne Streszczenie W dzisiejszych czasach wyzwaniem dla menedżerów jest pozyskiwanie szeroko rozumianej informacji biznesowej służącej wsparciu procesów decyzyjnych. Zadaniem decydentów jest rozumieć otoczenie, w którym funkcjonuje organizacja, skutecznie konkurować, a w rezultacie osiągać sukces i rozwój. Market intelligence jako praktyczny program działań umożliwia pozyskanie informacji o rynku i jego uczestnikach, poprzez ciągłe monitorowanie otoczenia i bieżących zmian, które w nim zachodzą, jak również w formie projektów realizowanych ad hoc. Obecnie market intelligence osiąga w wielu organizacjach pozycję porównywalną do pozycji innych funkcji wspierających procesy zarządcze, takich jak zarządzanie ryzykiem czy public relations.
Celem artykułu było wyjaśnienie istoty market intelligence, jako koncepcji pełniącej krytyczną rolę w generowaniu wartościowej wiedzy o rynku, budowaniu konkurencyjności przedsiębiorstwa oraz osiąganiu wzrostu na obsługiwanym rynku. Przedstawione zostały także wyniki wstępnych badań na temat funkcjonowania programów pozyskiwania wiedzy o rynku w rodzimych przedsiębiorstwach. Badanie przeprowadzono wśród dużych i średnich przedsiębiorstw województwa łódzkiego, za pomocą metody wywiadu osobistego, a narzędziem pomiaru był kwestionariusz wywiadu.

54
Słowa kluczowe: market intelligence, badania marketingowe, badania rynku, wiedza o rynku
Informacja o autorach:
Prof. dr hab. Bogdan Gregor Dr Magdalena Kalińska-Kula Uniwersytet Łódzki Wydział Zarządzania ul. Matejki 22/26 90-237 Łódź e-mail: [email protected]
55
15 (64) 2016
Mariusz Grębowiec Szkoła Główna Gospodarstwa Wiejskiego w Warszawie
Rola marki w procesie podejmowania decyzji zakupu produktów mleczarskich na przykładzie rynku jogurtów
THE ROLE OF BRAND IN THE PURCHASE DECISION
MAKING OF DAIRY PRODUCTS FOR EXAMPLE YOGHURT MARKET
Produkty wysokiej jakości cieszą się uznaniem wśród konsumentów.
Nieustająca analiza preferencji i wyborów nabywców pozwala na dostrzeganie zmian w zachowaniach rynkowych, a także wskazuje przedsiębiorstwom kierunki rozwoju. Uwzględnianie tych preferencji w działaniach przedsiębiorstw wpływa na wzrost ich pozycji rynkowej, a także na pozyskiwanie coraz większej liczby lojalnych nabywców. Marka spełnia istotną rolę podczas dokonywania wyboru spośród szerokiego wachlarza ofert rynkowych. Lojalność nabywców wobec marki wpływa więc na zwiększanie się jej renomy. Przekłada się to również na wzrost sprzedaży oraz możliwość dalszego rozwoju firmy. Znane marki mogą konkurować jakością o lojalność klientów. Wykorzystując strategie kreowania wizerunku marki, zyskuje ona przewagę konkurencyjną.
Celem opracowania było określenie znaczenia marki podczas zakupu produktów mleczarskich. Jako główne spektrum zainteresowania wybrany został rynek mleka oraz jego przetworów, ze szczególnym uwzględnieniem rynku jogurtów. W opracowaniu zebrano rozważania teoretyczne z zakresu marki i czynników warunkujących jej siłę, ponadto przedstawiono współczesną sytuację na rynku mleka oraz jego przetworów. Rozważania teoretyczne poparto badaniami przeprowadzonymi wśród 250 przypadkowo dobranych respondentów. Osiągnięte wyniki badań pozwoliły na wyciągniecie wniosków zawartych na końcu opracowania. Z przeprowadzonych badań wynika, że marka ma istotne znaczenie w procesie zakupu jogurtów. Wysoka jakość produktów markowych wpływa na zaufanie konsumentów do marki, a wzrost lojalności nabywców przekłada się na wzrost sprzedaży i umocnienie pozycji rynkowej przedsiębiorstwa. Producenci jogurtów, posiadający markę cieszącą się uznaniem, powinni w swoich działaniach kierować się dobrem konsumenta, gdyż od jego wyborów zależy dalszy rozwój wizerunku marki i przedsiębiorstwa także w wymiarze ekonomicznym.
Słowa kluczowe: marka, branża mleczarska, jogurt.

56
Wstęp Problematyka marki ma coraz większe znaczenie we współczesnym marketingu. Ma ona charakter interdyscyplinarny, gdyż marka jest przedmiotem zainteresowania specjalistów wielu dziedzin nauki, m.in. ekonomistów, psychologów, a nawet plastyków.
Współczesne przedsiębiorstwa przywiązują dużą wagę do roli odgrywanej przez markę. Wiążę się to bezpośrednio z powstawaniem coraz nowszych produktów, zastępowaniem jednych produktów ich substytutami, co przekłada się na wysoką konkurencję. Przedsiębiorstwa więc muszą dążyć do wypromowania swojej marki, dzięki której mogą osiągnąć stabilną pozycję rynkową. Ważne jest także, znalezienie i zdefiniowanie atrybutów silnej marki. Pozwala to na trafne kształtowanie strategii marki, co ma wpływ na budowanie świadomości marki wśród konsumentów w procesie zakupu. Znajomość marki wpływa także na powiązywanie jej z jakością, jak również na wzrost lojalności, który będzie miał odzwierciedlenie w wysokości sprzedaży i nastawieniu konsumentów do danego przedsiębiorstwa.
Marka i czynniki decydujące o sile jej rynkowego oddziaływania Jedną z najpopularniejszych i najczęściej cytowanych definicji marki jest definicja Ph. Kotlera, według której marka określana jest jako: „nazwa, znak, symbol, wzór lub kombinacja tych elementów; nadana przez sprzedawcę (…) w celu identyfikacji dobra lub usługi oraz ich wyróżnienia na tle produktów konkurencyjnych”1. Według słownika języka polskiego PWN marka to „znak firmowy umieszczany na wyrobach; jakość lub gatunek wyrobów danej firmy; dobra opinia”2. Warto dostrzec, że termin marka może być odmiennie rozumiany przez różnych nabywców. Marka jest trwałym elementem, który identyfikuje producenta z wytwarzanym przez niego produktem. Jest nieodłączną częścią funkcjonowania przedsiębiorstwa. Stanowi podstawę do odróżnienia produktów konkretnego wytwórcy od towarów konkurencyjnych. Dzięki marce przedsiębiorstwa mogą budować przewagę konkurencyjną.
Wizerunek maki budowany jest długofalowo przez przedsiębiorstwo, co wpływa na niemożność natychmiastowego jego naśladownictwa przez rywali rynkowych3. Siła marki jest związana z jej pozycją rynkową. Rozumiana jest jako popyt na daną markę w stosunku do popytu na towary konkurencyjne4. To jak postrzegana będzie marka na tle rywali rynkowych zależy od jej indywidualnych cech.
Atrybut marki to „cechy lub oznaczenie marki pozwalające na jej odróżnienie od innych”5. O konkurencyjności produktu decydują złożone elementy, które tworzą spójną całość. Nieefektywność jednego z nich może przyczynić się do niepowodzenia marki za sprawą braku akceptacji wśród konsumentów. Zasadniczymi atrybutami silnej marki są6:
• Wizerunek marki, 1 Kotler Ph., Armstrong G., Saunders J., Wong V., Marketing. Podręcznik akademicki, Polskie Wydawnictwo Ekonomiczne, Warszawa 2002, s. 626. 2 Słownik Języka Polskiego, PWN, http://sjp.pwn.pl/sjp/marka-I;2481355.html (dostęp z dn. 27.12.2014r.). 3 A. Rudzewicz, Rola i znaczenie zaufania w kreowaniu marki, „Marketing i Rynek”, 2014, nr 8, s. 645. 4 M. K. Witek-Hajduk, Zarządzanie…, dz. cyt., s. 39. 5 Grzegorczyk A., Reklama, Polskie Wydawnictwo Ekonomiczne, Warszawa 2010, s. 68. 6 M. K. Witek-Hajduk, Zarządzanie…, dz. cyt., s. 39.

57
• Jakość dostrzegana przez nabywców, • Lojalność wobec marki, • Świadomość (znajomość) marki,
Wizerunek marki jest subiektywnym obrazem marki, który pojawia się w świadomości nabywców. Uzależniony jest on od indywidualnych cech konsumentów7. Silna marka wyróżnia się bezkonkurencyjnym wizerunkiem, który wpływa na powszechną jej akceptację. Konsument w procesie zakupowym wybierze tą markę, której cechy górują nad produktami konkurencji. Będzie miał też na uwadze korzyści jakie spłyną na niego dzięki nabyciu danego produktu. Na podstawie skojarzeń konsumenci podejmują decyzje zakupowe. Ogólna ocena jest wynikiem różnorodnych elementów i wpływa na stopień pozytywnej oceny wizerunku marki8. Jakość marki jest oceniana indywidualnie przez nabywców. Produkty markowe mogą realnie charakteryzować się inną jakością, niż według opinii nabywców.
Zauważana przez nabywców jakość może podnosić wartość marki. Zwiększa częstotliwość zakupu danego produktu przez pomoc w dokonywaniu wyboru pomiędzy alternatywami. Wpływa także na odpowiednie klasowanie produktów i uszeregowanie ich np. w grupie produktów luksusowych. W ramach myślenia stereotypowego jakość marki wiąże się z wyższą ceną, dlatego może wpłynąć to na podwyższenie jego ceny, co zwiększa przychody przedsiębiorstw. Produkty o postrzeganej wysokiej jakości przyciągają uwagę hurtowników, gdyż taki produkt zwiększa atrakcyjność ich ofert9.
Znajomość marki to zdolność do jej rozpoznania lub przypomnienia i świadomość kategorii produktów jaką ona reprezentuje.
Wyodrębnia się cztery stopnie znajomości marki wśród nabywców10: • Nieznajomość marki- konsument nie jest w stanie, ani rozpoznać, ani
przypomnieć sobie marki podczas dokonywania zakupu, • Wspomagana znajomość marki- konsument rozpoznaje markę dopiero po
pokazaniu mu kilku innych marek. Wtedy potrafi już przyporządkować ją do odpowiedniej grupy,
• Spontaniczna znajomość marki- konsument nie uzyskując jakiejkolwiek pomocy wskazuje grupę marek w określonej mu kategorii,
• Marka wskazana jako pierwsza- konsument wśród danej kategorii wymienia markę jako pierwszą. Może też wymienić ją jako jedyną z danej grupy produktów.
Znajomość marki jest podstawą do pojawienia się w konsumencie szeregu skojarzeń z nią powiązanych. Przyczynia się także do włączenia jej do koszyka wariantów spośród których konsument wybierze oczekiwany produkt.
7 Tamże, s. 40. 8 M. Dębski, Kreowanie silnej marki, Polskie Wydawnictwo Ekonomiczne, Warszawa 2009, s. 15. 9 Urbanek G., Zarządzanie marką, Polskie Wydawnictwo Ekonomiczne, Warszawa 2002, s. 46-46. 10 Witek – Hajduk M. K., Zarządzanie silną marką, Wyd. Oficyna a Wolters Kulwer business, Warszawa 2011, s. 50.

58
Rynek mleka i jego przetworów w Polsce Produkcja mleka w Polsce jest gałęzią produkcji rolniczej, którą uważa się za jedną z najważniejszych11. W przeciwieństwie do produkcji roślinnej jest ona źródłem stałego dochodu rolniczego12. Rynek mleka cechuje niejednolitość oraz różnorodność segmentów i ich specyfika13. Uwarunkowane jest to przez różnorodne potrzeby konsumentów co do jakości, poziomu cen oraz różnorodności asortymentu. Niejednolity rynek warunkuje też specyfika branży. Bogata struktura asortymentowa wpływa na różnorodność procesów produkcyjnych, co przyczynia się do powstawania odrębnych segmentów w obrębie branży.
Polska jest jednym z czołowych producentów mleka w Unii Europejskiej. W kraju wytwarza się około 8% całkowitej produkcji całej wspólnoty. W strukturze krajowej, globalnej produkcji rolniczej, udział produkcji mleka waha się w granicach 12-15%14. Liczba mleczarni w Polsce nadal spada. W 2014 roku liczba zakładów wynosiła 176, czyli o 18 zakładów mniej w porównaniu do 2011 roku. Zmniejsza się także liczba osób zatrudnionych w tych zakładach. Spadek liczby zakładów nie oznacza jednak spadku wartości sprzedaży. Ciągły wzrost sprzedaży przy jednoczesnym zmniejszeniu liczby zakładów oznacza natomiast, że rośnie wydajność produkcyjna jednostek oraz poprawie ulega technologiczny poziom przetwórstwa. W 2014 roku uznano za rentowne 63% firm mleczarskich, co wykazuje jednak tendencję spadkową w stosunku do roku 2012, kiedy to udział firm rentownych wynosił ponad 70%. Wśród zakładów przetwórczych zaobserwowany został także narastający proces koncentracji15. Wraz z wstąpieniem Polski do Unii Europejskiej nastąpił proces modernizacji polskich przetwórni mleczarskich. Przetwórnie krajowe cechują się współcześnie wysokim poziomem technologicznym. Przestrzegane są w nich bardzo wysokie standardy higieny w procesach produkcyjnych. Istotną kwestią jest bowiem zachowanie wysokiej jakości produktów16. Przemysł mleczarski nieustannie ulega przemianom dostosowując się do ciągle zmieniającej się sytuacji na rynku, która jest wynikową zmieniających się preferencji konsumenckich.
11 J. Kossakowska, J. Sych- Winiarek, E. Bochlińska, Spożycie przetworów mleczarskich w Polsce na tle zmian w podaży mleka, „Biuletyn Informacyjny”, ARR, Warszawa 2013, nr 4, s. 4. 12 M. Świątkowska, Mleko - podstawa diety i gospodarki żywnościowej, „Biuletyn Informacyjny”, ARR, Warszawa 2014, nr 3, s. 2. 13 Tamże, s. 5. 14 Tamże, s. 4. 15 Rynek mleka, stan i perspektywy. Analizy rynkowe, IERiGŻ, ARR i MRiRW, wrzesień 2015, s. 15 16 Tamże, s. 16.

59
Rysunek 1. Produkcja mleka i jego przetworów w Polsce w latach 2012-2015 (w tys. ton).
Opracowanie własne na podstawie: Rynek mleka, stan i perspektywy. Analizy rynkowe, IERiGŻ, ARR i MRiRW, wrzesień 2015, str. 15.
Na rynku mleczarskim dynamicznie zmienia się oferta asortymentowa.
Zwiększa się także dostępność produktów. Poprawie ulega jakość oferowanych wyrobów oraz ich atrakcyjność. Szeroko pojęte działania marketingowe wpływają na pozytywny wizerunek artykułów mleczarskich. Przekłada się to na zmianę obrazu produktów w oczach konsumenta, co pozytywnie wpływa na jego decyzje w procesie zakupu.
Spożycie mleka i artykułów mleczarskich Badanie budżetów gospodarstw domowych pokazuje, że najwyższym poziomem konsumpcji cechuje się mleko spożywcze. Produkt ten zajmuje czołowe miejsce pomimo dynamicznego spadku jego konsumpcji. Na kolejnym miejscu znalazły się sery twarogowe, a kolejno za nimi jogurty. Taka tendencja może się nieznacznie różnić w analizach szczegółowych, które uwzględniają zależności społeczne oraz ekonomiczne17.
Według danych Głównego Urzędu Statystycznego poziom spożycia bilansowego mleka kształtował się na poziomie 205 l/mieszkańca w 2014 roku. Konsumpcja mleka jest mniejsza o około 30% w stosunku do jego spożycia w pozostałych krajach członkowskich UE18.
Spożycie mleka na przełomie 2010 – 2014 roku spadło o 0,21 l na osobę. Co wiązać się mogło ze zmniejszeniem przeciętnych wydatków miesięcznych na mleko w gospodarstwach domowych. Pierwszy kwartał 2014 roku przyniósł jednak nieznaczny wzrost tych wydatków, co może przełożyć się jednocześnie na zwiększenie spożycia mleka oraz przetworów mleczarskich. Spadek spożycia mleka zauważa się we wszystkich rodzajach gospodarstw domowych (pracownicy, rolnicy, pracujący na własny rachunek, emeryci i renciści). Najwyższy poziom spożycia odnotowano w grupie
17 Tamże, s. 16. 18 M. Świątkowska, Mleko…, dz. cyt., s. 5.
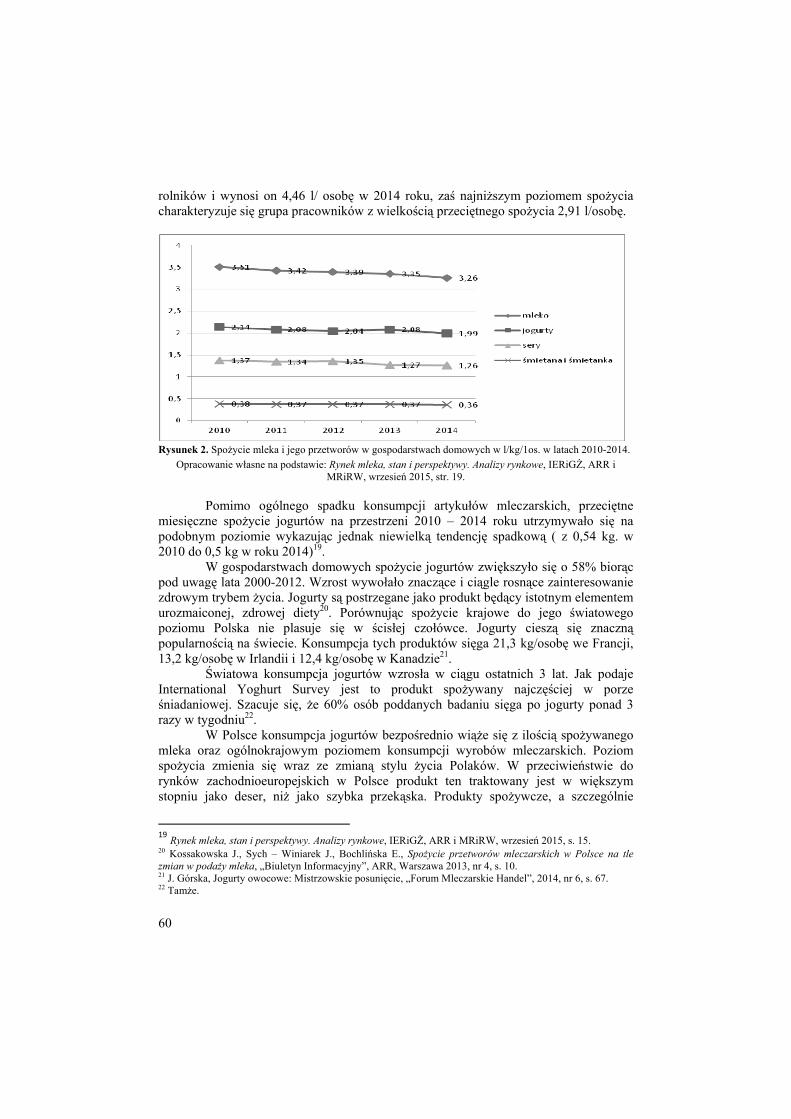
60
rolników i wynosi on 4,46 l/ osobę w 2014 roku, zaś najniższym poziomem spożycia charakteryzuje się grupa pracowników z wielkością przeciętnego spożycia 2,91 l/osobę.
Rysunek 2. Spożycie mleka i jego przetworów w gospodarstwach domowych w l/kg/1os. w latach 2010-2014.
Opracowanie własne na podstawie: Rynek mleka, stan i perspektywy. Analizy rynkowe, IERiGŻ, ARR i MRiRW, wrzesień 2015, str. 19.
Pomimo ogólnego spadku konsumpcji artykułów mleczarskich, przeciętne miesięczne spożycie jogurtów na przestrzeni 2010 – 2014 roku utrzymywało się na podobnym poziomie wykazując jednak niewielką tendencję spadkową ( z 0,54 kg. w 2010 do 0,5 kg w roku 2014)19.
W gospodarstwach domowych spożycie jogurtów zwiększyło się o 58% biorąc pod uwagę lata 2000-2012. Wzrost wywołało znaczące i ciągle rosnące zainteresowanie zdrowym trybem życia. Jogurty są postrzegane jako produkt będący istotnym elementem urozmaiconej, zdrowej diety20. Porównując spożycie krajowe do jego światowego poziomu Polska nie plasuje się w ścisłej czołówce. Jogurty cieszą się znaczną popularnością na świecie. Konsumpcja tych produktów sięga 21,3 kg/osobę we Francji, 13,2 kg/osobę w Irlandii i 12,4 kg/osobę w Kanadzie21.
Światowa konsumpcja jogurtów wzrosła w ciągu ostatnich 3 lat. Jak podaje International Yoghurt Survey jest to produkt spożywany najczęściej w porze śniadaniowej. Szacuje się, że 60% osób poddanych badaniu sięga po jogurty ponad 3 razy w tygodniu22.
W Polsce konsumpcja jogurtów bezpośrednio wiąże się z ilością spożywanego mleka oraz ogólnokrajowym poziomem konsumpcji wyrobów mleczarskich. Poziom spożycia zmienia się wraz ze zmianą stylu życia Polaków. W przeciwieństwie do rynków zachodnioeuropejskich w Polsce produkt ten traktowany jest w większym stopniu jako deser, niż jako szybka przekąska. Produkty spożywcze, a szczególnie
19 Rynek mleka, stan i perspektywy. Analizy rynkowe, IERiGŻ, ARR i MRiRW, wrzesień 2015, s. 15. 20 Kossakowska J., Sych – Winiarek J., Bochlińska E., Spożycie przetworów mleczarskich w Polsce na tle zmian w podaży mleka, „Biuletyn Informacyjny”, ARR, Warszawa 2013, nr 4, s. 10. 21 J. Górska, Jogurty owocowe: Mistrzowskie posunięcie, „Forum Mleczarskie Handel”, 2014, nr 6, s. 67. 22 Tamże.
61
pochodzenia mleczarskiego, powinny mieć cechy, które pozytywnie wpływają na proces ich postrzegania. Według badań wpływu różnorodnych czynników na podejmowanie decyzji przez konsumentów w sklepach wynika, że w znacznym stopniu konsumenci zwracają uwagę na smak, świeżość oraz skład, a zwłaszcza zawartość tłuszczu oraz różnego rodzaju dodatki zawarte w produktach mleczarskich. Kwestia smaku ma największe znaczenie w procesie zakupu jogurtów oraz serów twarogowych23.
Podsumowując, obecnie na poziom spożycia artykułów mleczarskich a szczególnie jogurtów ma wpływ zróżnicowana oferta produktów, ich dynamiczna zmiana oraz szeroka i powszechna dostępność asortymentu. Istotna jest także wiedza konsumentów na temat danego produktu oraz uwarunkowania emocjonalne związane z procesem konsumpcji. Wysokie oddziaływanie ma też miejsce dokonywania zakupu.
Znaczenie marki w procesie zakupu jogurtów w świetle badań Cel i metodyka badań Przeprowadzone badania miały na celu określenie wpływu marki i czynników z nią związanych, na podejmowanie decyzji nabywczych na przykładzie branży mleczarskiej, a ściślej ujmując na rynku jogurtów. Zostały one przeprowadzone metodą ankiety internetowej w grupie 250 przypadkowo dobranych osób w czerwcu 2015 roku. Wśród ankietowanych 51% stanowiły kobiety, a 49% mężczyźni. Tak równomierny podział ze względu na płeć pozwolił na dostrzeżenie zmiennych zachowań w grupie kobiet oraz mężczyzn. Grupa wiekowa 20 – 30 była najliczniejszą grupą wśród respondentów (35%), zarówno wśród kobiet jak i wśród mężczyzn. Zaś najmniej liczną była grupa wiekowa 40 i więcej (19%). Wykształceniem średnim charakteryzowała się grupa 52% respondentów. Wykształcenie wyższe posiadało 19% ankietowanych, przy czym większość stanowili mężczyźni. Najmniejszym odsetkiem badanych odznaczała się grupa ankietowanych z wykształcenie zawodowym, stanowiła ona zaledwie 5% ogółu badanych. Ze względu na miejsce zamieszkania, 56% ankietowanych zamieszkiwało tereny wiejskie, zaś 44% z nich była mieszkańcami miast. W większości respondenci określili swoją sytuację materialną jako dobrą lub przeciętną.
Czynniki brane pod uwagę w procesie nabywczym jogurtów Jogurt jest artykułem spożywczym codziennego użytku. Znajduje się on w koszyku zakupowym przeciętnego konsumenta przynajmniej kilka razy w miesiącu. Wszyscy badani respondenci zadeklarowali, że są konsumentami jogurtów. Największa ich grupa (42%) zadeklarowała, że kupuje ten produkt kilka razy w tygodniu. Jedynie 7% ankietowanych oświadczyło, iż dokonuje zakupu jogurtów rzadziej niż raz w miesiącu. Wysoka częstotliwość zakupów świadczy o popularności tych produktów oraz o częstym ich spożywaniu wśród konsumentów.
23 M. Świątkowska, Mleko…, dz. cyt., s. 8-9.

62
Rysunek 3. Częstotliwość zakupu jogurtów
Źródło: opracowanie własne na podstawie wyników badań
Dokonywanie zakupów w sklepach samoobsługowych pozwala konsumentom na spędzenie większej ilości czasu przed półką sklepową analizując oferowany przez producentów wachlarz artykułów mleczarskich. Najczęściej wybieranym miejscem zakupu jogurtów były właśnie sklepy samoobsługowe. Dokonuje w nich zakupów aż 77% badanych. Mężczyźni częściej dokonują zakupów w sklepach z tradycyjną obsługą, niż kobiety. Sklepy internetowe, jako miejsce zakupu nie były wymieniane przez badanych.
Badani, podczas dokonywania zakupu zwracają uwagę na szereg cech funkcjonalnych, dzięki którym mogą dokonać stosownego wyboru. Kluczową cechą jogurtu, która skłania konsumenta do zakupu jest jego smak (57%) oraz jego jakość (56%). Kolejno ankietowani wybierali także cenę (36%), skład (29%) oraz wartości odżywcze (28%). W mniejszym stopniu zwracali uwagę na wygląd opakowania (2%), a element działań promocyjnych miał mało istotne znaczenie w procesie wyboru wśród badanych. Cechy te zdaniem Górskiej-Warszewicz (2011) kształtują i wpływają na całościowy wizerunek marki, będący kompilacją obrazu produktu żywnościowego odzwierciedlającego cechy organoleptyczne produktu związane z percepcją fizycznych atrybutów oraz obrazu marki odzwierciedlanego poprzez atrybuty symboliczne24.
24 H. Górska –Warsewicz., Zarządzanie markami w przedsiębiorstwach sektora żywnościowego w perspektywie długookresowej. Roczniki Naukowe SERiA, T. XVI, z. 4, s. 100.

63
Rysunek 4. Cechy brane pod uwagę w procesie zakupu jogurtów.
Źródło: opracowanie własne na podstawie wyników badań.
Nabywcy preferują głównie jogurty owocowe i smakowe (36%) oraz naturalne (23%). Najrzadziej w ich koszyku zakupowym znajdują się jogurty typu greckiego (8%). Mężczyźni wybierają więcej jogurtów pitnych niż kobiety, a w procesie zakupu i spożyciu jogurtów naturalnych głownie dominują kobiety. Uzyskane wyniki pozostają w zgodzie z innymi wynikami Autora 25.
Rola marki w procesie zakupu jogurtów Nabywcy mają konkretne oczekiwania w stosunku do markowych jogurtów. Oczekują oni, że ich wyższa cena przełoży się także na wysoką jakość. W dużej mierze liczą także na to, iż producent zachowując wysoką jakość zadba także o brak konserwantów w ich składzie. Oczekują oni, że będą to produkty posiadające wysoką powtarzalną jakość (84% ), bez zawartości konserwantów (60%). Nabywcy oczekują także, że wyższa cena, którą płacą za markowy jogurt będzie odzwierciedleniem jego wysokiej jakości (60%). Najmniejszą rolę wśród badanych odgrywa fakt, iż marka może być modna lub też nabywanie produktów markowych może wiązać się z prestiżem, czy też statusem materialnym nabywcy (4%).
25M. Grębowiec., Znaczenie marki produktów mleczarskich w społeczeństwie informacyjnym. Marketing i rynek. Nr 11/2014 s. 165.

64
Rysunek 5. Oczekiwane cechy dobrej marki jogurtów.
Źródło: opracowanie własne na podstawie wyników badań
Nabywcy zauważają także istotne różnice między jogurtami znanych przedsiębiorstw mleczarskich, a niemarkowymi substytutami. Z łatwością dostrzegają oni różnice cenowe, gdyż nie jest konieczne zagłębianie się w szczegóły dotyczące wyrobu. Biorąc pod uwagę cechy produktu, istotną różnicą jest ich konsystencja, wyrazistość smaku oraz ilość zawartych dodatków. Istotne dysproporcje występują także w jakości opakowania. Zdaniem respondentów, jogurty markowe umieszczane są w opakowaniach wykonanych z twardszego, solidniejszego tworzywa.
Zdaniem badanych, cena jest często najbardziej zauważalną różnicą (80%). Kolejną wymienioną przez respondentów różnicą jest wyrazistość smaku (57%), która może być uzależniona od ilości zawartych owoców lub soków owocowych w jogurtach. Istotną różnicą jest także konsystencja jogurtów markowych (41%) w stosunku do konkurencyjnych produktów. Nabywcy rzadziej zauważają różnicę w pojemności opakowania (10%) czy w terminie ważności (14%). Jedynie 6% ankietowanych nie zauważyło żadnych cech różnicujących te produkty (wykres 6).
Rysunek 6. Różnice między jogurtem markowym, a nie markowym.
Źródło: opracowanie własne na podstawie wyników badań.

65
Na zmianę ulubionej marki na markę konkurencyjną w opinii konsumentów może wpływać szereg bodźców. Do najważniejszych zaliczyć można zdaniem respondentów: spadek jakości produktu (72%), potrzebę odkrywania przez nich nowości (66%) oraz wzrost ceny (63%). Najmniejszy wpływ na dokonywanie zmian mają impulsywnie dokonywane zakupy w których konsumenci nie zwracają uwagi na rodzaj wybieranego produktu. 14% ankietowanych stwierdziło, że pozostają lojalni wobec wybranej przez siebie marki i nie dokonują jej zmian. Przywiązanie do marki może przerodzić się w lojalność konsumentów. Na przywiązanie do danej marki jogurtów najczęściej wpływa satysfakcja i zadowolenie z produktu. Konsumenci odczuwający satysfakcję z konsumpcji wyrobu mleczarskiego konkretnej marki nie widzą powodów do zmiany producenta. W dużej mierze na przywiązanie do marki wpływa także przyzwyczajenie nabywców i dokonywanie zakupów w sposób rutynowy, bez występowania bodźców do zmiany wybieranego asortymentu. Niekiedy zdarza się jednak, że nabywcy jogurtów decydują się na zmianę ulubionej marki.
Głównym bodźcem takiej decyzji jest spadek jakości produktu, przyczyniający się do zrodzenia się w konsumencie braku zaufania do marki. Satysfakcja i zadowolenie z produktu w największym stopniu wpływają bowiem zdaniem badanych na przywiązanie do marki (86%). Konsumenci wskazują także na przyzwyczajenie się do wyboru danego rodzaju produktu (55%), jak również emocjonalne przywiązanie do marki (53%). Ponieważ dokonują oni zakupu tych produktów od szeregu lat, co świadczy o pełnym zadowoleniu z dokonywanego wyboru oraz o stabilności cech marki w czasie.
Spośród czołowych producentów w branży mleczarskiej najczęściej wybieraną marką jogurtów była marka Danone. Wybierało ją, aż 32% konsumentów. Wśród popularnych marek znalazły się także Bakoma 21% wskazań i Zott 20%. Konsumenci wymienili także takie marki jak: Mlekovita (11%) czy Piątnica (5%).
Podsumowanie Marka ma istotne znaczenie podczas dokonywania zakupów wyrobów mleczarskich. Zgodnie z wynikami przeprowadzonych badań nasuwają się wnioski potwierdzające powyższe stwierdzenie.
Konsumenci w procesie zakupowym zwracają uwagę na jakość produktów oznaczonych marką i wybierają te, dzięki którym odczuwają satysfakcję z zakupu. Zazwyczaj takie artykuły oznaczone są ogólnie uznanymi markami. Funkcja gwarancyjna, czyli zagwarantowanie przez producenta wysokiej jakości wyrobu spełniającego wszelkie normy, wpływa na pozytywny odbiór takich towarów przez konsumentów, co przekłada się także na ich lojalność wobec danej marki. Głównym aspektem branym pod uwagę w czasie dokonywania wyboru jogurtu jest także jego smak. Konsumenci w dużej mierze zwracają również uwagę na jego jakość, dlatego też decydują się zapłacić wyższą cenę za oferowaną gwarancję wysokiej jakości markowych wyrobów. Nabywcy jogurtów potrzebują także odkrywania nowości rynkowych, co daje szansę markom wchodzącym na rynek. Kluczową przyczyną zmian decyzji nabywczej,
66
jest także wzrost ceny wyrobu, co zmusza konsumentów do poszukiwania tańszych substytutów. Pomimo znaczącej częstotliwości emisji reklam promujących marki jogurtów, konsumenci nie odczuwają ich związku z dokonywaniem przez nich wyboru produktów. Reklama nie jest więc głównym bodźcem wpływającym na konsumentów i skłaniających ich do wyboru danej marki podczas dokonywania zakupów. Niemniej jednak dostarcza ona informacji o istnieniu danej marki, a jej funkcja przypominająca umacnia lojalnych konsumentów w przekonaniu co do świetności marki. Na podstawie powyższych rozważań można wysnuć wniosek, że marka ma istotne znaczenie w procesie zakupu jogurtów. Wysoka jakość produktów markowych wpływa na zaufanie konsumentów do marki, a wzrost lojalności nabywców przekłada się na wzrost sprzedaży i umocnienie pozycji rynkowej przedsiębiorstwa. Producenci jogurtów, posiadający markę cieszącą się uznaniem, powinni w swoich działaniach kierować się dobrem konsumenta, gdyż od jego wyborów zależy dalszy wizerunek marek jogurtów.
Literatura Dębski M.: Kreowanie silnej marki, Polskie Wydawnictwo Ekonomiczne, Warszawa 2009. Górska J.: Jogurty owocowe: Mistrzowskie posunięcie, „Forum Mleczarskie Handel”, 2014, nr 6. Górska –Warsewicz H.: Zarządzanie markami w przedsiębiorstwach sektora żywnościowego w
perspektywie długookresowe,. Roczniki Naukowe SERiA, 2014 T. XVI, z. 4. Grębowiec M.: Znaczenie marki produktów mleczarskich w społeczeństwie informacyjnym,
Marketing i rynek. Nr 11/2014. Grzegorczyk A.: Reklama, Polskie Wydawnictwo Ekonomiczne, Warszawa 2010. Kossakowska J., Sych – Winiarek J., Bochlińska E.: Spożycie przetworów mleczarskich w Polsce
na tle zmian w podaży mleka, „Biuletyn Informacyjny”, ARR, Warszawa 2013, nr 4. Kotler Ph., Armstrong G., Saunders J., Wong V.: Marketing. Podręcznik akademicki, Polskie
Wydawnictwo Ekonomiczne, Warszawa 2002. Raport Konsument na Rynku Artykułów Żywnościowych, Departament Inspekcji Handlowej
UOKIK, Warszawa, Warszawa 2009. Rudzewicz A.: Rola i znaczenie zaufania w kreowaniu marki, „Marketing i Rynek”, 2014, nr 8. Słownik języka polskiego, t. 1, PWN, Warszawa 2007. Świątkowska M.: Mleko - podstawa diety i gospodarki żywnościowej, „Biuletyn Informacyjny”,
ARR, Warszawa 2014, nr 3. Urbanek G.: Zarządzanie marką, Polskie Wydawnictwo Ekonomiczne, Warszawa 2002. Witek – Hajduk M. K.: Zarządzanie silną marką, Wyd. Oficyna a Wolters Kulwer business,
Warszawa 2011.
Summary High-quality products are appreciated by consumers. The ongoing analysis of the preferences and choices of buyers allows the perception of changes in the behavior of the market, and indicates directions of development companies. Taking into account the needs and preferences of consumers in the activities of enterprises affects the growth of their market position, as well as gaining more and more loyal customers. Brand plays a crucial role in making a selection from a wide range of market offers. The loyalty of customers towards the brand affects the increase in its reputation. This translates into an increase in sales and the possibility of further development of the company.

67
Famous brands can compete on quality of customer loyalty. Using strategies to create brand image, it gains a competitive advantage.
The aim of the study was to investigate the significance of the brand among consumers when buying dairy products. As the main spectrum of interest is selected market milk and dairy products, with particular emphasis yoghurt market.
Key words: brand, dairy industry, yoghurt Informacje o autorze: Dr inż. Mariusz Grębowiec Szkoła Główna Gospodarstwa Wiejskiego W Warszawie Wydział Nauk Ekonomicznych ul. Nowoursynowska 166, 02-787 Warszawa e-mail: [email protected]

68
15 (64) 2016
Wojciech Grzegorczyk Uniwersytet Łódzki
THE PROBLEMS OF MARKETING PERFORMANCE MEASUREMENT
The presented article deals with the problems of marketing performance measurement. In order to measure marketing performance we should determine the costs of marketing activities as well as the volume of revenues generated in the process of their implementation. There are different indicators that can be used to determine the effectiveness of marketing decisions (activities), the one of particular importance being Return on Marketing Investment. ROMI is defined as a financial surplus generated by a marketing investment in relation to the costs incurred in the process of this investment (undertaking). Marketing performance measurement is strictly related to the concept of marketing control. In order to avoid potential overlapping of marketing control and marketing research it is of key importance to precisely define the notion of ‘marketing control’ and the scope of its content. Key words: marketing performance, marketing effectiveness, marketing control, marketing costs, marketing research
Introduction The aim of this article is to present the author’s proposals concerning the evaluation of marketing costs and different options of the use of marketing control for the purposes of marketing performance measurement. The article is intended to eliminate ambiguities both in the terminology of marketing research and marketing control and the scope of content of these two notions. In order to achieve that the author conducted research based on literature in the field of marketing and marketing control.
The costs of the marketing activities
The first budget elements to be determined are marketing expenditures that constitute marketing costs. An extremely important element of the marketing budget, apart from the costs of marketing activities, are the revenues generated from the sales resulting from a specific marketing activity. Therefore it is necessary to estimate the market potential and to conduct a forecast of revenues generated from the sales of particular products. However, as far as marketing costs are concerned, there are problems to define their level clearly arising from the fact that it is difficult to determine the scope of marketing activities and, as a result, the scope of marketing costs. According to some practitioners and scholars in the field of management, marketing solely involves promotional activities supporting the sales of products, so marketing costs include mainly the costs of advertising and other promotional activities [Niestrój, 2002; Karasiewicz, 2014]. In this

69
approach other marketing activities are largely ignored. The opposite approach towards marketing costs, in contrast, takes into account, apart from expenditures on promotion, all other costs incurred in the process of preparation and implementation of any marketing activities undertaken in a given period of time resulting from the marketing strategy being implemented. They are related to market research, product and price policies, delivering a product to the market and promotional activities. Some of these costs refer to classical marketing activities whereas others are incurred while other company’s functions are being performed. The criterion to make a distinction between them can be the place of occurrence, however they can be distinguished in a relatively simple way on the basis of the company’s organizational structure as well as the production and commercial processes implemented (e.g. the costs of materials, raw materials, energy, costs of production and sales). The problem of the diverse character of marketing costs has been pointed out by R. Niestrój, who presented a relevant proposal of dividing them into two categories. The first category includes the costs related to the marketing system functioning, whereas the other category comprises the costs related to the marketing system development. The costs of the marketing system functioning consist of fixed and variable costs. Fixed marketing costs include the costs of the marketing department functioning on a day-to-day basis (e.g. the employees’ salaries, costs to provide equipment and buy professional literature and trade press for the marketing department, the costs of research surveys, etc.), whereas variable costs involve the costs of the implementation of particular undertakings resulting from the adopted marketing strategy. As it also follows from the above list, some of the marketing costs are incurred in the production process (e.g. the costs of the concept preparation and trial production). The costs of market testing can also be classed in the category of costs related to production. The remaining costs result from promotional and distributional (sales-related) activities.
Another extremely important element of the marketing budget, in addition to the costs of marketing activities, is the sales revenues generated from particular undertakings. Therefore, it is necessary to determine the market potential and prepare revenue forecasts from the sales of particular products. Depending on the required accuracy of the sales forecast we can use the terms of sales projections, predictions and forecasts. A sales projection involves transferring of the past and present conditions into the future (extrapolation). A sales prediction refers to determining the future sales volume on the basis of the discovered relations between sales and factors affecting sales performance. A sales forecast is drawn up on the basis of projections and predictions as well as anticipating the factors that are not measurable and it can be prepared with the use of qualitative and quantitative methods [Dębski, 1998; Dittman, 2008].
The other category of marketing costs refers to the development of marketing activities and the marketing system in an enterprise as a result of long-term decisions. It may include, for example, a change or development of the company’s IT system, development or expansion of the company’s distribution networks on the domestic market and abroad (building storage and warehousing facilities, wholesale outlets, retail stores). The costs incurred in the process of marketing development as well as expenditures on current marketing activities should be treated as a marketing investment that results in the increase of an enterprise’s business value and the value of its assets.

70
They could be both tangible and intangible assets, such as modern IT systems, company distribution networks, market shares, brand awareness and the company’s brand image.
Marketing performance
The fact that marketing outlays are treated as marketing investments means that they have to be measured and that their effectiveness and efficiency have to be determined. The predominant conviction that had been present in marketing literature for many years was that marketing performance measurement was not possible due to the specific character of marketing activities and mutual interrelations between the applied marketing instruments. In consequence, such an approach did not allow determining the interdependence between the company’s marketing strategy and its finance. It was only at the beginning of the 1990s when the debate concerning the efficiency of marketing strategies and the interdependence between marketing and finance started. The process of marketing management involves the analysis of an enterprise and its environment, determination of marketing objectives, marketing strategy and the applied marketing instruments as well as implementation of the marketing strategy. The last stage of this process refers to marketing control and it is at this stage that the extent to which the assumed marketing objectives and efficiency have been achieved is being examined. The comparison of the achieved objectives in relation to particular undertakings with the ones planned will enable to determine the extent to which the assumed plans have been realised, which means it will determine their effectiveness. On the other hand, the comparison of the outlays on marketing undertakings with the effects that they have brought about will enable to determine their efficiency. Marketing efficiency can be measured in relation to different aspects. It can refer to: the company’s market position – e.g. its sales volume, market share, buyers – e.g. customer satisfaction, product image, marketing assets – e.g. brand value, customer value, distribution network.[Karasiewicz, Skorek, Wilczak, 2006]
The literature concerning marketing performance still raises the problem of difficulties involved in examining individual impact of each of the applied marketing instruments on the realization of the assumed objectives, which is fully justifiable, as they are applied jointly. Moreover, the effects of the undertaken activities are very frequently postponed in time.
There are various kinds of indicators used to measure marketing performance. They refer to all kinds of marketing activities undertaken in the areas of product policy, pricing, distribution and promotion [Kozielski 2006]. The indicator that is most frequently used to measure both the short-term and long-term results of marketing activities, however, is the Rate of Return on Marketing Investment. It is a typical indicator of financial character. There are even opinions, presented in some publications on the subject, that it is the primary indicator used to evaluate investment undertakings in the area of marketing. [Lenskold 2004] It enables us to relate the total costs of a particular marketing investment to the total profit that it generates. A marketing investment, therefore, includes all the costs of a given undertaking resulting from a marketing plan, which are subject to risk, whereas the whole financial surplus that can be assigned to this investment is a return on this investment. If an investment concerns a

71
market launch of a new product the gross margin is calculated by deducting the costs directly related to sales from the revenues. The costs strictly related to marketing fall under the category of investment involved in a given undertaking. In relation to the development of a new product these costs involve personnel costs necessary to prepare a marketing plan for a new product, the costs of prototype development, trial production and new product testing, the costs of promotional activities and the costs related to the delivery of a new product onto the market (distribution).
Return on Marketing Investment is thus a fraction in which the difference between the gross margin and the marketing investment is a numerator, while the marketing investment is a denominator. The gross margin is the difference between the sales revenues and the costs of the products sold including additional costs. The costs of the products sold include both fixed and variable costs of production (materials, raw materials, energy, labour) as well as overheads. A simplified formula presenting Return on Marketing Investment has been given below [Lesnskold 2004]
Return on Marketing Investment = (Gross margin – marketing investment) : Marketing investment = (sales revenues – sales costs – marketing costs of the undertaking) : marketing costs of the undertaking
As it can be seen the use of the rate of Return on Marketing Investment
corresponds to the already mentioned principle of treating marketing outlays as an investment.
The rate of Return on Marketing Investment can be also defined as a rate of marketing expenditures (outlays). Its calculation can be related to different time periods (e.g. months, quarters or years), depending on the requirements of marketing analysis. According to the principles of rational behavior the break-even point level of an investment in a company needs to be determined before any strategic decisions have been made and the return on particular marketing investments should be estimated after that. It will enable the company to select a marketing option that will either meet or exceed the assumed break-even point level. Of course, the rate of return on a marketing investment should also be determined after the given undertaking has been realised, mainly in order to compare the quantities that were planned with the ones that were really achieved.
Some marketing activities in an enterprise are being constantly implemented over a long period of time and they support many other marketing undertakings. They are related to the fixed costs of the company’s marketing system functioning. Such activities include, among others, the Internet use involving placing advertising messages informing about the company or its product offer, maintaining marketing databases, etc. The costs related to such activities should be allocated in proportion to either all subsequent marketing undertakings or to the most important marketing undertakings, that is the ones that generate the highest proportion of the company’s gross margin.
Marketing control and its role in marketing performance research As it has already been mentioned, the last stage of marketing management is marketing control. Recently, this stage has been commonly referred to as marketing controlling [Sławińska, 2014]. Questions arise, however, as to the meaning of this term. In
72
marketing publications the last stage of the marketing management process called marketing controlling is limited to examining the extent to which the assumed objectives have been reached and analysing the efficiency of marketing undertakings. The results of these examination are supposed to be used to adjust the content of particular stages of marketing management in subsequent periods of time.
In the literature concerning marketing control itself; however, it is defined in much broader terms. Functionally, marketing control is defined as a data-feeding system which supports the process of the company’s management through coordination, planning, control and analysis [Godziszewski 1990; Nowak, 2011]. Institutionally, it is equivalent to management accounting. Management accounting deals with the collecting, processing and reporting of the company’s data for the purposes of the management process in the company. [Nowak, 2000]. According to the IFAC (The International Federation of Accountants) definition, management accounting is a process of collecting, analysing, interpreting and communicating information of not only financial but also non-financial character [Nita, 2008]. Controlling, therefore, involves acquiring information from accounting and creating an information system supporting the processes of planning, controlling and analysing based on this information within a company. According to the above presented definitions the content of controlling/management accounting largely overlaps with the content of the Marketing Information System. The Marketing Information system (MIS) is a coordinated system of teams of people and their activities as well as tools and procedures to collect, process, analyse and store the information necessary to take marketing decisions [Karcz, Kędzior, 1997; Kotler 1994]. It consists of four subsystems of: archive resources, marketing intelligence, marketing research and marketing decisions support. Two of these subsystems: marketing research and marketing intelligence are particularly destined to collect and analyse the information about a company and its environment. They collect, among others, the financial information about a company with the use of the company’s financial documents (balance sheets, profit and loss accounts, cash flow statements) as well as the financial information about the company’s competitors acquired from various sources. It is evident then that the Marketing Information System (MkIS) functions overlap with those of controlling/ management accounting. This problem has not been addressed yet by the authors dealing with the issues of marketing and controlling. [Nowak, 2011]. Some authors of publications concerning controlling claim that MkIS constitutes an underlying basis for the functioning of marketing control without providing any in-depth analyses. These publications do not make a distinction between controlling and MkIS either and although controlling as such is presented in functional terms, the practical recommendations to use it indicate that it is perceived as management accounting.
In practice marketing managers applying MkIS are able to evaluate and interpret the acquired information, including the information related to finance. In order to achieve a permanent competitive edge, however, companies have to collaborate with controlling, management accounting and marketing managers. Collaboration of this kind should involve providing marketing managers with the financial information obtained as a result of the analysis of the financial documents of the company and its competitors (balance sheets, profit and loss accounts, cash flow statements.) This information, among others, is used to determine the position of the company and its major

73
competitors in a particular economic sector and can indicate a potential necessity of changes in the company’s marketing strategy.
It seems that the problem of an overlap between the content of Marketing Information System and controlling/management accounting can be resolved in a number of different ways. In order to do that the company should put controlling/management accounting in the right place of its organizational structure as we deal here with the Management Information System, which, according to the functional approach, consists of several particular information systems such as Marketing, Production, Research and Development, Human Resources and Finance as well as the influx of information from outside the company [Kaczmarczyk, 1999]. It can be assumed then that the Information System created by management accounting/controlling is part of the Management Information System called the Financial Information System. We can also assume that that it is a new additional element of the Management Information System under the name of the System of Management Information, along with the existing Financial Information System. Placing controlling within the Financial Information System or making it a separate independent element of the Management Information System means that all functions in the company are equally important and strongly engaged in the implementation of the company’s strategic aims. It is significant in view of the fact that ecently published accounting literature has introduced the term of a business partner, i.e. management accounting specialist. According to the authors using this term the business partner should be placed in the centre of the company’s organizational processes and the business partner’s activity should be regarded as the highest form of business partnership. Such a business partner is defined as a financial leader be to lead the company’s managers in order to achieve the company’s long-term goals [Kabalski, Sobańska,2014]. Such an approach may result in a potential clash between different functions in the company.
Marketing control can be also regarded as the last stage of the company’s marketing management process, which means that in fact it only deals with marketing performance research. In this case we use selected indicators of marketing performance effectiveness referring to all the aspects of marketing activities and the content of marketing control and that of the Marketing Information System do not overlap then.
Summary Marketing performance research is necessary to make right marketing decisions. The company uses different sorts of information for that purpose but the financial information and the financial indicators concerning the company’s marketing performance are becoming of particular importance. When accounting, finance and marketing experts examine the company’s performance separately the content of their research and their activities related to marketing performance evaluation may overlap. It appears that in order to avoid such a situation two different options can be proposed. The first of them is to place the System of Management Information within the Management Information System. The other option is to treat marketing performance research as a stage of marketing control that can be implemented as a result of marketing research.

74
Bibliography Dębski W., Prognozowanie sprzedaży, CIM Warszawa 1998; Dittmann P., Prognozowanie w przedsiębiorstwie, Wolters Kluwer, Kraków 2008 Godziszewski J., Controlling-system koordynacji przedsiębiorstwa, Przegląd Organizacji, nr 8-9/1990 Kabalski P., Sobańska I., Partner biznesowy-nowa rola specjalisty od rachunkowości zarządczej, Przegląd Organizacji, nr 7/2014 Kaczmarczyk S., Badania marketingowe. Metody i techniki, PWE, Warszawa 1999 Karasiewicz G., Wydatki marketingowe polskich przedsiębiorstw, Marketing i Rynek nr 8/2014 Karasiewicz G., Skorek M., Wilczak A., Efektywność działań marketingowych a marketingowa marża brutto, w: Ekspansja czy regres marketingu, PWE, Warszawa 2006, Karcz K., Kędzior Z. Badania marketingowe w praktyce, PWE, Warszawa 1997, Kotler Ph. Marketing, Analiza, planowanie, wdrażanie i kontrola, Gebethner i S-ka, Warszawa 1994 Kozielski R. (red.) Wskaźniki marketingowe, Woters Kluwer, Kraków 2006 Lenskold D., Pomiar rentowności inwestycji marketingowych, Wolters Kluwer Kraków 2004 Niestrój R., Finansowe aspekty planowania marketingowego, w: Marketing , koncepcje, badania, zarządzanie, PWE Warszawa 2002 Nita B., Rachunkowość w zarządzaniu przedsiębiorstwem, Wolters Kluwer, Kraków 2008, Nowak E., Rachunkowość zarządcza strategiczna i operacyjna, Controlling i rachunkowość Zarządcza, nr 5/2000 Nowak E., Controlling w działalności przedsiębiorstwa, PWE Warszawa 2011 Sławińska M., Marketing jako koncepcja zarządzania –trendy rozwoju, Marketing i Rynek, nr8/2014
Problemy pomiaru rezultatów działań marketingowych
Streszczenie Prezentowany artykuł dotyczy problemów badania efektywności działań marketingowych. W tym celu należy więc określić koszty przedsięwzięć marketingowych oraz osiągane przychody z tytułu realizacji tych przedsięwzięć. Ustalenie efektywności podejmowanych decyzji (przedsięwzięć) marketingowych można osiągnąć przy pomocy różnych mierników, wśród których szczególne znaczenie ma wskaźnik zwrotu z inwestycji marketingowej. Jest to nadwyżka finansowa ponad inwestycję, którą można jej przypisać w relacji do kosztów tej inwestycji(przedsięwzięcia). Pomiar efektywności jest ściśle związany z pojęciem controllingu marketingowego. Istotne znaczenie ma sprecyzowanie jego pojęcia i zakresu treściowego dla wyeliminowania ewentualnych kolizji z badaniami marketingowymi.
Słowa kluczowe: efektywność marketingu, controlling marketingowy, koszty marketingu, badania marketingowe. Informacje o autorze: Prof. zw. dr hab. Wojciech Grzegorczyk Uniwersytet Łódzki Wydział Zarządzania ul. Matejki 22/26, Łódź e-mail: [email protected]

75
15 (64) 2016
Witold Kowal Uniwersytet Ekonomiczny we Wrocławiu
VARYING LEVELS OF IMPORTANCE ATTRIBUTED TO MARKETING OUTCOMES FOR THE PURPOSES OF
EVALUATIONS OF ORGANIZATIONAL EFFECTIVENESS IN THE LIGHT OF A STUDY INVOLVING COMPANY
MANAGERS
Organizational evaluations are something obvious. Company effectiveness may be the subject of such an evaluation. Most often, effectiveness is associated with the accomplishment of goals. The development of marketing concepts has demonstrated numerous relationships between the results representing a firm’s principal goals and its marketing outcomes. This paper aims to examine the differences in importance attached to the results of various marketing activities for the purposes of organizational assess-ment. Therefore, it would seem justified to expect a growing impact of marketing out-comes on the evaluation of organisational effectiveness. The results of the study proved that an increase in the significance attributed to effectiveness as a criterion for organ-isational evaluation was accompanied by a corresponding increase in the significance attributed to the results representing a company's principal goals. The same tendency could be observed only in respect of small number of marketing outcomes. Key words: organizational evaluation, effectiveness, organizational goals, marketing outcomes (effects)
Introduction For decades, marketing has been developing as a philosophy of market activity of busi-nesses. The above development is manifested in diverse theoretical concepts of market-ing. The idea behind the development of the above marketing concepts is to improve organizational effectiveness. As a consequence, a growing number of results of market-ing activities have been identified which are seen as expressing the relationship between marketing actions and financial results of an organization. This paper aims to examine the differences in importance attached to the results of various marketing activities for the purposes of organizational assessment. The above problem was the focus of a re-search project titled "Emotional, behavioural and financial effects in the evaluation of efficiency of the business organisation" (Project No. 2012/05/B/HS4/02414), imple-mented in 2013-2015 with financing from the National Science Centre in Krakow. The present paper supplements the results presented in other publications1
1 See W. Kowal, Synthetic Organizational Evaluation. Emotional, Behavioural and Financial Effects of
Marketing Activities in Effectiveness and Efficiency Evaluation, Publishing House of Wrocław University of Economics, Wrocław 2015

76
Source material and research methods A review of the literature of the subject suggests the existence of two approaches to a firm’s raison d’être. They relate to the characteristics of the outcomes of various activi-ties performed within the organization and to their contribution to the organization's goals as well as to the criteria for organizational evaluation (including the interpretation of effectiveness as a criterion for synthetic organizational evaluation).
There have been numerous attempts at identifying and classifying the results of marketing activities. A wealth of various classifications of marketing outcomes may be found in the literature on advertising2, brand management3 and in publications on various marketing concepts4. The characterizations of the effects of marketing activities found in the above publications are relatively selective although they point out to certain coherent interrelation-ships between individual outcomes (results). The underlying idea behind the above research projects was the search for a relationship between marketing activities and organizational goals. Over time, the outcomes of marketing activities became the subject of theoretical in-vestigations in their own right. The above outcomes were classified as part of characterising the categories of marketing performance and marketing productivity5. The above studies have led to the division of the outcomes of marketing activities into "financial results" and "marketing outcomes". The latter ones may be classified as "behavioural results”, "consumer mental results" and "market results".
As a result of the analysis of the body of theoretical work, a model (chain) of marketing productivity has been prepared which shows interdependencies between nine fundamental outcomes associated with marketing actions (see Figure 1).
Two of the above results (financial result and company value) reflect the principal goals of a firm. They are the only forms of company goals with which marketing was or is trying to establish a relationship as part of the formulated marketing concepts. Under the so-called managerial theories of the firm, sales are regarded as the principal goal of an organization6. On the other hand, the body of theoretical marketing research very
2 See T.E. Barry, D.J. Howard A review and critique of the hierarchy of effects in advertising, “Interna-
tional Journal of Advertising” 1990, no. 9, pp. 121-135; J. Woźniczka, Efekty reklamy w systemie komunikacji marketingowej, Seria: Monografie i Opracowania nr 190, Prace Naukowe Uniwersytetu Ekonomicznego we Wrocławiu nr 45, Wydawnictwo Uniwersytetu Ekonomicznego, Wrocław 2009
3 See D.A. Aaker, Managing Brand Equity, Free Press, New York 1991; K.L. Keller, Strategic Brand Management. Building, Measuring, and Managing Brand Equity, Prentice Hall, Upper Saddle River 1998; R.T, Rust, V.A. Zeithaml, K. N. Lemon, Driving Customer Equity. How Customer Lifetime Value Is Reshaping Corporate Strategy, Free Press, New York 2000
4 See K. Storbacka, T. Strandvik, C. Gronroos, Managing customer relationship for profit: The dynamics of rela-tionship quality, ”International Journal of Service Industry Management” 1994, vol. 5, no. 5, pp. 21-38; J. Egan, Relationship Marketing, Prentice Hall, Harlow 2001; P. Doyle, Marketing wartości, Felberg SJA, Warszawa 2003
5 See B.H. Clark., Marketing performance measures: History and interrelationships, “Journal of Market-ing Management” 1999, vol. 15, pp. 711-732; D.V. Vorhies, N.A. Morgan, A configuration theory assessment of marketing organization fit with business strategy and its relationship with marketing performance, “Journal of Marketing”, January 2003, vol. 67, pp. 100-115; T. Ambler, F. Kokkinaki, S. Puntoni , Assessing marketing performance: Reasons for metrics selection, “Journal of Marketing Management” 2004, vol. 20, pp. 475-498; R.T. Rust, T. Ambler, G.S. Carpenter, V. Kumar, R.K. Srivastava, Measuring marketing productivity: Current knowledge and future directions, “Journal of Marketing”, October 2004, vol. 68, pp. 76-89; L. Gronholdt, A. Martensen, Key marketing performance measures, “The Marketing Review” 2006, no. 6, pp. 243-252
6 See E. Domańska, Kapitalizm menedżerski, PWE, Warszawa 1986
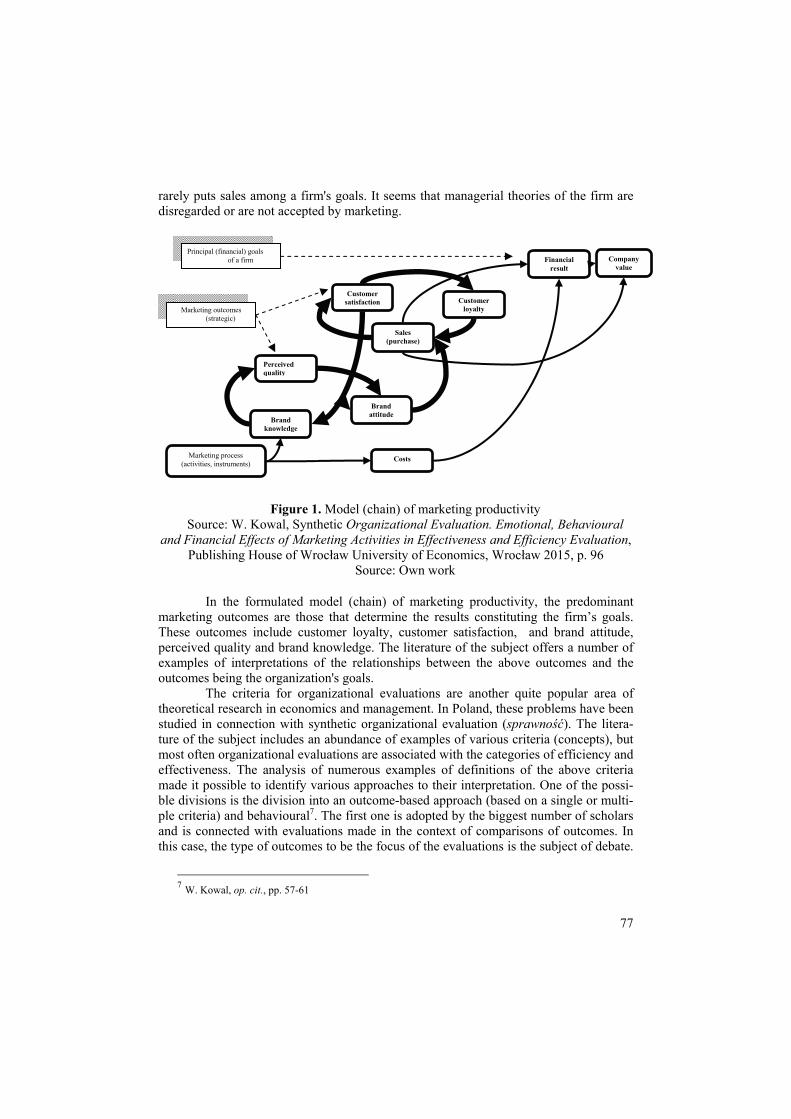
77
rarely puts sales among a firm's goals. It seems that managerial theories of the firm are disregarded or are not accepted by marketing.
Figure 1. Model (chain) of marketing productivity Source: W. Kowal, Synthetic Organizational Evaluation. Emotional, Behavioural
and Financial Effects of Marketing Activities in Effectiveness and Efficiency Evaluation, Publishing House of Wrocław University of Economics, Wrocław 2015, p. 96
Source: Own work
In the formulated model (chain) of marketing productivity, the predominant marketing outcomes are those that determine the results constituting the firm’s goals. These outcomes include customer loyalty, customer satisfaction, and brand attitude, perceived quality and brand knowledge. The literature of the subject offers a number of examples of interpretations of the relationships between the above outcomes and the outcomes being the organization's goals.
The criteria for organizational evaluations are another quite popular area of theoretical research in economics and management. In Poland, these problems have been studied in connection with synthetic organizational evaluation (sprawność). The litera-ture of the subject includes an abundance of examples of various criteria (concepts), but most often organizational evaluations are associated with the categories of efficiency and effectiveness. The analysis of numerous examples of definitions of the above criteria made it possible to identify various approaches to their interpretation. One of the possi-ble divisions is the division into an outcome-based approach (based on a single or multi-ple criteria) and behavioural7. The first one is adopted by the biggest number of scholars and is connected with evaluations made in the context of comparisons of outcomes. In this case, the type of outcomes to be the focus of the evaluations is the subject of debate.
7 W. Kowal, op. cit., pp. 57-61
Perceived quality
Brand knowledge
Brand attitude
Financial result
Company value
Customer satisfaction Customer
loyalty
Costs
Sales (purchase)
Principal (financial) goals of a firm
Marketing outcomes (strategic)
Marketing process (activities, instruments)

78
The most obvious alternative is to compare organizational outcomes against organiza-tional goals or against costs (that is, to assess effectiveness or efficiency). Still another dilemma in the interpretation of the essence of outcome-based approaches to organiza-tional evaluations is the number of criteria for such evaluations. The problem is espe-cially apparent in the body of research on the interpretation of organizational effective-ness8. Ultimately, one may differentiate three basic results-based assessment criteria, i.e. effectiveness from the point of view of goals, effectiveness based on multiple criteria and economic effectiveness9.
Another approach worth mentioning is the behavioural approach to organiza-tional assessments. Its essence was presented by P. Drucker (1988) as part of his inter-pretations of effectiveness and efficiency. The above approach is particularly evident in marketing and its examples include studies of marketing orientation or of marketing effectiveness10. However, it is worth noting that the behavioural approach is less results-based.
The problem being at the focus of the present paper is analysed in the context of the above-outlined development tendencies of the body of theoretical economic research. It concerns the changeability of the perceived significance of marketing results for or-ganizational assessments (in this case for the evaluations of effectiveness). If the role of marketing is to serve the accomplishment of a firm’s goals (effectiveness), it seems justified to identify the importance of various outcomes for the purposes of such evalua-tions. As could be noticed, effectiveness may be evaluated using a single or multiple criteria. It then seems reasonable to consider whether a preference for effectiveness as a criterion for organizational assessment is associated with an increase in the perceived significance of only these outcomes that represent organizational goals or maybe it is also accompanied by an increase in the perceived significance of marketing outcomes. In light of the literature review it is justified to expect a dependence between a higher im-portance attributed to effectiveness (as a criterion for organizational assessment) and the firm’s outcomes representing the company’s goals (such as financial results, company value and even sales). The question of the impact of marketing results remains more open for debate. The literature of the subjects abounds in examples of relationships be-tween marketing outcomes and the firm’s principal goals, which should justify the in-creased significance of marketing results for the evaluation of organizational effective-ness.
Results and discussion The above-formulated problem was analysed on the basis of measurements based on a series of CATI interviews. The interviews were conducted on a group of respondents including CEOs/directors of companies, marketing managers and employees investing in shares. The sample consisted of 575 respondents. The respondents represented compa-
8 See R.M. Steers, Problems in the measurement of organizational effectiveness, “Administrative Science
Quarterly” 1975, vol. 20, no. 4, pp. 546-568;P. Chelladurai Multidimensionality and Multiple Perspectives of Organizational Effectiveness, “Journal of Sport Management” 1987, 1, pp. 37-47
9 See W. Kowal, op. cit., p.59 10 See P. Kotler , From sales obsession to marketing effectiveness, “Harvard Business Review”, Novem-
ber-December 1977, vol. 55, no 6,pp. 67-75

79
nies with employment exceeding 250 whose core business was in the consumer products market. The above sample selection made it possible to observe the differences in organ-izational evaluations within a relatively coherent respondent group. The measurements of preferences for various criteria of synthetic organizational evaluation were made us-ing rank scales and descriptions (definitions) of various organizational assessment crite-ria (the names of these criteria were not presented to the respondents). On the other hand, the measurement of the impact of various outcomes on synthetic organizational evaluation (sprawność) was made using a 7-degree interval scale.
Firstly, the general results relating to the significance of various outcomes for syn-thetic organizational evaluation should be presented. Figure 2 shows the mean impact scores for the above variables and their coefficients of variation for all the respondents.
Figure 2. Map of mean impact scores and coefficient of variation for marketing and financial outcomes in
synthetic organizational evaluation – overall results Source: W. Kowal, Synthetic Organizational Evaluation. Emotional, Behavioural and Financial Effects
of Marketing Activities in Effectiveness and Efficiency Evaluation, Publishing House of Wrocław University of Economics, Wrocław 2015, p. 122
The results of the study showed that sales and customer satisfaction had the
highest mean value but first of all a low coefficient of variation. The above may suggest their relatively stable impact on organizational evaluation. The outcomes representing the firm’s principal goals (financial results and company value) were characterised by lower mean values and a higher variation. The above was particularly evident for com-pany value. The above variable had one of the lowest mean values (next to two other

80
variables, i.e. brand attitude and brand knowledge), and it also had the highest coeffi-cient of variation. Such a high coefficient of variation for the above variable (company value) indicates that it has a varying importance for organizational evaluations. There-fore, it will be interesting to discover whether a higher perceived significance of effec-tiveness as a criterion for organizational evaluation will explain the observed variation. The analysis of the variability of the mean impact scores of the above marketing and financial outcomes of a firm depending on the perception of effectiveness as a criterion for organizational evaluation would exclude or not exclude the above-mentioned rela-tionship.
In order to identify the expected interdependence, respondents were divided into those showing a higher preference for effectiveness as a criterion for organizational evaluation and those showing a higher preference for other criteria (such as economic efficiency and behaviour-based evaluations). The above classification was made on the basis of ranks assigned to individual criteria for organizational evaluation. The obtained rank distribution made it possible to make unambiguous classification of the preferences for 326 respondents (other cases were excluded from the analysis). It should also be pointed out that two forms of effectiveness were considered: effectiveness as an evalua-tion based on comparisons with goals and as a multi-criteria evaluation. Table 1 presents the t-test results for the analysed variables broken down into the above-mentioned two groups.
Table 1. T-test for equality of the mean values for the perceived significance of marketing and financial out-comes in company evaluation – grouping variable: effectiveness vs. other criteria for organizational assessment
Levene’s test homo-geneity of variances T-test for equality of means
F Significance t df Significance (double-sided)
Customer loyalty
Assumed equality of variances ,162 ,688 2,117 324 ,035 No assumed equality of variances 2,176 243,425 ,031
Customer satisfaction
Assumed equality of variances ,205 ,651 2,281 324 ,023 No assumed equality of variances 2,330 239,200 ,021
Brand attitude
Assumed equality of variances 5,184 ,023 ,201 324 ,841 No assumed equality of variances ,220 285,242 ,826
Perceived quality
Assumed equality of variances 2,365 ,125 1,358 324 ,175 No assumed equality of variances 1,406 248,134 ,161
Brand knowledge
Assumed equality of variances ,255 ,614 1,154 324 ,249 No assumed equality of variances 1,223 264,323 ,222
Financial result
Assumed equality of variances ,226 ,635 2,170 324 ,031 No assumed equality of variances 2,227 242,280 ,027
Costs Assumed equality of variances ,155 ,694 2,364 324 ,019 No assumed equality of variances 2,450 249,066 ,015
Value of the firm
Assumed equality of variances ,686 ,408 2,322 324 ,021 No assumed equality of variances 2,402 247,662 ,017
Sales Assumed equality of variances ,931 ,335 1,212 324 ,227 No assumed equality of variances 1,324 285,443 ,187
Source: elaboration based on own research

81
The results obtained show an increase in mean values for the group with a pref-erence for effectiveness as the criterion for organizational evaluation. The test result indicates that the observed differences are statistically significant only for five variables (outcomes), i.e. for the financial result, company value, costs, customer loyalty and cus-tomer satisfaction. Two of the above variables represent outcomes classified as the firm’s principal goal (financial result and company value) and the growth of their mean values was expected. Among marketing outcomes, only two (customer loyalty and cus-tomer satisfaction) had a noticeable increase in the impact on the evaluation (increase in mean values). The above means that the results of the study do not exclude a scenario where an improvement in these outcomes may increase the evaluation of the firm’s ef-fectiveness. The remaining variables (marketing outcomes) did not demonstrate any statistically significant increase in mean values. Sales were observed to have a stable significance for organizational evaluation (no significant change in mean value). In each of the groups covered by the research, this variable had the highest mean value. Surpris-ingly, an increase was observed in the impact of costs as a criterion for organizational evaluation. Although, the “opposition” group had a mixed character (showed a prefer-ence for either economic effectiveness or for behaviour-based evaluation), but other analyses carried out under the study did not show other dependencies relating to costs11.
Conclusions The results obtained justify a suggestion that a preference for effectiveness as a criterion for organizational evaluation is associated with higher perceived importance of out-comes representing the firm’s principal goals. The observed growth in the importance (impact) of these outcomes has its theoretical justification and therefore it is obvious. Among other variables, only two marketing outcomes demonstrated a significant covari-ance. Improved customer satisfaction and customer loyalty covaried with a preference for effectiveness as a criterion for organizational evaluation. In light of the results of the study, the remaining outcomes (their improvement) do not necessarily have to be associ-ated with improved organizational effectiveness.
Further research might examine the role of other marketing outcomes (effects) in evaluating an organization. It is important to understand the role of marketing for organization.
References 1. Aaker D.A., Managing Brand Equity, Free Press, New York 1991.pp? 2. Ambler T., Kokkinaki F., Puntoni S., Assessing marketing performance: Reasons for metrics
selection, “Journal of Marketing Management” 2004, vol. 20, pp. 475-498, 3. Barry T.E., Howard D.J, A review and critique of the hierarchy of effects in advertising, “In-
ternational Journal of Advertising” 1990, no. 9, pp. 121-135 4. Chelladurai P., Multidimensionality and Multiple Perspectives of Organizational Effectiveness,
“Journal of Sport Management” 1987, 1, pp. 37-47, 5. Clark B.H., Marketing performance measures: History and interrelationships, “Journal of
Marketing Management” 1999, vol. 15, pp. 711-732,
11 See W. Kowal, op. cit.

82
6. Domańska E., Kapitalizm menedżerski, PWE, Warszawa 1986.pp? 7. Doyle P., Marketing wartości, Felberg SJA, Warszawa 2003. 8. Drucker P.F., Management. Tasks, Responsibilities, Practices, Butterworth Heinemann, Ox-
ford 1988.pp? 9. Egan J., Relationship Marketing, Prentice Hall, Harlow 2001. 10. Gronholdt L., Martensen A., Key marketing performance measures, “The Marketing Review”
2006, no. 6, pp. 243-252, 11. Keller K.L., Strategic Brand Management. Building, Measuring, and Managing Brand Equity,
Prentice Hall, Upper Saddle River 1998.pp? 12. Kotler P., From sales obsession to marketing effectiveness, “Harvard Business Review”, No-
vember-December 1977, vol. 55, no 6,pp. 67-75. 13. Kowal W., 2015. Synthetic Organizational Evaluation. Emotional, Behavioural and Financial
Effects of Marketing Activities in Effectiveness and Efficiency Evaluation, Publishing House of Wrocław University of Economics, Wrocław pp
14. Rust R.T., Zeithaml V.A., Lemon K.N., Driving Customer Equity. How Customer Lifetime Value Is Reshaping Corporate Strategy, Free Press, New York 2000.pp
15. Rust R.T., Ambler T., Carpenter G.S., Kumar V., Srivastava R.K., Measuring marketing productivity: Current knowledge and future directions, “Journal of Marketing”, October 2004, vol. 68, pp. 76-89,
16. Steers R.M., Problems in the measurement of organizational effectiveness, “Administrative Science Quarterly” 1975, vol. 20, no. 4, pp. 546-568,
17. Storbacka K., Strandvik T., Gronroos C., Managing customer relationship for profit: The dynamics of relationship quality, ”International Journal of Service Industry Management” 1994, vol. 5, no. 5, pp. 21-38.
18. Woźniczka J., Efekty reklamy w systemie komunikacji marketingowej, Seria: Monografie i Opracowania nr 190, Prace Naukowe Uniwersytetu Ekonomicznego we Wrocławiu nr 45, Wydawnictwo Uniwersytetu Ekonomicznego, Wrocław 2009.pp?
19. Vorhies D.V., Morgan N.A., A configuration theory assessment of marketing organization fit with business strategy and its relationship with marketing performance, “Journal of Market-ing”, January 2003, vol. 67, pp. 100-115,.
Zmienność wpływu efektów marketingowych na ocenę skuteczności przedsiębiorstwa w świetle wyników badań
menedżerów przedsiębiorstw Streszczenie
Ocena przedsiębiorstwa jest czymś oczywistym. Skuteczność przedsiębiorstwa jest przykładem jednej z takich ocen. Najczęściej jest ona kojarzona z realizacją celów. Rozwój koncepcji marke-tingowych uzasadnia liczne związki między efektami reprezentującymi cele podstawowe przed-siębiorstwa a efektami marketingowymi. Celem artykułu jest próba rozpoznania zmienności zna-czenia różnych efektów działań marketingowych dla ocenę przedsiębiorstwa. Zasadne wydaje się oczekiwanie wzrostu wpływu efektów marketingowych na ocenę skuteczności przedsiębiorstwa. Wyniki przeprowadzonego wykazały, iż wzrostowi percepcji znaczenia skuteczności jako kryte-rium oceny przedsiębiorstwa towarzyszył wzrost percepcji znaczenia efektów reprezentujących cele podstawowe przedsiębiorstwa. Taką samą tendencję dało się zauważyć jedynie w odniesieniu do nielicznych efektów marketingowych.

83
Słowa kluczowe: ocean przedsiębiorstwa, skuteczność, cele przedsiębiorstwa, efekty działań marketingowych Informacja o Autorze: dr hab. Witold Kowal, prof. UE Uniwersytet Ekonomiczny we Wrocławiu Instytut Marketingu ul. Komandorska 118/120 53-345 Wrocław e-mail: [email protected]
84
15 (64) 2016
Eugeniusz Michalski Koszalin University of Technology
MARKETING MANAGEMENT OF ENTERPRISE
The main goal of this article is to present how the new conception of marketing mix affects delivering value to customers and benefit an enterprise. The task of marketing management is to make the good and service available when a customer is ready to buy it. An enterprise needs timely, accurate and relevant information on customers, competitors and new socio-economic trends in the country and the world. The analysis of marketing management paradigm and creation of value based management were carry out. Next, the concept of marketing strategy and SWOT analysis were under consideration. Lastly, the impact of information technology on marketing management were described.
Key words: paradigm, values, strategy, SWOT, information technology
Introduction This paper analyses the factors shaping marketing management of enterprise by applying descriptive, casual and comparative research. Work began to hypothesize that marketing management aims not only to gain profit but also to get customers, business partners the value, society well-being and protect the natural environment. The American Marketing Association describes marketing as an organizational function and set of processes for creating, communicating, and delivering value to customers and for managing customer relationship in ways that benefit the organization and its stakeholders [AMA 2015]. During an act of buying or selling individuals or groups obtain what they need and want through freely exchanging goods or services of value with each other. Exchange is a value-creating process because it leaves both parties better off or at least not worse off than before. To make successful exchanges an enterprise analyzes what customers expect from its offers. The process of negotiation leads to mutually acceptable terms. The enterprise without customers can’t exists.
Coping with exchange processes calls for a considerable amount of work and skill. The enterprise should be better in creating, delivering and communicating value to target markets from the competitors. Original ideas about competition between domestic and foreign enterprises have gained great economic significance recently. Products have been design not only for target and niche markets, but more often for individual customers. General marketing’s role is to deliver a higher standard of living.
An enterprise should be competently managing and well-run. Decision-maker have many demands on broad and sound knowledge, acquire the latest news and improve technological and marketing skills. Enterprises now know that marketing is done not only by marketers and customer support personnel but every employee has an impact on the customer and must see the customer as the source of enterprise’s prosperity. More emphasis is also being placed on the management of new-product

85
realization, customer’s acquisition and retention, and orders fulfilment. In addition to monitoring a changing environment, markers want information to help interpret past performance as well as plan future activities [Roy 2014].
Discovering a customer insight and understanding its implication can often lead to a successful product launch or spur the growth. Good marketing research is characterized by creativity, multiple scientific methods, accurate monitoring, cost benefit analysis, healthy skepticism and ethical focus. It’s get to know hidden, even underlying needs and imagination of customers. Very important tasks of producer and middleman are to stimulate a level, structure and fluctuation for demand. Customers can easer compare offers, prices and substitute for products by Internet. Middlemen increase in strength through combine with producers into marketing network.
New aspects of marketing mix In marketing theory and practice are widen and increased knowledge about marketing mix. Apart from goods, services and ideas new designation for product have come such as experience, image, events, information, place and non-profit organization [Armstrong et al. 2015]. Marketing mix strategy directs to market target consists of four parts: an offer (goods, service, and price) information (advertising, sales promotion, sales force, public relation, direct marketing), distribution channels and target markets. The enterprise can change price and medium of information during every phase marketing activity in short term. New-product development and modification of distribution channels require a long period of time.
Experience refers to past events, knowledge and feelings that make up customer’s life or character. By orchestrating several goods and services, an enterprise can create and stage market experiences. Customer experiences are feeling of joy during visiting an exhibition, trade shows, artistic stage performance, musical entertainment and celebrating enterprise anniversary. Sporting events are promoted to both enterprises and fans. There are professionals who work out an event and make sure it comes off perfectly.
The image of a person, group, product or enterprise is the way that they appear to customers. The enterprise establishes the product’s character and value proposition in highlighted and distinctive way. Image should be diffused in ads, annual reports, brochures, catalogs packaging, enterprise stationary and business cards. It could create image of politician, actor, comedian, musician, physician and lawyer. Image can be associate also with the highlighting place, region, country place for active leisure and entertainment.
Aside from consumer and industrial products gain quite significance meaning nonprofit and governmental markets. Nonprofit organizations such as churches, schools, universities, charitable organizations government agency need to be price carefully because they have limited purchasing power. Lower prices affect the features and quality that seller can built into the offering. Much government purchasing calls for bids, with the lowest bid being favored. There are promoting more frequently country, recreational centers, theaters, restaurant and parks. It is extend market sphere, because aside from shops purchase can be done through internet. Customers can order products from various directions of the world,a plane, bus or train.
86
Meta market comes into existence. It is a cluster of complementary products and services that are closely related into minds of customers but are spread across a diverse set of enterprises [Meta Markets 2015].The automobile meta market consists of automobile manufactures, new car and use car dealers, financing and insurance companies, mechanics, spare parts dealers, service shops, auto magazines, classified auto ads in newspapers, and auto sites in internet. Other example are the home ownership market, baby care market, and the wedding market.
Information can be also marked as a product. Schools, universities, books, professional journals and computer worlds distributed knowledge, competence and expertise. Even enterprises that sell physical goods attempt to add value through the use of information. Technological advances in transportation, shipping and communication have made easier for enterprises to market in others countries and readily to customers to buy products from other countries. Information can be appraise against a background of sources or impact on promotion. An enterprise can get to know some unknown reason behind fall the demand for the product. The demand can be hidden, under fluctuation or come to an end. The customers are on alert for buying unhealthy products or harmful to natural environment.
The concept of marketing management Marketing management is the art and science of choosing target markets and getting, keeping and growing customers through creating, delivering and communicating superior value. The first task facing an enterprise is to identify its potential long-run opportunities given to its market experience and core competencies. To understand what is happening inside and outside the enterprise needs a reliable marketing information system, it will closely monitor outside environment [Kotler, Keller 2006]. Marketing research is an indispensable system for assessing customer wants and behavior and actual and potential market size.
The enterprise macro environment consists of demographic, economic, physical, technological, political, legal and social-cultural forces that affect sales and profits. Microenvironment encompasses all the players who affect its ability to sells products – suppliers, intermediaries, customers, banks and competitors. To transform marketing strategy into programs, managers must make decisions on marketing expenditures, activities and allocation of employs.
Undertaken marketing decisions can be gathered and expressed in paradigm of marketing management. The paradigm present in table 1, like any other model, contains simplification of real marketing management. Six characteristics make up the paradigm: knowledge, know-how, motivation, conditions, responsibility and courage [Michalski 2014].
Knowledge is a familiarity, awareness or understanding facts, information, descriptions or skills, which are acquired through education and experience by a decision-maker. Knowledge obliges with identify the situation on the market, describe criterion for choosing and assessment of the marketing decision, generate option for solving and assess the effects. In paradigm can be set apart following distinctive features, which are essential to make the best use of knowledge: know-how, motivation, conditions, responsibility and courage.

87
Know-how is the ability or skill to application of knowledge, methods or techniques for doing something, especially something practical. It is commercial and saleable knowledge of how to make particular marketing decision. Benchmarking provides valuable context, helping to set meaningful target markets, gain insight into trends occurring across business environments and find out how successfully competing.
Motivation is the willingness to exert high levels of effort to reach enterprise goals, conditioned by the ability to satisfy customer’s desires and needs and employ’s actions. A motive is what prompts the decision-makers to act in a certain way or at least develop an inclination for specific behavior favorable for customers. Table 1. Paradigm of marketing management
Characteristics Distinctive features
Knowledge Knowledge acquire during the studies, data-gathering and analysis of
marketing research findings, which facilitates election and implementation of marketing decisions, challenge
and throw down the competitors.
Know-how The ability to make good use of employ’s competence, develop their skills from own and competitors
successes or failures.
Motivation Initiate new stimulus to influence on employ attitude towards activities and customers; that be
inclined to initiatives, the entrepreneurial spirit and innovation.
Conditions Create favorable atmosphere for taking effective decisions, implement modern information technology,
remove barriers and restrictions hinder progress and sensible manage marketing activities.
Responsibility Responsibility for obey the low and business ethics; contribute to the well-being society, environmental
protection and abandon unfair competition.
Courage Confident and conscious support and insist on the realization of the appropriate marketing decision, take sometimes risk despite the shortcomings.
Source: Own elaborate
Conditions are a particular state of situation with respect to external or existing in the enterprise circumstances. It is something that supports or restricts marketing activities. The conditions to make the best use of marketing knowledge and know-how can be considered on global, international, domestic and local levels.
The attribute of marketing activity is to obey legal norms and business and professional ethics. An enterprise holds responsible for every good or bad deeds of employs. It must balance of shareholders, employs, customers, suppliers and ecological interests. An enterprise can apply four approaches to marketing responsibility awareness: negation, defense, taken on an obligation and prevention harmful business activity.
Courage is the quality to have the confidence to do what marketing decision-maker believes is right, even though may be afraid or other people may not agree or approve. Conformity is the act of matching attitudes, beliefs, and behaviors to group
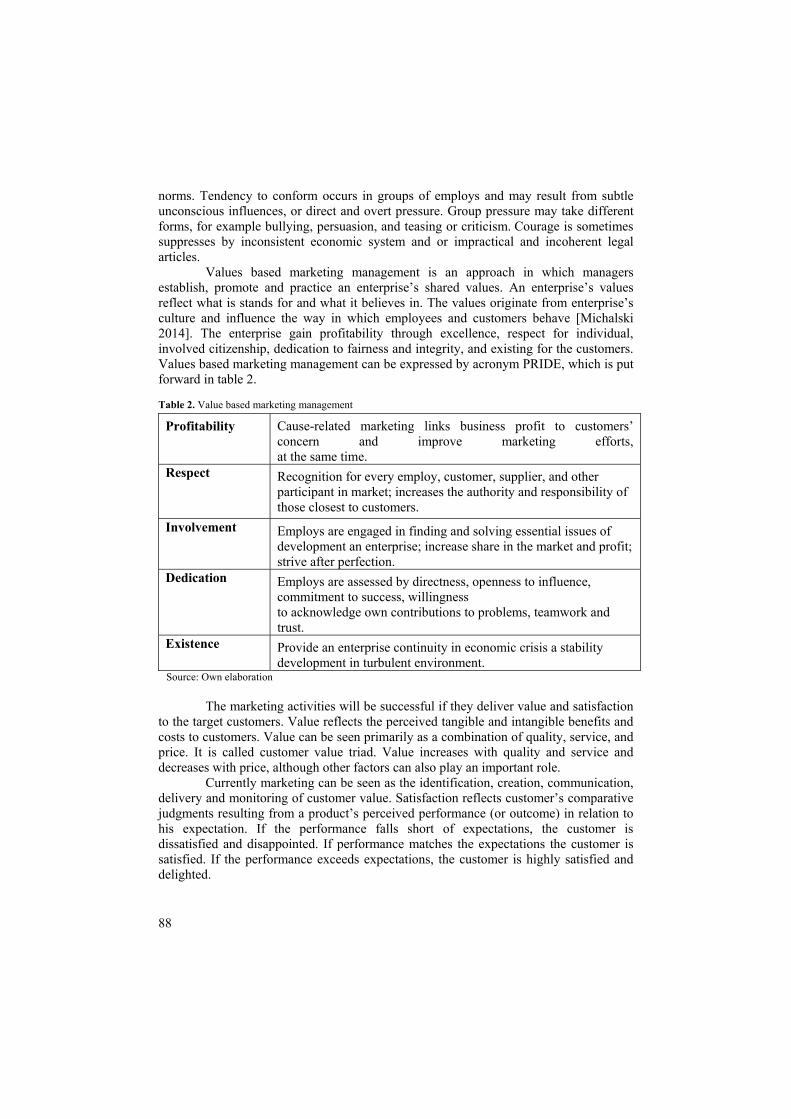
88
norms. Tendency to conform occurs in groups of employs and may result from subtle unconscious influences, or direct and overt pressure. Group pressure may take different forms, for example bullying, persuasion, and teasing or criticism. Courage is sometimes suppresses by inconsistent economic system and or impractical and incoherent legal articles.
Values based marketing management is an approach in which managers establish, promote and practice an enterprise’s shared values. An enterprise’s values reflect what is stands for and what it believes in. The values originate from enterprise’s culture and influence the way in which employees and customers behave [Michalski 2014]. The enterprise gain profitability through excellence, respect for individual, involved citizenship, dedication to fairness and integrity, and existing for the customers. Values based marketing management can be expressed by acronym PRIDE, which is put forward in table 2.
Table 2. Value based marketing management
Profitability
Cause-related marketing links business profit to customers’ concern and improve marketing efforts, at the same time.
Respect Recognition for every employ, customer, supplier, and other participant in market; increases the authority and responsibility of those closest to customers.
Involvement Employs are engaged in finding and solving essential issues of development an enterprise; increase share in the market and profit; strive after perfection.
Dedication
Employs are assessed by directness, openness to influence, commitment to success, willingness to acknowledge own contributions to problems, teamwork and trust.
Existence
Provide an enterprise continuity in economic crisis a stability development in turbulent environment.
Source: Own elaboration The marketing activities will be successful if they deliver value and satisfaction
to the target customers. Value reflects the perceived tangible and intangible benefits and costs to customers. Value can be seen primarily as a combination of quality, service, and price. It is called customer value triad. Value increases with quality and service and decreases with price, although other factors can also play an important role.
Currently marketing can be seen as the identification, creation, communication, delivery and monitoring of customer value. Satisfaction reflects customer’s comparative judgments resulting from a product’s perceived performance (or outcome) in relation to his expectation. If the performance falls short of expectations, the customer is dissatisfied and disappointed. If performance matches the expectations the customer is satisfied. If the performance exceeds expectations, the customer is highly satisfied and delighted.

89
Marketing strategyplanning The first task facing the managers are to develop marketing strategy which identify its potential opportunities given their market experience and core competition. Next they must develop concrete marketing plans and going forward tactics. Marketing information system and marketing research are reliable and indispensable tools for assessing customer wants and behavior, and actual and potential market size. To transform strategy into programs, managers must make decision on marketing expenditures, activities and resources allocation.
An enterprise must consider the strategies how to create value for its target markets, and develop strong, profitable and long term relationship with customers [Michalski 2012]. Strategy choices on whether the enterprise is a market leader, challenger, follower or nicher. Marketers must also pay close attention to competitors, anticipating competitors’ moves and knowing how to react quickly and decisively against issue challenges.
At the heart of marketing program are goods – the enterprise’s tangible offering to the market, which includes quality, design, features, and packaging. As a part of offering may be provided various support service which can guarantee competitive advantage in market place. A critical marketing decision relates to price. It has to decide on wholesale, and retail price, discounts, allowances and credit terms. An enterprise must identify, recruit and link various marketing facilitators to supply its goods and services efficiently to the target markets.
Marketing communications activities are means by which an enterprise attempts to inform, persuade and remind customers, directly or indirectly, about its offerings. An enterprise can develop an integrated communication program consisting of advertising, sales promotion, evens, public relations and lines of personal communication in the form of direct and interactive promotion.
Finally an enterprise must organize marketing resources and implement and control the marketing strategy plans. Evaluation and control are necessary to understand the efficiency and effectiveness of marketing activities and how both could be improved. To ensure that the proper activates are selected and executed, strategic planning is paramount and calls for action in three key areas:
• managing an enterprise’s business as an investment portfolio, • assessing each business’s strength by considering the market growth rate and
enterprise’s position and fit in the market, • establishing a strategy for achieving its long-run objectives.
The strategic marketing plan lays out the target markets and value propositions that be offered, based on an analysis of the best market opportunities. Assessing growth opportunists involves planning new businesses, downsizing, or terminating older business. If there is a gap between future desired sales and project sales, management will develop or acquire new business to fill it.
The enterprise first considers whether it could gain more market share with its current products in its current markets (market-penetration strategy). Next it considers whether it can find or develop new markets for its current products (market-development strategy). Then it considers whether it can develop new products of potential interest to its current markets (product development strategy). Later it would also review

90
opportunities to develop new products for new market (diversification strategy). By examining these intensive growth strategies, management may discover several ways to grow. Still, that growth may not be enough so the management must also look for integrative growth opportunities [Bartlett and Beamish 2011].
An enterprise’s sales and profits may be increased through backward, forward or horizontal integration with its partners. The industrial enterprise might acquire one or more of its suppliers to gain more control or generate more profit (backward integration) It may acquire some wholesalers or retailers, especially if they are highly profitable (forward integration). Finally, it may acquire one or more competitors, provided that the government does not bare this move (horizontal integration). However, these new sources may still not deliver the desired sales volume. In that case, the enterprise must consider diversification.
Diversification growth makes sense when good opportunities can be found outside the present businesses. A good opportunity is one in which the industry is highly attractive and the enterprise has the right mix of business strengths to be successful. Several types of diversification is possible.
The industrial enterprise could seek new products that have technological or marketing synergies with existing product lines, even though the products themselves may appeal to a different group of customers (concentric strategy). It might search for new product lines, even though the new products are technologically unrelated to its current product line (horizontal strategy). The enterprise might also seek new businesses that have no relationship to its current technology, product or markets (conglomerate strategy). Managers should focus on growth opportunities, and not fritter away energy and resources trying to salvage hemorrhaging businesses.
The overall evaluation of an enterprise’s strengths, weaknesses, opportunities, and threats is called SWOT analysis (Kotler and Keller 2006]. It involves monitoring the external and internal marketing environment. External environment consists of macro environment forces (demographic-economic, natural, technological, political-legal, and social-cultural) and microenvironment partners (customers, competitors, suppliers, distributors, dealers) that affect its ability to earn profits and to identify the associated opportunities and threats. Marketing opportunities is an area of customer needs and interests in which there is a high probability that an enterprise can profitably satisfy that needs. There are two main sources of market opportunities: to supply something that is in short supply or to supply an existing good or service in a new or superior way.
The possible improvements can be uncovered by asking customers for their suggestions (problem detection method); by asking customers to imagine an ideal version of the good or service, and by asking consumers to chart their steps in acquiring, using, and disposing of a product (consumption chain method). The latest sources often leads to new good or service.
An environmental threat is a challenge posed by an unfavorable trend or development that would lead, in absence of defensive marketing action, to lower sales or profit [Stiglitz 2002]. Threats should be classified according to seriousness and probability of occurrence.
Once management has identified the major threats and opportunities facing an enterprise, it can characterize that enterprise’s overall attractiveness. It is one thing to

91
find attractive opportunities and another to be able to take advantage of them. Each enterprise needs to evaluate its strength and weaknesses by checking:
• Marketing: enterprise reputation, market share, customer satisfaction customer retention, good quality, service quality, pricing effectiveness, promotion effectiveness, sales force effectiveness, innovation effectiveness and geographical coverage;
• Finance: cost, availability of capital, cash flow, financial stability; • Manufacturing: facilities, economic of scale, capacity, able-dedicated
workforce, ability to produce on time, technical manufacturing skill; • Management: visionary and capable leadership, dedicated employees,
entrepreneurial orientation and flexible or responsible activities. M. Porter has proposed three generic strategies: overall cost leadership,
differentiation and focus [Kotler and Keller 2006]. The enterprise can work to achieve the lowest production and distribution costs so that it can price lower than its competitors and win large market share. The problem with this strategy is that other enterprises will usually compete with still lower costs and hurt the enterprise that rested its whole future cost. The enterprise might concentrate on achieving superior performance in important customer benefit area, valued by a large part of the market. It cultivates those strengths that will contribute to the intendent differentiation. The enterprise can focused on one or more narrow market segments. It gets to know these segments intimately and pursues either cost leadership or differentiation within target market.
Enterprises might also discover that they need strategic partners if they hope to be effective. Enter in foreign market may require the enterprise to license its product, form joint venture with local enterprise or buy from local suppliers to meet domestic requirements [Bartlett Beamish 2011]. Many strategic take the form of marketing alliances fall into four categories:
• Good or service alliances – one enterprise licenses another to produce its product or two enterprises jointly market their complementary products or a new product.
• Promotion alliances – one enterprise agrees to carry a promotion for another enterprise’s good or service.
• Logistics alliances – one enterprise offers logistical services for another enterprise’s product.
• Pricing collaborations – one or more enterprises join in a special pricing collaboration (hotel and rental car enterprises offer mutual price discounts). Enterprises need to give creative thought to finding partners that might
complement their strengths and offset their weaknesses. Well-manages alliances allow enterprises to obtain a greater sales impact at less cost. To keep their strategic alliances thriving, enterprises have begun to develop new organizational structures to support them and have come to view the ability to form and manage partnerships as core skills.
Impact of information technology on management Information technology (IT) is the application of computers and telecommunications equipment to store, retrieve, transmit and manipulate data, often in the context of an enterprise. The term is commonly used as a synonym for computers and computer

92
networks, but it also encompasses other information distribution technologies such as television and telephones. IT marketing professionals possess the right combination of knowledge and practical expertise to take care of both an enterprise’s information technology infrastructure and the employs who use it [Daft and Armstrong, 2015].There are software systems concern reliability, security, usability and effectiveness for marketing intended purpose. IT jobs include computer programming, network administration, computer engineering, Web development, technical support, and many other related occupations. Since we live in the "information age," information technology has become a part of our everyday lives.
IT concerns with all aspects of managing and processing information. It actually includes layers of all systems within an enterprise – from the physical hardware to the operating systems, applications, databases, storage and servers. Telecommunication technologies, including internet and business phones are also part of an IT infrastructure.
Electronic-marketing (E-marketing) is the application of information and communication technologies (ICT) in support of all the activities of enterprise. E-marketing constitutes the exchange of goods and services between businesses, groups and individuals and can be seen recently as one of the essential activities of any enterprise [Zeithamlel al. 2009]. It focuses on the external activities and relationships to inform customers, promote, and sell goods and services over internet network. E-marketing includes e-commerce and also covers internal processes such as production, inventory management, product development, risk management, finance and human resources. E-marketing strategy is more complex, focused also on cost savings and improvements in efficiency and productivity.
Electronic commerce (E-commerce) is trading in goods using computer networks, such as mobile commerce, electronic funds transfer, supply chain management, online transaction processing, electronic data interchange (EDI), inventory management systems, and automated data collection systems. It typically uses the World Wide Web for at least one part of the transaction's life cycle, although it may also use other technologies such as e-mail. It may employ online shopping web sites for retail sales direct to consumers, providing or participating in process third-party business-to-consumer (B2C) or consumer-to-consumer (C2C) sales and business (B2B) buying and selling or electronic.
E-commerce is gathering and using demographic data through web contacts and social media. It can establish customers by e-mail or fax and engaging in retail for launching new products. E-commerce covers outward-facing processes that touch customers, suppliers and external partners, including sales, marketing, order taking, delivery, customer service, purchasing of raw materials and supplies for production and procurement of indirect operating-expense items, such as office supplies. It involves new business models and the potential to gain new revenue or lose some existing revenue to new competitors.
B2B refers to a situation where one enterprise makes a commercial transaction with another. This occurs when an enterprise is sourcing materials for their production process, needs the services of another enterprise for operational reasons (e.g. an accountancy firm to audit its finance), re-sells goods and services produced by others manufacturers. Contrasting terms is business-to-government (B2G). B2C focus on retail transactions.

93
The overall volume of B2B transactions is much higher than the volume of B2C transactions. The primary reason for this is that in a typical supply chain there will be many transactions involving sub components or raw materials, and only one B2C transaction, specifically sale of the finished product to the end customer. For example, an automobile manufacturer makes several B2B transactions such as buying tires, glass for windscreens, and rubber hoses for its vehicles. The final transaction, a finished vehicle sold to the consumer, is a single (B2C) transaction.
B2B marketing techniques rely on the same basic principles as consumer marketing, but are executed in a unique way. While consumers choose products based not only on price but on popularity, status, and other emotional triggers, B2B buyers make decisions on price and potential profit. B2B involves three types of integration:
• vertical integration of front-end Web site applications to existing transaction systems;
• cross-business integration of a company with Web sites of customers, suppliers or intermediaries such as Web-based marketplaces;
• integration of technology with modestly redesigned processes for order handling, purchasing or customer service. Business-to-consumer activity exists both online and offline but the acronym
B2C has primarily been used to describe the online variety. B2C play a large role in the rapid development of free online services and discounted shopping, spurring adoption of the new medium. The digital revolution has created a whole new set of capabilities to consumers and enterprises. Consumers today can easier compere competitors prices and product attributes, exchange information and opinions. They can get answers on the internet without drive to stores and access online books, medical information, move ratings, consumer opinion and reports and other countless information sources. They can place orders from home, office or mobile 24 hours a day, 7days a week, and the orders will be delivered to their home or office quickly.
The technological progress of information lead to more accurate levels of production, more targeted communications and more relevant pricing. Customers can even name the price they want to pay for a product. Middlemen aggregating their purchases can join with others to achieve deeper volume discounts. Customers can order goods almost from anywhere in the world, which help them bypass country with very limited local offerings and achieve great savings.
Conclusion The article widened and increased knowledge about new marketing mix and comprised the strategies how to create value for target markets, and develop strong, profitable and long term relationship with customers. The hypothesis that marketing management aims not only to gain profit but also to get customers, business partners and society the value and protect the natural environment have been proven. Author’s propose for the marketing management paradigm is made up of six characteristics: knowledge, know-how, motivation, conditions, responsibility and courage.
New marketing mix, directs to market targets, consists of four parts: an offer, information, distribution channels and markets. New designation for product are such as experience, image, events, information, places and non-profit organizations. Values

94
based marketing management established, promoted and practiced an enterprise’s shared values, which originate from its culture and influence the way in which employees and customers behave. It should be highly recommended for industrial enterprises, middlemen, wholesalers as well as retailers.
In the article has been proved how an enterprise considered the strategies to create value for its target markets and develop strong profitable, long term relationship with customers. The marketing strategic plan lays out the target markets and value propositions that be offered and based on an analysis of the market opportunities. An enterprise’s sales and profits increased through backward, forward or horizontal integration with its partners. Porter’s proposal of three generic strategies: overall cost leadership, differentiation and focus plays a significant role in marketing management. Enterprises needed to give creative thought to finding partners that might complement their strengths and offset their weaknesses.
Electronic-marketing (E-marketing) not only support of all the activities of enterprise but also creates novelty value of enterprise’s marketing management. Planning and managing an enterprise’s IT infrastructure is a difficult and complex job that requires a solid foundation in applied computing as well as management and professional skills. Bigger and bigger application find in electronic commerce (E-commerce) that traded in goods using computer networks, such as mobile commerce, electronic funds transfer, supply chain management, online transaction processing, electronic data interchange, inventory management systems, and automated data collection systems – typically uses the World Wide Web. The technological progress of information lead to more accurate levels of production, more targeted communications and more relevant pricing.
The outcomes of the inquiry show how complex are todays marketing management of enterprise and proved importance of new aspects of marketing mix, created marketing strategy and role of information technology for made marketing decisions.
References AMA (2015), https://www.ama.org/AboutAMA/Pages/Definition-of-Marketing.aspx (10.30.2015) Armstrong G., Kotler Po., Trifts V., Buchwitz L. A. (2015), Marketing. An Introduction, Pearson Prentice Hall, Toronto, 5 Bartlett Ch. A., Beamish P.W. , (2011) Transnational Management, McGraw Hill, New York, 434, 511-512 Daft R. L., Armstrong A., (2015) Organization Theory and Design, NELSON Education, Toronto, 253 Kotler Ph., Keller K. L., (2006), Marketing Management, Pearson Prentice Hall, New Jersey, 56, 78 Meta Markets, 2015, http://www.marketing91.com/meta-markets/ (10.30.2015) Michalski E., 2015, Zarządzanie przedsiębiorstwem, Wydawnictwo Naukowe PWN, Warszawa, 35, 63 Michalski E., 2012, Marketing, Wydawnictwo Naukowe PWN, Warszawa, 451-453 Roy E. (2014), http://www.tradeready.ca/2014/fittskills-refresher/six-steps-creating-clear-useful-trade-research-objectives/ (12.11.2014) Stiglitz J. E., (2002), Globalization and Its Discontents, W. W. Norton, New York, 36 Zeithaml V. A, Bitter M. J., Gremler D. D., (2009), Services Marketing, McGraw Hill, Boston, 353

95
Zarządzanie marketingowe przedsiębiorstwem
Streszczenie Głównym celem artykułu jest przedstawienie jak nowa koncepcja marketingu mix wpływa na dostarczanie wartości dla nabywców i przynosi korzyści przedsiębiorstwu. Zadaniem zarządzania marketingowego jest udostepnienie dóbr i usług nabywcom wtedy kiedy są gotowi do zakupu. Przedsiębiorstwo potrzebuje trafne i aktualne informacje o nabywcach, konkurentach i nowych trendach rozwoju społeczno-gospodarczego w kraju i na świecie. Analizie poddano paradygmat zarzadzania marketingowego i proces tworzenia zarzadzania marketingowego opartego na wartościach. Następnie rozpatrzono koncepcje strategii marketingowej i analizę SWOT. Na końcu omówiono wpływ technologii informacyjnej na zarzadzanie marketingowe.
Słowa kluczowe: paradygmat, wartości, strategia, SWOT, technologia informacyjna Informacje o autorze:
prof. zw. dr hab. Eugeniusz Michalski Department of Management, Koszalin University of Technology, E. Kwiatkowskiego 6e, 74343 Koszalin, Poland, e-mail: e-mail: [email protected]
96
15 (64) 2016
Bogdan Mróz Szkoła Główna Handlowa w Warszawie
CONSUMER SOVEREIGNTY AT A TIME OF GLOBALIZATION AND ICT EXPANSION
Living in a globalized world with robustly expanding information and communications technology, the 21st century consumer is exposed to innovative business models emerging in the cyberspace. On the one hand, this offers a chance of consumer empowerment and wider choice but on the other, previously unknown issues and threats are making themselves felt, among them electronic surveillance and loss of privacy. In the present article, an attempt is made to diagnose the chances for, and threats to, consumer sovereignty resulting from globalization and swift development of new information and communications technology.
Key words: consumer sovereignty, globalization, information and communications technology.
Introduction The purpose of this article is to specify how the growth of information and communications technology (ICT) influences the extent of sovereignty of the contemporary consumer, and also to identify possible threats in this field (electronic surveillance, profiling of internet users, loss of privacy, etc). The hypothesis put forward herein is that the contemporary consumer (especially in the lower age brackets) condones the loss of privacy, regarded as a sort of currency buying access to online content, which may result in a loss of consumer sovereignty.
Source material and research methods The author critically analyses specialist literature on ICT and consumer sovereignty (books, articles, research reports, etc.), while leveraging his own experience and reflections from an array of research projects on consumer behaviour.
Results and discussion ICT's capacity to process, systematize and group enormous amounts of data in different breakdowns is very useful in creating value-added for the consumer [Sobolewska 2011]. There are a number of conditions to be met in order to develop good relations with consumers based on a skilful use of collected data, both hard (e.g. demographic numbers) and soft (e.g. psycho- and sociographic information on lifestyles and consumer behaviour). Among these conditions are the following: ● well developed marketing procedures ● capacity to easily collect names, addresses/locations and data on consumers'
shopping patterns

97
● capacity to collect repeat-purchase data upon sales ● capacity to create and browse the company's own databases ● capacity to offer customer loyalty programmes, bringing tangible benefits to both
parties [Szwarc 2010]. The need to gather detailed information about consumers reflects the
circumstance that the era of standardized marketing strategies is drawing to an end. Geodemographic specialists, profiling characteristics of populations in various geographic areas, note that consumers have been growing increasingly diverse in terms of ethnicity, income, wealth, lifestyle, embraced values, etc. As found in the 1970s by Claritas demography agency, 40 factors sufficed then to describe the lifestyles of the US population, but in the opening decade of the new millennium that number rose to 66 [Rigby and Vishwanath 2006].
Retailing has been the scene of tremendous technology change, from credit/debit card readers at point of sale (POS), to data mining software, to online sales, to radio-frequency identification (RFID) which uses chips to pinpoint and track tags attached to objects. As a result, merchants can access valuable data about local preferences and consumer behaviours, immediately identify differences between the structures of supply and demand in particular outlets, and swiftly react to make corrections bringing their offer in line with consumer requirements.
The US retailing giant Wal-Mart, in a search to establish the right pattern of supplies to its stores, uses a huge date base of its the Retail Link software, making it possible for local managers to go through a two-year history of daily sales of any product in any of the chain's outlets. Leveraging Retail Link, Wal-Mart and its suppliers can generate maps of local demand, indicating when and where a given product should be included in their offer. At the beginning of the first decade of the 21st century, Wal-Mart had only five planograms (schematic diagrams showing how products should be shelved) to align its soup offer with local preferences. Five years later, the chain and its suppliers had as many as two hundred carefully designed planograms for this purpose. The system is also used by producers, as a tool to monitor sales and inventories at Wal-Mart stores and distribution centers, and also develop pricing and marketing programmes to drive sales [Rigby and Vishwanath 2006].
In seeking to understand changes in consumer behaviours and quickly respond to new trends, the key to success is harnessing technology to collect consumer big data, process these data and use them for marketing purposes – which requires having effective in-house analytical departments and engaging with specialist agencies for market insights, marketing analytics, database storage, information processing, etc. Managements and marketing staffs today have access to huge amounts of consumer data, but they not always know how to handle this treasure. The “data flood” is a tough challenge that must be taken head-on by pretenders to a leading market position. This is how the US statistician Nate Slater describes the problem: “Every day, three times per second, we produce the equivalent of the amount of data that the Library of Congress has in its entire print collection. Most of it is…irrelevant noise. So unless you have good techniques for filtering and processing the information, you’re going to get into trouble” [Nichols 2013].
An example of a company whose business models draw on consumer data and refined analytical tools is Netflix, a provider of on-demand internet streaming TV and

98
films, with an offer adjusted to internet users' personalized tastes and preferences. And Yahoo has acquired a data mining operator, whom the company tasked with researching correlations between the content of pages viewed by visitors (including advertising content) and the interest of internet users, as reflected e.g. in click-through rates.
Another way of leveraging technology to meet consumer needs has been employed by the UK company Tesco, which after entering the South Korean market faced problems caused by limited opportunities for expansion in the conventional distribution channel and a much smaller number of retail outlets as compared with the market leader. Upon closer scrutiny of local lifestyles and daily routines of in-a-hurry consumers, the company hit the nail right on the head: it installed virtual stores at subway stations, where commuters waiting for their trains can make a picture of selected items with their smartphone, and then order home delivery [Solon 2011].
Companies relying on one-on-one marketing collect information about their customers and then contact each one individually to create lasting personalized commercial relations. These customers themselves provide their data to the company, which may gain insight in a variety of ways, including: ● registration forms (completed while requesting a newsletter, opening a user
account, etc.) ● questionnaires ● monitoring of shopping history and pages viewed by internet users ● statistics of website traffic ● reading comments and opinions on chat forums ● feedback monitoring and customer engagement systems (e.g. sugester.pl,
uservoice.com) ● tracking click streams for e-mailed links ● e-mail communications [Szwarc 2010].
All these methods can be applied individually or in combination. With professional management of customer relations, the company gets previous information about the behaviour, preferences, expectations and unfulfilled requirements of its clientèle. An in-depth analysis of these characteristics is a sine qua non condition for effective marketing, thus enabling the company to quickly respond to the changing consumer expectations by adjusting its offer accordingly. At this time of fast changing market trends, customer data must be collected on a regular basis, as only in this way can the changes be identified and handled on time.
Special kind of insight – increasingly appreciated, because it is hard to obtain or entirely unavailable elsewhere – is provided by social networking services, offering communication channels for people gathered around common interests. Their users contribute contacts and connections (the so-called media graph), and can themselves meet new acquaintances. Mechanisms involving other kinds of knowledge, such as chat forums, are also involved in these services, but it is the cumulative “relationship capital” – a network of friends, translating into user numbers – which determines why a certain site overtakes others and pulls companies, advertisers and other entities [Doligalski 2009].
One such website, with over one billion registered users worldwide, is Facebook – a powerful marketing tool, where plenty of information about users is provided by the users themselves (e.g. while preparing and updating their profiles), thus

99
making it much easier to personalize offers and align the advertising message with user requirements and expectations. For example, if a user posts a photo from a skiing outing, or writes about it, it is very likely that an advert from a skiing gear and accessories shop will soon appear on his or her profile. Which adverts go there – taking up no more than a dozen or so percent of overall content – is determined by the Facebook algorithm known as EdgeRank [Miłosz 2013].
While offering internet users access to seemingly unbounded knowledge, a multitude of thrills and attractions, online shopping, etc., the cyberspace also poses threats which enthralled technology fans may easily overlook or neglect. Technology makes life easier, offering previously unknown opportunities for peer-to-peer communications (as reflected in the explosion of social networking) but also for business-to-people interactions. Companies have been handed a new, sophisticated tool to collect data about buyers of their products and services, with typical behavioural patterns being automatically identified and analyzed by servers, with the use of advanced data mining techniques. This process has revealed its added dimension when a recently published study found that 45% of the 185 most popular US websites share user data with other internet portals and services [Husak 2013].
Insights into the behaviour of online shoppers who use social media and engage in other kinds on web activity are “marketing munitions” for providers of various goods and services, who take advantage of the fast developing innovative software for network user profiling. Cyberspace marketing makes possible an interactive communication with customers, to whom a personalized offer can be presented, based on consumer data which were previously collected, processed and applied. The profiling of website users can yield marketing-worthy information about their preferences, skills, social and occupational status, finances, aspirations, requirements, interests, etc. which can be put to use with specialist online marketing tools.
User profiling can be open, drawing on registration questionnaires where the users themselves determine the extent and reliability of the information provided, or it can be hidden, where users' behaviours and reactions are watched on the visited websites, online stores, social networking services, etc., and then recorded using log files, cookies, session tracking modules, etc. [Husak 2013].
Typically, the collected user data are about demographics, knowledge and skills, interests, plans, preferences and patterns of online behaviour (e.g. using price comparison sites, appraisal and recommendation systems, etc.), which makes it possible to come up with highly accurate marketing offers and personalized promotional messages. This behavioural targeting, while arming marketers with a new weapon, also breeds potential threats to web users' privacy, personal data protection and, in fact, their sovereignty. In April 2012, Visa applied for a patent for a technology to profile credit card holders, based not just on transaction history but also information from social networking media and insurance companies, which would produce more refined profiling and improved offer personalization. More than that, Visa and MasterCard, the two largest payment systems, have plans to integrate their databases. The merging of transaction history on individual accounts with the account holder's personal data will create an ideal package for potential advertisers, setting the stage for an exchange of customer insights with marketing firms – a prospect which raises concerns among NGOs and institutions tasked with the protection of personal data [Husak 2013].

100
New profiling opportunities are also arising in respect of mobile phone users. With a technology developed by he UK company Path Intelligence, shopping malls in Europe, Australia and the United States can track shoppers' movement with the accuracy of a couple of meters, learning how much time an average visitor spends in a store, how many shoppers also visit other establishments, etc. – a kind of information which can be used in merchandising activity and promotional campaigns. But such hidden surveillance, which doubtless pleases marketers and distributors, is not necessarily to the liking of the consumers, because it poses a threat to their privacy and decision-making sovereignty.
What makes the highly personalized consumer offers possible is the collecting, analyzing and leveraging of big data (involving demography, socio- and psychography, click streams, etc.). Referred to as the “next best offers”, they nudge consumers towards specific products and services. One case in point are Microsoft's e-mail offers (directing users to the Bing browser) which instantaneously get adjusted to the customer profile upon opening. In the space of 0.2 second, advanced analytical software presents an offer based on the latest information about the customer's location, age, gender, cyberspace activity (past and most recent), etc. [Davenport, Dalle Mulle and Lucker 2012-2013].
The “next best offers” (also known as predictive offers) target the customers who have already bought the company's products or services, those who will likely get hooked and make another purchase. In designing these offers the so-called predictive models are drawn upon, to get the highest possible probability of achieving a certain outcome.
The customer profiling tools may serve a number of company goals, including higher profitability, better competitive position, increased customer loyalty, etc. In Tesco's strategy of its next best offers, the emphasis has been on increasing sales to regular customers and tightening their loyalty via personalized Clubcard vouchers [Davenport, Dalle Mulle and Lucker 2012-2013]. The Clubcard programme tracks customer data (which Tesco stores they visit, which products they buy, how they pay), thus allowing the retail chain to adjust its offer to local tastes and diversify it between individual outlets of various formats (from small convenience stores to hypermarkets). For example, a Clubcard programme participant buying nappies for the first time will be mailed vouchers not only for that particular item, but also for paper tissues and children's toys [Rust, Moorman and Bhalla 2010-2011]. Tesco has also been experimenting with the so-called flash sales to make its next best offers even more tempting to selected clients. They are issued with vouchers of up to thrice the standard value, but there are also stricter redemption deadlines, with a clock ticking and showing how much time and how many products are left before the offer expires, cranking up suspense and goading customers to respond quickly, just as the company expects them to do [Davenport, Dalle Mulle and Lucker 2012-2013].
Some information needed to prepare bespoke offers is relatively easy to get (age, gender, children, address, income, assets), but other data are more difficult to reach and have to be obtained, for example, via loyalty programmes (such as Clubcard). With access to a customer's shopping history and behavioural analytics, the company can predict his or her next purchase with a fair level of probability. Data have also been obtained from increasingly accessible social, mobile and location (SoMoLo) sources. In designing their offers, more and more companies take into consideration the customer's

101
current location, their interests as revealed by social media entries, and even the purchases made and topics discussed by their online friends. The personalized offers of Foursquare company, for example, reflect the frequency with which a given retail outlet has been visited. In a search for the best methods of turning SoMoLo data into marketing tools, the top US retailer Wal-Mart has set up a digital strategy department (@WalmartLabs) and engaged in acquisitions of social media technology start-ups. One of the new department's priorities is to develop ways of predicting customer purchases based on insights into their interests, opinions and views revealed on social media. As some consumer rights organizations point out, this opens the door to discreet manipulation of consumer behaviour, posing a threat to their sovereignty as decision-makers. In this context, the ancient Roman warning caveat emptor! is assuming a new, contemporary importance.
The popular coffee shop chain Starbucks draws on no less than ten electronic channels to send personalized offers, measure the degree of customer satisfaction, and learn the frequency of their response, in order to develop concepts of new products, to be supported by its brand ambassadors. Using a Starbucks application, smartphone users can receive personalized offers of discounts on purchases of food, drinks and other items, wholly based on data from social, mobile and location sources [Davenport, Dalle Mulle and Lucker 2012-2013].
The clothing retailer H&M, operating in the fast fashion sector, has teamed up with the producer of MyTown online game to collect and use location data about potential customers. When these play MyTown on a mobile device in the vicinity of an H&M store and log in using this device, the company rewards them with virtual clothes and points, and if they scan promoted articles at a shop they enter a lottery. Early results are fairly encouraging: among the 700,000 customers who logged in, nearly 43% (300,000) visited the shop and scanned a product [Davenport, Dalle Mulle and Lucker 2012-2013].
Useful marketing software, developed by Sense Networks, compares data on a particular customer's movements with billions of data on changing locations and features of other customers. Based on a customer's mobility history the software can estimate their age, income/affluence level, travelling patterns and, importantly, their probably next location.
These examples of how consumer-related data are collected and put to marketing use, drawing on sophisticated information and communications technology, demonstrate that new, more refined customer insight tools have come into the picture, helping companies to align their offers with consumer requirements and expectations, thus winning a competitive advantage.
R.H. Thaler and W. Tucker also point to the other side of the coin: government agencies and companies can and should arrange for smart disclosure of big data collections to the consumers, thus helping them with going through multitudes of market offers and with making right choices. This would be achieved using smart choice engines, allowing consumers to instantaneously obtain the requested information via smartphone applications. The two authors give the example of Tesco, which plans to launch a service through which consumers holding loyalty cards would get access to their shopping history and to a number of other functionalities, such as rational planning

102
of purchases. Tesco intends to open company data bases to consumers even before government issues the relevant regulations [Thaler, Tucker 2013].
Conclusions The rise of the internet has triggered a revolution not only in business-consumer relations, but also in mutual contacts among the consumers themselves. Online communities have been emerging for users of a given brand to share their experiences, which – while promoting durable emotional engagement with the company – also makes it possible to gather invaluable consumer insights, extremely hard to obtain otherwise (or not available at all).
By collecting data about internet users companies can learn their preferences and expectations, which opens the way to employing subtle segmentation techniques, profiling consumers, anticipating their behaviours and eventually to providing them with the right value-added mix.
But it is hard to dismiss the thought that what this brave new digital world has to offer is not only a blessing for the consumer. The price consumers pay for having company offerings better aligned with their requirements and expectations is the loss of privacy, the threat of electronic surveillance, and exposure to sophisticated techniques of invisible velvet manipulation by omnichannel providers of goods and services. Consequently the sovereignty of the consumer, which the growth of information and communications technology would be expected to promote, may in many instances turn out to be illusory.
References Davenport, Th.H., Dalle Mulle L., Lucker J., 2012-2013. Poznaj potrzeby klientów wcześniej niż oni sami [Learn customers' requirements earlier than they do], Harvard Business Review Polska, December-January, 116-125. Doligalski T., 2009. Społeczne uwarunkowania marketingu w Internecie i e-biznesu [Social determinants of online marketing and e-business], e-mentor 1, 82-87. Husak, Z. 2013. Zagadnienie gromadzenia danych o użytkownikach portali internetowych na potrzeby profilowania marketingowego [Collection of website user data for profiling purposes], in : Współczesne uwarunkowania promocji i reklamy [Contemporary determinants of promotion and adertising], ed. by A.J. Kukuła, Difin Warszawa, 90-102. Miłosz M., 2013. Krótki poradnik e-konsumenta [A concise guidebook for the e-consumer], Dziennik Gazeta Prawna, 8–10 February. https://edgp.gazetaprawna.pl/wydanie/52892,8-lutego-13-nr-28.html, accessed: 12 October 2015. Nichols, W., 2013. Advertising Analytics 2.0, Harvard Business Review, March, 62-63. Rigby D.K., Vishwanath V., 2006. Między standaryzacją a lokalnym dostosowaniem: rewolucja na rynkach konsumenckich [Between standardization and local alignment: a revolution on consumer markets], Harvard Business Review Polska, June, 90-103. Rust R.T., Moorman Ch., Bhalla G., 2010-2011. Zmiana podejścia do marketingu [A change in approach to marketing], Harvard Business Review Polska, December-January, 60-71. Szwarc N., 2010. Od masowej komunikacji marketingowej po personalizację w e-marketingu [From mass marketing communication to personalization in e-marketing , e-mentor, 3, 75-81. Sobolewska S., 2011. Pozyskiwanie i wykorzystanie wiedzy klienta - możliwości i ograniczenia [Gathering and making use of customer insights – opportunities and constraints], Studia i Materiały Polskiego Stowarzyszenia Zarządzania Wiedzą, 50, 154-165.

103
Solon O., 2011. Tesco Brings the Supermarket to Time-Poor Commuters in South Korea, Wired, 30 June. http://www.wired.co.uk/news/archive/2011-06/30/tesco-home-plus-billboard-store, accessed: 26 October 2015. Thaler R.H., Tucker W., 2013. Smarter information, smarter consumers, Harvard Business Review, January-February, 44-54.
Suwerenność konsumenta w dobie globalizacji i rozwoju nowych technologii informacyjno-komunikacyjnych
Streszczenie.
Konsumenci XXI wieku żyją w epoce globalizacji i dynamicznego rozwoju nowych technologii informacyjno-komunikacyjnych owocujących m.in. pojawieniem się innowacyjnych modeli biznesowych w przestrzeni wirtualnej. Z jednej strony daje to szansę upodmiotowienia konsumentów i zwiększenia zakresu ich swobody wyboru, z drugiej – stwarza nieznane wcześniej problemy i zagrożenia, związane m.in. z elektroniczną inwigilacją, utratą prywatności itp. W artykule podjęto próbę diagnozy szans i zagrożeń dla suwerenności konsumentów wynikających z procesów globalizacji i szybkiego rozwoju nowych technologii informacyjno-komunikacyjnych.
Słowa kluczowe: suwerenność konsumenta, globalizacja, nowe technologie informacyjno-komunikacyjne.
Informacje o autorze:
prof. dr hab. Bogdan Mróz Szkoła Główna Handlowa w Warszawie, Kolegium Zarządzania i Finansów, Instytut Zarządzania, Zakład Badań Zachowań Konsumentów, ul. Madalińskiego 6/8, 02-513 Warszawa, e-mail: [email protected].

104
15 (64) 2016
Agata Niemczyk Uniwersytet Ekonomiczny w Krakowie
FREE TIME AS A DETERMINANT OF ECONOMIC DEVELOPMENT
CULTURAL CONTEXT
Czas wolny jako czynnik rozwoju gospodarczego kontekst kulturowy
The article presents the results of the analysis of the interplay between free time and economic development of a region. Since culture is one of the ways of spending one’s free time, the main objective of this article is the presentation of interdependencies between the level of development of the cultural function of a region and the level of its economic development. Published GUS data referring to Polish voivodships were used and their availability set the timeframe of the research which covered the years 2005 – 2013. Theoretical considerations describing the relation between free time and economic development were preceded by empirical analyses.
Key words: free time, economic development, voivodship, cultural function of regions
Introductions It cannot be denied that a region’s economic development is shaped by many factors. Free time, amongst these factors is the one with a significant role. On the other hand, this factor per se is determined by the economic development. Thus the relation between both categories is mutual. The term free time is capacious and refers to different spheres of leisure management – including participation in culture. The above provided the grounds for drawing attention to the region’s cultural function, which is the phenomenon not yet considered in the literature on the subject.
The purpose of this article is to show the interdependency between free time and economic development of a region, and since culture is one of the ways of spending one’s free time, the main objective of this article is the presentation of interdependencies between the level of development of the cultural function of a region and the level of its economic development. The main purpose defined in such way allowed formulation of the following specific objectives: 1) presentation of free time categories and culture as one of the forms of spending it; 2) description of relationships emerging between free time and economic development; 3) creation of the indicators for: cultural function and economic development of Polish voivodships; 4) identification of direction and strength of dependency between the cultural function of Polish voivodships and the level of their economic development.
The following questions were raised in this context:

105
1. Which of the researched voivodships reported the strongest interdependency between the level of development of the region’s cultural function and the level of its economic development?
2. Are the changes in the level of development of the region’s cultural function revealed in the researched period in particular voivodships proportionate to the changes in the level of economic development of these regions (e.g. did they keep the role of a leader; has the distance between the strongest and weakest voivodships decreased in this respect?)
In order to achieve the objectives, the literature review and results of own research conducted on the published GUS data were used. The availability of the latter set the timeframe of the studies which covered the years 2005-2013.
Theory and background Free time is an essential element of each individual’s life. Growing interest in free time comes from a belief that it plays a significant role in social and economic processes. Free time in its “pure” form1 is understood as either specific set of behaviour applied during free time2 or a state of mind3. According to M. Bombol “free time is the time when one can project their own ability to work and also the time of consumption of disposable income from work during both working life and after”4.
As economic category free time should be considered in terms of market system, namely5 demand-for-free time market, free time-creating market and free time-serving market; it may be used for tourism, culture, sport and other forms which match one of the distinguished markets, that is free time-serving market. More precisely, the following ways of taking advantage of free time are singled out:
− participation in culture: 1) getting into physical contact with material carriers of cultural content and values (books, paintings) by purchasing or borrowing them and while reading, listening, looking at and collecting them; 2) visiting facilities, institutions and cultural facilities (theatres, operas, operettas, philharmonics [stage culture], cinemas, museums, exhibitions, etc.); 3) watching television and listening to the radio, watching films on DVDs and Blu-Ray, using VOD service and the like; 4) using the Internet and other forms of digital data transmission (culture through computer and mobile devices, so called virtualisation of culture)6;
− participation in entertainment; − participation in sport and active recreation;
1 E.g. S. Simpson, C. Yoshioka: Aristotelian view of leisure: An outdoor recreation perspective. Leisure Studies 11/1992, pp. 219-231. 2 E.g. D. Looseley: Joffre Dumazedier, Toward a society of leisure. International Journal of Cultural Policy 16(1)/2010. 3 E.g. P. Heintzman, R.C. Mannell: Spiritual function of leisure and spiritual well being: Coping with time pressure. Leisure Science 25/2003, pp. 207-230. 4 M. Bombol: Czas wolny jako kategoria diagnostyczna procesów rozwoju społeczno-gospodarczego.. Monografie i Opracowania 555. SGH, Warsaw 2008, pp. 16-17. 5 A. Niemczyk: Turystyka – sposób na zagospodarowanie czasu wolnego (na przykładzie mieszkańców powiatu nowosądeckiego. Handel Wewnętrzny 4/2013., pp. 131-142. 6 A. Niemczyk: Wirtualizacja kultury. Świat Marketingu 6/2008. http://www.swiatmarketingu.pl/index.php?rodzaj=01&id_numer=627349 [Accessed: 04.2015].
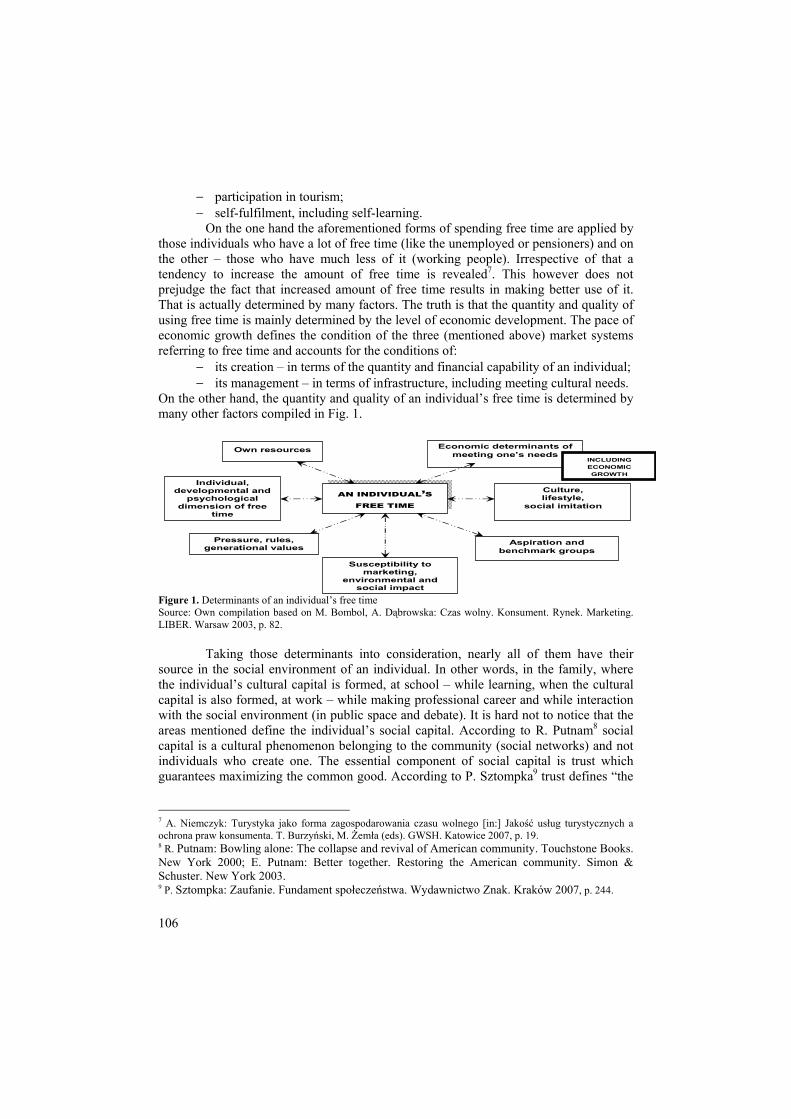
106
− participation in tourism; − self-fulfilment, including self-learning.
On the one hand the aforementioned forms of spending free time are applied by those individuals who have a lot of free time (like the unemployed or pensioners) and on the other – those who have much less of it (working people). Irrespective of that a tendency to increase the amount of free time is revealed7. This however does not prejudge the fact that increased amount of free time results in making better use of it. That is actually determined by many factors. The truth is that the quantity and quality of using free time is mainly determined by the level of economic development. The pace of economic growth defines the condition of the three (mentioned above) market systems referring to free time and accounts for the conditions of:
− its creation – in terms of the quantity and financial capability of an individual; − its management – in terms of infrastructure, including meeting cultural needs.
On the other hand, the quantity and quality of an individual’s free time is determined by many other factors compiled in Fig. 1.
AN INDIVIDUAL’S
FREE TIME
Own resources
Individual, developmental and
psychological dimension of free
time
Pressure, rules, generational values
Aspiration and benchmark groups
Culture, lifestyle,
social imitation
Economic determinants of meeting one’s needs
Susceptibility tomarketing,
environmental and social impact
INCLUDING ECONOMIC GROWTH
Figure 1. Determinants of an individual’s free time Source: Own compilation based on M. Bombol, A. Dąbrowska: Czas wolny. Konsument. Rynek. Marketing. LIBER. Warsaw 2003, p. 82.
Taking those determinants into consideration, nearly all of them have their
source in the social environment of an individual. In other words, in the family, where the individual’s cultural capital is formed, at school – while learning, when the cultural capital is also formed, at work – while making professional career and while interaction with the social environment (in public space and debate). It is hard not to notice that the areas mentioned define the individual’s social capital. According to R. Putnam8 social capital is a cultural phenomenon belonging to the community (social networks) and not individuals who create one. The essential component of social capital is trust which guarantees maximizing the common good. According to P. Sztompka9 trust defines “the
7 A. Niemczyk: Turystyka jako forma zagospodarowania czasu wolnego [in:] Jakość usług turystycznych a ochrona praw konsumenta. T. Burzyński, M. Żemła (eds). GWSH. Katowice 2007, p. 19. 8 R. Putnam: Bowling alone: The collapse and revival of American community. Touchstone Books. New York 2000; E. Putnam: Better together. Restoring the American community. Simon & Schuster. New York 2003. 9 P. Sztompka: Zaufanie. Fundament społeczeństwa. Wydawnictwo Znak. Kraków 2007, p. 244.

107
most precious form of social capital”. F. Fukuyama10 assumes that the level of trust between the residents of a town determines social and economic development and the ability to compete with other countries. According to this author social capital is created by the cultural mechanisms such as religion, tradition and historical aspects. The mechanisms of culture shall define the cultural capital identified as “social position of a family environment where the socialization process of an individual (so called social background) and mental well-being were taking place”11. Cultural capital may be shaped by participation in culture, as A. Kłoskowska12 says, the participation in three systems of culture including institutionalized participation (the second system of culture) and media participation (the third system of culture). Obviously, using free time is not limited to culture, and the socialization process (see Fig. 2) lasts throughout the whole life of a person and is also expressed by either tourist or recreational and sports activities.
ECONOMIC GROWTH
SOCIAL CAPITAL
FREE TIME
CULTURAL CAPITAL
HUMAN CAPITAL
the ability to cooperate with other people within groups
and organisations in order to achieve personal objectives
habits, abilities acquired through socialization –
e.g. using cultural institutions
knowledge, abilities, skills and other individual attributes which facilitate creation of personal, social and economic well-being
Knowledge-based economy
Figure 2. Dependencies between free time, cultural capital and economic development Source: Own compilation based on: J. Czapiński: Kapitał ludzki i kapitał społeczny a dobrobyt materialny: polski paradoks. Zarządzanie Publiczne 4/2008; The Well-being of Nations, The Role of Human and Social Capital. 2001. OECD Publishing, p. 18.
In light of the above it should be stressed that: − economic development has an impact on free time of an individual; − quantity and quality of an individual’s free time are shaped by cultural capital
(socialization process in relation to cultural institutions);
10 F. Fukuyama: Zaufanie. Kapitał społeczny a droga do dobrobytu. PWN. Warsaw-Wrocław 1997, p. 39. 11 J. Czapiński: Kapitał ludzki i kapitał społeczny a dobrobyt materialny: polski paradoks. Zarządzanie Publiczne 4/2008. 12 A. Kłoskowska: Socjologia kultury. Wydawnictwo Naukowe PWN. Warsaw 2007.
108
− quantity and quality of an individual’s free time is shaped by reciprocal relationship between the members of a group (social capital), which the individual belongs to.
On the other hand, it is explicitly noticed that the quantity and quality of particular individual’s free time and thus the societies shall have impact on the economic development (see Fig. 2). It is prejudged by the fact that social and cultural capital which is related to the individual’s free time influences its human capital (in the context of the previous considerations it is noted that also the human capital is shaped by economic development). According to B. Mikuła human capital “consists of joint resources whose carriers are people themselves, in particular knowledge, health, values, norms, attitudes, opinions, and the like”13. The theory of human capital was discussed by numerous economists. The one particulaly worth mentioning is the opinion of G. Becker who attempted to prove that the resources of knowledge, capabilities and health embodied in each person already constitute the human capital. Each person’s ability to work and earn derives from these resources therefore they become the source of satisfaction in terms of being a consumer. Broad investment in human capital according to Becker means “all activities that have impact on the future financial and physical income by increasing the resources in people”14.
In knowledge-based economy typical of the 21st century, the key to success is human capital. According to A. Koźmiński “knowledge-based economy is such economy where many enterprises run their activity and whose competitive advantage is based on knowledge”15. This definition was complemented by A. Bylicki with the following words: “where the mechanisms leading to the use of knowledge as means of increasing the competitiveness of enterprises work”16. Taking into consideration the source of competitive advantage it can be stated that knowledge-based economy is an economic system which uses its economic potential related to intellectual potential of the employees; the condition of intellectual potential is in a way determined by quantity and quality of spending free time.
Last but not least, free time is the time of consumption. “The societies could purchase and consume more, if they had more free time to spare. Free time influences consumption in a similar way as income. The more income an individual has, the higher their consumption might become, and so the standard of living”17.
Summing up, it can be stated that free time is a factor shaping economic development. As M. Bombol says “free time facilitates and accompanies the processes of development of both the individual and the society, and processes of economic development”18. Considering the fact that culture is one of the spheres of free time 13 B. Mikuła: Relacje jako element kapitału ludzkiego [in:] Budowanie relacji w zarządzaniu zasobami ludzkimi. J.S. Kardas (ed.). Wydawnictwo Studio Emka. Warsaw 2009, p. 93. 14 G. Becker: Human Capital, New York 1975, p. 9. 15 A. Koźmiński: Jak tworzyć gospodarkę opartą na wiedzy? [in:] Strategia rozwoju Polski u progu XXI wieku, Kancelaria Prezydenta RP i Komitet Prognoz Polska 2000 Plus. PAN. Warsaw 2001, p. 87. 16 A. Bylicki: Uwagi dotyczące realizacji w Polsce programu budowy gospodarki opartej na wiedzy [in:] Gospodarka oparta na wiedzy. Perspektywy Banku Światowego. A. Kukliński (ed.) Scholar. Warsaw 2003, p. 123. 17 C. Bywalec, L. Rudnicki: Konsumpcja. PWE. Warsaw 2002, p. 72. 18 M. Bombol: Czas wolny jako kategoria diagnostyczna procesów rozwoju społeczno-gospodarczego. Monografie i Opracowania 555. SGH, Warsaw 2008, p. 21.
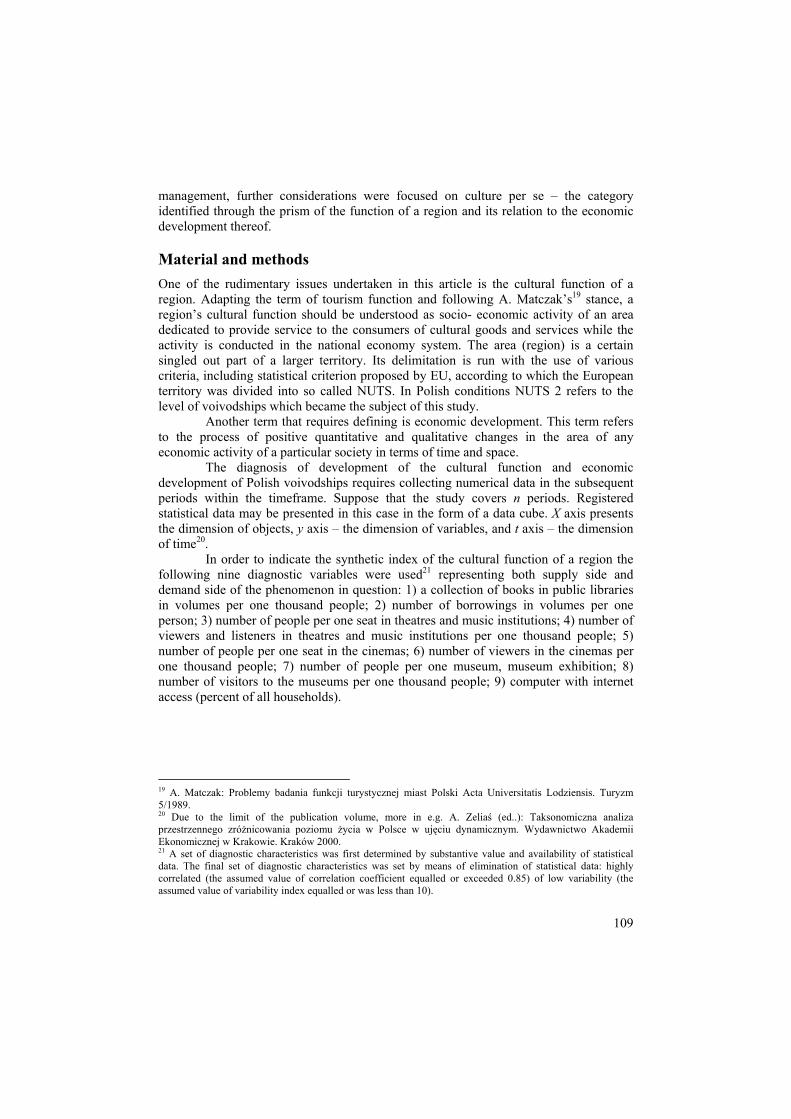
109
management, further considerations were focused on culture per se – the category identified through the prism of the function of a region and its relation to the economic development thereof.
Material and methods One of the rudimentary issues undertaken in this article is the cultural function of a region. Adapting the term of tourism function and following A. Matczak’s19 stance, a region’s cultural function should be understood as socio- economic activity of an area dedicated to provide service to the consumers of cultural goods and services while the activity is conducted in the national economy system. The area (region) is a certain singled out part of a larger territory. Its delimitation is run with the use of various criteria, including statistical criterion proposed by EU, according to which the European territory was divided into so called NUTS. In Polish conditions NUTS 2 refers to the level of voivodships which became the subject of this study.
Another term that requires defining is economic development. This term refers to the process of positive quantitative and qualitative changes in the area of any economic activity of a particular society in terms of time and space.
The diagnosis of development of the cultural function and economic development of Polish voivodships requires collecting numerical data in the subsequent periods within the timeframe. Suppose that the study covers n periods. Registered statistical data may be presented in this case in the form of a data cube. X axis presents the dimension of objects, y axis – the dimension of variables, and t axis – the dimension of time20.
In order to indicate the synthetic index of the cultural function of a region the following nine diagnostic variables were used21 representing both supply side and demand side of the phenomenon in question: 1) a collection of books in public libraries in volumes per one thousand people; 2) number of borrowings in volumes per one person; 3) number of people per one seat in theatres and music institutions; 4) number of viewers and listeners in theatres and music institutions per one thousand people; 5) number of people per one seat in the cinemas; 6) number of viewers in the cinemas per one thousand people; 7) number of people per one museum, museum exhibition; 8) number of visitors to the museums per one thousand people; 9) computer with internet access (percent of all households).
19 A. Matczak: Problemy badania funkcji turystycznej miast Polski Acta Universitatis Lodziensis. Turyzm 5/1989. 20 Due to the limit of the publication volume, more in e.g. A. Zeliaś (ed..): Taksonomiczna analiza przestrzennego zróżnicowania poziomu życia w Polsce w ujęciu dynamicznym. Wydawnictwo Akademii Ekonomicznej w Krakowie. Kraków 2000. 21 A set of diagnostic characteristics was first determined by substantive value and availability of statistical data. The final set of diagnostic characteristics was set by means of elimination of statistical data: highly correlated (the assumed value of correlation coefficient equalled or exceeded 0.85) of low variability (the assumed value of variability index equalled or was less than 10).

110
In order to calculate the synthetic index of economic development22 of a region the following five diagnostic variables were used, namely: 1) the number of natural persons running business activity per one hundred people at working-age; 2) investment outlays per one resident in PLN; 3) expenditures on R&D per one person in PLN; 4) the value of fixed assets per one person in PLN; 5) sold production of industry per one person in PLN.
In the analysed set of diagnostic characteristics one can find the values of different direction of impact on the studied subject. In order to gain comparability of the input variables the procedure of so called normalisation was applied and the formula for ratio-metric transformation23.
Results and discussion Pertinent calculations based on empirical data obtained from the published GUS data, i.e. from the GUS Bank of Local Data and Statistical Yearbook for Voivodship allowed calculating the synthetic index of the level of cultural function’s development of the Polish voivodships under study in 2003-2013. Detailed data is presented in Table 1. Basing on it, it is concluded that the leader region in terms of cultural function in the studied period was the Voivodship of Mazovia. At the other end in this respect was the Voivodship of Lublin in both the first and the last year of the study. The distance between the values of the synthetic index of the level of cultural function’s development in the region with the highest index in this respect and the lowest – increased. If in 2005 this distance was 0.258, in 2013 it was 0.349.
Table 1. The synthetic index of the level of cultural function’s development of Polish voivodships in the years 2003-2013 Voivodship 2005 2006 2007 2008 2009 2010 2011 2012 2013 The Voivodeship of Lower Silesia 0.515 0.546 0.587 0.640 0.663 0.657 0.640 0.643 0.681
The Voivodeship of Cuiavia & Pomerania 0.473 0.492 0.525 0.560 0.575 0.574 0.584 0.591 0.603
The Voivodeship of Lublin 0.383 0.394 0.424 0.440 0.458 0.459 0.467 0.466 0.484
The Voivodeship of Lubusz 0.429 0.438 0.436 0.520 0.568 0.537 0.532 0.563 0.625
The Voivodeship of Łódź 0.435 0.476 0.490 0.497 0.524 0.529 0.548 0.552 0.562 The Voivodeship of Lesser Poland 0.612 0.630 0.651 0.677 0.706 0.717 0.734 0.711 0.731
22 The set of diagnostics characteristics in this case was limited to the ones included in the context. The author is familiar with the wide spectrum of characteristics describing a broader phenomenon of socio-economic development covering inter alia the availability of cultural services. See: A. Niemczyk, T. Zacłona:. Funkcja turystyczna polskich makroregionów w aspekcie społeczno-ekonomicznym pierwszej dekady członkostwa w UE, [in:] Gospodarka turystyczna w regionie. Przedsiębiorstwo. Samorząd. Współpraca, red. A. Rapacz, Prace Naukowe Uniwersytetu Ekonomicznego we Wrocławiu nr 379, Wrocław 2015, s. 13-22. However here they are treated separately in the form of the features describing the cultural function of regions. Therefore, the focus was only on the economic development identified through the prism of the variables included in the content. 23 D. Strahl: Taksonomia struktur w badaniach regionalnych. Wydawnictwo Akademii Ekonomicznej we Wrocławiu. Wrocław 1998.

111
The Voivodeship of Mazovia 0.641 0.655 0.681 0.713 0.729 0.759 0.777 0.782 0.833
The Voivodeship of Opole 0.443 0.443 0.459 0.491 0.497 0.492 0.512 0.517 0.545
The Voivodeship of Sub-Carpathia 0.427 0.440 0.450 0.468 0.487 0.496 0.511 0.523 0.535
The Voivodeship of Podlassia 0.450 0.483 0.508 0.565 0.568 0.569 0.574 0.609 0.623
The Voivodeship of Pomerania 0.584 0.611 0.638 0.649 0.644 0.625 0.673 0.672 0.717
The Voivodeship of Silesia 0.508 0.549 0.579 0.601 0.619 0.620 0.621 0.623 0.618
The Voivodeship of Kielce 0.412 0.423 0.428 0.463 0.483 0.490 0.498 0.530 0.549
The Voivodeship of Varmia and Masuria 0.442 0.451 0.462 0.493 0.516 0.521 0.511 0.515 0.537
The Voivodeship of Greater Poland 0.506 0.541 0.559 0.574 0.589 0.598 0.608 0.614 0.617
The Voivodeship of Western Pomerania 0.513 0.524 0.515 0.530 0.542 0.553 0.555 0.560 0.561
Source: Own research.
Moreover, the undertaken study allowed noticing that in the whole analysed period, the fastest rate of changes in the development of the cultural function (measured by means of the geometric average of chain indices of dynamics) was observed in the Voivodships of Lubusz and Podlassia, respectively: 4.8% and 4.2% (see Fig. 3). The rate of these changes was by 1.2-1.4 percentage points higher than the average rate of changes for all the voivodships under study (3.0%). On the other hand, the lowest index in this respect was observed in the Voivodship of Western Pomerania, i.e. 1.1%.
When analysing the synthetic index of the level of economic development of Polish voivodships in 2005-2013 (see Table 2), growing dynamics is observed after 2009. As in the case of cultural function, the voivodship with the highest synthetic index of the level of economic development occurred to be the Voivodship of Mazovia. The situation is slightly different for the voivodships with the lowest indices in this respect. If the ranking list in 2005 was closed by the Voivodship of Lublin, in 2013 it was the Voivodship of Varmia and Masuria, which reached the index higher than the last but one on the list – the Voivodship of Lubusz only by 0.01.
Table 2. The synthetic index of the level of economic development of Polish voivodships in the years 2005-2013 Voivodship 2005 2006 2007 2008 2009 2010 2011 2012 2013 The Voivodeship of Lower Silesia 0,384 0,467 0,521 0.551 0.564 0.583 0.623 0.659 0.674 The Voivodeship of Cuiavia & Pomerania 0.345 0.361 0.393 0.427 0.451 0.446 0.468 0.467 0.468
The Voivodeship of Lublin 0.270 0.280 0.316 0.336 0.345 0.369 0.402 0.434 0.423 The Voivodeship of Lubusz 0.367 0.385 0.427 0.423 0.436 0.525 0.542 0.516 0.535
The Voivodeship of Łódź 0.393 0.407 0.453 0.479 0.466 0.492 0.547 0.594 0.587 The Voivodeship of Lesser Poland 0.382 0.406 0.440 0.465 0.460 0.497 0.535 0.577 0.580
The Voivodeship of 0.633 0.676 0.745 0.817 0.811 0.859 0.910 0.940 0.994
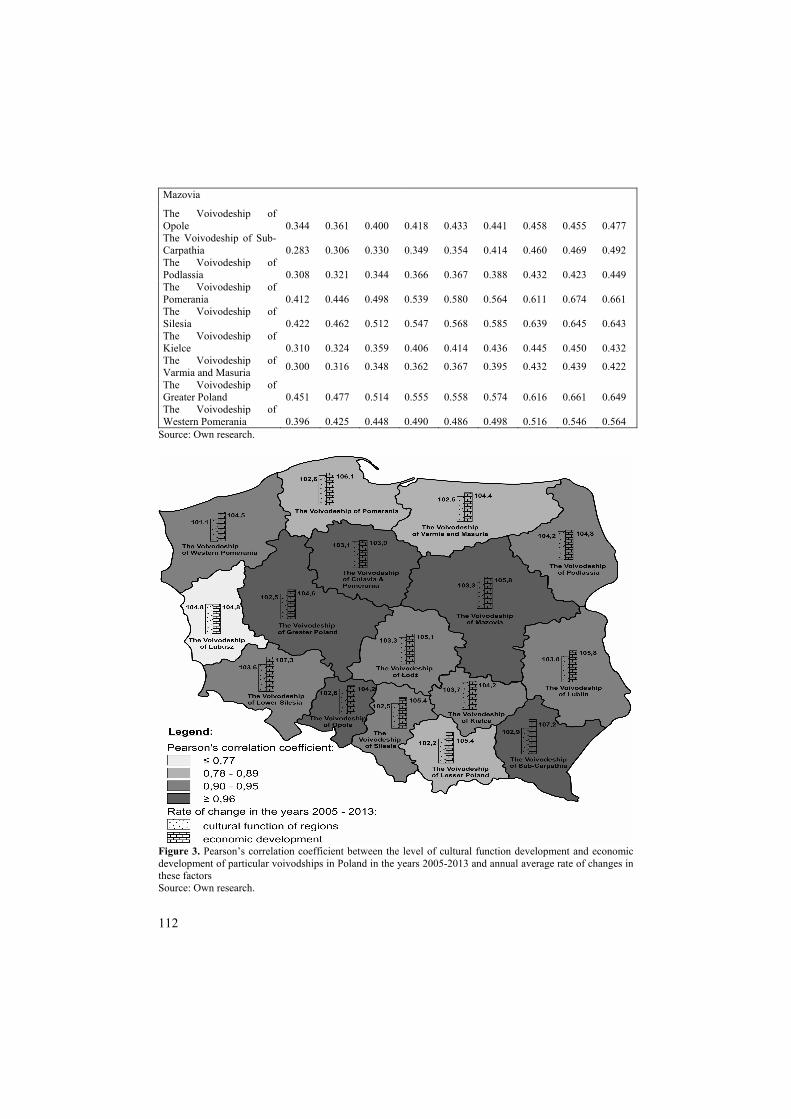
112
Mazovia
The Voivodeship of Opole 0.344 0.361 0.400 0.418 0.433 0.441 0.458 0.455 0.477 The Voivodeship of Sub-Carpathia 0.283 0.306 0.330 0.349 0.354 0.414 0.460 0.469 0.492 The Voivodeship of Podlassia 0.308 0.321 0.344 0.366 0.367 0.388 0.432 0.423 0.449 The Voivodeship of Pomerania 0.412 0.446 0.498 0.539 0.580 0.564 0.611 0.674 0.661 The Voivodeship of Silesia 0.422 0.462 0.512 0.547 0.568 0.585 0.639 0.645 0.643 The Voivodeship of Kielce 0.310 0.324 0.359 0.406 0.414 0.436 0.445 0.450 0.432 The Voivodeship of Varmia and Masuria 0.300 0.316 0.348 0.362 0.367 0.395 0.432 0.439 0.422
The Voivodeship of Greater Poland 0.451 0.477 0.514 0.555 0.558 0.574 0.616 0.661 0.649 The Voivodeship of Western Pomerania 0.396 0.425 0.448 0.490 0.486 0.498 0.516 0.546 0.564
Source: Own research.
Figure 3. Pearson’s correlation coefficient between the level of cultural function development and economic development of particular voivodships in Poland in the years 2005-2013 and annual average rate of changes in these factors Source: Own research.

113
Unfortunately, during these nine years the distance between the values of synthetic index of the level of economic development between the region with the highest level in this respect and the weakest region – grew from 0.363 in 2005 to as much as 0.572 in 2013.
Data summarized in Fig. 3 allow concluding that the most dynamic rate of changes in the economic development in Poland was observed in the following voivodships: Lower Silesia and Sub-Carpathia – respectively 7.3% and 7.2%. The annual average rate for all voivodships under study equalled 5.2%. The lowest rate of changes was noted in the Voivodship of Cuiavia and Pomerania, namely 3.9%.
The subject of analysis herein was also the search for a relationship between the level of development of cultural function and the level of economic development of Polish voivodships in the years 2003-2013. Considering the data presented in Fig. 3 one can see positive dependencies between both categories – the strongest in the voivodships of Cuiavia and Pomerania, Mazovia, and also of Sub-Carpathia and Opole. This proves the existence of positive strong relationship (Pearson’s correlation coefficient ranged between 0.99 and 0.96) between the level of development of culture and the level of economic development of the above regions. Weaker in comparison to the aforementioned regions, yet positive dependencies were revealed in the following voivodships of: Lubusz (0.769) and Varmia and Masuria (0.875), which subsequently represented the lowest scale of the categories in question.
Conclusions The above considerations allow drawing the conclusions which also allow achieving the objective and resolving the research problems:
1. The highest level of development of cultural function and of economic development in the years 2005-2013 was granted to the Voivodship of Mazovia.
2. In 2013 the Voivodship of Mazovia reached the level of development of the cultural function nearly twice higher than the Voivodship of Lublin – the weakest in this respect.
3. There is a positive dependency between the level of development of the region’s cultural function and the level of its economic development. It may be stated that the investment in human capital (cultural development of an individual – institutionalized and media participation) determine more dynamic economic growth (confirmed by G. Becker’s views).
4. In the years 2005 – 2013 the most dynamic change in development of the cultural function (measured with the geometric average of chain indices of dynamics) was noted in the Voivodships of Lublin and Podlassia.
5. In all voivodships covered by the study there is a strong positive dependency between the development of region’s cultural function and its economic development.
6. The strongest dependency regarding the aforementioned category was observed in the Voivodship of Cuiavia and Pomerania (0.99) and of Mazovia (0.98).
Being aware of the changing surroundings of the functioning of spatial units, changing needs of their residents including in the scope of cultural needs, the regularities described in the article should be monitored. It should be taken into account that it forms an excellent foundation for the further discussion and should be subject to further

114
modifications, e.g. in terms of the variables describing the categories herein, which are selected according to their availability. Certainly, such activities shall become the topic of future studies of the author.
References Becker G.: Human Capital, New York 1975. Bombol M.: Czas wolny jako kategoria diagnostyczna procesów rozwoju społeczno-
gospodarczego. Monografie i Opracowania 555. SGH, Warsaw 2008. Bombol M., Dąbrowska A.: Czas wolny. Konsument. Rynek. Marketing. LIBER. Warsaw 2003. Bylicki A.: Uwagi dotyczące realizacji w Polsce programu budowy gospodarki opartej na wiedzy
[in:] Gospodarka oparta na wiedzy. Perspektywy Banku Światowego. A. Kukliński (ed.) Scholar. Warsaw 2003.
Bywalec C., Rudnicki L.: Konsumpcja. PWE. Warsaw 2002. Czapiński J.: Kapitał ludzki i kapitał społeczny a dobrobyt materialny: polski paradoks.
Zarządzanie Publiczne 4/2008. Fukuyama F.: Zaufanie. Kapitał społeczny a droga do dobrobytu. PWN. Warsaw-Wrocław 1997. Heintzman P., Mannell R.C.: Spiritual function of leisure and spiritual well being: Coping
with time pressure. Leisure Science 25/2003. Kłoskowska A.: Socjologia kultury. Wydawnictwo Naukowe PWN. Warsaw 2007. Koźmiński A.: Jak tworzyć gospodarkę opartą na wiedzy? [in:] Strategia rozwoju Polski u progu
XXI wieku, Kancelaria Prezydenta RP i Komitet Prognoz Polska 2000 Plus. PAN. Warsaw 2001.
Looseley D.: Joffre Dumazedier, Toward a society of leisure. International Journal of Cultural Policy 16(1)/2010.
Matczak A.: Problemy badania funkcji turystycznej miast Polski. Acta Universitatis Lodziensis. Turyzm 5/1989.
Mikuła B.: Relacje jako element kapitału ludzkiego [in:] Budowanie relacji w zarządzaniu zasobami ludzkimi. J.S. Kardas (ed.). Wydawnictwo Studio Emka. Warsaw 2009.
Niemczyk A.: Turystyka jako forma zagospodarowania czasu wolnego [in:] Jakość usług turystycznych a ochrona praw konsumenta. T. Burzyński, M. Żemła (ed.). GWSH. Katowice 2007.
Niemczyk A.: Wirtualizacja kultury. Świat Marketingu 6/2008; http://www.swiatmarketingu.pl/index.php?rodzaj=01&id_numer=627349 [Accessed: 04.2015].
Niemczyk A.: Turystyka – sposób na zagospodarowanie czasu wolnego (na przykładzie mieszkańców powiatu nowosądeckiego. Handel Wewnętrzny 4/2013.
Niemczyk A, Zacłona T.: Funkcja turystyczna polskich makroregionów w aspekcie społeczno-ekonomicznym pierwszej dekady członkostwa w UE, [in:] Gospodarka turystyczna w regionie. Przedsiębiorstwo. Samorząd. Współpraca, red. A. Rapacz, Prace Naukowe Uniwersytetu Ekonomicznego we Wrocławiu nr 379, Wrocław 2015.
Putnam R.: Bowling alone: The collapse and revival of American community. Touchstone Books. New York 2000.
Putnam R.: Better together. Restoring the American community. Simon & Schuster. New York 2003.
Simpson S., Yoshioka C.: Aristotelian view of leisure: An outdoor recreation perspective. Leisure Studies 11/1992.
Strahl D. (ed.): Taksonomia struktur w badaniach regionalnych. Wydawnictwo Akademii Ekonomicznej we Wrocławiu. Wrocław 1998.
Sztompka P.: Zaufanie. Fundament społeczeństwa. Wydawnictwo Znak. Kraków 2007. The Well-being of Nations, The Role of Human and Social Capital. 2001. OECD Publishing 2001.

115
Zeliaś A. (ed..): Taksonomiczna analiza przestrzennego zróżnicowania poziomu życia w Polsce w ujęciu dynamicznym. Wydawnictwo Akademii Ekonomicznej w Krakowie. Kraków 2000.
Streszczenie Artykuł przedstawia wyniki analizy zależności pomiędzy czasem wolnym a rozwojem gospodarczym regionu, a biorąc pod uwagę fakt, że wśród wielu sposobów spędzania czasu wolnego wymienia się kulturę, to głównym celem artykuł stało się przedstawienie zależności pomiędzy poziomem rozwoju funkcji kulturowej regionu a poziomem jego rozwoju gospodarczego. W pracy wykorzystano publikowane dane GUS odnośnie do polskich województw, a ich dostępność wyznaczyła zakres czasowy badania, który przypadł na lata 2005-2013. Analizy empiryczne poprzedziły rozważania teoretyczne opisujące relacje pomiędzy czasem wolnym a rozwojem gospodarczym.
Słowa kluczowe: czas wolny, rozwój gospodarczy, województwo, funkcja kulturowa regionu. Informacje o autorze:
Dr Agata Niemczyk Katedra Turystyki, Uniwersytet Ekonomiczny w Krakowie, ul. Rakowicka 27; 31-510 Kraków, e-mail: [email protected]

116
15 (64) 2016
Emilia Głowacka Szkoła Główna Gospodarstwa Wiejskiego w Warszawie Wojciech Pizło Szkoła Główna Gospodarstwa Wiejskiego w Warszawie
Oszczędności gospodarstw domowych emerytów zamieszkujących tereny wiejskie –studium przypadku
HOUSEHOLD SAVINGS OF PENSIONERS LIVING IN
RURAL AREAS –STUDIUM CASE
Celem artykułu jest diagnoza wielkości oszczędności gospodarstw domowych emerytów obszarów wiejskich. W pracy wykorzystano następujące metody badacze: metodę sondażu diagnostycznego, metodę obserwacji i metodę dokumentacji. Obszarem badań była wiejska gmina Dobre, w powiecie mińskim. Badania empiryczne przeprowadzone zostały w typowych dla tego obszaru gospodarstwach domowych emerytów. Wybór gospodarstw domowych dokonany został przez trzech ekspertów: przewodniczącego Związku Emerytów, Rencistów i Inwalidów „Tęcza” w Dobrem, wójta gminy Dobre oraz lekarza z ośrodka zdrowia w Dobrem. Przeprowadzone wyniki badania wśród 9 gospodarstw domowych emerytów zamieszkujących obszary wiejskie wskazują, iż dochody gospodarstw domowych emerytów zamieszkujących tereny wiejskie są niższe, niż w pozostałych grupach społeczno- ekonomicznych w Polsce. Na podstawie struktury wydatków gospodarstw domowych emerytów stwierdzić można, że emeryci po przejściu na emeryturę zmniejszają poziom bieżącej i przyszłej konsumpcji na rzecz zaspokojenia potrzeb zdrowotnych. Badana grupa gospodarstw domowych emerytów pomimo podeszłego wieku, niskiego poziomu wykształcenia jest grupą aktywną na szczeblu społeczności lokalnej i w sposób racjonalny stara się dysponować domowym budżetem.
Słowa kluczowe: oszczędności, gospodarstwo domowe, tereny wiejskie
Wstęp Problematyka starzenia się społeczeństwa polskiego jest coraz częściej poruszana w różnych obszarach nauk społecznych. Wzrost udziału emerytów w społeczeństwie stanowi istotne wyzwanie dla polityki socjalnej państwa. System emerytalny w dużej mierze wpływa na warunki życia jego beneficjentów. Dzieje się tak, gdyż sytuacja dochodowa gospodarstw domowych emerytów uzależniona jest od dochodów uzyskiwanych ze świadczeń emerytalnych. Gospodarstwo domowe jest najbardziej

117
trwałą jednostką gospodarczą, która opiera swą działalność na własnych środkach materialnych oraz sile roboczej jego członków. Podlega ono ciągłym zmianom, które uwarunkowane są czynnikami zewnętrznymi występującymi w sferze gospodarki, społeczeństwa czy polityki państwa. Wobec tych przemian w gospodarstwach domowych przekształceniu ulegają struktura, zakres działania oraz znaczenie poszczególnych funkcji, które spełniają gospodarstwa domowe1. Prowadzenie działalności gospodarczej jest istotą gospodarstwa domowego. Rozwój gospodarstwa domowego bazuje na zasobach materialnych oraz zasobach siły robaczej członków tego gospodarstwa. W owej działalności gospodarczej wyróżnić możemy działalność produkcyjną i usługową, zakup towarów i usług oraz w dużej mierze oszczędnościach i powiązanych z nimi konsumpcją2. Nadrzędnym celem działania gospodarstwa domowego staje się zaspokajanie potrzeb członków tego gospodarstwa. Każde gospodarstwo wyznacza sobie określone cele, które chce konsekwentnie realizować. Cele te zależne są od wartości jakimi kierują się domownicy oraz ich indywidualnych potrzeb, ambicji czy marzeń oraz wielkości oszczędności i dochodów bieżących jakimi dysponuje gospodarstwo domowe. W gospodarstwach domowych występują dwa rodzaje celów: grupowe, które dotyczą wszystkich członków gospodarstwa oraz te wynikające z indywidualnych potrzeb domowników, nazywane calami jednostkowymi3.
Cel i metodyka badań Celem pracy jest diagnoza wielkości oszczędności gospodarstw domowych emerytów zamieszkujących tereny wiejskie. W pracy wykorzystano literatury z zakresu ekonomiki gospodarstwa domowego oraz finansów. Analiza danych statystycznych została przeprowadzona na podstawie roku 2013, które stanowić mogą punkt odniesienia z uwagi na uspokojenie sytuacji gospodarczej na rynkach zagranicznych oddziaływujących na gospodarkę krajowa. Wybrane gospodarstwa domowe wskazane zostały jako typowe4 przez trzech ekspertów (1. Przewodniczącego Związku Emerytów, Rencistów i Inwalidów „Tęcza” w Dobrem, który wytypował gospodarstwa ponumerowane od 1-3, 2. wójta gminy Dobre, który wskazał jako typowe gospodarstwa domowe we wsi Sołki gospodarstwa o numerach 2-6 oraz lekarz z ośrodka zdrowia w Dobrem gospodarstwa o numerach 7-9). W każdym gospodarstwie domowym wykorzystano następujące metody badawcze: metodę dokumentacji, obserwacji oraz sondażu diagnostycznego. Przeprowadzone badania spełniały wymóg metodyczny odnoszący się do triangulacji badań. W ramach badań pierwotnych wykorzystano kwestionariusz wywiadu poszerzony o wywiad swobodny, jak również metodę obserwacji i metodę dokumentacji. Wywiad tak prowadzono by respondent czuł się swobodnie i bez barier wypowiadał się na badany temat. W trakcie badań wykorzystano również metodę obserwacji, która dostarczyła istotnych informacji na temat zachowań
1 A. Mazurkiewicz-Pizło, W. Pizło, Miejsce rodziny i gospodarstwa domowego w systemie społeczno-gospodarczym, [w:] Gospodarowanie w sadownictwie Grójca i Warki. Społeczno-ekonomiczne uwarunkowania rozwoju gospodarstw domowych, Wyd. SGGW, Warszawa 2013, s..34-35.. 2 A. Hodoly, Gospodarstwo domowe i jego rola społeczno-ekonomiczna, KiW, Warszawa 1971, s. 16-20. 3 T. Zalega, Konsumpcja. Determinanty-teorie-modele, Wyd. PWE, Warszawa 2012, s. 81. 4 Typowym gospodarstwem domowym emerytów z obszarów wiejskich w gminie Dobre należy uznać dwuosobowe gospodarstwo domowe w którym głównym źródłem utrzymania jest świadczenie emerytalne.

118
emerytów w obrębie własnego gospodarstwa domowego oraz ich opinii na temat otaczającego ich świata. Obszarem badań była wiejska gmina Dobre, w powiecie mińskim. Badania empiryczne przeprowadzone zostały w typowych dla tego obszaru gospodarstwach domowych emerytów.
Gospodarstwo domowe jako jednostka gospodarująca Gospodarstwo domowe jest jednostką gospodarującą o specyficznym charakterze w porównaniu do pozostałych podmiotów gospodarczych. Odmienność ta widoczna jest w różnicach, które występują pomiędzy gospodarstwem domowym, a innymi podmiotami5. Każde gospodarstwo domowe przyjmuje sobie konkretne cele, które następnie realizuje. W tym tkwi, podstawowa różnica pomiędzy każdym z gospodarstw domowych. Natomiast działalność każdego z członków gospodarstw domowych nakierowana jest na zaspokojenie jednostkowych i zbiorowych potrzeb domowników oraz poprawę jakości życia6. Ta cecha odróżnia gospodarstwo domowe od pozostałych jednostek gospodarujących, których głównym celem jest osiągnięcie maksymalnego zysku7. Wśród najczęściej przytaczanych definicji gospodarstwa domowego jako jednostki gospodarującej jest ta stworzona przez A. Hodoly. Według, którego gospodarstwo domowe określane jest jako „baza ekonomiczna”, którą tworzy grupa osób związanych ze sobą różnego rodzaju więziami. Na gospodarkę domową składa się poziom konsumpcji oraz stopa oszczędności, a także cała organizacja spożycia, a więc planowanie, podejmowanie decyzji, dostarczanie produktów, realizowanie prac w gospodarstwie oraz dysponowanie zasobami8. Działalność podejmowana przez gospodarstwa domowe, w głównej mierze prowadzi do zwiększenia dochodów, efektywnego zarządzania nimi w formie konsumpcji i gromadzenia poprzez oszczędzanie i inwestowanie. Działalność ta sprowadza się także do zarządzania pracą domowników9. Funkcjonowanie gospodarstwa domowego nie podlega jednakowym regułom czy zasadom, które muszą spełniać pozostałe podmioty gospodarcze, działając na zasadzie rachunku ekonomicznego. Mimo to, większość gospodarstw domowych prowadzi swój własny budżet domowy, w celu względnie racjonalnego wykorzystania swoich zasobów.
Specyfika gospodarstw domowych na terenach wiejskich Za wiejskie gospodarstwo domowe uznaje się gospodarstwo znajdujące się na terenie jednostki administracyjnej typu wiejskiego. Do grupy tych gospodarstw należy ludność, która utrzymuje się w szczególności z pracy w rolnictwie, osób dla których rolnictwo
5 T. Zalega, Konsumpcja. Determinanty-teorie-modele, Wyd. PWE, Warszawa 2012, s. 80. 6 A. Mazurkiewicz-Pizło, Jakość życia gospodarstw domowych w województwie mazowieckim – ujęcie społeczno-ekonomiczne, [w:] Rynek pracy na obszarach wiejskich Mazowsza – perspektywa gender, Wyd. SGGW, Warszawa 2013, s. 131-163. 7 W licznych badaniach wskazuje się, że głównym celem jest nie tylko zysk, jak napisano dla uproszczenia, ale dokładnie zysk satysfakcjonujący, wartość przedsiębiorstwa, czy też wartość dodana. Patrz szerzej A. Noga, Teorie przedsiębiorstw, wyd. PWE, Warszawa 2009, s.64-67. 8 A. Hodoly, Gospodarstwo domowe i jego rola społeczno-ekonomiczna, Wyd. KiW, Warszawa 1971, s. 20. 9 W. Pizło, Gospodarowanie w sadownictwie Grójca i Warki. Społeczno-ekonomiczne uwarunkowania rozwoju gospodarstw domowych, Wyd. SGGW, Warszawa 2013, s. 32.

119
jest dodatkowym źródłem dochodów, utrzymujących się z pracy najemnej, bądź też osób pracujących na własny rachunek, jak również emerytów i rencistów10. Pomimo, iż znajdujące się na terenach wiejskich gospodarstwa domowe różnią się pewnymi cechami, takimi jak: liczba osób w gospodarstwie, źródło utrzymania, wykształceniem czy sposobem użytkowania działki to łączy je wieś jako miejsce zamieszkania. Mieszkańcy wsi oraz tworzona przez nich grupa gospodarstw domowych uznawani są za „mikrojednostkę gospodarującą o specyficznych cechach”11. Rodzinne gospodarstwa domowe na obszarach wiejskich pojmowane są jako swoiste społeczności lokalne. Gdyż odnaleźć można w nich specyficzne cechy każdej społeczności wiejskiej, a w szczególności fakt iż większość gospodarstw domowych odczuwa więź łączącą ich z zamieszkiwanym terytorium. Członkowie wiejskich gospodarstw domowych czują przynależność do danego terytorium, silniej więc odczuwają chęć uczestnictwa w stosunkach sąsiedzkich, jak i w ogólnym oddziaływaniu na siebie oraz wspólnych relacjach ze społecznością wiejską12. Wyodrębniając specyfikę wiejskiego gospodarstwa domowego bierze się pod uwagę fakt, iż większość gospodarstw na terenach wiejskich powiązana jest z gospodarstwem rolnym. Gospodarstwo domowe funkcjonując przy gospodarstwie rolnym wzajemnie się uzupełnia, wobec czego „sfera spożycia połączona jest z działalnością produkcyjną”13. Również rolnik i jego rodzinna, często trzypokoleniowa, występują jednocześnie w dwóch rolach: jako członkowie gospodarstwa domowego oraz jako siła robocza w gospodarstwie rolnym. Istnieje więc silna współzależność, gdyż gospodarstwo rolne pomaga utrzymać gospodarstwo domowe, z kolei rodzina biorąc czynny udział i pracując w gospodarstwie wnosi swój udział do gospodarstwa rolnego14. Cechą charakterystyczną wiejskiego gospodarstwa domowego jest także jedność budżetu gospodarstwa, które łączy przychody gospodarstwa domowego i rolnego oraz warunkuje ich rozdysponowanie. Dochód przeznaczany jest w dużej mierze na inwestycje i utrzymanie gospodarstwa rolnego oraz spożycie w gospodarstwie domowym. Z powodu nakładów poniesionych na działalność inwestycyjną w gospodarstwie rolnym, dochody na zaspokojenie potrzeb rodziny nie są stałe. Często członkowie wiejskich gospodarstw na pierwszym miejscu stawiają wydatki na polepszenie sytuacji gospodarstwa rolnego, następnie wydatki na zaspokojenie potrzeb niższego rzędu, a dopiero w dalszej części na zaspokojenie potrzeb wyższego rzędu15. Jest to warunek konieczny, aby gospodarstwo rolne się rozwijało i zwiększało swoją produkcję, gdyż od tego zależy sytuacja dochodowa własnego gospodarstwa domowego. Należy również pamiętać, że prace domowe i gospodarcze wykonywane są przez te same osoby, toteż trudno o rozgraniczenie czasu jaki członkowie gospodarstwa poświęcają na prace domowe i prace na roli. Trudne są zatem do ustalenia jak wiele 10 K. Żelazna, Zarządzanie zasobami wiejskich gospodarstw domowych, Wyd. SGGW, Warszawa 2000, s. 18. 11 K. Gutkowska, Rodzinne gospodarstwa domowe na wsi w warunkach gospodarki rynkowej, Wyd. SGGW, Warszawa 1997, s.29. 12 J. Turowski, Socjologia wsi i rolnictwa, Wyd. KUL, Lublin 1995, passim. 13 K. Żelazna, Zarządzanie zasobami wiejskich gospodarstw domowych, Wyd. SGGW, Warszawa 2000, s.19. 14 Przykładem może być tu rozwój gospodarstw winiarskich przedstawiony w pracy A. Mazurkiewicz-Pizło, Enoturystyka, jako szansa rozwoju społeczno-ekonomicznego obszarów wiejskich, wyd. TNOiK, Warszawa-Toruń, 2013, s. 225-254. 15 A. Mazurkiewicz-Pizło, W. Pizło, Rodzina i gospodarstwa domowe na obszarach wiejskich, [w:] Gospodarowanie w sadownictwie Grójca i Warki: Społeczno-ekonomiczne uwarunkowania rozwoju gospodarstw domowych, część II, Wyd. SGGW, Warszawa 2013, s. 39-47.

120
czasu członkowie gospodarstw poświęcają pracy, a ile na czas wolny. Większość prac w gospodarstwie rolnym podlega sezonowości, a więc to pory roku decydują o tym jak dużo czasu poświęcamy na pracę w gospodarstwie rolnym. Kolejną specyficzną cechą wiejskiego gospodarstwa domowego jest częściowa niezależność od rynku produktów żywnościowych, gdyż wiele produktów gospodarstwa te wytwarzają samodzielnie.
Oszczędzanie oraz decyzje inwestycyjne podejmowane w gospodarstwach domowych Oszczędzanie jest „zaniechaniem konsumpcji bieżącej na rzecz konsumpcji przyszłej”16. W przypadku gospodarstw o niskich dochodach, oszczędzanie staje się koniecznością, która ma zapewnić prawidłowe funkcjonowanie. Natomiast w gospodarstwach zamożniejszych oszczędzanie przybiera formę inwestowania, gdyż zwykle oznacza odkładanie środków pieniężnych w celu zwiększenia własnego kapitału17. Cechą wspólną pomiędzy oszczędzaniem i inwestowaniem jest „konieczność rezygnacji z bieżącej konsumpcji”18. W literaturze przedmiotu wskazuje się na zależność pomiędzy poziomem zamożności danego społeczeństwa (szczególnie poziomem PKB per capita), a poziomem oszczędzania19, a także innych czynników takich jak wysokość stopy procentowej, a także nastawienie psychiczne do oszczędzania20. Oszczędzanie jest pierwotną funkcją w stosunku do inwestowania. J. Hirshleifer przedstawił istotę inwestycji, jako: „teraźniejsze wyrzeczenie się dla przyszłej korzyści”21. W ten sposób autor wyróżnił także dwie główne cechy oszczędzania. Są nimi: element psychologiczny, którym jest poświęcenie teraźniejszej konsumpcji na rzecz oszczędzania oraz przyszłych korzyści, które osiągnięte zostaną w przyszłości22. Należy jednak pamiętać, że decyzje o oszczędzaniu które są w danej chwili pewne i znane, w przyszłe ich korzyści są już niepewne23, bowiem obarczone są subiektywnym poziomem ryzyka odczuwanego w zależności od cech społeczno-demograficznych. Oszczędzanie, jak i inwestowanie różni się podstawowym celem, gdyż w przypadku tego pierwszego zabezpieczamy się głównie poprzez dążenie do posiadania rezerw finansowych na przyszłość, natomiast inwestując skupiamy się w szczególności na pomnażaniu kapitału. Istnieją również odmienne formy gromadzenia nadwyżek finansowych w przypadku oszczędzania i inwestowania. Instrumenty o znanej stopie zwrotu oraz o tej nieznanej, nazywane są odpowiednio bezpiecznymi i ryzykownymi. Nie tylko dochód jest uznawany za czynnik wpływający na podejmowanie decyzji związanych z
16 D. Korenik, Oszczędzanie indywidualne w Polsce, AE, Wrocław 2003, s. 25-26. 17 J. Harasim, Oszczędzanie i inwestowanie nadwyżek finansowych przez ludność, [w:] Oszczędzanie i inwestowanie w teorii i praktyce, Wyd. PTE, Katowice 2010, s. 19. 18 Ibidem. 19 S. Białowąs, I. Olejnik, Oszczędności gospodarstw domowych w różnych fazach cyklu koniunkturalnego, Studia Oeconomica Posnaniensia 2015, vol. 3, no 4. 20 B. Frączek, Analiza czynników wpływających na oszczędzanie i inwestowanie, Studia Ekonomiczne, Uniwersytet Ekonomiczny w Katowicach, 2012, nr 122, s. 92. 21 J. Hirshleifer, Investment Decision under Uncertainty: Choice-Theoretic Approaches [w:] The Quarterly Journal of Economics 1965, Vol. LXXIX, No 4, s. 509. 22 W. Rogowski, Rachunek efektywności inwestycji, Oficyna Wolers Kluwer Buisness, Kraków 2008, s. 14. 23 J. Harasim, Oszczędzanie i inwestowanie nadwyżek finansowych przez ludność, [w:] Oszczędzanie i inwestowanie w teorii i praktyce, PTE, Katowice 2010, s. 19.

121
oszczędzaniem i inwestowaniem. Wielkość i struktura oszczędności każdego gospodarstwa domowego zależna jest od czynników o charakterze obiektywnym, jak i subiektywnym24. Według P. Anioły i Z. Gołasia na zachowania gospodarstw domowych w sferze oszczędności i inwestycji istotny wpływ ma siedem głównych czynników do których zaliczamy:25 dochód gospodarstw domowych, status społeczno-zawodowy głowy gospodarstwa domowego, jej wiek, wykształcenie oraz stan cywilny, jak również typ biologiczny rodziny oraz aspekty zdrowotne. O zachowaniach oszczędnościowych i podejmowaniu decyzji inwestycyjnych poza wysokością dochodu decyduje również przynależność do konkretnej grupy społeczno-zawodowej. Dzieje się tak dlatego, iż rodzaj wykonywanej pracy powiązany jest z wysokością wynagrodzeń, a to z kolei decyduje o tym jaką część dochodu chcemy przeznaczyć na oszczędności i w jakiej formie. Wraz ze wzrostem wykształcenia rośnie również świadomość finansowa. Dlatego też bardziej zamożne gospodarstwa domowe podejmują bardziej ryzykowne decyzje finansowe, niż w przypadku mniej zamożnych gospodarstw. Również wiek ma istotny wpływ na podejmowanie decyzji odnoście ryzykownych i biernych form oszczędzania środków pieniężnych. Społeczeństwo starzejące się dużo częściej wybiera produkty oszczędnościowe, które cechują się niskim stopniem ryzyka (np. depozyty bankowe, ubezpieczenia na życie czy obligacje). Wraz ze wzrostem wieku członków gospodarstw domowych wzrasta także niechęć do ryzyka26. Większą skłonnością do oszczędzania charakteryzują się rodziny z dziećmi, które chcąc zabezpieczyć ich przyszłość oszczędzają, natomiast gospodarstwa jednoosobowe, w szczególności ludzie młodzi, nie przejawiają tak dużej wagi do oszczędzania co potwierdza teoria cyklu życia rodzinnego. Pomimo stwierdzenia, iż głównym celem oszczędzania jest zabezpieczenie się na okres starości wiele gospodarstw domowych nie oszczędza wcale lub niewystarczająco licząc w głównej mierze na wypłaty z ubezpieczeń społecznych27. Każde z przedstawicieli gospodarstw domowych ma inny stosunek do inwestowania oraz oszczędzania. Często tradycja rodzinna oraz funkcjonowanie wśród pozostałych gospodarstw domowych wpływa na zachowanie się ich członków wobec decyzji finansowych występujących w każdym gospodarstwie28. To w jakim stopniu oszczędzamy zależy od wielu czynników. Tak samo się dzieje w przypadku motywów oszczędzania. Oszczędzać możemy z różnorakich powodów: chcąc zaspokoić własne potrzeby (np. kupno nowego samochodu czy telefonu), myśląc o przyszłości swojej rodziny (np. wybudowanie domu czy finansowanie edukacji swoich dzieci) albo chcąc nieustannie pomnażać swój kapitał inwestując29. Najczęstszym motywem gromadzenia
24 M. Szafrańska, R. Matysiak-Pejas, Determinanty gromadzenia oszczędności pieniężnych przez wiejskie gospodarstwa domowe, ACTA Scientiarum Polonolum, Oeconomia 9(3), 2010, s. 266. 25 P. Anioła, Z. Gołaś, Zachowania oszczędnościowe gospodarstw domowych w Polsce, Wyd. Uniwersytetu Przyrodniczego w Poznaniu, Poznań 2013, s. 33-49. 26 G. Rytlewska, A. Kłopocka, Wpływ czynników demograficznych na poziom i strukturę oszczędności gospodarstw domowych w Polsce, „Bank i Kredyt” 2010 , nr.1, s. 77. 27 F. Bylok, Zachowania konsumpcyjne ludzi starszych w Polsce na początku XXI wieku [w:] Starość i starzenie się jako doświadczenie jednostek i zbiorowości ludzkich, pod red. nauk. J.T. Kowalski i P. Szukalski, Wyd. Zakład Demografii Uniwersytetu Łódzkiego, Łódź 2006, s. 92. 28 B. Frączek, Analiza czynników wpływających na oszczędzanie i inwestowanie, Uniwersytet Ekonomiczny w Katowicach, nr 122/2012, s. 92. 29 J. Harasim, Oszczędzanie i inwestowanie nadwyżek finansowych przez ludność, [w:] Oszczędzanie i inwestowanie w teorii i praktyce, PTE, Katowice 2010, s. 36

122
oszczędności jest zarządzanie gotówką, co ujawnia się w motywie transakcyjnym. Gospodarstwa domowe oszczędzają, więc by móc zarządzać własnym budżetem w celu regulowania należności. Gromadzenie oszczędności buforowych odpowiada motywowi oszczędnościowemu, a więc zabezpieczenia się na wypadek nieprzewidzianych zdarzeń w przyszłości. Trzecim motywem jest oszczędzanie na konkretny cel, łączy się więc z motywem celowości. Na szczycie piramidy przedstawiono motyw „portfelowy”, jakim jest pomnażanie majątku do czego niezbędne jest prawidłowe zarządzanie własnym kapitałem pieniężnym. Powody jakimi kierują się członkowie gospodarstw domowych gromadząc oszczędności są przedstawiane w różnych kombinacjach. Istotnymi czynnikami oszczędzania w gospodarstwach domowych są następujące motywy:30 ostrożności (odłożenie pieniędzy na nieprzewidziane wydatki), przezorności (akumulowania zapasów w formie pieniężnej na przyszłość), wyrachowania (chęć pomnażania kapitału), poprawy (zwiększenia dobrobytu w przyszłości), niezależności (możliwość realizacji planów życiowych), przedsiębiorczości (rozwijanie się), dumy (spadku, pozostawienia majątku dla potomstwa) oraz skąpstwa (jako niechęci wydawania pieniędzy). Dodatkowo M. Browing i A. Lusardi31 wskazali na nie wymieniony wcześniej motyw oszczędzania jakim jest chęć spłaty wcześniej podjętych zobowiązań finansowych.
Ogólna charakterystyka społeczno-ekonomiczna badanej zbiorowości emerytów zamieszkujących gminę Dobre Za emerytów uznaje się grupę społeczno-ekonomiczną, która ze względu na obowiązujące prawo jest uprawniona do zabezpieczenia z tytułu wieku, przepracowanych lat oraz dochodów jakie uzyskała w czasie aktywności zawodowej32. Jest to zatem grupa społeczna, która za powodu upływających lat nie jest już aktywna zawodowo, tak jak reszta społeczeństwa, a głównym źródłem dochodów stają się dla niej dochody ze świadczeń społecznych, w głównej mierze emerytury. W strukturze przeciętnego miesięcznego dochodu w gospodarstwach domowych emerytów największy udział, bo 87,3% zajmuje dochód ze świadczeń ubezpieczeń społecznych i świadczeń pozostałych z czego, aż 82,9 % stanowią świadczenia emerytalne. W 2013 roku 8,6% dochodów emerytów stanowiły dochody z pracy najemnej, w tym również dorywczej. Świadczyć to może o tym, iż emeryci pomimo przejścia na emeryturę starają się pracować dorywczo, w celu otrzymywania dodatkowych środków na zaspokojenie potrzeb gospodarstwa domowego. Tylko 1% wszystkich dochodów emerytów stanowią dochody z pracy na własny rachunek, a niewiele, bo jedynie 0,3% stanowią dochody z własności oraz wynajmu budynków i budowli niezwiązanych z działalnością gospodarczą, jak i niewiele, bo jedynie 0,4% dochody z gospodarstwa indywidualnego w rolnictwie.
30 J. M. Keynes, Ogólna teoria zatrudnienia, procentu i pieniądza, Wyd. Naukowe PWN, Warszawa 2003, s. 82. 31 M. Browning, A. Lusardi, Household Saving: Micro Theories and Micro Facts, Journal of Economics Literature, Vol. XXXIV, s. 1797. 32 A. Kotlarska-Michalska, Starość w aspekcie socjologicznym, Roczniki Socjologii Rodziny, Tom 12 (2000), s. 148.

123
W wskazanej grupie typowych dla danego regionu 9 gospodarstw domowych emerytów poszukiwano ich cech wspólnych, które łączą wszystkie te gospodarstwa. Pierwsza z nich to miejsce zamieszkania, którym jest wieś. Drugim jest z kolei liczba osób tworzących gospodarstwo domowe. Wśród badanych są małżeństwa emerytów tworzących wspólne, dwuosobowe gospodarstwo domowe. Kolejnym jest wiek, który przeciętnie wynosi 73 lata (dokładnie 73,33). Najmłodszy członek badanego gospodarstwa miał 68 lat, natomiast najstarszy 87 lat. Warto również zwrócić uwagę, iż emeryci z obszarów wiejskich mają niższy poziom wykształcenia, w stosunku do emerytów zamieszkujących obszary miejskie. Jest to często uzasadnione tym, iż po ukończeniu szkoły podstawowej osoby te pomagały w rodzinnym gospodarstwie domowym nie przywiązując dużej wagi do wykształcenia. Ujawnia się to w badaniu, gdzie w omawianych gospodarstwach dominuje wykształcenie podstawowe (aż 83%). W związku prowadzonymi badaniami gospodarstw domowych na obszarach wiejskich, warto wskazać na rodzaj pracy zawodowej jaką wykonują lub wykonywali. Dwa gospodarstwa domowe emerytów (22,2%) posiadają własne gospodarstwo rolne, natomiast znaczna część, bo aż 7 gospodarstw (77,8%) przekazało własne gospodarstwo rolne swoim dzieciom, bądź też zrezygnowało z prowadzenia gospodarstwa rolnego. Respondenci wskazali, iż gospodarstwa rolne (wcześniej przez nich posiadane) nie przynoszą zysków, ale i nie ponoszą dodatkowych kosztów ich prowadzenia. Emeryci prowadzący gospodarstwo rolne robią to z dwóch powodów: po pierwsze, aby dzięki niemu uzyskać produkty rolno-spożywcze i zmniejszyć wydatki na produkty żywnościowe, po drugie, aby mieć zajęcie zapełniając czas wolny pracami w gospodarstwie. Z punktu widzenia badanych respondentów we były dochody uzyskiwane z Zakładu Ubezpieczeń Społecznych (ZUS) oraz Kasy Rolniczego Ubezpieczenia Społecznego (KRUS). W badanej grupie pobierane są świadczenia zarówno z obu tych instytucji - zazwyczaj jeden emeryt w gospodarstwie domowym pobiera świadczenie z ZUS, natomiast drugi małżonek z KRUS. Wśród 9 badanych gospodarstw taka sytuacja występuje w 5 gospodarstwach, w 3 gospodarstwach oboje małżonków pobiera świadczenia z ZUS, natomiast tylko w jednym gospodarstwie oboje z członków pobiera emerytury rolnicze. Ponad połowa, bo 56% badanych gospodarstw domowych emerytów pobiera zarówno emerytury z Zakładu Ubezpieczeń Społecznych, jak i Kasy Rolniczego Ubezpieczenia Społecznego. Emerytura z ZUS, która jest wyższa od tej która jest pobierana w systemie rolniczym dlatego te gospodarstwa domowe swobodniej wykorzystują dochody bieżące, niż jest to w przypadku gospodarstwa, który pobiera świadczenia emerytalne jedynie z KRUS. Wśród badanej grupy 9 gospodarstw domowych emerytów największy udział stanowiły wydatki na żywność i napoje, służbę zdrowia oraz użytkowanie mieszkania i nośniki energii, odpowiednio 26,3%, 22,2% oraz 21,8%. Wydatki na żywność oraz użytkowanie mieszkania były zbliżone do wartości wydatków ogółem dla grupy emerytów w Polsce w 2013 roku, które wynosiły odpowiednio 29,6% i 23,9%. Drugą co do wielkości wartość stanowiły wydatki na służbę zdrowia, które były o 13,7 punktów procentowych wyższe od wydatków emerytów w Polsce. Nieco mniej środków pieniężnych badane gospodarstwa przeznaczają na transport i łączność w porównaniu do średniej dla Polski. Jest to spowodowane faktem, iż emeryci niechętnie się przemieszczają środkami transportu. Jak zaznaczają preferują załatwiać najważniejsze sprawy podczas cotygodniowego targu, który odbywa się w miejscowości gminnej. W pozostałe dni starają się pozostawać w
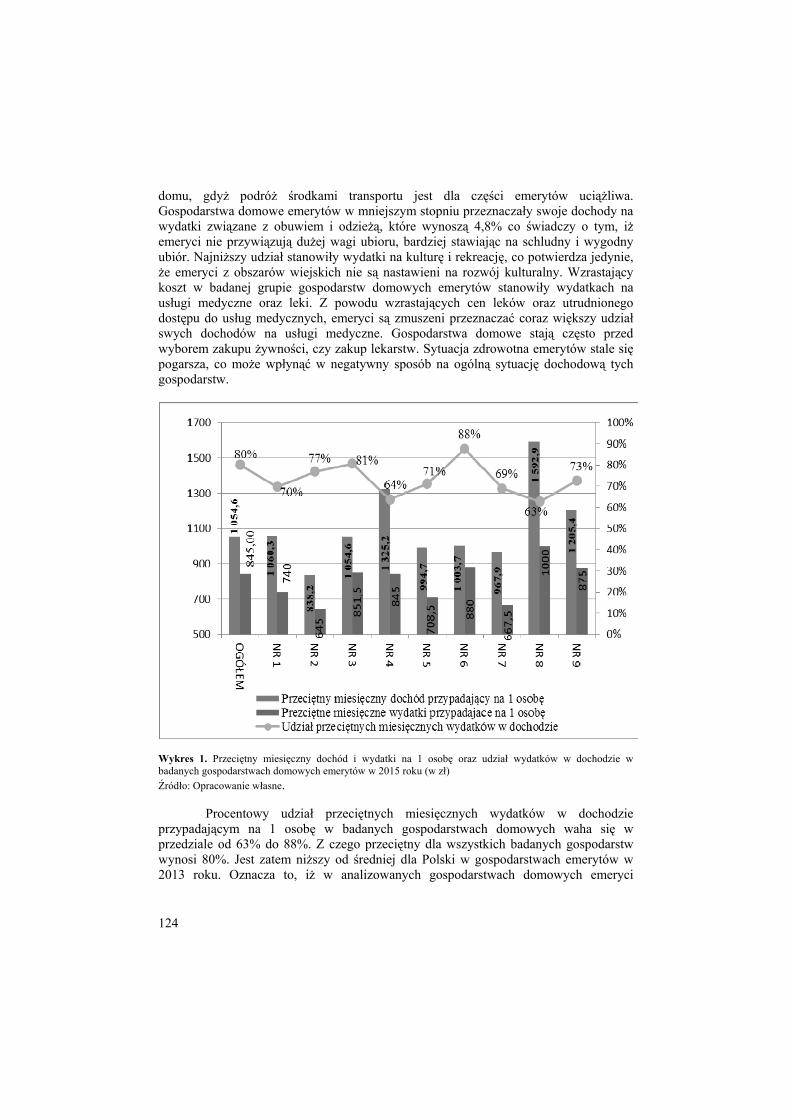
124
domu, gdyż podróż środkami transportu jest dla części emerytów uciążliwa. Gospodarstwa domowe emerytów w mniejszym stopniu przeznaczały swoje dochody na wydatki związane z obuwiem i odzieżą, które wynoszą 4,8% co świadczy o tym, iż emeryci nie przywiązują dużej wagi ubioru, bardziej stawiając na schludny i wygodny ubiór. Najniższy udział stanowiły wydatki na kulturę i rekreację, co potwierdza jedynie, że emeryci z obszarów wiejskich nie są nastawieni na rozwój kulturalny. Wzrastający koszt w badanej grupie gospodarstw domowych emerytów stanowiły wydatkach na usługi medyczne oraz leki. Z powodu wzrastających cen leków oraz utrudnionego dostępu do usług medycznych, emeryci są zmuszeni przeznaczać coraz większy udział swych dochodów na usługi medyczne. Gospodarstwa domowe stają często przed wyborem zakupu żywności, czy zakup lekarstw. Sytuacja zdrowotna emerytów stale się pogarsza, co może wpłynąć w negatywny sposób na ogólną sytuację dochodową tych gospodarstw.
Wykres 1. Przeciętny miesięczny dochód i wydatki na 1 osobę oraz udział wydatków w dochodzie w badanych gospodarstwach domowych emerytów w 2015 roku (w zł) Źródło: Opracowanie własne.
Procentowy udział przeciętnych miesięcznych wydatków w dochodzie przypadającym na 1 osobę w badanych gospodarstwach domowych waha się w przedziale od 63% do 88%. Z czego przeciętny dla wszystkich badanych gospodarstw wynosi 80%. Jest zatem niższy od średniej dla Polski w gospodarstwach emerytów w 2013 roku. Oznacza to, iż w analizowanych gospodarstwach domowych emeryci

125
przeznaczają mniejszą sumę wydatków na bieżącą konsumpcję. Jest to spowodowane faktem, iż większość z nich odkłada zaoszczędzone pieniądze ze świadczeń emerytalnych na „czarną godzinę”. Ponad połowa badanych gospodarstw domowych emerytów oceniała swoją sytuację materialną jako „średnią”. Natomiast 1/3, bo 33,3% określa, że żyje im się „źle”. Jest to wynik o 17,5% wyższy w porównaniu do wyników badań GUS z 2013 roku odnoszących się do emerytów zamieszkujących Polskę. Z kolei jedno gospodarstwo stwierdziło, że żyje im się źle. Skupiając się na gospodarowaniu domowym budżetem przez badaną grupę emerytów zadano im następujące pytanie: Które z następujących określeń najlepiej charakteryzuje sposób gospodarowania dochodem przez Państwa gospodarstwo domowe. Wśród badanych gospodarstw domowych emerytów 1/3 twierdzi, iż żyje im się „oszczędnie i dzięki temu starcza na wszystko”, jak również, że „żyje bardzo oszczędnie, aby odłożyć na poważniejsze zakupy”. Oznacza to przede wszystkim, iż członkowie tych gospodarstw ostrożnie rozporządzają domowym budżetem. Jeden z respondentów stwierdził, iż nie oszczędza na przyszłość, jak również zarządza swoim budżetem bez specjalnych wyrzeczeń. Jedynie jeden z respondentów ocenił zarządzanie swoim budżetem jako „trudne, gdyż pieniędzy starcza jedynie na najtańsze jedzenie, ubranie oraz najpotrzebniejsze opłaty”.
Oszczędności w badanej grupie gospodarstw domowych emerytów Analizując gospodarowanie domowym budżetem przez badaną grupę gospodarstw domowych emerytów należy przyjrzeć się oszczędnościom jakie posiadają. Oszczędności po przejściu na emeryturę stają się nie tylko środkiem zaspokajającym potrzeby konsumpcyjne gospodarstw domowych. Członkowie gospodarstw domowych myśląc przyszłościowo traktują oszczędności jako rezerwę na zdarzenia losowe. Odkładają pieniądze w celu zabezpieczenia rodziny w momencie choroby lub śmierci. Według wszystkich gospodarstw domowych oszczędzanie na konkretny cel jest trudne do realizacji. Oszczędności w badanych gospodarstwach domowych są w znacznym stopniu uzależnione od dochodów jakie one uzyskują. Określają one jak długo gospodarstwo domowe jest w stanie funkcjonować w momencie nieotrzymywania żadnych środków pieniężnych. W badanych gospodarstwach domowych emerytów poziom oszczędności jest stosunkowo niski w stosunku do średniej Polski. Wśród badanych gospodarstw domowych emerytów tylko jedno spośród wszystkich dziewięciu posiada oszczędności powyżej półrocznych – do rocznych. Z kolei, 4 gospodarstwa posiadają oszczędności jedynie do wysokości miesięcznych dochodów gospodarstwa, co wpływa negatywnie na zaspokojenie potrzeb wyższego rzędu, czy nieoczekiwanych zdarzeń. Tyle samo gospodarstw domowych posiada oszczędności powyżej miesięcznych – do 3 miesięcznych dochodów gospodarstwa domowego, co również nie zapewnia bezpieczeństwa materialnego wśród badanej grupy emerytów. Badana grupa emerytów nie zabezpiecza swoich oszczędności w postaci obligacji, funduszy inwestycyjnych, czy polis ubezpieczeniowych. W przeważającej mierze gospodarstwa domowe emerytów gromadzą swoje oszczędności w postaci gotówki. Osiem z dziewięciu badanych gospodarstw domowych posiada oszczędności jedynie w formie gotówki. Większość z nich traktuje taki sposób oszczędzania w tzw. „skarpetę” jako najbardziej bezpieczny. Niektórzy z nich przyznają się, że zmieniają miejsca przechowywania gotówki w swoim domu. Często zdarza się, że miejsca te są dość

126
oryginalne, np. wazon, kieliszki, łóżko czy nawet poszewki na poduszki. Zdarza się również, iż przechowywanie oszczędności w tak wielu miejscach sprawia trudności z określeniem konkretnej kwoty jaką aktualnie dysponują. Jedynie w jednym gospodarstwie domowym oszczędności są przechowywane w bankach. Oznacza to niskie zaufanie badanych respondentów do instytucji bankowych. Ponad połowa gospodarstw domowych badanej grupy emerytów nie posiadają konta w banku i nigdy nie korzystali z jego usług. Jedynie cztery gospodarstwa na dziewięć posiadają konto w banku, ale najczęściej z powodu otrzymywania na nie emerytury, a wcześniej pensji.
W gospodarstwach domowych emerytów deklarowane były różne cele na które gospodarstwa domowe gromadzą swoje oszczędności. Do najbardziej popularnych celów na które badane gospodarstwa domowe przeznaczają swoje oszczędności zalicza się leczenie i rezerwy losowe (wykres 2). Największa ilość oszczędności, bo aż w 8 gospodarstwach domowych przeznaczana jest na cele związane z leczeniem oraz rezerwę na sytuacje losowe. Sześć gospodarstw domowych przeznacza swoje oszczędności na wydatki konsumpcyjne, opłaty stałe, remont domu oraz zabezpieczenie na okres starości. Tylko jedno spośród dziewięciu gospodarstw domowych przeznacza swoje oszczędności na wypoczynek. Wynika z tego, że wśród badanych gospodarstw domowych emeryci nie czują potrzeby odpoczynku czy wyjazdów na wakacje lub też nie mają na ten cel wystarczająco dużo środków pieniężnych.
Wykres 2. Cele na które gospodarstwa domowe emerytów gromadzą oszczędności Źródło: Opracowanie własne.

127
Podsumowanie i wnioski Wyniki badań pozwoliły określić strukturę dochodów i wydatków badanej grupy gospodarstw domowych emerytów zamieszkujących tereny wiejskie oraz odpowiedzieć na pytanie jak wygląda sytuacja społeczna tych gospodarstw. Z analizy danych GUS dotyczących dochodów gospodarstw domowych emerytów w Polsce wynika, iż emeryci są drugą po osobach pracujących na własny rachunek grupą społeczno-ekonomiczną uzyskującą najwyższe dochody. Jest to spowodowane głównie faktem, iż gospodarstwa domowe emerytów są zwykle gospodarstwami dwuosobowymi, w skutek czego dochód dzielony jest na mniejszą liczbę osób, niż w przypadku pozostałych grup zawodowych.
Przeprowadzone wyniki badania wśród 9 gospodarstw domowych emerytów zamieszkujących obszary wiejskie wskazują, iż dochody gospodarstw domowych emerytów zamieszkujących tereny wiejskie są niższe, niż w pozostałych grupach społeczno- ekonomicznych w Polsce. Dochód rozporządzalny na 1 osobę wśród emerytów w Polsce odbiega od wyników osiągniętych wśród badanej grupy emerytów na obszarach wiejskich. Wśród badanej grupy emerytów zamieszkujących gminę Dobre przeciętny miesięczny dochód na 1 osobę wynosił 1054,62 zł. Był zatem o 18,25% niższy w stosunku do średniej dla wszystkich gospodarstw domowych w Polsce w roku 2013 oraz aż o 24,83% od dochodu uzyskiwanego przez przeciętnego polskiego emeryta w 2013 roku. Na podstawie struktury wydatków gospodarstw domowych emerytów stwierdzić można, że emeryci po przejściu na emeryturę zmniejszają poziom bieżącej i przyszłej konsumpcji na rzecz zaspokojenia potrzeb zdrowotnych. Owa specyfika wydatków gospodarstw domowych emerytów przejawia się głównej mierze obserwując wydatki ponoszone na służbę zdrowia wśród emerytów w Polsce, które znajdują się na trzecim miejscu osiągając wartość 8,5%, w momencie gdy dla średniej dla Polski wynosiły jedynie 5,1%. Wśród badanej grupy gospodarstw domowych emerytów w gminie Dobre drugą co do wielkości wartość w strukturze wydatków stanowiły wydatki związane ze służbą zdrowia, które wynosiły 22,2%. Były one o 13,7 % wyższe niż wydatki przeciętnego polskiego emeryta. Z powodu stale wzrastających cen leków i usług medycznych, emeryci są zmuszeni coraz większą wartość swoich dochodów przeznaczać na służbę zdrowia, stając często przed wyborem zmniejszenia bieżącej i przyszłej konsumpcji na rzecz wykupu lekarstw. Z badań wynika także, iż badana grupa gospodarstw domowych emerytów ostrożnie dysponuje domowym budżetem, aby zaoszczędzić na wydatki nieprzewidywalne, rzadziej na zaspokojenie potrzeb konsumpcyjnych wyższego rzędu. Członkowie gospodarstw domowych po przejściu na emeryturę posiadają dużo więcej czasu wolnego, aniżeli pozostałe grupy zawodowe. Emeryci z obszarów wiejskich dzięki nieustannemu kontaktowi ze społecznością lokalną oraz życiu w zgodzie z naturą są pomimo pogarszającego się stanu zdrowia, czy świadczeń emerytalnych jakie uzyskują pozytywnie nastawieni do sytuacji życiowej w której się znajdują. Badana grupa gospodarstw domowych emerytów pomimo podeszłego wieku oraz niskiego poziomu wykształcenia jest grupą aktywną na szczeblu społeczności lokalnej i w sposób racjonalny stara się dysponować domowym budżetem. Należy również pamiętać, iż poprawa sytuacji materialnej emerytów, która dotyczy wzrostu wypłacanych emerytów w skutek corocznej waloryzacji wciąż nie jest satysfakcjonująca, aby mówić o dobrej sytuacji tej grupy społeczno – ekonomicznej.

128
Bibliografia 1. Anioła P., Gołaś Z., Zachowania oszczędnościowe gospodarstw domowych w Polsce, Wyd.
Uniwersytetu Przyrodniczego w Poznaniu, Poznań 2013, s. 33-49. 2. Białowąs S., Olejnik I., Oszczędności gospodarstw domowych w różnych fazach cyklu
koniunkturalnego, Studia Oeconomica Posnaniensia 2015, vol. 3, no 4. 3. Browning M., Lusardi A., Household Saving: Micro Theories and Micro Facts, Journal of
Economics Literature, Vol. XXXIV, s. 1797. 4. Bylok F., Zachowania konsumpcyjne ludzi starszych w Polsce na początku XXI wieku [w:]
Starość i starzenie się jako doświadczenie jednostek i zbiorowości ludzkich, pod red. nauk. J.T. Kowalski i P. Szukalski, Zakład Demografii Uniwersytetu Łódzkiego, Łódź 2006, s. 92.
5. Frączek B., Analiza czynników wpływających na oszczędzanie i inwestowanie, Studia Ekonomiczne, Uniwersytet Ekonomiczny w Katowicach, 2012, nr 122, s. 92.
6. Gutkowska K., Rodzinne gospodarstwa domowe na wsi w warunkach gospodarki rynkowej, Wyd. SGGW, Warszawa 1997, s.29.
7. Harasim J., Oszczędzanie i inwestowanie nadwyżek finansowych przez ludność, [w:] Oszczędzanie i inwestowanie w teorii i praktyce, PTE, Katowice 2010, s. 19.
8. Hirshleifer J., Investment Decision under Uncertainty: Choice-Theoretic Approaches [w:] The Quarterly Journal of Economics 1965, Vol. LXXIX, No 4, s. 509.
9. Hodoly A., Gospodarstwo domowe i jego rola społeczno-ekonomiczna, Wyd. KiW, Warszawa 1971, s. 20.
10. Keynes J. M., Ogólna teoria zatrudnienia, procentu i pieniądza, Wyd. Naukowe PWN, Warszawa 2003, s. 82.
11. Korenik D., Oszczędzanie indywidualne w Polsce, AE, Wrocław 2003, s. 25-26. 12. Kotlarska-Michalska A., Starość w aspekcie socjologicznym, Roczniki Socjologii Rodziny,
Tom 12 (2000), s. 148. 13. Mazurkiewicz-Pizło A., Enoturystyka, jako szansa rozwoju społeczno-ekonomicznego
obszarów wiejskich, wyd. TNOiK, Warszawa-Toruń, 2013, s. 225-254. 14. Mazurkiewicz-Pizło A., Jakość życia gospodarstw domowych w województwie
mazowieckim – ujęcie społeczno-ekonomiczne, [w:] Rynek pracy na obszarach wiejskich Mazowsza – perspektywa gender, Wyd. SGGW, Warszawa 2013, s. 131-163.
15. Mazurkiewicz-Pizło A., W. Pizło W., Rodzina i gospodarstwa domowe na obszarach wiejskich, [w:] Gospodarowanie w sadownictwie Grójca i Warki: Społeczno-ekonomiczne uwarunkowania rozwoju gospodarstw domowych, część II, Wyd. SGGW, Warszawa 2013, s. 39-47.
16. Mazurkiewicz-Pizło A., Pizło W., Miejsce rodziny i gospodarstwa domowego w systemie społeczno-gospodarczym, [w:] Gospodarowanie w sadownictwie Grójca i Warki. Społeczno-ekonomiczne uwarunkowania rozwoju gospodarstw domowych, Wyd. SGGW, Warszawa 2013, s..34-35.
17. Noga A., Teorie przedsiębiorstw, wyd. PWE, Warszawa 2009, s.64-67. 18. Rogowski W., Rachunek efektywności inwestycji, Oficyna a Wolers Kluwer Buisness,
Kraków 2008, s. 14 19. Rytlewska G., Kłopocka A., Wpływ czynników demograficznych na poziom i strukturę
oszczędności gospodarstw domowych w Polsce, „Bank i Kredyt” 2010 , nr.1, s. 77. 20. Szafrańska M., Matysik-Pejas R., Determinanty gromadzenia oszczędności pieniężnych przez
wiejskie gospodarstwa domowe, ACTA Scientiarum Polonolum, Oeconomia 9(3), 2010, str.266.
21. Turowski J., Socjologia wsi i rolnictwa, Wyd. KUL, Lublin 1995, passim. 22. Zalega T., Konsumpcja. Determinanty-teorie-modele, Wyd. PWE, Warszawa 2012, s. 80. 23. Żelazna K., Zarządzanie zasobami wiejskich gospodarstw domowych, Wyd. SGGW,
Warszawa 2000, s. 18.

129
Summary The aim of the article is to diagnose the size of the household savings pensioners in rural areas. The study used the following methods researchers: diagnostic survey method, observation method, and the method of documentation. The area of study was the rural municipality good, in the district of Minsk. Empirical studies were carried out in the typical for this area households of retirees. Selection of households was made by three experts: President of the Union of Pensioners and Disabled "Rainbow" in the Good, the Commune and the good doctor from the health center in Dobre. Carried out the test results of 9 households of retirees living in rural areas indicate that household income of pensioners living in rural areas are lower than in other socio-economic groups in Poland. Based on the structure of household expenses of retirees tell you that pensioners after retirement reduce the level of current and future consumption to meet health needs. The study group households of retirees in spite of old age, low educational level is a group active at the community level and in a rational way is trying to have a household budget.
Key words: savings, household, rural area Informacje o autorze: Dr hab. inż. Wojciech Pizło Szkoła Główna Gospodarstwa Wiejskiego w Warszawie Wydział Nauk Ekonomicznych ul. Nowoursynowska 166, 02-787 Warszawa e-mail: [email protected]
Emilia Głowacka Katedra Polityki Europejskiej, Finansów Publicznych i Marketingu Wydział Nauk Ekonomicznych SGGW

130
15 (64) 2016
Edyta Rudawska University of Szczecin
Ewa Frąckiewicz University of Szczecin
Małgorzata Wiścicka University of Szczecin
SUSTAINABLE MARKETING MIX – THE BASIC
ASSUMPTIONS1
The growing importance of sustainable development concept finds its consequences in companies’ marketing policy, on both micro and macro level. A new concept of sustainable marketing has emerged. It focuses on the necessity of satisfying the needs with profit, while creating, communicating and delivering value for consumers, partners and the society. Therefore concentrating activities on achieving values of social, ethical and / or environmental character, while maintaining economic efficiency, marketing can be seen as an activity, which enables the implementation of sustainable development at a company level. The article fits into the current discussion on the new management concept, including marketing activities. The goal was to identify the impact of sustainable development on marketing tools of modern organizations. The article is a review and has been prepared based on an analysis of recent literature.
Keywords: marketing, sustainable development, marketing instruments
Introduction The degradation of the natural environment, the changes in the technological or social environment of organizations operating in the market cause the expansion of the influence of sustainable development concept beyond the realm of ecologists, demographers and sociologists. Intensification of negative changes in the environment is obviously noticed on a global scale, but their effects increasingly show up in the economy at the level of individual countries, regions, local markets and even businesses. In the recent years, this implies a need to change the mind set of scientific and business circles about the role and nature of the strategy carried out by these companies. Today, their modification towards sustainable strategies, looking for sources of the company's success in maximizing economic value while creating social and environmental value in
1 Research grant financed by the National Science Centre in Poland, Harmonia Funding, registration no. 2014/14/M/HS4/00891 (Head: dr hab. prof. US Edyta Rudawska).

131
the long term, becomes necessary. The strategy of marketing, as the one that is the most committed to the relationship between the company and the environment in which it operates, appears to be undergoing through the biggest change in relation to the dissemination of the concept of sustainable development. The article fits into the current discussion on the new management concept, including marketing activities. The goal was to identify the impact of sustainable development on marketing tools of modern organizations. The article is a review and has been prepared based on an analysis of recent literature.
Marketing and the concept of sustainable development The concept of sustainable development implies the need for such a development of the economies as well as business entities, which allows satisfying present needs without compromising the ability to meet the needs of future generations [Dąbrowska, Gutkowska 2015]. Its popularization finds its consequences in companies’ marketing policy. On the micro scale the implementation of the principles of sustainable development means supporting the company's success to its long-term, sustainable development resulting from the inclusion in its activity three dimensions: economic, ecological and social one. And here the special role of marketing, which is seen as the concept included in sustainable development and the activity, which supports it, should be emphasized [Hunt 2011]. The growing importance of marketing strategies modification towards sustainable operations, which is a consequence of global change over the past few decades, has led to the emergence of the concept of sustainable marketing. It focuses on the necessity of satisfying the needs with profit, while creating, communicating and delivering value for consumers, partners and the society. Therefore concentrating activities on achieving values of social, ethical and / or environmental character, while maintaining economic efficiency, marketing can be seen as an activity, which enables the implementation of sustainable development at a company level.
A company with sustainable oriented marketing is the one in which the rule of transparency covers an area of all marketing tools. From the traditional point of view, they are limited to product, price, distribution and promotion. In this article it is proposed to broaden a set of marketing tools by the company personnel, previously linked primarily to the sphere of service, due to the strongly emphasized and highlighted role of personnel in the strategies of globalizing companies. Moreover, so far the concept of 4P or 5P was related to the area of cooperation between the company and its customers. In sustainable marketing concept it also relates to the company itself, its investors and shareholders as well as communities and the government.
Assumptions for sustainable product policy Streams of products flooding the world pose significant social and environmental problems. The development of the concept of sustainable product fits into actions for sustainable development and should be run through discussion on the economic, social and environmental goals [Pabian 2011].
The product will be sustainable if it takes into account aspects of environmental, social and economic nature: the features and characteristics of the product assortment,

132
brand, accompanying services, but also raw material sourcing, transportation, storage, production, sale, use and recycling [Pabian 2011]. Sustainable product and/or service is defined as an offer serving customer needs while fostering the implementation of environmental and social objectives, in the whole of the product life cycle. Sustainable product should be characterized by several key characteristics: - enable to satisfy customer needs. - durability of the product - sustainable product should enable meeting the needs
of the customer in the long term, - the dual nature of sustainable offers, i.e. the implementation of social and environmental aspects. Unlike the organic, sustainable products should focus on social and environmental aspects, - broad understanding of the product life cycle - from raw material acquisition stage, through transport and manufacturing to use and post - use, - continuous improvement of products – sustainable products and services are not absolute measures but are dependent on the state of knowledge, the latest technologies and societal aspirations, which change over time. Hence there is a need for continuous improvement of offers regarding changing customers’ needs as well as changing social and ecological environment, - taking into account the significant improvements - sustainable products have to make a worthwhile contribution to tackling socio-ecological problems for both: the target group and the society, - transparency, not only in terms of the level of the service quality or product performance assessment, but also the manufacturing process (including the type of sources and their origin) [Belz 2012].
The concept of sustainable product includes all aspects in the product life cycle, i.e., from obtaining raw materials and semi-finished products through its production, and its total elimination from the environment (this process is referred to the "from cradle to grave" [Wolf 2013]. In this context, sustainable offers should meet the following requirements: cyclicality (pass the full life cycle without harming the environment), efficiency (the use of available resources, but not degrading the environment), no impurities (in the whole product life cycle) [Emery 2012]. Thanks to them it is possible to reduce the negative impact on the natural environment of manufactured products. The control of this process is carried out at the conceptual stage through the Environmental Product Declaration (EPD) [Rutkowski 2011]. This is a detailed description of the product and the manufacturing process, ecological balance, i.e. data relating to the impact of the product on the environment, as well as guidelines for using of product collected in one document.
The latest concept of marketing implies the necessity to concentrate not so much on providing a specific product, but on broadly defined customer value to gain competitive advantage. That value for the customer today also stems from the activities of the supplier demonstrating its commitment to creating offers, which have a significant influence on eliminating undesirable socio-environmental issues.

133
Objectives and opportunities of sustainable prices Undoubtedly, another marketing mix tool, which is difficult to harmonize with the concept of sustainable marketing, is the price. On the one hand, sustainable products have higher prices than other offers, which is an important barrier on the demand side [Pabian 2015]. On the other hand, it is the only tool for the company, which directly contributes to the size of the generated revenues, and therefore if main tool for gaining competitive advantage on the global market. Thus, shaping the pricing policies is a particularly important and sensitive element of company management. The inclusion of sustainable marketing principles additionally makes it more complex. It goes beyond internal costs incurred by the company. Sustainable marketing concept is not confined to calculating the economic costs, but also takes into account the social and environmental costs. Moreover, an estimation of the amount of costs should be analysed from the point of view of both company and all stakeholders.
Setting prices in a sustainable manner means for the company the necessity to: − research the possibility of connecting prices with important social or
environmental issue, − identify opportunities for growth in margins and/or increasing the
competitiveness of the prices combining them with ecological impacts, − identify the price level, which will be accepted by customers thanks to the
features possessed by the product, − include overall social and environmental costs in the price while providing
benefits for the buyer and a fair profit level for the seller [Martin, Schouten 2012 ]. In particular, the last point is the biggest challenge. It derives from the fact that
it is very difficult to track location, moments of expenses as well as to estimate their amount. As a result, it is not easy to allocate them to a specific organization and enforce them. This means that also for objective reasons the market price may not cover the full cost. The change in this situation would require that all participants in the production and sales process would lead policies compatible with the idea of sustainable marketing.
The consequences of recognition of the concept of sustainable development in pricing policy will also be reflected in the price calculation from the point of view of the customer. In this case the attention of managers setting the price should be focused on all the costs borne by the purchaser. Although the concept of total costs of the buyer is not new, in sustainable marketing a broader, holistic view is proposed. Apart from purchase costs, the costs of use, modernization and products disposal are included. In addition, the opportunities to reduce them are analyse. Therefore, the most important goal, but at the same time difficulty in the process of adaptation of sustainable principles in pricing policy is calculating the total costs that are incurred in the full product life cycle.
Cooperation and costs of sales channels The concept of sustainable development has also its consequences in the company's distribution policy. Physical distribution of goods and services has both direct and indirect impact on the environment. A thorough knowledge of the full cost, their amount and the kind is the basis for the design of distribution policy. It enables a reduction of

134
economic, social and environmental costs, which is one of the main objectives of the management of flow in distribution channels in a sustainable way. In practice, factors determining the implementation of sustainable marketing idea include cooperation in distribution channels taking into account the requirements of environmental protection, the choice of suppliers who have appropriate certificates certifying their activities, in accordance with sustainable development, the reduction of energy consumption in the process of supplying products, re-using or recycling, responsible policy related to the design, construction and recycling of packaging and cooperation with customers in the field of environmental protection, eg. through the organization in places of sale points of collection of used products. Because the essence of distribution policy is to reach out to customers in the right place and time with the right product, the key seems to be seeking answers to the question: How to reach consumers through new/modified distribution channels allowing minimizing the negative impact on the socio-ecological environment? This issue fits into the concept of green supply chain management. M. Ciesielski defines it as "maximizing customer service levels while minimizing costs and minimizing negative impacts on the environment” [Ciesielski 2011]. Hence, a sustainable marketing takes into account issues such as:
− at the side of the company – the control of the selection of suppliers, integration of the supply processes, manufacturing, delivery, returns handling, recycling processes, and waste management for fulfilling social and environmental standards,
− at the side of the client - the organization of responsible sales system, taking into account the distance between producer and customer, the sales outlets are also places for recycling used products. As in the case of sustainable marketing mix discussed earlier, distribution
policy is also characterized with a higher complexity than in the traditional approach. Nevertheless, its implementation should bring many advantages. These are: positive impact on the environment, through obtaining, storing and retrieving products which do not have negative impact on nature, costs reduction (e.g. related to emissions of pollutions) and customer service improvements [Mesjasz-Lech 2014].
Responsible communication Referring to another traditional marketing mix tool, i.e. the promotion, it has to be emphasized that its primary purpose is to give credibility to the company as an entity implementing marketing strategy in a sustainable way. Thus the method of its application should ensure open, transparent, interactive and holistic communication between the company and its customers [Beltz 2012]. Undoubtedly, the realization of this task raises a lot of controversy. From promotional activities, including advertising, personal selling, sale promotion and PR an increase in demand is expected. Focusing on this task leads to encouraging customers to make additional purchases also in a situation where the products are unnecessary and may even be harmful in the long term. However, in sustainable marketing concept the process of exchanging information has a much different character. It is based on an interactive dialogue, following the actual needs and expectations of the customer. In the promotional campaigns companies operating in a

135
sustainable way will of course encourage to purchase their offers, but at the same time underline the products and brands features, which meet the socio-ecological requirements. When taking the discussion on the kind of media used for giving content by the company, attention is directed, among others: on the type of equipment used, the overall economic, social and environmental cost of producing it, the infrastructure for operating and disposal costs ( e.g. old, unused leaflets). In this context traditional means, like television, press and radio are rated worse than the Internet, which allows a reduction in the use of materials. One has to agree here that the global network will not eliminate them completely, for that the on-line communication requires suitable devices [Trojanowski 2013]. Their growing popularity and diversity leads up even to the phenomenon reverse to the idea of sustainable development and strategies of aging the products.
The role of customer is also emphasized in the sustainable marketing communication. He becomes a creator of the content and shares it not only with the company but with other customers as well. This fact makes that communication process is more and more often beyond the company's control (e.g. EWOM). That's why communication in sustainable marketing is the inclusion of a company in a dialogue with various stakeholders. This corresponds to a broad approach to marketing communications, but with a significantly extended circle of influence and integrating a variety of communication channels. Undoubtedly, sustainable marketing concept also exposes an educational role of promotion. As it was previously indicated, products or services provided by companies operating in a sustainable way have a higher price, thus the image of luxury products. Meanwhile, their purchase should not be judged as snobbish, but conscious and responsible behaviour of the buyer. According to the World Business Council for Sustainable Development (WBCSD), the overarching objective is supporting consumers in eco-efficient choices, sustainable goods and services. Such goods contain fewer harmful elements, can be better recycled or longer used by consumers. This is where the marketing can play a fundamental role, as a way to stimulate and reinforce rational and responsible consumption.
Sustainable marketing activities in relation to employees An important tool of sustainable marketing is the organization staff recognized in modern management concept as one of the most valuable assets of the organization [Gotowska, Jakubczak 2015]. Employees are an integral part of the sustainable marketing strategy, because they directly implement its foundation and thus determine the effectiveness in achieving its objectives. The strength of relations between employees and the organization, identification with the company philosophy and strategy, their commitment to the development of the entity creates a huge potential for effective implementation in sustainable marketing. Employees, as one of the key stakeholder groups, in addition to customers and shareholders should be addressed a carefully planned and consistently implemented long-term actions that can be defined as sustainable internal marketing. Among these actions one can indicate a few most important. First, integration, internal communication and social dialogue, which takes into account the needs of employees. These actions may contribute to the elimination of crises; provide opportunities for joint development, i.e. both the company and
136
employees. Secondly, these activities include safety in the workplace and health care and employees' rights. Creating a safe and healthy working conditions as well as the state of health of the workforce result in the quality of their work. Companies conducting marketing activities aimed at employees that are consistent with the concept of sustainable development face the necessity of not admitting to any form of discrimination with regard to working conditions (access to promotion, hiring and firing policies, etc.). Another group of activities includes training, remuneration and promotion system, opportunities and participation of employees in the development of the organization. The successful implementation of sustainable marketing related to employees is determined whether employees will be involved in the decision-making processes within the organization and whether they become the co-creators of marketing strategies and at the same time people jointly responsible for their success. Creating proper conditions for submitting ideas of changes, organizational improvements or innovations in the customer value seems to be crucial in this process. An important part of a sustainable internal marketing is also employee volunteering. Company engagement in the socio-ecological initiatives as well as informing and educating employees in this area as well as encouraging employees to engage in them enables the realization of win-win-win strategy, i.e. that will result in the achievement of benefits by employees (team integration, self-realization, satisfaction, pride), company (greater involvement of employees, improvement in the atmosphere at work) as well as the environment. Finally, the creation of company friendly to parents and ensuring the harmony between work and private live (work-life-balance), i.e. offering a flexible/reduced working time, individual setting of schedule or telecommuting opportunities, play an important role as far as sustainable internal marketing is concerned.
Implementation of sustainable marketing programs among employees creates new opportunities to build a better employee morale, increases their motivation and job satisfaction - and consequently productivity, creativity and innovation. It also seems an invaluable tool for creating their loyalty to the employer, as not only financial incentives but also those intangible ones decide today about the attitudes of employees to the organization. Company image, so-called employer branding created by activities in the field of sustainable marketing play in this process invaluable role. It also creates opportunities for acquiring new, valuable employees in the future.
Conclusions We are facing today significant changes of a global nature. Environmental degradation, demographic collapse in developed countries and increasing social problems caused largely by an excessive consumption mean that issues related to sustainable development of enterprises become current and critical. Marketing activities run by companies are seen as one of the sources of emerging problems. It is perceived as the one that is responsible for shaping many bad behaviours and habits of customers leading to over-consumption, manipulation of information being given to customers or "artificial" product differentiation. The current criticism of marketing in many aspects is right. Its concept, and in particular the practice, insufficiently exposes the role and importance of the customer to the company. For a long time this activity was in fact seen exclusively as a tool for sale and profit increase.

137
Hence, modern marketing faces currently a new challenge regarding such a creation of marketing instruments that will contribute to achieving both financial benefits and positive socio-environmental changes. Of course, the meaning and scope of various sustainable marketing tools will vary depending on the size of the company, the industry in which it operates or its organizational culture. For example, one of the world’s biggest mining companies – KGHM, takes a lot of strategic projects such as: “zero harm”, programme of land reclamation, social dialogue with local communities, support children and young people, protection the breeding sites of falcons, sport sponsorship, voluntary service etc. Usually, activities of small and medium-sized enterprises are not so complex. In some cases they will be mainly focused on creating a more ‘sustainable’ product, in others on the promotional activities associated with engaging in social events of major importance to the community, and yet in others marketers are going to implement sustainable marketing concept through a complete correction and re-development of the individual marketing tools. In each of these situations managers’ awareness regarding to the need of implementing sustainable marketing activities and eco-friendly and pro-social attitude of all participants in the value chain is important.
References 1. Beltz B.F., Peattie K.: Sustainability marketing. A Global Perspective, Wiley, Chichester
2012 2. Ciesielski M.: Supply Chain Management, PWE, Warsaw 2011 3. Dąbrowska A., Gutkowska K.: Collaborative consumption as a new trend of sustainable
consumption, Acta Scientiarum Polonorum Oeconomica, No. 14 (2)/2015 4. Emery B.: Sustainability Marketing, Pearson, London 2012 5. Hunt S.: Sustainable Marketing, Eguity, and Economic Growth: a Resource-Advantage
Economic Freedom Approach, Journal of the Academy of Marketing Science Vol. 39, No. 1/2011
6. Jakubczak A., Gotowska M.: The quality of work life and socially responsible actions directed at employees on the example of a service company, Acta Scientiarum Polonorum Oeconomica, Vol. 14, No. 1/2015
7. Martin D., Schouten J.: Sustainable Marketing, Prentice Hall, New York 2012 8. Mesjasz-Lech A.: Reasons of development of green supply chains, Logistics, No. 5/2014 9. Pabian A.: Product strategy in sustainable marketing activities in: Strategic choices in
enterprises. Functional strategies, Urbanowska-Sojkin E. (ed.), EU Poznań, ZN No. 172/2011
10. Pabian A.: Sustainable prices as an element of the marketing mix, Marketing and Market, No. 4/2015
11. Rutkowski I.: Strategies of sustainable development of new products in the area of relationship technology-product-market, in Strategic choices in enterprises. Functional strategies, Urbanowska-Sojkin E. (ed.), EU Poznań, ZN No. 172/2011
12. Trojanowski T.: Sustainable Marketing Communications, Economics and Business Administration, No. 10/2013
13. Wolf I.: Corporate marketing activity conditions for sustainable development: Finance and Marketing Management Problems, ZN University of Szczecin, Szczecin No. 775/2013

138
Streszczenie Rosnące znaczenie koncepcji zrównoważonego rozwoju znajduje swoje konsekwencje w polityce marketingowej współczesnych organizacji, zarówno na poziomie mikro jak i makro. W ostatnich latach pojawiła się koncepcja zrównoważonego marketingu. Koncentruje się ona na konieczności zaspokajania potrzeb z zyskiem, przy jednoczesnym tworzeniu, komunikowaniu i dostarczaniu wartości dla konsumentów, partnerów i społeczeństwa. Dążąc do kreowania wartości o charakterze społecznym, etycznym i/lub środowiskowym przy zachowaniu efektywności ekonomicznej marketing jest postrzegany jako aktywność umożliwiająca realizację koncepcji zrównoważonego rozwoju na poziomie przedsiębiorstwa. Artykuł wpisuje się w aktualną dyskusję na temat nowej koncepcji zarządzania, w tym koncepcji zarządzania marketingowego. Celem opracowania jest określenie wpływu koncepcji zrównoważonego rozwoju na charakter instrumentarium marketingowego oddziaływania współczesnych organizacji. Artykuł ma charakter przeglądowy i został przygotowany w oparciu o analizę najnowszej literatury przedmiotu.
Słowa kluczowe: marketing, zrównoważony rozwój, instrumenty marketingowe Informacja o Autorach:
Dr hab. Prof. US Edyta Rudawska Dr hab. Prof. US Ewa Frąckiewicz Dr Małgorzata Wiścicka University of Szczecin Faculty of Economics and Management [email protected] Mickiewicza 64 71-101 Szczecin

139
15 (64) 2016
Łukasz Satoła Uniwersytet Rolniczy w Krakowie
Wykorzystanie funduszy Unii Europejskiej na inwestycje komunalne a ograniczanie zadłużenia samorządów
THE USE OF EUROPEAN UNION FUNDS FOR MUNICIPAL
INVESTMENTS AND LIMITING DEBT OF LOCAL GOVERNMENTS
Integracja europejska w znaczącym stopniu zmieniła warunki funkcjonowania jednostek samorządu terytorialnego głównie za sprawą dostępności funduszy strukturalnych. Obecnie wiele podejmowanych przez gminy działań, szczególnie inwestycyjnych odbywa się przy udziale dofinansowania w ramach instrumentów polityki regionalnej UE. Pozyskane fundusze z jednej strony stanowią wsparcie dla lokalnych budżetów, z drugiej zaś powodują wzrost wydatków, które często finansowane są z kredytów. Celem artykułu jest identyfikacja relacji zachodzących pomiędzy zrealizowanymi przy wsparciu finansowym inwestycjami komunalnymi a nowo wprowadzonymi wskaźnikami zadłużenia. Polskie gminy cechowało duże zróżnicowanie poziomu wykorzystania funduszy UE. Nowe limity zadłużenia mogą ograniczać zdolności absorpcyjne samorządów w konsekwencji spłat odsetek od zaciąganych w przeszłości zobowiązań.
Słowa kluczowe: ekonomia sektora publicznego, fundusze strukturalne, gmina, polityka regionalna, sytuacja finansowa gmin, zadłużenie
Wstęp Jednostki samorządu terytorialnego (JST) zaliczane są do tej części sektora publicznego, której zadaniem jest dostarczanie dóbr i usług publicznych w zdecentralizowany sposób. Jak wskazują międzynarodowe doświadczenia zastosowanie lokalnego podejścia (decentralizacja funkcji państwa) prowadzi do osiągania wyższej wartości efektywności alokacyjnej wydatków publicznych1. Samorząd terytorialny w większym stopniu niż władze centralne odwzorowuje skalę preferencji lokalnych, co w konsekwencji powoduje lepsze rozpoznanie i adresowanie usług publicznych.
Podejmowane przez samorządy zadania służą zarówno bieżącemu funkcjonowaniu, jak i realizacji przedsięwzięć inwestycyjnych, bez których nie może dokonywać się rozwój jednostki terytorialnej2. Realizacja niektórych zadań publicznych
1 Oates W., Fiscal federalism, Harcourt Brace Jovanovich, New York 1972. 2 Por. Prus P., Wawrzyniak B. M. Zarządzanie projektami i funkcje gmin w zakresie programów rozwoju obszarów wiejskich. Studia i Materiały Polskiego Stowarzyszenia Zarządzania Wiedzą, 2011, nr 44, s. 77-92.
140
odbywa się na zasadzie współpracy (związku, porozumienia) z innymi jednostkami administracji publicznej3. Zadania te stanowią podstawowe narzędzie wykorzystywane w procesie planowania oraz wdrażania w życie zróżnicowanych koncepcji rozwoju. Mogą one bowiem stymulować lub hamować tempo oraz zakres przemian w zależności od stanu i poziomu zróżnicowania zasobów, a także stopnia atrakcyjności i konkurencyjności przestrzeni społeczno-gospodarczej, jakim charakteryzuje się dana jednostka samorządu terytorialnego4.
Od momentu integracji Polski ze strukturami UE duże zmiany nastąpiły szczególnie w zakresie podejmowania przez samorządy działalności inwestycyjnej. Pojawiły się bowiem możliwości uzyskania dofinansowania w ramach wdrażanych instrumentów polityki regionalnej.
Realizacja projektów inwestycyjnych, w tym również współfinansowanych z funduszy UE wymaga od JST dużego zaangażowania finansowego, które często przekracza ich możliwości budżetowe. W takich sytuacjach konieczne jest korzystanie ze zwrotnych źródeł finansowania, tzn. zaciąganie kredytów, a w przypadku części samorządów również emisja obligacji komunalnych. Wszystkie te sposoby prowadzą w konsekwencji do wzrostu zadłużenia.
Celem artykułu jest identyfikacja relacji zachodzących pomiędzy zrealizowanymi przy wsparciu finansowym inwestycjami komunalnymi a nowo wprowadzonymi wskaźnikami zadłużenia.
Materiał i metodyka opracowania Materiał empiryczny do prowadzonych analiz został pozyskany z baz danych Ministerstwa Finansów obejmujących kształtowanie się poszczególnych parametrów sytuacji ekonomicznej JST. Te dane wykorzystane zostały do obliczenia wartości indywidualnych wskaźników zadłużenia (IWZ) samorządów. Drugim istotnym źródłem informacji były zasoby Banku Danych Lokalnych Głównego Urzędu Statystycznego (BDL GUS). Posłużyły one do oceny poziomu absorpcji funduszy strukturalnych w poszczególnych JST.
Zakres czasowy prowadzonych analiz ze względu na zachowanie zasady porównywalności danych ograniczono do okresu 2011-2014. Zakres podmiotowy analizy stanowią wszystkie jednostki samorządu terytorialnego szczebla podstawowego w Polsce (2478 gmin).
Do oceny stopnia wykorzystania funduszy UE posłużono się wskaźnikiem pozyskanego dofinansowania na mieszkańca obliczonym według formuły:
m
dpm L
WW = , gdzie:
Wpm – wskaźnik wykorzystania funduszy UE na mieszkańca [zł/os.], Wd – wykorzystana kwota dofinansowania [zł],
3 Zob. Milewska, A., Jóźwik, M. Organization and changes of local government finance system in view of implementation of participatory budgeting. Acta Scientiarum Polonorum Oeconomia, 13 (4), 2014, s. 125-134. 4 Paluch Ł., Sroka W., Socio-economic and environmental determinants of sustainable development of rural communes in Małopolska Province. Acta Scientiarum Polonorum Oeconomia, 12 (2), 2013, s. 65-76.
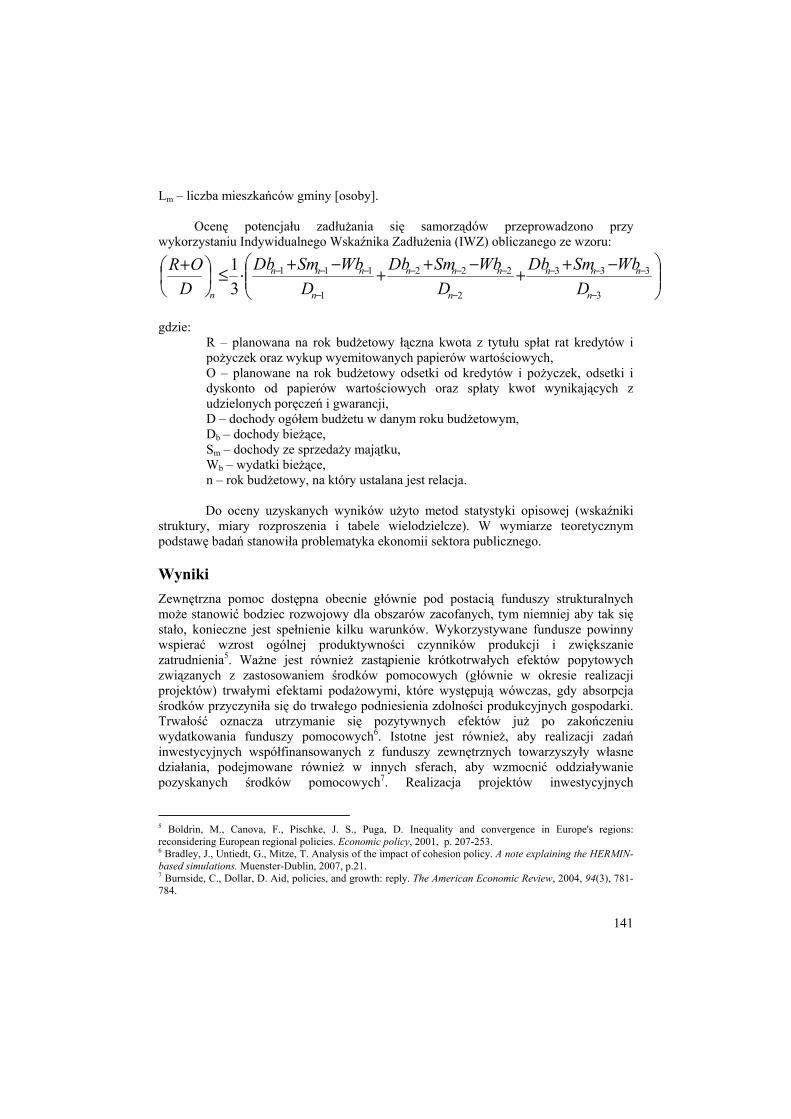
141
Lm – liczba mieszkańców gminy [osoby]. Ocenę potencjału zadłużania się samorządów przeprowadzono przy
wykorzystaniu Indywidualnego Wskaźnika Zadłużenia (IWZ) obliczanego ze wzoru:
⎟⎟⎠
⎞⎜⎜⎝
⎛ −++−++−+⋅≤⎟⎠⎞
⎜⎝⎛ +
−
−−−
−
−−−
−
−−−
3
333
2
222
1
111
31
n
nnn
n
nnn
n
nnn
n DWbSmDb
DWbSmDb
DWbSmDb
DOR
gdzie:
R – planowana na rok budżetowy łączna kwota z tytułu spłat rat kredytów i pożyczek oraz wykup wyemitowanych papierów wartościowych, O – planowane na rok budżetowy odsetki od kredytów i pożyczek, odsetki i dyskonto od papierów wartościowych oraz spłaty kwot wynikających z udzielonych poręczeń i gwarancji, D – dochody ogółem budżetu w danym roku budżetowym, Db – dochody bieżące, Sm – dochody ze sprzedaży majątku, Wb – wydatki bieżące, n – rok budżetowy, na który ustalana jest relacja.
Do oceny uzyskanych wyników użyto metod statystyki opisowej (wskaźniki
struktury, miary rozproszenia i tabele wielodzielcze). W wymiarze teoretycznym podstawę badań stanowiła problematyka ekonomii sektora publicznego.
Wyniki Zewnętrzna pomoc dostępna obecnie głównie pod postacią funduszy strukturalnych może stanowić bodziec rozwojowy dla obszarów zacofanych, tym niemniej aby tak się stało, konieczne jest spełnienie kilku warunków. Wykorzystywane fundusze powinny wspierać wzrost ogólnej produktywności czynników produkcji i zwiększanie zatrudnienia5. Ważne jest również zastąpienie krótkotrwałych efektów popytowych związanych z zastosowaniem środków pomocowych (głównie w okresie realizacji projektów) trwałymi efektami podażowymi, które występują wówczas, gdy absorpcja środków przyczyniła się do trwałego podniesienia zdolności produkcyjnych gospodarki. Trwałość oznacza utrzymanie się pozytywnych efektów już po zakończeniu wydatkowania funduszy pomocowych6. Istotne jest również, aby realizacji zadań inwestycyjnych współfinansowanych z funduszy zewnętrznych towarzyszyły własne działania, podejmowane również w innych sferach, aby wzmocnić oddziaływanie pozyskanych środków pomocowych7. Realizacja projektów inwestycyjnych
5 Boldrin, M., Canova, F., Pischke, J. S., Puga, D. Inequality and convergence in Europe's regions: reconsidering European regional policies. Economic policy, 2001, p. 207-253. 6 Bradley, J., Untiedt, G., Mitze, T. Analysis of the impact of cohesion policy. A note explaining the HERMIN-based simulations. Muenster-Dublin, 2007, p.21. 7 Burnside, C., Dollar, D. Aid, policies, and growth: reply. The American Economic Review, 2004, 94(3), 781-784.
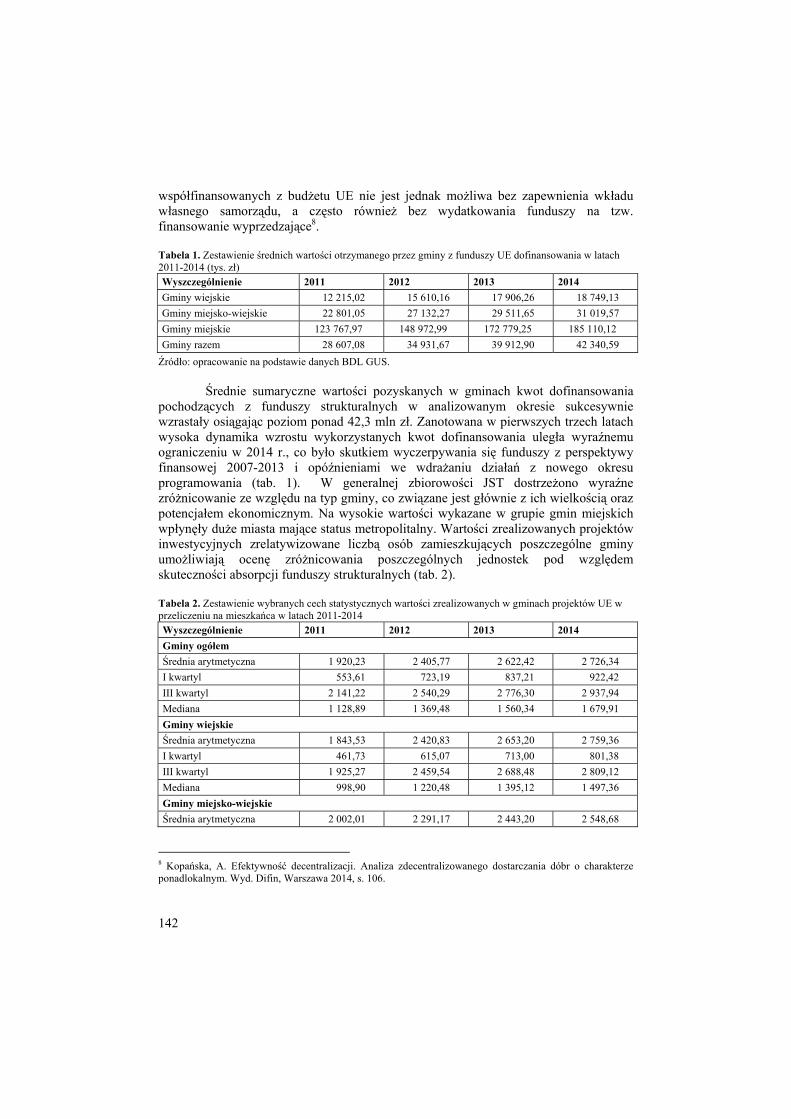
142
współfinansowanych z budżetu UE nie jest jednak możliwa bez zapewnienia wkładu własnego samorządu, a często również bez wydatkowania funduszy na tzw. finansowanie wyprzedzające8.
Tabela 1. Zestawienie średnich wartości otrzymanego przez gminy z funduszy UE dofinansowania w latach 2011-2014 (tys. zł) Wyszczególnienie 2011 2012 2013 2014 Gminy wiejskie 12 215,02 15 610,16 17 906,26 18 749,13 Gminy miejsko-wiejskie 22 801,05 27 132,27 29 511,65 31 019,57 Gminy miejskie 123 767,97 148 972,99 172 779,25 185 110,12 Gminy razem 28 607,08 34 931,67 39 912,90 42 340,59 Źródło: opracowanie na podstawie danych BDL GUS.
Średnie sumaryczne wartości pozyskanych w gminach kwot dofinansowania
pochodzących z funduszy strukturalnych w analizowanym okresie sukcesywnie wzrastały osiągając poziom ponad 42,3 mln zł. Zanotowana w pierwszych trzech latach wysoka dynamika wzrostu wykorzystanych kwot dofinansowania uległa wyraźnemu ograniczeniu w 2014 r., co było skutkiem wyczerpywania się funduszy z perspektywy finansowej 2007-2013 i opóźnieniami we wdrażaniu działań z nowego okresu programowania (tab. 1). W generalnej zbiorowości JST dostrzeżono wyraźne zróżnicowanie ze względu na typ gminy, co związane jest głównie z ich wielkością oraz potencjałem ekonomicznym. Na wysokie wartości wykazane w grupie gmin miejskich wpłynęły duże miasta mające status metropolitalny. Wartości zrealizowanych projektów inwestycyjnych zrelatywizowane liczbą osób zamieszkujących poszczególne gminy umożliwiają ocenę zróżnicowania poszczególnych jednostek pod względem skuteczności absorpcji funduszy strukturalnych (tab. 2).
Tabela 2. Zestawienie wybranych cech statystycznych wartości zrealizowanych w gminach projektów UE w przeliczeniu na mieszkańca w latach 2011-2014 Wyszczególnienie 2011 2012 2013 2014 Gminy ogółem Średnia arytmetyczna 1 920,23 2 405,77 2 622,42 2 726,34 I kwartyl 553,61 723,19 837,21 922,42 III kwartyl 2 141,22 2 540,29 2 776,30 2 937,94 Mediana 1 128,89 1 369,48 1 560,34 1 679,91 Gminy wiejskie Średnia arytmetyczna 1 843,53 2 420,83 2 653,20 2 759,36 I kwartyl 461,73 615,07 713,00 801,38 III kwartyl 1 925,27 2 459,54 2 688,48 2 809,12 Mediana 998,90 1 220,48 1 395,12 1 497,36 Gminy miejsko-wiejskie Średnia arytmetyczna 2 002,01 2 291,17 2 443,20 2 548,68
8 Kopańska, A. Efektywność decentralizacji. Analiza zdecentralizowanego dostarczania dóbr o charakterze ponadlokalnym. Wyd. Difin, Warszawa 2014, s. 106.

143
I kwartyl 706,97 842,57 986,78 1 070,60 III kwartyl 2 285,44 2 541,09 2 761,23 2 930,27 Mediana 1 350,71 1 530,69 1 703,96 1 876,32 Gminy miejskie Średnia arytmetyczna 2 151,85 2 553,56 2 816,51 2 905,95 I kwartyl 892,78 1 070,23 1 296,83 1 366,96 III kwartyl 2 489,83 2 828,02 3 133,46 3 379,08 Mediana 1 567,46 1 772,04 2 045,54 2 114,09 Źródło: opracowanie na podstawie danych BDL GUS.
Wartość współfinansowanych projektów w przeliczeniu na mieszkańca wykazywała rosnącą tendencję w okresie 2011-2014, tym niemniej dynamika wzrostu była każdego roku niższa. Relatywnie najwyższe kwoty zdołały pozyskać miasta, natomiast przeciętnie najniższe wartości stwierdzono dla gmin miejsko-wiejskich, tym niemniej zróżnicowanie pomiędzy grupami nie było w tym przypadku duże.
Istotną obserwacją jest fakt, że zarówno rozkład w całej zbiorowości generalnej, jak i w poszczególnych grupach gmin charakteryzował się silną prawostronną skośnością. Oznacza to, że obok relatywnie licznej populacji samorządów, które zdołały zrealizować na swoim terytorium stosunkowo niewielkie projekty inwestycyjne, istniała dosyć nieliczna grupa podmiotów, które pozyskały dofinansowanie znacznie przekraczające obliczone wartości średnie (w wielu przypadkach, szczególnie w grupie gmin wiejskich wartości średniej arytmetycznej są zbliżone do III kwartyla rozkładu zmiennej).
Obok analizy wartości zrealizowanych projektów inwestycyjnych ocenie poddano również wskaźnik wartości pozyskanego dofinansowania na mieszkańca (rys. 1).
Rysunek 1. Wysokość dofinansowania uzyskanego na realizację inwestycji (zł/mieszkańca gminy) w latach 2011-2014 Źródło: opracowanie na podstawie danych BDL GUS.
Najbardziej dynamiczny wzrost wysokości uzyskanego dofinansowania per capita odnotowano w roku 2012, później tendencja wzrostowa została wyhamowana. Warto zwrócić uwagę, że istniejące na początku okresu analizy różnice pomiędzy różnymi typami gmin z każdym kolejnym rokiem ulegały ograniczeniu i w ostatnim
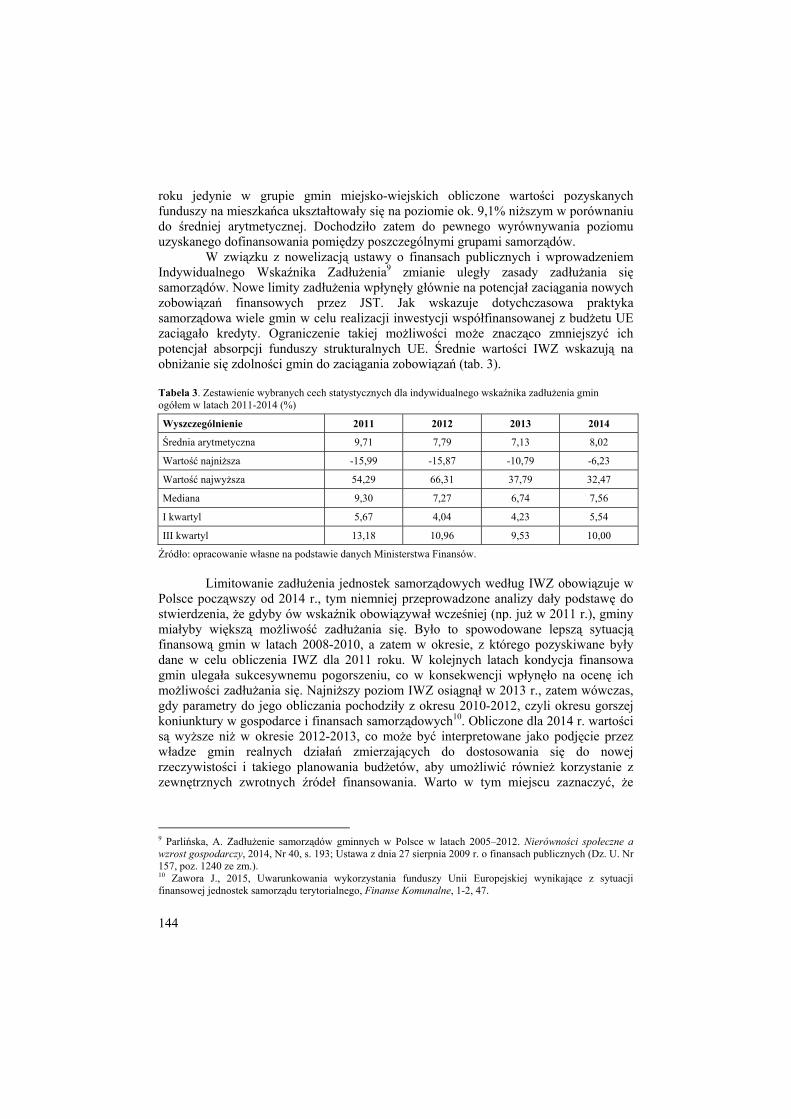
144
roku jedynie w grupie gmin miejsko-wiejskich obliczone wartości pozyskanych funduszy na mieszkańca ukształtowały się na poziomie ok. 9,1% niższym w porównaniu do średniej arytmetycznej. Dochodziło zatem do pewnego wyrównywania poziomu uzyskanego dofinansowania pomiędzy poszczególnymi grupami samorządów.
W związku z nowelizacją ustawy o finansach publicznych i wprowadzeniem Indywidualnego Wskaźnika Zadłużenia9 zmianie uległy zasady zadłużania się samorządów. Nowe limity zadłużenia wpłynęły głównie na potencjał zaciągania nowych zobowiązań finansowych przez JST. Jak wskazuje dotychczasowa praktyka samorządowa wiele gmin w celu realizacji inwestycji współfinansowanej z budżetu UE zaciągało kredyty. Ograniczenie takiej możliwości może znacząco zmniejszyć ich potencjał absorpcji funduszy strukturalnych UE. Średnie wartości IWZ wskazują na obniżanie się zdolności gmin do zaciągania zobowiązań (tab. 3). Tabela 3. Zestawienie wybranych cech statystycznych dla indywidualnego wskaźnika zadłużenia gmin ogółem w latach 2011-2014 (%)
Wyszczególnienie 2011 2012 2013 2014
Średnia arytmetyczna 9,71 7,79 7,13 8,02
Wartość najniższa -15,99 -15,87 -10,79 -6,23
Wartość najwyższa 54,29 66,31 37,79 32,47
Mediana 9,30 7,27 6,74 7,56
I kwartyl 5,67 4,04 4,23 5,54
III kwartyl 13,18 10,96 9,53 10,00
Źródło: opracowanie własne na podstawie danych Ministerstwa Finansów.
Limitowanie zadłużenia jednostek samorządowych według IWZ obowiązuje w Polsce począwszy od 2014 r., tym niemniej przeprowadzone analizy dały podstawę do stwierdzenia, że gdyby ów wskaźnik obowiązywał wcześniej (np. już w 2011 r.), gminy miałyby większą możliwość zadłużania się. Było to spowodowane lepszą sytuacją finansową gmin w latach 2008-2010, a zatem w okresie, z którego pozyskiwane były dane w celu obliczenia IWZ dla 2011 roku. W kolejnych latach kondycja finansowa gmin ulegała sukcesywnemu pogorszeniu, co w konsekwencji wpłynęło na ocenę ich możliwości zadłużania się. Najniższy poziom IWZ osiągnął w 2013 r., zatem wówczas, gdy parametry do jego obliczania pochodziły z okresu 2010-2012, czyli okresu gorszej koniunktury w gospodarce i finansach samorządowych10. Obliczone dla 2014 r. wartości są wyższe niż w okresie 2012-2013, co może być interpretowane jako podjęcie przez władze gmin realnych działań zmierzających do dostosowania się do nowej rzeczywistości i takiego planowania budżetów, aby umożliwić również korzystanie z zewnętrznych zwrotnych źródeł finansowania. Warto w tym miejscu zaznaczyć, że
9 Parlińska, A. Zadłużenie samorządów gminnych w Polsce w latach 2005–2012. Nierówności społeczne a wzrost gospodarczy, 2014, Nr 40, s. 193; Ustawa z dnia 27 sierpnia 2009 r. o finansach publicznych (Dz. U. Nr 157, poz. 1240 ze zm.). 10 Zawora J., 2015, Uwarunkowania wykorzystania funduszy Unii Europejskiej wynikające z sytuacji finansowej jednostek samorządu terytorialnego, Finanse Komunalne, 1-2, 47.
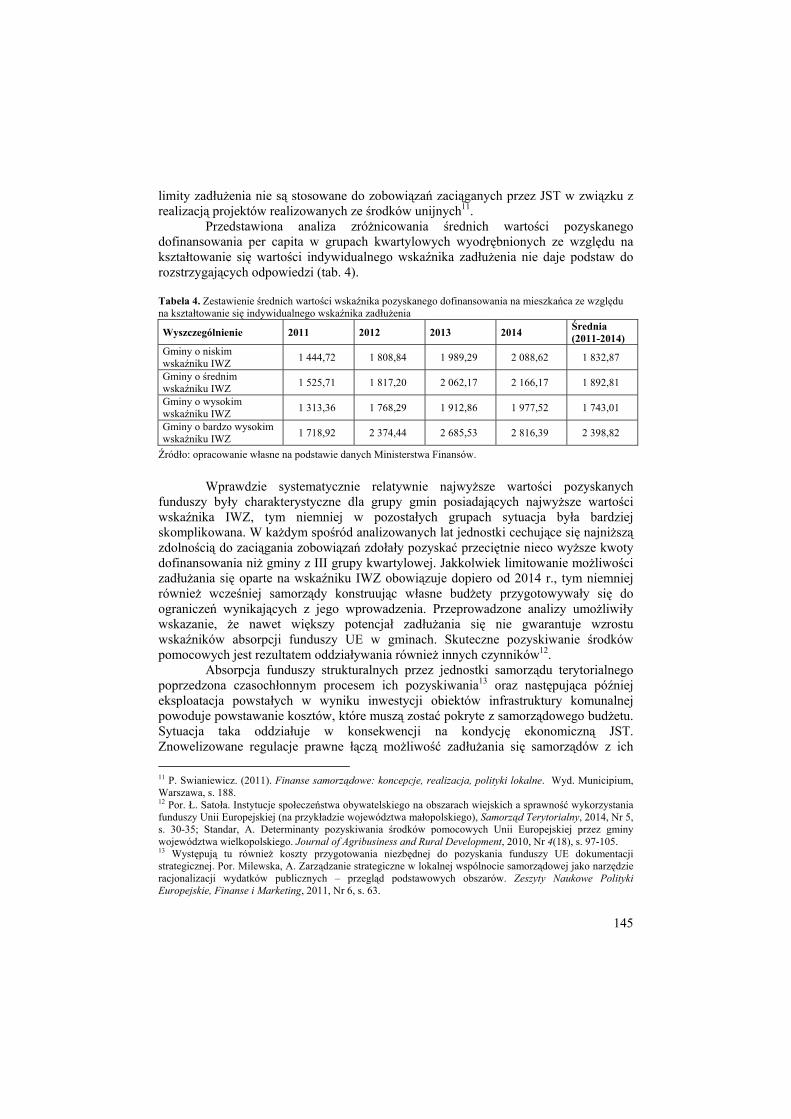
145
limity zadłużenia nie są stosowane do zobowiązań zaciąganych przez JST w związku z realizacją projektów realizowanych ze środków unijnych11.
Przedstawiona analiza zróżnicowania średnich wartości pozyskanego dofinansowania per capita w grupach kwartylowych wyodrębnionych ze względu na kształtowanie się wartości indywidualnego wskaźnika zadłużenia nie daje podstaw do rozstrzygających odpowiedzi (tab. 4). Tabela 4. Zestawienie średnich wartości wskaźnika pozyskanego dofinansowania na mieszkańca ze względu na kształtowanie się indywidualnego wskaźnika zadłużenia
Wyszczególnienie 2011 2012 2013 2014 Średnia (2011-2014)
Gminy o niskim wskaźniku IWZ 1 444,72 1 808,84 1 989,29 2 088,62 1 832,87
Gminy o średnim wskaźniku IWZ 1 525,71 1 817,20 2 062,17 2 166,17 1 892,81
Gminy o wysokim wskaźniku IWZ 1 313,36 1 768,29 1 912,86 1 977,52 1 743,01
Gminy o bardzo wysokim wskaźniku IWZ 1 718,92 2 374,44 2 685,53 2 816,39 2 398,82
Źródło: opracowanie własne na podstawie danych Ministerstwa Finansów.
Wprawdzie systematycznie relatywnie najwyższe wartości pozyskanych
funduszy były charakterystyczne dla grupy gmin posiadających najwyższe wartości wskaźnika IWZ, tym niemniej w pozostałych grupach sytuacja była bardziej skomplikowana. W każdym spośród analizowanych lat jednostki cechujące się najniższą zdolnością do zaciągania zobowiązań zdołały pozyskać przeciętnie nieco wyższe kwoty dofinansowania niż gminy z III grupy kwartylowej. Jakkolwiek limitowanie możliwości zadłużania się oparte na wskaźniku IWZ obowiązuje dopiero od 2014 r., tym niemniej również wcześniej samorządy konstruując własne budżety przygotowywały się do ograniczeń wynikających z jego wprowadzenia. Przeprowadzone analizy umożliwiły wskazanie, że nawet większy potencjał zadłużania się nie gwarantuje wzrostu wskaźników absorpcji funduszy UE w gminach. Skuteczne pozyskiwanie środków pomocowych jest rezultatem oddziaływania również innych czynników12.
Absorpcja funduszy strukturalnych przez jednostki samorządu terytorialnego poprzedzona czasochłonnym procesem ich pozyskiwania13 oraz następująca później eksploatacja powstałych w wyniku inwestycji obiektów infrastruktury komunalnej powoduje powstawanie kosztów, które muszą zostać pokryte z samorządowego budżetu. Sytuacja taka oddziałuje w konsekwencji na kondycję ekonomiczną JST. Znowelizowane regulacje prawne łączą możliwość zadłużania się samorządów z ich 11 P. Swianiewicz. (2011). Finanse samorządowe: koncepcje, realizacja, polityki lokalne. Wyd. Municipium, Warszawa, s. 188. 12 Por. Ł. Satoła. Instytucje społeczeństwa obywatelskiego na obszarach wiejskich a sprawność wykorzystania funduszy Unii Europejskiej (na przykładzie województwa małopolskiego), Samorząd Terytorialny, 2014, Nr 5, s. 30-35; Standar, A. Determinanty pozyskiwania środków pomocowych Unii Europejskiej przez gminy województwa wielkopolskiego. Journal of Agribusiness and Rural Development, 2010, Nr 4(18), s. 97-105. 13 Występują tu również koszty przygotowania niezbędnej do pozyskania funduszy UE dokumentacji strategicznej. Por. Milewska, A. Zarządzanie strategiczne w lokalnej wspólnocie samorządowej jako narzędzie racjonalizacji wydatków publicznych – przegląd podstawowych obszarów. Zeszyty Naukowe Polityki Europejskie, Finanse i Marketing, 2011, Nr 6, s. 63.

146
zdolnością do obsługi14 długu będącej pochodną ich sytuacji finansowej. W tym celu przeprowadzono ocenę relacji zachodzących pomiędzy dynamiką indywidualnego wskaźnika zadłużenia, a średnimi wartościami pozyskanego dofinansowania (rys. 2).
Rysunek 2. Zestawienie średnich wartości wskaźnika pozyskanego dofinansowania na mieszkańca (zł) ze względu na dynamikę indywidualnego wskaźnika zadłużenia gmin Źródło: opracowanie własne na podstawie danych BDL GUS oraz Ministerstwa Finansów.
Przeprowadzone analizy nie dały podstawy do jednoznacznego stwierdzenia, czy zmiana potencjału do zaciągania zadłużenia przez gminy była związana z wykorzystaniem funduszy Unii Europejskiej. Największą wartość dofinansowania per capita zanotowano w grupie gmin, gdzie w okresie 2011-2014 nastąpił największy wzrost indywidualnego wskaźnika zadłużenia. Różnice pomiędzy pozostałymi grupami były na tyle niewielkie, że nie dawały podstawy do wnioskowania o występowaniu statystycznej zależności pomiędzy zmiennymi. Warto w tym miejscu zaznaczyć, że na kształtowanie się wysokości wskaźnika IWZ oraz jego dynamiki w zdecydowanie większym stopniu niż absorpcja funduszy UE wpływa sfera bieżącej działalności jednostek samorządu terytorialnego. Konstrukcja IWZ w mniejszym stopniu odnosi się bowiem do części budżetu majątkowego, równocześnie wykorzystując głównie kluczowe składniki budżetu bieżącego.
Podsumowanie Skuteczne pozyskiwanie i efektywna absorpcja funduszy strukturalnych UE jest dla jednostek samorządu terytorialnego zarówno dużym wyzwaniem organizacyjnym i finansowym, jak i szansą dynamizacji procesów rozwojowych. Dostarczane w zdecentralizowany sposób dobra publiczne zgodne z lokalną skalą preferencji potrzeb mogą determinować przemiany w gospodarce lokalnej. Zewnętrzne środki finansowe są w stanie kreować warunki do trwałego rozwoju gospodarczego pod warunkiem właściwego ich ukierunkowania i efektywnego zastosowania. 14 Por. Marchewka-Bartkowiak, K., Wiśniewski, M. Indywidualny wskaźnik zadłużenia JST – ocena krytyczna i propozycje zmian. Analizy BAS, 2012, Nr 21(88), s. 4.

147
Pozyskiwanie funduszy pomocowych powoduje jednak konieczność dokonywania znaczących wydatków z budżetów samorządów. Wydatki te w związku z ograniczonymi możliwościami gminnych budżetów często finansowane są z kredytów. Znowelizowane zasady zadłużania się oznaczają dla JST konieczność limitowania długu w oparciu o wskaźniki indywidualne.
Przeprowadzone analizy dowiodły dużego zróżnicowania wykorzystania funduszy strukturalnych przez polskie gminy zarówno w wartościach bezwzględnych, jak i w ujęciu relatywnym. Dostrzeżono duże spolaryzowanie w tym zakresie, tzn. obok stosunkowo niezbyt licznej grupy jednostek, które zdołały pozyskać wysokie kwoty z funduszy strukturalnych istniała liczna grupa, dla której obliczone wskaźniki dofinansowania kształtowały się na niskim poziomie. Wartości pozyskanego dofinansowania na mieszkańca pozwoliły stwierdzić, że najniższe kwoty środków pomocowych wykorzystały gminy miejsko-wiejskie, tym niemniej różnice pomiędzy typami gmin nie były w tym przypadku duże.
Na podstawie przeprowadzonych analiz nie można jednoznacznie stwierdzić występowania zależności pomiędzy wartością absorpcji środków finansowych przez gminy a indywidualnymi wskaźnikami zadłużenia. Istnienie nowych wskaźników limitujących możliwość zadłużania się może oddziaływać ograniczająco na przyszłe zdolności absorpcyjne samorządów. Sytuacja taka może wystąpić szczególnie w grupie dotychczas najaktywniejszych gmin, które zaciągały zobowiązania na realizację współfinansowanych z funduszy UE inwestycji. Konieczność spłaty zobowiązań kredytowych spowoduje spadek ich potencjału do podejmowania, realizacji i finansowania nowych zadań inwestycyjnych.
Bibliografia Boldrin, M., Canova, F., Pischke, J. S., Puga, D. (2001). Inequality and convergence in Europe's regions: reconsidering European regional policies. Economic policy, p. 207-253. Bradley, J., Untiedt, G., Mitze, T. (2007). Analysis of the impact of cohesion policy. A note explaining the HERMIN-based simulations. Muenster-Dublin. Burnside, C., Dollar, D. (2004). Aid, policies, and growth: reply. The American Economic Review, 94(3), 781-784. Kopańska, A. (2014). Efektywność decentralizacji. Analiza zdecentralizowanego dostarczania dóbr o charakterze ponadlokalnym. Wyd. Difin, Warszawa. Marchewka-Bartkowiak, K., Wiśniewski, M. (2012). Indywidualny wskaźnik zadłużenia JST – ocena krytyczna i propozycje zmian, Analizy BAS, 21 (88), s. 1-6. Milewska, A. (2011). Zarządzanie strategiczne w lokalnej wspólnocie samorządowej jako narzędzie racjonalizacji wydatków publicznych – przegląd podstawowych obszarów. Zeszyty Naukowe Polityki Europejskie, Finanse i Marketing, Nr 6(55), s. 57-66. Milewska, A., Jóźwik, M. (2014). Organization and changes of local government finance system in view of implementation of participatory budgeting. Acta Scientiarum Polonorum Oeconomia, 13 (4), 125–134. Oates W., 1972, Fiscal federalism, Harcourt Brace Jovanovich, New York. Paluch Ł., Sroka W., (2013) Socio-economic and environmental determinants of sustainable development of rural communes in Małopolska Province. Acta Scientiarum Polonorum Oeconomia, 12 (2), p. 65-76. Parlińska, A. (2014). Zadłużenie samorządów gminnych w Polsce w latach 2005–2012. Nierówności społeczne a wzrost gospodarczy, (40), 191-200.

148
Prus P., Wawrzyniak B. M. Zarządzanie projektami i funkcje gmin w zakresie programów rozwoju obszarów wiejskich. Studia i Materiały Polskiego Stowarzyszenia Zarządzania Wiedza, 2011, nr 44, s. 77-92. Satoła Ł. (2014). Instytucje społeczeństwa obywatelskiego na obszarach wiejskich a sprawność wykorzystania funduszy Unii Europejskiej (na przykładzie województwa małopolskiego), Samorząd Terytorialny, Nr 5, s. 24-35. Standar, A. (2010). Determinanty pozyskiwania środków pomocowych Unii Europejskiej przez gminy województwa wielkopolskiego. Journal of Agribusiness and Rural Development, 4(18), 97-105. Swianiewicz P. (2011). Finanse samorządowe: koncepcje, realizacja, polityki lokalne. Wyd. Municipium, Warszawa. Zawora J., (2015). Uwarunkowania wykorzystania funduszy Unii Europejskiej wynikające z sytuacji finansowej jednostek samorządu terytorialnego, Finanse Komunalne, 1-2, 43-54. Ustawa z dnia 27 sierpnia 2009 r. o finansach publicznych (Dz. U. Nr 157, poz. 1240 ze zm.).
Summary European integration has significantly changed the conditions for the functioning of local government units mainly due to the availability of structural funds. Nowadays, many activities undertaken by the communities, especially the investment is carried out with the participation of co-financing within the EU regional policy instruments. The obtained funds give not only support to local budgets, but also cause an increase in expenditures, which are often financed with loans. The aim of the article is to identify the relations between municipal investments realized with the financial support and the newly introduced debt indicators. Polish municipalities differed significantly among the utilization of EU funds. New debt limits may reduce the absorption capacity of local governments as a consequence of interest payments on loans taken out in the past.
Keywords: public sector economics, structural funds, municipality, regional policy, financial situation of municipalities, debt
Informacje o autorze: Dr inż. Łukasz Satoła Uniwersytet Rolniczy w Krakowie Instytut Ekonomiki i Zarządzania Przedsiębiorstwami Al. Mickiewicza 21 31-120 Kraków tel. (12) 662 43 87 e-mail: [email protected]

149
15 (64) 2016
Maria Sławińska Uniwersytet Ekonomiczny w Poznaniu CHANGES TO RETAIL BUSINESS MODELS - OVERVIEW
OF THE DETERMINING FACTORS
Retail business models, both with respect to overall retail operations, as well as individual types of retail organisations, are undergoing transformation brought on by the current economic environment. This can be attributed to growing competition, changes to customer behaviour and expectations, globalisation, as well as the availability and development of new information technologies. This paper outlines the essence and fundamental components of retail business models, indicates the probable directions in which those models may evolve and identifies the determining factors and trends that shape the business models applied by retailers. In her analysis the author has demonstrated that although the retail sector eagerly embraces innovation, any changes to business models are evolutionary in their nature. They mainly involve the introduction of new solutions in terms of store formats, co-operation within the distribution channels, changes to the range of products and services offered and the use of mobile technologies. Key words: business models, retailing, store format, innovation in commerce, competition, buyer behaviour.
Introduction The retail sector is undergoing dynamic changes caused by the processes occurring in the business environment and the growth strategies implemented by companies. Such changes are subsequently reflected in the structure of the retail sector, which is beginning to be dominated by large retail chains, and in the creation of new business models. The key challenge facing retailers in the current economic setting is to answer the question how to ensure and deliver value to customers and what innovations to introduce with the view to building a relatively solid competitive advantage. A new paradigm governing the establishment of business models and competitive strategies is the assumption that the company and the customer co-create value1. A customer-oriented approach constitutes the chief premise behind the introduction of innovation in retailing on a highly competitive market.
This paper aims to identify the factors determining changes to retail business models both with respect to overall retail operations and the individual store formats. Based on the observations of the operations of contemporary retail enterprises and the findings of the research conducted into structural transformation of retailing in Poland, one may argue that changes occurring in the business environment result in the need to
1 C.V. Prahalad, V. Ramswamy: Przyszłość konkurencji, PWE, Warszawa 2005, s. 148.

150
search for and implement effective ways of building competitive advantage using new business models.
This paper will discuss, consecutively, the nature and constitutive parts of a retail business model, the question of business model evolution, the analysis of external and internal factors determining the introduction of changes to business models, as well as selected trends and examples of innovative solutions in shaping retail business models.
Nature and constitutive parts of a retail business model The notion of a “business model” relates to the principles and manner of conducting business operations in an organised format. It defines the foundations of a given type of business activity, the rationale behind business operations, the choice of resources, the scope and character of internal and external relations, the main cause and effect dependencies between the individual components of the model2. This term has come into widespread use with the development of information technologies and the advent of new e-commerce ventures3. According to Afuah and Ch. L. Tucci, any company that wishes to do business online should have a viable business model specifying how they intend to generate profit in the long term. The business model answers the question of who the customers of a given company are, what constitutes value to those customers, what the sources of revenue are, what the company competencies are and how the value chain is configured4. J. Magretta believes that a business model of a given enterprise sets forth how to make money, defines the economic rationale behind its business and how to deliver value to customers while at the same time maintaining costs at an optimum level5.
Management literature also uses the term “business system”, understood as a “specific configuration of resources, value-adding activities and products/service offerings directed at creating value for customers”6. The shape of a business system (or system of creating value) depends on the business sector and type of business operations. The relations between the business system and the fundamental components of a company’s organisational system are shown in Fig. 1.
The development of a business model is a complex decision-making process, requiring answers to the following questions:
- what the company’s core business is or should be, - what resources and key competencies are required for the company to gain a
competitive advantage,
2 T. Gołębiowski, T.M. Dudzik, M.Lewandowska, M. Witek-Hajduk: Modele biznesu polskich przedsiębiorstw, SGH, Warszawa 2008, s. 17. 3 A.K. Koźmiński: Zarządzanie w warunkach niepewności. Podręcznik dla zaawansowanych, Wydawnictwo Naukowe PWN, Warszawa 2004, s. 123. 4 A. Afuah, Ch.L. Tucci: Biznes internetowy. Strategie i modele, Oficyna Ekonomiczna, Kraków 2003, s. 29. 5 J. Magretta: Tajniki modelu biznesowego, Harvard Business Review Polska, 2003 marzec, s. 53. 6 B. De Witt, R. Meyer: Synteza strategii, PWE, Warszawa 2007, s. 112-113.

151
- how the resources and competencies are configured7. The first question concerns specifying the company’s main area of operations
and the strategy employed, the second relates to the need to allocate specific resources and having key competencies, whereas the third indicates the need to determine enterprise architecture, i.e. internal and external dependencies within the organisational structure.
The fundamental components of a business model, such as the range of products or services offered (value delivered to customers), resources and competencies, as well as value chain configuration, are present in any business, but may be shaped differently depending on the company’s area of operations and the manner in which it strives to build its competitive advantage.
Figure 1. Relationship between the business system and organisational systems Source: B. De Witt, R. Meyer: Synteza strategii, PWE, Warszawa 2007, s. 112-113.
When attempting to explain the importance of a business model in retailing, it has to be assumed that the model represents the principles governing the operation of a retailer whose main task involves the purchase of goods with a view to reselling those to end customers. Through their operations retailers increase added value in the distribution chain by offering goods at the place where customers are willing to purchase them (place utility), at the right time (time utility) and by enabling the conclusion of a transaction on the basis of which a given product is purchased (utility of possession).
The notion of a business model relates in essence to the entire enterprise, however, when applied to retail operations, it is important to specify the manner in which the operational activities involving the sales of goods to end customers will be
7 K. Obłój: Tworzywo skutecznych strategii. Na styku starych i nowych reguł konkurencji, PWE, Warszawa 2002, s. 100.
Business system
Personnel
Org
anis
atio
nals
truct
ure
Org
anis
atio
nalp
roce
sses
Org
anis
atio
nalc
ultu
re

152
conducted. This concerns the choice of the store format. A strategic problem is deciding on a multidimensional concept for the store format, i.e. selecting the correct combination of the following components: range of products and services, location, pricing policy and terms of purchase, which together make up a package of benefits for the consumer8.
Taking into account the fact that trading companies vary significantly in terms of the type and number of stores operated, their location on many markets in geographical sense, as well as in the choice of the form of commerce, e.g. brick-and-mortar stores, online stores or mail order (the so-called Multi Channel Retailing) and the degree to which their operations are standardised, it may be safe to say that there exist numerous business models in retailing. The fundamental components of retail business models include the subject (profile) of activity, i.e. the range of products and services offered, the spatial range and target market (who the customers are and what they consider to be of value to them), resources and competencies and value chain configuration (how business functions are executed, how the relations with suppliers and other business partners are established and maintained).
Retail business model evolution A business model understood as a concept for company operations is not subject to frequent modifications. Rather, the usual tendency is to maximise the potential offered by a given model and limit the risks related to any potential changes.
The models used by companies within a particular business sector are mostly based on solutions applied industry-wide and are improved or adjusted to reflect the specific market conditions. The starting point for introducing changes to a retail business model may be a particular store format, e.g. a department store, discount store, supermarket, hypermarket or a specialist store or the form of trading, e.g. brick-and-mortar stores, e-commerce, mail order or direct selling.
In order to transform the existing models into a new business model a question arises as to what changes should be introduced to enable the retailer to better seize market opportunities and stand out among its competitors.
During the period of systemic transformation in Poland the business models employed by foreign trading enterprises and their chains of stores became a benchmark for many domestic retailers, who decided to follow the established path and adopt some of their solutions. For instance, Poland was quick to take up the concept of franchising, as well as other forms of co-operation within distribution chains.
Now and again, however, an innovative business model is developed, often as a consequence of challenging the assumptions and rules of the game followed by established companies and creating new variants of the fundamental characteristics of a store format (Fig. 2). An example of such an innovative model is the concept of discount trade developed by the founders of the Aldi chain, which became a model to be followed later by many trading enterprises operating in various sectors.
8 J.-J. Lambin: Strategiczne zarządzanie marketingiem, Wydawnictwo Naukowe PWN, Warszawa 2001, s. 418.

153
Figure 2. Constitutive objectives of a store format Source: B. Borusiak: Innowacyjne formaty handlu detalicznego, w: Innowacje w marketingu i handlu, Zeszyty Naukowe 189, Wydawnictwo Uniwersytetu Ekonomicznego w Poznaniu, Poznań 2011, s. 114.
Other examples of trading companies that have introduced innovative business
models include Amazon, Benetton, Ikea, Tchibo, Wal-Mart and Zara. Their business experience continues to be the source of inspiration for many retailers who try to adopt or imitate certain solutions. According to Ph. Kotler, companies that have achieved market success owing to innovative business solutions have a number of advantages at their disposal, which constitute a unique combination of a few factors or components making up the business model. A competitor who chooses to copy only some of those components (methods of operation) is likely to fail to gain a competitive advantage9. Thus, changes to the business model may be evolutionary in nature if they involve the modification of a selected element or function, or radical (comprehensive) if they lead to the reconstruction of the existing mode of operation (Fig. 3).
Figure 3. Change of a business model Source: P. Banaszyk, Sz. Cyfert: Strategiczna odnowa przedsiębiorstwa, Difin, Warszawa 2007, s. 44.
Changes introduced into the business model may be considered innovative if
they are related to a new business idea or manner of operation or if they improve the existing organisational solutions. The notion of innovation in commerce may be defined as any successful launch of a new or improved process of providing commercial services that has been accepted by market participants10. Most frequently business model
9 Ph. Kotler: Marketing od A do Z, PWE, Warszawa 2004, s. 156. 10 J. Chwałek: Kierunki rozwoju innowacji w handlu, Handel Wewnętrzny 2014, nr 2, s. 88.
Store format Scope of services
Pricing levels
Sales area
Manner of service
Location
Range of products
radical change strategy old
business model
new business model

154
modifications involve the introduction of changes to the existing store formats, applying the concept of outsourcing or incorporating certain activities in the value change of a given trading enterprise, for instance services or production (own bakeries or other manufacturing plants).
Other forms and methods of introducing changes to the retail business model include: - gradual expansion by satisfying the needs of new market segments and
expanding into new markets in spatial terms, - introducing new product categories not related to the existing profile of
operations, - introducing additional services aimed at offering to customers specific
solutions rather than just products, - incorporating new business models as a consequence of mergers and
acquisitions.
Changes to retail business models – the determining factors The need to modify business models is driven, on the one hand, by external, i.e. environmental, factors, and, on the other hand, by internal considerations depending on the company itself. The main external factors that may affect the existing retail business models include:
- the state and intensity of competition, including the market behaviour of direct and indirect competitors,
- consumer preferences and expectations, - the development of new information technologies, - economic globalisation and trade internationalisation, - the tendency to cross over the boundaries of own sector (sectorial
convergence). The modern competition processes and the competitors’ market behaviour are
characterised by great complexity and intensity. As far as changes to retail business models are concerned, competing for customers and resources seems of particular importance. In the first case it is about the correct positioning of the company and its range of products in the mind of customers. Retailers are in direct competition with other retailers at the level of the whole enterprise. Competition also occurs on the individual national markets, where shopping chains operate, as well as at the level of individual stores, taking into account their location. Apart from direct competition there is also indirect competition between companies operating different store formats. This is due to the similarity of the range of products and services offered and similar tools employed to impact the target market. Consequently, competition arises between discount stores and supermarkets or local neighbourhood stores, as well as between brick-and-mortar and online stores. In turn, competing for limited resources mainly involves seeking land for planned investments or finding and securing the right shopping premises11.
The growing competition in the retail sector often gives rise to mergers and acquisitions, which require the introduction of new business solutions. In the present
11 M. Sławińska (red.): Modele biznesu w handlu detalicznym, Wydawnictwo Uniwersytetu Ekonomicznego w Poznaniu, Poznań 2010, s. 53.

155
economy retailers consider mergers and acquisitions to be the fastest way of boosting sales by, simultaneously, taking over a chain of stores and increasing the customer base, thus radically improving their market share. The process of concentration (consolidation) in retailing may give rise to innovative business models that determine various aspects of retailing operations, e.g. the type of resources employed and their configuration, the development of a commercial offer (at the level of the whole enterprise and individual stores), forms of customer service, co-operation with suppliers and spatial range of operations.
Furthermore, it should be added that competition in the retail sector does not concern only companies with a similar profile of activity, but rather entire chains of co-operating business entities, i.e. chains of stores, suppliers of goods, logistics service providers, advertising agencies or companies rendering other services.
Another important factor determining changes to retail business models is buyer behaviour. When faced with the buyer’s market, where supply exceeds demand and competition is fierce, it is increasingly important to be able to create and deliver adequate value to customers. Such value is most often defined as the difference between the expected benefits of a transaction and the overall cost of obtaining such benefits12. Customer orientation, taking into account their preferences and expectations, constitutes a vital argument in favour of innovation in terms of determining the range of products and services to be offered and the customer service process. Contemporary buyers, having access to innumerable sources of information and a choice of places where goods can be purchased (for instance brick-and-mortar or online stores), may actively impact the purchasing process. Customers’ expectations no longer concern only the product itself (its quality, properties or price), but also include convenience of purchase (place, time), service quality (speed, professionalism, comprehensiveness), as well as the manner of communicating with the company. To maximise customer satisfaction, the desired product with specific properties needs to be made available (or delivered) at the right place and time, with access to complementary products or services13.
New information technologies also affect consumer behaviour, as well as the operation of trading enterprises. Owing to those technologies it has become possible to effectively manage chains of stores located on various geographical markets, as well as to use centralised supply and warehousing systems and introduce changes to customer service.
However, new information technologies are of particular importance when it comes to virtualisation of commercial operations. They have created new opportunities in terms of communicating with customers and introducing e-commerce business models. The use of applications that make it easier for customers to obtain information and make mobile purchases is becoming more and more widespread. Mobile technologies also facilitate personalised activities aimed at existing and prospective customers in terms of marketing communication14.
The factors determining changes to retail business models include globalisation, which poses new strategic challenges to trading enterprises. As a consequence of
12 G. Sobczyk: Bliskość handlu źródłem wartości dla klienta, Marketing i Rynek 2015, nr 8, s. 631. 13 M. Kucia: Wirtualizacja działalności handlowej przedsiębiorstw, Marketing i Rynek 2015, nr 8, s. 214. 14 A. Sznajder: Technologie mobilne w marketingu, Oficyna a Wolter Kluwer business, Warszawa 2014, s. 11.

156
globalisation more and more retailers decide to enter foreign markets and, on the one hand, attempt to standardize the store formats, and, on the other hand, recognise the need to adapt to local conditions. International retail operations make certain business models gain in popularity, for instance franchising or discount trade, as well as affect the manner in which domestic companies operate after observing the activities undertaken by foreign retail chains and their competitive strategies.
Another important factor responsible for changes to retail business models is the trend to expand industry boundaries15. This is reflected in the interpenetration of various types of business activity. At present we are witnessing the decline of the traditional monofunctional division of tasks in business operations, based upon the assumption that a manufacturer produces goods and intermediaries (vendors) sell them to the end customers. Manufacturers have acknowledged the importance of direct influence16 upon customers and relationship building, therefore they seek ways to eliminate the middlemen at the retail level. Consequently, they establish electronic distribution channels and set up chains of their own stores, as well as selling their products through vending machines. Retailers, in turn, incorporate into their value chain manufacturing or wholesale activities, as well as diversifying their operations through various strategies, such as introducing new store formats.
The reasons why retailers choose to expand their scope of operations may include:
- the wish to boost company’s competitiveness by offering a comprehensive range of products and services,
- the strive for increased sales profitability, - the preference of customers to purchase various good and services at a
single place (one-stop-shopping). The internal factors determining changes to retail business models result
primarily from the need to maintain or strengthen the company’s market position, as well as to secure adequate profitability. These factors comprise, first and foremost, the vision and strategy of business development, management skills and the resources at the company’s disposal, such as human, tangible, financial, technological and intangible resources (i.e. know-how, corporate brand, private brands).
Based on the above review of various conditions, both external and internal, it may be concluded that strategic decisions with respect to the introduction of changes to business models are influenced by a large number of interdependent factors. Retailers wishing to modify any component of their business model need to proceed carefully, beginning with a thorough analysis of the external environment and the company’s internal potential, as well as resolving a number of decision-making problems.
New retail business model trends Faced with growing competition in the retail sector, often international in its nature, as well as the changing consumer expectations and preferences, companies are forced to
15 Ch. Kin, R. Mauborgne: Kreowanie „błękitnych oceanów” rynku, w: Biznes, tom 2. Biblioteka Gazety Wyborczej, Wydawnictwo Naukowe PWN, Warszawa 2007, s. 190. 16 T. Domański: Strategie rozwoju handlu, PWE, Warszawa 2005, s. 60.
157
introduce innovative solutions into their business models. Such changes should result in the creation of value for customers and increased efficiency.
As demonstrated by business practice, changes to retail business models are evolutionary in nature and most often involve the introduction of new solutions within the following areas:
- store formats and store location on various geographical markets, - range of products and services, requiring the employment of new resources
and the establishment of new transaction links within the supply chain, - forms of co-operation with other business entities, - development of e-commerce and the use of mobile technologies, - communication with customers and the positioning of the corporate brand
and private brands with respect to goods and services. When developing a new store format concept, companies usually takes into
consideration the resources and key skills they have at their disposal and aim to achieve the synergy effect. In such circumstances the following factors seem of particular importance: range of products (potentially increasing the volume of purchases from suppliers), sales technology (IT system and logistics services) and familiarity with the target market. Examples of such a solution include the following store formats: Freshmarket established by Żabka Polska or Krakowski Kredens owned by Alma Market S.A., as well as the creation of smaller outlets adapted to local conditions as part of the Carrefour or Tesco chains.
Changes to business models may also include the expansion of the product range to include new product categories, as well as the introduction to the product range of private labels or services provided in the same points of sale or services addressed to the same target market, but requiring the creation of separate infrastructure, e.g. petrol stations, catering services, hotel services or entertainment. Commerce and services may be combined in a dispersed or consolidated form (i.e. shopping and service centres). Depending on the existing business model each company may adopt different solutions, for instance the Rossmann chain of health and beauty stores introduces new product categories unrelated to the health and beauty sector. In turn, the Lidl chain of discount stores continuously expands its product range to include private label brands and producers’ brands. Moreover, it increases its range of fresh produce and runs special campaigns based on the country of origin of various products or their designated use (e.g. lines of sportswear or household goods).
The expansion of the number of products offered by discount chains, as well as offering fresh produce and ready-to-eat meals, is intended to create an incentive for daily shopping. This is also facilitated by the location of stores in the vicinity of housing districts or places with intense customer traffic. There is a noticeable increase in convergence in the retail sector, i.e. the blurring of clearcut boundaries between individual store formats. This constitutes a strategic challenge to trading company owners and managers, who are forced to seek new and innovative solutions.
An example of a unique business model is the Tchibo chain of stores, where the extensive range of Tchibo coffee products is accompanied by a wide selection of products grouped into collections under a given theme, a new one each week. At the same time the company sells its products online, giving the customer’s choice as to the manner in which they wish to make a purchase.

158
In order to improve the competitive position and boost economic effectiveness, trading companies also develop various forms of co-operation in the value-creation chain. Examples of solutions in this respect include franchising systems used and developed by retailers and wholesalers alike, as well as by manufacturers launching their own branded chains of stores.
Innovations in retail business models also involve the introduction of e-commerce solutions, which may be used as the main or as a supplementary distribution channel (online stores parallel to brick-and-mortar stores).
According to Ch. Anderson, owing to the rapid growth in e-commerce, we are facing an era of unprecedented choice17. There are virtually no limits when it comes to expanding the range of products offered by e-commerce companies. For instance, the marketplace software used by Amazon enables it to aggregate the range of products available in a dispersed chain of stores18.
Another change occurring in the area of retail business models includes new solutions for communicating with customers and positioning or repositioning the corporate brand. To that end a large number of different promotional tools and activities are used, which should together make up coherent and integrated marketing communication.
Conclusions Identifying retail business models and their determining factors is a complex research problem due to the great variety of entities in that sector. Certain fundamental, conventional business models founded upon the wish to increase sales by competing on price or, alternatively, on standing out in terms of product quality and superior customer service, usually serve as a benchmark for developing own, unique business solutions with a view to gaining and maintaining a competitive advantage. In her research the author has found that such solutions involve mainly:
- developing an original concept of a store format or form of sales and introducing it on different markets in geographical terms,
- implementing new forms of business co-operation with other entities in terms of product distribution, for instance by outsourcing or introducing franchising as an option for business growth,
- introducing or improving e-commerce operations, - using new forms of marketing communication and means of positioning the
corporate and product brands. In a rapidly changing environment, especially in terms of the state and intensity
of competition, buyer behaviour and preferences, as well as the development and application of information technologies, retailers need to review their business models and improve the processes related to the execution of fundamental business functions, such as procurement, warehousing, sales and customer service.
17 Ch. Anderson: Długi ogon. Ekonomia przyszłości - każdy konsument ma głos, Media Rodzina, Poznań 2008, s. 239. 18 Tamże, s. 306.

159
The effectiveness of the changes or modifications introduced into business models is ultimately determined by the way in which a given retailer and its store formats are perceived by customers and whether the new additions to the range of products and services meet with a positive reception.
References Afuah A., Tucci Ch.L.: Biznes internetowy. Strategie i modele, Oficyna Ekonomiczna, Kraków 2003. Anderson Ch.: Długi ogon. Ekonomia przyszłości - każdy konsument ma głos, Media Rodzina Poznań, 2008. Banaszyk P., Cyfert Sz.: Strategiczna odnowa przedsiębiorstwa, Difin Warszawa 2007. Borusiak B.: Innowacyjne formaty handlu detalicznego, w: Innowacje w marketingu i handlu, Zeszyty Naukowe 189. Wydawnictwo Uniwersytetu Ekonomicznego w Poznaniu Poznań2011. Chwałek J.: Kierunki rozwoju innowacji w handlu, Handel Wewnętrzny 2 2014. De Witt B., Meyer R.: Synteza strategii, PWE Warszawa 2007. Domański T.: Strategie rozwoju handlu, PWE Warszawa, 2005. Gołębiowski T., Dudzik T.M., Lewandowska M., Witek-Hajduk M.: Modele biznesu polskich przedsiębiorstw. SGH Warszawa, 2008. Kin Ch., Mauborgne R.: Kreowanie „błękitnych oceanów” rynku, w: Biznes, tom 2. Biblioteka Gazety Wyborczej, Wydawnictwo Naukowe PWN, Warszawa 2007. Kotler Ph.: Marketing od A do Z, PWE, Warszawa 2004. Koźmiński A.K.: Zarządzanie w warunkach niepewności. Podręcznik dla zaawansowanych, Wydawnictwo Naukowe PWN, Warszawa 2004. Kucia M.: Wirtualizacja działalności handlowej przedsiębiorstw, Marketing i Rynek 8/2015. Lambin J.-J.: Strategiczne zarządzanie marketingiem, Wydawnictwo Naukowe PWN, Warszawa 2001. Magretta J.: Tajniki modelu biznesowego, Harvard Business Review Polska marzec/2003. Obłój K.: Tworzywo skutecznych strategii. Na styku starych i nowych reguł konkurencji, PWE, Warszawa 2002. Prahalad C.V., Ramswamy V.: Przyszłość konkurencji, PWE ,Warszawa 2005. Sławińska M. (red.): Modele biznesu w handlu detalicznym, Wydawnictwo Uniwersytetu Ekonomicznego w Poznaniu, Poznań 2010. Sobczyk G.: Bliskość handlu źródłem wartości dla klienta, Marketing i Rynek 8/2015. Sznajder A.: Technologie mobilne w marketingu, Oficyna a Wolter Kluwer business, Warszawa 2014.
Uwarunkowania zmian modeli biznesowych w handlu detalicznym
Streszczenie Modele biznesu w handlu detalicznym zarówno w odniesieniu do funkcjonowania całego przedsiębiorstwa, jak i poszczególnych typów jednostek handlowych ulegają zmianom w warunkach współczesnej gospodarki. Ma to związek z rosnącą konkurencją, zmianami zachowań i oczekiwań klientów, globalizacją gospodarki, dostępnością i rozwojem nowych technologii informacyjnych. W artykule przedstawiono istotę i podstawowe elementy modeli biznesowych w handlu detalicznym, wskazano na kierunki ich ewolucji oraz dokonano identyfikacji determinant i trendów w kształtowaniu modeli biznesowych firm handlowych.

160
Z przeprowadzonej analizy wynika, że sektor handlu detalicznego cechuje się dużą innowacyjnością, ale zmiany modeli biznesowych mają charakter ewolucyjny. Polegają one głównie na wprowadzaniu nowych rozwiązań w zakresie formatów sklepów, współpracy w kanałach dystrybucji, zmianach oferty asortymentowo-usługowej, stosowaniu technologii mobilnych.
Słowa kluczowe: modele biznesu, handel detaliczny, format sklepu, innowacje w handlu, konkurencja, zachowania nabywców.
Informacje o autorze:
prof. dr hab. Maria Sławińska Uniwersytet Ekonomiczny w Poznaniu e-mail: [email protected]

161
15 (64) 2016
Andrzej Szromnik Uniwersytet Ekonomiczny w Krakowie
CITY PLACEMENT – INNOVATIONAL MEANS OF PROMOTING CITIES
A detail attempt of the “city placement” strategy, has been made in the article. Its main threads, components and decision making problems of the film producers teams have been emphasized. The author based his knowledge, in this case, on the diagnosis and analysis of the processes and decision making procedures adequate for big, Polish cities, their administrative authorities, promotional strategies and the rules of coopera-tion with media partners. Assumedly, the used process-structural conceptualization is to emphasize the main determinants of the “city placement” strategy introduction in mar-keting practice of the cities and regions.
Key words: city promotion, "city placement", marketing strategies, "a city in a film business"
Introduction The main area of marketing innovations in the cities and regions promotional strategies are widely understood social media. Their common, current inclusion to the set of mar-keting means of communication, relevantly changed a typical promotion-mix profile of the settlement centers and appropriate frequency hierarchy of using individual communi-cation channels. The social media adaptation process to the needs and conditions of the cities and regions marketing strategies, generally involved different classes of local gov-ernment units, including rural and urban communities, big and small units, which have a developed range of functions, as well as the ones with limited eligibility.
The promotional means, which is called “the city placement” should be includ-ed to the marketing innovations, in the field of market communication of the cities and regions. It is a specific development or a variant of a known „product placement” con-cept. If there are relatively many domestic article elaborations and monographs about the “product placement” strategies, the “city placement” concept is intermittently a sub-ject of research and analyses, especially in the theoretical-conceptual sphere. Rare pub-lications about this subject do not give a full image of the range and promotional possi-bilities of the new means of marketing communication, do not explain operational prob-lems of the audiovisual products, including a film, to promote the attractions the of settlement units either. In the article the „city placement” is when the units make their territories available to organize different artistic projects, mainly the film ones, which have strengthened and repetitive form, in exchange for the direct or indirect promotion of them.
The aim of the article is to make an attempt of a detailed ”city placement” strat-egy projection with the emphasis on its main threads, components and decision making problems of the film producers. The author based his knowledge, in this case, on the

162
diagnosis and analysis of the processes and the decision making procedures appropriate for big, Polish cities, their administrative authorities, promotional strategies and the rules of cooperation with media partners.
"City placement" – promotion without promotion
In the cities and regions marketing, similarly to other sector (trade) marketing, known and accessible instrument – impact tools on the target markets, comes from a classical set of orderly means in a certain marketing composition-mix. That is why, in numerous articles dedicated to territorial marketing, it can sometimes be noticed, even a literal transfer and instrument marketing composition interpretation, appropriate for goods and services market, on the grounds of specific, without doubt, territorial products market – the market of settlement units.
The signaled phenomenon not always means absolute methodological mistake, approach and undefined operational territorial marketing concept mistake. It should be based, without doubt, on general philosophy, its essence, aims, functions and the aims realization tools. A simple analogy between the city and consumption markets, which in practice leads to simple comments of the marketing – mix 4P concept in relations to the marketing strategy of the territorial units cannot be accepted. In this case, however, there are no avoidance or explanation of the territorial product essence, prices concept or dis-counts used by the cities, especially products distribution system, that is the essence and structure of the market.
Despite the objections, it can be stated that in the territorial marketing, there are relatively many cases, maybe even the biggest number of people use the achievements in the field of marketing communication by adapting it for the cities marketing needs. It lead to the situation that published and introduced concepts of widely understood promo-tion of space-administrative (mainly in the cities) units base directly on appropriate speculations adequate to popular markets, its subjects and connected to the consumption goods and services. Such practice can be acknowledged as permissible, especially when the “urban organism” is treated as a specific concern, as a mega subject of various prod-uct markets.
On the background of the present studies, attention is paid to the use of theoret-ical and practical “strategy product placement” achievement – strategical and used by numerous producers of goods and services, especially in relation to the half luxurious and luxurious products [Choliński 2013, Gmerek i MisztaK 2007].
The “product placement” strategy, which aim is to deliberate and payable prod-uct placement in film production (movies), and even in other audiovisual products of their own production with clearly emphasized brand in order to indirectly advertise them among the viewers [Urbaniec 2009]. That is nothing else than “a branded product placed in a product” – a gadget, exhibit, prop, object “playing” an episodic role in a film. Its use is connected to the certain salary, because in this way it is a subject of a commercial [Choliński 2002].
The main advantage of the “product placement” strategy is showing an object or even a property, in the functional context [Wyrwisz 2013]. It is not on the shop shelf, in the supermarket or in the saloon, but it is presented in an operational way, in movement, according to the direction of use. What is more, this way of promoting brands and their
163
products uses added value – it is an exhibit fulfilling the needs and used by widely known, admired and prestigious people or groups (film heroes) [Sadowski i Szymaniak 2008]. These figures with possessed and used (consumed) goods are objects of observa-tion, extinguishment and admiration, and what comes after that imitation. Promotional presentation of the props brings sale effect in the end.
The promotional potential, which is in the “product placement”, was noticed by specialists from the territorial marketing range. They understood quickly that modern marketing of the cities and their groups (also other space-administrative units) can suc-cessfully use new promotional strategies fulfilling their typical, traditional promotion-mix or even replacing its less efficient components [Czarnecki 2002]. The directed mar-ket activity of the audiovisual producers, studio film owners, directors and representing them specialized agencies (committees) had influence on innovational marketing pro-grammes transformations of the cities and regions. They and their representatives made the self-government authorities of the commune, counties and voivodships how, with the profit for both sides, use the „city placement” strategy [Gołata 2012].
The "City placement", as an integral part of the promotion – mix of the territori-al units, is a commercial sharing of the city, region, country or other chosen parts (urban, architectural, or environmental ones) in order to organize artistic – film, theatrical, musi-cal, literary, sport and other undertakings on their area, in a strengthened, repeatable form (media) in exchange for direct or indirect promotion of these units by showing them to the public.
The presented definition of the „city placement” is a word formulation, relative-ly expanded, consisting of a few threads as components of this definition. In marketing practice, in popularizing discussions and interviews, a deepened definition of the “city placement” can be replaced by short, one sentence terms, relating to the essence of the matter – the most important characteristics of this form of promotion [Zawadzki, 2013]. In this way, the following terms can be met – synthetic equivalents to the proper defini-tion: city in the film, city attractions in the plot and image, city in the background of audiovisual undertakings (wider: artistic), presentation of the city by media production (audiovisual), the city promotion by film or image of it and its components strengthened in art.
These are some, keyword explanations of the “city placement” essence, short terms, possible to use only agreed on, conditionally. They do not show other important features of this strategy as a synthesis.
The determinants of differentiating the “city placement” strategy of the city. It can be generally stated that two main groups of factors influence the components of strategy preparation of promoting a city in a film. The first one includes the factors, which are known as engagement (contribution) of the city to a film project, including financial, material, service, organizational contribution, as well as immaterial one (con-stant contact with authorities and emergency services, change of the communication traffic system of the city, free of charge services etc.).
The second group of factors, influencing the individual character of the “city placement” realization strategy, are the city`s expectations from the film producers. They

164
concern, not only the range of expected promotional campaign of the city in a film itself, but also a degree of its identification for the viewers- including necessary parts of the city, geographical accent in the dialogues, showing city symbols (icons) etc. In both cases, the enumerated circumstances determine a different character of negotiations, range of necessary compromises, services, payments, which sometimes must be changes in relation to the offer or initial arrangements.
The financial factor, among the signaled ones, plays a crucial role in the “city placement” strategy. In practice, it means the scale of direct subsidization to the film production by the interested in recording city. The amount of subsidization can by sym-bolic or it can even cover the costs of the movie production.
The list of the city contribution in the production and its total size (estimation) includes many different positions, only signaled at this point. “Personal commitment” (free of charge or partially payable), is an important element of this list. It comes down to sending a team of employees (from municipal companies) or in the form of recruiting the extras to adjuvant works when the film is produced. Another case is engagement of the authorities themselves on the realization stage.
Among the immaterial factors, a crucial role plays the fact that the film studio can use the city brand. It is about the inclusion of the city symbols to the marketing char-acteristics of the film with the descriptive information, which refers to the details realiza-tion.
The issue of “hard” benefits for the city, in connection to a film recording in the place, is a new, rarely raised subject in negotiations with a crew of the film produc-ers. It is about specific “after production” benefits for the city, like for example:
- free distribution and presentation of the film in a given city (the city where the film was recorded),
- free handover of the costumes, dummies, scenography and props, made for the pro-duction needs, to the city,
- participation of the city in financial benefits generated by a mass emission of the film (profit sharing),
- preliminary declarations of future cooperation, but also such undertakings, which are crucial for the inhabitants and people visiting the city – including tourists - like:
- meetings with actors and directors, - presentations of film parts, - visiting the movie set, - open photo sessions for the inhabitants, - visits of the film crew at schools, universities, cinemas or other cultural institutions.
The main expectations of the city, as far as the film recording in its area is con-cerned, according to the essence of the “city placement”, are marketing benefits, and more precisely the promotional ones. The range of these benefits is the effect of the agreement, which is, in turn, the result of negotiations and a formal contract. Cumulative range of the promotional effect for the city is generally directly proportional to the con-tribution of the city to the film production – in recoding a certain movie within the city, although the proper promotional programme (what, how, when, what in particular?) is a separate subject of discussion.
165
"City placement" - identyfication of the city in a film production The fact of recording movies within the city, films about different things, actor crew, detailed screenplays, the country of origin of the film studio and producers, time of emission and other realization (technical, organizational, financial) features, did not translate automatically on promotion of this city, on free or almost free presentation of its values by a cinema screening. The above mentioned promotional effect, as a specific side effect product of a film production, depends on the range, way of the subject and the recording length time of the city on “the tape” and aware recording, allowing the viewers recognize the city to some extent. The basis of these, were people, words, signs, images and the whole outdoor shots captured in film action. Their characteristic elements direct-ly or indirectly showed a given city, its localization, country, and most of all its name.
The city identification – the places of the film production, its basics and level are based on verbal, symbolic or graphic information deliberately put in the film screenplay. Their perception allows the viewers to recognize the city name with some probability.
The degree of the city identification in the movie, along with the influence of some identifiers, can be presented on the linear scale in the form of segment, which is between the point, meaning full identification of the film realization (recognized city) and the second point, extreme one, which equals absolute lack of information about it (anonymous city). Between these two points, different identifiers (signs, graphic-image takes, verbal shots, characters, objects, outdoor scenery), which have differentiated pow-er of identification, can be marked.
Undoubtedly, the biggest influence on full and unequivocal identification of the place (city) has the fact of including its name in the film title (audiovisual product) and appropriate annotations in its marketing programmes. Introducing characteristic, recog-nizable in the country and abroad, architectonical buildings, which have unique character or their special proper names, can be enumerated on further places. Introducing symbols of certain cities (family crests, logos), characteristic inhabitants (ethnic features, clothes, behaviour) or direct introduction of the geographical city name in the dialogues, strongly influences the level of recognizability of the city, in which the film action (exclusively or only partially) takes place. In some film screenplays, the names of the cities are not giv-en deliberately or a fictional name is chosen. It happens in case of marketing protection of the city against negative effects, which may be caused by the film plot.
Considering the influence of different film characteristics on its identification of the place realization, in this case registered and presented, during the film emission, attractions of a certain city, it should be stressed that there is obvious dependency – the more city is shown in the film, the more information and images allowing to increase the level of its recognizability, the bigger marketing value of the film (and other audiovisual products) for this city, the stronger its influence on shaping “the image”. That is why the city marketing services particularly care about reaching high level of its identification among the viewers after the film emission.
"City placement" – choosig the film city strategy
The city attractiveness for domestic and foreign film projects is the resultant of many factors, circumstances, and influences, which have very differentiated character. In this
166
place, an attempt will be made to order the determinants of the city choice in order to record a film along with the offer of algorithm of proceeding in this issue.
From the point of view of the realization-producer film team, the choice of place of recording the whole film or its part, is connected to the necessity of defeating the following difficulties and barriers:
- geographical-distance barrier, means the necessity to show the distance between the native country of the film studio and the involved team of people to the destination coun-try and detailed place of its realization. It also concerns transport of the technical equipment, screenplay elements, costumes and props (sometimes animals) in different climate conditions,
- time barrier, which means negative influence of the whole logistic operation con-nected to transport of the people and equipment to the filming place for the time of the production,
- cost barrier – connected to the considerable growth of the costs of the film project in case of its realization in the places (cities) located far from the native town or country. These are the costs of the people and equipment being transported by professional, often expensive, means of transport,
- culture barrier, resulting from important differences in living and working condi-tions, including the ways of eating, relaxing, communication and also other rules of law, religion or social (relating to customs) life of the inhabitants, crucial to exist in a civi-lized world. It can generally be stated that there are two groups of factors which influ-ence the decision of placing a given product in a film: external and internal ones. The first group is irrespective of the values considered for the localization ,as they are con-nected to:
- top-down suggestions and determined indications, the preferences of the public (re-sort) authorities or central, creative unions,
- suggestions of the film studio advisers, consultants, managers and the owners, - business connections, which are outside the film studio, including cooperation with
other film studios, connections with the suppliers, film institutions, etc.. - marketing image and opinions in the film environment, concerning widely under-
stood conditions of the film realization in different countries, regions and cities, existing formal barriers,
- detailed opinions, assessments and impressions of the realization crews (directors, scenographers, producers and others), concerning their work in a given country, region and city,
- own experiences from recording the previous movies, including contacts and coop-eration with authorities, partners, goods and services suppliers and local community,
- personal contacts of the main governing bodies (decision-makers), including private and business (official) contacts.
The factors, which have internal character, have impact on the external influ-ences. The internal ones, are strictly connected to the characteristics and resources of the target city, the proper region and country location, overlap each other and decide about the place of the “product placement”. The factors as localization determinants of the film realization or only its certain parts, refer to the specific, personal values of the city (town), crucial to the film production. Among such factors – personal determinants of „film attractiveness” some values can be distinguished: social values, organizational-

167
technical values, economic-financial values, infrastructural values, geographical-communication values, existence values, recreation values, safety values, sanitary val-ues, view values, media values, prestigious (brand) values.
Enumerated, in this case, twelve detailed groups of the city characteristics, cre-ates the general spectrum of the criteria, taken into consideration by the people (team) who make decisions about choosing the city, but first the country and region, to realize their own film plans. There are features, which have special meaning for the film crew among the above mentioned characteristics, such as: infrastructural, safety, view, media and prestigious values, which circumstances will influence and define the compatibility of the city with the requirements of the screenplay and the film director`s concept.
Nobody will locate a film production in the city, which they have not heard, read about or seen. No one will also take into consideration the local government unit, which does not care about promoting itself according to the “city placement” strategy – it is not in the media, nor at specialist meetings or exhibitions, or the one, which does not exist in “the environmental circuit”. Even, potentially interesting and unique cities must therefore solicit but also present, invite the creative environments representatives to declare in direct contact, document and simulate the contribution of an individual to the concept and the film realization itself.
The managers and advisers of the marketing services in the cities are aware, that the teams of the film studios have many localization possibilities at their disposal for the production of films, beginning from specially built media cities, by adjusted to the filmmakers districts and smaller parts of the cities to “live”, authentic, normally func-tioning urban organisms.
General truth is that the cities are similar to each other, especially the ones lo-cated in the same geographical- environmental zones, cities which have similar location origins, similar functions, size and development mechanisms. But at the same time, there are no identical cities, which even have similar attractions, people, atmosphere and im-age. That is why, the film studios` managers have the whole set of potential localiza-tions, which match their organizational, logistic, screenplay, financial and media re-quirements. Only in some cases, their decisions of choice are determined or limited, which results from the film plot, its clear and unambiguous geographical relation or access to unique resources (objects, people) and the places, where they appear.
From the point of view of the whole project connected to the production of a certain film, the decision which place to choose to record a film belongs to the crucial, strategical decisions and has an important influence on its final success. From this rea-son, the main problem for the filming team is such a choice of the city (place) of the film realization, thanks to which its own (artistic) values would be enriched in specific “local-ization pension”, understood as a promotional addition for the film, resulting from a chosen place of its realization. Therefore, it is about specific strengthening of the film project from the side of the recorded city, the city which has a big promotional-media potential. In this way, a mutual flow of benefits comes to realization – the city promotes itself thanks to the film, but also the film itself is promoted thanks to its own media force.

168
Conclusions - "the film in the city-the city in the film" The “city placement” concept as a special kind of a known “product placement” concept has been used for many years. It is more and more often the subject of discussions and analyses in the local government environment, actually their organs of executive power and being the main flow of discussion, similarly to other marketing activities connected to the efficiency and effectiveness of audiovisual undertakings, where its own city or region appears, above all, the film production. Examples of some Polish and foreign villages, cities and regions, clearly revived the authorities of many settlement units inter-est in “getting” the film crews, and at the same time, placing their cities in certain prod-ucts.
The willingness to show and expose the city or region values withstand widely understood, necessary disbursals as the condition of a success of marketing undertaking of the „city placement’ type. In the account of the “profits and losses”, marketing bene-fits, which have primitive character, are usually taken into consideration on the side of benefits. They mainly increase the degree of the place recognizability- the level of its awareness in the society, in occupational, demographical and regional groups.
Common identification of the city or region, their distinguishing and unique features as the results of repeated audiovisual products emissions, make the society want to meet them better, direct contact, participation or sensual experience. Primitive benefits bring secondary ones – generating new form of tourism. It is ultimately connected to the places of film action, objects, districts, institutions, and even people, what comes to “regular or advanced” visitations of them – organized or individual sightseeing, degusta-tion, playing scenes, and even meetings and discussions under the motto “let`s experi-ence it again”. Film tourism is more and more meaningful. It has the followers in the whole world. It is a crucial enrichment of traditional tourist offer for cities and film re-gions. It can be thought that in the nearest future it will be, actually its economic effects, an important factor and argument in the decision making process of the municipal au-thorities connected with contacting the film production.
References Choliński A., 2013. Product Placement – planowanie, kreacja i pomiar skuteczności Product
placement- planning, creation and the effectiveness measurement). Oficyna Wolters Kluwer Business Warszawa.
Choliński A.,2002. U źródeł product placement (In the sources of the product placement). Market-ing w Praktyce VIII.
Czarnecki A., 2002. Pomiar skuteczności product placement (The measurement the of product placement efficiency). Marketing w Praktyce XII.
Gmerek N., Misztak M., 2007. Product placement jako instrument komunikacji marketingowej. (Product placement as an instrument of marketing communication). Zeszyty Naukowe Uni-wersytetu Szczecińskiego nr 472
Gołata K., 2012. Możliwości wykorzystania product placement do budowania wizerunku miast i regionów (The possibility of using the product placement to build the image of the cities and regions). [ w:] Public Relations. Doskonalenie procesu komunikowania (Public relations- im-proving the communication process), pr. zbior. pod red. A. Adamus – Maruszyńskiej, R. Mac-kowskiej, Uniwersytet Ekonomiczny w Katowicach.
169
Sadowski A., Szymaniak T., 2008. Product placement w praktyce (The product placement in pracitce). Marketing i Rynek VII.
Urbaniec E., 2009. Product Placement – medioznawstwo a marketing kreatywny (Product place-ment – media studies and creative marketing). Novae Res – Wydawnictwo Innowacyjne w Gdyni.
Wyrwisz J., 2013. Product Placement – korzyści i ograniczenia w komunikacji marketingowej produktów i usług (Product Placement – benefits and limits in marketing communication of the products and services). Przegląd Organizacji XIII.
Zawadzki P., 2013. City placement jako element promocji produktu turystycznego miast (The city placement as an element of the tourist product promotion of the cities). Prace Naukowe Uni-wersytetu Ekonomicznego we Wrocławiu nr 304
City placement - innowacyjny środek promocji miast
Streszczenie W artykule dokonano próby szczegółowej projekcji strategii „city placement” z zaakcentowaniem głównych jej wątków, elementów składowych oraz problemów decyzyjnych zespołów realizato-rów filmowych. Autor oparł się w tym względzie na diagnozie oraz analizie procesów oraz proce-dur decyzyjnych właściwych dla dużych polskich miast, ich organów administracyjnych, strategii promocyjnych oraz zasad współpracy z partnerami medialnymi. Zastosowane ujęcie procesowo – strukturalne w założeniu ma naświetlić główne determinanty wdrażania strategii „city placement” w marketingowej praktyce miast i regionów.
Słowa kluczowe: promocja miast,"city placement", strategie marketingowe, miasto w biznesie filmowym
Informacja o autorze:
Prof. dr hab. Andrzej Szromnik, Uniwersytet Ekonomiczny w Krakowie Katedra Handlu i Instytucji Rynkowych ul. Rakowicka 27, 31-510 Kraków, e-mail: [email protected]
170
15 (64) 2016
Jan W. Wiktor Uniwersytet Ekonomiczny w Krakowie
Próba analizy bibliometrycznej publikacji 25. Zjazdu Katedr Marketingu, Handlu i Konsumpcji - doświadczenia
przeszłości i wyzwania przyszłości
AN ATTEMPT OF BIBLIOMETRIC ANALYSIS OF THE PUBLICATIONS FROM THE 25TH CONGRESS OF MARKETING, COMMERCE AND CONSUMPTION
DEPARTMENTS - EXPERIENCES OF THE PAST AND CHALLENGES OF THE FUTURE
Artykuł stanowi próbę oceny bibliometrycznej publikacji 25. Zjazdu katedr marketingu, handlu i konsumpcji w Toruniu w 2014 r. Składa się z dwóch części. Pierwsza koncentruje uwagę na istocie bibliometrii, jej znaczeniu w działalności naukowej i komunikowaniu wyników badań. Część druga prezentuje rezultaty własnej kwerendy i analizy dorobku publikacyjnego Zjazdu przy wykorzystaniu podstawowych przekrojów bibliometrii (kraj pochodzenia autora publikacji, język i forma publikacji). Analizowany materiał objął zbiór 195 artykułów, w których cytowano łącznie 3164 prac autorów polskich (49,8%) i zagranicznych (50,2%). „Współczynnik wpływu”- „impact factor” publikacji ze zjazdów wcześniejszych ukształtował się na poziomie znikomym - 0,6%. Prezentowana analiza ma charakter wstępny i ograniczony. Za zasadne można uznać podjęcie szerokich, pogłębionych badań bibliometrycznych publikacji z zakresu marketingu w Polsce i stworzenie wskaźnika wpływu marketingu ( literatury marketingowej) na inne dziedziny i dyscypliny nauki. Punktem wyjścia winno być stworzenie uzgodnionego zestawu czasopism z zakresu marketingu, rynku, handlu i konsumpcji, których pozycja i „efektywność” w znaczeniu bibliometrii jest szczególnie ważna i znacząca. Byłoby to zarazem swoistą odpowiedzią środowiska na „wyzwania przyszłości” - wyzwania akcentowane w drugiej części tytułu jubileuszowego, 25. Zjazdu katedr w Toruniu w 2014 r.
Słowa kluczowe: marketing, bibliometria, 25 Zjazd katedr marketingu w Polsce
1. Wprowadzenie Celem artykułu jest refleksja nad polskim „piśmiennictwem marketingowym” poprzez pryzmat bibliometrii. W szczególności zmierza do analizy prac zawartych w specyficznej „publikacji” przygotowanej na prestiżowe spotkanie środowiska naukowego zajmującego się problematyką handlu, rynku, konsumpcji i marketingu w formie 25. Zjazdu katedr. Zjazd ten, pod nazwą „Marketing - handel - konsumpcja.

171
Doświadczenia przeszłości i wyzwania przyszłości” miał miejsce w Toruniu w dniach 14-16.09.2014 r.
Realizacja zamierzeń wyrażonych przez formułę badań bibliometrycznych w odniesieniu do „literatury marketingowej” (jest to termin ujmujący łącznie dorobek badań nad rynkiem, handlem, konsumpcją i marketingiem) jest zamierzeniem niezwykle rozległym. Pełna, odpowiadająca współczesnym standardom analiza bibliometryczna wymaga pracy licznego lub nawet licznych zespołów, opracowania systemów i programów informatycznych, a przede wszystkim - poczynienia ustaleń metodycznych, precyzujących zakres i metody prowadzenia badań, sposób ich prezentacji i wykorzystania. Jako taki cel ten posiada, w moim przekonaniu, znaczenie kierunkowe i przyszłościowe. Jest zarazem istotny z punktu widzenia dokumentacji dorobku nauki o marketingu w Polsce i starań o jego pełny, ścisłym tego znaczeniu, status jako samodzielnej dyscypliny lub subdyscypliny naukowej1. Ograniczone możliwości i zarazem ramy artykułu stanowią przesłankę jego syntetycznego charakteru i profilu. Artykuł ma dwie części. Pierwsza ukazuje istotę i koncepcję badań bibliometrycznych, druga przedstawia założenia i syntetyczne rezultaty badań własnych nad problematyką wyrażonych w tytule pracy.
2. Bibliometria - istota, funkcje i przekroje analityczne Bibliometria jest ważnym i dynamicznie rozwijającym się nurtem badań nad nauką i jej osiągnięciami, prowadzonych w ramach naukoznawstwa, informacji naukowej i badań nad rozwojem nauki jako procesu informacyjnego2 (Klincewicz i in., s. 7). Istotę bibliometrii wyraża proces badania piśmiennictwa naukowego przy wykorzystaniu metod matematycznych i statystycznych. Jest sposobem dokumentowania, krytycznej analizy i wnioskowania odnośnie do stanu naukowego poznania świata i jego opisu i formy udostępnienia jego rezultatów. W monografiach wiele miejsca poświęca się kwestiom formalnym, definicyjnym i metodycznym. Oba nurty są znacząca, wręcz zasadnicze dla wyrażenia istoty i znaczenia bibliometrii. B. Nowak, prezentując krytyczne studium nad problemami metodycznymi badań nad piśmiennictwem (nawiązując m. in. do prac E.W. Hulme’a, A. Pritcharda, F. Narina, J. Molla, H.D. Withe’a i K. McCaina, W. Pindlovej, M. Skalskiej-Zlat) pisze, że bibliometria stanowi „kwantytatywny, ilościowy sposób badań nad książką naukową i informacją naukową”
3, a szerzej z pewnością także nad każdą publikacją o charakterze naukowym”. Jest jednak nie tylko analizą bibliograficzną książki - jest czymś znacznie głębszym i poważniejszym. Ważne jest wyróżnienie - w ślad za propozycją D.Nicholasa i M,
1 Zob. w tej sprawie m. in. L. Żabiński, Nauka o marketingu i rynkach. Argumenty za instytucjonalizacją dyscypliny naukowej raz jeszcze, „Marketing i Rynek” 2014, nr 8 (wersja CD), B. Pilarczyk., Ewolucja marketingu w kontekście powiązań z innymi dyscyplinami nauki, [w:] E. Okoń-Horodyńska (red.), Przedsiębiorczość jako niewykorzystane źródło sukcesu polskiej gospodarki, PTE, Warszawa 2009, Sz. Cyfert, W. Dyduch, D. Latusek-Jurczak, J. Niemczyk, A. Sopińska, Subdyscypliny w naukach o zarządzaniu - logika wyodrębnienia, identyfikacja modelu koncepcyjnego oraz zawartość tematyczna, „Organizacja i Kierowanie” 1/2014. 2 Klincewicz K., Zemigła M., Mijal M.: Bibliometria w zarządzaniu technologiami i badaniami naukowymi technologiami, Ministerstwo Nauki i Szkolnictwa Wyższego, Warszawa 2012, s. 7. 3 B. Nowak, Bibliometria. Webometria. Podstawy, wybrane zastosowania, Wydawnictwo Naukowe UAM, Poznań 2006, s. 17.

172
Richte’a dwóch komponentów, i zarazem podejść lub nurtów badawczych - bibliometrii opisowej (descriptiv bibliometrics) i bibliometrii behawioralnej (behavioral bibliometrics). Przedmiotem bibliometrii opisowej jest poznanie i statystyczna analiza cech (parametrów) publikacji naukowych, ale także opis struktury instytucjonalnej nauki i sfery badawczej - instytucji zajmujących się badaniami naukowymi i publikacją wyników. Z kolei bibliometria behawioralna skupia się „na badaniu relacji zachodzących między cechami dokumentów, a jej podstawą jest analiza cytowań”4. Rozwój piśmiennictwa naukowego w świecie sprawia, że analiza bibliometryczna staje się współcześnie nieodzownym elementem formalnym badań w nauce, i badań nad nauką, równie ważnym jak rzeczywisty świat badań naukowych.
Przedmiotem badań bibliometrycznych jest twórczość naukowa, wyrażona w postaci dokumentu o zróżnicowanej formie. Jak pisze Skalska-Zlat, bibliometria „może brać pod uwagę wszystkie rodzaje dokumentów i badać je w sposób kompleksowy bądź też wybrać określony rodzaj (np. książki, czasopisma, […]) i pewien tylko rodzaj opisu bibliograficznego (np. autorów publikacji, kraj pochodzenia czy język). Kombinacji i skojarzeń jest bardzo wiele, a wszystko zależy od celu badań”5 . Jest to ważne z punktu widzenia celu niniejszego artykułu. Badania bibliometryczne mają swoją wartość autoteliczną, ale mają zarazem znaczenie utylitarne - ich rezultaty „umożliwiają bowiem definiowanie i ocenę wskaźników efektywności badań naukowych, ocenę badaczy i jednostek badawczych oraz doskonalenie działalności systemów informacyjnych […], W badaniach tych wykorzystuje się specyficzne dla bibliometrii narzędzia postępowania badawczego, takie jak np. analiza cytowań czy prawa bibliometryczne. […] Jednostką pomiaru jest opis bibliograficzny lub wybrane jego cechy (zarówno formalne jak i treściowe. […] Rezultaty studiów bibliometrycznych znajdują wykorzystanie w opisie i wyjaśnianiu zjawisk zachodzących w nauce poprzez analizę wytwarzanego przez nią strumienia informacji”6. Takim, znaczącym zasobem i strumieniem informacji w badaniach naukowych nad marketingiem jest niewątpliwie publikacja z 25. Zjazdu katedr w Toruniu w roku 2014. W bibliometrii toczy się dyskusja nad wieloma szczegółowymi zagadnieniami terminologicznymi i metodycznymi. Same w sobie są ważne, jednak niemożliwe i zbędne do podjęcia w niniejszym opracowaniu. Z punktu widzenia celu artykułu należy podkreślić na kilka zasadniczych wątków dyskusji. Analizy bibliometryczne mają swoje możliwości i ograniczenia - dotyczy to zwłaszcza obszaru nauk społecznych, w ramach których sytuuje się ekonomia ze swoim subsytemami badawczymi, naukami o zarządzaniu, w tym marketingu. Zadaniem badań bibliometrycznych jest analiza i ocena piśmiennictwa naukowego w jego różnorodnych formach - bada się zatem wielkość, strukturę i dynamikę zmian efektów badań naukowych wyrażonych w różnorodnych formach komunikacji pisanej. Formy te obejmują zarówno wydawnictwa zwarte, publikacje w czasopismach i prezentowane w innych formach wydawniczych. W ostatnich latach 4 Tamże, s. 17. 5 Skalska-Zlat M.: Bibliometryczna analiza zbiorów publikacji jako podstawa oceny zespołów i instytucji naukowych, „Zagadnienia Naukoznawstwa” 3-4/1995, s. 186. 6 P. Nowak, Bibliometria…, op. cit., s 19. Zob. także Drabek, A.: Bibliometryczna analiza czasopism naukowych w dziedzinie nauk społecznych, Dom Wydawniczy Duet, Toruń 2010.

173
przedmiotem badań staje się dorobek naukowy zawarty w zasobach sieci, a webometria ze swoimi zasadami i wyraźną specyfiką środowiska Internetu jest znaczącą częścią badań naukometrycznych. Rejestracja dorobku, jego naukowy opis przez pryzmat przyjętych cech i kryteriów, ocena wpływu autora, jego dzieła na rozwój nauki (dyscypliny naukowej) i ewaluacja czasopisma naukowego, jego znaczenia jako miejsca sformalizowanej komunikacji naukowej jest tylko pierwszą, choć niezwykle ważną funkcją bibliometrii. Jej naturalne uzupełnienie stanowi - zgodnie z logiką badań naukowych - poszukiwanie i formułowanie prawidłowości i praw, którymi można wyrazić i opisać uogólnione, pojedyncze wyniki i rezultaty. Przykładami takich prawidłowości w bibliometrii są chociażby prawo rozproszenia S.C. Bradforda, prawo A. Lotki czy prawo G. Zipfa. Analiza materiału bibliograficznego - zasobów i strumieni informacyjnych o charakterze masowym jest podstawą formułowanych uogólnień, choć niewątpliwie należy pamiętać o naturalnych w tym zakresie ograniczeniach w wymiarze czasu, przestrzeni i formy publikacji.
Bibliometria, zarówno w tradycyjnym środowisku edytorskim - klasycznych form wydawniczych publikacji naukowych jak i w środowisku sieci koncentruje się na danych o charakterze masowym. Jest to w pełni zrozumiałe, zważywszy na światowe, ale też i regionalne zasoby publikacji o charakterze naukowym. Rozwój badań bibliometrycznych, zarówno o charakterze statystycznym jak i behawioralnym, poszukiwanie powiązań między strumieniami i źródłami informacji naukowej wymaga oparcia na technologiach informacyjnych. Dotyczy to zarówno kwerendy danych, jednostek opisu bibliograficznego jak i poszukiwania zależności między poszczególnymi, przyjętymi do analiz przekrojami i właściwościami cech dokumentów. Bez tego nie jest możliwy do osiągnięcia cel, jaki stawia przed sobą bibliometria. Z tych względów zasadnicze znaczenie mają skomputeryzowane bazy danych publikacji naukowych. Problematyka baz danych a także indeksów cytowań mają swój zasadniczy ciężar gatunkowy. Do tych dwóch zasadniczych kwestii jest niekiedy sprowadzana istota badań bibliometrycznych, zwłaszcza tego nurtu, który analizuje rozmiary dorobku publikacyjnego i poszukuje właściwych, poprawnych merytorycznie wskaźników „efektywności naukowej” - zarówno pojedynczych osób, naukowców jak i instytucji naukowo-badawczych, w tym efektywności czasopism naukowych, ich znaczenia dla nauki i środowiska naukowego.
Zagadnienia baz danych oraz indeksów cytowań, same w sobie interesujące i złożone, są przedmiotem licznych studiów i analiz. Stanowią zarazem przedmiot sporów i kontrowersji toczonych w wymiarze metodycznej płaszczyzny ewaluacji „efektywności naukowej” badacza, instytucji, czasopisma naukowego. Nie rozwijając tego wątku podkreślmy w tym nurcie refleksji znaczenie baz danych i indeksów cytowań Institute for Scientific Information (ISI), Science Citation Index (SCI - na stronie Web of Science), Journak Citation Reports (JCR), zawierający tytuły i dane na temat czasopism indeksowanych w ISI/ThompsonScience. Czasopisma są charakteryzowane poprzez 2 wskaźniki: impast factor oraz immediacy index.
Każda z analiz bibliometrycznych jest zawsze osadzona w określonym czasie i określonej przestrzeni. Mogą one przybrać formę analizy wąskiej, (lokalnej), średniej i najszerszej (światowej), a kryterium zasięgu dotyczyć może zarówno przestrzeni, rozmiarów baz bibliograficznych, liczby jednostek pomiaru itp.

174
Szczególnym przedmiotem uwagi bibliometrii jest badanie i ocena efektywności czasopisma naukowego. Zagadnienie jest interesujące i ważne samo w sobie, budzi przy tym liczne kontrowersje metodyczne, związane z procedurą i kryteriami oceny jego „jakości”. Kategoria jakości merytorycznej czasopisma naukowego jest zagadnieniem wielowymiarowym i trudnym. Wciąż poszukiwane są kryteria, mierniki i sposoby wyrażenia rangi tytułu i znaczenia dla rozwoju nauki. Metod oceny wartości czasopisma jest wiele - obejmują one zarówno metody metryczne, jak i oparte na innych zasadach. Przykładem oceny jest ranking czasopism MNiSzW wyróżniający trzy kategorie - A, B i C. Każda z nich posiada inną punktację dla poszczególnych tytułów i jest zmienna w okresach rocznych. Punktacja czasopism - ranking MNiSzW ma ważne konsekwencje - społeczne - dla czasopisma jak i osobiste, dla naukowca, autora. Oba nurty zasługują na wyraźne podkreślenie i podjęcie - już w innym miejscu - dyskusji i refleksji. Z punktu widzenia zamierzeń artykułu ważne w tym miejscu jest zwrócenie uwagi na ocenę rangi czasopisma przez wskaźnik cytowalności prac w nim zawartych oraz sformalizowane metody oceny „efektywności” lub „jakości czasopisma”. Cytowalność prac, rozróżnienie cytowań, „właściwych” lub „dobrych” z jednej strony i cytowań „niewłaściwych” lub „złych” z drugiej to zasadnicze elementy poważnego, wieloaspektowego zjawiska i problemu w nauce. Przymiotniki powyższe odzwierciedlają - ogólnie ujmując - wartość cytowanych w danym tekście prac - odpowiednio: dużą, znaczącą i małą, nieistotną. Poza tym zasadniczym nurtem ewaluacji cytowań kryje się szereg zagadnień merytorycznych - nawiązywanie do istniejącego dorobku nauki i stanu wiedzy, ale także kwestii etyki pracy i publikacji naukowej, Cytowalność prac poszczególnych badaczy, autorów tekstów staje się ważnym elementem formalnej oceny kandydata w postępowaniu awansowym. Nie podejmując tego nurtu rozważań podkreślmy w tym miejscu ważne znaczenie tej kategorii dla analizy tytułowego problemu artykułu. Drugą kwestią oceny „efektywności” czasopisma naukowego są zagadnienia metodyki, w tym zasady, metody i miary oceny. Za podstawowe wskaźniki oceny czasopisma w bibliometrii przyjmuje się: wskaźnik wpływu czasopisma (IF - impast factor, journal), ustandaryzowny wskaźnik wpływu czasopisma (impast factor standard), wskaźnik odbicia (echo factor), immediancy index, wskaźnik (waga) wpływu (influence weight), zdolność „przyciągania” autorów („attraction power), a także wskaźnik wpływu dziedziny wiedzy7. Wskaźniki te, mimo że mają odmienną konstrukcję, sposób liczenia i pole recepcji, mają w zamierzeniu wyrażać jakość - „efektywność” danego tytułu czasopisma. Wykorzystane w skali szerokiej, do porównań w ramach poszczególnych obszarów wiedzy, dziedzin i dyscyplin naukowych, przy zachowaniu formuły ceteris paribus ujawniają - lub mogą ujawniać znaczenie poszczególnych tytułów czasopism dla upowszechnienia wyników badań naukowych. Mierniki te, oparte na rozbudowanych bazach danych, wraz z zagadnieniami oceny bibliometrycznej poszczególnych naukowców, autorów tekstów, w tym cytowalności ich tekstów, wyceny udziału w pracach zbiorowych stanowią nadal istotne i ważne pole dyskusji w bibliometrii.
7 Opis tych wskaźników zawierają prace Nowak P., Bibliometria…, op. cit, , Klincewicz K., Zemigła M., Mijal M.: Bibliometria w zarządzaniu…, op. cit., Drabek, A.: Bibliometryczna analiza…, op. cit.
175
3. Założenia metodyczne badań Przedmiotem analizy artykułu jest „publikacja” przygotowana na 25. Zjazd Katedr Rynku, Marketingu, Handlu i Konsumpcji w Toruniu w 2014 r. Stanowi ona zbiór artykułów (referatów-?) opublikowanych w czasopiśmie naukowym „Marketing i Rynek” 2014, nr 8, w wersji elektronicznej i w tej postaci znajduje się na stronie wydawcy - PWE w Warszawie (www.marketingirynek.pl).
W roku 2014, w roku publikacji „Marketing i Rynek” (ISSN 1231-7853) znajdował się na liście B wykazu czasopism Ministra Nauki i Szkolnictwa Wyższego, mając przyznanych, w oparciu o określoną metodologię oceny czasopism naukowych - 6 punktów. W roku 2010 tytuł posiadał 9 punktów, w latach 2011-12 - 7, w roku 2013 - otrzymał 6 punktów. Nie ma wskaźnika IF (impact factor). Wydawcą tytułu jest Polskie Wydawnictwo Ekonomiczne S.A.. Klasyfikacji Thomson - Reuters sytuuje tytuł Marketing i Rynek w kategorii: Business; Communication; Economics; Management; w klasyfikacji polskiej (opisie w bazie impactfaktor.pl) - wśród publikacji z dziedziny nauk ekonomicznych, dyscyplin: ekonomia i nauki o zarządzaniu. Językiem publikacji są języki polski i angielski. Czasopismo ma radę naukową - tworzą ją naukowcy zajmujący się problematyką „rynku i marketingu” z Polski, Chorwacji, Słowacji, Stanów Zjednoczonych i Ukrainy. Wszystkie teksty naukowe są recenzowane przez zespół recenzentów. „Marketing i Rynek” jest obecny w bazach: CEJSH (http://cejsh.icm.edu.pl/), PBN(https://pbn.nauka.gov.pl/journals/34988), Index Copernicus - IC Journals Master List http://www.journals.indexcopernicus.com/wskaźnik ICV 5,35) oraz BazEkon (http://kangur.uek.krakow.pl/bazy_ae/bazekon/nowy/).
Analiza bibliometryczna może być prowadzona w wielu różnych przekrojach, tak indywidualnym, w odniesieniu do oceny dorobku („produktywności”) autorów - badaczy, jak i instytucjonalnym - oceny „efektywności” czasopisma. Zazwyczaj zmierza do określenia tych wskaźników i miar, jakimi posługuje się bibliometria, zarówno wymiarze światowym jak i regionalnym (krajowym). Operuje tymi właśnie standardami i przekrojami analizy8.
Analiza w niniejszym artykule ma charakter specyficzny. Stanowi próbę bibliometrycznej oceny dorobku nie całego tytułu w pewnym okresie (roku, n- latach), ani autorów, publikujących na jego łamach swoje teksty. Podejmuje badania struktury cytowań we wszystkich artykułach, jakie zostały przygotowane na 25. Zjazd w Toruniu w roku 2014 i jakie zostały opublikowane we wspomnianym wyżej numerze czasopisma. Sama analiza w podstawowych przekrojach bibliometrii jest ciekawa i interesująca. Ważnym zarazem wyzwaniem tego typu badań była i jest kwestia terminologii, w tym precyzja w określeniu podstawowych „jednostek opisu bibliograficznego”. Mam przykładowo na myśli zróżnicowanie „form wydawniczych”, jakie są cytowane w bibliografii każdego z analizowanych tekstów. Czy „rozdział w monografii” jest rzeczywiście „rozdziałem w monografii”, czy artykułem - referatem przygotowanym na konferencję naukową i wydaną w formie pracy zwartej, a nazwa tej
8 Zob. Marszakowa-Szajkiewicz I.: O bibliometrii i bazach danych Instytutu Informacji Naukowej (ISI) w
Filadelfii, „Nauka” 3/2000, s. 181–190.

176
formy wydawniczej nawiązuje do formalno-biurokratycznych rozwiązań w nauce i sposobów oceny autora, badacza, jednostki naukowej uczelni czy czasopisma? Czy wykorzystywane podręczniki jako prace o charakterze dydaktycznym mogą być zaliczane do źródeł naukowych w artykule o takim właśnie charakterze? Podobnych pytań, wynikających z założeń badań bibliometrycznych jest więcej. Mam świadomość wielu wyzwań i ograniczeń wynikających z przyjęcia pełnego standardu badań bibliometrycznych - tak w wymiarze merytorycznym, formalnym jak i organizacyjnym. Podkreślę tym miejscu ograniczone możliwości badań własnych i pracochłonność kwerendy9 oraz problemy przyjętej formy opisów bibliograficznych w artykułach (przypisy dolne i brak bibliografii załącznikowej). Przy takich ograniczeniach analiza w niniejszym artykule ma charakter wyraźnie ograniczony i selektywny. Nie podejmuje, bowiem tego uczynić nie mogła, szerokiego opisu bibliograficznego jednej, specyficznej publikacji - „materiałów na 25. Zjazd Katedr Marketingu, Handlu i Konsumpcji”, w tym biblio metrycznej oceny poszczególnych badaczy, sformułowania indywidualnych wskaźników wpływu i wskaźników cytowalności czy oceny poszczególnych wskaźników oceny efektywności czasopisma naukowego („Marketingu i Rynku”). Artykuł zmierza do sformułowania odpowiedzi na pytanie, jaki jest „wskaźnik wpływu” (influence weight) publikacji przygotowanych na wcześniejsze zjazdy na dorobek i strukturę publikacji 25. Zjazdu w Toruniu w roku 2014. Analiza nie ma zamiaru ani podstaw formułować prawa i prawidłowości (wspomniane wcześniej prawa bibliometryczne), opisujące dorobek „polskiego marketingu”. Jest to bowiem zadanie niezwykle złożone, wymagające i poważnej pracy zespołowej, określonych środków, ustaleń formalnych, definicyjnych środowiska, a także określonych rozwiązań instytucjonalnych. Przy tych założeniach wyjściowych zaprezentowana poniżej analiza stara się sformułować odpowiedź na postawione pytanie - ważne i interesujące, nie tylko, jak sądzę, w wymiarze osobistych zainteresowań. Jest zarazem zrozumiałe, że jej wyjściowym elementem jest ogólny, bibliometryczny opis „obiektu i materiału badawczego” lub inaczej ujmując - określonego „zasobu informacyjnego”, jaki stanowi zbiór artykułów w czasopiśmie „Marketing i Rynek” 2014, nr 8, stanowiący dorobek publikacyjny 25. Zjazdu środowisk „katedr marketingowych”.
4. Publikacja 25. Zjazdu katedr w świetle analizy bibliometrycznej - doświadczenia przeszłości Publikacje 25. Zjazdu tworzą całość, składającą się ze 195 artykułów, napisanych łącznie przez 226 autorów. Liczba artykułów, w świetle bibliometrii, w tym „rozmiarów” czasopism naukowych, jest znaczna. W analizach bibliometrycznych za duże bazy danych uznaje się grupę ok. 500 artykułów danego tytułu. Przeciętnie, numer czasopisma „Marketing i Rynek” zawiera ok. 10 artykułów i doniesień (bez wersji artykułów dołączonych na CD i obecnych na stronie wydawnictwa. Artykuły
9 Pragnę w tym miejscu podziękować mgr K. Flis za pomoc w kwerendzie bibliograficznej, porządkującej części 4 i 5 „publikacji” ze Zjazdu oraz dr J. Petrykowskiej (współredaktorowi zestawu artykułów na łamach „Marketingu i Rynku”) za udostępnienie części (liczącej ok. 100 jednostek z bazy liczącej 195 artykułów) dokumentacji bibliograficznej.

177
jednoosobowe - stanowią 87,3% wszystkich tekstów, dwuosobowe - 10,2%, trzyosobowe - 1,5%, a tylko 1,0% % tekstów zostało napisanych przez 4. autorów. Zbiór artykułów składa się z 5 grup (części) merytorycznych:
1. Współczesne teorie, koncepcje oraz problemy marketingu, handlu i konsumpcji (n=30). W tej części znajduje się 28 artykułów indywidualnych i 2 artykuły napisane w zespołach trzyosobowych.
2. Wyzwania dydaktyki marketingu, handlu i konsumpcji (n=15). Artykuły indywidualne przygotowało 11 autorów, 4 artykuły zostały napisane jako wspólne: w tym 3 - w zespołach dwuosobowych i 1 -w zespole trzyosobowym.
3. Praktyczne aspekty marketingu (n=76). 65 artykułów zostało przygotowanych przez 1. autora, a 11 - jest tekstami napisanymi w zespołach dwuosobowych. Autorem jednego artykułu jest cudzoziemiec (poz, 3. 38)
4. Handel na rynkach lokalnych, regionalnych i globalnych (n=23). 21 tekstów jest jednoosobowych, a dwa mają formę prac zespołowych, w zespołach dwuosobowych.
5. Konsumpcja – zachowania, lojalność, satysfakcja nabywców (n=51). 45 artykułów jest jednoosobowych, a 6 - jest napisanych we współautorstwie, w tym 4 - w zespołach dwuosobowych, 1 - w trzyosobowym, 1 - w zespole czteroosobowym.
Przeprowadzona kwerenda dostarcza szerokiego materiału analitycznego. Ograniczone ramy artykułu zmuszają jednak do wyraźnej selekcji i zaprezentowania podstawowych wniosków i ocen. Analiza koncentruje uwagę na trzech zasadniczych kwestiach: 1) rozmiarach wykorzystanej (cytowanej) literatury, 2) poznania jej struktury w zasadniczym przekroju dla badan bibliograficznych oraz 3) identyfikacji znaczenia - zakresu wykorzystania publikacji zaprezentowanych na wcześniejszych Zjazdach katedr. Wyniki przeprowadzonej analizy można przedstawić w postaci następujących wniosków i konstatacji.
1. Rozmiary wykorzystanej literatury Analizowany zestaw 195 artykułów oparty został na 3164 pozycjach literatury. Szczegółową liczbę cytowań w przekroju grup tematycznych Zjazdu (i zarazem publikacji w MiR) przedstawiają tabele nr 1 i 2. Rozkład liczby cytowań jest następujący:
− grupa nr 1: średnia liczba cytowanych pozycji literatury wynosi 18,9, przy rozpiętości 3 do 50 (najmniejsza i największa liczba cytowanych prac w artykule),
− grupa nr 2: średnia wynosi 18,3 pozycje, przy rozpiętości 2-36, − grupa nr 3: średnia - 19,9, a rozpiętość określa relacja 0- 50 cytowanych
pozycji, − grupa nr 4: średnia liczba cytowanych prac wynosi 14,2, a zróżnicowanie 6-30, − grupa nr 5: średnia - 16,2, a rozpiętość liczby cytowań waha się w przedziale 4-
35. Z prezentowanych danych wynika, że przeciętnie każdy ze 195 artykułów nawiązywał do 16,2 prac. Czy można ocenić tę liczbę? Odpowiedź na to pytanie jest

178
złożona. Badania bibliometryczne wskazują na istote zróżnicowanie tego parametru pomiędzy dziedzinami i dyscyplinami. Są, dyscypliny, i zarazem czasopisma, w których normą jest niewielka liczba cytowań w publikowanych artykułach, są też dziedziny, w których norma jest zupełnie odmienna. Niezależnie od braku odpowiedniej płaszczyzny odniesienia dla czasopisma z marketingu należy zwrócić uwagę na istotne różnice w liczbie cytowań w ramach poszczególnych grup tematycznych publikacji Zjazdu. To zachęca do głębszej refleksji - biorąc chociażby pod uwagę jednolity, z założenia, charakter merytoryczny, każdej z wyróżnionych części. Ważnym elementem w tym nurcie analizy jest ocena autocytowań. Ten element badań bibliometrycznych dotyczy wyłącznie autorów „krajowych”, a więc grupy prac autorów polskich (wyjątkiem jest artykuł jednego autora z zagranicy - z Czech). Na 1575 cytowań prac autorów polskich - 173 stanowią cytowania własne. Stanowi to 10,9% ogólnej liczby cytowań. Nie rozwijam tej kwestii - ani nie formułuję sądów wartościujących, nawiążę jedynie do toczonej w środowisku naukowym, także w wymiarze międzynarodowym nad „fenomenem cytowań”, także do konstrukcji wskaźników cytowalności wyłączających autocytowania z pola recepcji. Chcę zarazem wyrazić przekonanie, że wszystkie mają charakter „cytowań dobrych” w tym znaczeniu, jakie nadaje bibliometria i stanowią potrzebną z merytorycznego punktu widzenia informację o własnych badaniach, studiach i publikacjach.
2. Struktura cytowanych prac Strukturę tę można - i tak czyni bibliometria - analizować w wielu, różnych przekrojach. W niniejszym artykule za wyjściowy przyjęto kraj pochodzenia autora cytowanej pracy (literatura autorów polskich i zagranicznych), a następnie - język cytowanej pracy i strukturę „rodzajową” wydawnictwa. Analiza operuje terminem „prace autorów polskich” i „autorów zagranicznych” z ważnego powodu. Publikacje autorów polskich były zaprezentowane w innych, niż polski, językach - angielskim (42 publikacje i niemieckim - 1 praca). Ogólnie rzecz biorąc, prace autorów polskich w innych językach stanowiły 2,7% cytowanych prac. Badania w oparciu o powyższe kryteria zaprezentowano w tablicach nr 1 i 2. Tabela 1. Syntetyczne zestawienie struktury cytowań publikacji autorów polskich w artykułach przygotowanych na 25. Zjazd katedr w Toruniu w 2014 r. („Marketing i Rynek” 2014, nr 8, wersja CD, www.marketingirynek.pl) Wyszczególnienie Część 1 Część 3 Część 4 Część 4 Część 5 Ogółem
Prace autorów polskich 193 131 602 177 472 1575
Autocytowania 27 3 74 12 57 173
Cytowania wtórne 6 3 5 2 1 18
Prace autorów polskich w językach obcych:
- angielskim
- niemieckim
10
4
11
1
7
11
42
1

179
Udział monografii, rozdziałów, monografii, podręczników w całości (w %%)
61,6
76,2
67,3
56,7
66,2
65,6
Artykuły on-line 6 10 12 6 22 40
Źródła on-line, raporty online, źródła niepublikowane (np. doktorat)
12 23 121 21 96
Artykuły z wcześniejszych Zjazdów” liczba i udział (w %%)
4
2.1
0
0,0
5
0,8
1
0,6
0
0,0
10
0,6
Źródło: badania własne Z prezentowanych danych wynika, że dla całego zbioru - 195 artykułów mających 3164 cytowań, proporcje między pracami autorów polskich i zagranicznych kształtują się na poziomie 1 - 1: udział cytowanych prac badaczy polskich wynosi 49,8%. W poszczególnych grupach tematycznych sytuacja jest nieco zróżnicowana - najmniejszy udział cytowanych prac polskich autorów ma miejsce w części nr 1: Współczesne teorie, koncepcje oraz problemy marketingu, handlu i konsumpcji (34,1%), a największy w części 5: Konsumpcja – zachowania, lojalność, satysfakcja nabywców (60,0%). Wyjaśnienie takiego zróżnicowania wydaje się naturalne i zrozumiałe. Istotnym czynnikiem jest właśnie profil i charakter każdej z części i obszaru tematycznego. Tabela 2. Syntetyczne zestawienie struktury publikacji z 25. Zjazdu katedr w Toruniu w 2014 r. - struktura cytowań literatury zagranicznej (prac autorów zagranicznych („Marketing i Rynek” 2014, nr 8, wersja CD, www.marketingirynek.pl) Wyszczególnienie Część 1 Część 2 Część 3 Część 4 Część 5 Ogółem
Prace autorów zagranicznych ogółem 373 143 609 149 315 1589
Prace w języku angielskim 333 132 527 117 258 1367
Prace wydane w języku polskim 40 8 75 15 55 193
W tym prace wydane w innych językach:
- niemieckim
- francuskim
- rosyjskim
- czeskim
1
2
2
3
2
1
15
1
1
1
1
19
4
6
1
Udział monografii, rozdziałów w monografii,
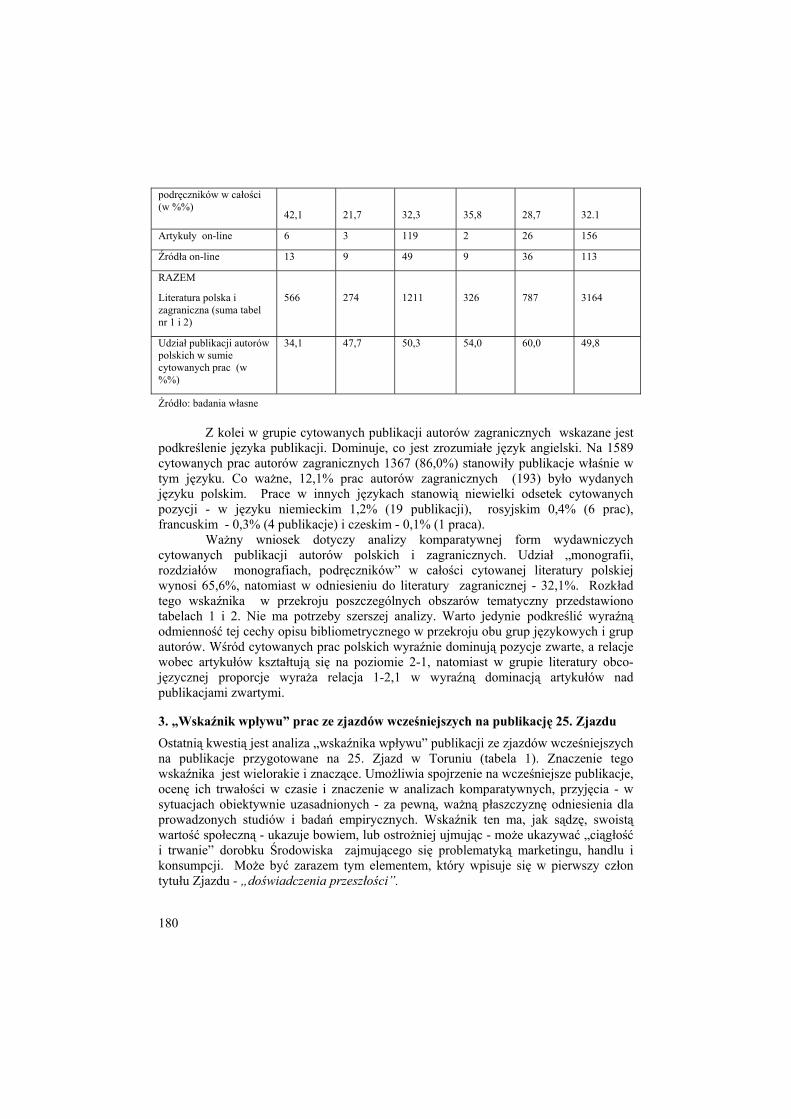
180
podręczników w całości (w %%)
42,1
21,7
32,3
35,8
28,7
32.1
Artykuły on-line 6 3 119 2 26 156
Źródła on-line 13 9 49 9 36 113
RAZEM
Literatura polska i zagraniczna (suma tabel nr 1 i 2)
566
274
1211
326
787
3164
Udział publikacji autorów polskich w sumie cytowanych prac (w %%)
34,1 47,7 50,3 54,0 60,0 49,8
Źródło: badania własne Z kolei w grupie cytowanych publikacji autorów zagranicznych wskazane jest podkreślenie języka publikacji. Dominuje, co jest zrozumiałe język angielski. Na 1589 cytowanych prac autorów zagranicznych 1367 (86,0%) stanowiły publikacje właśnie w tym języku. Co ważne, 12,1% prac autorów zagranicznych (193) było wydanych języku polskim. Prace w innych językach stanowią niewielki odsetek cytowanych pozycji - w języku niemieckim 1,2% (19 publikacji), rosyjskim 0,4% (6 prac), francuskim - 0,3% (4 publikacje) i czeskim - 0,1% (1 praca). Ważny wniosek dotyczy analizy komparatywnej form wydawniczych cytowanych publikacji autorów polskich i zagranicznych. Udział „monografii, rozdziałów monografiach, podręczników” w całości cytowanej literatury polskiej wynosi 65,6%, natomiast w odniesieniu do literatury zagranicznej - 32,1%. Rozkład tego wskaźnika w przekroju poszczególnych obszarów tematyczny przedstawiono tabelach 1 i 2. Nie ma potrzeby szerszej analizy. Warto jedynie podkreślić wyraźną odmienność tej cechy opisu bibliometrycznego w przekroju obu grup językowych i grup autorów. Wśród cytowanych prac polskich wyraźnie dominują pozycje zwarte, a relacje wobec artykułów kształtują się na poziomie 2-1, natomiast w grupie literatury obco-języcznej proporcje wyraża relacja 1-2,1 w wyraźną dominacją artykułów nad publikacjami zwartymi.
3. „Wskaźnik wpływu” prac ze zjazdów wcześniejszych na publikację 25. Zjazdu Ostatnią kwestią jest analiza „wskaźnika wpływu” publikacji ze zjazdów wcześniejszych na publikacje przygotowane na 25. Zjazd w Toruniu (tabela 1). Znaczenie tego wskaźnika jest wielorakie i znaczące. Umożliwia spojrzenie na wcześniejsze publikacje, ocenę ich trwałości w czasie i znaczenie w analizach komparatywnych, przyjęcia - w sytuacjach obiektywnie uzasadnionych - za pewną, ważną płaszczyznę odniesienia dla prowadzonych studiów i badań empirycznych. Wskaźnik ten ma, jak sądzę, swoistą wartość społeczną - ukazuje bowiem, lub ostrożniej ujmując - może ukazywać „ciągłość i trwanie” dorobku Środowiska zajmującego się problematyką marketingu, handlu i konsumpcji. Może być zarazem tym elementem, który wpisuje się w pierwszy człon tytułu Zjazdu - „doświadczenia przeszłości”.
181
W świetle prezentowanych danych indeks o tym charakterze kształtuje się na poziomie znikomym - dla wszystkich grup tematycznych wynosi bowiem 0,6%, a w przekroju dwóch grup - (grupa 2 i 4) „wskaźnik wpływu” wynosił 0,0%. Oznacza to w rzeczywistości bardzo niewielki wpływ dorobku wcześniejszych zjazdów na „publikację” przygotowaną na jubileuszowy, 25. Zjazd w Toruniu w 2014 r.
4. Podsumowanie - wyzwania przyszłości Artykuł stanowi próbę oceny bibliometrycznej publikacji 25. Zjazdu katedr marketingu, handlu i konsumpcji w Toruniu w 2014 r. Składa się z dwóch części. Pierwsza koncentruje uwagę na istocie bibliometrii, jej znaczeniu w działalności naukowej i komunikowaniu wyników badań. Ma charakter selektywny i syntetyczny. Część druga prezentuje rezultaty własnej kwerendy i analizy dorobku publikacyjnego Zjazdu przy wykorzystaniu podstawowych przekrojów bibliometrii kraj pochodzenia autora publikacji, język i forma publikacji). Analizowany materiał objął zbiór 195 artykułów, w których cytowano łącznie 3164 prac autorów polskich (49,8%) i zagranicznych (50,2%). „Współczynnik wpływu”, swoisty impact factor prac ze zjazdów wcześniejszych ukształtował się na poziomie znikomym - 0,6%. Prezentowana analiza ma charakter wstępny i ograniczony. Za zasadne można uznać podjęcie szerokich, pogłębionych badań bibliometrycznych publikacji z zakresu marketingu w Polsce i stworzenie wskaźnika wpływu marketingu - literatury marketingowej na inne dziedziny i dyscypliny nauki. Punktem wyjścia winno być stworzenie uzgodnionego zestawu czasopism z zakresu marketingu, rynku, handlu i konsumpcji, których pozycja i „efektywność” w znaczeniu bibliometrii jest szczególnie ważna i znacząca. Byłoby to zarazem swoistą odpowiedzią środowiska na „wyzwania przyszłości” - wyzwania akcentowane w drugiej części tytułu jubileuszowego, 25. Zjazdu katedr w Toruniu w 2014 r.
Literatura 1. Cyfert Sz., Dyduch W., Latusek-Jurczak D., Niemczyk J., Sopińska A.: Subdyscypliny w
naukach o zarządzaniu - logika wyodrębnienia, identyfikacja modelu koncepcyjnego oraz zawartość tematyczna, „Organizacja i Kierowanie” 1/2014
2. Drabek, A.: Bibliometryczna analiza czasopism naukowych w dziedzinie nauk społecznych, Dom Wydawniczy Duet, Toruń 2010
3. Klincewicz K., Zemigła M., Mijal M.: Bibliometria w zarządzaniu technologiami i badaniami naukowymi technologiami, Ministerstwo Nauki i Szkolnictwa Wyższego, Warszawa 2012 [http://www.nauka.gov.pl/fileadmin/user_upload/20120118_Bibliomet ria_w_zarzadzaniu_technologiami_i_badaniami_naukowymi.pdf].
4. Marketing i Rynek” 8/2014, zbiór 195 artykułów w wersji CD (PDF) 5. Nowak P.: Bibliometria. Webometria. Podstawy, wybrane zastosowania, Wydawnictwo
Naukowe UAM, Poznań 2006 6. Pilarczyk B.: Ewolucja marketingu w kontekście powiązań z innymi dyscyplinami nauki, [w:]
Okoń-Horodyńska E. (red.), Przedsiębiorczość jako niewykorzystane źródło sukcesu polskiej gospodarki, PTE, Warszawa 2009
7. Skalska-Zlat M.: Bibliometryczna analiza zbiorów publikacji jako podstawa oceny zespołów i instytucji naukowych, „Zagadnienia Naukoznawstwa” 3-4/1995

182
8. Żabiński L.: Nauka o marketingu i rynkach. Argumenty za instytucjonalizacją dyscypliny naukowej raz jeszcze, „Marketing i Rynek” 8/2014, (wersja CD)
Summary The paper endeavours to assess the publications from 25th Congress of Marketing, Commerce and Consumption Departments, which took place in Toruń in 2014, using a bibliometric analysis. It consists of two parts. The first focuses on the essence of bibliometrics, its importance in the academic activity and in communicating research results. The second part presents findings of the author’s own query, and an analysis of publication output of the 2014 congress. Research has utilized the basic bibliometric data (country of origin, the author, language and a form of publication). The analyzed material consisted of 195 papers, in which altogether there were 3164 texts of Polish (49,8%) and foreign (50,2%) authors. The impact factor of previous congresses was very small – 0,6%. This analysis has a preliminary and limited chatacter. It is recommended that an extended and deeper bibliometric research on the marketing literaturę in Poland should be undertaken, and a marketing impact factor (of marketing literature) on other academic fields and disciplines need to be created. A first step should focus on the formation of a set of marketing, market, commerce and consumption journals which positions and „effectiveness” in terms of bibliometrics is significant. It would be a community’s answer to the „challenges of the future,” which were underlined during the second part of the 25th Congress of Departments in Toruń in 2014.
Keywords: marketing, bibliometrics, 25th Marketing Departments Congress in Poland
Informacja o Autorze:
Prof. dr hab. Jan W. Wiktor Uniwersytet Ekonomiczny w Krakowie [email protected]
![Europejskie regionalne strategie innowacji jako źródło wzorców dla Polski [European regional innovation strategies as a pattern source for Poland]](https://static.fdokumen.com/doc/165x107/63331603576b626f850db341/europejskie-regionalne-strategie-innowacji-jako-zrodlo-wzorcow-dla-polski-european.jpg)