Political Preferences and Voting Behaviour of Naturalized Citizens in Germany
22
ECPR JOINT SESSIONS, TURIN, MARCH 22-27, 2002 Workshop No. 14: Political Participation of Immigrants and their Descendents in Post-War Western Europe Andreas M. Wüst Political Preferences and Voting Behaviour of Naturalized Citizens in Germany Contents Introduction .............................................................................................................................................. 1 Analytical Frame and Hypotheses ........................................................................................................... 2 Socio-demographic Characteristics of Naturalized Germans .................................................................. 3 Degrees of Integration ............................................................................................................................. 5 Naturalized Citizens’ Political Interest and Knowledge of German Parties and Politicians ..................... 6 Political Preferences ................................................................................................................................ 7 Voting Behaviour...................................................................................................................................... 8 Conclusion ............................................................................................................................................. 10 References............................................................................................................................................. 11 Appendix: Tables and Graphs ............................................................................................................... 12 Tables................................................................................................................................................. 12 Graphs................................................................................................................................................ 21 About the author Andreas M. Wüst, born in Karlsruhe in 1969, is working in the DFG-funded project “Euromanifestos”, directed by PD Dr. Hermann Schmitt at the MZES. The author studied political science, history, and geography at the University of Heidelberg and as exchange student at the University of Delaware/USA (1992/93). He received an M.A. from the University of Heidelberg in 1996 where he is lecturing since 1999 and has completed his dissertation on political preferences and voting behaviour of naturalized citizens in Germany in 2001. [Internet: www.awuest.de ; e-mail: [email protected] ]
-
Upload
xn--universitt-stuttgart-jzb -
Category
Documents
-
view
2 -
download
0
Transcript of Political Preferences and Voting Behaviour of Naturalized Citizens in Germany
ECPR JOINT SESSIONS, TURIN, MARCH 22-27, 2002 Workshop No. 14: Political Participation of Immigrants and their Descendents in Post-War Western Europe Andreas M. Wüst Political Preferences and Voting Behaviour of Naturalized Citizens in Germany
Contents
Introduction ..............................................................................................................................................1
Analytical Frame and Hypotheses ...........................................................................................................2
Socio-demographic Characteristics of Naturalized Germans..................................................................3
Degrees of Integration .............................................................................................................................5
Naturalized Citizens’ Political Interest and Knowledge of German Parties and Politicians.....................6
Political Preferences ................................................................................................................................7
Voting Behaviour......................................................................................................................................8
Conclusion .............................................................................................................................................10
References.............................................................................................................................................11
Appendix: Tables and Graphs ...............................................................................................................12
Tables.................................................................................................................................................12
Graphs................................................................................................................................................21
About the author
Andreas M. Wüst, born in Karlsruhe in 1969, is working in the DFG-funded project “Euromanifestos”, directed by PD Dr. Hermann Schmitt at the MZES. The author studied political science, history, and geography at the University of Heidelberg and as exchange student at the University of Delaware/USA (1992/93). He received an M.A. from the University of Heidelberg in 1996 where he is lecturing since 1999 and has completed his dissertation on political preferences and voting behaviour of naturalized citizens in Germany in 2001. [Internet: www.awuest.de; e-mail: [email protected]]
Andreas M. Wüst: Political Preferences and Voting Behaviour of Naturalized Citizens in Germany
- 1 -
Introduction As both direct and indirect consequences of immigration to post-war Germany, naturalization rates
have grown substantially in Germany in the last decade of the 20th century. Up to 1988, less than
50.000 people naturalized annually, since 1993 more than 200.000 people per year have done alike.
Further, there has been a shift in the composition of naturalized persons in the 1990s: as the bulk of
new citizens have been resettlers (Aussiedler) in the first half of the 1990s, the share of non-resettlers
has remarkably grown in the second half. While the latter growth can be characterized as a long-term
consequence of labour migration in the pre-recruitment stop period which is not only likely to continue
but to accelerate in the years to come, the resettler peak needs to be labelled a specific post-Cold War
phenomenon currently fading away.
The observations of an overall rise and of the change in composition of naturalized persons in
Germany are important pieces of the background picture the analysis presented here is based upon.
In the 1990s, naturalized citizens have added to the (native) German-born population in approximately
the same size as the German-born population declined. Naturalized citizens have therefore compen-
sated the population decline of German-born citizens demographically, sociologically, and politically.
In light of these developments, an electoral researcher’s analysis is likely to focus on political
preferences and the voting behaviour of the naturalized citizens in total, in the various sub-groups,
over time, and will ask about the short-term as well as the long-term impact the new citizens have and
will have on election results. To do so, data, and preferably survey data on both naturalized citizens,
and on their political preferences are necessary. This does especially require a sufficient number of
cases, but also a sufficient number of issue-related questions posed to naturalized citizens in a
survey. While the number of naturalized citizens in immigrant and foreigner surveys tends to be
satisfactorily high, the amount of useful information on political preferences tends to be low.1 The
opposite is the case for general surveys on political preferences in which naturalized citizens are
usually not separated from citizens by birth.
These deficiencies require an original database. Fortunately, data on the political preferences and on
the voting behaviour of naturalized citizens were collected in 1999 by a local face-to-face survey in
Heidelberg among 378 citizens which have been naturalized between 1988 and 1997, and by an
eleven-months screening within the monthly nation-wide Politbarometer, all-in-all interviewing 660
naturalized citizens by telephone. The findings presented in this paper are primarily based on
analyses of these two data sources.2
1 The main problem of these surveys (f.i. SOEP, Marplan surveys) is the focus on socio-demography. The information on long-, mid-, and short-term party preferences, candidates, issues, and problem-solving competencies is therefore limited.
2 An extended analysis is available in German (Wüst 2001).
Andreas M. Wüst: Political Preferences and Voting Behaviour of Naturalized Citizens in Germany
- 2 -
Analytical Frame and Hypotheses The traditional analysis of electoral behaviour builds on socio-structural, socio-psychological, and
rational choice models of voting. While the current paradigm of voting behaviour is supposed to be the
rational-choice approach, many recent analyses of voting behaviour have demonstrated that social
characteristics (Columbia Model), partly resulting in long-term party identifications, candidate and
issue evaluations (Michigan Model), do still play important roles in explaining the vote (f.i. Schmitt
2001; Weßels 2000: 152; Pappi 2002). Therefore it seems valuable to start with a socio-structural
analysis of the group of naturalized citizens, to proceed with a sub-group voting analysis based on
social characteristics, moving on to party identification, issue preferences, problem solving
competencies, and candidate evaluations. Consecutively, at the end of this initial analysis, voting
patterns of naturalized citizens and their subgroups will become clearer, and a comparison of the
voting patterns of naturalized Germans with the ones of German-born citizens should be possible.
However, an analysis of the voting behaviour of naturalized Germans does also need to consider
migratory factors for the analysis. Some of these factors can be included into the traditional set of
socio-demographic variables comparatively easy. This assessment applies to religion, ethnicity,
former citizenship, country of birth, year of immigration and naturalization etc. Within the socio-
demographic analysis, the importance of these additional factors will be worked out. Yet, in addition to
a modified socio-demographic set of variables, at least one aspect deserves special attention: the
degree to which naturalized citizens are integrated into German society. Therefore, the degree of
integration will be measured for the four dimensions of assimilation proposed by Hartmut Esser
(1980), using a selection of indicators portrayed: language skills (for the cognitive dimension),
membership in German clubs or parties (socio-interactive dimension), ethnic de-segregation in the city
district of living (structural dimension), and sense of belonging to the Germans (identificative
dimension).
Due to the character of the surveys, some socio-structural and the integration variables are only
available for the local (Heidelberg) survey. Nevertheless, most indicators on the local and on the
national level are identical, so that the overwhelming majority of analyses are applicable both to the
Heidelberg and the Politbarometer dataset.
Aside from principally instructive descriptive analyses, the following three hypotheses on the voting
behaviour of naturalized citizens are tested:
• that the electoral behaviour of naturalized citizens can well be explained by the traditional models of voting;
• that the voting behaviour of naturalized citizens can be explained better and can be understood better by including key variables of the migratory background into the analysis;
• that the degree of integration into German society reduces but not neutralizes the explanatory value of migration variables.
Andreas M. Wüst: Political Preferences and Voting Behaviour of Naturalized Citizens in Germany
- 3 -
Especially the last assessment refers to an old but important controversy between Robert A. Dahl and
Raymond E. Wolfinger. While Dahl (1961: 34-36) portrays immigrant voting patterns as transitory,
Wolfinger (1965) in line with the findings of Nathan Glazer and Daniel P. Moynihan (1963) assesses a
persistence of distinct immigrant voting patterns. And this is a key question the analysis presented
here attempts to answer at least partially. Based on the assumption that there are distinct immigrant
voting patterns which will be proven, their persistence and especially long-term effects are considered
to be crucial. Hence, if there is persistence, the immigrant vote will not only affect the outcome of
elections, but is also likely to affect the issue positions of parties, campaigns, and in the long run
possibly the party system as well.
Socio-demographic Characteristics of Naturalized Germans3
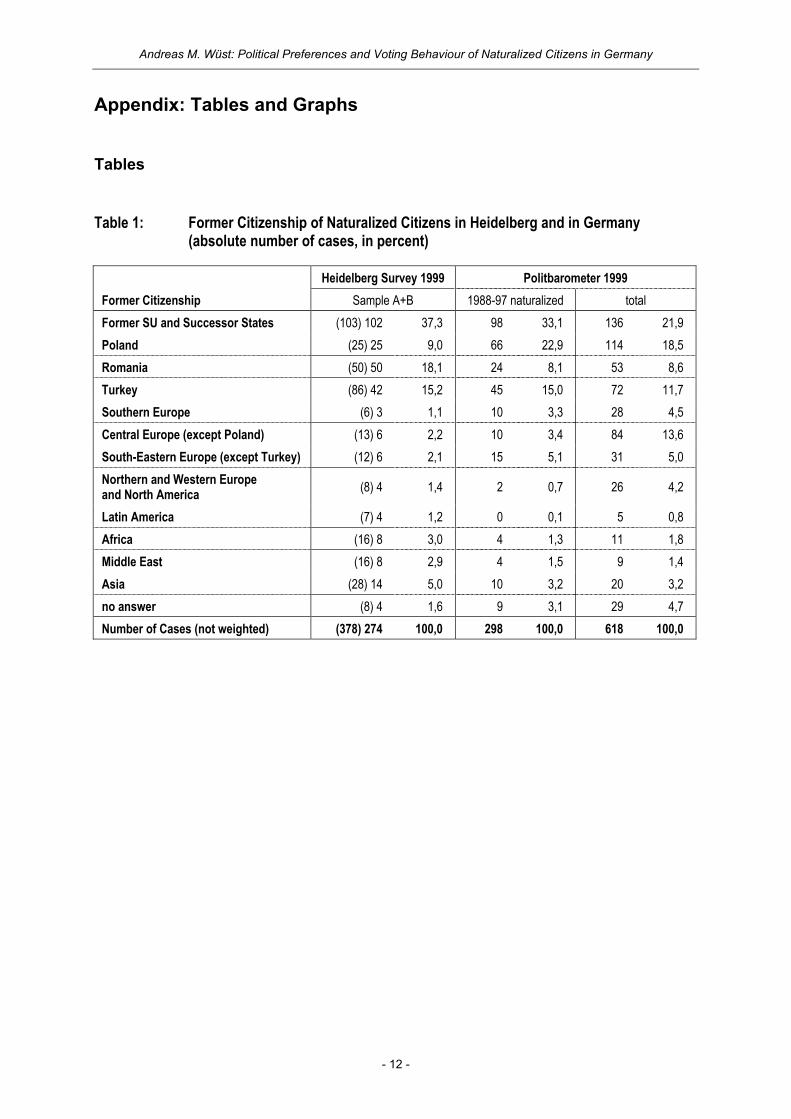
The results of the local and the nation-wide surveys show that most naturalized Germans have
formerly been citizens of the Soviet Union or of one of her successor states. Based on all naturalized
citizens interviewed, their share is 22 %; based on the core period (1988-97), they even make up one
third or more (Table 1). Former citizens of Poland are the second largest group nationally (19 % or
23 % for 1988-97), but only rank fourth in Heidelberg (9 %). The opposite holds true for naturalized
Germans of formerly Romanian citizenship: they rank second in Heidelberg (18 %), but only fifth
nationally (9 % or 8 % for 1988-97). A surge in naturalizations of formerly Turkish citizens in the 1990s
have made them the third largest sub-group of naturalized Germans for the core period (15 % in
Heidelberg and nationally), but they only rank fourth (12 %) in general, beaten by naturalized persons
from Central Europe (14 %) who have been the dominant group prior to the guestworker period (cf.
Graph 1).
So all in all, the big majority of naturalized Germans is made up of resettlers from Eastern Europe,
especially from the Soviet Union. Heidelberg proved to have a larger share of ethnic Germans from
Romania than from Poland, while the proportion of formerly Turkish citizens is almost the same nation-
wide as in Heidelberg. Considering naturalization by former citizenship over time, the history of
German immigration and of German naturalization policies is visible quite well. While there is a
negligible time-lag between immigration and naturalization peaks of the resettler total and the various
resettler groups (median: one year), the one for Turkish-born Germans (median: 21 years) is immense
(Heidelberg data only).
There are too many differences in socio-demographic characteristics between German-born citizens,
naturalized citizens, and the sub-groups to be dealt with in detail in this paper. Nevertheless, a
selective overview on the central characteristics is given. On average, naturalized citizens are five to
ten years younger than German-born citizens. Yet, for former Turkish citizens, the difference is fifteen
Andreas M. Wüst: Political Preferences and Voting Behaviour of Naturalized Citizens in Germany
- 4 -
to twenty years. Hardly any naturalized Turkish-born German interviewed in one of the surveys was 65
years of age or above, while well over 15 % of the formerly Romanian citizens fall into that category.
Conversely although not surprisingly, hardly any resettler was born in Germany, but around one third
of the Turkish-born Germans. Noticeable differences have also been measured pertaining to
education, occupation, and religion. While the overall degree of education of naturalized Germans
compared to native-born Germans is not much but significantly higher, there are remarkable
differences between the various sub-groups. Formerly Romanian, Turkish and Polish citizens show a
higher degree of education than the German-born, but the educational degree of former citizens of the
Soviet Union is only equivalent to the average German-born one. These Politbarometer-based
comparisons do especially neglect the fact that most naturalized citizens went to school abroad, and
that they have earned an educational degree in their home country. Therefore, the Heidelberg survey
asked for the years of school attendance and whether the degree has been earned in Germany or
abroad. The question on years of schooling confirms that formerly Romanian citizens spent
significantly more years in school (mean: 11.1) than former citizens of the Soviet Union or one of her
successor states (mean: 9.1). The formerly Turkish citizens rank in-between (mean: 9.9), but they are
the only group whose majority has earned a degree in Germany. In all other groups, around 90 %
went to school in their home country.
The occupational structure is of course strongly influenced by the educational degree. Despite the
above-average educational level measured in the Politbarometer surveys, more naturalized citizens
(33 %) than German-born citizens (24 %) are blue-collar workers, among citizens from the former SU
and her successor states even a majority (54 %). Contrarily, white-collar workers, civil servants, and
self-employed are underrepresented among naturalized citizens. Only ex-Romanians have a white-
collar/civil servant share (51 %) and only former Turks have a self-employed share (8 %) comparable
to German-born citizens (49 % and 9 % respectively). So at least sub-group differences in
occupational status reflect the differences detected in degree of education. Also, the comparatively
high share of self-employed among naturalized citizens from Turkey comes not surprisingly, because
of the known high shares of self-employed Turkish citizens living in Germany.
Religion and religiosity are still of important influence in explaining political preferences based on
social characteristics. While among German-born citizens the non-religious group makes up one
quarter, its share is only 14 % among naturalized citizens. Therefore, the potential influence of religion
on the vote of naturalized citizens is bigger. There are considerably more Catholics among naturalized
citizens (43 %) than among the German-born (34 %), and also more non-Christians (18 % vs. 1 %
respectively), but significantly less Protestants (24 % vs. 40 % respectively). Further, a detailed break-
up of the non-Christian group in the Heidelberg survey shows that approximately two thirds of them
are Muslims, of which 70 % are Sunnites. Being a Muslim is the rule among formerly Turkish citizens,
and almost all formerly Polish citizens are of Catholic faith. An absolute majority of Protestants can be
3 Due to the fact that the socio-demography of naturalized citizens is hardly known, and that socio-demographic characteristics are considered crucial for the analyses of political preferences, the socio-demographic
Andreas M. Wüst: Political Preferences and Voting Behaviour of Naturalized Citizens in Germany
- 5 -
found among naturalized citizens from the former SU, and among the naturalized citizens from
Romania, a relative majority is of Protestant faith as well. The non-religious portion is biggest among
naturalized Turks (19 %), followed by former citizens of the SU and one of her successor states
(11 %) or of Poland (10 %), and with the smallest portion among formerly Romanian citizens (5 %).
Not surprisingly, church attendance is more frequent among naturalized than among German-born
citizens and most frequent among the naturalized citizens who have come from Poland. While the
naturalized citizens of other resettler countries (SU and successor states, Romania) also attend
church more frequently than the German-born citizens, over 50 % of the naturalized formerly Turkish
citizens do neither attend church nor a mosque. One could argue this result cannot be used as a valid
indicator for lower religiosity among ex-Turkish citizens, because the availability of mosques is likely to
be an intervening factor. However, this interpretation is externally validated by results of surveys
among Turkish citizens living in Germany (Diehl/Urbahn 1999: 31 f.) and by another result of the
Heidelberg survey: on an eleven-point religiosity scale, the average for all naturalized citizens was 5.7,
but for naturalized Turks as well as for naturalized Muslims, the result was only 5.4 on average. Thus,
naturalized Germans of formerly Turkish citizenship are less religious than most other sub-groups.
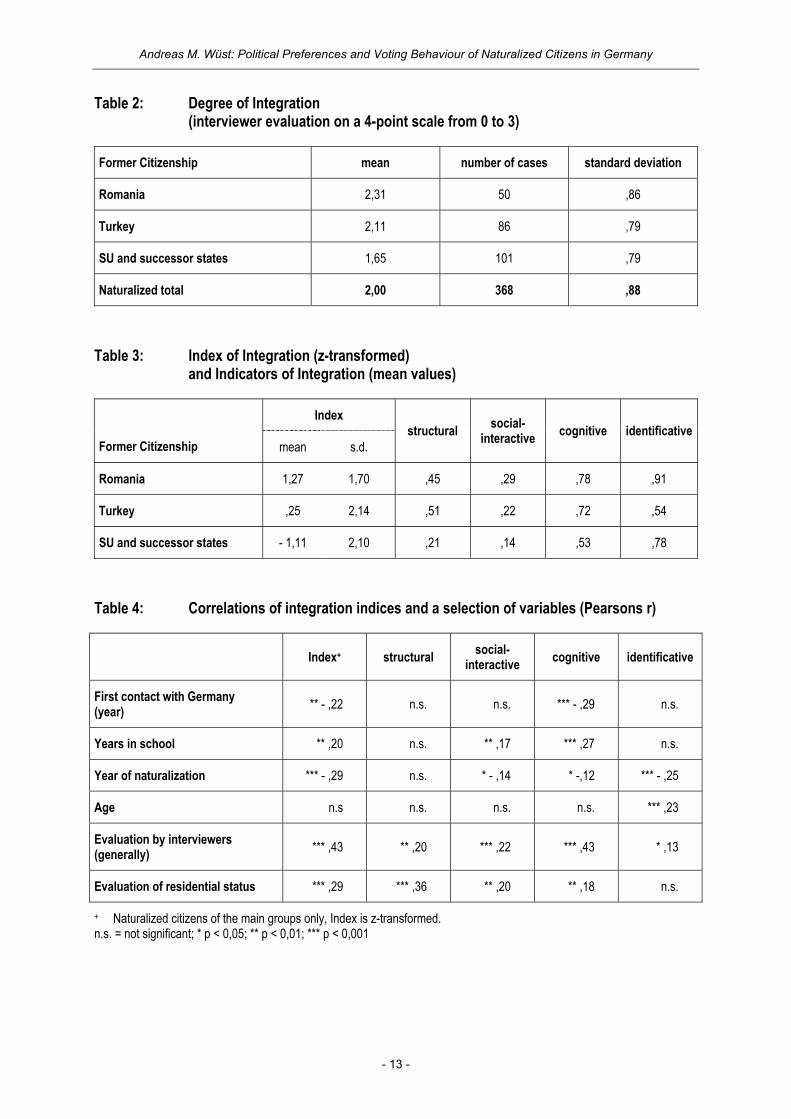
Degrees of Integration Based on the results on the socio-structural composition of naturalized citizens and their main sub-
groups, the various degrees of integration come not as a surprise. A general evaluation by the
interviewers results in best grades for former citizens of Romania, followed by formerly Turkish
citizens, and placing former citizens of the SU or of one of her successor states last (Table 2). This
ranking based on the subjective evaluations by the interviewers is supported by the integration index
constructed additively (Table 3) including the four dimensions named earlier (Page 2). Naturalized ex-
Romanians are by far the best-integrated naturalized citizens, only beaten by the ex-Turks in the
structural dimension. The latter rank second in the social-interactive and the cognitive dimension,
while former citizens of the SU or one of her successor states finish by far last in the already
mentioned three dimensions, and only second in the identificative dimension. This is not too
surprising, because the identification with Germany and the German identity has been an important
precondition for resettlers from Eastern Europe to decide to “return” to Germany and to get access to
the country. On the other hand, naturalized citizens of formerly Turkish citizenship have often
experienced a mood of exclusion, based on the ethnicity-based German self-understanding (Brubaker
1992: 165 ff.; Joppke 1999: 62 ff., Castles/Miller 1998: 43).
Correlations of the integration index and its four dimensions with selected variables which are
suspected to have an influence on the degrees of integration (Table 4) display a higher degree of
integration if the foreigner naturalized earlier. Only in case of the identificative dimension this has to do
characteristics of naturalized citizens both nation-wide and in Heidelberg are documented in this section.
Andreas M. Wüst: Political Preferences and Voting Behaviour of Naturalized Citizens in Germany
- 6 -
with age, and only in case of the cognitive dimension a correlation with the first migration of the
naturalized citizen to Germany can be ascertained. The social-interactive and the cognitive dimension
are very much affected by education, yet the structural dimension (de-segregation) is hardly effected
by any of these selected, long-term indicators. However, if we correlate the structural dimension with
the evaluation of the naturalized citizen’s residential status, the correlation is considerably stronger
than with all other dimensions. Conversely, there are quite some empirical hints to the validity of all
four integration indicators.
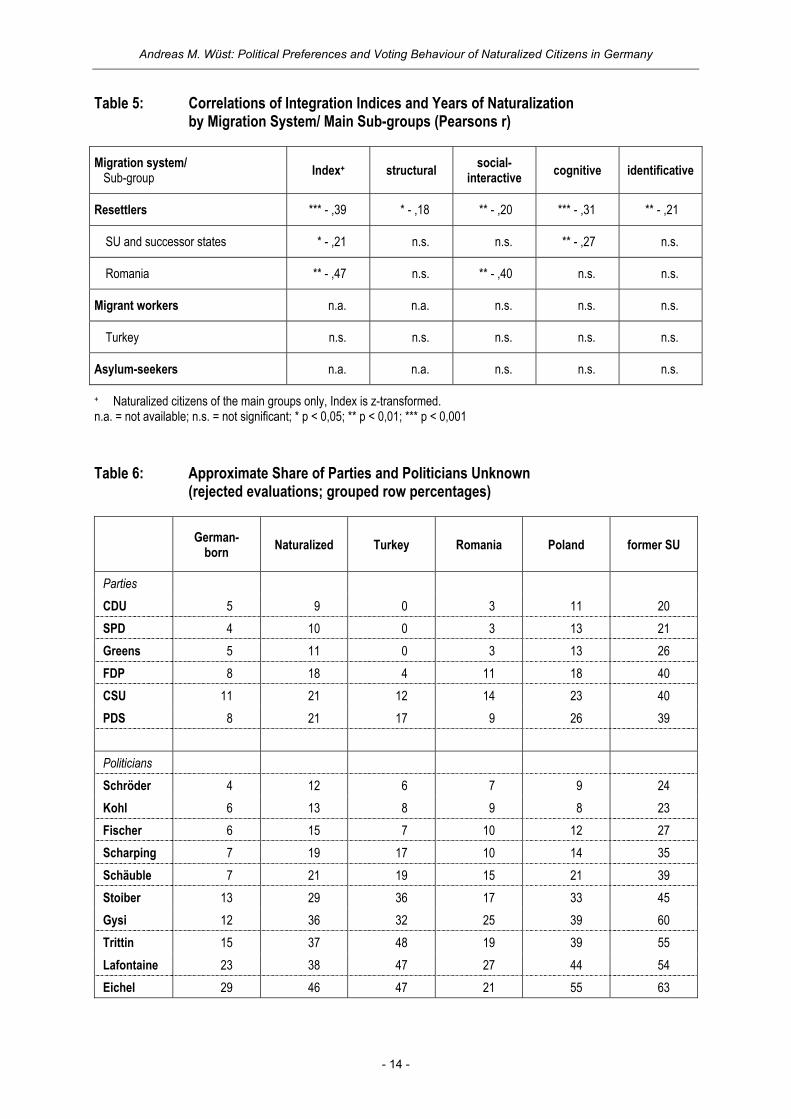
If we take a conclusive look at the integration indicators and the integration index in the migration
groups and the main sub-groups longitudinally (Table 5), we learn that the resettlers’ degrees of
integration have improved significantly over time. Further, especially resettlers from the SU or one of
her successor states have improved cognitively, while resettlers from Romania gained socio-
interactively. Former guestworkers and former citizens of Turkey do not show any significant changes
in degree of integration since naturalization. So these findings demonstrate that the degree of
integration of the various resettlers has even been lower at the time they naturalized then was
measured in the surveys. Also, the non-resettlers who naturalized have already been integrated well
at the time they naturalized – a fact that underlines the existence of very different preconditions for
naturalization depending on the belonging to one or the other migration group: the privileged resettlers
are, despite of improvements, integrated less well into German society than guestworkers and their
descendents who have naturalized.
Naturalized Citizens’ Political Interest and Knowledge of German Parties and Politicians Before entering the voting decision arena to analyse political preferences and the voting behaviour of
naturalized citizens, let us first look at the interest in and the knowledge of German politics, parties,
and politicians. Compared to German-born citizens, naturalized ones are less interested in politics.
42 % of the German-born say they are (very) much interested in politics, and only 13 % say not much
or not at all. The respective shares for naturalized Germans are 31 % and 26 %. While naturalized
citizens of formerly Turkish or Romanian citizenship display a political interest above average, once
again former citizens of the SU or of one of her successor states are much less interested: only 23 %
told the interviewers they are (very) much interested, but 42 % said they are not much or not at all
interested in politics.
The low interest in politics, especially among naturalized citizens of the former SU or of one of her
successor states, is also reflected in the knowledge of German Parties and Politicians (Table 6).4
Naturalized citizens know parties and politicians much less than German-born citizens do. While about
95 % of the German-born citizens know the SPD, CDU, and the Greens, and 90 % know the FDP,
4 For a more sophisticated though descriptive analysis based on Heidelberg data refer to Wüst (2000: 565 ff.).
Andreas M. Wüst: Political Preferences and Voting Behaviour of Naturalized Citizens in Germany
- 7 -
CSU, and PDS, the share is 90 % and 80 % for all naturalized Germans, and approximately 80 % and
60 % for the naturalized citizens from the SU or her successor states respectively. Politicians are, not
unexpectedly, even known to a lower degree. At least 90 % of the German-born citizens, and at least
80 % of all naturalized citizens know Schröder, Kohl, Fischer, and Scharping, but only 65 % of the
resettlers from the former SU and her successor states know them. Once more, naturalized citizens
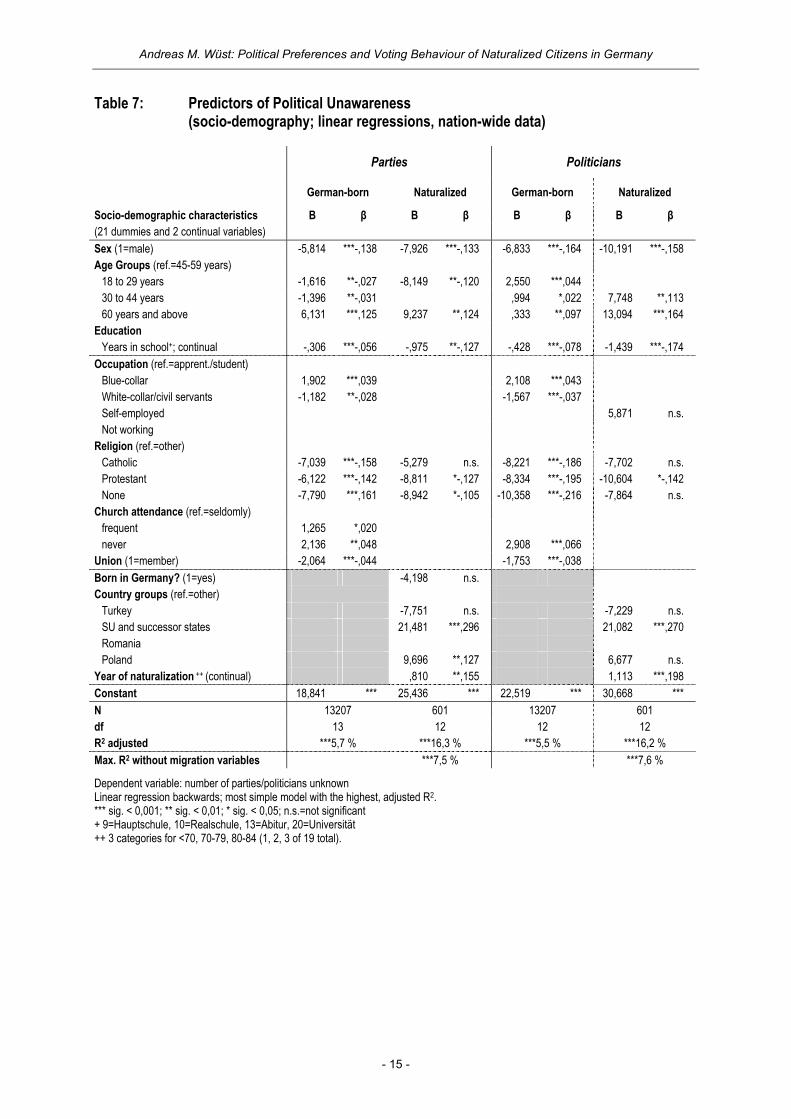
from Romania or Turkey are considerably better informed about German parties and politicians. And
this difference is not only the result of a variation in socio-demography (esp. sex, age, education)
between the sub-groups with birth in Germany being a negligible factor, but as regression analyses
(Table 7) show, to a considerable degree caused by the difference in former citizenship which means
by different migratory backgrounds. Migration variables included, the explained variance is double the
one using socio-demographic variables exclusively.
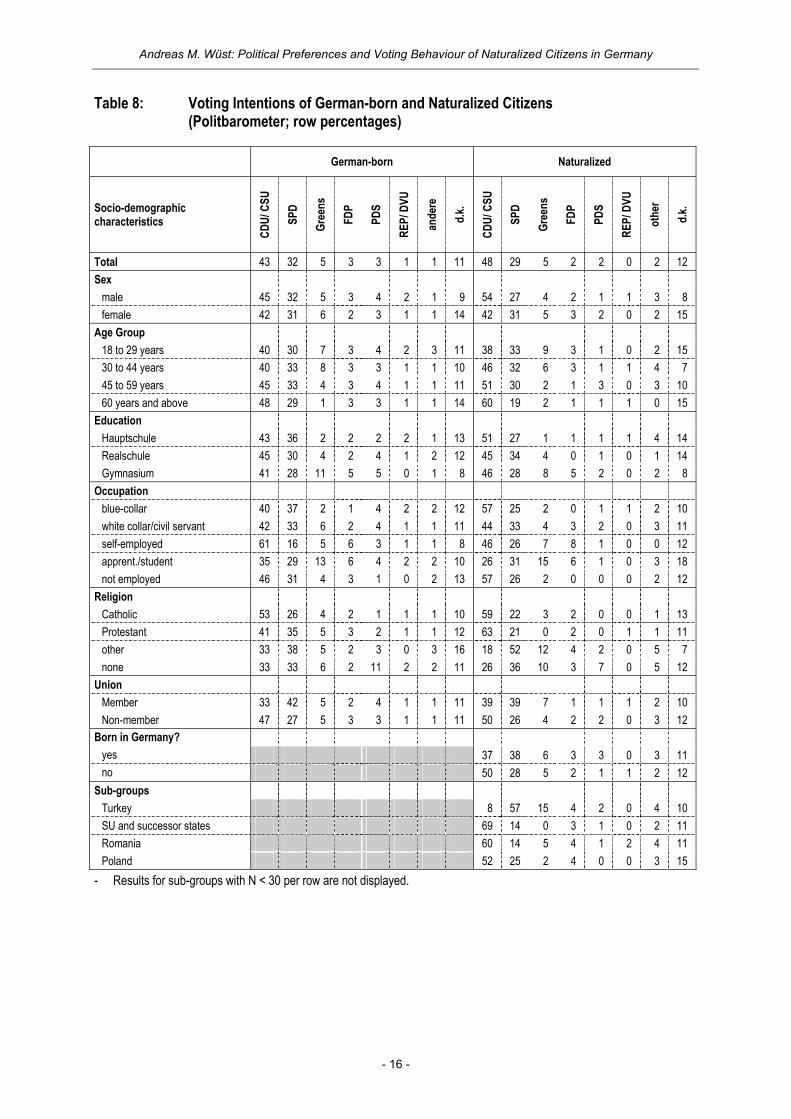
Political Preferences The political preferences of all naturalized citizens aggregated do not differ much from the political
preferences of German-born citizens. Both the question on preferred party and on the voting decision
show slightly more support for the CDU/CSU, and a little less support for SPD, FDP, and PDS among
naturalized citizens compared to the German-born. A detailed look on voting preferences in the
various socio-economic groups (Table 8) suggests a stronger relevance of the socio-structural factors
for the voting patterns of naturalized citizens than of German-born citizens. This holds especially true
for the voting intention by age group and by religious group. While some socio-demographic voting
patterns are well known and just more pronounced, other results diverge from what we know about
socio-demography, cleavages, and voting behaviour. At first sight surprisingly, naturalized citizens
with a low educational degree, blue-collar workers, and Protestants show above-average support for
the CDU/CSU, and below-average support for the SPD, which is preferred by the German-born in the
respective groups. These and a few additional results cannot be easily explained by the Columbia and
cleavage models of voting. At least one additional variable intervenes. To some degree birth in
Germany or abroad might have an intervening effect, but former citizenship is most promising in this
respect. No other social indicator displays such distinctive voting patterns than former citizenship.
57 % of the naturalized Turks say they would vote for the Social Democrats, and only 8 % for the
Christian Democrats. Vice versa, 69 % of former citizens of the SU or of one of her successor states
announce they would vote for the Christian Democrats, and a meagre 14 % prefer the Social
Democrats. Limiting the analysis on citizens that naturalized in the “core period” (1988-97),
preferences become even more distinct.
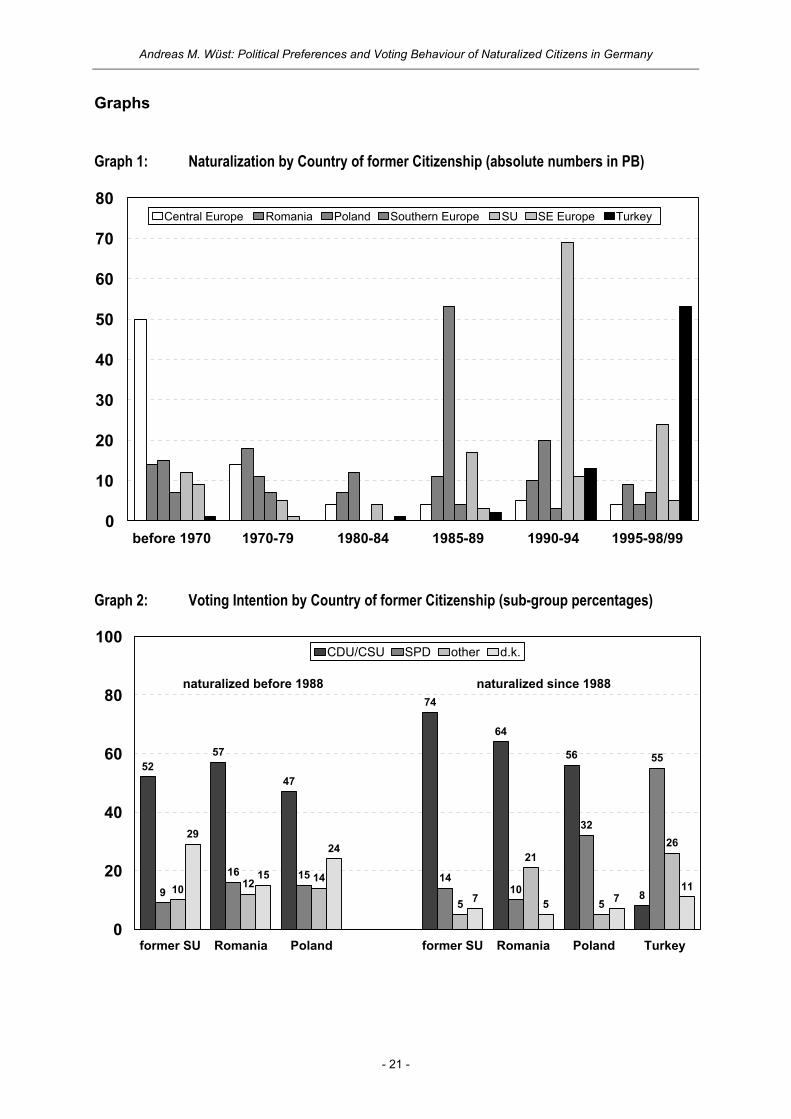
The most interesting questions regarding sub-group voting patterns are whether these are transitory or
not and whether degree of integration matters or not. Even though the data used has some limitations
in regard to answer both questions (panel data would be more valuable), a comparison of sub-group
voting patterns between those naturalized before 1988 and after (Graph 2) shows that the differences
in party preference within two groups decreased, but within one group increased. The most
Andreas M. Wüst: Political Preferences and Voting Behaviour of Naturalized Citizens in Germany
- 8 -
remarkable and common trend is that the “don’t know” share increased substantially (10 % to 20 %),
so that one could conclude that sub-group voting patterns generally prevailed, but weakened. With
respect to the degree of integration, a first descriptive analysis (Table 9) shows that the voters of the
CDU are significantly less well integrated than the voters of the SPD, especially concerning the
cognitive dimension. So a higher degree of integration should be advantageous for the Social
Democrats.
The analysis of party identification (PI) supports this finding. Without documenting or discussing the
regression analyses of PI for each party in detail, former citizenship proves to be a very important
predictor of PI for all parties, but the integration index is only of relevance in the case of PI for the
Social Democrats. Along with all socio-demographic variables in table 8 plus years in school,
frequency of church attendance, and year of naturalization, a multivariate logistic regression terms
degree of integration the single most important predictor for a SPD PI. At least regarding the long run,
degree of integration can be singled out as an intervening factor to voting patterns detected among the
sub-groups of naturalized citizens.
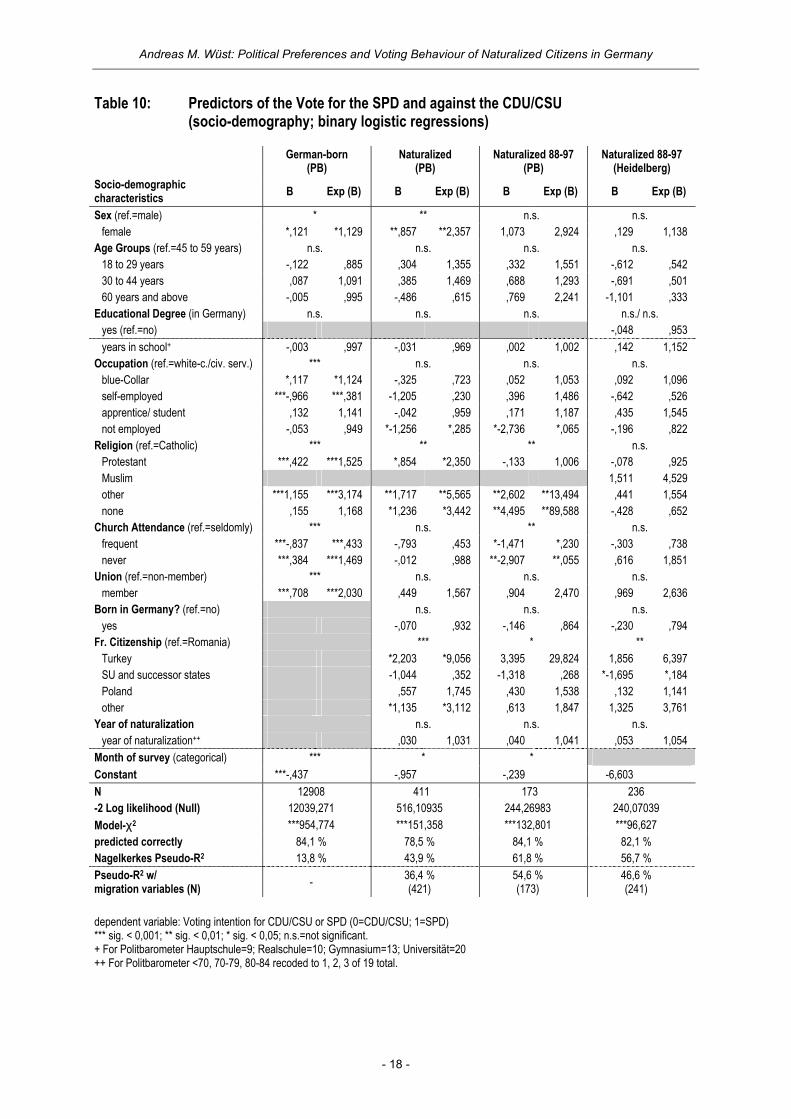
Voting Behaviour Let us finally turn to analyses of naturalized citizens’ voting behaviour based on, first, socio-
demographic variables (Columbia Model) and on, second, variables except socio-structural ones
(especially Michigan Model). Within both analyses which are limited to a CDU/CSU-SPD-dichotomy
for the dependent variable, the relevance of the immigration and naturalization background (former
citizenship, birth in Germany, year of naturalization) are calculated. The socio-demographic analysis
(Table 10) highlights the relevance of socio-demographic factors and the importance of the country
variable (former citizenship) for the explanation of the voting intention. It is striking that the explained
variance of socio-demographic variables for the vote of naturalized citizens is at least double the one
for the vote of the German-born. Further, the set of migration variables is able to increase the
explained variance even more, making the country variable the single most important one in predicting
the naturalized citizens’ vote. The integration index and three out of the four indicators of it (except the
social-interactive one) are additionally able to slightly increase the explained variance, yet itself
remains insignificant (not shown). Of all other variables religion proves to be the most important one in
explaining the naturalized citizens’ vote socio-demographically.
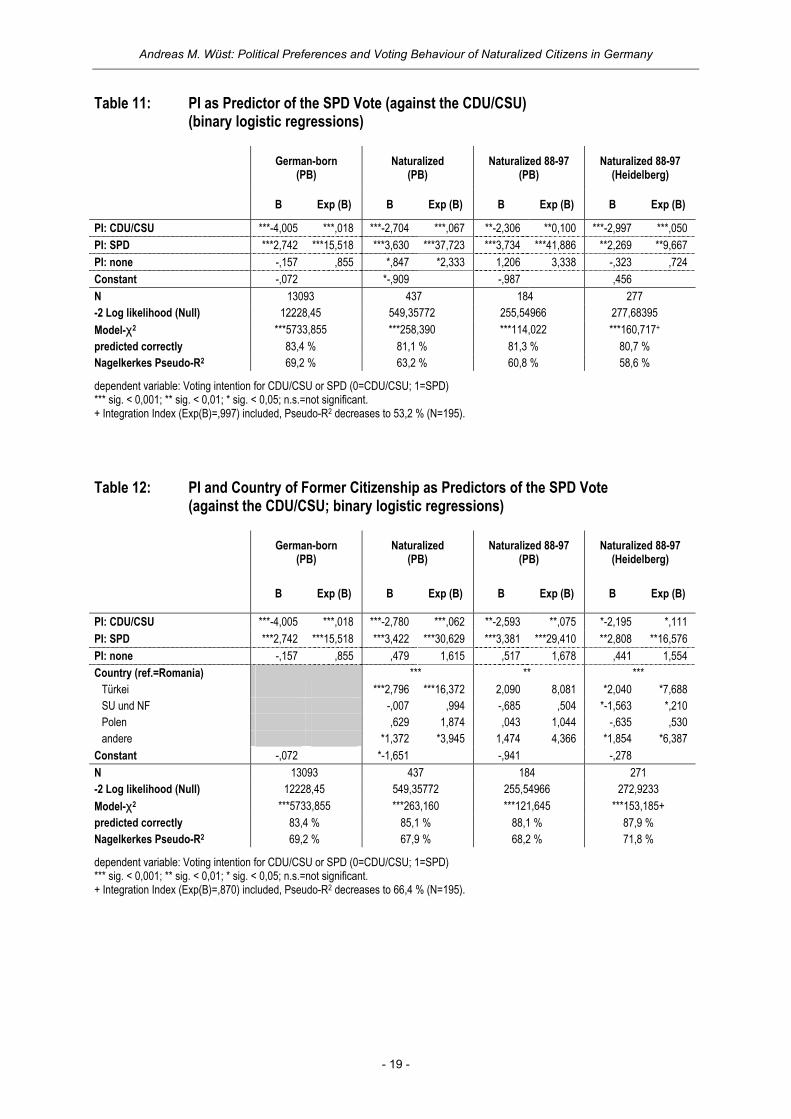
Even though it might be considered daring to include party identification in a voting analysis, the
Michigan Model requires this long-term indicator. PI alone is – not surprisingly – the single most
important variable explaining 69 % (Pseudo-R2) of the variance in voting intention for German-born
citizens, but only 63 % for naturalized citizens, and even a little bit less, if only the core group
naturalized between 1988 and 1997 is analysed (Table 11). This decreasing ability in explaining the
vote of only recently naturalized citizens can interestingly be balanced out by including only PI and
country of former citizenship into the regression analysis (Table 12). The country variable lifts the
Andreas M. Wüst: Political Preferences and Voting Behaviour of Naturalized Citizens in Germany
- 9 -
explained variance for the vote of naturalized citizens on the level of German-born citizens. Even more
interesting is the fact that the inclusion of the integration index into the analysis is not able to explain
the vote better. So up to this point the country of former citizenship variable proved to be
extraordinarily important for the analysis of the voting behaviour of naturalized citizens. While this
could have been expected for the socio-demographically-based analysis from earlier descriptive
findings, it is amazing for the analysis including PI, which is to a high degree identical with the voting
intention.
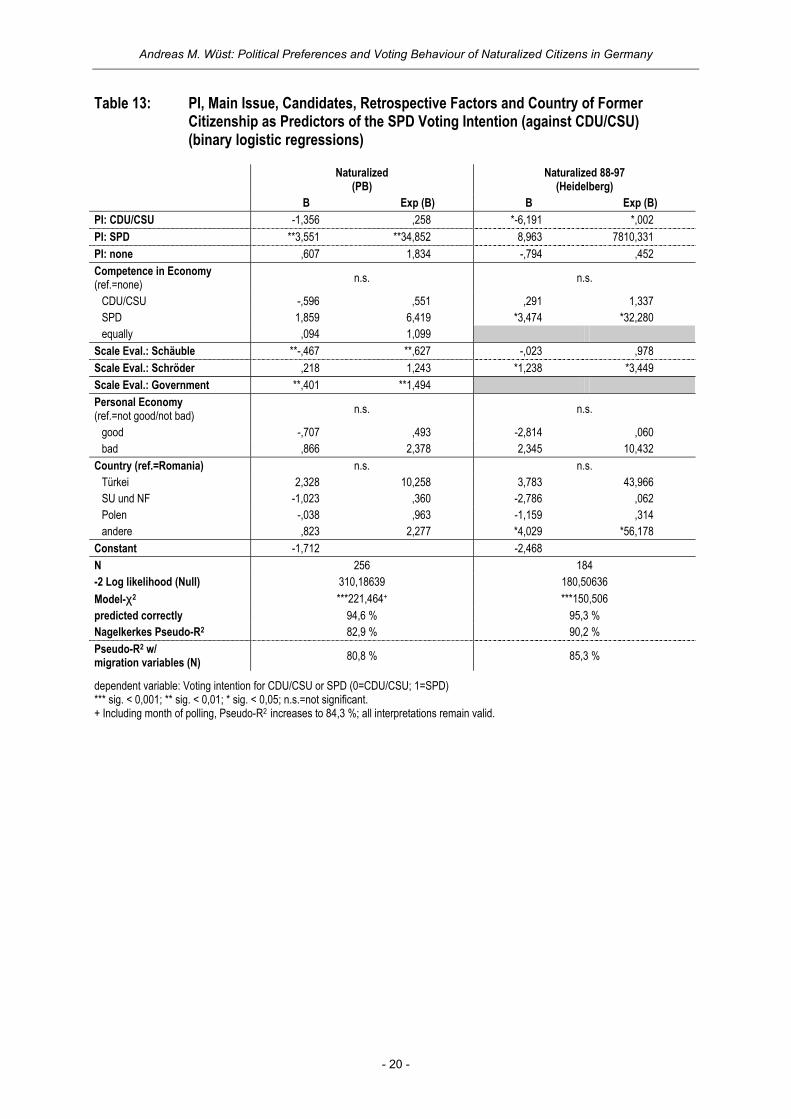
In a final analysis, issue competence, the evaluation of candidates and the government, and the
perception of the personal economic situation, are added to PI and the country variable (Table 13).
These additional variables are all very much linked to the voting intention, and do statistically explain
85 % of the variance in the voting intentions of the German-born with only the perception of the
economy variable being insignificant. Even within this set of variables, the country of former citizenship
variable is able to raise the explained variance by two percentage points nationally and five
percentage points locally. This means that the immigration background and especially the country of
former citizenship has a lasting impact on the voting behaviour of naturalized citizens that might be
transitory in the long run, but not in the foreseeable future.
At the end of the analyses presented here, the question of why we have observed quite stable sub-
group voting patterns among naturalized citizens remains to be answered. Based on the data
available, the following though incomplete answers can be given. First, a rejection of non-bourgeois
parties among resettlers, and especially among resettlers from Romania, can be observed. Consider-
ably more resettlers than German-born do neither list the SPD, the Greens, nor the PDS when asked
for the three most preferred parties. Yet, only in the case of formerly Romanian citizens this rejection
is likely to be a result of a distinct right self-positioning on the left-right scale which itself could not be
ascribed the predictive value as in an analysis among immigrants in the Netherlands (Tillie 1998).
Leaving aside the data, the rejection of leftist parties is likely to be caused by the experiences
resettlers, specifically in Romania, had with socialist political systems. In addition, religiosity and
Christianity seem to be of long-term effect for the preference of the Christian Democrats. In most data
analysis, religion proved to be influential on political preferences, although not a better predictor for the
preferences than former citizenship.
Religion is also likely to be very influential for the rejection of the CDU, and much more the CSU
among formerly Turkish citizens. The main alternative to the Christian parties is the SPD which is
primarily preferred. The self-positioning to the left on the left-right scale may therefore be already a
result, and not a cause of the predominant SPD preference. However, in addition to past experiences
and religion, it seems fair to assume that distinct immigration policies of the parties, especially in the
past, had and still have an effect on party preferences. The CDU/CSU has always been very
supportive of resettlers while the SPD was at least reluctant in support for resettlers; yet, the SPD has
been quite active in promoting guestworker integration since the 1970s while the CDU/CSU promoted
and subsidized their return (cf. Wüst 1995). These experiences have probably linked the resettlers to
Andreas M. Wüst: Political Preferences and Voting Behaviour of Naturalized Citizens in Germany
- 10 -
the Christian Democrats and the guestworkers to the Social Democrats. While there are numerous
hints in the data to support this hypothesis, a clear evidence cannot be presented, not at least
because it would require additional data beyond the scope of this analysis.
Conclusion Immigrants and their descendents are, as Mark J. Miller (1981) posited long ago, “an emerging
political force”. On the one hand, the analyses of data on naturalized citizens in Germany and in the
city of Heidelberg have shown that the voting behaviour of naturalized Germans can well be explained
by the traditional models of voting electoral research offers. On the other hand, the voting behaviour of
naturalized citizens differs from the German-born one, especially socio-demographically. While for
instance German-born blue-collar workers and Protestants support the Social Democrats, naturalized
Germans in the same socio-structural groups prefer the CDU/CSU. These and quite a few more
results are caused by at least one important intervening variable. In the analyses presented here, the
country of former citizenship proved to be a very good supplementary variable for the analysis of
naturalized citizens’ political preferences.
While the importance of the migratory background for the analysis of the naturalized citizens’ voting
behaviour could repeatedly been proven, the answer to the question on the transitional character of
sub-group voting patterns was less clear-cut. There were indeed signs that the detected distinct voting
patterns of naturalized citizens are becoming weaker over time. Yet, this weakening meant not at all
disappearing. Even for those naturalized much earlier the sub-group voting patterns remained clear.
Also, the degree of integration proved to be only in part influential on political preferences. In the two
main models of voting, the socio-demographic and the socio-psychological, degree of integration
played a negligible role. However, the Social Democrats are likely to gain long-term supporters if
naturalized citizens improve pertaining to degree of integration.
Despite empirical evidence for distinct naturalized citizen voting patterns and enough hints for an at
least mid-term prevalence, the question on the relevance of this distinct group on election results in
Germany has not been touched yet. According to the nation-wide screening, 4.5 % of the total voting
population in Germany is not German by birth but through naturalization. The composition of this very
heterogeneous group is currently changing: the non-resettlers, and within this group the share of
formerly Turkish citizens is gaining importance. In the years to come and in light of the empirical
findings presented here, the voting intention of the whole group of naturalized citizens is likely to shift
from the Christian Democrats to the Social Democrats. This means that the impact naturalized citizens
will have on election results in Germany is likely to change, and, considering the socio-demographic
structure of the German-born, is likely to increase.
To highlight the relevance naturalized citizens had on election results in the past, the following
example tries to quantify the minimum impact naturalized citizens had on the outcome of the 1994
Bundestag election that the Kohl coalition government won with a meagre 0.3 % surplus:
Andreas M. Wüst: Political Preferences and Voting Behaviour of Naturalized Citizens in Germany
- 11 -
Effect (CDU/CSU/FDP; 1994) = surplus in preference * share of naturalized citizens * participation adjustment
= 15 percentage points * 0,03 * 1,08
= .49 percentage points
Based on half the CDU/CSU and FDP surplus measured in the 1999 Politbarometer survey among
citizens that naturalized before 1995 (30 percentage points), the impact would still have been sufficient
to secure the re-election of the Kohl government. Maybe already in the 2002 Bundestag election, but
at least compared to former elections and by 2006 the latest, the Social Democrats will profit from the
changing group of naturalized citizens. Probably, naturalized citizens have contributed significantly to
election outcomes in the past, and probably they will do so in the future as well.
References BRUBAKER, [WILLIAM] ROGERS (1992): Nationhood and Citizenship in France and Germany,
Cambridge: Harvard UP.
CASTLES, STEPHEN/ MARK J. MILLER (1993, 21998): The Age of Migration, New York/ London: Guilford.
DAHL, ROBERT A. (1961): Who Governs? Democracy and Power in an American City, New Haven/ London: Yale UP.
DIEHL, CLAUDIA/ JULIA URBAHN (21999): Die soziale und politische Partizipation von Zuwanderern in der Bundesrepublik Deutschland, Bonn: FES.
ESSER, HARTMUT (1980): Aspekte der Wanderungssoziologie. Assimilation und Integration von Wanderern, ethnischen Gruppen und Minderheiten. Eine handlungstheoretische Analyse, Darmstadt/ Neuwied: Luchterhand.
JOPPKE, CHRISTIAN (1999): Immigration and the Nation-State, New York: Oxford UP.
MILLER, MARK J. (1981): Foreign Workers in Western Europe, New York: Praeger.
PAPPI, FRANZ U. (2002): Die politisierte Sozialstruktur heute: Historische Reminiszenz oder aktuelles Erklärungspotential?, in: BRETTSCHNEIDER, FRANK et al., ed.: Das Ende der politisierten Sozialstruktur?, Opladen: Leske + Budrich, pp. 26-46.
SCHMITT, HERMANN (2001): Politische Repräsentation in Europa, Frankfurt: Campus.
TILLIE, JEAN (1998): Explaining Migrant Voting Behaviour in the Netherlands. Combining the Electoral Research and Ethnic Studies Perspective, in: REMI 14 (2), pp. 71-95.
WOLFINGER, RAYMOND E. (1965): The Development and Persistence of Ethnic Voting, APSR 59, pp. 896-908.
WEßELS, BERNHARD (2000): Gruppenbindung und Wahlverhalten, in: KLEIN, MARKUS et al., ed.: 50 Jahre Empirische Wahlforschung in der Bundesrepublik Deutschland, Wiesbaden: WDV, pp. 129-155.
WÜST, ANDREAS M. (2001): Wie wählen Neubürger? Politische Einstellungen und Wahlverhalten eingebürgerter Personen in Deutschland, Heidelberg: Institut für Politische Wissenschaft (Ph. D. thesis).
— (2000): Research Report: New Citizens – New Voters? Political Preferences and Voting Intentions of Naturalized Germans, IMR 34 (2), pp. 560-567.
— (1995): Vorbild USA? Deutsche Einwanderungspolitik auf dem Prüfstand, Heidelberg: Institut für Politische Wissenschaft (M.A. thesis).
Andreas M. Wüst: Political Preferences and Voting Behaviour of Naturalized Citizens in Germany
- 12 -
Appendix: Tables and Graphs
Tables
Table 1: Former Citizenship of Naturalized Citizens in Heidelberg and in Germany (absolute number of cases, in percent)
Heidelberg Survey 1999 Politbarometer 1999 Former Citizenship Sample A+B 1988-97 naturalized total Former SU and Successor States (103) 102 37,3 98 33,1 136 21,9 Poland (25) 25 9,0 66 22,9 114 18,5 Romania (50) 50 18,1 24 8,1 53 8,6 Turkey (86) 42 15,2 45 15,0 72 11,7 Southern Europe (6) 3 1,1 10 3,3 28 4,5 Central Europe (except Poland) (13) 6 2,2 10 3,4 84 13,6 South-Eastern Europe (except Turkey) (12) 6 2,1 15 5,1 31 5,0 Northern and Western Europe and North America (8) 4 1,4 2 0,7 26 4,2
Latin America (7) 4 1,2 0 0,1 5 0,8 Africa (16) 8 3,0 4 1,3 11 1,8 Middle East (16) 8 2,9 4 1,5 9 1,4 Asia (28) 14 5,0 10 3,2 20 3,2 no answer (8) 4 1,6 9 3,1 29 4,7 Number of Cases (not weighted) (378) 274 100,0 298 100,0 618 100,0
Andreas M. Wüst: Political Preferences and Voting Behaviour of Naturalized Citizens in Germany
- 13 -
Table 2: Degree of Integration (interviewer evaluation on a 4-point scale from 0 to 3)
Former Citizenship mean number of cases standard deviation
Romania 2,31 50 ,86
Turkey 2,11 86 ,79
SU and successor states 1,65 101 ,79
Naturalized total 2,00 368 ,88
Table 3: Index of Integration (z-transformed) and Indicators of Integration (mean values)
Index
Former Citizenship mean s.d. structural social-
interactive cognitive identificative
Romania 1,27 1,70 ,45 ,29 ,78 ,91
Turkey ,25 2,14 ,51 ,22 ,72 ,54
SU and successor states - 1,11 2,10 ,21 ,14 ,53 ,78
Table 4: Correlations of integration indices and a selection of variables (Pearsons r)
Index+ structural social-interactive cognitive identificative
First contact with Germany (year) ** - ,22 n.s. n.s. *** - ,29 n.s.
Years in school ** ,20 n.s. ** ,17 *** ,27 n.s.
Year of naturalization *** - ,29 n.s. * - ,14 * -,12 *** - ,25
Age n.s n.s. n.s. n.s. *** ,23
Evaluation by interviewers (generally) *** ,43 ** ,20 *** ,22 *** ,43 * ,13
Evaluation of residential status *** ,29 *** ,36 ** ,20 ** ,18 n.s.
+ Naturalized citizens of the main groups only, Index is z-transformed. n.s. = not significant; * p < 0,05; ** p < 0,01; *** p < 0,001
Andreas M. Wüst: Political Preferences and Voting Behaviour of Naturalized Citizens in Germany
- 14 -
Table 5: Correlations of Integration Indices and Years of Naturalization by Migration System/ Main Sub-groups (Pearsons r)
Migration system/ Sub-group Index+ structural social-
interactive cognitive identificative
Resettlers *** - ,39 * - ,18 ** - ,20 *** - ,31 ** - ,21
SU and successor states * - ,21 n.s. n.s. ** - ,27 n.s.
Romania ** - ,47 n.s. ** - ,40 n.s. n.s.
Migrant workers n.a. n.a. n.s. n.s. n.s.
Turkey n.s. n.s. n.s. n.s. n.s.
Asylum-seekers n.a. n.a. n.s. n.s. n.s.
+ Naturalized citizens of the main groups only, Index is z-transformed. n.a. = not available; n.s. = not significant; * p < 0,05; ** p < 0,01; *** p < 0,001
Table 6: Approximate Share of Parties and Politicians Unknown (rejected evaluations; grouped row percentages)
German- born Naturalized Turkey Romania Poland former SU
Parties CDU 5 9 0 3 11 20 SPD 4 10 0 3 13 21 Greens 5 11 0 3 13 26 FDP 8 18 4 11 18 40 CSU 11 21 12 14 23 40 PDS 8 21 17 9 26 39 Politicians Schröder 4 12 6 7 9 24 Kohl 6 13 8 9 8 23 Fischer 6 15 7 10 12 27 Scharping 7 19 17 10 14 35 Schäuble 7 21 19 15 21 39 Stoiber 13 29 36 17 33 45 Gysi 12 36 32 25 39 60 Trittin 15 37 48 19 39 55 Lafontaine 23 38 47 27 44 54 Eichel 29 46 47 21 55 63
Andreas M. Wüst: Political Preferences and Voting Behaviour of Naturalized Citizens in Germany
- 15 -
Table 7: Predictors of Political Unawareness (socio-demography; linear regressions, nation-wide data)
Parties Politicians
German-born Naturalized German-born Naturalized
Socio-demographic characteristics B β B β B β B β (21 dummies and 2 continual variables) Sex (1=male) -5,814 ***-,138 -7,926 ***-,133 -6,833 ***-,164 -10,191 ***-,158 Age Groups (ref.=45-59 years)
18 to 29 years -1,616 **-,027 -8,149 **-,120 2,550 ***,044 30 to 44 years -1,396 **-,031 ,994 *,022 7,748 **,113 60 years and above 6,131 ***,125 9,237 **,124 ,333 **,097 13,094 ***,164
Education Years in school+; continual -,306 ***-,056 -,975 **-,127 -,428 ***-,078 -1,439 ***-,174
Occupation (ref.=apprent./student) Blue-collar 1,902 ***,039 2,108 ***,043 White-collar/civil servants -1,182 **-,028 -1,567 ***-,037 Self-employed 5,871 n.s. Not working
Religion (ref.=other) Catholic -7,039 ***-,158 -5,279 n.s. -8,221 ***-,186 -7,702 n.s. Protestant -6,122 ***-,142 -8,811 *-,127 -8,334 ***-,195 -10,604 *-,142 None -7,790 ***,161 -8,942 *-,105 -10,358 ***-,216 -7,864 n.s.
Church attendance (ref.=seldomly) frequent 1,265 *,020 never 2,136 **,048 2,908 ***,066
Union (1=member) -2,064 ***-,044 -1,753 ***-,038 Born in Germany? (1=yes) -4,198 n.s. Country groups (ref.=other)
Turkey -7,751 n.s. -7,229 n.s. SU and successor states 21,481 ***,296 21,082 ***,270 Romania Poland 9,696 **,127 6,677 n.s.
Year of naturalization ++ (continual) ,810 **,155 1,113 ***,198 Constant 18,841 *** 25,436 *** 22,519 *** 30,668 *** N 13207 601 13207 601 df 13 12 12 12 R2 adjusted ***5,7 % ***16,3 % ***5,5 % ***16,2 % Max. R2 without migration variables ***7,5 % ***7,6 %
Dependent variable: number of parties/politicians unknown Linear regression backwards; most simple model with the highest, adjusted R2. *** sig. < 0,001; ** sig. < 0,01; * sig. < 0,05; n.s.=not significant + 9=Hauptschule, 10=Realschule, 13=Abitur, 20=Universität ++ 3 categories for <70, 70-79, 80-84 (1, 2, 3 of 19 total).
Andreas M. Wüst: Political Preferences and Voting Behaviour of Naturalized Citizens in Germany
- 16 -
Table 8: Voting Intentions of German-born and Naturalized Citizens (Politbarometer; row percentages)
German-born Naturalized
Socio-demographic characteristics
CDU/
CSU
SPD
Gree
ns
FDP
PDS
REP/
DVU
ande
re
d.k.
CDU/
CSU
SPD
Gree
ns
FDP
PDS
REP/
DVU
othe
r
d.k.
Total 43 32 5 3 3 1 1 11 48 29 5 2 2 0 2 12 Sex
male 45 32 5 3 4 2 1 9 54 27 4 2 1 1 3 8 female 42 31 6 2 3 1 1 14 42 31 5 3 2 0 2 15
Age Group 18 to 29 years 40 30 7 3 4 2 3 11 38 33 9 3 1 0 2 15 30 to 44 years 40 33 8 3 3 1 1 10 46 32 6 3 1 1 4 7 45 to 59 years 45 33 4 3 4 1 1 11 51 30 2 1 3 0 3 10 60 years and above 48 29 1 3 3 1 1 14 60 19 2 1 1 1 0 15
Education Hauptschule 43 36 2 2 2 2 1 13 51 27 1 1 1 1 4 14 Realschule 45 30 4 2 4 1 2 12 45 34 4 0 1 0 1 14 Gymnasium 41 28 11 5 5 0 1 8 46 28 8 5 2 0 2 8
Occupation blue-collar 40 37 2 1 4 2 2 12 57 25 2 0 1 1 2 10 white collar/civil servant 42 33 6 2 4 1 1 11 44 33 4 3 2 0 3 11 self-employed 61 16 5 6 3 1 1 8 46 26 7 8 1 0 0 12 apprent./student 35 29 13 6 4 2 2 10 26 31 15 6 1 0 3 18 not employed 46 31 4 3 1 0 2 13 57 26 2 0 0 0 2 12
Religion Catholic 53 26 4 2 1 1 1 10 59 22 3 2 0 0 1 13 Protestant 41 35 5 3 2 1 1 12 63 21 0 2 0 1 1 11 other 33 38 5 2 3 0 3 16 18 52 12 4 2 0 5 7 none 33 33 6 2 11 2 2 11 26 36 10 3 7 0 5 12
Union Member 33 42 5 2 4 1 1 11 39 39 7 1 1 1 2 10 Non-member 47 27 5 3 3 1 1 11 50 26 4 2 2 0 3 12
Born in Germany? yes 37 38 6 3 3 0 3 11 no 50 28 5 2 1 1 2 12
Sub-groups Turkey 8 57 15 4 2 0 4 10 SU and successor states 69 14 0 3 1 0 2 11 Romania 60 14 5 4 1 2 4 11 Poland 52 25 2 4 0 0 3 15
- Results for sub-groups with N < 30 per row are not displayed.

Andreas M. Wüst: Political Preferences and Voting Behaviour of Naturalized Citizens in Germany
- 17 -
Table 9: Degree of Integration By Voting Intention: Integration Index (z-transformed) and Integration Indices (mean values; Heidelberg survey)
Index
Voting Intention mean value s.d.
structural social-interactive cognitive identificative
CDU - ,29 2,18 ,32 ,18 ,61 ,83
SPD ,23 2,18 ,41 ,21 ,72 ,62
Greens -* -* -* ,43 ,82 ,56
* N < 10.
Andreas M. Wüst: Political Preferences and Voting Behaviour of Naturalized Citizens in Germany
- 18 -
Table 10: Predictors of the Vote for the SPD and against the CDU/CSU (socio-demography; binary logistic regressions)
German-born (PB)
Naturalized (PB)
Naturalized 88-97 (PB)
Naturalized 88-97 (Heidelberg)
Socio-demographic characteristics B Exp (B) B Exp (B) B Exp (B) B Exp (B)
Sex (ref.=male) * ** n.s. n.s. female *,121 *1,129 **,857 **2,357 1,073 2,924 ,129 1,138
Age Groups (ref.=45 to 59 years) n.s. n.s. n.s. n.s. 18 to 29 years -,122 ,885 ,304 1,355 ,332 1,551 -,612 ,542 30 to 44 years ,087 1,091 ,385 1,469 ,688 1,293 -,691 ,501 60 years and above -,005 ,995 -,486 ,615 ,769 2,241 -1,101 ,333
Educational Degree (in Germany) n.s. n.s. n.s. n.s./ n.s. yes (ref.=no) -,048 ,953 years in school+ -,003 ,997 -,031 ,969 ,002 1,002 ,142 1,152
Occupation (ref.=white-c./civ. serv.) *** n.s. n.s. n.s. blue-Collar *,117 *1,124 -,325 ,723 ,052 1,053 ,092 1,096 self-employed ***-,966 ***,381 -1,205 ,230 ,396 1,486 -,642 ,526 apprentice/ student ,132 1,141 -,042 ,959 ,171 1,187 ,435 1,545 not employed -,053 ,949 *-1,256 *,285 *-2,736 *,065 -,196 ,822
Religion (ref.=Catholic) *** ** ** n.s. Protestant ***,422 ***1,525 *,854 *2,350 -,133 1,006 -,078 ,925 Muslim 1,511 4,529 other ***1,155 ***3,174 **1,717 **5,565 **2,602 **13,494 ,441 1,554 none ,155 1,168 *1,236 *3,442 **4,495 **89,588 -,428 ,652
Church Attendance (ref.=seldomly) *** n.s. ** n.s. frequent ***-,837 ***,433 -,793 ,453 *-1,471 *,230 -,303 ,738 never ***,384 ***1,469 -,012 ,988 **-2,907 **,055 ,616 1,851
Union (ref.=non-member) *** n.s. n.s. n.s. member ***,708 ***2,030 ,449 1,567 ,904 2,470 ,969 2,636
Born in Germany? (ref.=no) n.s. n.s. n.s. yes -,070 ,932 -,146 ,864 -,230 ,794
Fr. Citizenship (ref.=Romania) *** * ** Turkey *2,203 *9,056 3,395 29,824 1,856 6,397 SU and successor states -1,044 ,352 -1,318 ,268 *-1,695 *,184 Poland ,557 1,745 ,430 1,538 ,132 1,141 other *1,135 *3,112 ,613 1,847 1,325 3,761
Year of naturalization n.s. n.s. n.s. year of naturalization++ ,030 1,031 ,040 1,041 ,053 1,054
Month of survey (categorical) *** * * Constant ***-,437 -,957 -,239 -6,603 N 12908 411 173 236 -2 Log likelihood (Null) 12039,271 516,10935 244,26983 240,07039 Model-χ2 ***954,774 ***151,358 ***132,801 ***96,627 predicted correctly 84,1 % 78,5 % 84,1 % 82,1 % Nagelkerkes Pseudo-R2 13,8 % 43,9 % 61,8 % 56,7 % Pseudo-R2 w/ migration variables (N) - 36,4 %
(421) 54,6 % (173)
46,6 % (241)
dependent variable: Voting intention for CDU/CSU or SPD (0=CDU/CSU; 1=SPD) *** sig. < 0,001; ** sig. < 0,01; * sig. < 0,05; n.s.=not significant. + For Politbarometer Hauptschule=9; Realschule=10; Gymnasium=13; Universität=20 ++ For Politbarometer <70, 70-79, 80-84 recoded to 1, 2, 3 of 19 total.
Andreas M. Wüst: Political Preferences and Voting Behaviour of Naturalized Citizens in Germany
- 19 -
Table 11: PI as Predictor of the SPD Vote (against the CDU/CSU) (binary logistic regressions)
German-born (PB)
Naturalized (PB)
Naturalized 88-97 (PB)
Naturalized 88-97 (Heidelberg)
B Exp (B) B Exp (B) B Exp (B) B Exp (B)
PI: CDU/CSU ***-4,005 ***,018 ***-2,704 ***,067 **-2,306 **0,100 ***-2,997 ***,050 PI: SPD ***2,742 ***15,518 ***3,630 ***37,723 ***3,734 ***41,886 **2,269 **9,667 PI: none -,157 ,855 *,847 *2,333 1,206 3,338 -,323 ,724 Constant -,072 *-,909 -,987 ,456 N 13093 437 184 277 -2 Log likelihood (Null) 12228,45 549,35772 255,54966 277,68395 Model-χ2 ***5733,855 ***258,390 ***114,022 ***160,717+
predicted correctly 83,4 % 81,1 % 81,3 % 80,7 % Nagelkerkes Pseudo-R2 69,2 % 63,2 % 60,8 % 58,6 %
dependent variable: Voting intention for CDU/CSU or SPD (0=CDU/CSU; 1=SPD) *** sig. < 0,001; ** sig. < 0,01; * sig. < 0,05; n.s.=not significant. + Integration Index (Exp(B)=,997) included, Pseudo-R2 decreases to 53,2 % (N=195).
Table 12: PI and Country of Former Citizenship as Predictors of the SPD Vote (against the CDU/CSU; binary logistic regressions)
German-born (PB)
Naturalized (PB)
Naturalized 88-97 (PB)
Naturalized 88-97 (Heidelberg)
B Exp (B) B Exp (B) B Exp (B) B Exp (B)
PI: CDU/CSU ***-4,005 ***,018 ***-2,780 ***,062 **-2,593 **,075 *-2,195 *,111 PI: SPD ***2,742 ***15,518 ***3,422 ***30,629 ***3,381 ***29,410 **2,808 **16,576 PI: none -,157 ,855 ,479 1,615 ,517 1,678 ,441 1,554 Country (ref.=Romania) *** ** ***
Türkei ***2,796 ***16,372 2,090 8,081 *2,040 *7,688 SU und NF -,007 ,994 -,685 ,504 *-1,563 *,210 Polen ,629 1,874 ,043 1,044 -,635 ,530 andere *1,372 *3,945 1,474 4,366 *1,854 *6,387
Constant -,072 *-1,651 -,941 -,278 N 13093 437 184 271 -2 Log likelihood (Null) 12228,45 549,35772 255,54966 272,9233 Model-χ2 ***5733,855 ***263,160 ***121,645 ***153,185+ predicted correctly 83,4 % 85,1 % 88,1 % 87,9 % Nagelkerkes Pseudo-R2 69,2 % 67,9 % 68,2 % 71,8 %
dependent variable: Voting intention for CDU/CSU or SPD (0=CDU/CSU; 1=SPD) *** sig. < 0,001; ** sig. < 0,01; * sig. < 0,05; n.s.=not significant. + Integration Index (Exp(B)=,870) included, Pseudo-R2 decreases to 66,4 % (N=195).
Andreas M. Wüst: Political Preferences and Voting Behaviour of Naturalized Citizens in Germany
- 20 -
Table 13: PI, Main Issue, Candidates, Retrospective Factors and Country of Former Citizenship as Predictors of the SPD Voting Intention (against CDU/CSU) (binary logistic regressions)
Naturalized (PB)
Naturalized 88-97 (Heidelberg)
B Exp (B) B Exp (B) PI: CDU/CSU -1,356 ,258 *-6,191 *,002 PI: SPD **3,551 **34,852 8,963 7810,331 PI: none ,607 1,834 -,794 ,452 Competence in Economy (ref.=none) n.s. n.s.
CDU/CSU -,596 ,551 ,291 1,337 SPD 1,859 6,419 *3,474 *32,280 equally ,094 1,099
Scale Eval.: Schäuble **-,467 **,627 -,023 ,978 Scale Eval.: Schröder ,218 1,243 *1,238 *3,449 Scale Eval.: Government **,401 **1,494 Personal Economy (ref.=not good/not bad) n.s. n.s.
good -,707 ,493 -2,814 ,060 bad ,866 2,378 2,345 10,432
Country (ref.=Romania) n.s. n.s. Türkei 2,328 10,258 3,783 43,966 SU und NF -1,023 ,360 -2,786 ,062 Polen -,038 ,963 -1,159 ,314 andere ,823 2,277 *4,029 *56,178
Constant -1,712 -2,468 N 256 184 -2 Log likelihood (Null) 310,18639 180,50636 Model-χ2 ***221,464+ ***150,506 predicted correctly 94,6 % 95,3 % Nagelkerkes Pseudo-R2 82,9 % 90,2 % Pseudo-R2 w/ migration variables (N) 80,8 % 85,3 %
dependent variable: Voting intention for CDU/CSU or SPD (0=CDU/CSU; 1=SPD) *** sig. < 0,001; ** sig. < 0,01; * sig. < 0,05; n.s.=not significant. + Including month of polling, Pseudo-R2 increases to 84,3 %; all interpretations remain valid.
Andreas M. Wüst: Political Preferences and Voting Behaviour of Naturalized Citizens in Germany
- 21 -
Graphs
Graph 1: Naturalization by Country of former Citizenship (absolute numbers in PB)
before 1970 1970-79 1980-84 1985-89 1990-94 1995-98/990
10
20
30
40
50
60
70
80Central Europe Romania Poland Southern Europe SU SE Europe Turkey
Graph 2: Voting Intention by Country of former Citizenship (sub-group percentages)
5257
47
74
64
56
89
16 15 1410
32
55
10 12 14
5
21
5
2629
15
24
7 5 711
former SU Romania Poland former SU Romania Poland Turkey0
20
40
60
80
100CDU/CSU SPD other d.k.
naturalized before 1988 naturalized since 1988