Political Leadership in Afghanistan - RAND Corporation
942
Dissertation Political Leadership in Afghanistan Identifying and Assessing Determining Factors Ahmad Idrees Rahmani This document was submitted as a dissertation in January 2016 in partial fulfillment of the requirements of the doctoral degree in public policy analysis at the Pardee RAND Graduate School. The faculty committee that supervised and approved the dissertation consisted of Terrence Kelly (Chair), Gery Ryan, and Thomas Szayna. PARDEE RAND GRADUATE SCHOOL
-
Upload
khangminh22 -
Category
Documents
-
view
3 -
download
0
Transcript of Political Leadership in Afghanistan - RAND Corporation

Dissertation
Political Leadership in AfghanistanIdentifying and Assessing Determining Factors
Ahmad Idrees Rahmani
This document was submitted as a dissertation in January 2016 in partial fulfillment of the requirements of the doctoral degree in public policy analysis at the Pardee RAND Graduate School. The faculty committee that supervised and approved the dissertation consisted of Terrence Kelly (Chair), Gery Ryan, and Thomas Szayna.
PARDEE RAND GRADUATE SCHOOL

For more information on this publication, visit http://www.rand.org/pubs/rgs_dissertations/RGSD371.html
Perhaps no question is as central to political discourse as that of political leadership. For if there is an “irreducible fact” of politics, it is that in many political society some shall be the rulers and some the ruled (Dahl and Neubauer, 1968).
Published by the RAND Corporation, Santa Monica, Calif.
© Copyright 2016 RAND Corporation
R® is a registered trademark
Limited Print and Electronic Distribution Rights
This document and trademark(s) contained herein are protected by law. This representation of RAND intellectual property is provided for noncommercial use only. Unauthorized posting of this publication online is prohibited. Permission is given to duplicate this document for personal use only, as long as it is unaltered and complete. Permission is required from RAND to reproduce, or reuse in another form, any of its research documents for commercial use. For information on reprint and linking permissions, please visit www.rand.org/pubs/permissions.html.
The RAND Corporation is a research organization that develops solutions to public policy challenges to help make communities throughout the world safer and more secure, healthier and more prosperous. RAND is nonprofit, nonpartisan, and committed to the public interest.
RAND’s publications do not necessarily reflect the opinions of its research clients and sponsors.
Support RAND Make a tax-deductible charitable contribution at
www.rand.org/giving/contribute
www.rand.org

3
PREFACE
This dissertation is written in partial fulfillment of requirements for the degree of Doctor of
Philosophy in Policy Research and Analysis by Pardee RAND Graduate School. The committee
that approved this dissertation on December 14th 2015 consisted of Terrence Kelly (Chairman),
Gery Ryan, Thomas Szayna, and Francis Fukuyama (external advisor).
The study is designed to explore the socio-cultural norms, expectations, and values of the
Afghan people for good political leadership, and assess variations across different ethnic groups.
The effort aims to examine if the socio-cultural norms and values of the Afghan society are to be
credited or blamed for the patterns of political leadership that have emerged in the past five
decades.
The analysis and policy recommendation provided in this document will be of interest to
individuals concerned with political leadership and factors that determine good leadership in the
context of Afghanistan. Some of the issues discussed in this study could be defined as time
sensitive, meaning more relevant to the time of the study rather than a distance time in the future.
But most conclusions and policy recommendations of the study will likely remain relevant for
several decades to come.
The views expressed in this study are those of the author, they should not be interpreted as
representing the view of the institutions and individuals who provided the technical and financial
support, and/or any individual cited herein.

4
ABSTRACT
Afghanistan is a country where national institutions are weak, if they exist at all. Any socio-
political change is initiated and enforced through strong political initiatives exhibited by unique
individuals with charismatic leadership capacity. Even after the end of Afghanistan’s isolation in
2002, and excessive foreign investment in building institutions, many experts believe that the
process has not lived up to expectations, partly because Afghans tend to mobilize around
individuals and do not treat institutions seriously. This study takes those beliefs as a starting
point and explores the factors that lead to a political leader in Afghanistan being defined as
“good,” “strong,” or “popular”—as well as what needs to be done to improve political leadership
for future generations, given cultural consensus on characteristics of good political leadership.

5
TABLE OF CONTENTS
PREFACE ....................................................................................................................................... 3
ABSTRACT .................................................................................................................................... 4
TABLE OF CONTENTS ................................................................................................................ 5
TABLE OF FIGURES .................................................................................................................... 9
TABLE OF TABLES ................................................................................................................... 12
SUMMARY .................................................................................................................................. 14
AKNOWLEDGEMENTS............................................................................................................. 24
ABBREVIATION......................................................................................................................... 25
CH – 1: INTRODUCTION ........................................................................................................... 27
Impact on Policy ..................................................................................................................................... 29
Historical Background ........................................................................................................................ 30
Impact on research .................................................................................................................................. 36
The Current Concept of Political Leadership ..................................................................................... 39
Expected Contribution from This Research ........................................................................................... 44
CH – 2: METHODOLOGY .......................................................................................................... 47

6
Theoretical Framework and Assumptions .............................................................................................. 47
Analysis and Data Collection Strategy ................................................................................................... 50
Level-1 Analysis ................................................................................................................................ 51
Level-2 Analysis ................................................................................................................................ 51
Level-1 Data Collection ..................................................................................................................... 54
Level-2 Data Collection ..................................................................................................................... 57
How to read the analysis .................................................................................................................... 59
Factor Analysis ................................................................................................................................... 65
CH – 3: DEMOGRAPHICS ......................................................................................................... 69
Stratification Strategy ............................................................................................................................. 71
Sampling Strategy .................................................................................................................................. 73
CH – 4: DEFINITION OF LEADERSHIP ................................................................................... 82
CH – 5: CHARACTERISTICS OF LEADERS ........................................................................... 93
Factor 1: Measure of Goodness .............................................................................................................. 99
Factor 2: Islamic Factor ........................................................................................................................ 101
Factor 3: Pashtun Factor ....................................................................................................................... 103
Factor 4: Trust & Dependability ........................................................................................................... 105
Factor 5: Non-Pashtun Standard ........................................................................................................... 106

7
Important Findings from the First Stage ............................................................................................... 109
Judging Characteristics of Known Political Leaders ............................................................................ 113
CH – 6: EXPECTATIONS FROM LEADERS .......................................................................... 118
Factor 1: Measure of Goodness ............................................................................................................ 124
Factor 2: Islamic Factor ........................................................................................................................ 125
Factor 3: Justice and Honesty ............................................................................................................... 126
Factor 4: Decentralization of Power ..................................................................................................... 127
Factor 5: The Culture of Denying Personal Expectations .................................................................... 127
CH – 7: IDENTITY OF POLITICAL LEADERS ..................................................................... 132
Factor 1: Tajik Factor ........................................................................................................................... 141
Factor 2: Pashtun Factor ....................................................................................................................... 142
Factor 3: Gender, Rights, and Anti-Jihadi ............................................................................................ 143
Factor 4: Hazara Factor ........................................................................................................................ 143
Factor 5: Karzai Factor ......................................................................................................................... 145
Factor 6: Inner Circle ............................................................................................................................ 145
Factor 7: Communist Factor ................................................................................................................. 146
Factor 8: Radical Islamic ...................................................................................................................... 147
Factor 9: Western Technocrats ............................................................................................................. 148

8
Factor 10: Pashtun Nationalists ............................................................................................................ 148
Factor 11: VP Factor ............................................................................................................................ 149
Factor 12: Tajik Nationalist .................................................................................................................. 149
Other Political Leaders: ........................................................................................................................ 150
CH – 8: MAIN FINDINGS & POLICY IMPLICATIONS ........................................................ 154
Definition of Leadership ....................................................................................................................... 154
Characteristics of Leaders .................................................................................................................... 156
Policy Implications ............................................................................................................................... 163
Policy Recommendation I: Fix the judiciary to deliver justice ........................................................ 164
Policy Recommendation II: Ensure candidates for high office are well qualified ........................... 166
Policy Recommendation III: Foster future leaders of good character .............................................. 168
Policy Recommendation IV: Reduce the propensity towards radical Islamic dogmatism .............. 169
Policy Recommendation V: Provide specialized training for future political leaders ...................... 172
Policy Recommendation VI: Teach Afghan children about the country and their cultures ............. 175
Policy Recommendation VII: Provide safeguards for political leaders............................................ 176
BIBLIOGRAPHY ....................................................................................................................... 181
APPENDICES ............................................................................................................................ 187

9
TABLE OF FIGURES
Figure 2.1: Scree plot of words frequently repeated by respondents .............. 60
Figure 2.2a: Divergence of views between Pashtuns and non-Pashtuns over
legitimacy of political leadership. ......................................................................... 64
Figure 2.2b: Divergence of views between Pashtuns and non-Pashtuns over
legitimacy of political leadership. ......................................................................... 65
Figure 2.3: A diagram of relationship between proxy measures (items) and
underlying constructs (factors) ............................................................................. 67
Figure 4.1: Frequency of words used for definition of leadership. ................. 84
Figure 4.2: Pashtuns and none Pashtuns divergence of views. ....................... 86
Figure 4.3: Frequency of words in response to what a leader must have before
you call him a good leader. ................................................................................... 87
Figure 4.4: Frequency of words in response to what a leaders should be bfore
one calls him a good leader. .................................................................................. 88
Figure 4.5: Frequency of words used in response to the question of what
makes a leader popular. ......................................................................................... 89
Figure 4.6: Desired level of education for a good political leader vs. the level
of education of respondents. ................................................................................. 90

10
Figure 5.1: Distribution of scores (1 – 5) to different characteristics of a good
political leader. ...................................................................................................... 95
Figure 5.2: Scree plot of Eigen values for main factors ................................. 97
Figure 5.3: Divergence of views between Pashtuns and None Pashtuns over
characteristics of good political leadership. ........................................................ 104
Figure 5.4: Divergence of views between Pashtuns and None Pashtuns over
characteristics of good political leadership. ........................................................ 107
Figure 5.5: Consensus of respondents over characteristics of good political
leadership plotted by UCINET. .......................................................................... 110
Figure 5.6: Lack of consensus over characteristics of good political leadership
plotted by UCINET. ............................................................................................ 112
Figure 5.7: No significant divergence of views between Pashtuns and none
Pashtuns over some characteristics of good political leadership. ....................... 113
Figure 5.8: Key words used in evaluation of actual political leaders (depicted
in word cloud). .................................................................................................... 115
Figure 6.1 presents sorted distribution of scores for the 41 policy expectation
ratings. ................................................................................................................. 120
Figure 6.2: Scree plot of Eigen values for main factors ............................... 122

11
Figure 6.3: Relative importance of making peace with the insurgents for the
Pashtuns population vs other ethnic groups of Afghanistan. .............................. 130
....................................................................................................................... 131
Figure 6.4: Tiny difference in views of Pashtuns and none Pashtuns over
recognition of ethnic identity of all ethnic groups equally. ................................ 131
Figure 7.1: Distribution of scores (1 – 10) to actual political leaders of
Afghanistan. ........................................................................................................ 136
Figure 7.2: Summary statistics of missing values in the dataset................... 137
Figure 7.3: Distribution of mean values and its proximity to normal
distribution. ......................................................................................................... 138
Figure 7.4: Scree plot of Eigen values for main factors. .............................. 139
Figure 7.5: Frequency of response to question of who is the most famous
leader of Afghanistan. ......................................................................................... 151
12
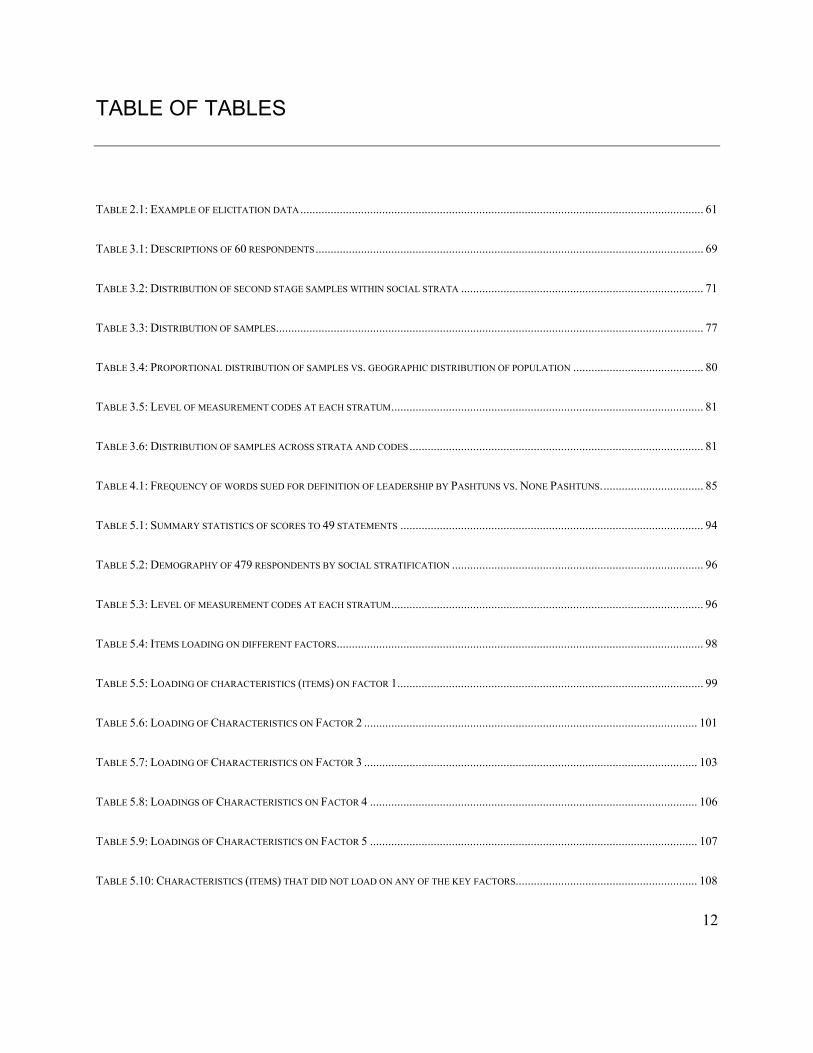
TABLE OF TABLES
TABLE 2.1: EXAMPLE OF ELICITATION DATA ..................................................................................................................................... 61
TABLE 3.1: DESCRIPTIONS OF 60 RESPONDENTS ................................................................................................................................ 69
TABLE 3.2: DISTRIBUTION OF SECOND STAGE SAMPLES WITHIN SOCIAL STRATA ................................................................................ 71
TABLE 3.3: DISTRIBUTION OF SAMPLES ............................................................................................................................................. 77
TABLE 3.4: PROPORTIONAL DISTRIBUTION OF SAMPLES VS. GEOGRAPHIC DISTRIBUTION OF POPULATION ........................................... 80
TABLE 3.5: LEVEL OF MEASUREMENT CODES AT EACH STRATUM ....................................................................................................... 81
TABLE 3.6: DISTRIBUTION OF SAMPLES ACROSS STRATA AND CODES ................................................................................................. 81
TABLE 4.1: FREQUENCY OF WORDS SUED FOR DEFINITION OF LEADERSHIP BY PASHTUNS VS. NONE PASHTUNS. ................................. 85
TABLE 5.1: SUMMARY STATISTICS OF SCORES TO 49 STATEMENTS .................................................................................................... 94
TABLE 5.2: DEMOGRAPHY OF 479 RESPONDENTS BY SOCIAL STRATIFICATION ................................................................................... 96
TABLE 5.3: LEVEL OF MEASUREMENT CODES AT EACH STRATUM ....................................................................................................... 96
TABLE 5.4: ITEMS LOADING ON DIFFERENT FACTORS ......................................................................................................................... 98
TABLE 5.5: LOADING OF CHARACTERISTICS (ITEMS) ON FACTOR 1 ..................................................................................................... 99
TABLE 5.6: LOADING OF CHARACTERISTICS ON FACTOR 2 .............................................................................................................. 101
TABLE 5.7: LOADING OF CHARACTERISTICS ON FACTOR 3 .............................................................................................................. 103
TABLE 5.8: LOADINGS OF CHARACTERISTICS ON FACTOR 4 ............................................................................................................ 106
TABLE 5.9: LOADINGS OF CHARACTERISTICS ON FACTOR 5 ............................................................................................................ 107
TABLE 5.10: CHARACTERISTICS (ITEMS) THAT DID NOT LOAD ON ANY OF THE KEY FACTORS ............................................................ 108

13
TABLE 5.11: TRANSLATION AND FREQUENCY OF WORDS USED REPEATEDLY IN THE WORD CLOUD ANALYSIS ................................... 116
TABLE 6.1: SUMMARY STATISTICS OF POLICY PRIORITIES ................................................................................................................ 119
TABLE 6.2: DEMOGRAPHICS OF 494 RESPONDENTS BY SOCIAL STRATIFICATION ............................................................................. 121
TABLE 6.3: LEVEL OF MEASUREMENT CODES AT EACH STRATUM ..................................................................................................... 121
TABLE 6.4: TABLE OF LOADINGS FOR FIVE EXTRACTED FACTORS .................................................................................................. 123
TABLE 6.5: POLICY PRIORITY LOADING ON FACTOR 1 ...................................................................................................................... 124
TABLE 6.6: POLICY PRIORITY LOADINGS ON FACTOR 2 .................................................................................................................... 125
TABLE 6.7: POLICY PRIORITY LOADINGS ON FACTOR 3 ................................................................................................................... 126
TABLE 6.8: POLICY PRIORITY LOADINGS ON FACTORS 4 AND 5 ........................................................................................................ 128
TABLE 6.9: OTHER POLICY PRIORITIES ........................................................................................................................................... 128
TABLE 7.1: LOADING OF ITEMS (POLITICAL LEADER) ON FACTORS: ................................................................................................ 139

14
SUMMARY
Since the fall of the royal system in 1973, Afghanistan has faced repeated failure -- or at least
crisis -- of political leadership. Many Afghans believe that this is because other powerful
countries use their economic and military power to install leaders of their own choice in
Afghanistan. Historical anecdotes support their theory. The British installed Shah Shuja, the
Russians installed communist leaders, the Pakistanis endorsed Mujahideen fighters, and recently
the U.S. installed Hamid Karzai to shape Afghanistan’s political landscape to their advantage.
Foreign experts of Afghanistan also ask the very same questions, but answer them based on their
own theoretical assumptions. Some experts believe that crisis in political leadership is
happening because the country’s educational system has failed since the collapse of the royal
system. Some other experts believe it is the ethnic conflict and political legitimacy crisis of
Pashtun dynasties that is causing political leadership failures. And, there are other experts who
think it is the conflict between educated urbanites and the puritan-rural-uneducated villagers of
Afghanistan that has produced consistent leadership failures in Afghanistan.
Afghanistan is a country where national institutions are weak, if existing at all. Any socio-
political change is initiated and enforced through strong political initiatives exhibited by unique
individuals with charismatic leadership capacity. Even after the end of Afghanistan’s isolation in
2002, and excessive foreign investment in building institutions, many experts believe that the
process has not lived up to expectations, partly because Afghans tend to mobilize around
individuals and do not treat institutions seriously.

15
This study takes those beliefs as the starting point and tries to answer questions such as; what
is it that makes a political leader “good”, “strong” or “popular” for the people of Afghanistan? Is
there any nationwide consensus on the characteristics of good leadership among the Afghans? If
yes, what characteristics? If not, what variations exist across different segments of population?
And finally, what needs to be done to improve political leadership for future generations, given
cultural consensus on characteristics of good political leadership?
The study explores Afghan’s socio-cultural values, norms and attitudes to find a meaningful
answer for these questions. It uses systematic analytical methods such as cultural consensus
analysis, psychometric analysis, and social network analysis to determine underlying constructs
in the minds of Afghans when they think about good political leadership. The study relies on
primary data collected from 18 different geographical regions of Afghanistan in two different
stages of data collection during 2012 and 2013. A total of 63 individuals were interviewed
during the first stage of data collection, and their answers were used to determine key questions
for a large scale second stage data collection, which was then administered through interviews of
568 respondents with a variety of socio-economic backgrounds. Through the study, one question
has underlain the process of research; what do the Afghans want to see in a political leader
before they define him/her as a “good” leader and decide to follow him/her?
The study suggests that some of the theoretical assumptions in the analyses of Western
experts are probably correct. There are detectable signs of ethnic conflict at the level of socio-
political norms, values and attitudes of Afghans. The study also suggests that majority of
Afghan political leaders are not popular among the people of Afghanistan. Only a few political
leaders – long deceased – seem to be scored somewhat positively. When Afghans think about

16
their political leaders and try to judge their measure of “goodness”, their thoughts are mostly
driven by the following underlying constructs:
1. Definition of “Goodness” in the context of political leadership: The most important
construct was what I define here as the people of Afghanistan’s definition of what makes
a political leader good and popular. Key proxy variables that Afghans picked for
evaluation and scored, included:
a. How just, honest, and truthful a leader is in his/her behavior.
b. How decisive a political leader is.
c. How much capacity he/she has for “governing” the country (the word used in
responses was “management”).
d. The level of leader’s passion and love for the country.
e. The level of leader’s respect for the law and endorsement of laws.
f. Does the leader have a clear political agenda?
g. Does he/she believe in God?
h. To what extent does the leader discriminate on the basis of ethnic identity?
i. How much he/she accepts responsibility.
j. Is the leader elected through an election?
2. The second most important construct in the minds of Afghans when thinking about good
political leader was defined as Afghans’ measure of Islamic behavior. The proxies that
most Afghans were measuring in this regard, included:
a. Does the leader have religious education?
b. Is the leader highly educated?

17
c. Does the leader fight the foreigners?
d. Is the leader willing to let the foreigners in the country?
e. Is the leader selected through a tribal Jirga?
3. The third most significant construct in Afghans mind was what I define as the measure of
adhering to Pashtun values. The key proxy measures that Afghans scored in this regard,
were:
a. The leader putting on a turban.
b. The leader putting on Perahan Tunban (traditional shalwar kamis).
c. The leader being from Kandahar.
d. The leader belonging to a noble family.
e. The leader who treats all ethnic groups equally, and
f. The leader who is not young.
4. A fourth construct that Afghans emphasized had to do with the measure of trust,
dependability and accountability of political leaders. Afghans mostly judged proxy
measures such as:
a. Does the political leader have family outside the country?
b. Is the spouse of the political leader a foreigner?
c. Does the leader own a business outside the country?
d. Does the leader own a property (house) outside the country?
These underlying constructs were determined as mostly influencing Afghans when they
thought about a good political leader in the absence of an identity for the leader. That means
respondents were judging goodness of political leadership without discussing any specific

18
political leader. When the questions included identity of a current or past specific political
leader, the underlying constructs that determined their judgements changed. In this case the most
important construct that influenced their views included:
1. Ethnic identity of political leaders: Respondents measured leader’s goodness and
popularity under strong influence of their ethnic backgrounds. Tajik identity was
determined to be the strongest construct in Afghan’s minds, followed by the Pashtun
ethnic identity, and then Hazara ethnic identity as the fourth underlying construct. That
means respondents on average scored leaders of the same ethnic group similarly.
2. The third most significant construct that influenced Afghans views were the gender of the
political leader as well as their attitudes towards women’s rights and dislike of Jehadi
parties. This was the only major construct that had nothing to do with ethnicity but still
reached the same level of importance in Afghans’ minds.
3. Other than ethnicity, gender, and pro-women’s rights – anti Jehadi constructs, I found
eight additional constructs that were not very significant, but important enough to
distinguish. These constructs included:
a. Belonging to Karzai’s family.
b. Belonging to the inner circle of Karzai’s power structure.
c. Belonging to communist parties.
d. Belonging to radical Islamist parties.
e. Belonging to pro-west technocrat diaspora.
f. Belonging to radical Pashtun nationalist groups.
g. Belonging to radical Tajik nationalist groups.

19
h. Being vice presidents in Karzai governments.
Given these findings the study concludes that the most important determinants of being
perceived a good political leader for the people of Afghanistan may include the following
characteristics:
1. Perception of people about how just, honest, and truthful the leader is.
2. Governing capacity of a leader.
3. Ethnicity background of a leader.
4. Educational background of a leader.
5. Islamic knowledge of a leader.
6. Sense of belonging of a leader to the society.
7. Political ideology of a leader.
The study concludes with policy implication of the findings for future generations of
Afghanistan. It acknowledges the fact that policy environment of Afghanistan is unique and
challenging. While established institutions are needed to endorse policy reforms and improve
political leadership, the leadership is needed before that to establish the necessary institutions.
Therefore, policy recommendations are addressed towards a group of young and educated
“transitional” leaders of Afghans who can break the chicken and the egg cycle, and serve as the
founding fathers of political leadership reform.
Key policy recommendations are focused on the reform of the country’s judiciary system to
improve legitimacy of future political leaders. The study reveals that Afghans strongly associate
prevalence of justice with the quality of political leadership, and therefore expect any good

20
leader to prove his or her goodness by prevailing justice in the society. However, it is a daunting
task to reform the existing judiciary system of the country without having a very strong political
leadership first. Therefore, it is suggested that the focus be directed towards boosting
traditional–unofficial–local judiciary system of the country and work with village elders to
reduce the demand for official judiciary system which is highly corrupt and politicized.
The study also suggests that in the minds of the Afghan, a good leader also means a good
governor or a good ruler who is accessible by the people. They expect a good leader to govern
honestly, decisively, and live within close proximity of people so they have access to him/her all
the time. The policy recommendation in this regard is oriented towards policy of especial
leadership education, recruitment and promotion of leadership positions. This suggests that
current system of political appointees should be changed to a system of merit, and promotion
should always remain systematic. No provincial governor should be able to get the job unless a
candidate has first served in a district governor position for a certain period of time, and no
candidate should be given the job of district governorship unless he/she has gone through
especial leadership training program first. Systematic promotion will not only help leaders to
build their governing capacity, which is a very important expectation of Afghans from their
political leaders, but also allow politicians to live in close proximity of people and develop the
bonds of trust and dependability.
Another characteristic of good political leadership that was strongly detected by the
underlying construct analysis was degree to which a leader is affected by power itself. That
means when Afghan leaders are in a position of power they tend to act as if they are above the
law. Afghans have become cognizant of this effect of power, and believe a good leader is

21
someone who can resist these negative effects and remain humble even after he/she is in power.
Research shows that Afghans appreciate such characteristics as accepting responsibility, being
elected through an election, respecting & enforcing the laws, and believing in God, all of which
emphasize the effects of power on a leader’s behavior. The study suggests three prime policy
reforms; A) ensure that future leaders have social science education to understand how violations
of laws and norms can set the example for everyone to follow the suit, B) enforce several
measures of power-containing policy so as to strengthen the resilience of future leaders to the
negative effects of power, and finally, C) establish methods of checks and balances so as to
reduce chances of overruling to protect images of good leadership for the future.
The second strongest underlying construct in Afghans’ mind when they think about good
political leadership is formed by the degree of “radical Islamic dogmatism”. In part it is a
product of sustained international support to religious schools during the Cold War, and partly it
reflects the nature of the Afghan society. Afghanistan has always been a religious country with
very low level of education for the bulk of its modern history. Promoting modern education is
probably the best policy to reduce religious radicalism in Afghanistan. The current leaders of
Afghanistan need to commit themselves to support sustained modern education for two to three
more generations to reduce the effects of religious dogmatism in the country. It is also an
important policy priority for the international community to commit funding for public school
education program so the choice of education is not limited to the religious schools which are
highly radicalized due to the era of Jehad and Cold War. Making education available for the
next few generations of Afghans can overcome this challenge. It is equally important to reduce
the flow of funding to religious madrasas so that future leaders are not forced by the religious
22
views of their followers to become more religiously dogmatic. Afghans expect a good leader to
fight foreigners which is a mindset borrowed from the era of colonialism. Future generations of
Afghanistan need to be educated on how the global political system works, the possible rationale
to go to war with another country, and how to develop the country’s international relationships
so as to maximize the prosperity of the country.
Finally, there has always been a common understanding about Afghanistan that Afghans
assess their political leaders on the basis of how successful they are in the provision of security
and economic opportunities. My findings suggest that good leadership is not as much defined on
the basis of reducing conflict and poverty, as in the context of social and cultural values of the
country. Afghans expect their political leaders to be highly knowledgeable and capable of
guiding them in their social life. The common word that Afghans use for the term “leader” is
“Rahbar” which literally means a guide. Future generations of leaders need to understand these
bases of socio-cultural expectations of Afghan population. Better level of education in social
sciences will help them in many different dimensions of leadership challenges. For example,
future Afghan leaders need to understand the most important factors that determine people’s
judgment about good political leaders. For instance, it is important that future leaders understand
that justice and honesty are important political values for the people of Afghanistan. Data
suggest that ethnic divergence happens when respondents evaluate political leaders. Divergences
are mostly driven by diversity of norms and values among different segments of Afghan
population. Future political leaders need to understand such characteristics of the society and be
prepared to overcome the challenge of diversity in cultural norms. At the very least, they need to
know where norms and values become critically important to certain ethnic groups of

23
Afghanistan, and adjust their policy decisions accordingly. Establishment of a political
leadership institute and including leadership skills in the educational system can pave the road
for future leaders of the country.

24
ACKNOWLEDGEMENTS
This study became possible with the generous help of several Pardee RAND Graduate
School, and RAND colleagues who give their time and insights on this issue. However, the
analysis and views expressed herein are solely my responsibility. I would like to particularly
thank Dr. Terrence Kelly, the chairman of my committee for his sincere support, and the team of
internal and external advisors, without who’s technical and moral support this would not have
been possible.
I would also like to thank Maxine and Eugene Rosenfeld, as well as RAND’s National
Security Research Division (NSRD), for their generous financial support which paid for the cost
of data collection and travel to 18 geographic locations of Afghanistan.
This study would not have been completed without tireless support from my family and
friends, specially my father whose big dream was to see me defend this dissertation, but
unfortunately he passed away a few weeks before my dissertation defense seminar was
scheduled. I would like to dedicate this work to him for his support to the family, his love for the
country, his sincere attitude of being a true public servant, and his dedicated devotion to the
citizens of Afghanistan.
Finally, I would like to take the opportunity to thank everyone who reviewed and commented
on several drafts of this document before it was submitted for approval.
Thank you.

25
ABBREVIATIONS
FA Factor Analysis
CA Correspondence Analysis
CCA Cultural Consensus Analysis
SNA Social Network Analysis

26

27
CH – 1: INTRODUCTION
Variations exist in norms, values, beliefs, and attitudes of different ethnic groups of
Afghanistan when judging the characteristics of a good political leader. This study seeks to
explore the socio-cultural norms, expectations, and values of the Afghan people for good
political leadership, and assess variations across different ethnic groups. This effort aims to
examine if the socio-cultural norms and values of the Afghan society are to be credited or
blamed for the patterns of political leadership that have emerged in the past five decades.
The academic objective of this research is to explore the culturally correct answer to the
question of what are the most important characteristics for a good political leader in Afghanistan.
However, the policy objective of the study is to seek areas of value, norm, or attitude divergence
and ways to pave the road for better political leadership in Afghanistan.
To address these goals, this dissertation addresses these four main research questions:
To what degree do Afghans have a shared understanding of good leadership?
If Afghans have a shared understanding, what constitutes commonalities?
How do Afghans differ in their understanding of good leadership?
How does their understanding vary by ethnicity, gender and social class?
To address these questions, this study uses a two-stage research design. In the first stage,
exploratory data were collected in late 2012 with semi-structured interview of 63 interviewees
randomly selected from different strata of cultural geography of Afghanistan. In the second

28
stage, standardized survey data were collected from 568 respondents across 18 different
provinces of Afghanistan in early 2013. To assess patterns between similarities and differences
in people’s beliefs about the characteristics of an effective political leader, various methods were
used, including cultural consensus analysis (CCA)1, factor analysis (FA), correspondence
analysis (CA), and social network analysis (SNA).
As part of a secondary objective, this study reviews recent theories of political leadership in
academic circles to establish a baseline for comparison with the findings from Afghanistan, and
then uses the contrast to formulate policy recommendations for the development of educational
system, and future political institutions of Afghanistan. Key policy recommendations are focused
on such questions as:
How can the educational system in Afghanistan promote cultural acceptance and
harmony among different ethnic groups in the country?
How can the educational system pave the road for the emergence of future political
leaders who are culturally mindful?
What policy changes in political institutions can help Afghanistan’s future political
parties accommodate for the growth of culturally aware political leaders?
What kind of public awareness can help raise awareness among Afghans of the critical
differences in their cultural norms, especially about choices of political leadership and
future political development of their country?
1 See, for example, Romney et al. (1986).

29
Finally, this research aims to generate policy input that could be relevant to the political
development of Afghanistan, and identify areas for additional research to be carried out in the
future.
Impact on Policy
Since 1774, when Afghanistan was first established as a state, the country has experienced a
total 34 transitions in political leadership, with an average ruling period lasting 7.9 years, but
some ruling up to 40 years and others just a few months. However, in the past 50 years, these
transitions have become more frequent, with the average ruling period dropping to about 3.6
years per leader; only one leader was able to remain in office for seven years. In several cases,
Afghanistan has seen two rulers assuming the position in the same year. Many average citizens
of Afghanistan, including highly educated Afghans, said they believe this is happening because
foreign countries determine who should rule in Afghanistan. The idea of what determines an
effective political leader for the Afghans has never been studied academically, and, therefore,
presents the question of why Afghans revolt frequently against their political leaders regardless
of their competency.
While this study is not going to focus on the political and economic reasons of political
transitions of Afghanistan, it will highlight how various groups of Afghans perceive and judge
characteristics of effective political leadership in different ways. These perceptions are important
because they will affect collective judgment of Afghans on the success of a political leader, and,
thus, the legitimacy of his rule. Exploring these perceptions can help identify where different
groups of Afghans disagree, particularly about norms and values.

30
Historical Background
The modern history of Afghanistan begins with the rule of King Abdul Rahman Khan in
1880. King Abdul Rahmani and two generations of his children tried to build a modern
education system for the country to establish a group of political elites so they can guide the
future generations of Afghanistan systematically, but the process was disrupted after political
failure of King Amanullah in 1929. The first modern high school in Afghanistan—constructed
by the United States—was established around 1903, which later become a symbol of friendship
between the two countries. A decade later, Germany and France built two additional high
schools, which later became iconic symbols of friendship with those two European powers. King
Zahir Shah expanded the initiative and provided educational facilities to about 50 percent of the
country’s population by 1970. These schools produced most of Afghan political leaders through
the rest of the century.2 As expected, these early century educational investments paid off by the
middle of the century when the country moved full speed toward growth, democracy, and
modern social life.
It was during this period of cultural, political and economic optimization, that a new wave of
power competition within the royal family opened doors toward political failures that came in the
second half of the 20th century, and continues to date. A few regional and domestic events
constituted the basis of a political rivalry within the family:
Loss of territory to British India in 1892
2 Some examples of political leaders who have graduated from Habibia High School in Kabul, Afghanistan, include King Zahir Khan, President Mohammad Najibullah, President Hamid Karzai, President Sibghatullah Mujadidi, Prime Minister Maiwandwal, Minister Raheen, and Minister Rahim Wardak.

31
The political awaking effects of education in all ethnic groups of Afghanistan, which in
turn caused the rise of political competition challenging the myth of Pashtun rule
The belief that Pashtuns should maintain monopoly of political power.
While the loss of territory to British India was a major setback to Pashtun power, Afghans
had no choice, as they could not challenge a super power but hoped to one day reclaim the lost
land. However, by 1947, when the territory was handed over to a new political entity, Pakistan,
Afghan rulers become very concerned about the permanent loss of this territory. Afghanistan’s
relationship with the new neighbor became unfriendly from the beginning.3 While no Afghan
government has officially reclaimed the territory, Pashtun politicians frequently use the issue for
domestic political purposes, especially when it serves the interest of Pashtun power projection
against other ethnic groups. For example, former President Hamid Karzai constantly used anti-
Pakistan policy during his rule, 2002 – 2014, especially when he discovered that a democratic
process could deprive Pashtuns from the top power positions. Karzai also used old Pashtun
grievances with Pakistan to isolate the chances of being punished by the Pashtun tribes for being
a puppet of the Western powers.
In 1929, the overthrow of King Amanullah by the religiously motivated peasants of northern
plains of Kabul, and subsequent takeover by a Tajik leader, Habibullah Kalakani, caused Pashtun
political elites to become too conservative in their policies toward political awakening and thus
empowerment of other ethnic groups. King Nader Shah and his brothers implemented a series of
policies, 1929 – 1943 to deprive other ethnic groups of education and other aspects of social
3 “We and Pakistan,” a collection of articles by Akram Andishmand published by local publisher, Maiwan, in Afghanistan.

32
status to prevent future loss of political power. These conservative policies reversed much of the
educational effects of early investments by King Abdul Rahman and his children before 1929.
Education typically increases demand for political participation, and Afghanistan was not an
exception to the rule. These two opposing events—efforts to consolidate Pashtun rule while
increasing demand for broader political participation—could hardly coexist at the same time. It
was for this reason that King Zahir Shah reversed the policies of his uncles and tried to open up
the political space to everyone in order to stabilize domestic political problems and focus on
foreign policy issues, such as the loss of territory to British. The decade of democracy was a very
good outcome of the policy measures King Zahir Shah put in effect.
However, he soon faced political pressure from within his own family to reverse some of
those policies. For example, his cousin, future President Daoud, who was also his prime minister
from 1953 to 1963, used the grievances of territorial loss to Pakistan as a means for increasing
his political weight in the elite community of Afghanistan. He pushed for policies that brought
relations between the two countries to its knees at one time. Eventually, King Zahir decided to
remove Daoud from his post as prime minister, and in 1963 constitution he passed legislation
banning members of the royal family from rising to positions of power. This was the turning
point when a major crack emerged in the integrity of the royal family, which eventually caused
total collapse of the royal system. Daoud joined other political parties that emerged during the
decade of democracy and removed the king from power through a military coup in 1973. Since
then, political stability has never come back to Afghanistan.
One of the very important outcomes of this period was a reiteration of Pashtun domination,
and association of political power with the Pashtun culture and history. While the rulers did it

33
for specific political objectives (initially foreign policy, and later domestic political
consolidation) they never considered the negative effects of that on diverging values, norms and
attitudes among the Afghan population over time. Since then, Afghan political elites never
consulted political science on the viability of a power monopoly doctrine, or its long term effects
on political stability of the country. Afghanistan moved toward the Cold War era (a completely
different phenomenon that had nothing to do with Afghanistan’s domestic or regional issues)
other ethnic groups found the opportunity to expand their political power and claim bigger space
in Afghanistan’s political space. Moving forward, with the beginning of the war on terrorism
and return of democratic system to the country, the issue of power monopoly faced serious
contests. It was not easy for the contemporary Pashtun politicians to find a solution to this
problem. Thus, they bypassed established processes and paid off politicians to get around
democratic rules and save Pashtuns political domination. Karzai and his political advisers
ignored constitutionally mandated democratic rules many times to secure power for the Pashtuns.
The 2010 election win of parliamentary seats in the Ghazni province by the Hazaras is an
example of how Karzai circumvented the democratic process to ensure Pashtuns remain in
power.4
However, for future generations of Afghans, it is very important to understand that the effects
of political decisions in the 20th century have created critical divides between ethnic groups that
go beyond the power rivalry of the political elites. The political rhetoric of several decades has
now created certain cultural norms and values for the new generations of the Pashtuns and other
ethnic groups that can pose challenges for a democratic Afghanistan. The concepts of political
4 See, for example, “Karzai Backs Down from Afghan Leaders,” January 22, 2011, USA Today, web page.

34
leadership, power and state have been linked with Pashtun cultural norms that, for all practical
reasons, make it hard for people to elect their new leaders through fair and transparent elections.
The 2004, 2009, and 2014 presidential elections, as well as decisions of Bonn Accord, have all
been affected by the challenge of whether a person from another ethnic group can become
Afghan President if he has the majority vote of the people. If Afghanistan is supposed to come
out of its violent and political instability, future generations of Afghanistan need to review and
examine carefully how attitudinal divisions have ruined their political life. More specifically,
how their norms and values have damaged processes that can affect their country’s political
leadership, state governance, and democratic transition of power.
This research is a small step toward testing the hypothesis of whether there are significant
differences between the Pashtun and non-Pashtun ethnic groups when it comes to their views
about the characteristics of good political leadership. While the findings of this research might
not present a complete picture of ethnic divide over values and norms in Afghanistan, it does
explain how the Pashtun and non-Pashtun ethnic groups define good political leadership
differently. The main objective of this study is to detect differences, if they exist, and the
distribution of these differences across geography, gender, age, and other social strata. Many
experts and observers of Afghanistan agree that the problem of good political leadership is
probably central to any political order and future stability of Afghanistan (Wilson, 2011).
Afghanistan is facing a political divide along its ethnic lines, and defining characteristic of good
political leadership that are demanded by different ethnic groups could be central to future
stability of the country. Many researchers in this area agree that “political leadership and

35
followership account for significant differences across and within individual nation states”
(Masciulli et al., 2009).
There is very little agreement among scholars of political science that the causal relationship
between good leadership and political popularity is one way stronger than the other ways.
However, there is more agreement that society’s norms and cultural beliefs impact the views of
political leaders, because political leaders act like entrepreneurs and adopt themselves to the
societal norms and demands for political leadership. Both leaders and followers are involved in a
circular process of motivation and power exchange that is often difficult to break into a causal
sequence (Wildavsky, 2006). Leaders influence their followers as much as followers influence
their leaders. However, when it comes to the most important variables that shape the demand
side of the political leadership in Afghanistan, social and cultural norms will probably stand
alone.
In this research, firsthand empirical evidence from Afghanistan is used to assess how social
and cultural norms from different ethnic groups affect the popularity of different political
leaders. The study does not intend to answer all questions about the challenges of political
leadership in Afghanistan. Because of the limitation of resources and access to larger groups of
population, more fundamental questions will have to be answered through future research by the
Afghan political scientists.
Finally, it is important to note that the method used in this research could be applied to
understating similar questions regarding political leadership and distribution of views and norms

36
in other countries and cultures. As such, this dissertation also makes small contribution to
understanding of how to address these questions in other contexts.
Impact on research
There are two sets of literature that are relevant to this dissertation:
Latest theories of political leadership in general, which is a very large body of literature,
but to a great extent not central to the main thesis of this study.
Academic research on the political leadership of Afghanistan, which does not exceed a
dozen sources, and the best of which is focused on the model of leadership among a
Pashtun tribe (Yusoufzai) in the northern valleys of Pakistan (Barth, 1959).
Modern theories of political leadership frequently disapprove the idea of the “big-man”
approach to successful leadership. Recent academic literature places greater emphasis on the
harmony of cultural norms, values, and beliefs of leaders and followers as the most important
determinants of successful leadership. Robert Cialdini (2001) argues if the leadership is about
“getting things done through others” then it is logically meaningful to ask the question of what
factors make the followers listen to their political leader. Such factors should contain
characteristics, behavior patterns, policy choices, or any other processes or mental stimulators
that are important for the followers and that allow the leader to stimulate those factors to
influence his/her followers. Topics such as psychology of leadership, psychology of politicians,
and leader-followership relations aggressively discuss the impact of surroundings in which
leaders emerge and succeed. While there is not much agreement on how characteristics of an
individual leader can shape the course of history for a country—except for some exceptional

37
cases such as U.S. President Franklin D. Roosevelt and British Prime Ministers Stanley Baldwin
(Hamby, 2006, 233) and Winston Churchill (Lord, 2003); Lenin (Service, 2000); Deng Xiaoping
(Shambaugh, 1995); and even radical leaders such as Mao, Stalin and Hitler (Tucker, 1987)—
there is considerable consensus among scholars that social, cultural, and psychological factors of
a society influence the views and behaviors of political leaders to a great extent. Some scholars
believe that “the operation of psychological processes always depends upon social context”
(Israel and Tajfel, 1972). Most scholars agree that the social and cultural norms, as well as
psychological conditions of the environment in which leaders emerge, determine the views and
future actions of political leaders. The authors of “The New Psychology of Leadership” argue
that the social and contextual factors that impact a leader’s capacity to influence others include
the culture of the group that is being led, as well as that of the broader society in which the group
belongs (Haslam, Reicher and Platow, 2011). Nye believes that in order to “understand, explain
and predict patterns of political leadership … inquirers need to analyze the beliefs, values,
characters, … attitudes [of] followers, as well as their historical situation and cultural-
institutional context” (Nye, 2008). Moreover, leadership seems to be a symbolic activity
mediated by social and cultural norms. Leaders as the entrepreneurs of social and cultural norms
are engaged in providing a vision to create, reshape or enhance these characteristics. What is
interesting is that in the process, leaders and followers themselves get reshaped by what they
help shape (Rousseau, 1987). Therefore, scholars raise such questions as: Do leaders really
shape history, or is it the historical forces that primarily shape them? Why do followers follow
leaders? Is it because of leaders’ charismatic characteristics, actions, and thoughts; or it is simply
the socioeconomic self-interest of the followers? What part of a leader’s characteristics,

38
behaviors, and personalities are regarded as the personal property of the leader; and what part of
it as a mere reflection of the predominant social, cultural and economic forces? (Masciulli et al.,
2009)
On the other hand, “a growing number of political analysts see leadership as … some kind of
process … that in some way gets people to do something’, or involves ‘some sort of relationship
between leaders and followers in which something happens or gets done” (Ciulla, 1998; Burns,
1978). In this perspective, leaders affect their followers’ attitudes, beliefs, demands and needs;
and the followers affect the leader’s characteristics, qualities, beliefs and motivations, as they
both transform the society together and reflectively get transformed by their own actions
(Blondel, 1987; Hay, 2002; Tucker, 1977; Tucker, 1981; Wildavsky, 2006; Rousseau, 1987). It is
because of this mutually adaptive relationship between the leaders and followers that some
scholars believe political leadership implies followership, where tasks need to be accomplished
in a specific institutional and cultural context (Heifetz, 1994; Tucker, 1995; Nye, 1999; Bennis
and Thomas, 2002; Nye, 2008). Because of this adoptive nature of the relationship between
political leaders and their followers, it is important to assess whether the three decades of war
and destruction in Afghanistan were because of the imposition of bad political leaders by foreign
countries, or rather an outcome of socio-cultural norms and context of the Afghan society. Most
respondents interviewed in this study asserted that Afghanistan did not go in the right direction
because of the lack of good political leaders. But the latest theories of political leadership suggest
that leaders simply adapt themselves to the existing social and cultural environment of the
society to increase their influence. If this is the case, then a search for good leaders is probably
not the right answer in Afghanistan, but rather shifting the socio-cultural norms of the society

39
might be the solution. Afghan political leaders also believe that people have strong cultural
norms and standards, which provide wrong incentives to foreign countries to engage with
Afghanistan such that good leaders are isolated from power.5 The leaders are left with no choice
but to adapt to the same social and cultural norms that their followers value if they are to increase
their influence.
Political leadership and characteristics of an effective political leader in the context of
Afghanistan have never been researched through rigorous academic methods. This study’s search
among political leadership literature found only two academic papers: Azim M. Nasimi’s
dissertation, which is basically an ethnographic study of the Afghan political leaders during the
royal system in contrast with the communist leaders of post royal system of the country; and
Fredrik Barth’s “Political Leadership Among Swat Pathans” (1959) is a study related
tangentially to the cultural norms and values of the Pashtuns in Afghanistan. “Although Barth's
monograph stands out as one of the classics of political anthropology (Edwards, 1979), its
findings can hardly be generalized to the whole population of Afghanistan because the study
discusses one isolated Pashtun tribe (Yusufzaiof the Swat valley in Pakistan). Afghanistan is
composed of many different ethnic groups, and Yosoufzai is only one of several Pashtun tribes,
and is predominantly settled outside of Afghanistan.
The Current Concept of Political Leadership
Political leadership is the primary means through which human societies change because it
motivates people to put their shoulders to the wheel of progress and work together toward a
5 From personal interviews with political leaders in Kabul.

40
common goal (Haslam, Reicher and Platow, 2011). However, the current challenge is that
political leadership has yet to be properly defined in academic literature. As one of the founders
in the leadership field, R.J. Stogdell noted: Leadership in various segments of the population
(students, military personnel and business) [has] been heavily researched, while others
(politicians, labor leaders, and criminal leaders) have been relatively neglected (Blondel, 1987).
Although such charismatic leaders as India’s Gandhi, the United States’ John F. Kennedy, or
South Africa’s Nelson Mandela are popularly referred to as outstanding examples of strong
political leadership, very few researchers have examined the political, policy and public contexts
of their achievements (Burns, 1978; Heifetz, 1994; Tucker, 1995). Partly because the main
disciplines that concern politicians, such as law, political science and public administration, have
largely neglected political leadership in their analytical discourse. This is because: a) these
academic disciplines focus more on institutions and regimes, and b) the traditional understanding
is that politicians make policy and public servants execute them, leaving little or no room for
political leadership (Hartley, 2010a; Behn, 1998).
Kellerman (1984) asserts that leadership is perceived as a form of influence or persuasion.
Whether as a function of a group process or an individual personality, it simply increases a
leader’s influence among followers. However, some experts believe that political leadership is
simply control over policies that affect public welfare. What is really lacking is a theory of
political leadership that illustrates the relationship between leaders and followers in different
settings. “Hence, the wry observation that leadership is one of the most observed and least
understood phenomena on earth” (Kellerman, 1986).

41
Edinger (1990) argues that it is the conditions of international regimes and relations among
states that explains key political outcome in both domestic and foreign affairs. In this method of
thinking, the actions of a particular individual do not matter at all. This is because nation states
are the main variable in the principle analysis of international theories, not individual actors.
Factors such as geopolitical, economic, and military conditions are more crucial than political
leaders who constantly change during the course of time. At the level of intrastate analysis,
individual political leadership still seems to be less important for key political outcomes than
other factors, such as a country’s historical development, economic constraints, and other long-
term conditions. In some analysis, researchers put more emphasis on socioeconomic structures
and relations than on the role of an individual character from a dominant ruling class. Other
scholars put more emphasis on such factors as the changing nature of political systems, political
regimes, and the political ruling class than specific political leaders (Edinger, 1990).
Alternatively, some scholars believe that the concept of political leadership is inherently
difficult to define because it depends on such factors as institutional, cultural and historical
contexts and situations. (Blondel, 1987; Wildavsky, 2006; Wildavsky, 1989; Klenke, 1996). All
leaderships occur in social and cultural contexts, which inspires followers with certain social and
cultural characteristics and at the same time permits leaders to utilize certain social and cultural
characteristics: inherent qualities and characteristics, socialized customs, cultural skills, social
insight, and intelligence of various types, including emotional intelligence and contextual
intelligence, but also power-wielding, organizational and communication skills (Greenstein,
2004; Greenstein, 2006; Bose, 2006; Nye, 2008). When it comes to the question of what makes
people listen to leaders, Weber distinguishes between the cultural, social and psychological

42
sources of leaders’ powers. Weber (1986) argues that leadership is exercised based on
traditional, cultural, or charismatic domination. Weber believes the most usual engine of
leadership in societies requires leaders to remain embedded in society so they can influence their
followers.
Weber is not alone in his thinking. Other scholars, such as Kellerman, also believe that
complex problems of societies that are going through rapid changes require something more than
just good policy decision and/or good public administration. International regime, historical
development, and economic circumstances do not always explain the events that are direct
outcome of good political leadership in the process. It is truer in the context of war and post war
societies. Kellerman argues that political leadership is the most important element of successful
political developments. Leadership is very critical for any successful governance reform
program: weak leadership contributes to government failures, and strong leadership is
indispensable for success. Wise leadership typically endures prosperity in the long run;
incompetent leaders usually bring about catastrophes (Kellerman, 1986).
So, if leadership is really important, we need to have a critical look at the meaning of this
concept. The most fundamental question: What does the term “leadership” mean? (Grint, 2000;
Hartley and Benington, 2010). The term, as argued by Masciulli, is of more recent usage.
Leadership was coined in the early 19th century and refers to the dignity, or position, of a leader.
It refers to the position of a group of people leading or influencing others within a given context.
The Concise Oxford English Dictionary defines a “leader” as “the person who leads or
commands a group, organization, or country.”

43
Although leadership is seen as a universal phenomenon, it oftentimes proves difficult to find
equivalent description and comparison terms in different languages. For example, there is no
word for leadership in Japanese, and none of the Romance languages has a term for the word
“leader” (Edinger, 1990). In other languages, the meanings of equivalent terms differ
considerably, but they recently have also adopted the English terms of “leader” and “leadership”
(Blondel 1987). With regards to an overall guiding definition of political leadership for research
purposes, cultural context matters in giving substantial content to any definition. For example, in
a Russian cultural context, a leader with weak character would be rejected as a failure—
Gorbachev’s weakness versus Putin’s strength as contrasting images (Wildavsky, 2006; House et
al., 2004). As discussed in the chapters ahead, the terms used by different ethnic groups in
Afghanistan have different meanings. This research shows that the definition of leadership
among citizens of the same country is not necessarily the same. Pashtuns define leadership
differently from non-Pashtuns because they have different social and cultural structures.
Pashtuns referring to a political leader use the word “Mesher,” which basically means “an elder,”
while other ethnic groups refer to a political leader using the Farsi word “Rahbar,” which
literally means “someone who can show the way,” or simply “a guide.” In Chapter Four of this
dissertation, some empirical findings will be presented to support this.
In general, researchers agree that the following elements should be taken into account when
defining political leadership:
The personality and traits of a leader, including her or his ethical and cultural character;
The traits and cultural character of the followers with whom the leader interacts

44
Expected Contribution from This Research
Jean Hartley and her colleague argue that three concepts might be relevant to understanding
the essence of political leadership (Hartley and Allison, 2000). Analyzing quality of leadership
based on:
The person
The position
The processes.
In some cases, these analytical methods could be combined in practice, but it is helpful to
distinguish them conceptually. Studies of political leadership based on the leader and his or her
personal characteristics are quite popular and tend to focus more on such characteristics as the
skills, abilities, personality, styles of engagement, and the behavior of individual leaders (Yukl,
2006). Popular leadership literature is full of articles about this approach to leadership, but such
methods can be problematic if they neglect the environment and the context in which the leader
acts (Hartley and Benington, 2010). In recent research, scholars have focused more on the
interactions of the leader within context (Bryman, 1992; Grint, 2000; Hartley and Allison, 2000;
Porter and McLaughlin, 2006). Edinger’s method of analysis suggests that we should first define
the phenomenon—in this case, political leadership—and then describe the level of analysis for it,
and then proceed with counterfactual tests. The level of analysis concerns the question of how
much importance individual leadership deserves in the interpretation of political developments.
Does it make a difference in the real world and, if so, how much of a difference (Edinger, 1990)?
Other political scientists have reached a certain degree of consensus that the case-study method,

45
along with qualitative approaches together with systematic use of counterfactual investigations
(Kellerman 2004; Kellerman 2008; Gergen, 2000; George and Bennett, 2005; Greenstein, 2004;
Ferguson, 1999), combined with quantitative analysis (King 2002; Rejai and Phillips, 1983), is
going to be indispensable for arriving at reliable knowledge about political leadership. Of
course, experimental research and other causal methods are undeniably more useful for the study
of political leadership (Lane, 2003). We also could use typological methods to describe various
observable groups of political leaders and their followers, the nature of the relationship that binds
the two groups together, their social and cultural traits, functions and societal roles, as well as the
extent their character impacts the society at large. Some of the pertinent questions that arise in
this regard are:
How and why do certain individuals gain power in a particular society or state? What are
the origins of their power? (Blondel, 1987)?
What are leaders’ and followers’ personal characteristics (Greenstein, 2004; Hollander,
1998; Kellerman, 2008)? How do leaders and followers relate (Kellerman, 2004;
Kellerman, 2008; Burns, 1978; Burns, 2003)?
Whatever contextual variations presents, political leadership–followership is a social process
of adaptation and innovation, meaning innovative adaptation to an environment or context in
which a group’s way of life and values are challenged. The leader’s tasks are to:
Interpret society’s problems;
Define ends and means to solve problems;
Inspire followers by personal visions as solutions or, at least, responses to problems;

46
Mobilize followers to own those solutions and implement them (Heifetz, 1994; Tucker,
1995).
The leadership–followership dual system means that, to a significant extent, those being led
create leaders. Followers matter because leadership is seen as a process, which is caused by
following (Mant 1999).
The actual “supply” of political leadership is driven by a pre-existing demand in society,
which the political entrepreneurs seek to satisfy. Usually, there is more than one way to satisfy
that demand, or to generate a view that the expectation can be met. One of the contributions of
this study will be an exploration of the demand for political leadership in Afghanistan, because it
has never been studied in the past. Another contribution will be to provide insights into how
leaders are judged by their followers, which will allow for a better understanding of the
judgmental lenses of different ethnic groups in Afghanistan. And finally, the last contribution
will discuss the details of how followers define and prioritize the problems of Afghanistan from
their point of views. Variations across ethnic groups will be reviewed to determine areas in
which followers present diverging expectations for Afghanistan’s political leaders.

47
CH – 2: METHODOLOGY
Theoretical Framework and Assumptions
One of the primary objectives of this research is to determine whether there is any shared
cultural agreement among Afghans regarding their perceptions of good leadership, and, if there
is, to what degree do these notions systematically differ across ethnic groups and social strata.
Fortunately, there is a relatively well-established approach for addressing such questions called
cultural consensus analysis. This approach uses a mathematical model to determine the degree of
shared knowledge within groups of people and estimates the “culturally correct” answer when
previously unknown. The analysis initially solves for individual estimates of competency by
factoring an agreement (correlation) matrix among informants. The ratio between the first and
second eigenvalues determines whether a single-factor solution exists, which would indicate a
single, shared cultural belief system (Chavez et al., 1995).
As Russell Bernard (2006) summarizes, the theory behind the model has three main
assumptions
1. Informants share a common culture and there is a culturally correct answer to any
question asked of them. The culturally correct answer might be incorrect from an
outsider’s perspective. Any variation found among informants is the result of individual
differences in their knowledge, not the result of being a member of a culture.

48
2. Informants give their answers to test questions independently of one another, meaning no
two respondents were interviewed in one setting.
3. All the questions in a test come from the same cultural domain— i.e., things that can be
listed, such as types of animals, hand tools, or weekend activities. This is why a first
stage data collection was necessary to determine the cultural domain of political
leadership within the Afghan community.
People can be competent in one domain but incompetent in another. Cultural consensus
method must be used for people who are knowledgeable about a particular domain (Bernard,
2006). To use the consensus technique, you simply give a sample of informants a test that asks
them to make judgments about a list of items in a cultural domain. You can use true-false
questions, Likert scale questions, multiple-choice questions, or fill-in-the-blank questions
(Bernard 2006).6
This dissertation’s rationale for the use of the cultural consensus model is based on two
central concepts from cognitive anthropology: First, people organize their cultural beliefs and
values with what are called mental models, also known as cultural models. Second, agreement
and disagreement about these cultural models often have a clear social pattern of variation, as
can be shown by analyses of which beliefs and values are shared across groups of society
(Kempton, Boster, and Hartley, 1995). Anthropologists use models that are shared within a
culture or social group, and thus refer to them as cultural models” (Holland and Quinn, 1987). In
6 See, for example, Romney et al. (1986), Caulkins (2001), de Munck et al. (2002), Furlow (2003), Swora (2003), Harvey and Bird (2004), Jaskyte and Dressler (2004), and Miller et al. (2004) for more technical details about the cultural consensus model.

49
this study, data carry mental models of the individuals interviewed and were widely shared, so it
stands to argue that they are Afghans’ cultural models.
The second rationale for using this approach is to determine the extent to which cultural
models are shared. To establish this, interviews spanned a broad range of social strata, ranging
from rural Pashtuns of the Kandahar province, to middle-ground educated citizens in Kabul, to
religious scholars (Ulema) of the northern provinces of Afghanistan encompassing different
ethnic groups, genders, and age groups. “I use the word ‘belief’ to refer to what people think the
world is like and ‘values’ to refer to their guiding principles of what is moral, desirable, or just.
Either beliefs or values may be incorporated into a cultural model or may stand alone as simple
isolates” (Kempton, Boster, and Hartley, 1995). The knowledge of existing Afghan beliefs is
crucial even for those who are more concerned with motivations and/or actions, because some of
the study’s findings are that these beliefs partially determine how ethnic groups of Afghanistan
are politically distinct, which type of political leaders are more popular among which ethnic
groups, and how certain public policy positions are more important for one ethnic group than
another.
Some readers (both scientists and nonscientists) might say these results are obvious and
trivial. In response to these reactions, I would say: Every person believes his or her own models
of the world are correct because this belief is continually reinforced by interacting with people
who share the same cultural models and use them in the same ways—whether in the lab or at
home.

50
This study is somewhat unusual within political science and public policy research realms in
that it uses methods developed by psychologists and cultural anthropologists for understanding
cognitive concepts in foreign cultures. Even among anthropological studies, it is atypical in
combining personal views of respondents with more formal and quantitative methods in
analyzing cognitive variation within a culture. The following section provides background on
both methods so readers can understand this study’s resulting data and interpretations.
Analysis and Data Collection Strategy
Cultural consensus analysis is carried out in two different stages. The purpose of first-stage
analysis (level-1 analysis) is to determine the overall items that include in the domain of good
political leadership among Afghans. The purpose of second-stage analysis (level-2 analysis) is to
study these items across a wider range of respondents from different strata of the society.
Moreover, open-ended questions are used in the semi structured interviews to produce free
lists, which are useful tools in determining the cultural domain of good leadership among
Afghans. Free listing is a common elicitation technique in the social sciences (Weller and
Romney, 1988). Researchers use free listing to identify items in a cultural domain and calculate
each item’s relative psychological or cultural saliences (i.e., prominence, importance,
familiarities or representativeness). Other researchers use free listing to measure cognitive
characteristics of informants, including their knowledge of a domain and their categorization
patterns.

51
Level-1 Analysis
In the first-stage analysis, semi structured interviews, free listing methods, and text analysis
techniques were employed to analyze answers from respondents. The themes (items) that came
up with the highest frequency in the answer set formed questions for the second level of analysis.
In the second stage, data is generated through fixed-form survey in which a large number of
respondents express their agreement or disagreement with the answers generated from the first
level of analysis. These two methods offer different strengths, and are not always used together
in the same study. The textual analysis of the semi structured interviews yields rich insights into
Afghans’ views and values on what constitutes characteristics of good political leadership, which
are often different from those of political leadership scholars. The cultural variation analysis of
the survey delineates the distribution of these beliefs and values among diverse groups of
population within Afghanistan. The synthesis of these two methods synergistically yields more
insight into Afghan political leadership thinking than would either method if used independently.
Level-2 Analysis
In the second-stage, the fixed-form survey is employed. The survey did not intend to prove or
disapprove that certain characteristics are preferred or disliked by Afghans, which is what one
can expect from a typical national poll, but rather documenting the reasoning behind it. National
surveys are like photos, giving a broad overview of public opinion. Anthropological research
corresponds to exploration on the ground, charting details of the features glimpsed by the
national surveys and looking for causal explanations. The sampling strategy of this study differed
from that of a survey research as my goals of the study did so. Whereas in a survey research you

52
need to draw a large sample to establish exact percentage of public opinion, in my sampling
strategy it was more important that I have very exhaustive stratification across different segments
of Afghan population who have divergent interest and personal attitudes toward political
leadership. These groups included all cross-sections and every combination of ethnicity with
gender, age, rural/urban settlement, level of income, level of education, and level of participation
in public affairs, etc. (more details will be presented in the next chapter).
On top of these variations, samples were distributed across 18 geographic locations
(provinces) and extracted responses from 28 different provinces.7 These geographic locations
were chosen because they bracket the range of variation in social, cultural and political views
across Afghanistan. Despite the fact that the sampling strategy and the analytical model did not
require probability sampling, the sample selection was randomized as much as security, logistics,
and cost constrains permitted. Having diverse views from every social stratum of the society was
more critical for the study’s research than responses drawn randomly from the whole country.
The diverse social background corresponds to diverse cultural interests, which illustrate how
individuals construct political leadership beliefs within each cultural segment of the society.
It is also important to acknowledge that the sample selection was biased toward the
population with higher education because resources and time were unavailable to conduct each
interview in person. About 57 percent of survey questionnaires were distributed to sampled
respondents who could read and write. They were asked to fill out the questionnaire and return it
7 Although interviews were conducted in 18 provinces, respondents introduced themselves as being from 28 provinces, which I think happened because there is currently a high level of internal labor migration movements inside Afghanistan because of the unbalanced distribution of security and employment opportunities.

53
back to researcher in Kabul. These constraints introduced a few challenges that were dealt with
at a later stage:
4. They reduced the proportion of uneducated respondents in the sample size to about 10
percent, which, while below a desired level, also presented a positive externality because
the segment of population who are more interested and knowledgeable about political
leadership is most likely the portion of society that is fairly educated. This is also part of
the requirement of the analytical model used in this dissertation (cultural consensus
analysis). Correlation between level of education and selection of “Don’t Know” in the
response set is -0.34 (higher number represented higher level of education), meaning my
assumption about positive effects of educational bias holds to some extent.
5. In some cases respondents did not follow the protocol for the interview and filled the
questionnaire with similar responses (probably filled it together in a group). During data
cleaning 10 observations were dropped because they had similar responses. For the
interviews that I did not administer, I ran an analysis of correlation among respondents
from the same neighborhoods. If the correlation was more than 0.9, I dropped those
responses to make sure the assumptions of the model held (for more details, see
analytical model assumption in this chapter’s “Theoretical Framework and Assumptions”
section).
6. These constraints also allowed the respondents not to answer any part of the
questionnaire that they didn’t like, which in turn introduced higher number of non-
response rate. Interviews that were conducted in person generated fewer numbers of non-
responses because interviewer has more control over the process. This problem was

54
more serious because for some sets of analysis (i.e., factor analysis), as I had to drop all
responses that had more than a 1-percent non-response.
For a complete chart of sampling distribution, see Appendix I.
Level-1 Data Collection
The main purpose of level-1 data collection was to establish the key areas of inquiries for the
level-2 data collection. In this stage, written questions developed in Farsi and Pashtu were
generated and used in semi structured interviews. Specific preliminary discussions were used
before each question so the respondents were encouraged to present as much detail in their
answers as possible. The key for this stage of the study was to exhaust the answer set for every
question in the questionnaire. The informants were given leeway to elaborate or bring up new
themes and/or topics they considered important. Additional probing questions were created on
the spot to pursue topics raised by respondents and paraphrased to verify and correct my
understanding of their answers. In semi structured interviews, probing questions are usually the
key to understand the meaning of unfamiliar or unexpected answers. In this type of interview, the
respondents are considered more informed about the possible sets of answers than in other
structured or semi structured interviews, because they are more knowledgeable on the subject
than the researcher. So, the researcher needs to give respondents as much time as they need and
provide as many additional probing questions as possible to unload most of their information for
further analysis. While conducting semi structured interviews, two assistants helped capture the
information. In those parts of Afghanistan where people were not sensitive to recording their

55
voice, a digital audio record of the interview was produced to increase the efficiency of data
collection.8
The interview generally would follow this pattern:
7. It would start with a broad question, such as, “What constitutes the characteristics of a
good human being?” Then, the interviewer tried to record everything the respondents
mentioned in their own languages. Their answers were first transcribed and analyzed
before they were translated into English to reduce the chances of losing important points
in the process of translation. Several probing questions were used to expand the list of
characteristics respondents listed under “characteristics of a good human being.” The
probing questions normally would continue until the respondent said, “I do not recall
anything more.”
8. Then, that response was immediately followed by: “What are the characteristics of a good
political leader?” Again, the same protocol rules of probing continued. When the list of
characteristics for a good political leader was exhausted, the interviewer would proceed
to the third set.
9. The third question included: “Which Afghan political leaders have these characteristics
that you have listed for me? Could you please name as many leaders as you think have
these characteristics?” Probing questions followed to exhaust the set of names of political
leaders from the respondent.
8 See Bernard (1994) for more details about this type of interviews.

56
10. The next question set was asked: “Where are the leaders you have listed coming from?
What societal or social background, do you think, has produced these good leaders? Can
you please list for me specific structures and/or institutions that produced these leaders?”
The set of questions was repeated various ways to make sure the respondent understood
the main objective of the question. When requesting elaboration from a respondent,
additional time was given to ensure the respondent understood the meaning of each word
used in the question.
11. The next question set was, “What makes a ‘good political leader’ more legitimate? What
do you think increases or decreases the legitimacy of a political leader? Can you please
list for me everything you can think of?
12. Then, the final question: “What do you expect ‘good leaders’ to do, once they are in
power?” Additional requests for elaborations were made to confirm that respondents
understood the main purpose of the question and in an attempt to get into the policies that
were considered a priority for them. But it would not make sense if the interviewer had
used the word “policy” in the questionnaire. There is no exact translation of this word in
local languages; the word has been introduced only recently to the government officials.
So, the question was formed to ask what respondents expected leaders to push for once in
office (nothing about issues they had already discussed).
Sixty people from ten different social strata of Afghanistan were selected for first-stage
interviews. They included 12 Uzbeks, 16 Pashtuns, 16 Hazaras and 16 Tajiks. The sample also
included a fair mix of genders, occupations, ages, education levels, income levels and urban-
rural backgrounds. On average, the sample included six respondents from a province, distributed

57
across ten provinces of Afghanistan. A complete summary of respondent demographics for the
first-stage of the study is presented in Chapter Three. Most academic works in the context of
Afghanistan suggest considerable variation across ethnic and geographic regions of the country.
Ethnic variation is a very important aspect of main research question for this study. Therefore, in
both stages of the study special attention was paid on balanced stratification of samples along
those two lines. For example, in the second stage, the number of Pashtuns who declined to take
the survey was more than what was needed for proportional views of the Pashtuns in the study.
Additional respondents were oversampled in southern provinces of Afghanistan to make sure the
findings are representative of the Pashtuns views.
Level-2 Data Collection
While a semi-structured interview allows the respondent to express his or her understanding
of important characteristics in a good political leader, the fixed-form surveys allow a researcher
to study how those individual understandings of characteristics are distributed across larger
groups of population. When a respondent mentions a particular characteristic, the researcher
cannot conclude whether other people share the same views based on the outcome of semi
structured interview alone. Conducting a second-stage fixed form survey helps to establish the
external validity of findings from the first stage.
To construct the fixed-form survey, views (characteristics listed by the respondents) from the
first stage were analyzed. Because statements were recorded in the words of the respondents and
transcribed in the same wording, they needed further textual analysis to standardize these
answers across all responses. This was needed to ensure their views were understandable when

58
presented in the second stage, and completely outside of the context of first-stage interviews
(respondents of the fixed-form survey were different from those of the semi-structured
interviews). A threshold of 5 percent was established, meaning if 5 percent of the respondents
mentioned the same characteristics in their responses, then they would be included in the second-
stage fixed-form survey. The value of this threshold is a call by the researcher because they
differ from one research to another depending on the capability and personality of respondents.
If respondents were highly competent in the cultural domain of the question, then the frequency
of similarity of themes would go very high, which means a higher threshold is acceptable. On the
other hand, if they are not elaborative enough in their answers or not competent in the culture,
then lower frequency of themes will appear. In those cases the researcher might decide to accept
a lower threshold to generate enough questions for the second stage survey. Since the concept of
political leadership was not a topic of everyday discussion in most non-elite communities of
Afghanistan, the frequency of common characteristics generated in the first stage were not as
high as expected, which is why the threshold was dropped to 5 percent.
Frequently, repeated characteristics extracted from the first stage took the form of statements
so respondents of the survey could indicate their level of agreement/disagreement with each
statement. The survey was administered on a total of 586 respondents from 18 different
provinces of Afghanistan. In most cases, the researcher, with the help from two undergraduate
students from Kabul University who volunteered to help in efforts to learn the research method,
conducted the survey. Because of the large sample size in the second stage, it took a total of
about 11 months to complete both stages of the study across 18 different province of
Afghanistan. In some cases where cultural, security, and/or resource constraints prohibited direct

59
interviews with respondents,9 the questionnaires were distributed to the respondents (according
to the sampling strategy) through local contacts with instructions to fill out the form and return it
to the researcher. The final number of observations in the study’s cleaned dataset was therefore
reduced to 576 samples. A more-detailed review of the sampling strategy and data cleaning
process is discussed in Chapter Three.
How to read the analysis
The data from first stage semi structured interviews were entered into Excel sheets and were
categorized by each question to list specific standardized words (in most cases, adjectives)
repeated in each respondent’s answers to different questions. A collection of all the
characteristics from different respondents generated a master list, which was used as the head
row defining all the columns. The names or IDs for each respondent were used as the entries in
the first column defining each row.10 Scoring 1 in each cell if the corresponding respondent
mentioned the item in his or her responses and 0 otherwise produced a two-mode matrix. The
matrix was then used to generate a scree plot11 (Figure 2.1) by adding down different columns,
which delivered the frequency of items mentioned by the informants. A visible knee of the scree
plot (defined by an arrow in Figure 2.1) was used to decide on the number of most-important
characteristics to be further studied in the second-stage fixed-form survey.
9 In the insecure parts of Afghanistan where insurgents have strong influence, local people are quick distinguished from any outsiders, and those who were not from the area could easily be arrested on suspicion of spying. 10 The actual names and IDs of respondents are protected in this study. 11 Scree plot is a term used by STATA software for depiction of frequency (figure 1 shows an example)

60
Figure 2.1: Scree plot of words frequently repeated by respondents
The data from the survey was entered into an Excel sheet and checked for systematic
measurement error and consistency in spelling. The data was then turned into a two-mode
matrix12 by scoring each respondent’s measure of agreement or disagreement with each question.
The cells corresponding to each characteristics of leadership (column head) and each respondent
(row head) contained 0 or 1, and the matrices were fed into UCINET for systematic analysis of
12 A two-mode matrix means a matrix in which head rows have different information from head columns.

61
cultural consensus. While two-dimensional matrices are the direct input for UCINET, for some
analysis one-dimensional matrices were also produced.13 One-dimensional matrices are used for
multi-dimensional scaling and cluster analysis where variation and similarity of different groups
of Afghans over each characteristic (hence one dimension) of leadership are calculated and
presented in visual graphics.14 Other aspects of analysis follow standard quantitative and
qualitative methods that are commonly used in the world of social science research. Table 2.1
offers an example of how findings from first-stage interviews were used to construct survey
questions in the second stage. For example, if one of the participants of the semi structured
interviews in response to the question, “What are the most important characteristics of a good
political leader” listed the following:
Table 2.1: Example of elicitation data
The Exact Wording Expressed in Local Language
The Exact Word‐by‐Word Translation in English
Standardized Form of The Response for the Purpose of Analysis
1 قدرت حل و فصل را داشته باشد Must have the resolving power Has resolving power 2 تمام مردم وطن از آن پيروی کند The whole country is following him Has followers 3 شايسه رھبری را داشته باشد Deserves leadership Deserves leadership 4 بقه کار در وطنسا Has work experience in the country Has work experience 5 احترام به موضوعات سالمی Respects Islamic issues Respects Islam 6 خدمت گار Servant Is servant 7 پيروی از اسالم Following Islam Is following Islam 8 تحصيل Education Is educated 9 سياست عالی Good policies Has good policies 10 شناخت بيرون مرزی Understanding of foreign Knows foreign issues 11 عادل Just Is Just 12 تطبيق قانون Enforcing the law Enforces the law
The standardized form of the response was compared against responses from other
participants using the themes (phrases) used in each response as my main point of comparison.
13 A one-dimensional matrix means both head rows and head columns have the same information. 14 See, for example, Bernard (2006) for more technical details about matrices.

62
Then, the similarities of adjectives were searched to create a master list of different adjectives
that were used for the purpose of describing characteristics. In the master list, I searched for the
number of times each adjective was repeated. I sorted them based on their frequency of repetition
to generate a scree plot to determine the number of adjectives that are significantly more
repeated than the rest in the master list.
Scree plots are usually a good tool to determine the threshold above which the highly
repeated themes in the mast list should be taken. As indicated in the graph by the red arrow, the
knee of the graph is a good threshold below which the repetition does not have adequate
frequency change, and could be ignored.
Out of the 60 respondents, 39 of them mention the phrase, “Is Educated,” as one of the
characteristics of a good political leader. Thus, in the second stage of the study, one of the
questions in the fixed-form survey would be:
A good political leader should:
Be highly educated
Strongly Disagree 0 1 2 3 4 5 Strongly Agree
In the same way, characteristics that were most frequently repeated were presented in the
form of agree-disagreement statements in the second stage. Appendix II presents a complete set
of survey questions that were presented to fixed-form survey participants.
A very similar analysis was used for the question “What do you expect the leaders to do once
they are in power?” Similar questions, such as “What social structures have produced these

63
leaders?” were used for cross-checking of the results. The highly repeated responses from the
semi structured interviews were presented in the form of paired-comparison. Respondents were
asked to compare each pair of structures that were frequently mentioned in the first stage. For
example, if three social structures, such as “religious schools,” “famous families,” and/or “tribal
communities,” were most frequently mentioned, I constructed the following questions for use in
the second stage:
Following are some pairs of institutions that according to some Afghans have produced
Afghan leaders. For each pair of the institution below, please pick the one that you think
is more important than the other one (put a tick mark next to the one that you think is
more important).
1 Religious Schools Famous Families 1
2 Religious Schools Tribal Communities 2
3 Tribal Communities Famous Families 3
Answers were analyzed for variation of choices across different segments of society,
particularly different ethnic groups, to detect similarities that are significant. For the question,
“What increases legitimacy of a good leader,” a very similar approach was used to detect
variation of sources of legitimacy among different ethnic groups. For example, if the three most
frequently mentioned phrases in the first stage were “is elected in the election,” “comes from a
Jihadi background,” or “is a Pashtun from Kandahar,” respondents were asked the following
question:

64
The following are pairs of factors that according to other Afghans increase legitimacy of
political leaders. For each pair of factors, please pick the one that you think is more
important than the other one (put a tick mark next to the one that you think is more
important).
1 Is elected in the election Comes from Jihadi background 1
2 Is elected in the election Is a Pashtun from Kandahar 2
3 Is a Pashtun from Kandahar Comes from Jihadi background 3
Additional questions such as fill-in-the-blank, multiple-choice answers, and free listing were
also used to serve as control question.
It is also important to note that data analysis
of the second stage included a variety of
univariate, bivariate and multivariate analysis
(i.e., correspondence analysis, cultural consensus
analysis, factor analysis, etc.) the results of
which will be presented in different chapters as
they relate to the main argument of each chapter.
Figure 2.2a: Divergence of views between Pashtuns and non-Pashtuns over legitimacy of political
leadership.

65
The charts in Figure 2.2a (above) &
2.2b (below) present significant
differences across different segments of
the society, particularly Pashtuns and
non-Pashtuns over sources of legitimacy
of political leaders.
Figure 2.2b: Divergence of views between Pashtuns and non-Pashtuns over legitimacy of political
leadership.
Factor Analysis
Chapter Three of this research uses a statistical method called factor analysis, which is one of
the mathematical methods developed for multivariate analysis of data. Although, factor analysis
is widely used by psychologist and social scientists, it is useful to say a few word about its most
fundamental principles and the rationale for using it in this research.
Factor analysis consists of a number of statistical techniques that aim to simplify a complex
set of data. In the social sciences, factor analysis is usually applied to correlations between
variables (Kline, 1994). As Royce (1963) has demonstrated, while there may have been different
definitions of a factor, there is a common underlying trend to them all. Essentially, a factor is a
dimension or construct that is a condensed statement of the relationships between a set of
variables. More precisely, Royce (1963) states that a factor is a construct operationally defined
by its factor loadings. Factor loadings are the correlations of a variable with the factor, which

66
are represented by an arrow and a number between 0 and 1 (see Figure 2.3). The arrow shows
the dimension of correlation or the amount of variance in a variable (item) explained by an
underlying construct (factor).
While factors can be used to simplify correlation matrices, an important question still
remains: what can be done with factors and how can they be useful in this research? To answer
this question, I need to say a few words about the form of factor analysis that this research
primarily uses, called explanatory factor analysis. The goal in explanatory factor analysis is to
explore the data to discover the main constructs or dimensions. It was for this purpose that factor
analysis was originally developed by Spearman (1904) in the area of human abilities. Spearman
attempted to answer the question of why human abilities are always positively correlated. In this
study, I am asking a very similar question perception of Afghans on political leadership: What
are the underlying constructs, or factors, that determine good political leadership for the people
of Afghanistan?
In order to understand the terminologies used in this method and present some relevant
examples from this study, look at the following factor analysis path diagram (Figure 2.3). In it,
every arrow shows the direction and size of correlation between a variable (popularly called an
“item” in psychology and social sciences) with the main underlying constructs (factors). If we
observe that several variables correlate with each other, it is believed that there is an underlying
construct (factor) that causes these partial correlations between variables; exactly how Spearman
asked the question of why human abilities are correlated positively.

67
There is also a portion of variance that is not accounted for by the respective factors, which
in this case are retained in an error term defined as “e”. In this case, if we are able to determine
the size of each arrow, then we can technically say that var1, var2, and var3 correlate with each
other because there is an underlying construct (factor1) that exists there. Then, the researcher has
to use his or her knowledge and secondary source data and make sense of how these three
variables could relate to each other. By systematic reasoning, he or she can define the factor that
is behind the three variables. The same analogy goes with factor2 and factor3. In addition,
modern statistical methods allow one to extract factors under two different conditions: A) when
factors correlate with each other, in which case you show correlations of factors with two-sided
arrows (see Figure 2.3); and B) when factors are forced to remain uncorrelated with each other,
which by consequence will change the size and scope of covariance between each variables and
its respective factor and error term.
Figure 2.3: A diagram of
relationship between proxy
measures (items) and
underlying constructs
(factors)
When a respondent was
asked what defines a good
political leader, I was looking
for the main variables that

68
their answers might define. When I discovered enough of them, in the second-stage fixed-form
survey, I asked other Afghans to express their degree of agreement or disagreement with the
statement that said a good political leader will have or do X (where X is one of the main
variables). The data generated in this manner allowed me to look for correlation between all of
those variables (items) and explore the existence of underlying constructs (factors) in good
political leadership. For example, in one set of analysis, I found that such characteristics as just,
human rights, honesty, etc., were highly correlated and load on the same factor. Therefore, it is
safe to conclude that there is an underlying construct in Afghans’ cognitive thinking about
political leadership that defines a just leader as a good leader. The same set of analysis was used
for questions that had to with what good leaders should do. Finally, this method was used with a
different set of data that was presented to Afghans a bit differently: Instead of asking to evaluate
the characteristics of a good leader, I gave respondents a set of political leaders’ names and ask
them to express their agreement or disagreement with the assertion that they were good political
leaders. The logical reasoning behind this change of question was to see if the underlying factors
change when the identity and personality of actual leaders were evaluated, as was the case in the
findings from the first stage.
The following chapters present how the method was applied to the data. Please refer to “An
Easy Guide to Factor Analysis” by Paul Kline’s (1994) for mathematical details of systematic
factor analysis.

69
CH – 3: DEMOGRAPHICS
In this section, the study provides background information on the informants from the semi
structured interviews and survey respondents in the second stage. For both informant groups, the
study provides summary statistics to offer a detailed picture of the sample size and its
distribution across different strata. For fixed-form survey respondents, additional statistics and
reasoning behind the sampling strategy are presented. Demographic information in the survey is
detailed to analyze variations of views across as many social strata as possible. The main logic
behind stratification was to detect variations across most critical layers of social structures, but as
seen in the chapters ahead, the most important strata that exhibited significant variations were
ethnicity, gender, and geography.
Table 3.1 provides a complete list of informants and their background information for the
semi structured interviews.
Table 3.1: Descriptions of 60 respondents
ID Education Occupation Province Rural/Urban Ethnicity Below 25
Sex Influential
INF‐1 BA Sr. Civil Servant Kabul U Hazara M Y INF‐2 Some Schooling Shopkeeper Kabul U Hazara M INF‐3 BA Female School Principal Kabul U Hazara F Y INF‐4 Grade 12 Unemployed Kabul U Hazara F INF‐5 Grade 12 Shopkeeper Kabul U Uzbek M INF‐6 Uneducated Soldier Kabul U Uzbek M INF‐7 BA Director of Youth Union Kabul U Hazara Y M Y INF‐8 Student Student Kabul U Hazara Y M INF‐9 BA Human Rights Activist Kabul U Hazara Y F Y INF‐10 Grade 12 Teacher Kabul U Hazara Y F Y INF‐11 Student Student Kabul U Uzbek Y M INF‐12 Grade 12 Carpet Seller Kabul U Uzbek Y M INF‐13 Grade 12 Street Representative Parwan R Tajik M Y INF‐14 Grade 12 Farmer Parwan R Tajik M INF‐15 Uneducated Housewife Parwan R Tajik F

70
INF‐16 Diploma Teacher Parwan R Tajik Y M Y INF‐17 Student Student Parwan R Tajik Y M INF‐18 Masters Midwife Parwan R Tajik Y F Y INF‐19 Diploma Teacher Parwan R Tajik Y F Y INF‐20 Religious School Mosque Leader Baghlan U Tajik M Y INF‐21 BA Civil Society Work Baghlan U Tajik M Y INF‐22 Diploma Teacher Baghlan U Tajik F Y INF‐23 Some Schooling Housewife Baghlan U Tajik F INF‐24 Grade 12 Vocational School Manager Baghlan R Tajik F Y INF‐25 BA Institute Manager Baghlan U Tajik Y M Y INF‐26 Grade 12 Jr. Civil Servant Baghlan U Tajik Y M Y INF‐27 Diploma Teacher Baghlan U Tajik Y F Y INF‐28 Grade 12 Housewife Baghlan U Tajik Y F INF‐29 Grade 12 Housewife Baghlan U Uzbek Y F INF‐30 Grade 12 Unemployed Baghlan U Uzbek Y M INF‐31 Uneducated Shopkeeper Balkh U Uzbek M INF‐32 Uneducated Driver Balkh U Uzbek M INF‐33 Diploma Transport Director Balkh U Uzbek Y M Y INF‐34 Uneducated Daily Wage Worker Balkh U Uzbek Y M INF‐35 Student Student Faryab U Uzbek Y M INF‐36 BA Jr. Civil Servant Bkhshn. U Uzbek Y M Y INF‐37 Grade 12 Head Master Ghazni R Hazara M Y INF‐38 Grade 12 Teacher Ghazni R Hazara M Y INF‐39 Grade 12 Teacher Ghazni R Hazara F Y INF‐40 Some Schooling Housewife Ghazni R Hazara F INF‐41 Grade 12 Religious Cleric Ghazni R Hazara Y M Y INF‐42 Some Schooling Shopkeeper Ghazni R Hazara Y M INF‐43 Grade 12 Head Master Ghazni R Hazara Y F Y INF‐44 Some Schooling Student Ghazni R Hazara Y F INF‐45 BA Retired Military Officer Laghman U Pashtun M Y INF‐46 Some Schooling Daily Wage Worker Laghman U Pashtun M INF‐47 Grade 12 Teacher Laghman U Pashtun F Y INF‐48 Some Schooling Teacher Laghman U Pashtun F Y INF‐49 Religious School Farmer Laghman R Pashtun M INF‐50 Uneducated Housewife Laghman R Pashtun F INF‐51 Uneducated Farmer Laghman U Pashtun Y M INF‐52 Grade 12 Student Laghman U Pashtun Y M INF‐53 Grade 12 Teacher Laghman U Pashtun Y F Y INF‐54 Student Student Laghman R Pashtun Y M INF‐55 Grade 12 Housewife Laghman R Pashtun Y F INF‐56 Some Schooling Farmer Kunar R Pashtun M INF‐57 Uneducated Housewife Kunar R Pashtun F INF‐58 Some Schooling Student Kunar U Pashtun Y F INF‐59 BA Jr. Civil Servant Kunar R Pashtun Y M Y INF‐60 Grade 12 Student Kunar R Pashtun Y F
Complete table of demographics for all 576 participants of the fixed-form survey is presented
in Appendix–I. Table 3.2 presents the sample stratification for the survey:

71
Table 3.2: Distribution of second stage samples within social strata
Key Strata Categories Pashtuns Tajiks Hazaras Uzbeks Others Total Ratio
Men 1 185 121 48 22 14 390 .69 Women 2 39 80 46 10 3 178 .31
Rural 2 90 72 67 17 7 253 .45 Urban 1 134 129 27 15 10 315 .55
High income 3 24 24 10 0 3 61 .11 Middle income 2 90 76 28 17 5 216 .38 Low income 1 110 101 56 15 9 291 .51
Old generation 5 15 14 2 3 1 35 .06 Older mid‐generation 4 15 25 6 6 0 52 .09 Younger mid‐ generation 3 32 44 14 4 5 99 .17 Older new‐generation 2 76 70 42 16 7 211 .37 Younger new‐generation 1 86 48 30 3 4 171 .30
High education 4 7 12 7 1 3 30 .05 Mid education 3 99 100 37 21 6 263 .46 Low education 2 98 77 30 9 8 222 .39 Uneducated 1 20 12 20 1 0 53 .09
Participant 1 35 25 16 6 3 85 .15 Attentive 2 89 77 26 10 5 207 .36 None participant 3 100 99 52 16 9 276 .49
Ethnic Composition .39 .35 .17 .06 .03
Stratification Strategy
For structured interviews, stratification was simply developed on the basis of current
literature about major cultural and political fault lines in Afghanistan. The most important ones
included ethnicity, geography, and gender, as well as rural-urban divides, as emphasized by
Afghanistan observers such as Thomas Barfield (2010). Given that more than 60 percent of the
Afghan population is younger than 25, I also decided to divide my key informants into two
groups (25 and older, and younger than 25) to see if there were any differences in the opinion of
the younger generation.
In the second-stage fixed-form survey, I stratified my sampling frame based on the findings
from the semi structure interview data. I also added the suggested important stratification by the
existing political leadership literature as well as political and cultural history of Afghanistan. For

72
the purpose of this study, a provincial district was considered rural if it did not have a
functioning municipality, otherwise it was considered an urban area. Villages were always
considered rural, but the actual dividing line between urban and rural is subject to dispute
because of the lack of administrative boundaries.
An average monthly income higher than 50,000 Afghani (roughly equal to $1,000) is
considered as high income, 50,000 to 10,000 Afghani as an average Afghan income, and
amounts under 10,000 as low-income groups.
Any respondent with a reported age of 21 and younger was considered as younger new-
generation, 22 to 31 as older new-generation, 32 to 41 as younger mid-generation, 42 to 51 as
older mid-generation, and any person older than 51 was old generation. The age of 21 was
picked as the baseline because it was assumed that he or she was about 7 years old in 2001 when
Afghanistan moved to a new era. Most of these people might not remember much of the
political and economic issues of the Taliban period. From that point on every period of 10-year
were examined to see if generational variation of views exists across different segments of
Afghan population.
Respondents with a master’s or a doctorate degree are grouped as high level of education,
with a bachelor of arts or bachelor of science as moderate level of education, with a diploma or
high school certificate as low level of education and any one with some years of schooling and/or
no schooling at all are grouped as uneducated respondents.
If a respondent worked for the government, and/or any other political institution, he or she
would be grouped as “participant” in the public affairs of the country. If the respondent was not

73
a government or political worker but was observing the political development of the country
closely, then he or she would be considered as “attentive” of the public affairs, otherwise as
“none participant.” This stratification was suggested by the political leadership literature and was
expected to have significant effects on variation of views and attitudes toward types of political
leadership characteristics.15
Sampling Strategy
One of the key conditions for the cultural consensus model to produce robust results is to
make sure respondents share cultural knowledge, or in another word, their cultural competency is
above average of 0.5. That means if a simple question, such as, “What are the most common
Afghan foods?” was asked from a group of respondents, correlation between their answers would
be at least 0.5. (Romney, 1986). If average cultural competency among the respondents is
between 0.7 and 0.8, the model produces robust results at 95 percent confidence interval with as
few as 4 samples per strata. If increased to 27 samples, 99.9 percent confidence interval is
maintained (Romney, 1986). For the study to reliably distinguish cultural competence among
informants, it is best to have about 40 questions in the questionnaire (Bernard, 2006). In this
study, more than 40 questions were included for each sets of analysis to ensure the results were
reliable. The model produces robust results even with as few as 4 sample points because the bulk
of variation comes from the number of questions and not the number of samples, which is
15 Robert Putnam’s the Comparative Study of Political Elites.

74
another unique property of cultural consensus model (this would also make the mode uniquely
cost effectiveness method of study).16
My sampling strategy began with the requirement of maintaining at least 4 sample points per
strata to allow comparisons across every cell (see Table 3.2). Although finding the adequate
number of samples for some sells proved out of budget for this study, I still worked toward
maintaining a minimum number of 19 x 5 x 4 = 380 samples to conduct this study, which means
19 social strata by 5 ethnic groups by 4 samples (see Table 3.2 for more details). Given the
number of questions in the questionnaire, as well as sensitivity of the subject to an average
person in Afghanistan, a relatively higher rate of nonresponse was expected. Therefore, I boosted
my sample size by about 25 percent. About 470 questionnaires were printed and distributed to
convenient randomly selected respondents from within each selected strata to take the survey.
As I expected the rate of nonresponse was high but not across all regions of Afghanistan. The
highest rate of nonresponse was experienced in the southern and eastern parts of the country.
Given the level of influence from insurgents in these regions, and the long period of war in these
regions, people were very suspicious of my research questions. In some cases, they thought it
was a study for the United States or Afghan intelligence institutions rather than an academic
research. Some respondents did not want to take the chance and comment on a politically
provocative question because it could affect their security. My survey protocol required
voluntary participation, and many respondents decided not to take it.
16 A complete review of sample options is presented by Romney (1986), which could be used as the basis of sample calculation.

75
As a consequence, the number of responses from the Pashtun population dropped to a level
that was unacceptable for the main thesis of this dissertation. Pashtuns are one of the main ethnic
groups of Afghanistan, so it was important to ensure their participation was proportional to their
population in Afghanistan. However, the proportional statistics of ethnic groups are not very
credible in Afghanistan. There are commonly accepted ratios that are frequently used by
government and international organizations, but accuracy of those figures is not rigorously
verified. I needed at least 37 percent to 40 percent Pashtun participants, 30 percent to 35 percent
Tajik, 11 percent to 15 percent Hazara, 6 percent to 9 percent Uzbek, and about 2 percent to 3
percent other ethnic groups to abide by the commonly accepted ratios of ethnic groups in
Afghanistan.17 A very high rate of nonresponse from the Pashtun population of Afghanistan
could have damaged external validity of this research, especially because the role of Pashtuns in
Afghanistan’s political leadership, as well as shaping the politics of Afghanistan, has been
significant—much more considerable than other ethnic groups in the past two centuries. It was
also important because social structure of Pashtun communities (being a tribal society) was
considerably different from those of the non-Pashtun population of Afghanistan. The
characteristics of political leadership were expected to be different for Pashtuns in comparison
with other Afghans based on these ratios.
Therefore, I had a choice to make: drop the observations from other ethnic groups
proportionally to that of the Pashtuns; or oversample the Pashtun population to balance it out.
After consultation with dissertation advisers, we decided to oversample both the southern and
17 Average of ethnic ration accepted by the Central Statistics Office of Afghanistan, World Bank, United Nations, and United States Agency for International Development, were taken for this purpose.

76
eastern regions of Afghanistan for an additional 110 samples to ensure proportional participation
of Pashtun population. In Table 4, the column, “After over sampling,” shows distribution of
samples after 110 additional samples were added.
Finally, for the samples to be proportional to geographical distribution of population, I also
created a statistical map of Afghanistan’s population across five different regions of the country.
I used the latest population data from Afghanistan’s Central Statistics Office (CSO) to conduct
these calculations, and used the common perception of regional classification as they are grouped
by different Afghan and international organizations.
Table 3.3 shows the distribution of samples in proportion to the geographical distribution of
population:

77
Table 3.3: Distribution of samples
Provinces
Population Distribution Sample Distribution
Both Male Female Original Sampling After Oversampling Responses Received
Cen
tral
1 Kabul 3,691.40 1,906.70 1,784.70 100 100 65
2 Kapisa 406.2 205 201.2 6
3 Parwan 610.3 308.7 301.6 10 10 12
4 Panjsher 141.4 72.3 69.1 1
5 Bamyan 411.7 208.7 203 10 10 16
6 Daykundi 424.1 217.8 206.3 10 10 10
5,685,100.00 2,919,200.00 2,765,900.00 130 130 110
East
1 Logar 360.9 183.6 177.3 10 20 15
2 Nangarhar 1,383.90 708.3 675.6 50 50 9
3 Laghman 410.3 210.2 200.1 10 11
4 Paktia 507.8 259.6 248.2 10 20 11
5 Khost 528.9 270.8 258.1 10 10 12
6 Kunar 414.7 212.2 202.5 2
7 Nooristan 136.3 69.5 66.8 ‐
3,742,800.00 1,914,200.00 1,828,600.00 80 110 60
North
1 Baghlan 833.3 427.1 406.2 10 10 11
2 Badakhshan 874.8 445.7 429.1 20 20 37
3 Takhar 901.9 460 441.9 1
4 Kunduz 917.9 467.1 450.8 1
5 Samangan 356.3 182.4 173.9 10 10 6
6 Balkh 1,194.00 610.8 583.2 100 100 134
7 Sar‐e‐Pul 514.1 263.2 250.9 1
8 Jawzjan 494.2 251.5 242.7 10 10 6
6,086,500.00 3,107,800.00 2,978,700.00 150 150 197
West
1 Badghis 456.4 233.3 223.1 ‐
2 Herat 1,710.10 866.3 843.8 ‐
3 Farah 466.3 239.2 227.1 1
4 Ghor 635.7 324.7 311 2
5 Nimroz 151.1 77.3 73.8 ‐
6 Faryab 915.8 467.4 448.4 10 10 21
4,335,400.00 2,208,200.00 2,127,200.00 10 10 24
South
1 Ghazni 1,130.10 577.5 552.6 20 30 46
2 Urozgan 322.6 166.1 156.5 10 10 3
3 Wardak 549.2 280.3 268.9 10 20 15
4 Zabul 279.8 143.5 136.3 ‐
5 Kandahar 1,103.40 565.9 537.5 50 100 100
6 Helmand 850.2 436.5 413.7 10 20 13
7 Paktika 400.5 205.5 195 ‐
4,635,800.00 2,375,300.00 2,260,500.00 100 180 177
Given this, I distributed 470 samples across five different regions proportional to the size of
population in each region (column named “Original Sampling” shows in detail). After
oversampling the southern and eastern provinces for 110 additional samples, the total number of
samples reached 580.

78
Within each region, provinces for study were chosen based on my financial, security and
logistical constraints. I wanted to make sure that the study covered every region in which
patterns of political leadership might be distributed differently. The Herat province in western
Afghanistan was one of the key provinces that I was unable to sample for this study. I could not
find the local assistance in Herat for distributing questionnaires and returning the completed
ones. Logistically, Herat province is far from Kabul, and I could not afford the time and
resources to travel to the province. However, given the social structure of Herat, it was not very
problematic to assume that the patterns of political leadership choices there would be similar to
those of Balkh or Kandahar.
Furthermore, I intentionally allowed respondents to register the province they belonged to
according to their own choice. That means, instead of me registering them as respondents from
the province in which they were sampled, I allowed them to define their provinces where they
think they belong. This rationale behind this decision was based on the dislocation of populations
in Afghanistan, which has been a major problem since the Russian invasion of Afghanistan and
the return of refugees post-2001. Even in the past 12 years, a large number of Afghans have
moved from one province to another in search of employment and security. I wanted to make
sure that the temporary dislocation of populations for security or economic reasons did not
distort the geographical distribution of views representing a person’s actual province instead of
their interim environment. So, the last column (“Responses Received”) in Table 3.3 shows the
actual geographic distribution of samples after the survey was administered and the answers
were recorded.

79
I lost some pages of two completed questionnaires during the transportation of files to Kabul,
so both observations were dropped from the study. I also detected higher rate of correlation
between answers of ten female respondents from one province, which indicated coordination of
work while responding to the questionnaire. Nine of these observations were dropped to comply
with the assumptions of the model. Therefore, the final number of samples (in the far right
column of Table 3.3) is 12, which is fewer than that of the actual survey questionnaires
distributed to provinces.
Table 3.4 shows proportional computation and distribution of samples and population across
all regions of Afghanistan:

80
Table 3.4: Proportional distribution of samples vs. geographic distribution of population
Cen
tral
Proportion of region’s population according to CSO 23%
Proportion of sample originally assigned to this region 28%
Proportion of samples in the dataset 19%
Proportion of samples after over sampling 22%
Relative rate of over or under sampling in this region 1% Under
East
Proportion of region’s population according to CSO 15%
Proportion of sample originally assigned to this region 17%
Proportion of samples in the dataset 11%
Proportion of samples after over sampling 19%
Relative rate of over or under sampling in this region 4% Over
North
Proportion of region’s population according to CSO 25%
Proportion of sample originally assigned to this region 32%
Proportion of samples in the dataset 35%
Proportion of samples after over sampling 26%
Relative rate of over or under sampling in this region 1% Over
West
Proportion of region’s population according to CSO 18%
Proportion of sample originally assigned to this region 2%
Proportion of samples in the dataset 4%
Proportion of samples after over sampling 2%
Relative rate of over or under sampling in this region 16% Under
South
Proportion of region’s population according to CSO 19%
Proportion of sample originally assigned to this region 21%
Proportion of samples in the dataset 31%
Proportion of samples after over sampling 31%
Relative rate of over or under sampling in this region 12% Over
It is important to note that the highlighted figures representing actual proportion of response
of each region do not correspond to the original samples sizes and/or to the proportion of
regional population weight, mainly because in many cases respondents identified themselves
from another province. For example, 100 samples were allocated to Kabul City, but only 65 of
them identified themselves as being from Kabul (see Table 3.3).
Coding of strata and distribution of samples under each code are depicted in Tables 3.5 and
3.6:

81
Table 3.5: Level of measurement codes at each stratum
Strata 1 2 3 4 5
Age 21 and younger 22‐31 32‐41 42‐51 Older than 51Education Uneducated & Some Schooling 12G & Diploma B.A. & B.S. M.A. & Ph.D. Regions Central East North West South R/U Urban RuralGender Men WomenEthnicity Pashtuns Tajiks Hazaras Uzbeks Other Income Below 10K 10K ‐ 50K Above 50KElites None Participants Attentive ParticipantsInternet Users Yes No No Response
Table 3.6: Distribution of samples across strata and codes
Categories Age Education Regions R/U Gender Ethnicity Income Elite Internet
1 30% 9% 19% 55% 69% 39% 51% 49% 60% 2 37% 39% 11% 45% 31% 35% 38% 36% 32% 3 17% 46% 35% 17% 11% 15% 8% 4 9% 5% 4% 6%5 6% 31% 3%

82
CH – 4: DEFINITION OF LEADERSHIP
Generally, leadership is defined as the art of motivating people to act toward achieving a
common goal. However, different societies and cultures define the phenomenon in various ways.
Language, as a symbol of a culture, allows us to examine how different cultures refer to the
concept of leadership through their own cultural lenses. This research shows that the cognitive
definition of leadership is influenced by the word available in the local language for the concept
of such a term. For example, as part of literature review discussed earlier in the study, Japanese
does not have a word for leadership (Edinger, 1990). In Arabic, for instance, the word for
leadership is “zaeem,” which basically means “representative” or “someone who is responsible
for something.” In Pakistan, they use the word “qaeed,” which means “someone who is seated.”
In Pashtu, the word “mesher,” which means “elder” or “someone who is older than others” is
used. In Farsi (the language used in Iran, Tajikistan, and Afghanistan), the word used for leader
is “rahbar,” which is basically two words—“raah,” meaning the “way” or “the path,” and “bar,”
meaning “someone who takes you, walks you through the path.’ It could also mean “someone
who guides you or finds the right direction for you.” Some other countries near Afghanistan use
the word, “raeece,” meaning “the elder,” when referring to their heads of states. In some
religious contexts, the word “mawla” is used, which means “respectable,” “the head,” or “the
owner.” In some contexts, other words are used, such as “sahib” or “mowlana,” which both
mean “the owner.” In most radical Islamic contexts, the word “khalifa” (or “caliph” in English)

83
is used, which simply means “someone who has replaced the prophet.” The word “khilafat,” or
caliphate, basically refers to the concept of khalifa or “the replacement.”
Given all of the variety of words and constructs used in different languages in referring to the
concept of leadership, I decided to test this in the context of Afghanistan to see if there are
significant differences between ethnic groups when it comes to the choice of words. I was
curious because Pashtu and Farsi speakers use similar words in daily conversations. So, I wanted
to see if different ethnic groups have different cognitive definition for the concept of political
leadership given the cultural differences that they might have.
I asked several open ended questions, free listing questions, and fill-in-the-bank type of
questions to explore the domain of words/concepts used by Afghans while referring to a political
leader (see Appendix III). I was particularly interested to see if there is any relationship between
the literal meaning of the words chosen by different ethnic groups and the overall consensus over
who is a leader. I was also interested to see if different groups of population have different
consensus over the definition of leadership and/or a leader.
In response to questions like “What does the word ‘leader’ mean to you if you say it in one
phrase; or what comes to your mind when you hear the word leader?” a total of 568 respondents
responded, and the text of their answers was analyzed for most frequently words used. The result
of the analysis is depicted in Figure 4.1, together with the list of words in Farsi for better
understanding:

84
Figure 4.1: Frequency of words used for definition of leadership.
This is a national level representation of what words are used when describing definition of
leadership. However, when I separated responses of Pashtuns and looked at their definitions in
comparison with the rest of the ethnic groups (mostly Farsi speaking), I noticed that for Pashtuns
the word “elder” is frequently repeated definition, while for other ethnic groups it is the world
130
116
48 42
34
1714 10
9 8 8 8 66
3 3 2 2 2 2 2 1 1 1 1 1 1 1 1
Guide
Elder
The point person
Leader ( the word means guide)
The one who is steering
The person who guides
Representative
The head
President (means sitting on the top)
The person who leads
The person who gives orders
Manager
Representative, in charge
Exam
ple
First
Leader (Direct use of the English word)
Teacher
Protector
Servant
The powerful
Prophet
Supporter
Imam
(Islam
ic Grand Leader)
Serva nt
Representative (in political system)
Responsible
Advisor
Rescuer
Guardian
What the word leader means to you?
Frequencyنما
رھ
گزر
ب
وايش
پ
بررھ
ندهه کن
اراد
ندهت کن
دايھ
ندهماي
ن
سر
سئي
ر
ندهدھ
ق سو
ندهرما
ف
يرمد
عيمز
گوال
ولا
درلي
تاداس
فظحا
دمخا
مندور
ز
بريام
پ
میحا ماما
ارتگ
دمخ
يلوک
ولئ
مس
ورشا
م
جینا
انھب
نگ

85
“guide”. Table 4.1 shows complete detail of choices between Pashtuns and other ethnic groups,
when responding to the question in Figure 4.1:
Table 4.1: Frequency of words sued for definition of leadership by Pashtuns vs. None Pashtuns.
This is probably because the word that Pashtu language has for leadership is “misher,” which
basically means “elder.” Meanwhile, in Farsi, the word used for leadership is “rahbari,” which
appears as the third choice in Table 4.1. Rahbari is a synonym of “rahnoma,” which is a highly
repeated word by non-Pashtuns in the interview.
In response to a question that a good political leader should not be young (Figure 4.2),
Pashtuns and Uzbeks relatively agreed more than other ethnic groups.
Farsi English Frq Farsi English Frq
رھنما Guide 63 Elderبزرگ 85
The point personپيشوا 39 رھنما Guide 67
رھبر Leader (the word means guide) 35 اداره کننده The one who is steering 9
Elderبزرگ 31 The point personپيشوا 9
اداره کننده The one who is steering 25 رھبر Leader (the word means guide) 7
ھدايت کننده The person who guides 16 رئيس President (means sitting on the top) 6
Representativeنماينده 12 الگو Example 3
The headسر 9 اول First 3
The person who leadsسوق 6 The person who gives ordersفرمانده 3
زعيم Representative (in charge) 6 Leader (Direct use of the English word)ليدر 3
مدير Manager 5 مدير Manager 3
The person who gives ordersفرمانده 5 استاد Teacher 2
رئيس President (means sitting on the top) 3 The person who leadsسوق 2
الگو Example 3 Representativeنماينده 2
حافظ Protector 2 حامی Supporter 1
خادم Servant 2 The headسر 1
زورمند The powerful 2 مسئول Responsible 1
Prophetپيامبر 2 مشاور Advisor 1
امام Imam (Islamic Grand Leader) 1 Rescuerناجی 1
خدمتگار Servant 1 Guardianنگھبان 1
وکيل Representative (in political system) 1 ھدايت کننده The person who guides 1
Definition by PashtunsDefinition by Other Ethnic Groups
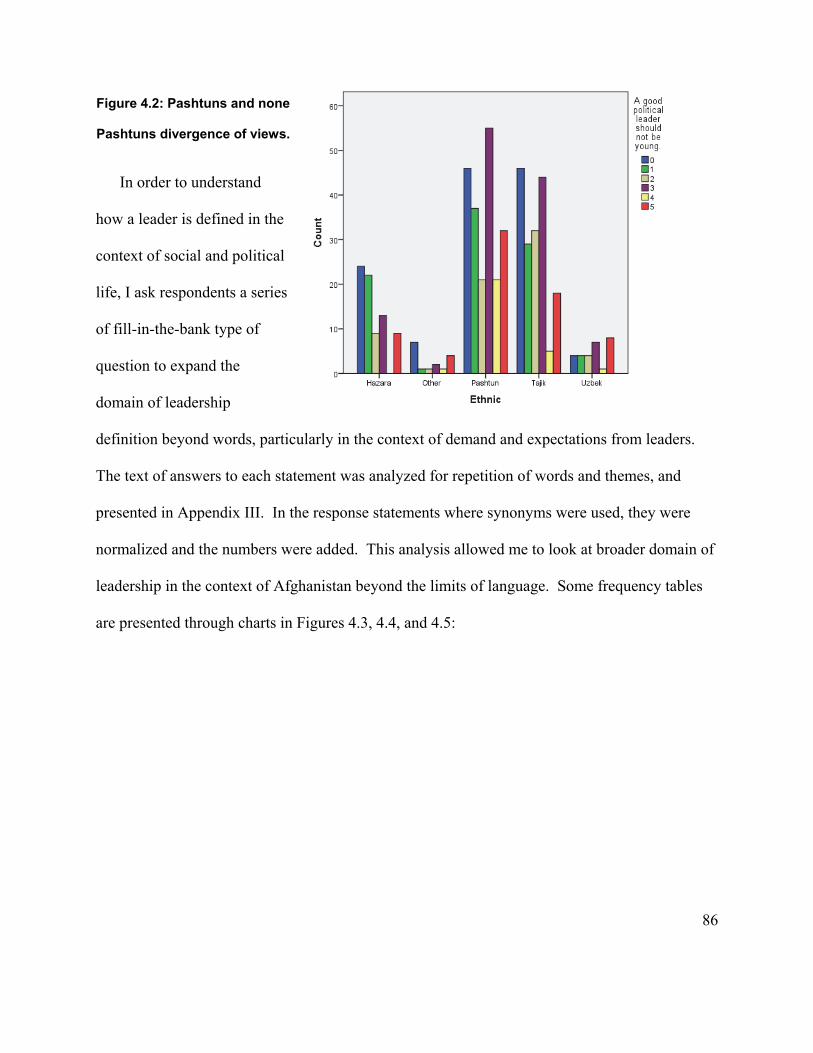
86
Figure 4.2: Pashtuns and none
Pashtuns divergence of views.
In order to understand
how a leader is defined in the
context of social and political
life, I ask respondents a series
of fill-in-the-bank type of
question to expand the
domain of leadership
definition beyond words, particularly in the context of demand and expectations from leaders.
The text of answers to each statement was analyzed for repetition of words and themes, and
presented in Appendix III. In the response statements where synonyms were used, they were
normalized and the numbers were added. This analysis allowed me to look at broader domain of
leadership in the context of Afghanistan beyond the limits of language. Some frequency tables
are presented through charts in Figures 4.3, 4.4, and 4.5:

87
Figure 4.3: Frequency of words in response to what a leader must have before you call him a
good leader.
82
68
5250
40 39
33
29
16 1513 13 12 12 11
9 8 8 8 7 7 6 5 4 4 4 4 4 4 4 3 3
Higher Education
Good morals
Popularity
Political knowledge
Islamic belief
Wisdom
Honesty
Justice
Ideas
Vision
Personality
Virtue
Faith
Love
for country
Experience
Management
Emotions
Capabilities
Commitment
Steering
Leadership
Capacity
Decision
Talent
Trust
Plan
Dominance
Relations
Courage
Power
Citizenship
Deeds
For you, a good political leader must have ____________________.
Frequency

88
Figure 4.4: Frequency of words in response to what a leaders should be bfore one calls him a
good leader.

89
Figure 4.5: Frequency of words used in response to the question of what makes a leader popular.
The charts reveal that the most important attribute of a good political leader for the people of
Afghanistan is being educated, staying in close contact with people, having good morals, being
honest, being just and having Islamic identity. These are probably the most important
characteristics that Afghans want to see in someone before they consider him or her as a good
political leader. Most of the elders, tribal chiefs, and religious clerics become popular when they
present signs of being educated, having good moral (purity), being honest and just before people
refer to them as the community elder. Elders, tribal chiefs, and religious clerics need to live

90
among the people so residents can have access to them at all times so they can be considered as
leaders.
Furthermore, it is important to look for what is not included in the answer set of respondents.
For example, such phrases as protecting people, providing security, defending the country, being
democratic, promoting civil rights, etc., do not show up in their responses, which may have some
policy implication for future leaders and political scientists who want to practice and/or study the
concept of political leadership in Afghanistan.
When asking respondents about the level of education they expect from a political leader
(Figure 4.6), the answers
were heavily skewed
toward higher education,
except for the choice of
highly educated
respondents, who did not
emphasis on education as
important characteristics of
a good political leader.
Figure 4.6: Desired level of education for a good political leader vs. the level of education of
respondents.

91
While this might have been due to the fact that my respondents were mostly educated
Afghans, but additional analyses (presented in chapters 5) indicate that people of Afghanistan
expect their political leaders to be knowledgeable, able to guide followers, and, ultimately, able
to know things that are beyond the understanding of average people. These expectations set the
bar high for the future political leaders of Afghanistan.
During the 1970s and 1980s, school teachers were among the groups systematically targeted
and sometimes killed by anti-government forces. Furthermore, the other group of leaders that
was constantly attacked by the government was religious clerics. These groups were essentially
individuals who were expected by residents to know more than the rest of the community and,
therefore, to lead communities.
Although the type of education that the majority of Afghan villagers believed in during 1970s
and 1980s was religious based, the years of war and immigration to the neighboring countries
changed Afghans’ perspectives toward modern education. Today, demand for education among
Afghans is not comparable to the country’s past history. However, the same demand seems to
exist when it comes to characteristics of good political leadership. This very simple finding of
the study will have major implication not only on public policy priorities of Afghanistan, but also
on new generations of political leaders who want to prepare themselves for future challenges of
the country. It might be very hard for the next generation of leaders to lead Afghanistan unless
they exhibit very strong evidence of knowledge and wisdom.

92
This is probably one of the reasons why radical Islamic parties are heavily investing in
Islamic institutions of higher education in Afghanistan. Otherwise, they will not be able to
maintain their grasp on power as the playing field shifts down the road.

93
CH – 5: CHARACTERISTICS OF LEADERS
In this chapter, I will analyze the data respondents provided in reply to question number 16th
of the questionnaire (see Appendix II). The question required respondents to indicate their
agreement or disagreement with 49 different statements.18 For example, “a good political leader
should have a professional cabinet” was presented to respondents, and they had to pick a number
between 1 and 5 (with 1 meaning total disagreement and 5 as total agreement) to indicate their
feelings on the statement. A total of 49 similar statements were extracted from the data of semi
structured interviews (in the first stage) and presented to each respondent under this question.
Table 5.1 presents summary statistics of scores the 49 statements received from respondents.
18 In the first stage, 60 different respondents were asked to list most important characteristics of a good political leader. Their answers generated a total of 49 characteristics that were repeated frequently (at least 5 percent of the 60 responded mentioned it in their answers). Their answers were normalized and corrected for the use of synonyms. Most of normalizations were made in local languages before they were translated into English. The final master list of characteristics, which contained about 49 important items, was turned into typical statements that were then presented to respondents of the second-stage, fixed-form survey to indicate their agreement or disagreement.

94
Table 5.1: Summary statistics of scores to 49 statements
In addition, the bar chart in Figure 5.1 presents sorted distribution of scores for the 49
statements:
Description of Items Obs Max Min Mean Median Mode NR SD Skewness Kurtosis
Have professional cabinet 532 5 0 4.682 5 5 36 0.836 ‐3.246 11.702Have good morals 529 5 0 4.686 5 5 39 0.826 ‐3.050 9.932Be a woman 519 5 0 2.532 3 3 49 1.757 0.006 ‐1.282Be a man 494 5 0 4.209 5 5 74 1.210 ‐1.710 2.693Not have double passport 512 5 0 3.961 5 5 56 1.672 ‐1.352 0.339Not have family outside country 512 5 0 3.674 5 5 56 1.693 ‐0.943 ‐0.481Not be married to foreigners 520 5 0 3.773 5 5 48 1.750 ‐1.079 ‐0.365Not have business outside the country 521 5 0 3.843 5 5 47 1.634 ‐1.149 ‐0.053Not have a home outside the country 519 5 0 3.844 5 5 49 1.636 ‐1.163 ‐0.027Have high income from legitimate sources 515 5 0 3.769 5 5 53 1.583 ‐1.088 0.013Pray five times in the mosque 527 5 0 3.934 5 5 41 1.522 ‐1.232 0.339Have religious education 517 5 0 3.683 5 5 51 1.644 ‐0.942 ‐0.434Put on a turban 507 5 0 2.341 2 0 61 1.863 0.197 ‐1.403Put on Perahan Tunban 510 5 0 2.720 3 5 58 1.880 ‐0.085 ‐1.430Put on suit with tie 513 5 0 2.949 3 5 55 1.741 ‐0.292 ‐1.176Speak both Pashtu and Dari 519 5 0 4.405 5 5 49 1.274 ‐2.304 4.378Be from Kandahar 514 5 0 1.558 1 0 54 1.779 0.920 ‐0.562Be from a noble family 511 5 0 2.174 1 0 57 1.949 0.354 ‐1.434See all ethnic groups with one eye 518 5 0 2.656 3 5 50 1.837 ‐0.038 ‐1.404Be from south 534 5 0 4.822 5 5 34 0.707 ‐5.018 27.548Be decisive 534 5 0 4.787 5 5 34 0.642 ‐3.745 16.126Have clear political agenda 533 5 0 4.803 5 5 35 0.655 ‐4.322 21.626Be a good manager 535 5 0 4.826 5 5 33 0.622 ‐4.775 27.118Be accepting responsibility 534 5 0 4.848 5 5 34 0.546 ‐4.739 26.956Be honest 535 5 0 4.865 5 5 33 0.513 ‐5.136 32.436Be just 535 5 1 4.871 5 5 33 0.578 ‐5.142 27.513Not lie to people 537 5 0 4.719 5 5 31 0.836 ‐3.549 13.299Be highly educated 534 5 0 4.710 5 5 34 0.682 ‐2.765 8.821Love the country 536 5 0 4.841 5 5 32 0.623 ‐4.816 25.175Fight the foreigners 527 5 0 3.524 4 5 41 1.676 ‐0.728 ‐0.803Not let foreigners in the country 523 5 0 2.430 2 5 45 1.994 0.122 ‐1.566Acknowledges Durand Line 529 5 0 3.208 4 5 39 2.049 ‐0.536 ‐1.432Respect/enforce the law 535 5 0 4.839 5 5 33 0.676 ‐5.411 32.050Believe in God 537 5 0 4.791 5 5 31 0.756 ‐4.203 18.374Be brave 534 5 0 4.801 5 5 34 0.658 ‐4.439 23.163Be impartial 530 5 0 4.455 5 5 38 1.242 ‐2.401 4.861Have good relations with neighboring countries 534 5 0 4.515 5 5 34 1.006 ‐2.400 5.783Be internationally famous 531 5 0 4.245 5 5 37 1.159 ‐1.698 2.595Respect human rights 528 5 0 4.648 5 5 40 0.818 ‐2.738 7.894Respect women's rights 531 5 0 4.565 5 5 37 0.934 ‐2.462 6.001Allow women to work 529 5 0 4.185 5 5 39 1.317 ‐1.703 2.090Be good speaker 525 5 0 4.383 5 5 43 1.070 ‐2.010 4.112Be good looking 518 5 0 3.081 3 5 50 1.640 ‐0.352 ‐1.066Be elected through election 533 5 0 4.698 5 5 35 0.834 ‐3.283 11.475Not discriminate based on ethnicity 532 5 0 4.694 5 5 36 0.956 ‐3.369 10.610Not discriminate based on religion 530 5 0 4.662 5 5 38 1.024 ‐3.339 10.521Not be young 507 5 0 2.085 2 0 61 1.704 0.312 ‐1.093Have same deeds as words 519 5 0 4.663 5 5 49 0.877 ‐3.276 11.431Be selected through Jirga 508 5 0 3.094 4 5 60 1.996 ‐0.448 ‐1.451

95
Figure 5.1: Distribution of scores (1 – 5) to different characteristics of a good political leader.

96
Given a very high level of agreements among respondents on a number of characteristics,
and presence of nonresponse to some items, it is technically not appropriate to conduct
systematic structural analysis of the data, unless we take care of these two issues first. Structural
analysis, such as exploratory factor analysis and correspondence analysis, will allow us to detect
presence of major latent variables that might have determined views of respondents while
scoring these items. In order to prepare the data for further structural analysis, I had to drop all
observations that missed scores for more than three items, and impute the rest of the data. After
dropping 89 observations, demographical statistics of the remaining 479 respondents changed to
the following:
Table 5.2: Demography of 479 respondents by social stratification
Strata Age Education Regions R/U Gender Ethnicity Income Elite Internet
1 0.28 0.8 0.19 0.57 0.71 0.43 0.49 0.48 0.61 2 0.38 0.38 0.11 0.43 0.29 0.34 0.39 0.38 0.33 3 0.19 0.48 0.33 0.14 0.12 0.15 0.7 4 0.9 0.6 0.5 0.65 0.6 0.33 0.3
Note: Please see table below for definition of head row numbers
Table 5.3: Level of measurement codes at each stratum
Strata 1 2 3 4 5
Age 21 & younger 22‐31 32‐41 42‐51 Older than 51Education Uneducated & Some Schooling 12G & Diploma B.A. & B.S. M.A. & Ph.D. Regions Central East North West South R/U Urban RuralGender Men WomenEthnicity Pashtuns Tajiks Hazaras Uzbeks Other Income Below 10K 10K ‐ 50K Above 50KElites None Participants Attentive ParticipantsInternet Users Yes No No Response
In addition, to make sure that the data were satisfactory for conducting factor analysis, I had
to check for Cronbach Alpha and Kaiser-Meyer-Olkin (KMO) coefficients (KMO is a measure

97
of sample adequacy commonly used for test of reliability of items). KMO was 0.838, but it
could be higher if items were not adversely scored:
A good leader should be a woman.
A good leader should put on suit and tie.
A good leader should recognize the Durand Line.
Still, running factor analysis (rotated varimax) without dropping these items produced seven
factors with an eigenvalue of above 1, five of which had an eigenvalue of 2 or higher. However,
when factors were rotated using the promax method, the number of factors produced with
eigenvalue higher than one increased to 21, 15
of which had a value of 2 or higher. The scree
plot of the Eigen values (Figure 5.2) shows
that only two factors have very significant
importance and the other three are somewhat
important.
Figure 5.2: Scree plot of Eigen values for main factors
Table 5.4 presents five factors extracted under each method of rotation. In each column
covariance of items with the factors are printed. If an item has a covariance of more than 0.4
with one of the factors, is highlighted in red to distinguish it as an item that belongs to that
factor. Chapter Two offers further details on how to read factor analysis.
02
46
8E
igen
valu
es
0 10 20 30 40 50Number of Factors
Scree plot of eigenvalues

98
Table 5.4: Items loading on different factors
Items Uncorrelated Factors Correlated Factors
F‐1 F‐2 F‐3 F‐4 F‐5 F‐1 F‐2 F‐3 F‐4 F‐5
Have professional cabinet 0.15 ‐0.16 ‐0.03 0.27 0.06 0.08 ‐0.07 ‐0.15 0.28 0.03Have good morals 0.15 0.09 0.30 0.06 ‐0.02 0.09 0.32 0.04 0.00 ‐0.06Be a women ‐0.19 ‐0.09 ‐0.04 ‐0.08 0.46 ‐0.30 ‐0.04 ‐0.05 ‐0.08 0.51Be a man 0.00 0.07 0.15 0.22 ‐0.18 ‐0.02 0.16 0.01 0.22 ‐0.20Not have double passport 0.08 ‐0.02 0.00 0.48 0.06 0.00 ‐0.05 ‐0.03 0.49 0.04Not have family outside country ‐0.03 0.04 0.06 0.66 0.08 ‐0.16 0.00 0.00 0.69 0.07Not be married to foreigners 0.07 0.15 0.16 0.55 0.01 ‐0.02 0.11 0.11 0.54 ‐0.02Not have business outside the country 0.14 0.11 0.07 0.69 ‐0.03 0.06 0.00 0.09 0.70 ‐0.06Not have a home outside the country 0.05 ‐0.02 0.13 0.72 ‐0.01 ‐0.10 0.08 ‐0.07 0.74 ‐0.05Have high income from legitimate sources 0.16 0.02 0.09 0.21 0.26 0.07 0.05 0.05 0.18 0.25Pray five times in the mosque 0.09 0.32 0.65 0.21 ‐0.02 ‐0.05 0.69 0.20 0.10 ‐0.05Have religious education 0.00 0.33 0.61 0.13 ‐0.15 ‐0.10 0.67 0.19 0.04 ‐0.18Put on a turban ‐0.03 0.62 0.31 0.10 ‐0.20 0.06 0.31 0.56 0.05 ‐0.19Put on Perahan Tunban ‐0.09 0.56 0.26 0.11 ‐0.20 ‐0.01 0.27 0.50 0.08 ‐0.18Put on suit with tie 0.04 ‐0.04 0.06 0.13 0.39 ‐0.08 0.04 ‐0.01 0.10 0.40Speak both Pashtu and Dari 0.20 0.02 0.35 0.12 ‐0.07 0.11 0.36 ‐0.04 0.06 ‐0.12Be from Kandahar ‐0.13 0.75 0.08 ‐0.02 ‐0.04 0.04 0.06 0.78 ‐0.04 0.03Be from a noble family ‐0.11 0.63 0.07 0.04 ‐0.13 0.04 0.05 0.64 0.02 ‐0.09See all ethnic groups with one eye ‐0.03 0.53 0.11 0.00 0.14 0.05 0.08 0.57 ‐0.04 0.19Be from south 0.33 ‐0.15 0.23 0.00 ‐0.04 0.26 0.24 ‐0.18 ‐0.06 ‐0.10Be decisive 0.67 ‐0.09 ‐0.03 0.10 0.13 0.69 ‐0.12 0.02 0.04 0.08Have clear political agenda 0.56 ‐0.05 ‐0.06 0.01 0.09 0.61 ‐0.14 0.05 ‐0.04 0.05Be a good manager 0.64 ‐0.03 0.04 0.02 0.09 0.68 ‐0.03 0.06 ‐0.06 0.04Be accepting responsibility 0.66 ‐0.11 ‐0.06 0.06 0.06 0.71 ‐0.14 ‐0.01 0.00 0.01Be honest 0.66 ‐0.02 0.20 ‐0.01 0.02 0.67 0.15 0.03 ‐0.11 ‐0.04Be just 0.67 ‐0.06 0.06 0.07 ‐0.04 0.71 ‐0.01 0.00 0.00 ‐0.11Not lie to people 0.48 ‐0.03 0.21 0.08 0.10 0.43 0.17 ‐0.01 0.00 0.06Be highly educated 0.25 ‐0.07 0.44 0.09 0.14 0.07 0.46 ‐0.14 0.00 0.09Love the country 0.64 ‐0.02 0.06 0.04 0.06 0.68 ‐0.01 0.06 ‐0.04 0.01Fight the foreigners 0.02 0.30 0.52 0.04 0.01 ‐0.07 0.56 0.20 ‐0.05 ‐0.01Not let foreigners in the country ‐0.04 0.33 0.40 ‐0.05 0.03 ‐0.09 0.44 0.26 ‐0.12 0.03Acknowledges Durand Line ‐0.03 0.01 0.09 ‐0.16 0.21 ‐0.07 0.11 0.02 ‐0.19 0.23Respect/enforce the law 0.66 ‐0.08 0.03 ‐0.03 0.10 0.70 ‐0.04 0.02 ‐0.11 0.05Believe in God 0.50 0.07 0.39 0.10 ‐0.02 0.45 0.37 0.05 0.00 ‐0.09Be brave 0.37 ‐0.02 0.26 0.10 0.08 0.30 0.24 ‐0.02 0.02 0.04Be impartial 0.19 ‐0.03 0.38 0.25 0.21 0.00 0.38 ‐0.08 0.18 0.17Have good relations with neighboring countries 0.21 ‐0.24 0.34 0.05 0.24 0.01 0.36 ‐0.28 ‐0.03 0.19Be internationally famous 0.25 0.06 0.31 0.11 0.36 0.11 0.29 0.07 0.02 0.35Respect human rights 0.34 ‐0.04 0.08 0.08 0.46 0.24 0.03 0.04 0.02 0.46Respect women's rights 0.27 ‐0.11 ‐0.03 0.02 0.54 0.17 ‐0.09 0.00 ‐0.03 0.56Allow women to work 0.11 ‐0.19 ‐0.14 ‐0.04 0.62 0.00 ‐0.19 ‐0.07 ‐0.06 0.66Be good speaker 0.29 ‐0.14 0.15 0.21 0.38 0.14 0.11 ‐0.10 0.15 0.36Be good looking 0.02 0.32 0.01 0.09 0.12 0.07 ‐0.03 0.36 0.07 0.15Be elected through election 0.47 ‐0.14 0.05 0.10 0.11 0.44 ‐0.01 ‐0.09 0.05 0.06Not discriminate based on ethnicity 0.41 ‐0.10 ‐0.09 0.17 0.00 0.44 ‐0.15 ‐0.04 0.15 ‐0.04Not discriminate based on religion 0.26 ‐0.14 0.04 0.16 0.20 0.17 0.00 ‐0.11 0.13 0.17Not be young ‐0.07 0.42 0.00 0.10 0.10 0.00 ‐0.03 0.46 0.09 0.15Have same deeds as words 0.23 ‐0.12 0.29 0.02 0.10 0.11 0.30 ‐0.15 ‐0.04 0.06Be selected through Jirga 0.01 0.33 0.39 ‐0.01 0.07 ‐0.04 0.42 0.27 ‐0.09 0.07
eigenvalue 6.6 4.6 2.0 1.7 1.1 6.6 4.6 2.0 1.7 1.1% of Variance Explained 27% 16% 15% 13% 11% 31% 23% 20% 17% 16%

99
Except for five items, the rest load similarly under both rotation methods, which could mean
that these factors are more important than the others. Furthermore, those items that were
relatively uniform in distribution (smaller Kurtosis values) loaded on one of the five factors,
which is one of the reasons why factor analysis was chosen for this dataset. All other items over
which Afghans had significant agreement (higher values of Kurtosis) are self-explanatory and
most likely correlated.
Factor 1: Measure of Goodness
I define this factor as the “Measure of Goodness” when it comes to judgments of good
political leadership by the Afghans. The items (characteristics) that mostly load on this factor
are:
Table 5.5: Loading of characteristics (items) on factor 1
Bivariate analysis of each item that loaded on the above factor does not show variation across
different ethnicity groups, gender, age, income levels, education levels, and other social stratum,
which means all Afghans commonly accept these characteristics as signs of good political
leadership. See Appendix IV for a complete univariate and bivariate analysis of items loaded on
Items Uncorrelated Correlated
Be decisive 0.67 0.69Have clear political agenda 0.56 0.61Be a good manager 0.64 0.68Be accepting responsibility 0.66 0.71Be honest 0.66 0.67Be just 0.67 0.71Not lie to people 0.48 0.43Love the country 0.64 0.68Respect/enforce the law 0.66 0.70Believe in God 0.50 0.45Be elected through election 0.47 0.44Not discriminate based on ethnicity 0.41 0.44

100
this factor. If you are a political leader in Afghanistan and your words or behavior shows any
sign of decisiveness, honesty, loving the country or believing in God, people can easily get
attracted to you even if they don’t like you for some other reasons. These characteristics impact
the spirit of every Afghan pretty easily. Those who have experience leading people can tell if
they agree with this conclusion or not. But in order to validate this further, I will use these
characteristics as the baseline and review the text data from survey question 17. Under question
17 in the questionnaire (see Appendix II), survey respondents were asked to express their
thoughts about strength and weakness of most famous Afghan political leaders and then rate each
one using a scale of one to ten. It is important to note that popularity of leaders is a constantly
changing variable and the results might not be representative of the views of Afghans today.19
But it shows how the most important characteristics of good political leadership have constantly
been used when judging goodness of different political leaders. Obviously, this data answers
more questions, such as:
Which leader is associated more with characteristics of good political leadership, and
thus in better position to politically grow in the future?
Which leaders are associated with characteristics that are favorable to one ethnic group,
but not necessarily to the other ones?
How do Afghans rate leaders and grouped them cognitively while comparing their
characteristics? In other words, how respondents score leaders similarly?
19 The data was collected in late 2012 and early 2013.

101
In order to answer these questions more accurately, we need to define additional factors and
check their association with ethnicity, gender, etc., before analyzing data for actual political
leaders. But we will refer back to findings of this chapter when we discuss characteristics
associated with each political leader.
Factor 2: Islamic Factor
I define this underlying construct as the “Islamic” factor that determines good political
leadership in Afghans’ minds. Given that Afghans are highly religious people, it is not a surprise
that this factor shows at the second most important underlying construct in their definition of
good political leadership. It is important to note that the item “being highly educated” does not
load on this factor when you force factors not to correlate. That means the item “being highly
educated” does not really belong to this factor, but when you allow correlation of factors it
comes close, which is probably because education is an important issue for religious people as
well.
Table 5.6: Loading of Characteristics on Factor 2
Items Uncorrelated Correlated
Pray five times in the mosque 0.65 0.69Have religious education 0.61 0.67Be highly educated 0.44 0.46Fight the foreigners 0.52 0.56Not let foreigners in the country 0.40 0.44Be selected through Jirga 0.39 0.42
In order to test that this factor is not miss-specified, I have conducted thorough bivariate
analysis of these items with key social strata to check for significant associations. A complete

102
set of analysis is printed on Appendix V for the reader’s judgment. My conclusion based on
review of bivariate analysis is that this factor has more of a religious nature than anything else.
Afghanistan is a very religious country; therefore, it is hard to see major differences across
geography or gender. However, the level of education indicates that highly educated people are
less in favor of these items. We also notice that respondents within the range of 22 to 31 years
old are relatively less in favor of this factor. I believe these respondents are the ones who grew
up during the relatively prosperous, low violence and economically thriving days of 2001 to
2005. They are more influenced by the developments of early good days than those who came
before them, or even after them. But again, I will leave further judgment about this factor to the
reader, as there is room for speculation.
What we can clearly notice is that these items do not have any significant Pashtun/non-
Pashtun association, which is the main point of interest for the thesis of this dissertation. We also
notice that Hazaras, Uzbeks and other minorities have responded less favorably than Pashtuns
and Tajiks, which is another reason why I think this is a religious factor rather than ethnic.
Hazaras are believed for being less fanatic when it comes to religious extremism. Other
researches in Afghanistan show that Pashtuns and Tajiks are more radicalized on the basis of
religion than other ethnic groups of the country.20
An interesting observation in this research is how Afghans reacted to the item “a good leader
should fight the foreigners.” Respondents scored this item favorably, but did not do the same
thing with the item “a good leader should not let foreigners into the country.” Data were
20 AIR Consulting study of youth radicalization sponsored by KOCHA.

103
collected while the panic of 2014 was not yet that serious in Afghanistan. So, it might have been
the economic benefits of having foreigners in the country over-road their anti-foreign attitude.
Factor 3: Pashtun Factor
I define this construct as the “Pashtun” factor of good political leadership. We need to
review the loadings of this factor before we move on and look at association of these items with
key social strata to crosscheck and see if this construct is truly a Pashtun underlying factor in
political leadership.
Table 5.7: Loading of Characteristics on Factor 3
Items Uncorrelated Correlated
Put on a turban 0.62 0.56Put on Perahan Tunban 0.56 0.50Be from Kandahar 0.75 0.78Be from a noble family 0.63 0.64See all ethnic groups with one eye 0.53 0.57Not be young 0.42 0.46
Univariate and bivariate analysis presented in Appendix VI shows that there are significant
differences between associations of Pashtuns with these characteristics than non-Pashtuns. For
example, Pashtuns scored the item “a good leader should put on a Turban” much more favorably
than non-Pashtuns (Figure 5.3). Refer to a detailed bivariate analysis of all items in Appendix VI
for more details.
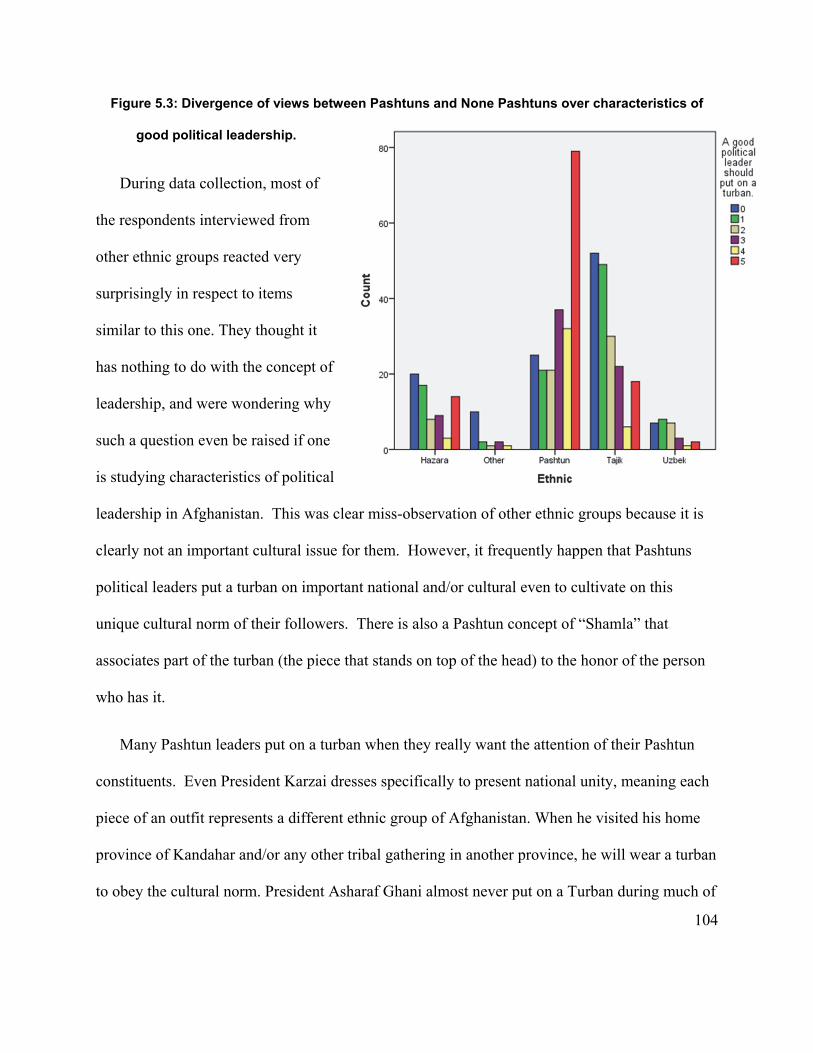
104
Figure 5.3: Divergence of views between Pashtuns and None Pashtuns over characteristics of
good political leadership.
During data collection, most of
the respondents interviewed from
other ethnic groups reacted very
surprisingly in respect to items
similar to this one. They thought it
has nothing to do with the concept of
leadership, and were wondering why
such a question even be raised if one
is studying characteristics of political
leadership in Afghanistan. This was clear miss-observation of other ethnic groups because it is
clearly not an important cultural issue for them. However, it frequently happen that Pashtuns
political leaders put a turban on important national and/or cultural even to cultivate on this
unique cultural norm of their followers. There is also a Pashtun concept of “Shamla” that
associates part of the turban (the piece that stands on top of the head) to the honor of the person
who has it.
Many Pashtun leaders put on a turban when they really want the attention of their Pashtun
constituents. Even President Karzai dresses specifically to present national unity, meaning each
piece of an outfit represents a different ethnic group of Afghanistan. When he visited his home
province of Kandahar and/or any other tribal gathering in another province, he will wear a turban
to obey the cultural norm. President Asharaf Ghani almost never put on a Turban during much of

105
his public live and public appearance until he began his electoral campaign and his term in the
office. The picture below shows the presidential ceremony to sworn him in to the office. The
way he appeared in this ceremony shocked many educated Afghans because they thought he was
a highly educated Afghan and would follow his regular standards of dressing. A very similar
argument holds about Perahan Tunban, which due to space limitation I will not discuss in details.
Many Pashtun leaders, including
president Karzai, thought that
wearing Perahan Tunban in
official settings is a good sign of
having their own identity, while
many non-Pashtuns were surprised
when they saw their new leaders in
this outfit.
Factor 4: Trust & Dependability
I define this underlying construct as “Trust & Dependability” factor, which I think has
affected Afghans attitude toward political leadership due to the return of many educated Afghans
from exile. Returned Afghans controlled more resources and seized more power than those who
stayed behind and suffered all the difficulties of war. Today Afghans think that if they rely on
them for leadership, they might leave the country and go back to their secondary homeland when
tough days come again. The data suggests that the low-income respondents were not very
Source: AFP Shah Marai

106
concerned about these characteristics. I suspect it is because they do not consider these relatively
high salaried returnees as their direct competitors.
Table 5.8: Loadings of Characteristics on Factor 4
Items Uncorrelated Correlated
Not have double passport 0.48 0.49Not have family outside country 0.66 0.69Not be married to foreigners 0.55 0.54Not have business outside the country 0.69 0.70Not have a home outside the country 0.72 0.74
It is also important to note is that these items do not present any association with other social
strata, such as ethnicity, which makes it a relatively national reaction to the concept of political
leadership than a sub-group concern. Refer to Appendix VII for a complete review of bivariate
analysis of these items.
Factor 5: Non-Pashtun Standard
I will define this construct as the “Non-Pashtun Standard” of political leadership. Bivariate
analysis of these items suggests that ethnicity makes this factor more like a non-Pashtun norm
rather than something like gender, or education. Pashtun respondents mostly scored these items
more unfavorably than any other ethnic groups. It is also important to notice that some items
load on this factor under one set of condition but not the other (allowing factors to be correlated
or uncorrelated).

107
Table 5.9: Loadings of Characteristics on Factor 5
Items Uncorrelated Correlated
Be a woman 0.46 0.51Put on suit with tie 0.39 0.40Respect human rights 0.46 0.46Respect women's rights 0.54 0.56Allow women to work 0.62 0.66Be good speaker 0.38 0.36
But there is also a gender
association to this factor, which is
detectable because women have shown
bias toward each of the items relating
to the social status of women.
However, there are items that are
relatively non-Pashtun in nature. For
example, association of “a good leader
should put on suit and tie” has clear
ethnicity associations (Figure 5.4).
Figure 5.4: Divergence of views between Pashtuns and None Pashtuns over characteristics of
good political leadership.
In this graph, the only ethnic group that has responded more negatively is the Pashtuns. For a
more detailed bivariate analysis of these items, refer to Appendix VIII. Bivariate analysis of
other items also shows a division of interest between Pashtuns and non-Pashtuns.

108
The items in Table 5.9 did not load on any of the above five factors, but it is important to
include their univariate and bivariate analyses presented in Appendix IX:
Table 5.10: Characteristics (items) that did not load on any of the key factors
Items
Have professional cabinetHave good moralsBe a manHave high income from legitimate sourcesSpeak both Pashtu and DariBe from SouthAcknowledges Durand LineBe braveBe impartialHave good relations with neighboring countriesBe internationally famousBe good lookingNot discriminate based on religionHave same deeds as words
Of these items, the ones that exhibited signs of ethnic association were:
A good political leader should have a professional cabinet.
A good political leader should acknowledge the Durand Line.
A good political leader should have high income from legitimate sources.
A good political leader should be impartial.
A good political leader should have good relations with neighboring countries.
The item over, which few ethnic groups had any significant bias was “a good political leader
should be good looking”.

109
Important Findings from the First Stage
Ethnic division was observable in the data from the first stage, even though, it was based on
responses from as few as 63 people. In the first stage, respondents from all ethnic groups had
some degree of consensus when discussing characteristics of good political leadership, but their
responses presented significant levels of ethnic division when they were asked which leaders
actually possessed those characteristics.21 Two charts from data analysis of first-stage are
represented in Figures 5.5 and 5.6. Responses are coded and turned into two-dimensional
matrices of respondents by characteristics so they could be mapped with social network analysis
software, such as UCINET.
21 This is part of the reason why two-stage research design is more effective than one stage.
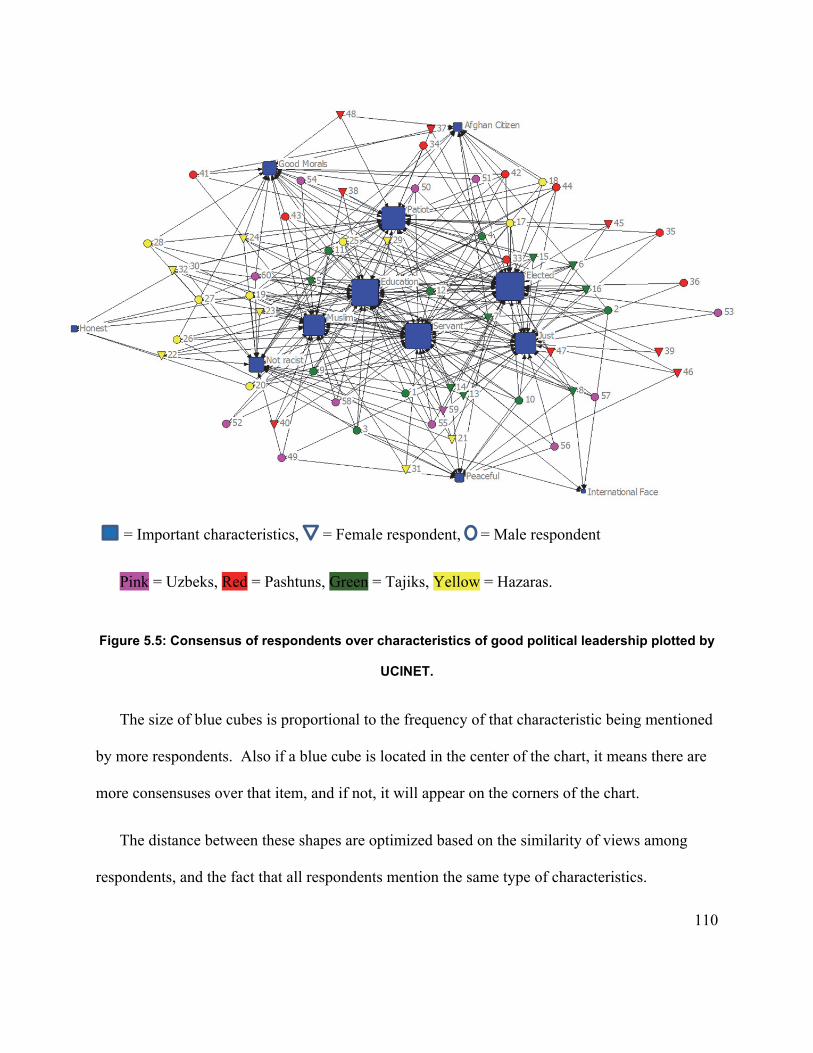
110
= Important characteristics, = Female respondent, = Male respondent
Pink = Uzbeks, Red = Pashtuns, Green = Tajiks, Yellow = Hazaras.
Figure 5.5: Consensus of respondents over characteristics of good political leadership plotted by
UCINET.
The size of blue cubes is proportional to the frequency of that characteristic being mentioned
by more respondents. Also if a blue cube is located in the center of the chart, it means there are
more consensuses over that item, and if not, it will appear on the corners of the chart.
The distance between these shapes are optimized based on the similarity of views among
respondents, and the fact that all respondents mention the same type of characteristics.

111
Therefore, if there is a great level of consensus among a group of respondents, the blue cubes
come in the middle and all respondents surround it in a way that no pattern of color or shape
skewness is detectable. However, if there is no consensus among respondent then the graph will
exhibit all sort of skewness and patterns of shapes and colors. For example, when the same group
of respondent was asked, “Which Afghan leaders have these characteristics that you just
mentioned?” responses suddenly presented a very detectable pattern of shapes and colors (Figure
5.6).
Notice that Pashtun respondents gather on the right top corner of the chart, Hazaras on the
left of side of the chart, and Tajiks and Uzbeks around lower middle part of the map. This map
clearly shows the presence of personalities shift consistency of people toward ethnic bias. We
also notice that except for two political leaders (Afghan President Ashraf Ghani and former
Afghan Interior Minister Ali Ahmad Jalali) who positioned around the upper-middle part of the
map, all other leaders appear close to their own ethnic constituencies. These two leaders attract
followers from all ethnic groups because they are highly educated and most of their followers are
drawn to them based on their interest in education (when I changed the colors to represent level
of education, I noticed that respondents around Ghani and Jalali were mostly educated). On the
other hand, it is also very important to note that the number of respondents who mentioned the
name of these two leaders was very small, which means they were not as popular as other leaders
at the time of data collection. As mentioned previously, the popularity of leaders is a function of
time and other events. The data for this study were collected in late 2012, and the relative
popularity of leaders presented in this graph also belongs to that time.

112
= Important characteristics, = Female respondent, = Male respondent
Pink = Uzbeks, Red = Pashtuns, Green = Tajiks, Yellow = Hazaras.
Figure 5.6: Lack of consensus over characteristics of good political leadership plotted by UCINET.
So, even the low responses from the first-stage analysis detect the sharp divisions between
the Pashtuns and non-Pashtuns when it comes to characteristics of good political leadership. The
difference becomes particularly significant when the issue is brought up in the context of
personalities. A depersonalized context seems to be producing less diverging choices between
different ethnic groups than a personalized context.

113
Figure 5.7: No significant divergence of
views between Pashtuns and none
Pashtuns over some characteristics of
good political leadership.
Also, it turns out that there are
specific areas, where Pashtun and non-
Pashtun values diverge even in the
context of impersonalized political
leadership. For Pashtuns, political
leadership has certain characteristics
that are not important for non-Pashtuns, such as putting a turban. By the same token, political
leadership possesses some other characteristics that are important for non-Pashtuns, but not for
Pashtuns, such as putting a suit and tie. The disagreement over characteristics of political
leadership goes beyond power politics and ethnic rivalry, and seems to be embedded in socio-
cultural values of each group. Some of these values are deeply embedded in each group, posing
challenges to making democratic developments in Afghanistan.
Judging Characteristics of Known Political Leaders
As mentioned previously, initial analysis in the first stage suggested that Afghans did not
have diversion of norms and values when they commented on characteristics of good political
leadership. However, their views become divergent along ethnic lines when the names of actual
political leaders were mentioned in the interviews. In this section, I aim to cross-check this

114
finding from the first stage. Also, I analyze the data for those questions in which respondents
were asked to judge the characteristics of the actual political leaders of Afghanistan.
In the first stage, I asked every respondent to give me a list of officials whom they thought
had all the characteristics of a good political leader. I summed up the names that each respondent
listed, and then created a master list of famous political leaders. I deleted all the names that only
one respondent (of the 60) mentioned, and took the rest and put in the questionnaire of my fixed-
form survey. In the second stage, I asked respondents to answer the following three questions (to
see a complete list of 63 leaders, refer to Appendix II):
1. What do you think are the most important strengths of these 63 political leaders?
2. What do you think are the most important weaknesses of these 63 political leaders?
3. Given all the strengths and weaknesses that you mentioned, could you please rate these
leaders in a scale of 1 to 10?
The answers to the first two questions, unexpectedly, generated a very large body of text that
required labor-intensive textual analysis. However, resource limitations for this dissertation
project prevented a detailed textual analysis of all the answers provided by the respondents. A
summary of the findings from the first two questions is presented in a word cloud chart (Figure
5.9). The answer to the third question is used for another set of multivariate analysis, which will
be discussed in Chapter Six.
The original text (all in local languages)—produced in response to the first two questions
(strengths and weakness of 63 political leaders)—was used as the primary source of data for
generating the word cloud chart. This method of mapping, or data visualization, is helpful

115
because the size of the text is proportional to the frequency of that word repeated in answers
from respondents. In the word cloud chart in Figure 5.9, several of the most frequently
mentioned words have been outlined and translated to cross-check them with the key
characteristics that were discussed earlier in the dissertation:
Figure 5.8: Key words used in evaluation of actual political leaders (depicted in word cloud).
1. Knowledge 11. Discriminating 21. Foreign2. Honest 12. Afghanistan 22. Personality3. Country (together with # 10 means loving the country) 13. Discrimination 23. Service4. Religion 14. Tribal 24. Experience5. Decisive 15. Oppressor 25. Independence 6. Political 16. Freedom 26. People7. Management 17. Knowledgeable8. Brave 18. Killer9. Performance 19. Jihadi/Mujahid (freedom fighter) 10. Loving/Liking 20. Ethnically Discriminating

116
Even though these single words do not pass the whole message that the data has recorded,
but it still provides a good picture of what respondents intended to say.22 Here is why; when I
asked respondents another question of what would make a political leader popular among people,
the answers are analyzed by frequency analysis—the words in Table 5.11 are the same as those
depicted in the word cloud in Figure 5.8.
Table 5.11: Translation and frequency of words used repeatedly in the word cloud analysis
Also, I noticed that there were some differences in the choice of words when they judged
strengths and weaknesses of actual political leaders, versus defining characteristics of good
political leadership.
The question about characteristics of good political leadership was intentionally asked before
respondents were exposed to the list of political leaders’ names (see Appendix II). This was
22 Complete analysis of all data required much more time and resources than what I achieve within the timeline of writing this dissertation.

117
done in an effort to cross-check if the choice of words would differ when respondents react to the
list of names instead of open-ended questions about abstract characteristics. But as seen in the
word cloud in Figure 5.9, the choices of words in both cases come very close.
.

118
CH – 6: EXPECTATIONS FROM LEADERS
During the first stage when exploring the most important characteristics of good political
leadership among Afghans, I noticed that a number of respondents listed policy actions and other
behavioral expectations as characteristics of a good political leader. For example, they said “a
good leader would promote women’s rights”, or “a good leader will let women work”, or “a
good leader would fight the foreigners”, etc. I noticed that for Afghans also like all other people
around the world good leadership is not only defined by the characteristics of the leader, but also
by what do actually do when they are in the office.
Therefore, I decided to add another question about policy expectations to see if the
underlying constructs that influence judgments of Afghans under policy expectation are different
or the same as those under characteristics of leaders. This chapter review analysis of data about
a number of policy decisions that were explored in the first stage and evaluated in the second
stage fixed form survey. Under the question of what would you expect a good political leader do
when s/he is in power, respondents of semi structured interviews listed a total of 41 policy
decisions that were turned into fixed form survey question in the second stage. Respondents
were asked to rate each policy statement with one of the three choices:
Very important (Coded as 3)
Somewhat important (Coded 2)
Not important (Coded 1)
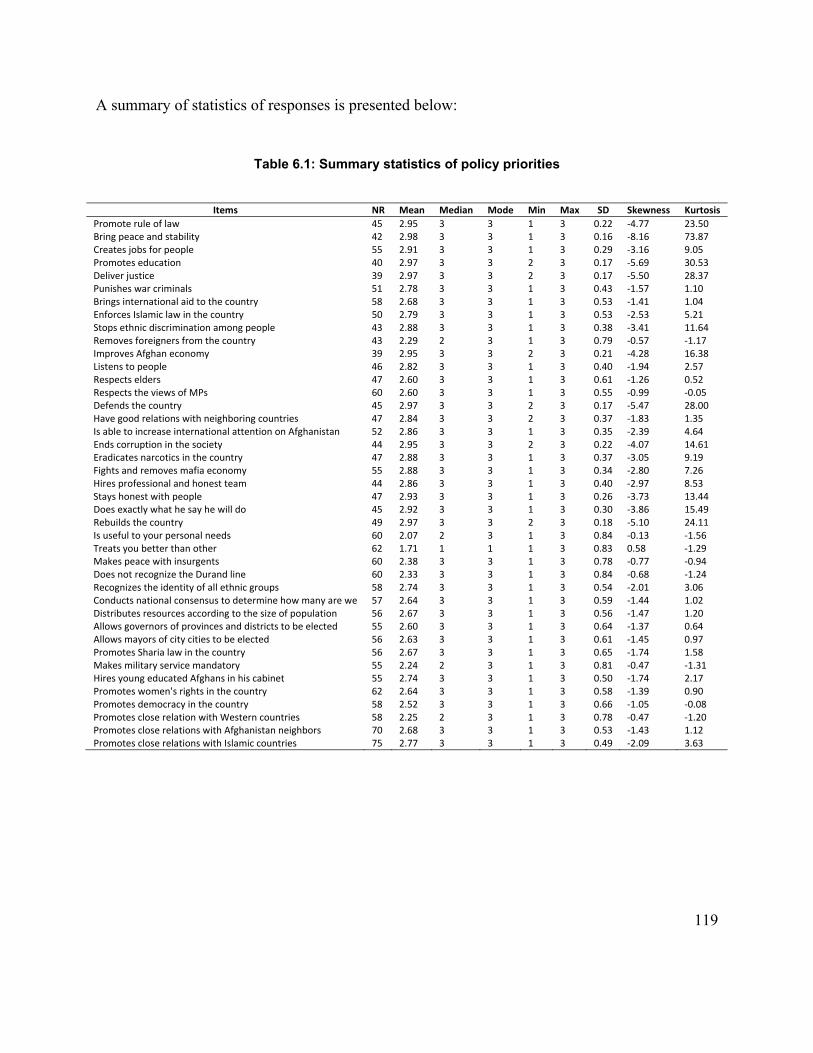
119
A summary of statistics of responses is presented below:
Table 6.1: Summary statistics of policy priorities
Items NR Mean Median Mode Min Max SD Skewness Kurtosis
Promote rule of law 45 2.95 3 3 1 3 0.22 ‐4.77 23.50Bring peace and stability 42 2.98 3 3 1 3 0.16 ‐8.16 73.87Creates jobs for people 55 2.91 3 3 1 3 0.29 ‐3.16 9.05Promotes education 40 2.97 3 3 2 3 0.17 ‐5.69 30.53Deliver justice 39 2.97 3 3 2 3 0.17 ‐5.50 28.37Punishes war criminals 51 2.78 3 3 1 3 0.43 ‐1.57 1.10Brings international aid to the country 58 2.68 3 3 1 3 0.53 ‐1.41 1.04Enforces Islamic law in the country 50 2.79 3 3 1 3 0.53 ‐2.53 5.21Stops ethnic discrimination among people 43 2.88 3 3 1 3 0.38 ‐3.41 11.64Removes foreigners from the country 43 2.29 2 3 1 3 0.79 ‐0.57 ‐1.17Improves Afghan economy 39 2.95 3 3 2 3 0.21 ‐4.28 16.38Listens to people 46 2.82 3 3 1 3 0.40 ‐1.94 2.57Respects elders 47 2.60 3 3 1 3 0.61 ‐1.26 0.52Respects the views of MPs 60 2.60 3 3 1 3 0.55 ‐0.99 ‐0.05Defends the country 45 2.97 3 3 2 3 0.17 ‐5.47 28.00Have good relations with neighboring countries 47 2.84 3 3 2 3 0.37 ‐1.83 1.35Is able to increase international attention on Afghanistan 52 2.86 3 3 1 3 0.35 ‐2.39 4.64Ends corruption in the society 44 2.95 3 3 2 3 0.22 ‐4.07 14.61Eradicates narcotics in the country 47 2.88 3 3 1 3 0.37 ‐3.05 9.19Fights and removes mafia economy 55 2.88 3 3 1 3 0.34 ‐2.80 7.26Hires professional and honest team 44 2.86 3 3 1 3 0.40 ‐2.97 8.53Stays honest with people 47 2.93 3 3 1 3 0.26 ‐3.73 13.44Does exactly what he say he will do 45 2.92 3 3 1 3 0.30 ‐3.86 15.49Rebuilds the country 49 2.97 3 3 2 3 0.18 ‐5.10 24.11Is useful to your personal needs 60 2.07 2 3 1 3 0.84 ‐0.13 ‐1.56Treats you better than other 62 1.71 1 1 1 3 0.83 0.58 ‐1.29Makes peace with insurgents 60 2.38 3 3 1 3 0.78 ‐0.77 ‐0.94Does not recognize the Durand line 60 2.33 3 3 1 3 0.84 ‐0.68 ‐1.24Recognizes the identity of all ethnic groups 58 2.74 3 3 1 3 0.54 ‐2.01 3.06Conducts national consensus to determine how many are we 57 2.64 3 3 1 3 0.59 ‐1.44 1.02Distributes resources according to the size of population 56 2.67 3 3 1 3 0.56 ‐1.47 1.20Allows governors of provinces and districts to be elected 55 2.60 3 3 1 3 0.64 ‐1.37 0.64Allows mayors of city cities to be elected 56 2.63 3 3 1 3 0.61 ‐1.45 0.97Promotes Sharia law in the country 56 2.67 3 3 1 3 0.65 ‐1.74 1.58Makes military service mandatory 55 2.24 2 3 1 3 0.81 ‐0.47 ‐1.31Hires young educated Afghans in his cabinet 55 2.74 3 3 1 3 0.50 ‐1.74 2.17Promotes women's rights in the country 62 2.64 3 3 1 3 0.58 ‐1.39 0.90Promotes democracy in the country 58 2.52 3 3 1 3 0.66 ‐1.05 ‐0.08Promotes close relation with Western countries 58 2.25 2 3 1 3 0.78 ‐0.47 ‐1.20Promotes close relations with Afghanistan neighbors 70 2.68 3 3 1 3 0.53 ‐1.43 1.12Promotes close relations with Islamic countries 75 2.77 3 3 1 3 0.49 ‐2.09 3.63

120
Figure 6.1 presents sorted distribution of scores for the 41 policy expectation ratings.
In the Figure 6.1, 1 means Not Important, 2=Somewhat Important, and 3=Very Important.

121
A total of 33 observations were dropped because respondents did not respond to more than
one policy priority. Another 41 observations were dropped because responses did not present any
variations (respondents scored all policy priorities in a similar way). The demographics of 494
respondents were distributed as follows:
Table 6.2: Demographics of 494 Respondents by Social Stratification
Age Education Regions R/U Gender Ethnicity Income Elite Internet
1 0.29 0.08 0.19 0.55 0.70 0.40 0.49 0.47 0.61 2 0.38 0.38 0.10 0.45 0.30 0.35 0.39 0.38 0.32 3 0.17 0.48 0.34 0.16 0.12 0.15 0.07 4 0.09 0.06 0.05 0.065 0.06 0.32 0.03
Table 6.3: Level of measurement codes at each stratum
Strata 1 2 3 4 5
Age 21 & younger 22‐31 32‐41 42‐51 Older than 51Education Uneducated & Some Schooling 12G & Diploma B.A. & B.S. M.A. & Ph.D. Regions Central East North West South R/U Urban RuralGender Men WomenEthnicity Pashtuns Tajiks Hazaras Uzbeks Other Income Below 10K 10K ‐ 50K Above 50KElites None Participants Attentive ParticipantsInternet Users Yes No No Response
Cronbach Alpha coefficient of 0.81 suggests that the reliability of the samples was good.
The Kaiser-Meyer-Olkin (KMO) coefficient was initially 0.73, but after dropping item No. 4, “a
good leader promotes education” presented in Table 6.1, the KMO coefficient became 0.75. This
number meets the minimum requirement for conducting factor analysis. The scree plot of the
factors was:

122
Figure 6.2: Scree plot of Eigen values for main factors
At least three important factors are visible on the Scree plot in Figure 6.2 (remember we had
two important factors in Chapter Five). The loading of factors show that at least five factors have
an eigenvalue of greater than 1, exactly the same number in Chapter Five. I decided to extract
five factors and compare them with the factors extracted for characteristics of political leadership
in Chapter Five. This allowed cross-checking to see if the underlying constructs for good
political leadership were still the same while analyzing two different sets of data.
Table 6.4 shows factor loadings under both correlated and uncorrelated conditions. Items that
have loaded on any of the five factors with a covariance of at least 0.4 are highlighted for easy
tracking.
01
23
45
Eig
enva
lues
0 10 20 30 40Number of Factors
Scree plot of eigenvalues

123
Table 6.4: Table of Loadings for Five Extracted Factors
Items Uncorrelated Factors Correlated Factors
F‐1 F‐2 F‐3 F‐4 F‐5 F‐1 F‐2 F‐3 F‐4 F‐5
Promote rule of law ‐0.01 0.10 0.26 0.11 ‐0.15 0.04 ‐0.06 0.27 0.09 ‐0.15 Bring peace and stability 0.07 0.12 0.40 ‐0.10 0.21 0.06 ‐0.05 0.41 ‐0.14 0.20 Creates jobs for people 0.08 0.22 0.41 0.05 0.06 0.15 ‐0.04 0.41 ‐0.01 0.05 Deliver justice 0.11 0.04 0.26 0.01 ‐0.14 ‐0.03 0.08 0.28 ‐0.01 ‐0.15 Punishes war criminals 0.26 0.20 0.24 0.00 0.16 0.15 0.18 0.21 ‐0.06 0.15 Brings international aid to the country 0.14 0.39 0.09 ‐0.10 0.02 0.42 0.07 0.01 ‐0.19 0.00 Enforces Islamic law in the country 0.74 ‐0.10 0.14 ‐0.01 0.07 ‐0.23 0.76 0.13 ‐0.02 0.07 Stops ethnic discrimination among people 0.22 ‐0.02 0.40 0.06 ‐0.17 ‐0.15 0.17 0.43 0.05 ‐0.17 Removes foreigners from the country 0.52 0.00 0.01 0.04 0.23 ‐0.06 0.51 ‐0.02 0.02 0.23 Improves Afghan economy 0.12 0.12 0.36 0.12 ‐0.25 0.03 0.07 0.37 0.08 ‐0.25 Listens to people 0.36 0.38 0.23 0.10 0.06 0.34 0.27 0.16 0.00 0.05 Respects elders 0.58 0.25 0.19 0.08 0.08 0.18 0.52 0.12 ‐0.01 0.08 Respects the views of MPs 0.32 0.49 0.11 0.16 0.02 0.48 0.24 0.01 0.04 0.02 Defends the country 0.11 0.01 0.50 0.15 ‐0.14 ‐0.13 0.03 0.55 0.14 ‐0.13 Have good relations with neighboring countries 0.41 0.29 ‐0.01 0.05 ‐0.24 0.27 0.42 ‐0.09 ‐0.03 ‐0.24 Is able to increase international attention on Afghanistan 0.16 0.31 0.12 0.05 ‐0.16 0.30 0.11 0.06 ‐0.03 ‐0.17 Ends corruption in the society 0.06 0.03 0.40 0.07 ‐0.13 ‐0.07 0.00 0.43 0.05 ‐0.13 Eradicates narcotics in the country 0.19 0.18 0.48 ‐0.01 0.11 0.09 0.07 0.48 ‐0.06 0.10 Fights and removes mafia economy ‐0.02 0.31 0.33 0.07 0.02 0.28 ‐0.14 0.31 0.00 0.02 Hires professional and honest team 0.04 0.21 0.18 0.08 0.00 0.19 ‐0.03 0.16 0.03 0.00 Stays honest with people 0.16 0.22 0.33 ‐0.04 ‐0.08 0.16 0.08 0.31 ‐0.10 ‐0.10 Does exactly what he say he will do 0.22 0.01 0.56 ‐0.03 ‐0.01 ‐0.13 0.13 0.60 ‐0.05 ‐0.02 Rebuilds the country 0.08 0.08 0.26 0.12 0.15 0.02 0.00 0.26 0.10 0.16 Is useful to your personal needs 0.12 0.00 0.05 0.12 0.57 ‐0.02 0.05 0.04 0.13 0.58 Treats you better than other 0.24 0.05 ‐0.15 0.12 0.59 0.06 0.20 ‐0.18 0.11 0.60 Makes peace with insurgents 0.36 0.07 ‐0.06 0.00 0.09 0.05 0.37 ‐0.10 ‐0.03 0.09 Does not recognize the Durand line 0.34 0.06 ‐0.01 ‐0.03 0.26 0.04 0.32 ‐0.04 ‐0.06 0.25 Recognizes the identity of all ethnic groups 0.14 0.24 0.22 0.04 ‐0.12 0.20 0.08 0.19 ‐0.03 ‐0.13 Conducts national consensus to determine population ‐0.09 0.45 0.02 0.38 ‐0.05 0.49 ‐0.17 ‐0.06 0.29 ‐0.02 Distributes resources according to the size of population 0.04 0.31 0.17 0.33 ‐0.04 0.28 ‐0.04 0.13 0.26 ‐0.01 Allows governors of provinces and districts to be elected 0.09 0.09 0.01 0.74 0.09 0.03 0.05 ‐0.01 0.74 0.16 Allows mayors of city cities to be elected 0.04 0.09 0.03 0.75 0.02 0.03 0.00 0.01 0.75 0.10 Promotes Sharia law in the country 0.70 ‐0.09 0.10 0.07 0.13 ‐0.21 0.71 0.09 0.06 0.14 Makes military service mandatory 0.25 0.14 0.07 0.16 0.26 0.11 0.20 0.04 0.13 0.27 Hires young educated Afghans in his cabinet 0.16 0.25 0.12 0.00 0.22 0.25 0.08 0.07 ‐0.06 0.21 Promotes women's rights in the country ‐0.06 0.53 0.09 0.14 0.06 0.58 ‐0.17 0.00 0.03 0.06 Promotes democracy in the country ‐0.14 0.57 0.11 0.07 0.09 0.64 ‐0.26 0.02 ‐0.05 0.08 Promotes close relation with Western countries ‐0.10 0.57 ‐0.02 0.13 ‐0.02 0.65 ‐0.19 ‐0.13 0.01 ‐0.02 Promotes close relations with Afghanistan neighbors 0.23 0.40 ‐0.10 0.22 ‐0.29 0.42 0.23 ‐0.21 0.12 ‐0.28 Promotes close relations with Islamic countries 0.62 0.05 ‐0.02 0.05 ‐0.16 ‐0.01 0.66 ‐0.07 0.01 ‐0.16
eigenvalue 5.1 2.4 1.8 1.2 1.1 5.1 2.4 1.8 1.2 1.1 % of Variance Explained 23% 19% 17% 12% 10% 27% 26% 24% 13% 11%
The very first observation is that items load on all five factors almost identically under both
methods of rotations. Except for a few items, the rest load on the same factors whether they
rotate in accordance with the varimax method or remain oblique. The only difference that
appears is the change in eigenvalue of factors, and, therefore, the factors’ positions change when
we choose a different method of rotation. In the following sections, I will explore the five factors
under both methods of rotation to present a complete picture. But it is important to note that in

124
the context of political leadership, it might make more sense to allow factors to correlate because
most characteristics of political leaders can have definitional overlap.
Factor 1: Measure of Goodness
I am going to define this underlying construct as “Measure of Goodness” for priority policies
of a good political leader. Some of the policy priorities that have loaded on this factor are time
sensitive and driven by the public priorities of the time when the data were collected in the field,
but other ones could be relevant for future priorities as much as for today. Obviously “measure
of goodness” of policy priorities should be time sensitive because priorities change over time and
so the measure of goodness construct in the public’s mind.
The key difference in this set of analysis that one can observe is that the method of rotation
changes eigenvalue of Factor 1, which was not the case in characteristics of good political
leadership. This is probably because policy priorities are not as clearly defined in Afghans’
minds as characteristics of political leaders.
Table 6.5: Policy priority loading on factor 1
Items Uncorrelated Correlated
F‐2 F‐1
Brings international aid to the country 0.39 0.42 Respects the views of MPs 0.49 0.48 Conducts national census to determine how many are we 0.45 0.49 Promotes women's rights in the country 0.53 0.58 Promotes democracy in the country 0.57 0.64 Promotes close relation with Western countries 0.57 0.65 Promotes close relations with Afghanistan neighbors 0.40 0.42

125
The item that narrowly slips from loading on this factor (under uncorrelated conation) is “a
good political leader brings international aid to the country.” The other item that barely makes it
is “a good leader promotes close relations with Afghanistan neighbors.” All other items load on
the factor under both correlated and uncorrelated conditions. Review bivariate analysis of these
items on the basis of both geography and ethnicity in the Appendix X.
Factor 2: Islamic Factor
I define the underlying construct, once again, as the “Islamic” factor of good political
leadership decisions. This is the same factor that we captured in the analysis of characteristics of
good political leadership. Again, this not a surprise because we know Afghanistan has always
been a religious society. However, the effects of Jihadi slogans and promotions during the Cold
War, and the subsequent period of Taliban rule have influenced the attitudes, norms, and values
of the new generation to a great extent. The items that mostly load on this factor are:
Table 6.6: Policy priority loadings on factor 2
Items Uncorrelated Correlated
F‐1 F‐2
Enforces Islamic law in the country 0.74 0.76 Removes foreigners from the country 0.52 0.51 Respects elders 0.58 0.52 Have good relations with neighboring countries 0.41 0.42 Promotes Sharia law in the country 0.70 0.71 Promotes close relations with Islamic countries 0.62 0.66
Refer to Appendix XI for detailed review of bivariate analysis of these items across different
social stratification of respondents. The most important stratum associated with items of this
factor is education. Respondents with higher level of education scored these policy priorities

126
very unfavorably, while the uneducated respondents scored them generously. This is going to be
one of the most important justifications for the policy recommendations that I will provide in the
last chapter of dissertation. At every level of this study, I find strong evidence for sustained and
continuous education in Afghanistan if the country is supposed to place itself on a path toward
prosperity. Neither of stratifications such as ethnicity, geography, gender, and age account for
variation of items loaded on this factor. It is important to notice that younger generation
(especially those younger than 21) is more radicalized on religious views than other age groups
(see bivariate analysis under Appendix XI).
Factor 3: Justice and Honesty
I define this underlying construct as the “Justice and Honesty” factor of good political
leadership. It is important to note that this factor did not exist under characteristics of leadership,
probably because the concept of honesty is more relevant to the actual behavior of a leader rather
than his or her personal characteristics. Afghans are very concerned about the dishonest, unjust,
and unfair actions of their political leaders and, therefore, this underlying construct becomes an
important factor in their definitions of good political leadership decisions. The items that load on
this factor are:
Table 6.7: Policy Priority Loadings on Factor 3
Items Uncorrelated Correlated
F‐1 F‐2
Bring peace and stability 0.40 0.41Creates jobs for people 0.41 0.41Stops ethnic discrimination among people 0.40 0.43Defends the country 0.50 0.55Ends corruption in the society 0.40 0.43Eradicates narcotics in the country 0.48 0.48Does exactly what he says he will do 0.56 0.60
127
Bivariate analysis of these items shows that there is a complete national consensus over
priorities of these policies, and there is no significant association between these items and key
social strata. See Appendix XII for the details of crosstab analysis.
Factor 4: Decentralization of Power
Factor 4 is a construct related to the concept of “decentralization of power.” This has been a
matter of public debate since 2002, but the degree of centralization of power appropriate for
Afghanistan remains a controversial issue as Pashtuns consider it equivalent to the independence
of other ethnic groups, and non-Pashtuns, particularly Tajiks and Uzbeks, have been demanding
it since 2001. It turns out that at the time of data collection, decentralization of power might have
been a policy issues that Afghans were thinking about, but as the scree plot in Figure 6.2
suggested, fourth and fifth factors are not very significant constructs in Afghan’s minds.
Factor 5: The Culture of Denying Personal Expectations
This factor relates to a somewhat deeper cultural construct that is common in Afghanistan. I
would define it as the culture of denying personal expectations that one has for a person in
power. Afghans usually expect favor from their friends if they are in a position of power, but
they pretend it is not the case in public. When I first heard this from a few villagers in rural
Afghanistan as their measure of good political leadership, I suspected that most respondents
would deny it in the second stage. The data suggest that my suspicion was correct. While

128
Afghans expect people in power to be helpful to their personal needs, residents never
acknowledge such an idea in public. The items that load on each of Factors 4 and 5 are:
Table 6.8: Policy priority loadings on factors 4 and 5
Items Uncorrelated Correlated F‐4 F‐5 F‐4 F‐5
Is useful to your personal needs 0.12 0.57 0.13 0.58 Treats you better than other 0.12 0.59 0.11 0.60
Allows governors of provinces and districts to be elected 0.74 0.09 0.74 0.16 Allows mayors of city cities to be elected 0.75 0.02 0.75 0.10
See Appendix XIII for association of these items with key social strata.
The following items did not load on any of the five factors:
Table 6.9: Other Policy Priorities
Items
Promote rule of lawDeliver justicePunishes war criminalsImproves Afghan economyListens to peopleIs able to increase international attention on AfghanistanFights and removes mafia economyHires professional and honest teamStays honest with peopleRebuilds the countryMakes peace with insurgentsDoes not recognize the Durand lineRecognizes the identity of all ethnic groupsDistributes resources according to the size of populationMakes military service mandatoryHires young educated Afghans in his cabinet
It is important to note that one item (“a good political leader promotes education”) was
dropped to increase reliability of the items. A total of 17 items did not load on any of the major
factors. Coincidently, most of these policy priorities correlate with priority objectives of

129
international assistance to the government of Afghanistan. Some of them uniquely relate to
segments of Afghan population. For example, “a good leader does not recognize the Durand
Line,” is a very unique border conflict issue with Pakistan that has its own special importance to
the Pashtuns of Afghanistan.
On the other hand, several of these policy expectations (Table 6.9, highlighted in red) such as
“a good leader delivers justice” should have loaded on the honesty factor. The reason it is not
loaded is probably because there are some aspects of justice delivery that Afghans usually expect
from other sources of authority, such as religious clergies who dominate the judiciary system of
the country.
It might be useful to review both univariate and bivariate analyses of these items to see if any
of them have significant associations with key social strata. Appendix XIV presents univariate
and bivariate analyses of these items. Although these policies priorities do not load on any of the
key factors, their univariate analysis shows considerable ethnic variations. For example, items
such as “a good political leader makes peace with insurgents” (Figure 6.3) and “a good political
leader does not recognize the Durand Line” are more associated with Pashtun interest, than non-
Pashtuns of Afghanistan.
Some other items, such as “a good political leader recognizes the identity of all ethnic
groups” (Figure 6.4) or “a good leader hires young educated Afghans in his cabinet”, exhibit
slightly more non-Pashtun interest than Pashtuns.

130
Figure 6.3: Relative importance of making peace with the insurgents for the Pashtuns population
vs other ethnic groups of Afghanistan.

131
Figure 6.4: Tiny difference in views of Pashtuns and none Pashtuns over recognition of ethnic
identity of all ethnic groups equally.

132
CH – 7: IDENTITY OF POLITICAL LEADERS
In the past two chapters, the discussion has focused on the characteristics of good leaders, as
well as policy expectations from good leaders. However, in both cases, the study did not reveal
the name and/or other identity of an actual political leader to the respondents. However, as
discussed in Chapter Five, I learned in the first stage that Afghans’ views drastically differ when
questions about the characteristics of political leadership include the names of actual political
leaders. In this chapter, I will look into why Afghans’ views change when characteristics of
leadership are evaluated in the presence of actual name and/or identities of specific political
leaders. I will look specifically for the presence of similar latent variables that were extracted in
Chapters Five and Six. If different factors are found, then I will explore possible influences from
those factors on Afghans’ attitudes toward leadership in the context of political leaders’ names.
In this chapter, I will attempt to answer three questions driven by the findings from the first
stage:
Are there other factors that influence Afghans’ attitudes toward political leadership when
evaluated in the presence of actual leader’s names?
If so, what are they, and what causes diversion of views when political leader’s identity
(name) is judged?
Do Pashtuns and non-Pashtuns evaluate political leaders similarly?

133
During first-stage analysis, we discovered that Afghans’ views exhibit more harmony on
characteristic of good political leadership when they talk about the subject of leadership in the
abstract, rather than when connected to politician’s names. This was a key observation because it
suggests that there is consensus among Afghans when it comes to characteristics of good
political leadership. Because ethnic divisions appear when political identity of actual leaders is
discussed, this means that there is another set of underlying factors that are different from what
we analyzed in previous chapters. In this chapter we will review try to identity these factors and
compare them with those extracted in previous chapters.
Political leadership literature considers a leader’s traits and environment in determining
important factors that relate a leader to a group of people or make him or her more popular than
others. In contrast, a new psychology of leadership suggests that effective leadership is never
about the individual leader, but rather about how leaders and followers come to see each other as
part of a common team or group (Haslam, Reicher, and Platow, 2011). It is all about social
identity and how a group of individuals (both leaders and followers) identify each other as
representative or members of the same team. Haslam, Reicher and Platwo argue that effective
leadership is defined by how leaders effectively craft a sense of “us” and convincingly construct
the perception of “doing it for us.” In this case, “us” is defined by a continuous and constantly
evolving set of interactions in which both leaders and followers participate. Leaders define
themselves differently from the rest of the identities used by previous leaders, and they strive to
open space for successful political leadership by successfully convincing a group of people that
they belong to this newly defined social identity more than other existing identities.

134
In the past three decades, several groups of political leaders have come to the forefront and
quickly moved off the stage through rapid waves of wars and political transitions in Afghanistan.
After the collapse of royal system in early 1970s, a group of relatively progressive thinkers came
to power, which was quickly challenged by different groups of radical Islamists during the
1980s. All leaders of relatively secular and Islamic parties were challenged by a group of
extremely radical Islamists, the Taliban, in the mid-1990s. Since the collapse of the Taliban in
2001, almost all of the previous political groups returned to the political system and participated
in a political process that continues to this date.
The three presidential elections of 2004, 2009, and 2014 presented many opportunities, but
also challenges. One of the challenges entails a labeling game that is a common method of
political rivalry in the Afghan political community. Labeling and blame games have confused
the new generation of Afghanistan to think properly about social identities presented by different
groups of Afghan political leaders. A very quick review of the Afghan social media suggests
that in most cases the general public is skeptical about their political leaders. The new generation
is particularly less willing to participate in the political process because it fails to recognize a
group identity that motivates them to join. Several polls in 2013 and 2014 suggested that more
than 50 percent of Afghan voters were not sure for whom they should vote, or whether they were
going to vote at all, while a considerable number of them were not interested to vote in the first
place (Shawe et al, 2013).
This chapter of analysis will present the search for any social or political identities that
Afghans have in the back of their minds. Are those identities ethnic based, which is a common
perception in the political community of Afghanistan, or is the basis something else? I will use

135
the rating pattern of respondents to look for systematic correlation and determine whether there
are any other factors that influence respondents about political leaders. If such latent variable
exists, are they significantly distinguishable? And, if there are signification factors, how should
we define those factors, given the cultural, social and political context of Afghanistan?
As mentioned previously, about 60 individuals from different backgrounds were interview in
the first stage, and they were asked the following two questions:
1. What characteristics do you want to see in a leader before you say, “I would like to
follow this leader?”
2. Which Afghan political leaders, do you think have those characteristics?
The answers to these questions produced a total of 63 leaders’ names who were mentioned
more than three times by all the respondents. I took these 63 political leaders and formed the
following three questions for the second-stage, fixed-form survey:
From your point of view, what are the strengths of Mr./Ms. [fill in the blank with name]?
(A specific name from the list of 63 political leaders was mentioned in each question.)
From your point of view, what are the weaknesses of Mr./Ms. [fill in the blank with
name]?
Considering all of the strengths and weaknesses you mentioned for leader [fill in the
blank with name], how would you rate him/her in a scale of 0 to 10? (10 being the most
ideal leader of your choice, and 0 the least ideal.)
Respondents were allowed to come back and change their ratings for a given leader if he or
she decided to do so after rating other leaders until he or she was satisfied with the ratings to all

136
63 leaders. A bar chart of scale distribution from 0 to 10, including nonresponses, for each ethnic
group, as well as at the national level, is depicted in Figure 7.1.
Figure 7.1: Distribution of scores (1 – 10) to actual political leaders of Afghanistan.
The challenge in collecting data for this question was the reluctance of respondents to share
their views about actual political leaders. Some nonresponses were expected because, after all,
Afghanistan is a society at war and it is not convenient for most Afghan residents to take risks
and comment on powerful politicians.
0%
10%
20%
30%
40%
50%
60%
70%
80%
90%
100%
Mirwais Nia
Ahmad
Shah
Baba
Abdul Rahman
Khan
Habibullah Khan
Amanullah Khan
Zahir Khan
Daw
ood Khan
Tarakee
Hafeezullah Amin
Babrak Karmal
Dr N
ajib
Sebghatullah Mujadadi
Ustad
Rabani
Ham
id Karzai
Qayoom Karzai
Ahmad
Shah
Masood
Hekm
atyar
Mullah Omar
Abdul Ali Mazari
Karim
Khalili
Marshal Fahim
Ahmad
Zia M
asood
Amrullah Saleh
Ustad
Atta
Ismael Khan
Gul Agha Sherzai
Mohqeq
Gen. Dostum
Ustad
Sayaf
Younus Qanooni
Shekh
Asif M
ohseni
Sayed Ahmad
Gelani
Ashraf G
hani Ahmadzai
Ali Ahmad
Jalali
Zalmay Khalilzad
Anwarul Haq
Ahadi
Ismael Yoon
Tahir Badakhshi
Sultan
Ali Kishtm
and
Haneef A
tmar
Farooq Wardak
Ram
azan
Bashar Dost
Dr Seema Samar
Shukria Barakzai
Fawzia Koofee
Semeen Barakzai
Habiba Sarabee
Banoo Ghazanfar
Malaly Joya
Dr A
bdullah
Dr Spanta
Besm
ellah Khan
Gen. Rahim
Wardak
Syed Mustafa Kazimi
Lateef Pedram
Baktash Seyawash
Ahmad
Behzad
Haji Qadeer
Omar Zakhilw
alKarim
Khuram
Omar Daw
oodzai
Mahmood Karzai
Ahmad
Wali Karzai
10
9
8
7
6
5
4
3
2
1
0

137
Figure 7.2: Summary statistics of missing
values in the dataset
The study protocol required
respondents to share their views
voluntarily and only if they felt safe to
do so. Therefore, it was not possible to increase the response rate more than a certain rate. Out of
the 568 respondents only 59 of them scored all leaders voluntarily. The chart in Figure 7.2
provides summary statistics of the missing values for this question.
As it was the case in first stage of analysis, responses exhibited significant divisions along
ethnic lines when characteristics of good political leadership were evaluated in the context of
actual political leaders’ names.
Respondents were given names and were asked to determine the most important
characteristic of leaders. Appendix VX shows the details of strong ethnic bias when respondents
evaluated characteristics of actual political leaders.
Scores of 63 leaders had missing data, and out of 568 respondents only 59 of them scored all
leaders without any missing data. In total, 20,813 missing points existed in the data, which
constitutes about 55.8 percent of all the data. Systematic analysis of missing points is presented
in Appendix – XV, which shows presence of two patterns. The pattern of nonresponses seemed
to be systematic, and Little’s MCAR test turned to be significant with Chi-Square = 11208.264,
DF = 10707, Sig. = 0.000. Therefore, I had to impute data using multiple imputation method of

138
SPSS to prepare it for factor analysis. Appendix XVI provides complete statistical details of
factor extraction.
Figure 7.3: Distribution of mean values
and its proximity to normal distribution.
Cronbach Alpha coefficient was
equal to 0.84, but histogram chart of
mean values suggested skewed scores
toward lower numbers, which means
low popularity of most political leaders
in Afghanistan. In a perfect world,
distribution of mean values should be close to a normal distribution, but in certain contexts
skewed mean distributions are not a major problem for extracting factors.
Usually it is important to rotate factors under both conditions of correlated and uncorrelated
factors, but in this case I only rotated them by restricting correlation of factors because it will not
only make interpretation of results easier, but also reduces the chances of one item loading on
different factors at the same time (reduces association of leaders to several underlying constructs
at the same time).
The scree plot of eigenvalues in Figure 7.4 shows that there are at least 13 factors with an
eigenvalue of greater than one. However, three of these factors are the most important ones
because they appear before the first knee in the graph. It is interesting to observe that there is
more than one observable knee in this scree plot. This leaves the decision to the research to

139
decide which knee should be accepted as the cutoff point and thus define only those factors that
have an eigenvalue of greater than that point.
Figure 7.4: Scree plot of Eigen values for main factors.
The summary of factor loadings is presented in the table below:
Table 7.1: Loading of Items (Political Leader) on Factors:
Political Leaders Factors with eigenvalue > 1
1 2 3 4 5 6 7 8 9 10 11 12 13
Ustad Atta 0.80 0.19 0.16 0.15 0.25 0.06 0.07 -0.03 0.08 0.00 0.03 0.15 0.02 Dr Abdullah 0.73 0.22 0.13 0.12 0.15 0.07 0.15 -0.03 -0.01 0.10 0.14 -0.15 -0.01 Younus Qanooni 0.67 0.28 0.28 0.21 0.10 -0.06 0.11 0.02 0.04 0.19 0.12 -0.05 0.05 Ahmad Shah Masood 0.66 0.29 0.14 0.01 -0.01 0.08 0.08 0.11 0.09 0.13 0.09 -0.04 0.05 Ismael Khan 0.66 0.14 0.07 0.24 0.16 0.12 0.09 0.11 0.32 0.04 0.18 0.06 -0.18 Amrullah Saleh 0.65 0.21 0.12 0.07 -0.02 0.07 0.04 -0.07 0.11 -0.02 0.07 0.35 0.08 Ustad Rabani 0.62 0.15 0.04 0.07 -0.07 0.22 0.29 0.31 0.12 0.13 0.15 -0.08 -0.08 Syed Mustafa Kazimi 0.61 0.20 0.27 0.24 0.06 0.07 0.08 0.06 0.04 -0.16 0.07 0.22 0.08 Besmellah Khan 0.58 0.13 0.22 0.08 0.15 0.13 0.04 0.12 0.14 0.21 0.16 0.03 0.19 Shekh Asif Mohseni 0.56 0.12 0.13 0.06 0.17 0.05 -0.05 0.15 -0.08 0.21 0.16 0.18 0.24 Baktash Seyawash 0.54 0.25 0.36 0.18 0.11 0.17 0.06 -0.12 0.16 0.10 -0.03 0.14 0.14 Ahmad Zia Masood 0.53 0.17 0.28 0.15 0.08 0.17 -0.08 0.11 0.11 -0.01 0.44 -0.02 -0.25 Habibullah Khan 0.52 0.22 -0.01 0.16 0.24 0.03 0.19 0.18 0.01 -0.10 -0.14 0.21 0.10

140
Ramazan Bashar Dost 0.49 0.14 0.42 0.14 0.00 0.15 0.11 0.14 0.05 0.13 -0.12 0.12 -0.06 Lateef Pedram 0.48 0.12 0.36 0.27 -0.02 0.16 0.22 -0.04 0.06 0.10 -0.18 0.14 -0.09 Banoo Ghazanfar 0.44 0.26 0.40 0.13 0.13 -0.02 0.06 0.04 -0.01 0.24 0.02 0.29 -0.01 Ustad Sayaf 0.43 0.12 0.16 0.12 0.08 0.28 0.13 0.37 0.14 0.03 0.04 -0.11 0.04 Mirwais Nika 0.21 0.78 0.19 -0.04 0.14 0.06 0.05 0.19 0.18 -0.05 0.01 0.07 0.13 Ahmad Shah Baba 0.34 0.74 0.13 0.05 0.15 0.11 0.05 0.09 0.11 0.09 -0.05 0.08 0.11 Zahir Khan 0.26 0.66 0.08 0.14 0.21 0.09 0.13 0.02 -0.02 0.04 0.14 -0.04 -0.12 Amanullah Khan 0.33 0.62 0.24 -0.03 0.00 0.01 0.12 0.01 0.10 0.14 0.16 0.02 -0.01 Dr Najib 0.38 0.49 0.25 0.14 0.04 -0.10 0.17 -0.10 0.06 0.19 -0.12 0.20 -0.07 Abdul Rahman Khan 0.12 0.48 -0.07 -0.03 0.35 0.22 0.12 0.17 0.05 -0.12 0.05 0.09 -0.21 Daoud Khan 0.30 0.48 0.04 0.09 0.01 -0.01 0.06 0.10 0.16 0.11 0.04 0.09 0.09 Hamid Karzai 0.21 0.47 0.09 0.19 0.36 0.05 0.10 0.11 0.11 0.35 0.12 -0.04 -0.02 Dr Spanta 0.11 0.26 0.10 0.23 -0.04 0.20 0.23 0.06 0.26 0.17 0.11 0.06 0.19 Shukria Barakzai 0.21 0.14 0.67 0.02 0.00 0.21 0.08 0.08 0.10 0.15 0.27 0.02 0.01 Malaly Joya 0.28 0.07 0.65 0.00 0.25 -0.01 0.09 -0.05 0.01 0.06 0.03 0.17 0.01 Fawzia Koofee 0.33 0.24 0.62 0.14 0.14 0.13 0.16 0.08 0.09 -0.11 0.00 0.19 0.29 Habiba Sarabee 0.34 0.30 0.54 0.16 0.13 0.21 0.00 0.08 0.05 0.18 0.15 -0.10 0.20 Dr Seema Samar 0.14 0.09 0.48 0.32 0.11 0.01 0.13 0.02 0.23 0.07 0.05 0.02 -0.05 Haji Qadeer 0.34 0.17 0.39 0.16 0.20 0.28 0.09 0.11 0.09 0.04 -0.01 0.02 0.09 Sayed Ahmad Gelani 0.14 0.18 0.33 0.00 0.19 0.11 0.08 0.19 0.11 0.07 0.28 0.17 0.29 Abdul Ali Mazari 0.16 -0.03 0.10 0.78 0.01 0.22 0.18 0.16 -0.01 0.03 0.10 0.07 -0.02 Mohqeq 0.34 0.04 0.13 0.67 0.17 0.11 0.21 0.17 0.09 -0.01 -0.04 -0.02 0.10 Karim Khalili 0.26 0.21 0.06 0.60 0.09 0.09 0.21 0.20 0.07 0.20 0.25 0.11 0.11 Gen. Dostum 0.47 0.16 0.15 0.48 0.16 -0.07 0.37 0.13 -0.07 0.06 -0.10 0.16 -0.01 Sultan Ali Kishtmand 0.25 0.05 0.27 0.47 0.06 0.06 0.24 0.06 0.01 0.14 0.20 0.35 0.04 Mahmood Karzai 0.09 0.14 0.21 0.04 0.77 0.31 0.09 0.18 -0.01 0.09 0.03 0.09 0.03 Gul Agha Sherzai 0.28 0.15 0.19 0.18 0.59 0.15 0.04 0.16 0.27 -0.05 0.00 0.05 0.01 Ahmad Wali Karzai -0.03 0.17 0.14 0.02 0.53 0.25 0.10 0.04 0.10 0.08 0.22 -0.05 0.10 Farooq Wardak 0.28 0.34 0.24 0.06 0.50 0.29 0.00 0.11 0.07 0.20 0.08 -0.03 -0.05 Qayoom Karzai 0.20 0.12 -0.05 0.11 0.45 0.11 0.28 0.29 0.17 0.09 -0.04 0.23 0.05 Gen. Rahim Wardak 0.28 0.27 0.29 0.19 0.34 0.30 0.00 0.17 0.07 0.06 0.04 0.12 -0.05 Omar Daoudzai 0.11 0.12 0.21 0.16 0.25 0.75 0.05 0.14 -0.04 -0.07 0.06 0.06 0.11 Karim Khuram 0.11 -0.04 0.02 0.05 0.26 0.66 0.03 0.06 0.25 0.14 0.14 0.04 0.02 Omar Zakhilwal 0.08 0.16 0.13 0.17 0.29 0.61 0.17 0.15 0.15 0.27 -0.04 -0.13 -0.09 Haneef Atmar 0.19 0.26 0.22 0.21 0.24 0.38 0.16 0.07 0.21 0.30 0.07 0.12 -0.15 Hafeezullah Amin 0.11 0.14 0.07 0.21 0.07 0.09 0.80 0.23 0.12 0.08 -0.03 0.05 0.11 Tarakee 0.15 0.13 0.10 0.19 0.11 0.12 0.75 0.06 0.01 0.12 0.10 0.05 -0.13 Babrak Karmal 0.20 0.09 0.29 0.31 0.13 -0.03 0.63 0.06 0.11 -0.11 0.18 0.10 0.13 Hekmatyar 0.06 0.13 0.00 0.15 0.18 0.10 0.08 0.76 0.14 0.05 0.14 0.09 -0.10 Mullah Omar 0.01 0.10 0.07 0.22 0.20 0.13 0.18 0.63 0.01 0.06 0.01 0.02 0.11 Sebghatullah Mujadadi 0.30 0.24 0.22 0.27 0.08 0.20 0.15 0.30 0.05 0.23 0.20 -0.20 -0.03 Ali Ahmad Jalali 0.19 0.18 0.14 -0.05 0.15 0.15 0.12 0.11 0.69 0.01 0.08 0.02 -0.06 Ashraf Ghani 0.13 0.40 0.17 0.17 0.16 0.13 0.02 0.13 0.57 0.27 0.01 -0.04 0.13 Anwarul Haq Ahadi 0.31 0.27 0.18 0.16 0.18 0.21 0.13 0.08 0.17 0.65 0.07 0.02 0.09 Ismael Yoon 0.18 0.01 0.36 0.02 0.07 0.34 0.04 0.26 -0.01 0.44 -0.03 0.21 -0.04 Marshal Fahim 0.34 0.06 0.17 0.25 0.15 0.12 0.18 0.18 0.07 0.07 0.67 0.11 0.04 Zalmay Khalilzad 0.10 0.29 0.20 0.11 0.14 0.14 0.23 -0.03 0.28 -0.05 0.33 0.14 0.12 Tahir Badakhshi 0.26 0.11 0.26 0.17 0.12 0.03 0.16 0.12 0.02 0.05 0.09 0.71 0.06 Ahmad Behzad 0.56 0.02 0.25 0.22 0.06 0.05 0.06 -0.07 -0.02 0.03 0.01 0.11 0.56 Semeen Barakzai 0.20 0.16 0.48 0.24 0.16 0.28 0.06 -0.09 0.19 -0.03 0.18 -0.06 0.01

141
eigenvalue 8.89 4.85 4.48 3.38 3.2 3.0 2.8 2.2 1.8 1.7 1.6 1.6 1.1
% of Variance
Explained 14.1% 7.7% 7.1% 5.4% 5.1% 4.7% 4.4% 3.5% 2.8% 2.8% 2.6% 2.5% 1.8%
Factor 1: Tajik Factor
The most significant underlying construct that defines views of the Afghans about the
identity of actual political leaders is the “Tajik” factor. Most of the leaders that load on this
factor with a covariance of above 0.4 are Tajik political leaders (see the cells highlighted in red
in Table 7.1). A few leaders, such as Shekh Asif Mohseni, Sayed Mustafa Kazaimi, Ramazan
Bashar Dost, Gen. Dostum, Banoo Ghazanfar, Ahmad Behzad, and Ustad Sayaf, who are not
necessarily Tajiks by ethnic background also load on this factor, but most of them have been
allies of the Tajik political parties at some point. Thus, they are perceived to be highly associated
with Tajik political leadership dimension of the Afghan society. This data suggest that Tajik
underlying constructs of political leadership in Afghanistan are prominent in Afghans’ minds.
However, it is important to note that current events usually affect the popularity of political
leaders, and political environment of Afghanistan is very fluid. Leaders are known to change
their affiliations and support based on the events that happen on daily basis.23 Therefore, this
might not be the case if similar analysis is conducted few years down the road. Appendix XVII
presents bivariate analysis of all political leaders (items) loaded on this factor with key social
strata such as ethnicity. As predicted before, the results show very significant ethnicity bias of
all respondents (most Tajiks have scored these leaders favorably and Pashtuns unfavorably).
23 This data was collected from early 2012 to mid-2013. The popularity of certain leaders was a product of events that were happening at that moment in time. Some of the relationships and affiliation that data captured might not make a lot of sense today.

142
Factor 2: Pashtun Factor
The second underlying construct that has formed respondents’ views about the identity of
actual political leaders is the “Pashtun” factor of political leadership. With an eigenvalue of
smaller than the Tajik factor, it seems to be the second most-important factor that influences
Afghans’ cognitive thinking about the identity of actual political leaders. The two leaders who
negatively load on this factor are Abdul Ali Mazari and Karim Khuram, which is an important
observation. Usually it is a helpful method to look at items that negatively load on a factor
because it helps the researcher to define the opposite side of the defined factor. While it is
understandable why Abdul Ali Mazari is negatively loaded on this factor (most Pashtuns do not
consider him as a member of political leadership community of Afghanistan), it is very strange to
see Karim Khuram, a Pashtun who is considered to be a radical Pashtun nationalist, is also
loaded negatively. It seems like most respondents did not score him similar to popular Pashtun
leaders, which means he is as much foreign to the community of Pashtun political leaders as
Abdul Ali Mazari. It is also important to note which Tajik leaders come close to the Pashtun
factor, even though, no one of them load with a covariance of greater than 0.4. The ones that
come close are Ahmad Shah Masud and Yunous Qanooni. Adversely, the Pashtun leaders who
come close to Tajik factor included, Ahmad Shah Baba, Amanullah Khan, Daoud Khan and Dr
Najib. This is because some Pashtun and Tajik leaders have been able to create a political
leadership identity for themselves that is popular beyond their own ethnic groups. See Appendix
XVIII for detailed bivariate analysis of these leaders with strata such as ethnicity.

143
Factor 3: Gender, Rights, and Anti-Jihadi
The third underlying construct that has influenced Afghans’ views about the identity of
political leaders is a mixture of gender, rights, and “Anti-Jihadi” factor. Although, the leaders
who have loaded on this factor are mostly women members of Parliament who are quite vocal
about crimes of Mujahedin and advocate for human rights and punishment of former Mujahedin
leaders. I think the most common political behavior that makes these leaders look similar is their
constant challenge of Jihadi power brokers. The items that mostly define this factor are such
leaders as Dr. Seema Samar, Ramazan Bashar Dost, and Malali Joya who load on this factor with
a covariance of greater than 0.4. Many other leaders who come close but do not fully load on this
factor have similar identities except for Sayed Ahmad Gailani, who happens to be a Jihadi
leader, but the most progressive and least criminal one of all Mujahideen leaders. He has been a
famous liberal Mujahedin leader since the early days of war in Afghanistan. The others are either
vocal or actively challenging the current Mujahideen leaders. Cross tabulation of ethnicity with
these leaders and the summary statistics of all leaders loading on this factor are presented in
Appendix XIX.
Factor 4: Hazara Factor
The forth underlying construct is Hazara factor of political leadership identity. This contains
the names of Afghanistan’s Hazara leaders, with the exception of Gen. Dustum, who is an Uzbek
leader but who still loads on both Tajik and Hazara factors with equal covariance. Dostum has
remained a close ally of the Tajiks and Hazaras for a long time, but the recent election changed
that pattern for the first time (as mentioned previously, the data were collected before the 2014

144
electoral grouping was formed).24 Therefore, these data and results do not reflect Dustom’s
recent shift of popularity. Recently, Dostum and some Hazara leaders advocated for the
unification of all ethnic groups with Turkic origin. The move was supported by the Turkish
government, but furiously rejected by the Iranians and other regional players who have similar
regional ambitions. It was particularly a problem for Hazaras as they consider Iran their
traditional supporters of Shia minorities of Afghanistan. The reason Dostum also comes close to
Tajiks is because Uzbek and Tajik leaders have been contesting Pashtun leadership since the
beginning of war in Afghanistan and are geographically mixed over the same parts of the
country. They also follow the Sunni sect of Islam, which is different from the Shia sect that
Hazaras are following. Although Hazaras and Uzbeks have closer ethnic ties, they do not get
along with the question of Islamic orientations in the forefront of politics.
The best evidence of ethnic cleavages in political leadership is the fact that Sultan Ali
Kishtmand, a former communist Hazara leader and ideologically the opposite of such leaders as
Abdul Ali Mazari, Mahqeq or Khalili is also loading on this factor. The only underlying
construct that connects all of them together is belonging to the same Hazara ethnic group. The
Hazara factor is the third strongest underlying construct in political leadership identity of
Afghanistan, and provides more evidence that political leadership in Afghanistan is not only
divided along Pashtun and non-Pashtun cleavages, but also within non-Pashtuns population of
the country. These additional cleavages were observable during early stage analysis, but not as
clearly as here. The reason for that, I think, is the presence of actual personalities whose
24 Political developments of Afghanistan post-election 2014 again show that Dostum is moving closer to his traditional allies than following his new course of support with Pashtuns.

145
identities are clearly associated with ethnicity. My first-stage analysis detected ethnic divisions
when respondents talked about characteristics of good political leadership, but only after names
of the leaders were mentioned. Appendix XX provides more details about bivariate analysis of
items loading on this factor.
Factor 5: Karzai Factor
I define an underlying construct of political leadership as the “Karzai” factor, because the
leaders who mostly load on this factor are close family members of Karzai or some of his close
allies/subordinates. Even those who come close to loading on it are of very similar in nature. For
example, Gen. Rahim Wardak, Omar Zakhilwal, Omar Daoudzai, Karim Khuram are all
perceived to be the key members of President Karzai’s patrimonial system of governance. The
best evidence that can help us re-confirm the definition of this factor is the negative loading of
Dr. Rangin Dadfar Spanta who was part of Karzai’s inner circle but not considered one of his old
friends, a family member, or tribal ally. Although Karzai is widely blamed for reinforcing the
tribal system of politics in Afghanistan, the system has long been part of the country’s political
culture. See Appendix XXI for univariate and bivariate analysis of all items that significantly
loaded on this factor.
Factor 6: Inner Circle
I define this underlying construct that defines Afghans’ views about the identity of political
leadership as the “Inner Circle” factor. Afghans elites refer to this group of leaders as the “Bats
of the Presidential Palace.” They created a public perception that controlling the flow of

146
information around the president is by itself a very important political leadership role that many
young Afghans were aspired to. The jobs around the president became very attractive, especially
after they learned that these people get paid lucrative sums by foreign intelligence institutions to
keep the views of the president positive toward their country’s interest. During Karzai’s time in
office, many believe that a group of close aides controlled most of his decision-making and
secret politics. They mostly became famous after Karzai began his rivalry with the Americans.
Additional bivariate analysis of these items is presented in Appendix XXII.
Factor 7: Communist Factor
I define the seventh underlying construct of political leadership identity in Afghanistan as the
“communist” factor. This group of leaders is probably the most distinguished group because no
matter how many times you run factor analysis under different conditions, they would still stick
together and load on the very same factor. It is relatively easy to define it because only former
communist leaders load on this factor. The leaders who significantly load on this factor are the
three famous communist party leaders. However, Dr, Najib, who was also one of the prominent
communist leaders, does not load on this factor and does not come close. Based on univariate
analysis of scores among all 63 leaders, it turns out that Najib is the most popular political leader
for the people of Afghanistan (see Appendix XXX for more details). He became the most
popular political leader of Afghanistan because of such events as:
13. His predictions about what might happen if the Mujahedin assumed power became
reality, yet it was difficult for people to believe that he could predict the event with such
level of accuracy. Most of Najib’s speeches are kept on smartphones, and new

147
generations of Afghans use his speeches in their political debates on social media as a
very strong evidence of what good leadership should look like.
14. He was brutally killed by the Taliban. Later, the incident was publicized as if the
Pakistani military generals who accompanied the Taliban to Kabul in 1996 killed him.
My data suggest that, on average, Afghans scored dead leaders more generously than
living leaders.
15. The recent announcement that Afghanistan’s ancient golden treasury was protected by
Najib during the civil war immediately increased Afghans’ respect for him. If it were not
for the communist background of his political career, he would have been chosen as the
national hero of Afghanistan by now.
A complete set of univariate and bivariate analysis of these items are presented in Appendix
XXIII.
Factor 8: Radical Islamic
I define this underlying construct as the “radical Islamic” factor of political leadership
identity in Afghanistan. The only two leaders who load on this factor are Taliban leader Mullah
Omar and Hizb-e-Islami leader Gulbudin Hekmatyar. During first stage of analysis, no one
mentioned the name of Haqani, otherwise, I suspect he would have also been loading on this
factor. The other leaders who came close to this factor were professor Rabani, Ustad Sayaf, and
Sebghatullah Mujadidi, who are all key political Islamic leaders of Afghanistan. The leaders who
negatively load on this factor come mostly from different political backgrounds, but their

148
commonality seems to be anti-Islamic radicalism. More bivariate analysis is presented in
Appendix XXIV.
Factor 9: Western Technocrats
The ninth underlying construct that has influenced public perception about the identity of
political leadership is the “Western Technocrats” factor. I think the most important identity
associated with this group is that they are all considered politicians who are loyal to the Western
countries. The other leaders who come somewhat close to this group, but do not load
significantly, are Dr. Spanta, and Dr. Zalmai Khalilzad, which makes sense. One member of this
group, Dr. Ashraf Ghani, also loads on the Pashtun factor, which explains part of the reason why
he was able to mobilize Pashtuns to vote for him in the 2014 election (the data for this study was
collected about two years before the electoral season). See additional bivariate analysis in
Appendix XXV.
Factor 10: Pashtun Nationalists
The next underlying construct seems to be radical “Pashtun Nationalists” factor of political
leadership in Afghanistan. The two political leaders who significantly load on this factor are
popular for being radical Pashtun nationalists who categorically reject the right of other ethnic
groups to run for presidency. They are also famous for promoting Pashtu language as a national
language in order to define Afghanistan as a Pashtun state with pure Pashtun criteria that would
make it significantly different from other countries such as Iran, Uzbekistan, Tajikistan, or
Turkmenistan. It is also believed that radical Pashtun nationalism is promoted as a counter

149
measure to contain Islamic radicalism among the Pashtuns of Afghanistan and thus navigate
Afghanistan in a different direction. Some political leaders who come close, but do not load
significantly include President Ashraf Ghani and Mr. Haneef Atmar. Appendix XXVI has
univariate and cross tabulation of these items.
Factor 11: VP Factor
Only two political leaders significantly load on this factor, Ahmad Zia Masud and Marshal
Mohammad Qasim Fahim, who were both Karzai’s vice presidents. They are both famous for
being willing to move away from their political constituencies to remain relevant to the food
chain. The other individual who comes close to this factor is Dr. Zalmay Khalilzad, who also is
famous for being a major power player during Karzai’s government. Therefore, I suspect this
construct is about the “second person” factor of political leadership identity in Afghanistan.
However, due to the fact that the last few factors have very small eigenvalue and very few
leaders load on it, it is hard to define them with confidence. The readers might define this factor
differently based on their reading of the Afghan political environment. Additional bivariate
analysis is presented in Appendix XXVII.
Factor 12: Tajik Nationalist
Only one political leader load on this factor and the eigenvalue is so low that it is a bit hard to
define it with confidence. The only leader who loads on this factor is Mr. Tahir Badakhshi who
was famous for being an anti-Pashtun power monopoly figure. He was killed by the communist
regime while he was in prison, and considered by many radical Tajik Nationalists as a symbolic

150
leader for those who want to challenge the monopoly of the Pashtuns over control of political
power. However, it is hard to define this factor as the “radical Tajik nationalism” dimension,
because many other political leaders who have similar popularities negatively load on this factor.
The most interesting example is Latif Pedram. Alternatively, Sultan Ali Kishtmand from Hazara
factor comes very close, while his background is quite different from those of Mr. Badakhshi.
The only commonality between these two leaders is that they were brother in laws, but not
politically aliened (Badakhshi was executed by the same political party that counted Kishtmand
as a member). See Appendix XXVIII to review univariate and bivariate analysis of these two
items.
Other Political Leaders:
There are several political leaders who did not load on any of the 13 factors significantly.
Given history of their political behavior it seems like one of the key characteristics that prevent
these leaders from loading on any of the 13 factors is because they are mostly cross-factor
personalities. Their behavior gives people a perception that they are associated with more than
two groups of political leaders at the same time. For a better understanding of the association of
these leaders, the bivariate analysis on all of them is attached as Appendix XXIX.
It is also important to have a look at another control question in the questionnaire. In the
second-stage fixed-form survey, I asked, “Who is the most famous leader of Afghanistan at the
moment?” I wanted to compare this with the findings from Chapter Six in which respondents
were pushed to think about leaders’ positive and negative points before rating them. I suspected
that asking a simple question about popularity of leaders might lead to a different set of answers

151
than examining the issue of good political leadership even if the names of the leaders were
mentioned.
The chart in Figure 7.5 depicts frequency of names mentioned in response to my control
question in the second stage.
Figure 7.5: Frequency of response to question of who is the most famous leader of Afghanistan.
For this simple question, Karzai is mentioned most frequently, while under systematic
research that was conducted in Chapter Six, Najibullah was rated as the best political leader. It
only confirms that my chosen method for this study was useful and produced better results. The
simple question, “Who is the most popular leader,” which is common question in public polling

152
of Afghanistan, detects the seasonal fame of politicians based on the political conditions of that
particular time. This is what I had expected from the beginning, and thus designed a control
question to check if it would be the case. This is an interesting example of how simple survey
research designs produce different result from cognitive anthropology researches. The fact that
I asked them to think and list positive and negative aspects of leaders’ personalities, pushed
respondents to think about their own norms and values and then bring each leader close to that to
decide how to rate them. Therefore, their answer contained more information that what a simple
survey can pick from quick-access memory. I suspect their answer to my question of who is the
most popular leader was based on their quick and shallow perception of what is commonly
thought about that leader in society. Cognitive anthropology is used to examine how
communities of people come to share cultural understanding of the world. It looks at how people
reason, define things, construct culturally shared models of the world, and act on the basis of
those models. It explores how cultural knowledge comes to have a patterned distribution
throughout society. I use methods developed for the study of cultures because I thought variation
of values and norms among different segments of Afghan population are diverse and had not yet
been empirically researched to discover what underlying construct really determines Afghans’
thinking about political leadership. Most works about the conflict and political culture of the
country fail to provide empirics about the exact norms and values that feed into the conflict
and/or form the political culture of Afghans.
I think the data set of rating and evaluating Afghan political leaders have more in-depth
information regarding the underlying constructs of political leadership than a data set that would
only ask Afghans for a list of popular or successful leaders. The findings from this chapter

153
provide a better map of norms and values that influences the views of Afghan when they think
about their political leaders. The model captures the obvious attitudes on the surface, as well as
the underlying constructs that help average Afghan citizen determine a good political leader.
The cognitive constructs that defines Afghans’ valuation of political leaders comprises about
five to seven hidden factors when the identity of the leader is not disclosed. It comprises about
12 to 13 factors when the identity of the leader is known. It is also detected that these two sets of
underlying constructs are not only different among them, but they also vary from the immediate
thinking of Afghans when they react on the basis of day-to-day politics.
The next chapter offers a summary of main findings from Chapters Five, Six, and Seven.

154
CH – 8: MAIN FINDINGS & POLICY IMPLICATIONS
To summarize the findings of this analysis, I would like to begin by defining leadership and
then proceed to the analysis of characteristics of good leadership, policy expectations of the
followers, and a quick review of main findings from the evaluation of actual political leaders.
After this, I will discuss those findings that have important policy implications. In doing this, I
will propose policies that could address some of the troubling implications of this research,
though each would require further analysis to determine best approaches and how to implement
it; they are ideas for future Afghan policies to resolve issues brought to light by this analysis, not
the subject of this research.
Definition of Leadership
It turns out that linguistic definition of leaders is not the same for all ethnic groups of
Afghanistan. Pashtuns and non-Pashtuns have different cognitive perception of leadership
because they use different words in the languages when they refer to leadership. Pashtun’s
cognitive thinking defines leadership more in the context of “eldership” because the word they
use for leadership in Pashtu is Mesher مشر, which basically means “elder.” However, non-
Pashtuns define a leader as a person who can guide them to a destination because the word they
use in Farsi is Raahnomaa, رھنما, which basically means the “guide.”
Analysis of Chapter Five, Characteristics of Leaders, suggests that there are detectable
differences between Pashtuns and non-Pashtuns over definition of leadership, and that includes

155
both cognitive and cultural perception of what a leader is all about. Their cognitive definition of
leadership impacts their views about characteristics of leadership when they think about an
actual political leader. It is probably more important for a Pashtun citizen of Afghanistan to see
his/her political leader as one of their elders, while this might not necessarily be the case for the
other ethnic groups such as Hazaras and Tajiks.
Further definitional analysis suggests that all ethnic groups expect a good political leader to
be highly educated, people oriented, a firm decision maker, honest and Muslim in his public
views. The analyses of Chapter Six (Expectations of Leaders) and Chapter Seven (Identity of
Political Leaders) suggest that the people of Afghanistan expect their leaders to be highly
educated, stay in close proximity with people, have good morals, be honest and just, and have an
Islamic identity. These are different characteristics from what outsiders, especially Westerners,
think Afghans should want to see in their political leaders. The definition of justice is probably
not the same for Afghans and Westerners. For Afghans, I believe justice is defined more in the
context of resource distribution than following certain rules and regulations defined by the state
or law. According to one political leader interviewed for this research, “the number one task
they [people of Afghanistan] expect their leader to be good at is resolving resource conflict that
they face in their daily life.” They come to your house and expect you as a leader to be able to
solve their conflict in a just way.25 It is likely because of this expectation of the Afghan people
that the Taliban established a mobile court policy in every stage of political life, even when they
did not possess territorial control over a specific geography. They probably knew this would
increase their image of political leadership in the eyes of average Afghan villagers. There is a
25 Interview conducted by the author in Kabul.

156
need for further research to explore Afghans’ expectations from their political leaders when it
comes to the delivery of justice. From the findings of this research we can only infer that “being
just” is one of the most important characteristics of good political leadership according to
Afghans’ definition.
Many Western supporters of Afghanistan assume that protecting citizens, providing security,
defending the country, being democratically elected, promoting civil rights, creating
employment, etc., are probably the most important expectations of political leaders for average
citizens in Afghanistan. However, this research suggests that people many not place much value
on these characteristics of political leadership, if any at all. Therefore, it is important to note that
the concept of political leadership in Afghanistan is defined differently from those in the West,
and it will have major policy implication when it comes to supporting Afghanistan in the coming
years to overcome its political instability and establishment of a legitimate political system.
Characteristics of Leaders
This analysis indicates that the strongest underlying construct26 in Afghans’ mind when
thinking about good political leadership correlates strongly with such characteristics as being
decisive, having a clear political agenda, being a good manager, accepting responsibility, being
honest, being just, not lying to the people, loving the country, believing in God, enforcing the
law, not discriminating on the basis of ethnicity, and being elected democratically. These are
probably the most important characteristics that an average Afghan wants to see in a political
leader before he or she decides to label him as a good political leader and decide to follow him,
26 Underlying construct is another term for the mathematical term known as factor.

157
based on this analysis. Many interviewed respondents categorically agreed that just and honest
behavior in the eyes of citizens is the key characteristic that boosts the popularity of an average
political leader. The success of Dr. Ramazan Bashar Dost in the 2009 election cannot be
attributed to any other characteristics other than he is widely perceived to be honest, just, fair,
and truthful in his words and behaviors.
The other dimension of the first underlying construct is about the capacity to get things done.
Afghans do not favor a leader who is weak and cannot get anything done. Characteristics such as
being decisive, being a good manager, and enforcing the law mostly point toward governing
capability of a good political leader that Afghans really want to see in practice. In a pairwise
analysis of the most important characteristics of good leadership, respondents rated the
governing capability of a leader higher than being elected democratically, and even higher than
being educated. The successes of many active governors, such as Ismail Khan in Herat province,
Ustad Atta in Balkh, and Gul Agha Sherzai in Nangarhar, turned them into popular political
leaders for a short period of time simply because Afghans appreciate the capability of good
governance by their political leaders. If these governors had exhibited more of the characteristics
that Afghans scored highly, they would have become important figures on the country’s national
political stage, as in the case for Atta, to some extent.
There is also a third dimension of the main underlying construct behind good political
leadership, according to this analysis, which is humility and not misusing the power of
leadership. Afghans emphasize such characteristics as being democratically elected, accepting
responsibility, and believing in God because the third dimension of this construct appears to be
the degree of humility in leaders. The concept of humility also emerges repeatedly when

158
reviewing the positive characteristics of current political leaders. If a political leader happens to
be strong, decisive, and yet humble and just, it would be hard to prevent his or her success in the
political leadership domain of Afghanistan. There are not many political leaders who are
considered humble by average Afghans. At some point, Karzai—probably during earlier stages
of his leadership (2001 to 2004)—was perceived to be a humble leader because he was not
misusing his power as much as he did later in office. Other political leaders who were described
by respondents as humble included the late Afghan leader Ahmad Shah Masood and Taliban
leader Mullah Omar.
The second underlying construct of good political leadership, Islamic dogmatism, correlates
with such characteristics as praying five times in the mosque, having religious education, being
highly educated, being selected through a Jirga, not letting foreigners into the country, and
fighting the foreigners. It turns out this factor of leadership also has three dimensions, which
includes education, religious dogmatism, and resisting foreign invasion. Given the lower
eigenvalue of this factor, these characteristics are certainly not as important as those that
belonged to the first factor, but still considerable importance in Afghans’ minds when they think
about good political leadership. The widespread emphasis on education is a relatively new
phenomenon, although religious education has been an important indicator of good leadership
for ages. Afghanistan’s educational system is relatively new. Before 1890, there was no sign of
modern education in Afghanistan. Except for some special education programs that were
specifically arranged for members of royal families, Afghans had to attend religious madrasas to
learn the basics of reading and writing. The introduction of modern education was not an easy
process in the early 1900s. The religious leaders of the country were quick to declare modern

159
education as not Islamic and thus forbidden to a Muslim child. Even in the 1960s, Afghan
families used to pay bribes to government officials not to enlist their children in newly
established schools. The collapse of the royal system and four decades of war and immigration
opened Afghans’ eyes toward the importance and effectiveness of modern education. Therefore,
we observed a strong emphasis on higher education for good political leaders while still
maintaining the importance of religious education. This attitude change is probably why more
than 5 million children were sent to school in 2001. Importantly, many average villagers of
Afghanistan harshly rejected a similar attempt by the Russians in 1980.
The second dimension is the clear impact of Islamic characteristics on the country, in
particular the past four decades of jihad and struggle against the Russians under the auspices of
religion. While Afghans are religious by many standards, they were not as religious 30 years ago
as they are today. The past three decades of war brought huge amounts of funds from outside
countries, including the United States, to finance religious education, build religious schools and
madrasas to sustain a force for the proxy war against the Soviet Union. Although the Soviet
Union collapsed in 1990, the effects of this earlier investment in religious education are felt in
the Afghan society today. The emphasis on both types of education is probably because the
United States and the rest of the world switched funding from religious schools to modern public
schools in 2001. If the outside commitment continues for another decade or so, we might observe
a switch in public emphasis from religious education and religious dogmatism to modern
education, thus prompting more harmony in future generations of Afghanistan.
The third underlying construct of good political leadership in Afghans’ minds highly
correlated with such characteristics as putting on a turban, putting on Perahan Turban, being

160
from Kandahar, being from a noble family, not being young, and seeing all ethnic groups with
one eye (which basically means treating all groups equally). Except for the last characteristic,
which is about justice and we have already covered that, the remaining ones only have one
dimension: That a leader has to be a Pashtun from Kandahar, and adhere to cultural norms and
values of Pashtuns. Univariate and multivariate analyses of these characteristics show that
putting on a turban and Perahan Turban (local Afghan Shalwar Kamis) are not necessarily
serious expectations by Pashtuns.
The last underlying construct of good political leadership in respondents’ minds is highly
correlated with such characteristics as not having two passports (meaning double citizenship),
not having family outside the country, not marrying a foreign woman, not having a business
outside the country, and not having a home outside the country. This construct has only one clear
dimension, which I would define as trustfulness and dependability of leaders. Afghans are
basically concerned about the loyalty of their political leaders to their followers. Existence of this
construct in Afghans’ minds suggests that there is considerable trust crisis between the people of
Afghanistan and their political leaders. While this construct might have emerged because of the
shortfalls of previous Afghan political leaders, one aspect clearly mentioned in this study is to
have a secondary “home” outside the country, whether it is in the form of a house, a business,
citizenship, or a wife. In the past 15 years, many past political leaders with secondary citizenship
made irresponsible decisions and then escaped the country to avoid the consequences. The
former minister of commerce and the governor of the Afghanistan Bank are examples of such
personalities.

161
However, political leaders also escape the country when they are out of power and some of
their decisions, especially reform decisions, appear to be controversial and/or against the norms
and cultural values of Afghans. Reformist leaders have faced major security consequences in the
past, and, therefore, other leaders have chosen to leave the country when they leave office.
Analyses were conducted with policy expectations as proxy measures of good political
leadership (instead of characteristics) to detect underlying constructs in Afghan minds when they
think about good political leadership. It turned out that similar constructs influence Afghans’
thinking even when proxy variables were changed for measuring the underlying constructs. But
when proxy measures were changed to the actual political leaders’ names, the analyses produced
completely different set of underlying constructs. The most dominant underlying construct in
this case was ethnicity as first, and second and third factors, respectively, correlated with Tajik,
Pashtun, and Hazara leaders. The third factor correlated with all female leaders, which formed
the third most-important construct in Afghans’ minds when they evaluated current political
leaders of Afghanistan. Below is a list of additional detectable factors, according to the size of
their eigenvalue:
1. Karzai family factor
2. Inner Circle factor
3. Communists factor
4. Islamist factor
5. Pro-West technocrats factor
6. Pashtun superiority factor
7. Vice president factor

162
8. Tajik superiority factor
The underlying constructs influenced respondent’s views to score leaders not only on the
basis of ethnicity and gender, but also political ideology that those leaders promoted. For
example, some leaders who loaded on the Tajik factor were not necessarily Tajiks by ethnicity,
but they were strong allies of Tajik leaders and their political objectives. One leader who loaded
on gender factor was not necessarily a woman, but he was a very strong ally of those female
leaders on political ideology grounds.
Therefore, we can conclude that most underlying constructs under the second factor of good
political leadership were about ethnic identity, gender identity, and political ideology. These
constructs actually have nothing to do with good political leadership but rather explain their
political identity in the context of Afghanistan’s domestic politics. This is probably why the
study of political leadership through analyzing the portfolio of actual political leaders and/or
using political leaders as proxy measures does not produce accurate results. This is the best proof
that the study of political leadership through psychometric analysis is the best way to go about
this phenomenon. It allows researchers to identify and distinguish deep underlying constructs
that people have in the back of their minds when they think about their ideal leaders. They might
not even know it themselves as vividly as this methodology reveals it.
One conclusion that I could make from such a drastic shift of underlying construct when
respondents reacted to the names of current political leaders is that the Afghan leaders have
successfully managed to introduce themselves as leaders of ethnicity, gender and political
ideology rather than leaders of justice, decisiveness, knowledge and other key Afghan values.

163
These are the constructs that usually come into play when people talk about leadership that really
want to see in their life. Therefore, it is very important to think about what could be done to
produce the ideal Afghan political leaders who might be the actual inspirational leaders for future
generations.
Policy Implications
It is well known that Afghanistan is a country where conditions for policy reform are harsh
and complicated. The country’s only functioning economy is based on narcotics, its political
system is badly damaged by widespread insurgency and its critical intuitions for good
governance are broken or nonexistent. Most of the Afghan leaders, as revealed by this research,
are perceived to be unpopular, incapable, and highly divisive along the lines of ethnicity, gender
and political ideologies. Under such conditions, it is hard to determine what needs to be
prioritized in order to begin the process of policy reform to develop good political leaders for the
future. Strong and functioning institutions are necessary to train future leaders, but on the other
hand, good leaders are needed in establishing these institutions. It is very much like the dilemma
of the chicken and the egg—one cannot exist unless the other one precedes it first. That is,
Afghanistan needs good leaders with the characteristics of leadership discussed above to create
the strong institutions that will make it a viable country able to produce strong leaders. However,
without institutions that can function and produce good leaders, Afghanistan lacks the leadership
it needs to accomplish this.
Given this situation in the country, the only way a policy reform process can begin is to have
a group of well-trained, highly capable, and critically committed individuals to join hands and

164
serve as the founding fathers of new institutions that can facilitate emergence of future political
leaders of Afghanistan. These institutions can only begin to exist if someone establishes them at
some point. In the absence of functioning institutions, policy reforms can never start, let alone
succeed in the long run, unless a strong leader makes it happen. A group of young, highly
educated, and seriously committed Afghans who have learned the necessary skills (e.g., the
Fulbright Alumni of Afghanistan) can begin the process of building institutions today so
Afghanistan has its people’s ideal good political leaders tomorrow. The majority of the policy
recommendations from this research will have to be implemented by such a group of strong
individuals, which will call the “founding leaders” of Afghanistan.
As soon as the first institutions necessary for the process of developing future good leaders
come into existence, the cycle of chicken and egg can be broken and the process of policy reform
will find its path. Once these institutions produce the next generation of good leaders and before
these founding leaders retire, the process of improving good political leadership in Afghanistan
can find its way into the future.
With that in mind, let me present a few policy recommendations that I think are highly
endorsed by the empirical findings of this research:
Policy Recommendation I: Fix the judiciary to deliver justice
It is hard to separate the importance of justice, honesty, and truthfulness from the image of
good political leadership in the minds of the Afghan population. A group of highly educated and
committed Afghans whom we might call “transitional leaders” or “founding leaders” of the
country can work on the reform process of Afghanistan’s judicial system. Restoration of justice

165
by the political system of the country will increase the political legitimacy of future leaders of
the country. No leader can establish justice unless he can create a functioning judiciary machine.
The research suggests that future leaders of the country cannot be viewed as good political
leaders unless they are perceived to be delivering justice. In the absence of a functioning and
effective judiciary system, no leader can win the title of good political leader even if he happens
to be a just leader. An individual cannot meet the judiciary demand of 30 million people, no
matter his or her commitment and power. Therefore, it is the top task of today’s transitional
leaders to build strong institutions for delivery of justice so future leaders can use them and
deliver justice in the country.27
It is not going to be easy; one of the sectors in which the international community never
succeeded in the past 15 years, was the reform of the Afghan judiciary system. The current
system is highly corrupt and influenced by the religious political figures. Given the Islamic
identity of the Afghan state, it would be hard for any reformist to bring radical changes in the
current system.
One approach for establishing a working justice system is to de-monopolize it. The de-
monopolization of the judiciary power can make a very strong crack in the corruption network of
the system. If the unofficial and traditional institutions of justice in local villages of the country
can be strengthen, most of the conflicts that Afghans have to bring to the courts can be solved at
the village level. Traditionally, highly respected and honest elders within communities establish
and run these institutions. They still exist because people frequently refer to them to resolve
27 Further research is necessary to define Afghans’ expectations when it comes to good judiciary system.

166
their issues. The only problem they have is that they are not trained lawyers and judges by any
academic measures. If a group of strong leaders begin to support these institutions and the
international community invests in their efforts, the process could become a success in the
medium to long term. Success of unofficial judiciary system can not only reduce the power of
the government’s corrupt judiciary machine, but will also reduce the relevance of Taliban’s
mobile judiciary policy which has gained considerable amount of political legitimacy for the
Taliban insurgency groups. If the unofficial judiciary structures gain power in the long run, the
existing government system can lose its relevance in the society at which point it is much easier
to abolish it and build a new judiciary system that works in harmony with the community owned
judiciary mechanism.
This policy cannot succeed unless the transitional Afghan leaders work side by side with
their international community and the civil society activists of Afghanistan to make it a success.
Again, this is only way the problem of injustice can be fixed in Afghanistan. There has to be
other ways to fix the country’s malfunctioning judiciary system, which I think needs further
research. However, the suggestion I presented here is one that could be effective.
Policy Recommendation II: Ensure candidates for high office are well qualified
Research suggests that political leaders’ capacity for governing and decision-making, and
proximity with people are scored highly by the Afghans. These characteristics are obtained in
schools as effectively as in practice. Policies that encourage future political leaders to develop
their governing and public relation skills can be very helpful for their success in becoming good
political leaders of Afghanistan. One way this can happen is if Afghanistan provides more

167
opportunities for systematic learning of governance and public relation knowledge and skills in
specialized higher education programs. Potential leaders of tomorrow would be able to learn
about the challenges of leadership before they resume a critical role in society. Systematic
progression in public leadership positions could also allow future leaders of Afghanistan to learn
the critical skills of governance, public engagement, and decision-making in a gradual manner
before they rise to the higher levels of leadership and damage their leadership image.
The government can endorse a policy that makes leadership education a prerequisite for most
junior leadership positions such as district governor office, parliamentarian candidates, judiciary
clerks, and mid-level ministerial positions. Such policy could be important because what
Afghans expect from their political leaders can hardly be learned in a typical school. It will be
easier for the Afghan leaders to learn critical expectations of the people through practical and
systematic engagement in early stages of life before they are challenged in higher levels of
leadership down the road. Early learning of leadership and governance skills can develop the
necessary capabilities in early jobs before potential leaders face higher expectations and
challenges in higher leadership positions. Such requirements by the country’s civil service
regulations could prevent leaders’ loss of popularity and increase their chances for becoming
more successful political leaders for the country. The government of Afghanistan along with the
current leaders of the country can make this policy happen. All future leaders of the country,
including other senior government officials would be affected by it.

168
Policy Recommendation III: Foster future leaders of good character
Another characteristic of good political leadership that was strongly detected by the
underlying construct analysis was degree to which a leader is affected by power itself. That
means when Afghan leaders are in a position of power they begin to act as if they are above the
law. For the sake of simplicity I will call this characteristic “humility” of political leaders.
Research shows that Afghans appreciate such characteristics as accepting responsibility, being
elected, enforcing the laws, and believing in God, all which emphasize the effects of power on a
leader’s behavior. It is well known that humility is a function of knowledge, education, and
systematic power containment policies. Requiring future leaders to be educated in such
disciplines as politics, economics, philosophy, and history will make it easier for them to
understand the consequences of violating the law while in power. These future leaders will be
more capable of living up to the expectations of the Afghan people, if they know what can
happen when they do not abide by the rules. Increasing a leader’s understanding of power, how it
impacts other human beings, and how it corrupts individuals can help that official overcome the
natural temptations of misusing power. Explicit recognition of how violating democratic norms
sets the wrong example for other politicians, and how they in turn will be tempted to follow that
course and use violence to obtain power, may help future leaders overcome the negative effects
of power.
Requiring educational credentials of future political leaders in Afghanistan may increase the
probability of developing humble leaders more than any other measures. This policy can happen
only if the current transitional leaders set the right examples, and work with legal system of the
country to make higher education a requirement for any political leadership position. They can

169
also work on several power containment policies, such as increasing checks and balances,
promoting freedom of media, and policy review institutions so senior political leader’s decision
go through a number of filters before it backfires on them and ruins their leadership popularity.
These policies will affect all senior public leaders of the country and requires strong commitment
of the current leaders to begin the cycle.
Policy Recommendation IV: Reduce the propensity towards radical Islamic dogmatism
The second strongest underlying construct in Afghans’ mind, when they think about good
political leadership, is formed by the “radical Islamic dogmatism” that has dominated Afghan
society for the last several decades. While part of it is due to sustained international support to
religious schools during the Cold War, another portion of it belongs to the Afghan society.
Arguably, this mindset has led to continuing violence and the destruction of opportunities for
Afghanistan to become more prosperous and peaceful. Reversing this popular perception (that
radical Islamic dogmatism is a positive leadership characteristic) may be critical to Afghanistan’s
future.
Afghanistan has always been a religious country with very low level of education for the
bulk of its modern history. Promoting modern education may be the best policy to reduce
religious dogmatism in Afghanistan. If this is true, the current leaders of Afghanistan need to
commit themselves to support sustained modern education for two to three decades to reduce the
effects of religious dogmatism in the country. It is also an important policy priority for the
international community to commit funding for public school education so it is available for the
next few generations of Afghans.

170
Furthermore, the current curriculum of Afghan schools is seriously skewed toward violence
and religious extremism. The content of language and math books of schools are contaminated
with extremely harmful ideas that will only make future generations of Afghanistan more
violent, more isolated, more radical, and less knowledgeable. Appendix XXXI shows several
pages of a school math book with translation of contents in English. If the future generations of
the country are educated with similar type of educational material, Afghanistan will never get a
chance to move out of the vicious circle of violence and religious extremism. A radically
religious Afghanistan will only serve the objectives of proxy wars, such as the Afghan Jihad
against the Soviet Union, while a knowledgeable Afghanistan will always know how to serve the
interest of its own people and its future prosperity. It is very important to know how religious
education serves Afghanistan’s national interest, and thus what kind of religious curriculums
need to be promoted for the religious schools of the country. There is a very famous Afghan
proverb, “The crop you plant is what you yield,” which explains the importance of good
education better than 100 books. It is, therefore, an extremely important policy priority for the
political leaders of Afghanistan to insure that future school curriculums are more knowledge-
oriented than violence-and religious-based.
Transitional leaders of the country need to work with the ministries of education, religious
affairs, and higher education to reform Afghanistan’s educational system and make this policy
work. This is the most important policy reform Afghanistan needs because it effects all of it
future generations, and it also cures additional causes of poor leadership that this research has
identified. For example, ethnic conflict is a major challenge to political stability and economic
security for the future generations of Afghanistan. While part of the problem is going to be

171
tackled by the first policy recommendation of this document, the other part can only be fixed
through sustained public education that promotes cross-cultural values of different ethnic groups
of Afghanistan. Future generations of Afghanistan can have less ethnic bias if they learn more
about the beauties of cultural diversity of Afghanistan. Early education will influence personal
values and norms. Therefore, it is very important for these differences to be reconciled at an
earlier stage of life so future generations of Afghans have a firm understanding of how different
ethnic groups are part of Afghanistan’s cultural mosaic. In the presence of solid cross-cultural
education, and a judiciary system that treats all citizens of the country equally, it would be easier
for future generations of Afghanistan to produce more national leaders than ethnic.
The research also shows that Afghans expect their political leaders to be against foreigners
and fight them in order to be perceived as good political leaders. Fighting foreigners has turned
into a patriotic behavior since the invasion of Afghanistan by the British, and then the Russians,
and then the Americans during the past two centuries. Many Afghans today do not have clear
understanding of the international regime and rules of engagement among nations. Such lack of
understanding reduces their capability to form their views about other countries in light of their
national interest rather than traditional rhetoric that they have heard from their ancestors.
Future generations of Afghanistan need to be educated more on the realities of the
international system and its political and economic regime to counter this biased perception of
what constitutes a good leader. They need to know how the relationship of a country is
determined in the global space.

172
They also need to know world history, a subject that has never been taught in Afghan schools
since the onset of modern education. It is important that future public education curriculums
teach Afghan children how the concept of fighting foreigners emerged in the past, and when it
serves the vital interests of Afghanistan to go to war with other nations. They need to know that
the idea of fighting foreigners was most relevant during the era of colonialism, which does not
exist in the international system any more. They need to learn that the interest of the country
should determine what to do with every other nations of the world, at every stages of time, not
the blanket label of “foreign” all the time. Future generations need to be aware of how previous
generations were sent to bloody wars under the auspices of fighting the foreigners, but the
eventual results of those wars were destruction, poverty, poor relationships with more countries,
and the return of more foreigners to the country. Transitional leaders of the country will have to
be the primary agents of change to reform Afghanistan’s educational system and make it more
attune toward critical needs of good political leadership for tomorrow. The new generation of
leaders need to protect future generations of Afghanistan from those educational material, which
bring only war, destruction and blood. As mentioned before, this is the most important policy
reform the country needs and it will affect every individual in the future. While several
ministerial organizations will have to work on it, the most important stakeholder for this policy is
a committed and well-trained group of transitional leaders who can begin the process of change.
Policy Recommendation V: Provide specialized training for future political leaders
There are very few aspects of political leadership about which Afghans are as clear as their
desire that their leaders should be highly educated and professionally trained. A common
“understanding” about Afghanistan has always been that Afghans rate their political leaders on

173
the basis of how successful they are in providing security and economic opportunities. This
research suggest that Afghans view good leadership as not defined on the basis of reducing
conflict and poverty, but rather in the context of the social and cultural values of the country.
Afghans define good political leaders more on the basis of qualities such as education, ethnicity,
religious identity, proximity with people, and ruling capability, rather than achieving political
and economic prosperity. Training of future leaders should recognize this distinction.
Empirical evidence suggests that Afghans expect their political leaders to be well educated.
The majority of Afghan leaders completed some form of high school education in the country
before they moved to other countries to obtain higher educational degrees. For example, King
Zahir Shah, Presidents Najibullah, and Karzai are a very few examples of leaders who went to
Habibia High School, the first high school that was built in Afghanistan with the assistance of
the United States. Schools were always at the forefront in producing new leaders of Afghanistan.
After several years of United States disengagement with Afghanistan, in 2002, the largest project
of U.S. government assistance to Afghanistan was the return to school for 4 million children. It is
therefore, not a surprise that one of the main characteristics of a good political leader is defined
to be highly educated person. Afghans expect their leaders to be more educated so they can lead
people toward a better tomorrow.
Moreover, the country does not have any specialized school for political leadership, yet
needs good political leaders to make a better future. Political leadership is not a distinct
academic discipline in most academic institutions, yet in some countries specialized institutions
exist which help improve political leadership in the society. The institute for political leadership
in Harvard University is one example of such educational institutions in the United States. Many

174
regional neighbors of Afghanistan have such instruction under their military programs, but not
available to civilians. It might be helpful for Afghanistan to establish a political leadership
school where future generations of leaders can learn better skills for serving in public domains.
Learning more specific topics about the essence of good political leadership for Afghanistan
could be another item in the curriculum, which is subject to further research and analysis.
Countries with diverse cultural values but plagued by conflict need such institutions to build a
generation of leaders who are trained specifically to stay above existing challenges in an effort to
solve them. For example, future Afghan leaders need to understand the most important factors
that determine people’s judgment about good political leaders in order for them to be one of
those perceived as such. Or, for instance, it is important that future leaders understand that justice
and honesty are important political values for the people of Afghanistan. Data suggest that ethnic
divergence happens when respondents evaluate political leaders. Divergences are mostly driven
by diversity of norms and values among different segments of Afghan population. Future
political leaders need to be alerted toward such characteristics of the society. They need to
prepare to overcome the challenge of diversity in cultural norms. At the very least, they need to
know where norms and values become critically important to certain ethnic groups of
Afghanistan, and adjust their policy decisions accordingly. Establishment of a political
leadership institute and amendment of the country’s education programs to include leadership
skills can pave the road for future leaders of the country. Further research might be necessary to
determine the exact scope and size of such educational amendments.
While improving country’s educational system is an important policy recommendation to
facilitate growth of better political leadership in the long run, we need additional measures to

175
ensure current leaders are equipped with better educational attributes. To achieve this goal, a
group of transitional leaders who have already obtained higher degrees of education can commit
themselves to establishing a mid-carrier political leadership school in Afghanistan to specifically
enroll the current and near future leaders of the country. The international community can
support such an initiative to reduce the financial burden of making it happen, and the government
can help it by demanding current generation of political leaders to take classes in such an
institution as part of their job requirements. Further research could be employed to determine the
scope and the content of special leadership training program.
Policy Recommendation VI: Teach Afghan children about the country and their cultures
Afghanistan’s current school curriculum does not teach children about ethnic and identity
divergence of Afghanistan. This is probably part of the reason why the research shows strong
ethnic divergence among respondents to the study. Most Afghans inherit cultural values from
their own family and neighborhood, and that makes them very alien to the cultural norms and
concepts of other ethnic groups of Afghanistan, who do not necessarily live in their
neighborhood. Such educational gaps makes leaders of Afghanistan vulnerable when they face
political maneuvering in the form of cultural norms and values. It is hard to lead in modern
societies if you do not hook up with followers’ cultural norms and values, especially if you are in
a country where these cultural factors are at the heart of political disagreements. Cross-cultural
educational activities can help future generations of political leaders to become more immune
against the politics of ethnic diversity. While the other policy recommendations of this study
may take time to amend school curriculums, the country needs a widespread public awareness
campaign to help Afghans understand the challenge of diversity in the short run.

176
Afghanistan traditionally has been a country where teachers and religious officials have had
major roles in public leadership tasks, especially in local public awareness campaigns. Given this
characteristic of the society, it is important to establish incentives and mechanisms to attract
highly intelligent citizens in an effort to start a national campaign about the value of diversity
among different ethnic groups. The media and other social forums can be the other groups of
stakeholders for such a mass awareness campaign. The process should help people learn about
their own divergence of norms and values, and the need for cooperation with their leaders to
move them toward some sort of convergence. Public awareness is probably the most important
instrument to inform people that diversity is normal and they should not judge good political
leaders on the basis of their ethnic and cultural affiliations. This policy also will affect most of
the population of the country and can be initiated and lead by a group of strong leaders in
coordination with the international community. Afghan leaders need to be challenged to institute
such programs.
Policy Recommendation VII: Provide safeguards for political leaders
Recent technological advances have connected the world in ways previously unimaginable.
A modern human being moves around the world and connects to different societies very easily.
Advances in information technology and the Internet make it harder for people to consider
themselves as members of one society and ignore others. This phenomenon has affected citizens
of the modern world as well as those of the least developed countries, though to different extents.
Educational and employment curiosity is particularly a force behind every modern citizen’s
decision to travel to different parts of the world and possibly become member of larger global
community.

177
On the other hand, the high cost of being a decision-maker in a divided and at-war society
makes it risky for political elites not to shield their children from the reactions of the society,
especially when their reform policies fail and people retaliate. President Daoud was murdered
with several members of his family, including his young children, because members of the
society did not agree with some of his policy decisions. Similar incidences have happened to
many mid-level political leaders when the state collapsed or the country’s political regime
changed.
It is also a reality that the gap in knowledge, social norms, and values between Afghan
political leaders and their followers makes their policy positions very alien to the average
followers. This has been particularly deadly for most reformists who tried to bring socio-
economic changes for the country. King Amanullah and Najibullah are outstanding examples.
The history of Afghanistan shows that Afghans do not forgive their leaders when they enforce
any policy that is targeted toward social and cultural changes. While most educated leaders
know that these changes are necessary for the country to catch up with the rest of the world,
average Afghans are very sensitive toward change and highly suspicions of any foreign ideas.
On the other hand, lack of professional education and solidarity among the political elites of
Afghanistan make them very tough enemies of each other. For example, they cannot agree on a
code of conduct that determines how far to punish the losing side of political maneuverings.
When opposition groups try to pave the road for their return to power, the group in power never
calculates how much to resist them so that when they do return to power they do not take a
bloody revenge. By the same token, those who assume power never have a measure of how to
treat the outgoing group of political elites to prevent the creation of an insurgency group and

178
maintain an acceptable standard of living in the society. Lack of such agreements among Afghan
political elites makes political confrontation dangerous, and thus the leaders nervous about life
outside the power circle.
Therefore, a lack of personal security and safety for political elites makes it an optimal
choice for them to seek a secondary citizenship in a different country where they can save the
life of their loved ones in case their policy agenda fails and they face public revenge. This has
been a popular method of securing life in the past five decades of war and conflict. Kings who
ruled Afghanistan before the period of political instability have also used similar methods. Over
time, every one learned how to immunize themselves against future failures before they moved
toward political leadership positions.
Today, due to abundance of political leaders with double citizenship, the Afghan people have
developed a measure for the sense of belonging to the country, which basically means do not
have a secondary passport if you want to be perceived as a good political leader for the country.
Residents are convinced that if a political leader has a way out of the country, it is not possible to
hold them responsible for their decisions— they make bad decisions but do not want to live with
the consequences of them. The last 14 years of Karzai’s government provided lots of
justification for the average Afghans to take this issue seriously. They even pushed for
incorporating such measures into the constitution of the country. However, because of some
pressure from Western countries, this law bound only the President. This research catches some
of the symptoms of this phenomenon as it was carried out at a time when many presidential
candidates had double citizenships. Members of all ethnic groups and genders scored highly

179
such characteristics as a good leader should not have home, business, or even wife located in a
different country.
The best way future leaders can cope with such a challenge is putting strong policy measures
in place toward safeguarding the lives of political leaders and their immediate family members.
Development of a code of conduct among future political leaders can definitely help, but it has to
be introduced to them in the early stages of their educational lives so they really honor them. An
overhaul of the processes in which one person decides on key reform decisions is needed to
ensure no individual is penalized for such actions, especially when controversial laws are at
stake. The new methods of decision-making should be communicated to all Afghans so they are
aware that no one person is responsible for reforms. Special education programs for future
leaders should emphasize that Afghan officials need to stay away from making unilateral
decisions in order to make history or put other people behind. The country might not be able to
institute such methods of decision-making and distribution of power until Afghanistan gets out
of the gravitational field of war and conflict, but it should have a plan to do so. It is also
important for future Afghan leaders to spend more energy on systematic reforms through
educational and economic growth rather than pushing for quick fixes. Even if there are some
areas that require quick fixes, future leaders should calculate the cost of an uprising and state
collapse in comparison with the benefits of quick-fix policy decisions.
After all, people understand there are no quick solutions for Afghanistan to get out of its
current state of political and economic instability. Only sustained education and economic
progress can restore Afghanistan on a path toward success and prosperity.

180

181
BIBLIOGRAPHY
Associated Press, “Karzai Backs Down in Dispute with Afghan Lawmakers,” USA Today, January 22, 2011, web page. As of January 11, 2016: http://usatoday30.usatoday.com/news/world/environment/2011-01-22-afghanistan-parliament_N.htm
Barfield, T., Afghanistan: A Cultural and Political History, Princeton: Princeton University
Press, 2010. Barth, Frederik, Political Leadership Among Swat Pathans, The Athlone Press, University of
London, London School of Economics Monographs on Social Anthropology, No. 19, 1959. Behn, R. “What Right Do Public Managers Have To Lead?” Public Administration Review,
Vol. 58 No. 3, 1998, pp. 209-224. Bennis, Warren, On Becoming a Leader, Second Edition, New York: Basic Books, 2003. Bennis, Warren, and Patricia W. Biederman, The Secrets of Creative Collaboration, New
York: Perseus, 1997/
Bennis, Warren, and Robert J. Thomas, Geeks and Geezers: How Era, Values, and Defining Moments Shape Leaders, Boston, Mass.: Harvard Business School Press, 2002.
Bernard, H. Russell, Research Methods in Cultural Anthropology, Second Edition, Newbury
Park, Calif.: Sage Publications, 1994. Bernard, H. Russell, Research Methods in Anthropology: Qualitative and Quantitative
Approaches, Fourth Edition, Oxford, UK: AltaMira Press, 2006. Blondel, Jean, Political Leadership: Towards a General Analysis. London: Sage
Publications, 1987 Bose, Meena, “What Makes a Great President? An Analysis of Leadership Qualities in Fred I. Greenstein’s ‘The Presidential Difference’,” in Berman, ed., 2006, pp.
27–44. Bryman, Alan, Charisma and Leadership in Organizations. London: Sage Publications,
1992.

182
Burns, James, Leadership, New York: Harper and Row, 1978. Cialdini, Robert, “Harnessing the Science of Persuasion,” Harvard Business Review, October
2001, pp. 71-80. Ciulla, Joanne B., Ethics: The Heart of Leadership, First Edition, Westport, Conn.: Quorum,
1998. Ciulla, Joanne B., Ethics: The Heart of Leadership, Second Edition, Westport, Conn.: Praeger, 2004. Caulkins, D. D. 2001. Consensus, clines, and edges in Celtic cultures. Cross-Culture
Research 35:109–26. Dahl R., Neubauer D, Readings in Modern Political Analysis, Englewood Cliffs, N.J.:
Prentice-Hall, 1968. deMunck, V., N. Dudley, and J. Cardinale. 2002. Cultural models of gender in Sri Lanka and
the United States. Ethnology 41:255–61. Edinger, Lewis, Approaches to the Comparative Analysis of Political Leadership. The
Review of Politics, Vol. 52 (No. 4), 1990, pp. 509-523. As of January 13, 2016: http://www.jstor.org/stable/1407521
Ellis, Richard, Robert Kagan and Austin Ranney, “A Cultural Theory of Leadership,” in
Bryan D. Jones, ed., Leadership and Politics: New Perspectives in Political Science, Lawrence, Kan.: University Press of
Kansas, 1989, pp. 87–113. Ferguson, Niall, Virtual History: Alternatives and Counterfactuals, New York: Perseus,
1999. Furlow, C. 2003. .Comparing indicators of knowledge within and between cultural domains.
Field Methods 15:51–40. Gergen, David, Eyewitness to Power: The Essence of Leadership, Nixon to Clinton, New
York: Simon & Schuster, 2000. George, Alexander L., and Andrew Bennett, Case Studies and Theory Development in the Social Sciences, Cambridge, Mass.: MIT Press, 2005. Greenstein, Fred, The Hidden-Hand Presidency: Eisenhower as Political Leader, New York:
Basic Books, 1982.

183
___, “Dwight David Eisenhower: Leadership Theorist in the White House,” in Fred Greenstein, ed., Leadership in the Modern Presidency, Cambridge, Mass.: Harvard University Press, 1998, pp. 76–107.
___, The Presidential Difference: Leadership Style from FDR to George W. Bush, Princeton,
N.J.: Princeton University Press, 2004. ____, “Plumbing the Presidential Psyche: Building on Neustadt and Barber,” in Larry
Berman, ed., The Art of Political Leadership: Essays in Honor of Fred I. Greenstein, New York: Rowman & Littlefield, 2006, pp. 17–26.
Grint, Keith, Leadership: Classical, Contemporary, and Critical Approaches, New York: Oxford University Press, 1997. ___, The Arts of Leadership, New York: Oxford University Press, 2000. ___, Leadership: Limits and Possibilities, New York: Macmillan, 2005. Hamby, Alonzo, “Leadership, Charisma, and Political Cultures in the Great Depression: Adolf Hitler, Franklin Roosevelt, and Stanley Baldwin,” in Larry Berman, ed., The Art of Political Leadership: Essays in Honor of Fred I. Greenstein, New
York: Rowman & Littlefield, 2006, pp. 17–26. Hartley, Jean, “Public Sector Leadership and Management Development,” in Jeff Gold,
Richard Thorpe and Alan Mumford, eds., Gower Handbook of Leadership and Management Development, Farnham, U.K.: Gower Publishing Unlimited, 2010, pp. 531-546.
Hartley, Jean, and Maria Allison, “The Modernization and Improvement of Government and
Public Services: The Role of Leadership in Modernization and Improvement of Public Service,” Public Money and Management, Vol. 20, No. 2, 2000, pp. 35-40.
Hartley, Jean, and John Benington, Leadership for Healthcare. Bristol, Conn.: Policy Press,
2010. Harvey, S. M., and S. Thorburn Bird. 2004. What makes women feel powerful? An
exploratory study of relationship power and sexual decision-making with African American at risk for HIV/STDs. Women and Health 39:1–18.
Haslam, S. Alexander, Stephen Reicher, and Michael Platow, The New Psychology of
Leadership: Identity, Influence, and Power, Sussex, U.K.: Psychology Press, 2010. Hay, Colin, “Structure and Agency,” in David Marsh and Gerry Stoker, eds., Theory and
Methods in Political Science, First Edition, New York, N.Y.: St Martin’s Press, 1995, pp.192–206.

184
___, Political Analysis: A Critical Introduction, New York: Palgrave, 2002. Heifetz, Ronald A., Leadership Without Easy Answers, Cambridge, Mass.: Harvard
University Press/Belknap Press, 1994. Hollander, Edwin, “Ethical Challenges in the Leader–Follower Relationship,” Business
Ethics Quarterly, Vol. 5, No. 1, January 1995, pp. 55-65. Israel, Joachim, and Henri Tajfel, The Context of Social Psychology: A Critical Assessment,
London: Academic Press, 1972. Jaskyte, K., and W. W. Dressler. 2004. Studying culture as an integral aggregate variable:
Organizational culture and innovation in a group of nonprofit organizations. Field Methods 16:265–84.
Kellerman, Barbara, Leadership: Multidisciplinary Perspectives, Englewood Cliffs NJ: Prentice Hall, Pp. XVI, 288, 1984. ___, Political Leadership: A Source Book, Pittsburgh: University of Pittsburgh
Press, 1986.
___, Reinventing Leadership: Making the Connection Between Politics and Business, Albany, N.Y.: State University of New York Press, 1999.
___, Bad Leadership: What it is, How it Happens, Why it Matters, Boston, Mass.:
Harvard Business School Press, 2004. ___, Followership, Boston, Mass.: Harvard Business School Press, 2008. Kempton, Willett, James Boster, and Jennifer Hartley, Environmental Values in American
Culture. Cambridge, Mass.: MIT Press, 1996 King, Anthony, Leaders’ Personalities and the Outcomes of Democratic Elections, New
York: Oxford University Press, 2002. Klenke, Karin, Women and Leadership: A Contextual Perspective, New York: Springer, 1996. Kline, Paul, An Easy Guide to Factor Analysis, New York: Routledge, 1994. Lane, Robert E., “Epilogue: Rescuing Political Science from Itself,” in David O. Sears, Leonie Huddy and Robert Jervis, eds., Oxford Handbook of Political Psychology, New York: Oxford University Press, 2003, pp. 755–793.

185
Lord, Carnes, The Modern Prince: What Leaders Need to Know Now, New Haven, Conn.:
Yale University Press, 2004. Mant, Alistair (1999), Intelligent Leadership, Second Edition, London, England: Allen &
Unwin, 1999, p. 6. Masciulli, Joseph, Mikhail Molchanov, and W. Andy Knight, The Ashgate Research
Companion to Political Leadership. United Kingdom: Ashgate Publishing Limited, 2009. Messick, David, and Roderick Kramer, The Psychology of Leadership: New Perspectives and
Research, Mahwah, N.J.: Lawrence Erlbaum Associates, Publishers, 2005. Miller, M. L., J. Kaneko, P. Bartram, J. Marks, and D. D. Brewer. 2004. Cultural consensus
analysis and environmental anthropology: Yellowfin tuna fishery management in Hawaii. Cross-Cultural Research 38:289–314.
Nye, Joseph, “New Models of Public Leadership,” in Frances Hesselbein, Marshall
Goldsmith and Iain Somerville, eds., Leading Beyond the Walls, San Francisco, Calif.: Jossey-Bass, 1999.
___, The Powers to Lead, New York: Oxford University Press, 2008. Porter, Lyman, and Grace McLaughlin, “Leadership and the organizational context: like the
weather?” Leadership Quarterly, Vol. 17, 2006, pp. 559-576. Putnam, Robert, The Comparative Study of Political Elites, Englewood Cliffs, N.J.: Prentice-
Hall, 1976. Rejai, Mustafa, and Kay Phillips, Concepts of Leadership in Western Political Thought, Westport, Conn.: Praeger, 2002. Romney, A. Kimball, Susan C. Weller, and William H. Batchelder. 1968. “Culture as
Consensus: A theory of Culture and Infomrant Accuracy.” American Anthropologist 88:313–338.
Rousseau, Jean-Jacques, Basic Political Writings, trans. and ed. Donald A. Cress, Indianapolis, Ind.: Hackett, 1987. Royce, J. R. (1963) ‘Factors as theoretical constructs’, in D. N. Jackson and S. Messick (eds)
Problems in Human Assessment. New York: McGraw Hill. Service, Robert, Lenin – A Biography, Cambridge, Mass.: Harvard University Press, 2000.

186
Shambaugh, David, Deng Xiaoping: Portrait of a Chinese Statesman, New York: Oxford University Press, 1995. Shawe, Keith, Shahim Ahmad Kabuli, Shamim Sarabi, Palwasha Kakar, and Zach Warren,
Afghanistan in 2013: A Survey of the Afghan People, The Asia Foundation, November 2013. As of January 13, 2016: http://asiafoundation.org/resources/pdfs/2013AfghanSurvey.pdf
Spearman, C. (1904): General Intelligence: Objectively Determined and Measured, American
Journal of Psychology 15:201-92. Swora, M. G. 2003. Using cultural consensus analysis to study sexual risk perception: A
report on a pilot study. Culture, Health, and Sexuality 5:339–52. Tucker, Robert C., “Personality and Political Leadership,” Political Science Quarterly, Vol.
92, No. 3, 1977, pp. 383–393. ___, Politics as Leadership, Second Edition, Columbia, Mo.: University of Missouri Press,
1995. ___, Political Culture and Leadership in the USSR: From Lenin to Gorbachev, New York:
W.W. Norton and Company, 1987, pp. 34-40, p. 199. ___, From Max Weber: Essays in Sociology, Oxford University Press, 1958. Weinberg, Ashley, The Psychology of Politicians, Cambridge, U.K.: Cambridge University
Press, January 2012. Weller, S. C., and A. K. Romney. 1988. Structure interviewing. Newbury Park, California:
Sage. Wildavsky, Aaron B., Cultural Analysis: Politics, Public Law, and Administration. Vol. 1,
Transaction Publishers, 2006. Wilson, Hamilton, Building Leadership for Transition: The Challenge of Afghanistan, People
in Aid, 2011. As of January 13, 2016: http://www.peopleinaid.org/pool/files/pubs/building-leadership-for-transition-afghanistan-
%282011%29.pdf Yukl, Gary, Leadership in Organizations, Sixth Edition, Upper Saddle River, N.J.: Pearson
Prentice Hall, 2006.

187
APPENDICES


189

190

191

192

193

194

195

196

197

198

199

200

201

202

203

204

205

206

207

208

209

210

211

212

213

214

215

216

217

218
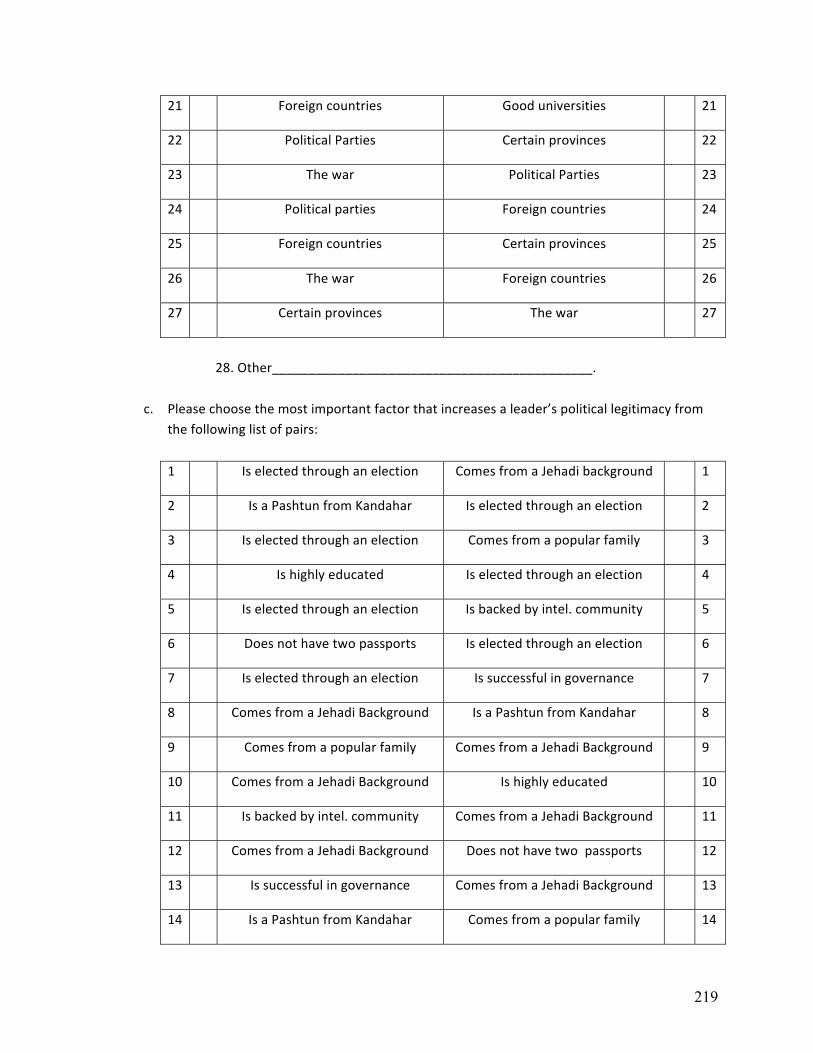
219

220

221

222
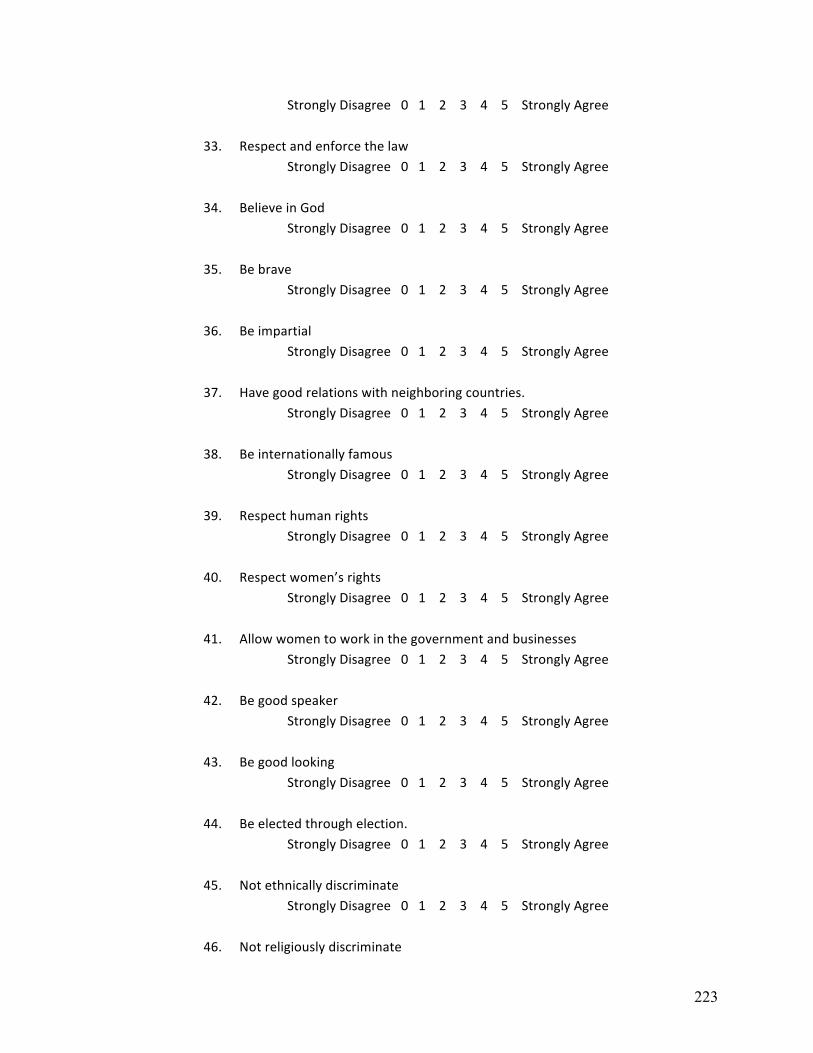
223

224

225

226

227
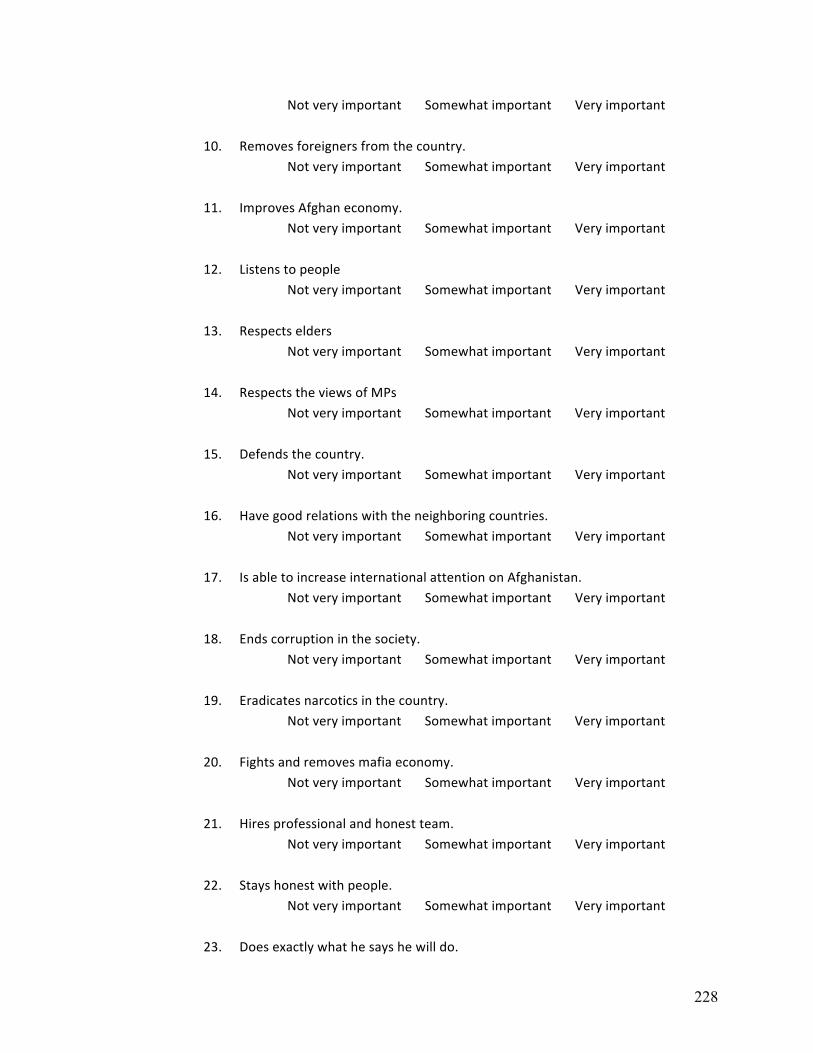
228
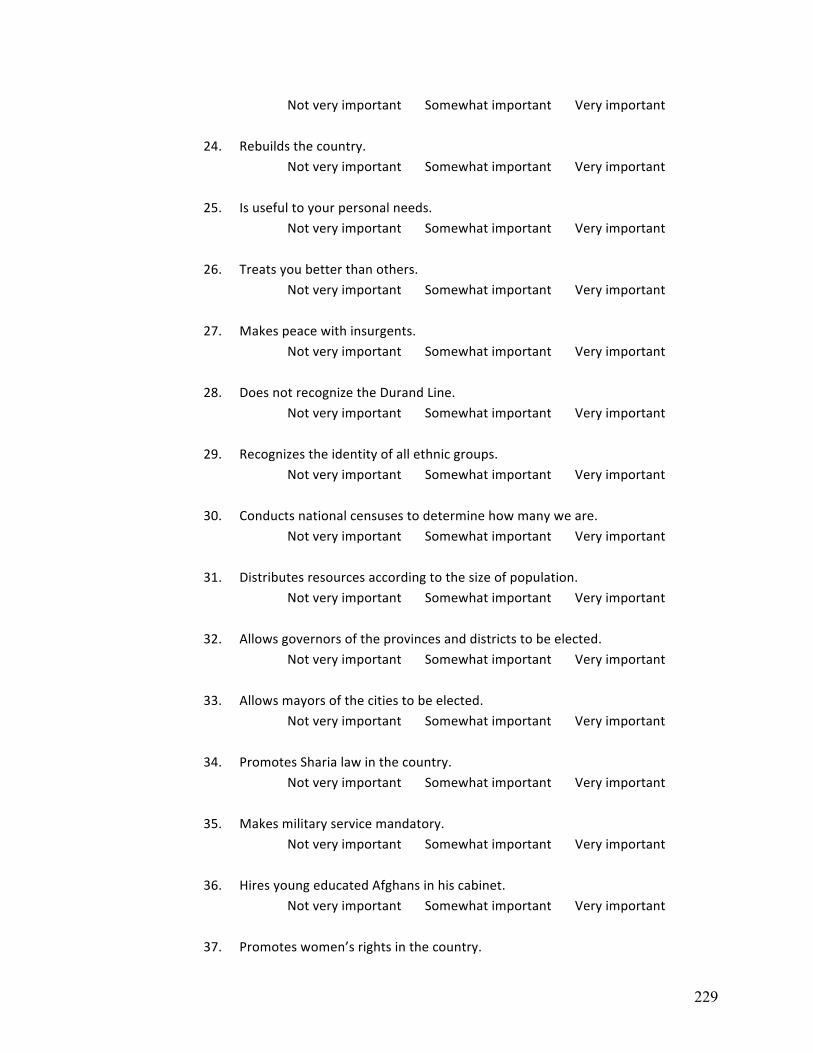
229

230

231

رھنمابزرگ رھنما بزرگپيشوا پيشوا رھنمارھبر رھبر اداره کننده
اداره کننده بزرگ پيشواھدايت کننده اداره کننده رھبر
نماينده ھدايت کننده رئيسسر نماينده الگو
رئيس سر اولسوق دھنده سوق فرمانده
فرمانده زعيم ليدرمدير مدير مديرزعيم فرمانده استادالگو رئيس سوقاول الگو نمايندهليدر حافظ حامی
استاد خادم سرحافظ زورمند مسئولخادم پيامبر مشاور
زورمند امام ناجیپيامبر خدمتگار نگھبانحامی وکيل ھدايت کننده
امامخدمتگار
وکيلمسئولمشاورناجی
نگھبان

نماره رمم
ارها
وب ها الن نهنما
اسس رم
سرئ قوم
هورم
ران م فه
وانا عمز
نهرما
ف ملماع
الو
ا اول ش وبص
ش رل
ساا
ابان ذر رق
ظمن ام ام اه
رس مناره شر
سمص
شعم
ض ههع فر
زمهار
لفم
عمر
وسنف


حصيالت عالیخالق خوب
محبوبيتدانش سياسی
سالميتآگاھی و دانايی
صداقتعدالت
مفکورهديدگاه
شخصيتتقوا
ايمانوطن دوستی
تجربهمديريتاحساستوانايی
تعھداداره
رھبریظرفيتتصميماستعداداعتماد
النحاکميت
روابطشجاعت
قدرتتابعيت
عمل

وب رمم
نشا
اسس مل
الماس فر قوا ملا ن اهآ
رس اه شور عااس
صص انا
اعش ون
اننس
فاا ا
ممص وس مل
ع ار سولم
اا
شان
رابرب
شوا وان ام واه رالم
سص
ش صفا فارنن
قوا اقل مر ممل
نانوط
هم


محبوبتحصيل يافته
صادقعادل
وطن دوستآگاه و فھميده
مسلمانبا خالقمدارسياست دلسوز
از افغانستانبا تجربه
قاطعبا شخصيت
با تقوامدير
مھرباناجتماعیحوصلهوفادار
سخاوتمندمتعھد

رمم
الع عال وس اس
س الع
نشا
سسا
اقوا ابطرو م بر
هفهم
راما
هم
سشنا اقل
ع مق ملصا
اق اهلنه
رازب
هرب
صبع
ام القر ن سمر
وهر
ظرف م قلب را عهم مل فسن
فه
وشه
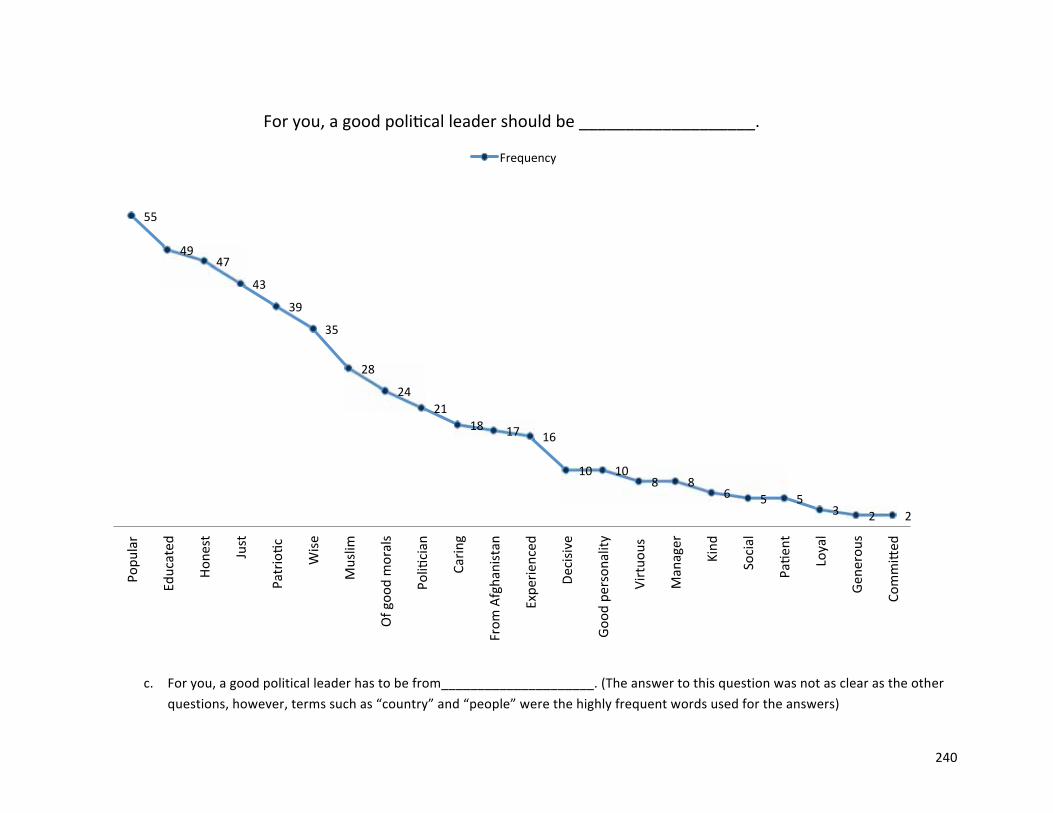

مردمخوبخالقجامعه
افغانستانخبر
سياستکار
کشوروطنملتآگاه
آگاھیتحصيل
دانشسياسی
طبقهافغان
حصيالتخدمترھبرنيکو
تابعيتقوم
نيکبطنپاک
تعصباتدفاع
دوسترشوت
شخصيتعدالت
فسادفکر
قومیقوی
مديريتمسلمان
مليتصاحب

242
Frequencies Statistics
A g
ood
polit
ical
lead
er s
houl
d be
de
cisi
ve.
A g
ood
polit
ical
lead
er s
houl
d ha
ve a
cle
ar p
oliti
cal a
gend
a.
A g
ood
polit
ical
lead
er s
houl
d be
a
good
man
ager
.
A g
ood
polit
ical
lead
er s
houl
d be
ac
cept
ing
resp
onsi
bilit
y.
A g
ood
polit
ical
lead
er s
houl
d be
ho
nest
.
A g
ood
polit
ical
lead
er s
houl
d be
ju
st.
A g
ood
polit
ical
lead
er s
houl
d no
t lie
to th
e pe
ople
.
A g
ood
polit
ical
lead
er s
houl
d lo
ve th
e co
untry
.
A g
ood
polit
ical
lead
er s
houl
d re
spec
t and
enf
orce
the
law
.
A g
ood
polit
ical
lead
er s
houl
d be
lieve
in G
od.
A g
ood
polit
ical
lead
er s
houl
d be
el
ecte
d th
roug
h el
ectio
n.
A g
ood
polit
ical
lead
er s
houl
d no
t eth
nica
lly d
iscr
imin
ate.
N Valid 534 533 535 534 535 535 537 536 535 537 533 532
Missing 34 35 33 34 33 33 31 32 33 31 35 36 Mean 4.79 4.80 4.83 4.85 4.87 4.87 4.72 4.84 4.84 4.79 4.70 4.69 Median 5.00 5.00 5.00 5.00 5.00 5.00 5.00 5.00 5.00 5.00 5.00 5.00 Mode 5 5 5 5 5 5 5 5 5 5 5 5 Std. Deviation .642 .655 .622 .546 .513 .578 .836 .623 .676 .756 .834 .956 Skewness -3.745 -4.322 -4.775 -4.739 -5.136 -5.142 -3.549 -4.816 -5.411 -4.203 -3.283 -3.369 Std. Error of Skewness .106 .106 .106 .106 .106 .106 .105 .106 .106 .105 .106 .106 Kurtosis 16.126 21.626 27.118 26.956 32.436 27.513 13.299 25.175 32.050 18.374 11.475 10.610 Std. Error of Kurtosis .211 .211 .211 .211 .211 .211 .210 .211 .211 .210 .211 .211 Minimum 0 0 0 0 0 1 0 0 0 0 0 0 Maximum 5 5 5 5 5 5 5 5 5 5 5 5

243
Frequency Table A good political leader should be decisive.
Frequency Percent Valid Percent
Cumulative
Percent
Valid 0 1 .2 .2 .2
1 3 .5 .6 .7
2 6 1.1 1.1 1.9
3 19 3.3 3.6 5.4
4 41 7.2 7.7 13.1
5 464 81.7 86.9 100.0
Total 534 94.0 100.0 Missing System 34 6.0 Total 568 100.0
A good political leader should have a clear political agenda.
Frequency Percent Valid Percent
Cumulative
Percent
Valid 0 2 .4 .4 .4
1 5 .9 .9 1.3
2 1 .2 .2 1.5
3 19 3.3 3.6 5.1
4 34 6.0 6.4 11.4
5 472 83.1 88.6 100.0
Total 533 93.8 100.0 Missing System 35 6.2 Total 568 100.0

244
A good political leader should be a good manager.
Frequency Percent Valid Percent
Cumulative
Percent
Valid 0 3 .5 .6 .6
1 2 .4 .4 .9
2 2 .4 .4 1.3
3 17 3.0 3.2 4.5
4 30 5.3 5.6 10.1
5 481 84.7 89.9 100.0
Total 535 94.2 100.0 Missing System 33 5.8 Total 568 100.0
A good political leader should be accepting responsibility.
Frequency Percent Valid Percent
Cumulative
Percent
Valid 0 1 .2 .2 .2
1 2 .4 .4 .6
2 4 .7 .7 1.3
3 11 1.9 2.1 3.4
4 34 6.0 6.4 9.7
5 482 84.9 90.3 100.0
Total 534 94.0 100.0 Missing System 34 6.0 Total 568 100.0

245
A good political leader should be honest.
Frequency Percent Valid Percent
Cumulative
Percent
Valid 0 1 .2 .2 .2
1 2 .4 .4 .6
2 2 .4 .4 .9
3 11 1.9 2.1 3.0
4 31 5.5 5.8 8.8
5 488 85.9 91.2 100.0
Total 535 94.2 100.0 Missing System 33 5.8 Total 568 100.0
A good political leader should be just.
Frequency Percent Valid Percent
Cumulative
Percent
Valid 1 6 1.1 1.1 1.1
2 5 .9 .9 2.1
3 8 1.4 1.5 3.6
4 14 2.5 2.6 6.2
5 502 88.4 93.8 100.0
Total 535 94.2 100.0 Missing System 33 5.8 Total 568 100.0

246
A good political leader should not lie to the people.
Frequency Percent Valid Percent
Cumulative
Percent
Valid 0 5 .9 .9 .9
1 5 .9 .9 1.9
2 11 1.9 2.0 3.9
3 20 3.5 3.7 7.6
4 33 5.8 6.1 13.8
5 463 81.5 86.2 100.0
Total 537 94.5 100.0 Missing System 31 5.5 Total 568 100.0
A good political leader should love the country.
Frequency Percent Valid Percent
Cumulative
Percent
Valid 0 1 .2 .2 .2
1 6 1.1 1.1 1.3
2 4 .7 .7 2.1
3 10 1.8 1.9 3.9
4 24 4.2 4.5 8.4
5 491 86.4 91.6 100.0
Total 536 94.4 100.0 Missing System 32 5.6 Total 568 100.0

247
A good political leader should respect and enforce the law.
Frequency Percent Valid Percent
Cumulative
Percent
Valid 0 6 1.1 1.1 1.1
1 1 .2 .2 1.3
2 4 .7 .7 2.1
3 8 1.4 1.5 3.6
4 24 4.2 4.5 8.0
5 492 86.6 92.0 100.0
Total 535 94.2 100.0 Missing System 33 5.8 Total 568 100.0
A good political leader should believe in God.
Frequency Percent Valid Percent
Cumulative
Percent
Valid 0 3 .5 .6 .6
1 8 1.4 1.5 2.0
2 5 .9 .9 3.0
3 16 2.8 3.0 6.0
4 18 3.2 3.4 9.3
5 487 85.7 90.7 100.0
Total 537 94.5 100.0 Missing System 31 5.5 Total 568 100.0

248
A good political leader should be elected through election.
Frequency Percent Valid Percent
Cumulative
Percent
Valid 0 4 .7 .8 .8
1 5 .9 .9 1.7
2 11 1.9 2.1 3.8
3 26 4.6 4.9 8.6
4 36 6.3 6.8 15.4
5 451 79.4 84.6 100.0
Total 533 93.8 100.0 Missing System 35 6.2 Total 568 100.0
A good political leader should not ethnically discriminate.
Frequency Percent Valid Percent
Cumulative
Percent
Valid 0 5 .9 .9 .9
1 15 2.6 2.8 3.8
2 13 2.3 2.4 6.2
3 7 1.2 1.3 7.5
4 25 4.4 4.7 12.2
5 467 82.2 87.8 100.0
Total 532 93.7 100.0 Missing System 36 6.3 Total 568 100.0

249
Pie Chart

250

251

252

253

254

255
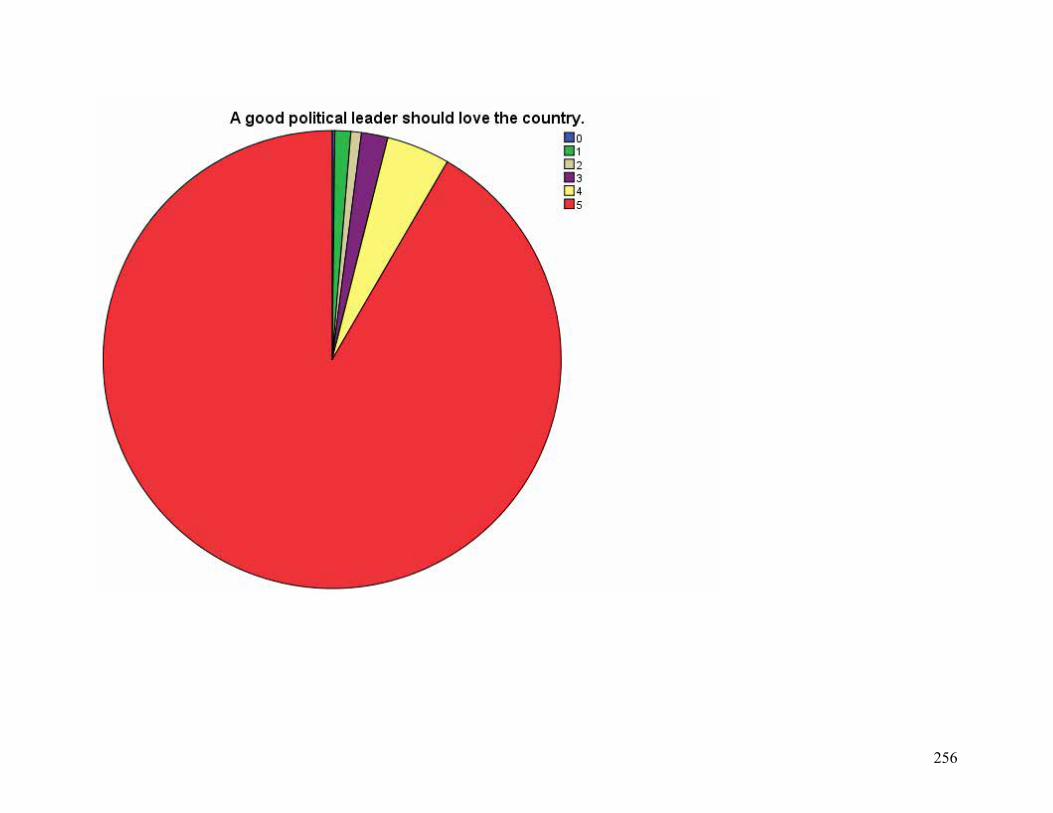
256

257

258

259

260

261
Crosstabs Case Processing Summary
Cases
Valid Missing Total
N Percent N Percent N Percent
Ethnic * A good political leader
should be decisive. 534 94.0% 34 6.0% 568 100.0%
Ethnic * A good political leader
should have a clear political
agenda.
533 93.8% 35 6.2% 568 100.0%
Ethnic * A good political leader
should be a good manager. 535 94.2% 33 5.8% 568 100.0%
Ethnic * A good political leader
should be accepting
responsibility.
534 94.0% 34 6.0% 568 100.0%
Ethnic * A good political leader
should be honest. 535 94.2% 33 5.8% 568 100.0%
Ethnic * A good political leader
should be just. 535 94.2% 33 5.8% 568 100.0%
Ethnic * A good political leader
should not lie to the people. 537 94.5% 31 5.5% 568 100.0%
Ethnic * A good political leader
should love the country. 536 94.4% 32 5.6% 568 100.0%
Ethnic * A good political leader
should respect and enforce the
law.
535 94.2% 33 5.8% 568 100.0%
Ethnic * A good political leader
should believe in God. 537 94.5% 31 5.5% 568 100.0%

262
Ethnic * A good political leader
should be elected through
election.
533 93.8% 35 6.2% 568 100.0%
Ethnic * A good political leader
should not ethnically
discriminate.
532 93.7% 36 6.3% 568 100.0%
Ethnic * A good political leader should be decisive.
Crosstab
A good political leader should be decisive.
Total 0 1 2 3 4 5
Ethnic Hazara Count 0 0 1 1 5 72 79
Expected Count .1 .4 .9 2.8 6.1 68.6 79.0
Other Count 0 0 0 0 0 16 16
Expected Count .0 .1 .2 .6 1.2 13.9 16.0
Pashtun Count 1 2 4 15 25 170 217
Expected Count .4 1.2 2.4 7.7 16.7 188.6 217.0
Tajik Count 0 1 1 2 11 175 190
Expected Count .4 1.1 2.1 6.8 14.6 165.1 190.0
Uzbek Count 0 0 0 1 0 31 32
Expected Count .1 .2 .4 1.1 2.5 27.8 32.0
Total Count 1 3 6 19 41 464 534
Expected Count 1.0 3.0 6.0 19.0 41.0 464.0 534.0

263
Chi-Square Tests
Value df
Asymp. Sig. (2-
sided)
Pearson Chi-Square 29.000a 20 .088
Likelihood Ratio 34.494 20 .023
N of Valid Cases 534 a. 20 cells (66.7%) have expected count less than 5. The minimum
expected count is .03.

264

265
Ethnic * A good political leader should have a clear political agenda. Crosstab
A good political leader should have a clear political agenda.
Total 0 1 2 3 4 5
Ethnic Hazara Count 0 0 0 1 4 75 80
Expected Count .3 .8 .2 2.9 5.1 70.8 80.0
Other Count 0 0 0 0 0 16 16
Expected Count .1 .2 .0 .6 1.0 14.2 16.0
Pashtun Count 1 3 0 15 22 178 219
Expected Count .8 2.1 .4 7.8 14.0 193.9 219.0
Tajik Count 0 2 1 3 5 177 188
Expected Count .7 1.8 .4 6.7 12.0 166.5 188.0
Uzbek Count 1 0 0 0 3 26 30
Expected Count .1 .3 .1 1.1 1.9 26.6 30.0
Total Count 2 5 1 19 34 472 533
Expected Count 2.0 5.0 1.0 19.0 34.0 472.0 533.0
Chi-Square Tests
Value df
Asymp. Sig. (2-
sided)
Pearson Chi-Square 36.134a 20 .015
Likelihood Ratio 36.752 20 .013
N of Valid Cases 533 a. 20 cells (66.7%) have expected count less than 5. The minimum
expected count is .03.

266

267
Ethnic * A good political leader should be a good manager.
Crosstab
A good political leader should be a good manager.
Total 0 1 2 3 4 5
Ethnic Hazara Count 0 0 0 0 4 76 80
Expected Count .4 .3 .3 2.5 4.5 71.9 80.0
Other Count 0 0 0 1 0 15 16
Expected Count .1 .1 .1 .5 .9 14.4 16.0
Pashtun Count 2 1 2 13 17 184 219
Expected Count 1.2 .8 .8 7.0 12.3 196.9 219.0
Tajik Count 1 0 0 3 8 177 189
Expected Count 1.1 .7 .7 6.0 10.6 169.9 189.0
Uzbek Count 0 1 0 0 1 29 31
Expected Count .2 .1 .1 1.0 1.7 27.9 31.0
Total Count 3 2 2 17 30 481 535
Expected Count 3.0 2.0 2.0 17.0 30.0 481.0 535.0
Chi-Square Tests
Value df
Asymp. Sig. (2-
sided)
Pearson Chi-Square 27.845a 20 .113
Likelihood Ratio 29.541 20 .078
N of Valid Cases 535
a. 21 cells (70.0%) have expected count less than 5. The minimum
expected count is .06.

268

269
Ethnic * A good political leader should be accepting responsibility.
Crosstab
A good political leader should be accepting responsibility.
Total 0 1 2 3 4 5
Ethnic Hazara Count 0 0 0 0 7 74 81
Expected Count .2 .3 .6 1.7 5.2 73.1 81.0
Other Count 0 0 0 0 0 16 16
Expected Count .0 .1 .1 .3 1.0 14.4 16.0
Pashtun Count 1 2 4 6 19 185 217
Expected Count .4 .8 1.6 4.5 13.8 195.9 217.0
Tajik Count 0 0 0 5 6 178 189
Expected Count .4 .7 1.4 3.9 12.0 170.6 189.0
Uzbek Count 0 0 0 0 2 29 31
Expected Count .1 .1 .2 .6 2.0 28.0 31.0
Total Count 1 2 4 11 34 482 534
Expected Count 1.0 2.0 4.0 11.0 34.0 482.0 534.0
Chi-Square Tests
Value df
Asymp. Sig. (2-
sided)
Pearson Chi-Square 21.489a 20 .369
Likelihood Ratio 27.867 20 .113
N of Valid Cases 534
a. 22 cells (73.3%) have expected count less than 5. The minimum
expected count is .03.

270

271
Ethnic * A good political leader should be honest. Crosstab
A good political leader should be honest.
Total 0 1 2 3 4 5
Ethnic Hazara Count 0 0 1 3 5 71 80
Expected Count .1 .3 .3 1.6 4.6 73.0 80.0
Other Count 0 0 0 1 0 15 16
Expected Count .0 .1 .1 .3 .9 14.6 16.0
Pashtun Count 1 2 1 6 19 189 218
Expected Count .4 .8 .8 4.5 12.6 198.8 218.0
Tajik Count 0 0 0 1 5 183 189
Expected Count .4 .7 .7 3.9 11.0 172.4 189.0
Uzbek Count 0 0 0 0 2 30 32
Expected Count .1 .1 .1 .7 1.9 29.2 32.0
Total Count 1 2 2 11 31 488 535
Expected Count 1.0 2.0 2.0 11.0 31.0 488.0 535.0
Chi-Square Tests
Value df
Asymp. Sig. (2-
sided)
Pearson Chi-Square 21.373a 20 .375
Likelihood Ratio 24.779 20 .210
N of Valid Cases 535 a. 23 cells (76.7%) have expected count less than 5. The minimum
expected count is .03.
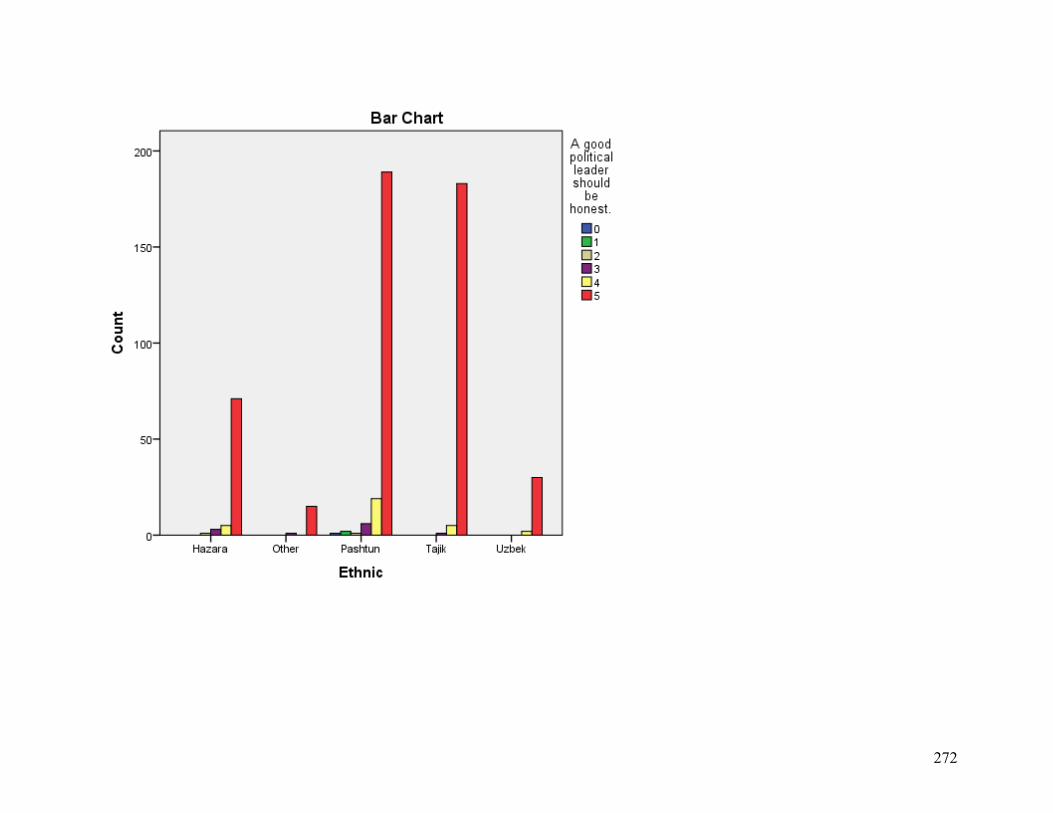
272

273
Ethnic * A good political leader should be just.
Crosstab
A good political leader should be just.
Total 1 2 3 4 5
Ethnic Hazara Count 0 2 1 5 72 80
Expected Count .9 .7 1.2 2.1 75.1 80.0
Other Count 0 0 0 1 15 16
Expected Count .2 .1 .2 .4 15.0 16.0
Pashtun Count 6 3 6 4 199 218
Expected Count 2.4 2.0 3.3 5.7 204.6 218.0
Tajik Count 0 0 1 3 186 190
Expected Count 2.1 1.8 2.8 5.0 178.3 190.0
Uzbek Count 0 0 0 1 30 31
Expected Count .3 .3 .5 .8 29.1 31.0
Total Count 6 5 8 14 502 535
Expected Count 6.0 5.0 8.0 14.0 502.0 535.0
Chi-Square Tests
Value df
Asymp. Sig. (2-
sided)
Pearson Chi-Square 24.540a 16 .078
Likelihood Ratio 27.537 16 .036
N of Valid Cases 535
a. 19 cells (76.0%) have expected count less than 5. The minimum
expected count is .15.

274
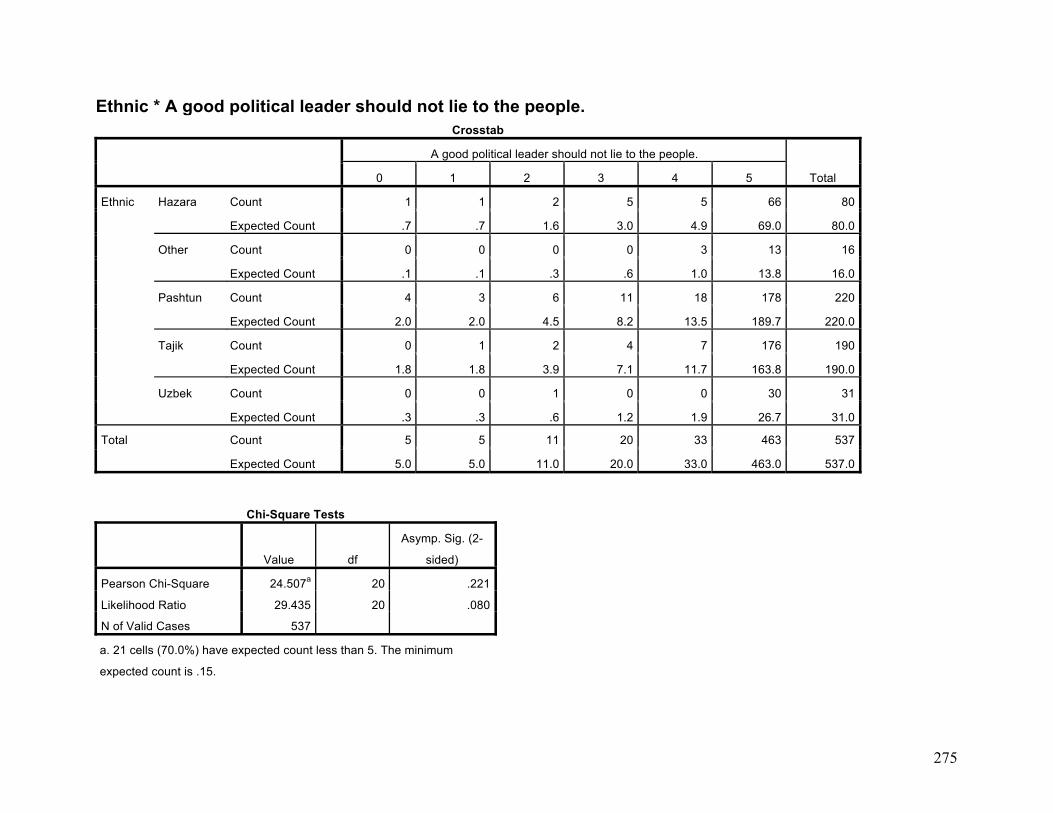
275
Ethnic * A good political leader should not lie to the people. Crosstab
A good political leader should not lie to the people.
Total 0 1 2 3 4 5
Ethnic Hazara Count 1 1 2 5 5 66 80
Expected Count .7 .7 1.6 3.0 4.9 69.0 80.0
Other Count 0 0 0 0 3 13 16
Expected Count .1 .1 .3 .6 1.0 13.8 16.0
Pashtun Count 4 3 6 11 18 178 220
Expected Count 2.0 2.0 4.5 8.2 13.5 189.7 220.0
Tajik Count 0 1 2 4 7 176 190
Expected Count 1.8 1.8 3.9 7.1 11.7 163.8 190.0
Uzbek Count 0 0 1 0 0 30 31
Expected Count .3 .3 .6 1.2 1.9 26.7 31.0
Total Count 5 5 11 20 33 463 537
Expected Count 5.0 5.0 11.0 20.0 33.0 463.0 537.0
Chi-Square Tests
Value df
Asymp. Sig. (2-
sided)
Pearson Chi-Square 24.507a 20 .221
Likelihood Ratio 29.435 20 .080
N of Valid Cases 537 a. 21 cells (70.0%) have expected count less than 5. The minimum
expected count is .15.

276

277
Ethnic * A good political leader should love the country. Crosstab
A good political leader should love the country.
Total 0 1 2 3 4 5
Ethnic Hazara Count 0 0 0 1 3 76 80
Expected Count .1 .9 .6 1.5 3.6 73.3 80.0
Other Count 0 0 0 2 0 14 16
Expected Count .0 .2 .1 .3 .7 14.7 16.0
Pashtun Count 1 5 4 6 13 189 218
Expected Count .4 2.4 1.6 4.1 9.8 199.7 218.0
Tajik Count 0 1 0 1 8 181 191
Expected Count .4 2.1 1.4 3.6 8.6 175.0 191.0
Uzbek Count 0 0 0 0 0 31 31
Expected Count .1 .3 .2 .6 1.4 28.4 31.0
Total Count 1 6 4 10 24 491 536
Expected Count 1.0 6.0 4.0 10.0 24.0 491.0 536.0
Chi-Square Tests
Value df
Asymp. Sig. (2-
sided)
Pearson Chi-Square 29.667a 20 .075
Likelihood Ratio 30.050 20 .069
N of Valid Cases 536 a. 23 cells (76.7%) have expected count less than 5. The minimum
expected count is .03.

278

279
Ethnic * A good political leader should respect and enforce the law.
Crosstab
A good political leader should respect and enforce the law.
Total 0 1 2 3 4 5
Ethnic Hazara Count 0 0 0 0 5 73 78
Expected Count .9 .1 .6 1.2 3.5 71.7 78.0
Other Count 1 0 0 0 0 15 16
Expected Count .2 .0 .1 .2 .7 14.7 16.0
Pashtun Count 4 1 4 7 14 189 219
Expected Count 2.5 .4 1.6 3.3 9.8 201.4 219.0
Tajik Count 1 0 0 1 5 184 191
Expected Count 2.1 .4 1.4 2.9 8.6 175.6 191.0
Uzbek Count 0 0 0 0 0 31 31
Expected Count .3 .1 .2 .5 1.4 28.5 31.0
Total Count 6 1 4 8 24 492 535
Expected Count 6.0 1.0 4.0 8.0 24.0 492.0 535.0
Chi-Square Tests
Value df
Asymp. Sig. (2-
sided)
Pearson Chi-Square 28.501a 20 .098
Likelihood Ratio 32.793 20 .036
N of Valid Cases 535
a. 23 cells (76.7%) have expected count less than 5. The minimum
expected count is .03.

280

281
Ethnic * A good political leader should believe in God. Crosstab
A good political leader should believe in God.
Total 0 1 2 3 4 5
Ethnic Hazara Count 2 2 1 4 1 69 79
Expected Count .4 1.2 .7 2.4 2.6 71.6 79.0
Other Count 0 1 0 2 0 13 16
Expected Count .1 .2 .1 .5 .5 14.5 16.0
Pashtun Count 1 4 1 5 8 201 220
Expected Count 1.2 3.3 2.0 6.6 7.4 199.5 220.0
Tajik Count 0 1 2 3 6 179 191
Expected Count 1.1 2.8 1.8 5.7 6.4 173.2 191.0
Uzbek Count 0 0 1 2 3 25 31
Expected Count .2 .5 .3 .9 1.0 28.1 31.0
Total Count 3 8 5 16 18 487 537
Expected Count 3.0 8.0 5.0 16.0 18.0 487.0 537.0
Chi-Square Tests
Value df
Asymp. Sig. (2-
sided)
Pearson Chi-Square 29.324a 20 .082
Likelihood Ratio 24.537 20 .220
N of Valid Cases 537 a. 21 cells (70.0%) have expected count less than 5. The minimum
expected count is .09.

282

283
Ethnic * A good political leader should be elected through election. Crosstab
A good political leader should be elected through election.
Total 0 1 2 3 4 5
Ethnic Hazara Count 0 0 0 6 2 71 79
Expected Count .6 .7 1.6 3.9 5.3 66.8 79.0
Other Count 1 0 0 0 2 13 16
Expected Count .1 .2 .3 .8 1.1 13.5 16.0
Pashtun Count 3 3 8 14 21 168 217
Expected Count 1.6 2.0 4.5 10.6 14.7 183.6 217.0
Tajik Count 0 2 2 5 7 173 189
Expected Count 1.4 1.8 3.9 9.2 12.8 159.9 189.0
Uzbek Count 0 0 1 1 4 26 32
Expected Count .2 .3 .7 1.6 2.2 27.1 32.0
Total Count 4 5 11 26 36 451 533
Expected Count 4.0 5.0 11.0 26.0 36.0 451.0 533.0
Chi-Square Tests
Value df
Asymp. Sig. (2-
sided)
Pearson Chi-Square 35.073a 20 .020
Likelihood Ratio 37.167 20 .011
N of Valid Cases 533 a. 20 cells (66.7%) have expected count less than 5. The minimum
expected count is .12.

284

285
Ethnic * A good political leader should not ethnically discriminate. Crosstab
A good political leader should not ethnically discriminate.
Total 0 1 2 3 4 5
Ethnic Hazara Count 2 3 1 0 4 68 78
Expected Count .7 2.2 1.9 1.0 3.7 68.5 78.0
Other Count 0 0 0 1 1 14 16
Expected Count .2 .5 .4 .2 .8 14.0 16.0
Pashtun Count 2 7 10 4 15 180 218
Expected Count 2.0 6.1 5.3 2.9 10.2 191.4 218.0
Tajik Count 1 5 1 2 4 176 189
Expected Count 1.8 5.3 4.6 2.5 8.9 165.9 189.0
Uzbek Count 0 0 1 0 1 29 31
Expected Count .3 .9 .8 .4 1.5 27.2 31.0
Total Count 5 15 13 7 25 467 532
Expected Count 5.0 15.0 13.0 7.0 25.0 467.0 532.0
Chi-Square Tests
Value df
Asymp. Sig. (2-
sided)
Pearson Chi-Square 24.053a 20 .240
Likelihood Ratio 26.505 20 .150
N of Valid Cases 532 a. 20 cells (66.7%) have expected count less than 5. The minimum
expected count is .15.

286

287
Frequencies Statistics
A g
ood
polit
ical
lead
er s
houl
d pr
ay fi
ve ti
mes
in th
e m
osqu
e.
A go
od p
oliti
cal l
eade
r sho
uld
have
relig
ious
edu
catio
n.
A go
od p
oliti
cal l
eade
r sho
uld
be h
ighl
y ed
ucat
ed.
A g
ood
polit
ical
lead
er s
houl
d fig
ht th
e fo
reig
ners
.
A g
ood
polit
ical
lead
er s
houl
d no
t let
fore
igne
rs in
the
coun
try.
A go
od p
oliti
cal l
eade
r sho
uld
be s
elec
ted
thro
ugh
Jirg
a.
N Valid 527 517 534 527 523 508
Missing 41 51 34 41 45 60
Mean 3.93 3.68 4.71 3.52 2.43 3.09
Median 5.00 5.00 5.00 4.00 2.00 4.00
Mode 5 5 5 5 5 5
Std. Deviation 1.522 1.644 .682 1.676 1.994 1.996
Skewness -1.232 -.942 -2.765 -.728 .122 -.448
Std. Error of Skewness .106 .107 .106 .106 .107 .108
Kurtosis .339 -.434 8.821 -.803 -1.566 -1.451
Std. Error of Kurtosis .212 .214 .211 .212 .213 .216
Minimum 0 0 0 0 0 0
Maximum 5 5 5 5 5 5
Frequency Table
A good political leader should pray five times in the mosque.
Frequency Percent Valid Percent
Cumulative
Percent
Valid 0 26 4.6 4.9 4.9
1 29 5.1 5.5 10.4
2 38 6.7 7.2 17.6
3 80 14.1 15.2 32.8
4 42 7.4 8.0 40.8
5 312 54.9 59.2 100.0

288
Total 527 92.8 100.0 Missing System 41 7.2 Total 568 100.0
A good political leader should have religious education.
Frequency Percent Valid Percent
Cumulative
Percent
Valid 0 34 6.0 6.6 6.6
1 42 7.4 8.1 14.7
2 47 8.3 9.1 23.8
3 72 12.7 13.9 37.7
4 58 10.2 11.2 48.9
5 264 46.5 51.1 100.0
Total 517 91.0 100.0 Missing System 51 9.0 Total 568 100.0
A good political leader should be highly educated.
Frequency Percent Valid Percent
Cumulative
Percent
Valid 0 1 .2 .2 .2
1 1 .2 .2 .4
2 7 1.2 1.3 1.7
3 32 5.6 6.0 7.7
4 61 10.7 11.4 19.1
5 432 76.1 80.9 100.0
Total 534 94.0 100.0 Missing System 34 6.0 Total 568 100.0
A good political leader should fight the foreigners.
Frequency Percent Valid Percent
Cumulative
Percent
Valid 0 36 6.3 6.8 6.8
1 50 8.8 9.5 16.3
2 59 10.4 11.2 27.5
3 87 15.3 16.5 44.0
4 47 8.3 8.9 52.9
5 248 43.7 47.1 100.0
Total 527 92.8 100.0 Missing System 41 7.2 Total 568 100.0

289
A good political leader should not let foreigners in the country.
Frequency Percent Valid Percent
Cumulative
Percent
Valid 0 134 23.6 25.6 25.6
1 90 15.8 17.2 42.8
2 46 8.1 8.8 51.6
3 75 13.2 14.3 66.0
4 26 4.6 5.0 70.9
5 152 26.8 29.1 100.0
Total 523 92.1 100.0 Missing System 45 7.9 Total 568 100.0
A good political leader should be selected through Jirga.
Frequency Percent Valid Percent
Cumulative
Percent
Valid 0 90 15.8 17.7 17.7
1 67 11.8 13.2 30.9
2 32 5.6 6.3 37.2
3 50 8.8 9.8 47.0
4 54 9.5 10.6 57.7
5 215 37.9 42.3 100.0
Total 508 89.4 100.0 Missing System 60 10.6 Total 568 100.0

290
Pie Chart

291

292

293

294

295

296
Crosstabs Case Processing Summary
Cases
Valid Missing Total
N Percent N Percent N Percent
Ethnic * A good political leader
should pray five times in the
mosque.
527 92.8% 41 7.2% 568 100.0%
Ethnic * A good political leader
should have religious
education.
517 91.0% 51 9.0% 568 100.0%
Ethnic * A good political leader
should be highly educated. 534 94.0% 34 6.0% 568 100.0%
Ethnic * A good political leader
should fight the foreigners. 527 92.8% 41 7.2% 568 100.0%
Ethnic * A good political leader
should not let foreigners in the
country.
523 92.1% 45 7.9% 568 100.0%
Ethnic * A good political leader
should be selected through
Jirga.
508 89.4% 60 10.6% 568 100.0%
Ethnic * A good political leader should pray five times in the mosque.
Crosstab
A good political leader should pray five times in the mosque.
Total 0 1 2 3 4 5
Ethnic Hazara Count 12 8 5 22 4 23 74
Expected Count 3.7 4.1 5.3 11.2 5.9 43.8 74.0
Other Count 3 0 1 4 0 8 16
Expected Count .8 .9 1.2 2.4 1.3 9.5 16.0
Pashtun Count 6 6 16 21 19 151 219
Expected Count 10.8 12.1 15.8 33.2 17.5 129.7 219.0
Tajik Count 4 13 16 26 15 113 187
Expected Count 9.2 10.3 13.5 28.4 14.9 110.7 187.0
Uzbek Count 1 2 0 7 4 17 31
Expected Count 1.5 1.7 2.2 4.7 2.5 18.4 31.0
Total Count 26 29 38 80 42 312 527
Expected Count 26.0 29.0 38.0 80.0 42.0 312.0 527.0

297
Chi-Square Tests
Value df
Asymp. Sig. (2-
sided)
Pearson Chi-Square 75.695a 20 .000
Likelihood Ratio 71.223 20 .000
N of Valid Cases 527
a. 12 cells (40.0%) have expected count less than 5. The minimum
expected count is .79.

298
Ethnic * A good political leader should have religious education. Crosstab
A good political leader should have religious education.
Total 0 1 2 3 4 5
Ethnic Hazara Count 12 11 6 13 8 22 72
Expected Count 4.7 5.8 6.5 10.0 8.1 36.8 72.0
Other Count 6 0 0 3 1 6 16
Expected Count 1.1 1.3 1.5 2.2 1.8 8.2 16.0
Pashtun Count 5 11 21 22 28 129 216
Expected Count 14.2 17.5 19.6 30.1 24.2 110.3 216.0
Tajik Count 9 16 17 27 20 95 184
Expected Count 12.1 14.9 16.7 25.6 20.6 94.0 184.0
Uzbek Count 2 4 3 7 1 12 29
Expected Count 1.9 2.4 2.6 4.0 3.3 14.8 29.0
Total Count 34 42 47 72 58 264 517
Expected Count 34.0 42.0 47.0 72.0 58.0 264.0 517.0
Chi-Square Tests
Value df
Asymp. Sig. (2-
sided)
Pearson Chi-Square 70.632a 20 .000
Likelihood Ratio 60.360 20 .000
N of Valid Cases 517
a. 11 cells (36.7%) have expected count less than 5. The minimum
expected count is 1.05.

299

300
Ethnic * A good political leader should be highly educated. Crosstab
A good political leader should be highly educated.
Total 0 1 2 3 4 5
Ethnic Hazara Count 0 0 0 7 11 62 80
Expected Count .1 .1 1.0 4.8 9.1 64.7 80.0
Other Count 0 0 0 0 4 12 16
Expected Count .0 .0 .2 1.0 1.8 12.9 16.0
Pashtun Count 1 1 3 14 25 173 217
Expected Count .4 .4 2.8 13.0 24.8 175.6 217.0
Tajik Count 0 0 2 10 20 158 190
Expected Count .4 .4 2.5 11.4 21.7 153.7 190.0
Uzbek Count 0 0 2 1 1 27 31
Expected Count .1 .1 .4 1.9 3.5 25.1 31.0
Total Count 1 1 7 32 61 432 534
Expected Count 1.0 1.0 7.0 32.0 61.0 432.0 534.0
Chi-Square Tests
Value df
Asymp. Sig. (2-
sided)
Pearson Chi-Square 18.557a 20 .551
Likelihood Ratio 18.406 20 .561
N of Valid Cases 534
a. 20 cells (66.7%) have expected count less than 5. The minimum
expected count is .03.

301

302
Ethnic * A good political leader should fight the foreigners. Crosstab
A good political leader should fight the foreigners.
Total 0 1 2 3 4 5
Ethnic Hazara Count 6 15 8 17 8 26 80
Expected Count 5.5 7.6 9.0 13.2 7.1 37.6 80.0
Other Count 4 1 3 3 0 5 16
Expected Count 1.1 1.5 1.8 2.6 1.4 7.5 16.0
Pashtun Count 13 13 27 30 25 106 214
Expected Count 14.6 20.3 24.0 35.3 19.1 100.7 214.0
Tajik Count 12 19 19 32 13 92 187
Expected Count 12.8 17.7 20.9 30.9 16.7 88.0 187.0
Uzbek Count 1 2 2 5 1 19 30
Expected Count 2.0 2.8 3.4 5.0 2.7 14.1 30.0
Total Count 36 50 59 87 47 248 527
Expected Count 36.0 50.0 59.0 87.0 47.0 248.0 527.0
Chi-Square Tests
Value df
Asymp. Sig. (2-
sided)
Pearson Chi-Square 34.769a 20 .021
Likelihood Ratio 32.499 20 .038
N of Valid Cases 527
a. 10 cells (33.3%) have expected count less than 5. The minimum
expected count is 1.09.

303

304
Ethnic * A good political leader should not let foreigners in the country. Crosstab
A good political leader should not let foreigners in the country.
Total 0 1 2 3 4 5
Ethnic Hazara Count 24 23 7 8 3 14 79
Expected Count 20.2 13.6 6.9 11.3 3.9 23.0 79.0
Other Count 9 1 1 1 1 2 15
Expected Count 3.8 2.6 1.3 2.2 .7 4.4 15.0
Pashtun Count 46 30 18 34 16 70 214
Expected Count 54.8 36.8 18.8 30.7 10.6 62.2 214.0
Tajik Count 47 29 19 28 5 58 186
Expected Count 47.7 32.0 16.4 26.7 9.2 54.1 186.0
Uzbek Count 8 7 1 4 1 8 29
Expected Count 7.4 5.0 2.6 4.2 1.4 8.4 29.0
Total Count 134 90 46 75 26 152 523
Expected Count 134.0 90.0 46.0 75.0 26.0 152.0 523.0
Chi-Square Tests
Value df
Asymp. Sig. (2-
sided)
Pearson Chi-Square 33.586a 20 .029
Likelihood Ratio 32.320 20 .040
N of Valid Cases 523
a. 11 cells (36.7%) have expected count less than 5. The minimum
expected count is .75.
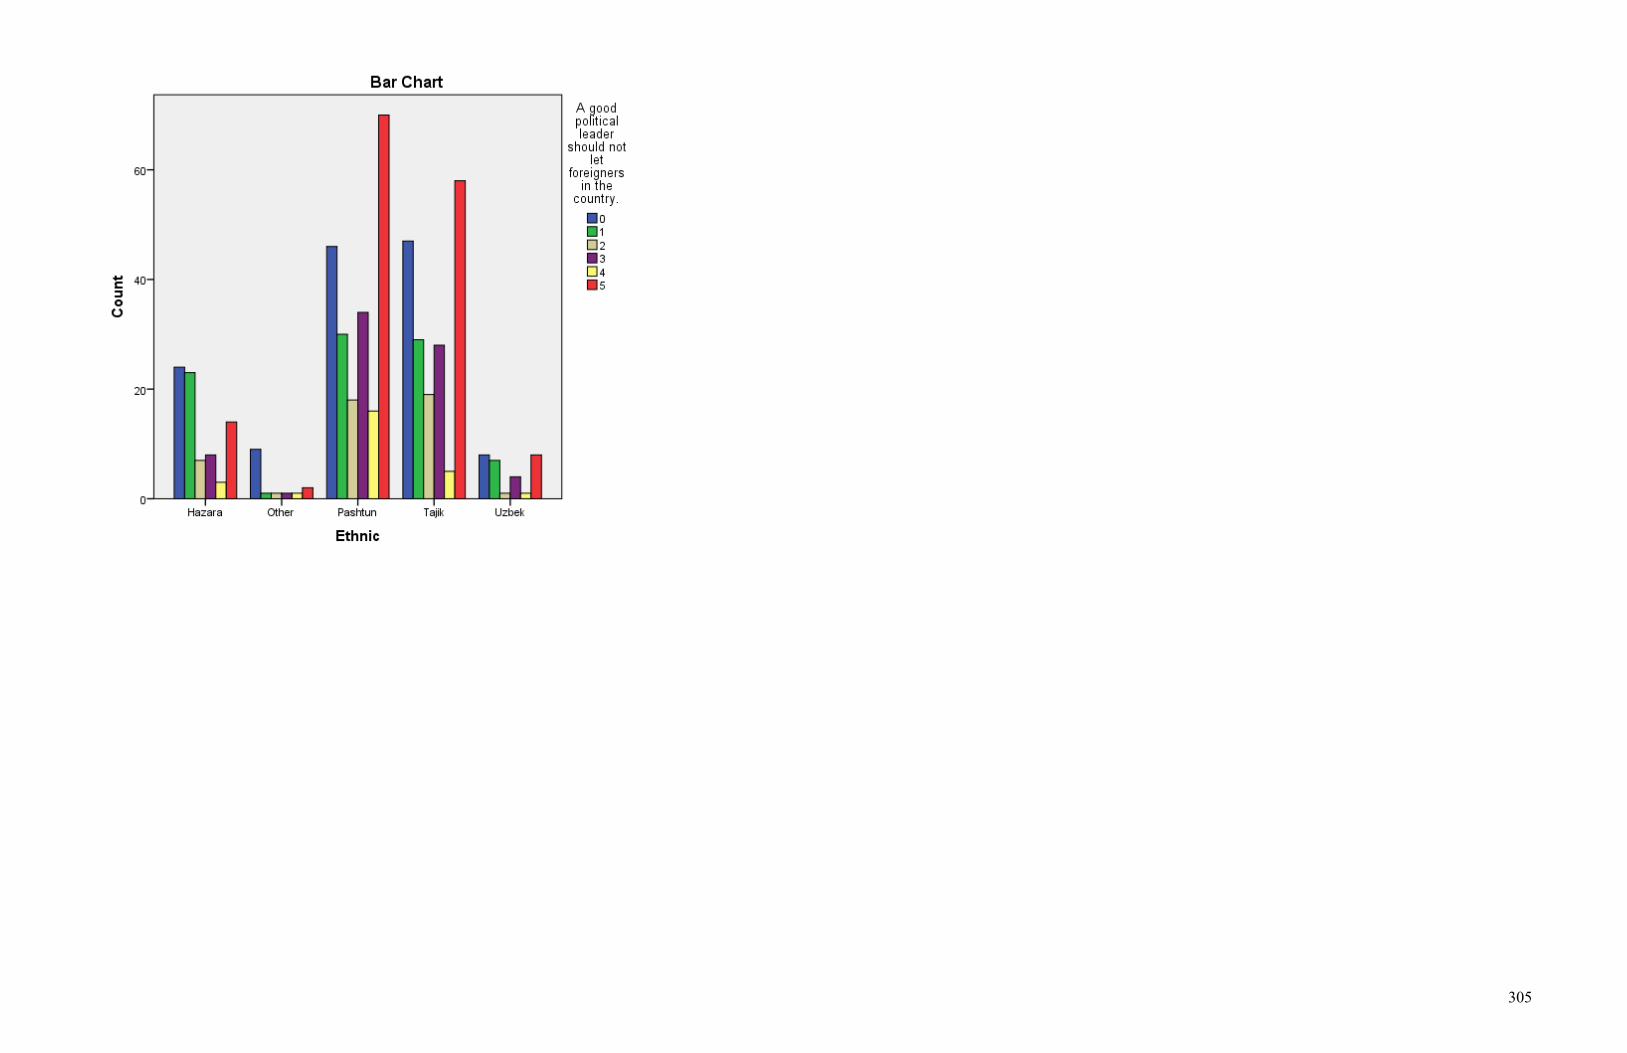
305

306
Ethnic * A good political leader should be selected through Jirga. Crosstab
A good political leader should be selected through Jirga.
Total 0 1 2 3 4 5
Ethnic Hazara Count 16 16 7 7 5 27 78
Expected Count 13.8 10.3 4.9 7.7 8.3 33.0 78.0
Other Count 5 2 1 0 3 4 15
Expected Count 2.7 2.0 .9 1.5 1.6 6.3 15.0
Pashtun Count 27 22 9 22 33 96 209
Expected Count 37.0 27.6 13.2 20.6 22.2 88.5 209.0
Tajik Count 37 22 11 18 11 79 178
Expected Count 31.5 23.5 11.2 17.5 18.9 75.3 178.0
Uzbek Count 5 5 4 3 2 9 28
Expected Count 5.0 3.7 1.8 2.8 3.0 11.9 28.0
Total Count 90 67 32 50 54 215 508
Expected Count 90.0 67.0 32.0 50.0 54.0 215.0 508.0
Chi-Square Tests
Value df
Asymp. Sig. (2-
sided)
Pearson Chi-Square 32.527a 20 .038
Likelihood Ratio 32.830 20 .035
N of Valid Cases 508
a. 11 cells (36.7%) have expected count less than 5. The minimum
expected count is .94.

307

308
Crosstabs Case Processing Summary
Cases
Valid Missing Total
N Percent N Percent N Percent
AgeBin * A good political
leader should pray five times in
the mosque.
527 92.8% 41 7.2% 568 100.0%
AgeBin * A good political
leader should have religious
education.
517 91.0% 51 9.0% 568 100.0%
AgeBin * A good political
leader should be highly
educated.
534 94.0% 34 6.0% 568 100.0%
AgeBin * A good political
leader should fight the
foreigners.
527 92.8% 41 7.2% 568 100.0%
AgeBin * A good political
leader should not let foreigners
in the country.
523 92.1% 45 7.9% 568 100.0%
AgeBin * A good political
leader should be selected
through Jirga.
508 89.4% 60 10.6% 568 100.0%

309
AgeBin * A good political leader should pray five times in the mosque. Crosstab
A good political leader should pray five times in the mosque.
Total 0 1 2 3 4 5
AgeBin Below 21 Count 4 7 9 13 8 111 152
Expected Count 7.5 8.4 11.0 23.1 12.1 90.0 152.0
22 to 31 Count 12 11 10 39 17 108 197
Expected Count 9.7 10.8 14.2 29.9 15.7 116.6 197.0
32 to 41 Count 7 4 12 18 8 47 96
Expected Count 4.7 5.3 6.9 14.6 7.7 56.8 96.0
42 to 51 Count 1 3 5 7 6 27 49
Expected Count 2.4 2.7 3.5 7.4 3.9 29.0 49.0
Above 51 Count 2 4 2 3 3 19 33
Expected Count 1.6 1.8 2.4 5.0 2.6 19.5 33.0
Total Count 26 29 38 80 42 312 527
Expected Count 26.0 29.0 38.0 80.0 42.0 312.0 527.0
Chi-Square Tests
Value df
Asymp. Sig. (2-
sided)
Pearson Chi-Square 32.252a 20 .041
Likelihood Ratio 31.912 20 .044
Linear-by-Linear Association 5.971 1 .015
N of Valid Cases 527
a. 9 cells (30.0%) have expected count less than 5. The minimum expected
count is 1.63.

310

311
AgeBin * A good political leader should have religious education. Crosstab
A good political leader should have religious education.
Total 0 1 2 3 4 5
AgeBin Below 21 Count 5 9 13 11 16 94 148
Expected Count 9.7 12.0 13.5 20.6 16.6 75.6 148.0
22 to 31 Count 15 15 8 33 25 96 192
Expected Count 12.6 15.6 17.5 26.7 21.5 98.0 192.0
32 to 41 Count 8 11 13 18 9 37 96
Expected Count 6.3 7.8 8.7 13.4 10.8 49.0 96.0
42 to 51 Count 3 3 11 7 4 21 49
Expected Count 3.2 4.0 4.5 6.8 5.5 25.0 49.0
Above 51 Count 3 4 2 3 4 16 32
Expected Count 2.1 2.6 2.9 4.5 3.6 16.3 32.0
Total Count 34 42 47 72 58 264 517
Expected Count 34.0 42.0 47.0 72.0 58.0 264.0 517.0
Chi-Square Tests
Value df
Asymp. Sig. (2-
sided)
Pearson Chi-Square 41.310a 20 .003
Likelihood Ratio 40.536 20 .004
Linear-by-Linear Association 10.523 1 .001
N of Valid Cases 517
a. 8 cells (26.7%) have expected count less than 5. The minimum expected
count is 2.10.

312

313
AgeBin * A good political leader should be highly educated. Crosstab
A good political leader should be highly educated.
Total 0 1 2 3 4 5
AgeBin Below 21 Count 1 0 2 5 14 131 153
Expected Count .3 .3 2.0 9.2 17.5 123.8 153.0
22 to 31 Count 0 0 3 15 20 162 200
Expected Count .4 .4 2.6 12.0 22.8 161.8 200.0
32 to 41 Count 0 0 1 8 14 74 97
Expected Count .2 .2 1.3 5.8 11.1 78.5 97.0
42 to 51 Count 0 0 1 3 8 38 50
Expected Count .1 .1 .7 3.0 5.7 40.4 50.0
Above 51 Count 0 1 0 1 5 27 34
Expected Count .1 .1 .4 2.0 3.9 27.5 34.0
Total Count 1 1 7 32 61 432 534
Expected Count 1.0 1.0 7.0 32.0 61.0 432.0 534.0
Chi-Square Tests
Value df
Asymp. Sig. (2-
sided)
Pearson Chi-Square 25.828a 20 .172
Likelihood Ratio 17.298 20 .634
Linear-by-Linear Association 1.536 1 .215
N of Valid Cases 534
a. 18 cells (60.0%) have expected count less than 5. The minimum expected
count is .06.

314

315
AgeBin * A good political leader should fight the foreigners. Crosstab
A good political leader should fight the foreigners.
Total 0 1 2 3 4 5
AgeBin Below 21 Count 3 13 17 25 13 79 150
Expected Count 10.2 14.2 16.8 24.8 13.4 70.6 150.0
22 to 31 Count 17 15 19 35 19 93 198
Expected Count 13.5 18.8 22.2 32.7 17.7 93.2 198.0
32 to 41 Count 12 12 11 16 10 36 97
Expected Count 6.6 9.2 10.9 16.0 8.7 45.6 97.0
42 to 51 Count 3 4 10 8 2 23 50
Expected Count 3.4 4.7 5.6 8.3 4.5 23.5 50.0
Above 51 Count 1 6 2 3 3 17 32
Expected Count 2.2 3.0 3.6 5.3 2.9 15.1 32.0
Total Count 36 50 59 87 47 248 527
Expected Count 36.0 50.0 59.0 87.0 47.0 248.0 527.0
Chi-Square Tests
Value df
Asymp. Sig. (2-
sided)
Pearson Chi-Square 26.568a 20 .148
Likelihood Ratio 27.288 20 .127
Linear-by-Linear Association 3.346 1 .067
N of Valid Cases 527
a. 7 cells (23.3%) have expected count less than 5. The minimum expected
count is 2.19.

316

317
AgeBin * A good political leader should not let foreigners in the country. Crosstab
A good political leader should not let foreigners in the country.
Total 0 1 2 3 4 5
AgeBin Below 21 Count 17 24 14 24 12 59 150
Expected Count 38.4 25.8 13.2 21.5 7.5 43.6 150.0
22 to 31 Count 58 35 17 32 9 47 198
Expected Count 50.7 34.1 17.4 28.4 9.8 57.5 198.0
32 to 41 Count 31 17 10 14 2 22 96
Expected Count 24.6 16.5 8.4 13.8 4.8 27.9 96.0
42 to 51 Count 20 9 3 3 1 13 49
Expected Count 12.6 8.4 4.3 7.0 2.4 14.2 49.0
Above 51 Count 8 5 2 2 2 11 30
Expected Count 7.7 5.2 2.6 4.3 1.5 8.7 30.0
Total Count 134 90 46 75 26 152 523
Expected Count 134.0 90.0 46.0 75.0 26.0 152.0 523.0
Chi-Square Tests
Value df
Asymp. Sig. (2-
sided)
Pearson Chi-Square 39.287a 20 .006
Likelihood Ratio 42.465 20 .002
Linear-by-Linear Association 11.446 1 .001
N of Valid Cases 523
a. 6 cells (20.0%) have expected count less than 5. The minimum expected
count is 1.49.

318

319
AgeBin * A good political leader should be selected through Jirga. Crosstab
A good political leader should be selected through Jirga.
Total 0 1 2 3 4 5
AgeBin Below 21 Count 10 13 7 16 18 79 143
Expected Count 25.3 18.9 9.0 14.1 15.2 60.5 143.0
22 to 31 Count 39 31 13 20 16 78 197
Expected Count 34.9 26.0 12.4 19.4 20.9 83.4 197.0
32 to 41 Count 24 13 6 9 12 27 91
Expected Count 16.1 12.0 5.7 9.0 9.7 38.5 91.0
42 to 51 Count 12 4 3 2 6 19 46
Expected Count 8.1 6.1 2.9 4.5 4.9 19.5 46.0
Above 51 Count 5 6 3 3 2 12 31
Expected Count 5.5 4.1 2.0 3.1 3.3 13.1 31.0
Total Count 90 67 32 50 54 215 508
Expected Count 90.0 67.0 32.0 50.0 54.0 215.0 508.0
Chi-Square Tests
Value df
Asymp. Sig. (2-
sided)
Pearson Chi-Square 35.234a 20 .019
Likelihood Ratio 37.761 20 .009
Linear-by-Linear Association 12.499 1 .000
N of Valid Cases 508
a. 7 cells (23.3%) have expected count less than 5. The minimum expected
count is 1.95.

320

321
Crosstabs Case Processing Summary
Cases
Valid Missing Total
N Percent N Percent N Percent
EliteBin * A good political
leader should pray five times in
the mosque.
527 92.8% 41 7.2% 568 100.0%
EliteBin * A good political
leader should have religious
education.
517 91.0% 51 9.0% 568 100.0%
EliteBin * A good political
leader should be highly
educated.
534 94.0% 34 6.0% 568 100.0%
EliteBin * A good political
leader should fight the
foreigners.
527 92.8% 41 7.2% 568 100.0%
EliteBin * A good political
leader should not let foreigners
in the country.
523 92.1% 45 7.9% 568 100.0%
EliteBin * A good political
leader should be selected
through Jirga.
508 89.4% 60 10.6% 568 100.0%
EliteBin * A good political leader should pray five times in the mosque.
Crosstab
A good political leader should pray five times in the mosque.
Total 0 1 2 3 4 5
EliteBin None Participants Count 8 11 13 37 19 165 253
Expected Count 12.5 13.9 18.2 38.4 20.2 149.8 253.0
Attentives Count 10 12 15 32 17 108 194
Expected Count 9.6 10.7 14.0 29.4 15.5 114.9 194.0
Participants Count 8 6 10 11 6 39 80
Expected Count 3.9 4.4 5.8 12.1 6.4 47.4 80.0
Total Count 26 29 38 80 42 312 527
Expected Count 26.0 29.0 38.0 80.0 42.0 312.0 527.0
Chi-Square Tests
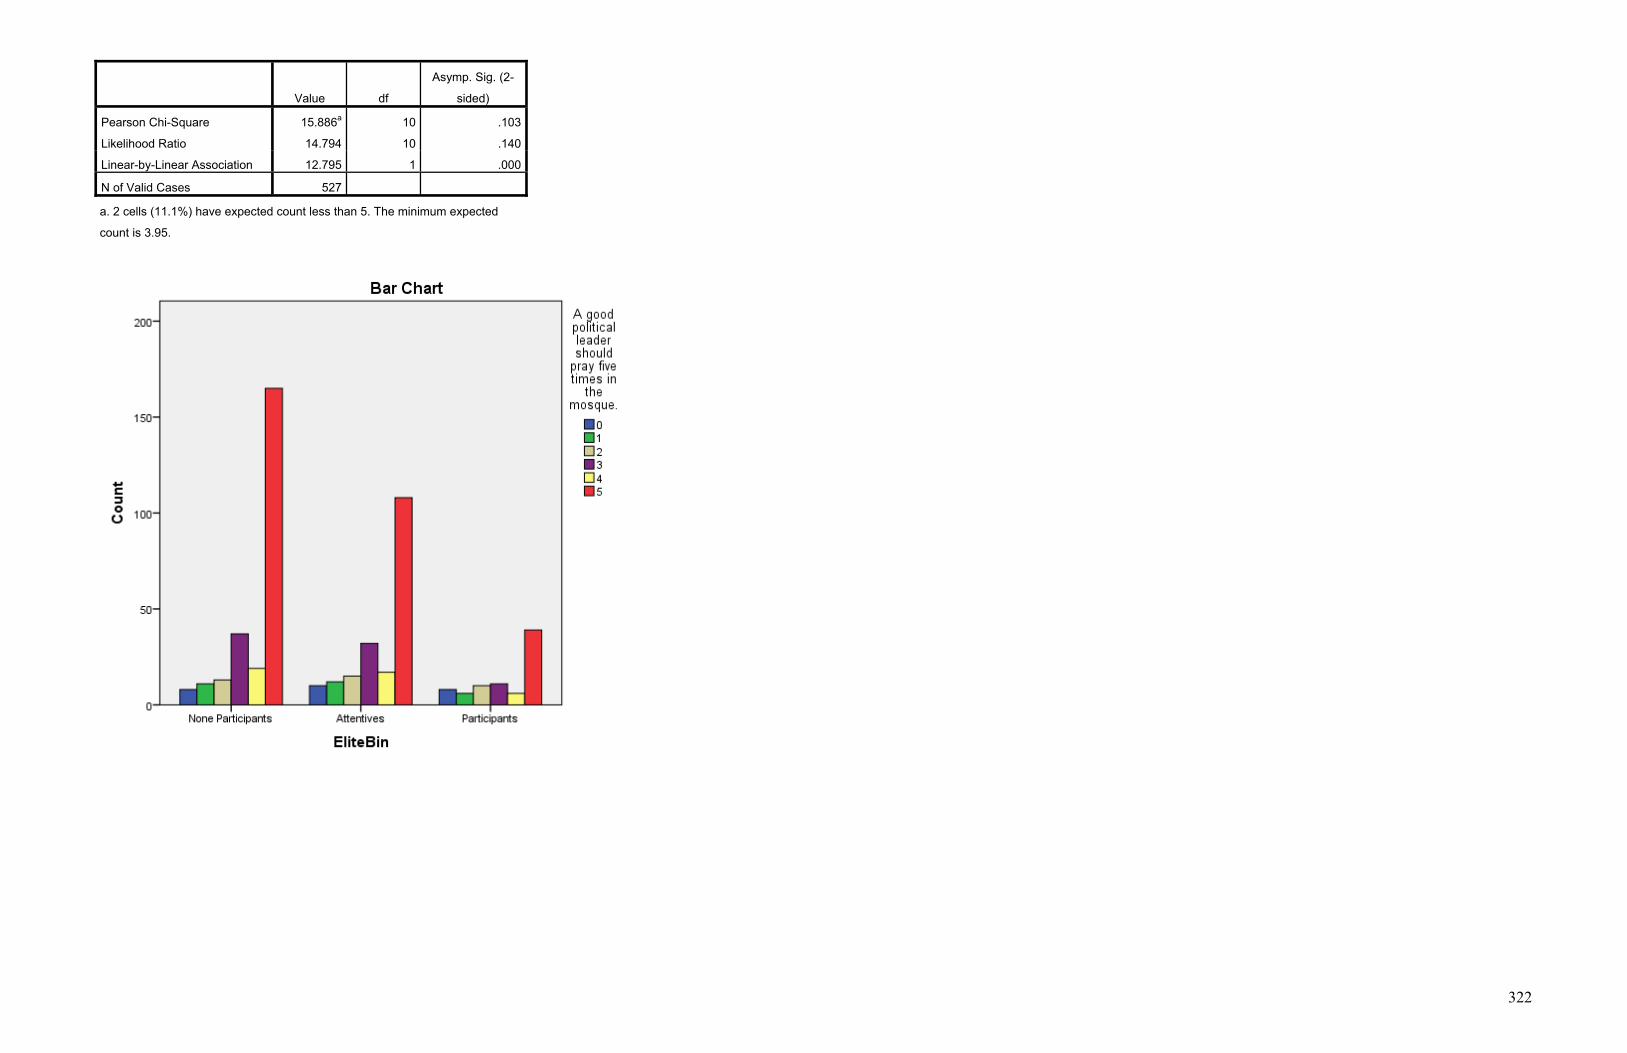
322
Value df
Asymp. Sig. (2-
sided)
Pearson Chi-Square 15.886a 10 .103
Likelihood Ratio 14.794 10 .140
Linear-by-Linear Association 12.795 1 .000
N of Valid Cases 527
a. 2 cells (11.1%) have expected count less than 5. The minimum expected
count is 3.95.

323
EliteBin * A good political leader should have religious education. Crosstab
A good political leader should have religious education.
Total 0 1 2 3 4 5
EliteBin None Participants Count 16 18 17 32 22 141 246
Expected Count 16.2 20.0 22.4 34.3 27.6 125.6 246.0
Attentives Count 12 13 17 30 28 93 193
Expected Count 12.7 15.7 17.5 26.9 21.7 98.6 193.0
Participants Count 6 11 13 10 8 30 78
Expected Count 5.1 6.3 7.1 10.9 8.8 39.8 78.0
Total Count 34 42 47 72 58 264 517
Expected Count 34.0 42.0 47.0 72.0 58.0 264.0 517.0
Chi-Square Tests
Value df
Asymp. Sig. (2-
sided)
Pearson Chi-Square 18.766a 10 .043
Likelihood Ratio 17.386 10 .066
Linear-by-Linear Association 7.381 1 .007
N of Valid Cases 517
a. 0 cells (0.0%) have expected count less than 5. The minimum expected
count is 5.13.

324

325
EliteBin * A good political leader should be highly educated. Crosstab
A good political leader should be highly educated.
Total 0 1 2 3 4 5
EliteBin None Participants Count 1 1 3 13 16 226 260
Expected Count .5 .5 3.4 15.6 29.7 210.3 260.0
Attentives Count 0 0 3 14 33 144 194
Expected Count .4 .4 2.5 11.6 22.2 156.9 194.0
Participants Count 0 0 1 5 12 62 80
Expected Count .1 .1 1.0 4.8 9.1 64.7 80.0
Total Count 1 1 7 32 61 432 534
Expected Count 1.0 1.0 7.0 32.0 61.0 432.0 534.0
Chi-Square Tests
Value df
Asymp. Sig. (2-
sided)
Pearson Chi-Square 18.027a 10 .055
Likelihood Ratio 19.302 10 .037
Linear-by-Linear Association 2.289 1 .130
N of Valid Cases 534
a. 10 cells (55.6%) have expected count less than 5. The minimum expected
count is .15.

326

327
EliteBin * A good political leader should fight the foreigners. Crosstab
A good political leader should fight the foreigners.
Total 0 1 2 3 4 5
EliteBin None Participants Count 12 17 25 44 26 133 257
Expected Count 17.6 24.4 28.8 42.4 22.9 120.9 257.0
Attentives Count 15 22 23 33 17 82 192
Expected Count 13.1 18.2 21.5 31.7 17.1 90.4 192.0
Participants Count 9 11 11 10 4 33 78
Expected Count 5.3 7.4 8.7 12.9 7.0 36.7 78.0
Total Count 36 50 59 87 47 248 527
Expected Count 36.0 50.0 59.0 87.0 47.0 248.0 527.0
Chi-Square Tests
Value df
Asymp. Sig. (2-
sided)
Pearson Chi-Square 15.295a 10 .122
Likelihood Ratio 15.295 10 .122
Linear-by-Linear Association 11.291 1 .001
N of Valid Cases 527
a. 0 cells (0.0%) have expected count less than 5. The minimum expected
count is 5.33.

328

329
EliteBin * A good political leader should not let foreigners in the country. Crosstab
A good political leader should not let foreigners in the country.
Total 0 1 2 3 4 5
EliteBin None Participants Count 50 33 23 41 15 91 253
Expected Count 64.8 43.5 22.3 36.3 12.6 73.5 253.0
Attentives Count 51 41 16 30 10 46 194
Expected Count 49.7 33.4 17.1 27.8 9.6 56.4 194.0
Participants Count 33 16 7 4 1 15 76
Expected Count 19.5 13.1 6.7 10.9 3.8 22.1 76.0
Total Count 134 90 46 75 26 152 523
Expected Count 134.0 90.0 46.0 75.0 26.0 152.0 523.0
Chi-Square Tests
Value df
Asymp. Sig. (2-
sided)
Pearson Chi-Square 33.879a 10 .000
Likelihood Ratio 34.944 10 .000
Linear-by-Linear Association 25.700 1 .000
N of Valid Cases 523
a. 1 cells (5.6%) have expected count less than 5. The minimum expected
count is 3.78.

330
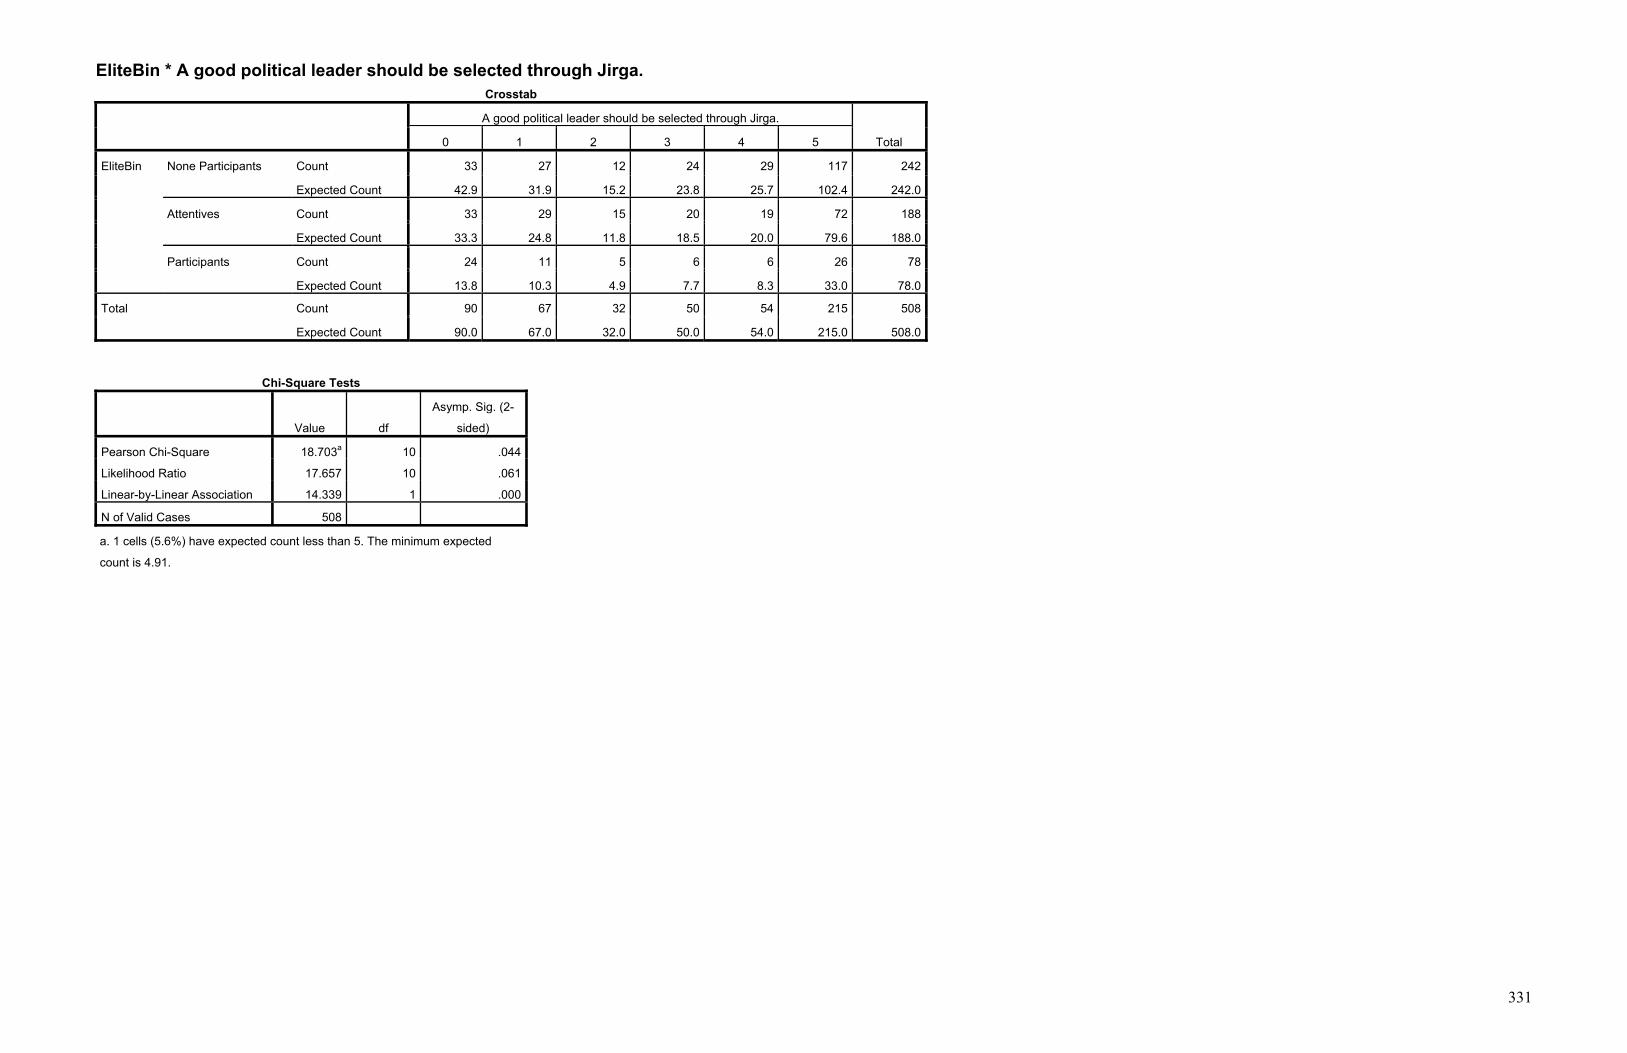
331
EliteBin * A good political leader should be selected through Jirga. Crosstab
A good political leader should be selected through Jirga.
Total 0 1 2 3 4 5
EliteBin None Participants Count 33 27 12 24 29 117 242
Expected Count 42.9 31.9 15.2 23.8 25.7 102.4 242.0
Attentives Count 33 29 15 20 19 72 188
Expected Count 33.3 24.8 11.8 18.5 20.0 79.6 188.0
Participants Count 24 11 5 6 6 26 78
Expected Count 13.8 10.3 4.9 7.7 8.3 33.0 78.0
Total Count 90 67 32 50 54 215 508
Expected Count 90.0 67.0 32.0 50.0 54.0 215.0 508.0
Chi-Square Tests
Value df
Asymp. Sig. (2-
sided)
Pearson Chi-Square 18.703a 10 .044
Likelihood Ratio 17.657 10 .061
Linear-by-Linear Association 14.339 1 .000
N of Valid Cases 508
a. 1 cells (5.6%) have expected count less than 5. The minimum expected
count is 4.91.

332

333
Crosstabs Case Processing Summary
Cases
Valid Missing Total
N Percent N Percent N Percent
AgeBin * A good political
leader should pray five times in
the mosque.
527 92.8% 41 7.2% 568 100.0%
AgeBin * A good political
leader should have religious
education.
517 91.0% 51 9.0% 568 100.0%
AgeBin * A good political
leader should be highly
educated.
534 94.0% 34 6.0% 568 100.0%
AgeBin * A good political
leader should fight the
foreigners.
527 92.8% 41 7.2% 568 100.0%
AgeBin * A good political
leader should not let foreigners
in the country.
523 92.1% 45 7.9% 568 100.0%
AgeBin * A good political
leader should be selected
through Jirga.
508 89.4% 60 10.6% 568 100.0%

334
AgeBin * A good political leader should pray five times in the mosque. Crosstab
A good political leader should pray five times in the mosque.
Total 0 1 2 3 4 5
AgeBin Below 21 Count 4 7 9 13 8 111 152
Expected Count 7.5 8.4 11.0 23.1 12.1 90.0 152.0
22 to 31 Count 12 11 10 39 17 108 197
Expected Count 9.7 10.8 14.2 29.9 15.7 116.6 197.0
32 to 41 Count 7 4 12 18 8 47 96
Expected Count 4.7 5.3 6.9 14.6 7.7 56.8 96.0
42 to 51 Count 1 3 5 7 6 27 49
Expected Count 2.4 2.7 3.5 7.4 3.9 29.0 49.0
Above 51 Count 2 4 2 3 3 19 33
Expected Count 1.6 1.8 2.4 5.0 2.6 19.5 33.0
Total Count 26 29 38 80 42 312 527
Expected Count 26.0 29.0 38.0 80.0 42.0 312.0 527.0
Chi-Square Tests
Value df
Asymp. Sig. (2-
sided)
Pearson Chi-Square 32.252a 20 .041
Likelihood Ratio 31.912 20 .044
Linear-by-Linear Association 5.971 1 .015
N of Valid Cases 527
a. 9 cells (30.0%) have expected count less than 5. The minimum expected
count is 1.63.

335

336
AgeBin * A good political leader should have religious education. Crosstab
A good political leader should have religious education.
Total 0 1 2 3 4 5
AgeBin Below 21 Count 5 9 13 11 16 94 148
Expected Count 9.7 12.0 13.5 20.6 16.6 75.6 148.0
22 to 31 Count 15 15 8 33 25 96 192
Expected Count 12.6 15.6 17.5 26.7 21.5 98.0 192.0
32 to 41 Count 8 11 13 18 9 37 96
Expected Count 6.3 7.8 8.7 13.4 10.8 49.0 96.0
42 to 51 Count 3 3 11 7 4 21 49
Expected Count 3.2 4.0 4.5 6.8 5.5 25.0 49.0
Above 51 Count 3 4 2 3 4 16 32
Expected Count 2.1 2.6 2.9 4.5 3.6 16.3 32.0
Total Count 34 42 47 72 58 264 517
Expected Count 34.0 42.0 47.0 72.0 58.0 264.0 517.0
Chi-Square Tests
Value df
Asymp. Sig. (2-
sided)
Pearson Chi-Square 41.310a 20 .003
Likelihood Ratio 40.536 20 .004
Linear-by-Linear Association 10.523 1 .001
N of Valid Cases 517
a. 8 cells (26.7%) have expected count less than 5. The minimum expected
count is 2.10.

337

338
AgeBin * A good political leader should be highly educated. Crosstab
A good political leader should be highly educated.
Total 0 1 2 3 4 5
AgeBin Below 21 Count 1 0 2 5 14 131 153
Expected Count .3 .3 2.0 9.2 17.5 123.8 153.0
22 to 31 Count 0 0 3 15 20 162 200
Expected Count .4 .4 2.6 12.0 22.8 161.8 200.0
32 to 41 Count 0 0 1 8 14 74 97
Expected Count .2 .2 1.3 5.8 11.1 78.5 97.0
42 to 51 Count 0 0 1 3 8 38 50
Expected Count .1 .1 .7 3.0 5.7 40.4 50.0
Above 51 Count 0 1 0 1 5 27 34
Expected Count .1 .1 .4 2.0 3.9 27.5 34.0
Total Count 1 1 7 32 61 432 534
Expected Count 1.0 1.0 7.0 32.0 61.0 432.0 534.0
Chi-Square Tests
Value df
Asymp. Sig. (2-
sided)
Pearson Chi-Square 25.828a 20 .172
Likelihood Ratio 17.298 20 .634
Linear-by-Linear Association 1.536 1 .215
N of Valid Cases 534
a. 18 cells (60.0%) have expected count less than 5. The minimum expected
count is .06.

339

340
AgeBin * A good political leader should fight the foreigners. Crosstab
A good political leader should fight the foreigners.
Total 0 1 2 3 4 5
AgeBin Below 21 Count 3 13 17 25 13 79 150
Expected Count 10.2 14.2 16.8 24.8 13.4 70.6 150.0
22 to 31 Count 17 15 19 35 19 93 198
Expected Count 13.5 18.8 22.2 32.7 17.7 93.2 198.0
32 to 41 Count 12 12 11 16 10 36 97
Expected Count 6.6 9.2 10.9 16.0 8.7 45.6 97.0
42 to 51 Count 3 4 10 8 2 23 50
Expected Count 3.4 4.7 5.6 8.3 4.5 23.5 50.0
Above 51 Count 1 6 2 3 3 17 32
Expected Count 2.2 3.0 3.6 5.3 2.9 15.1 32.0
Total Count 36 50 59 87 47 248 527
Expected Count 36.0 50.0 59.0 87.0 47.0 248.0 527.0
Chi-Square Tests
Value df
Asymp. Sig. (2-
sided)
Pearson Chi-Square 26.568a 20 .148
Likelihood Ratio 27.288 20 .127
Linear-by-Linear Association 3.346 1 .067
N of Valid Cases 527
a. 7 cells (23.3%) have expected count less than 5. The minimum expected
count is 2.19.

341

342
AgeBin * A good political leader should not let foreigners in the country. Crosstab
A good political leader should not let foreigners in the country.
Total 0 1 2 3 4 5
AgeBin Below 21 Count 17 24 14 24 12 59 150
Expected Count 38.4 25.8 13.2 21.5 7.5 43.6 150.0
22 to 31 Count 58 35 17 32 9 47 198
Expected Count 50.7 34.1 17.4 28.4 9.8 57.5 198.0
32 to 41 Count 31 17 10 14 2 22 96
Expected Count 24.6 16.5 8.4 13.8 4.8 27.9 96.0
42 to 51 Count 20 9 3 3 1 13 49
Expected Count 12.6 8.4 4.3 7.0 2.4 14.2 49.0
Above 51 Count 8 5 2 2 2 11 30
Expected Count 7.7 5.2 2.6 4.3 1.5 8.7 30.0
Total Count 134 90 46 75 26 152 523
Expected Count 134.0 90.0 46.0 75.0 26.0 152.0 523.0
Chi-Square Tests
Value df
Asymp. Sig. (2-
sided)
Pearson Chi-Square 39.287a 20 .006
Likelihood Ratio 42.465 20 .002
Linear-by-Linear Association 11.446 1 .001
N of Valid Cases 523
a. 6 cells (20.0%) have expected count less than 5. The minimum expected
count is 1.49.

343

344
AgeBin * A good political leader should be selected through Jirga. Crosstab
A good political leader should be selected through Jirga.
Total 0 1 2 3 4 5
AgeBin Below 21 Count 10 13 7 16 18 79 143
Expected Count 25.3 18.9 9.0 14.1 15.2 60.5 143.0
22 to 31 Count 39 31 13 20 16 78 197
Expected Count 34.9 26.0 12.4 19.4 20.9 83.4 197.0
32 to 41 Count 24 13 6 9 12 27 91
Expected Count 16.1 12.0 5.7 9.0 9.7 38.5 91.0
42 to 51 Count 12 4 3 2 6 19 46
Expected Count 8.1 6.1 2.9 4.5 4.9 19.5 46.0
Above 51 Count 5 6 3 3 2 12 31
Expected Count 5.5 4.1 2.0 3.1 3.3 13.1 31.0
Total Count 90 67 32 50 54 215 508
Expected Count 90.0 67.0 32.0 50.0 54.0 215.0 508.0
Chi-Square Tests
Value df
Asymp. Sig. (2-
sided)
Pearson Chi-Square 35.234a 20 .019
Likelihood Ratio 37.761 20 .009
Linear-by-Linear Association 12.499 1 .000
N of Valid Cases 508
a. 7 cells (23.3%) have expected count less than 5. The minimum expected
count is 1.95.

345

346
Frequencies
Statistics
A g
ood
polit
ical
lead
er s
houl
d pu
t on
a tu
rban
.
A go
od p
oliti
cal l
eade
r sho
uld
put o
n Pe
raha
n Tu
nban
.
A g
ood
polit
ical
lead
er s
houl
d be
from
Kan
daha
r.
A g
ood
polit
ical
lead
er s
houl
d be
from
a n
oble
fam
ily.
A go
od p
oliti
cal l
eade
r sho
uld
see
all e
thni
c gr
oups
with
one
eye
.
A go
od p
oliti
cal l
eade
r sho
uld
not b
e yo
ung.
N Valid 507 510 514 511 518 507
Missing 61 58 54 57 50 61
Mean 2.34 2.72 1.56 2.17 2.66 2.08
Median 2.00 3.00 1.00 1.00 3.00 2.00
Mode 0 5 0 0 5 0
Std. Deviation 1.863 1.880 1.779 1.949 1.837 1.704
Skewness .197 -.085 .920 .354 -.038 .312
Std. Error of Skewness .108 .108 .108 .108 .107 .108
Kurtosis -1.403 -1.430 -.562 -1.434 -1.404 -1.093
Std. Error of Kurtosis .217 .216 .215 .216 .214 .217
Minimum 0 0 0 0 0 0
Maximum 5 5 5 5 5 5
Frequency Table
A good political leader should put on a turban.
Frequency Percent Valid Percent
Cumulative
Percent
Valid 0 114 20.1 22.5 22.5
1 97 17.1 19.1 41.6
2 67 11.8 13.2 54.8
3 73 12.9 14.4 69.2
4 43 7.6 8.5 77.7
5 113 19.9 22.3 100.0

347
Total 507 89.3 100.0 Missing System 61 10.7 Total 568 100.0
A good political leader should put on Perahan Tunban.
Frequency Percent Valid Percent
Cumulative
Percent
Valid 0 92 16.2 18.0 18.0
1 67 11.8 13.1 31.2
2 81 14.3 15.9 47.1
3 79 13.9 15.5 62.5
4 34 6.0 6.7 69.2
5 157 27.6 30.8 100.0
Total 510 89.8 100.0 Missing System 58 10.2 Total 568 100.0
A good political leader should be from Kandahar.
Frequency Percent Valid Percent
Cumulative
Percent
Valid 0 202 35.6 39.3 39.3
1 128 22.5 24.9 64.2
2 46 8.1 8.9 73.2
3 45 7.9 8.8 81.9
4 19 3.3 3.7 85.6
5 74 13.0 14.4 100.0
Total 514 90.5 100.0 Missing System 54 9.5 Total 568 100.0
A good political leader should be from a noble family.
Frequency Percent Valid Percent
Cumulative
Percent
Valid 0 141 24.8 27.6 27.6
1 115 20.2 22.5 50.1
2 40 7.0 7.8 57.9
3 67 11.8 13.1 71.0
4 25 4.4 4.9 75.9
5 123 21.7 24.1 100.0
Total 511 90.0 100.0 Missing System 57 10.0 Total 568 100.0
A good political leader should see all ethnic groups with one eye.

348
Frequency Percent Valid Percent
Cumulative
Percent
Valid 0 87 15.3 16.8 16.8
1 87 15.3 16.8 33.6
2 68 12.0 13.1 46.7
3 92 16.2 17.8 64.5
4 43 7.6 8.3 72.8
5 141 24.8 27.2 100.0
Total 518 91.2 100.0 Missing System 50 8.8 Total 568 100.0
A good political leader should not be young.
Frequency Percent Valid Percent
Cumulative
Percent
Valid 0 127 22.4 25.0 25.0
1 93 16.4 18.3 43.4
2 67 11.8 13.2 56.6
3 121 21.3 23.9 80.5
4 28 4.9 5.5 86.0
5 71 12.5 14.0 100.0
Total 507 89.3 100.0 Missing System 61 10.7 Total 568 100.0

349
Pie Chart

350

351

352

353

354

355
Crosstabs Case Processing Summary
Cases
Valid Missing Total
N Percent N Percent N Percent
Ethnic * A good political leader
should put on a turban. 507 89.3% 61 10.7% 568 100.0%
Ethnic * A good political leader
should put on Perahan Tunban. 510 89.8% 58 10.2% 568 100.0%
Ethnic * A good political leader
should be from Kandahar. 514 90.5% 54 9.5% 568 100.0%
Ethnic * A good political leader
should be from a noble family. 511 90.0% 57 10.0% 568 100.0%
Ethnic * A good political leader
should see all ethnic groups
with one eye.
518 91.2% 50 8.8% 568 100.0%
Ethnic * A good political leader
should not be young. 507 89.3% 61 10.7% 568 100.0%
Ethnic * A good political leader should put on a turban.
Crosstab
A good political leader should put on a turban.
Total 0 1 2 3 4 5
Ethnic Hazara Count 20 17 8 9 3 14 71
Expected Count 16.0 13.6 9.4 10.2 6.0 15.8 71.0
Other Count 10 2 1 2 1 0 16
Expected Count 3.6 3.1 2.1 2.3 1.4 3.6 16.0
Pashtun Count 25 21 21 37 32 79 215
Expected Count 48.3 41.1 28.4 31.0 18.2 47.9 215.0
Tajik Count 52 49 30 22 6 18 177
Expected Count 39.8 33.9 23.4 25.5 15.0 39.4 177.0
Uzbek Count 7 8 7 3 1 2 28
Expected Count 6.3 5.4 3.7 4.0 2.4 6.2 28.0
Total Count 114 97 67 73 43 113 507
Expected Count 114.0 97.0 67.0 73.0 43.0 113.0 507.0

356
Chi-Square Tests
Value df
Asymp. Sig. (2-
sided)
Pearson Chi-Square 112.985a 20 .000
Likelihood Ratio 116.530 20 .000
N of Valid Cases 507
a. 9 cells (30.0%) have expected count less than 5. The minimum expected
count is 1.36.
Symmetric Measures
Value Approx. Sig.
Nominal by Nominal Phi .472 .000
Cramer's V .236 .000
N of Valid Cases 507
Ethnic * A good political leader should put on Perahan Tunban.
Crosstab
A good political leader should put on Perahan Tunban.
Total 0 1 2 3 4 5
Ethnic Hazara Count 18 16 8 8 5 19 74

357
Expected Count 13.3 9.7 11.8 11.5 4.9 22.8 74.0
Other Count 7 3 2 1 0 3 16
Expected Count 2.9 2.1 2.5 2.5 1.1 4.9 16.0
Pashtun Count 18 14 23 32 18 109 214
Expected Count 38.6 28.1 34.0 33.1 14.3 65.9 214.0
Tajik Count 43 31 42 31 9 23 179
Expected Count 32.3 23.5 28.4 27.7 11.9 55.1 179.0
Uzbek Count 6 3 6 7 2 3 27
Expected Count 4.9 3.5 4.3 4.2 1.8 8.3 27.0
Total Count 92 67 81 79 34 157 510
Expected Count 92.0 67.0 81.0 79.0 34.0 157.0 510.0
Chi-Square Tests
Value df
Asymp. Sig. (2-
sided)
Pearson Chi-Square 107.056a 20 .000
Likelihood Ratio 110.992 20 .000
N of Valid Cases 510
a. 12 cells (40.0%) have expected count less than 5. The minimum
expected count is 1.07.
Symmetric Measures
Value Approx. Sig.
Nominal by Nominal Phi .458 .000
Cramer's V .229 .000
N of Valid Cases 510

358

359
Ethnic * A good political leader should be from Kandahar. Crosstab
A good political leader should be from Kandahar.
Total 0 1 2 3 4 5
Ethnic Hazara Count 29 24 9 4 1 4 71
Expected Count 27.9 17.7 6.4 6.2 2.6 10.2 71.0
Other Count 10 3 2 1 0 0 16
Expected Count 6.3 4.0 1.4 1.4 .6 2.3 16.0
Pashtun Count 53 44 15 34 15 56 217
Expected Count 85.3 54.0 19.4 19.0 8.0 31.2 217.0
Tajik Count 94 47 20 5 3 12 181
Expected Count 71.1 45.1 16.2 15.8 6.7 26.1 181.0
Uzbek Count 16 10 0 1 0 2 29
Expected Count 11.4 7.2 2.6 2.5 1.1 4.2 29.0
Total Count 202 128 46 45 19 74 514
Expected Count 202.0 128.0 46.0 45.0 19.0 74.0 514.0
Chi-Square Tests
Value df
Asymp. Sig. (2-
sided)
Pearson Chi-Square 101.316a 20 .000
Likelihood Ratio 108.287 20 .000
N of Valid Cases 514
a. 10 cells (33.3%) have expected count less than 5. The minimum
expected count is .59.
Symmetric Measures
Value Approx. Sig.
Nominal by Nominal Phi .444 .000
Cramer's V .222 .000
N of Valid Cases 514

360

361
Ethnic * A good political leader should be from a noble family. Crosstab
A good political leader should be from a noble family.
Total 0 1 2 3 4 5
Ethnic Hazara Count 26 25 1 9 3 7 71
Expected Count 19.6 16.0 5.6 9.3 3.5 17.1 71.0
Other Count 11 2 1 1 0 1 16
Expected Count 4.4 3.6 1.3 2.1 .8 3.9 16.0
Pashtun Count 23 32 12 32 19 97 215
Expected Count 59.3 48.4 16.8 28.2 10.5 51.8 215.0
Tajik Count 67 48 25 22 3 15 180
Expected Count 49.7 40.5 14.1 23.6 8.8 43.3 180.0
Uzbek Count 14 8 1 3 0 3 29
Expected Count 8.0 6.5 2.3 3.8 1.4 7.0 29.0
Total Count 141 115 40 67 25 123 511
Expected Count 141.0 115.0 40.0 67.0 25.0 123.0 511.0
Chi-Square Tests
Value df
Asymp. Sig. (2-
sided)
Pearson Chi-Square 154.842a 20 .000
Likelihood Ratio 161.577 20 .000
N of Valid Cases 511
a. 10 cells (33.3%) have expected count less than 5. The minimum
expected count is .78.
Symmetric Measures
Value Approx. Sig.
Nominal by Nominal Phi .550 .000
Cramer's V .275 .000
N of Valid Cases 511

362

363
Ethnic * A good political leader should see all ethnic groups with one eye. Crosstab
A good political leader should see all ethnic groups with one eye.
Total 0 1 2 3 4 5
Ethnic Hazara Count 19 14 9 14 8 15 79
Expected Count 13.3 13.3 10.4 14.0 6.6 21.5 79.0
Other Count 9 2 2 1 0 2 16
Expected Count 2.7 2.7 2.1 2.8 1.3 4.4 16.0
Pashtun Count 26 31 25 47 21 66 216
Expected Count 36.3 36.3 28.4 38.4 17.9 58.8 216.0
Tajik Count 32 35 23 27 11 51 179
Expected Count 30.1 30.1 23.5 31.8 14.9 48.7 179.0
Uzbek Count 1 5 9 3 3 7 28
Expected Count 4.7 4.7 3.7 5.0 2.3 7.6 28.0
Total Count 87 87 68 92 43 141 518
Expected Count 87.0 87.0 68.0 92.0 43.0 141.0 518.0
Chi-Square Tests
Value df
Asymp. Sig. (2-
sided)
Pearson Chi-Square 45.670a 20 .001
Likelihood Ratio 41.516 20 .003
N of Valid Cases 518
a. 11 cells (36.7%) have expected count less than 5. The minimum
expected count is 1.33.
Symmetric Measures
Value Approx. Sig.
Nominal by Nominal Phi .297 .001
Cramer's V .148 .001
N of Valid Cases 518

364

365
Ethnic * A good political leader should not be young. Crosstab
A good political leader should not be young.
Total 0 1 2 3 4 5
Ethnic Hazara Count 24 22 9 13 0 9 77
Expected Count 19.3 14.1 10.2 18.4 4.3 10.8 77.0
Other Count 7 1 1 2 1 4 16
Expected Count 4.0 2.9 2.1 3.8 .9 2.2 16.0
Pashtun Count 46 37 21 55 21 32 212
Expected Count 53.1 38.9 28.0 50.6 11.7 29.7 212.0
Tajik Count 46 29 32 44 5 18 174
Expected Count 43.6 31.9 23.0 41.5 9.6 24.4 174.0
Uzbek Count 4 4 4 7 1 8 28
Expected Count 7.0 5.1 3.7 6.7 1.5 3.9 28.0
Total Count 127 93 67 121 28 71 507
Expected Count 127.0 93.0 67.0 121.0 28.0 71.0 507.0
Chi-Square Tests
Value df
Asymp. Sig. (2-
sided)
Pearson Chi-Square 42.867a 20 .002
Likelihood Ratio 45.023 20 .001
N of Valid Cases 507
a. 10 cells (33.3%) have expected count less than 5. The minimum
expected count is .88.
Symmetric Measures
Value Approx. Sig.
Nominal by Nominal Phi .291 .002
Cramer's V .145 .002
N of Valid Cases 507

366

367
Frequencies Statistics
A go
od p
oliti
cal l
eade
r sho
uld
not h
ave
doub
le p
assp
ort.
A go
od p
oliti
cal l
eade
r sho
uld
not h
ave
his/
her f
amily
& c
hild
ren
outs
ide
the
coun
try.
A g
ood
polit
ical
lead
er s
houl
d no
t be
mar
ried
to a
fore
ign
wife
.
A g
ood
polit
ical
lead
er s
houl
d no
t hav
e a
busi
ness
out
side
the
coun
try.
A g
ood
polit
ical
lead
er s
houl
d no
t hav
e a
hous
e in
ano
ther
cou
ntry
.
N Valid 512 512 520 521 519
Missing 56 56 48 47 49
Mean 3.96 3.67 3.77 3.84 3.84
Median 5.00 5.00 5.00 5.00 5.00
Mode 5 5 5 5 5
Std. Deviation 1.672 1.693 1.750 1.634 1.636
Skewness -1.352 -.943 -1.079 -1.149 -1.163
Std. Error of Skewness .108 .108 .107 .107 .107
Kurtosis .339 -.481 -.365 -.053 -.027
Std. Error of Kurtosis .215 .215 .214 .214 .214
Minimum 0 0 0 0 0
Maximum 5 5 5 5 5

368
Frequency Table A good political leader should not have double passport.
Frequency Percent Valid Percent
Cumulative
Percent
Valid 0 40 7.0 7.8 7.8
1 34 6.0 6.6 14.5
2 25 4.4 4.9 19.3
3 46 8.1 9.0 28.3
4 29 5.1 5.7 34.0
5 338 59.5 66.0 100.0
Total 512 90.1 100.0 Missing System 56 9.9 Total 568 100.0
A good political leader should not have his/her family & children outside the country.
Frequency Percent Valid Percent
Cumulative
Percent
Valid 0 40 7.0 7.8 7.8
1 40 7.0 7.8 15.6
2 42 7.4 8.2 23.8
3 77 13.6 15.0 38.9
4 39 6.9 7.6 46.5
5 274 48.2 53.5 100.0
Total 512 90.1 100.0 Missing System 56 9.9 Total 568 100.0
A good political leader should not be married to a foreign wife.
Frequency Percent Valid Percent
Cumulative
Percent
Valid 0 45 7.9 8.7 8.7
1 43 7.6 8.3 16.9
2 38 6.7 7.3 24.2
3 45 7.9 8.7 32.9
4 37 6.5 7.1 40.0
5 312 54.9 60.0 100.0
Total 520 91.5 100.0 Missing System 48 8.5 Total 568 100.0

369
A good political leader should not have a business outside the country.
Frequency Percent Valid Percent
Cumulative
Percent
Valid 0 34 6.0 6.5 6.5
1 37 6.5 7.1 13.6
2 41 7.2 7.9 21.5
3 57 10.0 10.9 32.4
4 48 8.5 9.2 41.7
5 304 53.5 58.3 100.0
Total 521 91.7 100.0 Missing System 47 8.3 Total 568 100.0
A good political leader should not have a house in another country.
Frequency Percent Valid Percent
Cumulative
Percent
Valid 0 34 6.0 6.6 6.6
1 39 6.9 7.5 14.1
2 37 6.5 7.1 21.2
3 55 9.7 10.6 31.8
4 53 9.3 10.2 42.0
5 301 53.0 58.0 100.0
Total 519 91.4 100.0 Missing System 49 8.6 Total 568 100.0

370
Pie Chart

371

372

373

374

375
Crosstabs Case Processing Summary
Cases
Valid Missing Total
N Percent N Percent N Percent
Ethnic * A good political leader
should not have double
passport.
512 90.1% 56 9.9% 568 100.0%
Ethnic * A good political leader
should not have his/her family
& children outside the country.
512 90.1% 56 9.9% 568 100.0%
Ethnic * A good political leader
should not be married to a
foreign wife.
520 91.5% 48 8.5% 568 100.0%
Ethnic * A good political leader
should not have a business
outside the country.
521 91.7% 47 8.3% 568 100.0%
Ethnic * A good political leader
should not have a house in
another country.
519 91.4% 49 8.6% 568 100.0%
Ethnic * A good political leader should not have double passport.
Crosstab
A good political leader should not have double passport.
Total 0 1 2 3 4 5
Ethnic Hazara Count 4 5 5 5 7 46 72
Expected Count 5.6 4.8 3.5 6.5 4.1 47.5 72.0
Other Count 2 0 1 2 0 10 15
Expected Count 1.2 1.0 .7 1.3 .8 9.9 15.0
Pashtun Count 22 15 11 24 15 125 212
Expected Count 16.6 14.1 10.4 19.0 12.0 140.0 212.0
Tajik Count 11 11 7 12 7 135 183
Expected Count 14.3 12.2 8.9 16.4 10.4 120.8 183.0
Uzbek Count 1 3 1 3 0 22 30
Expected Count 2.3 2.0 1.5 2.7 1.7 19.8 30.0
Total Count 40 34 25 46 29 338 512
Expected Count 40.0 34.0 25.0 46.0 29.0 338.0 512.0

376
Chi-Square Tests
Value df
Asymp. Sig. (2-
sided)
Pearson Chi-Square 20.598a 20 .421
Likelihood Ratio 23.823 20 .250
N of Valid Cases 512
a. 13 cells (43.3%) have expected count less than 5. The minimum
expected count is .73.

377
Ethnic * A good political leader should not have his/her family & children outside the country. Crosstab
A good political leader should not have his/her family & children outside the country.
Total 0 1 2 3 4 5
Ethnic Hazara Count 8 11 4 9 5 35 72
Expected Count 5.6 5.6 5.9 10.8 5.5 38.5 72.0
Other Count 5 1 1 1 3 5 16
Expected Count 1.3 1.3 1.3 2.4 1.2 8.6 16.0
Pashtun Count 18 11 23 28 15 116 211
Expected Count 16.5 16.5 17.3 31.7 16.1 112.9 211.0
Tajik Count 7 12 13 32 12 108 184
Expected Count 14.4 14.4 15.1 27.7 14.0 98.5 184.0
Uzbek Count 2 5 1 7 4 10 29
Expected Count 2.3 2.3 2.4 4.4 2.2 15.5 29.0
Total Count 40 40 42 77 39 274 512
Expected Count 40.0 40.0 42.0 77.0 39.0 274.0 512.0
Chi-Square Tests
Value df
Asymp. Sig. (2-
sided)
Pearson Chi-Square 43.639a 20 .002
Likelihood Ratio 37.453 20 .010
N of Valid Cases 512
a. 10 cells (33.3%) have expected count less than 5. The minimum
expected count is 1.22.

378

379
Ethnic * A good political leader should not be married to a foreign wife. Crosstab
A good political leader should not be married to a foreign wife.
Total 0 1 2 3 4 5
Ethnic Hazara Count 7 12 9 13 3 28 72
Expected Count 6.2 6.0 5.3 6.2 5.1 43.2 72.0
Other Count 6 2 0 0 1 7 16
Expected Count 1.4 1.3 1.2 1.4 1.1 9.6 16.0
Pashtun Count 17 15 9 18 14 142 215
Expected Count 18.6 17.8 15.7 18.6 15.3 129.0 215.0
Tajik Count 13 10 18 13 15 119 188
Expected Count 16.3 15.5 13.7 16.3 13.4 112.8 188.0
Uzbek Count 2 4 2 1 4 16 29
Expected Count 2.5 2.4 2.1 2.5 2.1 17.4 29.0
Total Count 45 43 38 45 37 312 520
Expected Count 45.0 43.0 38.0 45.0 37.0 312.0 520.0
Chi-Square Tests
Value df
Asymp. Sig. (2-
sided)
Pearson Chi-Square 55.530a 20 .000
Likelihood Ratio 48.836 20 .000
N of Valid Cases 520
a. 10 cells (33.3%) have expected count less than 5. The minimum
expected count is 1.14.

380

381
Ethnic * A good political leader should not have a business outside the country. Crosstab
A good political leader should not have a business outside the country.
Total 0 1 2 3 4 5
Ethnic Hazara Count 5 5 8 10 13 32 73
Expected Count 4.8 5.2 5.7 8.0 6.7 42.6 73.0
Other Count 3 1 0 1 2 9 16
Expected Count 1.0 1.1 1.3 1.8 1.5 9.3 16.0
Pashtun Count 13 15 13 22 17 136 216
Expected Count 14.1 15.3 17.0 23.6 19.9 126.0 216.0
Tajik Count 11 13 17 20 13 112 186
Expected Count 12.1 13.2 14.6 20.3 17.1 108.5 186.0
Uzbek Count 2 3 3 4 3 15 30
Expected Count 2.0 2.1 2.4 3.3 2.8 17.5 30.0
Total Count 34 37 41 57 48 304 521
Expected Count 34.0 37.0 41.0 57.0 48.0 304.0 521.0
Chi-Square Tests
Value df
Asymp. Sig. (2-
sided)
Pearson Chi-Square 20.388a 20 .434
Likelihood Ratio 19.413 20 .495
N of Valid Cases 521
a. 11 cells (36.7%) have expected count less than 5. The minimum
expected count is 1.04.

382

383
Ethnic * A good political leader should not have a house in another country. Crosstab
A good political leader should not have a house in another country.
Total 0 1 2 3 4 5
Ethnic Hazara Count 5 7 6 11 4 40 73
Expected Count 4.8 5.5 5.2 7.7 7.5 42.3 73.0
Other Count 4 0 0 2 1 9 16
Expected Count 1.0 1.2 1.1 1.7 1.6 9.3 16.0
Pashtun Count 14 18 15 18 25 127 217
Expected Count 14.2 16.3 15.5 23.0 22.2 125.9 217.0
Tajik Count 10 12 15 20 19 110 186
Expected Count 12.2 14.0 13.3 19.7 19.0 107.9 186.0
Uzbek Count 1 2 1 4 4 15 27
Expected Count 1.8 2.0 1.9 2.9 2.8 15.7 27.0
Total Count 34 39 37 55 53 301 519
Expected Count 34.0 39.0 37.0 55.0 53.0 301.0 519.0
Chi-Square Tests
Value df
Asymp. Sig. (2-
sided)
Pearson Chi-Square 19.041a 20 .519
Likelihood Ratio 18.186 20 .575
N of Valid Cases 519
a. 11 cells (36.7%) have expected count less than 5. The minimum
expected count is 1.05.
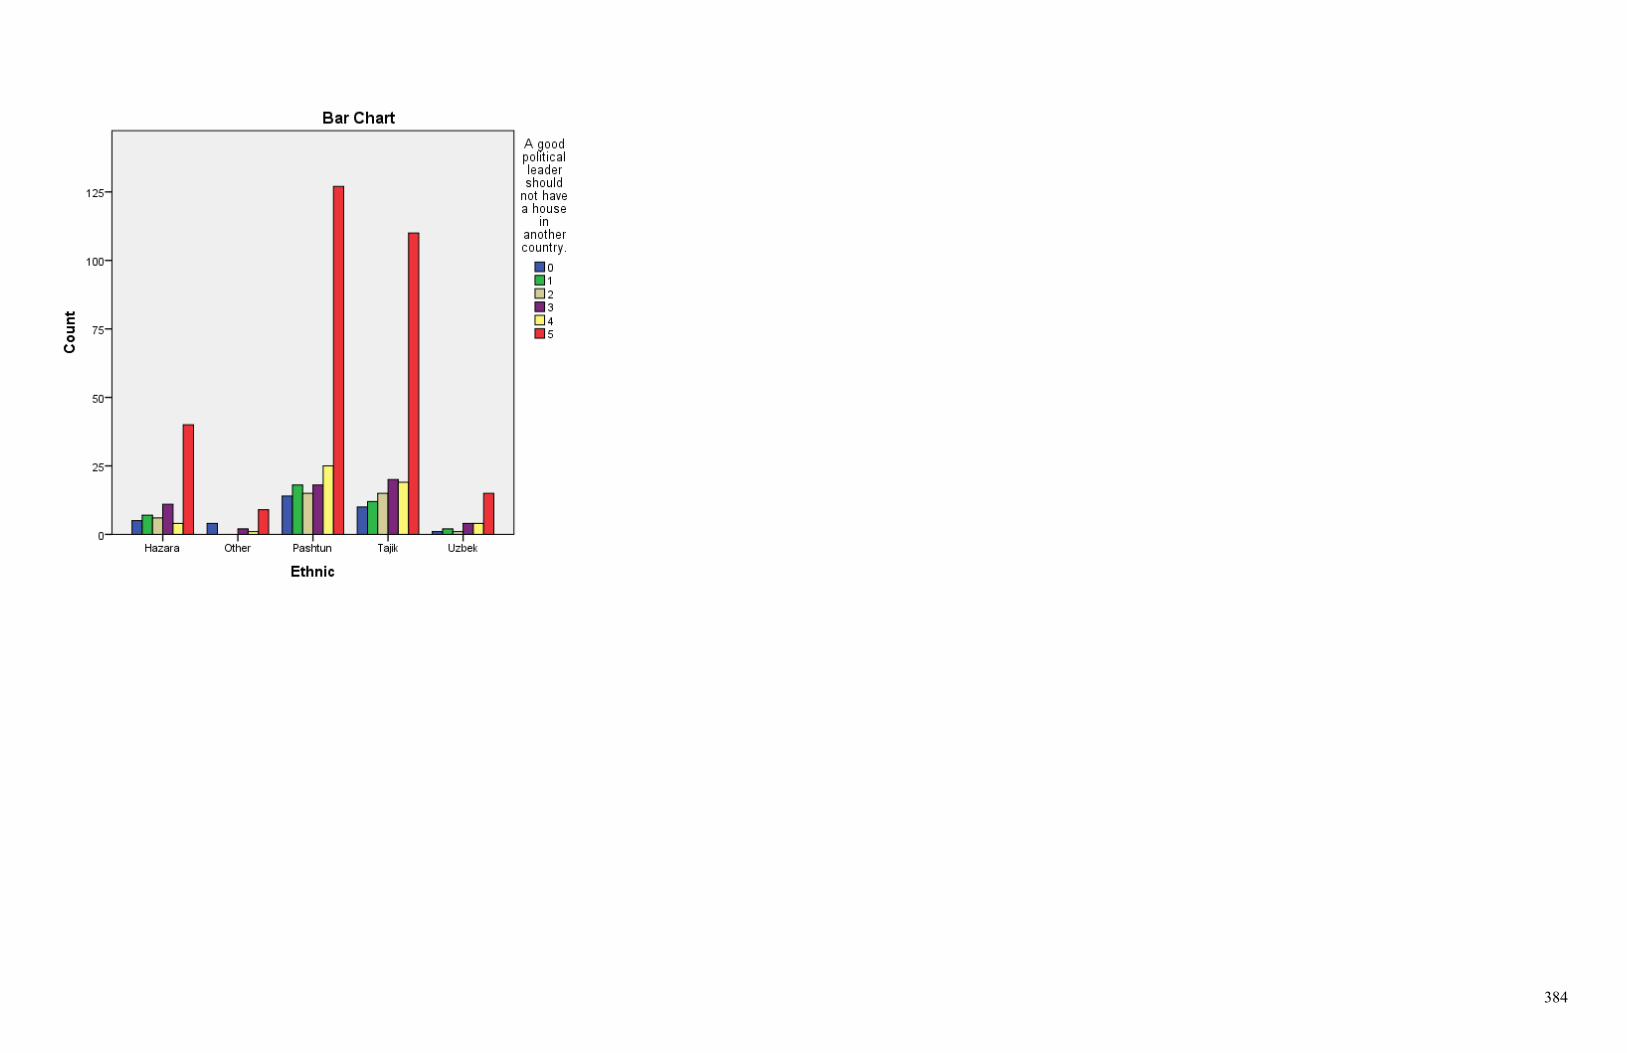
384

385
Frequencies Statistics
A go
od p
oliti
cal l
eade
r sho
uld
be a
wom
an.
A g
ood
polit
ical
lead
er s
houl
d pu
t on
a su
it w
ith ti
e.
A g
ood
polit
ical
lead
er s
houl
d re
spec
t hum
an ri
ghts
.
A g
ood
polit
ical
lead
er s
houl
d re
spec
t wom
en's
righ
ts.
A g
ood
polit
ical
lead
er s
houl
d al
low
wom
en to
wor
k in
the
gove
rnm
ent a
nd b
usin
ess.
A go
od p
oliti
cal l
eade
r sho
uld
be g
ood
spea
ker.
N Valid 519 513 528 531 529 525
Missing 49 55 40 37 39 43
Mean 2.53 2.95 4.65 4.56 4.19 4.38
Median 3.00 3.00 5.00 5.00 5.00 5.00
Mode 3 5 5 5 5 5
Std. Deviation 1.757 1.741 .818 .934 1.317 1.070
Skewness .006 -.292 -2.738 -2.462 -1.703 -2.010
Std. Error of Skewness .107 .108 .106 .106 .106 .107
Kurtosis -1.282 -1.176 7.894 6.001 2.090 4.112
Std. Error of Kurtosis .214 .215 .212 .212 .212 .213
Minimum 0 0 0 0 0 0
Maximum 5 5 5 5 5 5

386
Frequency Table A good political leader should be a woman.
Frequency Percent Valid Percent
Cumulative
Percent
Valid 0 90 15.8 17.3 17.3
1 89 15.7 17.1 34.5
2 62 10.9 11.9 46.4
3 120 21.1 23.1 69.6
4 49 8.6 9.4 79.0
5 109 19.2 21.0 100.0
Total 519 91.4 100.0 Missing System 49 8.6 Total 568 100.0
A good political leader should put on a suit with tie.
Frequency Percent Valid Percent
Cumulative
Percent
Valid 0 65 11.4 12.7 12.7
1 58 10.2 11.3 24.0
2 74 13.0 14.4 38.4
3 109 19.2 21.2 59.6
4 55 9.7 10.7 70.4
5 152 26.8 29.6 100.0
Total 513 90.3 100.0 Missing System 55 9.7 Total 568 100.0
A good political leader should respect human rights.
Frequency Percent Valid Percent
Cumulative
Percent
Valid 0 1 .2 .2 .2
1 8 1.4 1.5 1.7
2 8 1.4 1.5 3.2
3 34 6.0 6.4 9.7
4 57 10.0 10.8 20.5
5 420 73.9 79.5 100.0
Total 528 93.0 100.0 Missing System 40 7.0 Total 568 100.0

387
A good political leader should respect women's rights.
Frequency Percent Valid Percent
Cumulative
Percent
Valid 0 3 .5 .6 .6
1 8 1.4 1.5 2.1
2 18 3.2 3.4 5.5
3 34 6.0 6.4 11.9
4 62 10.9 11.7 23.5
5 406 71.5 76.5 100.0
Total 531 93.5 100.0 Missing System 37 6.5 Total 568 100.0
A good political leader should allow women to work in the government and business.
Frequency Percent Valid Percent
Cumulative
Percent
Valid 0 17 3.0 3.2 3.2
1 19 3.3 3.6 6.8
2 26 4.6 4.9 11.7
3 56 9.9 10.6 22.3
4 80 14.1 15.1 37.4
5 331 58.3 62.6 100.0
Total 529 93.1 100.0 Missing System 39 6.9 Total 568 100.0
A good political leader should be good speaker.
Frequency Percent Valid Percent
Cumulative
Percent
Valid 0 9 1.6 1.7 1.7
1 5 .9 1.0 2.7
2 18 3.2 3.4 6.1
3 64 11.3 12.2 18.3
4 77 13.6 14.7 33.0
5 352 62.0 67.0 100.0
Total 525 92.4 100.0 Missing System 43 7.6 Total 568 100.0

388
Pie Chart

389

390

391

392

393

394
Crosstabs Case Processing Summary
Cases
Valid Missing Total
N Percent N Percent N Percent
Gender * A good political
leader should be a woman. 519 91.4% 49 8.6% 568 100.0%
Gender * A good political
leader should put on a suit with
tie.
513 90.3% 55 9.7% 568 100.0%
Gender * A good political
leader should respect human
rights.
528 93.0% 40 7.0% 568 100.0%
Gender * A good political
leader should respect women's
rights.
531 93.5% 37 6.5% 568 100.0%
Gender * A good political
leader should allow women to
work in the government and
business.
529 93.1% 39 6.9% 568 100.0%
Gender * A good political
leader should be good
speaker.
525 92.4% 43 7.6% 568 100.0%
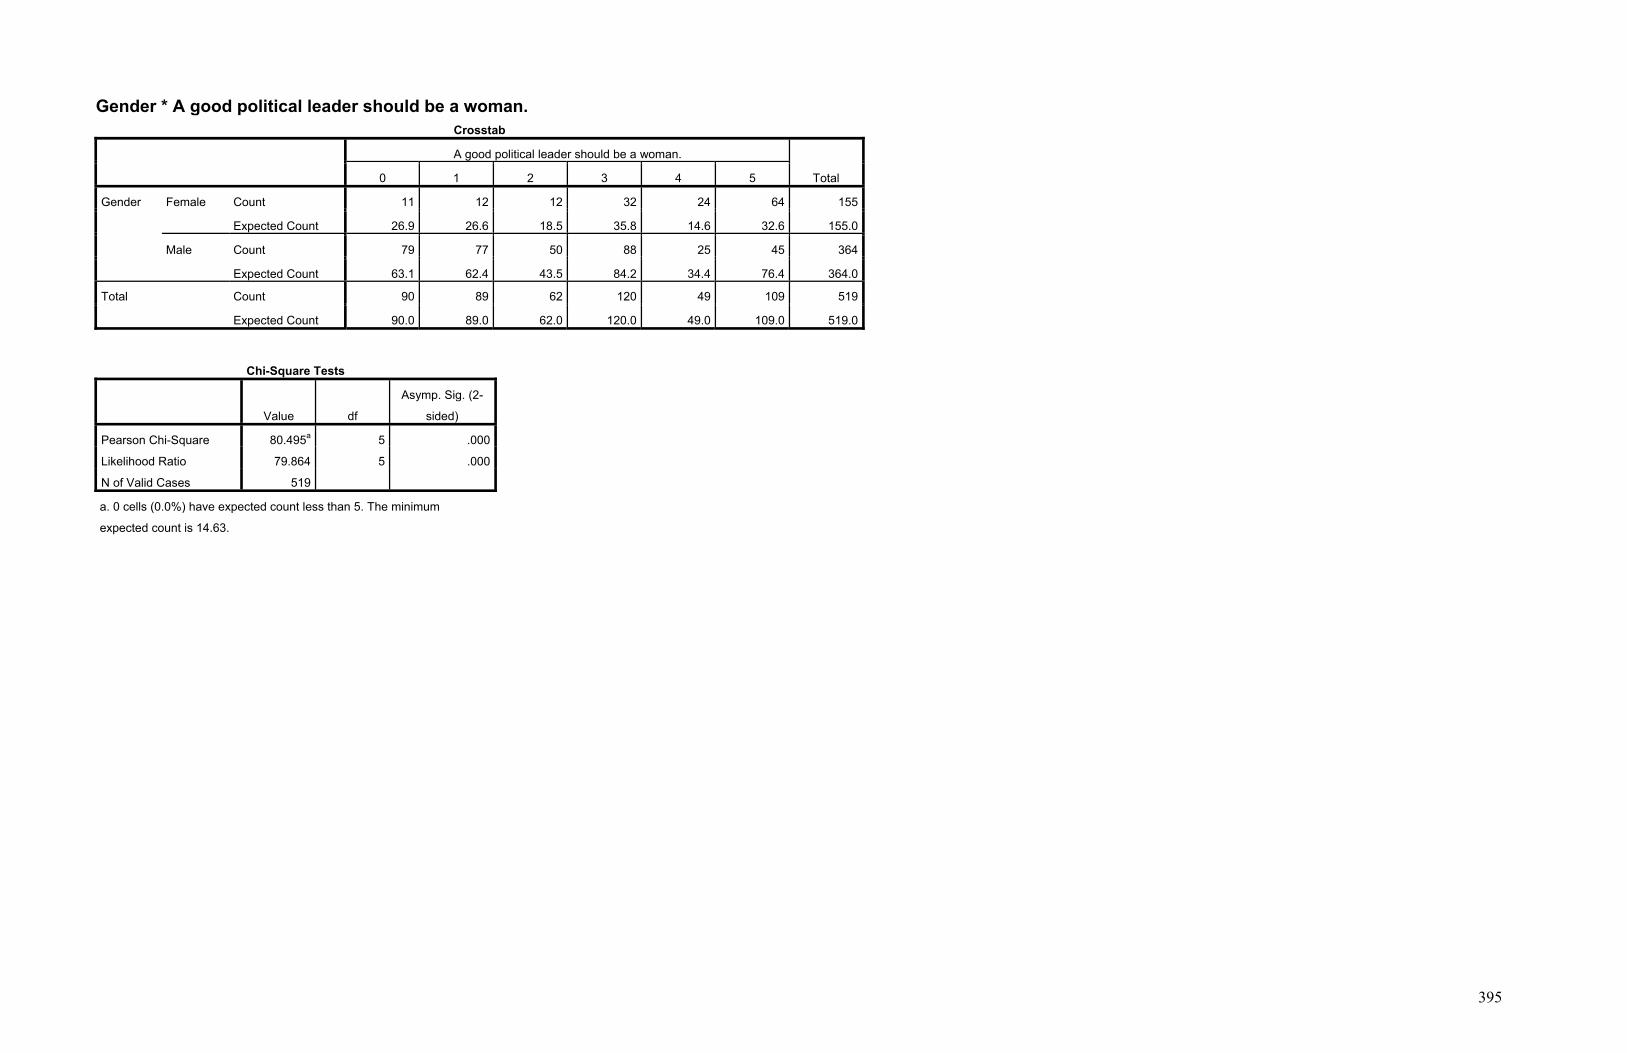
395
Gender * A good political leader should be a woman. Crosstab
A good political leader should be a woman.
Total 0 1 2 3 4 5
Gender Female Count 11 12 12 32 24 64 155
Expected Count 26.9 26.6 18.5 35.8 14.6 32.6 155.0
Male Count 79 77 50 88 25 45 364
Expected Count 63.1 62.4 43.5 84.2 34.4 76.4 364.0
Total Count 90 89 62 120 49 109 519
Expected Count 90.0 89.0 62.0 120.0 49.0 109.0 519.0
Chi-Square Tests
Value df
Asymp. Sig. (2-
sided)
Pearson Chi-Square 80.495a 5 .000
Likelihood Ratio 79.864 5 .000
N of Valid Cases 519
a. 0 cells (0.0%) have expected count less than 5. The minimum
expected count is 14.63.

396

397
Gender * A good political leader should put on a suit with tie. Crosstab
A good political leader should put on a suit with tie.
Total 0 1 2 3 4 5
Gender Female Count 11 9 20 24 18 69 151
Expected Count 19.1 17.1 21.8 32.1 16.2 44.7 151.0
Male Count 54 49 54 85 37 83 362
Expected Count 45.9 40.9 52.2 76.9 38.8 107.3 362.0
Total Count 65 58 74 109 55 152 513
Expected Count 65.0 58.0 74.0 109.0 55.0 152.0 513.0
Chi-Square Tests
Value df
Asymp. Sig. (2-
sided)
Pearson Chi-Square 32.328a 5 .000
Likelihood Ratio 32.335 5 .000
N of Valid Cases 513
a. 0 cells (0.0%) have expected count less than 5. The minimum
expected count is 16.19.

398

399
Gender * A good political leader should respect human rights. Crosstab
A good political leader should respect human rights.
Total 0 1 2 3 4 5
Gender Female Count 0 0 1 5 8 141 155
Expected Count .3 2.3 2.3 10.0 16.7 123.3 155.0
Male Count 1 8 7 29 49 279 373
Expected Count .7 5.7 5.7 24.0 40.3 296.7 373.0
Total Count 1 8 8 34 57 420 528
Expected Count 1.0 8.0 8.0 34.0 57.0 420.0 528.0
Chi-Square Tests
Value df
Asymp. Sig. (2-
sided)
Pearson Chi-Square 18.405a 5 .002
Likelihood Ratio 22.497 5 .000
N of Valid Cases 528
a. 4 cells (33.3%) have expected count less than 5. The minimum
expected count is .29.

400

401
Gender * A good political leader should respect women's rights. Crosstab
A good political leader should respect women's rights.
Total 0 1 2 3 4 5
Gender Female Count 0 0 2 3 8 144 157
Expected Count .9 2.4 5.3 10.1 18.3 120.0 157.0
Male Count 3 8 16 31 54 262 374
Expected Count 2.1 5.6 12.7 23.9 43.7 286.0 374.0
Total Count 3 8 18 34 62 406 531
Expected Count 3.0 8.0 18.0 34.0 62.0 406.0 531.0
Chi-Square Tests
Value df
Asymp. Sig. (2-
sided)
Pearson Chi-Square 29.643a 5 .000
Likelihood Ratio 36.218 5 .000
N of Valid Cases 531
a. 3 cells (25.0%) have expected count less than 5. The minimum
expected count is .89.

402

403
Gender * A good political leader should allow women to work in the government and business. Crosstab
A good political leader should allow women to work in the government and business.
Total 0 1 2 3 4 5
Gender Female Count 1 1 2 2 14 137 157
Expected Count 5.0 5.6 7.7 16.6 23.7 98.2 157.0
Male Count 16 18 24 54 66 194 372
Expected Count 12.0 13.4 18.3 39.4 56.3 232.8 372.0
Total Count 17 19 26 56 80 331 529
Expected Count 17.0 19.0 26.0 56.0 80.0 331.0 529.0
Chi-Square Tests
Value df
Asymp. Sig. (2-
sided)
Pearson Chi-Square 61.787a 5 .000
Likelihood Ratio 73.393 5 .000
N of Valid Cases 529
a. 0 cells (0.0%) have expected count less than 5. The minimum
expected count is 5.05.

404

405
Gender * A good political leader should be good speaker. Crosstab
A good political leader should be good speaker.
Total 0 1 2 3 4 5
Gender Female Count 2 0 3 9 14 129 157
Expected Count 2.7 1.5 5.4 19.1 23.0 105.3 157.0
Male Count 7 5 15 55 63 223 368
Expected Count 6.3 3.5 12.6 44.9 54.0 246.7 368.0
Total Count 9 5 18 64 77 352 525
Expected Count 9.0 5.0 18.0 64.0 77.0 352.0 525.0
Chi-Square Tests
Value df
Asymp. Sig. (2-
sided)
Pearson Chi-Square 24.237a 5 .000
Likelihood Ratio 27.239 5 .000
N of Valid Cases 525
a. 3 cells (25.0%) have expected count less than 5. The minimum
expected count is 1.50.

406

407
Crosstabs Case Processing Summary
Cases
Valid Missing Total
N Percent N Percent N Percent
Ethnic * A good political leader
should be a woman. 519 91.4% 49 8.6% 568 100.0%
Ethnic * A good political leader
should put on a suit with tie. 513 90.3% 55 9.7% 568 100.0%
Ethnic * A good political leader
should respect human rights. 528 93.0% 40 7.0% 568 100.0%
Ethnic * A good political leader
should respect women's rights. 531 93.5% 37 6.5% 568 100.0%
Ethnic * A good political leader
should allow women to work in
the government and business.
529 93.1% 39 6.9% 568 100.0%
Ethnic * A good political leader
should be good speaker. 525 92.4% 43 7.6% 568 100.0%
Ethnic * A good political leader should be a woman.
Crosstab
A good political leader should be a woman.
Total 0 1 2 3 4 5
Ethnic Hazara Count 5 4 13 26 7 22 77
Expected Count 13.4 13.2 9.2 17.8 7.3 16.2 77.0
Other Count 3 1 2 5 2 2 15
Expected Count 2.6 2.6 1.8 3.5 1.4 3.2 15.0
Pashtun Count 50 48 20 43 16 37 214
Expected Count 37.1 36.7 25.6 49.5 20.2 44.9 214.0
Tajik Count 30 31 24 41 17 41 184
Expected Count 31.9 31.6 22.0 42.5 17.4 38.6 184.0
Uzbek Count 2 5 3 5 7 7 29
Expected Count 5.0 5.0 3.5 6.7 2.7 6.1 29.0
Total Count 90 89 62 120 49 109 519
Expected Count 90.0 89.0 62.0 120.0 49.0 109.0 519.0

408
Chi-Square Tests
Value df
Asymp. Sig. (2-
sided)
Pearson Chi-Square 43.385a 20 .002
Likelihood Ratio 44.960 20 .001
N of Valid Cases 519
a. 9 cells (30.0%) have expected count less than 5. The minimum
expected count is 1.42.

409
Ethnic * A good political leader should put on a suit with tie. Crosstab
A good political leader should put on a suit with tie.
Total 0 1 2 3 4 5
Ethnic Hazara Count 8 8 5 21 4 25 71
Expected Count 9.0 8.0 10.2 15.1 7.6 21.0 71.0
Other Count 3 2 2 3 1 5 16
Expected Count 2.0 1.8 2.3 3.4 1.7 4.7 16.0
Pashtun Count 39 29 37 48 18 45 216
Expected Count 27.4 24.4 31.2 45.9 23.2 64.0 216.0
Tajik Count 14 18 24 32 24 69 181
Expected Count 22.9 20.5 26.1 38.5 19.4 53.6 181.0
Uzbek Count 1 1 6 5 8 8 29
Expected Count 3.7 3.3 4.2 6.2 3.1 8.6 29.0
Total Count 65 58 74 109 55 152 513
Expected Count 65.0 58.0 74.0 109.0 55.0 152.0 513.0
Chi-Square Tests
Value df
Asymp. Sig. (2-
sided)
Pearson Chi-Square 45.041a 20 .001
Likelihood Ratio 44.969 20 .001
N of Valid Cases 513
a. 10 cells (33.3%) have expected count less than 5. The minimum
expected count is 1.72.

410

411
Ethnic * A good political leader should respect human rights. Crosstab
A good political leader should respect human rights.
Total 0 1 2 3 4 5
Ethnic Hazara Count 0 0 0 7 7 63 77
Expected Count .1 1.2 1.2 5.0 8.3 61.3 77.0
Other Count 0 0 0 0 3 13 16
Expected Count .0 .2 .2 1.0 1.7 12.7 16.0
Pashtun Count 0 4 4 20 29 162 219
Expected Count .4 3.3 3.3 14.1 23.6 174.2 219.0
Tajik Count 1 2 4 6 16 157 186
Expected Count .4 2.8 2.8 12.0 20.1 148.0 186.0
Uzbek Count 0 2 0 1 2 25 30
Expected Count .1 .5 .5 1.9 3.2 23.9 30.0
Total Count 1 8 8 34 57 420 528
Expected Count 1.0 8.0 8.0 34.0 57.0 420.0 528.0
Chi-Square Tests
Value df
Asymp. Sig. (2-
sided)
Pearson Chi-Square 24.329a 20 .228
Likelihood Ratio 26.710 20 .144
N of Valid Cases 528
a. 20 cells (66.7%) have expected count less than 5. The minimum
expected count is .03.

412

413
Ethnic * A good political leader should respect women's rights. Crosstab
A good political leader should respect women's rights.
Total 0 1 2 3 4 5
Ethnic Hazara Count 0 0 0 6 7 65 78
Expected Count .4 1.2 2.6 5.0 9.1 59.6 78.0
Other Count 0 0 0 1 3 12 16
Expected Count .1 .2 .5 1.0 1.9 12.2 16.0
Pashtun Count 2 6 12 21 35 141 217
Expected Count 1.2 3.3 7.4 13.9 25.3 165.9 217.0
Tajik Count 1 2 6 6 14 160 189
Expected Count 1.1 2.8 6.4 12.1 22.1 144.5 189.0
Uzbek Count 0 0 0 0 3 28 31
Expected Count .2 .5 1.1 2.0 3.6 23.7 31.0
Total Count 3 8 18 34 62 406 531
Expected Count 3.0 8.0 18.0 34.0 62.0 406.0 531.0
Chi-Square Tests
Value df
Asymp. Sig. (2-
sided)
Pearson Chi-Square 36.291a 20 .014
Likelihood Ratio 44.402 20 .001
N of Valid Cases 531
a. 18 cells (60.0%) have expected count less than 5. The minimum
expected count is .09.

414

415
Ethnic * A good political leader should allow women to work in the government and business. Crosstab
A good political leader should allow women to work in the government and business.
Total 0 1 2 3 4 5
Ethnic Hazara Count 1 0 1 5 6 66 79
Expected Count 2.5 2.8 3.9 8.4 11.9 49.4 79.0
Other Count 0 1 0 2 3 10 16
Expected Count .5 .6 .8 1.7 2.4 10.0 16.0
Pashtun Count 13 12 17 31 49 94 216
Expected Count 6.9 7.8 10.6 22.9 32.7 135.2 216.0
Tajik Count 3 5 7 17 21 135 188
Expected Count 6.0 6.8 9.2 19.9 28.4 117.6 188.0
Uzbek Count 0 1 1 1 1 26 30
Expected Count 1.0 1.1 1.5 3.2 4.5 18.8 30.0
Total Count 17 19 26 56 80 331 529
Expected Count 17.0 19.0 26.0 56.0 80.0 331.0 529.0
Chi-Square Tests
Value df
Asymp. Sig. (2-
sided)
Pearson Chi-Square 68.238a 20 .000
Likelihood Ratio 75.031 20 .000
N of Valid Cases 529
a. 13 cells (43.3%) have expected count less than 5. The minimum
expected count is .51.

416

417
Ethnic * A good political leader should be good speaker. Crosstab
A good political leader should be good speaker.
Total 0 1 2 3 4 5
Ethnic Hazara Count 0 0 0 14 13 50 77
Expected Count 1.3 .7 2.6 9.4 11.3 51.6 77.0
Other Count 1 0 0 2 3 10 16
Expected Count .3 .2 .5 2.0 2.3 10.7 16.0
Pashtun Count 6 2 16 32 35 124 215
Expected Count 3.7 2.0 7.4 26.2 31.5 144.2 215.0
Tajik Count 2 2 2 13 23 146 188
Expected Count 3.2 1.8 6.4 22.9 27.6 126.0 188.0
Uzbek Count 0 1 0 3 3 22 29
Expected Count .5 .3 1.0 3.5 4.3 19.4 29.0
Total Count 9 5 18 64 77 352 525
Expected Count 9.0 5.0 18.0 64.0 77.0 352.0 525.0
Chi-Square Tests
Value df
Asymp. Sig. (2-
sided)
Pearson Chi-Square 42.093a 20 .003
Likelihood Ratio 46.292 20 .001
N of Valid Cases 525
a. 17 cells (56.7%) have expected count less than 5. The minimum
expected count is .15.

418
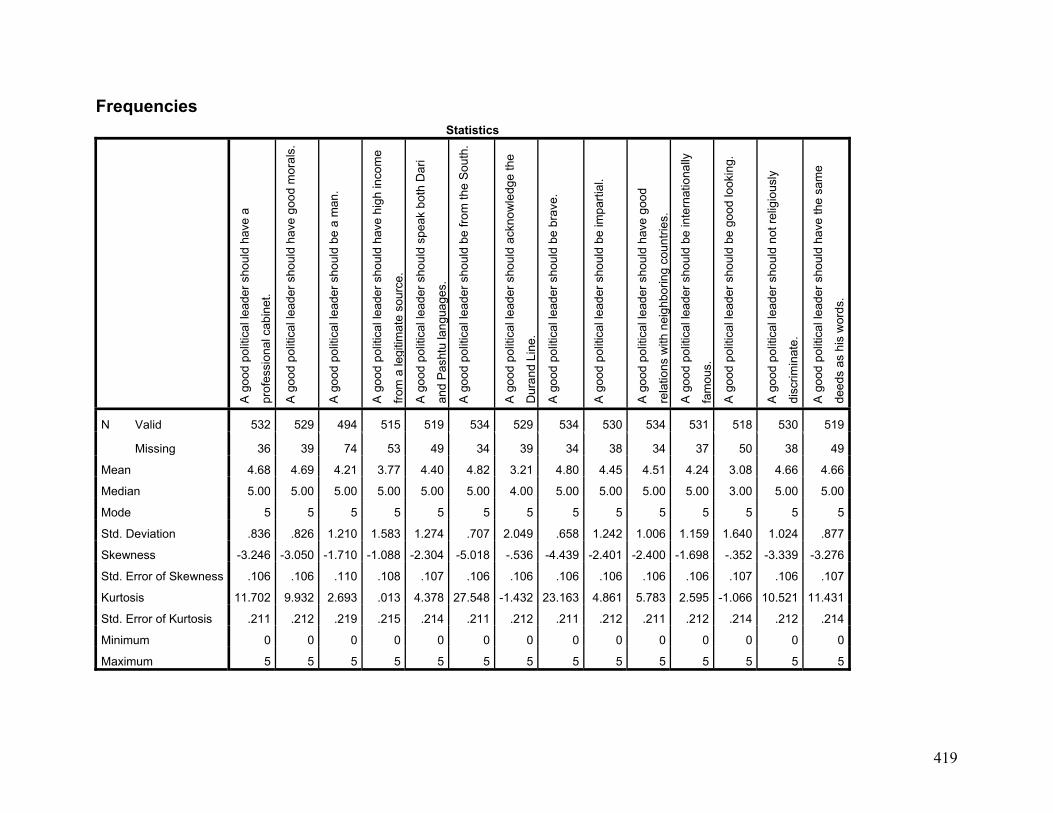
419
Frequencies Statistics
A go
od p
oliti
cal l
eade
r sho
uld
have
a
prof
essi
onal
cab
inet
.
A g
ood
polit
ical
lead
er s
houl
d ha
ve g
ood
mor
als.
A go
od p
oliti
cal l
eade
r sho
uld
be a
man
.
A go
od p
oliti
cal l
eade
r sho
uld
have
hig
h in
com
e
from
a le
gitim
ate
sour
ce.
A g
ood
polit
ical
lead
er s
houl
d sp
eak
both
Dar
i
and
Pash
tu la
ngua
ges.
A g
ood
polit
ical
lead
er s
houl
d be
from
the
Sou
th.
A go
od p
oliti
cal l
eade
r sho
uld
ackn
owle
dge
the
Dur
and
Line
.
A go
od p
oliti
cal l
eade
r sho
uld
be b
rave
.
A go
od p
oliti
cal l
eade
r sho
uld
be im
parti
al.
A go
od p
oliti
cal l
eade
r sho
uld
have
goo
d
rela
tions
with
nei
ghbo
ring
coun
tries
.
A go
od p
oliti
cal l
eade
r sho
uld
be in
tern
atio
nally
fam
ous.
A go
od p
oliti
cal l
eade
r sho
uld
be g
ood
look
ing.
A g
ood
polit
ical
lead
er s
houl
d no
t rel
igio
usly
disc
rimin
ate.
A go
od p
oliti
cal l
eade
r sho
uld
have
the
sam
e
deed
s as
his
wor
ds.
N Valid 532 529 494 515 519 534 529 534 530 534 531 518 530 519
Missing 36 39 74 53 49 34 39 34 38 34 37 50 38 49
Mean 4.68 4.69 4.21 3.77 4.40 4.82 3.21 4.80 4.45 4.51 4.24 3.08 4.66 4.66
Median 5.00 5.00 5.00 5.00 5.00 5.00 4.00 5.00 5.00 5.00 5.00 3.00 5.00 5.00
Mode 5 5 5 5 5 5 5 5 5 5 5 5 5 5
Std. Deviation .836 .826 1.210 1.583 1.274 .707 2.049 .658 1.242 1.006 1.159 1.640 1.024 .877
Skewness -3.246 -3.050 -1.710 -1.088 -2.304 -5.018 -.536 -4.439 -2.401 -2.400 -1.698 -.352 -3.339 -3.276
Std. Error of Skewness .106 .106 .110 .108 .107 .106 .106 .106 .106 .106 .106 .107 .106 .107
Kurtosis 11.702 9.932 2.693 .013 4.378 27.548 -1.432 23.163 4.861 5.783 2.595 -1.066 10.521 11.431
Std. Error of Kurtosis .211 .212 .219 .215 .214 .211 .212 .211 .212 .211 .212 .214 .212 .214
Minimum 0 0 0 0 0 0 0 0 0 0 0 0 0 0
Maximum 5 5 5 5 5 5 5 5 5 5 5 5 5 5

420
Frequency Table A good political leader should have a professional cabinet.
Frequency Percent Valid Percent Cumulative Percent
Valid 0 5 .9 .9 .9
1 4 .7 .8 1.7
2 7 1.2 1.3 3.0
3 33 5.8 6.2 9.2
4 41 7.2 7.7 16.9
5 442 77.8 83.1 100.0
Total 532 93.7 100.0 Missing System 36 6.3 Total 568 100.0
A good political leader should have good morals.
Frequency Percent Valid Percent Cumulative Percent
Valid 0 3 .5 .6 .6
1 5 .9 .9 1.5
2 9 1.6 1.7 3.2
3 36 6.3 6.8 10.0
4 32 5.6 6.0 16.1
5 444 78.2 83.9 100.0
Total 529 93.1 100.0 Missing System 39 6.9 Total 568 100.0

421
A good political leader should be a man.
Frequency Percent Valid Percent Cumulative Percent
Valid 0 14 2.5 2.8 2.8
1 9 1.6 1.8 4.7
2 13 2.3 2.6 7.3
3 87 15.3 17.6 24.9
4 72 12.7 14.6 39.5
5 299 52.6 60.5 100.0
Total 494 87.0 100.0 Missing System 74 13.0 Total 568 100.0
A good political leader should have high income from a legitimate source.
Frequency Percent Valid Percent Cumulative Percent
Valid 0 34 6.0 6.6 6.6
1 31 5.5 6.0 12.6
2 34 6.0 6.6 19.2
3 89 15.7 17.3 36.5
4 60 10.6 11.7 48.2
5 267 47.0 51.8 100.0
Total 515 90.7 100.0 Missing System 53 9.3 Total 568 100.0

422
A good political leader should speak both Dari and Pashtu languages.
Frequency Percent Valid Percent Cumulative Percent
Valid 0 19 3.3 3.7 3.7
1 17 3.0 3.3 6.9
2 11 1.9 2.1 9.1
3 33 5.8 6.4 15.4
4 47 8.3 9.1 24.5
5 392 69.0 75.5 100.0
Total 519 91.4 100.0 Missing System 49 8.6 Total 568 100.0
A good political leader should be from the South.
Frequency Percent Valid Percent Cumulative Percent
Valid 0 6 1.1 1.1 1.1
1 2 .4 .4 1.5
2 3 .5 .6 2.1
3 13 2.3 2.4 4.5
4 22 3.9 4.1 8.6
5 488 85.9 91.4 100.0
Total 534 94.0 100.0 Missing System 34 6.0 Total 568 100.0

423
A good political leader should acknowledge the Durand Line.
Frequency Percent Valid Percent Cumulative Percent
Valid 0 97 17.1 18.3 18.3
1 65 11.4 12.3 30.6
2 26 4.6 4.9 35.5
3 46 8.1 8.7 44.2
4 33 5.8 6.2 50.5
5 262 46.1 49.5 100.0
Total 529 93.1 100.0 Missing System 39 6.9 Total 568 100.0
A good political leader should be brave.
Frequency Percent Valid Percent Cumulative Percent
Valid 0 3 .5 .6 .6
1 3 .5 .6 1.1
2 3 .5 .6 1.7
3 16 2.8 3.0 4.7
4 38 6.7 7.1 11.8
5 471 82.9 88.2 100.0
Total 534 94.0 100.0 Missing System 34 6.0 Total 568 100.0

424
A good political leader should be impartial.
Frequency Percent Valid Percent Cumulative Percent
Valid 0 18 3.2 3.4 3.4
1 14 2.5 2.6 6.0
2 14 2.5 2.6 8.7
3 36 6.3 6.8 15.5
4 29 5.1 5.5 20.9
5 419 73.8 79.1 100.0
Total 530 93.3 100.0 Missing System 38 6.7 Total 568 100.0
A good political leader should have good relations with neighboring countries.
Frequency Percent Valid Percent Cumulative Percent
Valid 0 7 1.2 1.3 1.3
1 5 .9 .9 2.2
2 21 3.7 3.9 6.2
3 40 7.0 7.5 13.7
4 61 10.7 11.4 25.1
5 400 70.4 74.9 100.0
Total 534 94.0 100.0 Missing System 34 6.0 Total 568 100.0

425
A good political leader should be internationally famous.
Frequency Percent Valid Percent Cumulative Percent
Valid 0 10 1.8 1.9 1.9
1 11 1.9 2.1 4.0
2 22 3.9 4.1 8.1
3 75 13.2 14.1 22.2
4 91 16.0 17.1 39.4
5 322 56.7 60.6 100.0
Total 531 93.5 100.0 Missing System 37 6.5 Total 568 100.0
A good political leader should be good looking.
Frequency Percent Valid Percent Cumulative Percent
Valid 0 41 7.2 7.9 7.9
1 71 12.5 13.7 21.6
2 66 11.6 12.7 34.4
3 118 20.8 22.8 57.1
4 71 12.5 13.7 70.8
5 151 26.6 29.2 100.0
Total 518 91.2 100.0 Missing System 50 8.8 Total 568 100.0

426
A good political leader should not religiously discriminate.
Frequency Percent Valid Percent Cumulative Percent
Valid 0 11 1.9 2.1 2.1
1 11 1.9 2.1 4.2
2 10 1.8 1.9 6.0
3 12 2.1 2.3 8.3
4 26 4.6 4.9 13.2
5 460 81.0 86.8 100.0
Total 530 93.3 100.0 Missing System 38 6.7 Total 568 100.0
A good political leader should have teh same deeds as his words.
Frequency Percent Valid Percent Cumulative Percent
Valid 0 5 .9 1.0 1.0
1 8 1.4 1.5 2.5
2 8 1.4 1.5 4.0
3 19 3.3 3.7 7.7
4 56 9.9 10.8 18.5
5 423 74.5 81.5 100.0
Total 519 91.4 100.0 Missing System 49 8.6 Total 568 100.0

427
Pie Chart

428

429

430

431

432

433

434

435

436

437

438

439

440

441
Crosstabs Case Processing Summary
Cases
Valid Missing Total
N Percent N Percent N Percent
Ethnic * A good political leader
should have a professional
cabinet.
532 93.7% 36 6.3% 568 100.0%
Ethnic * A good political leader
should have good morals. 529 93.1% 39 6.9% 568 100.0%
Ethnic * A good political leader
should be a man. 494 87.0% 74 13.0% 568 100.0%
Ethnic * A good political leader
should have high income from
a legitimate source.
515 90.7% 53 9.3% 568 100.0%
Ethnic * A good political leader
should speak both Dari and
Pashtu languages.
519 91.4% 49 8.6% 568 100.0%
Ethnic * A good political leader
should be from the South. 534 94.0% 34 6.0% 568 100.0%
Ethnic * A good political leader
should acknowledge the
Durand Line.
529 93.1% 39 6.9% 568 100.0%
Ethnic * A good political leader
should be brave. 534 94.0% 34 6.0% 568 100.0%
Ethnic * A good political leader
should be impartial. 530 93.3% 38 6.7% 568 100.0%

442
Ethnic * A good political leader
should have good relations
with neighboring countries.
534 94.0% 34 6.0% 568 100.0%
Ethnic * A good political leader
should be internationally
famous.
531 93.5% 37 6.5% 568 100.0%
Ethnic * A good political leader
should be good looking. 518 91.2% 50 8.8% 568 100.0%
Ethnic * A good political leader
should not religiously
discriminate.
530 93.3% 38 6.7% 568 100.0%
Ethnic * A good political leader
should have teh same deeds
as his words.
519 91.4% 49 8.6% 568 100.0%
Ethnic * A good political leader should have a professional cabinet.
Crosstab
A good political leader should have a professional cabinet.
Total 0 1 2 3 4 5
Ethnic Hazara Count 0 1 2 7 8 65 83
Expected Count .8 .6 1.1 5.1 6.4 69.0 83.0
Other Count 0 0 1 0 3 11 15
Expected Count .1 .1 .2 .9 1.2 12.5 15.0
Pashtun Count 2 2 3 23 19 167 216
Expected Count 2.0 1.6 2.8 13.4 16.6 179.5 216.0

443
Tajik Count 3 1 0 2 10 173 189
Expected Count 1.8 1.4 2.5 11.7 14.6 157.0 189.0
Uzbek Count 0 0 1 1 1 26 29
Expected Count .3 .2 .4 1.8 2.2 24.1 29.0
Total Count 5 4 7 33 41 442 532
Expected Count 5.0 4.0 7.0 33.0 41.0 442.0 532.0
Chi-Square Tests
Value df
Asymp. Sig. (2-
sided)
Pearson Chi-Square 36.048a 20 .015
Likelihood Ratio 41.194 20 .004
N of Valid Cases 532
a. 19 cells (63.3%) have expected count less than 5. The minimum
expected count is .11.

444

445
Ethnic * A good political leader should have good morals. Crosstab
A good political leader should have good morals.
Total 0 1 2 3 4 5
Ethnic Hazara Count 2 1 3 14 8 51 79
Expected Count .4 .7 1.3 5.4 4.8 66.3 79.0
Other Count 0 1 0 1 2 12 16
Expected Count .1 .2 .3 1.1 1.0 13.4 16.0
Pashtun Count 0 1 2 14 12 191 220
Expected Count 1.2 2.1 3.7 15.0 13.3 184.7 220.0
Tajik Count 1 2 3 6 8 164 184
Expected Count 1.0 1.7 3.1 12.5 11.1 154.4 184.0
Uzbek Count 0 0 1 1 2 26 30
Expected Count .2 .3 .5 2.0 1.8 25.2 30.0
Total Count 3 5 9 36 32 444 529
Expected Count 3.0 5.0 9.0 36.0 32.0 444.0 529.0
Chi-Square Tests
Value df
Asymp. Sig. (2-
sided)
Pearson Chi-Square 42.873a 20 .002
Likelihood Ratio 35.841 20 .016
N of Valid Cases 529
a. 20 cells (66.7%) have expected count less than 5. The minimum
expected count is .09.

446

447
Ethnic * A good political leader should be a man.
Crosstab
A good political leader should be a man.
Total 0 1 2 3 4 5
Ethnic Hazara Count 4 1 5 18 12 31 71
Expected Count 2.0 1.3 1.9 12.5 10.3 43.0 71.0
Other Count 1 1 0 3 3 6 14
Expected Count .4 .3 .4 2.5 2.0 8.5 14.0
Pashtun Count 6 2 3 30 31 135 207
Expected Count 5.9 3.8 5.4 36.5 30.2 125.3 207.0
Tajik Count 3 5 4 28 22 112 174
Expected Count 4.9 3.2 4.6 30.6 25.4 105.3 174.0
Uzbek Count 0 0 1 8 4 15 28
Expected Count .8 .5 .7 4.9 4.1 16.9 28.0
Total Count 14 9 13 87 72 299 494
Expected Count 14.0 9.0 13.0 87.0 72.0 299.0 494.0
Chi-Square Tests
Value df
Asymp. Sig. (2-
sided)
Pearson Chi-Square 28.414a 20 .100
Likelihood Ratio 26.974 20 .136
N of Valid Cases 494
a. 17 cells (56.7%) have expected count less than 5. The minimum
expected count is .26.

448

449
Ethnic * A good political leader should have high income from a legitimate source.
Crosstab
A good political leader should have high income from a legitimate source.
Total 0 1 2 3 4 5
Ethnic Hazara Count 5 7 8 17 7 29 73
Expected Count 4.8 4.4 4.8 12.6 8.5 37.8 73.0
Other Count 2 0 0 3 2 8 15
Expected Count 1.0 .9 1.0 2.6 1.7 7.8 15.0
Pashtun Count 21 20 12 43 24 94 214
Expected Count 14.1 12.9 14.1 37.0 24.9 110.9 214.0
Tajik Count 3 4 12 22 24 119 184
Expected Count 12.1 11.1 12.1 31.8 21.4 95.4 184.0
Uzbek Count 3 0 2 4 3 17 29
Expected Count 1.9 1.7 1.9 5.0 3.4 15.0 29.0
Total Count 34 31 34 89 60 267 515
Expected Count 34.0 31.0 34.0 89.0 60.0 267.0 515.0
Chi-Square Tests
Value df
Asymp. Sig. (2-
sided)
Pearson Chi-Square 45.184a 20 .001
Likelihood Ratio 51.481 20 .000
N of Valid Cases 515
a. 12 cells (40.0%) have expected count less than 5. The minimum
expected count is .90.

450

451
Ethnic * A good political leader should speak both Dari and Pashtu languages.
Crosstab
A good political leader should speak both Dari and Pashtu languages.
Total 0 1 2 3 4 5
Ethnic Hazara Count 6 2 2 7 6 50 73
Expected Count 2.7 2.4 1.5 4.6 6.6 55.1 73.0
Other Count 2 0 0 2 1 11 16
Expected Count .6 .5 .3 1.0 1.4 12.1 16.0
Pashtun Count 2 7 7 12 24 163 215
Expected Count 7.9 7.0 4.6 13.7 19.5 162.4 215.0
Tajik Count 7 6 1 11 15 146 186
Expected Count 6.8 6.1 3.9 11.8 16.8 140.5 186.0
Uzbek Count 2 2 1 1 1 22 29
Expected Count 1.1 .9 .6 1.8 2.6 21.9 29.0
Total Count 19 17 11 33 47 392 519
Expected Count 19.0 17.0 11.0 33.0 47.0 392.0 519.0
Chi-Square Tests
Value df
Asymp. Sig. (2-
sided)
Pearson Chi-Square 24.790a 20 .210
Likelihood Ratio 25.366 20 .188
N of Valid Cases 519
a. 16 cells (53.3%) have expected count less than 5. The minimum
expected count is .34.

452

453
Ethnic * A good political leader should be from the South.
Crosstab
A good political leader should be from the South.
Total 0 1 2 3 4 5
Ethnic Hazara Count 0 0 0 1 3 76 80
Expected Count .9 .3 .4 1.9 3.3 73.1 80.0
Other Count 0 0 0 0 0 16 16
Expected Count .2 .1 .1 .4 .7 14.6 16.0
Pashtun Count 3 2 2 8 14 189 218
Expected Count 2.4 .8 1.2 5.3 9.0 199.2 218.0
Tajik Count 3 0 1 3 5 177 189
Expected Count 2.1 .7 1.1 4.6 7.8 172.7 189.0
Uzbek Count 0 0 0 1 0 30 31
Expected Count .3 .1 .2 .8 1.3 28.3 31.0
Total Count 6 2 3 13 22 488 534
Expected Count 6.0 2.0 3.0 13.0 22.0 488.0 534.0
Chi-Square Tests
Value df
Asymp. Sig. (2-
sided)
Pearson Chi-Square 15.611a 20 .740
Likelihood Ratio 20.355 20 .436
N of Valid Cases 534
a. 22 cells (73.3%) have expected count less than 5. The minimum
expected count is .06.
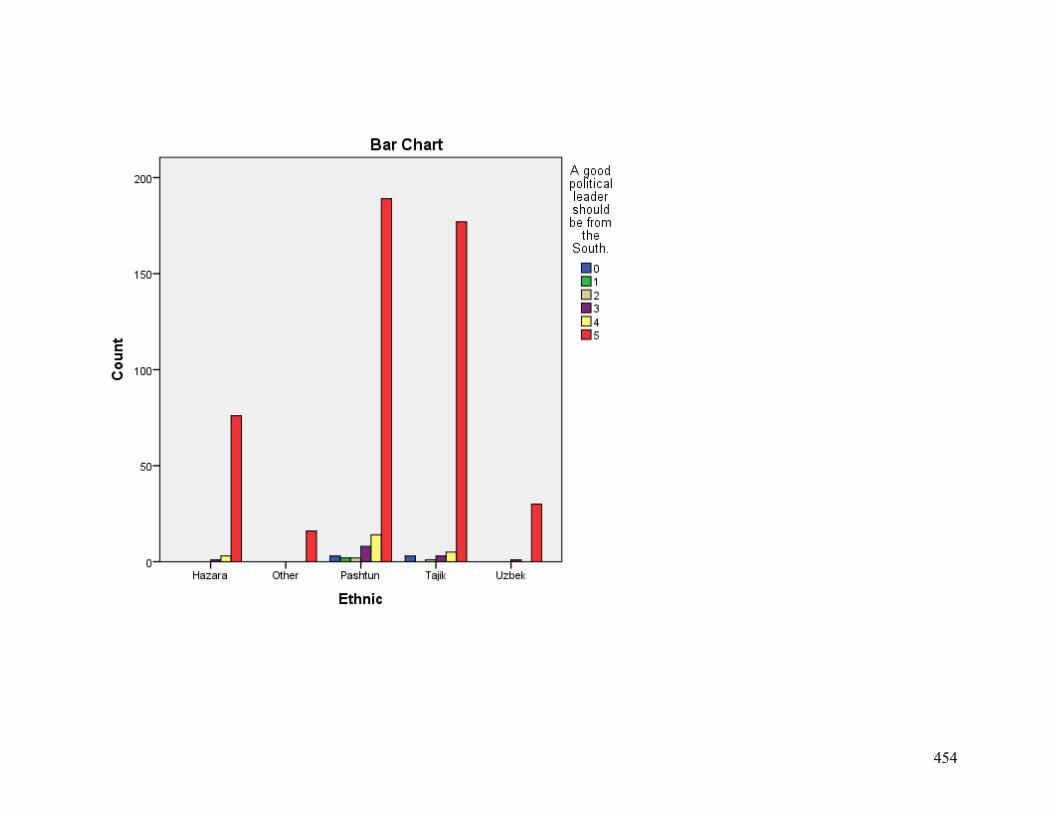
454

455
Ethnic * A good political leader should acknowledge the Durand Line.
Crosstab
A good political leader should acknowledge the Durand Line.
Total 0 1 2 3 4 5
Ethnic Hazara Count 10 9 6 8 5 41 79
Expected Count 14.5 9.7 3.9 6.9 4.9 39.1 79.0
Other Count 5 2 3 0 1 4 15
Expected Count 2.8 1.8 .7 1.3 .9 7.4 15.0
Pashtun Count 57 30 7 15 14 95 218
Expected Count 40.0 26.8 10.7 19.0 13.6 108.0 218.0
Tajik Count 24 22 9 20 11 102 188
Expected Count 34.5 23.1 9.2 16.3 11.7 93.1 188.0
Uzbek Count 1 2 1 3 2 20 29
Expected Count 5.3 3.6 1.4 2.5 1.8 14.4 29.0
Total Count 97 65 26 46 33 262 529
Expected Count 97.0 65.0 26.0 46.0 33.0 262.0 529.0
Chi-Square Tests
Value df
Asymp. Sig. (2-
sided)
Pearson Chi-Square 37.474a 20 .010
Likelihood Ratio 37.114 20 .011
N of Valid Cases 529
a. 11 cells (36.7%) have expected count less than 5. The minimum
expected count is .74.

456

457
Ethnic * A good political leader should be brave.
Crosstab
A good political leader should be brave.
Total 0 1 2 3 4 5
Ethnic Hazara Count 0 0 0 3 5 70 78
Expected Count .4 .4 .4 2.3 5.6 68.8 78.0
Other Count 1 0 0 1 1 13 16
Expected Count .1 .1 .1 .5 1.1 14.1 16.0
Pashtun Count 1 3 2 10 20 182 218
Expected Count 1.2 1.2 1.2 6.5 15.5 192.3 218.0
Tajik Count 0 0 1 1 11 178 191
Expected Count 1.1 1.1 1.1 5.7 13.6 168.5 191.0
Uzbek Count 1 0 0 1 1 28 31
Expected Count .2 .2 .2 .9 2.2 27.3 31.0
Total Count 3 3 3 16 38 471 534
Expected Count 3.0 3.0 3.0 16.0 38.0 471.0 534.0
Chi-Square Tests
Value df
Asymp. Sig. (2-
sided)
Pearson Chi-Square 30.464a 20 .063
Likelihood Ratio 27.087 20 .133
N of Valid Cases 534
a. 20 cells (66.7%) have expected count less than 5. The minimum
expected count is .09.

458

459
Ethnic * A good political leader should be impartial.
Crosstab
A good political leader should be impartial.
Total 0 1 2 3 4 5
Ethnic Hazara Count 2 2 5 6 4 59 78
Expected Count 2.6 2.1 2.1 5.3 4.3 61.7 78.0
Other Count 1 2 0 2 1 10 16
Expected Count .5 .4 .4 1.1 .9 12.6 16.0
Pashtun Count 10 6 5 16 11 171 219
Expected Count 7.4 5.8 5.8 14.9 12.0 173.1 219.0
Tajik Count 4 4 4 11 7 157 187
Expected Count 6.4 4.9 4.9 12.7 10.2 147.8 187.0
Uzbek Count 1 0 0 1 6 22 30
Expected Count 1.0 .8 .8 2.0 1.6 23.7 30.0
Total Count 18 14 14 36 29 419 530
Expected Count 18.0 14.0 14.0 36.0 29.0 419.0 530.0
Chi-Square Tests
Value df
Asymp. Sig. (2-
sided)
Pearson Chi-Square 30.657a 20 .060
Likelihood Ratio 24.053 20 .240
N of Valid Cases 530
a. 16 cells (53.3%) have expected count less than 5. The minimum
expected count is .42.

460

461
Ethnic * A good political leader should have good relations with neighboring countries.
Crosstab
A good political leader should have good relations with neighboring countries.
Total 0 1 2 3 4 5
Ethnic Hazara Count 1 2 1 5 10 60 79
Expected Count 1.0 .7 3.1 5.9 9.0 59.2 79.0
Other Count 0 0 0 0 2 14 16
Expected Count .2 .1 .6 1.2 1.8 12.0 16.0
Pashtun Count 6 3 18 28 35 130 220
Expected Count 2.9 2.1 8.7 16.5 25.1 164.8 220.0
Tajik Count 0 0 1 6 13 169 189
Expected Count 2.5 1.8 7.4 14.2 21.6 141.6 189.0
Uzbek Count 0 0 1 1 1 27 30
Expected Count .4 .3 1.2 2.2 3.4 22.5 30.0
Total Count 7 5 21 40 61 400 534
Expected Count 7.0 5.0 21.0 40.0 61.0 400.0 534.0
Chi-Square Tests
Value df
Asymp. Sig. (2-
sided)
Pearson Chi-Square 66.822a 20 .000
Likelihood Ratio 74.863 20 .000
N of Valid Cases 534
a. 17 cells (56.7%) have expected count less than 5. The minimum
expected count is .15.

462
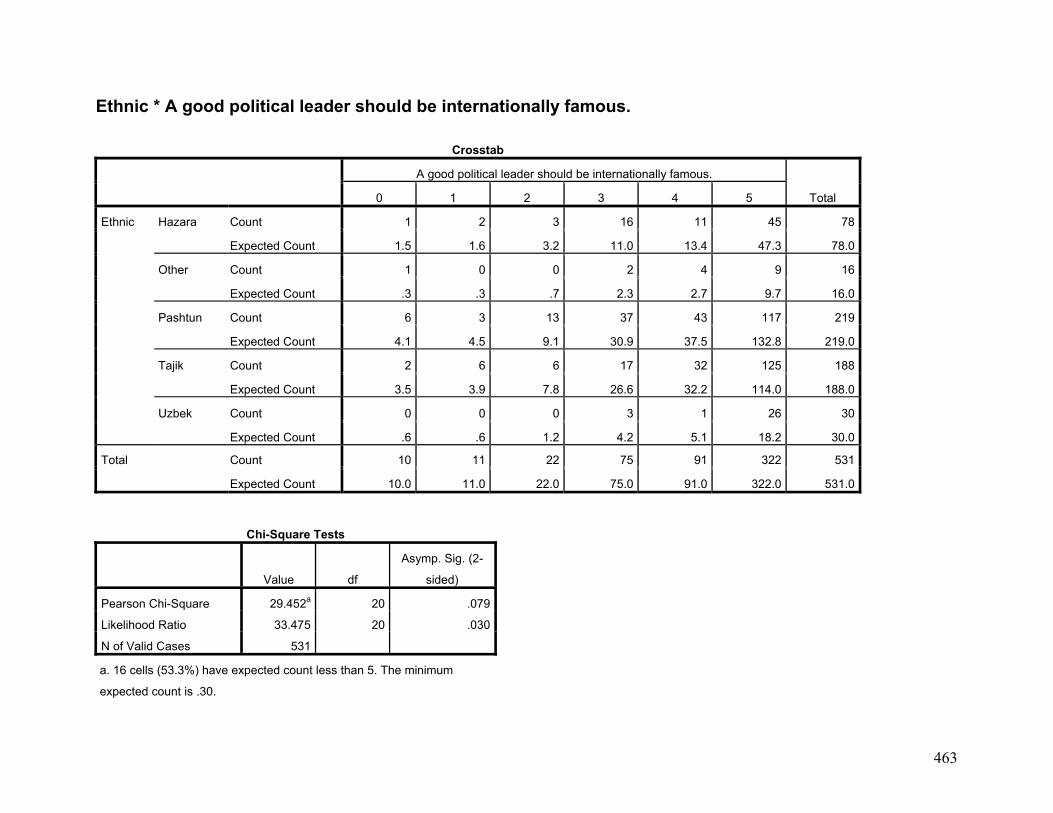
463
Ethnic * A good political leader should be internationally famous.
Crosstab
A good political leader should be internationally famous.
Total 0 1 2 3 4 5
Ethnic Hazara Count 1 2 3 16 11 45 78
Expected Count 1.5 1.6 3.2 11.0 13.4 47.3 78.0
Other Count 1 0 0 2 4 9 16
Expected Count .3 .3 .7 2.3 2.7 9.7 16.0
Pashtun Count 6 3 13 37 43 117 219
Expected Count 4.1 4.5 9.1 30.9 37.5 132.8 219.0
Tajik Count 2 6 6 17 32 125 188
Expected Count 3.5 3.9 7.8 26.6 32.2 114.0 188.0
Uzbek Count 0 0 0 3 1 26 30
Expected Count .6 .6 1.2 4.2 5.1 18.2 30.0
Total Count 10 11 22 75 91 322 531
Expected Count 10.0 11.0 22.0 75.0 91.0 322.0 531.0
Chi-Square Tests
Value df
Asymp. Sig. (2-
sided)
Pearson Chi-Square 29.452a 20 .079
Likelihood Ratio 33.475 20 .030
N of Valid Cases 531
a. 16 cells (53.3%) have expected count less than 5. The minimum
expected count is .30.

464

465
Ethnic * A good political leader should be good looking.
Crosstab
A good political leader should be good looking.
Total 0 1 2 3 4 5
Ethnic Hazara Count 12 17 5 20 9 14 77
Expected Count 6.1 10.6 9.8 17.5 10.6 22.4 77.0
Other Count 3 1 1 5 1 5 16
Expected Count 1.3 2.2 2.0 3.6 2.2 4.7 16.0
Pashtun Count 9 17 27 52 39 71 215
Expected Count 17.0 29.5 27.4 49.0 29.5 62.7 215.0
Tajik Count 16 34 25 33 19 54 181
Expected Count 14.3 24.8 23.1 41.2 24.8 52.8 181.0
Uzbek Count 1 2 8 8 3 7 29
Expected Count 2.3 4.0 3.7 6.6 4.0 8.5 29.0
Total Count 41 71 66 118 71 151 518
Expected Count 41.0 71.0 66.0 118.0 71.0 151.0 518.0
Chi-Square Tests
Value df
Asymp. Sig. (2-
sided)
Pearson Chi-Square 48.240a 20 .000
Likelihood Ratio 47.557 20 .000
N of Valid Cases 518
a. 10 cells (33.3%) have expected count less than 5. The minimum
expected count is 1.27.

466

467
Ethnic * A good political leader should not religiously discriminate.
Crosstab
A good political leader should not religiously discriminate.
Total 0 1 2 3 4 5
Ethnic Hazara Count 2 2 0 1 3 70 78
Expected Count 1.6 1.6 1.5 1.8 3.8 67.7 78.0
Other Count 1 0 2 1 1 11 16
Expected Count .3 .3 .3 .4 .8 13.9 16.0
Pashtun Count 8 5 6 7 13 178 217
Expected Count 4.5 4.5 4.1 4.9 10.6 188.3 217.0
Tajik Count 0 4 2 2 9 170 187
Expected Count 3.9 3.9 3.5 4.2 9.2 162.3 187.0
Uzbek Count 0 0 0 1 0 31 32
Expected Count .7 .7 .6 .7 1.6 27.8 32.0
Total Count 11 11 10 12 26 460 530
Expected Count 11.0 11.0 10.0 12.0 26.0 460.0 530.0
Chi-Square Tests
Value df
Asymp. Sig. (2-
sided)
Pearson Chi-Square 30.955a 20 .056
Likelihood Ratio 33.646 20 .029
N of Valid Cases 530
a. 23 cells (76.7%) have expected count less than 5. The minimum
expected count is .30.

468

469
Ethnic * A good political leader should have the same deeds as his words.
Crosstab
A good political leader should have the same deeds as his words.
Total 0 1 2 3 4 5
Ethnic Hazara Count 2 1 1 0 10 63 77
Expected Count .7 1.2 1.2 2.8 8.3 62.8 77.0
Other Count 0 2 0 1 1 12 16
Expected Count .2 .2 .2 .6 1.7 13.0 16.0
Pashtun Count 2 2 6 17 22 163 212
Expected Count 2.0 3.3 3.3 7.8 22.9 172.8 212.0
Tajik Count 1 3 1 1 18 159 183
Expected Count 1.8 2.8 2.8 6.7 19.7 149.2 183.0
Uzbek Count 0 0 0 0 5 26 31
Expected Count .3 .5 .5 1.1 3.3 25.3 31.0
Total Count 5 8 8 19 56 423 519
Expected Count 5.0 8.0 8.0 19.0 56.0 423.0 519.0
Chi-Square Tests
Value df
Asymp. Sig. (2-
sided)
Pearson Chi-Square 43.668a 20 .002
Likelihood Ratio 40.880 20 .004
N of Valid Cases 519
a. 20 cells (66.7%) have expected count less than 5. The minimum
expected count is .15.
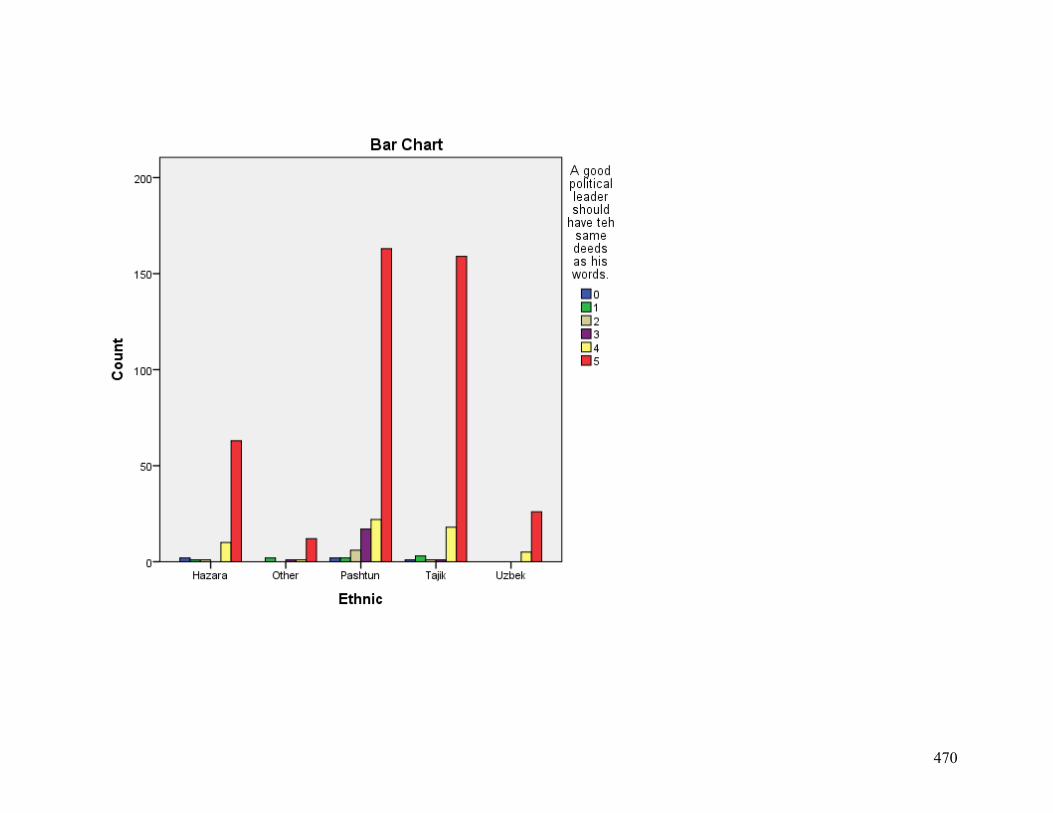
470

471
Frequencies: Statistics
A g
ood
polit
ical
lead
er b
rings
inte
rnat
iona
l aid
to th
e co
untry
.
A g
ood
polit
ical
lead
er re
spec
ts th
e vi
ews
of M
Ps.
A g
ood
polit
ical
lead
er c
ondu
cts
natio
nal c
ensu
ses
to d
eter
min
e ho
w m
any
we
are.
A g
ood
polit
ical
lead
er p
rom
otes
wom
en's
righ
ts in
the
coun
try.
A g
ood
polit
ical
lead
er p
rom
otes
dem
ocra
cy in
the
coun
try.
A g
ood
polit
ical
lead
er p
rom
otes
clo
se re
latio
ns w
ith W
este
rn c
ount
ries.
A go
od p
oliti
cal l
eade
r pro
mot
es c
lose
rela
tions
with
Afg
hani
stan
nei
ghbo
rs.
N Valid 510 508 511 506 510 510 498
Missing 58 60 57 62 58 58 70
Frequency Table:
A good political leader brings international aid to the country.
Frequency Percent Valid Percent
Cumulative
Percent
Valid Not Important 16 2.8 3.1 3.1
Somewhat Important 130 22.9 25.5 28.6
Very Important 364 64.1 71.4 100.0
Total 510 89.8 100.0 Missing nr 58 10.2 Total 568 100.0

472
A good political leader respects the views of MPs.
Frequency Percent Valid Percent
Cumulative
Percent
Valid Not Important 16 2.8 3.1 3.1
Somewhat Important 169 29.8 33.3 36.4
Very Important 323 56.9 63.6 100.0
Total 508 89.4 100.0 Missing nr 60 10.6 Total 568 100.0
A good political leader conducts national censuses to determine how many we are.
Frequency Percent Valid Percent
Cumulative
Percent
Valid Not Important 31 5.5 6.1 6.1
Somewhat Important 121 21.3 23.7 29.7
Very Important 359 63.2 70.3 100.0
Total 511 90.0 100.0 Missing nr 57 10.0 Total 568 100.0
A good political leader promotes women's rights in the country.
Frequency Percent Valid Percent
Cumulative
Percent
Valid Not Important 28 4.9 5.5 5.5
Somewhat Important 127 22.4 25.1 30.6
Very Important 351 61.8 69.4 100.0
Total 506 89.1 100.0 Missing nr 62 10.9 Total 568 100.0
A good political leader promotes democracy in the country.
Frequency Percent Valid Percent
Cumulative
Percent
Valid Not Important 47 8.3 9.2 9.2
Somewhat Important 150 26.4 29.4 38.6
Very Important 313 55.1 61.4 100.0
Total 510 89.8 100.0 Missing nr 58 10.2 Total 568 100.0

473
A good political leader promotes close relations with Western countries.
Frequency Percent Valid Percent
Cumulative
Percent
Valid Not Important 106 18.7 20.8 20.8
Somewhat Important 170 29.9 33.3 54.1
Very Important 234 41.2 45.9 100.0
Total 510 89.8 100.0 Missing nr 58 10.2 Total 568 100.0
A good political leader promotes close relations with Afghanistan neighbors.
Frequency Percent Valid Percent
Cumulative
Percent
Valid Not Important 16 2.8 3.2 3.2
Somewhat Important 125 22.0 25.1 28.3
Very Important 357 62.9 71.7 100.0
Total 498 87.7 100.0 Missing nr 70 12.3 Total 568 100.0

474
Pie Chart

475

476

477

478

479

480

481
Crosstabs Case Processing Summary
Cases
Valid Missing Total
N Percent N Percent N Percent
Ethnic * A good political leader
brings international aid to the
country.
510 89.8% 58 10.2% 568 100.0%
Ethnic * A good political leader
respects the views of MPs. 508 89.4% 60 10.6% 568 100.0%
Ethnic * A good political leader
conducts national censuses to
determine how many we are.
511 90.0% 57 10.0% 568 100.0%
Ethnic * A good political leader
promotes women's rights in the
country.
506 89.1% 62 10.9% 568 100.0%
Ethnic * A good political leader
promotes democracy in the
country.
510 89.8% 58 10.2% 568 100.0%
Ethnic * A good political leader
promotes close relations with
Western countries.
510 89.8% 58 10.2% 568 100.0%
Ethnic * A good political leader
promotes close relations with
Afghanistan neighbors.
498 87.7% 70 12.3% 568 100.0%

482
Ethnic * A good political leader brings international aid to the country. Crosstab
A good political leader brings international aid to the
country.
Total Not Important
Somewhat
Important Very Important
Ethnic Hazara Count 4 33 40 77
Expected Count 2.4 19.6 55.0 77.0
Other Count 0 7 9 16
Expected Count .5 4.1 11.4 16.0
Pashtun Count 8 45 156 209
Expected Count 6.6 53.3 149.2 209.0
Tajik Count 2 39 137 178
Expected Count 5.6 45.4 127.0 178.0
Uzbek Count 2 6 22 30
Expected Count .9 7.6 21.4 30.0
Total Count 16 130 364 510
Expected Count 16.0 130.0 364.0 510.0
Chi-Square Tests
Value df
Asymp. Sig. (2-
sided)
Pearson Chi-Square 24.782a 8 .002
Likelihood Ratio 24.211 8 .002
N of Valid Cases 510
a. 4 cells (26.7%) have expected count less than 5. The minimum
expected count is .50.

483

484
Ethnic * A good political leader respects the views of MPs. Crosstab
A good political leader respects the views of MPs.
Total Not Important
Somewhat
Important Very Important
Ethnic Hazara Count 0 30 46 76
Expected Count 2.4 25.3 48.3 76.0
Other Count 0 7 9 16
Expected Count .5 5.3 10.2 16.0
Pashtun Count 10 75 120 205
Expected Count 6.5 68.2 130.3 205.0
Tajik Count 6 46 129 181
Expected Count 5.7 60.2 115.1 181.0
Uzbek Count 0 11 19 30
Expected Count .9 10.0 19.1 30.0
Total Count 16 169 323 508
Expected Count 16.0 169.0 323.0 508.0
Chi-Square Tests
Value df
Asymp. Sig. (2-
sided)
Pearson Chi-Square 14.100a 8 .079
Likelihood Ratio 17.804 8 .023
N of Valid Cases 508
a. 3 cells (20.0%) have expected count less than 5. The minimum
expected count is .50.

485

486
Ethnic * A good political leader conducts national censuses to determine how many we are. Crosstab
A good political leader conducts national censuses to
determine how many we are.
Total Not Important
Somewhat
Important Very Important
Ethnic Hazara Count 1 14 62 77
Expected Count 4.7 18.2 54.1 77.0
Other Count 2 0 13 15
Expected Count .9 3.6 10.5 15.0
Pashtun Count 15 70 123 208
Expected Count 12.6 49.3 146.1 208.0
Tajik Count 11 32 136 179
Expected Count 10.9 42.4 125.8 179.0
Uzbek Count 2 5 25 32
Expected Count 1.9 7.6 22.5 32.0
Total Count 31 121 359 511
Expected Count 31.0 121.0 359.0 511.0
Chi-Square Tests
Value df
Asymp. Sig. (2-
sided)
Pearson Chi-Square 27.847a 8 .001
Likelihood Ratio 31.923 8 .000
N of Valid Cases 511
a. 4 cells (26.7%) have expected count less than 5. The minimum
expected count is .91.

487

488
Ethnic * A good political leader promotes women's rights in the country. Crosstab
A good political leader promotes women's rights in the
country.
Total Not Important
Somewhat
Important Very Important
Ethnic Hazara Count 4 19 55 78
Expected Count 4.3 19.6 54.1 78.0
Other Count 0 6 10 16
Expected Count .9 4.0 11.1 16.0
Pashtun Count 21 67 117 205
Expected Count 11.3 51.5 142.2 205.0
Tajik Count 3 30 142 175
Expected Count 9.7 43.9 121.4 175.0
Uzbek Count 0 5 27 32
Expected Count 1.8 8.0 22.2 32.0
Total Count 28 127 351 506
Expected Count 28.0 127.0 351.0 506.0
Chi-Square Tests
Value df
Asymp. Sig. (2-
sided)
Pearson Chi-Square 35.893a 8 .000
Likelihood Ratio 38.844 8 .000
N of Valid Cases 506
a. 4 cells (26.7%) have expected count less than 5. The minimum
expected count is .89.

489

490
Ethnic * A good political leader promotes democracy in the country. Crosstab
A good political leader promotes democracy in the country.
Total Not Important
Somewhat
Important Very Important
Ethnic Hazara Count 2 22 53 77
Expected Count 7.1 22.6 47.3 77.0
Other Count 0 7 9 16
Expected Count 1.5 4.7 9.8 16.0
Pashtun Count 25 66 116 207
Expected Count 19.1 60.9 127.0 207.0
Tajik Count 19 47 112 178
Expected Count 16.4 52.4 109.2 178.0
Uzbek Count 1 8 23 32
Expected Count 2.9 9.4 19.6 32.0
Total Count 47 150 313 510
Expected Count 47.0 150.0 313.0 510.0
Chi-Square Tests
Value df
Asymp. Sig. (2-
sided)
Pearson Chi-Square 13.369a 8 .100
Likelihood Ratio 16.418 8 .037
N of Valid Cases 510
a. 3 cells (20.0%) have expected count less than 5. The minimum
expected count is 1.47.

491

492
Ethnic * A good political leader promotes close relations with Western countries. Crosstab
A good political leader promotes close relations with
Western countries.
Total Not Important
Somewhat
Important Very Important
Ethnic Hazara Count 13 28 37 78
Expected Count 16.2 26.0 35.8 78.0
Other Count 2 5 9 16
Expected Count 3.3 5.3 7.3 16.0
Pashtun Count 36 70 99 205
Expected Count 42.6 68.3 94.1 205.0
Tajik Count 46 61 72 179
Expected Count 37.2 59.7 82.1 179.0
Uzbek Count 9 6 17 32
Expected Count 6.7 10.7 14.7 32.0
Total Count 106 170 234 510
Expected Count 106.0 170.0 234.0 510.0
Chi-Square Tests
Value df
Asymp. Sig. (2-
sided)
Pearson Chi-Square 9.676a 8 .289
Likelihood Ratio 10.029 8 .263
N of Valid Cases 510
a. 1 cells (6.7%) have expected count less than 5. The minimum expected
count is 3.33.

493

494
Ethnic * A good political leader promotes close relations with Afghanistan neighbors. Crosstab
A good political leader promotes close relations with
Afghanistan neighbors.
Total Not Important
Somewhat
Important Very Important
Ethnic Hazara Count 3 22 51 76
Expected Count 2.4 19.1 54.5 76.0
Other Count 0 6 10 16
Expected Count .5 4.0 11.5 16.0
Pashtun Count 5 54 143 202
Expected Count 6.5 50.7 144.8 202.0
Tajik Count 8 39 129 176
Expected Count 5.7 44.2 126.2 176.0
Uzbek Count 0 4 24 28
Expected Count .9 7.0 20.1 28.0
Total Count 16 125 357 498
Expected Count 16.0 125.0 357.0 498.0
Chi-Square Tests
Value df
Asymp. Sig. (2-
sided)
Pearson Chi-Square 7.676a 8 .466
Likelihood Ratio 9.077 8 .336
N of Valid Cases 498
a. 4 cells (26.7%) have expected count less than 5. The minimum
expected count is .51.

495

496
Crosstabs Case Processing Summary
Cases
Valid Missing Total
N Percent N Percent N Percent
Province * A good political
leader brings international aid
to the country.
510 89.8% 58 10.2% 568 100.0%
Province * A good political
leader respects the views of
MPs.
508 89.4% 60 10.6% 568 100.0%
Province * A good political
leader conducts national
censuses to determine how
many we are.
511 90.0% 57 10.0% 568 100.0%
Province * A good political
leader promotes women's
rights in the country.
506 89.1% 62 10.9% 568 100.0%
Province * A good political
leader promotes democracy in
the country.
510 89.8% 58 10.2% 568 100.0%
Province * A good political
leader promotes close relations
with Western countries.
510 89.8% 58 10.2% 568 100.0%
Province * A good political
leader promotes close relations
with Afghanistan neighbors.
498 87.7% 70 12.3% 568 100.0%

497
Province * A good political leader brings international aid to the country. Crosstab
A good political leader brings international aid to the
country.
Total Not Important
Somewhat
Important Very Important
Province Badakhshan Count 0 7 23 30
Expected Count .9 7.6 21.4 30.0
Baghlan Count 0 1 8 9
Expected Count .3 2.3 6.4 9.0
Balkh Count 4 22 93 119
Expected Count 3.7 30.3 84.9 119.0
Bamyan Count 0 5 6 11
Expected Count .3 2.8 7.9 11.0
Daikundi Count 1 4 2 7
Expected Count .2 1.8 5.0 7.0
Farah Count 0 0 1 1
Expected Count .0 .3 .7 1.0
Faryab Count 2 4 14 20
Expected Count .6 5.1 14.3 20.0
Ghazni Count 1 13 27 41
Expected Count 1.3 10.5 29.3 41.0
Ghor Count 0 0 2 2
Expected Count .1 .5 1.4 2.0
Helmand Count 4 2 6 12
Expected Count .4 3.1 8.6 12.0
Jawzjan Count 0 1 5 6
Expected Count .2 1.5 4.3 6.0
Kabul Count 0 27 33 60
Expected Count 1.9 15.3 42.8 60.0
Kandahar Count 3 29 63 95
Expected Count 3.0 24.2 67.8 95.0
Kapisa Count 0 1 5 6
Expected Count .2 1.5 4.3 6.0
Khost Count 0 0 12 12
Expected Count .4 3.1 8.6 12.0

498
Kunar Count 0 0 1 1
Expected Count .0 .3 .7 1.0
Kunduz Count 0 0 1 1
Expected Count .0 .3 .7 1.0
Laghman Count 0 2 8 10
Expected Count .3 2.5 7.1 10.0
Logar Count 0 2 12 14
Expected Count .4 3.6 10.0 14.0
Nangarhar Count 0 0 8 8
Expected Count .3 2.0 5.7 8.0
Paktya Count 0 1 10 11
Expected Count .3 2.8 7.9 11.0
Panj Sher Count 0 0 1 1
Expected Count .0 .3 .7 1.0
Parwan Count 0 0 9 9
Expected Count .3 2.3 6.4 9.0
Samangan Count 0 3 3 6
Expected Count .2 1.5 4.3 6.0
Sarpul Count 0 0 1 1
Expected Count .0 .3 .7 1.0
Takhar Count 0 0 1 1
Expected Count .0 .3 .7 1.0
Uruzgan Count 0 1 1 2
Expected Count .1 .5 1.4 2.0
Wardak Count 1 5 8 14
Expected Count .4 3.6 10.0 14.0
Total Count 16 130 364 510
Expected Count 16.0 130.0 364.0 510.0
Chi-Square Tests
Value df
Asymp. Sig. (2-
sided)
Pearson Chi-Square 94.229a 54 .001
Likelihood Ratio 82.300 54 .008
N of Valid Cases 510
a. 62 cells (73.8%) have expected count less than 5. The minimum
expected count is .03.

499

500
Province * A good political leader respects the views of MPs. Crosstab
A good political leader respects the views of MPs.
Total Not Important
Somewhat
Important Very Important
Province Badakhshan Count 0 12 20 32
Expected Count 1.0 10.6 20.3 32.0
Baghlan Count 0 2 7 9
Expected Count .3 3.0 5.7 9.0
Balkh Count 0 25 96 121
Expected Count 3.8 40.3 76.9 121.0
Bamyan Count 0 6 6 12
Expected Count .4 4.0 7.6 12.0
Daikundi Count 0 3 3 6
Expected Count .2 2.0 3.8 6.0
Farah Count 0 1 0 1
Expected Count .0 .3 .6 1.0
Faryab Count 0 9 12 21
Expected Count .7 7.0 13.4 21.0
Ghazni Count 4 14 23 41
Expected Count 1.3 13.6 26.1 41.0
Ghor Count 0 0 2 2
Expected Count .1 .7 1.3 2.0
Helmand Count 0 3 9 12
Expected Count .4 4.0 7.6 12.0
Jawzjan Count 0 1 5 6
Expected Count .2 2.0 3.8 6.0
Kabul Count 4 29 24 57
Expected Count 1.8 19.0 36.2 57.0
Kandahar Count 1 38 52 91
Expected Count 2.9 30.3 57.9 91.0
Kapisa Count 0 2 4 6
Expected Count .2 2.0 3.8 6.0
Khost Count 1 4 7 12
Expected Count .4 4.0 7.6 12.0
Kunar Count 0 0 2 2

501
Expected Count .1 .7 1.3 2.0
Kunduz Count 0 0 1 1
Expected Count .0 .3 .6 1.0
Laghman Count 0 2 8 10
Expected Count .3 3.3 6.4 10.0
Logar Count 1 2 11 14
Expected Count .4 4.7 8.9 14.0
Nangarhar Count 2 3 4 9
Expected Count .3 3.0 5.7 9.0
Paktya Count 0 5 6 11
Expected Count .3 3.7 7.0 11.0
Panj Sher Count 1 0 0 1
Expected Count .0 .3 .6 1.0
Parwan Count 2 1 7 10
Expected Count .3 3.3 6.4 10.0
Samangan Count 0 2 3 5
Expected Count .2 1.7 3.2 5.0
Sarpul Count 0 1 0 1
Expected Count .0 .3 .6 1.0
Takhar Count 0 0 1 1
Expected Count .0 .3 .6 1.0
Uruzgan Count 0 1 1 2
Expected Count .1 .7 1.3 2.0
Wardak Count 0 3 9 12
Expected Count .4 4.0 7.6 12.0
Total Count 16 169 323 508
Expected Count 16.0 169.0 323.0 508.0
Chi-Square Tests
Value df
Asymp. Sig. (2-
sided)
Pearson Chi-Square 111.751a 54 .000
Likelihood Ratio 86.020 54 .004
N of Valid Cases 508
a. 62 cells (73.8%) have expected count less than 5. The minimum
expected count is .03.
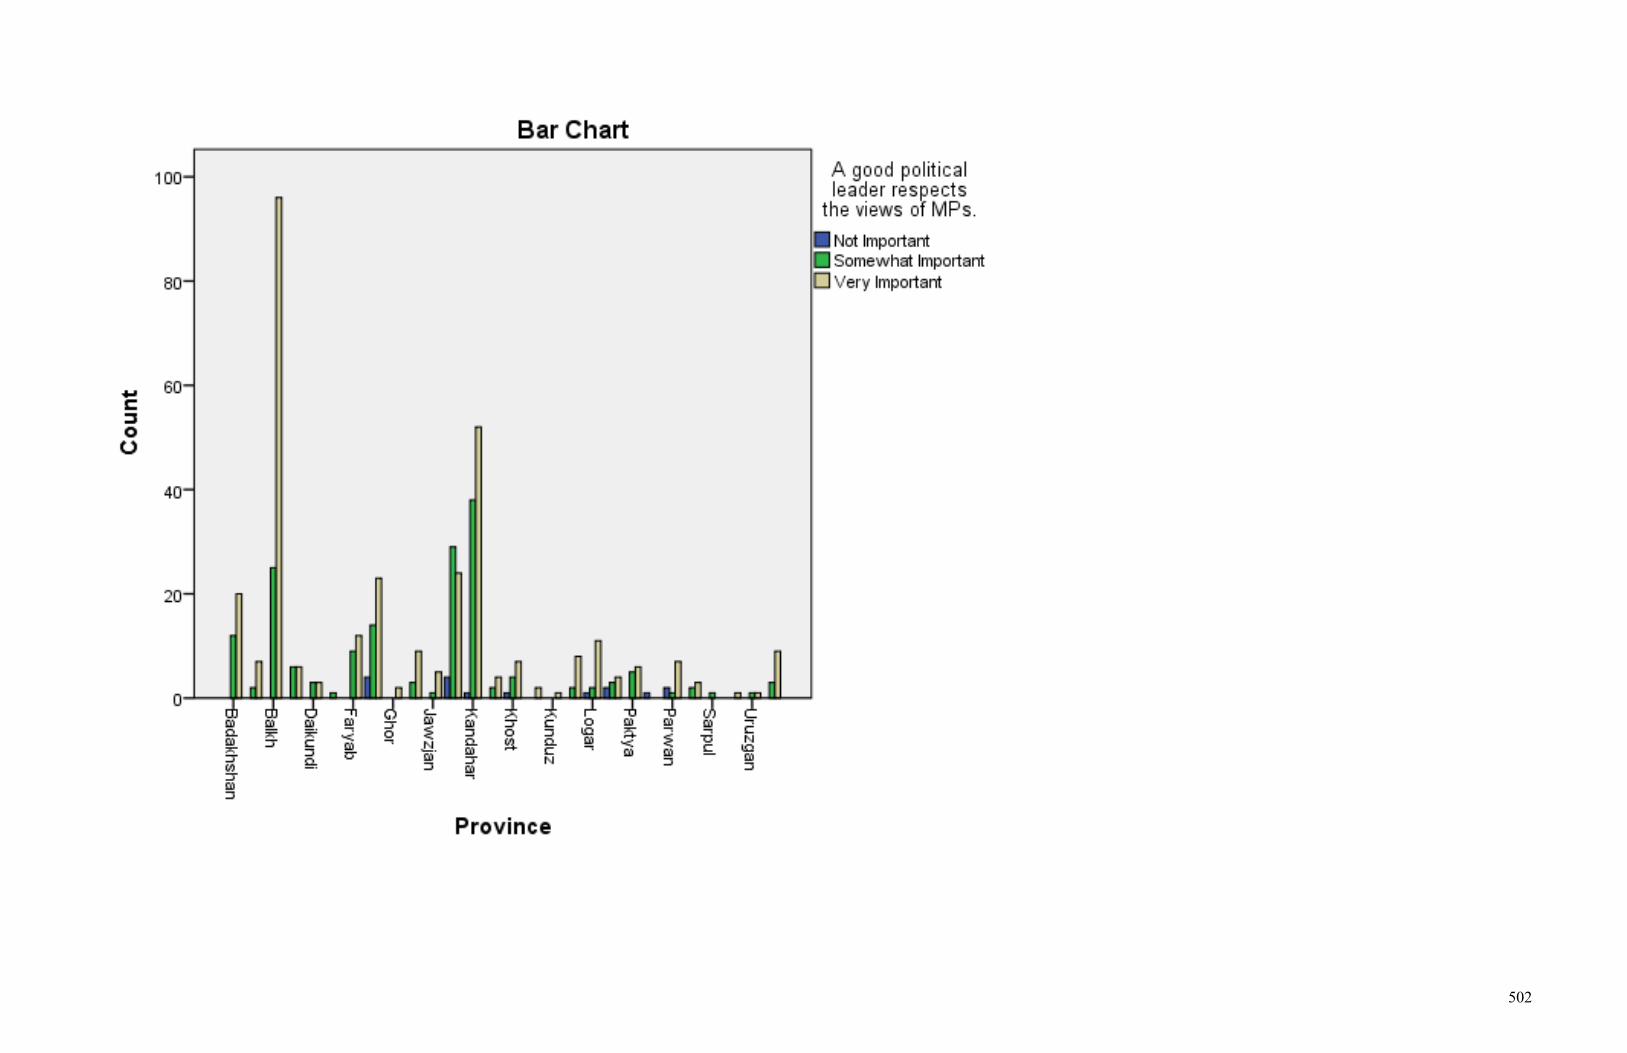
502

503
Province * A good political leader conducts national censuses to determine how many we are. Crosstab
A good political leader conducts national censuses to
determine how many we are.
Total Not Important
Somewhat
Important Very Important
Province Badakhshan Count 1 12 18 31
Expected Count 1.9 7.3 21.8 31.0
Baghlan Count 1 1 8 10
Expected Count .6 2.4 7.0 10.0
Balkh Count 8 14 101 123
Expected Count 7.5 29.1 86.4 123.0
Bamyan Count 0 1 11 12
Expected Count .7 2.8 8.4 12.0
Daikundi Count 1 1 5 7
Expected Count .4 1.7 4.9 7.0
Farah Count 0 0 1 1
Expected Count .1 .2 .7 1.0
Faryab Count 0 3 18 21
Expected Count 1.3 5.0 14.8 21.0
Ghazni Count 3 7 30 40
Expected Count 2.4 9.5 28.1 40.0
Ghor Count 0 0 2 2
Expected Count .1 .5 1.4 2.0
Helmand Count 0 3 6 9
Expected Count .5 2.1 6.3 9.0
Jawzjan Count 1 0 5 6
Expected Count .4 1.4 4.2 6.0
Kabul Count 2 12 46 60
Expected Count 3.6 14.2 42.2 60.0
Kandahar Count 8 45 37 90
Expected Count 5.5 21.3 63.2 90.0
Kapisa Count 0 2 3 5
Expected Count .3 1.2 3.5 5.0
Khost Count 1 1 10 12
Expected Count .7 2.8 8.4 12.0
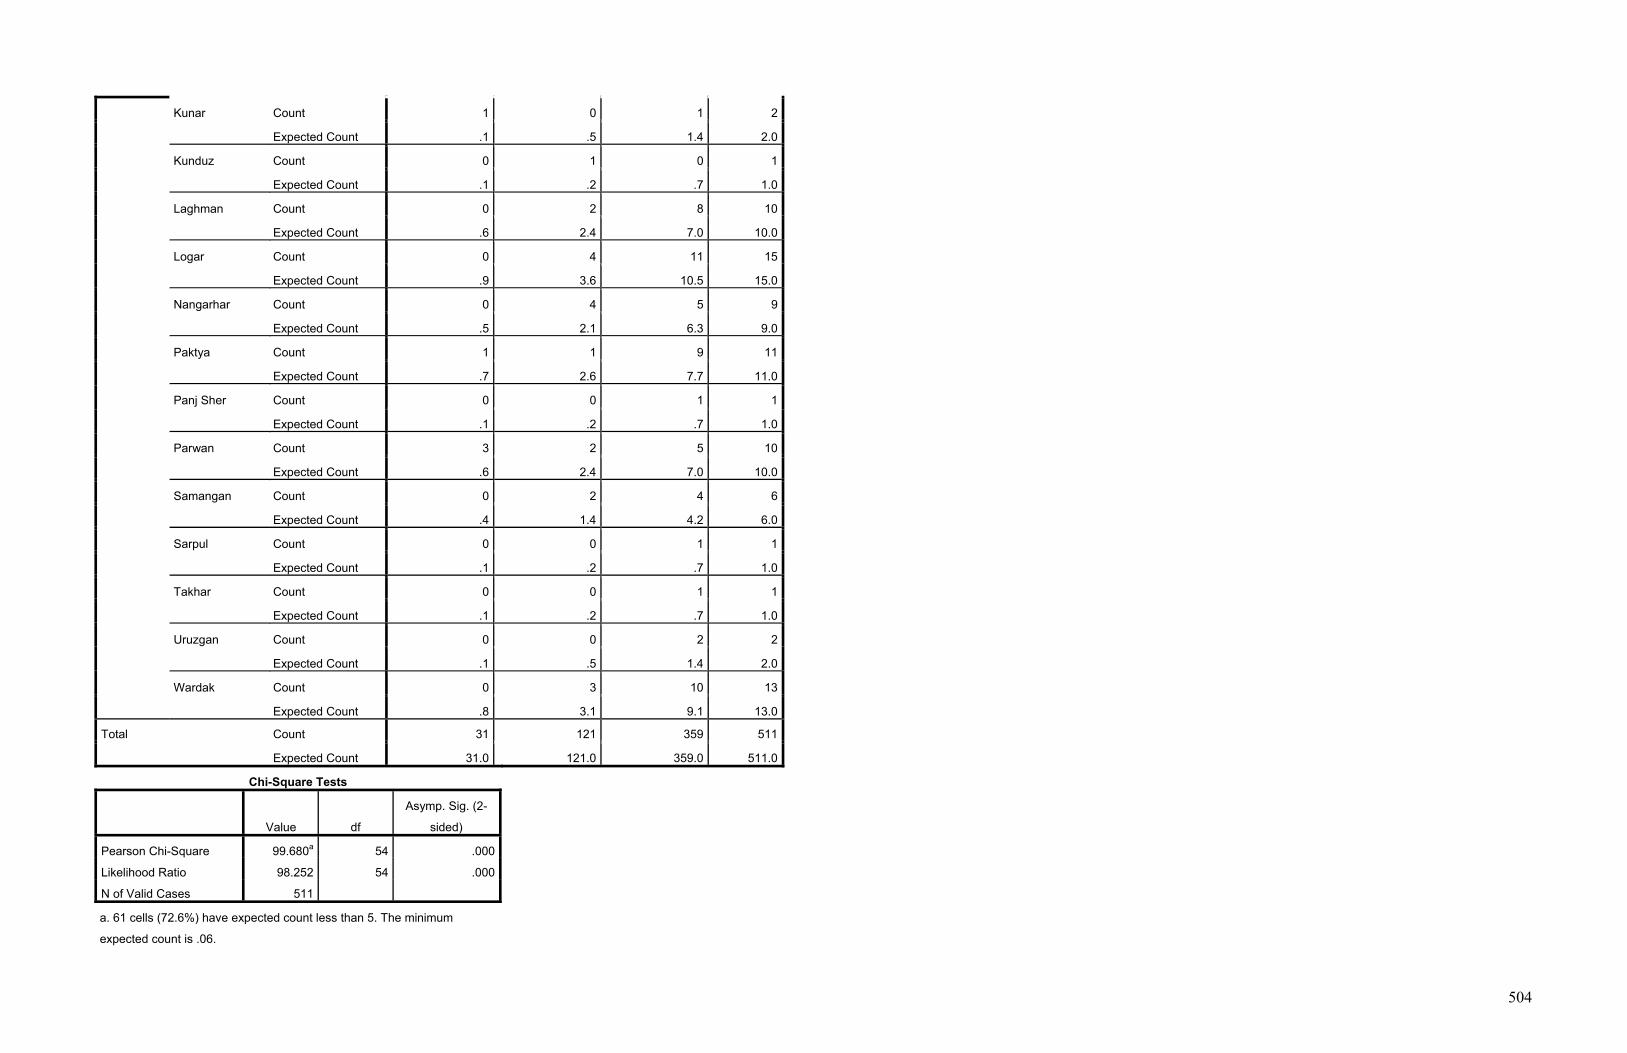
504
Kunar Count 1 0 1 2
Expected Count .1 .5 1.4 2.0
Kunduz Count 0 1 0 1
Expected Count .1 .2 .7 1.0
Laghman Count 0 2 8 10
Expected Count .6 2.4 7.0 10.0
Logar Count 0 4 11 15
Expected Count .9 3.6 10.5 15.0
Nangarhar Count 0 4 5 9
Expected Count .5 2.1 6.3 9.0
Paktya Count 1 1 9 11
Expected Count .7 2.6 7.7 11.0
Panj Sher Count 0 0 1 1
Expected Count .1 .2 .7 1.0
Parwan Count 3 2 5 10
Expected Count .6 2.4 7.0 10.0
Samangan Count 0 2 4 6
Expected Count .4 1.4 4.2 6.0
Sarpul Count 0 0 1 1
Expected Count .1 .2 .7 1.0
Takhar Count 0 0 1 1
Expected Count .1 .2 .7 1.0
Uruzgan Count 0 0 2 2
Expected Count .1 .5 1.4 2.0
Wardak Count 0 3 10 13
Expected Count .8 3.1 9.1 13.0
Total Count 31 121 359 511
Expected Count 31.0 121.0 359.0 511.0
Chi-Square Tests
Value df
Asymp. Sig. (2-
sided)
Pearson Chi-Square 99.680a 54 .000
Likelihood Ratio 98.252 54 .000
N of Valid Cases 511
a. 61 cells (72.6%) have expected count less than 5. The minimum
expected count is .06.

505

506
Province * A good political leader promotes women's rights in the country. Crosstab
A good political leader promotes women's rights in the
country.
Total Not Important
Somewhat
Important Very Important
Province Badakhshan Count 0 5 22 27
Expected Count 1.5 6.8 18.7 27.0
Baghlan Count 0 4 6 10
Expected Count .6 2.5 6.9 10.0
Balkh Count 3 16 104 123
Expected Count 6.8 30.9 85.3 123.0
Bamyan Count 0 4 8 12
Expected Count .7 3.0 8.3 12.0
Daikundi Count 0 2 5 7
Expected Count .4 1.8 4.9 7.0
Farah Count 0 0 1 1
Expected Count .1 .3 .7 1.0
Faryab Count 0 2 19 21
Expected Count 1.2 5.3 14.6 21.0
Ghazni Count 3 11 27 41
Expected Count 2.3 10.3 28.4 41.0
Ghor Count 0 0 2 2
Expected Count .1 .5 1.4 2.0
Helmand Count 0 3 7 10
Expected Count .6 2.5 6.9 10.0
Jawzjan Count 0 1 5 6
Expected Count .3 1.5 4.2 6.0
Kabul Count 5 12 43 60
Expected Count 3.3 15.1 41.6 60.0
Kandahar Count 12 34 43 89
Expected Count 4.9 22.3 61.7 89.0
Kapisa Count 0 3 2 5
Expected Count .3 1.3 3.5 5.0
Khost Count 3 4 5 12
Expected Count .7 3.0 8.3 12.0

507
Kunar Count 0 1 1 2
Expected Count .1 .5 1.4 2.0
Kunduz Count 0 1 0 1
Expected Count .1 .3 .7 1.0
Laghman Count 0 4 6 10
Expected Count .6 2.5 6.9 10.0
Logar Count 1 2 12 15
Expected Count .8 3.8 10.4 15.0
Nangarhar Count 0 3 6 9
Expected Count .5 2.3 6.2 9.0
Paktya Count 0 4 6 10
Expected Count .6 2.5 6.9 10.0
Panj Sher Count 0 0 1 1
Expected Count .1 .3 .7 1.0
Parwan Count 0 4 6 10
Expected Count .6 2.5 6.9 10.0
Samangan Count 0 3 3 6
Expected Count .3 1.5 4.2 6.0
Sarpul Count 1 0 0 1
Expected Count .1 .3 .7 1.0
Uruzgan Count 0 0 2 2
Expected Count .1 .5 1.4 2.0
Wardak Count 0 4 9 13
Expected Count .7 3.3 9.0 13.0
Total Count 28 127 351 506
Expected Count 28.0 127.0 351.0 506.0
Chi-Square Tests
Value df
Asymp. Sig. (2-
sided)
Pearson Chi-Square 94.766a 52 .000
Likelihood Ratio 87.885 52 .001
N of Valid Cases 506
a. 58 cells (71.6%) have expected count less than 5. The minimum
expected count is .06.

508

509
Province * A good political leader promotes democracy in the country. Crosstab
A good political leader promotes democracy in the country.
Total Not Important
Somewhat
Important Very Important
Province Badakhshan Count 9 7 14 30
Expected Count 2.8 8.8 18.4 30.0
Baghlan Count 0 4 5 9
Expected Count .8 2.6 5.5 9.0
Balkh Count 9 20 95 124
Expected Count 11.4 36.5 76.1 124.0
Bamyan Count 0 4 8 12
Expected Count 1.1 3.5 7.4 12.0
Daikundi Count 0 2 5 7
Expected Count .6 2.1 4.3 7.0
Farah Count 0 0 1 1
Expected Count .1 .3 .6 1.0
Faryab Count 1 5 15 21
Expected Count 1.9 6.2 12.9 21.0
Ghazni Count 1 14 26 41
Expected Count 3.8 12.1 25.2 41.0
Ghor Count 0 0 2 2
Expected Count .2 .6 1.2 2.0
Helmand Count 1 4 5 10
Expected Count .9 2.9 6.1 10.0
Jawzjan Count 0 1 5 6
Expected Count .6 1.8 3.7 6.0
Kabul Count 5 19 35 59
Expected Count 5.4 17.4 36.2 59.0
Kandahar Count 13 40 38 91
Expected Count 8.4 26.8 55.8 91.0
Kapisa Count 0 3 2 5
Expected Count .5 1.5 3.1 5.0
Khost Count 2 5 5 12
Expected Count 1.1 3.5 7.4 12.0
Kunar Count 0 0 2 2

510
Expected Count .2 .6 1.2 2.0
Kunduz Count 0 1 0 1
Expected Count .1 .3 .6 1.0
Laghman Count 1 3 6 10
Expected Count .9 2.9 6.1 10.0
Logar Count 2 3 10 15
Expected Count 1.4 4.4 9.2 15.0
Nangarhar Count 0 3 6 9
Expected Count .8 2.6 5.5 9.0
Paktya Count 0 1 9 10
Expected Count .9 2.9 6.1 10.0
Panj Sher Count 0 1 0 1
Expected Count .1 .3 .6 1.0
Parwan Count 2 2 6 10
Expected Count .9 2.9 6.1 10.0
Samangan Count 0 2 4 6
Expected Count .6 1.8 3.7 6.0
Sarpul Count 0 1 0 1
Expected Count .1 .3 .6 1.0
Takhar Count 1 0 0 1
Expected Count .1 .3 .6 1.0
Uruzgan Count 0 0 2 2
Expected Count .2 .6 1.2 2.0
Wardak Count 0 5 7 12
Expected Count 1.1 3.5 7.4 12.0
Total Count 47 150 313 510
Expected Count 47.0 150.0 313.0 510.0
Chi-Square Tests
Value df
Asymp. Sig. (2-
sided)
Pearson Chi-Square 87.232a 54 .003
Likelihood Ratio 87.542 54 .003
N of Valid Cases 510
a. 59 cells (70.2%) have expected count less than 5. The minimum
expected count is .09.

511

512
Province * A good political leader promotes close relations with Western countries. Crosstab
A good political leader promotes close relations with
Western countries.
Total Not Important
Somewhat
Important Very Important
Province Badakhshan Count 9 17 5 31
Expected Count 6.4 10.3 14.2 31.0
Baghlan Count 4 4 2 10
Expected Count 2.1 3.3 4.6 10.0
Balkh Count 31 22 71 124
Expected Count 25.8 41.3 56.9 124.0
Bamyan Count 2 6 4 12
Expected Count 2.5 4.0 5.5 12.0
Daikundi Count 2 3 2 7
Expected Count 1.5 2.3 3.2 7.0
Farah Count 0 0 1 1
Expected Count .2 .3 .5 1.0
Faryab Count 6 5 10 21
Expected Count 4.4 7.0 9.6 21.0
Ghazni Count 6 15 20 41
Expected Count 8.5 13.7 18.8 41.0
Ghor Count 0 0 2 2
Expected Count .4 .7 .9 2.0
Helmand Count 4 2 4 10
Expected Count 2.1 3.3 4.6 10.0
Jawzjan Count 0 2 4 6
Expected Count 1.2 2.0 2.8 6.0
Kabul Count 12 23 24 59
Expected Count 12.3 19.7 27.1 59.0
Kandahar Count 14 41 33 88
Expected Count 18.3 29.3 40.4 88.0
Kapisa Count 0 3 2 5
Expected Count 1.0 1.7 2.3 5.0
Khost Count 0 3 9 12
Expected Count 2.5 4.0 5.5 12.0

513
Kunar Count 0 1 1 2
Expected Count .4 .7 .9 2.0
Kunduz Count 0 1 0 1
Expected Count .2 .3 .5 1.0
Laghman Count 4 3 3 10
Expected Count 2.1 3.3 4.6 10.0
Logar Count 1 3 11 15
Expected Count 3.1 5.0 6.9 15.0
Nangarhar Count 3 4 2 9
Expected Count 1.9 3.0 4.1 9.0
Paktya Count 0 3 7 10
Expected Count 2.1 3.3 4.6 10.0
Panj Sher Count 0 0 1 1
Expected Count .2 .3 .5 1.0
Parwan Count 3 1 6 10
Expected Count 2.1 3.3 4.6 10.0
Samangan Count 2 3 1 6
Expected Count 1.2 2.0 2.8 6.0
Sarpul Count 1 0 0 1
Expected Count .2 .3 .5 1.0
Takhar Count 1 0 0 1
Expected Count .2 .3 .5 1.0
Uruzgan Count 0 0 2 2
Expected Count .4 .7 .9 2.0
Wardak Count 1 5 7 13
Expected Count 2.7 4.3 6.0 13.0
Total Count 106 170 234 510
Expected Count 106.0 170.0 234.0 510.0
Chi-Square Tests
Value df
Asymp. Sig. (2-
sided)
Pearson Chi-Square 87.739a 54 .003
Likelihood Ratio 98.660 54 .000
N of Valid Cases 510
a. 62 cells (73.8%) have expected count less than 5. The minimum
expected count is .21.

514

515
Province * A good political leader promotes close relations with Afghanistan neighbors. Crosstab
A good political leader promotes close relations with
Afghanistan neighbors.
Total Not Important
Somewhat
Important Very Important
Province Badakhshan Count 1 6 23 30
Expected Count 1.0 7.5 21.5 30.0
Baghlan Count 1 0 8 9
Expected Count .3 2.3 6.5 9.0
Balkh Count 6 16 100 122
Expected Count 3.9 30.6 87.5 122.0
Bamyan Count 1 6 5 12
Expected Count .4 3.0 8.6 12.0
Daikundi Count 0 2 5 7
Expected Count .2 1.8 5.0 7.0
Farah Count 0 0 1 1
Expected Count .0 .3 .7 1.0
Faryab Count 0 4 14 18
Expected Count .6 4.5 12.9 18.0
Ghazni Count 2 13 24 39
Expected Count 1.3 9.8 28.0 39.0
Ghor Count 0 0 2 2
Expected Count .1 .5 1.4 2.0
Helmand Count 0 4 6 10
Expected Count .3 2.5 7.2 10.0
Jawzjan Count 0 0 6 6
Expected Count .2 1.5 4.3 6.0
Kabul Count 2 19 38 59
Expected Count 1.9 14.8 42.3 59.0
Kandahar Count 1 29 55 85
Expected Count 2.7 21.3 60.9 85.0
Kapisa Count 0 2 3 5
Expected Count .2 1.3 3.6 5.0
Khost Count 0 3 9 12
Expected Count .4 3.0 8.6 12.0

516
Kunar Count 0 0 2 2
Expected Count .1 .5 1.4 2.0
Kunduz Count 0 1 0 1
Expected Count .0 .3 .7 1.0
Laghman Count 0 3 7 10
Expected Count .3 2.5 7.2 10.0
Logar Count 1 1 13 15
Expected Count .5 3.8 10.8 15.0
Nangarhar Count 1 7 1 9
Expected Count .3 2.3 6.5 9.0
Paktya Count 0 0 9 9
Expected Count .3 2.3 6.5 9.0
Panj Sher Count 0 1 0 1
Expected Count .0 .3 .7 1.0
Parwan Count 0 1 10 11
Expected Count .4 2.8 7.9 11.0
Samangan Count 0 2 4 6
Expected Count .2 1.5 4.3 6.0
Sarpul Count 0 1 0 1
Expected Count .0 .3 .7 1.0
Takhar Count 0 0 1 1
Expected Count .0 .3 .7 1.0
Uruzgan Count 0 1 1 2
Expected Count .1 .5 1.4 2.0
Wardak Count 0 3 10 13
Expected Count .4 3.3 9.3 13.0
Total Count 16 125 357 498
Expected Count 16.0 125.0 357.0 498.0
Chi-Square Tests
Value df
Asymp. Sig. (2-
sided)
Pearson Chi-Square 72.360a 54 .048
Likelihood Ratio 81.381 54 .009
N of Valid Cases 498
a. 62 cells (73.8%) have expected count less than 5. The minimum
expected count is .03.

517

518
Frequencies Statistics
A g
ood
polit
ical
lead
er e
nfor
ces
Isla
mic
law
s in
the
coun
try.
A g
ood
polit
ical
lead
er re
mov
es fo
reig
ners
from
the
coun
try.
A g
ood
polit
ical
lead
er re
spec
ts e
lder
s
A go
od p
oliti
cal l
eade
r will
hav
e go
od re
latio
ns w
ith th
e ne
ighb
orin
g co
untri
es.
A g
ood
polit
ical
lead
er p
rom
otes
Sha
ria la
w in
the
coun
try.
A g
ood
polit
ical
lead
er p
rom
otes
clo
se re
latio
ns w
ith Is
lam
ic c
ount
ries.
N Valid 518 525 521 521 512 493
Missing 50 43 47 47 56 75

519
Frequency Table A good political leader enforces Islamic laws in the country.
Frequency Percent Valid Percent
Cumulative
Percent
Valid Not Important 31 5.5 6.0 6.0
Somewhat Important 45 7.9 8.7 14.7
Very Important 442 77.8 85.3 100.0
Total 518 91.2 100.0 Missing nr 50 8.8 Total 568 100.0
A good political leader removes foreigners from the country.
Frequency Percent Valid Percent
Cumulative
Percent
Valid Not Important 108 19.0 20.6 20.6
Somewhat Important 155 27.3 29.5 50.1
Very Important 262 46.1 49.9 100.0
Total 525 92.4 100.0 Missing nr 43 7.6 Total 568 100.0
A good political leader respects elders
Frequency Percent Valid Percent
Cumulative
Percent
Valid Not Important 33 5.8 6.3 6.3
Somewhat Important 141 24.8 27.1 33.4
Very Important 347 61.1 66.6 100.0
Total 521 91.7 100.0 Missing nr 47 8.3 Total 568 100.0
A good political leader will have good relations with the neighboring countries.
Frequency Percent Valid Percent
Cumulative
Percent
Valid Somewhat Important 85 15.0 16.3 16.3
Very Important 436 76.8 83.7 100.0
Total 521 91.7 100.0 Missing nr 47 8.3 Total 568 100.0

520
A good political leader promotes Sharia law in the country.
Frequency Percent Valid Percent
Cumulative
Percent
Valid Not Important 51 9.0 10.0 10.0
Somewhat Important 68 12.0 13.3 23.2
Very Important 393 69.2 76.8 100.0
Total 512 90.1 100.0 Missing nr 56 9.9 Total 568 100.0
A good political leader promotes close relations with Islamic countries.
Frequency Percent Valid Percent
Cumulative
Percent
Valid Not Important 16 2.8 3.2 3.2
Somewhat Important 80 14.1 16.2 19.5
Very Important 397 69.9 80.5 100.0
Total 493 86.8 100.0 Missing nr 75 13.2 Total 568 100.0

521
Pie Chart

522
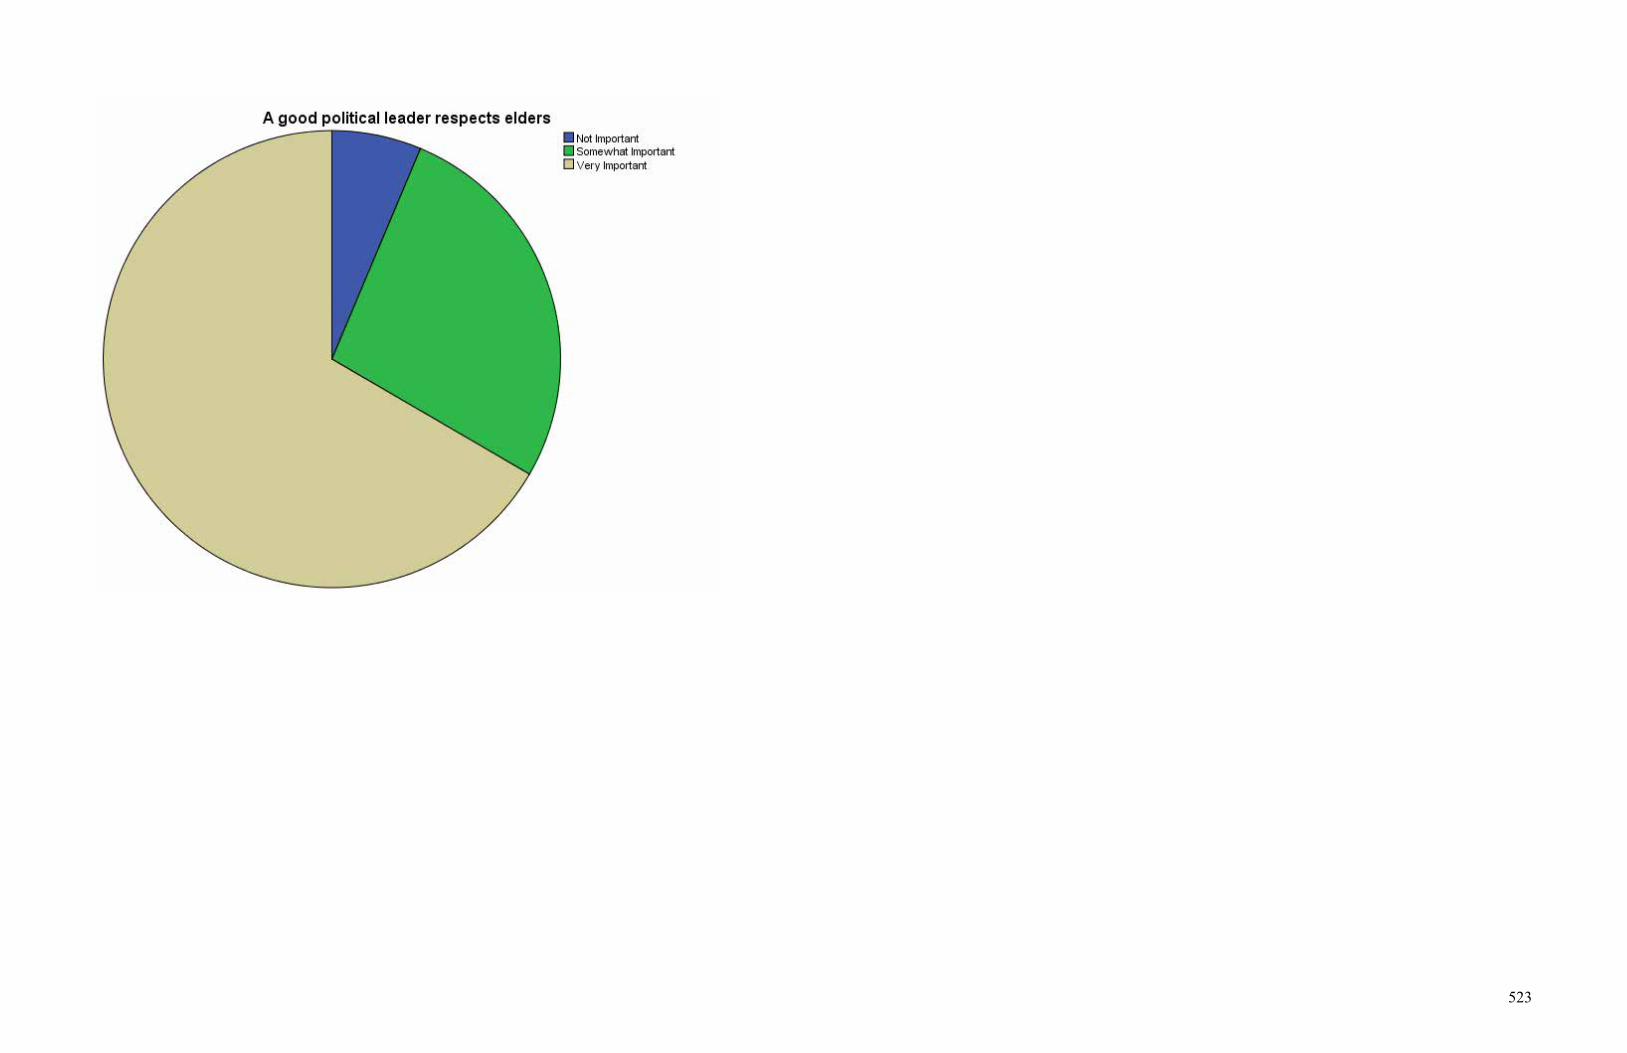
523

524

525

526

527
Crosstabs Case Processing Summary
Cases
Valid Missing Total
N Percent N Percent N Percent
Ethnic * A good political leader
enforces Islamic laws in the
country.
518 91.2% 50 8.8% 568 100.0%
Ethnic * A good political leader
removes foreigners from the
country.
525 92.4% 43 7.6% 568 100.0%
Ethnic * A good political leader
respects elders 521 91.7% 47 8.3% 568 100.0%
Ethnic * A good political leader
will have good relations with
the neighboring countries.
521 91.7% 47 8.3% 568 100.0%
Ethnic * A good political leader
promotes Sharia law in the
country.
512 90.1% 56 9.9% 568 100.0%
Ethnic * A good political leader
promotes close relations with
Islamic countries.
493 86.8% 75 13.2% 568 100.0%

528
Ethnic * A good political leader enforces Islamic laws in the country. Crosstab
A good political leader enforces Islamic laws in the
country.
Total Not Important
Somewhat
Important Very Important
Ethnic Hazara Count 8 13 54 75
Expected Count 4.5 6.5 64.0 75.0
Other Count 3 2 11 16
Expected Count 1.0 1.4 13.7 16.0
Pashtun Count 7 19 187 213
Expected Count 12.7 18.5 181.7 213.0
Tajik Count 11 9 163 183
Expected Count 11.0 15.9 156.2 183.0
Uzbek Count 2 2 27 31
Expected Count 1.9 2.7 26.5 31.0
Total Count 31 45 442 518
Expected Count 31.0 45.0 442.0 518.0
Chi-Square Tests
Value df
Asymp. Sig. (2-
sided)
Pearson Chi-Square 22.153a 8 .005
Likelihood Ratio 19.755 8 .011
N of Valid Cases 518
a. 5 cells (33.3%) have expected count less than 5. The minimum
expected count is .96.

529

530
Ethnic * A good political leader removes foreigners from the country. Crosstab
A good political leader removes foreigners from the
country.
Total Not Important
Somewhat
Important Very Important
Ethnic Hazara Count 34 26 19 79
Expected Count 16.3 23.3 39.4 79.0
Other Count 7 4 5 16
Expected Count 3.3 4.7 8.0 16.0
Pashtun Count 23 62 127 212
Expected Count 43.6 62.6 105.8 212.0
Tajik Count 38 56 93 187
Expected Count 38.5 55.2 93.3 187.0
Uzbek Count 6 7 18 31
Expected Count 6.4 9.2 15.5 31.0
Total Count 108 155 262 525
Expected Count 108.0 155.0 262.0 525.0
Chi-Square Tests
Value df
Asymp. Sig. (2-
sided)
Pearson Chi-Square 50.633a 8 .000
Likelihood Ratio 49.431 8 .000
N of Valid Cases 525
a. 2 cells (13.3%) have expected count less than 5. The minimum
expected count is 3.29.
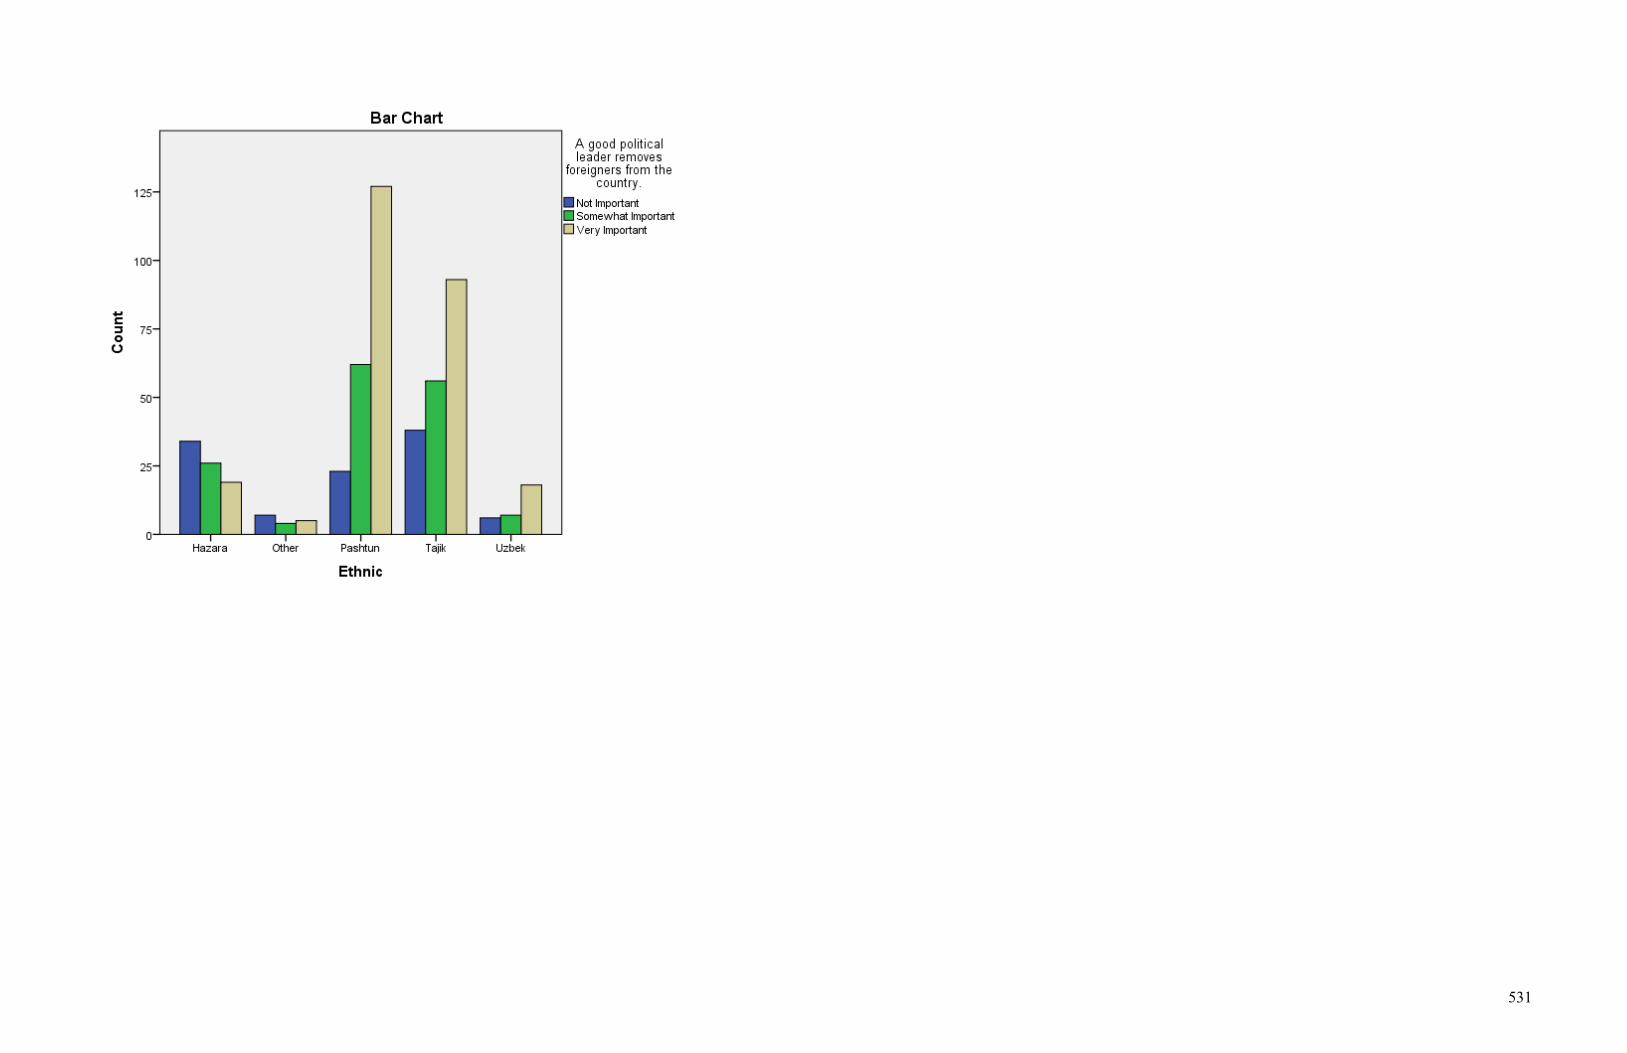
531

532
Ethnic * A good political leader respects elders Crosstab
A good political leader respects elders
Total Not Important
Somewhat
Important Very Important
Ethnic Hazara Count 15 29 35 79
Expected Count 5.0 21.4 52.6 79.0
Other Count 3 5 8 16
Expected Count 1.0 4.3 10.7 16.0
Pashtun Count 7 49 156 212
Expected Count 13.4 57.4 141.2 212.0
Tajik Count 7 49 128 184
Expected Count 11.7 49.8 122.5 184.0
Uzbek Count 1 9 20 30
Expected Count 1.9 8.1 20.0 30.0
Total Count 33 141 347 521
Expected Count 33.0 141.0 347.0 521.0
Chi-Square Tests
Value df
Asymp. Sig. (2-
sided)
Pearson Chi-Square 41.730a 8 .000
Likelihood Ratio 34.997 8 .000
N of Valid Cases 521
a. 3 cells (20.0%) have expected count less than 5. The minimum
expected count is 1.01.

533

534
Ethnic * A good political leader will have good relations with the neighboring countries. Crosstab
A good political leader will have good relations
with the neighboring countries.
Total Somewhat Important Very Important
Ethnic Hazara Count 16 62 78
Expected Count 12.7 65.3 78.0
Other Count 1 15 16
Expected Count 2.6 13.4 16.0
Pashtun Count 38 173 211
Expected Count 34.4 176.6 211.0
Tajik Count 26 158 184
Expected Count 30.0 154.0 184.0
Uzbek Count 4 28 32
Expected Count 5.2 26.8 32.0
Total Count 85 436 521
Expected Count 85.0 436.0 521.0
Chi-Square Tests
Value df
Asymp. Sig. (2-
sided)
Pearson Chi-Square 3.622a 4 .460
Likelihood Ratio 3.899 4 .420
N of Valid Cases 521
a. 1 cells (10.0%) have expected count less than 5. The minimum
expected count is 2.61.

535

536
Ethnic * A good political leader promotes Sharia law in the country. Crosstab
A good political leader promotes Sharia law in the country.
Total Not Important
Somewhat
Important Very Important
Ethnic Hazara Count 11 25 39 75
Expected Count 7.5 10.0 57.6 75.0
Other Count 3 2 11 16
Expected Count 1.6 2.1 12.3 16.0
Pashtun Count 15 25 169 209
Expected Count 20.8 27.8 160.4 209.0
Tajik Count 19 14 147 180
Expected Count 17.9 23.9 138.2 180.0
Uzbek Count 3 2 27 32
Expected Count 3.2 4.3 24.6 32.0
Total Count 51 68 393 512
Expected Count 51.0 68.0 393.0 512.0
Chi-Square Tests
Value df
Asymp. Sig. (2-
sided)
Pearson Chi-Square 40.281a 8 .000
Likelihood Ratio 34.991 8 .000
N of Valid Cases 512
a. 4 cells (26.7%) have expected count less than 5. The minimum
expected count is 1.59.

537
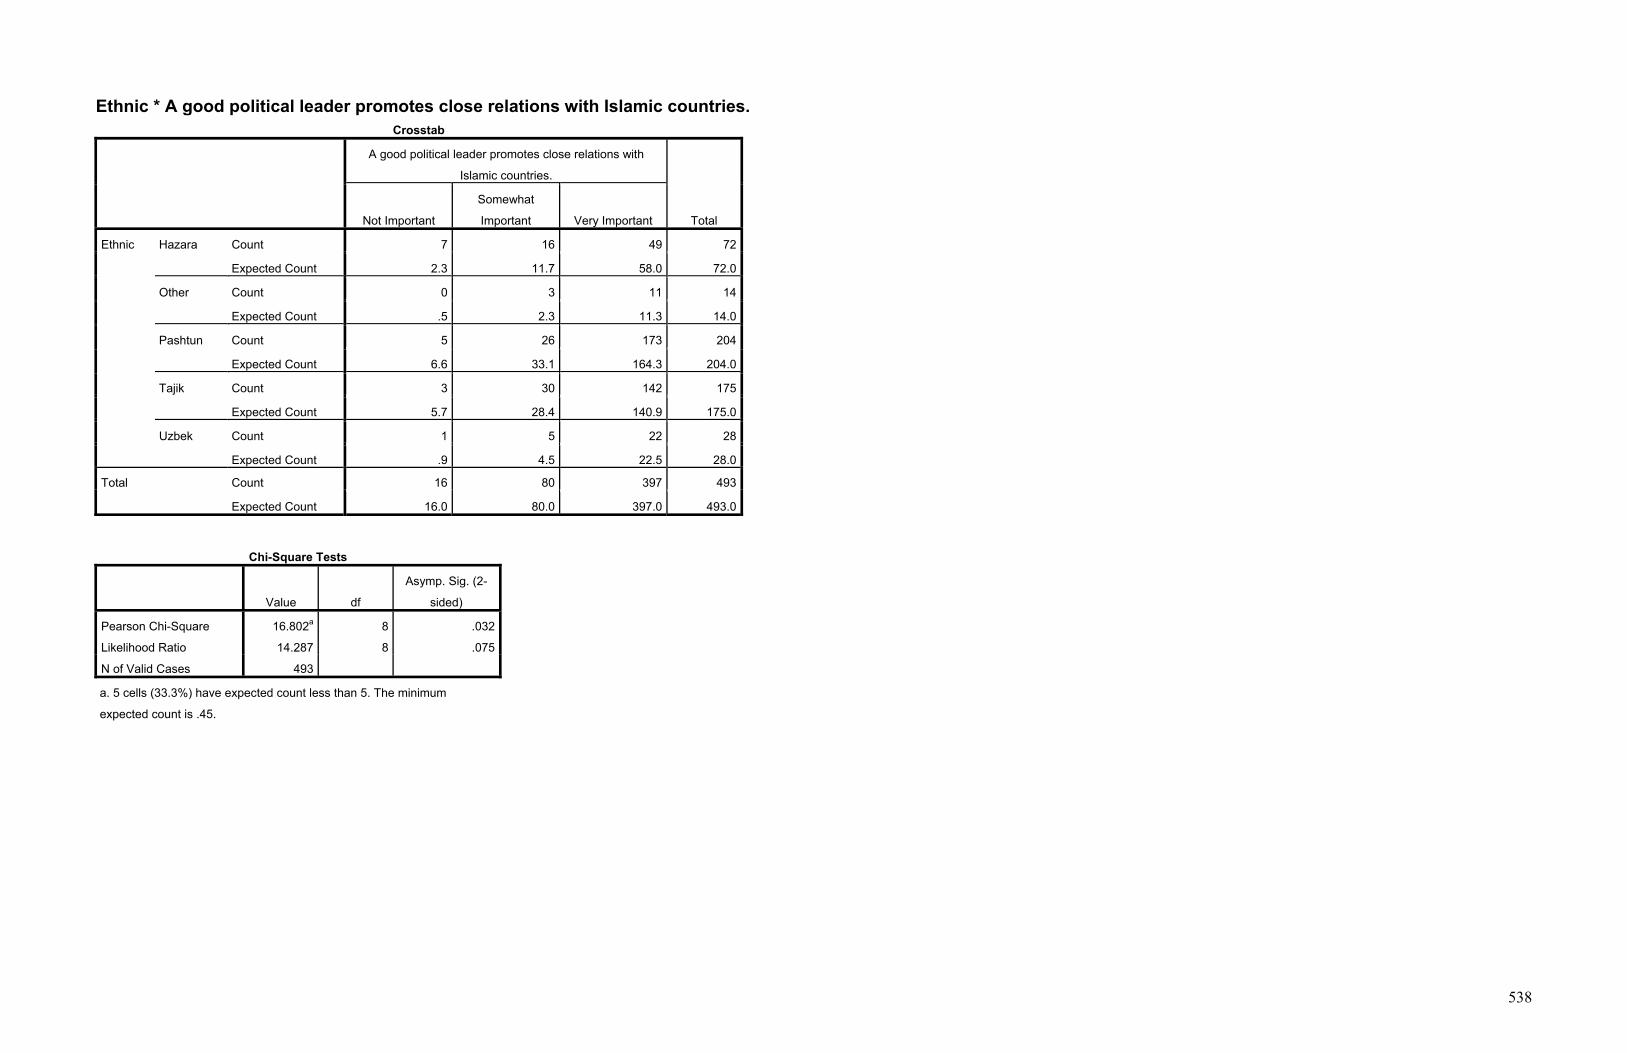
538
Ethnic * A good political leader promotes close relations with Islamic countries. Crosstab
A good political leader promotes close relations with
Islamic countries.
Total Not Important
Somewhat
Important Very Important
Ethnic Hazara Count 7 16 49 72
Expected Count 2.3 11.7 58.0 72.0
Other Count 0 3 11 14
Expected Count .5 2.3 11.3 14.0
Pashtun Count 5 26 173 204
Expected Count 6.6 33.1 164.3 204.0
Tajik Count 3 30 142 175
Expected Count 5.7 28.4 140.9 175.0
Uzbek Count 1 5 22 28
Expected Count .9 4.5 22.5 28.0
Total Count 16 80 397 493
Expected Count 16.0 80.0 397.0 493.0
Chi-Square Tests
Value df
Asymp. Sig. (2-
sided)
Pearson Chi-Square 16.802a 8 .032
Likelihood Ratio 14.287 8 .075
N of Valid Cases 493
a. 5 cells (33.3%) have expected count less than 5. The minimum
expected count is .45.

539

540
Crosstabs Case Processing Summary
Cases
Valid Missing Total
N Percent N Percent N Percent
Education * A good political
leader enforces Islamic laws in
the country.
518 91.2% 50 8.8% 568 100.0%
Education * A good political
leader removes foreigners from
the country.
525 92.4% 43 7.6% 568 100.0%
Education * A good political
leader respects elders 521 91.7% 47 8.3% 568 100.0%
Education * A good political
leader will have good relations
with the neihboring countries.
521 91.7% 47 8.3% 568 100.0%
Education * A good political
leader promotes Sharia law in
the country.
512 90.1% 56 9.9% 568 100.0%
Education * A good political
leader promotes close relations
with Islamic countries.
493 86.8% 75 13.2% 568 100.0%

541
Education * A good political leader enforces Islamic laws in the country. Crosstab
A good political leader enforces Islamic laws in the
country.
Total Not Important
Somewhat
Important Very Important
Education BA Count 14 21 211 246
Expected Count 14.7 21.4 209.9 246.0
Diploma Count 1 3 63 67
Expected Count 4.0 5.8 57.2 67.0
High School Count 2 11 122 135
Expected Count 8.1 11.7 115.2 135.0
Masters Count 12 8 3 23
Expected Count 1.4 2.0 19.6 23.0
PhD Count 2 0 1 3
Expected Count .2 .3 2.6 3.0
Religious School Count 0 0 1 1
Expected Count .1 .1 .9 1.0
Some Schooling Count 0 1 32 33
Expected Count 2.0 2.9 28.2 33.0
Uneducated Count 0 1 9 10
Expected Count .6 .9 8.5 10.0
Total Count 31 45 442 518
Expected Count 31.0 45.0 442.0 518.0
Chi-Square Tests
Value df
Asymp. Sig. (2-
sided)
Pearson Chi-Square 147.597a 14 .000
Likelihood Ratio 90.840 14 .000
N of Valid Cases 518
a. 13 cells (54.2%) have expected count less than 5. The minimum
expected count is .06.

542

543
Education * A good political leader removes foreigners from the country. Crosstab
A good political leader removes foreigners from the
country.
Total Not Important
Somewhat
Important Very Important
Education BA Count 53 83 115 251
Expected Count 51.6 74.1 125.3 251.0
Diploma Count 7 19 40 66
Expected Count 13.6 19.5 32.9 66.0
High School Count 23 33 81 137
Expected Count 28.2 40.4 68.4 137.0
Masters Count 15 7 3 25
Expected Count 5.1 7.4 12.5 25.0
PhD Count 2 1 0 3
Expected Count .6 .9 1.5 3.0
Religious School Count 0 0 1 1
Expected Count .2 .3 .5 1.0
Some Schooling Count 6 7 19 32
Expected Count 6.6 9.4 16.0 32.0
Uneducated Count 2 5 3 10
Expected Count 2.1 3.0 5.0 10.0
Total Count 108 155 262 525
Expected Count 108.0 155.0 262.0 525.0
Chi-Square Tests
Value df
Asymp. Sig. (2-
sided)
Pearson Chi-Square 46.516a 14 .000
Likelihood Ratio 44.470 14 .000
N of Valid Cases 525
a. 9 cells (37.5%) have expected count less than 5. The minimum
expected count is .21.

544

545
Education * A good political leader respects elders Crosstab
A good political leader respects elders
Total Not Important
Somewhat
Important Very Important
Education BA Count 14 76 156 246
Expected Count 15.6 66.6 163.8 246.0
Diploma Count 1 16 49 66
Expected Count 4.2 17.9 44.0 66.0
High School Count 5 26 107 138
Expected Count 8.7 37.3 91.9 138.0
Masters Count 10 13 2 25
Expected Count 1.6 6.8 16.7 25.0
PhD Count 1 1 1 3
Expected Count .2 .8 2.0 3.0
Religious School Count 0 0 1 1
Expected Count .1 .3 .7 1.0
Some Schooling Count 1 6 25 32
Expected Count 2.0 8.7 21.3 32.0
Uneducated Count 1 3 6 10
Expected Count .6 2.7 6.7 10.0
Total Count 33 141 347 521
Expected Count 33.0 141.0 347.0 521.0
Chi-Square Tests
Value df
Asymp. Sig. (2-
sided)
Pearson Chi-Square 82.739a 14 .000
Likelihood Ratio 65.159 14 .000
N of Valid Cases 521
a. 11 cells (45.8%) have expected count less than 5. The minimum
expected count is .06.

546

547
Education * A good political leader will have good relations with the neighboring countries. Crosstab
A good political leader will have good
relations with the neighboring
countries.
Total
Somewhat
Important Very Important
Education BA Count 36 214 250
Expected Count 40.8 209.2 250.0
Diploma Count 7 58 65
Expected Count 10.6 54.4 65.0
High School Count 26 109 135
Expected Count 22.0 113.0 135.0
Masters Count 8 17 25
Expected Count 4.1 20.9 25.0
PhD Count 0 3 3
Expected Count .5 2.5 3.0
Religious School Count 1 0 1
Expected Count .2 .8 1.0
Some Schooling Count 2 30 32
Expected Count 5.2 26.8 32.0
Uneducated Count 5 5 10
Expected Count 1.6 8.4 10.0
Total Count 85 436 521
Expected Count 85.0 436.0 521.0
Chi-Square Tests
Value df
Asymp. Sig. (2-
sided)
Pearson Chi-Square 23.897a 7 .001
Likelihood Ratio 20.583 7 .004
N of Valid Cases 521
a. 6 cells (37.5%) have expected count less than 5. The minimum
expected count is .16.

548

549
Education * A good political leader promotes Sharia law in the country. Crosstab
A good political leader promotes Sharia law in the country.
Total Not Important
Somewhat
Important Very Important
Education BA Count 19 41 184 244
Expected Count 24.3 32.4 187.3 244.0
Diploma Count 5 4 56 65
Expected Count 6.5 8.6 49.9 65.0
High School Count 7 15 116 138
Expected Count 13.7 18.3 105.9 138.0
Masters Count 18 3 1 22
Expected Count 2.2 2.9 16.9 22.0
PhD Count 2 1 0 3
Expected Count .3 .4 2.3 3.0
Religious School Count 0 0 1 1
Expected Count .1 .1 .8 1.0
Some Schooling Count 0 1 29 30
Expected Count 3.0 4.0 23.0 30.0
Uneducated Count 0 3 6 9
Expected Count .9 1.2 6.9 9.0
Total Count 51 68 393 512
Expected Count 51.0 68.0 393.0 512.0
Chi-Square Tests
Value df
Asymp. Sig. (2-
sided)
Pearson Chi-Square 164.639a 14 .000
Likelihood Ratio 107.954 14 .000
N of Valid Cases 512
a. 12 cells (50.0%) have expected count less than 5. The minimum
expected count is .10.

550

551
Education * A good political leader promotes close relations with Islamic countries. Crosstab
A good political leader promotes close relations with
Islamic countries.
Total Not Important
Somewhat
Important Very Important
Education BA Count 7 42 186 235
Expected Count 7.6 38.1 189.2 235.0
Diploma Count 1 6 55 62
Expected Count 2.0 10.1 49.9 62.0
High School Count 5 21 105 131
Expected Count 4.3 21.3 105.5 131.0
Masters Count 2 9 11 22
Expected Count .7 3.6 17.7 22.0
PhD Count 1 1 1 3
Expected Count .1 .5 2.4 3.0
Religious School Count 0 0 1 1
Expected Count .0 .2 .8 1.0
Some Schooling Count 0 0 31 31
Expected Count 1.0 5.0 25.0 31.0
Uneducated Count 0 1 7 8
Expected Count .3 1.3 6.4 8.0
Total Count 16 80 397 493
Expected Count 16.0 80.0 397.0 493.0
Chi-Square Tests
Value df
Asymp. Sig. (2-
sided)
Pearson Chi-Square 34.275a 14 .002
Likelihood Ratio 32.777 14 .003
N of Valid Cases 493
a. 13 cells (54.2%) have expected count less than 5. The minimum
expected count is .03.

552

553
Crosstabs Case Processing Summary
Cases
Valid Missing Total
N Percent N Percent N Percent
AgeBin * A good political leader
enforces Islamic laws in the
country.
518 91.2% 50 8.8% 568 100.0%
AgeBin * A good political leader
removes foreigners from the
country.
525 92.4% 43 7.6% 568 100.0%
AgeBin * A good political leader
respects elders 521 91.7% 47 8.3% 568 100.0%
AgeBin * A good political leader
will have good relations with
the neihboring countries.
521 91.7% 47 8.3% 568 100.0%
AgeBin * A good political leader
promotes Sharia law in the
country.
512 90.1% 56 9.9% 568 100.0%
AgeBin * A good political leader
promotes close relations with
Islamic countries.
493 86.8% 75 13.2% 568 100.0%

554
AgeBin * A good political leader enforces Islamic laws in the country. Crosstab
A good political leader enforces Islamic laws in the
country.
Total Not Important
Somewhat
Important Very Important
AgeBin Below 21 Count 6 15 130 151
Expected Count 9.0 13.1 128.8 151.0
22 to 31 Count 8 14 170 192
Expected Count 11.5 16.7 163.8 192.0
32 to 41 Count 12 10 70 92
Expected Count 5.5 8.0 78.5 92.0
42 to 51 Count 4 3 42 49
Expected Count 2.9 4.3 41.8 49.0
Above 51 Count 1 3 30 34
Expected Count 2.0 3.0 29.0 34.0
Total Count 31 45 442 518
Expected Count 31.0 45.0 442.0 518.0
Chi-Square Tests
Value df
Asymp. Sig. (2-
sided)
Pearson Chi-Square 13.430a 8 .098
Likelihood Ratio 11.879 8 .157
N of Valid Cases 518
a. 4 cells (26.7%) have expected count less than 5. The minimum
expected count is 2.03.

555

556
AgeBin * A good political leader removes foreigners from the country. Crosstab
A good political leader removes foreigners from the
country.
Total Not Important
Somewhat
Important Very Important
AgeBin Below 21 Count 25 43 84 152
Expected Count 31.3 44.9 75.9 152.0
22 to 31 Count 37 62 99 198
Expected Count 40.7 58.5 98.8 198.0
32 to 41 Count 27 26 40 93
Expected Count 19.1 27.5 46.4 93.0
42 to 51 Count 13 15 21 49
Expected Count 10.1 14.5 24.5 49.0
Above 51 Count 6 9 18 33
Expected Count 6.8 9.7 16.5 33.0
Total Count 108 155 262 525
Expected Count 108.0 155.0 262.0 525.0
Chi-Square Tests
Value df
Asymp. Sig. (2-
sided)
Pearson Chi-Square 8.610a 8 .376
Likelihood Ratio 8.310 8 .404
N of Valid Cases 525
a. 0 cells (0.0%) have expected count less than 5. The minimum expected
count is 6.79.

557

558
AgeBin * A good political leader respects elders Crosstab
A good political leader respects elders
Total Not Important
Somewhat
Important Very Important
AgeBin Below 21 Count 5 34 112 151
Expected Count 9.6 40.9 100.6 151.0
22 to 31 Count 13 57 127 197
Expected Count 12.5 53.3 131.2 197.0
32 to 41 Count 9 30 55 94
Expected Count 6.0 25.4 62.6 94.0
42 to 51 Count 5 12 31 48
Expected Count 3.0 13.0 32.0 48.0
Above 51 Count 1 8 22 31
Expected Count 2.0 8.4 20.6 31.0
Total Count 33 141 347 521
Expected Count 33.0 141.0 347.0 521.0
Chi-Square Tests
Value df
Asymp. Sig. (2-
sided)
Pearson Chi-Square 10.290a 8 .245
Likelihood Ratio 10.453 8 .235
N of Valid Cases 521
a. 2 cells (13.3%) have expected count less than 5. The minimum
expected count is 1.96.

559

560
AgeBin * A good political leader will have good relations with the neighboring countries. Crosstab
A good political leader will have good
relations with the neighboring
countries.
Total
Somewhat
Important Very Important
AgeBin Below 21 Count 32 116 148
Expected Count 24.1 123.9 148.0
22 to 31 Count 25 173 198
Expected Count 32.3 165.7 198.0
32 to 41 Count 17 76 93
Expected Count 15.2 77.8 93.0
42 to 51 Count 10 39 49
Expected Count 8.0 41.0 49.0
Above 51 Count 1 32 33
Expected Count 5.4 27.6 33.0
Total Count 85 436 521
Expected Count 85.0 436.0 521.0
Chi-Square Tests
Value df
Asymp. Sig. (2-
sided)
Pearson Chi-Square 10.156a 4 .038
Likelihood Ratio 11.817 4 .019
N of Valid Cases 521
a. 0 cells (0.0%) have expected count less than 5. The minimum expected
count is 5.38.

561

562
AgeBin * A good political leader promotes Sharia law in the country. Crosstab
A good political leader promotes Sharia law in the country.
Total Not Important
Somewhat
Important Very Important
AgeBin Below 21 Count 6 19 120 145
Expected Count 14.4 19.3 111.3 145.0
22 to 31 Count 19 21 155 195
Expected Count 19.4 25.9 149.7 195.0
32 to 41 Count 15 19 57 91
Expected Count 9.1 12.1 69.8 91.0
42 to 51 Count 8 5 34 47
Expected Count 4.7 6.2 36.1 47.0
Above 51 Count 3 4 27 34
Expected Count 3.4 4.5 26.1 34.0
Total Count 51 68 393 512
Expected Count 51.0 68.0 393.0 512.0
Chi-Square Tests
Value df
Asymp. Sig. (2-
sided)
Pearson Chi-Square 19.803a 8 .011
Likelihood Ratio 19.787 8 .011
N of Valid Cases 512
a. 3 cells (20.0%) have expected count less than 5. The minimum
expected count is 3.39.

563

564
AgeBin * A good political leader promotes close relations with Islamic countries. Crosstab
A good political leader promotes close relations with
Islamic countries.
Total Not Important
Somewhat
Important Very Important
AgeBin Below 21 Count 6 14 115 135
Expected Count 4.4 21.9 108.7 135.0
22 to 31 Count 4 32 155 191
Expected Count 6.2 31.0 153.8 191.0
32 to 41 Count 5 18 64 87
Expected Count 2.8 14.1 70.1 87.0
42 to 51 Count 0 11 37 48
Expected Count 1.6 7.8 38.7 48.0
Above 51 Count 1 5 26 32
Expected Count 1.0 5.2 25.8 32.0
Total Count 16 80 397 493
Expected Count 16.0 80.0 397.0 493.0
Chi-Square Tests
Value df
Asymp. Sig. (2-
sided)
Pearson Chi-Square 10.869a 8 .209
Likelihood Ratio 12.357 8 .136
N of Valid Cases 493
a. 4 cells (26.7%) have expected count less than 5. The minimum
expected count is 1.04.

565

566
Frequencies Statistics
A go
od p
oliti
cal l
eade
r brin
gs p
eace
and
sta
bilit
y.
A g
ood
polit
ical
lead
er c
reat
es jo
bs fo
r peo
ple.
A go
od p
oliti
cal l
eade
r sto
ps e
thni
c di
scrim
inat
ion
amon
g pe
ople
.
A g
ood
polit
ical
lead
er d
efen
ds th
e co
untry
.
A g
ood
polit
ical
lead
er e
nds
corru
ptio
n in
the
soci
ety.
A g
ood
polit
ical
lead
er e
radi
cate
s na
rcot
ics
in th
e co
untry
.
A go
od p
oliti
cal l
eade
r doe
s ex
actly
wha
t he
says
he
will
do.
N Valid 526 513 525 523 524 521 523
Missing 42 55 43 45 44 47 45
Frequency Table
A good political leader brings peace and stability.
Frequency Percent Valid Percent
Cumulative
Percent
Valid Not Important 1 .2 .2 .2
Somewhat Important 9 1.6 1.7 1.9
Very Important 516 90.8 98.1 100.0
Total 526 92.6 100.0 Missing nr 42 7.4 Total 568 100.0

567
A good political leader creates jobs for people.
Frequency Percent Valid Percent
Cumulative
Percent
Valid Not Important 1 .2 .2 .2
Somewhat Important 43 7.6 8.4 8.6
Very Important 469 82.6 91.4 100.0
Total 513 90.3 100.0 Missing nr 55 9.7 Total 568 100.0
A good political leader stops ethnic discrimination among people.
Frequency Percent Valid Percent
Cumulative
Percent
Valid Not Important 10 1.8 1.9 1.9
Somewhat Important 41 7.2 7.8 9.7
Very Important 474 83.5 90.3 100.0
Total 525 92.4 100.0 Missing nr 43 7.6 Total 568 100.0
A good political leader defends the country.
Frequency Percent Valid Percent
Cumulative
Percent
Valid Somewhat Important 16 2.8 3.1 3.1
Very Important 507 89.3 96.9 100.0
Total 523 92.1 100.0 Missing nr 45 7.9 Total 568 100.0
A good political leader ends corruption in the society.
Frequency Percent Valid Percent
Cumulative
Percent
Valid Somewhat Important 27 4.8 5.2 5.2
Very Important 497 87.5 94.8 100.0
Total 524 92.3 100.0 Missing nr 44 7.7 Total 568 100.0

568
A good political leader eradicates narcotics in the country.
Frequency Percent Valid Percent
Cumulative
Percent
Valid Not Important 7 1.2 1.3 1.3
Somewhat Important 51 9.0 9.8 11.1
Very Important 463 81.5 88.9 100.0
Total 521 91.7 100.0 Missing nr 47 8.3 Total 568 100.0
A good political leader does exactly what he says he will do.
Frequency Percent Valid Percent
Cumulative
Percent
Valid Not Important 4 .7 .8 .8
Somewhat Important 35 6.2 6.7 7.5
Very Important 484 85.2 92.5 100.0
Total 523 92.1 100.0 Missing nr 45 7.9 Total 568 100.0

569
Pie Chart

570

571

572

573

574

575

576
Crosstabs Case Processing Summary
Cases
Valid Missing Total
N Percent N Percent N Percent
Ethnic * A good political leader
brings peace and stability. 526 92.6% 42 7.4% 568 100.0%
Ethnic * A good political leader
creates jobs for people. 513 90.3% 55 9.7% 568 100.0%
Ethnic * A good political leader
stops ethnic discrimination
among people.
525 92.4% 43 7.6% 568 100.0%
Ethnic * A good political leader
defends the country. 523 92.1% 45 7.9% 568 100.0%
Ethnic * A good political leader
ends corruption in the society. 524 92.3% 44 7.7% 568 100.0%
Ethnic * A good political leader
eradicates narcotics in the
country.
521 91.7% 47 8.3% 568 100.0%
Ethnic * A good political leader
does exactly what he says he
will do.
523 92.1% 45 7.9% 568 100.0%

577
Ethnic * A good political leader brings peace and stability. Crosstab
A good political leader brings peace and stability.
Total Not Important
Somewhat
Important Very Important
Ethnic Hazara Count 0 1 79 80
Expected Count .2 1.4 78.5 80.0
Other Count 0 2 14 16
Expected Count .0 .3 15.7 16.0
Pashtun Count 0 2 213 215
Expected Count .4 3.7 210.9 215.0
Tajik Count 0 4 180 184
Expected Count .3 3.1 180.5 184.0
Uzbek Count 1 0 30 31
Expected Count .1 .5 30.4 31.0
Total Count 1 9 516 526
Expected Count 1.0 9.0 516.0 526.0
Chi-Square Tests
Value df
Asymp. Sig. (2-
sided)
Pearson Chi-Square 28.693a 8 .000
Likelihood Ratio 12.688 8 .123
N of Valid Cases 526
a. 10 cells (66.7%) have expected count less than 5. The minimum
expected count is .03.
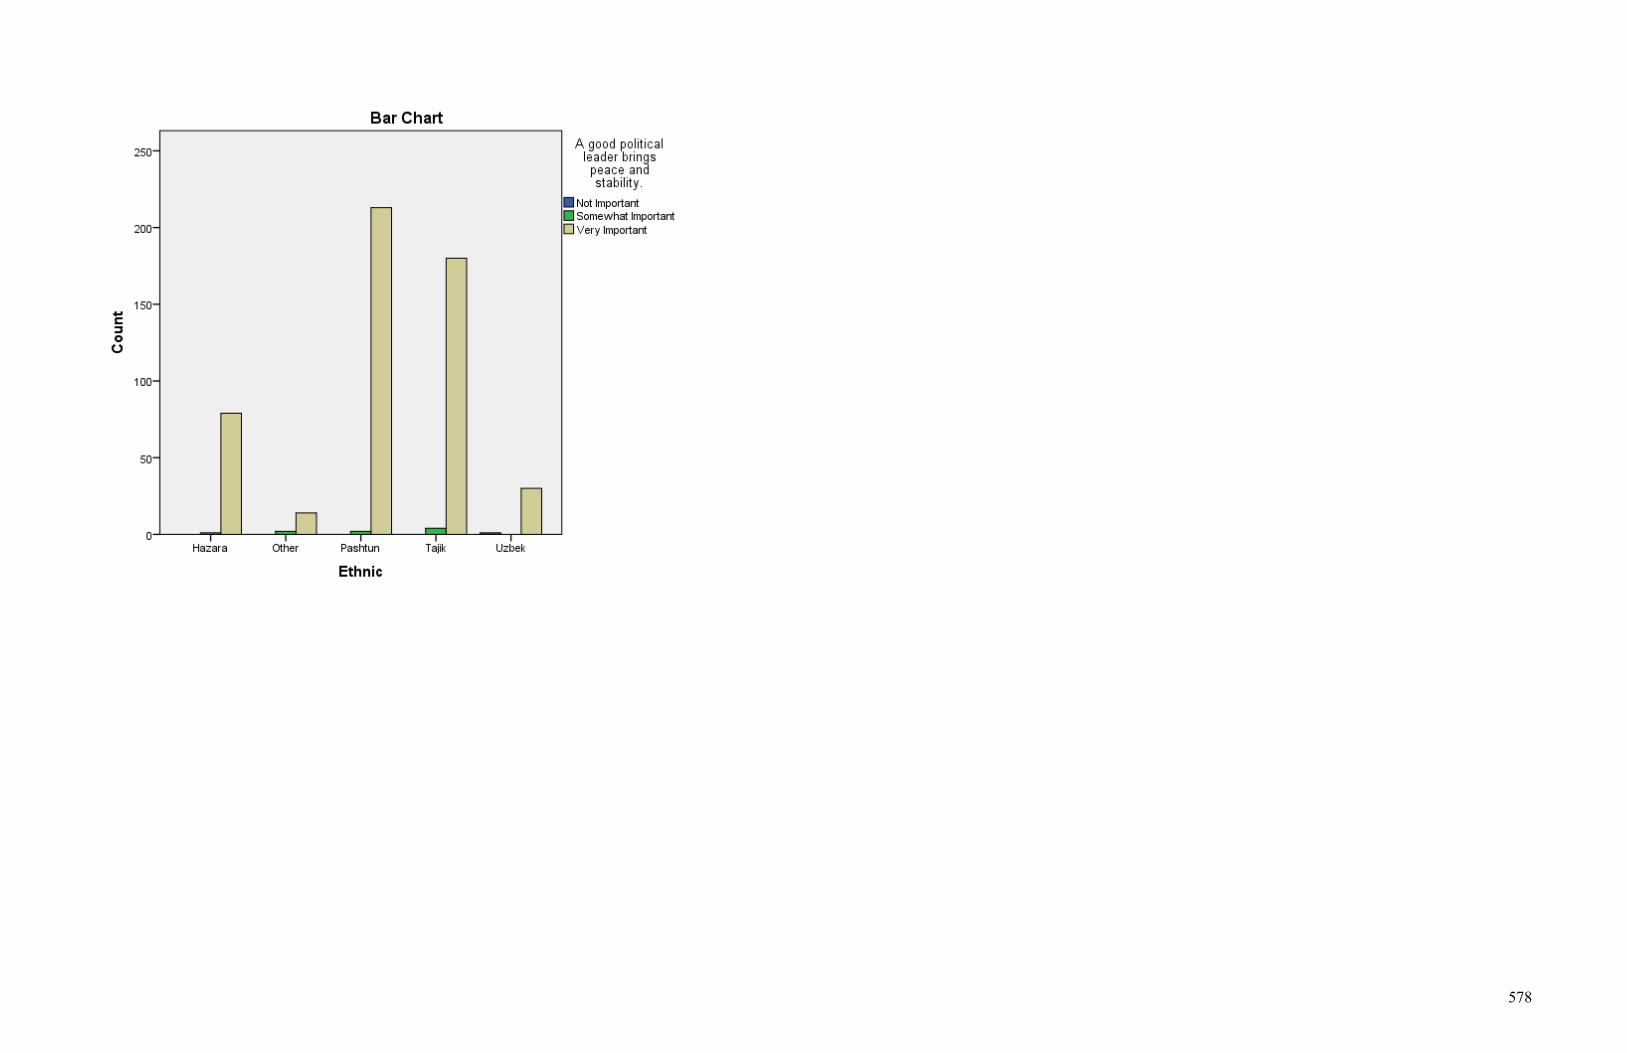
578

579
Ethnic * A good political leader creates jobs for people. Crosstab
A good political leader creates jobs for people.
Total Not Important
Somewhat
Important Very Important
Ethnic Hazara Count 1 7 70 78
Expected Count .2 6.5 71.3 78.0
Other Count 0 3 13 16
Expected Count .0 1.3 14.6 16.0
Pashtun Count 0 22 183 205
Expected Count .4 17.2 187.4 205.0
Tajik Count 0 10 174 184
Expected Count .4 15.4 168.2 184.0
Uzbek Count 0 1 29 30
Expected Count .1 2.5 27.4 30.0
Total Count 1 43 469 513
Expected Count 1.0 43.0 469.0 513.0
Chi-Square Tests
Value df
Asymp. Sig. (2-
sided)
Pearson Chi-Square 12.429a 8 .133
Likelihood Ratio 10.519 8 .230
N of Valid Cases 513
a. 7 cells (46.7%) have expected count less than 5. The minimum
expected count is .03.

580

581
Ethnic * A good political leader stops ethnic discrimination among people. Crosstab
A good political leader stops ethnic discrimination among
people.
Total Not Important
Somewhat
Important Very Important
Ethnic Hazara Count 1 7 72 80
Expected Count 1.5 6.2 72.2 80.0
Other Count 1 1 14 16
Expected Count .3 1.2 14.4 16.0
Pashtun Count 5 17 191 213
Expected Count 4.1 16.6 192.3 213.0
Tajik Count 2 15 168 185
Expected Count 3.5 14.4 167.0 185.0
Uzbek Count 1 1 29 31
Expected Count .6 2.4 28.0 31.0
Total Count 10 41 474 525
Expected Count 10.0 41.0 474.0 525.0
Chi-Square Tests
Value df
Asymp. Sig. (2-
sided)
Pearson Chi-Square 3.997a 8 .857
Likelihood Ratio 3.720 8 .881
N of Valid Cases 525
a. 7 cells (46.7%) have expected count less than 5. The minimum
expected count is .30.

582

583
Ethnic * A good political leader defends the country. Crosstab
A good political leader defends the
country.
Total
Somewhat
Important Very Important
Ethnic Hazara Count 2 78 80
Expected Count 2.4 77.6 80.0
Other Count 1 15 16
Expected Count .5 15.5 16.0
Pashtun Count 10 200 210
Expected Count 6.4 203.6 210.0
Tajik Count 3 182 185
Expected Count 5.7 179.3 185.0
Uzbek Count 0 32 32
Expected Count 1.0 31.0 32.0
Total Count 16 507 523
Expected Count 16.0 507.0 523.0
Chi-Square Tests
Value df
Asymp. Sig. (2-
sided)
Pearson Chi-Square 4.986a 4 .289
Likelihood Ratio 5.815 4 .213
N of Valid Cases 523
a. 3 cells (30.0%) have expected count less than 5. The minimum
expected count is .49.

584

585
Ethnic * A good political leader ends corruption in the society. Crosstab
A good political leader ends corruption
in the society.
Total
Somewhat
Important Very Important
Ethnic Hazara Count 3 76 79
Expected Count 4.1 74.9 79.0
Other Count 1 15 16
Expected Count .8 15.2 16.0
Pashtun Count 16 197 213
Expected Count 11.0 202.0 213.0
Tajik Count 6 178 184
Expected Count 9.5 174.5 184.0
Uzbek Count 1 31 32
Expected Count 1.6 30.4 32.0
Total Count 27 497 524
Expected Count 27.0 497.0 524.0
Chi-Square Tests
Value df
Asymp. Sig. (2-
sided)
Pearson Chi-Square 4.378a 4 .357
Likelihood Ratio 4.353 4 .360
N of Valid Cases 524
a. 3 cells (30.0%) have expected count less than 5. The minimum
expected count is .82.

586

587
Ethnic * A good political leader eradicates narcotics in the country. Crosstab
A good political leader eradicates narcotics in the country.
Total Not Important
Somewhat
Important Very Important
Ethnic Hazara Count 2 7 69 78
Expected Count 1.0 7.6 69.3 78.0
Other Count 0 2 14 16
Expected Count .2 1.6 14.2 16.0
Pashtun Count 1 25 186 212
Expected Count 2.8 20.8 188.4 212.0
Tajik Count 4 14 165 183
Expected Count 2.5 17.9 162.6 183.0
Uzbek Count 0 3 29 32
Expected Count .4 3.1 28.4 32.0
Total Count 7 51 463 521
Expected Count 7.0 51.0 463.0 521.0
Chi-Square Tests
Value df
Asymp. Sig. (2-
sided)
Pearson Chi-Square 5.659a 8 .685
Likelihood Ratio 6.377 8 .605
N of Valid Cases 521
a. 7 cells (46.7%) have expected count less than 5. The minimum
expected count is .21.

588

589
Ethnic * A good political leader does exactly what he says he will do. Crosstab
A good political leader does exactly what he says he will
do.
Total Not Important
Somewhat
Important Very Important
Ethnic Hazara Count 0 7 72 79
Expected Count .6 5.3 73.1 79.0
Other Count 0 2 14 16
Expected Count .1 1.1 14.8 16.0
Pashtun Count 3 20 190 213
Expected Count 1.6 14.3 197.1 213.0
Tajik Count 1 5 177 183
Expected Count 1.4 12.2 169.4 183.0
Uzbek Count 0 1 31 32
Expected Count .2 2.1 29.6 32.0
Total Count 4 35 484 523
Expected Count 4.0 35.0 484.0 523.0
Chi-Square Tests
Value df
Asymp. Sig. (2-
sided)
Pearson Chi-Square 11.541a 8 .173
Likelihood Ratio 13.212 8 .105
N of Valid Cases 523
a. 7 cells (46.7%) have expected count less than 5. The minimum
expected count is .12.

590

591
Frequencies Statistics
A g
ood
polit
ical
lead
er is
use
ful t
o yo
ur p
erso
nal n
eeds
.
A g
ood
polit
ical
lead
er tr
eats
you
bet
ter t
han
othe
rs.
A g
ood
polit
ical
lead
er a
llow
s go
vern
ors
of th
e pr
ovin
ces
and
dist
ricts
to b
e el
ecte
d.
A g
ood
polit
ical
lead
er a
llow
s m
ayor
s of
the
citie
s to
be
elec
ted.
N Valid 508 506 513 512
Missing 60 62 55 56
Frequency Table
A good political leader is useful to your personal needs.
Frequency Percent Valid Percent Cumulative Percent
Valid Not Important 161 28.3 31.7 31.7
Somewhat Important 152 26.8 29.9 61.6
Very Important 195 34.3 38.4 100.0
Total 508 89.4 100.0 Missing nr 60 10.6 Total 568 100.0

592
A good political leader treats you better than others.
Frequency Percent Valid Percent
Cumulative
Percent
Valid Not Important 266 46.8 52.6 52.6
Somewhat Important 120 21.1 23.7 76.3
Very Important 120 21.1 23.7 100.0
Total 506 89.1 100.0 Missing nr 62 10.9 Total 568 100.0
A good political leader allows governors of the provinces and districts to be elected.
Frequency Percent Valid Percent
Cumulative
Percent
Valid Not Important 44 7.7 8.6 8.6
Somewhat Important 116 20.4 22.6 31.2
Very Important 353 62.1 68.8 100.0
Total 513 90.3 100.0 Missing nr 55 9.7 Total 568 100.0
A good political leader allows mayors of the cities to be elected.
Frequency Percent Valid Percent
Cumulative
Percent
Valid Not Important 36 6.3 7.0 7.0
Somewhat Important 116 20.4 22.7 29.7
Very Important 360 63.4 70.3 100.0
Total 512 90.1 100.0 Missing nr 56 9.9 Total 568 100.0

593
Pie Chart

594

595

596

597
Crosstabs Case Processing Summary
Cases
Valid Missing Total
N Percent N Percent N Percent
Ethnic * A good political leader
is useful to your personal
needs.
508 89.4% 60 10.6% 568 100.0%
Ethnic * A good political leader
treats you better than others. 506 89.1% 62 10.9% 568 100.0%
Ethnic * A good political leader
allows governors of the
provinces and districts to be
elected.
513 90.3% 55 9.7% 568 100.0%
Ethnic * A good political leader
allows mayors of the cities to
be elected.
512 90.1% 56 9.9% 568 100.0%
Ethnic * A good political leader is useful to your personal needs.
Crosstab
A good political leader is useful to your personal needs.
Total Not Important
Somewhat
Important Very Important
Ethnic Hazara Count 30 25 22 77
Expected Count 24.4 23.0 29.6 77.0
Other Count 6 1 9 16
Expected Count 5.1 4.8 6.1 16.0
Pashtun Count 46 76 89 211
Expected Count 66.9 63.1 81.0 211.0
Tajik Count 68 42 64 174
Expected Count 55.1 52.1 66.8 174.0
Uzbek Count 11 8 11 30
Expected Count 9.5 9.0 11.5 30.0
Total Count 161 152 195 508
Expected Count 161.0 152.0 195.0 508.0

598
Chi-Square Tests
Value df
Asymp. Sig. (2-
sided)
Pearson Chi-Square 23.229a 8 .003
Likelihood Ratio 25.141 8 .001
N of Valid Cases 508
a. 1 cells (6.7%) have expected count less than 5. The minimum expected
count is 4.79.
Symmetric Measures
Value Approx. Sig.
Nominal by Nominal Phi .214 .003
Cramer's V .151 .003
N of Valid Cases 508

599
Ethnic * A good political leader treats you better than others. Crosstab
A good political leader treats you better than others.
Total Not Important
Somewhat
Important Very Important
Ethnic Hazara Count 57 14 6 77
Expected Count 40.5 18.3 18.3 77.0
Other Count 9 3 3 15
Expected Count 7.9 3.6 3.6 15.0
Pashtun Count 69 69 71 209
Expected Count 109.9 49.6 49.6 209.0
Tajik Count 109 32 34 175
Expected Count 92.0 41.5 41.5 175.0
Uzbek Count 22 2 6 30
Expected Count 15.8 7.1 7.1 30.0
Total Count 266 120 120 506
Expected Count 266.0 120.0 120.0 506.0
Chi-Square Tests
Value df
Asymp. Sig. (2-
sided)
Pearson Chi-Square 61.382a 8 .000
Likelihood Ratio 65.352 8 .000
N of Valid Cases 506
a. 2 cells (13.3%) have expected count less than 5. The minimum
expected count is 3.56.
Symmetric Measures
Value Approx. Sig.
Nominal by Nominal Phi .348 .000
Cramer's V .246 .000
N of Valid Cases 506
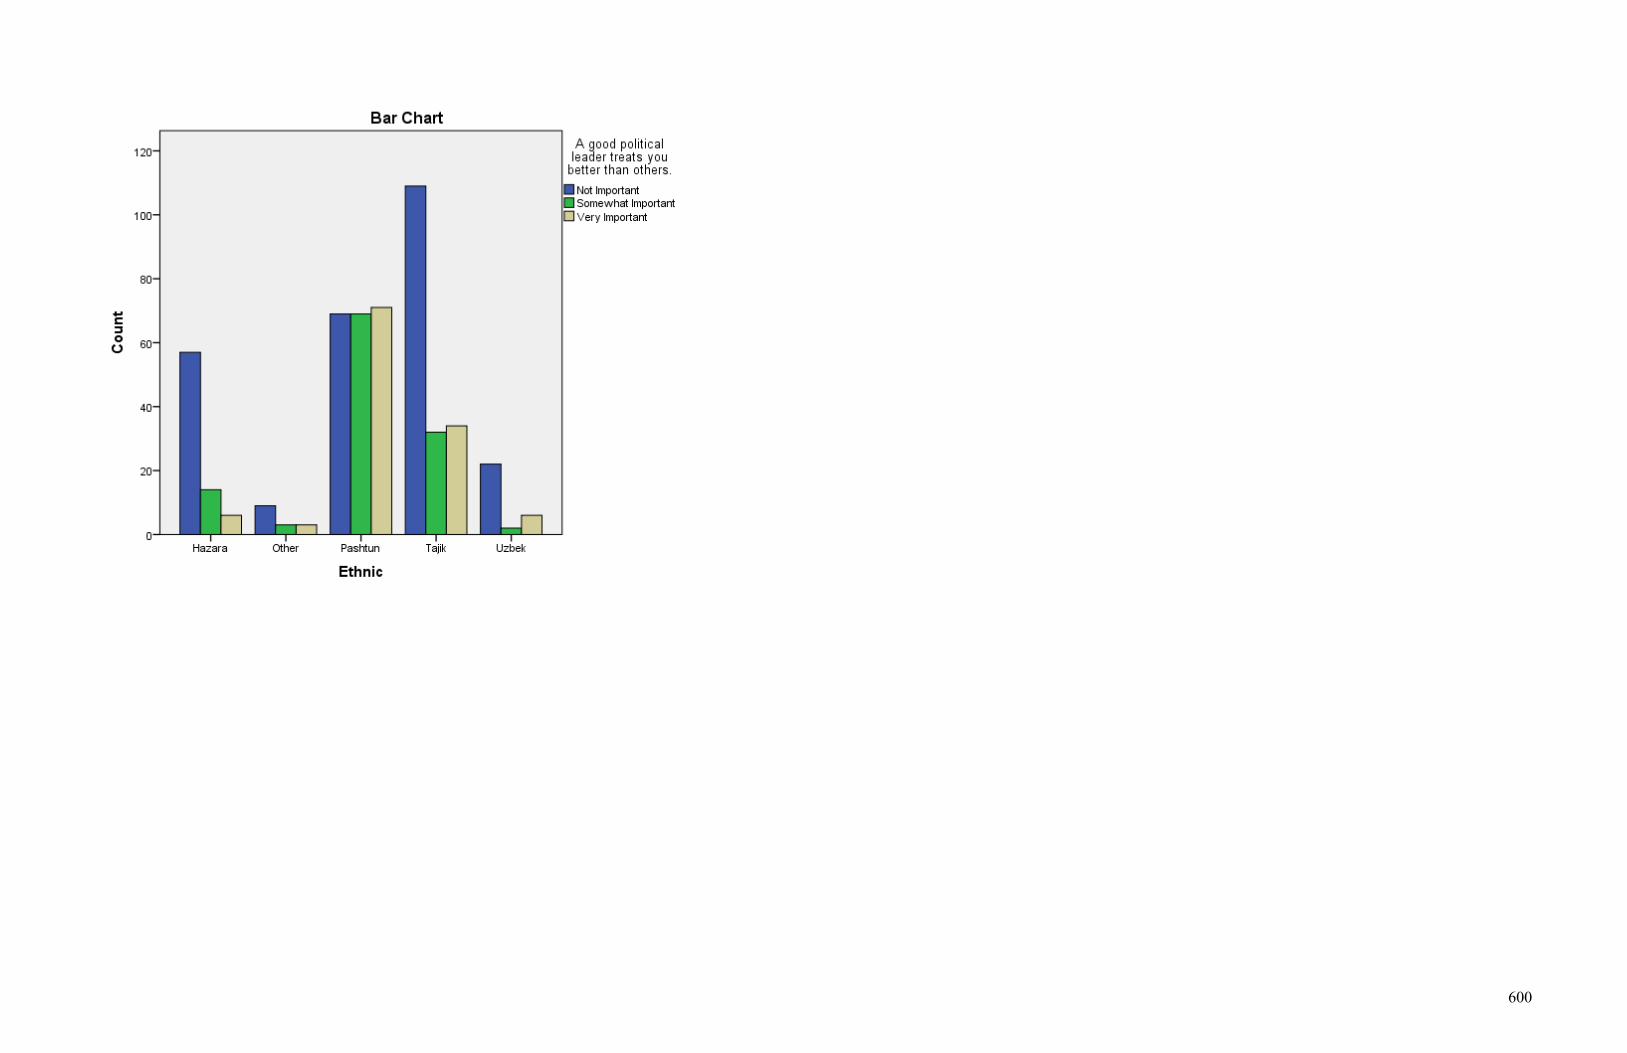
600

601
Ethnic * A good political leader allows governors of the provinces and districts to be elected. Crosstab
A good political leader allows governors of the provinces
and districts to be elected.
Total Not Important
Somewhat
Important Very Important
Ethnic Hazara Count 6 14 58 78
Expected Count 6.7 17.6 53.7 78.0
Other Count 3 5 8 16
Expected Count 1.4 3.6 11.0 16.0
Pashtun Count 23 46 139 208
Expected Count 17.8 47.0 143.1 208.0
Tajik Count 10 45 124 179
Expected Count 15.4 40.5 123.2 179.0
Uzbek Count 2 6 24 32
Expected Count 2.7 7.2 22.0 32.0
Total Count 44 116 353 513
Expected Count 44.0 116.0 353.0 513.0
Chi-Square Tests
Value df
Asymp. Sig. (2-
sided)
Pearson Chi-Square 9.054a 8 .338
Likelihood Ratio 8.795 8 .360
N of Valid Cases 513
a. 3 cells (20.0%) have expected count less than 5. The minimum
expected count is 1.37.
Symmetric Measures
Value Approx. Sig.
Nominal by Nominal Phi .133 .338
Cramer's V .094 .338
N of Valid Cases 513

602

603
Ethnic * A good political leader allows mayors of the cities to be elected. Crosstab
A good political leader allows mayors of the cities to be
elected.
Total Not Important
Somewhat
Important Very Important
Ethnic Hazara Count 8 16 53 77
Expected Count 5.4 17.4 54.1 77.0
Other Count 0 4 12 16
Expected Count 1.1 3.6 11.3 16.0
Pashtun Count 16 50 144 210
Expected Count 14.8 47.6 147.7 210.0
Tajik Count 7 43 128 178
Expected Count 12.5 40.3 125.2 178.0
Uzbek Count 5 3 23 31
Expected Count 2.2 7.0 21.8 31.0
Total Count 36 116 360 512
Expected Count 36.0 116.0 360.0 512.0
Chi-Square Tests
Value df
Asymp. Sig. (2-
sided)
Pearson Chi-Square 11.603a 8 .170
Likelihood Ratio 12.676 8 .123
N of Valid Cases 512
a. 3 cells (20.0%) have expected count less than 5. The minimum
expected count is 1.13.
Symmetric Measures
Value Approx. Sig.
Nominal by Nominal Phi .151 .170
Cramer's V .106 .170
N of Valid Cases 512

604

605
Frequencies
A g
ood
polit
ical
lead
er p
rom
otes
rule
of l
aw.
A g
ood
polit
ical
lead
er p
rom
otes
edu
catio
n.
A g
ood
polit
ical
lead
er d
eliv
ers
just
ice.
A g
ood
polit
ical
lead
er p
unis
hes
war
crim
inal
s.
A g
ood
polit
ical
lead
er im
prov
es A
fgha
n ec
onom
y.
A g
ood
polit
ical
lead
er li
sten
s to
peo
ple.
A g
ood
polit
ical
lead
er is
abl
e to
incr
ease
inte
rnat
iona
l atte
ntio
n on
Afg
hani
stan
.
A g
ood
polit
ical
lead
er fi
ghts
and
rem
oves
maf
ia e
cono
my.
A g
ood
polit
ical
lead
er h
ires
prof
essi
onal
and
hon
est t
eam
.
A g
ood
polit
ical
lead
er s
tays
hon
est w
ith p
eopl
e.
A g
ood
polit
ical
lead
er re
build
s th
e co
untry
.
A g
ood
polit
ical
lead
er m
akes
pea
ce w
ith in
surg
ents
.
A g
ood
polit
ical
lead
er d
oes
not r
ecog
nize
the
Dur
and
Line
.
A g
ood
polit
ical
lead
er re
cogn
izes
the
iden
tity
of a
ll et
hnic
gro
ups.
A g
ood
polit
ical
lead
er d
istri
bute
s re
sour
ces
acco
rdin
g to
the
size
of p
opul
atio
n.
A g
ood
polit
ical
lead
er m
akes
mili
tary
ser
vice
man
dato
ry.
A g
ood
polit
ical
lead
er h
ires
youn
g ed
ucat
ed A
fgha
ns in
his
cab
inet
.
N Valid 523 528 529 517 529 522 516 513 524 521 519 508 508 510 512 513 513
Missing 45 40 39 51 39 46 52 55 44 47 49 60 60 58 56 55 55
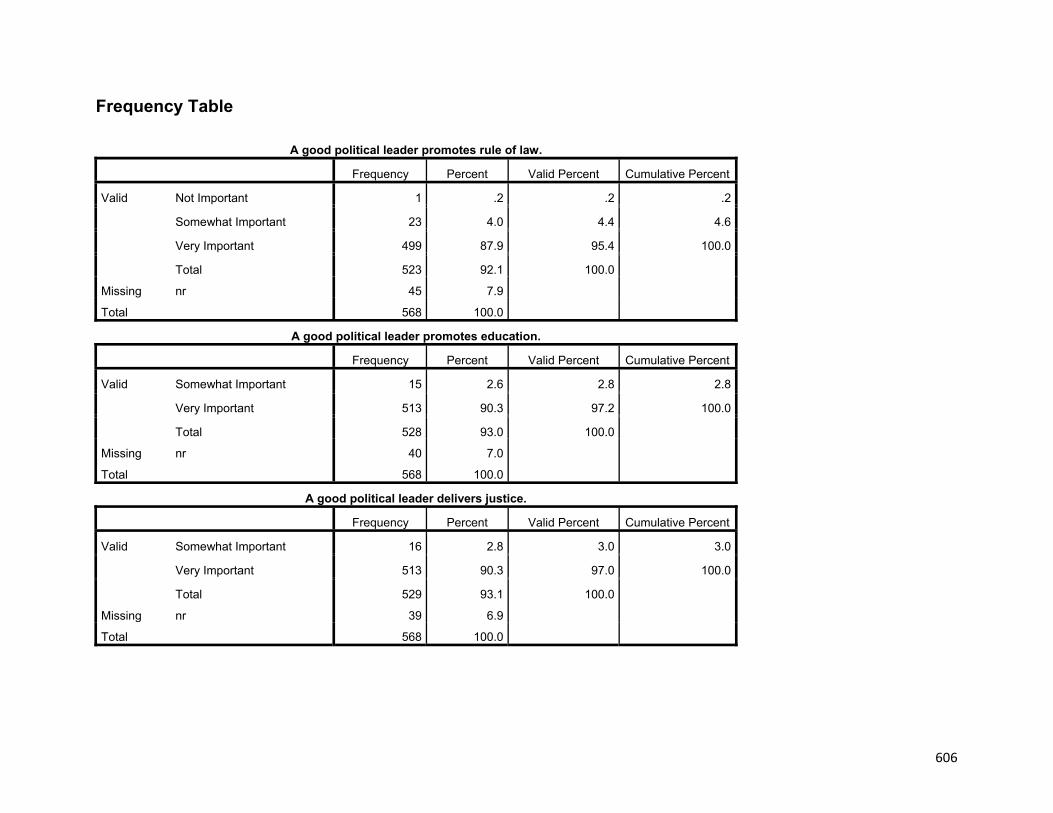
606
Frequency Table
A good political leader promotes rule of law.
Frequency Percent Valid Percent Cumulative Percent
Valid Not Important 1 .2 .2 .2
Somewhat Important 23 4.0 4.4 4.6
Very Important 499 87.9 95.4 100.0
Total 523 92.1 100.0 Missing nr 45 7.9 Total 568 100.0
A good political leader promotes education.
Frequency Percent Valid Percent Cumulative Percent
Valid Somewhat Important 15 2.6 2.8 2.8
Very Important 513 90.3 97.2 100.0
Total 528 93.0 100.0 Missing nr 40 7.0 Total 568 100.0
A good political leader delivers justice.
Frequency Percent Valid Percent Cumulative Percent
Valid Somewhat Important 16 2.8 3.0 3.0
Very Important 513 90.3 97.0 100.0
Total 529 93.1 100.0 Missing nr 39 6.9 Total 568 100.0

607
A good political leader punishes war criminals.
Frequency Percent Valid Percent Cumulative Percent
Valid Not Important 3 .5 .6 .6
Somewhat Important 108 19.0 20.9 21.5
Very Important 406 71.5 78.5 100.0
Total 517 91.0 100.0 Missing nr 51 9.0 Total 568 100.0
A good political leader improves Afghan economy.
Frequency Percent Valid Percent Cumulative Percent
Valid Somewhat Important 25 4.4 4.7 4.7
Very Important 504 88.7 95.3 100.0
Total 529 93.1 100.0 Missing nr 39 6.9 Total 568 100.0
A good political leader listens to people.
Frequency Percent Valid Percent Cumulative Percent
Valid Not Important 3 .5 .6 .6
Somewhat Important 88 15.5 16.9 17.4
Very Important 431 75.9 82.6 100.0
Total 522 91.9 100.0 Missing nr 46 8.1 Total 568 100.0

608
A good political leader is able to increase international attention on Afghanistan.
Frequency Percent Valid Percent Cumulative Percent
Valid Not Important 2 .4 .4 .4
Somewhat Important 66 11.6 12.8 13.2
Very Important 448 78.9 86.8 100.0
Total 516 90.8 100.0 Missing nr 52 9.2 Total 568 100.0
A good political leader fights and removes mafia economy.
Frequency Percent Valid Percent Cumulative Percent
Valid Not Important 3 .5 .6 .6
Somewhat Important 55 9.7 10.7 11.3
Very Important 455 80.1 88.7 100.0
Total 513 90.3 100.0 Missing nr 55 9.7 Total 568 100.0
A good political leader hires professional and honest team.
Frequency Percent Valid Percent Cumulative Percent
Valid Not Important 11 1.9 2.1 2.1
Somewhat Important 52 9.2 9.9 12.0
Very Important 461 81.2 88.0 100.0
Total 524 92.3 100.0 Missing nr 44 7.7 Total 568 100.0

609
A good political leader stays honest with people.
Frequency Percent Valid Percent Cumulative Percent
Valid Not Important 1 .2 .2 .2
Somewhat Important 34 6.0 6.5 6.7
Very Important 486 85.6 93.3 100.0
Total 521 91.7 100.0 Missing nr 47 8.3 Total 568 100.0
A good political leader rebuilds the country.
Frequency Percent Valid Percent Cumulative Percent
Valid Somewhat Important 18 3.2 3.5 3.5
Very Important 501 88.2 96.5 100.0
Total 519 91.4 100.0 Missing nr 49 8.6 Total 568 100.0
A good political leader makes peace with insurgents.
Frequency Percent Valid Percent Cumulative Percent
Valid Not Important 94 16.5 18.5 18.5
Somewhat Important 129 22.7 25.4 43.9
Very Important 285 50.2 56.1 100.0
Total 508 89.4 100.0 Missing nr 60 10.6 Total 568 100.0

610
A good political leader does not recognize the Durand Line.
Frequency Percent Valid Percent Cumulative Percent
Valid Not Important 122 21.5 24.0 24.0
Somewhat Important 98 17.3 19.3 43.3
Very Important 288 50.7 56.7 100.0
Total 508 89.4 100.0 Missing nr 60 10.6 Total 568 100.0
A good political leader recognizes the identity of all ethnic groups.
Frequency Percent Valid Percent Cumulative Percent
Valid Not Important 26 4.6 5.1 5.1
Somewhat Important 80 14.1 15.7 20.8
Very Important 404 71.1 79.2 100.0
Total 510 89.8 100.0 Missing nr 58 10.2 Total 568 100.0
A good political leader distributes resources according to the size of population.
Frequency Percent Valid Percent Cumulative Percent
Valid Not Important 24 4.2 4.7 4.7
Somewhat Important 123 21.7 24.0 28.7
Very Important 365 64.3 71.3 100.0
Total 512 90.1 100.0 Missing nr 56 9.9 Total 568 100.0

611
A good political leader makes military service mandatory.
Frequency Percent Valid Percent Cumulative Percent
Valid Not Important 119 21.0 23.2 23.2
Somewhat Important 151 26.6 29.4 52.6
Very Important 243 42.8 47.4 100.0
Total 513 90.3 100.0 Missing nr 55 9.7 Total 568 100.0
A good political leader hires young educated Afghans in his cabinet.
Frequency Percent Valid Percent Cumulative Percent
Valid Not Important 14 2.5 2.7 2.7
Somewhat Important 106 18.7 20.7 23.4
Very Important 393 69.2 76.6 100.0
Total 513 90.3 100.0 Missing nr 55 9.7 Total 568 100.0

612
Pie Chart

613

614

615

616

617

618

619

620

621

622

623

624

625

626

627

628

629
Crosstabs: Case Processing Summary
Cases
Valid Missing Total
N Percent N Percent N Percent
Ethnic * A good political leader
promotes rule of law. 523 92.1% 45 7.9% 568 100.0%
Ethnic * A good political leader
promotes education. 528 93.0% 40 7.0% 568 100.0%
Ethnic * A good political leader
delivers justice. 529 93.1% 39 6.9% 568 100.0%
Ethnic * A good political leader
punishes war criminals. 517 91.0% 51 9.0% 568 100.0%
Ethnic * A good political leader
improves Afghan economy. 529 93.1% 39 6.9% 568 100.0%
Ethnic * A good political leader
listens to people. 522 91.9% 46 8.1% 568 100.0%
Ethnic * A good political leader
is able to increase international
attention on Afghanistan.
516 90.8% 52 9.2% 568 100.0%
Ethnic * A good political leader
fights and removes mafia
economy.
513 90.3% 55 9.7% 568 100.0%
Ethnic * A good political leader
hires professional and honest
team.
524 92.3% 44 7.7% 568 100.0%
Ethnic * A good political leader
stays honest with people. 521 91.7% 47 8.3% 568 100.0%

630
Ethnic * A good political leader
rebuilds the country. 519 91.4% 49 8.6% 568 100.0%
Ethnic * A good political leader
makes peace with insurgents. 508 89.4% 60 10.6% 568 100.0%
Ethnic * A good political leader
does not recognize the Durand
Line.
508 89.4% 60 10.6% 568 100.0%
Ethnic * A good political leader
recognizes the identity of all
ethnic groups.
510 89.8% 58 10.2% 568 100.0%
Ethnic * A good political leader
distributes resources according
to the size of population.
512 90.1% 56 9.9% 568 100.0%
Ethnic * A good political leader
makes military service
mandatory.
513 90.3% 55 9.7% 568 100.0%
Ethnic * A good political leader
hires young educated Afghans
in his cabinet.
513 90.3% 55 9.7% 568 100.0%

631
Ethnic * A good political leader promotes rule of law. Crosstab
A good political leader promotes rule of law.
Total Not Important
Somewhat
Important Very Important
Ethnic Hazara Count 0 5 73 78
Expected Count .1 3.4 74.4 78.0
Other Count 0 0 15 15
Expected Count .0 .7 14.3 15.0
Pashtun Count 1 12 202 215
Expected Count .4 9.5 205.1 215.0
Tajik Count 0 5 180 185
Expected Count .4 8.1 176.5 185.0
Uzbek Count 0 1 29 30
Expected Count .1 1.3 28.6 30.0
Total Count 1 23 499 523
Expected Count 1.0 23.0 499.0 523.0
Chi-Square Tests
Value df
Asymp. Sig. (2-
sided)
Pearson Chi-Square 4.964a 8 .761
Likelihood Ratio 6.026 8 .644
N of Valid Cases 523
a. 8 cells (53.3%) have expected count less than 5. The minimum
expected count is .03.

632

633
Ethnic * A good political leader promotes education.
Crosstab
A good political leader promotes education.
Total Somewhat Important Very Important
Ethnic Hazara Count 3 76 79
Expected Count 2.2 76.8 79.0
Other Count 0 16 16
Expected Count .5 15.5 16.0
Pashtun Count 5 212 217
Expected Count 6.2 210.8 217.0
Tajik Count 6 179 185
Expected Count 5.3 179.7 185.0
Uzbek Count 1 30 31
Expected Count .9 30.1 31.0
Total Count 15 513 528
Expected Count 15.0 513.0 528.0
Chi-Square Tests
Value df
Asymp. Sig. (2-
sided)
Pearson Chi-Square 1.081a 4 .897
Likelihood Ratio 1.521 4 .823
N of Valid Cases 528
a. 3 cells (30.0%) have expected count less than 5. The minimum
expected count is .45.

634

635
Ethnic * A good political leader delivers justice.
Crosstab
A good political leader delivers justice.
Total Somewhat Important Very Important
Ethnic Hazara Count 2 76 78
Expected Count 2.4 75.6 78.0
Other Count 0 16 16
Expected Count .5 15.5 16.0
Pashtun Count 8 209 217
Expected Count 6.6 210.4 217.0
Tajik Count 5 182 187
Expected Count 5.7 181.3 187.0
Uzbek Count 1 30 31
Expected Count .9 30.1 31.0
Total Count 16 513 529
Expected Count 16.0 513.0 529.0
Chi-Square Tests
Value df
Asymp. Sig. (2-
sided)
Pearson Chi-Square .962a 4 .915
Likelihood Ratio 1.432 4 .839
N of Valid Cases 529
a. 3 cells (30.0%) have expected count less than 5. The minimum
expected count is .48.

636

637
Ethnic * A good political leader punishes war criminals.
Crosstab
A good political leader punishes war criminals.
Total Not Important Somewhat Important Very Important
Ethnic Hazara Count 0 17 58 75
Expected Count .4 15.7 58.9 75.0
Other Count 0 5 10 15
Expected Count .1 3.1 11.8 15.0
Pashtun Count 1 35 178 214
Expected Count 1.2 44.7 168.1 214.0
Tajik Count 1 44 137 182
Expected Count 1.1 38.0 142.9 182.0
Uzbek Count 1 7 23 31
Expected Count .2 6.5 24.3 31.0
Total Count 3 108 406 517
Expected Count 3.0 108.0 406.0 517.0
Chi-Square Tests
Value df
Asymp. Sig. (2-
sided)
Pearson Chi-Square 9.817a 8 .278
Likelihood Ratio 8.352 8 .400
N of Valid Cases 517
a. 6 cells (40.0%) have expected count less than 5. The minimum
expected count is .09.

638
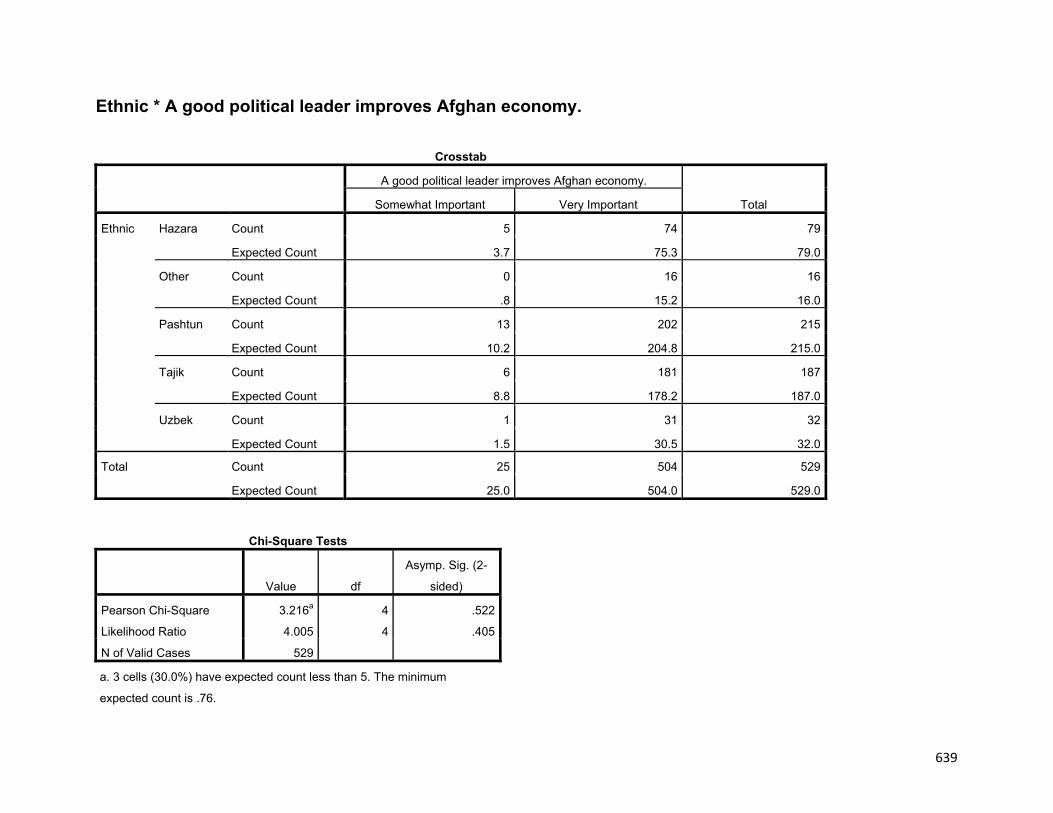
639
Ethnic * A good political leader improves Afghan economy.
Crosstab
A good political leader improves Afghan economy.
Total Somewhat Important Very Important
Ethnic Hazara Count 5 74 79
Expected Count 3.7 75.3 79.0
Other Count 0 16 16
Expected Count .8 15.2 16.0
Pashtun Count 13 202 215
Expected Count 10.2 204.8 215.0
Tajik Count 6 181 187
Expected Count 8.8 178.2 187.0
Uzbek Count 1 31 32
Expected Count 1.5 30.5 32.0
Total Count 25 504 529
Expected Count 25.0 504.0 529.0
Chi-Square Tests
Value df
Asymp. Sig. (2-
sided)
Pearson Chi-Square 3.216a 4 .522
Likelihood Ratio 4.005 4 .405
N of Valid Cases 529
a. 3 cells (30.0%) have expected count less than 5. The minimum
expected count is .76.

640

641
Ethnic * A good political leader listens to people.
Crosstab
A good political leader listens to people.
Total Not Important Somewhat Important Very Important
Ethnic Hazara Count 0 20 59 79
Expected Count .5 13.3 65.2 79.0
Other Count 0 5 11 16
Expected Count .1 2.7 13.2 16.0
Pashtun Count 2 34 176 212
Expected Count 1.2 35.7 175.0 212.0
Tajik Count 1 25 157 183
Expected Count 1.1 30.9 151.1 183.0
Uzbek Count 0 4 28 32
Expected Count .2 5.4 26.4 32.0
Total Count 3 88 431 522
Expected Count 3.0 88.0 431.0 522.0
Chi-Square Tests
Value df
Asymp. Sig. (2-
sided)
Pearson Chi-Square 9.402a 8 .310
Likelihood Ratio 9.351 8 .314
N of Valid Cases 522
a. 6 cells (40.0%) have expected count less than 5. The minimum
expected count is .09.

642

643
Ethnic * A good political leader is able to increase international attention on Afghanistan.
Crosstab
A good political leader is able to increase international attention on Afghanistan.
Total Not Important Somewhat Important Very Important
Ethnic Hazara Count 0 11 68 79
Expected Count .3 10.1 68.6 79.0
Other Count 0 2 14 16
Expected Count .1 2.0 13.9 16.0
Pashtun Count 1 22 188 211
Expected Count .8 27.0 183.2 211.0
Tajik Count 1 28 150 179
Expected Count .7 22.9 155.4 179.0
Uzbek Count 0 3 28 31
Expected Count .1 4.0 26.9 31.0
Total Count 2 66 448 516
Expected Count 2.0 66.0 448.0 516.0
Chi-Square Tests
Value df
Asymp. Sig. (2-
sided)
Pearson Chi-Square 3.404a 8 .907
Likelihood Ratio 3.880 8 .868
N of Valid Cases 516
a. 7 cells (46.7%) have expected count less than 5. The minimum
expected count is .06.

644

645
Ethnic * A good political leader fights and removes mafia economy.
Crosstab
A good political leader fights and removes mafia economy.
Total Not Important Somewhat Important Very Important
Ethnic Hazara Count 0 7 73 80
Expected Count .5 8.6 71.0 80.0
Other Count 0 0 16 16
Expected Count .1 1.7 14.2 16.0
Pashtun Count 3 35 168 206
Expected Count 1.2 22.1 182.7 206.0
Tajik Count 0 11 170 181
Expected Count 1.1 19.4 160.5 181.0
Uzbek Count 0 2 28 30
Expected Count .2 3.2 26.6 30.0
Total Count 3 55 455 513
Expected Count 3.0 55.0 455.0 513.0
Chi-Square Tests
Value df
Asymp. Sig. (2-
sided)
Pearson Chi-Square 20.233a 8 .009
Likelihood Ratio 22.586 8 .004
N of Valid Cases 513
a. 7 cells (46.7%) have expected count less than 5. The minimum
expected count is .09.

646

647
Ethnic * A good political leader hires professional and honest team.
Crosstab
A good political leader hires professional and honest team.
Total Not Important Somewhat Important Very Important
Ethnic Hazara Count 3 8 68 79
Expected Count 1.7 7.8 69.5 79.0
Other Count 0 3 13 16
Expected Count .3 1.6 14.1 16.0
Pashtun Count 3 23 188 214
Expected Count 4.5 21.2 188.3 214.0
Tajik Count 5 17 162 184
Expected Count 3.9 18.3 161.9 184.0
Uzbek Count 0 1 30 31
Expected Count .7 3.1 27.3 31.0
Total Count 11 52 461 524
Expected Count 11.0 52.0 461.0 524.0
Chi-Square Tests
Value df
Asymp. Sig. (2-
sided)
Pearson Chi-Square 6.185a 8 .627
Likelihood Ratio 7.230 8 .512
N of Valid Cases 524
a. 7 cells (46.7%) have expected count less than 5. The minimum
expected count is .34.

648

649
Ethnic * A good political leader stays honest with people.
Crosstab
A good political leader stays honest with people.
Total Not Important Somewhat Important Very Important
Ethnic Hazara Count 0 7 72 79
Expected Count .2 5.2 73.7 79.0
Other Count 0 2 14 16
Expected Count .0 1.0 14.9 16.0
Pashtun Count 1 13 198 212
Expected Count .4 13.8 197.8 212.0
Tajik Count 0 11 173 184
Expected Count .4 12.0 171.6 184.0
Uzbek Count 0 1 29 30
Expected Count .1 2.0 28.0 30.0
Total Count 1 34 486 521
Expected Count 1.0 34.0 486.0 521.0
Chi-Square Tests
Value df
Asymp. Sig. (2-
sided)
Pearson Chi-Square 3.740a 8 .880
Likelihood Ratio 3.935 8 .863
N of Valid Cases 521
a. 7 cells (46.7%) have expected count less than 5. The minimum
expected count is .03.

650

651
Ethnic * A good political leader rebuilds the country.
Crosstab
A good political leader rebuilds the country.
Total Somewhat Important Very Important
Ethnic Hazara Count 4 75 79
Expected Count 2.7 76.3 79.0
Other Count 3 13 16
Expected Count .6 15.4 16.0
Pashtun Count 8 201 209
Expected Count 7.2 201.8 209.0
Tajik Count 3 181 184
Expected Count 6.4 177.6 184.0
Uzbek Count 0 31 31
Expected Count 1.1 29.9 31.0
Total Count 18 501 519
Expected Count 18.0 501.0 519.0
Chi-Square Tests
Value df
Asymp. Sig. (2-
sided)
Pearson Chi-Square 14.812a 4 .005
Likelihood Ratio 10.737 4 .030
N of Valid Cases 519
a. 3 cells (30.0%) have expected count less than 5. The minimum
expected count is .55.

652

653
Ethnic * A good political leader makes peace with insurgents.
Crosstab
A good political leader makes peace with insurgents.
Total Not Important Somewhat Important Very Important
Ethnic Hazara Count 26 23 28 77
Expected Count 14.2 19.6 43.2 77.0
Other Count 6 4 6 16
Expected Count 3.0 4.1 9.0 16.0
Pashtun Count 14 55 137 206
Expected Count 38.1 52.3 115.6 206.0
Tajik Count 44 38 97 179
Expected Count 33.1 45.5 100.4 179.0
Uzbek Count 4 9 17 30
Expected Count 5.6 7.6 16.8 30.0
Total Count 94 129 285 508
Expected Count 94.0 129.0 285.0 508.0
Chi-Square Tests
Value df
Asymp. Sig. (2-
sided)
Pearson Chi-Square 44.726a 8 .000
Likelihood Ratio 47.423 8 .000
N of Valid Cases 508
a. 2 cells (13.3%) have expected count less than 5. The minimum
expected count is 2.96.

654

655
Ethnic * A good political leader does not recognize the Durand Line.
Crosstab
A good political leader does not recognize the Durand Line.
Total Not Important Somewhat Important Very Important
Ethnic Hazara Count 26 17 32 75
Expected Count 18.0 14.5 42.5 75.0
Other Count 6 5 5 16
Expected Count 3.8 3.1 9.1 16.0
Pashtun Count 32 27 148 207
Expected Count 49.7 39.9 117.4 207.0
Tajik Count 47 41 92 180
Expected Count 43.2 34.7 102.0 180.0
Uzbek Count 11 8 11 30
Expected Count 7.2 5.8 17.0 30.0
Total Count 122 98 288 508
Expected Count 122.0 98.0 288.0 508.0
Chi-Square Tests
Value df
Asymp. Sig. (2-
sided)
Pearson Chi-Square 36.735a 8 .000
Likelihood Ratio 37.260 8 .000
N of Valid Cases 508
a. 2 cells (13.3%) have expected count less than 5. The minimum
expected count is 3.09.

656

657
Ethnic * A good political leader recognizes the identity of all ethnic groups.
Crosstab
A good political leader recognizes the identity of all ethnic groups.
Total Not Important Somewhat Important Very Important
Ethnic Hazara Count 1 13 63 77
Expected Count 3.9 12.1 61.0 77.0
Other Count 0 2 13 15
Expected Count .8 2.4 11.9 15.0
Pashtun Count 14 45 149 208
Expected Count 10.6 32.6 164.8 208.0
Tajik Count 9 17 154 180
Expected Count 9.2 28.2 142.6 180.0
Uzbek Count 2 3 25 30
Expected Count 1.5 4.7 23.8 30.0
Total Count 26 80 404 510
Expected Count 26.0 80.0 404.0 510.0
Chi-Square Tests
Value df
Asymp. Sig. (2-
sided)
Pearson Chi-Square 16.742a 8 .033
Likelihood Ratio 18.694 8 .017
N of Valid Cases 510
a. 5 cells (33.3%) have expected count less than 5. The minimum
expected count is .76.

658

659
Ethnic * A good political leader distributes resources according to the size of population.
Crosstab
A good political leader distributes resources according to the size of population.
Total Not Important Somewhat Important Very Important
Ethnic Hazara Count 8 11 59 78
Expected Count 3.7 18.7 55.6 78.0
Other Count 1 3 11 15
Expected Count .7 3.6 10.7 15.0
Pashtun Count 6 62 139 207
Expected Count 9.7 49.7 147.6 207.0
Tajik Count 8 42 131 181
Expected Count 8.5 43.5 129.0 181.0
Uzbek Count 1 5 25 31
Expected Count 1.5 7.4 22.1 31.0
Total Count 24 123 365 512
Expected Count 24.0 123.0 365.0 512.0
Chi-Square Tests
Value df
Asymp. Sig. (2-
sided)
Pearson Chi-Square 15.172a 8 .056
Likelihood Ratio 14.523 8 .069
N of Valid Cases 512
a. 4 cells (26.7%) have expected count less than 5. The minimum
expected count is .70.
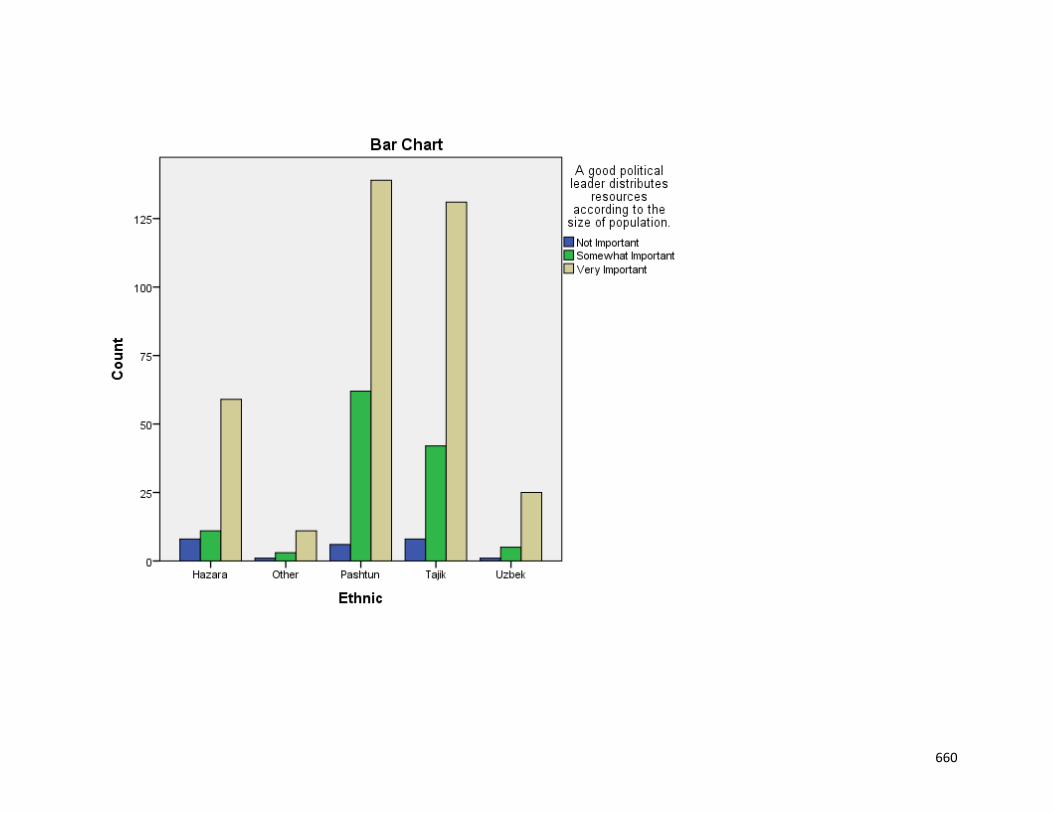
660

661
Ethnic * A good political leader makes military service mandatory.
Crosstab
A good political leader makes military service mandatory.
Total Not Important Somewhat Important Very Important
Ethnic Hazara Count 31 24 23 78
Expected Count 18.1 23.0 36.9 78.0
Other Count 4 6 6 16
Expected Count 3.7 4.7 7.6 16.0
Pashtun Count 42 62 102 206
Expected Count 47.8 60.6 97.6 206.0
Tajik Count 32 55 94 181
Expected Count 42.0 53.3 85.7 181.0
Uzbek Count 10 4 18 32
Expected Count 7.4 9.4 15.2 32.0
Total Count 119 151 243 513
Expected Count 119.0 151.0 243.0 513.0
Chi-Square Tests
Value df
Asymp. Sig. (2-
sided)
Pearson Chi-Square 23.928a 8 .002
Likelihood Ratio 24.079 8 .002
N of Valid Cases 513
a. 2 cells (13.3%) have expected count less than 5. The minimum
expected count is 3.71.

662

663
Ethnic * A good political leader hires young educated Afghans in his cabinet.
Crosstab
A good political leader hires young educated Afghans in his cabinet.
Total Not Important Somewhat Important Very Important
Ethnic Hazara Count 1 19 55 75
Expected Count 2.0 15.5 57.5 75.0
Other Count 0 6 10 16
Expected Count .4 3.3 12.3 16.0
Pashtun Count 9 36 163 208
Expected Count 5.7 43.0 159.3 208.0
Tajik Count 4 37 141 182
Expected Count 5.0 37.6 139.4 182.0
Uzbek Count 0 8 24 32
Expected Count .9 6.6 24.5 32.0
Total Count 14 106 393 513
Expected Count 14.0 106.0 393.0 513.0
Chi-Square Tests
Value df
Asymp. Sig. (2-
sided)
Pearson Chi-Square 9.034a 8 .339
Likelihood Ratio 9.779 8 .281
N of Valid Cases 513
a. 5 cells (33.3%) have expected count less than 5. The minimum
expected count is .44.

664

665
Univariate Statistics
N Mean Std. Deviation Missing No. of Extremesa
Count Percent Low High Mirwais 293 5.348 2.7062 275 48.4 39 41AhmadShah 351 5.627 2.7140 217 38.2 19 0AbdulRahman 281 3.477 2.7348 287 50.5 0 0Habibullah 255 3.576 3.3709 313 55.1 0 0Amanullah 347 5.896 2.7624 221 38.9 11 0ZahirKhan 331 4.157 2.9013 237 41.7 0 29DawoodKhan 339 5.540 2.7821 229 40.3 0 0Tarakee 278 2.032 2.1885 290 51.1 0 9HafeezullahAmin 263 1.681 2.1197 305 53.7 0 31BarakKarma 263 2.179 2.5775 305 53.7 0 8DrNajib 371 5.809 2.9635 197 34.7 0 0Sebghatulah 279 3.115 2.5092 289 50.9 0 0Rabani 296 3.598 3.0091 272 47.9 0 0HamidKarzai 369 4.593 2.6432 199 35.0 26 54QayoomKarzai 175 2.309 2.3235 393 69.2 0 3AShMasood 332 5.148 3.3451 236 41.5 0 0Hekmatyar 269 2.134 2.1693 299 52.6 0 1MullahOmar 289 2.156 2.3629 279 49.1 0 2AliMazari 240 2.654 2.5860 328 57.7 0 0KrimKhalili 245 2.551 2.2694 323 56.9 0 2Marshal 252 2.329 2.1917 316 55.6 0 2ZiaMasood 221 3.050 2.8304 347 61.1 0 16Saleh 248 4.536 3.0987 320 56.3 0 0UstadAtta 291 5.048 3.6033 277 48.8 0 0IsmaelKhan 252 3.290 2.9859 316 55.6 0 0Sherzai 259 3.216 2.5744 309 54.4 0 0Mohqeq 244 2.869 2.6292 324 57.0 0 0GenDostum 277 3.372 3.0708 291 51.2 0 0UstadSayaf 259 3.151 2.9116 309 54.4 0 0Qanooni 257 4.272 2.9428 311 54.8 0 0Mohseni 232 3.957 3.0731 336 59.2 0 0Ghailan 168 3.054 2.4889 400 70.4 0 0AshrafGhani 274 3.942 2.5884 294 51.8 0 11Jalali 193 3.751 2.4791 375 66.0 0 9KhalilZad 223 2.964 2.5991 345 60.7 0 0Ahadi 192 2.542 2.1215 376 66.2 0 3Yoon 151 1.894 1.8873 417 73.4 0 0

666
Badakhshi 132 2.644 2.8044 436 76.8 0 5Kishtmand 165 3.333 2.7923 403 71.0 0 0Atmar 218 3.275 2.5648 350 61.6 0 0FarooqWardak 243 3.576 2.7085 325 57.2 0 0BasharDost 314 5.019 2.8329 254 44.7 0 0SimaSamar 209 3.775 2.6858 359 63.2 0 12ShukriaBarakzai 250 4.036 2.8543 318 56.0 0 19FawziaKoofi 212 4.462 3.3121 356 62.7 0 0SimeenBarakzai 148 2.851 2.7215 420 73.9 0 0HabibaSarabi 179 3.687 2.9476 389 68.5 0 0BanuGhazanfar 173 3.595 3.0036 395 69.5 0 0MalalyJoya 217 3.696 2.9705 351 61.8 0 0DrAbdullah 260 3.958 3.0279 308 54.2 0 0DrSpanta 192 2.984 2.5674 376 66.2 0 0BesmellahKHan 189 3.280 2.5684 379 66.7 0 0GenRahimWardak 213 3.141 2.5787 355 62.5 0 0MustafaKazimi 201 4.269 3.2646 367 64.6 0 0LateefPedram 181 3.083 2.8439 387 68.1 0 0BaktashSeyawash 232 4.422 3.5005 336 59.2 0 0AhmadBehzad 162 3.37 2.817 406 71.5 0 0HajiQadeer 155 2.323 2.3381 413 72.7 0 2Zakhilwal 180 2.483 2.2335 388 68.3 0 5Khuram 166 1.958 2.0222 402 70.8 0 1Dawoodzai 141 2.11 2.290 427 75.2 0 3MahmudKarzai 186 2.231 2.1041 382 67.3 0 0WaliKarzai 194 2.835 2.3110 374 65.8 0 0a. Number of cases outside the range (Q1 - 1.5*IQR, Q3 + 1.5*IQR).
Little’s MCAR test: Chi‐Square=11208.264, DF=10707, Sig. = 0.000

667
Missing Values

668
Variable Summarya,b
Missing
Valid N Mean Std. Deviation N Percent Tahir Badakhshi 436 76.8% 132 2.644 2.8044 Omar Dawoodzai 427 75.2% 141 2.11 2.290 Semeen Barakzai 420 73.9% 148 2.851 2.7215 Ismael Yoon 417 73.4% 151 1.894 1.8873 Haji Qadeer 413 72.7% 155 2.323 2.3381 Ahmad Behzad 406 71.5% 162 3.37 2.817 Sultan Ali Kishtmand 403 71.0% 165 3.333 2.7923 Karim Khuram 402 70.8% 166 1.958 2.0222 Sayed Ahmad Gelani 400 70.4% 168 3.054 2.4889 Banoo Ghazanfar 395 69.5% 173 3.595 3.0036 Qayoom Karzai 393 69.2% 175 2.309 2.3235 Habiba Sarabee 389 68.5% 179 3.687 2.9476 Omar Zakhilwal 388 68.3% 180 2.483 2.2335 Lateef Pedram 387 68.1% 181 3.083 2.8439 Mahmood Karzai 382 67.3% 186 2.231 2.1041 Besmellah Khan 379 66.7% 189 3.280 2.5684 Dr Spanta 376 66.2% 192 2.984 2.5674 Anwarul Haq Ahadi 376 66.2% 192 2.542 2.1215 Ali Ahmad Jalali 375 66.0% 193 3.751 2.4791 Ahmad Wali Karzai 374 65.8% 194 2.835 2.3110 Syed Mustafa Kazimi 367 64.6% 201 4.269 3.2646 Dr Seema Samar 359 63.2% 209 3.775 2.6858 Fawzia Koofee 356 62.7% 212 4.462 3.3121 Gen. Rahim Wardak 355 62.5% 213 3.141 2.5787 Malaly Joya 351 61.8% 217 3.696 2.9705 Haneef Atmar 350 61.6% 218 3.275 2.5648 Ahmad Zia Masood 347 61.1% 221 3.050 2.8304 Zalmay Khalilzad 345 60.7% 223 2.964 2.5991 Baktash Seyawash 336 59.2% 232 4.422 3.5005 Shekh Asif Mohseni 336 59.2% 232 3.957 3.0731 Abdul Ali Mazari 328 57.7% 240 2.654 2.5860 Farooq Wardak 325 57.2% 243 3.576 2.7085 Mohqeq 324 57.0% 244 2.869 2.6292 Karim Khalili 323 56.9% 245 2.551 2.2694

669
Amrullah Saleh 320 56.3% 248 4.536 3.0987 Shukria Barakzai 318 56.0% 250 4.036 2.8543 Ismael Khan 316 55.6% 252 3.290 2.9859 Marshal Fahim 316 55.6% 252 2.329 2.1917 Habibullah Khan 313 55.1% 255 3.576 3.3709 Younus Qanooni 311 54.8% 257 4.272 2.9428 Ustad Sayaf 309 54.4% 259 3.151 2.9116 Gul Agha Sherzai 309 54.4% 259 3.216 2.5744 Dr Abdullah 308 54.2% 260 3.958 3.0279 Babrak Karmal 305 53.7% 263 2.179 2.5775 Hafeezullah Amin 305 53.7% 263 1.681 2.1197 Hekmatyar 299 52.6% 269 2.134 2.1693 Ashraf Ghani Ahmadzai 294 51.8% 274 3.942 2.5884 Gen. Dostum 291 51.2% 277 3.372 3.0708 Tarakee 290 51.1% 278 2.032 2.1885 Sebghatullah Mujadadi 289 50.9% 279 3.115 2.5092 Abdul Rahman Khan 287 50.5% 281 3.477 2.7348 Mullah Omar 279 49.1% 289 2.156 2.3629 Ustad Atta 277 48.8% 291 5.048 3.6033 Mirwais Nia 275 48.4% 293 5.348 2.7062 Ustad Rabani 272 47.9% 296 3.598 3.0091 Ramazan Bashar Dost 254 44.7% 314 5.019 2.8329 Zahir Khan 237 41.7% 331 4.157 2.9013 Ahmad Shah Masood 236 41.5% 332 5.148 3.3451 Dawood Khan 229 40.3% 339 5.540 2.7821 Amanullah Khan 221 38.9% 347 5.896 2.7624 Ahmad Shah Baba 217 38.2% 351 5.627 2.7140 Hamid Karzai 199 35.0% 369 4.593 2.6432 Dr Najib 197 34.7% 371 5.809 2.9635 a. Maximum number of variables shown: 63 b. Minimum percentage of missing values for variable to be included: 0.0%

670

671

672
Frequency analysis of items after multiple imputations
Mirw
ais
Nia
Ahm
ad S
hah
Bab
a
Abdu
l Rah
man
Kha
n
Hab
ibul
lah
Kha
n
Aman
ulla
h Kh
an
Zahi
r Kha
n
Daw
ood
Kha
n
Tara
kee
Haf
eezu
llah
Am
in
Babr
ak K
arm
al
Dr N
ajib
Sebg
hatu
llah
Muj
adad
i
Ust
ad R
aban
i
Ham
id K
arza
i
Qay
oom
Kar
zai
Ahm
ad S
hah
Mas
ood
Hek
mat
yar
Mul
lah
Om
ar
Abdu
l Ali
Maz
ari
Karim
Kha
lili
Mar
shal
Fah
im
Ahm
ad Z
ia M
asoo
d
Amru
llah
Sal
eh
Ust
ad A
tta
Ism
ael K
han
Gul
Agh
a S
herz
ai
Moh
qeq
Gen
. Dos
tum
Ust
ad S
ayaf
Youn
us Q
anoo
ni
Shek
h A
sif M
ohse
ni
Saye
d A
hmad
Gel
ani
Ashr
af G
hani
Ahm
adza
i
Ali A
hmad
Jal
ali
Zalm
ay K
halil
zad
Anw
arul
Haq
Aha
di
Ism
ael Y
oon
Tahi
r Bad
akhs
hi
Sulta
n A
li Ki
shtm
and
Han
eef A
tmar
Faro
oq W
arda
k
Ram
azan
Bas
har D
ost
Dr S
eem
a S
amar
Shuk
ria B
arak
zai
Faw
zia
Koo
fee
Sem
een
Bar
akza
i
Hab
iba
Sara
bee
Bano
o G
haza
nfar
Mal
aly
Joya
Dr A
bdul
lah
Dr S
pant
a
Besm
ella
h K
han
Gen
. Rah
im W
arda
k
Syed
Mus
tafa
Kaz
imi
Late
ef P
edra
m
Bakt
ash
Sey
awas
h
Ahm
ad B
ehza
d
Haj
i Qad
eer
Om
ar Z
akhi
lwal
Karim
Khu
ram
Om
ar D
awoo
dzai
Mah
moo
d K
arza
i
Ahm
ad W
ali K
arza
i
Valid 293 351 281 255 347 331 339 278 263 263 371 279 296 369 175 332 269 289 240 245 252 221 248 291 252 259 244 277 259 257 232 168 274 193 223 192 151 132 165 218 243 314 209 250 212 148 179 173 217 260 192 189 213 201 181 232 162 155 180 166 141 186 194Missing 275 217 287 313 221 237 229 290 305 305 197 289 272 199 393 236 299 279 328 323 316 347 320 277 316 309 324 291 309 311 336 400 294 375 345 376 417 436 403 350 325 254 359 318 356 420 389 395 351 308 376 379 355 367 387 336 406 413 388 402 427 382 374
5.35 5.63 3.48 3.58 5.90 4.16 5.54 2.03 1.68 2.18 5.81 3.11 3.60 4.59 2.31 5.15 2.13 2.16 2.65 2.55 2.33 3.05 4.54 5.05 3.29 3.22 2.87 3.37 3.15 4.27 3.96 3.05 3.94 3.75 2.96 2.54 1.89 2.64 3.33 3.28 3.58 5.02 3.78 4.04 4.46 2.85 3.69 3.60 3.70 3.96 2.98 3.28 3.14 4.27 3.08 4.42 3.37 2.32 2.48 1.96 2.11 2.23 2.84
2.71 2.71 2.73 3.37 2.76 2.90 2.78 2.19 2.12 2.58 2.96 2.51 3.01 2.64 2.32 3.35 2.17 2.36 2.59 2.27 2.19 2.83 3.10 3.60 2.99 2.57 2.63 3.07 2.91 2.94 3.07 2.49 2.59 2.48 2.60 2.12 1.89 2.80 2.79 2.56 2.71 2.83 2.69 2.85 3.31 2.72 2.95 3.00 2.97 3.03 2.57 2.57 2.58 3.26 2.84 3.50 2.82 2.34 2.23 2.02 2.29 2.10 2.31Valid 439 439 439 439 439 439 439 439 439 439 439 439 439 439 439 439 439 439 439 439 439 439 439 439 439 439 439 439 439 439 439 439 439 439 439 439 439 439 439 439 439 439 439 439 439 439 439 439 439 439 439 439 439 439 439 439 439 439 439 439 439 439 439Missing 129 129 129 129 129 129 129 129 129 129 129 129 129 129 129 129 129 129 129 129 129 129 129 129 129 129 129 129 129 129 129 129 129 129 129 129 129 129 129 129 129 129 129 129 129 129 129 129 129 129 129 129 129 129 129 129 129 129 129 129 129 129 129
5.40 5.78 3.72 3.95 5.92 4.23 5.54 2.43 2.24 2.81 5.85 3.54 3.93 4.70 2.91 5.27 2.45 2.51 3.28 3.18 2.78 3.59 4.93 5.03 3.96 3.80 3.39 3.77 3.82 4.52 4.36 3.52 4.41 4.31 3.69 3.21 3.05 3.99 3.75 3.96 4.30 5.21 4.49 4.49 4.99 3.74 4.40 4.07 4.50 4.35 3.50 4.06 3.72 4.77 3.99 4.76 4.24 3.42 3.09 2.76 3.46 2.88 3.22
2.64 2.67 2.58 3.12 2.70 2.77 2.70 2.20 2.17 2.56 2.88 2.49 2.90 2.62 2.24 3.20 2.16 2.30 2.56 2.29 2.06 2.59 3.01 3.20 2.85 2.66 2.52 2.90 2.89 2.77 2.97 2.33 2.64 2.50 2.63 2.11 2.10 2.83 2.61 2.55 2.66 2.75 2.62 2.72 2.89 2.48 2.73 2.68 2.89 2.96 2.48 2.58 2.47 2.92 2.78 3.09 2.67 2.42 2.15 2.16 2.44 2.12 2.30Valid 439 439 439 439 439 439 439 439 439 439 439 439 439 439 439 439 439 439 439 439 439 439 439 439 439 439 439 439 439 439 439 439 439 439 439 439 439 439 439 439 439 439 439 439 439 439 439 439 439 439 439 439 439 439 439 439 439 439 439 439 439 439 439Missing 129 129 129 129 129 129 129 129 129 129 129 129 129 129 129 129 129 129 129 129 129 129 129 129 129 129 129 129 129 129 129 129 129 129 129 129 129 129 129 129 129 129 129 129 129 129 129 129 129 129 129 129 129 129 129 129 129 129 129 129 129 129 129
5.46 5.73 3.88 3.87 6.02 4.26 5.46 2.52 2.29 2.93 5.82 3.57 4.16 4.67 2.94 5.26 2.59 2.60 3.44 3.17 3.04 3.82 4.91 5.05 3.94 3.81 3.42 3.86 3.72 4.44 4.26 3.87 4.35 4.49 3.30 3.29 2.87 3.78 4.59 3.93 4.13 5.26 4.34 4.47 5.09 3.81 4.56 4.35 4.36 4.45 3.76 4.28 3.99 4.84 4.01 4.93 4.28 3.99 3.33 3.01 3.48 3.04 3.30
2.71 2.65 2.64 3.11 2.70 2.82 2.72 2.22 2.21 2.66 2.88 2.49 2.98 2.59 2.33 3.14 2.16 2.47 2.65 2.36 2.34 2.77 2.94 3.28 2.85 2.66 2.58 2.97 2.79 2.71 2.82 2.45 2.50 2.58 2.48 2.26 2.12 2.76 2.75 2.54 2.70 2.67 2.55 2.69 2.87 2.55 2.89 2.72 2.79 2.84 2.57 2.60 2.56 2.93 2.74 3.12 2.65 2.81 2.30 2.28 2.52 2.12 2.34Valid 439 439 439 439 439 439 439 439 439 439 439 439 439 439 439 439 439 439 439 439 439 439 439 439 439 439 439 439 439 439 439 439 439 439 439 439 439 439 439 439 439 439 439 439 439 439 439 439 439 439 439 439 439 439 439 439 439 439 439 439 439 439 439Missing 129 129 129 129 129 129 129 129 129 129 129 129 129 129 129 129 129 129 129 129 129 129 129 129 129 129 129 129 129 129 129 129 129 129 129 129 129 129 129 129 129 129 129 129 129 129 129 129 129 129 129 129 129 129 129 129 129 129 129 129 129 129 129
5.40 5.62 3.85 3.93 5.90 4.22 5.44 2.40 2.17 2.75 5.70 3.74 3.84 4.67 2.93 5.31 2.54 2.59 3.19 3.15 2.94 3.74 4.88 5.00 3.88 3.84 3.44 3.69 3.63 4.48 4.22 3.93 4.48 4.28 3.41 3.18 2.85 3.86 4.21 3.76 4.09 5.24 4.50 4.51 4.96 3.73 4.48 4.01 4.35 4.23 3.78 4.02 3.69 4.51 3.86 4.65 4.35 3.25 3.26 2.98 3.48 3.01 3.402.63 2.66 2.65 3.11 2.71 2.83 2.72 2.13 2.13 2.50 2.92 2.54 2.81 2.61 2.31 3.15 2.12 2.36 2.52 2.33 2.24 2.72 2.88 3.22 2.81 2.65 2.53 2.87 2.76 2.72 2.84 2.60 2.60 2.45 2.53 2.10 2.29 2.79 2.62 2.57 2.62 2.71 2.68 2.67 2.86 2.64 2.82 2.79 2.84 2.90 2.61 2.56 2.36 2.94 2.82 3.03 2.67 2.32 2.24 2.21 2.51 2.18 2.42
Valid 439 439 439 439 439 439 439 439 439 439 439 439 439 439 439 439 439 439 439 439 439 439 439 439 439 439 439 439 439 439 439 439 439 439 439 439 439 439 439 439 439 439 439 439 439 439 439 439 439 439 439 439 439 439 439 439 439 439 439 439 439 439 439Missing 129 129 129 129 129 129 129 129 129 129 129 129 129 129 129 129 129 129 129 129 129 129 129 129 129 129 129 129 129 129 129 129 129 129 129 129 129 129 129 129 129 129 129 129 129 129 129 129 129 129 129 129 129 129 129 129 129 129 129 129 129 129 129
5.43 5.78 3.78 3.94 6.00 4.28 5.50 2.51 2.29 2.87 5.80 3.54 3.91 4.65 3.16 5.28 2.54 2.53 3.11 3.05 2.84 3.65 4.87 5.01 3.85 3.83 3.45 3.82 3.65 4.57 4.31 3.75 4.49 4.29 3.32 3.11 3.20 3.89 4.10 4.13 4.17 5.38 4.44 4.73 4.97 3.98 4.50 4.42 4.37 4.25 3.90 4.29 3.76 4.68 3.82 4.88 4.30 3.57 3.45 3.11 3.41 3.05 3.29
2.65 2.65 2.64 3.11 2.63 2.85 2.69 2.20 2.14 2.59 2.84 2.57 2.84 2.58 2.31 3.14 2.14 2.38 2.46 2.25 2.12 2.62 2.86 3.26 2.85 2.61 2.49 2.97 2.78 2.79 2.86 2.45 2.53 2.46 2.44 2.03 2.31 2.78 2.72 2.59 2.68 2.75 2.74 2.73 2.91 2.84 2.72 2.85 2.86 2.80 2.57 2.60 2.53 2.98 2.78 3.10 2.63 2.53 2.40 2.36 2.53 2.17 2.35Valid 439 439 439 439 439 439 439 439 439 439 439 439 439 439 439 439 439 439 439 439 439 439 439 439 439 439 439 439 439 439 439 439 439 439 439 439 439 439 439 439 439 439 439 439 439 439 439 439 439 439 439 439 439 439 439 439 439 439 439 439 439 439 439Missing 129 129 129 129 129 129 129 129 129 129 129 129 129 129 129 129 129 129 129 129 129 129 129 129 129 129 129 129 129 129 129 129 129 129 129 129 129 129 129 129 129 129 129 129 129 129 129 129 129 129 129 129 129 129 129 129 129 129 129 129 129 129 129
5.34 5.78 3.70 3.95 5.87 4.28 5.48 2.53 2.41 2.91 5.80 3.70 3.92 4.69 3.13 5.38 2.71 2.59 3.21 3.12 2.85 3.49 4.77 5.08 3.88 3.86 3.39 3.78 3.61 4.60 4.44 3.80 4.43 4.32 3.51 3.48 2.97 4.06 4.31 3.90 4.27 5.25 4.16 4.43 4.86 3.84 4.35 3.97 4.12 4.19 3.39 4.25 3.84 4.68 3.83 4.69 4.38 3.52 3.16 2.99 3.61 3.10 3.42
2.68 2.64 2.63 3.08 2.67 2.82 2.68 2.20 2.30 2.62 2.86 2.53 2.87 2.56 2.45 3.16 2.20 2.33 2.55 2.35 2.19 2.64 2.92 3.22 2.86 2.63 2.48 2.92 2.74 2.80 2.87 2.38 2.61 2.58 2.51 2.45 2.07 2.87 2.68 2.48 2.68 2.71 2.52 2.70 2.84 2.60 2.63 2.77 2.75 2.86 2.47 2.56 2.51 2.93 2.72 3.09 2.73 2.41 2.23 2.21 2.52 2.14 2.30Valid 439 439 439 439 439 439 439 439 439 439 439 439 439 439 439 439 439 439 439 439 439 439 439 439 439 439 439 439 439 439 439 439 439 439 439 439 439 439 439 439 439 439 439 439 439 439 439 439 439 439 439 439 439 439 439 439 439 439 439 439 439 439 439Missing 129 129 129 129 129 129 129 129 129 129 129 129 129 129 129 129 129 129 129 129 129 129 129 129 129 129 129 129 129 129 129 129 129 129 129 129 129 129 129 129 129 129 129 129 129 129 129 129 129 129 129 129 129 129 129 129 129 129 129 129 129 129 129
5.40 5.74 3.79 3.93 5.94 4.25 5.49 2.48 2.28 2.85 5.80 3.62 3.95 4.67 3.02 5.30 2.57 2.56 3.25 3.13 2.89 3.66 4.87 5.03 3.90 3.83 3.42 3.78 3.69 4.52 4.32 3.77 4.43 4.34 3.45 3.25 2.99 3.92 4.19 3.94 4.19 5.27 4.38 4.53 4.97 3.82 4.46 4.16 4.34 4.29 3.66 4.18 3.80 4.70 3.90 4.78 4.31 3.55 3.26 2.97 3.49 3.01 3.32
5 N
Mean
Std. D i tiPooled N
Mean
3 N
Mean
Std. D i ti4 N
Mean
Std. D i ti
1 N
Mean
Std. D i ti2 N
Mean
Std. D i ti
Imputation NumberOriginal data N
Mean
Std. D i ti

673
ANNEX – VXI: Factor Analysis Using Data about Actual Afghan Leaders. Rotated Factor Loadings:
Rotated Factor Matrixa,b
Factor
1 2 3 4 5 6 7 8 9 10 11 12 13 14 15 Ustad Atta 0.80 0.19 0.16 0.15 0.25 0.06 0.07 -0.03 0.08 0.00 0.03 0.15 0.02 0.03 -0.05 Dr Abdullah 0.73 0.22 0.13 0.12 0.15 0.07 0.15 -0.03 -0.01 0.10 0.14 -0.15 -0.01 0.03 -0.24 Younus Qanooni 0.67 0.28 0.28 0.21 0.10 -0.06 0.11 0.02 0.04 0.19 0.12 -0.05 0.05 0.07 -0.05 Ahmad Shah Masood 0.66 0.29 0.14 0.01 -0.01 0.08 0.08 0.11 0.09 0.13 0.09 -0.04 0.05 -0.02 0.07 Ismael Khan 0.66 0.14 0.07 0.24 0.16 0.12 0.09 0.11 0.32 0.04 0.18 0.06 -0.18 0.10 0.14 Amrullah Saleh 0.65 0.21 0.12 0.07 -0.02 0.07 0.04 -0.07 0.11 -0.02 0.07 0.35 0.08 0.09 0.00 Ustad Rabani 0.62 0.15 0.04 0.07 -0.07 0.22 0.29 0.31 0.12 0.13 0.15 -0.08 -0.08 -0.12 0.17 Syed Mustafa Kazimi 0.61 0.20 0.27 0.24 0.06 0.07 0.08 0.06 0.04 -0.16 0.07 0.22 0.08 0.03 0.16 Besmellah Khan 0.58 0.13 0.22 0.08 0.15 0.13 0.04 0.12 0.14 0.21 0.16 0.03 0.19 0.02 -0.03 Shekh Asif Mohseni 0.56 0.12 0.13 0.06 0.17 0.05 -0.05 0.15 -0.08 0.21 0.16 0.18 0.24 0.33 0.09 Baktash Seyawash 0.54 0.25 0.36 0.18 0.11 0.17 0.06 -0.12 0.16 0.10 -0.03 0.14 0.14 -0.06 -0.04 Ahmad Zia Masood 0.53 0.17 0.28 0.15 0.08 0.17 -0.08 0.11 0.11 -0.01 0.44 -0.02 -0.25 -0.08 -0.01 Habibullah Khan 0.52 0.22 -0.01 0.16 0.24 0.03 0.19 0.18 0.01 -0.10 -0.14 0.21 0.10 0.18 0.24 Ramazan Bashar Dost 0.49 0.14 0.42 0.14 0.00 0.15 0.11 0.14 0.05 0.13 -0.12 0.12 -0.06 -0.07 0.17 Lateef Pedram 0.48 0.12 0.36 0.27 -0.02 0.16 0.22 -0.04 0.06 0.10 -0.18 0.14 -0.09 0.11 -0.04 Banoo Ghazanfar 0.44 0.26 0.40 0.13 0.13 -0.02 0.06 0.04 -0.01 0.24 0.02 0.29 -0.01 -0.15 0.20 Ustad Sayaf 0.43 0.12 0.16 0.12 0.08 0.28 0.13 0.37 0.14 0.03 0.04 -0.11 0.04 0.42 0.04 Mirwais Nia 0.21 0.78 0.19 -0.04 0.14 0.06 0.05 0.19 0.18 -0.05 0.01 0.07 0.13 -0.06 -0.01 Ahmad Shah Baba 0.34 0.74 0.13 0.05 0.15 0.11 0.05 0.09 0.11 0.09 -0.05 0.08 0.11 -0.05 0.03 Zahir Khan 0.26 0.66 0.08 0.14 0.21 0.09 0.13 0.02 -0.02 0.04 0.14 -0.04 -0.12 -0.06 0.16 Amanullah Khan 0.33 0.62 0.24 -0.03 0.00 0.01 0.12 0.01 0.10 0.14 0.16 0.02 -0.01 0.19 -0.07 Dr Najib 0.38 0.49 0.25 0.14 0.04 -0.10 0.17 -0.10 0.06 0.19 -0.12 0.20 -0.07 0.12 -0.03 Abdul Rahman Khan 0.12 0.48 -0.07 -0.03 0.35 0.22 0.12 0.17 0.05 -0.12 0.05 0.09 -0.21 0.22 -0.02 Dawood Khan 0.30 0.48 0.04 0.09 0.01 -0.01 0.06 0.10 0.16 0.11 0.04 0.09 0.09 0.42 0.08 Hamid Karzai 0.21 0.47 0.09 0.19 0.36 0.05 0.10 0.11 0.11 0.35 0.12 -0.04 -0.02 0.10 0.06 Dr Spanta 0.11 0.26 0.10 0.23 -0.04 0.20 0.23 0.06 0.26 0.17 0.11 0.06 0.19 -0.03 -0.02 Shukria Barakzai 0.21 0.14 0.67 0.02 0.00 0.21 0.08 0.08 0.10 0.15 0.27 0.02 0.01 0.02 0.09 Malaly Joya 0.28 0.07 0.65 0.00 0.25 -0.01 0.09 -0.05 0.01 0.06 0.03 0.17 0.01 0.04 0.04 Fawzia Koofee 0.33 0.24 0.62 0.14 0.14 0.13 0.16 0.08 0.09 -0.11 0.00 0.19 0.29 -0.04 0.07 Habiba Sarabee 0.34 0.30 0.54 0.16 0.13 0.21 0.00 0.08 0.05 0.18 0.15 -0.10 0.20 0.09 0.02 Dr Seema Samar 0.14 0.09 0.48 0.32 0.11 0.01 0.13 0.02 0.23 0.07 0.05 0.02 -0.05 0.00 -0.06 Haji Qadeer 0.34 0.17 0.39 0.16 0.20 0.28 0.09 0.11 0.09 0.04 -0.01 0.02 0.09 0.15 -0.04 Sayed Ahmad Gelani 0.14 0.18 0.33 0.00 0.19 0.11 0.08 0.19 0.11 0.07 0.28 0.17 0.29 0.10 -0.13 Abdul Ali Mazari 0.16 -0.03 0.10 0.78 0.01 0.22 0.18 0.16 -0.01 0.03 0.10 0.07 -0.02 -0.01 0.07 Mohqeq 0.34 0.04 0.13 0.67 0.17 0.11 0.21 0.17 0.09 -0.01 -0.04 -0.02 0.10 0.11 -0.03 Karim Khalili 0.26 0.21 0.06 0.60 0.09 0.09 0.21 0.20 0.07 0.20 0.25 0.11 0.11 -0.13 0.03 Gen. Dostum 0.47 0.16 0.15 0.48 0.16 -0.07 0.37 0.13 -0.07 0.06 -0.10 0.16 -0.01 0.19 0.12 Sultan Ali Kishtmand 0.25 0.05 0.27 0.47 0.06 0.06 0.24 0.06 0.01 0.14 0.20 0.35 0.04 0.08 0.10 Mahmood Karzai 0.09 0.14 0.21 0.04 0.77 0.31 0.09 0.18 -0.01 0.09 0.03 0.09 0.03 -0.05 -0.06 Gul Agha Sherzai 0.28 0.15 0.19 0.18 0.59 0.15 0.04 0.16 0.27 -0.05 0.00 0.05 0.01 0.04 0.14 Ahmad Wali Karzai -0.03 0.17 0.14 0.02 0.53 0.25 0.10 0.04 0.10 0.08 0.22 -0.05 0.10 0.12 0.15

674
Farooq Wardak 0.28 0.34 0.24 0.06 0.50 0.29 0.00 0.11 0.07 0.20 0.08 -0.03 -0.05 0.00 -0.14 Qayoom Karzai 0.20 0.12 -0.05 0.11 0.45 0.11 0.28 0.29 0.17 0.09 -0.04 0.23 0.05 -0.09 0.01 Gen. Rahim Wardak 0.28 0.27 0.29 0.19 0.34 0.30 0.00 0.17 0.07 0.06 0.04 0.12 -0.05 0.03 -0.10 Omar Dawoodzai 0.11 0.12 0.21 0.16 0.25 0.75 0.05 0.14 -0.04 -0.07 0.06 0.06 0.11 -0.01 -0.06 Karim Khuram 0.11 -0.04 0.02 0.05 0.26 0.66 0.03 0.06 0.25 0.14 0.14 0.04 0.02 -0.04 0.11 Omar Zakhilwal 0.08 0.16 0.13 0.17 0.29 0.61 0.17 0.15 0.15 0.27 -0.04 -0.13 -0.09 0.16 0.11 Haneef Atmar 0.19 0.26 0.22 0.21 0.24 0.38 0.16 0.07 0.21 0.30 0.07 0.12 -0.15 0.08 0.17 Hafeezullah Amin 0.11 0.14 0.07 0.21 0.07 0.09 0.80 0.23 0.12 0.08 -0.03 0.05 0.11 -0.18 0.06 Tarakee 0.15 0.13 0.10 0.19 0.11 0.12 0.75 0.06 0.01 0.12 0.10 0.05 -0.13 0.16 0.02 Babrak Karmal 0.20 0.09 0.29 0.31 0.13 -0.03 0.63 0.06 0.11 -0.11 0.18 0.10 0.13 0.11 -0.07 Hekmatyar 0.06 0.13 0.00 0.15 0.18 0.10 0.08 0.76 0.14 0.05 0.14 0.09 -0.10 0.04 -0.06 Mullah Omar 0.01 0.10 0.07 0.22 0.20 0.13 0.18 0.63 0.01 0.06 0.01 0.02 0.11 0.06 0.04 Sebghatullah Mujadadi 0.30 0.24 0.22 0.27 0.08 0.20 0.15 0.30 0.05 0.23 0.20 -0.20 -0.03 -0.04 0.18 Ali Ahmad Jalali 0.19 0.18 0.14 -0.05 0.15 0.15 0.12 0.11 0.69 0.01 0.08 0.02 -0.06 0.08 0.03 Ashraf Ghani Ahmadzai 0.13 0.40 0.17 0.17 0.16 0.13 0.02 0.13 0.57 0.27 0.01 -0.04 0.13 -0.03 0.05 Anwarul Haq Ahadi 0.31 0.27 0.18 0.16 0.18 0.21 0.13 0.08 0.17 0.65 0.07 0.02 0.09 0.04 -0.03 Ismael Yoon 0.18 0.01 0.36 0.02 0.07 0.34 0.04 0.26 -0.01 0.44 -0.03 0.21 -0.04 0.04 -0.07 Marshal Fahim 0.34 0.06 0.17 0.25 0.15 0.12 0.18 0.18 0.07 0.07 0.67 0.11 0.04 0.04 0.09 Zalmay Khalilzad 0.10 0.29 0.20 0.11 0.14 0.14 0.23 -0.03 0.28 -0.05 0.33 0.14 0.12 0.07 -0.03 Tahir Badakhshi 0.26 0.11 0.26 0.17 0.12 0.03 0.16 0.12 0.02 0.05 0.09 0.71 0.06 0.01 -0.03 Ahmad Behzad 0.56 0.02 0.25 0.22 0.06 0.05 0.06 -0.07 -0.02 0.03 0.01 0.11 0.56 0.09 0.04 Semeen Barakzai 0.20 0.16 0.48 0.24 0.16 0.28 0.06 -0.09 0.19 -0.03 0.18 -0.06 0.01 0.12 0.55 Extraction Method: Principal Axis Factoring. Rotation Method: Varimax with Kaiser Normalization.
a. Imputation Number = 5 b. Rotation Converged in 13 iterations.

675
Total Variance Explained:
Factor Initial Eigenvalues Extraction Sums of Squared
Loadings Rotation Sums of Squared Loadings
Total % of Variance
Cumulative % Total % of
Variance Cumulative
% Total % of Variance
Cumulative %
1 22.813 36.211 36.211 22.496 35.709 35.709 8.89 14.111 14.111 2 3.791 6.018 42.228 3.476 5.517 41.226 4.848 7.696 21.807 3 3.057 4.853 47.081 2.779 4.411 45.637 4.482 7.114 28.92 4 2.47 3.921 51.002 2.156 3.423 49.06 3.376 5.358 34.279 5 2.02 3.206 54.209 1.717 2.726 51.785 3.207 5.091 39.369 6 1.865 2.96 57.168 1.545 2.452 54.237 2.974 4.72 44.09 7 1.532 2.432 59.601 1.199 1.902 56.14 2.757 4.377 48.466 8 1.473 2.337 61.938 1.151 1.827 57.967 2.199 3.491 51.957 9 1.299 2.062 64 0.973 1.544 59.511 1.755 2.785 54.742
10 1.274 2.022 66.022 0.97 1.539 61.051 1.731 2.748 57.491 11 1.219 1.934 67.956 0.913 1.449 62.5 1.624 2.578 60.069 12 1.191 1.89 69.847 0.883 1.402 63.902 1.591 2.525 62.593 13 1.113 1.766 71.613 0.798 1.266 65.168 1.13 1.794 64.387 14 1.079 1.713 73.325 0.745 1.182 66.35 0.994 1.578 65.965 15 1.009 1.602 74.927 0.665 1.056 67.406 0.908 1.441 67.406 16 0.939 1.49 76.418 17 0.859 1.364 77.781 18 0.826 1.312 79.093 19 0.762 1.209 80.302 20 0.743 1.18 81.482 21 0.695 1.103 82.585 22 0.661 1.049 83.635 23 0.642 1.02 84.654 24 0.587 0.932 85.586 25 0.57 0.904 86.491 26 0.531 0.843 87.334 27 0.461 0.732 88.067 28 0.449 0.712 88.779 29 0.434 0.688 89.467 30 0.415 0.659 90.126 31 0.404 0.641 90.767 32 0.383 0.607 91.375 33 0.366 0.581 91.955 34 0.347 0.551 92.506 35 0.331 0.525 93.032 36 0.318 0.505 93.537 37 0.304 0.483 94.02 38 0.299 0.475 94.495 39 0.287 0.455 94.95 40 0.261 0.415 95.365 41 0.243 0.386 95.751 42 0.229 0.364 96.114 43 0.22 0.349 96.464

676
44 0.204 0.324 96.788 45 0.201 0.319 97.107 46 0.176 0.279 97.386 47 0.171 0.271 97.657 48 0.168 0.267 97.924 49 0.153 0.242 98.167 50 0.139 0.221 98.388 51 0.133 0.212 98.6 52 0.124 0.196 98.796 53 0.12 0.19 98.986 54 0.106 0.168 99.154 55 0.091 0.145 99.3 56 0.082 0.13 99.429 57 0.075 0.119 99.548 58 0.061 0.096 99.644 59 0.057 0.091 99.735 60 0.05 0.079 99.814 61 0.045 0.072 99.886 62 0.039 0.062 99.948 63 0.033 0.052 100
Extraction Method: Principal Axis Factoring. a. Imputation Number = 5 Factor Correlation:
Factor Transformation Matrixa Factor 1 2 3 4 5 6 7 8 9 10 11 12 13 14 15
1 0.565 0.371 0.367 0.288 0.27 0.243 0.227 0.183 0.173 0.164 0.142 0.128 0.065 0.081 0.065 2 -0.579 0.03 -0.121 0.014 0.435 0.488 0.101 0.348 0.182 0.115 0.077 -0.16 -0.111 -0.017 0.022 3 -0.056 -0.553 -0.047 0.59 -0.144 -0.038 0.476 0.183 -0.143 -0.083 0.031 0.154 0.04 -0.025 0.064 4 0.038 0.502 -0.608 0.061 -0.056 -0.361 0.373 0.226 0.061 -0.043 -0.125 -0.042 -0.137 0.075 -0.043 5 -0.501 0.313 0.446 -0.018 0.063 -0.254 0.331 -0.239 0.026 -0.082 -0.154 0.362 0.22 -0.063 -0.046 6 0.163 -0.14 -0.184 -0.122 0.571 -0.007 -0.152 0.155 -0.3 -0.319 -0.319 0.431 0.15 0.115 -0.127 7 -0.027 -0.008 -0.019 -0.084 0.076 -0.172 -0.04 0.077 0.249 -0.61 0.698 0.043 0.109 0.063 0.097 8 -0.079 0 0.067 -0.151 -0.173 -0.22 -0.156 0.564 -0.196 0.42 0.307 0.206 0.279 -0.065 -0.335 9 0.093 -0.182 -0.011 -0.351 -0.307 0.204 0.198 0.219 0.508 -0.115 -0.339 0.017 0.422 0.216 0.005
10 0.13 -0.175 0.051 -0.432 -0.04 0.039 0.27 0.056 0.142 0.048 0.069 0.409 -0.608 -0.346 -0.011 11 -0.118 0.147 -0.001 0.33 -0.218 -0.029 -0.517 0.274 0.264 -0.086 -0.219 0.361 -0.125 -0.181 0.402 12 -0.041 0.137 0.375 -0.175 -0.218 0.062 0.085 0.407 -0.47 -0.326 -0.128 -0.235 -0.261 0.263 0.218 13 -0.109 -0.096 -0.076 -0.063 0.009 -0.075 -0.025 -0.148 0.032 0.33 0.157 0.309 -0.176 0.777 0.276 14 -0.031 0.266 -0.282 -0.019 -0.362 0.602 0.058 -0.203 -0.337 -0.101 0.195 0.342 0.171 -0.054 -0.005 15 -0.055 0.043 0.112 0.257 -0.162 0.117 -0.153 -0.013 0.194 -0.215 -0.059 0.071 -0.333 0.293 -0.751
Extraction Method: Principal Axis Factoring. Rotation Method: Varimax with Kaiser Normalization.a a. Imputation Number = 5

677

678
KMO and Bartlett's Testa
Kaiser-Meyer-Olkin Measure of Sampling Adequacy. 0.86
Bartlett's Test of Sphericity
Approx. Chi-Square 24888.71
df 1953
Sig. 0
a. Imputation Number = 5

679
Frequencies
Ust
ad A
tta
Dr A
bdul
lah
You
nus
Qan
ooni
Ahm
ad S
hah
Mas
ood
Ism
ael K
han
Amru
llah
Sal
eh
Ust
ad R
aban
i
Sye
d M
usta
fa K
azim
i
Bes
mel
lah
Kha
n
She
kh A
sif M
ohse
ni
Bak
tash
Sey
awas
h
Ahm
ad Z
ia M
asoo
d
Hab
ibul
lah
Kha
n
Ram
azan
Bas
har D
ost
Late
ef P
edra
m
Ban
oo G
haza
nfar
Ust
ad S
ayaf
Gen
. Dos
tum
Ahm
ad B
ehza
d
N Valid 291 260 257 332 252 248 296 201 189 232 232 221 255 314 181 173 259 277 162 Missing 277 308 311 236 316 320 272 367 379 336 336 347 313 254 387 395 309 291 406Mean 5.048 3.958 4.272 5.148 3.29 4.536 3.598 4.269 3.28 3.957 4.422 3.05 3.576 5.019 3.083 3.595 3.151 3.372 3.37Median 5 4 4 5 3 5 3 4 3 4 4 3 3 5 2 3 3 3 3Mode 10 0 5 5 0 5 0 5 5 5 10 0 0 5 0 .0a 0 0 0Std. Deviation 3.6033 3.0279 2.9428 3.3451 2.9859 3.0987 3.0091 3.2646 2.5684 3.0731 3.5005 2.8304 3.3709 2.8329 2.8439 3.0036 2.9116 3.0708 2.817Skewness 0.098 0.46 0.476 0.081 0.673 0.264 0.638 0.442 0.631 0.494 0.425 1.018 0.66 0.3 0.793 0.651 0.772 0.646 0.7Std. Error of Skewness 0.143 0.151 0.152 0.134 0.153 0.155 0.142 0.172 0.177 0.16 0.16 0.164 0.153 0.138 0.181 0.185 0.151 0.146 0.191Kurtosis -1.379 -0.702 -0.621 -1.14 -0.524 -0.922 -0.5 -0.86 -0.091 -0.633 -1.136 0.405 -0.791 -0.532 -0.17 -0.494 -0.208 -0.573 -0.161Std. Error of Kurtosis 0.285 0.301 0.303 0.267 0.306 0.308 0.282 0.341 0.352 0.318 0.318 0.326 0.304 0.274 0.359 0.367 0.302 0.292 0.379Minimum 0 0 0 0 0 0 0 0 0 0 0 0 0 0 0 0 0 0 0Maximum 10 10 10 10 10 10 10 10 10 10 10 10 10 10 10 10 10 10 10a. Multiple modes exist. The smallest value is shown
Frequency Table
Ustad Atta
Frequency Percent Valid Percent Cumulative
Percent Valid .0 43 7.6 14.8 14.8
1.0 20 3.5 6.9 21.6 2.0 23 4.0 7.9 29.6 3.0 31 5.5 10.7 40.2 4.0 19 3.3 6.5 46.7 5.0 38 6.7 13.1 59.8 6.0 9 1.6 3.1 62.9 7.0 13 2.3 4.5 67.4 8.0 22 3.9 7.6 74.9

680
9.0 7 1.2 2.4 77.3 10.0 66 11.6 22.7 100.0 Total 291 51.2 100.0
Missing System 277 48.8 Total 568 100.0
Dr Abdullah
Frequency Percent Valid Percent Cumulative
Percent Valid .0 45 7.9 17.3 17.3
1.0 20 3.5 7.7 25.0 2.0 26 4.6 10.0 35.0 3.0 35 6.2 13.5 48.5 4.0 27 4.8 10.4 58.8 5.0 42 7.4 16.2 75.0 6.0 11 1.9 4.2 79.2 7.0 11 1.9 4.2 83.5 8.0 16 2.8 6.2 89.6 9.0 7 1.2 2.7 92.3 10.0 20 3.5 7.7 100.0 Total 260 45.8 100.0
Missing System 308 54.2 Total 568 100.0
Younus Qanooni
Frequency Percent Valid Percent Cumulative
Percent Valid .0 25 4.4 9.7 9.7
1.0 26 4.6 10.1 19.8 2.0 26 4.6 10.1 30.0 3.0 38 6.7 14.8 44.7 4.0 28 4.9 10.9 55.6 5.0 45 7.9 17.5 73.2 6.0 16 2.8 6.2 79.4

681
7.0 6 1.1 2.3 81.7 8.0 17 3.0 6.6 88.3 9.0 5 .9 1.9 90.3 10.0 25 4.4 9.7 100.0 Total 257 45.2 100.0
Missing System 311 54.8 Total 568 100.0

682
Ahmad Shah Masood
Frequency Percent Valid Percent Cumulative
Percent Valid .0 41 7.2 12.3 12.3
1.0 14 2.5 4.2 16.6 2.0 26 4.6 7.8 24.4 3.0 32 5.6 9.6 34.0 4.0 22 3.9 6.6 40.7 5.0 75 13.2 22.6 63.3 6.0 10 1.8 3.0 66.3 7.0 16 2.8 4.8 71.1 8.0 18 3.2 5.4 76.5 9.0 12 2.1 3.6 80.1 10.0 66 11.6 19.9 100.0 Total 332 58.5 100.0
Missing System 236 41.5 Total 568 100.0
Ismael Khan
Frequency Percent Valid Percent Cumulative
Percent Valid .0 63 11.1 25.0 25.0
1.0 27 4.8 10.7 35.7 2.0 30 5.3 11.9 47.6 3.0 27 4.8 10.7 58.3 4.0 21 3.7 8.3 66.7 5.0 29 5.1 11.5 78.2 6.0 12 2.1 4.8 82.9 7.0 15 2.6 6.0 88.9 8.0 11 1.9 4.4 93.3 9.0 3 .5 1.2 94.4 10.0 14 2.5 5.6 100.0 Total 252 44.4 100.0
Missing System 316 55.6 Total 568 100.0

683
Amrullah Saleh
Frequency Percent Valid Percent Cumulative
Percent Valid .0 30 5.3 12.1 12.1
1.0 19 3.3 7.7 19.8 2.0 24 4.2 9.7 29.4 3.0 29 5.1 11.7 41.1 4.0 16 2.8 6.5 47.6 5.0 53 9.3 21.4 69.0 6.0 12 2.1 4.8 73.8 7.0 11 1.9 4.4 78.2 8.0 20 3.5 8.1 86.3 9.0 7 1.2 2.8 89.1 10.0 27 4.8 10.9 100.0 Total 248 43.7 100.0
Missing System 320 56.3 Total 568 100.0
Ustad Rabani
Frequency Percent Valid Percent Cumulative
Percent Valid .0 57 10.0 19.3 19.3
1.0 35 6.2 11.8 31.1 2.0 32 5.6 10.8 41.9 3.0 32 5.6 10.8 52.7 4.0 35 6.2 11.8 64.5 5.0 43 7.6 14.5 79.1 6.0 12 2.1 4.1 83.1 7.0 6 1.1 2.0 85.1 8.0 16 2.8 5.4 90.5 9.0 7 1.2 2.4 92.9 10.0 21 3.7 7.1 100.0 Total 296 52.1 100.0
Missing System 272 47.9 Total 568 100.0
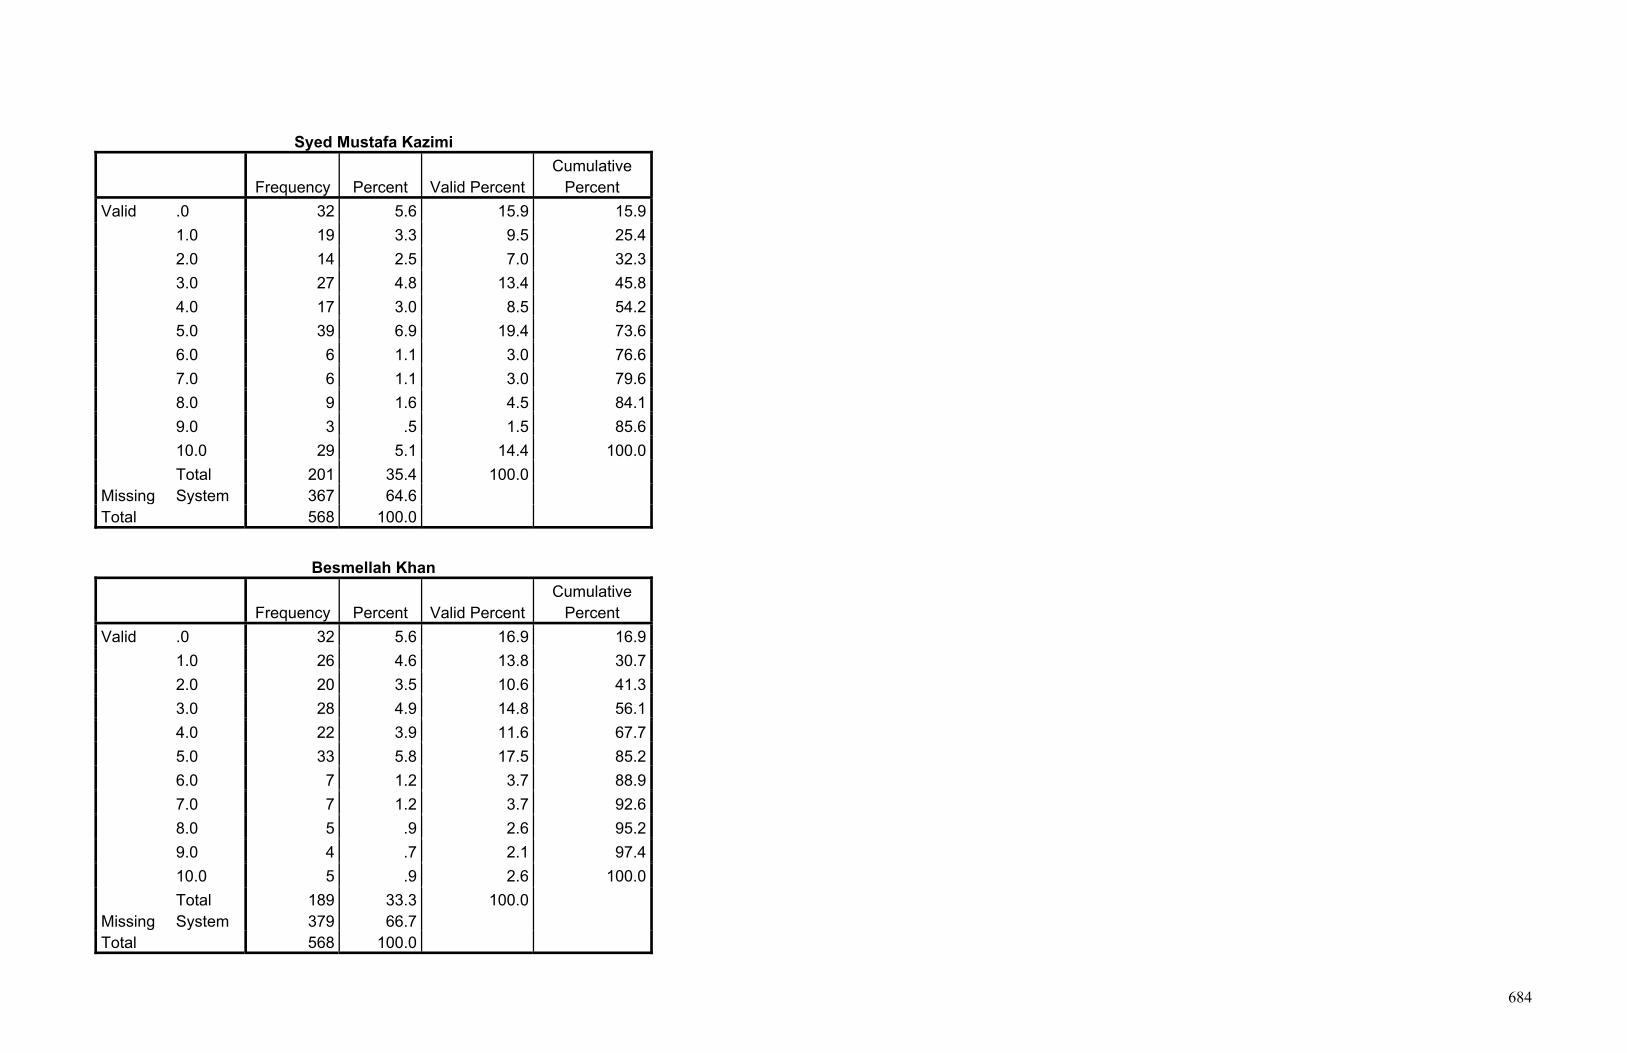
684
Syed Mustafa Kazimi
Frequency Percent Valid Percent Cumulative
Percent Valid .0 32 5.6 15.9 15.9
1.0 19 3.3 9.5 25.4 2.0 14 2.5 7.0 32.3 3.0 27 4.8 13.4 45.8 4.0 17 3.0 8.5 54.2 5.0 39 6.9 19.4 73.6 6.0 6 1.1 3.0 76.6 7.0 6 1.1 3.0 79.6 8.0 9 1.6 4.5 84.1 9.0 3 .5 1.5 85.6 10.0 29 5.1 14.4 100.0 Total 201 35.4 100.0
Missing System 367 64.6 Total 568 100.0
Besmellah Khan
Frequency Percent Valid Percent Cumulative
Percent Valid .0 32 5.6 16.9 16.9
1.0 26 4.6 13.8 30.7 2.0 20 3.5 10.6 41.3 3.0 28 4.9 14.8 56.1 4.0 22 3.9 11.6 67.7 5.0 33 5.8 17.5 85.2 6.0 7 1.2 3.7 88.9 7.0 7 1.2 3.7 92.6 8.0 5 .9 2.6 95.2 9.0 4 .7 2.1 97.4 10.0 5 .9 2.6 100.0 Total 189 33.3 100.0
Missing System 379 66.7 Total 568 100.0

685
Shekh Asif Mohseni
Frequency Percent Valid Percent Cumulative
Percent Valid .0 38 6.7 16.4 16.4
1.0 28 4.9 12.1 28.4 2.0 19 3.3 8.2 36.6 3.0 22 3.9 9.5 46.1 4.0 20 3.5 8.6 54.7 5.0 52 9.2 22.4 77.2 6.0 12 2.1 5.2 82.3 7.0 4 .7 1.7 84.1 8.0 10 1.8 4.3 88.4 9.0 4 .7 1.7 90.1 10.0 23 4.0 9.9 100.0 Total 232 40.8 100.0
Missing System 336 59.2 Total 568 100.0
Baktash Seyawash
Frequency Percent Valid Percent Cumulative
Percent Valid .0 36 6.3 15.5 15.5
1.0 22 3.9 9.5 25.0 2.0 29 5.1 12.5 37.5 3.0 21 3.7 9.1 46.6 4.0 21 3.7 9.1 55.6 5.0 34 6.0 14.7 70.3 6.0 5 .9 2.2 72.4 7.0 7 1.2 3.0 75.4 8.0 6 1.1 2.6 78.0 9.0 8 1.4 3.4 81.5 10.0 43 7.6 18.5 100.0 Total 232 40.8 100.0
Missing System 336 59.2 Total 568 100.0

686
Ahmad Zia Masood
Frequency Percent Valid Percent Cumulative
Percent Valid .0 47 8.3 21.3 21.3
1.0 35 6.2 15.8 37.1 2.0 26 4.6 11.8 48.9 3.0 33 5.8 14.9 63.8 4.0 26 4.6 11.8 75.6 5.0 20 3.5 9.0 84.6 6.0 7 1.2 3.2 87.8 7.0 6 1.1 2.7 90.5 8.0 5 .9 2.3 92.8 10.0 16 2.8 7.2 100.0 Total 221 38.9 100.0
Missing System 347 61.1 Total 568 100.0
Habibullah Khan
Frequency Percent Valid Percent Cumulative
Percent Valid .0 65 11.4 25.5 25.5
1.0 31 5.5 12.2 37.6 2.0 28 4.9 11.0 48.6 3.0 18 3.2 7.1 55.7 4.0 15 2.6 5.9 61.6 5.0 38 6.7 14.9 76.5 6.0 5 .9 2.0 78.4 7.0 13 2.3 5.1 83.5 8.0 8 1.4 3.1 86.7 9.0 4 .7 1.6 88.2 10.0 30 5.3 11.8 100.0 Total 255 44.9 100.0
Missing System 313 55.1 Total 568 100.0

687
Ramazan Bashar Dost
Frequency Percent Valid Percent Cumulative
Percent Valid .0 21 3.7 6.7 6.7
1.0 12 2.1 3.8 10.5 2.0 23 4.0 7.3 17.8 3.0 28 4.9 8.9 26.8 4.0 47 8.3 15.0 41.7 5.0 97 17.1 30.9 72.6 6.0 6 1.1 1.9 74.5 7.0 10 1.8 3.2 77.7 8.0 19 3.3 6.1 83.8 9.0 7 1.2 2.2 86.0 10.0 44 7.7 14.0 100.0 Total 314 55.3 100.0
Missing System 254 44.7 Total 568 100.0
Lateef Pedram
Frequency Percent Valid Percent Cumulative
Percent Valid .0 44 7.7 24.3 24.3
1.0 24 4.2 13.3 37.6 2.0 24 4.2 13.3 50.8 3.0 17 3.0 9.4 60.2 4.0 16 2.8 8.8 69.1 5.0 25 4.4 13.8 82.9 6.0 5 .9 2.8 85.6 7.0 12 2.1 6.6 92.3 8.0 3 .5 1.7 93.9 9.0 2 .4 1.1 95.0 10.0 9 1.6 5.0 100.0 Total 181 31.9 100.0
Missing System 387 68.1 Total 568 100.0

688
Banoo Ghazanfar
Frequency Percent Valid Percent Cumulative
Percent Valid .0 29 5.1 16.8 16.8
1.0 29 5.1 16.8 33.5 2.0 16 2.8 9.2 42.8 3.0 20 3.5 11.6 54.3 4.0 12 2.1 6.9 61.3 5.0 29 5.1 16.8 78.0 6.0 11 1.9 6.4 84.4 7.0 3 .5 1.7 86.1 8.0 8 1.4 4.6 90.8 9.0 3 .5 1.7 92.5 10.0 13 2.3 7.5 100.0 Total 173 30.5 100.0
Missing System 395 69.5 Total 568 100.0
Ustad Sayaf
Frequency Percent Valid Percent Cumulative
Percent Valid .0 66 11.6 25.5 25.5
1.0 33 5.8 12.7 38.2 2.0 24 4.2 9.3 47.5 3.0 28 4.9 10.8 58.3 4.0 27 4.8 10.4 68.7 5.0 37 6.5 14.3 83.0 6.0 9 1.6 3.5 86.5 7.0 9 1.6 3.5 90.0 8.0 8 1.4 3.1 93.1 9.0 3 .5 1.2 94.2 10.0 15 2.6 5.8 100.0 Total 259 45.6 100.0
Missing System 309 54.4 Total 568 100.0

689
Gen. Dostum
Frequency Percent Valid Percent Cumulative
Percent Valid .0 74 13.0 26.7 26.7
1.0 26 4.6 9.4 36.1 2.0 22 3.9 7.9 44.0 3.0 35 6.2 12.6 56.7 4.0 24 4.2 8.7 65.3 5.0 40 7.0 14.4 79.8 6.0 7 1.2 2.5 82.3 7.0 11 1.9 4.0 86.3 8.0 16 2.8 5.8 92.1 9.0 4 .7 1.4 93.5 10.0 18 3.2 6.5 100.0 Total 277 48.8 100.0
Missing System 291 51.2 Total 568 100.0
Ahmad Behzad
Frequency Percent Valid Percent Cumulative
Percent Valid 0 34 6.0 21.0 21.0
1 14 2.5 8.6 29.6 2 22 3.9 13.6 43.2 3 20 3.5 12.3 55.6 4 18 3.2 11.1 66.7 5 27 4.8 16.7 83.3 6 7 1.2 4.3 87.7 7 1 .2 .6 88.3 8 7 1.2 4.3 92.6 9 4 .7 2.5 95.1 10 8 1.4 4.9 100.0 Total 162 28.5 100.0
Missing System 406 71.5 Total 568 100.0

690
Pie Chart

691

692

693

694

695

696

697

698

699

700

701

702

703

704

705

706

707

708

709
Crosstabs Case Processing Summary
Cases
Valid Missing Total
N Percent N Percent N Percent
Ethnicity * Ustad Atta 291 51.2% 277 48.8% 568 100.0%
Ethnicity * Dr Abdullah 260 45.8% 308 54.2% 568 100.0%
Ethnicity * Younus Qanooni 257 45.2% 311 54.8% 568 100.0%
Ethnicity * Ahmad Shah Masood 332 58.5% 236 41.5% 568 100.0%
Ethnicity * Ismael Khan 252 44.4% 316 55.6% 568 100.0%
Ethnicity * Amrullah Saleh 248 43.7% 320 56.3% 568 100.0%
Ethnicity * Ustad Rabani 296 52.1% 272 47.9% 568 100.0%
Ethnicity * Syed Mustafa Kazimi 201 35.4% 367 64.6% 568 100.0%
Ethnicity * Besmellah Khan 189 33.3% 379 66.7% 568 100.0%
Ethnicity * Shekh Asif Mohseni 232 40.8% 336 59.2% 568 100.0%
Ethnicity * Baktash Seyawash 232 40.8% 336 59.2% 568 100.0%
Ethnicity * Ahmad Zia Masood 221 38.9% 347 61.1% 568 100.0%
Ethnicity * Habibullah Khan 255 44.9% 313 55.1% 568 100.0%
Ethnicity * Ramazan Bashar Dost 314 55.3% 254 44.7% 568 100.0%
Ethnicity * Lateef Pedram 181 31.9% 387 68.1% 568 100.0%
Ethnicity * Banoo Ghazanfar 173 30.5% 395 69.5% 568 100.0%
Ethnicity * Ustad Sayaf 259 45.6% 309 54.4% 568 100.0%

710
Ethnicity * Gen. Dostum 277 48.8% 291 51.2% 568 100.0%
Ethnicity * Ahmad Behzad 162 28.5% 406 71.5% 568 100.0%
Ethnicity * Ustad Atta
Crosstab
Ustad Atta
Total .0 1.0 2.0 3.0 4.0 5.0 6.0 7.0 8.0 9.0 10.0 Ethnicity Pashtun Count 38 6 11 14 9 12 1 4 1 2 13 111
Expected Count 16.4 7.6 8.8 11.8 7.2 14.5 3.4 5.0 8.4 2.7 25.2 111.0Tajik Count 1 5 6 9 6 19 4 4 16 5 48 123
Expected Count 18.2 8.5 9.7 13.1 8.0 16.1 3.8 5.5 9.3 3.0 27.9 123.0Hazara Count 3 8 4 5 3 4 0 3 0 0 1 31
Expected Count 4.6 2.1 2.5 3.3 2.0 4.0 1.0 1.4 2.3 .7 7.0 31.0Uzbek Count 0 1 0 1 1 0 4 1 4 0 3 15
Expected Count 2.2 1.0 1.2 1.6 1.0 2.0 .5 .7 1.1 .4 3.4 15.0Other Count 1 0 2 2 0 3 0 1 1 0 1 11
Expected Count 1.6 .8 .9 1.2 .7 1.4 .3 .5 .8 .3 2.5 11.0Total Count 43 20 23 31 19 38 9 13 22 7 66 291
Expected Count 43.0 20.0 23.0 31.0 19.0 38.0 9.0 13.0 22.0 7.0 66.0 291.0
Chi-Square Tests
Value df Asymp. Sig.
(2-sided) Pearson Chi-Square 165.655a 40 .000 Likelihood Ratio 160.103 40 .000 Linear-by-Linear Association 7.936 1 .005
N of Valid Cases 291 a. 37 cells (67.3%) have expected count less than 5. The minimum expected count is .26.

711
Symmetric Measures
Value Approx.
Sig. Nominal by Nominal
Phi .754 .000 Cramer's V .377 .000
N of Valid Cases 291

712
Ethnicity * Dr Abdullah Crosstab
Dr Abdullah
Total .0 1.0 2.0 3.0 4.0 5.0 6.0 7.0 8.0 9.0 10.0 Ethnicity Pashtun Count 34 12 7 20 11 25 1 1 3 1 2 117
Expected Count 20.3 9.0 11.7 15.8 12.2 18.9 5.0 5.0 7.2 3.2 9.0 117.0Tajik Count 7 4 7 8 9 12 7 8 11 4 16 93
Expected Count 16.1 7.2 9.3 12.5 9.7 15.0 3.9 3.9 5.7 2.5 7.2 93.0Hazara Count 3 2 12 4 5 4 0 0 0 1 0 31
Expected Count 5.4 2.4 3.1 4.2 3.2 5.0 1.3 1.3 1.9 .8 2.4 31.0Uzbek Count 0 1 0 1 1 0 3 1 1 1 2 11
Expected Count 1.9 .8 1.1 1.5 1.1 1.8 .5 .5 .7 .3 .8 11.0Other Count 1 1 0 2 1 1 0 1 1 0 0 8
Expected Count 1.4 .6 .8 1.1 .8 1.3 .3 .3 .5 .2 .6 8.0Total Count 45 20 26 35 27 42 11 11 16 7 20 260
Expected Count 45.0 20.0 26.0 35.0 27.0 42.0 11.0 11.0 16.0 7.0 20.0 260.0
Chi-Square Tests
Value df Asymp. Sig.
(2-sided) Pearson Chi-Square 126.412a 40 .000 Likelihood Ratio 121.338 40 .000 Linear-by-Linear Association 10.468 1 .001
N of Valid Cases 260 a. 37 cells (67.3%) have expected count less than 5. The minimum expected count is .22.
Symmetric Measures
Value Approx.
Sig. Nominal by Nominal
Phi .697 .000 Cramer's V .349 .000
N of Valid Cases 260

713

714
Ethnicity * Younus Qanooni Crosstab
Younus Qanooni
Total .0 1.0 2.0 3.0 4.0 5.0 6.0 7.0 8.0 9.0 10.0 Ethnicity Pashtun Count 20 13 12 18 12 19 5 0 4 0 3 106
Expected Count 10.3 10.7 10.7 15.7 11.5 18.6 6.6 2.5 7.0 2.1 10.3 106.0Tajik Count 3 5 11 5 11 17 9 3 11 4 20 99
Expected Count 9.6 10.0 10.0 14.6 10.8 17.3 6.2 2.3 6.5 1.9 9.6 99.0Hazara Count 1 7 2 10 5 6 0 0 0 0 1 32
Expected Count 3.1 3.2 3.2 4.7 3.5 5.6 2.0 .7 2.1 .6 3.1 32.0Uzbek Count 0 0 0 3 0 1 2 2 2 0 1 11
Expected Count 1.1 1.1 1.1 1.6 1.2 1.9 .7 .3 .7 .2 1.1 11.0Other Count 1 1 1 2 0 2 0 1 0 1 0 9
Expected Count .9 .9 .9 1.3 1.0 1.6 .6 .2 .6 .2 .9 9.0Total Count 25 26 26 38 28 45 16 6 17 5 25 257
Expected Count 25.0 26.0 26.0 38.0 28.0 45.0 16.0 6.0 17.0 5.0 25.0 257.0
Chi-Square Tests
Value df Asymp. Sig.
(2-sided) Pearson Chi-Square 105.979a 40 .000 Likelihood Ratio 110.656 40 .000 Linear-by-Linear Association
6.256 1 .012
N of Valid Cases 257 a. 36 cells (65.5%) have expected count less than 5. The minimum expected count is .18.
Symmetric Measures
Value Approx.
Sig. Nominal by Nominal
Phi .642 .000 Cramer's V .321 .000
N of Valid Cases 257

715

716
Ethnicity * Ahmad Shah Masood Crosstab
Ahmad Shah Masood
Total .0 1.0 2.0 3.0 4.0 5.0 6.0 7.0 8.0 9.0 10.0 Ethnicity Pashtun Count 25 3 15 16 14 42 2 5 3 2 10 137
Expected Count 16.9 5.8 10.7 13.2 9.1 30.9 4.1 6.6 7.4 5.0 27.2 137.0Tajik Count 4 3 2 6 5 20 6 10 11 7 50 124
Expected Count 15.3 5.2 9.7 12.0 8.2 28.0 3.7 6.0 6.7 4.5 24.7 124.0Hazara Count 11 6 8 8 1 9 0 0 0 0 2 45
Expected Count 5.6 1.9 3.5 4.3 3.0 10.2 1.4 2.2 2.4 1.6 8.9 45.0Uzbek Count 0 2 0 1 1 2 1 1 4 2 2 16
Expected Count 2.0 .7 1.3 1.5 1.1 3.6 .5 .8 .9 .6 3.2 16.0Other Count 1 0 1 1 1 2 1 0 0 1 2 10
Expected Count 1.2 .4 .8 1.0 .7 2.3 .3 .5 .5 .4 2.0 10.0Total Count 41 14 26 32 22 75 10 16 18 12 66 332
Expected Count 41.0 14.0 26.0 32.0 22.0 75.0 10.0 16.0 18.0 12.0 66.0 332.0
Chi-Square Tests
Value df Asymp. Sig.
(2-sided) Pearson Chi-Square 151.657a 40 .000 Likelihood Ratio 156.084 40 .000 Linear-by-Linear Association 2.651 1 .103
N of Valid Cases 332 a. 34 cells (61.8%) have expected count less than 5. The minimum expected count is .30.
Symmetric Measures
Value Approx.
Sig. Nominal by Nominal
Phi .676 .000 Cramer's V .338 .000
N of Valid Cases 332

717

718
Ethnicity * Ismael Khan Crosstab
Ismael Khan
Total .0 1.0 2.0 3.0 4.0 5.0 6.0 7.0 8.0 9.0 10.0 Ethnicity Pashtun Count 37 11 18 14 9 15 2 2 0 0 0 108
Expected Count 27.0 11.6 12.9 11.6 9.0 12.4 5.1 6.4 4.7 1.3 6.0 108.0Tajik Count 12 8 6 4 9 12 5 8 7 3 12 86
Expected Count 21.5 9.2 10.2 9.2 7.2 9.9 4.1 5.1 3.8 1.0 4.8 86.0Hazara Count 12 6 5 7 1 2 0 0 1 0 0 34
Expected Count 8.5 3.6 4.0 3.6 2.8 3.9 1.6 2.0 1.5 .4 1.9 34.0Uzbek Count 0 1 0 1 0 0 4 5 1 0 2 14
Expected Count 3.5 1.5 1.7 1.5 1.2 1.6 .7 .8 .6 .2 .8 14.0Other Count 2 1 1 1 2 0 1 0 2 0 0 10
Expected Count 2.5 1.1 1.2 1.1 .8 1.2 .5 .6 .4 .1 .6 10.0Total Count 63 27 30 27 21 29 12 15 11 3 14 252
Expected Count 63.0 27.0 30.0 27.0 21.0 29.0 12.0 15.0 11.0 3.0 14.0 252.0
Chi-Square Tests
Value df Asymp. Sig.
(2-sided) Pearson Chi-Square 126.124a 40 .000 Likelihood Ratio 127.553 40 .000 Linear-by-Linear Association
12.056 1 .001
N of Valid Cases 252 a. 38 cells (69.1%) have expected count less than 5. The minimum expected count is .12.
Symmetric Measures
Value Approx.
Sig. Nominal by Nominal
Phi .707 .000 Cramer's V .354 .000
N of Valid Cases 252

719

720
Ethnicity * Amrullah Saleh Crosstab
Amrullah Saleh
Total .0 1.0 2.0 3.0 4.0 5.0 6.0 7.0 8.0 9.0 10.0 Ethnicity Pashtun Count 23 8 8 13 7 26 4 1 0 1 8 99
Expected Count 12.0 7.6 9.6 11.6 6.4 21.2 4.8 4.4 8.0 2.8 10.8 99.0Tajik Count 2 5 8 7 2 21 7 8 15 4 16 95
Expected Count 11.5 7.3 9.2 11.1 6.1 20.3 4.6 4.2 7.7 2.7 10.3 95.0Hazara Count 4 5 7 7 6 3 0 0 1 0 0 33
Expected Count 4.0 2.5 3.2 3.9 2.1 7.1 1.6 1.5 2.7 .9 3.6 33.0Uzbek Count 0 1 0 1 0 1 1 2 2 2 3 13
Expected Count 1.6 1.0 1.3 1.5 .8 2.8 .6 .6 1.0 .4 1.4 13.0Other Count 1 0 1 1 1 2 0 0 2 0 0 8
Expected Count 1.0 .6 .8 .9 .5 1.7 .4 .4 .6 .2 .9 8.0Total Count 30 19 24 29 16 53 12 11 20 7 27 248
Expected Count 30.0 19.0 24.0 29.0 16.0 53.0 12.0 11.0 20.0 7.0 27.0 248.0
Chi-Square Tests
Value df Asymp. Sig.
(2-sided) Pearson Chi-Square 104.834a 40 .000 Likelihood Ratio 118.337 40 .000 Linear-by-Linear Association
4.905 1 .027
N of Valid Cases 248 a. 38 cells (69.1%) have expected count less than 5. The minimum expected count is .23.
Symmetric Measures
Value Approx.
Sig. Nominal by Nominal
Phi .650 .000 Cramer's V .325 .000
N of Valid Cases 248

721

722
Ethnicity * Ustad Rabani Crosstab
Ustad Rabani
Total .0 1.0 2.0 3.0 4.0 5.0 6.0 7.0 8.0 9.0 10.0 Ethnicity Pashtun Count 37 12 13 15 20 19 3 0 1 0 3 123
Expected Count 23.7 14.5 13.3 13.3 14.5 17.9 5.0 2.5 6.6 2.9 8.7 123.0Tajik Count 8 11 6 11 11 14 5 6 12 6 16 106
Expected Count 20.4 12.5 11.5 11.5 12.5 15.4 4.3 2.1 5.7 2.5 7.5 106.0Hazara Count 11 10 7 3 3 7 1 0 0 0 0 42
Expected Count 8.1 5.0 4.5 4.5 5.0 6.1 1.7 .9 2.3 1.0 3.0 42.0Uzbek Count 0 2 3 0 1 3 2 0 1 1 2 15
Expected Count 2.9 1.8 1.6 1.6 1.8 2.2 .6 .3 .8 .4 1.1 15.0Other Count 1 0 3 3 0 0 1 0 2 0 0 10
Expected Count 1.9 1.2 1.1 1.1 1.2 1.5 .4 .2 .5 .2 .7 10.0Total Count 57 35 32 32 35 43 12 6 16 7 21 296
Expected Count 57.0 35.0 32.0 32.0 35.0 43.0 12.0 6.0 16.0 7.0 21.0 296.0
Chi-Square Tests
Value df Asymp. Sig.
(2-sided) Pearson Chi-Square 109.227a 40 .000 Likelihood Ratio 122.273 40 .000 Linear-by-Linear Association
4.306 1 .038
N of Valid Cases 296 a. 37 cells (67.3%) have expected count less than 5. The minimum expected count is .20.
Symmetric Measures
Value Approx.
Sig. Nominal by Nominal
Phi .607 .000 Cramer's V .304 .000
N of Valid Cases 296

723

724
Ethnicity * Syed Mustafa Kazimi Crosstab
Syed Mustafa Kazimi
Total .0 1.0 2.0 3.0 4.0 5.0 6.0 7.0 8.0 9.0 10.0 Ethnicity Pashtun Count 23 6 6 16 5 14 3 0 2 0 6 81
Expected Count 12.9 7.7 5.6 10.9 6.9 15.7 2.4 2.4 3.6 1.2 11.7 81.0Tajik Count 6 6 3 5 6 12 2 6 5 1 16 68
Expected Count 10.8 6.4 4.7 9.1 5.8 13.2 2.0 2.0 3.0 1.0 9.8 68.0Hazara Count 2 5 4 5 4 10 1 0 0 0 0 31
Expected Count 4.9 2.9 2.2 4.2 2.6 6.0 .9 .9 1.4 .5 4.5 31.0Uzbek Count 0 0 0 1 0 0 0 0 2 2 7 12
Expected Count 1.9 1.1 .8 1.6 1.0 2.3 .4 .4 .5 .2 1.7 12.0Other Count 1 2 1 0 2 3 0 0 0 0 0 9
Expected Count 1.4 .9 .6 1.2 .8 1.7 .3 .3 .4 .1 1.3 9.0Total Count 32 19 14 27 17 39 6 6 9 3 29 201
Expected Count 32.0 19.0 14.0 27.0 17.0 39.0 6.0 6.0 9.0 3.0 29.0 201.0
Chi-Square Tests
Value df Asymp. Sig.
(2-sided) Pearson Chi-Square 107.058a 40 .000 Likelihood Ratio 102.829 40 .000 Linear-by-Linear Association
7.711 1 .005
N of Valid Cases 201 a. 41 cells (74.5%) have expected count less than 5. The minimum expected count is .13.
Symmetric Measures
Value Approx.
Sig. Nominal by Nominal
Phi .730 .000 Cramer's V .365 .000
N of Valid Cases 201

725

726
Ethnicity * Besmellah Khan Crosstab
Besmellah Khan
Total .0 1.0 2.0 3.0 4.0 5.0 6.0 7.0 8.0 9.0 10.0 Ethnicity Pashtun Count 22 12 8 13 12 14 2 0 0 0 2 85
Expected Count 14.4 11.7 9.0 12.6 9.9 14.8 3.1 3.1 2.2 1.8 2.2 85.0Tajik Count 5 5 8 8 7 15 2 7 3 4 3 67
Expected Count 11.3 9.2 7.1 9.9 7.8 11.7 2.5 2.5 1.8 1.4 1.8 67.0Hazara Count 3 7 2 5 3 4 0 0 0 0 0 24
Expected Count 4.1 3.3 2.5 3.6 2.8 4.2 .9 .9 .6 .5 .6 24.0Uzbek Count 0 2 1 0 0 0 2 0 1 0 0 6
Expected Count 1.0 .8 .6 .9 .7 1.0 .2 .2 .2 .1 .2 6.0Other Count 2 0 1 2 0 0 1 0 1 0 0 7
Expected Count 1.2 1.0 .7 1.0 .8 1.2 .3 .3 .2 .1 .2 7.0Total Count 32 26 20 28 22 33 7 7 5 4 5 189
Expected Count 32.0 26.0 20.0 28.0 22.0 33.0 7.0 7.0 5.0 4.0 5.0 189.0
Chi-Square Tests
Value df Asymp. Sig.
(2-sided) Pearson Chi-Square 78.258a 40 .000 Likelihood Ratio 76.867 40 .000 Linear-by-Linear Association
1.735 1 .188
N of Valid Cases 189 a. 43 cells (78.2%) have expected count less than 5. The minimum expected count is .13.
Symmetric Measures
Value Approx.
Sig. Nominal by Nominal
Phi .643 .000 Cramer's V .322 .000
N of Valid Cases 189

727

728
Ethnicity * Shekh Asif Mohseni Crosstab
Shekh Asif Mohseni
Total .0 1.0 2.0 3.0 4.0 5.0 6.0 7.0 8.0 9.0 10.0 Ethnicity Pashtun Count 21 11 11 11 12 17 0 1 2 0 6 92
Expected Count 15.1 11.1 7.5 8.7 7.9 20.6 4.8 1.6 4.0 1.6 9.1 92.0Tajik Count 5 10 4 4 3 17 12 1 7 3 15 81
Expected Count 13.3 9.8 6.6 7.7 7.0 18.2 4.2 1.4 3.5 1.4 8.0 81.0Hazara Count 12 5 2 4 5 14 0 0 0 0 1 43
Expected Count 7.0 5.2 3.5 4.1 3.7 9.6 2.2 .7 1.9 .7 4.3 43.0Uzbek Count 0 1 2 0 0 0 0 1 1 0 0 5
Expected Count .8 .6 .4 .5 .4 1.1 .3 .1 .2 .1 .5 5.0Other Count 0 1 0 3 0 4 0 1 0 1 1 11
Expected Count 1.8 1.3 .9 1.0 .9 2.5 .6 .2 .5 .2 1.1 11.0Total Count 38 28 19 22 20 52 12 4 10 4 23 232
Expected Count 38.0 28.0 19.0 22.0 20.0 52.0 12.0 4.0 10.0 4.0 23.0 232.0
Chi-Square Tests
Value df Asymp. Sig.
(2-sided) Pearson Chi-Square 105.887a 40 .000 Likelihood Ratio 105.620 40 .000 Linear-by-Linear Association
2.087 1 .149
N of Valid Cases 232 a. 38 cells (69.1%) have expected count less than 5. The minimum expected count is .09.
Symmetric Measures
Value Approx.
Sig. Nominal by Nominal
Phi .676 .000 Cramer's V .338 .000
N of Valid Cases 232

729

730
Ethnicity * Baktash Seyawash Crosstab
Baktash Seyawash
Total .0 1.0 2.0 3.0 4.0 5.0 6.0 7.0 8.0 9.0 10.0 Ethnicity Pashtun Count 25 10 11 13 5 13 1 0 0 1 9 88
Expected Count 13.7 8.3 11.0 8.0 8.0 12.9 1.9 2.7 2.3 3.0 16.3 88.0Tajik Count 8 8 12 3 8 12 2 3 5 4 28 93
Expected Count 14.4 8.8 11.6 8.4 8.4 13.6 2.0 2.8 2.4 3.2 17.2 93.0Hazara Count 2 3 3 5 6 6 1 1 0 1 3 31
Expected Count 4.8 2.9 3.9 2.8 2.8 4.5 .7 .9 .8 1.1 5.7 31.0Uzbek Count 0 1 0 0 0 1 1 2 1 2 3 11
Expected Count 1.7 1.0 1.4 1.0 1.0 1.6 .2 .3 .3 .4 2.0 11.0Other Count 1 0 3 0 2 2 0 1 0 0 0 9
Expected Count 1.4 .9 1.1 .8 .8 1.3 .2 .3 .2 .3 1.7 9.0Total Count 36 22 29 21 21 34 5 7 6 8 43 232
Expected Count 36.0 22.0 29.0 21.0 21.0 34.0 5.0 7.0 6.0 8.0 43.0 232.0
Chi-Square Tests
Value df Asymp. Sig.
(2-sided) Pearson Chi-Square 87.034a 40 .000 Likelihood Ratio 88.095 40 .000 Linear-by-Linear Association
8.720 1 .003
N of Valid Cases 232 a. 40 cells (72.7%) have expected count less than 5. The minimum expected count is .19.
Symmetric Measures
Value Approx.
Sig. Nominal by Nominal
Phi .612 .000 Cramer's V .306 .000
N of Valid Cases 232

731

732
Ethnicity * Ahmad Zia Masood Crosstab
Ahmad Zia Masood
Total .0 1.0 2.0 3.0 4.0 5.0 6.0 7.0 8.0 10.0 Ethnicity Pashtun Count 31 9 11 16 14 11 1 0 0 1 94
Expected Count 20.0 14.9 11.1 14.0 11.1 8.5 3.0 2.6 2.1 6.8 94.0Tajik Count 11 11 5 12 7 7 5 5 3 12 78
Expected Count 16.6 12.4 9.2 11.6 9.2 7.1 2.5 2.1 1.8 5.6 78.0Hazara Count 4 10 8 3 2 0 0 0 0 1 28
Expected Count 6.0 4.4 3.3 4.2 3.3 2.5 .9 .8 .6 2.0 28.0Uzbek Count 0 2 1 1 0 2 1 0 2 2 11
Expected Count 2.3 1.7 1.3 1.6 1.3 1.0 .3 .3 .2 .8 11.0Other Count 1 3 1 1 3 0 0 1 0 0 10
Expected Count 2.1 1.6 1.2 1.5 1.2 .9 .3 .3 .2 .7 10.0Total Count 47 35 26 33 26 20 7 6 5 16 221
Expected Count 47.0 35.0 26.0 33.0 26.0 20.0 7.0 6.0 5.0 16.0 221.0
Chi-Square Tests
Value df Asymp. Sig.
(2-sided) Pearson Chi-Square 90.301a 36 .000 Likelihood Ratio 91.778 36 .000 Linear-by-Linear Association
3.849 1 .050
N of Valid Cases 221 a. 35 cells (70.0%) have expected count less than 5. The minimum expected count is .23.
Symmetric Measures
Value Approx.
Sig. Nominal by Nominal
Phi .639 .000 Cramer's V .320 .000
N of Valid Cases 221

733

734
Ethnicity * Habibullah Khan Crosstab
Habibullah Khan
Total .0 1.0 2.0 3.0 4.0 5.0 6.0 7.0 8.0 9.0 10.0 Ethnicity Pashtun Count 38 11 14 8 9 18 1 2 0 0 5 106
Expected Count 27.0 12.9 11.6 7.5 6.2 15.8 2.1 5.4 3.3 1.7 12.5 106.0Tajik Count 7 11 6 5 4 16 4 8 7 3 21 92
Expected Count 23.5 11.2 10.1 6.5 5.4 13.7 1.8 4.7 2.9 1.4 10.8 92.0Hazara Count 17 4 6 4 0 1 0 0 0 0 2 34
Expected Count 8.7 4.1 3.7 2.4 2.0 5.1 .7 1.7 1.1 .5 4.0 34.0Uzbek Count 0 2 0 1 0 3 0 2 1 1 2 12
Expected Count 3.1 1.5 1.3 .8 .7 1.8 .2 .6 .4 .2 1.4 12.0Other Count 3 3 2 0 2 0 0 1 0 0 0 11
Expected Count 2.8 1.3 1.2 .8 .6 1.6 .2 .6 .3 .2 1.3 11.0Total Count 65 31 28 18 15 38 5 13 8 4 30 255
Expected Count 65.0 31.0 28.0 18.0 15.0 38.0 5.0 13.0 8.0 4.0 30.0 255.0
Chi-Square Tests
Value df Asymp. Sig.
(2-sided) Pearson Chi-Square 100.614a 40 .000 Likelihood Ratio 116.791 40 .000 Linear-by-Linear Association
.952 1 .329
N of Valid Cases 255 a. 38 cells (69.1%) have expected count less than 5. The minimum expected count is .17.
Symmetric Measures
Value Approx.
Sig. Nominal by Nominal
Phi .628 .000 Cramer's V .314 .000
N of Valid Cases 255

735
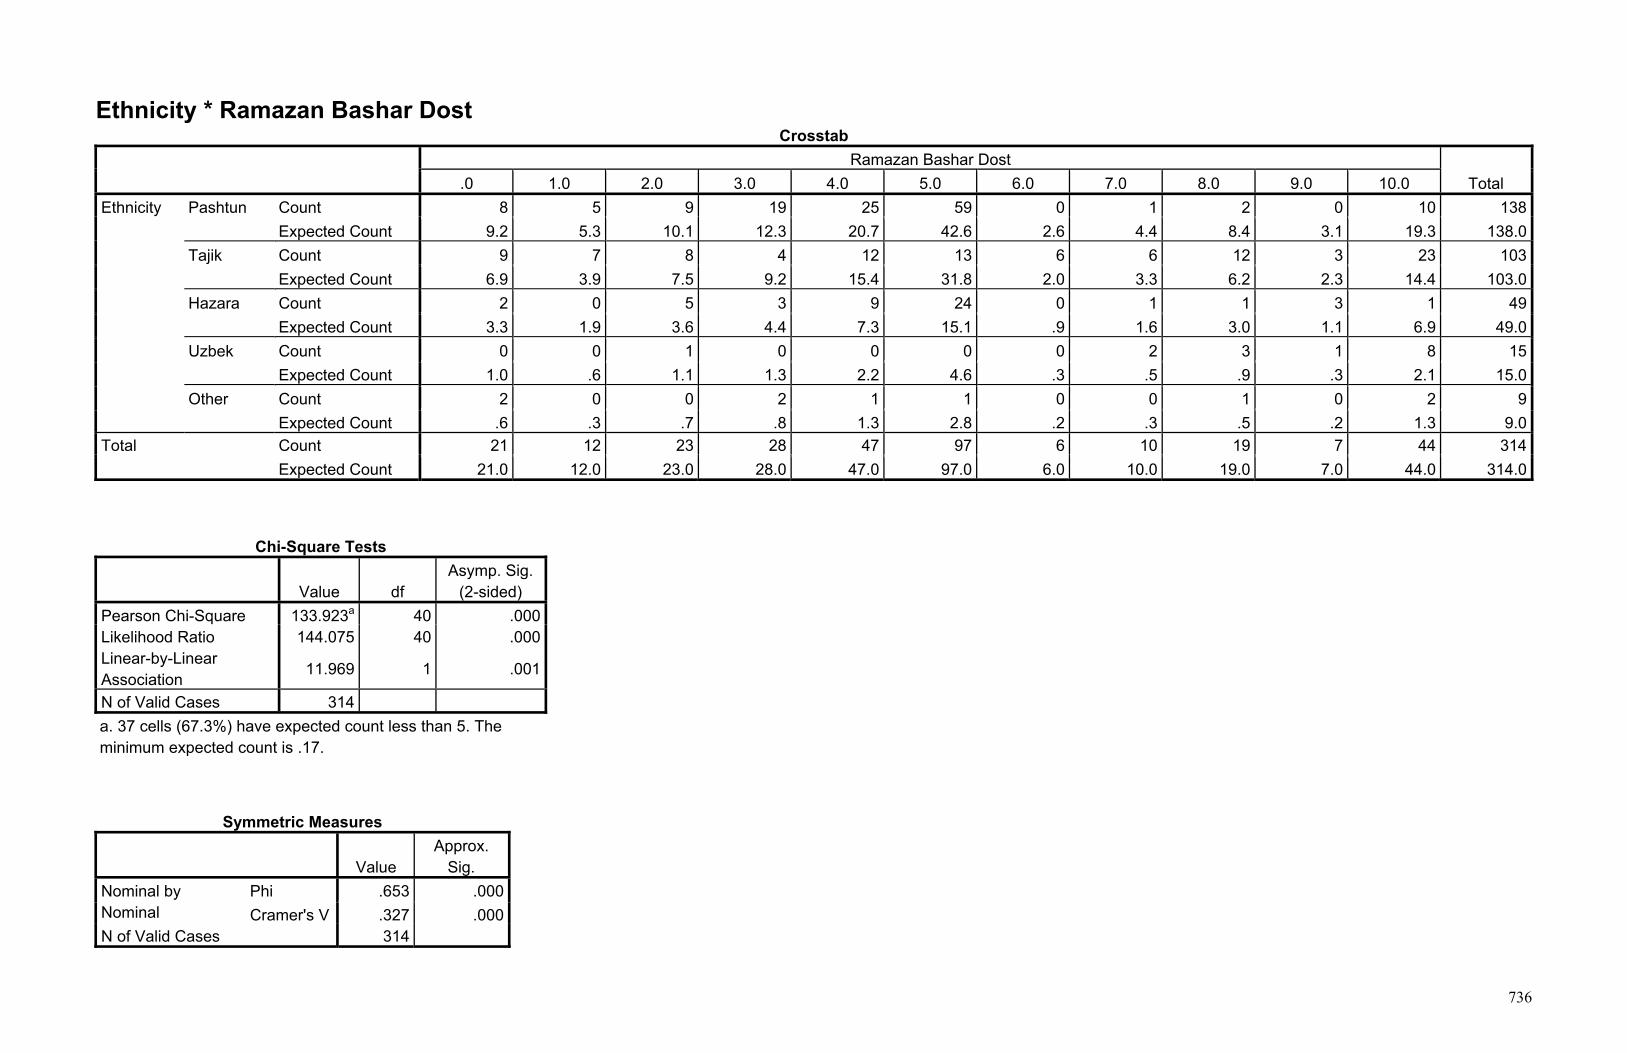
736
Ethnicity * Ramazan Bashar Dost Crosstab
Ramazan Bashar Dost
Total .0 1.0 2.0 3.0 4.0 5.0 6.0 7.0 8.0 9.0 10.0 Ethnicity Pashtun Count 8 5 9 19 25 59 0 1 2 0 10 138
Expected Count 9.2 5.3 10.1 12.3 20.7 42.6 2.6 4.4 8.4 3.1 19.3 138.0Tajik Count 9 7 8 4 12 13 6 6 12 3 23 103
Expected Count 6.9 3.9 7.5 9.2 15.4 31.8 2.0 3.3 6.2 2.3 14.4 103.0Hazara Count 2 0 5 3 9 24 0 1 1 3 1 49
Expected Count 3.3 1.9 3.6 4.4 7.3 15.1 .9 1.6 3.0 1.1 6.9 49.0Uzbek Count 0 0 1 0 0 0 0 2 3 1 8 15
Expected Count 1.0 .6 1.1 1.3 2.2 4.6 .3 .5 .9 .3 2.1 15.0Other Count 2 0 0 2 1 1 0 0 1 0 2 9
Expected Count .6 .3 .7 .8 1.3 2.8 .2 .3 .5 .2 1.3 9.0Total Count 21 12 23 28 47 97 6 10 19 7 44 314
Expected Count 21.0 12.0 23.0 28.0 47.0 97.0 6.0 10.0 19.0 7.0 44.0 314.0
Chi-Square Tests
Value df Asymp. Sig.
(2-sided) Pearson Chi-Square 133.923a 40 .000 Likelihood Ratio 144.075 40 .000 Linear-by-Linear Association
11.969 1 .001
N of Valid Cases 314 a. 37 cells (67.3%) have expected count less than 5. The minimum expected count is .17.
Symmetric Measures
Value Approx.
Sig. Nominal by Nominal
Phi .653 .000 Cramer's V .327 .000
N of Valid Cases 314

737

738
Ethnicity * Lateef Pedram Crosstab
Lateef Pedram
Total .0 1.0 2.0 3.0 4.0 5.0 6.0 7.0 8.0 9.0 10.0 Ethnicity Pashtun Count 32 9 11 6 7 8 0 0 0 1 1 75
Expected Count 18.2 9.9 9.9 7.0 6.6 10.4 2.1 5.0 1.2 .8 3.7 75.0Tajik Count 9 9 6 5 6 12 3 8 1 1 4 64
Expected Count 15.6 8.5 8.5 6.0 5.7 8.8 1.8 4.2 1.1 .7 3.2 64.0Hazara Count 2 6 6 3 2 3 0 1 0 0 1 24
Expected Count 5.8 3.2 3.2 2.3 2.1 3.3 .7 1.6 .4 .3 1.2 24.0Uzbek Count 0 0 0 1 1 0 2 1 2 0 3 10
Expected Count 2.4 1.3 1.3 .9 .9 1.4 .3 .7 .2 .1 .5 10.0Other Count 1 0 1 2 0 2 0 2 0 0 0 8
Expected Count 1.9 1.1 1.1 .8 .7 1.1 .2 .5 .1 .1 .4 8.0Total Count 44 24 24 17 16 25 5 12 3 2 9 181
Expected Count 44.0 24.0 24.0 17.0 16.0 25.0 5.0 12.0 3.0 2.0 9.0 181.0
Chi-Square Tests
Value df Asymp. Sig.
(2-sided) Pearson Chi-Square 100.726a 40 .000 Likelihood Ratio 88.381 40 .000 Linear-by-Linear Association
21.761 1 .000
N of Valid Cases 181 a. 42 cells (76.4%) have expected count less than 5. The minimum expected count is .09.
Symmetric Measures
Value Approx.
Sig. Nominal by Nominal
Phi .746 .000 Cramer's V .373 .000
N of Valid Cases 181

739
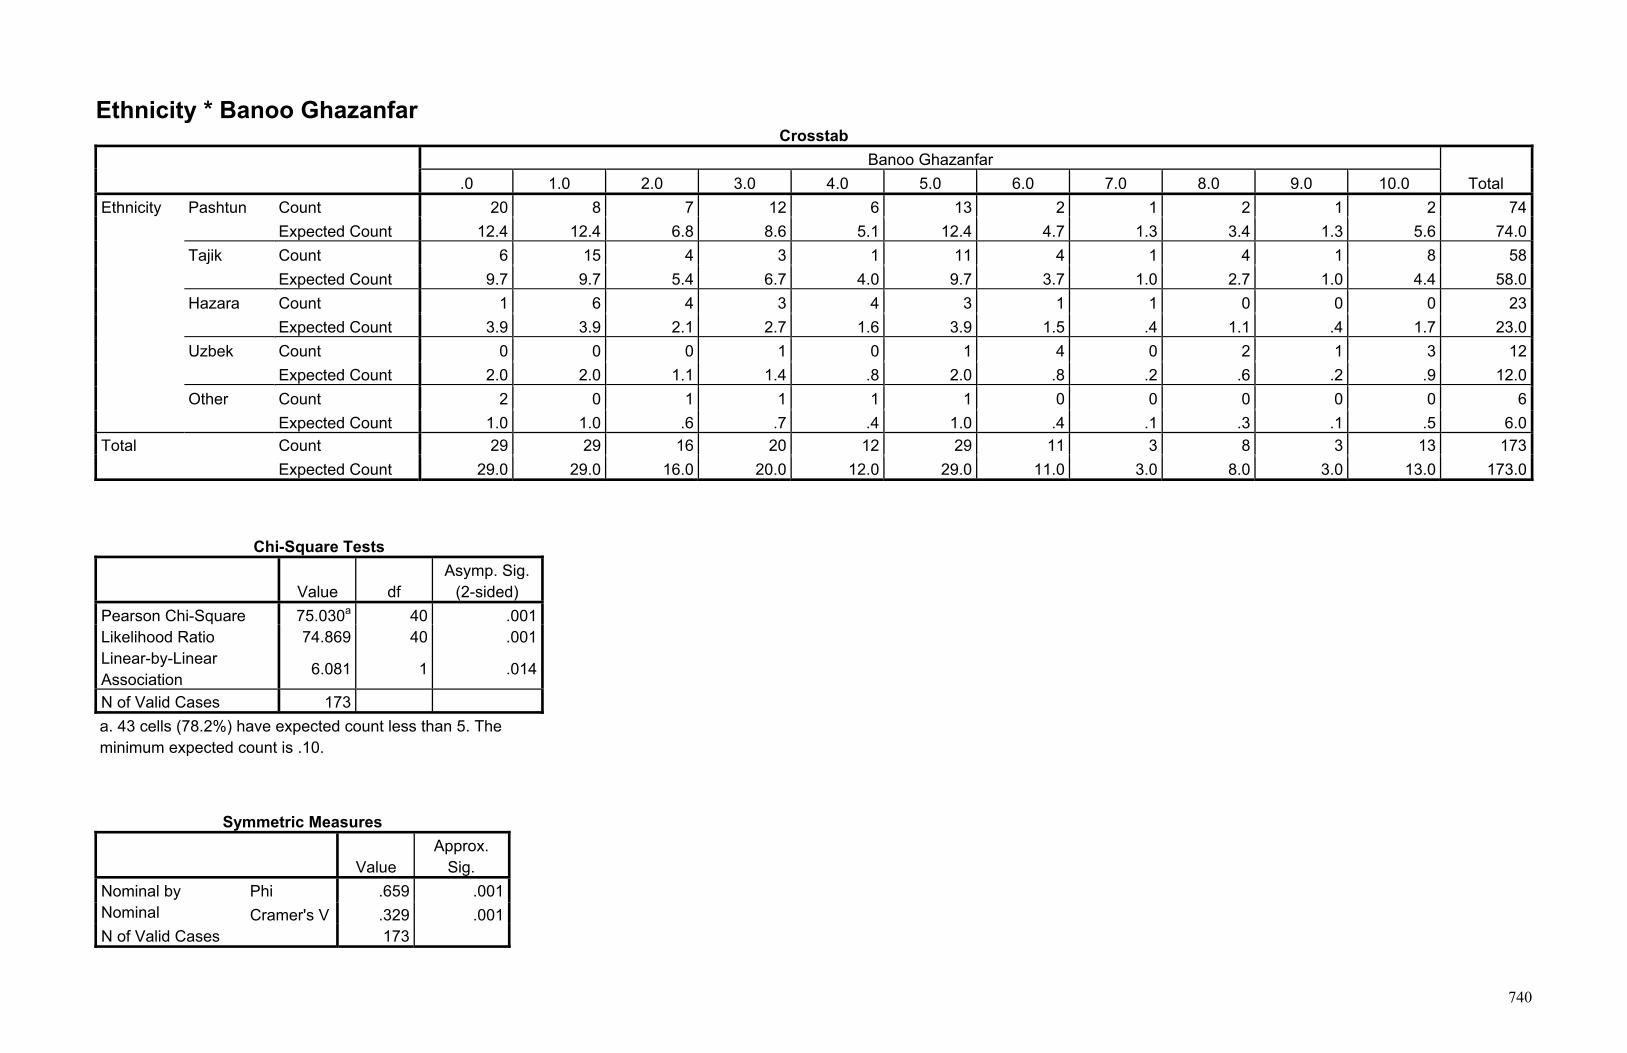
740
Ethnicity * Banoo Ghazanfar Crosstab
Banoo Ghazanfar
Total .0 1.0 2.0 3.0 4.0 5.0 6.0 7.0 8.0 9.0 10.0 Ethnicity Pashtun Count 20 8 7 12 6 13 2 1 2 1 2 74
Expected Count 12.4 12.4 6.8 8.6 5.1 12.4 4.7 1.3 3.4 1.3 5.6 74.0Tajik Count 6 15 4 3 1 11 4 1 4 1 8 58
Expected Count 9.7 9.7 5.4 6.7 4.0 9.7 3.7 1.0 2.7 1.0 4.4 58.0Hazara Count 1 6 4 3 4 3 1 1 0 0 0 23
Expected Count 3.9 3.9 2.1 2.7 1.6 3.9 1.5 .4 1.1 .4 1.7 23.0Uzbek Count 0 0 0 1 0 1 4 0 2 1 3 12
Expected Count 2.0 2.0 1.1 1.4 .8 2.0 .8 .2 .6 .2 .9 12.0Other Count 2 0 1 1 1 1 0 0 0 0 0 6
Expected Count 1.0 1.0 .6 .7 .4 1.0 .4 .1 .3 .1 .5 6.0Total Count 29 29 16 20 12 29 11 3 8 3 13 173
Expected Count 29.0 29.0 16.0 20.0 12.0 29.0 11.0 3.0 8.0 3.0 13.0 173.0
Chi-Square Tests
Value df Asymp. Sig.
(2-sided) Pearson Chi-Square 75.030a 40 .001 Likelihood Ratio 74.869 40 .001 Linear-by-Linear Association
6.081 1 .014
N of Valid Cases 173 a. 43 cells (78.2%) have expected count less than 5. The minimum expected count is .10.
Symmetric Measures
Value Approx.
Sig. Nominal by Nominal
Phi .659 .001 Cramer's V .329 .001
N of Valid Cases 173

741

742
Ethnicity * Ustad Sayaf Crosstab
Ustad Sayaf
Total .0 1.0 2.0 3.0 4.0 5.0 6.0 7.0 8.0 9.0 10.0 Ethnicity Pashtun Count 31 9 11 20 13 19 3 2 1 0 1 110
Expected Count 28.0 14.0 10.2 11.9 11.5 15.7 3.8 3.8 3.4 1.3 6.4 110.0Tajik Count 15 13 5 5 10 13 4 6 5 2 11 89
Expected Count 22.7 11.3 8.2 9.6 9.3 12.7 3.1 3.1 2.7 1.0 5.2 89.0Hazara Count 17 5 6 3 1 3 0 0 1 0 2 38
Expected Count 9.7 4.8 3.5 4.1 4.0 5.4 1.3 1.3 1.2 .4 2.2 38.0Uzbek Count 0 6 0 0 1 1 2 0 0 1 1 12
Expected Count 3.1 1.5 1.1 1.3 1.3 1.7 .4 .4 .4 .1 .7 12.0Other Count 3 0 2 0 2 1 0 1 1 0 0 10
Expected Count 2.5 1.3 .9 1.1 1.0 1.4 .3 .3 .3 .1 .6 10.0Total Count 66 33 24 28 27 37 9 9 8 3 15 259
Expected Count 66.0 33.0 24.0 28.0 27.0 37.0 9.0 9.0 8.0 3.0 15.0 259.0
Chi-Square Tests
Value df Asymp. Sig.
(2-sided) Pearson Chi-Square 89.578a 40 .000 Likelihood Ratio 91.211 40 .000 Linear-by-Linear Association
.366 1 .545
N of Valid Cases 259 a. 39 cells (70.9%) have expected count less than 5. The minimum expected count is .12.
Symmetric Measures
Value Approx.
Sig. Nominal by Nominal
Phi .588 .000 Cramer's V .294 .000
N of Valid Cases 259

743

744
Ethnicity * Gen. Dostum Crosstab
Gen. Dostum
Total .0 1.0 2.0 3.0 4.0 5.0 6.0 7.0 8.0 9.0 10.0 Ethnicity Pashtun Count 51 7 12 13 4 17 2 0 0 0 5 111
Expected Count 29.7 10.4 8.8 14.0 9.6 16.0 2.8 4.4 6.4 1.6 7.2 111.0Tajik Count 12 14 7 9 8 17 4 9 8 2 7 97
Expected Count 25.9 9.1 7.7 12.3 8.4 14.0 2.5 3.9 5.6 1.4 6.3 97.0Hazara Count 7 3 1 11 10 5 1 0 3 0 2 43
Expected Count 11.5 4.0 3.4 5.4 3.7 6.2 1.1 1.7 2.5 .6 2.8 43.0Uzbek Count 0 2 0 1 0 0 0 2 5 2 4 16
Expected Count 4.3 1.5 1.3 2.0 1.4 2.3 .4 .6 .9 .2 1.0 16.0Other Count 4 0 2 1 2 1 0 0 0 0 0 10
Expected Count 2.7 .9 .8 1.3 .9 1.4 .3 .4 .6 .1 .6 10.0Total Count 74 26 22 35 24 40 7 11 16 4 18 277
Expected Count 74.0 26.0 22.0 35.0 24.0 40.0 7.0 11.0 16.0 4.0 18.0 277.0
Chi-Square Tests
Value df Asymp. Sig.
(2-sided) Pearson Chi-Square 138.527a 40 .000 Likelihood Ratio 136.625 40 .000 Linear-by-Linear Association
18.898 1 .000
N of Valid Cases 277 a. 36 cells (65.5%) have expected count less than 5. The minimum expected count is .14.
Symmetric Measures
Value Approx.
Sig. Nominal by Nominal
Phi .707 .000 Cramer's V .354 .000
N of Valid Cases 277

745

746
Ethnicity * Ahmad Behzad Crosstab
Ahmad Behzad
Total 0 1 2 3 4 5 6 7 8 9 10 Ethnicity Pashtun Count 24 5 10 13 5 6 0 0 0 0 1 64
Expected Count 13.4 5.5 8.7 7.9 7.1 10.7 2.8 .4 2.8 1.6 3.2 64.0Tajik Count 8 5 6 3 4 10 5 1 5 2 4 53
Expected Count 11.1 4.6 7.2 6.5 5.9 8.8 2.3 .3 2.3 1.3 2.6 53.0Hazara Count 1 1 4 3 7 9 1 0 1 1 1 29
Expected Count 6.1 2.5 3.9 3.6 3.2 4.8 1.3 .2 1.3 .7 1.4 29.0Uzbek Count 0 2 0 1 1 0 0 0 1 1 2 8
Expected Count 1.7 .7 1.1 1.0 .9 1.3 .3 .0 .3 .2 .4 8.0Other Count 1 1 2 0 1 2 1 0 0 0 0 8
Expected Count 1.7 .7 1.1 1.0 .9 1.3 .3 .0 .3 .2 .4 8.0Total Count 34 14 22 20 18 27 7 1 7 4 8 162
Expected Count 34.0 14.0 22.0 20.0 18.0 27.0 7.0 1.0 7.0 4.0 8.0 162.0
Chi-Square Tests
Value df Asymp. Sig.
(2-sided) Pearson Chi-Square 72.732a 40 .001 Likelihood Ratio 78.145 40 .000 Linear-by-Linear Association
14.431 1 .000
N of Valid Cases 162 a. 43 cells (78.2%) have expected count less than 5. The minimum expected count is .05.
Symmetric Measures
Value Approx.
Sig. Nominal by Nominal
Phi .670 .001 Cramer's V .335 .001
N of Valid Cases 162

747

748
Frequencies Statistics
Mirw
ais
Nia
Ahm
ad S
hah
Bab
a
Zahi
r Kha
n
Aman
ulla
h Kh
an
Dr N
ajib
Abdu
l Rah
man
Kha
n
Daw
ood
Khan
Ham
id K
arza
i
Ash
raf G
hani
Ahm
adza
i
N Valid 293 351 331 347 371 281 339 369 274
Missing 275 217 237 221 197 287 229 199 294
Mean 5.348 5.627 4.157 5.896 5.809 3.477 5.540 4.593 3.942
Median 5.000 5.000 4.000 5.000 5.000 4.000 5.000 5.000 4.000
Mode 5.0 5.0 5.0 5.0 5.0 5.0 5.0 5.0 5.0
Std. Deviation 2.7062 2.7140 2.9013 2.7624 2.9635 2.7348 2.7821 2.6432 2.5884
Skewness .075 .087 .480 .055 .021 .413 .101 .347 .316
Std. Error of Skewness .142 .130 .134 .131 .127 .145 .132 .127 .147
Kurtosis -.257 -.405 -.518 -.701 -.871 -.566 -.699 -.160 -.275
Std. Error of Kurtosis .284 .260 .267 .261 .253 .290 .264 .253 .293
Minimum .0 .0 .0 .0 .0 .0 .0 .0 .0
Maximum 10.0 10.0 10.0 10.0 10.0 10.0 10.0 10.0 10.0

749
Frequency Table Mirwais Nia
Frequency Percent Valid Percent
Cumulative
Percent
Valid .0 18 3.2 6.1 6.1
1.0 14 2.5 4.8 10.9
2.0 7 1.2 2.4 13.3
3.0 17 3.0 5.8 19.1
4.0 14 2.5 4.8 23.9
5.0 140 24.6 47.8 71.7
6.0 5 .9 1.7 73.4
7.0 10 1.8 3.4 76.8
8.0 21 3.7 7.2 84.0
9.0 6 1.1 2.0 86.0
10.0 41 7.2 14.0 100.0
Total 293 51.6 100.0 Missing System 275 48.4 Total 568 100.0
Ahmad Shah Baba
Frequency Percent Valid Percent
Cumulative
Percent
Valid .0 19 3.3 5.4 5.4
1.0 6 1.1 1.7 7.1
2.0 12 2.1 3.4 10.5
3.0 24 4.2 6.8 17.4
4.0 19 3.3 5.4 22.8
5.0 157 27.6 44.7 67.5
6.0 10 1.8 2.8 70.4
7.0 10 1.8 2.8 73.2
8.0 22 3.9 6.3 79.5
9.0 14 2.5 4.0 83.5
10.0 58 10.2 16.5 100.0
Total 351 61.8 100.0 Missing System 217 38.2 Total 568 100.0

750
Zahir Khan
Frequency Percent Valid Percent
Cumulative
Percent
Valid .0 40 7.0 12.1 12.1
1.0 27 4.8 8.2 20.2
2.0 32 5.6 9.7 29.9
3.0 47 8.3 14.2 44.1
4.0 47 8.3 14.2 58.3
5.0 58 10.2 17.5 75.8
6.0 11 1.9 3.3 79.2
7.0 16 2.8 4.8 84.0
8.0 18 3.2 5.4 89.4
9.0 6 1.1 1.8 91.2
10.0 29 5.1 8.8 100.0
Total 331 58.3 100.0 Missing System 237 41.7 Total 568 100.0
Amanullah Khan
Frequency Percent Valid Percent
Cumulative
Percent
Valid .0 11 1.9 3.2 3.2
1.0 13 2.3 3.7 6.9
2.0 9 1.6 2.6 9.5
3.0 17 3.0 4.9 14.4
4.0 36 6.3 10.4 24.8
5.0 131 23.1 37.8 62.5
6.0 6 1.1 1.7 64.3
7.0 16 2.8 4.6 68.9
8.0 24 4.2 6.9 75.8
9.0 15 2.6 4.3 80.1
10.0 69 12.1 19.9 100.0
Total 347 61.1 100.0 Missing System 221 38.9 Total 568 100.0

751
Dr Najib
Frequency Percent Valid Percent
Cumulative
Percent
Valid .0 17 3.0 4.6 4.6
1.0 18 3.2 4.9 9.4
2.0 8 1.4 2.2 11.6
3.0 28 4.9 7.5 19.1
4.0 32 5.6 8.6 27.8
5.0 129 22.7 34.8 62.5
6.0 12 2.1 3.2 65.8
7.0 6 1.1 1.6 67.4
8.0 21 3.7 5.7 73.0
9.0 18 3.2 4.9 77.9
10.0 82 14.4 22.1 100.0
Total 371 65.3 100.0 Missing System 197 34.7 Total 568 100.0
Abdul Rahman Khan
Frequency Percent Valid Percent
Cumulative
Percent
Valid .0 57 10.0 20.3 20.3
1.0 34 6.0 12.1 32.4
2.0 18 3.2 6.4 38.8
3.0 30 5.3 10.7 49.5
4.0 28 4.9 10.0 59.4
5.0 67 11.8 23.8 83.3
6.0 6 1.1 2.1 85.4
7.0 16 2.8 5.7 91.1
8.0 12 2.1 4.3 95.4
9.0 4 .7 1.4 96.8
10.0 9 1.6 3.2 100.0
Total 281 49.5 100.0 Missing System 287 50.5 Total 568 100.0

752
Dawood Khan
Frequency Percent Valid Percent
Cumulative
Percent
Valid .0 13 2.3 3.8 3.8
1.0 16 2.8 4.7 8.6
2.0 16 2.8 4.7 13.3
3.0 23 4.0 6.8 20.1
4.0 37 6.5 10.9 31.0
5.0 115 20.2 33.9 64.9
6.0 11 1.9 3.2 68.1
7.0 11 1.9 3.2 71.4
8.0 28 4.9 8.3 79.6
9.0 19 3.3 5.6 85.3
10.0 50 8.8 14.7 100.0
Total 339 59.7 100.0 Missing System 229 40.3 Total 568 100.0
Hamid Karzai
Frequency Percent Valid Percent
Cumulative
Percent
Valid .0 26 4.6 7.0 7.0
1.0 26 4.6 7.0 14.1
2.0 25 4.4 6.8 20.9
3.0 36 6.3 9.8 30.6
4.0 50 8.8 13.6 44.2
5.0 124 21.8 33.6 77.8
6.0 11 1.9 3.0 80.8
7.0 17 3.0 4.6 85.4
8.0 12 2.1 3.3 88.6
9.0 10 1.8 2.7 91.3
10.0 32 5.6 8.7 100.0
Total 369 65.0 100.0 Missing System 199 35.0 Total 568 100.0

753
Ashraf Ghani Ahmadzai
Frequency Percent Valid Percent
Cumulative
Percent
Valid .0 32 5.6 11.7 11.7
1.0 31 5.5 11.3 23.0
2.0 19 3.3 6.9 29.9
3.0 31 5.5 11.3 41.2
4.0 29 5.1 10.6 51.8
5.0 83 14.6 30.3 82.1
6.0 11 1.9 4.0 86.1
7.0 11 1.9 4.0 90.1
8.0 10 1.8 3.6 93.8
9.0 6 1.1 2.2 96.0
10.0 11 1.9 4.0 100.0
Total 274 48.2 100.0 Missing System 294 51.8 Total 568 100.0

754
Pie Chart

755

756

757

758

759

760

761

762

763
Crosstabs Case Processing Summary
Cases
Valid Missing Total
N Percent N Percent N Percent
Ethnicity * Mirwais Nia 293 51.6% 275 48.4% 568 100.0%
Ethnicity * Ahmad Shah Baba 351 61.8% 217 38.2% 568 100.0%
Ethnicity * Zahir Khan 331 58.3% 237 41.7% 568 100.0%
Ethnicity * Amanullah Khan 347 61.1% 221 38.9% 568 100.0%
Ethnicity * Dr Najib 371 65.3% 197 34.7% 568 100.0%
Ethnicity * Abdul Rahman Khan 281 49.5% 287 50.5% 568 100.0%
Ethnicity * Dawood Khan 339 59.7% 229 40.3% 568 100.0%
Ethnicity * Hamid Karzai 369 65.0% 199 35.0% 568 100.0%
Ethnicity * Ashraf Ghani Ahmadzai 274 48.2% 294 51.8% 568 100.0%
Ethnicity * Mirwais Nia
Crosstab
Mirwais Nia
Total .0 1.0 2.0 3.0 4.0 5.0 6.0 7.0 8.0 9.0 10.0
Ethnicity Pashtun Count 3 4 3 3 10 117 1 0 4 3 12 160
Expected Count 9.8 7.6 3.8 9.3 7.6 76.5 2.7 5.5 11.5 3.3 22.4 160.0
Tajik Count 5 3 2 3 3 15 4 6 14 2 21 78
Expected Count 4.8 3.7 1.9 4.5 3.7 37.3 1.3 2.7 5.6 1.6 10.9 78.0
Hazara Count 9 3 2 7 1 6 0 0 0 0 3 31
Expected Count 1.9 1.5 .7 1.8 1.5 14.8 .5 1.1 2.2 .6 4.3 31.0
Uzbek Count 0 2 0 0 0 0 0 3 2 0 4 11
Expected Count .7 .5 .3 .6 .5 5.3 .2 .4 .8 .2 1.5 11.0
Other Count 1 2 0 4 0 2 0 1 1 1 1 13
Expected Count .8 .6 .3 .8 .6 6.2 .2 .4 .9 .3 1.8 13.0
Total Count 18 14 7 17 14 140 5 10 21 6 41 293
Expected Count 18.0 14.0 7.0 17.0 14.0 140.0 5.0 10.0 21.0 6.0 41.0 293.0

764
Chi-Square Tests
Value df
Asymp. Sig. (2-
sided)
Pearson Chi-Square 210.806a 40 .000
Likelihood Ratio 187.136 40 .000
Linear-by-Linear Association .694 1 .405
N of Valid Cases 293
a. 41 cells (74.5%) have expected count less than 5. The minimum expected count
is .19.
Symmetric Measures
Value Approx. Sig.
Nominal by Nominal Phi .848 .000
Cramer's V .424 .000
N of Valid Cases 293

765
Ethnicity * Ahmad Shah Baba Crosstab
Ahmad Shah Baba
Total .0 1.0 2.0 3.0 4.0 5.0 6.0 7.0 8.0 9.0 10.0
Ethnicity Pashtun Count 7 3 2 8 6 123 1 0 5 5 15 175
Expected Count 9.5 3.0 6.0 12.0 9.5 78.3 5.0 5.0 11.0 7.0 28.9 175.0
Tajik Count 3 3 2 5 5 20 8 8 14 5 35 108
Expected Count 5.8 1.8 3.7 7.4 5.8 48.3 3.1 3.1 6.8 4.3 17.8 108.0
Hazara Count 7 0 7 7 7 10 0 0 0 1 4 43
Expected Count 2.3 .7 1.5 2.9 2.3 19.2 1.2 1.2 2.7 1.7 7.1 43.0
Uzbek Count 0 0 1 1 0 1 1 1 1 3 4 13
Expected Count .7 .2 .4 .9 .7 5.8 .4 .4 .8 .5 2.1 13.0
Other Count 2 0 0 3 1 3 0 1 2 0 0 12
Expected Count .6 .2 .4 .8 .6 5.4 .3 .3 .8 .5 2.0 12.0
Total Count 19 6 12 24 19 157 10 10 22 14 58 351
Expected Count 19.0 6.0 12.0 24.0 19.0 157.0 10.0 10.0 22.0 14.0 58.0 351.0
Chi-Square Tests
Value df
Asymp. Sig. (2-
sided)
Pearson Chi-Square 206.257a 40 .000
Likelihood Ratio 191.837 40 .000
Linear-by-Linear Association .014 1 .906
N of Valid Cases 351
a. 37 cells (67.3%) have expected count less than 5. The minimum expected count
is .21.
Symmetric Measures
Value Approx. Sig.
Nominal by Nominal Phi .767 .000
Cramer's V .383 .000
N of Valid Cases 351

766

767
Ethnicity * Zahir Khan Crosstab
Zahir Khan
Total .0 1.0 2.0 3.0 4.0 5.0 6.0 7.0 8.0 9.0 10.0
Ethnicity Pashtun Count 14 8 12 30 28 39 3 2 4 1 9 150
Expected Count 18.1 12.2 14.5 21.3 21.3 26.3 5.0 7.3 8.2 2.7 13.1 150.0
Tajik Count 11 9 13 8 13 9 4 11 12 4 15 109
Expected Count 13.2 8.9 10.5 15.5 15.5 19.1 3.6 5.3 5.9 2.0 9.5 109.0
Hazara Count 14 6 5 8 3 6 0 0 1 0 3 46
Expected Count 5.6 3.8 4.4 6.5 6.5 8.1 1.5 2.2 2.5 .8 4.0 46.0
Uzbek Count 0 2 1 0 0 2 4 2 1 1 2 15
Expected Count 1.8 1.2 1.5 2.1 2.1 2.6 .5 .7 .8 .3 1.3 15.0
Other Count 1 2 1 1 3 2 0 1 0 0 0 11
Expected Count 1.3 .9 1.1 1.6 1.6 1.9 .4 .5 .6 .2 1.0 11.0
Total Count 40 27 32 47 47 58 11 16 18 6 29 331
Expected Count 40.0 27.0 32.0 47.0 47.0 58.0 11.0 16.0 18.0 6.0 29.0 331.0
Chi-Square Tests
Value df
Asymp. Sig. (2-
sided)
Pearson Chi-Square 116.019a 40 .000
Likelihood Ratio 108.120 40 .000
Linear-by-Linear Association .082 1 .774
N of Valid Cases 331
a. 33 cells (60.0%) have expected count less than 5. The minimum expected count
is .20.
Symmetric Measures
Value Approx. Sig.
Nominal by Nominal Phi .592 .000
Cramer's V .296 .000
N of Valid Cases 331

768

769
Ethnicity * Amanullah Khan Crosstab
Amanullah Khan
Total .0 1.0 2.0 3.0 4.0 5.0 6.0 7.0 8.0 9.0 10.0
Ethnicity Pashtun Count 4 4 2 6 22 95 0 1 4 5 16 159
Expected Count 5.0 6.0 4.1 7.8 16.5 60.0 2.7 7.3 11.0 6.9 31.6 159.0
Tajik Count 3 3 5 3 6 20 6 8 16 8 41 119
Expected Count 3.8 4.5 3.1 5.8 12.3 44.9 2.1 5.5 8.2 5.1 23.7 119.0
Hazara Count 4 4 2 6 6 13 0 1 1 0 4 41
Expected Count 1.3 1.5 1.1 2.0 4.3 15.5 .7 1.9 2.8 1.8 8.2 41.0
Uzbek Count 0 1 0 0 0 1 0 5 2 2 5 16
Expected Count .5 .6 .4 .8 1.7 6.0 .3 .7 1.1 .7 3.2 16.0
Other Count 0 1 0 2 2 2 0 1 1 0 3 12
Expected Count .4 .4 .3 .6 1.2 4.5 .2 .6 .8 .5 2.4 12.0
Total Count 11 13 9 17 36 131 6 16 24 15 69 347
Expected Count 11.0 13.0 9.0 17.0 36.0 131.0 6.0 16.0 24.0 15.0 69.0 347.0
Chi-Square Tests
Value df
Asymp. Sig. (2-
sided)
Pearson Chi-Square 166.604a 40 .000
Likelihood Ratio 158.721 40 .000
Linear-by-Linear Association 3.028 1 .082
N of Valid Cases 347
a. 36 cells (65.5%) have expected count less than 5. The minimum expected count
is .21.
Symmetric Measures
Value Approx. Sig.
Nominal by Nominal Phi .693 .000
Cramer's V .346 .000
N of Valid Cases 347

770

771
Ethnicity * Dr Najib Crosstab
Dr Najib
Total .0 1.0 2.0 3.0 4.0 5.0 6.0 7.0 8.0 9.0 10.0
Ethnicity Pashtun Count 9 5 1 13 17 86 2 1 4 3 19 160
Expected Count 7.3 7.8 3.5 12.1 13.8 55.6 5.2 2.6 9.1 7.8 35.4 160.0
Tajik Count 4 7 5 5 2 20 6 5 15 10 45 124
Expected Count 5.7 6.0 2.7 9.4 10.7 43.1 4.0 2.0 7.0 6.0 27.4 124.0
Hazara Count 4 3 2 9 12 17 3 0 0 2 4 56
Expected Count 2.6 2.7 1.2 4.2 4.8 19.5 1.8 .9 3.2 2.7 12.4 56.0
Uzbek Count 0 0 0 0 0 1 0 0 1 3 13 18
Expected Count .8 .9 .4 1.4 1.6 6.3 .6 .3 1.0 .9 4.0 18.0
Other Count 0 3 0 1 1 5 1 0 1 0 1 13
Expected Count .6 .6 .3 1.0 1.1 4.5 .4 .2 .7 .6 2.9 13.0
Total Count 17 18 8 28 32 129 12 6 21 18 82 371
Expected Count 17.0 18.0 8.0 28.0 32.0 129.0 12.0 6.0 21.0 18.0 82.0 371.0
Chi-Square Tests
Value df
Asymp. Sig. (2-
sided)
Pearson Chi-Square 166.506a 40 .000
Likelihood Ratio 167.253 40 .000
Linear-by-Linear Association 3.834 1 .050
N of Valid Cases 371
a. 35 cells (63.6%) have expected count less than 5. The minimum expected count
is .21.
Symmetric Measures
Value Approx. Sig.
Nominal by Nominal Phi .670 .000
Cramer's V .335 .000
N of Valid Cases 371
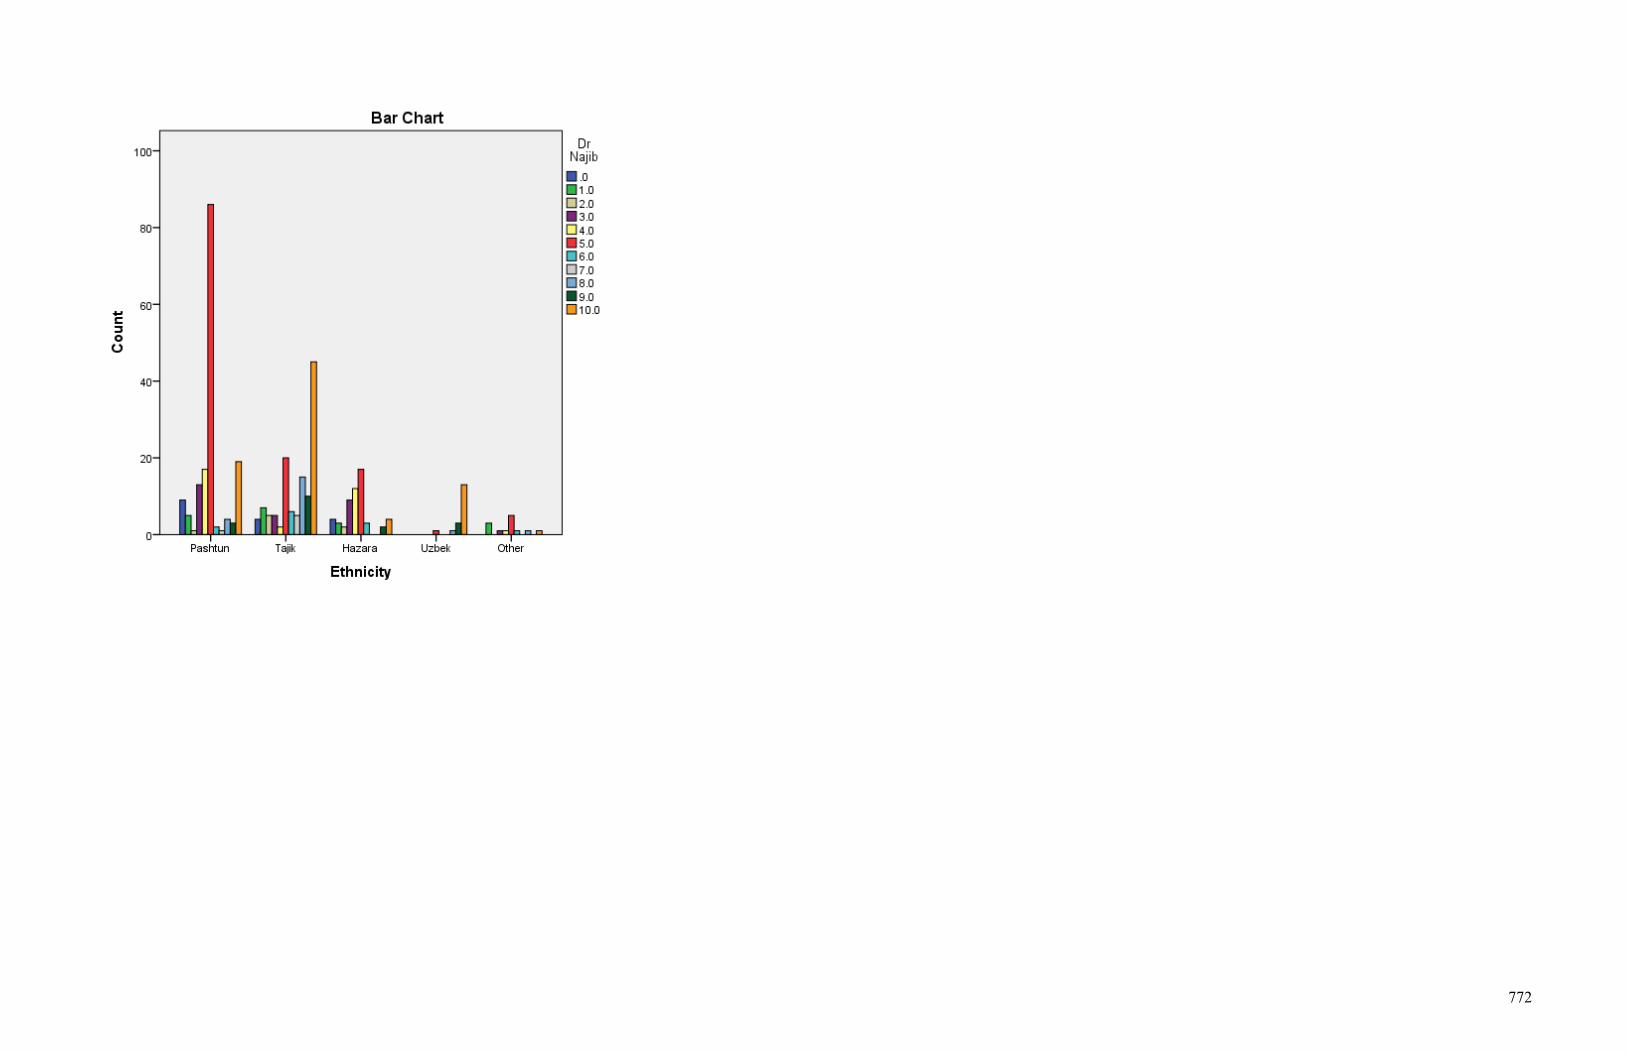
772

773
Ethnicity * Abdul Rahman Khan Crosstab
Abdul Rahman Khan
Total .0 1.0 2.0 3.0 4.0 5.0 6.0 7.0 8.0 9.0 10.0
Ethnicity Pashtun Count 15 4 10 20 14 48 1 7 2 1 3 125
Expected Count 25.4 15.1 8.0 13.3 12.5 29.8 2.7 7.1 5.3 1.8 4.0 125.0
Tajik Count 11 18 5 7 11 11 3 7 8 3 4 88
Expected Count 17.9 10.6 5.6 9.4 8.8 21.0 1.9 5.0 3.8 1.3 2.8 88.0
Hazara Count 28 4 1 2 2 5 0 0 0 0 1 43
Expected Count 8.7 5.2 2.8 4.6 4.3 10.3 .9 2.4 1.8 .6 1.4 43.0
Uzbek Count 0 6 0 0 1 2 1 2 0 0 1 13
Expected Count 2.6 1.6 .8 1.4 1.3 3.1 .3 .7 .6 .2 .4 13.0
Other Count 3 2 2 1 0 1 1 0 2 0 0 12
Expected Count 2.4 1.5 .8 1.3 1.2 2.9 .3 .7 .5 .2 .4 12.0
Total Count 57 34 18 30 28 67 6 16 12 4 9 281
Expected Count 57.0 34.0 18.0 30.0 28.0 67.0 6.0 16.0 12.0 4.0 9.0 281.0
Chi-Square Tests
Value df
Asymp. Sig. (2-
sided)
Pearson Chi-Square 145.280a 40 .000
Likelihood Ratio 136.593 40 .000
Linear-by-Linear Association 10.152 1 .001
N of Valid Cases 281
a. 37 cells (67.3%) have expected count less than 5. The minimum expected count
is .17.
Symmetric Measures
Value Approx. Sig.
Nominal by Nominal Phi .719 .000
Cramer's V .360 .000
N of Valid Cases 281

774

775
Ethnicity * Dawood Khan Crosstab
Dawood Khan
Total .0 1.0 2.0 3.0 4.0 5.0 6.0 7.0 8.0 9.0 10.0
Ethnicity Pashtun Count 6 3 8 13 19 82 2 1 5 7 11 157
Expected Count 6.0 7.4 7.4 10.7 17.1 53.3 5.1 5.1 13.0 8.8 23.2 157.0
Tajik Count 4 7 6 6 6 15 3 9 13 10 34 113
Expected Count 4.3 5.3 5.3 7.7 12.3 38.3 3.7 3.7 9.3 6.3 16.7 113.0
Hazara Count 3 4 1 4 10 14 2 0 1 0 3 42
Expected Count 1.6 2.0 2.0 2.8 4.6 14.2 1.4 1.4 3.5 2.4 6.2 42.0
Uzbek Count 0 2 0 0 1 0 2 0 7 1 2 15
Expected Count .6 .7 .7 1.0 1.6 5.1 .5 .5 1.2 .8 2.2 15.0
Other Count 0 0 1 0 1 4 2 1 2 1 0 12
Expected Count .5 .6 .6 .8 1.3 4.1 .4 .4 1.0 .7 1.8 12.0
Total Count 13 16 16 23 37 115 11 11 28 19 50 339
Expected Count 13.0 16.0 16.0 23.0 37.0 115.0 11.0 11.0 28.0 19.0 50.0 339.0
Chi-Square Tests
Value df
Asymp. Sig. (2-
sided)
Pearson Chi-Square 156.508a 40 .000
Likelihood Ratio 151.560 40 .000
Linear-by-Linear Association 2.872 1 .090
N of Valid Cases 339
a. 33 cells (60.0%) have expected count less than 5. The minimum expected count
is .39.
Symmetric Measures
Value Approx. Sig.
Nominal by Nominal Phi .679 .000
Cramer's V .340 .000
N of Valid Cases 339

776

777
Ethnicity * Hamid Karzai Crosstab
Hamid Karzai
Total .0 1.0 2.0 3.0 4.0 5.0 6.0 7.0 8.0 9.0 10.0
Ethnicity Pashtun Count 11 6 6 12 26 80 1 5 2 2 10 161
Expected Count 11.3 11.3 10.9 15.7 21.8 54.1 4.8 7.4 5.2 4.4 14.0 161.0
Tajik Count 10 12 11 11 11 25 8 8 7 8 17 128
Expected Count 9.0 9.0 8.7 12.5 17.3 43.0 3.8 5.9 4.2 3.5 11.1 128.0
Hazara Count 5 5 6 11 9 12 0 1 0 0 3 52
Expected Count 3.7 3.7 3.5 5.1 7.0 17.5 1.6 2.4 1.7 1.4 4.5 52.0
Uzbek Count 0 3 2 1 0 4 0 3 2 0 2 17
Expected Count 1.2 1.2 1.2 1.7 2.3 5.7 .5 .8 .6 .5 1.5 17.0
Other Count 0 0 0 1 4 3 2 0 1 0 0 11
Expected Count .8 .8 .7 1.1 1.5 3.7 .3 .5 .4 .3 1.0 11.0
Total Count 26 26 25 36 50 124 11 17 12 10 32 369
Expected Count 26.0 26.0 25.0 36.0 50.0 124.0 11.0 17.0 12.0 10.0 32.0 369.0
Chi-Square Tests
Value df
Asymp. Sig. (2-
sided)
Pearson Chi-Square 109.886a 40 .000
Likelihood Ratio 109.992 40 .000
Linear-by-Linear Association .169 1 .681
N of Valid Cases 369
a. 34 cells (61.8%) have expected count less than 5. The minimum expected count
is .30.
Symmetric Measures
Value Approx. Sig.
Nominal by Nominal Phi .546 .000
Cramer's V .273 .000
N of Valid Cases 369

778

779
Ethnicity * Ashraf Ghani Ahmadzai Crosstab
Ashraf Ghani Ahmadzai
Total .0 1.0 2.0 3.0 4.0 5.0 6.0 7.0 8.0 9.0 10.0
Ethnicity Pashtun Count 13 6 7 15 18 67 3 2 3 0 3 137
Expected Count 16.0 15.5 9.5 15.5 14.5 41.5 5.5 5.5 5.0 3.0 5.5 137.0
Tajik Count 12 9 7 10 5 9 3 5 7 4 7 78
Expected Count 9.1 8.8 5.4 8.8 8.3 23.6 3.1 3.1 2.8 1.7 3.1 78.0
Hazara Count 7 12 5 5 1 5 1 0 0 1 1 38
Expected Count 4.4 4.3 2.6 4.3 4.0 11.5 1.5 1.5 1.4 .8 1.5 38.0
Uzbek Count 0 2 0 0 3 0 3 2 0 1 0 11
Expected Count 1.3 1.2 .8 1.2 1.2 3.3 .4 .4 .4 .2 .4 11.0
Other Count 0 2 0 1 2 2 1 2 0 0 0 10
Expected Count 1.2 1.1 .7 1.1 1.1 3.0 .4 .4 .4 .2 .4 10.0
Total Count 32 31 19 31 29 83 11 11 10 6 11 274
Expected Count 32.0 31.0 19.0 31.0 29.0 83.0 11.0 11.0 10.0 6.0 11.0 274.0
Chi-Square Tests
Value df
Asymp. Sig. (2-
sided)
Pearson Chi-Square 131.071a 40 .000
Likelihood Ratio 126.931 40 .000
Linear-by-Linear Association .906 1 .341
N of Valid Cases 274
a. 38 cells (69.1%) have expected count less than 5. The minimum expected count
is .22.
Symmetric Measures
Value Approx. Sig.
Nominal by Nominal Phi .692 .000
Cramer's V .346 .000
N of Valid Cases 274

780

781
Frequencies Statistics
Ramazan
Bashar Dost Shukria Barakzai Malaly Joya Fawzia Koofee Habiba Sarabee
Dr Seema Samar
Semeen Barakzai
N Valid 314 250 217 212 179 209 148
Missing 254 318 351 356 389 359 420Mean 5.019 4.036 3.696 4.462 3.687 3.775 2.851Median 5.000 4.000 4.000 4.000 3.000 4.000 2.000Mode 5.0 5.0 5.0 10.0 .0 5.0 .0a
Std. Deviation 2.8329 2.8543 2.9705 3.3121 2.9476 2.6858 2.7215Skewness .300 .494 .668 .410 .570 .546 1.076Std. Error of Skewness .138 .154 .165 .167 .182 .168 .199Kurtosis -.532 -.411 -.275 -1.010 -.557 -.094 .587Std. Error of Kurtosis .274 .307 .329 .333 .361 .335 .396Minimum .0 .0 .0 .0 .0 .0 .0Maximum 10.0 10.0 10.0 10.0 10.0 10.0 10.0
a. Multiple modes exist. The smallest value is shown Frequency Table
Ramazan Bashar Dost
Frequency Percent Valid Percent Cumulative
Percent
Valid .0 21 3.7 6.7 6.7
1.0 12 2.1 3.8 10.5
2.0 23 4.0 7.3 17.8
3.0 28 4.9 8.9 26.8
4.0 47 8.3 15.0 41.7
5.0 97 17.1 30.9 72.6
6.0 6 1.1 1.9 74.5
7.0 10 1.8 3.2 77.7
8.0 19 3.3 6.1 83.8
9.0 7 1.2 2.2 86.0
10.0 44 7.7 14.0 100.0
Total 314 55.3 100.0
Missing System 254 44.7
Total 568 100.0

782
Shukria Barakzai
Frequency Percent Valid Percent Cumulative
Percent
Valid .0 31 5.5 12.4 12.4
1.0 26 4.6 10.4 22.8
2.0 22 3.9 8.8 31.6
3.0 31 5.5 12.4 44.0
4.0 32 5.6 12.8 56.8
5.0 54 9.5 21.6 78.4
6.0 11 1.9 4.4 82.8
7.0 7 1.2 2.8 85.6
8.0 10 1.8 4.0 89.6
9.0 7 1.2 2.8 92.4
10.0 19 3.3 7.6 100.0
Total 250 44.0 100.0
Missing System 318 56.0
Total 568 100.0
Malaly Joya
Frequency Percent Valid Percent Cumulative
Percent
Valid .0 36 6.3 16.6 16.6
1.0 30 5.3 13.8 30.4
2.0 17 3.0 7.8 38.2
3.0 22 3.9 10.1 48.4
4.0 30 5.3 13.8 62.2
5.0 46 8.1 21.2 83.4
6.0 2 .4 .9 84.3
7.0 5 .9 2.3 86.6
8.0 6 1.1 2.8 89.4
9.0 3 .5 1.4 90.8
10.0 20 3.5 9.2 100.0
Total 217 38.2 100.0
Missing System 351 61.8
Total 568 100.0

783
Fawzia Koofee
Frequency Percent Valid Percent Cumulative
Percent
Valid .0 27 4.8 12.7 12.7
1.0 20 3.5 9.4 22.2
2.0 24 4.2 11.3 33.5
3.0 23 4.0 10.8 44.3
4.0 23 4.0 10.8 55.2
5.0 31 5.5 14.6 69.8
6.0 7 1.2 3.3 73.1
7.0 7 1.2 3.3 76.4
8.0 13 2.3 6.1 82.5
9.0 3 .5 1.4 84.0
10.0 34 6.0 16.0 100.0
Total 212 37.3 100.0
Missing System 356 62.7
Total 568 100.0
Habiba Sarabee
Frequency Percent Valid Percent Cumulative
Percent
Valid .0 30 5.3 16.8 16.8
1.0 21 3.7 11.7 28.5
2.0 24 4.2 13.4 41.9
3.0 19 3.3 10.6 52.5
4.0 14 2.5 7.8 60.3
5.0 28 4.9 15.6 76.0
6.0 15 2.6 8.4 84.4
7.0 2 .4 1.1 85.5
8.0 12 2.1 6.7 92.2
9.0 2 .4 1.1 93.3
10.0 12 2.1 6.7 100.0
Total 179 31.5 100.0
Missing System 389 68.5
Total 568 100.0

784
Dr Seema Samar
Frequency Percent Valid Percent Cumulative
Percent
Valid .0 27 4.8 12.9 12.9
1.0 24 4.2 11.5 24.4
2.0 23 4.0 11.0 35.4
3.0 16 2.8 7.7 43.1
4.0 36 6.3 17.2 60.3
5.0 48 8.5 23.0 83.3
6.0 9 1.6 4.3 87.6
7.0 3 .5 1.4 89.0
8.0 7 1.2 3.3 92.3
9.0 4 .7 1.9 94.3
10.0 12 2.1 5.7 100.0
Total 209 36.8 100.0
Missing System 359 63.2
Total 568 100.0
Semeen Barakzai
Frequency Percent Valid Percent Cumulative
Percent
Valid .0 31 5.5 20.9 20.9
1.0 31 5.5 20.9 41.9
2.0 19 3.3 12.8 54.7
3.0 15 2.6 10.1 64.9
4.0 12 2.1 8.1 73.0
5.0 25 4.4 16.9 89.9
7.0 2 .4 1.4 91.2
8.0 3 .5 2.0 93.2
9.0 3 .5 2.0 95.3
10.0 7 1.2 4.7 100.0
Total 148 26.1 100.0
Missing System 420 73.9
Total 568 100.0

785
Pie Chart
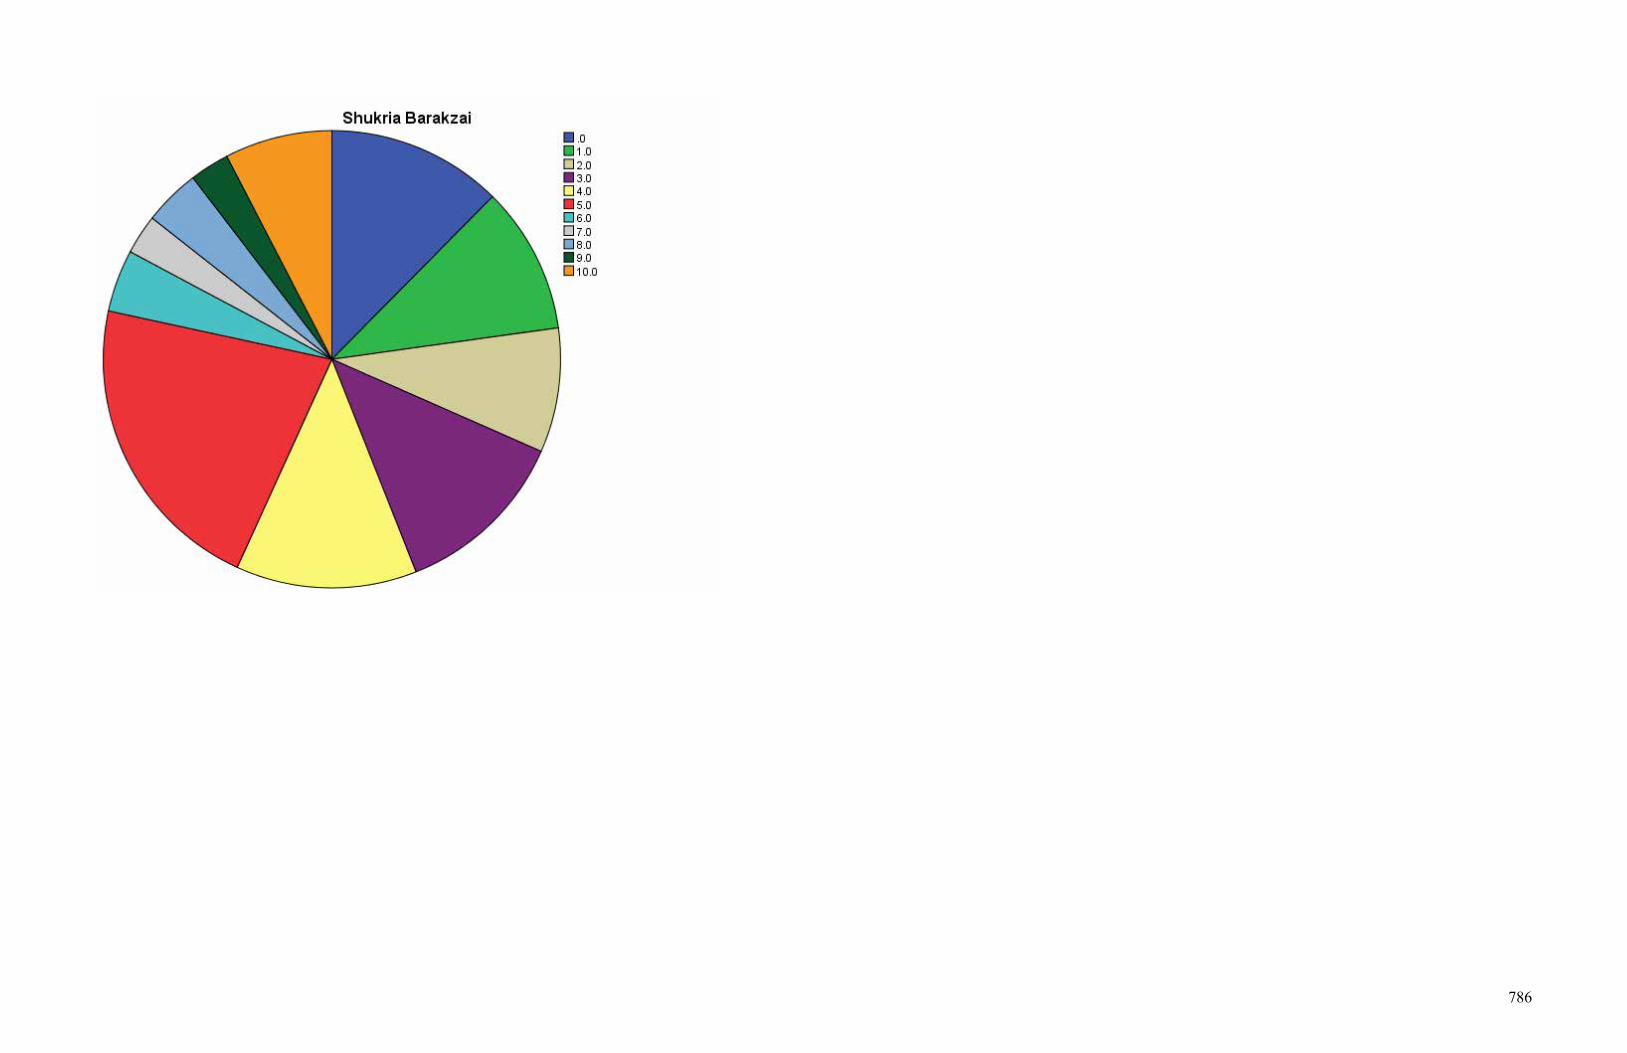
786

787

788

789

790

791

792
Crosstabs Case Processing Summary
Cases
Valid Missing Total
N Percent N Percent N Percent
Ethnicity * Ramazan Bashar
Dost 314 55.3% 254 44.7% 568 100.0%
Ethnicity * Shukria Barakzai 250 44.0% 318 56.0% 568 100.0%
Ethnicity * Malaly Joya 217 38.2% 351 61.8% 568 100.0%
Ethnicity * Fawzia Koofee 212 37.3% 356 62.7% 568 100.0%
Ethnicity * Habiba Sarabee 179 31.5% 389 68.5% 568 100.0%
Ethnicity * Dr Seema Samar 209 36.8% 359 63.2% 568 100.0%
Ethnicity * Semeen Barakzai 148 26.1% 420 73.9% 568 100.0%
Ethnicity * Ramazan Bashar Dost
Crosstab
Ramazan Bashar Dost
Total .0 1.0 2.0 3.0 4.0 5.0 6.0 7.0 8.0 9.0 10.0
Ethnicity Pashtun Count 8 5 9 19 25 59 0 1 2 0 10 138
Expected Count 9.2 5.3 10.1 12.3 20.7 42.6 2.6 4.4 8.4 3.1 19.3 138.0
Tajik Count 9 7 8 4 12 13 6 6 12 3 23 103
Expected Count 6.9 3.9 7.5 9.2 15.4 31.8 2.0 3.3 6.2 2.3 14.4 103.0
Hazara Count 2 0 5 3 9 24 0 1 1 3 1 49
Expected Count 3.3 1.9 3.6 4.4 7.3 15.1 .9 1.6 3.0 1.1 6.9 49.0
Uzbek Count 0 0 1 0 0 0 0 2 3 1 8 15
Expected Count 1.0 .6 1.1 1.3 2.2 4.6 .3 .5 .9 .3 2.1 15.0
Other Count 2 0 0 2 1 1 0 0 1 0 2 9
Expected Count .6 .3 .7 .8 1.3 2.8 .2 .3 .5 .2 1.3 9.0
Total Count 21 12 23 28 47 97 6 10 19 7 44 314
Expected Count 21.0 12.0 23.0 28.0 47.0 97.0 6.0 10.0 19.0 7.0 44.0 314.0

793
Chi-Square Tests
Value df
Asymp. Sig. (2-
sided)
Pearson Chi-Square 133.923a 40 .000
Likelihood Ratio 144.075 40 .000
Linear-by-Linear Association 11.969 1 .001
N of Valid Cases 314
a. 37 cells (67.3%) have expected count less than 5. The minimum expected count
is .17.
Symmetric Measures
Value Approx. Sig.
Nominal by Nominal Phi .653 .000
Cramer's V .327 .000
N of Valid Cases 314

794
Ethnicity * Shukria Barakzai Crosstab
Shukria Barakzai
Total .0 1.0 2.0 3.0 4.0 5.0 6.0 7.0 8.0 9.0 10.0
Ethnicity Pashtun Count 15 7 11 18 18 31 1 0 0 1 5 107
Expected Count 13.3 11.1 9.4 13.3 13.7 23.1 4.7 3.0 4.3 3.0 8.1 107.0
Tajik Count 10 13 4 5 9 16 7 5 8 2 10 89
Expected Count 11.0 9.3 7.8 11.0 11.4 19.2 3.9 2.5 3.6 2.5 6.8 89.0
Hazara Count 4 5 4 7 4 4 1 0 0 2 1 32
Expected Count 4.0 3.3 2.8 4.0 4.1 6.9 1.4 .9 1.3 .9 2.4 32.0
Uzbek Count 0 1 1 1 0 1 1 2 2 1 3 13
Expected Count 1.6 1.4 1.1 1.6 1.7 2.8 .6 .4 .5 .4 1.0 13.0
Other Count 2 0 2 0 1 2 1 0 0 1 0 9
Expected Count 1.1 .9 .8 1.1 1.2 1.9 .4 .3 .4 .3 .7 9.0
Total Count 31 26 22 31 32 54 11 7 10 7 19 250
Expected Count 31.0 26.0 22.0 31.0 32.0 54.0 11.0 7.0 10.0 7.0 19.0 250.0
Chi-Square Tests
Value df
Asymp. Sig. (2-
sided)
Pearson Chi-Square 80.767a 40 .000
Likelihood Ratio 87.586 40 .000
Linear-by-Linear Association 3.583 1 .058
N of Valid Cases 250
a. 40 cells (72.7%) have expected count less than 5. The minimum expected count
is .25.
Symmetric Measures
Value Approx. Sig.
Nominal by Nominal Phi .568 .000
Cramer's V .284 .000
N of Valid Cases 250

795

796
Ethnicity * Malaly Joya Crosstab
Malaly Joya
Total .0 1.0 2.0 3.0 4.0 5.0 6.0 7.0 8.0 9.0 10.0
Ethnicity Pashtun Count 17 9 10 10 17 32 0 2 0 0 6 103
Expected Count 17.1 14.2 8.1 10.4 14.2 21.8 .9 2.4 2.8 1.4 9.5 103.0
Tajik Count 11 14 3 4 9 12 2 1 3 2 7 68
Expected Count 11.3 9.4 5.3 6.9 9.4 14.4 .6 1.6 1.9 .9 6.3 68.0
Hazara Count 6 6 4 4 3 1 0 0 1 0 1 26
Expected Count 4.3 3.6 2.0 2.6 3.6 5.5 .2 .6 .7 .4 2.4 26.0
Uzbek Count 1 0 0 2 0 0 0 1 2 1 4 11
Expected Count 1.8 1.5 .9 1.1 1.5 2.3 .1 .3 .3 .2 1.0 11.0
Other Count 1 1 0 2 1 1 0 1 0 0 2 9
Expected Count 1.5 1.2 .7 .9 1.2 1.9 .1 .2 .2 .1 .8 9.0
Total Count 36 30 17 22 30 46 2 5 6 3 20 217
Expected Count 36.0 30.0 17.0 22.0 30.0 46.0 2.0 5.0 6.0 3.0 20.0 217.0
Chi-Square Tests
Value df
Asymp. Sig. (2-
sided)
Pearson Chi-Square 75.514a 40 .001
Likelihood Ratio 74.272 40 .001
Linear-by-Linear Association 3.544 1 .060
N of Valid Cases 217
a. 40 cells (72.7%) have expected count less than 5. The minimum expected count
is .08.
Symmetric Measures
Value Approx. Sig.
Nominal by Nominal Phi .590 .001
Cramer's V .295 .001
N of Valid Cases 217

797

798
Ethnicity * Fawzia Koofee Crosstab
Fawzia Koofee
Total .0 1.0 2.0 3.0 4.0 5.0 6.0 7.0 8.0 9.0 10.0
Ethnicity Pashtun Count 14 5 11 15 9 13 1 0 1 1 5 75
Expected Count 9.6 7.1 8.5 8.1 8.1 11.0 2.5 2.5 4.6 1.1 12.0 75.0
Tajik Count 9 9 6 2 7 15 5 4 10 1 22 90
Expected Count 11.5 8.5 10.2 9.8 9.8 13.2 3.0 3.0 5.5 1.3 14.4 90.0
Hazara Count 1 6 4 5 6 0 0 1 0 1 3 27
Expected Count 3.4 2.5 3.1 2.9 2.9 3.9 .9 .9 1.7 .4 4.3 27.0
Uzbek Count 1 0 1 0 1 2 0 2 2 0 4 13
Expected Count 1.7 1.2 1.5 1.4 1.4 1.9 .4 .4 .8 .2 2.1 13.0
Other Count 2 0 2 1 0 1 1 0 0 0 0 7
Expected Count .9 .7 .8 .8 .8 1.0 .2 .2 .4 .1 1.1 7.0
Total Count 27 20 24 23 23 31 7 7 13 3 34 212
Expected Count 27.0 20.0 24.0 23.0 23.0 31.0 7.0 7.0 13.0 3.0 34.0 212.0
Chi-Square Tests
Value df
Asymp. Sig. (2-
sided)
Pearson Chi-Square 80.424a 40 .000
Likelihood Ratio 91.563 40 .000
Linear-by-Linear Association 2.926 1 .087
N of Valid Cases 212
a. 40 cells (72.7%) have expected count less than 5. The minimum expected count
is .10.
Symmetric Measures
Value Approx. Sig.
Nominal by Nominal Phi .616 .000
Cramer's V .308 .000
N of Valid Cases 212

799
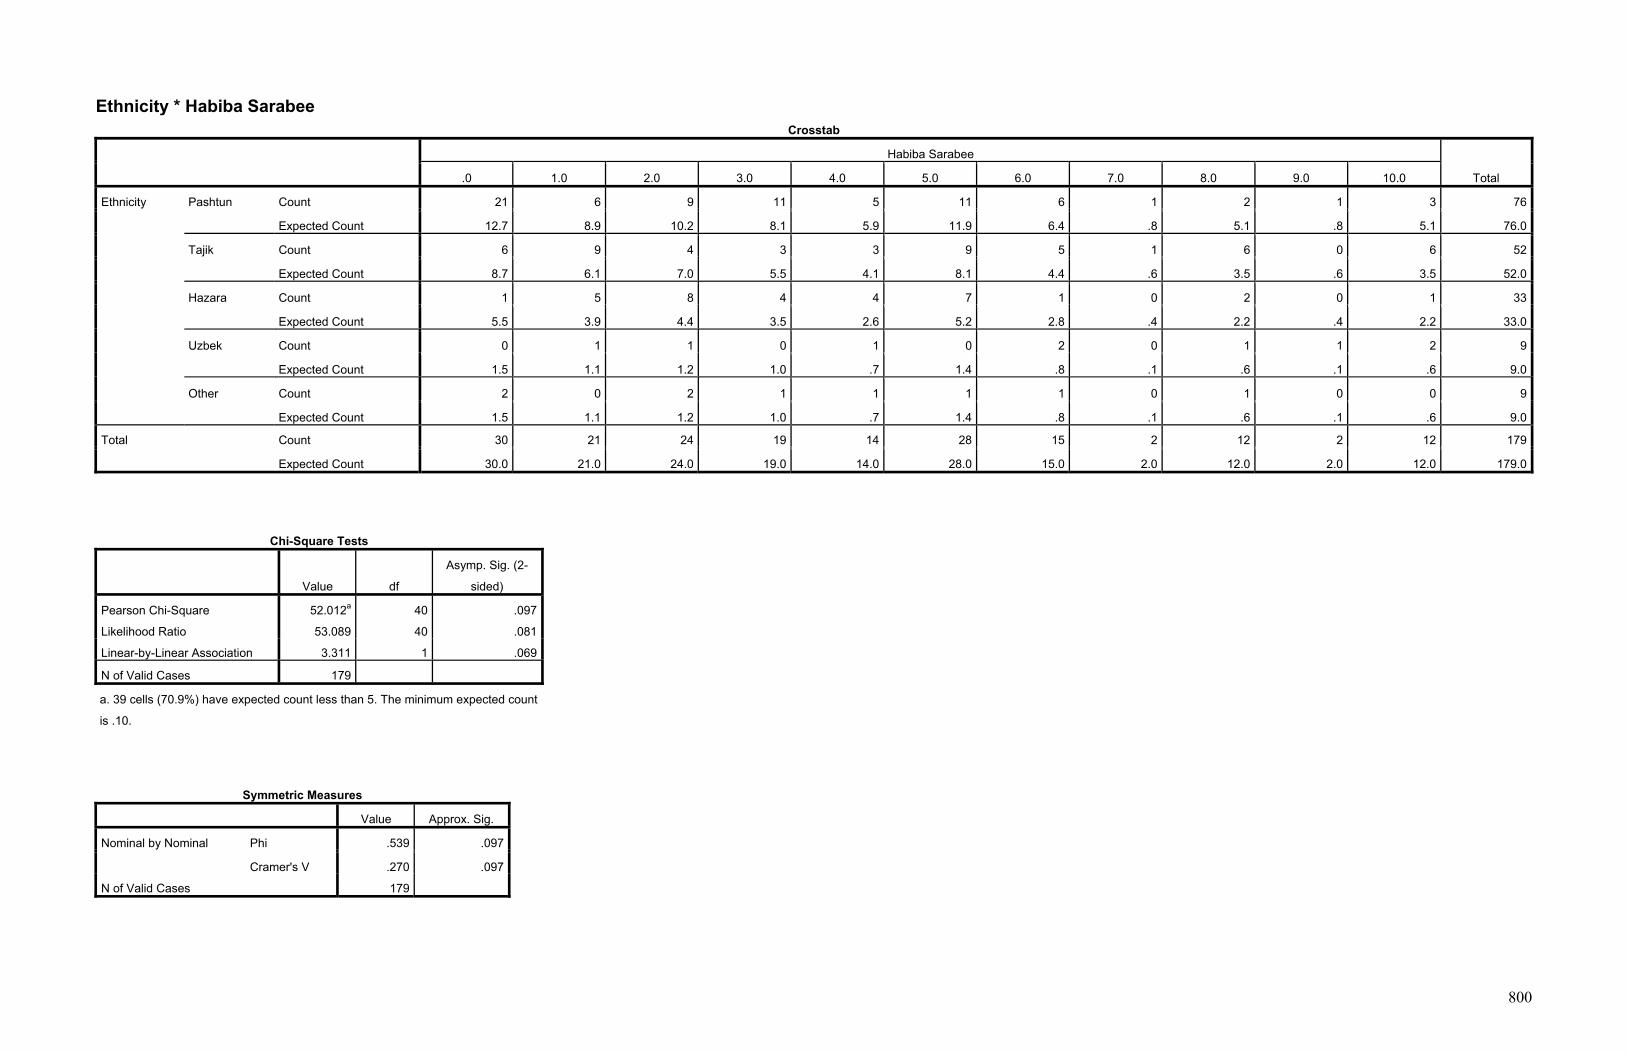
800
Ethnicity * Habiba Sarabee Crosstab
Habiba Sarabee
Total .0 1.0 2.0 3.0 4.0 5.0 6.0 7.0 8.0 9.0 10.0
Ethnicity Pashtun Count 21 6 9 11 5 11 6 1 2 1 3 76
Expected Count 12.7 8.9 10.2 8.1 5.9 11.9 6.4 .8 5.1 .8 5.1 76.0
Tajik Count 6 9 4 3 3 9 5 1 6 0 6 52
Expected Count 8.7 6.1 7.0 5.5 4.1 8.1 4.4 .6 3.5 .6 3.5 52.0
Hazara Count 1 5 8 4 4 7 1 0 2 0 1 33
Expected Count 5.5 3.9 4.4 3.5 2.6 5.2 2.8 .4 2.2 .4 2.2 33.0
Uzbek Count 0 1 1 0 1 0 2 0 1 1 2 9
Expected Count 1.5 1.1 1.2 1.0 .7 1.4 .8 .1 .6 .1 .6 9.0
Other Count 2 0 2 1 1 1 1 0 1 0 0 9
Expected Count 1.5 1.1 1.2 1.0 .7 1.4 .8 .1 .6 .1 .6 9.0
Total Count 30 21 24 19 14 28 15 2 12 2 12 179
Expected Count 30.0 21.0 24.0 19.0 14.0 28.0 15.0 2.0 12.0 2.0 12.0 179.0
Chi-Square Tests
Value df
Asymp. Sig. (2-
sided)
Pearson Chi-Square 52.012a 40 .097
Likelihood Ratio 53.089 40 .081
Linear-by-Linear Association 3.311 1 .069
N of Valid Cases 179
a. 39 cells (70.9%) have expected count less than 5. The minimum expected count
is .10.
Symmetric Measures
Value Approx. Sig.
Nominal by Nominal Phi .539 .097
Cramer's V .270 .097
N of Valid Cases 179

801

802
Ethnicity * Dr Seema Samar Crosstab
Dr Seema Samar
Total .0 1.0 2.0 3.0 4.0 5.0 6.0 7.0 8.0 9.0 10.0
Ethnicity Pashtun Count 15 5 15 8 15 17 2 0 0 0 2 79
Expected Count 10.2 9.1 8.7 6.0 13.6 18.1 3.4 1.1 2.6 1.5 4.5 79.0
Tajik Count 9 14 7 2 3 14 3 2 3 1 8 66
Expected Count 8.5 7.6 7.3 5.1 11.4 15.2 2.8 .9 2.2 1.3 3.8 66.0
Hazara Count 1 2 1 4 16 15 1 0 1 2 1 44
Expected Count 5.7 5.1 4.8 3.4 7.6 10.1 1.9 .6 1.5 .8 2.5 44.0
Uzbek Count 0 1 0 0 1 1 2 1 3 0 1 10
Expected Count 1.3 1.1 1.1 .8 1.7 2.3 .4 .1 .3 .2 .6 10.0
Other Count 2 2 0 2 1 1 1 0 0 1 0 10
Expected Count 1.3 1.1 1.1 .8 1.7 2.3 .4 .1 .3 .2 .6 10.0
Total Count 27 24 23 16 36 48 9 3 7 4 12 209
Expected Count 27.0 24.0 23.0 16.0 36.0 48.0 9.0 3.0 7.0 4.0 12.0 209.0
Chi-Square Tests
Value df
Asymp. Sig. (2-
sided)
Pearson Chi-Square 107.991a 40 .000
Likelihood Ratio 99.755 40 .000
Linear-by-Linear Association 8.788 1 .003
N of Valid Cases 209
a. 39 cells (70.9%) have expected count less than 5. The minimum expected count
is .14.
Symmetric Measures
Value Approx. Sig.
Nominal by Nominal Phi .719 .000
Cramer's V .359 .000
N of Valid Cases 209

803

804
Ethnicity * Semeen Barakzai Crosstab
Semeen Barakzai
Total .0 1.0 2.0 3.0 4.0 5.0 7.0 8.0 9.0 10.0
Ethnicity Pashtun Count 18 11 12 7 9 10 0 1 0 2 70
Expected Count 14.7 14.7 9.0 7.1 5.7 11.8 .9 1.4 1.4 3.3 70.0
Tajik Count 10 13 3 3 2 7 2 1 2 3 46
Expected Count 9.6 9.6 5.9 4.7 3.7 7.8 .6 .9 .9 2.2 46.0
Hazara Count 1 7 2 4 1 3 0 1 1 0 20
Expected Count 4.2 4.2 2.6 2.0 1.6 3.4 .3 .4 .4 .9 20.0
Uzbek Count 0 0 1 0 0 2 0 0 0 2 5
Expected Count 1.0 1.0 .6 .5 .4 .8 .1 .1 .1 .2 5.0
Other Count 2 0 1 1 0 3 0 0 0 0 7
Expected Count 1.5 1.5 .9 .7 .6 1.2 .1 .1 .1 .3 7.0
Total Count 31 31 19 15 12 25 2 3 3 7 148
Expected Count 31.0 31.0 19.0 15.0 12.0 25.0 2.0 3.0 3.0 7.0 148.0
Chi-Square Tests
Value df
Asymp. Sig. (2-
sided)
Pearson Chi-Square 50.279a 36 .057
Likelihood Ratio 49.004 36 .073
Linear-by-Linear Association 3.572 1 .059
N of Valid Cases 148
a. 40 cells (80.0%) have expected count less than 5. The minimum expected count
is .07.
Symmetric Measures
Value Approx. Sig.
Nominal by Nominal Phi .583 .057
Cramer's V .291 .057
N of Valid Cases 148

805

806
Frequencies Statistics
Abdul Ali Mazari Mohqeq Karim Khalili Gen. Dostum
Sultan Ali
Kishtmand
N Valid 240 244 245 277 165
Missing 328 324 323 291 403
Mean 2.654 2.869 2.551 3.372 3.333
Median 2.000 2.500 2.000 3.000 3.000
Mode .0 .0 .0 .0 .0
Std. Deviation 2.5860 2.6292 2.2694 3.0708 2.7923
Skewness .824 .816 .729 .646 .607
Std. Error of Skewness .157 .156 .156 .146 .189
Kurtosis -.021 .036 .106 -.573 -.380
Std. Error of Kurtosis .313 .310 .310 .292 .376
Minimum .0 .0 .0 .0 .0
Maximum 10.0 10.0 10.0 10.0 10.0
Frequency Table
Abdul Ali Mazari
Frequency Percent Valid Percent
Cumulative
Percent
Valid .0 68 12.0 28.3 28.3
1.0 44 7.7 18.3 46.7
2.0 16 2.8 6.7 53.3
3.0 24 4.2 10.0 63.3
4.0 24 4.2 10.0 73.3
5.0 37 6.5 15.4 88.8
6.0 7 1.2 2.9 91.7
7.0 6 1.1 2.5 94.2
8.0 7 1.2 2.9 97.1
9.0 2 .4 .8 97.9
10.0 5 .9 2.1 100.0
Total 240 42.3 100.0 Missing System 328 57.7 Total 568 100.0

807
Mohqeq
Frequency Percent Valid Percent
Cumulative
Percent
Valid .0 61 10.7 25.0 25.0
1.0 34 6.0 13.9 38.9
2.0 27 4.8 11.1 50.0
3.0 32 5.6 13.1 63.1
4.0 26 4.6 10.7 73.8
5.0 32 5.6 13.1 86.9
6.0 5 .9 2.0 88.9
7.0 9 1.6 3.7 92.6
8.0 10 1.8 4.1 96.7
9.0 1 .2 .4 97.1
10.0 7 1.2 2.9 100.0
Total 244 43.0 100.0 Missing System 324 57.0 Total 568 100.0
Karim Khalili
Frequency Percent Valid Percent
Cumulative
Percent
Valid .0 62 10.9 25.3 25.3
1.0 40 7.0 16.3 41.6
2.0 24 4.2 9.8 51.4
3.0 38 6.7 15.5 66.9
4.0 27 4.8 11.0 78.0
5.0 36 6.3 14.7 92.7
6.0 4 .7 1.6 94.3
7.0 7 1.2 2.9 97.1
8.0 3 .5 1.2 98.4
9.0 2 .4 .8 99.2
10.0 2 .4 .8 100.0
Total 245 43.1 100.0 Missing System 323 56.9 Total 568 100.0

808
Gen. Dostum
Frequency Percent Valid Percent
Cumulative
Percent
Valid .0 74 13.0 26.7 26.7
1.0 26 4.6 9.4 36.1
2.0 22 3.9 7.9 44.0
3.0 35 6.2 12.6 56.7
4.0 24 4.2 8.7 65.3
5.0 40 7.0 14.4 79.8
6.0 7 1.2 2.5 82.3
7.0 11 1.9 4.0 86.3
8.0 16 2.8 5.8 92.1
9.0 4 .7 1.4 93.5
10.0 18 3.2 6.5 100.0
Total 277 48.8 100.0 Missing System 291 51.2 Total 568 100.0
Sultan Ali Kishtmand
Frequency Percent Valid Percent
Cumulative
Percent
Valid .0 37 6.5 22.4 22.4
1.0 15 2.6 9.1 31.5
2.0 18 3.2 10.9 42.4
3.0 20 3.5 12.1 54.5
4.0 21 3.7 12.7 67.3
5.0 26 4.6 15.8 83.0
6.0 6 1.1 3.6 86.7
7.0 2 .4 1.2 87.9
8.0 10 1.8 6.1 93.9
9.0 5 .9 3.0 97.0
10.0 5 .9 3.0 100.0
Total 165 29.0 100.0 Missing System 403 71.0 Total 568 100.0

809
Pie Chart

810
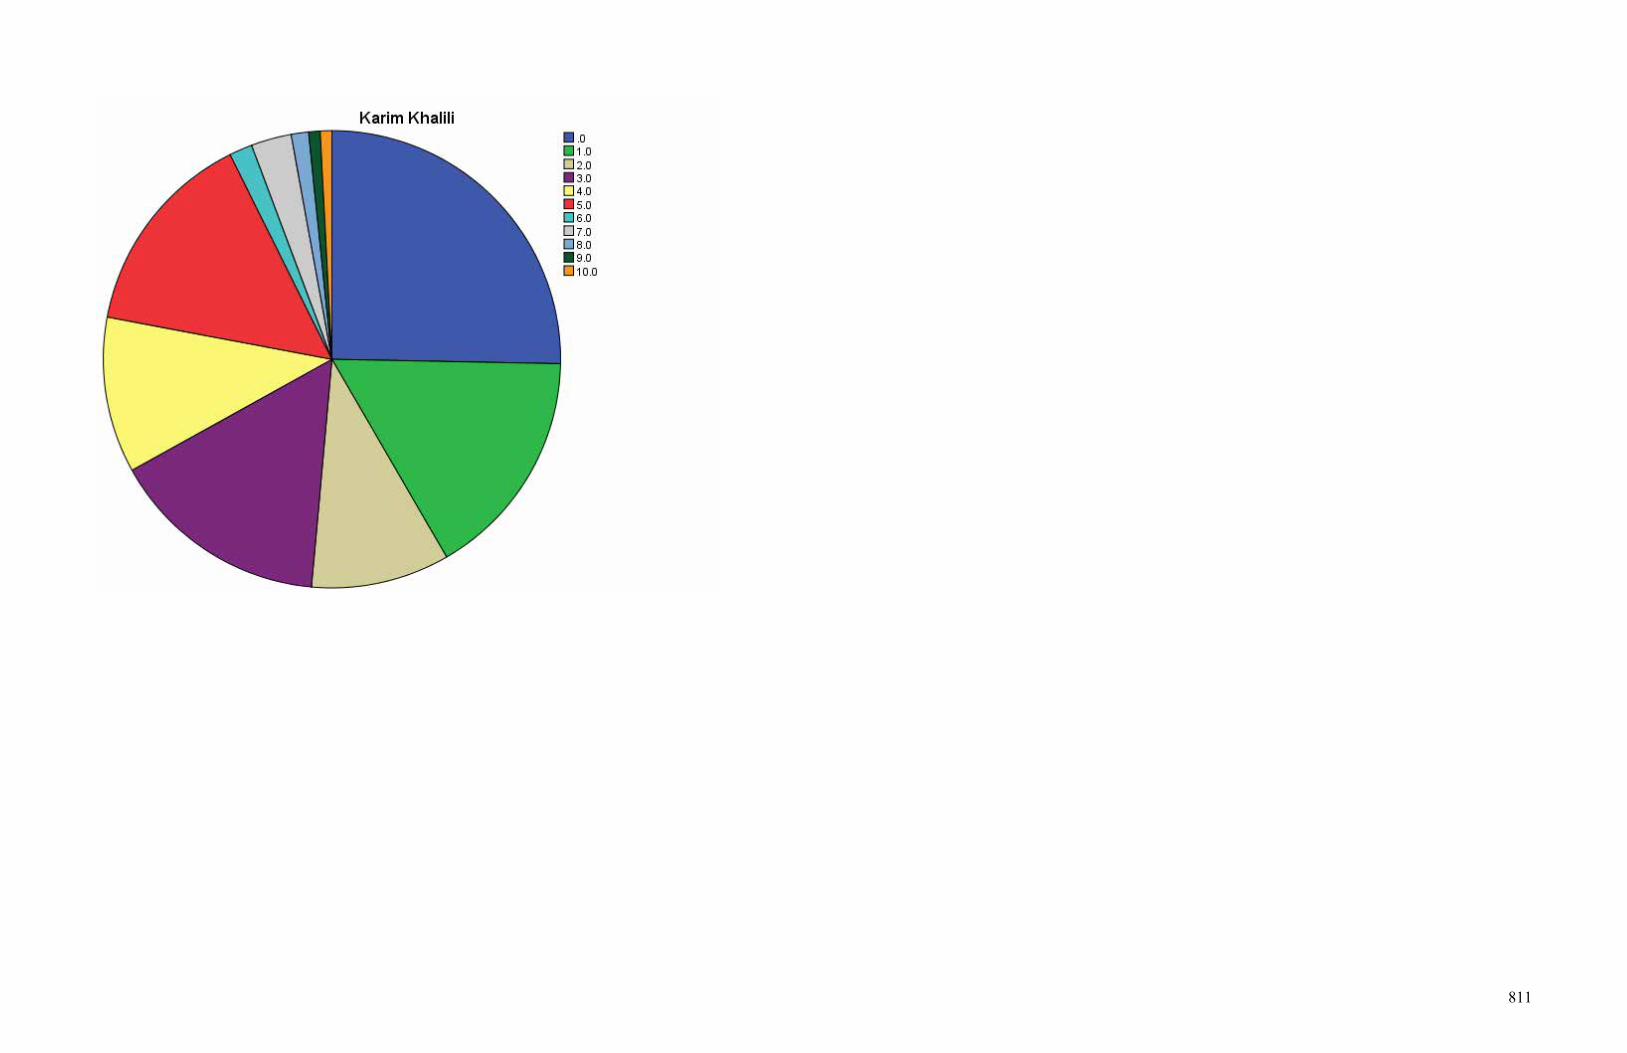
811

812

813

814
Crosstabs Case Processing Summary
Cases
Valid Missing Total
N Percent N Percent N Percent
Ethnicity * Abdul Ali Mazari 240 42.3% 328 57.7% 568 100.0%
Ethnicity * Mohqeq 244 43.0% 324 57.0% 568 100.0%
Ethnicity * Karim Khalili 245 43.1% 323 56.9% 568 100.0%
Ethnicity * Gen. Dostum 277 48.8% 291 51.2% 568 100.0%
Ethnicity * Sultan Ali Kishtmand 165 29.0% 403 71.0% 568 100.0%
Ethnicity * Abdul Ali Mazari
Crosstab
Abdul Ali Mazari
Total .0 1.0 2.0 3.0 4.0 5.0 6.0 7.0 8.0 9.0 10.0
Ethnicity Pashtun Count 43 18 6 12 6 4 0 0 1 0 1 91
Expected Count 25.8 16.7 6.1 9.1 9.1 14.0 2.7 2.3 2.7 .8 1.9 91.0
Tajik Count 22 20 5 9 6 5 3 4 2 1 0 77
Expected Count 21.8 14.1 5.1 7.7 7.7 11.9 2.2 1.9 2.2 .6 1.6 77.0
Hazara Count 1 3 3 2 6 26 1 1 3 0 3 49
Expected Count 13.9 9.0 3.3 4.9 4.9 7.6 1.4 1.2 1.4 .4 1.0 49.0
Uzbek Count 0 2 0 0 4 2 2 1 1 1 1 14
Expected Count 4.0 2.6 .9 1.4 1.4 2.2 .4 .4 .4 .1 .3 14.0
Other Count 2 1 2 1 2 0 1 0 0 0 0 9
Expected Count 2.6 1.7 .6 .9 .9 1.4 .3 .2 .3 .1 .2 9.0
Total Count 68 44 16 24 24 37 7 6 7 2 5 240
Expected Count 68.0 44.0 16.0 24.0 24.0 37.0 7.0 6.0 7.0 2.0 5.0 240.0
Chi-Square Tests
Value df
Asymp. Sig. (2-
sided)
Pearson Chi-Square 145.500a 40 .000
Likelihood Ratio 141.767 40 .000
Linear-by-Linear Association 44.733 1 .000
N of Valid Cases 240
a. 40 cells (72.7%) have expected count less than 5. The minimum expected count
is .08.

815
Symmetric Measures
Value Approx. Sig.
Nominal by Nominal Phi .779 .000
Cramer's V .389 .000
N of Valid Cases 240

816
Ethnicity * Mohqeq Crosstab
Mohqeq
Total .0 1.0 2.0 3.0 4.0 5.0 6.0 7.0 8.0 9.0 10.0
Ethnicity Pashtun Count 41 13 14 12 6 12 0 0 0 1 0 99
Expected Count 24.8 13.8 11.0 13.0 10.5 13.0 2.0 3.7 4.1 .4 2.8 99.0
Tajik Count 15 15 7 10 8 7 3 6 5 0 3 79
Expected Count 19.8 11.0 8.7 10.4 8.4 10.4 1.6 2.9 3.2 .3 2.3 79.0
Hazara Count 4 4 4 8 10 8 0 1 2 0 2 43
Expected Count 10.8 6.0 4.8 5.6 4.6 5.6 .9 1.6 1.8 .2 1.2 43.0
Uzbek Count 0 2 1 0 2 3 2 2 3 0 2 17
Expected Count 4.3 2.4 1.9 2.2 1.8 2.2 .3 .6 .7 .1 .5 17.0
Other Count 1 0 1 2 0 2 0 0 0 0 0 6
Expected Count 1.5 .8 .7 .8 .6 .8 .1 .2 .2 .0 .2 6.0
Total Count 61 34 27 32 26 32 5 9 10 1 7 244
Expected Count 61.0 34.0 27.0 32.0 26.0 32.0 5.0 9.0 10.0 1.0 7.0 244.0
Chi-Square Tests
Value df
Asymp. Sig. (2-
sided)
Pearson Chi-Square 89.120a 40 .000
Likelihood Ratio 96.793 40 .000
Linear-by-Linear Association 33.839 1 .000
N of Valid Cases 244
a. 39 cells (70.9%) have expected count less than 5. The minimum expected count
is .02.
Symmetric Measures
Value Approx. Sig.
Nominal by Nominal Phi .604 .000
Cramer's V .302 .000
N of Valid Cases 244
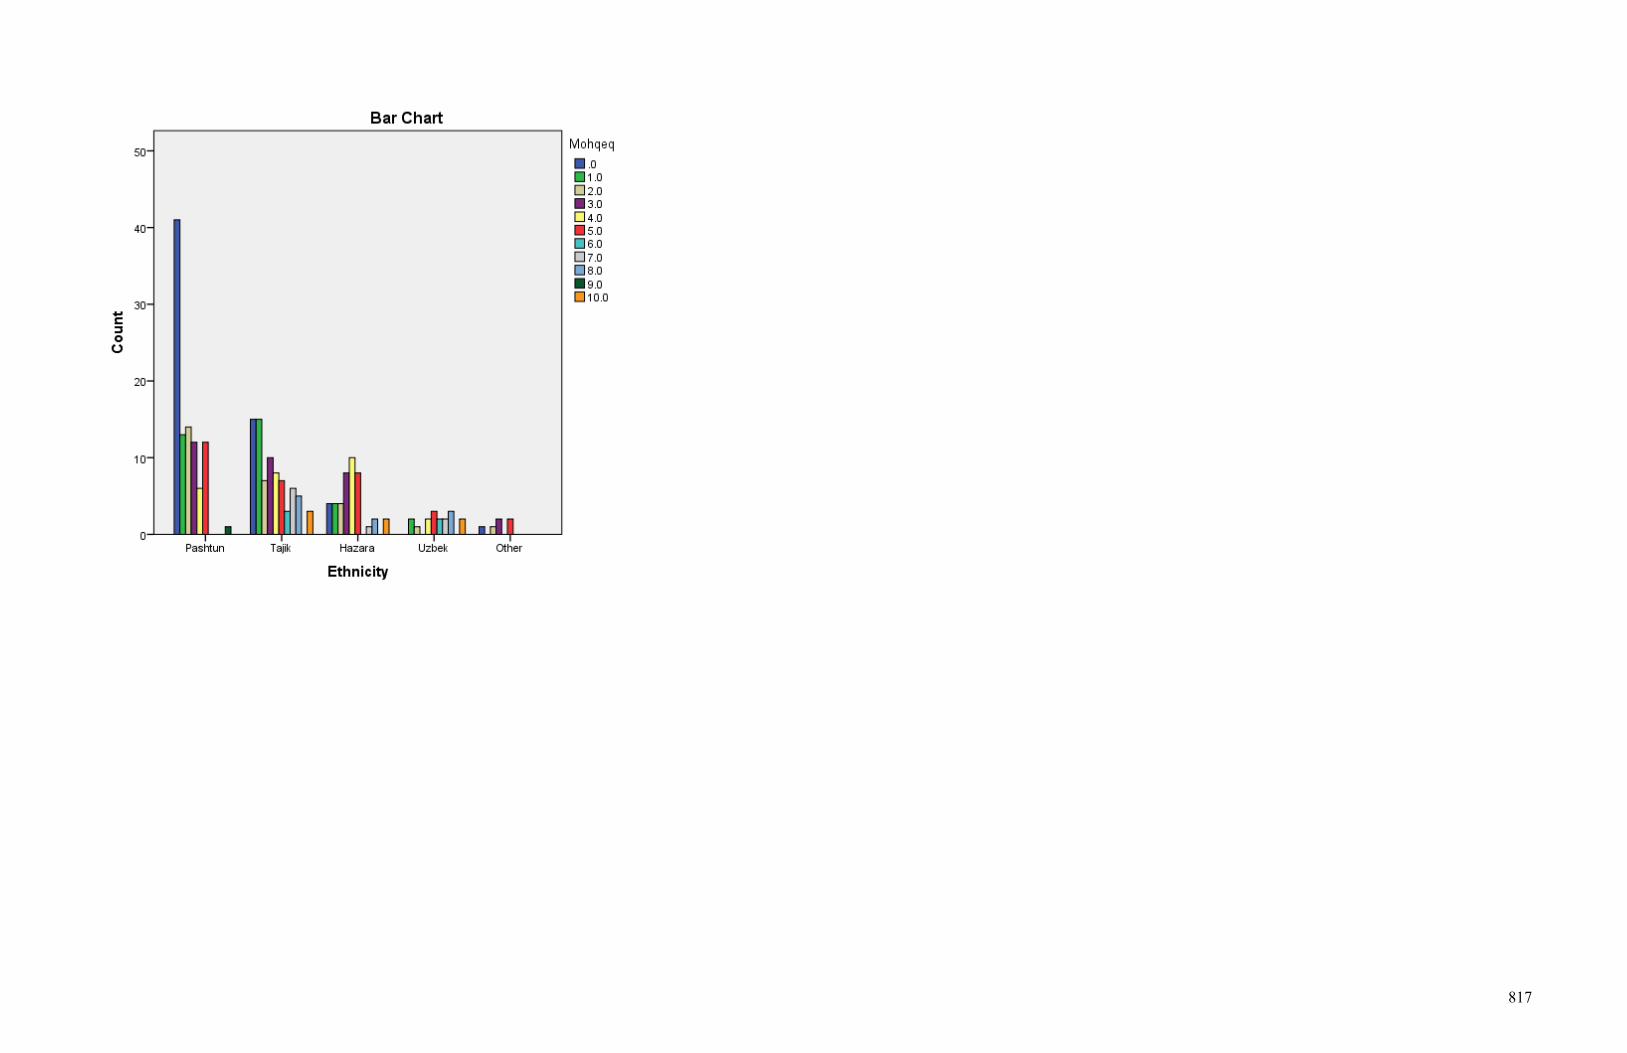
817

818
Ethnicity * Karim Khalili Crosstab
Karim Khalili
Total .0 1.0 2.0 3.0 4.0 5.0 6.0 7.0 8.0 9.0 10.0
Ethnicity Pashtun Count 38 15 13 14 8 15 0 0 0 0 1 104
Expected Count 26.3 17.0 10.2 16.1 11.5 15.3 1.7 3.0 1.3 .8 .8 104.0
Tajik Count 17 15 8 8 4 13 3 6 2 0 1 77
Expected Count 19.5 12.6 7.5 11.9 8.5 11.3 1.3 2.2 .9 .6 .6 77.0
Hazara Count 6 4 2 11 13 5 1 0 0 1 0 43
Expected Count 10.9 7.0 4.2 6.7 4.7 6.3 .7 1.2 .5 .4 .4 43.0
Uzbek Count 0 4 0 2 1 2 0 1 1 1 0 12
Expected Count 3.0 2.0 1.2 1.9 1.3 1.8 .2 .3 .1 .1 .1 12.0
Other Count 1 2 1 3 1 1 0 0 0 0 0 9
Expected Count 2.3 1.5 .9 1.4 1.0 1.3 .1 .3 .1 .1 .1 9.0
Total Count 62 40 24 38 27 36 4 7 3 2 2 245
Expected Count 62.0 40.0 24.0 38.0 27.0 36.0 4.0 7.0 3.0 2.0 2.0 245.0
Chi-Square Tests
Value df
Asymp. Sig. (2-
sided)
Pearson Chi-Square 80.445a 40 .000
Likelihood Ratio 78.100 40 .000
Linear-by-Linear Association 10.232 1 .001
N of Valid Cases 245
a. 39 cells (70.9%) have expected count less than 5. The minimum expected count
is .07.
Symmetric Measures
Value Approx. Sig.
Nominal by Nominal Phi .573 .000
Cramer's V .287 .000
N of Valid Cases 245

819

820
Ethnicity * Gen. Dostum Crosstab
Gen. Dostum
Total .0 1.0 2.0 3.0 4.0 5.0 6.0 7.0 8.0 9.0 10.0
Ethnicity Pashtun Count 51 7 12 13 4 17 2 0 0 0 5 111
Expected Count 29.7 10.4 8.8 14.0 9.6 16.0 2.8 4.4 6.4 1.6 7.2 111.0
Tajik Count 12 14 7 9 8 17 4 9 8 2 7 97
Expected Count 25.9 9.1 7.7 12.3 8.4 14.0 2.5 3.9 5.6 1.4 6.3 97.0
Hazara Count 7 3 1 11 10 5 1 0 3 0 2 43
Expected Count 11.5 4.0 3.4 5.4 3.7 6.2 1.1 1.7 2.5 .6 2.8 43.0
Uzbek Count 0 2 0 1 0 0 0 2 5 2 4 16
Expected Count 4.3 1.5 1.3 2.0 1.4 2.3 .4 .6 .9 .2 1.0 16.0
Other Count 4 0 2 1 2 1 0 0 0 0 0 10
Expected Count 2.7 .9 .8 1.3 .9 1.4 .3 .4 .6 .1 .6 10.0
Total Count 74 26 22 35 24 40 7 11 16 4 18 277
Expected Count 74.0 26.0 22.0 35.0 24.0 40.0 7.0 11.0 16.0 4.0 18.0 277.0
Chi-Square Tests
Value df
Asymp. Sig. (2-
sided)
Pearson Chi-Square 138.527a 40 .000
Likelihood Ratio 136.625 40 .000
Linear-by-Linear Association 18.898 1 .000
N of Valid Cases 277
a. 36 cells (65.5%) have expected count less than 5. The minimum expected count
is .14.
Symmetric Measures
Value Approx. Sig.
Nominal by Nominal Phi .707 .000
Cramer's V .354 .000
N of Valid Cases 277

821

822
Ethnicity * Sultan Ali Kishtmand Crosstab
Sultan Ali Kishtmand
Total .0 1.0 2.0 3.0 4.0 5.0 6.0 7.0 8.0 9.0 10.0
Ethnicity Pashtun Count 25 4 8 10 6 11 2 0 1 0 2 69
Expected Count 15.5 6.3 7.5 8.4 8.8 10.9 2.5 .8 4.2 2.1 2.1 69.0
Tajik Count 9 8 5 7 4 6 3 2 4 1 0 49
Expected Count 11.0 4.5 5.3 5.9 6.2 7.7 1.8 .6 3.0 1.5 1.5 49.0
Hazara Count 2 2 3 3 9 8 0 0 3 2 0 32
Expected Count 7.2 2.9 3.5 3.9 4.1 5.0 1.2 .4 1.9 1.0 1.0 32.0
Uzbek Count 0 0 0 0 0 1 1 0 1 2 3 8
Expected Count 1.8 .7 .9 1.0 1.0 1.3 .3 .1 .5 .2 .2 8.0
Other Count 1 1 2 0 2 0 0 0 1 0 0 7
Expected Count 1.6 .6 .8 .8 .9 1.1 .3 .1 .4 .2 .2 7.0
Total Count 37 15 18 20 21 26 6 2 10 5 5 165
Expected Count 37.0 15.0 18.0 20.0 21.0 26.0 6.0 2.0 10.0 5.0 5.0 165.0
Chi-Square Tests
Value df
Asymp. Sig. (2-
sided)
Pearson Chi-Square 99.508a 40 .000
Likelihood Ratio 80.983 40 .000
Linear-by-Linear Association 17.386 1 .000
N of Valid Cases 165
a. 42 cells (76.4%) have expected count less than 5. The minimum expected count
is .08.
Symmetric Measures
Value Approx. Sig.
Nominal by Nominal Phi .777 .000
Cramer's V .388 .000
N of Valid Cases 165

823

824
Frequencies Statistics
Mahmood Karzai Gul Agha Sherzai
Ahmad Wali
Karzai Farooq Wardak Qayoom Karzai
N Valid 186 259 194 243 175
Missing 382 309 374 325 393
Mean 2.231 3.216 2.835 3.576 2.309
Median 1.500 3.000 3.000 3.000 2.000
Mode .0 5.0 5.0 5.0 .0
Std. Deviation 2.1041 2.5744 2.3110 2.7085 2.3235
Skewness .535 .658 .196 .672 .949
Std. Error of Skewness .178 .151 .175 .156 .184
Kurtosis -.941 .146 -.986 -.024 .652
Std. Error of Kurtosis .355 .302 .347 .311 .365
Minimum .0 .0 .0 .0 .0
Maximum 8.0 10.0 10.0 10.0 10.0
Frequency Table
Mahmood Karzai
Frequency Percent Valid Percent
Cumulative
Percent
Valid .0 55 9.7 29.6 29.6
1.0 38 6.7 20.4 50.0
2.0 16 2.8 8.6 58.6
3.0 19 3.3 10.2 68.8
4.0 15 2.6 8.1 76.9
5.0 35 6.2 18.8 95.7
6.0 5 .9 2.7 98.4
7.0 1 .2 .5 98.9
8.0 2 .4 1.1 100.0
Total 186 32.7 100.0 Missing System 382 67.3 Total 568 100.0

825
Gul Agha Sherzai
Frequency Percent Valid Percent
Cumulative
Percent
Valid .0 50 8.8 19.3 19.3
1.0 35 6.2 13.5 32.8
2.0 21 3.7 8.1 40.9
3.0 34 6.0 13.1 54.1
4.0 33 5.8 12.7 66.8
5.0 57 10.0 22.0 88.8
6.0 7 1.2 2.7 91.5
7.0 4 .7 1.5 93.1
8.0 5 .9 1.9 95.0
9.0 3 .5 1.2 96.1
10.0 10 1.8 3.9 100.0
Total 259 45.6 100.0 Missing System 309 54.4 Total 568 100.0
Ahmad Wali Karzai
Frequency Percent Valid Percent
Cumulative
Percent
Valid .0 50 8.8 25.8 25.8
1.0 27 4.8 13.9 39.7
2.0 10 1.8 5.2 44.8
3.0 22 3.9 11.3 56.2
4.0 12 2.1 6.2 62.4
5.0 62 10.9 32.0 94.3
6.0 4 .7 2.1 96.4
7.0 3 .5 1.5 97.9
8.0 3 .5 1.5 99.5
10.0 1 .2 .5 100.0
Total 194 34.2 100.0 Missing System 374 65.8 Total 568 100.0

826
Farooq Wardak
Frequency Percent Valid Percent
Cumulative
Percent
Valid .0 32 5.6 13.2 13.2
1.0 38 6.7 15.6 28.8
2.0 22 3.9 9.1 37.9
3.0 34 6.0 14.0 51.9
4.0 25 4.4 10.3 62.1
5.0 52 9.2 21.4 83.5
6.0 11 1.9 4.5 88.1
7.0 5 .9 2.1 90.1
8.0 7 1.2 2.9 93.0
9.0 2 .4 .8 93.8
10.0 15 2.6 6.2 100.0
Total 243 42.8 100.0 Missing System 325 57.2 Total 568 100.0
Qayoom Karzai
Frequency Percent Valid Percent
Cumulative
Percent
Valid .0 55 9.7 31.4 31.4
1.0 32 5.6 18.3 49.7
2.0 11 1.9 6.3 56.0
3.0 25 4.4 14.3 70.3
4.0 12 2.1 6.9 77.1
5.0 32 5.6 18.3 95.4
6.0 1 .2 .6 96.0
7.0 2 .4 1.1 97.1
8.0 1 .2 .6 97.7
9.0 1 .2 .6 98.3
10.0 3 .5 1.7 100.0
Total 175 30.8 100.0 Missing System 393 69.2 Total 568 100.0

827
Pie Chart

828

829

830

831

832
Crosstabs Case Processing Summary
Cases
Valid Missing Total
N Percent N Percent N Percent
Ethnicity * Mahmood Karzai 186 32.7% 382 67.3% 568 100.0%
Ethnicity * Gul Agha Sherzai 259 45.6% 309 54.4% 568 100.0%
Ethnicity * Ahmad Wali Karzai 194 34.2% 374 65.8% 568 100.0%
Ethnicity * Farooq Wardak 243 42.8% 325 57.2% 568 100.0%
Ethnicity * Qayoom Karzai 175 30.8% 393 69.2% 568 100.0%
Ethnicity * Mahmood Karzai
Crosstab
Mahmood Karzai
Total .0 1.0 2.0 3.0 4.0 5.0 6.0 7.0 8.0
Ethnicity Pashtun Count 22 8 4 14 14 28 0 1 0 91
Expected Count 26.9 18.6 7.8 9.3 7.3 17.1 2.4 .5 1.0 91.0
Tajik Count 20 21 8 4 1 4 3 0 1 62
Expected Count 18.3 12.7 5.3 6.3 5.0 11.7 1.7 .3 .7 62.0
Hazara Count 11 5 2 1 0 1 1 0 1 22
Expected Count 6.5 4.5 1.9 2.2 1.8 4.1 .6 .1 .2 22.0
Uzbek Count 1 3 0 0 0 0 1 0 0 5
Expected Count 1.5 1.0 .4 .5 .4 .9 .1 .0 .1 5.0
Other Count 1 1 2 0 0 2 0 0 0 6
Expected Count 1.8 1.2 .5 .6 .5 1.1 .2 .0 .1 6.0
Total Count 55 38 16 19 15 35 5 1 2 186
Expected Count 55.0 38.0 16.0 19.0 15.0 35.0 5.0 1.0 2.0 186.0
Chi-Square Tests
Value df
Asymp. Sig. (2-
sided)
Pearson Chi-Square 75.206a 32 .000
Likelihood Ratio 79.036 32 .000
Linear-by-Linear Association 7.239 1 .007
N of Valid Cases 186
a. 32 cells (71.1%) have expected count less than 5. The minimum expected
count is .03.

833
Symmetric Measures
Value Approx. Sig.
Nominal by Nominal Phi .636 .000
Cramer's V .318 .000
N of Valid Cases 186

834
Ethnicity * Gul Agha Sherzai Crosstab
Gul Agha Sherzai
Total .0 1.0 2.0 3.0 4.0 5.0 6.0 7.0 8.0 9.0 10.0
Ethnicity Pashtun Count 26 8 9 25 20 42 2 0 1 0 6 139
Expected Count 26.8 18.8 11.3 18.2 17.7 30.6 3.8 2.1 2.7 1.6 5.4 139.0
Tajik Count 13 19 5 5 8 12 4 2 3 1 3 75
Expected Count 14.5 10.1 6.1 9.8 9.6 16.5 2.0 1.2 1.4 .9 2.9 75.0
Hazara Count 9 6 6 3 2 0 0 1 0 2 0 29
Expected Count 5.6 3.9 2.4 3.8 3.7 6.4 .8 .4 .6 .3 1.1 29.0
Uzbek Count 0 1 0 0 2 0 1 1 1 0 1 7
Expected Count 1.4 .9 .6 .9 .9 1.5 .2 .1 .1 .1 .3 7.0
Other Count 2 1 1 1 1 3 0 0 0 0 0 9
Expected Count 1.7 1.2 .7 1.2 1.1 2.0 .2 .1 .2 .1 .3 9.0
Total Count 50 35 21 34 33 57 7 4 5 3 10 259
Expected Count 50.0 35.0 21.0 34.0 33.0 57.0 7.0 4.0 5.0 3.0 10.0 259.0
Chi-Square Tests
Value df
Asymp. Sig. (2-
sided)
Pearson Chi-Square 89.105a 40 .000
Likelihood Ratio 89.247 40 .000
Linear-by-Linear Association .678 1 .410
N of Valid Cases 259
a. 40 cells (72.7%) have expected count less than 5. The minimum expected count
is .08.
Symmetric Measures
Value Approx. Sig.
Nominal by Nominal Phi .587 .000
Cramer's V .293 .000
N of Valid Cases 259

835

836
Ethnicity * Ahmad Wali Karzai Crosstab
Ahmad Wali Karzai
Total .0 1.0 2.0 3.0 4.0 5.0 6.0 7.0 8.0 10.0
Ethnicity Pashtun Count 19 5 5 13 10 53 2 0 1 0 108
Expected Count 27.8 15.0 5.6 12.2 6.7 34.5 2.2 1.7 1.7 .6 108.0
Tajik Count 19 16 1 6 0 5 1 2 2 1 53
Expected Count 13.7 7.4 2.7 6.0 3.3 16.9 1.1 .8 .8 .3 53.0
Hazara Count 10 3 2 2 0 3 0 1 0 0 21
Expected Count 5.4 2.9 1.1 2.4 1.3 6.7 .4 .3 .3 .1 21.0
Uzbek Count 0 3 1 1 0 0 0 0 0 0 5
Expected Count 1.3 .7 .3 .6 .3 1.6 .1 .1 .1 .0 5.0
Other Count 2 0 1 0 2 1 1 0 0 0 7
Expected Count 1.8 1.0 .4 .8 .4 2.2 .1 .1 .1 .0 7.0
Total Count 50 27 10 22 12 62 4 3 3 1 194
Expected Count 50.0 27.0 10.0 22.0 12.0 62.0 4.0 3.0 3.0 1.0 194.0
Chi-Square Tests
Value df
Asymp. Sig. (2-
sided)
Pearson Chi-Square 92.502a 36 .000
Likelihood Ratio 94.730 36 .000
Linear-by-Linear Association 10.791 1 .001
N of Valid Cases 194
a. 38 cells (76.0%) have expected count less than 5. The minimum expected count
is .03.
Symmetric Measures
Value Approx. Sig.
Nominal by Nominal Phi .691 .000
Cramer's V .345 .000
N of Valid Cases 194
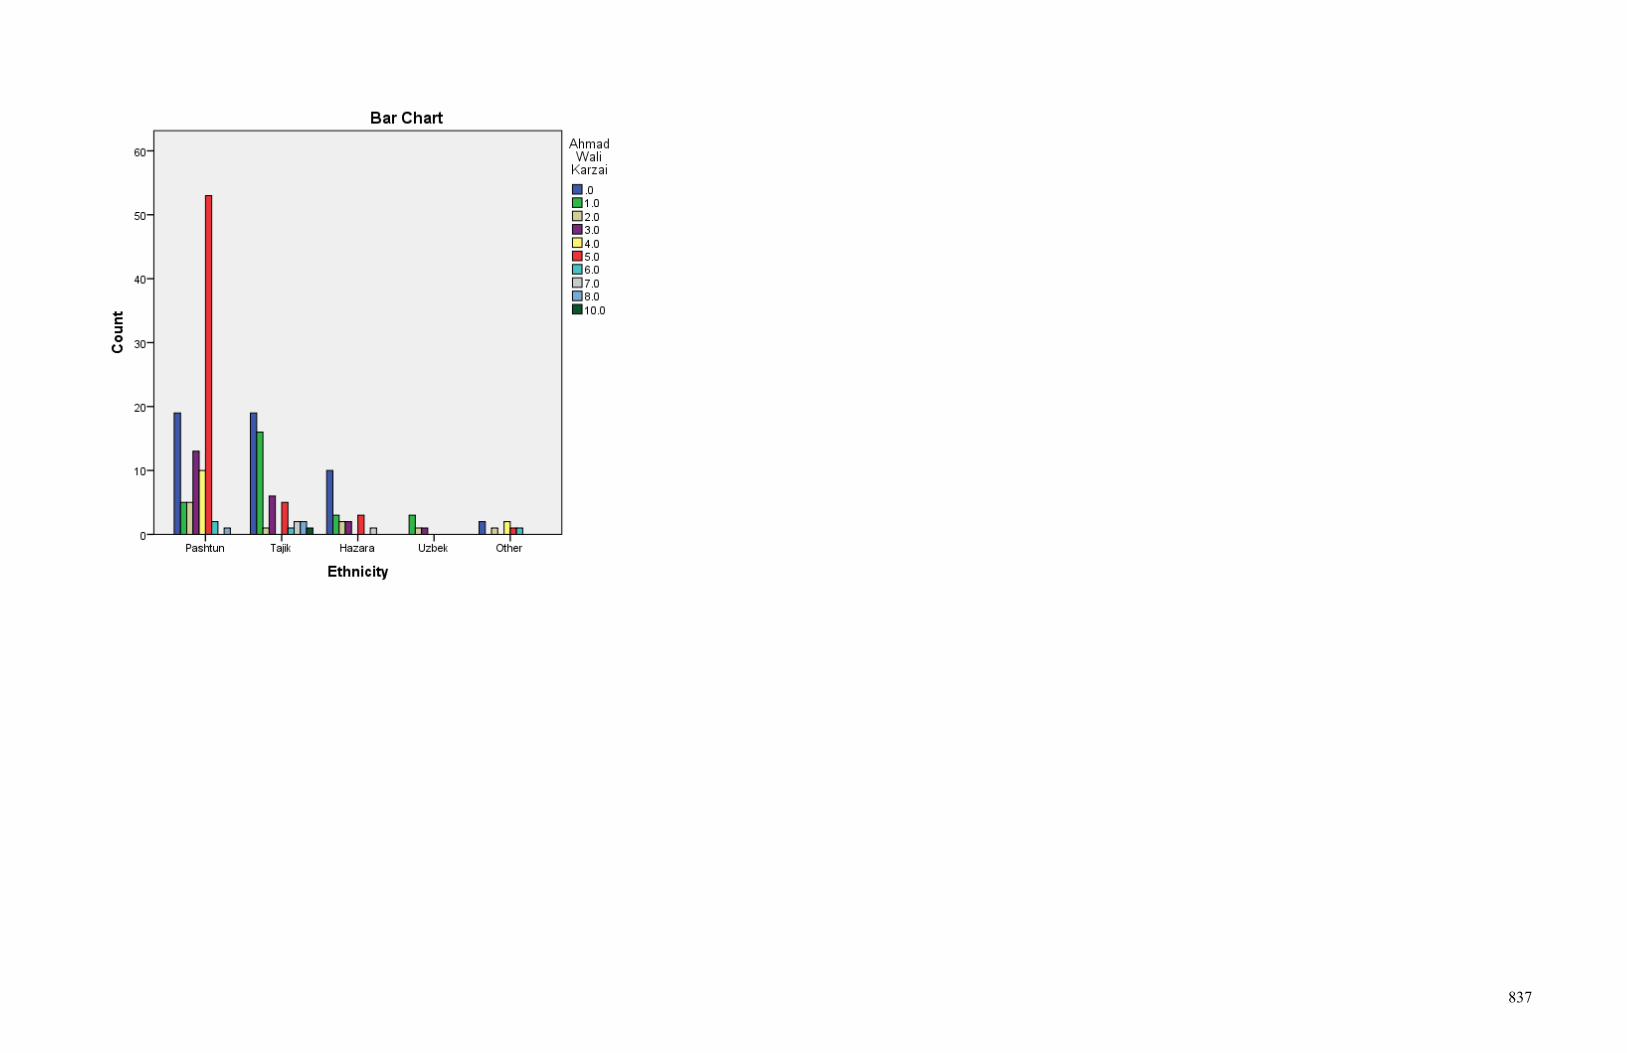
837

838
Ethnicity * Farooq Wardak Crosstab
Farooq Wardak
Total .0 1.0 2.0 3.0 4.0 5.0 6.0 7.0 8.0 9.0 10.0
Ethnicity Pashtun Count 10 9 9 16 19 43 6 0 0 1 4 117
Expected Count 15.4 18.3 10.6 16.4 12.0 25.0 5.3 2.4 3.4 1.0 7.2 117.0
Tajik Count 12 14 10 10 4 8 3 3 4 1 11 80
Expected Count 10.5 12.5 7.2 11.2 8.2 17.1 3.6 1.6 2.3 .7 4.9 80.0
Hazara Count 8 9 3 4 1 1 1 0 2 0 0 29
Expected Count 3.8 4.5 2.6 4.1 3.0 6.2 1.3 .6 .8 .2 1.8 29.0
Uzbek Count 0 5 0 1 1 0 1 1 1 0 0 10
Expected Count 1.3 1.6 .9 1.4 1.0 2.1 .5 .2 .3 .1 .6 10.0
Other Count 2 1 0 3 0 0 0 1 0 0 0 7
Expected Count .9 1.1 .6 1.0 .7 1.5 .3 .1 .2 .1 .4 7.0
Total Count 32 38 22 34 25 52 11 5 7 2 15 243
Expected Count 32.0 38.0 22.0 34.0 25.0 52.0 11.0 5.0 7.0 2.0 15.0 243.0
Chi-Square Tests
Value df
Asymp. Sig. (2-
sided)
Pearson Chi-Square 101.407a 40 .000
Likelihood Ratio 107.093 40 .000
Linear-by-Linear Association 6.618 1 .010
N of Valid Cases 243
a. 40 cells (72.7%) have expected count less than 5. The minimum expected count
is .06.
Symmetric Measures
Value Approx. Sig.
Nominal by Nominal Phi .646 .000
Cramer's V .323 .000
N of Valid Cases 243

839

840
Ethnicity * Qayoom Karzai Crosstab
Qayoom Karzai
Total .0 1.0 2.0 3.0 4.0 5.0 6.0 7.0 8.0 9.0 10.0
Ethnicity Pashtun Count 31 8 4 19 6 23 0 1 0 0 1 93
Expected Count 29.2 17.0 5.8 13.3 6.4 17.0 .5 1.1 .5 .5 1.6 93.0
Tajik Count 15 13 2 1 5 5 1 1 1 0 1 45
Expected Count 14.1 8.2 2.8 6.4 3.1 8.2 .3 .5 .3 .3 .8 45.0
Hazara Count 7 5 3 5 0 3 0 0 0 1 1 25
Expected Count 7.9 4.6 1.6 3.6 1.7 4.6 .1 .3 .1 .1 .4 25.0
Uzbek Count 2 4 0 0 0 0 0 0 0 0 0 6
Expected Count 1.9 1.1 .4 .9 .4 1.1 .0 .1 .0 .0 .1 6.0
Other Count 0 2 2 0 1 1 0 0 0 0 0 6
Expected Count 1.9 1.1 .4 .9 .4 1.1 .0 .1 .0 .0 .1 6.0
Total Count 55 32 11 25 12 32 1 2 1 1 3 175
Expected Count 55.0 32.0 11.0 25.0 12.0 32.0 1.0 2.0 1.0 1.0 3.0 175.0
Chi-Square Tests
Value df
Asymp. Sig. (2-
sided)
Pearson Chi-Square 60.080a 40 .022
Likelihood Ratio 60.751 40 .019
Linear-by-Linear Association .789 1 .374
N of Valid Cases 175
a. 44 cells (80.0%) have expected count less than 5. The minimum expected count
is .03.
Symmetric Measures
Value Approx. Sig.
Nominal by Nominal Phi .586 .022
Cramer's V .293 .022
N of Valid Cases 175

841

842
Frequencies Statistics
Omar Dawoodzai Karim Khuram Omar Zakhilwal
N Valid 141 166 180
Missing 427 402 388
Mean 2.11 1.958 2.483
Median 1.00 1.000 2.000
Mode 0 .0 1.0
Std. Deviation 2.290 2.0222 2.2335
Skewness 1.213 1.002 1.063
Std. Error of Skewness .204 .188 .181
Kurtosis 1.322 .439 1.315
Std. Error of Kurtosis .406 .375 .360
Minimum 0 .0 .0
Maximum 10 10.0 10.0
Frequency Table
Omar Dawoodzai
Frequency Percent Valid Percent
Cumulative
Percent
Valid 0 45 7.9 31.9 31.9
1 31 5.5 22.0 53.9
2 16 2.8 11.3 65.2
3 11 1.9 7.8 73.0
4 11 1.9 7.8 80.9
5 19 3.3 13.5 94.3
6 2 .4 1.4 95.7
7 3 .5 2.1 97.9
10 3 .5 2.1 100.0
Total 141 24.8 100.0 Missing System 427 75.2 Total 568 100.0

843
Karim Khuram
Frequency Percent Valid Percent
Cumulative
Percent
Valid .0 49 8.6 29.5 29.5
1.0 45 7.9 27.1 56.6
2.0 19 3.3 11.4 68.1
3.0 12 2.1 7.2 75.3
4.0 11 1.9 6.6 81.9
5.0 24 4.2 14.5 96.4
6.0 3 .5 1.8 98.2
7.0 2 .4 1.2 99.4
10.0 1 .2 .6 100.0
Total 166 29.2 100.0 Missing System 402 70.8 Total 568 100.0
Omar Zakhilwal
Frequency Percent Valid Percent
Cumulative
Percent
Valid .0 37 6.5 20.6 20.6
1.0 41 7.2 22.8 43.3
2.0 26 4.6 14.4 57.8
3.0 17 3.0 9.4 67.2
4.0 22 3.9 12.2 79.4
5.0 28 4.9 15.6 95.0
6.0 3 .5 1.7 96.7
8.0 1 .2 .6 97.2
9.0 1 .2 .6 97.8
10.0 4 .7 2.2 100.0
Total 180 31.7 100.0 Missing System 388 68.3 Total 568 100.0
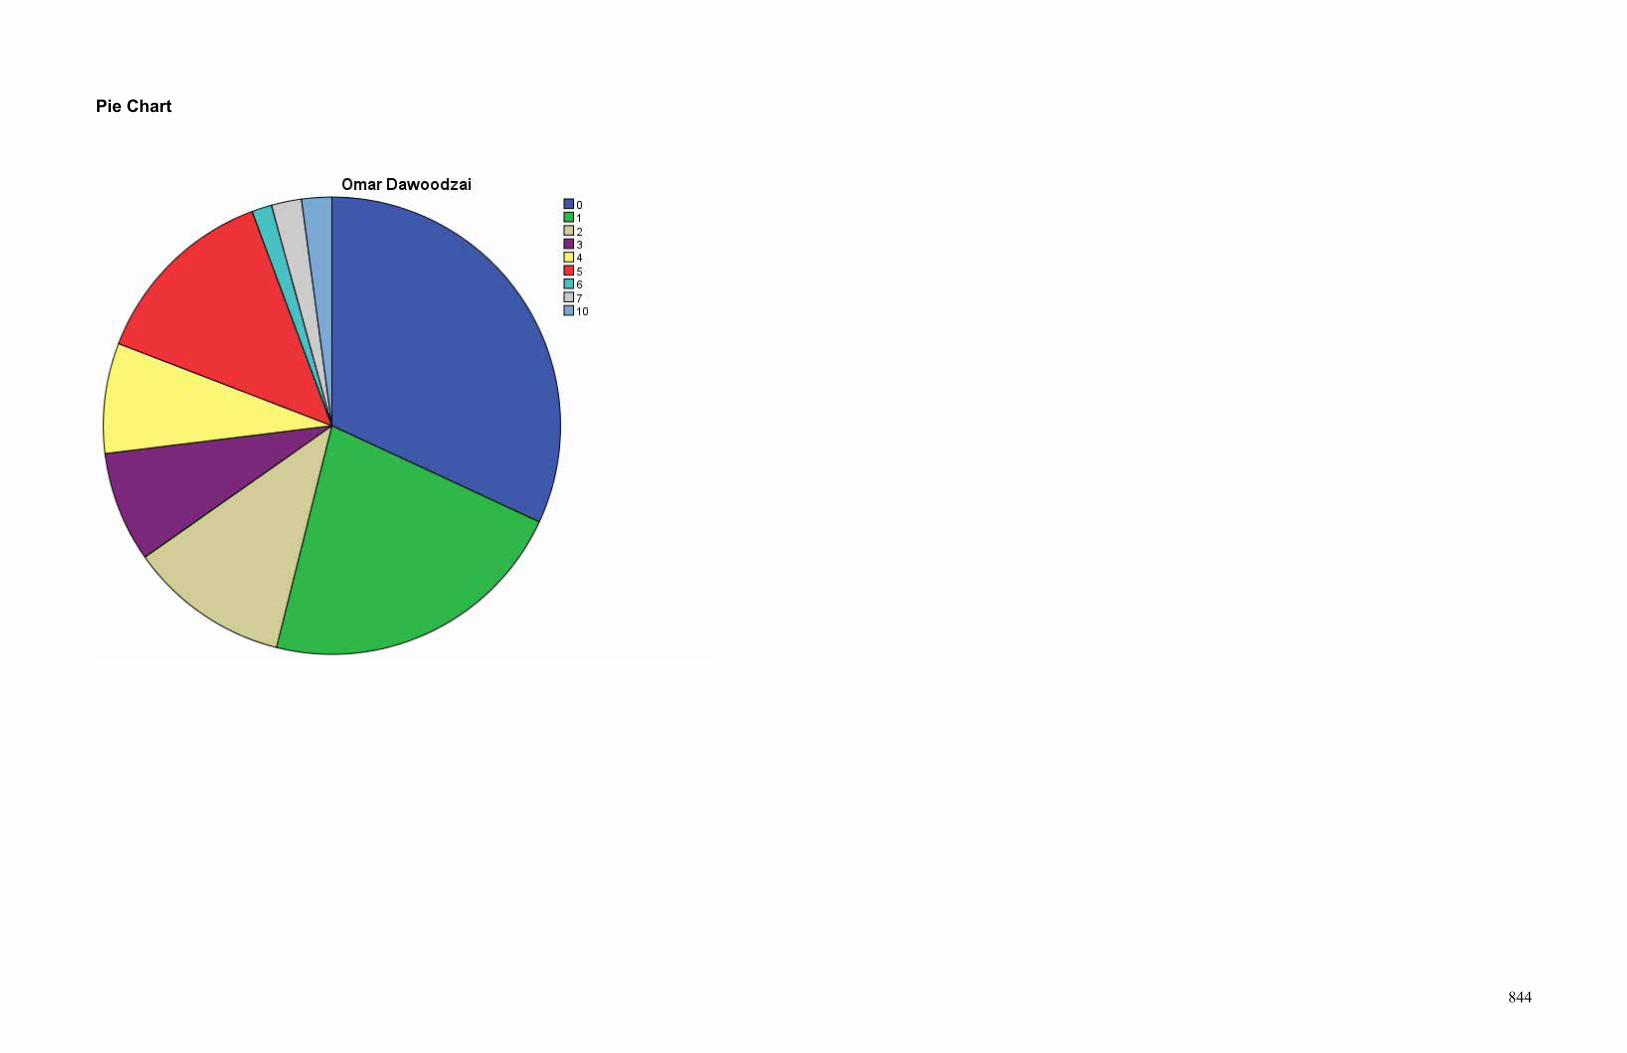
844
Pie Chart

845

846

847
Crosstabs Case Processing Summary
Cases
Valid Missing Total
N Percent N Percent N Percent
Ethnicity * Omar Dawoodzai 141 24.8% 427 75.2% 568 100.0%
Ethnicity * Karim Khuram 166 29.2% 402 70.8% 568 100.0%
Ethnicity * Omar Zakhilwal 180 31.7% 388 68.3% 568 100.0%
Ethnicity * Omar Dawoodzai
Crosstab
Omar Dawoodzai
Total 0 1 2 3 4 5 6 7 10
Ethnicity Pashtun Count 25 9 8 10 7 12 1 0 1 73
Expected Count 23.3 16.0 8.3 5.7 5.7 9.8 1.0 1.6 1.6 73.0
Tajik Count 13 13 6 1 2 2 1 2 2 42
Expected Count 13.4 9.2 4.8 3.3 3.3 5.7 .6 .9 .9 42.0
Hazara Count 6 4 1 0 0 4 0 1 0 16
Expected Count 5.1 3.5 1.8 1.2 1.2 2.2 .2 .3 .3 16.0
Uzbek Count 0 3 0 0 1 0 0 0 0 4
Expected Count 1.3 .9 .5 .3 .3 .5 .1 .1 .1 4.0
Other Count 1 2 1 0 1 1 0 0 0 6
Expected Count 1.9 1.3 .7 .5 .5 .8 .1 .1 .1 6.0
Total Count 45 31 16 11 11 19 2 3 3 141
Expected Count 45.0 31.0 16.0 11.0 11.0 19.0 2.0 3.0 3.0 141.0
Chi-Square Tests
Value df
Asymp. Sig. (2-
sided)
Pearson Chi-Square 36.680a 32 .261
Likelihood Ratio 41.995 32 .111
Linear-by-Linear Association .070 1 .791
N of Valid Cases 141
a. 35 cells (77.8%) have expected count less than 5. The minimum expected
count is .06.

848
Symmetric Measures
Value Approx. Sig.
Nominal by Nominal Phi .510 .261
Cramer's V .255 .261
N of Valid Cases 141

849
Ethnicity * Karim Khuram Crosstab
Karim Khuram
Total .0 1.0 2.0 3.0 4.0 5.0 6.0 7.0 10.0
Ethnicity Pashtun Count 22 11 10 7 8 16 0 0 1 75
Expected Count 22.1 20.3 8.6 5.4 5.0 10.8 1.4 .9 .5 75.0
Tajik Count 15 21 4 3 2 5 3 1 0 54
Expected Count 15.9 14.6 6.2 3.9 3.6 7.8 1.0 .7 .3 54.0
Hazara Count 9 8 3 1 0 3 0 1 0 25
Expected Count 7.4 6.8 2.9 1.8 1.7 3.6 .5 .3 .2 25.0
Uzbek Count 0 4 1 0 0 0 0 0 0 5
Expected Count 1.5 1.4 .6 .4 .3 .7 .1 .1 .0 5.0
Other Count 3 1 1 1 1 0 0 0 0 7
Expected Count 2.1 1.9 .8 .5 .5 1.0 .1 .1 .0 7.0
Total Count 49 45 19 12 11 24 3 2 1 166
Expected Count 49.0 45.0 19.0 12.0 11.0 24.0 3.0 2.0 1.0 166.0
Chi-Square Tests
Value df
Asymp. Sig. (2-
sided)
Pearson Chi-Square 39.159a 32 .179
Likelihood Ratio 44.263 32 .073
Linear-by-Linear Association 4.211 1 .040
N of Valid Cases 166
a. 34 cells (75.6%) have expected count less than 5. The minimum expected
count is .03.
Symmetric Measures
Value Approx. Sig.
Nominal by Nominal Phi .486 .179
Cramer's V .243 .179
N of Valid Cases 166

850

851
Ethnicity * Omar Zakhilwal Crosstab
Omar Zakhilwal
Total .0 1.0 2.0 3.0 4.0 5.0 6.0 8.0 9.0 10.0
Ethnicity Pashtun Count 17 10 10 15 15 21 2 0 0 1 91
Expected Count 18.7 20.7 13.1 8.6 11.1 14.2 1.5 .5 .5 2.0 91.0
Tajik Count 12 16 9 2 4 5 1 1 0 2 52
Expected Count 10.7 11.8 7.5 4.9 6.4 8.1 .9 .3 .3 1.2 52.0
Hazara Count 7 9 6 0 1 1 0 0 1 1 26
Expected Count 5.3 5.9 3.8 2.5 3.2 4.0 .4 .1 .1 .6 26.0
Uzbek Count 0 4 0 0 1 0 0 0 0 0 5
Expected Count 1.0 1.1 .7 .5 .6 .8 .1 .0 .0 .1 5.0
Other Count 1 2 1 0 1 1 0 0 0 0 6
Expected Count 1.2 1.4 .9 .6 .7 .9 .1 .0 .0 .1 6.0
Total Count 37 41 26 17 22 28 3 1 1 4 180
Expected Count 37.0 41.0 26.0 17.0 22.0 28.0 3.0 1.0 1.0 4.0 180.0
Chi-Square Tests
Value df
Asymp. Sig. (2-
sided)
Pearson Chi-Square 53.605a 36 .030
Likelihood Ratio 57.135 36 .014
Linear-by-Linear Association 4.778 1 .029
N of Valid Cases 180
a. 37 cells (74.0%) have expected count less than 5. The minimum expected
count is .03.
Symmetric Measures
Value Approx. Sig.
Nominal by Nominal Phi .546 .030
Cramer's V .273 .030
N of Valid Cases 180

852

853
Frequencies Statistics
Hafeezullah Amin Tarakee Babrak Karmal
N Valid 263 278 263
Missing 305 290 305
Mean 1.681 2.032 2.179
Median 1.000 1.000 1.000
Mode .0 .0 .0
Std. Deviation 2.1197 2.1885 2.5775
Skewness 1.850 1.276 1.364
Std. Error of Skewness .150 .146 .150
Kurtosis 3.771 1.539 1.257
Std. Error of Kurtosis .299 .291 .299
Minimum .0 .0 .0
Maximum 10.0 10.0 10.0
Frequency Table
Hafeezullah Amin
Frequency Percent Valid Percent
Cumulative
Percent
Valid .0 93 16.4 35.4 35.4
1.0 77 13.6 29.3 64.6
2.0 30 5.3 11.4 76.0
3.0 17 3.0 6.5 82.5
4.0 15 2.6 5.7 88.2
5.0 20 3.5 7.6 95.8
6.0 2 .4 .8 96.6
7.0 1 .2 .4 97.0
8.0 2 .4 .8 97.7
9.0 1 .2 .4 98.1
10.0 5 .9 1.9 100.0
Total 263 46.3 100.0 Missing System 305 53.7 Total 568 100.0

854
Tarakee
Frequency Percent Valid Percent
Cumulative
Percent
Valid .0 86 15.1 30.9 30.9
1.0 65 11.4 23.4 54.3
2.0 32 5.6 11.5 65.8
3.0 32 5.6 11.5 77.3
4.0 16 2.8 5.8 83.1
5.0 33 5.8 11.9 95.0
6.0 4 .7 1.4 96.4
7.0 1 .2 .4 96.8
8.0 5 .9 1.8 98.6
10.0 4 .7 1.4 100.0
Total 278 48.9 100.0 Missing System 290 51.1 Total 568 100.0
Babrak Karmal
Frequency Percent Valid Percent
Cumulative
Percent
Valid .0 88 15.5 33.5 33.5
1.0 63 11.1 24.0 57.4
2.0 28 4.9 10.6 68.1
3.0 12 2.1 4.6 72.6
4.0 20 3.5 7.6 80.2
5.0 27 4.8 10.3 90.5
6.0 6 1.1 2.3 92.8
7.0 4 .7 1.5 94.3
8.0 4 .7 1.5 95.8
9.0 3 .5 1.1 97.0
10.0 8 1.4 3.0 100.0
Total 263 46.3 100.0 Missing System 305 53.7 Total 568 100.0

855
Pie Chart

856

857

858
Crosstabs Case Processing Summary
Cases
Valid Missing Total
N Percent N Percent N Percent
Ethnicity * Hafeezullah Amin 263 46.3% 305 53.7% 568 100.0%
Ethnicity * Tarakee 278 48.9% 290 51.1% 568 100.0%
Ethnicity * Babrak Karmal 263 46.3% 305 53.7% 568 100.0%
Ethnicity * Hafeezullah Amin
Crosstab
Hafeezullah Amin
Total .0 1.0 2.0 3.0 4.0 5.0 6.0 7.0 8.0 9.0 10.0
Ethnicity Pashtun Count 43 28 13 9 10 14 0 0 0 0 2 119
Expected Count 42.1 34.8 13.6 7.7 6.8 9.0 .9 .5 .9 .5 2.3 119.0
Tajik Count 24 30 10 4 4 4 2 1 2 1 1 83
Expected Count 29.3 24.3 9.5 5.4 4.7 6.3 .6 .3 .6 .3 1.6 83.0
Hazara Count 23 7 3 0 1 1 0 0 0 0 2 37
Expected Count 13.1 10.8 4.2 2.4 2.1 2.8 .3 .1 .3 .1 .7 37.0
Uzbek Count 0 8 1 3 0 1 0 0 0 0 0 13
Expected Count 4.6 3.8 1.5 .8 .7 1.0 .1 .0 .1 .0 .2 13.0
Other Count 3 4 3 1 0 0 0 0 0 0 0 11
Expected Count 3.9 3.2 1.3 .7 .6 .8 .1 .0 .1 .0 .2 11.0
Total Count 93 77 30 17 15 20 2 1 2 1 5 263
Expected Count 93.0 77.0 30.0 17.0 15.0 20.0 2.0 1.0 2.0 1.0 5.0 263.0
Chi-Square Tests
Value df
Asymp. Sig. (2-
sided)
Pearson Chi-Square 59.027a 40 .027
Likelihood Ratio 63.709 40 .010
Linear-by-Linear Association 1.371 1 .242
N of Valid Cases 263
a. 42 cells (76.4%) have expected count less than 5. The minimum expected count
is .04.

859
Symmetric Measures
Value Approx. Sig.
Nominal by Nominal Phi .474 .027
Cramer's V .237 .027
N of Valid Cases 263

860
Ethnicity * Tarakee Crosstab
Tarakee
Total .0 1.0 2.0 3.0 4.0 5.0 6.0 7.0 8.0 10.0
Ethnicity Pashtun Count 45 18 17 16 7 24 1 0 2 0 130
Expected Count 40.2 30.4 15.0 15.0 7.5 15.4 1.9 .5 2.3 1.9 130.0
Tajik Count 20 31 4 11 7 6 3 1 3 1 87
Expected Count 26.9 20.3 10.0 10.0 5.0 10.3 1.3 .3 1.6 1.3 87.0
Hazara Count 19 7 5 3 0 1 0 0 0 2 37
Expected Count 11.4 8.7 4.3 4.3 2.1 4.4 .5 .1 .7 .5 37.0
Uzbek Count 0 7 2 0 2 1 0 0 0 1 13
Expected Count 4.0 3.0 1.5 1.5 .7 1.5 .2 .0 .2 .2 13.0
Other Count 2 2 4 2 0 1 0 0 0 0 11
Expected Count 3.4 2.6 1.3 1.3 .6 1.3 .2 .0 .2 .2 11.0
Total Count 86 65 32 32 16 33 4 1 5 4 278
Expected Count 86.0 65.0 32.0 32.0 16.0 33.0 4.0 1.0 5.0 4.0 278.0
Chi-Square Tests
Value df
Asymp. Sig. (2-
sided)
Pearson Chi-Square 73.900a 36 .000
Likelihood Ratio 79.041 36 .000
Linear-by-Linear Association .238 1 .626
N of Valid Cases 278
a. 36 cells (72.0%) have expected count less than 5. The minimum expected count
is .04.
Symmetric Measures
Value Approx. Sig.
Nominal by Nominal Phi .516 .000
Cramer's V .258 .000
N of Valid Cases 278

861

862
Ethnicity * Babrak Karmal Crosstab
Babrak Karmal
Total .0 1.0 2.0 3.0 4.0 5.0 6.0 7.0 8.0 9.0 10.0
Ethnicity Pashtun Count 49 17 14 6 12 12 2 0 2 0 1 115
Expected Count 38.5 27.5 12.2 5.2 8.7 11.8 2.6 1.7 1.7 1.3 3.5 115.0
Tajik Count 20 29 7 4 6 11 2 2 2 1 3 87
Expected Count 29.1 20.8 9.3 4.0 6.6 8.9 2.0 1.3 1.3 1.0 2.6 87.0
Hazara Count 16 8 4 2 1 3 0 0 0 0 2 36
Expected Count 12.0 8.6 3.8 1.6 2.7 3.7 .8 .5 .5 .4 1.1 36.0
Uzbek Count 0 6 0 0 0 1 2 2 0 1 2 14
Expected Count 4.7 3.4 1.5 .6 1.1 1.4 .3 .2 .2 .2 .4 14.0
Other Count 3 3 3 0 1 0 0 0 0 1 0 11
Expected Count 3.7 2.6 1.2 .5 .8 1.1 .3 .2 .2 .1 .3 11.0
Total Count 88 63 28 12 20 27 6 4 4 3 8 263
Expected Count 88.0 63.0 28.0 12.0 20.0 27.0 6.0 4.0 4.0 3.0 8.0 263.0
Chi-Square Tests
Value df
Asymp. Sig. (2-
sided)
Pearson Chi-Square 83.236a 40 .000
Likelihood Ratio 75.641 40 .001
Linear-by-Linear Association 3.931 1 .047
N of Valid Cases 263
a. 42 cells (76.4%) have expected count less than 5. The minimum expected count
is .13.
Symmetric Measures
Value Approx. Sig.
Nominal by Nominal Phi .563 .000
Cramer's V .281 .000
N of Valid Cases 263

863

864
Frequencies Statistics
Hekmatyar Mullah Omar
N Valid 269 289
Missing 299 279
Mean 2.134 2.156
Median 1.000 1.000
Mode .0 .0
Std. Deviation 2.1693 2.3629
Skewness .973 .934
Std. Error of Skewness .149 .143
Kurtosis .459 -.003
Std. Error of Kurtosis .296 .286
Minimum .0 .0
Maximum 10.0 10.0
Frequency Table
Hekmatyar
Frequency Percent Valid Percent
Cumulative
Percent
Valid .0 82 14.4 30.5 30.5
1.0 57 10.0 21.2 51.7
2.0 29 5.1 10.8 62.5
3.0 29 5.1 10.8 73.2
4.0 23 4.0 8.6 81.8
5.0 34 6.0 12.6 94.4
6.0 6 1.1 2.2 96.7
7.0 3 .5 1.1 97.8
8.0 2 .4 .7 98.5
9.0 3 .5 1.1 99.6
10.0 1 .2 .4 100.0
Total 269 47.4 100.0 Missing System 299 52.6 Total 568 100.0

865
Mullah Omar
Frequency Percent Valid Percent
Cumulative
Percent
Valid .0 101 17.8 34.9 34.9
1.0 66 11.6 22.8 57.8
2.0 12 2.1 4.2 61.9
3.0 23 4.0 8.0 69.9
4.0 19 3.3 6.6 76.5
5.0 48 8.5 16.6 93.1
6.0 5 .9 1.7 94.8
7.0 8 1.4 2.8 97.6
8.0 3 .5 1.0 98.6
9.0 2 .4 .7 99.3
10.0 2 .4 .7 100.0
Total 289 50.9 100.0 Missing System 279 49.1 Total 568 100.0

866
Pie Chart

867

868
Crosstabs Case Processing Summary
Cases
Valid Missing Total
N Percent N Percent N Percent
Ethnicity * Hekmatyar 269 47.4% 299 52.6% 568 100.0%
Ethnicity * Mullah Omar 289 50.9% 279 49.1% 568 100.0%
Ethnicity * Hekmatyar
Crosstab
Hekmatyar
Total .0 1.0 2.0 3.0 4.0 5.0 6.0 7.0 8.0 9.0 10.0
Ethnicity Pashtun Count 31 10 12 22 13 23 1 1 0 0 0 113
Expected Count 34.4 23.9 12.2 12.2 9.7 14.3 2.5 1.3 .8 1.3 .4 113.0
Tajik Count 23 27 10 4 6 8 4 1 2 2 1 88
Expected Count 26.8 18.6 9.5 9.5 7.5 11.1 2.0 1.0 .7 1.0 .3 88.0
Hazara Count 25 7 5 2 2 2 1 0 0 0 0 44
Expected Count 13.4 9.3 4.7 4.7 3.8 5.6 1.0 .5 .3 .5 .2 44.0
Uzbek Count 1 10 1 0 1 0 0 1 0 1 0 15
Expected Count 4.6 3.2 1.6 1.6 1.3 1.9 .3 .2 .1 .2 .1 15.0
Other Count 2 3 1 1 1 1 0 0 0 0 0 9
Expected Count 2.7 1.9 1.0 1.0 .8 1.1 .2 .1 .1 .1 .0 9.0
Total Count 82 57 29 29 23 34 6 3 2 3 1 269
Expected Count 82.0 57.0 29.0 29.0 23.0 34.0 6.0 3.0 2.0 3.0 1.0 269.0
Chi-Square Tests
Value df
Asymp. Sig. (2-
sided)
Pearson Chi-Square 90.564a 40 .000
Likelihood Ratio 88.351 40 .000
Linear-by-Linear Association 6.098 1 .014
N of Valid Cases 269
a. 40 cells (72.7%) have expected count less than 5. The minimum expected count
is .03.

869
Symmetric Measures
Value Approx. Sig.
Nominal by Nominal Phi .580 .000
Cramer's V .290 .000
N of Valid Cases 269

870
Ethnicity * Mullah Omar Crosstab
Mullah Omar
Total .0 1.0 2.0 3.0 4.0 5.0 6.0 7.0 8.0 9.0 10.0
Ethnicity Pashtun Count 41 15 7 15 15 33 0 2 0 0 1 129
Expected Count 45.1 29.5 5.4 10.3 8.5 21.4 2.2 3.6 1.3 .9 .9 129.0
Tajik Count 31 36 2 4 3 6 5 4 2 0 1 94
Expected Count 32.9 21.5 3.9 7.5 6.2 15.6 1.6 2.6 1.0 .7 .7 94.0
Hazara Count 24 5 2 3 0 7 0 1 1 1 0 44
Expected Count 15.4 10.0 1.8 3.5 2.9 7.3 .8 1.2 .5 .3 .3 44.0
Uzbek Count 1 9 0 0 1 0 0 1 0 1 0 13
Expected Count 4.5 3.0 .5 1.0 .9 2.2 .2 .4 .1 .1 .1 13.0
Other Count 4 1 1 1 0 2 0 0 0 0 0 9
Expected Count 3.1 2.1 .4 .7 .6 1.5 .2 .2 .1 .1 .1 9.0
Total Count 101 66 12 23 19 48 5 8 3 2 2 289
Expected Count 101.0 66.0 12.0 23.0 19.0 48.0 5.0 8.0 3.0 2.0 2.0 289.0
Chi-Square Tests
Value df
Asymp. Sig. (2-
sided)
Pearson Chi-Square 102.888a 40 .000
Likelihood Ratio 104.307 40 .000
Linear-by-Linear Association 2.987 1 .084
N of Valid Cases 289
a. 41 cells (74.5%) have expected count less than 5. The minimum expected count
is .06.
Symmetric Measures
Value Approx. Sig.
Nominal by Nominal Phi .597 .000
Cramer's V .298 .000
N of Valid Cases 289

871

872
Frequencies Statistics
Ali Ahmad Jalali
Ashraf Ghani
Ahmadzai
N Valid 193 274
Missing 375 294
Mean 3.751 3.942
Median 4.000 4.000
Mode 5.0 5.0
Std. Deviation 2.4791 2.5884
Skewness .485 .316
Std. Error of Skewness .175 .147
Kurtosis .033 -.275
Std. Error of Kurtosis .348 .293
Minimum .0 .0
Maximum 10.0 10.0
Frequency Table
Ali Ahmad Jalali
Frequency Percent Valid Percent
Cumulative
Percent
Valid .0 16 2.8 8.3 8.3
1.0 32 5.6 16.6 24.9
2.0 18 3.2 9.3 34.2
3.0 20 3.5 10.4 44.6
4.0 21 3.7 10.9 55.4
5.0 57 10.0 29.5 85.0
6.0 8 1.4 4.1 89.1
7.0 7 1.2 3.6 92.7
8.0 5 .9 2.6 95.3
10.0 9 1.6 4.7 100.0
Total 193 34.0 100.0 Missing System 375 66.0 Total 568 100.0

873
Ashraf Ghani Ahmadzai
Frequency Percent Valid Percent
Cumulative
Percent
Valid .0 32 5.6 11.7 11.7
1.0 31 5.5 11.3 23.0
2.0 19 3.3 6.9 29.9
3.0 31 5.5 11.3 41.2
4.0 29 5.1 10.6 51.8
5.0 83 14.6 30.3 82.1
6.0 11 1.9 4.0 86.1
7.0 11 1.9 4.0 90.1
8.0 10 1.8 3.6 93.8
9.0 6 1.1 2.2 96.0
10.0 11 1.9 4.0 100.0
Total 274 48.2 100.0 Missing System 294 51.8 Total 568 100.0

874
Pie Chart

875

876
Crosstabs Case Processing Summary
Cases
Valid Missing Total
N Percent N Percent N Percent
Ethnicity * Ali Ahmad Jalali 193 34.0% 375 66.0% 568 100.0%
Ethnicity * Ashraf Ghani
Ahmadzai 274 48.2% 294 51.8% 568 100.0%
Ethnicity * Ali Ahmad Jalali
Crosstab
Ali Ahmad Jalali
Total .0 1.0 2.0 3.0 4.0 5.0 6.0 7.0 8.0 10.0
Ethnicity Pashtun Count 8 10 6 12 13 38 3 0 1 1 92
Expected Count 7.6 15.3 8.6 9.5 10.0 27.2 3.8 3.3 2.4 4.3 92.0
Tajik Count 7 12 3 5 5 10 5 5 3 5 60
Expected Count 5.0 9.9 5.6 6.2 6.5 17.7 2.5 2.2 1.6 2.8 60.0
Hazara Count 1 6 8 1 3 3 0 1 0 1 24
Expected Count 2.0 4.0 2.2 2.5 2.6 7.1 1.0 .9 .6 1.1 24.0
Uzbek Count 0 3 1 0 0 2 0 0 0 2 8
Expected Count .7 1.3 .7 .8 .9 2.4 .3 .3 .2 .4 8.0
Other Count 0 1 0 2 0 4 0 1 1 0 9
Expected Count .7 1.5 .8 .9 1.0 2.7 .4 .3 .2 .4 9.0
Total Count 16 32 18 20 21 57 8 7 5 9 193
Expected Count 16.0 32.0 18.0 20.0 21.0 57.0 8.0 7.0 5.0 9.0 193.0
Chi-Square Tests
Value df
Asymp. Sig. (2-
sided)
Pearson Chi-Square 74.155a 36 .000
Likelihood Ratio 74.093 36 .000
Linear-by-Linear Association .374 1 .541
N of Valid Cases 193
a. 38 cells (76.0%) have expected count less than 5. The minimum expected
count is .21.

877
Symmetric Measures
Value Approx. Sig.
Nominal by Nominal Phi .620 .000
Cramer's V .310 .000
N of Valid Cases 193

878
Ethnicity * Ashraf Ghani Ahmadzai Crosstab
Ashraf Ghani Ahmadzai
Total .0 1.0 2.0 3.0 4.0 5.0 6.0 7.0 8.0 9.0 10.0
Ethnicity Pashtun Count 13 6 7 15 18 67 3 2 3 0 3 137
Expected Count 16.0 15.5 9.5 15.5 14.5 41.5 5.5 5.5 5.0 3.0 5.5 137.0
Tajik Count 12 9 7 10 5 9 3 5 7 4 7 78
Expected Count 9.1 8.8 5.4 8.8 8.3 23.6 3.1 3.1 2.8 1.7 3.1 78.0
Hazara Count 7 12 5 5 1 5 1 0 0 1 1 38
Expected Count 4.4 4.3 2.6 4.3 4.0 11.5 1.5 1.5 1.4 .8 1.5 38.0
Uzbek Count 0 2 0 0 3 0 3 2 0 1 0 11
Expected Count 1.3 1.2 .8 1.2 1.2 3.3 .4 .4 .4 .2 .4 11.0
Other Count 0 2 0 1 2 2 1 2 0 0 0 10
Expected Count 1.2 1.1 .7 1.1 1.1 3.0 .4 .4 .4 .2 .4 10.0
Total Count 32 31 19 31 29 83 11 11 10 6 11 274
Expected Count 32.0 31.0 19.0 31.0 29.0 83.0 11.0 11.0 10.0 6.0 11.0 274.0
Chi-Square Tests
Value df
Asymp. Sig. (2-
sided)
Pearson Chi-Square 131.071a 40 .000
Likelihood Ratio 126.931 40 .000
Linear-by-Linear Association .906 1 .341
N of Valid Cases 274
a. 38 cells (69.1%) have expected count less than 5. The minimum expected count
is .22.
Symmetric Measures
Value Approx. Sig.
Nominal by Nominal Phi .692 .000
Cramer's V .346 .000
N of Valid Cases 274

879

880
Frequencies Statistics
Anwarul Haq
Ahadi Ismael Yoon
N Valid 192 151
Missing 376 417
Mean 2.542 1.894
Median 2.000 1.000
Mode 1.0 .0
Std. Deviation 2.1215 1.8873
Skewness .826 .764
Std. Error of Skewness .175 .197
Kurtosis .641 -.570
Std. Error of Kurtosis .349 .392
Minimum .0 .0
Maximum 10.0 7.0
Frequency Table
Anwarul Haq Ahadi
Frequency Percent Valid Percent
Cumulative
Percent
Valid .0 37 6.5 19.3 19.3
1.0 38 6.7 19.8 39.1
2.0 29 5.1 15.1 54.2
3.0 28 4.9 14.6 68.8
4.0 20 3.5 10.4 79.2
5.0 28 4.9 14.6 93.8
6.0 6 1.1 3.1 96.9
7.0 1 .2 .5 97.4
8.0 2 .4 1.0 98.4
9.0 1 .2 .5 99.0
10.0 2 .4 1.0 100.0
Total 192 33.8 100.0 Missing System 376 66.2 Total 568 100.0

881
Ismael Yoon
Frequency Percent Valid Percent
Cumulative
Percent
Valid .0 47 8.3 31.1 31.1
1.0 34 6.0 22.5 53.6
2.0 21 3.7 13.9 67.5
3.0 17 3.0 11.3 78.8
4.0 6 1.1 4.0 82.8
5.0 23 4.0 15.2 98.0
6.0 1 .2 .7 98.7
7.0 2 .4 1.3 100.0
Total 151 26.6 100.0 Missing System 417 73.4 Total 568 100.0

882
Pie Chart

883

884
Crosstabs
Case Processing Summary
Cases
Valid Missing Total
N Percent N Percent N Percent
Ethnicity * Anwarul Haq Ahadi 192 33.8% 376 66.2% 568 100.0%
Ethnicity * Ismael Yoon 151 26.6% 417 73.4% 568 100.0%
Ethnicity * Anwarul Haq Ahadi
Crosstab
Anwarul Haq Ahadi
Total .0 1.0 2.0 3.0 4.0 5.0 6.0 7.0 8.0 9.0 10.0
Ethnicity Pashtun Count 16 12 12 18 7 18 2 0 0 0 1 86
Expected Count 16.6 17.0 13.0 12.5 9.0 12.5 2.7 .4 .9 .4 .9 86.0
Tajik Count 12 15 7 6 9 3 4 1 2 0 1 60
Expected Count 11.6 11.9 9.1 8.8 6.3 8.8 1.9 .3 .6 .3 .6 60.0
Hazara Count 8 4 9 1 3 4 0 0 0 1 0 30
Expected Count 5.8 5.9 4.5 4.4 3.1 4.4 .9 .2 .3 .2 .3 30.0
Uzbek Count 0 5 0 1 1 1 0 0 0 0 0 8
Expected Count 1.5 1.6 1.2 1.2 .8 1.2 .3 .0 .1 .0 .1 8.0
Other Count 1 2 1 2 0 2 0 0 0 0 0 8
Expected Count 1.5 1.6 1.2 1.2 .8 1.2 .3 .0 .1 .0 .1 8.0
Total Count 37 38 29 28 20 28 6 1 2 1 2 192
Expected Count 37.0 38.0 29.0 28.0 20.0 28.0 6.0 1.0 2.0 1.0 2.0 192.0
Chi-Square Tests
Value df
Asymp. Sig. (2-
sided)
Pearson Chi-Square 51.750a 40 .101
Likelihood Ratio 53.499 40 .075
Linear-by-Linear Association .874 1 .350
N of Valid Cases 192
a. 41 cells (74.5%) have expected count less than 5. The minimum expected count
is .04.

885
Symmetric Measures
Value Approx. Sig.
Nominal by Nominal Phi .519 .101
Cramer's V .260 .101
N of Valid Cases 192

886
Ethnicity * Ismael Yoon Crosstab
Ismael Yoon
Total .0 1.0 2.0 3.0 4.0 5.0 6.0 7.0
Ethnicity Pashtun Count 22 10 12 11 4 19 0 0 78
Expected Count 24.3 17.6 10.8 8.8 3.1 11.9 .5 1.0 78.0
Tajik Count 15 15 7 1 1 4 1 1 45
Expected Count 14.0 10.1 6.3 5.1 1.8 6.9 .3 .6 45.0
Hazara Count 9 5 1 3 0 0 0 1 19
Expected Count 5.9 4.3 2.6 2.1 .8 2.9 .1 .3 19.0
Uzbek Count 0 2 0 1 0 0 0 0 3
Expected Count .9 .7 .4 .3 .1 .5 .0 .0 3.0
Other Count 1 2 1 1 1 0 0 0 6
Expected Count 1.9 1.4 .8 .7 .2 .9 .0 .1 6.0
Total Count 47 34 21 17 6 23 1 2 151
Expected Count 47.0 34.0 21.0 17.0 6.0 23.0 1.0 2.0 151.0
Chi-Square Tests
Value df
Asymp. Sig. (2-
sided)
Pearson Chi-Square 38.806a 28 .084
Likelihood Ratio 44.604 28 .024
Linear-by-Linear Association 3.787 1 .052
N of Valid Cases 151
a. 29 cells (72.5%) have expected count less than 5. The minimum expected count
is .02.
Symmetric Measures
Value Approx. Sig.
Nominal by Nominal Phi .507 .084
Cramer's V .253 .084
N of Valid Cases 151

887

888
Frequencies
Statistics
Ahmad Zia
Masood Marshal Fahim
N Valid 221 252
Missing 347 316
Mean 3.050 2.329
Median 3.000 2.000
Mode .0 .0
Std. Deviation 2.8304 2.1917
Skewness 1.018 .954
Std. Error of Skewness .164 .153
Kurtosis .405 .503
Std. Error of Kurtosis .326 .306
Minimum .0 .0
Maximum 10.0 10.0
Frequency Table
Ahmad Zia Masood
Frequency Percent Valid Percent
Cumulative
Percent
Valid .0 47 8.3 21.3 21.3
1.0 35 6.2 15.8 37.1
2.0 26 4.6 11.8 48.9
3.0 33 5.8 14.9 63.8
4.0 26 4.6 11.8 75.6
5.0 20 3.5 9.0 84.6
6.0 7 1.2 3.2 87.8
7.0 6 1.1 2.7 90.5
8.0 5 .9 2.3 92.8
10.0 16 2.8 7.2 100.0
Total 221 38.9 100.0 Missing System 347 61.1 Total 568 100.0

889
Marshal Fahim
Frequency Percent Valid Percent
Cumulative
Percent
Valid .0 63 11.1 25.0 25.0
1.0 50 8.8 19.8 44.8
2.0 40 7.0 15.9 60.7
3.0 29 5.1 11.5 72.2
4.0 24 4.2 9.5 81.7
5.0 26 4.6 10.3 92.1
6.0 8 1.4 3.2 95.2
7.0 4 .7 1.6 96.8
8.0 6 1.1 2.4 99.2
10.0 2 .4 .8 100.0
Total 252 44.4 100.0 Missing System 316 55.6 Total 568 100.0

890
Pie Chart

891
Crosstabs
Case Processing Summary
Cases
Valid Missing Total
N Percent N Percent N Percent
Ethnicity * Ahmad Zia Masood 221 38.9% 347 61.1% 568 100.0%
Ethnicity * Marshal Fahim 252 44.4% 316 55.6% 568 100.0%

892
Ethnicity * Ahmad Zia Masood Crosstab
Ahmad Zia Masood
Total .0 1.0 2.0 3.0 4.0 5.0 6.0 7.0 8.0 10.0
Ethnicity Pashtun Count 31 9 11 16 14 11 1 0 0 1 94
Expected Count 20.0 14.9 11.1 14.0 11.1 8.5 3.0 2.6 2.1 6.8 94.0
Tajik Count 11 11 5 12 7 7 5 5 3 12 78
Expected Count 16.6 12.4 9.2 11.6 9.2 7.1 2.5 2.1 1.8 5.6 78.0
Hazara Count 4 10 8 3 2 0 0 0 0 1 28
Expected Count 6.0 4.4 3.3 4.2 3.3 2.5 .9 .8 .6 2.0 28.0
Uzbek Count 0 2 1 1 0 2 1 0 2 2 11
Expected Count 2.3 1.7 1.3 1.6 1.3 1.0 .3 .3 .2 .8 11.0
Other Count 1 3 1 1 3 0 0 1 0 0 10
Expected Count 2.1 1.6 1.2 1.5 1.2 .9 .3 .3 .2 .7 10.0
Total Count 47 35 26 33 26 20 7 6 5 16 221
Expected Count 47.0 35.0 26.0 33.0 26.0 20.0 7.0 6.0 5.0 16.0 221.0
Chi-Square Tests
Value df
Asymp. Sig. (2-
sided)
Pearson Chi-Square 90.301a 36 .000
Likelihood Ratio 91.778 36 .000
Linear-by-Linear Association 3.849 1 .050
N of Valid Cases 221
a. 35 cells (70.0%) have expected count less than 5. The minimum expected
count is .23.
Symmetric Measures
Value Approx. Sig.
Nominal by Nominal Phi .639 .000
Cramer's V .320 .000
N of Valid Cases 221

893
Ethnicity * Marshal Fahim
Crosstab
Marshal Fahim
Total .0 1.0 2.0 3.0 4.0 5.0 6.0 7.0 8.0 10.0
Ethnicity Pashtun Count 36 17 14 11 11 14 1 0 0 0 104
Expected Count 26.0 20.6 16.5 12.0 9.9 10.7 3.3 1.7 2.5 .8 104.0
Tajik Count 17 22 12 7 12 8 6 2 6 1 93
Expected Count 23.3 18.5 14.8 10.7 8.9 9.6 3.0 1.5 2.2 .7 93.0
Hazara Count 8 6 9 7 1 1 0 0 0 0 32

894
Expected Count 8.0 6.3 5.1 3.7 3.0 3.3 1.0 .5 .8 .3 32.0
Uzbek Count 0 4 2 1 0 2 1 2 0 1 13
Expected Count 3.3 2.6 2.1 1.5 1.2 1.3 .4 .2 .3 .1 13.0
Other Count 2 1 3 3 0 1 0 0 0 0 10
Expected Count 2.5 2.0 1.6 1.2 1.0 1.0 .3 .2 .2 .1 10.0
Total Count 63 50 40 29 24 26 8 4 6 2 252
Expected Count 63.0 50.0 40.0 29.0 24.0 26.0 8.0 4.0 6.0 2.0 252.0
Chi-Square Tests
Value df
Asymp. Sig. (2-
sided)
Pearson Chi-Square 76.467a 36 .000
Likelihood Ratio 71.400 36 .000
Linear-by-Linear Association 2.552 1 .110
N of Valid Cases 252
a. 35 cells (70.0%) have expected count less than 5. The minimum expected
count is .08.
Symmetric Measures
Value Approx. Sig.
Nominal by Nominal Phi .551 .000
Cramer's V .275 .000
N of Valid Cases 252

895

896
Frequencies
Statistics
Tahir Badakhshi Ahmad Behzad
N Valid 132 162
Missing 436 406
Mean 2.644 3.37
Median 2.000 3.00
Mode .0 0
Std. Deviation 2.8044 2.817
Skewness 1.104 .700
Std. Error of Skewness .211 .191
Kurtosis .350 -.161
Std. Error of Kurtosis .419 .379
Minimum .0 0
Maximum 10.0 10
Frequency Table
Tahir Badakhshi
Frequency Percent Valid Percent
Cumulative
Percent
Valid .0 37 6.5 28.0 28.0
1.0 25 4.4 18.9 47.0
2.0 17 3.0 12.9 59.8
3.0 13 2.3 9.8 69.7
4.0 9 1.6 6.8 76.5
5.0 12 2.1 9.1 85.6
6.0 2 .4 1.5 87.1
7.0 5 .9 3.8 90.9
8.0 5 .9 3.8 94.7
9.0 2 .4 1.5 96.2
10.0 5 .9 3.8 100.0
Total 132 23.2 100.0 Missing System 436 76.8 Total 568 100.0

897
Ahmad Behzad
Frequency Percent Valid Percent
Cumulative
Percent
Valid 0 34 6.0 21.0 21.0
1 14 2.5 8.6 29.6
2 22 3.9 13.6 43.2
3 20 3.5 12.3 55.6
4 18 3.2 11.1 66.7
5 27 4.8 16.7 83.3
6 7 1.2 4.3 87.7
7 1 .2 .6 88.3
8 7 1.2 4.3 92.6
9 4 .7 2.5 95.1
10 8 1.4 4.9 100.0
Total 162 28.5 100.0 Missing System 406 71.5 Total 568 100.0

898
Pie Chart

899
Crosstabs
Case Processing Summary
Cases
Valid Missing Total
N Percent N Percent N Percent
Ethnicity * Tahir Badakhshi 132 23.2% 436 76.8% 568 100.0%
Ethnicity * Ahmad Behzad 162 28.5% 406 71.5% 568 100.0%

900
Ethnicity * Tahir Badakhshi
Crosstab
Tahir Badakhshi
Total .0 1.0 2.0 3.0 4.0 5.0 6.0 7.0 8.0 9.0 10.0
Ethnicity Pashtun Count 23 9 8 7 3 7 0 1 0 0 0 58
Expected Count 16.3 11.0 7.5 5.7 4.0 5.3 .9 2.2 2.2 .9 2.2 58.0
Tajik Count 9 9 5 3 4 5 2 2 4 1 2 46
Expected Count 12.9 8.7 5.9 4.5 3.1 4.2 .7 1.7 1.7 .7 1.7 46.0
Hazara Count 3 5 2 2 1 0 0 1 1 0 0 15
Expected Count 4.2 2.8 1.9 1.5 1.0 1.4 .2 .6 .6 .2 .6 15.0
Uzbek Count 0 1 2 0 0 0 0 0 0 1 3 7
Expected Count 2.0 1.3 .9 .7 .5 .6 .1 .3 .3 .1 .3 7.0
Other Count 2 1 0 1 1 0 0 1 0 0 0 6
Expected Count 1.7 1.1 .8 .6 .4 .5 .1 .2 .2 .1 .2 6.0
Total Count 37 25 17 13 9 12 2 5 5 2 5 132
Expected Count 37.0 25.0 17.0 13.0 9.0 12.0 2.0 5.0 5.0 2.0 5.0 132.0
Chi-Square Tests
Value df
Asymp. Sig. (2-
sided)
Pearson Chi-Square 71.471a 40 .002
Likelihood Ratio 58.520 40 .029
Linear-by-Linear Association 7.618 1 .006
N of Valid Cases 132
a. 47 cells (85.5%) have expected count less than 5. The minimum expected count
is .09.
Symmetric Measures
Value Approx. Sig.
Nominal by Nominal Phi .736 .002
Cramer's V .368 .002
N of Valid Cases 132

901

902
Ethnicity * Ahmad Behzad
Crosstab
Ahmad Behzad
Total 0 1 2 3 4 5 6 7 8 9 10
Ethnicity Pashtun Count 24 5 10 13 5 6 0 0 0 0 1 64
Expected Count 13.4 5.5 8.7 7.9 7.1 10.7 2.8 .4 2.8 1.6 3.2 64.0
Tajik Count 8 5 6 3 4 10 5 1 5 2 4 53
Expected Count 11.1 4.6 7.2 6.5 5.9 8.8 2.3 .3 2.3 1.3 2.6 53.0
Hazara Count 1 1 4 3 7 9 1 0 1 1 1 29
Expected Count 6.1 2.5 3.9 3.6 3.2 4.8 1.3 .2 1.3 .7 1.4 29.0
Uzbek Count 0 2 0 1 1 0 0 0 1 1 2 8
Expected Count 1.7 .7 1.1 1.0 .9 1.3 .3 .0 .3 .2 .4 8.0
Other Count 1 1 2 0 1 2 1 0 0 0 0 8
Expected Count 1.7 .7 1.1 1.0 .9 1.3 .3 .0 .3 .2 .4 8.0
Total Count 34 14 22 20 18 27 7 1 7 4 8 162
Expected Count 34.0 14.0 22.0 20.0 18.0 27.0 7.0 1.0 7.0 4.0 8.0 162.0
Chi-Square Tests
Value df
Asymp. Sig. (2-
sided)
Pearson Chi-Square 72.732a 40 .001
Likelihood Ratio 78.145 40 .000
Linear-by-Linear Association 14.431 1 .000
N of Valid Cases 162
a. 43 cells (78.2%) have expected count less than 5. The minimum expected count
is .05.
Symmetric Measures
Value Approx. Sig.
Nominal by Nominal Phi .670 .001
Cramer's V .335 .001
N of Valid Cases 162

903

904
Frequencies Statistics
Dr Spanta Haji Qadeer
Sayed Ahmad
Gelani
Gen. Rahim
Wardak Haneef Atmar
Sebghatullah
Mujadadi Zalmay Khalilzad
N Valid 192 155 168 213 218 279 223
Missing 376 413 400 355 350 289 345
Mean 2.984 2.323 3.054 3.141 3.275 3.115 2.964
Median 2.000 2.000 3.000 3.000 3.000 3.000 2.000
Mode .0 .0 1.0 .0 .0 1.0 .0
Std. Deviation 2.5674 2.3381 2.4889 2.5787 2.5648 2.5092 2.5991
Skewness .668 1.157 .832 .791 .663 .670 .787
Std. Error of Skewness .175 .195 .187 .167 .165 .146 .163
Kurtosis -.166 1.026 .470 .274 .047 -.145 .008
Std. Error of Kurtosis .349 .387 .373 .332 .328 .291 .324
Minimum .0 .0 .0 .0 .0 .0 .0
Maximum 10.0 10.0 10.0 10.0 10.0 10.0 10.0
Frequency Table
Dr Spanta
Frequency Percent Valid Percent
Cumulative
Percent
Valid .0 44 7.7 22.9 22.9
1.0 22 3.9 11.5 34.4
2.0 31 5.5 16.1 50.5
3.0 19 3.3 9.9 60.4
4.0 15 2.6 7.8 68.2
5.0 32 5.6 16.7 84.9
6.0 12 2.1 6.3 91.1
7.0 7 1.2 3.6 94.8
8.0 4 .7 2.1 96.9
9.0 1 .2 .5 97.4
10.0 5 .9 2.6 100.0
Total 192 33.8 100.0 Missing System 376 66.2 Total 568 100.0

905
Haji Qadeer
Frequency Percent Valid Percent
Cumulative
Percent
Valid .0 41 7.2 26.5 26.5
1.0 32 5.6 20.6 47.1
2.0 24 4.2 15.5 62.6
3.0 18 3.2 11.6 74.2
4.0 9 1.6 5.8 80.0
5.0 16 2.8 10.3 90.3
6.0 8 1.4 5.2 95.5
7.0 1 .2 .6 96.1
8.0 1 .2 .6 96.8
9.0 3 .5 1.9 98.7
10.0 2 .4 1.3 100.0
Total 155 27.3 100.0 Missing System 413 72.7 Total 568 100.0
Sayed Ahmad Gelani
Frequency Percent Valid Percent
Cumulative
Percent
Valid .0 28 4.9 16.7 16.7
1.0 29 5.1 17.3 33.9
2.0 20 3.5 11.9 45.8
3.0 22 3.9 13.1 58.9
4.0 24 4.2 14.3 73.2
5.0 25 4.4 14.9 88.1
6.0 6 1.1 3.6 91.7
7.0 4 .7 2.4 94.0
8.0 3 .5 1.8 95.8
9.0 1 .2 .6 96.4
10.0 6 1.1 3.6 100.0
Total 168 29.6 100.0 Missing System 400 70.4 Total 568 100.0

906
Gen. Rahim Wardak
Frequency Percent Valid Percent
Cumulative
Percent
Valid .0 37 6.5 17.4 17.4
1.0 35 6.2 16.4 33.8
2.0 24 4.2 11.3 45.1
3.0 26 4.6 12.2 57.3
4.0 29 5.1 13.6 70.9
5.0 33 5.8 15.5 86.4
6.0 10 1.8 4.7 91.1
7.0 4 .7 1.9 93.0
8.0 5 .9 2.3 95.3
9.0 1 .2 .5 95.8
10.0 9 1.6 4.2 100.0
Total 213 37.5 100.0 Missing System 355 62.5 Total 568 100.0
Haneef Atmar
Frequency Percent Valid Percent
Cumulative
Percent
Valid .0 37 6.5 17.0 17.0
1.0 29 5.1 13.3 30.3
2.0 26 4.6 11.9 42.2
3.0 25 4.4 11.5 53.7
4.0 36 6.3 16.5 70.2
5.0 32 5.6 14.7 84.9
6.0 10 1.8 4.6 89.4
7.0 7 1.2 3.2 92.7
8.0 7 1.2 3.2 95.9
9.0 1 .2 .5 96.3
10.0 8 1.4 3.7 100.0
Total 218 38.4 100.0 Missing System 350 61.6 Total 568 100.0
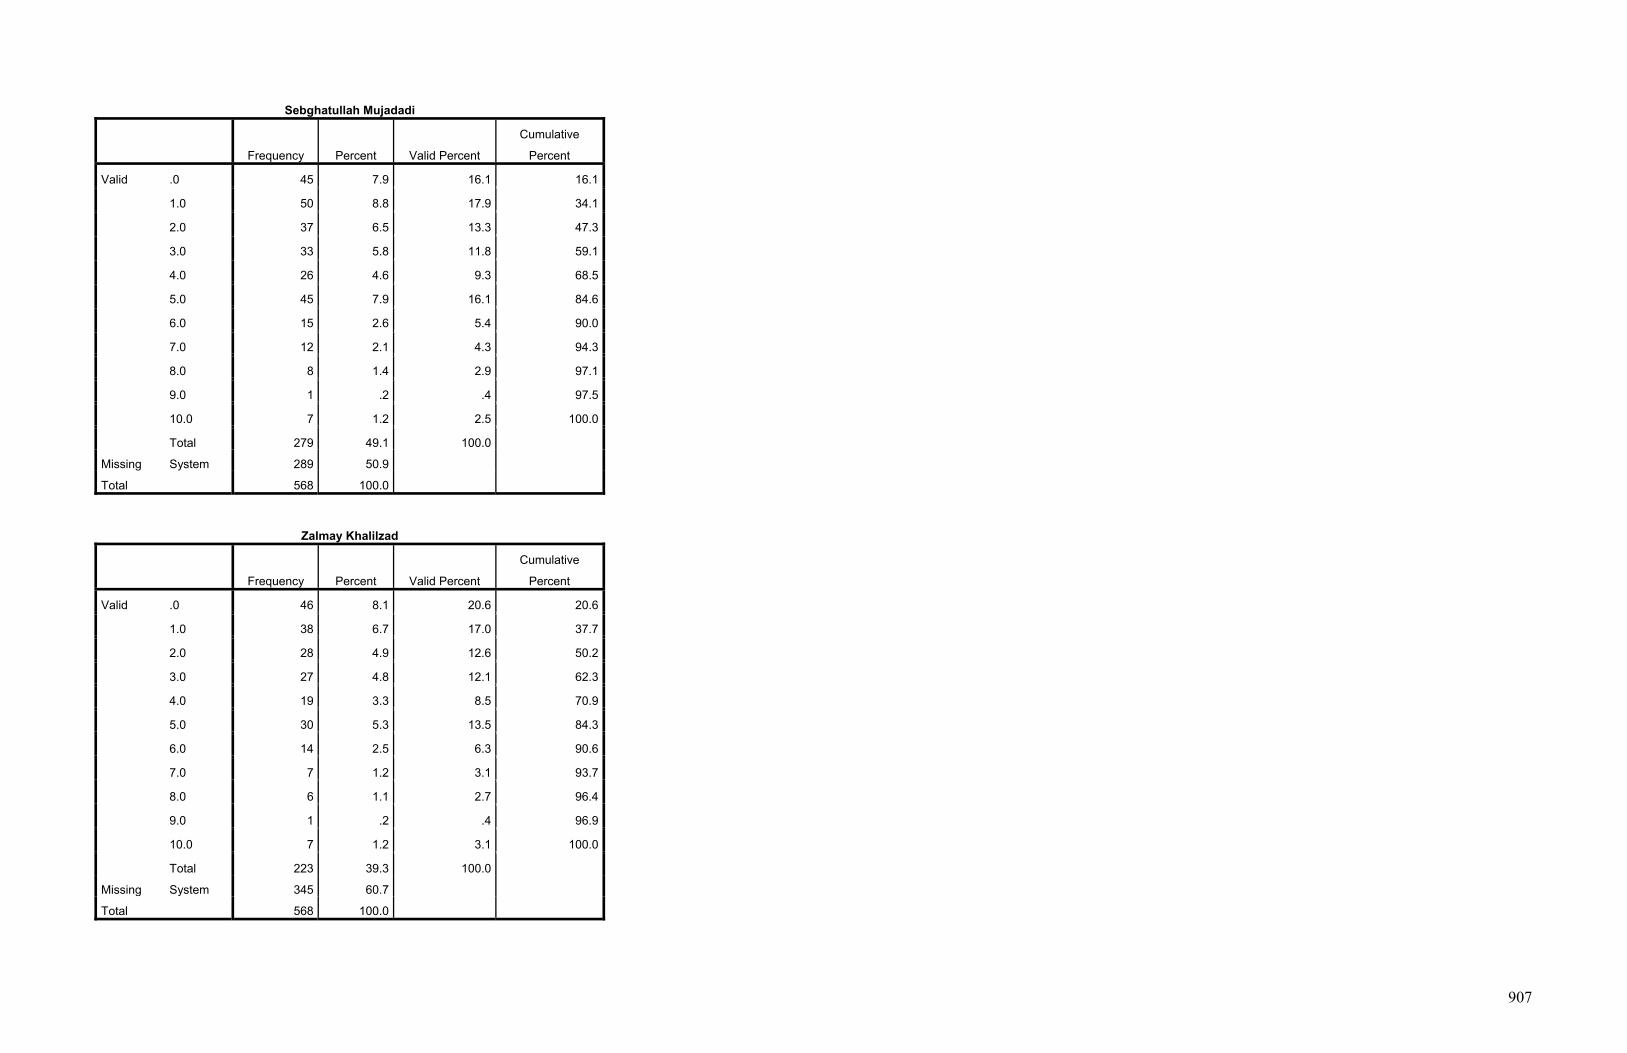
907
Sebghatullah Mujadadi
Frequency Percent Valid Percent
Cumulative
Percent
Valid .0 45 7.9 16.1 16.1
1.0 50 8.8 17.9 34.1
2.0 37 6.5 13.3 47.3
3.0 33 5.8 11.8 59.1
4.0 26 4.6 9.3 68.5
5.0 45 7.9 16.1 84.6
6.0 15 2.6 5.4 90.0
7.0 12 2.1 4.3 94.3
8.0 8 1.4 2.9 97.1
9.0 1 .2 .4 97.5
10.0 7 1.2 2.5 100.0
Total 279 49.1 100.0 Missing System 289 50.9 Total 568 100.0
Zalmay Khalilzad
Frequency Percent Valid Percent
Cumulative
Percent
Valid .0 46 8.1 20.6 20.6
1.0 38 6.7 17.0 37.7
2.0 28 4.9 12.6 50.2
3.0 27 4.8 12.1 62.3
4.0 19 3.3 8.5 70.9
5.0 30 5.3 13.5 84.3
6.0 14 2.5 6.3 90.6
7.0 7 1.2 3.1 93.7
8.0 6 1.1 2.7 96.4
9.0 1 .2 .4 96.9
10.0 7 1.2 3.1 100.0
Total 223 39.3 100.0 Missing System 345 60.7 Total 568 100.0

908
Pie Chart

909
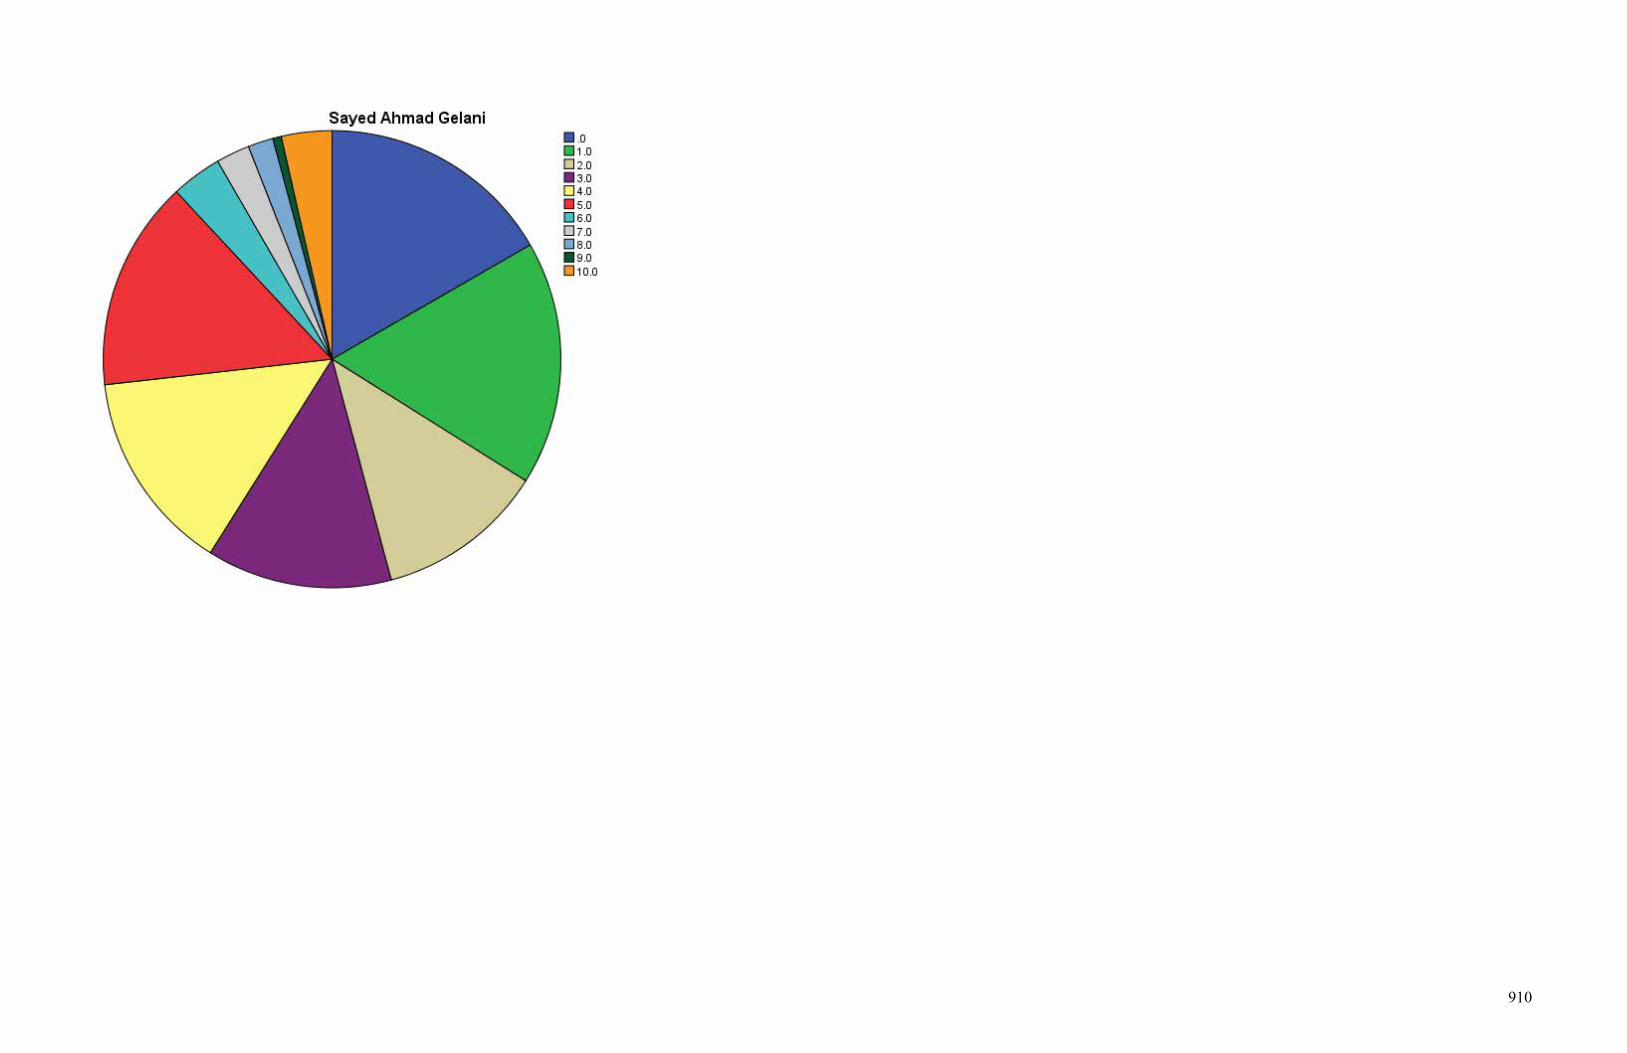
910
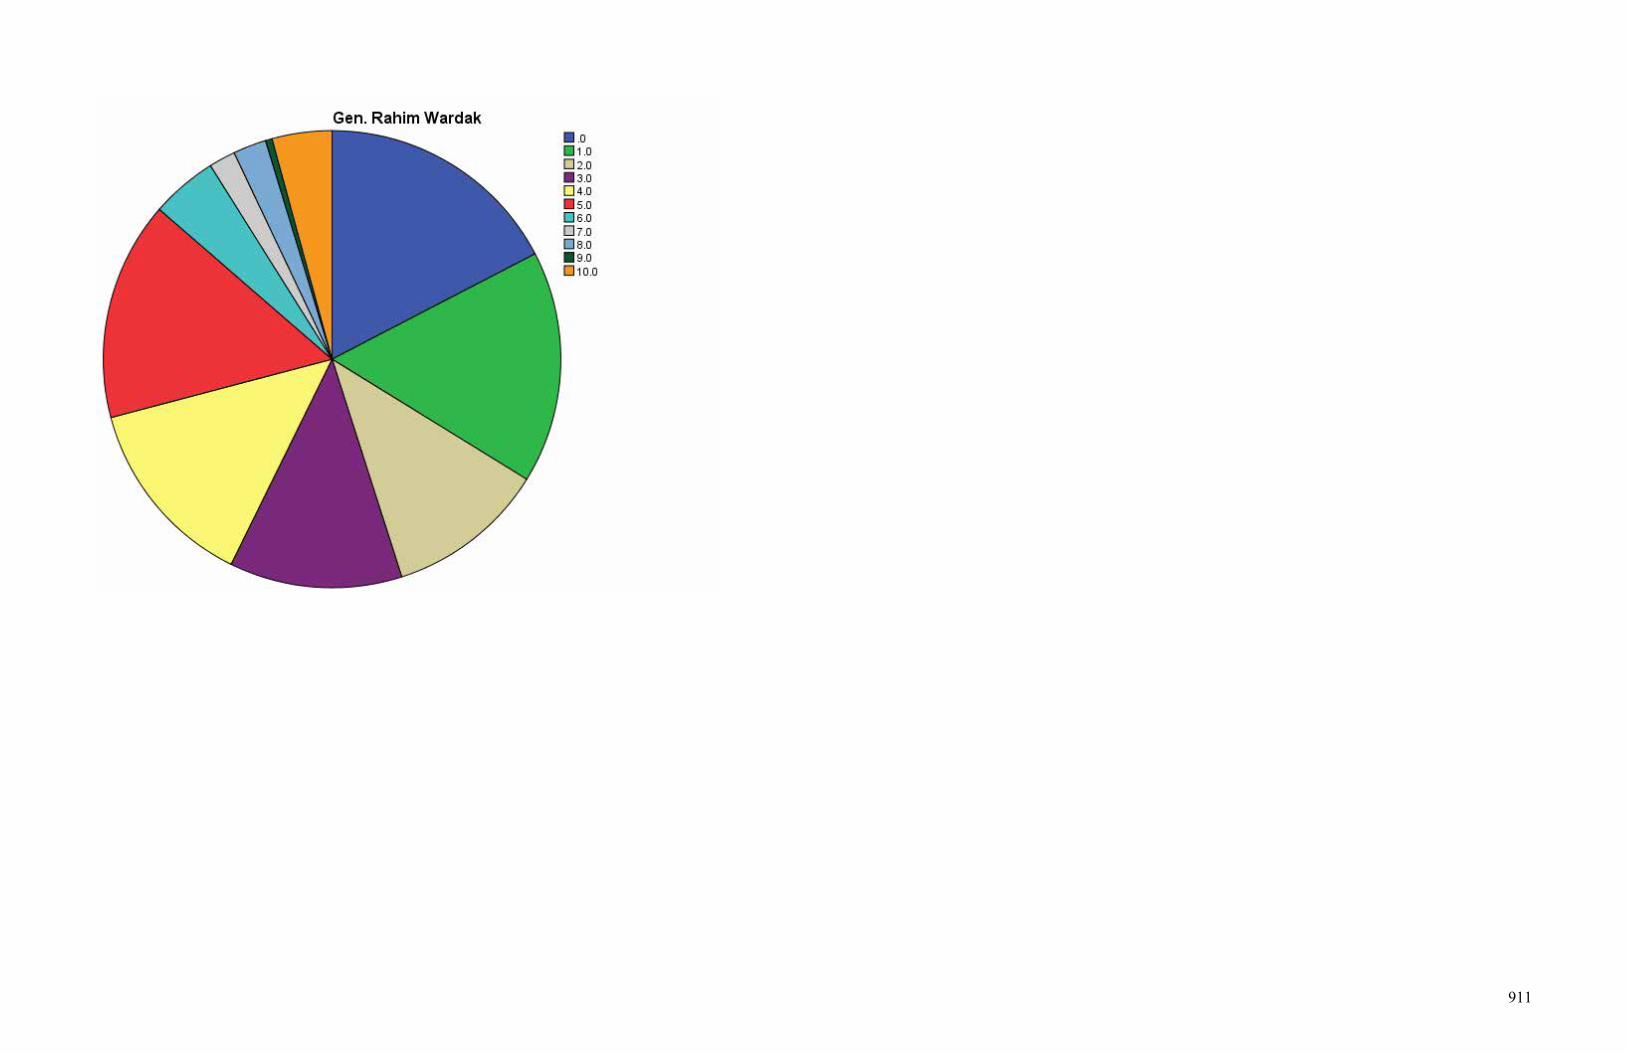
911
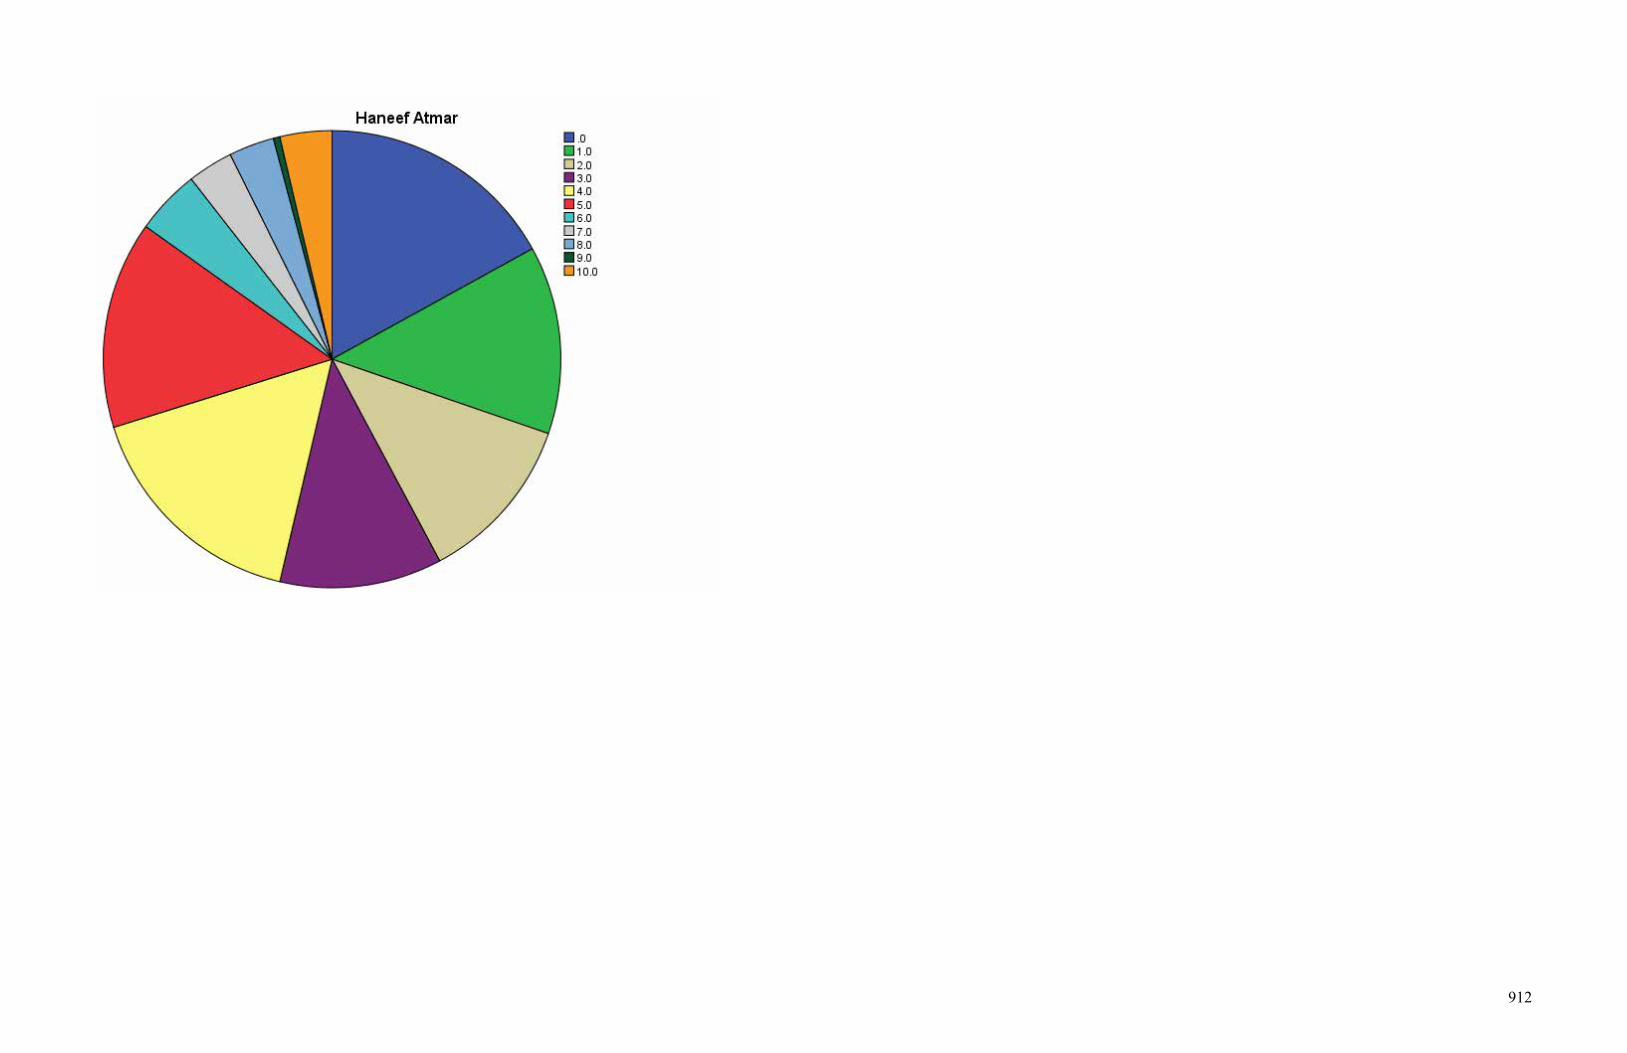
912

913
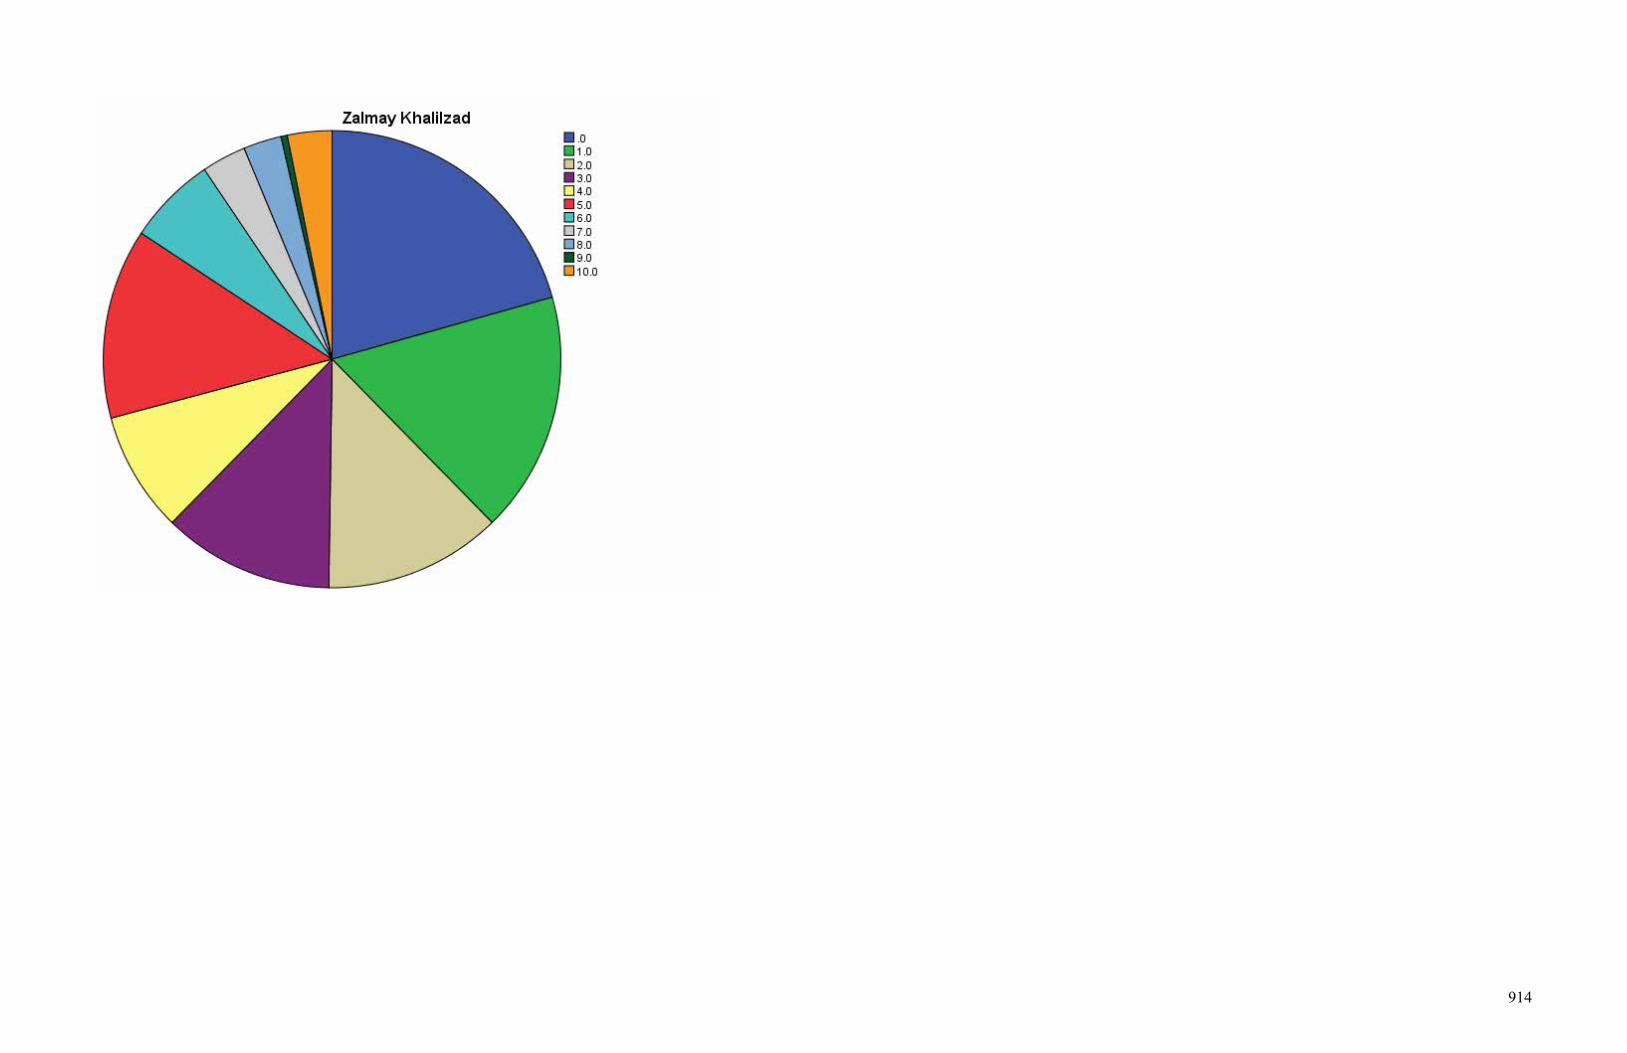
914

915
Crosstabs Case Processing Summary
Cases
Valid Missing Total
N Percent N Percent N Percent
Ethnicity * Dr Spanta 192 33.8% 376 66.2% 568 100.0%
Ethnicity * Haji Qadeer 155 27.3% 413 72.7% 568 100.0%
Ethnicity * Sayed Ahmad
Gelani 168 29.6% 400 70.4% 568 100.0%
Ethnicity * Gen. Rahim Wardak 213 37.5% 355 62.5% 568 100.0%
Ethnicity * Haneef Atmar 218 38.4% 350 61.6% 568 100.0%
Ethnicity * Sebghatullah
Mujadadi 279 49.1% 289 50.9% 568 100.0%
Ethnicity * Zalmay Khalilzad 223 39.3% 345 60.7% 568 100.0%
Ethnicity * Dr Spanta
Crosstab
Dr Spanta
Total .0 1.0 2.0 3.0 4.0 5.0 6.0 7.0 8.0 9.0 10.0
Ethnicity Pashtun Count 27 5 11 11 9 20 4 0 1 0 0 88
Expected Count 20.2 10.1 14.2 8.7 6.9 14.7 5.5 3.2 1.8 .5 2.3 88.0
Tajik Count 13 8 10 3 1 9 6 5 3 1 4 63
Expected Count 14.4 7.2 10.2 6.2 4.9 10.5 3.9 2.3 1.3 .3 1.6 63.0
Hazara Count 3 5 7 4 4 3 0 0 0 0 0 26
Expected Count 6.0 3.0 4.2 2.6 2.0 4.3 1.6 .9 .5 .1 .7 26.0
Uzbek Count 0 2 2 1 0 0 1 1 0 0 1 8
Expected Count 1.8 .9 1.3 .8 .6 1.3 .5 .3 .2 .0 .2 8.0
Other Count 1 2 1 0 1 0 1 1 0 0 0 7
Expected Count 1.6 .8 1.1 .7 .5 1.2 .4 .3 .1 .0 .2 7.0
Total Count 44 22 31 19 15 32 12 7 4 1 5 192
Expected Count 44.0 22.0 31.0 19.0 15.0 32.0 12.0 7.0 4.0 1.0 5.0 192.0

916
Chi-Square Tests
Value df
Asymp. Sig. (2-
sided)
Pearson Chi-Square 62.223a 40 .014
Likelihood Ratio 72.469 40 .001
Linear-by-Linear Association .935 1 .334
N of Valid Cases 192
a. 42 cells (76.4%) have expected count less than 5. The minimum expected count
is .04.
Symmetric Measures
Value Approx. Sig.
Nominal by Nominal Phi .569 .014
Cramer's V .285 .014
N of Valid Cases 192

917

918
Ethnicity * Haji Qadeer Crosstab
Haji Qadeer
Total .0 1.0 2.0 3.0 4.0 5.0 6.0 7.0 8.0 9.0 10.0
Ethnicity Pashtun Count 28 13 11 8 5 10 1 0 0 0 0 76
Expected Count 20.1 15.7 11.8 8.8 4.4 7.8 3.9 .5 .5 1.5 1.0 76.0
Tajik Count 8 12 5 8 1 5 4 1 1 1 2 48
Expected Count 12.7 9.9 7.4 5.6 2.8 5.0 2.5 .3 .3 .9 .6 48.0
Hazara Count 4 6 4 1 2 0 0 0 0 2 0 19
Expected Count 5.0 3.9 2.9 2.2 1.1 2.0 1.0 .1 .1 .4 .2 19.0
Uzbek Count 0 1 1 0 0 0 3 0 0 0 0 5
Expected Count 1.3 1.0 .8 .6 .3 .5 .3 .0 .0 .1 .1 5.0
Other Count 1 0 3 1 1 1 0 0 0 0 0 7
Expected Count 1.9 1.4 1.1 .8 .4 .7 .4 .0 .0 .1 .1 7.0
Total Count 41 32 24 18 9 16 8 1 1 3 2 155
Expected Count 41.0 32.0 24.0 18.0 9.0 16.0 8.0 1.0 1.0 3.0 2.0 155.0
Chi-Square Tests
Value df
Asymp. Sig. (2-
sided)
Pearson Chi-Square 75.053a 40 .001
Likelihood Ratio 60.606 40 .019
Linear-by-Linear Association 4.367 1 .037
N of Valid Cases 155
a. 45 cells (81.8%) have expected count less than 5. The minimum expected count
is .03.
Symmetric Measures
Value Approx. Sig.
Nominal by Nominal Phi .696 .001
Cramer's V .348 .001
N of Valid Cases 155

919

920
Ethnicity * Sayed Ahmad Gelani Crosstab
Sayed Ahmad Gelani
Total .0 1.0 2.0 3.0 4.0 5.0 6.0 7.0 8.0 9.0 10.0
Ethnicity Pashtun Count 17 8 8 12 12 17 1 2 1 0 2 80
Expected Count 13.3 13.8 9.5 10.5 11.4 11.9 2.9 1.9 1.4 .5 2.9 80.0
Tajik Count 6 12 7 7 7 6 5 2 2 1 3 58
Expected Count 9.7 10.0 6.9 7.6 8.3 8.6 2.1 1.4 1.0 .3 2.1 58.0
Hazara Count 3 6 4 2 1 2 0 0 0 0 0 18
Expected Count 3.0 3.1 2.1 2.4 2.6 2.7 .6 .4 .3 .1 .6 18.0
Uzbek Count 0 3 0 0 1 0 0 0 0 0 1 5
Expected Count .8 .9 .6 .7 .7 .7 .2 .1 .1 .0 .2 5.0
Other Count 2 0 1 1 3 0 0 0 0 0 0 7
Expected Count 1.2 1.2 .8 .9 1.0 1.0 .3 .2 .1 .0 .3 7.0
Total Count 28 29 20 22 24 25 6 4 3 1 6 168
Expected Count 28.0 29.0 20.0 22.0 24.0 25.0 6.0 4.0 3.0 1.0 6.0 168.0
Chi-Square Tests
Value df
Asymp. Sig. (2-
sided)
Pearson Chi-Square 45.789a 40 .244
Likelihood Ratio 47.514 40 .193
Linear-by-Linear Association .688 1 .407
N of Valid Cases 168
a. 43 cells (78.2%) have expected count less than 5. The minimum expected count
is .03.
Symmetric Measures
Value Approx. Sig.
Nominal by Nominal Phi .522 .244
Cramer's V .261 .244
N of Valid Cases 168

921

922
Ethnicity * Gen. Rahim Wardak Crosstab
Gen. Rahim Wardak
Total .0 1.0 2.0 3.0 4.0 5.0 6.0 7.0 8.0 9.0 10.0
Ethnicity Pashtun Count 18 9 8 19 18 24 3 0 2 0 4 105
Expected Count 18.2 17.3 11.8 12.8 14.3 16.3 4.9 2.0 2.5 .5 4.4 105.0
Tajik Count 13 13 11 4 5 7 5 4 3 1 5 71
Expected Count 12.3 11.7 8.0 8.7 9.7 11.0 3.3 1.3 1.7 .3 3.0 71.0
Hazara Count 4 10 4 2 4 1 0 0 0 0 0 25
Expected Count 4.3 4.1 2.8 3.1 3.4 3.9 1.2 .5 .6 .1 1.1 25.0
Uzbek Count 0 3 0 0 1 0 1 0 0 0 0 5
Expected Count .9 .8 .6 .6 .7 .8 .2 .1 .1 .0 .2 5.0
Other Count 2 0 1 1 1 1 1 0 0 0 0 7
Expected Count 1.2 1.2 .8 .9 1.0 1.1 .3 .1 .2 .0 .3 7.0
Total Count 37 35 24 26 29 33 10 4 5 1 9 213
Expected Count 37.0 35.0 24.0 26.0 29.0 33.0 10.0 4.0 5.0 1.0 9.0 213.0
Chi-Square Tests
Value df
Asymp. Sig. (2-
sided)
Pearson Chi-Square 63.996a 40 .009
Likelihood Ratio 67.795 40 .004
Linear-by-Linear Association 2.968 1 .085
N of Valid Cases 213
a. 43 cells (78.2%) have expected count less than 5. The minimum expected count
is .02.
Symmetric Measures
Value Approx. Sig.
Nominal by Nominal Phi .548 .009
Cramer's V .274 .009
N of Valid Cases 213

923

924
Ethnicity * Haneef Atmar Crosstab
Haneef Atmar
Total .0 1.0 2.0 3.0 4.0 5.0 6.0 7.0 8.0 9.0 10.0
Ethnicity Pashtun Count 17 6 10 11 23 25 4 1 2 0 0 99
Expected Count 16.8 13.2 11.8 11.4 16.3 14.5 4.5 3.2 3.2 .5 3.6 99.0
Tajik Count 13 13 9 6 6 6 5 3 3 1 7 72
Expected Count 12.2 9.6 8.6 8.3 11.9 10.6 3.3 2.3 2.3 .3 2.6 72.0
Hazara Count 6 9 5 3 4 1 0 1 0 0 0 29
Expected Count 4.9 3.9 3.5 3.3 4.8 4.3 1.3 .9 .9 .1 1.1 29.0
Uzbek Count 0 1 0 4 1 0 1 1 2 0 1 11
Expected Count 1.9 1.5 1.3 1.3 1.8 1.6 .5 .4 .4 .1 .4 11.0
Other Count 1 0 2 1 2 0 0 1 0 0 0 7
Expected Count 1.2 .9 .8 .8 1.2 1.0 .3 .2 .2 .0 .3 7.0
Total Count 37 29 26 25 36 32 10 7 7 1 8 218
Expected Count 37.0 29.0 26.0 25.0 36.0 32.0 10.0 7.0 7.0 1.0 8.0 218.0
Chi-Square Tests
Value df
Asymp. Sig. (2-
sided)
Pearson Chi-Square 80.366a 40 .000
Likelihood Ratio 84.024 40 .000
Linear-by-Linear Association .000 1 .988
N of Valid Cases 218
a. 43 cells (78.2%) have expected count less than 5. The minimum expected count
is .03.
Symmetric Measures
Value Approx. Sig.
Nominal by Nominal Phi .607 .000
Cramer's V .304 .000
N of Valid Cases 218
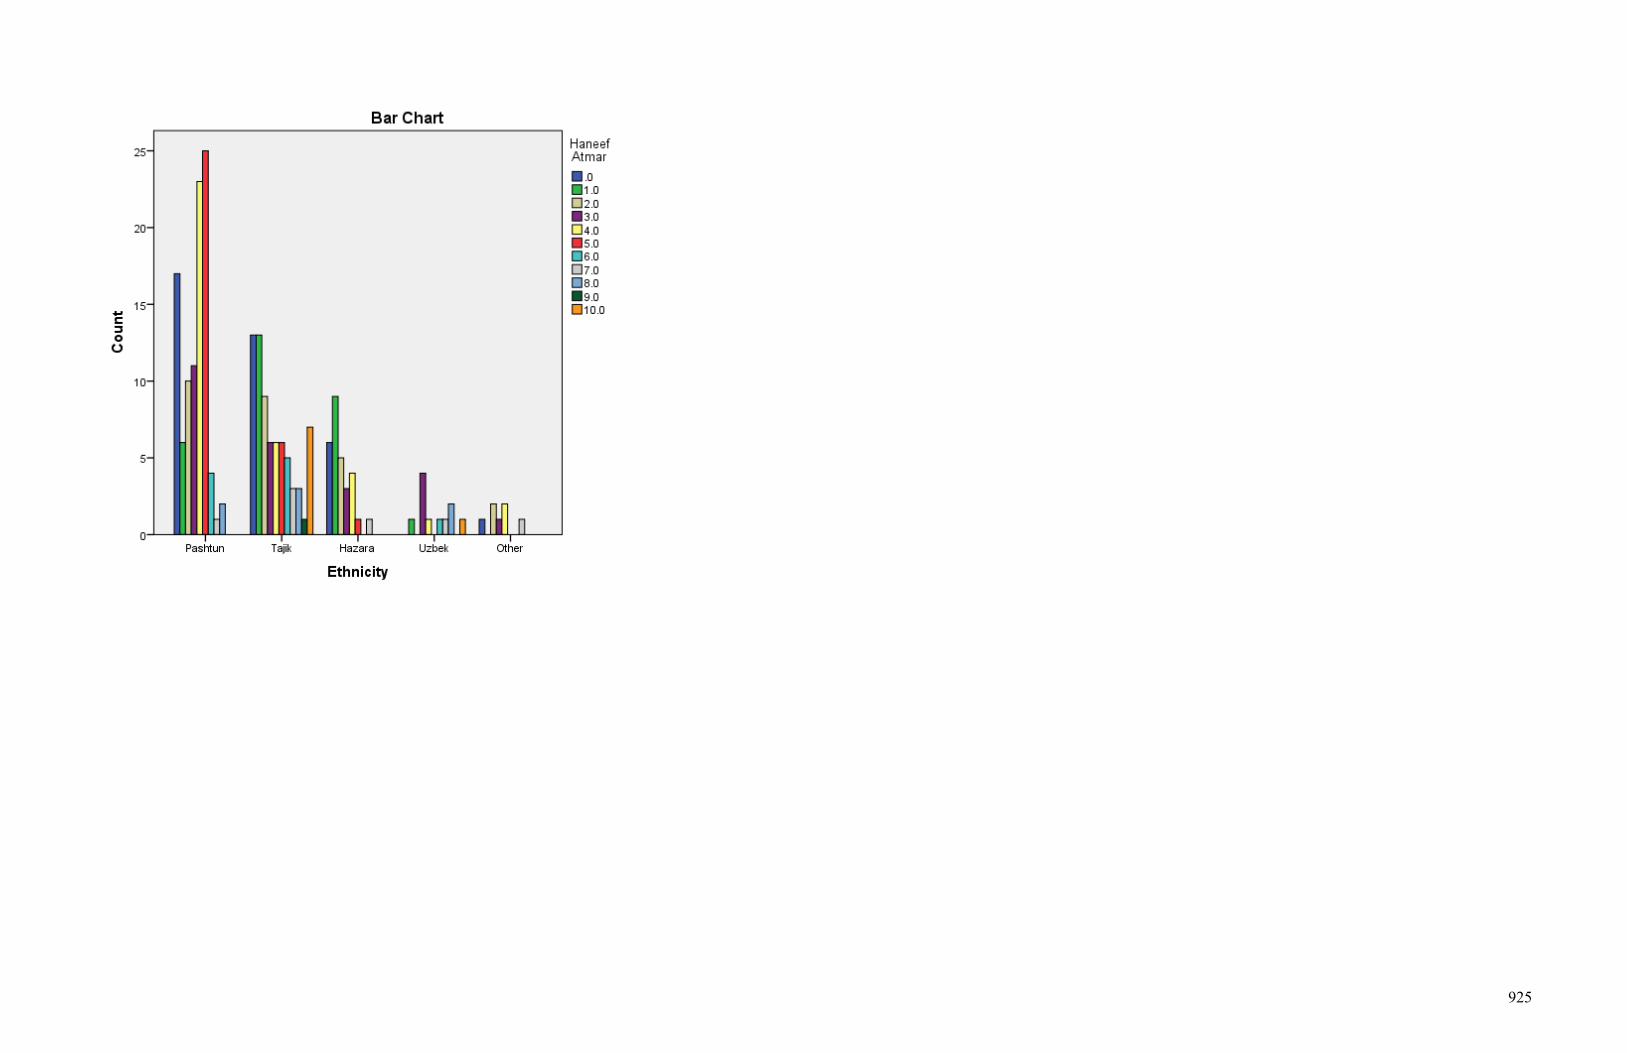
925

926
Ethnicity * Sebghatullah Mujadadi Crosstab
Sebghatullah Mujadadi
Total .0 1.0 2.0 3.0 4.0 5.0 6.0 7.0 8.0 9.0 10.0
Ethnicity Pashtun Count 25 19 19 17 13 20 3 2 1 0 2 121
Expected Count 19.5 21.7 16.0 14.3 11.3 19.5 6.5 5.2 3.5 .4 3.0 121.0
Tajik Count 15 20 11 6 7 13 11 8 4 1 2 98
Expected Count 15.8 17.6 13.0 11.6 9.1 15.8 5.3 4.2 2.8 .4 2.5 98.0
Hazara Count 4 7 3 8 4 8 0 0 1 0 1 36
Expected Count 5.8 6.5 4.8 4.3 3.4 5.8 1.9 1.5 1.0 .1 .9 36.0
Uzbek Count 0 2 3 0 1 3 1 1 2 0 2 15
Expected Count 2.4 2.7 2.0 1.8 1.4 2.4 .8 .6 .4 .1 .4 15.0
Other Count 1 2 1 2 1 1 0 1 0 0 0 9
Expected Count 1.5 1.6 1.2 1.1 .8 1.5 .5 .4 .3 .0 .2 9.0
Total Count 45 50 37 33 26 45 15 12 8 1 7 279
Expected Count 45.0 50.0 37.0 33.0 26.0 45.0 15.0 12.0 8.0 1.0 7.0 279.0
Chi-Square Tests
Value df
Asymp. Sig. (2-
sided)
Pearson Chi-Square 55.932a 40 .048
Likelihood Ratio 57.437 40 .036
Linear-by-Linear Association 6.300 1 .012
N of Valid Cases 279
a. 37 cells (67.3%) have expected count less than 5. The minimum expected count
is .03.
Symmetric Measures
Value Approx. Sig.
Nominal by Nominal Phi .448 .048
Cramer's V .224 .048
N of Valid Cases 279

927

928
Ethnicity * Zalmay Khalilzad Crosstab
Zalmay Khalilzad
Total .0 1.0 2.0 3.0 4.0 5.0 6.0 7.0 8.0 9.0 10.0
Ethnicity Pashtun Count 23 14 15 16 8 17 3 1 2 1 2 102
Expected Count 21.0 17.4 12.8 12.3 8.7 13.7 6.4 3.2 2.7 .5 3.2 102.0
Tajik Count 11 16 7 5 5 8 10 5 1 0 3 71
Expected Count 14.6 12.1 8.9 8.6 6.0 9.6 4.5 2.2 1.9 .3 2.2 71.0
Hazara Count 9 5 3 4 3 2 1 1 1 0 0 29
Expected Count 6.0 4.9 3.6 3.5 2.5 3.9 1.8 .9 .8 .1 .9 29.0
Uzbek Count 0 3 3 1 0 0 0 0 2 0 2 11
Expected Count 2.3 1.9 1.4 1.3 .9 1.5 .7 .3 .3 .0 .3 11.0
Other Count 3 0 0 1 3 3 0 0 0 0 0 10
Expected Count 2.1 1.7 1.3 1.2 .9 1.3 .6 .3 .3 .0 .3 10.0
Total Count 46 38 28 27 19 30 14 7 6 1 7 223
Expected Count 46.0 38.0 28.0 27.0 19.0 30.0 14.0 7.0 6.0 1.0 7.0 223.0
Chi-Square Tests
Value df
Asymp. Sig. (2-
sided)
Pearson Chi-Square 66.460a 40 .005
Likelihood Ratio 63.523 40 .010
Linear-by-Linear Association .699 1 .403
N of Valid Cases 223
a. 41 cells (74.5%) have expected count less than 5. The minimum expected count
is .04.
Symmetric Measures
Value Approx. Sig.
Nominal by Nominal Phi .546 .005
Cramer's V .273 .005
N of Valid Cases 223

929


931
ANNEX – XXX: Rating of Actual Afghan Leaders (Popularity Measure):
Average rating of an actual Afghan leader by 568 respondents:
No Leader’s Names Rating
Status (D=Dead, A=Alive)
6.2 داکتر نجيب 11 D 5.9 امان هللا خان 5 D 5.6 احمدشاه بابا 2 D 5.5 خانداود 7 D 5.3 ميرويس نيکه 1 D
5.2 احمدشاه مسعود 16 D 5.0 استاد عطا 24 A 5.0 رمضان بشردوست 42 A 4.6 حامد کرزی 14 A 4.5 امرهللا صالح 23 A 4.4 فوزيه کوفی 45 A 4.4 بکتاش سياوش 56 A 4.3 سيد مصطفی کاظمی 54 D 4.2 يونس قانونی 30 A 4.2 ظاھر شاه 6 D
4.0 شکريه بارکزی 44 A 4.0 شيخ آصف محسنی 31 A 4.0 داکتر عبدهللا 50 A 3.9 اشرف غنی احمدزی 33 A 3.8 علی احمد اللی 34 A 3.7 داکتر سيما سمر 43 A 3.7 اللی جويا 49 A 3.7 حبيبه سرابی 47 A 3.6 استاد ربانی 13 D 3.6 فاروق وردک 41 A 3.6 حبيب هللا کلکانی 4 D
3.6 بانو غضنفر 48 A 3.6 بسم هللا خان 52 A 3.5 عبدالرحمن خان 3 D
3.4 احمد بھزاد 57 A 3.4 سلطان علی کشتمند 39 A 3.3 جنرال دوستم 28 A 3.3 اسماعيل خان 25 A 3.2 گل آغا شيرزی 26 A 3.2 حنيف اتمر 40 A 3.2 استاد سياف 29 A 3.1 رحيم وردک 53 A 3.1 هللا مجددیصبغت 12 A 3.1 زلمی خليلزاد 35 A 3.1 لطيف پدرام 55 A 3.1 احمدضيا مسعود 22 A 3.1 سيد احمد گالنی 32 A 3.0 داکتر اسپانتا 51 A 2.9 محمد محقق 27 A 2.9 سمين بارکزی 46 A 2.8 احمدولی کرزی 63 A 2.6 عبدالعلی مزاری 19 D 2.6 طاھر بدخشی 38 A 2.5 انورالحق احدی 36 A 2.5 کريم خليلی 20 A 2.5 عمرزاخيلوال 59 A 2.3 قيوم کرزی 15 A 2.3 مارشال محمد قسيم فھيم 21 A 2.3 ظاھر قدير 58 A 2.2 محمود کرزی 62 A 2.2 ال محمد عمر 18 A 2.2 ببرک کارمل 10 D 2.1 حکمتيار 17 A 2.1 عمر داودزی 61 A

932
2.0 نورمحمد ترکی 8 D 2.0 کريم خرم 60 A 1.9 اسماعيل يون 37 A
1.7 حفيظ هللا امين 9 D
The most and least popular Afghan leaders (dead and alive):
Average not Alive Average Alive4.1 3.3
Top Ten High Rated Leaders Top Ten Low Rated Leaders
Leader Rate Status Leader Rate Status
Dr. Najib 6.2 D Zahir Qadeer 2.3 A King Amanullah 5.9 D Mahmood Karzai 2.2 A King Ahmad Shah 5.6 D Mollah Omar 2.2 A President Dawood 5.5 D Babrak Karmal 2.2 D Mirwais Nika 5.3 D Hekmatyar 2.1 A Ahmad Shah Masood 5.2 D Omar Dawoodzai 2.1 A Ustad Atta 5.0 A Noor Mohd. Taraki 2.0 D Dr. Bashar Dost 5.0 A Karim Khuram 2.0 A President Karzai 4.6 A Esmael Yoon 1.9 A Amrullah Saleh 4.5 A Hafeezullah Amin 1.7 D

933
Appendix – XXXI: Sample of Education Material in Afghanistan’s Educational System.
This is the title page of a first grade math book printed during Jihad of Afghanistan and were thought to
Afghan children during 80s and 90s. Below are some example pages from this book.

934
Letter Z (it is a Pashtu letter that sounds like Z in English)
Translation form Pashtu to English:
I keep my body clean. Youth go to Jehad. Good boys do not play in an inappropriate place.

935
In this math book they printed bullet symbols to help kids learn addition and subtraction.

936
Translation from Pashtu to English:
We have one religion, and pray towards one distention (Mekah)
Nobody can separate Muslims from one another.

937
Once again, symbols of bullets, hand grenade, and gun are used to teach math.

938
Translation from Pashtu to English:
Ahmad has sword. He uses his sword for Jihad.

939
Translation from Pashtu to English:
Jihad is a religious obligation. Jameel (male name in Afghanistan) has gone to Jihad. I will go too.

940
Translation from Pashtun to English:
Religion
Islam is our religion. I die for my religion. Infidels are the enemies of our religion.

941
Translation form Pashtu to English:
Mujahid
Muslims of Afghanistan are Mujahids.
Mujahids fight with Infidels. We are all Mujahid. My uncle is going to Jihad.

942
Translation from Pashtu to English:
Gun
My uncle has a gun.
He uses his gun for Jihad.