Polar and Neutral Lipid Composition in the Pelagic Tunicate Pyrosoma atlanticum
11
ORIGINAL ARTICLE Polar and Neutral Lipid Composition in the Pelagic Tunicate Pyrosoma atlanticum Patrick Mayzaud Marc Boutoute Renzo Perissinotto Peter Nichols Received: 6 February 2007 / Accepted: 17 April 2007 / Published online: 2 June 2007 ȑ AOCS 2007 Abstract Structure and functioning of colonial pyro- somes are largely undescribed and their lipid characteris- tics have received limited attention. The aim of this paper is to fill this gap on one of the dominant species Pyrosoma atlanticum. Lipid content is tightly coupled to size and weight. Lipid composition shows a large dominance of structural polar lipids. Neutral lipids were dominated by sterols with low levels of acylglycerols and free fatty acids. Phospholipids show a dominance of PC with intermediate percentages of PE and DPG. Other constituents (PS, PI, LPC, sphingolipids) were present at lower levels. Fatty acid composition of DAG and TAG showed a dominance of saturated acids (16:0, 14:0), DHA and intermediate levels of MUFA. Phospholipids were dominated by DHA with values exceeding 30% of total FA in all categories except for PI, where lower percentages occurred. Saturated acids were second in abundance with MUFA showing intermediate concentrations. Sterols were dominated by 24- methylcholesta-5,22E-dien-3b-ol with more than 22% of the total sterol. Cholesterol (cholest-5-en-3b-ol) repre- sented only 12 % of the total while 24-methylcholesta- 5,24(28)E-dien-3b-ol accounted for 11% of the total ster- ols. The low levels of triacylglycerols and free fatty acids, coupled with high concentrations of glycolipids and phy- toplankton-derived degraded chloropigments, is evidence of a direct link with the digestive activity and substantiate the idea of a high physiological turnover as an alternative to large lipid accumulation. The fatty acid and sterol pro- files are consistent with a diverse phytoplankton diet, and a strong contribution of phospholipid classes to energy needs, including locomotion. Introduction Pyrosomas are a small group of holoplanktonic tunicates, currently including only 8 described species and 3 genera [1]. They are restricted to the warmer open ocean waters, between approximately 50ŶN and 50 o S in all oceans [2]. Our knowledge of the lipid composition in tunicates re- mains fragmentary and detailed reports encompass essen- tially benthic tunicates, e.g. ascidians [3, 4] as well as salps, doliolids and appendicularians [5–8]. Knowledge of the lipid composition of Pyrosoma is limited to total fatty acid composition of Pyrosoma atlanticum reported by Culkin and Morris [9] and Jeffs et al. [10]. Both studies observed that the concentration of total lipids is generally low and dominated by structural lipids. Neither of the two studies on P. atlanticum considered the lipid composition in terms of lipid classes and their related fatty acid structure. During the last leg of the ANTARES-4 cruise to the south Indian and the Southern oceans, substantial numbers of P. atlanticum colonies were observed in the region north of the Subtropical Front. As examination of biomarker lipid profiles from different lipid P. Mayzaud (&) Á M. Boutoute Universite ´ Pierre et Marie Curie, Observatoire Oce ´anologique, UMR-CNRS 7093, LOV, BP. 28, 06230 Villefranche sur mer, France e-mail: [email protected] R. Perissinotto School of Biological and Conservation Sciences, G. Campbell Building, University of KwaZulu-Natal, Howard College Campus, Durban 4041, South Africa P. Nichols CSIRO, Marine and Atmospheric Research, Castray Esplanade, Hobart, TAS 7001, Australia 123 Lipids (2007) 42:647–657 DOI 10.1007/s11745-007-3066-0
-
Upload
laurentponson -
Category
Documents
-
view
2 -
download
0
Transcript of Polar and Neutral Lipid Composition in the Pelagic Tunicate Pyrosoma atlanticum
ORIGINAL ARTICLE
Polar and Neutral Lipid Composition in the Pelagic TunicatePyrosoma atlanticum
Patrick Mayzaud Æ Marc Boutoute ÆRenzo Perissinotto Æ Peter Nichols
Received: 6 February 2007 / Accepted: 17 April 2007 / Published online: 2 June 2007
� AOCS 2007
Abstract Structure and functioning of colonial pyro-
somes are largely undescribed and their lipid characteris-
tics have received limited attention. The aim of this paper
is to fill this gap on one of the dominant species Pyrosoma
atlanticum. Lipid content is tightly coupled to size and
weight. Lipid composition shows a large dominance of
structural polar lipids. Neutral lipids were dominated by
sterols with low levels of acylglycerols and free fatty acids.
Phospholipids show a dominance of PC with intermediate
percentages of PE and DPG. Other constituents (PS, PI,
LPC, sphingolipids) were present at lower levels. Fatty
acid composition of DAG and TAG showed a dominance
of saturated acids (16:0, 14:0), DHA and intermediate
levels of MUFA. Phospholipids were dominated by DHA
with values exceeding 30% of total FA in all categories
except for PI, where lower percentages occurred. Saturated
acids were second in abundance with MUFA showing
intermediate concentrations. Sterols were dominated by 24-
methylcholesta-5,22E-dien-3b-ol with more than 22% of
the total sterol. Cholesterol (cholest-5-en-3b-ol) repre-
sented only 12 % of the total while 24-methylcholesta-
5,24(28)E-dien-3b-ol accounted for 11% of the total ster-
ols. The low levels of triacylglycerols and free fatty acids,
coupled with high concentrations of glycolipids and phy-
toplankton-derived degraded chloropigments, is evidence
of a direct link with the digestive activity and substantiate
the idea of a high physiological turnover as an alternative
to large lipid accumulation. The fatty acid and sterol pro-
files are consistent with a diverse phytoplankton diet, and a
strong contribution of phospholipid classes to energy
needs, including locomotion.
Introduction
Pyrosomas are a small group of holoplanktonic tunicates,
currently including only 8 described species and 3 genera
[1]. They are restricted to the warmer open ocean waters,
between approximately 50�N and 50oS in all oceans [2].
Our knowledge of the lipid composition in tunicates re-
mains fragmentary and detailed reports encompass essen-
tially benthic tunicates, e.g. ascidians [3, 4] as well as
salps, doliolids and appendicularians [5–8]. Knowledge of
the lipid composition of Pyrosoma is limited to total fatty
acid composition of Pyrosoma atlanticum reported by
Culkin and Morris [9] and Jeffs et al. [10]. Both studies
observed that the concentration of total lipids is generally
low and dominated by structural lipids.
Neither of the two studies on P. atlanticum considered
the lipid composition in terms of lipid classes and their
related fatty acid structure. During the last leg of the
ANTARES-4 cruise to the south Indian and the Southern
oceans, substantial numbers of P. atlanticum colonies were
observed in the region north of the Subtropical Front. As
examination of biomarker lipid profiles from different lipid
P. Mayzaud (&) � M. Boutoute
Universite Pierre et Marie Curie,
Observatoire Oceanologique,
UMR-CNRS 7093, LOV, BP. 28,
06230 Villefranche sur mer, France
e-mail: [email protected]
R. Perissinotto
School of Biological and Conservation Sciences,
G. Campbell Building, University of KwaZulu-Natal,
Howard College Campus, Durban 4041, South Africa
P. Nichols
CSIRO, Marine and Atmospheric Research,
Castray Esplanade, Hobart, TAS 7001, Australia
123
Lipids (2007) 42:647–657
DOI 10.1007/s11745-007-3066-0

classes may provide more detailed information pertinent to
life cycle adaptation and food web research than is ob-
tained from total fatty acid profiles, the availability of a
sufficient number of samples prompted an investigation of
the lipid constitution with special emphasis on the polar
structural lipids.
Materials and Methods
Sampling
All samples were taken during the ANTARES-4 cruise of
the research vessel Marion Dufresne, during the period 5
January–23 February 1999. The operational area was re-
stricted between approximately 43–46oS and 61–65 oE, in
the Indian sector of the Southern Ocean and the region of
the Agulhas Front (for details see map in Perissinotto et al.,
16). Colonies of P. atlanticum were collected only in the
Agulhas Front region, north of the Subtropical Conver-
gence, during the period 2–16 February at stations G4
(44�21¢03S; 62�33¢37E). Specimens were collected using a
160 cm-diameter Omori Net (1,000 lm mesh, towed ob-
liquely from 200 m to the surface). Specimens were sorted
out immediately, briefly rinsed with distilled water, blotted
dry on sharkskin filter paper and deep frozen in liquid
nitrogen. Samples were kept at –80 �C until return to the
laboratory within 3 months.
Size, Weight Measurements and Lipid Extraction
Entire specimens were placed frozen on crushed ice and
brought to 0 �C. Size (total length = TL) and fresh weight
(WW) were measured prior to lipid extraction according to
the method of Bligh and Dyer [11]. The Bligh and Dyer
method when used as published may not fully extract
neutral lipids. This problem can be overcome using the
same solvent ratios (i.e. one phase), and a longer extraction
time. All lipid extracts were placed under nitrogen at
–70 �C until analysis. Individual dry weight (DW) was
recorded on sub-samples of 6 colonies dried at 70 �C for
six days to obtain the dry weight/wet weight ratio.
Lipid Analyses
Lipid classes were quantified after chromatographic sepa-
ration coupled with FID detection on an Iatroscan
MK V TH 10. Total lipid extracts were applied to SIII
chromarods using a SAS A4100 autospotter set up to deliver
1 ll of chloroform extract on each rod. Analyses were done
in triplicate. Neutral lipids were separated using a double
development procedure with the following solvent systems:
n-hexane: benzene: formic acid 80:20:1 (by volume)
followed by n-hexane:diethyl ether:formic acid 97:3:1.5
(v/v). Phospholipids were separated with chloroform:
methanol: NH4 50:50:5 (v/v). Separation of glycolipids was
achieved with chloroform/ethyl acetate/acetone/methanol/
acetic acid/water (60/12/15/16/3/3). Calibration was
achieved using commercial standards (Tripalmitin, 1,2 di-
palmitoyl-rac-glycerol, stearic acid, cholesterol, 3-sn-
phosphatidyl-L-serine from bovine brain, L-a-phosphatidyl
inositol from bovine liver, sphingomyelin from bovine
brain and a-lysophosphatidylcholine from egg yolk were
obtained from Sigma; MGDG and DGDG from spinach
were obtained from Larodan; L-a-Lecithin from egg yolk,
L-phosphatidyl- ethanolamine from egg and cardiolipin
from bovine heart were obtained from Avanti Polar Lipids).
Separation of neutral and polar lipids was achieved on a
preparative scale by column chromatography on silica gel
(Supelcosil A, Supelco). The neutral lipid fraction was
eluted with six column volumes of chloroform, the acetone
mobile compounds were eluted with four volumes of ace-
tone and the phospholipids were eluted with six volumes of
methanol. Each fraction collected was further separated by
thin-layer chromatography (TLC) on pre-coated silica gel
plates (Analtech, Uniplate) and developed with hexane :
diethyl ether : acetic acid, 170:30:2 (v/v) for neutral lipids,
or chloroform : methanol : aqueous ammonia 70:30:4 (v/v)
for glycolipids, and chloroform: methanol: aqueous
ammonia 50: 50: 5 (v/v) for polar lipids. All operations
took place under nitrogen. Lipid classes were visualized
using dichlorofluorescein and identification was achieved
by comparison with standard mixtures. Acetone fraction
was further separated on HPTLC using the same solvent
system as TLC, but with specific detection of glycolipids
made with Bial’s Orcinol reagents (Alltech). No attempt
was made to separate possible plasmalogen phospholipids.
Each band from TLC was scraped off and submitted to
methylation. Fatty acid methyl esters (FAME) of total
lipids were prepared with 7% boron trifluoride in methanol
[12]. FAME were purified on TLC and recovered in hex-
ane. Gas chromatography (GC) of all esters was carried out
on a 30 m length x 0.32 mm internal diameter quartz
capillary column coated with Famewax (Restek) in a Per-
kin-Elmer XL Autolab GC equipped with a flame ioniza-
tion detector (FID). The column was operated isothermally
at 185 �C for FAME. Helium was used as carrier gas at 7
psig. Injector and detector were maintained at 250 �C.
Individual components were identified by comparing
retention time data with those obtained from authentic (Nu-
Check prep) and laboratory standards (capelin : menhaden
oils 50:50). In addition to the examination of FAME as
recovered, a part of all FAME samples was completely
hydrogenated and the products examined qualitatively and
quantitatively by GC. The level of accuracy is ±5% for
major components, 1 to 9% for intermediate components
648 Lipids (2007) 42:647–657
123
and up to ±30% for minor components. Additional GLC
analysis was carried out on a 30 m length · 0.25 mm
internal diameter non polar DB1 column (J&W Scientific)
to resolve the co-elution of 20:1 and 18:5 fatty acids on
Famewax.
Analysis of sterols was conducted on an aliquot of the
separated sterol fraction after conversion to TMSi (trim-
ethylsilyl) ethers using N,O-bis-(trimethylsilyl)-trifluoro-
acetamide (BSFA, 50 ll) at 60 �C for 1 h. GC and GC-MS
analysis of sterols was achieved as described in Jeffs et al.
[10].
Statistical Treatment
Allometric relationships between dry weight (DW) and
length (TL) for the different colonies (DW = a * TLb) were
computed after log–log transformation and model I
regression [13]. Bivariate analyses were made with Stat-
graphics XV. Cluster analysis was based on Bray-Curtis
distance and farthest neighbour clustering (see: 15).
Correspondence analysis [14] was performed on a re-
duced data matrix of fatty acids transformed to relative
frequencies and scaled so that each row (or column) could
be viewed as a row (or column) of conditional probability
distribution. Distances between profiles were computed
with v2 metrics. This distance gives symmetry to the two
sets of data so that each factorial axis associated to the
cluster of variables (fatty acids) corresponds to a factorial
axis of the cluster of observations (phospholipids). Thus, it
was possible to represent simultaneously descriptors and
observations on the plane defined by the factorial axes.
Details on the method and means of interpretation are gi-
ven in Mayzaud et al. [16]. Computation of multivariate
tests was made using the SPAD 5.5 software [17].
Six replicates were used to compute all means and
standard deviations.
Results
Size, Weight and Lipid Relationships
The size of the colonies of pyrosomes collected during the
ANTARES 4 cruise ranged from 13 to 25 cm. The corre-
sponding wet and dry weight varied from 22 to 64 g and
from 1.1 to 3.6 g respectively, with water content
exceeding 90%. Lipid content on a dry weight basis was
generally low and ranged from 5 to 7%.
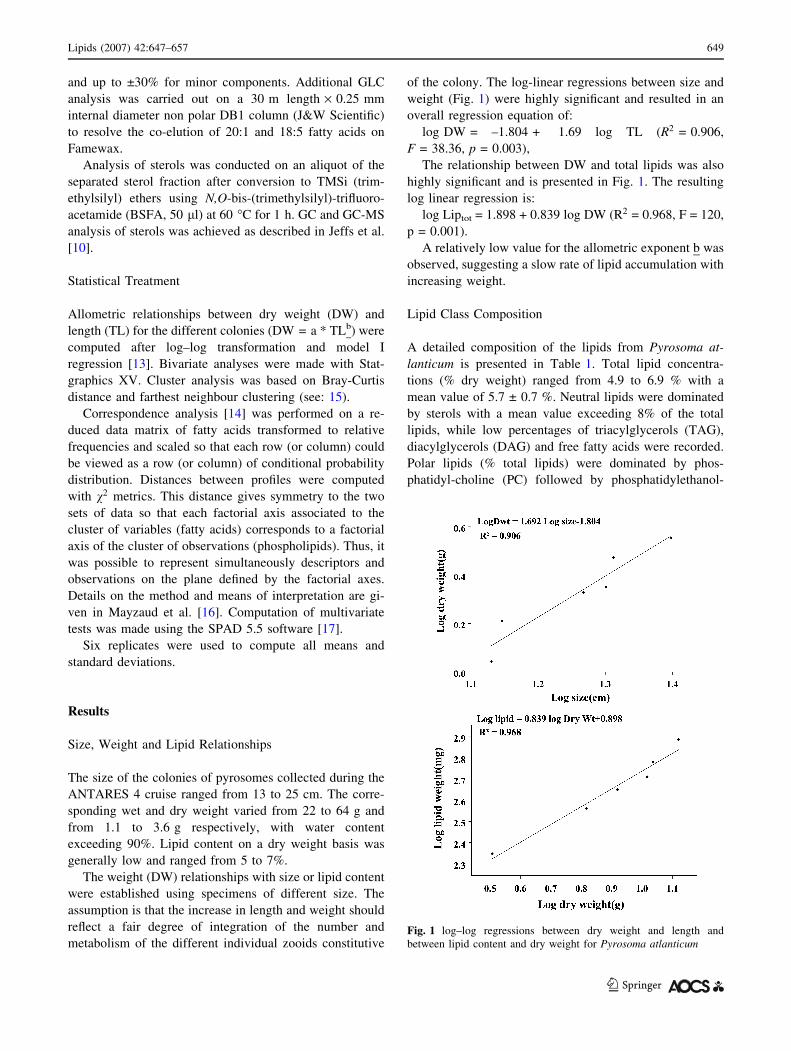
The weight (DW) relationships with size or lipid content
were established using specimens of different size. The
assumption is that the increase in length and weight should
reflect a fair degree of integration of the number and
metabolism of the different individual zooids constitutive
of the colony. The log-linear regressions between size and
weight (Fig. 1) were highly significant and resulted in an
overall regression equation of:
log DW = –1.804 + 1.69 log TL (R2 = 0.906,
F = 38.36, p = 0.003),
The relationship between DW and total lipids was also
highly significant and is presented in Fig. 1. The resulting
log linear regression is:
log Liptot = 1.898 + 0.839 log DW (R2 = 0.968, F = 120,
p = 0.001).
A relatively low value for the allometric exponent b was
observed, suggesting a slow rate of lipid accumulation with
increasing weight.
Lipid Class Composition
A detailed composition of the lipids from Pyrosoma at-
lanticum is presented in Table 1. Total lipid concentra-
tions (% dry weight) ranged from 4.9 to 6.9 % with a
mean value of 5.7 ± 0.7 %. Neutral lipids were dominated
by sterols with a mean value exceeding 8% of the total
lipids, while low percentages of triacylglycerols (TAG),
diacylglycerols (DAG) and free fatty acids were recorded.
Polar lipids (% total lipids) were dominated by phos-
phatidyl-choline (PC) followed by phosphatidylethanol-
Fig. 1 log–log regressions between dry weight and length and
between lipid content and dry weight for Pyrosoma atlanticum
Lipids (2007) 42:647–657 649
123

amine (PE), diphosphatidylglycerol (DPG) with lower
levels of phosphatidylserine+inositol (PS+PI), sphingo-
myelin and lysophosphatidylcholine (LPC). The lack of
significant relationships between total lipids or lipid class
per unit weight and either size or dry weight may be
related to the small number of data points(n = 6), or to
the lack of direct interactions between body mass and
lipid metabolism.
Two glycolipids fractions were found in concentrations
exceeding 4% which can be attributed to the filter-feeding
mode of the colonies. Their identification on HPTLC using
Bial’s Orcinol reagents, a sugar specific stain, showed that
one fraction displayed the same Rf as commercial MGDG,
while the second one run slightly faster than DGDG with
the solvent system used. The high concentration of ingested
chloropigments (from 0.3 to 1.6 lg colony–1, see Peris-
sinotto et al., 18), suggests that the second fraction also
originated from ingested phytoplankton. As discussed be-
low, the high level of saturation of this later fraction (96%
saturated acids) could explain the difference in migration
as it is more saturated than the higher plant standard. This
would agree with the possibility of a partial post ingestion
modification.
Fatty Acid Composition of the Total and Neutral Lipids
The relative composition of the total fatty acids and the
main neutral lipid classes is presented in Table 2. Fatty
acid composition of the total lipids was driven by the
abundance of polar lipids. Docosahexaenoic acid (DHA,
22:6n-3) dominated largely with more than 36% of the
total fatty acids. Saturated acids were second in abun-
dance (> 30%) with palmitic (16:0) and myristic (14:0) as
major components. Monounsaturated fatty acids (MUFA)
showed intermediate percentages (12%), with 18:1n-9,
16:1n-7 and 18:1n-7 as major contributors. Among PU-
FAs other than DHA, eicosapentaenoic acid (EPA 20:5n-
3) was the dominant pentaene, 18:2n-6, 18:3n-3 and
18:4n-3 dominated their respective group. DAG and TAG
showed a dominance of saturated acids with 16:0 and
14:0, followed by 22:6n-3 with respective percentages of
18.6% and 21.9% of total fatty acids. Both the DAG and
TAG fractions showed relatively high levels of 18:4n-3
(12.5 and 10.5%) and intermediate levels of MUFA with
the same characteristic fatty acids. The two acylglycerols
showed similar fatty acid composition, the only difference
being the larger proportion of myristic acid (14:0) in
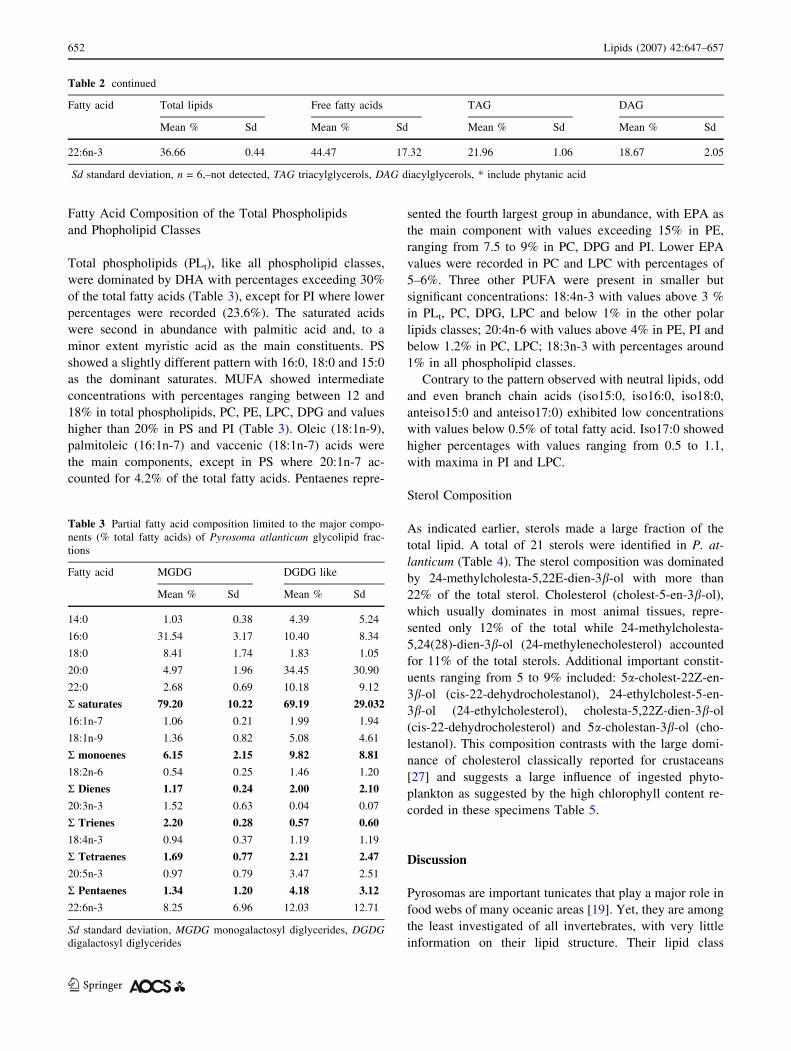
DAG. The free fatty acid fraction was considered because
of the high probability that it originates from digestive
hydrolysis. Indeed, DHA showed the highest percentages
with values ranging from 32 to 64% of the total fatty
acids (mean 44.5%) despite the similar concentrations of
free fatty acid contained in each specimen analyzed (3 to
4.5 % of total lipids). Stearic and myristic acids were the
dominant saturated acids with respective ranges of 2 to
15% and 0.6 to 10%. EPA ranged from 3 to 12%, while
oleic acid was the major MUFA with values ranging
between 3.8 and 6.8%. Other MUFA and PUFA included
18:1n-7, 16:1n-7, 18:2n-6, 18:4n-3 and 20:4n-6 with
percentages close to 2%. Odd branched chain acids (iso
and anteiso) exhibited moderately high values in all
neutral fractions, with percentages of iso15:0, anteiso15:0
and iso17:0 exceeding 1%.
Fatty Acid Fraction of the Glycolipids
The fatty acid composition of the two glycolipid fractions
will only be summarized because of the unusual vari-
ability between replicates. The partial composition pre-
sented in Table 3, showed a large dominance of the
saturated acids with 16:0 and 20:0 as main contributors
for MGDG and DGDG respectively. DHA was second in
importance but with values ranging from 2.8 to 20.4% for
MGDG and from 1.1 to 25.9% for DGDG. Hence, the
percent variability in fatty acid composition of MGDG,
based on six replicates, is 13% for the saturated acids,
35% for the monoenes, 82% for 20:5 and 86% for 22:6.
An increasing trend which agrees with the hypothesis of
selective loss of polyunsaturated acids. The second frac-
tion (DGDG-like) showed 40% variability for the satu-
rated acids, 90% for the monoenes, and 120% for most
unsaturated categories. Since the glycolipids originated
from the phytoplankton chloroplast membranes, such ex-
treme variance can only originate from different degree of
digestive degradation.
Table 1 Lipid content and composition in lipid classes of Pyrosomaatlanticum
Pyrosoma atlanticum n = 6
Total lipids (% dry weight) 5.70 ± 0.67
Lipid classes (% total lipids)
Phosphatidylcholine 45.7 ± 2.57
Phosphatidylethanolamine 13.9 ± 1.70
Diphosphatidylglycerol 6.41 ± 1.90
Phophatidylserine + inositol 2.92 ± 1.07
Lysophosphatidyl choline 2.63 ± 0.64
Sphingolipids 2.12 ± 0.17
Glycolipid # 1 MGDG 4.33 ± 1.56
Glycolipid # 2 DGDG like 4.18 ± 1.43
Diacylglycerols 2.28 ± 0.69
Triacylglycerols 3.52 ± 0.80
Free fatty acids 3.92 ± 0.98
Sterols 8.13 ± 0.60
Values expressed as mean ± standard deviation
650 Lipids (2007) 42:647–657
123
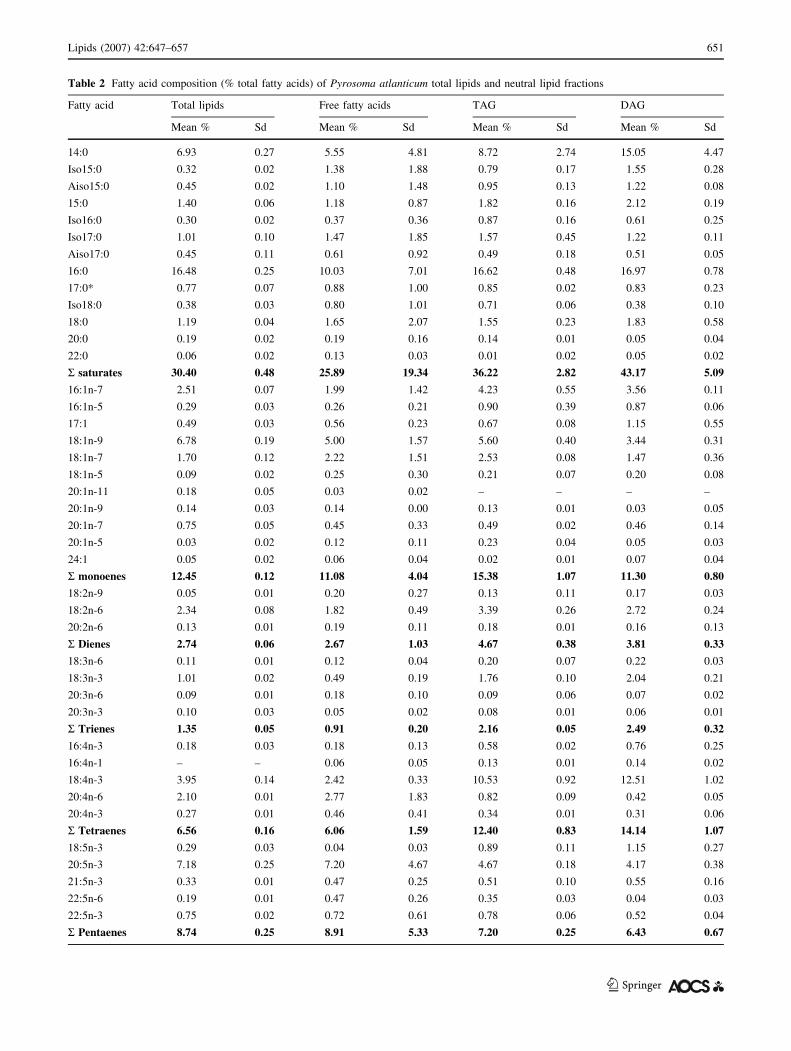
Table 2 Fatty acid composition (% total fatty acids) of Pyrosoma atlanticum total lipids and neutral lipid fractions
Fatty acid Total lipids Free fatty acids TAG DAG
Mean % Sd Mean % Sd Mean % Sd Mean % Sd
14:0 6.93 0.27 5.55 4.81 8.72 2.74 15.05 4.47
Iso15:0 0.32 0.02 1.38 1.88 0.79 0.17 1.55 0.28
Aiso15:0 0.45 0.02 1.10 1.48 0.95 0.13 1.22 0.08
15:0 1.40 0.06 1.18 0.87 1.82 0.16 2.12 0.19
Iso16:0 0.30 0.02 0.37 0.36 0.87 0.16 0.61 0.25
Iso17:0 1.01 0.10 1.47 1.85 1.57 0.45 1.22 0.11
Aiso17:0 0.45 0.11 0.61 0.92 0.49 0.18 0.51 0.05
16:0 16.48 0.25 10.03 7.01 16.62 0.48 16.97 0.78
17:0* 0.77 0.07 0.88 1.00 0.85 0.02 0.83 0.23
Iso18:0 0.38 0.03 0.80 1.01 0.71 0.06 0.38 0.10
18:0 1.19 0.04 1.65 2.07 1.55 0.23 1.83 0.58
20:0 0.19 0.02 0.19 0.16 0.14 0.01 0.05 0.04
22:0 0.06 0.02 0.13 0.03 0.01 0.02 0.05 0.02
S saturates 30.40 0.48 25.89 19.34 36.22 2.82 43.17 5.09
16:1n-7 2.51 0.07 1.99 1.42 4.23 0.55 3.56 0.11
16:1n-5 0.29 0.03 0.26 0.21 0.90 0.39 0.87 0.06
17:1 0.49 0.03 0.56 0.23 0.67 0.08 1.15 0.55
18:1n-9 6.78 0.19 5.00 1.57 5.60 0.40 3.44 0.31
18:1n-7 1.70 0.12 2.22 1.51 2.53 0.08 1.47 0.36
18:1n-5 0.09 0.02 0.25 0.30 0.21 0.07 0.20 0.08
20:1n-11 0.18 0.05 0.03 0.02 – – – –
20:1n-9 0.14 0.03 0.14 0.00 0.13 0.01 0.03 0.05
20:1n-7 0.75 0.05 0.45 0.33 0.49 0.02 0.46 0.14
20:1n-5 0.03 0.02 0.12 0.11 0.23 0.04 0.05 0.03
24:1 0.05 0.02 0.06 0.04 0.02 0.01 0.07 0.04
S monoenes 12.45 0.12 11.08 4.04 15.38 1.07 11.30 0.80
18:2n-9 0.05 0.01 0.20 0.27 0.13 0.11 0.17 0.03
18:2n-6 2.34 0.08 1.82 0.49 3.39 0.26 2.72 0.24
20:2n-6 0.13 0.01 0.19 0.11 0.18 0.01 0.16 0.13
S Dienes 2.74 0.06 2.67 1.03 4.67 0.38 3.81 0.33
18:3n-6 0.11 0.01 0.12 0.04 0.20 0.07 0.22 0.03
18:3n-3 1.01 0.02 0.49 0.19 1.76 0.10 2.04 0.21
20:3n-6 0.09 0.01 0.18 0.10 0.09 0.06 0.07 0.02
20:3n-3 0.10 0.03 0.05 0.02 0.08 0.01 0.06 0.01
S Trienes 1.35 0.05 0.91 0.20 2.16 0.05 2.49 0.32
16:4n-3 0.18 0.03 0.18 0.13 0.58 0.02 0.76 0.25
16:4n-1 – – 0.06 0.05 0.13 0.01 0.14 0.02
18:4n-3 3.95 0.14 2.42 0.33 10.53 0.92 12.51 1.02
20:4n-6 2.10 0.01 2.77 1.83 0.82 0.09 0.42 0.05
20:4n-3 0.27 0.01 0.46 0.41 0.34 0.01 0.31 0.06
S Tetraenes 6.56 0.16 6.06 1.59 12.40 0.83 14.14 1.07
18:5n-3 0.29 0.03 0.04 0.03 0.89 0.11 1.15 0.27
20:5n-3 7.18 0.25 7.20 4.67 4.67 0.18 4.17 0.38
21:5n-3 0.33 0.01 0.47 0.25 0.51 0.10 0.55 0.16
22:5n-6 0.19 0.01 0.47 0.26 0.35 0.03 0.04 0.03
22:5n-3 0.75 0.02 0.72 0.61 0.78 0.06 0.52 0.04
S Pentaenes 8.74 0.25 8.91 5.33 7.20 0.25 6.43 0.67
Lipids (2007) 42:647–657 651
123
Fatty Acid Composition of the Total Phospholipids
and Phopholipid Classes
Total phospholipids (PLt), like all phospholipid classes,
were dominated by DHA with percentages exceeding 30%
of the total fatty acids (Table 3), except for PI where lower
percentages were recorded (23.6%). The saturated acids
were second in abundance with palmitic acid and, to a
minor extent myristic acid as the main constituents. PS
showed a slightly different pattern with 16:0, 18:0 and 15:0
as the dominant saturates. MUFA showed intermediate
concentrations with percentages ranging between 12 and
18% in total phospholipids, PC, PE, LPC, DPG and values
higher than 20% in PS and PI (Table 3). Oleic (18:1n-9),
palmitoleic (16:1n-7) and vaccenic (18:1n-7) acids were
the main components, except in PS where 20:1n-7 ac-
counted for 4.2% of the total fatty acids. Pentaenes repre-
sented the fourth largest group in abundance, with EPA as
the main component with values exceeding 15% in PE,
ranging from 7.5 to 9% in PC, DPG and PI. Lower EPA
values were recorded in PC and LPC with percentages of
5–6%. Three other PUFA were present in smaller but
significant concentrations: 18:4n-3 with values above 3 %
in PLt, PC, DPG, LPC and below 1% in the other polar
lipids classes; 20:4n-6 with values above 4% in PE, PI and
below 1.2% in PC, LPC; 18:3n-3 with percentages around
1% in all phospholipid classes.
Contrary to the pattern observed with neutral lipids, odd
and even branch chain acids (iso15:0, iso16:0, iso18:0,
anteiso15:0 and anteiso17:0) exhibited low concentrations
with values below 0.5% of total fatty acid. Iso17:0 showed
higher percentages with values ranging from 0.5 to 1.1,
with maxima in PI and LPC.
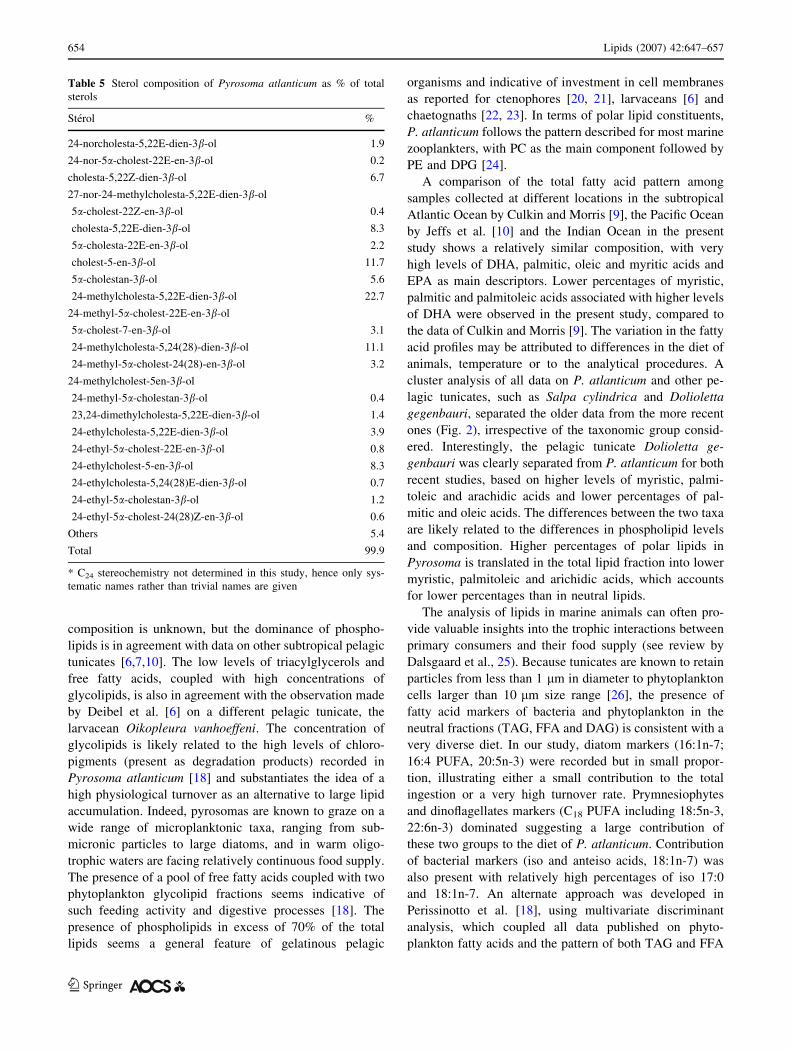
Sterol Composition
As indicated earlier, sterols made a large fraction of the
total lipid. A total of 21 sterols were identified in P. at-
lanticum (Table 4). The sterol composition was dominated
by 24-methylcholesta-5,22E-dien-3b-ol with more than
22% of the total sterol. Cholesterol (cholest-5-en-3b-ol),
which usually dominates in most animal tissues, repre-
sented only 12% of the total while 24-methylcholesta-
5,24(28)-dien-3b-ol (24-methylenecholesterol) accounted
for 11% of the total sterols. Additional important constit-
uents ranging from 5 to 9% included: 5a-cholest-22Z-en-
3b-ol (cis-22-dehydrocholestanol), 24-ethylcholest-5-en-
3b-ol (24-ethylcholesterol), cholesta-5,22Z-dien-3b-ol
(cis-22-dehydrocholesterol) and 5a-cholestan-3b-ol (cho-
lestanol). This composition contrasts with the large domi-
nance of cholesterol classically reported for crustaceans
[27] and suggests a large influence of ingested phyto-
plankton as suggested by the high chlorophyll content re-
corded in these specimens Table 5.
Discussion
Pyrosomas are important tunicates that play a major role in
food webs of many oceanic areas [19]. Yet, they are among
the least investigated of all invertebrates, with very little
information on their lipid structure. Their lipid class
Table 3 Partial fatty acid composition limited to the major compo-
nents (% total fatty acids) of Pyrosoma atlanticum glycolipid frac-
tions
Fatty acid MGDG DGDG like
Mean % Sd Mean % Sd
14:0 1.03 0.38 4.39 5.24
16:0 31.54 3.17 10.40 8.34
18:0 8.41 1.74 1.83 1.05
20:0 4.97 1.96 34.45 30.90
22:0 2.68 0.69 10.18 9.12
S saturates 79.20 10.22 69.19 29.032
16:1n-7 1.06 0.21 1.99 1.94
18:1n-9 1.36 0.82 5.08 4.61
S monoenes 6.15 2.15 9.82 8.81
18:2n-6 0.54 0.25 1.46 1.20
S Dienes 1.17 0.24 2.00 2.10
20:3n-3 1.52 0.63 0.04 0.07
S Trienes 2.20 0.28 0.57 0.60
18:4n-3 0.94 0.37 1.19 1.19
S Tetraenes 1.69 0.77 2.21 2.47
20:5n-3 0.97 0.79 3.47 2.51
S Pentaenes 1.34 1.20 4.18 3.12
22:6n-3 8.25 6.96 12.03 12.71
Sd standard deviation, MGDG monogalactosyl diglycerides, DGDGdigalactosyl diglycerides
Table 2 continued
Fatty acid Total lipids Free fatty acids TAG DAG
Mean % Sd Mean % Sd Mean % Sd Mean % Sd
22:6n-3 36.66 0.44 44.47 17.32 21.96 1.06 18.67 2.05
Sd standard deviation, n = 6,–not detected, TAG triacylglycerols, DAG diacylglycerols, * include phytanic acid
652 Lipids (2007) 42:647–657
123

Table 4 Fatty acid composition (% total fatty acids) of Pyrosoma atlanticum total phospholipids (PL) and phopholipid fractions
Fatty acid Total PL PC PE DPG PS PI LPC
Mean Sd Mean Sd Mean Sd Mean Sd Mean Sd Mean Sd Mean Sd
14:0 6.37 0.15 7.69 0.94 1.69 0.67 6.88 0.05 0.87 0.09 0.78 0.35 0.92 0.14
Iso15:0 0.27 0.03 0.31 0.02 0.17 0.02 0.26 0.02 0.19 0.04 0.23 0.07 0.21 0.07
Aiso15:0 0.38 0.06 0.38 0.01 0.63 0.39 0.29 0.01 0.31 0.08 0.90 0.10 0.25 0.06
15:0 1.35 0.04 1.68 0.09 0.59 0.10 1.54 0.03 6.26 1.81 1.27 0.52 0.81 0.10
Iso16:0 0.29 0.06 0.36 0.02 0.16 0.10 0.33 0.02 0.41 0.05 0.35 0.11 0.21 0.05
Iso17:0 0.78 0.11 0.54 0.02 0.69 0.08 0.60 0.02 0.90 0.07 1.10 0.11 1.10 0.08
Aiso17:0 0.37 0.17 0.19 0.01 0.54 0.24 0.17 0.02 0.58 0.09 0.63 0.11 0.43 0.01
16:0 16.21 0.78 15.47 0.19 15.44 0.45 16.85 0.05 11.60 0.07 15.01 0.41 19.19 1.93
17:0* 0.74 0.07 0.59 0.03 0.74 0.04 0.52 0.06 1.53 0.18 1.28 0.08 1.49 0.15
Iso18:0 0.53 0.05 0.39 0.09 0.22 0.03 0.53 0.08 0.78 0.14 0.96 0.22 0.93 0.03
18:0 0.99 0.04 1.06 0.08 0.99 0.20 1.02 0.09 4.73 0.21 4.76 0.03 6.95 0.99
19:0 0.17 0.01 0.14 0.01 0.10 0.03 0.11 0.03 0.76 0.16 1.11 0.36 0.74 0.47
20:0 0.16 0.05 0.12 0.05 0.02 0.01 0.34 0.02 1.19 0.26 0.75 0.04 0.66 0.14
22:0 0.10 0.07 0.02 0.01 0.20 0.01 0.11 0.04 – – 0.19 0.008 0.06 0.01
S saturates 28.77 0.85 29.07 1.10 22.24 1.21 30.60 0.08 30.21 1.56 29.32 1.48 33.96 3.08
16:1n-7 2.65 0.02 2.80 0.10 2.40 0.24 3.84 0.10 0.67 0.02 2.09 0.03 1.71 0.06
16:1n-5 0.36 0.09 0.48 0.07 0.27 0.10 0.55 0.03 0.28 0.12 0.35 0.06 0.39 0.03
17:1 0.48 0.02 0.52 0.02 0.74 0.07 0.63 0.03 0.80 0.05 1.49 0.11 0.72 0.06
18:1n-9 6.49 0.21 5.03 0.17 10.13 0.41 8.92 0.97 10.50 0.98 13.29 0.24 7.59 0.90
18:1n-7 1.96 0.12 2.11 0.25 2.45 0.48 1.87 0.65 3.54 0.34 4.05 0.26 2.48 0.08
18:1n-5 0.08 0.04 0.11 0.04 0.09 0.06 0.17 0.04 0.54 0.13 0.46 0.06 – –
20:1n-11 0.19 0.03 0.18 0.05 – – 0.19 0.12 – – – – – –
20:1n-9 0.34 0.11 0.13 0.01 0.10 0.02 0.23 0.11 1.20 0.06 – – – –
20:1n-7 0.80 0.03 0.97 0.08 0.15 0.04 1.62 0.16 4.22 1.25 1.62 0.45 2.49 0.34
S monoenes 13.64 0.20 12.45 0.12 16.54 0.18 18.18 0.65 23.64 1.11 24.91 1.96 15.46 1.03
18:2n-6 2.28 0.11 2.34 0.14 1.70 0.09 2.61 0.03 1.81 0.15 2.54 0.22 2.08 0.05
20:2n-6 0.24 0.05 0.16 0.03 0.04 0.02 0.14 0.10 0.23 0.02 0.50 0.23 – –
S Dienes 2.56 0.11 2.57 0.13 1.79 0.04 2.81 0.09 2.04 0.13 3.05 0.36 2.08 0.05
18:3n-6 0.11 0.01 0.20 0.04 0.02 0.01 0.20 0.01 – – – – – –
18:3n-3 0.98 0.06 1.17 0.10 0.60 0.08 0.88 0.05 0.62 0.06 0.70 0.069 0.80 0.13
20:3n-9 0.07 0.03 0.05 0.00 0.03 0.01 – – – – – – – –
20:3n-6 0.11 0.02 0.12 0.01 0.05 0.03 0.29 0.09 0.04 0.01 0.54 0.41 – –
20:3n-3 0.07 0.00 0.07 0.03 0.02 0.02 0.01 0.01 0.05 0.04 – – – –
S Trienes 1.35 0.11 1.60 0.10 0.73 0.06 1.39 0.06 0.71 0.07 1.27 0.44 0.80 0.13
18:4n-3 3.86 0.33 5.43 0.36 0.95 0.09 3.30 0.05 1.70 0.39 1.75 0.08 3.73 0.19
20:4n-6 2.16 0.07 1.19 0.08 5.92 0.29 2.85 0.38 2.10 0.04 4.54 0.37 0.78 0.16
20:4n-3 0.27 0.01 0.36 0.01 0.13 0.02 0.25 0.00 0.25 0.02 0.24 0.11 0.33 0.01
S Tetraenes 6.36 0.28 7.36 0.41 7.14 0.30 6.44 0.35 4.31 0.53 6.52 0.41 4.84 0.36
18:5n-3 0.36 0.04 0.31 0.09 0.11 0.02 – – – – – – – –
20:5n-3 7.44 0.26 5.74 0.26 15.91 0.48 8.38 0.06 4.68 0.32 10.10 0.37 4.33 0.74
21:5n-3 0.32 0.01 0.40 0.02 0.10 0.02 0.25 0.02 0.51 0.18 0.11 0.03 0.46 0.01
22:5n-6 0.18 0.04 0.15 0.02 0.21 0.02 0.11 0.04 0.52 0.16 0.77 0.38 – –
22:5n-3 0.76 0.04 0.73 0.06 0.43 0.09 0.55 0.03 0.60 0.04 0.33 0.05 0.61 0.19
S Pentaenes 9.07 0.18 7.33 0.14 16.77 0.52 9.29 0.04 6.32 0.38 11.31 0.10 5.40 0.92
22:6n-3 38.24 0.33 39.62 0.67 34.80 0.70 31.29 0.35 32.77 0.94 23.62 2.45 37.46 2.66
Sd standard deviation, n = 3, – not detected, PC phosphatidylcholine, PE phosphatidylethanolamine, DPG diphosphatidylglycerol, PSphosphatidylserine, PI phosphatidylinositol, LPC lysophosphatidylcholine, * include phytanic acid
Lipids (2007) 42:647–657 653
123
composition is unknown, but the dominance of phospho-
lipids is in agreement with data on other subtropical pelagic
tunicates [6,7,10]. The low levels of triacylglycerols and
free fatty acids, coupled with high concentrations of
glycolipids, is also in agreement with the observation made
by Deibel et al. [6] on a different pelagic tunicate, the
larvacean Oikopleura vanhoeffeni. The concentration of
glycolipids is likely related to the high levels of chloro-
pigments (present as degradation products) recorded in
Pyrosoma atlanticum [18] and substantiates the idea of a
high physiological turnover as an alternative to large lipid
accumulation. Indeed, pyrosomas are known to graze on a
wide range of microplanktonic taxa, ranging from sub-
micronic particles to large diatoms, and in warm oligo-
trophic waters are facing relatively continuous food supply.
The presence of a pool of free fatty acids coupled with two
phytoplankton glycolipid fractions seems indicative of
such feeding activity and digestive processes [18]. The
presence of phospholipids in excess of 70% of the total
lipids seems a general feature of gelatinous pelagic
organisms and indicative of investment in cell membranes
as reported for ctenophores [20, 21], larvaceans [6] and
chaetognaths [22, 23]. In terms of polar lipid constituents,
P. atlanticum follows the pattern described for most marine
zooplankters, with PC as the main component followed by
PE and DPG [24].
A comparison of the total fatty acid pattern among
samples collected at different locations in the subtropical
Atlantic Ocean by Culkin and Morris [9], the Pacific Ocean
by Jeffs et al. [10] and the Indian Ocean in the present
study shows a relatively similar composition, with very
high levels of DHA, palmitic, oleic and myritic acids and
EPA as main descriptors. Lower percentages of myristic,
palmitic and palmitoleic acids associated with higher levels
of DHA were observed in the present study, compared to
the data of Culkin and Morris [9]. The variation in the fatty
acid profiles may be attributed to differences in the diet of
animals, temperature or to the analytical procedures. A
cluster analysis of all data on P. atlanticum and other pe-
lagic tunicates, such as Salpa cylindrica and Dolioletta
gegenbauri, separated the older data from the more recent
ones (Fig. 2), irrespective of the taxonomic group consid-
ered. Interestingly, the pelagic tunicate Dolioletta ge-
genbauri was clearly separated from P. atlanticum for both
recent studies, based on higher levels of myristic, palmi-
toleic and arachidic acids and lower percentages of pal-
mitic and oleic acids. The differences between the two taxa
are likely related to the differences in phospholipid levels
and composition. Higher percentages of polar lipids in
Pyrosoma is translated in the total lipid fraction into lower
myristic, palmitoleic and arichidic acids, which accounts
for lower percentages than in neutral lipids.
The analysis of lipids in marine animals can often pro-
vide valuable insights into the trophic interactions between
primary consumers and their food supply (see review by
Dalsgaard et al., 25). Because tunicates are known to retain
particles from less than 1 lm in diameter to phytoplankton
cells larger than 10 lm size range [26], the presence of
fatty acid markers of bacteria and phytoplankton in the
neutral fractions (TAG, FFA and DAG) is consistent with a
very diverse diet. In our study, diatom markers (16:1n-7;
16:4 PUFA, 20:5n-3) were recorded but in small propor-
tion, illustrating either a small contribution to the total
ingestion or a very high turnover rate. Prymnesiophytes
and dinoflagellates markers (C18 PUFA including 18:5n-3,
22:6n-3) dominated suggesting a large contribution of
these two groups to the diet of P. atlanticum. Contribution
of bacterial markers (iso and anteiso acids, 18:1n-7) was
also present with relatively high percentages of iso 17:0
and 18:1n-7. An alternate approach was developed in
Perissinotto et al. [18], using multivariate discriminant
analysis, which coupled all data published on phyto-
plankton fatty acids and the pattern of both TAG and FFA
Table 5 Sterol composition of Pyrosoma atlanticum as % of total
sterols
Sterol %
24-norcholesta-5,22E-dien-3b-ol 1.9
24-nor-5a-cholest-22E-en-3b-ol 0.2
cholesta-5,22Z-dien-3b-ol 6.7
27-nor-24-methylcholesta-5,22E-dien-3b-ol
5a-cholest-22Z-en-3b-ol 0.4
cholesta-5,22E-dien-3b-ol 8.3
5a-cholesta-22E-en-3b-ol 2.2
cholest-5-en-3b-ol 11.7
5a-cholestan-3b-ol 5.6
24-methylcholesta-5,22E-dien-3b-ol 22.7
24-methyl-5a-cholest-22E-en-3b-ol
5a-cholest-7-en-3b-ol 3.1
24-methylcholesta-5,24(28)-dien-3b-ol 11.1
24-methyl-5a-cholest-24(28)-en-3b-ol 3.2
24-methylcholest-5en-3b-ol
24-methyl-5a-cholestan-3b-ol 0.4
23,24-dimethylcholesta-5,22E-dien-3b-ol 1.4
24-ethylcholesta-5,22E-dien-3b-ol 3.9
24-ethyl-5a-cholest-22E-en-3b-ol 0.8
24-ethylcholest-5-en-3b-ol 8.3
24-ethylcholesta-5,24(28)E-dien-3b-ol 0.7
24-ethyl-5a-cholestan-3b-ol 1.2
24-ethyl-5a-cholest-24(28)Z-en-3b-ol 0.6
Others 5.4
Total 99.9
* C24 stereochemistry not determined in this study, hence only sys-
tematic names rather than trivial names are given
654 Lipids (2007) 42:647–657
123

acids recorded for the present samples. Results confirmed
that both dinoflagellates and prymnesiophytes are domi-
nant constituents in the ingested material. One question
always open with colonial organisms is whether or not
ingested chlorophyll has passed the plasma membrane of
each individual. The actual process of ingestion and
digestion is a complicated one and no direct microscopic
observation could be made during this study. However, as
shown by Perissinotto et al. [18], most chloropigments
were in the form of pheaopigments (80 to 90%) with a high
rate of degradation into non-fluorescent compounds. Such a
process only occurs during gut transit and strongly support
the hypothesis that the phytoplankton cells were taken up
by individual zooids and digested.
Information on sterol composition is scarce and the
present data can only be compared with those of Jeffs et al.
[10] for samples of Pyrosoma atlanticum and Makar’eva
et al. [27] for samples of Pyrosoma giganteum. The pat-
terns of sterols recorded for P. atlanticum show both
similarities and differences. Both profiles show dominance
of 24-methylcholesta-5,22E-dien-3(-ol, cholesterol, cis-22-
dehydrocholesterol and similar levels of 24-ethylcholesta-
5,22E-dien-3(-ol, 24-ethylcholest-5-ene-3(-ol and 24-
nordehydrocholesterol. However, our specimens from the
Indian Ocean exhibit higher percentages of 24-methylene
cholesterol and cis-22-dehydrocholestanol. They also lack
in some of the major sterols observed off the New Zealand
coast, e.g. 24-methylcholesterol and dinosterol. The dif-
ferences are likely related to the heterogeneity of particles
ingested at the two sites, which may differ substantially in
their phytoplankton and microheterotroph-derived sterols.
We have no knowledge of the sterol metabolism of tuni-
cates, but the low level of cholesterol observed in P. at-
lanticum may suggest that the ability to convert
phytosterols to cholesterol, reported for many crustaceans
[28] may not be as effective in P. atlanticum. Copepods,
euphausiids, ostracods, phyllosomes and other inverte-
brates, such as siphonophores and ctenophores, show a
large dominance of cholesterol in contrast to tunicates
(ascidians and pyrosomes), which contain mostly algal-
derived sterols (10, present study). In terms of trophic
linkage sterol markers of diatoms (22-dehydrocholesterol,
cholesterol, 24-methylenecholesterol), prymnesiophytes
and dinoflagellates (24-methylcholesta-5,22E-dien-3(-ol,
24-ethylcholesta-5,22E-dien-3(-ol, 24-ethylcholest-5-ene-
3(-ol, 24-methylenecholesterol) are present but as indicated
by Volkman [29], many sterols are widely distributed and
assignment to a specific algal class remains difficult. The
lack of dinosterol in our samples may seem contradictory
with the trophic link described earlier, but a number of
dinoflagellate species do not contain dinosterol [30,31].
Hence, it may be that species of dinoflagellates lacking
dinosterol dominated this component of its diet. In oligo-
trophic waters, such as those studied in this paper, the
sterol composition would tend to support a diet dominated
by dinoflagellates and prymnesiopytes [29].
Our knowledge of the phospholipid composition of pe-
lagic marine organisms is, to a large extent, limited to a
description of the main classes in crustaceans: i.e., cope-
pods, euphausiids, decapods [24– 34], and cnidaria (see
review by Joseph, 35). Reports of fatty acid composition is
generally limited to benthic ascidians and total polar lipid
fraction [4], thus preventing meaningful taxonomic com-
parisons. Differences between fatty acid composition of the
phospholipid constituents seem directly related to the
specificity in the pathways of synthesis involved. In this
study, a comparison of the various profiles was achieved
using a factorial correspondence analysis (FCA). The first
three factorial axes accounted for more than 90% of the
total variance and projection of both fatty acid descriptors
Fig. 2 Cluster analysis of all published total fatty acid profiles for
pelagic tunicates based on computed Bray-Curtis distance (x axis non
dimensional). Symbols: P. atlant #= Pyrosoma atlanticum from the
present study; P.a_Jeffs # = Pyrosoma atlanticum from Jeffs et al.
(2004); P.a._Culkin = Pyrosoma atlanticum from Culkin and Morris
(1970); Dolioletta = Dolioletta gengenbauri from Pond and Sargent
(1998); S. cylindrica = Salpa cylindrica from Culkin and Morris
(1970)
Lipids (2007) 42:647–657 655
123

and phospholipid constituents, on the plane defined by the
first two axes (Fig. 3), discriminated between two groups.
The first axis separated PC, PE, DPG on the one hand and
PS, PI on the other, whereas it opposed PC to PE and PS to
PI on the second axis. This is consistent with the concept of
main interrelated synthetic routes via CDP-choline and
CDP-ethanolamine leading to PC and PE and secondary
transformations from PS to produce PE, and from CDP-
diacylglycerol to produce PI [36]. In terms of fatty acid
profiles, differences in PC were linked with 18:4n-3, 18:3n-
3, 20:3n-3, 18:3n-6 and 14:0, while differences in PE were
associated with EPA, arachidonic acid and 22:0. Discrim-
ination between PI and PS were related respectively to
arachidonic acid, 17:1, oleic and cis vaccenic acids and to
20:1n-7, 21:5n-3, 20:1n-9, 20:0 and 15:0.
The fatty acid composition of all polar lipid classes of P.
atlanticum also shared several common features: a high
degree of unsaturation with more than 35% of EPA and
DHA; a relatively constant percentage of DHA; and similar
levels of saturated acids, although with different constitu-
ents. Phospholipids containing high levels of DHA are
often associated with the need for high energy processes.
They have been proposed to be required as conformational
co-factors for the functional assemblage of membrane
proteins, ion pumps and/or complexes of the mitochondrial
electron transport chain [37, 38]. In the specific case of P.
atlanticum, locomotion is slow as a consequence of a slow
continuous jet emerging from the cloacal aperture of the
colony. The jet is produced by the ciliary activity of each
individual zooid, which is under nervous control [2]. We
have no knowledge of the energy needed and the complex
ion and electron transport processes involved in this
motion, but data agree with the hypothesis of a strong
contribution of all phospholipid classes. Within the
membrane bilayer system, PC, PE and DPG are often
associated with both passive and active transport, while PS
and PI are linked to nervous stimulation and PI hydrolysis
is associated to the production of intracellular messengers.
Such a view is consistent with the processes controlling
locomotion and the regulation of buoyancy, which utilizes
sulphate exclusion [2].
In summary, new results for the lipid class and com-
ponent fatty acid and sterol distributions of the gelatinous
pelagic tunicate P. atlanticum collected from the Indian
Ocean sector of the Southern Ocean have been obtained.
The profiles are consistent with a high physiological turn-
over, diverse phytoplankton diet, and strong contribution of
phospholipid classes to energy needs, including locomo-
tion.
Acknowledgements We thank the French CNRS, the French Polar
Institute (IPEV), the South African NRF and the University of
KwaZulu-Natal (Durban, South Africa) for providing funds for this
study. Finally, we like to thank the captain, officers and crew of the
‘‘RV Marion-Dufresne’’ for their assistance and cooperation during
the ANTARES-4 voyage.
References
1. vanSoest RWM (1981) A monograph of the order Pyrosomatida
(Tunicata, Thaliacea). J Plankton Res 3:603–631
2. Bone Q (1998) Locomotion, locomotor muscles and buoyancy.
In: Bone Q (ed) The biology of pelagic tunicates. Oxford Uni-
versity Press, Oxford, pp 35–53
3. Slantchev K, Yalcin F, Ersoz T, Nechev J, Cahs I, Stefanov K,
Popov F (2002) Composition of lipophilic extracts of two tuni-
cates. Styela sp. and Phallusia sp. from the eastern Mediterra-
nean. Z Naturforsch 57:534–540
Fig. 3 Pyrosoma atlanticum.
Correspondence analysis of the
fatty acid structure of the main
phospholipid classes. Projection
in the factorial plane defined by
axes 1 and 2. Filled trianglesillustrate fatty acid descriptors
and filled circles illustrate polar
lipid fractions. PCphosphatidylcholine; PEphosphatidylethanolamine; PIphosphatidylinositol; PSphosphatidylserine and DPGdiphosphoglycerols. Size of
symbols is representative of
significance on the plane of
projection
656 Lipids (2007) 42:647–657
123
4. Veracaoundin I, Barnathan G, Gaydou EM, Aknin M (2003)
Phospholipid FA from Indian Ocean Tunicates Eudistoma bitu-minis and Cystodytes violatinctus. Lipids 38:85–88
5. Reinhardt SB, Van Vleet ES (1986) Lipid composition of twenty
two species of Antarctic midwater zooplankton and fish. Mar Biol
91:149–159
6. Deibel D, Cavaletto JF, Riehl M, Gardner WS (1992) Lipid and
lipid class content of the pelagic tunicate Oikopleura vanhoeffeni.Mar Ecol Prog Ser 88:297–302
7. Pond DW, Sargent JR (1998) Lipid composition of the pelagic
tunicate Doiloletta gegenbauri (Tunicata, Thaliacea). J Plankton
Res 20:169–174
8. Phleger CF, Nelson MM, Mooney B, Nichols PD (2000) Lipids
of Antarctic salps and their commensal hyperiid amphipods.
Polar Biol 23:329–337
9. Culkin F, Morris RJ (1970) The fatty acid composition of two
marine filter-feeders in relation to a phytoplankton diet. Deep Sea
Res 17:861–865
10. Jeffs AG, Nichols PD, Mooney BD, Philipps KL, Phleger CF
(2004) Identifying potential prey of the pelagic larvae of the
spiny lobster Jasus edwardsii using signature lipids. Comp Bio-
chem Physiol 137B:487–507
11. Bligh EG, Dyer WJ (1959). A rapid method of total lipid
extraction and purification. Canadian Journal of Biochemistry
and Physiol 37:911–917
12. Morrison WR, Smith LM (1964) Preparation of fatty acid methyl
esters and dimethylacetals from lipids with boron fluoride-
methanol. J Lipid Res 5:600–608
13. Sokal RR, Rohlf FJ (1981) Biometry. Freeman and Co, NewYork
14. Gower JC (1987) Introduction to ordination techniques. In:
Legendre P, Legendre L (eds) Development in numerical ecol-
ogy. NATO ASI series G14, pp. 3–64
15. Pielou EC (1984) The interpretation of ecological data. Wiley-
Interscience, New York
16. Mayzaud P, Chanut JP, Ackman RG (1989) Seasonal changes of
the biochemical composition of marine particulate matter with
special reference to fatty acid and sterols. Mar Ecol Prog Ser
56:189–204
17. Lebart L, Morineau A, Piron M (1995) Statistique exploratoire
multidimensionnelle. Dunod, Paris
18. Perissinotto R, Mayzaud P, Nichols PD, Labat J-P (2007) Grazing
of Pyrosoma atlanticum (Tunicata, Thaliacea) in the south Indian
Ocean. Mar Ecol Prog Ser 330:1–11
19. Drits AV, Arashkevich EG, Semenova TN (1992) Pyrosoma at-
lanticum (Tunicata, Thaliacea): grazing impact on phytoplankton
standing stock and role in organic carbon flux. J Plankton Res
14:799–809
20. Lee RF (1974) Lipids of zooplankton from Bute Inlet, British
Columbia. J Fish Res Bd Can 31:1577–1582
21. Morris RJ, McCartney MJ, Schulze-Ronnecke A (1983) Bolin-opsis infundibulum biochemical composition in relation to diet. J
Exp Mar Biol Ecol 67:149–157
22. Lee RF (1975) Lipids of Arctic zooplankton. Comp Biochem
Physiol 51B:263–266
23. Falk-Petersen S, Sargent JR, Tande KS (1987) Lipid composition
of zooplankton in relation to the sub-arctic food web. Polar Biol
8:115–120
24. Hagen W (1988) On the significance of lipids in Antarctic zoo-
plankton. Berichte zur Polarforschung 49:1–129 (Can Trans Fish
Aquat; Sci., 5458)
25. Dalsgaard J, St John M, Kattner G, Muller-Navarra D, Hagen W
(2003) Fatty acid trophic markers in the pelagic marine envi-
ronment: a review. Adv Mar Biol 46:225–340
26. Harbison GR, McAlister VL (1979) The filter-feeding rates and
particle retention efficiencies of three species of Cyclosalpa
(Tunicata, Thaliacea). Limnol Oceanogr 24:875–892
27. Makar’eva TN, Grebnev BB, Dmitrenok AS, Stonik VA (1993)
Sterol composition of Pyrosoma giganteum. Chem Natural
Compounds 28:517–518
28. Teshima S (1972) Sterol metabolism. Mem Fac Fish Kagoshima
University 21:69–147
29. Volkman JK (1986) A review of sterol markers for marine and
terrigenous organic matter. Org Geochem 9:83–99
30. Mansour MP, Volkman JK, Jackson AE Blackburn SI (1999) The
fatty acid and sterol composition of five marine dinoflagellates. J
Phycol 35:710–720
31. Piretti MV, Pagliuca G, Boni L, Pistocchi R, Diamante M,
Gazzoti T (1997) Investigation of 4-methyl sterols from cultured
dinoflagellate algal strains. J Phycol 33:61–67
32. Mayzaud P, Albessard E, Cuzin-Roudy J (1998). Changes in
lipid composition of the Antarctic krill Euphausia superba in
the Indian sector of the Antarctic Ocean. Distribution among
organs and sexual maturity stage. Mar Ecol Prog Ser 173:149–
162
33. Mayzaud P, Albessard E, Virtue P, Boutoute M (2000) Envi-
ronmental constraints on the lipid structure and metabolism of
euphausiids: the case of Euphausia superba and Meganyctiphanes
norvegica. Can J Fish Aquat Sci 57:91–103
34. Mayzaud P, Boutoute M, Alonzo F (2003) Lipid composition of
the euphausiids Euphausia vallentini and Thysanoessa macruraduring the summer in the Indian sector of the Southern ocean.
Antarctic Sci 15:463–475
35. Joseph JD (1979) Lipid composition of marine and estuarine
invertebrates: porifera and cnidaria. Prog Lipid Res 18:1–30
36. Lehninger AL, Nelson DL, Cox MM (1993) Principles of bio-
chemistry. Worth Publishers, New York
37. Infante JP, Kirwan RC, Brenna JT (1987) High levels of doco-
sahexaenoic acid (22:6n-3)-containing phopholipids in high fre-
quency contraction muscles of hummingbirds and rattlesnakes.
Comp Biochem Physiol 130B:291–298
38. Zachowcki A (1993) Phopholipids in animal eukaryotic mem-
branes: transverse asymmetry and movement. Biochem J 294:1–
14
Lipids (2007) 42:647–657 657
123