
Plastics Disassembly versus Bulk Recycling: Engineering Design for End-of-Life Electronics...
8
Click here to load reader
-
Upload
independent -
Category
Documents
-
view
1 -
download
0
Transcript of Plastics Disassembly versus Bulk Recycling: Engineering Design for End-of-Life Electronics...

Plastics Disassembly versus BulkRecycling: Engineering Design forEnd-of-Life Electronics ResourceRecoveryP E D R O R I O S , †
J U L I E A N N S T U A R T , * , † A N D E D G R A N T ‡
School of Industrial Engineering and Department ofChemistry, Purdue University, 315 North Grant Street,West Lafayette, Indiana 47907-2023
Annual plastic flows through the business and consumerelectronics manufacturing supply chain include nearly 3 billionlb of high-value engineering plastics derived frompetroleum. The recovery of resource value from thisstream presents critical challenges in areas of materialsidentification and recycling process design that demand newgreen engineering technologies applied together withlife cycle assessment and ecological supply chain analysisto create viable plastics-to-plastics supply cycles. Thesustainable recovery of potentially high-value engineeringplastics streams requires that recyclers either avoidmixing plastic parts or purify later by separating smallerplastic pieces created in volume reduction (shredding) steps.Identification and separation constitute significantbarriers in the plastics-to-plastics recycling value proposition.In the present work, we develop a model that acceptsrandomly arriving electronic products to study scenariosby which a recycler might identify and separate high-valueengineering plastics as well as metals. Using discreteevent simulation, we compare current mixed plastics recoverywith spectrochemical plastic resin identification andsubsequent sorting. Our results show that limited disassemblywith whole-part identification can produce substantialyields in separated streams of recovered engineeringthermoplastics. We find that disassembly with identificationdoes not constitute a bottleneck, but rather, with relativelyfew workers, can be configured to pull the processand thus decrease maximum staging space requirements.
IntroductionAn important green engineering strategy calls for design formaterials separation throughout the life cycle of a product(1).Annual plastic flows through the electronics supply chainto thesink includenearly 3billion lbofhigh-valueengineeringplastics derived from petroleum, a non-renewable resource(2, 3). Yet, only a limited electronics recycling infrastructureexists today, and it focuses primarily on precious metalsrecovery (4, 5).Althoughan increasingnumberof companiesreceive, remanufacture, and dispose end-of-life (EOL) elec-tronics and appliances (6-9), less than 1% of the plasticsfrom EOL electronics are processed for plastics-to-plasticsrecycling (2, 10).
Tools to advance sustainable design and manufacturingstrategies includegreenengineering (1), life cycle assessment(LCA) (11), streamlinedLCA (12), andecological supply chainanalysis (EcoSCAn) (13). Strategic production planningmodels have been extended to consider product returns forrepair and recycling (14-16).Researchmodels to select EOLelectronics disassembly levels seek to maximize product netrevenue (17-19).
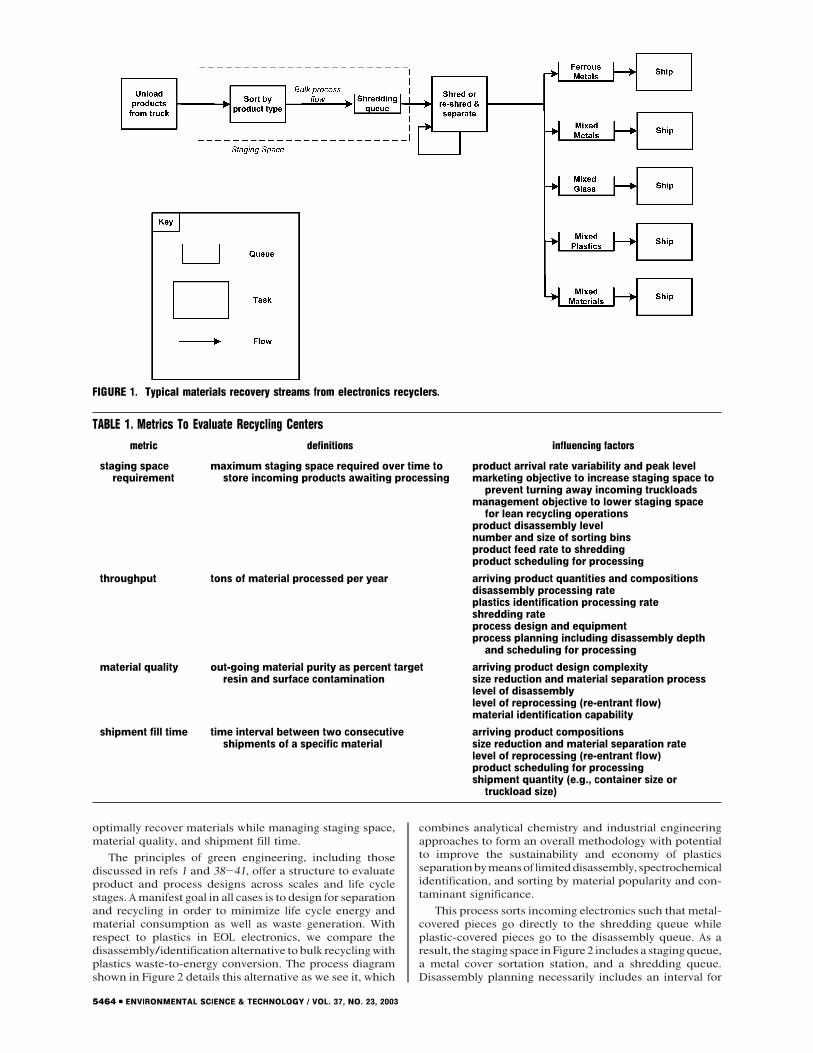
However, despite these research advances, current re-cycling strategies remain focused on producing low-valuemixtures of plastics for waste-to-energy (20). For example,pilot studies have demonstrated the recovery of significantquantities ofmixedplastics, but for themostpart, theplasticscollectedwerenot identified or separated (21-24).Yet, thesepilot studies involved an extensive disassembly depth thatcreated a costly bottleneck. Although recycling processes ingeneral seek to minimize disassembly depth (6-9, 25-30),some such preprocessing may be necessary in certain casesto recover parts for resale or screen for hazardous materials.Figure 1 diagrams a typical processing stream for electronicmaterials recovery today.
Current Electronics Recycling Process Design ThatProduces Low-Value Mixed Plastics. As diagrammed inFigure 1, conventional processing starts in a staging areawhere products are sorted and queued in batches forshredding. At the shredding step, the recycler sometimeschooses to reprocess mixtures for a second cycle to improvematerials separation (31). Magnetic separation, grinding,density separation, and manual sorting steps may followshredding operations (5). The outputs from the electronicsbulk recycling process in Figure 1 include ferrous metals,mixedmetals, glass, mixed plastics, andmixedmaterials (6).Outputs such asmixedmetals are sold for further separation(32-34). Recyclers seek to optimize the four performancemetrics detailed in Table 1 to achieve the highest turnoverin the staging space, the highest throughput, the highestmaterial grade, and the lowest shipment fill time (35).
A significant barrier to achieving an optimum materialgrade for the plastics produced in such an operation is thecommingling of plastic resins that occurs in bulk shredding.Mixedplastics have loworoften substantially negative value.No resin-specific identification method exists that cansupport the complete separation of commingled resins in ashreddedplasticmix.Purificationmethodsbasedonphysicalproperties, such as density, dielectric constant or surfacetension, have limited (<90%) andoften varying effectivenessfor complex, real-world input streams. For whole parts,however, as suggested by ref 36, the yield per measurementmay justify the application of exacting spectrochemicaltechniques for resin identification. Thus, we consider analternative scenario.
Alternative Electronics Recycling Process Design ThatUses Plastics Identification and Separation. To meet thegoalofachievinghighmaterial grade in recoveredengineeringplastic streams, a recyclermustmodify the typical electronicsrecyclingprocess inFigure 1 in order to avoidmixingplasticsinitially or somehow identify and separate small pieces fromshredded plastic mixtures (3, 6-9, 25-30, 37). The problemofefficient identificationandseparationconstitutes the singlemost significant barrier to plastics-to-plastics recycling. Toaddress this problem, we consider a model for electronicmaterials recovery that accepts randomly arrivingEOL goodsand, in scenarios that include resin identification of disas-sembled plastic parts, seeks to determine what engineeringdesign principles apply to recycling process design to
* Corresponding author telephone: (765)494-6256; fax: (765)494-1299; e-mail: [email protected].
† School of Industrial Engineering.‡ Department of Chemistry.
Environ. Sci. Technol. 2003, 37, 5463-5470
10.1021/es034675o CCC: $25.00 © 2003 American Chemical Society VOL. 37, NO. 23, 2003 / ENVIRONMENTAL SCIENCE & TECHNOLOGY 9 5463Published on Web 11/04/2003
optimally recover materials while managing staging space,material quality, and shipment fill time.
The principles of green engineering, including thosediscussed in refs 1 and 38-41, offer a structure to evaluateproduct and process designs across scales and life cyclestages. Amanifest goal in all cases is to design for separationand recycling in order to minimize life cycle energy andmaterial consumption as well as waste generation. Withrespect to plastics in EOL electronics, we compare thedisassembly/identification alternative to bulk recyclingwithplastics waste-to-energy conversion. The process diagramshown in Figure 2 details this alternative as we see it, which
combines analytical chemistry and industrial engineeringapproaches to form an overall methodology with potentialto improve the sustainability and economy of plasticsseparationbymeansof limiteddisassembly, spectrochemicalidentification, and sorting by material popularity and con-taminant significance.
This process sorts incoming electronics such that metal-covered pieces go directly to the shredding queue whileplastic-covered pieces go to the disassembly queue. As aresult, the staging space inFigure 2 includes a staging queue,a metal cover sortation station, and a shredding queue.Disassembly planning necessarily includes an interval for
FIGURE 1. Typical materials recovery streams from electronics recyclers.
TABLE 1. Metrics To Evaluate Recycling Centersmetric definitions influencing factors
staging space maximum staging space required over time to product arrival rate variability and peak levelrequirement store incoming products awaiting processing marketing objective to increase staging space to
prevent turning away incoming truckloadsmanagement objective to lower staging space
for lean recycling operationsproduct disassembly levelnumber and size of sorting binsproduct feed rate to shreddingproduct scheduling for processing
throughput tons of material processed per year arriving product quantities and compositionsdisassembly processing rateplastics identification processing rateshredding rateprocess design and equipmentprocess planning including disassembly depth
and scheduling for processing
material quality out-going material purity as percent target arriving product design complexityresin and surface contamination size reduction and material separation process
level of disassemblylevel of reprocessing (re-entrant flow)material identification capability
shipment fill time time interval between two consecutive arriving product compositionsshipments of a specific material size reduction and material separation rate
level of reprocessing (re-entrant flow)product scheduling for processingshipment quantity (e.g., container size or
truckload size)
5464 9 ENVIRONMENTAL SCIENCE & TECHNOLOGY / VOL. 37, NO. 23, 2003
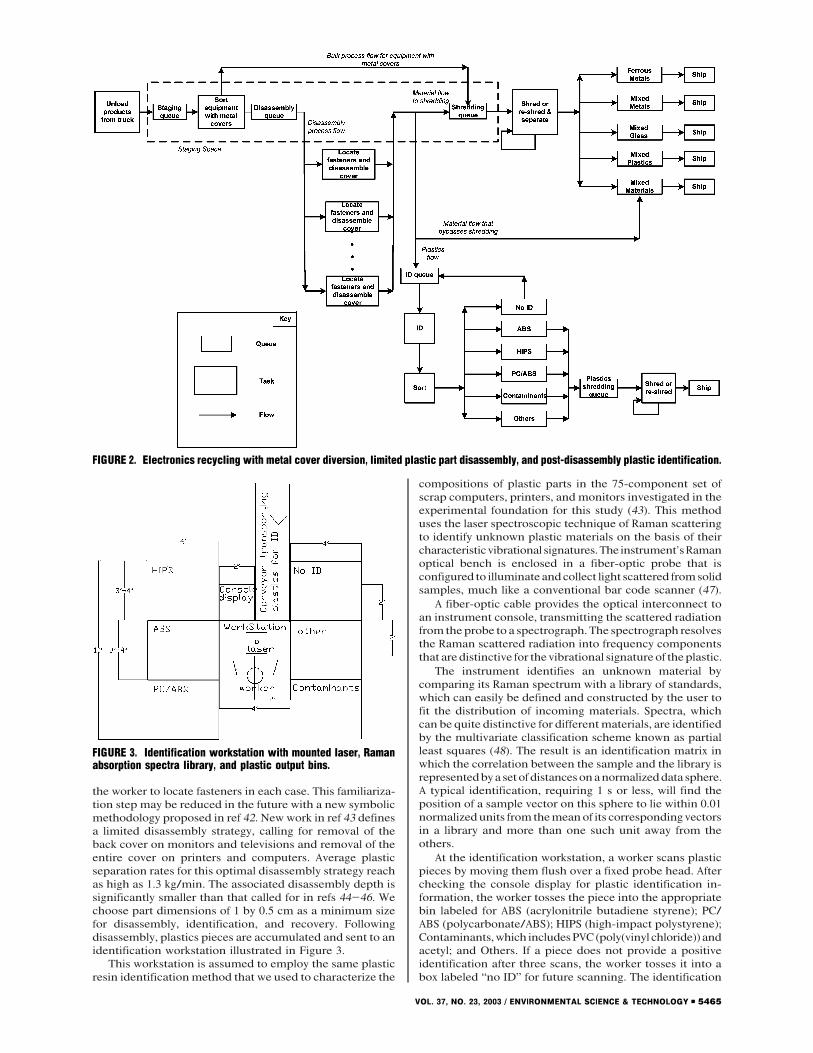
the worker to locate fasteners in each case. This familiariza-tion step may be reduced in the future with a new symbolicmethodology proposed in ref 42. New work in ref 43 definesa limited disassembly strategy, calling for removal of theback cover on monitors and televisions and removal of theentire cover on printers and computers. Average plasticseparation rates for this optimal disassembly strategy reachas high as 1.3 kg/min. The associated disassembly depth issignificantly smaller than that called for in refs 44-46. Wechoose part dimensions of 1 by 0.5 cm as a minimum sizefor disassembly, identification, and recovery. Followingdisassembly, plastics pieces are accumulated and sent to anidentification workstation illustrated in Figure 3.
This workstation is assumed to employ the same plasticresin identification method that we used to characterize the
compositions of plastic parts in the 75-component set ofscrap computers, printers, and monitors investigated in theexperimental foundation for this study (43). This methoduses the laser spectroscopic technique of Raman scatteringto identify unknown plastic materials on the basis of theircharacteristic vibrational signatures.The instrument’sRamanoptical bench is enclosed in a fiber-optic probe that isconfigured to illuminate andcollect light scattered fromsolidsamples, much like a conventional bar code scanner (47).
A fiber-optic cable provides the optical interconnect toan instrument console, transmitting the scattered radiationfrom theprobe to a spectrograph.The spectrograph resolvesthe Raman scattered radiation into frequency componentsthat aredistinctive for the vibrational signatureof theplastic.
The instrument identifies an unknown material bycomparing its Raman spectrum with a library of standards,which can easily be defined and constructed by the user tofit the distribution of incoming materials. Spectra, whichcan be quite distinctive for differentmaterials, are identifiedby the multivariate classification scheme known as partialleast squares (48). The result is an identification matrix inwhich the correlation between the sample and the library isrepresentedbya setofdistancesonanormalizeddata sphere.A typical identification, requiring 1 s or less, will find theposition of a sample vector on this sphere to lie within 0.01normalizedunits fromthemeanof its corresponding vectorsin a library and more than one such unit away from theothers.
At the identification workstation, a worker scans plasticpieces by moving them flush over a fixed probe head. Afterchecking the console display for plastic identification in-formation, the worker tosses the piece into the appropriatebin labeled for ABS (acrylonitrile butadiene styrene); PC/ABS (polycarbonate/ABS); HIPS (high-impact polystyrene);Contaminants,which includesPVC (poly(vinyl chloride)) andacetyl; and Others. If a piece does not provide a positiveidentification after three scans, the worker tosses it into abox labeled “no ID” for future scanning. The identification
FIGURE 2. Electronics recycling with metal cover diversion, limited plastic part disassembly, and post-disassembly plastic identification.
FIGURE 3. Identification workstation with mounted laser, Ramanabsorption spectra library, and plastic output bins.
VOL. 37, NO. 23, 2003 / ENVIRONMENTAL SCIENCE & TECHNOLOGY 9 5465

yield for first-entrant flow is high; typically fewer than 0.5%of disassembled parts are placed in the “no ID” box for re-entrant identification process flow in a separate shift. Toanalyze materials in re-entrant flow, the worker demountsthe laser and scans housing interiors since an exterior paintor coatingmay have interferedwith the first-entrant readingattempts. We assume a moderate identification yield on re-entrant flow. The fraction of the total identification processflow that remains after this step is added to the Others bin.
This research uses discrete event simulation models tomeasure the staging space requirement and shipment filltime for the recycling process designs summarized in Table2 and illustrated in Figures 1 and 2. Figure 1 represents atypical electronics bulk recycling process, which serves asour control. The process diagrammed in Figure 2 adds stepsthat divert equipment with metal covers to bulk shreddinganddisassemble theothers to recover their largeplastic partsfor identification and resin separation (49, 50).
Experimental SectionDiscreteEventSimulationModelsToCompareElectronicsRecycling Process Design Alternatives. To compare theperformance of the above recycling scenarios, we modelrandom truckload arrivals, finite processing capacities,division of multiple products into materials, random disas-sembly processing times, multiple-pass processing throughthe shredder, and shredder setup times to switch fromhazardous material runs to nonhazardous material runs. Ina discrete event simulation, we introduce probability dis-tributions to randomly generate a truckload arrival and adisassembly processing time (51, 52). Each such activityupdates all of the variables of the simulation. For example,a random truckload arrival changes the state of the system,which is represented by variables such as staging spaceutilization. Likewise, completing the cover disassembly of acomputer also changes the state of the system, as reflectedin a modified variable for the number of pieces in the IDqueue.
We carry out our simulations using ARENA 6.00.02 (53)set up for eachof the two scenarios inTable 2.We investigatethe sensitivity of arrival composition by testing the tworecyclingprocess scenarioswithbusiness equipment arrivalscomposed of computers, printers, and monitors (CPM) aswell as residential arrivals composed of mostly televisionsbut also computers, printers, and monitors (T-CPM). Eachcombination is described in the experimental design inTable3.
The truckload arrival compositions are based on pilotstudies (21, 22, 54). Details about the different truckloadcompositionsanddistributions for interarrival timesaregivenin Table S1, sections a and b, in the Supporting Information.Our material input consists of televisions, computers, print-ers, and monitors as detailed in Table S2 based on refs 21,22, and54.Tomodel the specific plastic compositionof thesegoods, the data in Table 4 is based on refs 43 and 54. The
recovered-plastic market value presented in Table 4 is takenfrom refs 21, 54, and 55.
Disassembly in scenarios 2 and 4 use two and fivedisassembly workers, respectively. The distributions for therandom processing times for disassembly and shredding inTable S3 are based on refs 6-9, 25-30, 35, 43, and 44. Thedisassembly processing time includes both disassemblyplanning in which the worker familiarizes himself/herselfwith the product fasteners anddisassembly actions inwhichthe worker removes the cover for computers and printersand the back cover for monitors (42, 56). The cover disas-sembly activities are scheduled according to disassemblyscheduling ruleSDT (spaceperdisassembly time ratio),whichhas been shown to reduce staging space considerably (35).The average number of plastic pieces per cover is given inTable S4 according to the study in ref 43. In the sample of21 computers in ref 43, 67% had plastic covers while theremainder had metal covers. In the disassembly process inFigure 2, only products with plastic covers are disassembledfor materials recovery. Table S5 shows how the total plasticidentification process time depends on the number of readsas well as material handling to position the piece and tossit in the correct bin in Figure 3. We determined the totalplastics identification time using the methods time mea-surement (MTM) technique (57). The identification yield forfirst-entrant flow taken from our experience with a sampleset of 75 EOL computers, monitors, and printers is assumedto be 99.5%; 0.5% are placed in the “no ID”box for re-entrantidentification process flow in a separate shift. The identifica-tion yield on re-entrant flow is assumed tobe50%.The0.25%of total identification process flow that is not identified byre-entrant analysis is added to the Others bin.
Forbulk, whole-component, ordisassembledplastic-partshredding, the sequence of goods or parts respectivelydetermines whether a setup step is required to clean out theshredder to avoid contaminationbetweenbatches.The setuprequirement is 0.25 h for each successor product sequenceandpolymer sequence inTables S6 and S7, respectively.Thegeneral material shredder operates at 2700 kg/h, and theplastics shredder operates at 2000 kg/h (5, 20, 58). Fortelevisions, monitors and printers, the shredding time is
TABLE 2. Summary of Current Practice and New Option forPlastics Identification and Sorting in Electronics RecyclingOperations
recyclingscenario description plastics grade
bulk (Figure 1) typical bulk recyclingprocess
low grade ofmixed plastics
disassembly(Figure 2)
add metal vs plasticcover sorting, limiteddisassembly, plasticpiece identification,and plastic piecesorting
high grade ofseparatedplastics
TABLE 3. Experimental Design
scenario arrival compositionrecycling
process design
1 computers, printers, andmonitors (CPM)
bulk (Figure 1)
2 CPM disassembly(Figure 2)
3 televisions, computers,printers, and monitors(T-CPM)
bulk (Figure 1)
4 T-CPM disassembly(Figure 2)
TABLE 4. Average Product Cover Polymer Composition, andRevenue (21, 43, 54, 55)
polymer
product typefor covers
1ABS
2HIPS
3PC/ABS
4Contaminants
5Others
televisions (%) 5 81 0 0 13monitor (%) 49 28 7 11 5printers (%) 34 16 35 0 15PC_Pa (%) 77 0 20 0 3recycled price
($/kg)0.70 0.62 0.78 (0.04) 0.04
a PC_P represents computers with plastic covers.
5466 9 ENVIRONMENTAL SCIENCE & TECHNOLOGY / VOL. 37, NO. 23, 2003

scaled by a factor of 1.2 to account for re-shredding. Thematerial truckload capacity is 13 600 kg, and the polymershipment capacity is 3000 kg forour shipment accumulationfill times. To reduce changeover setup times, we batch 1200products by category (i.e., television) for general materialsshredding and 3000 kg of each plastic (i.e., ABS) for plasticsshredding.
We ran the four scenarios in Arena 6.00.02 (53) for 100replications with replication length of 4160 h and warmupperiodsof2080honaDellOptiplexGX260Pentium4/2.53Gh/1GB requiring computation times from 4.1 to 45.5 min. Theaverageannual arrivalquantities across scenarioswere35 400computers, 38 826monitors, and16 689printers.Theaverageannual arrival quantities of televisions over the third andfourth scenarios was 96 017. The statistics for the randomarrival quantities are provided in Tables S8, sections a andb.
Results and DiscussionOn the basis of simulation runs with random interarrivaltimes for EOL business equipment electronics, we comparethe metrics staging space, throughput, material quality, andshipment fill times forbulk recycling versusdisassemblyplusbulk recycling. We further examine how these metrics varywhen our two scenarios expand to accept consumer elec-tronics as represented by televisions.
We consider first the metric of staging space. We initiallyexpected that the disassembly recycling scenario wouldrequire a substantially higher maximum staging space.Referring to Figure 4a, however, we find that our simulationcalls for a maximum staging space for the computerequipment disassembly scenario that is only 20% greaterthan that for bulk recycling.
The results are even more striking for scenarios thatinclude televisions. With efforts focused on the removal ofcovers, the five disassembly workers in scenario 4 (disas-sembly/T-CPM)achieve ameandisassembly timeof 2.9minor approximately 100 televisions/h. This disassembly pro-cessing time compares with the shredding rate of ap-proximately 100 televisions/h attained in bulk recycling.Moreover, the disassembly of televisions diverts televisionplastics to the plastics shredder following identification. Asa result, the disassembly scenario for computer equipmentand televisions requires at maximum 50% less staging spacethan bulk recycling. In other words, the five disassemblyworkers in scenario 4pull equipment for limiteddisassemblyat a rate comparable to the shredding rate. Adding adisassembly operation that is balanced with the shreddingprocess significantly reduces the maximum staging spacewithout a significant capital equipment investment toincrease general shredding capacity. In addition, a portionof the staging space saved by the disassembly operation inFigure4bmaybeallocated to theaddeddisassemblyprocess.These results provide evidence that disassembly does not
produce a bottleneckbut rather that a balanceddisassemblyoperation adds capacity to increase product turnover in thestaging area and reduce the likelihood of turning awaytruckload arrivals due to capacity constraints.
Wemeasure throughput for each scenario in terms of theannual number of shipments and shipped weight for eachmaterial. Our discrete event simulation model reflects theimpact of random arrivals and random processing times bycombining the results of 100 replicate runs. Thus, we reportour results as 95% confidence intervals (CI). By comparingTable 5, sections a and b, we see that these intervals for thenumber of truckload shipments and the shipped weightnearly match across scenarios for all materials but mixedplastics,whichdramatically decreasewhen theplastic coversare sorted. Likewise, when televisions are included Table 5,sections c and d, shows that material shipments other thanmixedplastics remain largelyunaffectedbydisassembly.Withdisassembly, we ship nearly pure recovered resins, ABS, PC/ABS, HIPS, with mixed plastics labeled Contaminant, andOthers in the quantities reported in Table 6, sections a andb.As anticipated, the HIPS andOthers throughputs increasewhen televisions are added to the input, in accordance withthe plastics composition profile of televisions as detailed inTable 4.ThePC/ABS throughput derived fromdisassembledcomputer equipment covers remain the same in bothdisassembly scenarios, showing that the processing oftelevisions in the arrival mix does not perturb materialsrecovery from business machines.
To characterize material quality, we examine the outputplastics compositions as reported in Figure 5. Bulk recyclingscenarios shipplastics entirely as low-gradeplasticmixtures.Both limited disassembly scenarios produce purified ABS,PC/ABS, and HIPS along with Contaminants (e.g., PVC) andunidentified Others in mixtures. When business equipmentis processed in scenario 2, ABS dominates the sorted plasticoutput. Adding a 3-fold excess of televisions in scenario 4rebalances the output in favor ofHIPS. Figure 5a,b shows forboth scenarios 2 and 4 that the mixed plastics remaining
FIGURE 4. (a) Maximum staging space for bulk/CPM and disas-sembly/CPM scenarios. (b) Maximum staging space for bulk/T-CPM and disassembly/T-CPM scenarios.
TABLE 5. Annual Material Throughput Shipped forScenarios 1-4
95% CI for no.of trucks in 1 yr
95% CI for totalweight in 1 yr (t)
materiallowerbound
upperbound
lowerbound
upperbound
Section a: Bulk/CPM (Scenario 1)ferrous 21.6 22.8 294 310mixed metal 22.4 23.5 304 320mixed glass 13.7 14.6 187 198mixed plastics 11.9 12.6 162 171mixed materials 0.0 0.0 0 0
Section b: Disassembly/CPM (Scenario 2)ferrous 21.4 22.4 291 305mixed metal 22.2 23.3 302 316mixed glass 13.7 14.5 187 197mixed plastics 1.5 1.7 21 24mixed materials 0.0 0.0 0 0
Section c: Bulk/T-CPM (Scenario 3)ferrous 70.4 74.9 957 1018mixed metal 40.9 43.6 557 593mixed glass 74.6 80.4 1015 1094mixed plastics 41.4 44.2 563 601mixed materials 28.6 31.1 389 424
Section d: Disassembly/T-CPM (Scenario 4)ferrous 67.9 73.1 923 994mixed metal 40.6 43.5 552 591mixed glass 70.8 76.8 963 1044mixed plastics 4.2 4.6 57 62mixed materials 27.2 29.7 370 404
VOL. 37, NO. 23, 2003 / ENVIRONMENTAL SCIENCE & TECHNOLOGY 9 5467

after limited disassembly constitute only 10% of the totalplastics. In other words, limited disassembly recovers 90%of themixedplastics thatwouldbeproducedbybulk recyclingin scenarios 1 and 3. Furthermore, referring to Table 4, at$0.04/kg, the value of the average annualweight of themixedplastics in scenarios 1and3areworthonly$7318and$25 588,respectively. On the other hand, the value of the averageannual weight of sorted plastics in scenarios 2 and 4 areestimated tobe$83 132and$275 504, respectively.Thepriceschosen for scenarios 2 and 4 reflect the transfer price in $/kgto a blender rather than the market price of feedstockrecyclate as might be paid by a molder. Thus, limiteddisassembly is shown to produce a result that is bothenvironmentally beneficial and, in principle, economicallyviable. Recovered plastics divert to reuse instead of going tolandfills or incinerators, and the labor costs of disassemblyaremitigatedby the commercial valueof recoveredmaterialsand staging space savings.
Turning to our final metric, we find that shipment filltimes forallmaterials exceptmixedplastics remainunalteredby the introduction of disassembly, as shown in Table 7,sections a and b. The shipment fill time for mixed plasticsincreases dramatically in the limited disassembly scenariossimply because most plastics are sorted for ABS, HIPS, orPC/ABS shipment. These results verify that adding a disas-sembly process with 50-70% average utilization does not
slow the recovery of metals, but rather, metals shipment filltimes remain thesameandplastic shipmentquality increases.Because limiteddisassembly scenarios identifyandsort inputplastics, mixed plastics output shipments occur less fre-quently and incur longer fill times in Table 7, sections a andb.Asexpected, addingHIPS-intensive televisions to thearrivalcompositiondecreases theHIPS shipment fill time inscenario4 in Table 8. Likewise, the shipment fill times for ABS andOthers decrease in Table 8 according to the plastics com-position of televisions in Table 4. Importantly, the additionof televisions to the mix of products processed does notincrease the shipment fill time of PC/ABS from computerequipment, showing again that the processing of consumerelectronics with limited disassembly does not perturb therecovery of engineering plastics from business machines.
To conclude, we have shown that two disassemblyworkstations, an identificationstation, andaplastics shreddercanannually convert 120 t ofplastic businessmachine coversintohigh-value engineeringplastics.With five disassemblersand an input stream that adds about 100 000 televisions/yr,the purified plastic output could exceed 400 t.
TABLE 6. Annual Plastics Throughput Shipped for Scenarios2 and 4
95% CI for no.of trucks in 1 yr
95% CI for totalweight in 1 yr (t)
plasticslowerbound
upperbound
lowerbound
upperbound
Section a: Disassembly/CPM (Scenario 2)ABS 22.1 23.3 66 70PC/ABS 6.4 6.7 19 20HIPS 10.0 10.5 30 32Contaminants 2.9 3.1 9 9Others 3.0 3.1 9 9
Section b: Disassembly/T-CPM (Scenario 4)ABS 27.1 28.9 81 87PC/ABS 6.3 6.7 19 20HIPS 101.8 110.7 305 332Contaminants 3.2 3.5 10 10Others 18.4 20.0 55 60
TABLE 7. 95% Confidence Interval for Materials Shipment Fill Time (d)ferrous mixed metal mixed glass mixed plastics mixed materials
scenariolowerbound
upperbound
lowerbound
upperbound
lowerbound
upperbound
lowerbound
upperbound
lowerbound
upperbound
Section a: CPMbulk 11.6 12.2 11.2 11.7 18.1 19.1 21.1 22.1 0.0 0.0disassembly 11.7 12.2 11.2 11.7 18.2 19.2 167.5 175.5 0.0 0.0
Section b: T-CPMbulk 3.5 3.8 6.1 6.5 3.3 3.6 6.0 6.4 8.6 9.4disassembly 3.7 4.0 6.1 6.5 3.5 3.8 57.5 61.6 9.1 10.0
TABLE 8. 95% Confidence Interval for Plastics Shipment Fill Time (d)ABS PC/ABS HIPS Contaminants Others
scenariolowerbound
upperbound
lowerbound
upperbound
lowerbound
upperbound
lowerbound
upperbound
lowerbound
upperbound
2, disassembly CPM 11.4 12.0 39.7 41.7 25.1 26.4 87.3 94.2 85.0 90.64, disassembly T-CPM 9.1 9.7 39.5 41.8 2.4 2.7 77.0 82.4 13.4 14.6
FIGURE 5. Materials plastic throughput for bulk recycling and limiteddisassembly scenarios for the processing of business machinesalone (a) and business machines with televisions (b). Units of metrictons per year. Note the scale difference between panels a and b.
5468 9 ENVIRONMENTAL SCIENCE & TECHNOLOGY / VOL. 37, NO. 23, 2003

This offers both an environmental benefit and an eco-nomic one. Environmental stewardship and green engineer-ing principles motivate plastics-to-plastics recycling. Ourmodel facility diverts tons of plastic from incineration/landfills and lowers materials consumption by facilitatingreuse. Remolding of recovered thermoplastics is well-documented by studies such as ref 59 for HIPS, and therevenues from sales to such markets can help substantiallyto offset the cost of disassembly labor.
Thus,byaddressingboth the industrial engineeringdesignof the recycling process in concert with the chemometricidentification of recovered plastics by resin, we have shownthat efficient disassembly, identification, and sorting in-creases a recovery system’s value-added throughput. Fur-thermore, we establish that these added processes do notinterferewithmetals throughputbut rather simplyaddoutputstreams of high-value engineering plastics. Although shownto offer the potential for profit, margins for plastics recoveryalone will be tight. However, the case for plastics-to-plasticsrecycling will only improve as plastic prices, disposal costs,and recycling infrastructure increase. In addition, plasticsseparationprocessesdemonstratedherecanbe implementedto add value to processes developed to recover nonplasticmaterials. Our results offer insights that will help in capacityplanning for recycling network design (36, 60).
To achieve environmental and economic benefits fromelectronics recycling, goodproductiondesignandoperationsmanagement are critical. We have built the success of thesystem proposed in this paper based in part on our priorresults for disassembly depth, plastics popularity, productbatching for changeovers, and scheduling. Those resultsdemonstrate that a disassembly depth strategy calling forwhole plastic cover removal for computers and printers andplastic back cover removal for televisions andmonitors yieldsan attractive plastics recovery rate (43). By sorting the mostpopular plastics, we efficiently accumulate shipment quanti-ties (43) with low shipment fill times. By batching productsfor shredding, we lower the changeover times to clean outthe shredders (61). Scheduling according to the ratio ofvolume to disassembly time reduces the staging space (35).Combining these industrial engineering designs with newchemometric technologies provide a powerful new processdesign and recycling management strategy for plastics-to-plastics recycling.
AcknowledgmentsThe authors appreciate the personal computer, printer, andmonitor donations from United Recycling Industries; Re-source Concepts, Inc.; IBM; and Wildcat Creek Solid WasteDistrict.Theauthors thankWinstonBonawi-tan forassistancein preparing the tables and the reviewers for helpfulcomments. This material is based upon work supported bytheNational ScienceFoundationunderGrantsBES-0124761andDMII-0049074.Any opinions, findings, and conclusionsor recommendations expressed in this paper are those of theauthors and do not necessarily reflect the views of theNational Science Foundation.
Supporting Information AvailableTables providing detailed distributions of arrival times andproduct compositions as well as number of recovered partsper unit and identification steps per unit, all derived fromseparate studiesofplastics recoveryoperations;abinary inputdesignation for use in devising shredder changeover rulesand the input statisticsassumed forproductarrivalquantities.This material is available free of charge via the Internet athttp://pubs.acs.org.
Literature Cited(1) Anastas, P. T.; Zimmerman, J. B. Environ. Sci. Technol. 2003 37
(5), 94A-101A.
(2) Dillon, P. S.; Aqua, E. N. Recycling Market Development forEngineering Thermoplastics from Used Electronic Equipment;TechnicalReport 20;ChelseaCenter forRecyclingandEconomicDevelopment, University of Massachusetts: Lowell, MA, 2000.
(3) Arola, D. F.; Biddle, M. B. Presented at the IEEE InternationalSymposiumonElectronics and theEnvironment,SanFrancisco,May 8-10, 2000; pp 75-80.
(4) Hoffman, J. E. JOM 1992, 4, 43-48.(5) Zhang, S.; Forssberg, E. Waste Manage. Res. 1998 16 (2), 119-
128.(6) Grenchus, E. Presented at the International Symposium on
Electronics and theEnvironment,SanFrancisco,May5-7, 1997;pp 157-160.
(7) Berko-Boateng, V.; Azar, J.; Jong, E. D.; Yander, G. A. Presentedat the IEEE International Symposium on Electronics and theEnvironment, Arlington, VA, 1993; pp 19-31.
(8) Burgdorf,P.Reuse andRecycling: Recycling at SiemensNixdorf;SiemensNixdorf InformationsystemeAG: Paderborn,Germany,1993.
(9) Danker, J.; Johnson,S.;Pomerleau,R.L.Presentedat theAnnualRecycling Conference, Chicago, November 7, 1996; pp 51-58.
(10) Electronic Product Recovery and Recycling Baseline Report:Recycling of Selected Electronic Product in the United States;National Safety Council: Washington, DC, 1999.
(11) Barnthouse, L., et al., Eds. Life Cycle Impact Assessment: TheState of the Art, 2nd ed.; Society of Environmental Toxicologyand Chemistry: Pensacola, FL, 1998.
(12) Graedel, T. E. Streamlined Life-Cycle Assessment; Prentice Hall:Upper Saddle River, NJ, 1998.
(13) Faruk, A. C.; Lamming, R. C.; Cousins, P. D.; Bowen, F. E. J. Ind.Ecol. 2002, 5 (2), 13-36.
(14) Stuart, J. A.; Ammons, J. C.; Turbini, L. J. Oper. Res. 1999, 47 (2),221-234.
(15) Eskigun, E.; Uzsoy, R. Technical Report 98-12. Purdue Univer-sity: West Lafayette, IN, 1998.
(16) Hoshino, T.; Yura, K.; Hitomi, K. Int. J. Prod. Res. 1995, 33 (8),2069-2078.
(17) O’Shea, B.; Grewal, S. S.; Kaebernick, H. Concurrent Eng. Res.Appl. 1998, 6 (4), 345-357.
(18) Gungor, A.; Gupta, S. M. Comput. Ind. Eng. 1999, 36 (4), 811-853.
(19) Lee,D.H.; Kang, J.G.; Xirouchakis,P.Presentedat the Institutionof Mechanical Engineers, 2001; pp 695-709.
(20) Obsolete computers, “Gold Mine”, or high-tech trash? Resourcerecovery from recycling; Fact Sheet FS-060-01; Department ofInterior-U.S. Geological Survey: Washington, DC, 2001.
(21) Residential Collection of Household End-of-Life Electrical andElectronic Equipment: Pilot Collection Project; EPA-901-E-98-002;United Stated Environmental Protection Agency Region 1,CommonSense InitiativeComputerandElectronicSector: 1998.
(22) Analysis of Five Community Consumer/Residential Collectionsof End-of-Life Electronic and Electrical Equipment; EPA-901-R-98-003; United Stated Environmental Protection Agency,Region 1, Common Sense Initiative Computer and ElectronicSector: 1999.
(23) Jung,L.B.The San JoseComputerCollection andRecyclingPilot;Technical Report for EPA Contract 7W-3901-TASA, Vista En-vironmental, Inc.: 1998.
(24) Davis, S. D. Presented at the IEEE International Symposium onElectronics and the Environment, Danvers, MA, May 11-131999; pp 309-313.
(25) Brenters, S.;Mirec B.V., Eindhoven, The Netherlands, personalcommunication, 1995.
(26) Brown, R. M. Recyclights, Inc., Columbus, OH, personalcommunication, 1998.
(27) Chapman,R.ResourceConcepts, Inc.,Carrollton, TX, personalcommunication, 1998.
(28) Magliaro, M. F. DMC: The Electronics Recycling Company,Newfields, NH, personal communication, 1998.
(29) Skurnac, S. M. Micromet, Roseville, CA, personal communica-tion, 1998.
(30) Gardner, J. Metech International, Inc., Gilroy, CA, personalcommunication, 2000.
(31) Stuart, J. A.; Lu, Q. IEEE Trans. Electron. Packag. Manuf. 2000,23 (4), 321-327.
(32) Sum, E. Y. L. JOM 1991, 43 (4), 53-61.(33) Zhang, S.; Forssberg, E.; van Houwelingen, J.; Rem, P.; Wei,
L.-Y. Waste Manage. Res. 2000, 18, 73-85.(34) Reimer, B.; Sodhi, M. S.; Knight, W. A. Presented at the IEEE
SymposiumonElectronics and theEnvironment,SanFrancisco,CA, May 8-10, 2000; pp 342-347.
VOL. 37, NO. 23, 2003 / ENVIRONMENTAL SCIENCE & TECHNOLOGY 9 5469

(35) Stuart, J. A.; Christina, V. IEEE Trans. Electron. Packag. Manuf.2003, 26 (2), pp 133-140.
(36) Murphy, C. F.; Dillon, P. S.; Pitts, G. E. Presented at the IEEESymposium on Electronics and the Environment, Denver, CO,May 7-9 2001; pp 229-235.
(37) Pomerleau,R.ButlerMacDonald, Inc., Indianapolis, IN,personalcommunication, 2002.
(38) Allen,D.T.; Shonnard,D.R.GreenEngineering:Environmentally-Conscious Design of Chemical Processes; Prentice Hall: UpperSaddle River, NJ, 2002.
(39) Sarkis, J., Ed. Greener Manufacturing and Operations: FromDesign to Delivery and Back; Greenleaf Publishing Limited:Sheffield, U.K., 2001.
(40) Stuart, J. A.; Sommerville, R. M. Int. J. Environ. Conscious Des.Manuf. 1998, 7 (1), 43-57.
(41) Stuart, J. A. In Handbook of Industrial Engineering; Salvendy,G., Ed.; John Wiley & Sons: New York, 2000; pp 530-545.
(42) Rios, P.; Blyler, L.; Tieman, L.; Stuart, J. A.; Grant, E. Environ.Sci. Technol. 2003, 37, 5417-5423.
(43) Stuart, J.A.; et al. Purdue University, unpublished results, 2003.(44) Boks,C.B.; Kroll,E.; Brouwers,W.C. J.; Stevels,A.L.N.Presented
at the IEEE Symposium on Electronics and the Environment,Dallas, May 6-8, 1996; pp 224-229.
(45) Kroll,E.; Beardsley,B.;Parulian,A. IIETrans. 1996 28, 837-845.(46) Das, S.; Mani, V.; Caudill, R.; Limaye, K. Presented at the
Proceedingsof the IEEE InternationalSymposiumonElectronicsand the Environment, San Francisco, 2002; pp 257-262.
(47) Spectracode Inc., West Lafayette, IN, 2003.(48) Geladi, P.; Kowalski, B. R. Anal. Chim. Acta 1986 185, 1-17.(49) Skoog, D. A.; Leary, J. J. Principles of Instrumental Analysis;
Saunders College Publishing: Fort Worth, TX, 1992.
(50) Grant, E. R.; Pomerleau, R. L.; Brooks, A. J. Presented at theAnnual Recycling Conference, Chicago, November 5-7, 1997;pp 61-70.
(51) Banks, J.; Carson, J. S., II; Nelson, B. L. Discrete-event SystemSimulation, 2nd ed.; Prentice-Hall: Upper Saddle River, NJ,1996.
(52) Hillier,F.S.; Lieberman,G. J. Introduction toOperationsResearch,6th ed.; McGraw-Hill Publishing Company: New York, 1995.
(53) Rockwell Software Inc., Sewickley, PA, 2002.(54) Hainault, T.; et al. Recycling Used Electronics: Report on
Minnesota’s Demonstration Project; Minnesota Office of Envi-ronmental Assistance: St. Paul, MN, 2001.
(55) K-Mac Plastics. http://k-mac-plastics.com/ (Accessed June2003).
(56) Rios, P.; et al. Presented at the IEEE International Symposiumon Electronics and the Environment, Boston, 2003; pp 341-346.
(57) Konz, S.; Johnson, S. In Work Design: Industrial Ergonomics,3rd ed.; Konz, S. A., Ed.; Holcomb Hathaway: Scottsdale, AZ,2000; pp 539-564.
(58) Stuart, J. A.; Lu, Q. IEEE Trans. Electron. Packag. Manuf. 2000,23 (4), 314-320.
(59) Kuswanti, C.; et al. J. Ind. Ecol. 2002, 6 (3-4), 125-135.(60) Fleischmann, M.; et al. Eur. J. Oper. Res. 1997 103, 1-17.(61) Lu,Q.; Stuart, J.A.PurdueUniversity, unpublished results, 2003.
Received for review June 29, 2003. Revised manuscript re-ceived August 27, 2003. Accepted September 11, 2003.
ES034675O
5470 9 ENVIRONMENTAL SCIENCE & TECHNOLOGY / VOL. 37, NO. 23, 2003