International schooling: a sociocultural study - ePrints Soton
Pa
RTa
b
c
a
ARR3AA
KPGBHEB
1
fitalwfoh
0d
Neuropsychologia 50 (2012) 612– 620
Contents lists available at SciVerse ScienceDirect
Neuropsychologia
j ourna l ho me pag e: ww w.elsev ier .com/ locate /neuropsychologia
lasticity of lateralization: Schooling predicts hand preference but not hand skillsymmetry in a non-industrial society
eint H. Geuzea,∗, Sara M. Schaafsmab, Jessica M. Lusta, Anke Boumaa, Wulf Schiefenhövelc,on G.G. Groothuisb
Department of Clinical and Developmental NeuroPsychology, University of Groningen, Grote Kruisstraat 2/1, 9712 TS Groningen, The NetherlandsDepartment of Behavioural Biology, Institute of Behaviour and Neuroscience, University of Groningen, PO Box 11103, 9700 CC Groningen, The NetherlandsMax-Planck-Institute for Ornithology, Human Ethology Group, Von-der-Tann-Str. 3, 82346, Andechs, Germany
r t i c l e i n f o
rticle history:eceived 9 September 2011eceived in revised form0 November 2011ccepted 23 December 2011vailable online 3 January 2012
eywords:egboardrip forceall throwingandednessvolutionehavioural asymmetry
a b s t r a c t
Considerable variation in the frequency of left-handedness between cultures has been reported, rangingfrom 0.5 to 24%. This variation in hand preference may have evolved under natural or cultural selection.It has been suggested that schooling affects handedness but as in most human societies only a selectedand minor part of the population does not attend school this is difficult to test. We investigated to whatextent schooling affects both hand preference and asymmetry in hand skill in a non-industrial popula-tion in the highlands of New Guinea. This provided unique opportunities because of the relatively recentestablishment of a primary school in this population, and where people still live a non-industrial tradi-tional life reflecting conditions in which handedness may have evolved. We interviewed 620 inhabitants(aged 5–70y) to collect demographic data and school history, tested hand preference on 10 ecologicallyrelevant activities, and measured performance of each hand on three tasks (pegboard, grip force, ballthrowing).
Schooled individuals were overall faster in fine motor performance, had greater grip strength andgreater throwing accuracy. This suggests that there is implicit selection on the fitter part of the popu-lation to enter school. Schooling is associated with hand preference, as schooled individuals were morelikely to be extremely right-handed and less likely to be strongly right-handed, but not with asymme-
try of hand skill (controlled for sex and age). Developmental plasticity in hand preference but not skillasymmetry, and the weak correlations between hand preference and hand skill asymmetry indicate thatthey represent different aspects of brain lateralization. Furthermore, the weak correlations between handpreference and hand skill asymmetry leave room for moderating factors such as schooling, sex and ageto have a differential effect on hand preference and hand skill, and each needs to be studied in its ownright.. Introduction
A common characteristic of all human populations is the highrequency of individuals with right-hand preference, and theres evidence that this exists over a long period of human evolu-ion, as detailed analyses of cave drawings and tool productionnd use suggest (Bradshaw & Rogers, 1996). Following the pub-ic concept of left-handedness being a characteristic of a person
ho more often prefers to use her/his left hand than right hand
or a representative set of common manual tasks only a minorityf the population is left-handed. Considerable variation in left-andedness between cultures, ranging from 0.5 to 24%, has been∗ Corresponding author. Tel.: +31 503636398; fax: +31 503636304.E-mail address: [email protected] (R.H. Geuze).
028-3932/$ – see front matter © 2012 Elsevier Ltd. All rights reserved.oi:10.1016/j.neuropsychologia.2011.12.017
© 2012 Elsevier Ltd. All rights reserved.
reported (Faurie & Raymond, 2005; Faurie et al., 2005; Marchant& McGrew, 1998; Perelle & Ehrman, 1994), but the cause of thisvariation remains unclear. The variation has been explained as aresult of variation in natural selection pressure on winning fights(Raymond, Pontier, Dufour, & Molier, 1996, but see Schaafsmaet al., in press) in which left-handers would have an advantageas long as they are in the minority. Populations in which fight-ing is important are thus expected to hold a higher frequency –but still a minority – of left-handers. Furthermore, variation hasbeen explained to result from genetic variation (e.g. Annett, 2002;Corballis, 1999; McManus & Bryden, 1992) and variation in culturalpressure against the use of the left hand for certain activities (writ-
ing, eating) (Holder & Kateeba, 2004; Medland et al., 2004; Perelle& Ehrman, 1994). Indeed, extreme right-handedness for writingwas found to be more frequent in cultures having many formalrules and extreme left-handedness more frequent in cultures with
sycho
f(osGdeawtfP&
CsipitifhttAsiSdnA
ssto3gsumpr
bHitTstifbw22Tm
usmit
R.H. Geuze et al. / Neurop
ew (Medland et al., 2004). However, as Marchant and McGrew1998) pointed out, most studies in this field use a limited setf measures to assess hand use, and differ in age ranges of theirample, a factor known to influence lateralization (Bishop, 1990;ilbert & Wysocki, 1992; Roy, Bryden, & Cavill, 2003). Moreover,ifferent studies used different criteria for classification of hand-dness, ranging from only the distinction between left and right to
graded system of direction and strength in terms of ambidexter,eak, strong and extreme. These limitations may explain part of
he reported variations within and between cultures. Moderatingactors such as sex and age affect handedness (sex: Papadatou-astou, Martin, Munafò, & Jones, 2008; age: Bishop, 1990; Gilbert
Wysocki, 1992).Another factor that may influence lateralization is schooling.
onnolly and Bishop (1992) investigated the association betweenchooling and handedness in a Papuan population. This populations ideal for investigating this association as a substantial part of theopulation did not attend school. Furthermore, associations found
n this non-industrial population may be of special relevance ashe individuals in this population live a traditional life, with sim-lar natural selection pressures that may have been responsibleor the evolution of human handedness. These authors assessedand preference of children and adolescents in a Papuan popula-ion by observing subjects performing a set of nine actions withypically ‘Western’ objects such as dealing cards and using scissors.gainst their predictions, there was a trend for those who had nochooling to be more right-handed for a task with a pencil (to filln a small white square) than those who had received schooling.chooling had no effect on handedness in other tasks. However,ue to unfamiliarity with some of the actions these measures mayot represent the subject’s true handedness (see Bryden, Ardila, &rdila, 1993).
To investigate whether schooling predicts handedness on mea-ures that are of ecological relevance, we measured handedness in aimilar Papuan non-industrial population, the Eipo, using activitieshat are common in the daily life of the individuals. This populationffered the unique chance to study the effect of schooling as about0% of this population spent some time in primary school. Investi-ating this population was further motivated by the virtual lack ofpecialized craftsmen for making tools and ornaments in this pop-lation. The latter is important because tools made by craftsmenay impose handedness onto the user of the tool, thus exerting
ressure on skill development of a single hand promoting mostlyight-hand preference, as is the case in industrial societies.
Hand preference is generally explained as the expression ofrain lateralization of fine motor function at the behavioral level.owever, our limbs, being the ‘tools’ with which we physically
nteract with the environment, are symmetrical and our neuromo-or system for voluntary action is symmetrical to a large extent too.his enables us to perform tasks with either limb, but there are alsoubtle differences in skill between the left and right limb. Similaro hand preference, this difference in skill between the hands isnterpreted as an expression of cerebral lateralization of fine motorunction at the behavioral level. The resulting difference in skilletween the hands seems to be only weakly or moderately relatedith hand preference (Borod, Caron, & Koff, 1984; Doyen et al.,
008; Triggs et al., 2000) and is task dependent (Cavill & Bryden,003; Corey, Hurley, & Foundas, 2001; Steenhuis & Bryden, 1999).herefore it is important to study both preference and skill asym-etry, each with a representative set of tasks.Although it is assumed that hand preference may have evolved
nder natural selection this may be even more likely so for hand
kill. Greater overall hand performance and asymmetry of skillay enable the subject to better deal with the environment andncrease chances for survival, thus increasing its fitness. In addi-ion, lateralization consists of two different aspects: direction and
logia 50 (2012) 612– 620 613
strength (Volkmann, Schnitzler, Witte, & Freund, 1998; also seeNettle, 2003). Therefore, we investigated the effect of schoolingon and the relation between hand preference, overall hand perfor-mance and hand skill asymmetry, both for strength and direction.
As it is known that there are small but consistent sex differencesin handedness across cultures (Papadatou-Pastou et al., 2008) sexis included as a predictor. Age is included as a covariate because agedifferences in handedness have been reported (2.5–8.5y – Bishop,1990; 10–86y – Gilbert & Wysocki, 1992; Roy et al., 2003), andparticipation in schooling is unevenly distributed over age. Withrespect to schooling we predict that subjects with schooling will bemore right-handed than those without (Holder & Kateeba, 2004;Perelle & Ehrman, 1994; but see Connolly & Bishop, 1992). Addi-tionally, as learning to write is a specific and intense training infine motor control, we expect that schooled individuals will showstronger asymmetry in hand skill, especially in fine motor skill, thanindividuals without schooling.
We used three hand skill tasks that measure speed (in a peg-board task), accuracy (in a ball throwing task) and strength (of handgrip) of each hand. We explored how these three measures relateto each other and to direction and strength of hand preference inthis population. As a validation of the skill tasks overall hand skillis analyzed with the predictions that males will be stronger andbetter throwers than females. The pegboard will be validated withdata in the literature. Hand preference data were validated before(Schaafsma et al., in press).
2. Method
2.1. Subjects and population
The population of this study are the Eipo people living in theupper part of a valley of the Eipo river (altitude >1500 m) in thecentral mountain range of New Guinea (Indonesia). In this isolatedarea, only accessible by light aircraft or by mountain trails, some1600 people live spread over 3 villages and some small hamlets.They have their own language (Eipo yupe), and live a traditional lifegrowing vegetables, sweet potatoes, tubers and fruits, with addi-tional supply of protein rich food from hunting and recently alsofish ponds. First brief contacts with non-Papuan people occurredin 1959 and 1968. From 1974 onwards German scientists regu-larly visited these villages (Ploeg, 2004; Schiefenhövel, 1976, 1991,1997). Missionaries were active from 1977 to about 2000 and con-verted the larger part of the population to Christianity in 1981.
A primary school was built in 1981 and a part of the population,both children and adults, then went to school. No school fee is to bepaid. In primary school they learn the Indonesian language, writ-ing and other usual topics. Thus a portion of the population couldspeak and/or understand at least some Indonesian. Higher educa-tion is available in larger inland towns at a distance of at least 5days walking, so the few adolescents and young adults attendingthese schools were rarely present.
People did not know their age or that of their children. We esti-mated the age of the subjects using the technique of a calendar ofevents known to them (see Table 1) of which the year of occurrencewas known to us. We used interpolation between these eventsusing questions like: “Were you married when . . .?” and “Can youpoint to a child here who has the same age as you when . . .?” Addi-tionally we used comparisons like “are you older (younger) thanX?”; X being a person whose age we had accurately determined.
Our research was introduced in a speech during church ser-
vice in each of the three villages. This speech in bahasa Indonesiawas translated into the Eipo language by one of the local peo-ple. Three research assistants with appropriate knowledge ofboth languages assisted in the interviews and tasks. The research
614 R.H. Geuze et al. / Neuropsychologia 50 (2012) 612– 620
Table 1Calendar of events used in estimating the age of the adult subjects.
Year Event
1959a First contact in December by French/Dutch expedition led byGaisseau
1969a Indonesian parachutists with medical dr. Bondan land in theEipo valley using flares
1974a Arrival German scientific expedition; some scientists stayed for18 months
1976b Two earthquakes of magnitude 7.1 on June 25 and October 291981 School and missionary house built1989 New church built1995 Arrival of missionary Janovski1999 First fishing ponds2005 Health care center built
a
(
pDr
w1(
2
saia(hsli
2
oolScfmcmojh
2
pht
o1bw
Table 2List of 12 activities used to determine hand preference (adapted from Oldfield, 1971).Tasks 10 and 12 were not included in the hand preference index (see text).
Task Description of question andtask: “Can you show me howyou . . .”
Materials
1 Sharpen this stick with thisknife
Hand knife, stick (L 50 cm)
2 Take the stone and hit thepebble to crush it
Pebble, handsize stone
3 Draw a circle on the earth withthis stick
Stick (L 50 cm)
4 Pick up the small bead andhand it over
Bead (Ø 2 mm)
5 Pick up the stone and the poleand hammer it in the earthwith the stone
Pole (45 cm); handsize stone
6 Pick up and eat a peanut Peeled peanut7 Chase an imaginary fly from
your nose8 Punch this bag Cloth bag (20 cm × 20 cm) filled
with soft material hanging onshort rope
9 Throw away this little pebble Small pebble10 Use a bush knife Bush knife11 Use a digging stick Stick (length 2 m)
From Schiefenhövel (1997).b http://earthquake.usgs.gov/earthquakes/world/historical country.php
retrieved 15 October 2010).
roject was approved by the ethical committee of the Psychologyepartment of the University of Groningen, and subjects were
ecruited only on a voluntary basis with informed verbal consent.In total 621 subjects participated, 289 males and 332 females,
ith an age range of 5–70 years, of which 235 were younger than8 years; 400 (65%) had never attended primary school, and 18630%) completed at least 1 year in primary school.
.2. Interview
All interviews and tests were done by the first two Indonesianpeaking authors, each always assisted by one of the three localssistants. In the interview that lasted about 30 min demographicnformation of the subject and its family was collected, includingn estimation of the subject’s age, self-reported hand preferencewe asked which was their preferred hand, then asked to raise thatand) and school history (none, years spent in preschool, primarychool, secondary school, higher education). The interview was fol-owed by a hand preference test and three hand performance tasks,n the following order.
.3. Hand preference test and procedure
Hand preference was determined in a similar way as in the studyf Annett (1970) by observation of spontaneous hand use in a seriesf 12 uni-manual and bi-manual tasks that we adapted to the dailyife of the Papuan population (see Table 2, Schaafsma et al., in press).ubjects were seated on the ground or a low rock with their legsrossed (items 1–9) or stood upright with both hands free directlyacing the observer who was positioned in a similar posture. The
aterials were presented to the participant in such a way that noue was provided as to the hand to use by first placing objects sym-etrically on a wooden board, then with two hands placed in front
f the subject within reach (items 1–6, 9) or presented to the sub-ect by the testers holding the object(s) symmetrically with bothands (items 8, 10–12).
.4. Hand skill tests and procedure
Three tests were used that measured the speed and accuracy ofeg placement, hand grip force, and the accuracy of throwing. Bothands were tested, the initial hand alternated over subjects. Thehree tests were administered in fixed order.
The Annett pegboard (Annett, 1985, p. 208) was constructed
f hardwood (L × W × H = 40 cm × 21 cm × 2.5 cm) with 2 rows of0 holes (Ø 0.5 cm, depth 1.2 cm) each 3.75 cm apart and distanceetween the rows 17 cm. The 10 steel pegs (Ø 0.45 cm, length 3 cm)ere placed in one row. Subjects were seated on a low flat rock12 Shoot the arrow with this bow Bow and arrow
with a thin board (±50 cm × 40 cm) on their lap. The pegboard wasplaced on this board, the row of pegs closest to the body at a distanceof approximately 10 cm. Subjects held the pegboard with one hand,while performing the task with the other. Subjects were instructedto move the pegs one by one to the compatible location at the otherrow working from the side of the hand as fast as possible withoutdropping a peg. Each trial started with a practice trial moving 3pegs forth and back. If the task had not properly been understooda second practice trial was given. Next, the subject was instructedto hold the first peg and to start after the tester had counted from3 back to zero. The time to complete the task was measured with astopwatch. If a peg was dropped the task was stopped, and the trialrepeated. The Annett pegboard task has been used in many studies(e.g. in Papua, Connolly & Bishop, 1992) and is a valid and reliabletool to measure hand skill asymmetry (Annett, Hudson, & Turner,1974; Doyen & Carlier, 2002).
Hand grip force was measured with a hand dynamometer(Bramshey BRSFU238) in a standard posture as follows: subjectswere seated with the thin board on their lap. The tester demon-strated the required arm and hand posture and briefly squeezed.Specifically it was demonstrated that the elbow should be close tobut not against the side of the body, the lower arm approximately atan angle of 90◦ forward and about halfway between pronation andsupination, and the fingers straight at a 90◦ angle with the hand.Then the dynamometer was placed firmly in the 90◦ angle parallelto the fingers, the fingers folded over the handle, the thumb alongthe other side, with the dynamometer extending in line with thelower arm. The lower arm and dynamometer were not to touch theboard, the other arm rested on the board. The subject was allowedto produce a light squeeze to ‘get the feel’ of the dynamometer. Thesubject was instructed to squeeze as hard as possible during 5 s atthe command ‘squeeze’. The dynamometer recorded the maximumforce produced which was then copied on paper. If the posture devi-ated too much (i.e. the arm was stretched) or if the subject pushedthe dynamometer hard on the board, or used help of the other hand,the trial was repeated for both hands. This was also done if the dif-ference in force between the hands was unrealistic (criterion 20%).
The few missing data were caused by subjects with a wound or mal-formation of one hand. The repeatability of this test was estimatedfrom two repeated trials of 38 subjects. Cronbach’s alpha was good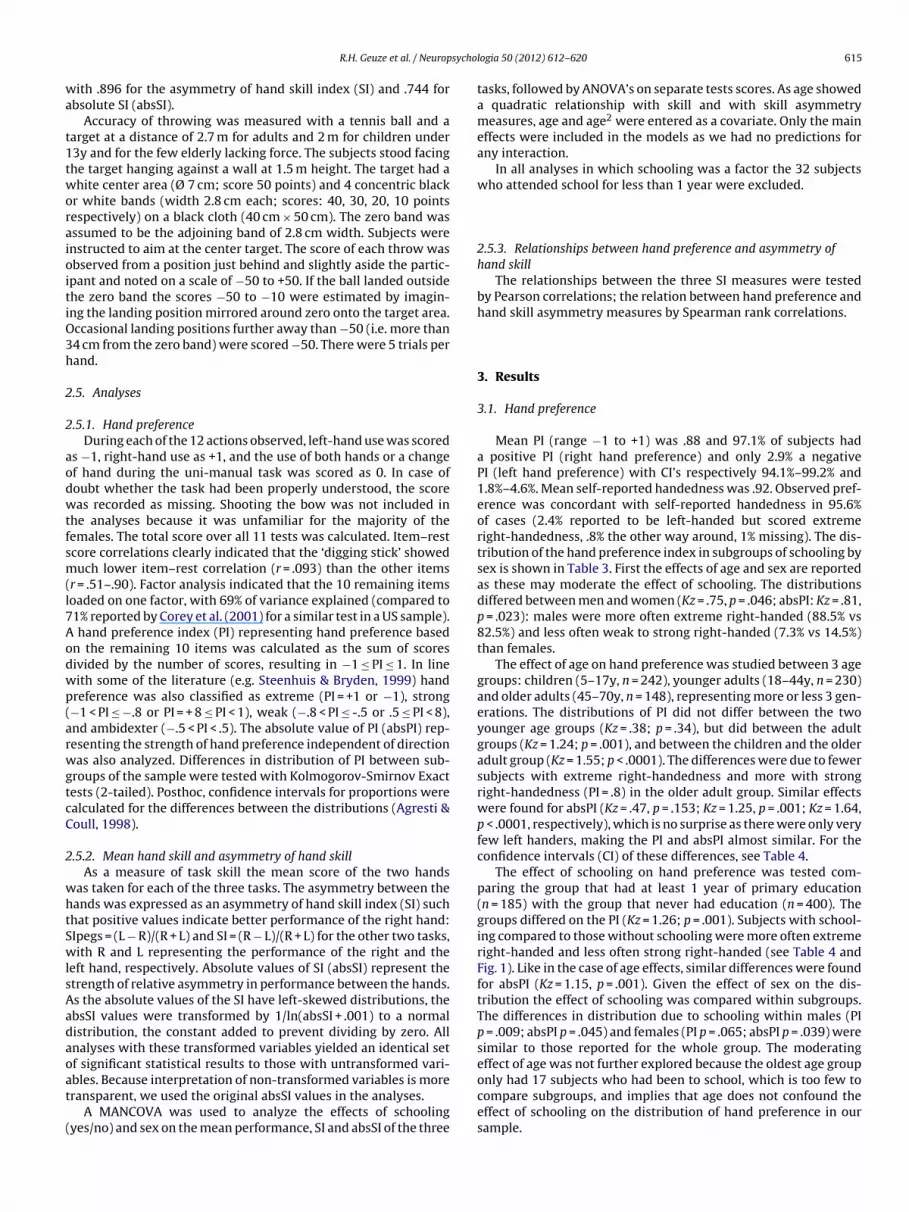
sycho
wa
t1tworaioitiO3h
2
2
aodwtfsm(l7Aodwp(arwgtcC
2
whtSwlsAadaoat
(
The differences in distribution due to schooling within males (PIp = .009; absPI p = .045) and females (PI p = .065; absPI p = .039) weresimilar to those reported for the whole group. The moderatingeffect of age was not further explored because the oldest age group
R.H. Geuze et al. / Neurop
ith .896 for the asymmetry of hand skill index (SI) and .744 forbsolute SI (absSI).
Accuracy of throwing was measured with a tennis ball and aarget at a distance of 2.7 m for adults and 2 m for children under3y and for the few elderly lacking force. The subjects stood facinghe target hanging against a wall at 1.5 m height. The target had ahite center area (Ø 7 cm; score 50 points) and 4 concentric black
r white bands (width 2.8 cm each; scores: 40, 30, 20, 10 pointsespectively) on a black cloth (40 cm × 50 cm). The zero band wasssumed to be the adjoining band of 2.8 cm width. Subjects werenstructed to aim at the center target. The score of each throw wasbserved from a position just behind and slightly aside the partic-pant and noted on a scale of −50 to +50. If the ball landed outsidehe zero band the scores −50 to −10 were estimated by imagin-ng the landing position mirrored around zero onto the target area.ccasional landing positions further away than −50 (i.e. more than4 cm from the zero band) were scored −50. There were 5 trials perand.
.5. Analyses
.5.1. Hand preferenceDuring each of the 12 actions observed, left-hand use was scored
s −1, right-hand use as +1, and the use of both hands or a changef hand during the uni-manual task was scored as 0. In case ofoubt whether the task had been properly understood, the scoreas recorded as missing. Shooting the bow was not included in
he analyses because it was unfamiliar for the majority of theemales. The total score over all 11 tests was calculated. Item–restcore correlations clearly indicated that the ‘digging stick’ showeduch lower item–rest correlation (r = .093) than the other items
r = .51–.90). Factor analysis indicated that the 10 remaining itemsoaded on one factor, with 69% of variance explained (compared to1% reported by Corey et al. (2001) for a similar test in a US sample).
hand preference index (PI) representing hand preference basedn the remaining 10 items was calculated as the sum of scoresivided by the number of scores, resulting in −1 ≤ PI ≤ 1. In lineith some of the literature (e.g. Steenhuis & Bryden, 1999) handreference was also classified as extreme (PI = +1 or −1), strong−1 < PI ≤ −.8 or PI = + 8 ≤ PI < 1), weak (−.8 < PI ≤ -.5 or .5 ≤ PI < 8),nd ambidexter (−.5 < PI < .5). The absolute value of PI (absPI) rep-esenting the strength of hand preference independent of directionas also analyzed. Differences in distribution of PI between sub-
roups of the sample were tested with Kolmogorov-Smirnov Exactests (2-tailed). Posthoc, confidence intervals for proportions werealculated for the differences between the distributions (Agresti &oull, 1998).
.5.2. Mean hand skill and asymmetry of hand skillAs a measure of task skill the mean score of the two hands
as taken for each of the three tasks. The asymmetry between theands was expressed as an asymmetry of hand skill index (SI) suchhat positive values indicate better performance of the right hand:Ipegs = (L − R)/(R + L) and SI = (R − L)/(R + L) for the other two tasks,ith R and L representing the performance of the right and the
eft hand, respectively. Absolute values of SI (absSI) represent thetrength of relative asymmetry in performance between the hands.s the absolute values of the SI have left-skewed distributions, thebsSI values were transformed by 1/ln(absSI + .001) to a normalistribution, the constant added to prevent dividing by zero. Allnalyses with these transformed variables yielded an identical setf significant statistical results to those with untransformed vari-
bles. Because interpretation of non-transformed variables is moreransparent, we used the original absSI values in the analyses.A MANCOVA was used to analyze the effects of schoolingyes/no) and sex on the mean performance, SI and absSI of the three
logia 50 (2012) 612– 620 615
tasks, followed by ANOVA’s on separate tests scores. As age showeda quadratic relationship with skill and with skill asymmetrymeasures, age and age2 were entered as a covariate. Only the maineffects were included in the models as we had no predictions forany interaction.
In all analyses in which schooling was a factor the 32 subjectswho attended school for less than 1 year were excluded.
2.5.3. Relationships between hand preference and asymmetry ofhand skill
The relationships between the three SI measures were testedby Pearson correlations; the relation between hand preference andhand skill asymmetry measures by Spearman rank correlations.
3. Results
3.1. Hand preference
Mean PI (range −1 to +1) was .88 and 97.1% of subjects hada positive PI (right hand preference) and only 2.9% a negativePI (left hand preference) with CI’s respectively 94.1%–99.2% and1.8%–4.6%. Mean self-reported handedness was .92. Observed pref-erence was concordant with self-reported handedness in 95.6%of cases (2.4% reported to be left-handed but scored extremeright-handedness, .8% the other way around, 1% missing). The dis-tribution of the hand preference index in subgroups of schooling bysex is shown in Table 3. First the effects of age and sex are reportedas these may moderate the effect of schooling. The distributionsdiffered between men and women (Kz = .75, p = .046; absPI: Kz = .81,p = .023): males were more often extreme right-handed (88.5% vs82.5%) and less often weak to strong right-handed (7.3% vs 14.5%)than females.
The effect of age on hand preference was studied between 3 agegroups: children (5–17y, n = 242), younger adults (18–44y, n = 230)and older adults (45–70y, n = 148), representing more or less 3 gen-erations. The distributions of PI did not differ between the twoyounger age groups (Kz = .38; p = .34), but did between the adultgroups (Kz = 1.24; p = .001), and between the children and the olderadult group (Kz = 1.55; p < .0001). The differences were due to fewersubjects with extreme right-handedness and more with strongright-handedness (PI = .8) in the older adult group. Similar effectswere found for absPI (Kz = .47, p = .153; Kz = 1.25, p = .001; Kz = 1.64,p < .0001, respectively), which is no surprise as there were only veryfew left handers, making the PI and absPI almost similar. For theconfidence intervals (CI) of these differences, see Table 4.
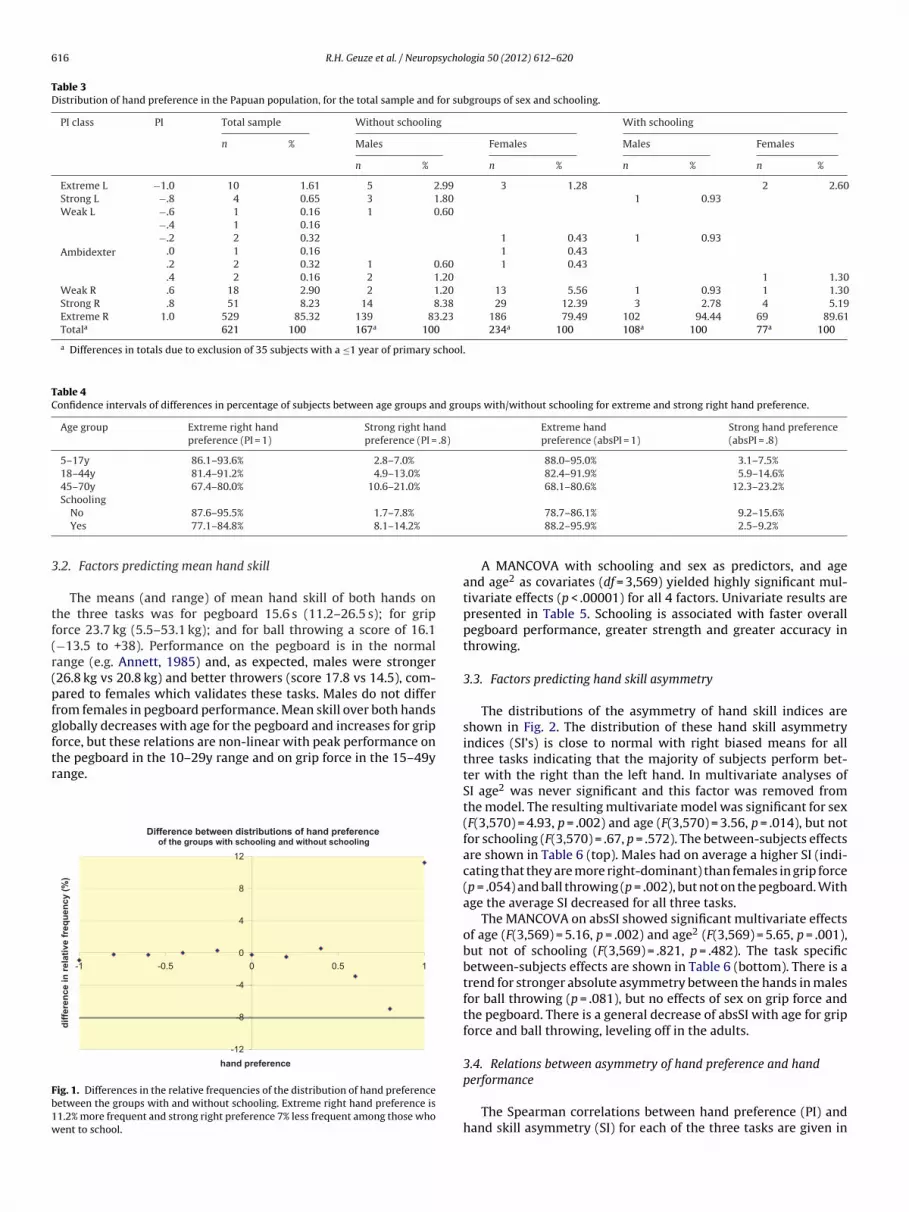
The effect of schooling on hand preference was tested com-paring the group that had at least 1 year of primary education(n = 185) with the group that never had education (n = 400). Thegroups differed on the PI (Kz = 1.26; p = .001). Subjects with school-ing compared to those without schooling were more often extremeright-handed and less often strong right-handed (see Table 4 andFig. 1). Like in the case of age effects, similar differences were foundfor absPI (Kz = 1.15, p = .001). Given the effect of sex on the dis-tribution the effect of schooling was compared within subgroups.
only had 17 subjects who had been to school, which is too few tocompare subgroups, and implies that age does not confound theeffect of schooling on the distribution of hand preference in oursample.
616 R.H. Geuze et al. / Neuropsychologia 50 (2012) 612– 620
Table 3Distribution of hand preference in the Papuan population, for the total sample and for subgroups of sex and schooling.
PI class PI Total sample Without schooling With schooling
n % Males Females Males Females
n % n % n % n %
Extreme L −1.0 10 1.61 5 2.99 3 1.28 2 2.60Strong L −.8 4 0.65 3 1.80 1 0.93Weak L −.6 1 0.16 1 0.60
Ambidexter
−.4 1 0.16−.2 2 0.32 1 0.43 1 0.93
.0 1 0.16 1 0.43
.2 2 0.32 1 0.60 1 0.43
.4 2 0.16 2 1.20 1 1.30Weak R .6 18 2.90 2 1.20 13 5.56 1 0.93 1 1.30Strong R .8 51 8.23 14 8.38 29 12.39 3 2.78 4 5.19Extreme R 1.0 529 85.32 139 83.23 186 79.49 102 94.44 69 89.61Totala 621 100 167a 100 234a 100 108a 100 77a 100
a Differences in totals due to exclusion of 35 subjects with a ≤1 year of primary school.
Table 4Confidence intervals of differences in percentage of subjects between age groups and groups with/without schooling for extreme and strong right hand preference.
Age group Extreme right handpreference (PI = 1)
Strong right handpreference (PI = .8)
Extreme handpreference (absPI = 1)
Strong hand preference(absPI = .8)
5–17y 86.1–93.6% 2.8–7.0% 88.0–95.0% 3.1–7.5%18–44y 81.4–91.2% 4.9–13.0% 82.4–91.9% 5.9–14.6%45–70y 67.4–80.0% 10.6–21.0% 68.1–80.6% 12.3–23.2%
3
tf(r(pfgftr
Fb1w
SchoolingNo 87.6–95.5% 1.7–7.8%
Yes 77.1–84.8% 8.1–14.2%
.2. Factors predicting mean hand skill
The means (and range) of mean hand skill of both hands onhe three tasks was for pegboard 15.6 s (11.2–26.5 s); for griporce 23.7 kg (5.5–53.1 kg); and for ball throwing a score of 16.1−13.5 to +38). Performance on the pegboard is in the normalange (e.g. Annett, 1985) and, as expected, males were stronger26.8 kg vs 20.8 kg) and better throwers (score 17.8 vs 14.5), com-ared to females which validates these tasks. Males do not differrom females in pegboard performance. Mean skill over both handslobally decreases with age for the pegboard and increases for grip
orce, but these relations are non-linear with peak performance onhe pegboard in the 10–29y range and on grip force in the 15–49yange.-12
-8
-4
0
4
8
12
10.50-0.5-1
diffe
renc
e in
rela
tive
freq
uenc
y (%
)
hand preference
Difference between distributions of hand preference of the groups with schooling and without schooling
ig. 1. Differences in the relative frequencies of the distribution of hand preferenceetween the groups with and without schooling. Extreme right hand preference is1.2% more frequent and strong right preference 7% less frequent among those whoent to school.
78.7–86.1% 9.2–15.6%88.2–95.9% 2.5–9.2%
A MANCOVA with schooling and sex as predictors, and ageand age2 as covariates (df = 3,569) yielded highly significant mul-tivariate effects (p < .00001) for all 4 factors. Univariate results arepresented in Table 5. Schooling is associated with faster overallpegboard performance, greater strength and greater accuracy inthrowing.
3.3. Factors predicting hand skill asymmetry
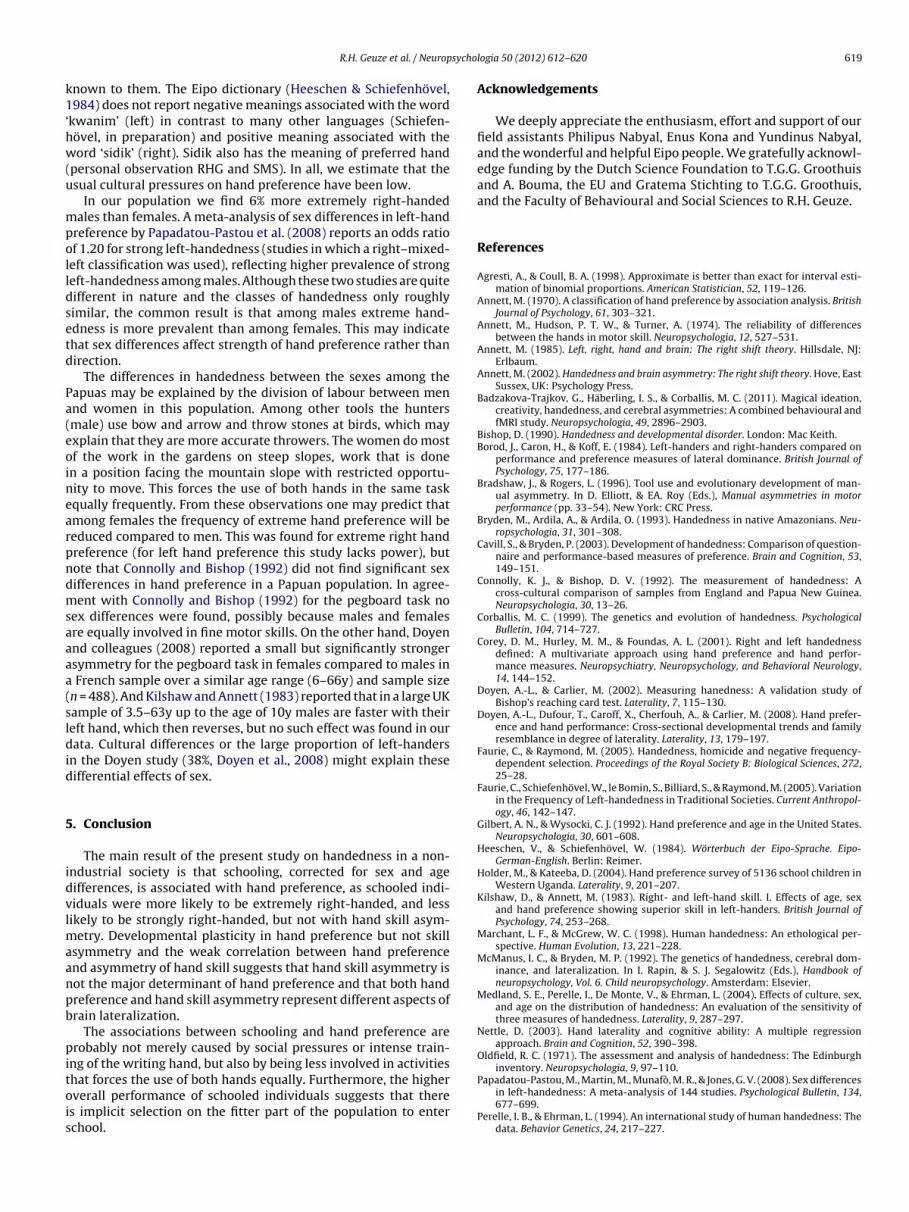
The distributions of the asymmetry of hand skill indices areshown in Fig. 2. The distribution of these hand skill asymmetryindices (SI’s) is close to normal with right biased means for allthree tasks indicating that the majority of subjects perform bet-ter with the right than the left hand. In multivariate analyses ofSI age2 was never significant and this factor was removed fromthe model. The resulting multivariate model was significant for sex(F(3,570) = 4.93, p = .002) and age (F(3,570) = 3.56, p = .014), but notfor schooling (F(3,570) = .67, p = .572). The between-subjects effectsare shown in Table 6 (top). Males had on average a higher SI (indi-cating that they are more right-dominant) than females in grip force(p = .054) and ball throwing (p = .002), but not on the pegboard. Withage the average SI decreased for all three tasks.
The MANCOVA on absSI showed significant multivariate effectsof age (F(3,569) = 5.16, p = .002) and age2 (F(3,569) = 5.65, p = .001),but not of schooling (F(3,569) = .821, p = .482). The task specificbetween-subjects effects are shown in Table 6 (bottom). There is atrend for stronger absolute asymmetry between the hands in malesfor ball throwing (p = .081), but no effects of sex on grip force andthe pegboard. There is a general decrease of absSI with age for gripforce and ball throwing, leveling off in the adults.
3.4. Relations between asymmetry of hand preference and hand
performanceThe Spearman correlations between hand preference (PI) andhand skill asymmetry (SI) for each of the three tasks are given in
R.H. Geuze et al. / Neuropsychologia 50 (2012) 612– 620 617
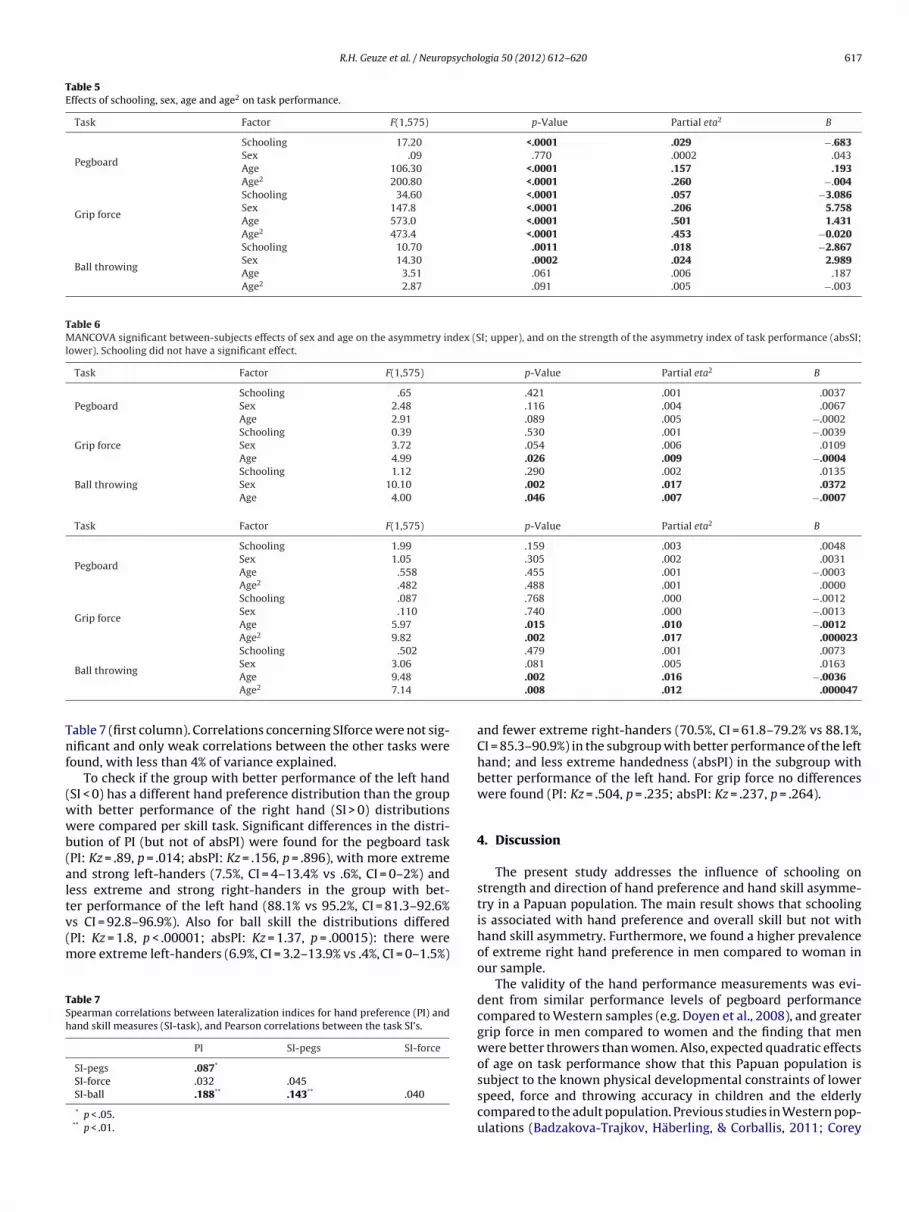
Table 5Effects of schooling, sex, age and age2 on task performance.
Task Factor F(1,575) p-Value Partial eta2 B
Pegboard
Schooling 17.20 <.0001 .029 −.683Sex .09 .770 .0002 .043Age 106.30 <.0001 .157 .193Age2 200.80 <.0001 .260 −.004
Grip force
Schooling 34.60 <.0001 .057 −3.086Sex 147.8 <.0001 .206 5.758Age 573.0 <.0001 .501 1.431Age2 473.4 <.0001 .453 −0.020
Ball throwing
Schooling 10.70 .0011 .018 −2.867Sex 14.30 .0002 .024 2.989Age 3.51 .061 .006 .187Age2 2.87 .091 .005 −.003
Table 6MANCOVA significant between-subjects effects of sex and age on the asymmetry index (SI; upper), and on the strength of the asymmetry index of task performance (absSI;lower). Schooling did not have a significant effect.
Task Factor F(1,575) p-Value Partial eta2 B
PegboardSchooling .65 .421 .001 .0037Sex 2.48 .116 .004 .0067Age 2.91 .089 .005 −.0002
Grip forceSchooling 0.39 .530 .001 −.0039Sex 3.72 .054 .006 .0109Age 4.99 .026 .009 −.0004
Ball throwingSchooling 1.12 .290 .002 .0135Sex 10.10 .002 .017 .0372Age 4.00 .046 .007 −.0007
Task Factor F(1,575) p-Value Partial eta2 B
Pegboard
Schooling 1.99 .159 .003 .0048Sex 1.05 .305 .002 .0031Age .558 .455 .001 −.0003Age2 .482 .488 .001 .0000
Grip force
Schooling .087 .768 .000 −.0012Sex .110 .740 .000 −.0013Age 5.97 .015 .010 −.0012Age2 9.82 .002 .017 .000023Schooling .502 .479 .001 .0073
Tnf
(wwb(altv(m
TSh
Ball throwingSex 3.06
Age 9.48
Age2 7.14
able 7 (first column). Correlations concerning SIforce were not sig-ificant and only weak correlations between the other tasks were
ound, with less than 4% of variance explained.To check if the group with better performance of the left hand
SI < 0) has a different hand preference distribution than the groupith better performance of the right hand (SI > 0) distributionsere compared per skill task. Significant differences in the distri-
ution of PI (but not of absPI) were found for the pegboard taskPI: Kz = .89, p = .014; absPI: Kz = .156, p = .896), with more extremend strong left-handers (7.5%, CI = 4–13.4% vs .6%, CI = 0–2%) andess extreme and strong right-handers in the group with bet-er performance of the left hand (88.1% vs 95.2%, CI = 81.3–92.6%
s CI = 92.8–96.9%). Also for ball skill the distributions differedPI: Kz = 1.8, p < .00001; absPI: Kz = 1.37, p = .00015): there wereore extreme left-handers (6.9%, CI = 3.2–13.9% vs .4%, CI = 0–1.5%)
able 7pearman correlations between lateralization indices for hand preference (PI) andand skill measures (SI-task), and Pearson correlations between the task SI’s.
PI SI-pegs SI-force
SI-pegs .087*
SI-force .032 .045SI-ball .188** .143** .040
* p < .05.** p < .01.
.081 .005 .0163
.002 .016 −.0036
.008 .012 .000047
and fewer extreme right-handers (70.5%, CI = 61.8–79.2% vs 88.1%,CI = 85.3–90.9%) in the subgroup with better performance of the lefthand; and less extreme handedness (absPI) in the subgroup withbetter performance of the left hand. For grip force no differenceswere found (PI: Kz = .504, p = .235; absPI: Kz = .237, p = .264).
4. Discussion
The present study addresses the influence of schooling onstrength and direction of hand preference and hand skill asymme-try in a Papuan population. The main result shows that schoolingis associated with hand preference and overall skill but not withhand skill asymmetry. Furthermore, we found a higher prevalenceof extreme right hand preference in men compared to woman inour sample.
The validity of the hand performance measurements was evi-dent from similar performance levels of pegboard performancecompared to Western samples (e.g. Doyen et al., 2008), and greatergrip force in men compared to women and the finding that menwere better throwers than women. Also, expected quadratic effectsof age on task performance show that this Papuan population is
subject to the known physical developmental constraints of lowerspeed, force and throwing accuracy in children and the elderlycompared to the adult population. Previous studies in Western pop-ulations (Badzakova-Trajkov, Häberling, & Corballis, 2011; Corey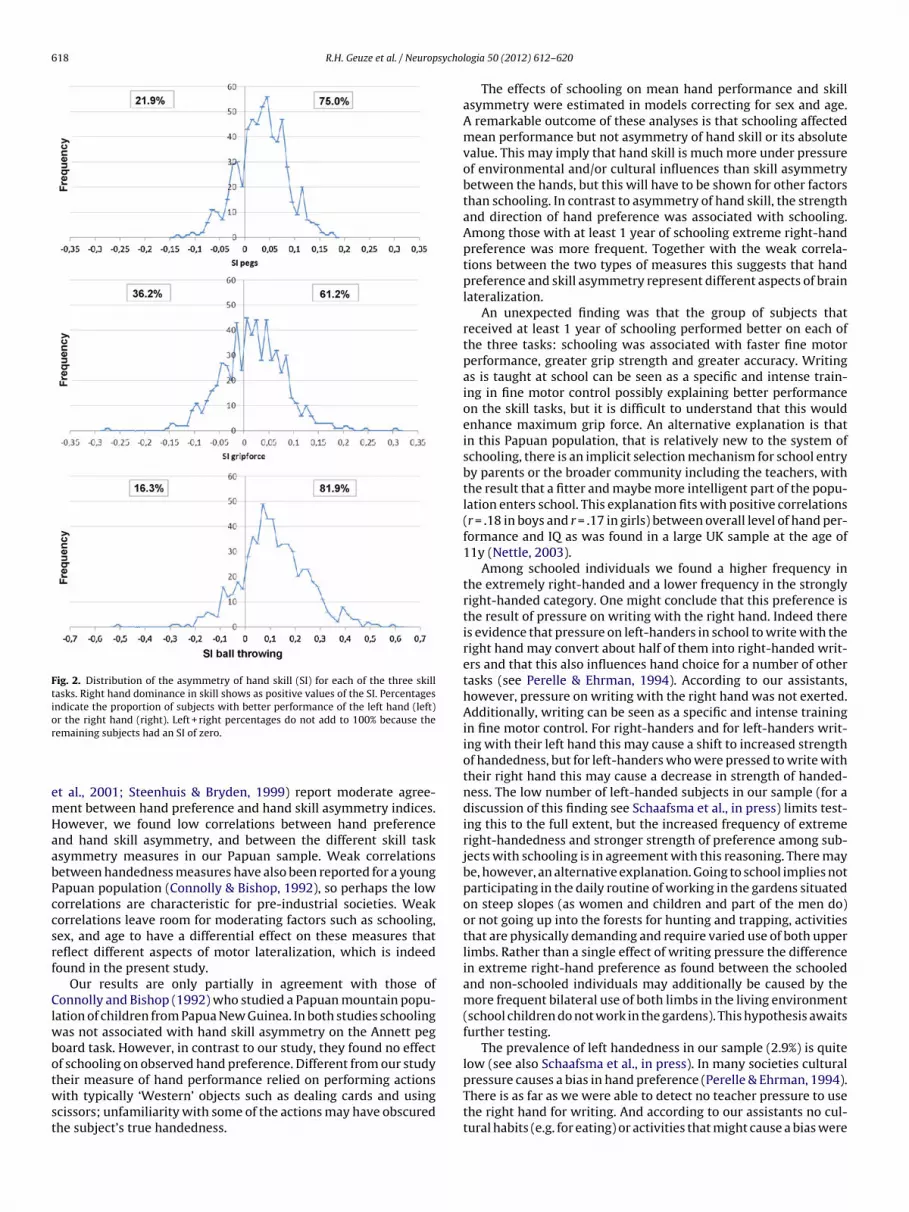
618 R.H. Geuze et al. / Neuropsycho
Fig. 2. Distribution of the asymmetry of hand skill (SI) for each of the three skilltasks. Right hand dominance in skill shows as positive values of the SI. Percentagesindicate the proportion of subjects with better performance of the left hand (left)or the right hand (right). Left + right percentages do not add to 100% because ther
emHaabPccsrf
Clwbotwst
pressure causes a bias in hand preference (Perelle & Ehrman, 1994).
emaining subjects had an SI of zero.
t al., 2001; Steenhuis & Bryden, 1999) report moderate agree-ent between hand preference and hand skill asymmetry indices.owever, we found low correlations between hand preferencend hand skill asymmetry, and between the different skill tasksymmetry measures in our Papuan sample. Weak correlationsetween handedness measures have also been reported for a youngapuan population (Connolly & Bishop, 1992), so perhaps the loworrelations are characteristic for pre-industrial societies. Weakorrelations leave room for moderating factors such as schooling,ex, and age to have a differential effect on these measures thateflect different aspects of motor lateralization, which is indeedound in the present study.
Our results are only partially in agreement with those ofonnolly and Bishop (1992) who studied a Papuan mountain popu-
ation of children from Papua New Guinea. In both studies schoolingas not associated with hand skill asymmetry on the Annett peg
oard task. However, in contrast to our study, they found no effectf schooling on observed hand preference. Different from our studyheir measure of hand performance relied on performing actions
ith typically ‘Western’ objects such as dealing cards and usingcissors; unfamiliarity with some of the actions may have obscuredhe subject’s true handedness.
logia 50 (2012) 612– 620
The effects of schooling on mean hand performance and skillasymmetry were estimated in models correcting for sex and age.A remarkable outcome of these analyses is that schooling affectedmean performance but not asymmetry of hand skill or its absolutevalue. This may imply that hand skill is much more under pressureof environmental and/or cultural influences than skill asymmetrybetween the hands, but this will have to be shown for other factorsthan schooling. In contrast to asymmetry of hand skill, the strengthand direction of hand preference was associated with schooling.Among those with at least 1 year of schooling extreme right-handpreference was more frequent. Together with the weak correla-tions between the two types of measures this suggests that handpreference and skill asymmetry represent different aspects of brainlateralization.
An unexpected finding was that the group of subjects thatreceived at least 1 year of schooling performed better on each ofthe three tasks: schooling was associated with faster fine motorperformance, greater grip strength and greater accuracy. Writingas is taught at school can be seen as a specific and intense train-ing in fine motor control possibly explaining better performanceon the skill tasks, but it is difficult to understand that this wouldenhance maximum grip force. An alternative explanation is thatin this Papuan population, that is relatively new to the system ofschooling, there is an implicit selection mechanism for school entryby parents or the broader community including the teachers, withthe result that a fitter and maybe more intelligent part of the popu-lation enters school. This explanation fits with positive correlations(r = .18 in boys and r = .17 in girls) between overall level of hand per-formance and IQ as was found in a large UK sample at the age of11y (Nettle, 2003).
Among schooled individuals we found a higher frequency inthe extremely right-handed and a lower frequency in the stronglyright-handed category. One might conclude that this preference isthe result of pressure on writing with the right hand. Indeed thereis evidence that pressure on left-handers in school to write with theright hand may convert about half of them into right-handed writ-ers and that this also influences hand choice for a number of othertasks (see Perelle & Ehrman, 1994). According to our assistants,however, pressure on writing with the right hand was not exerted.Additionally, writing can be seen as a specific and intense trainingin fine motor control. For right-handers and for left-handers writ-ing with their left hand this may cause a shift to increased strengthof handedness, but for left-handers who were pressed to write withtheir right hand this may cause a decrease in strength of handed-ness. The low number of left-handed subjects in our sample (for adiscussion of this finding see Schaafsma et al., in press) limits test-ing this to the full extent, but the increased frequency of extremeright-handedness and stronger strength of preference among sub-jects with schooling is in agreement with this reasoning. There maybe, however, an alternative explanation. Going to school implies notparticipating in the daily routine of working in the gardens situatedon steep slopes (as women and children and part of the men do)or not going up into the forests for hunting and trapping, activitiesthat are physically demanding and require varied use of both upperlimbs. Rather than a single effect of writing pressure the differencein extreme right-hand preference as found between the schooledand non-schooled individuals may additionally be caused by themore frequent bilateral use of both limbs in the living environment(school children do not work in the gardens). This hypothesis awaitsfurther testing.
The prevalence of left handedness in our sample (2.9%) is quitelow (see also Schaafsma et al., in press). In many societies cultural
There is as far as we were able to detect no teacher pressure to usethe right hand for writing. And according to our assistants no cul-tural habits (e.g. for eating) or activities that might cause a bias were
sycho
k1‘hw(u
mpolldsetd
Pa(eoinearpndmsaaaa(sldid
5
idvlmaanpb
pitois
R.H. Geuze et al. / Neurop
nown to them. The Eipo dictionary (Heeschen & Schiefenhövel,984) does not report negative meanings associated with the word
kwanim’ (left) in contrast to many other languages (Schiefen-övel, in preparation) and positive meaning associated with theord ‘sidik’ (right). Sidik also has the meaning of preferred hand
personal observation RHG and SMS). In all, we estimate that thesual cultural pressures on hand preference have been low.
In our population we find 6% more extremely right-handedales than females. A meta-analysis of sex differences in left-hand
reference by Papadatou-Pastou et al. (2008) reports an odds ratiof 1.20 for strong left-handedness (studies in which a right–mixed-eft classification was used), reflecting higher prevalence of strongeft-handedness among males. Although these two studies are quiteifferent in nature and the classes of handedness only roughlyimilar, the common result is that among males extreme hand-dness is more prevalent than among females. This may indicatehat sex differences affect strength of hand preference rather thanirection.
The differences in handedness between the sexes among theapuas may be explained by the division of labour between mennd women in this population. Among other tools the huntersmale) use bow and arrow and throw stones at birds, which mayxplain that they are more accurate throwers. The women do mostf the work in the gardens on steep slopes, work that is donen a position facing the mountain slope with restricted opportu-ity to move. This forces the use of both hands in the same taskqually frequently. From these observations one may predict thatmong females the frequency of extreme hand preference will beeduced compared to men. This was found for extreme right handreference (for left hand preference this study lacks power), butote that Connolly and Bishop (1992) did not find significant sexifferences in hand preference in a Papuan population. In agree-ent with Connolly and Bishop (1992) for the pegboard task no
ex differences were found, possibly because males and femalesre equally involved in fine motor skills. On the other hand, Doyennd colleagues (2008) reported a small but significantly strongersymmetry for the pegboard task in females compared to males in
French sample over a similar age range (6–66y) and sample sizen = 488). And Kilshaw and Annett (1983) reported that in a large UKample of 3.5–63y up to the age of 10y males are faster with theireft hand, which then reverses, but no such effect was found in ourata. Cultural differences or the large proportion of left-handers
n the Doyen study (38%, Doyen et al., 2008) might explain theseifferential effects of sex.
. Conclusion
The main result of the present study on handedness in a non-ndustrial society is that schooling, corrected for sex and ageifferences, is associated with hand preference, as schooled indi-iduals were more likely to be extremely right-handed, and lessikely to be strongly right-handed, but not with hand skill asym-
etry. Developmental plasticity in hand preference but not skillsymmetry and the weak correlation between hand preferencend asymmetry of hand skill suggests that hand skill asymmetry isot the major determinant of hand preference and that both handreference and hand skill asymmetry represent different aspects ofrain lateralization.
The associations between schooling and hand preference arerobably not merely caused by social pressures or intense train-
ng of the writing hand, but also by being less involved in activities
hat forces the use of both hands equally. Furthermore, the higherverall performance of schooled individuals suggests that theres implicit selection on the fitter part of the population to enterchool.logia 50 (2012) 612– 620 619
Acknowledgements
We deeply appreciate the enthusiasm, effort and support of ourfield assistants Philipus Nabyal, Enus Kona and Yundinus Nabyal,and the wonderful and helpful Eipo people. We gratefully acknowl-edge funding by the Dutch Science Foundation to T.G.G. Groothuisand A. Bouma, the EU and Gratema Stichting to T.G.G. Groothuis,and the Faculty of Behavioural and Social Sciences to R.H. Geuze.
References
Agresti, A., & Coull, B. A. (1998). Approximate is better than exact for interval esti-mation of binomial proportions. American Statistician, 52, 119–126.
Annett, M. (1970). A classification of hand preference by association analysis. BritishJournal of Psychology, 61, 303–321.
Annett, M., Hudson, P. T. W., & Turner, A. (1974). The reliability of differencesbetween the hands in motor skill. Neuropsychologia, 12, 527–531.
Annett, M. (1985). Left, right, hand and brain: The right shift theory. Hillsdale, NJ:Erlbaum.
Annett, M. (2002). Handedness and brain asymmetry: The right shift theory. Hove, EastSussex, UK: Psychology Press.
Badzakova-Trajkov, G., Häberling, I. S., & Corballis, M. C. (2011). Magical ideation,creativity, handedness, and cerebral asymmetries: A combined behavioural andfMRI study. Neuropsychologia, 49, 2896–2903.
Bishop, D. (1990). Handedness and developmental disorder. London: Mac Keith.Borod, J., Caron, H., & Koff, E. (1984). Left-handers and right-handers compared on
performance and preference measures of lateral dominance. British Journal ofPsychology, 75, 177–186.
Bradshaw, J., & Rogers, L. (1996). Tool use and evolutionary development of man-ual asymmetry. In D. Elliott, & EA. Roy (Eds.), Manual asymmetries in motorperformance (pp. 33–54). New York: CRC Press.
Bryden, M., Ardila, A., & Ardila, O. (1993). Handedness in native Amazonians. Neu-ropsychologia, 31, 301–308.
Cavill, S., & Bryden, P. (2003). Development of handedness: Comparison of question-naire and performance-based measures of preference. Brain and Cognition, 53,149–151.
Connolly, K. J., & Bishop, D. V. (1992). The measurement of handedness: Across-cultural comparison of samples from England and Papua New Guinea.Neuropsychologia, 30, 13–26.
Corballis, M. C. (1999). The genetics and evolution of handedness. PsychologicalBulletin, 104, 714–727.
Corey, D. M., Hurley, M. M., & Foundas, A. L. (2001). Right and left handednessdefined: A multivariate approach using hand preference and hand perfor-mance measures. Neuropsychiatry, Neuropsychology, and Behavioral Neurology,14, 144–152.
Doyen, A.-L., & Carlier, M. (2002). Measuring hanedness: A validation study ofBishop’s reaching card test. Laterality, 7, 115–130.
Doyen, A.-L., Dufour, T., Caroff, X., Cherfouh, A., & Carlier, M. (2008). Hand prefer-ence and hand performance: Cross-sectional developmental trends and familyresemblance in degree of laterality. Laterality, 13, 179–197.
Faurie, C., & Raymond, M. (2005). Handedness, homicide and negative frequency-dependent selection. Proceedings of the Royal Society B: Biological Sciences, 272,25–28.
Faurie, C., Schiefenhövel, W., le Bomin, S., Billiard, S., & Raymond, M. (2005). Variationin the Frequency of Left-handedness in Traditional Societies. Current Anthropol-ogy, 46, 142–147.
Gilbert, A. N., & Wysocki, C. J. (1992). Hand preference and age in the United States.Neuropsychologia, 30, 601–608.
Heeschen, V., & Schiefenhövel, W. (1984). Wörterbuch der Eipo-Sprache. Eipo-German-English. Berlin: Reimer.
Holder, M., & Kateeba, D. (2004). Hand preference survey of 5136 school children inWestern Uganda. Laterality, 9, 201–207.
Kilshaw, D., & Annett, M. (1983). Right- and left-hand skill. I. Effects of age, sexand hand preference showing superior skill in left-handers. British Journal ofPsychology, 74, 253–268.
Marchant, L. F., & McGrew, W. C. (1998). Human handedness: An ethological per-spective. Human Evolution, 13, 221–228.
McManus, I. C., & Bryden, M. P. (1992). The genetics of handedness, cerebral dom-inance, and lateralization. In I. Rapin, & S. J. Segalowitz (Eds.), Handbook ofneuropsychology, Vol. 6. Child neuropsychology. Amsterdam: Elsevier.
Medland, S. E., Perelle, I., De Monte, V., & Ehrman, L. (2004). Effects of culture, sex,and age on the distribution of handedness: An evaluation of the sensitivity ofthree measures of handedness. Laterality, 9, 287–297.
Nettle, D. (2003). Hand laterality and cognitive ability: A multiple regressionapproach. Brain and Cognition, 52, 390–398.
Oldfield, R. C. (1971). The assessment and analysis of handedness: The Edinburghinventory. Neuropsychologia, 9, 97–110.
Papadatou-Pastou, M., Martin, M., Munafò, M. R., & Jones, G. V. (2008). Sex differencesin left-handedness: A meta-analysis of 144 studies. Psychological Bulletin, 134,677–699.
Perelle, I. B., & Ehrman, L. (1994). An international study of human handedness: Thedata. Behavior Genetics, 24, 217–227.
6 sycho
P
R
R
S
S
20 R.H. Geuze et al. / Neurop
loeg, A. (2004). The German Eipo Research Project. Journal de la Société desOcéanistes, 118, 35–79.
aymond, M., Pontier, D., Dufour, A.-B., & Molier, A. P. (1996). Frequency-dependentmaintenance of left handedness in humans. Proceedings of the Royal Society B:Biological Sciences, 263, 1627–1633.
oy, E., Bryden, P., & Cavill, S. (2003). Hand differences in pegboard performancethrough development. Brain and Cognition, 53, 315–317.
chaafsma, S. M., Geuze, R. H., Riedstra, B., Schiefenhövel, W., Bouma, A., & Groothuis,T. G. G. Handedness in a non-industrial society challenges the fighting hypothesisas an evolutionary explanation of left-handedness. Evolution & Human Behavior,
in press.chiefenhövel, W. (1976). Die Eipo-Leute des Berglands von Indonesisch-Neuguinea: Kurzer Überblick über den Lebensraum und seine Menschen.Einführung zu den Eipo-Filmen des Humanethologischen Filmarchivs der Max-Planck-Gesellschaft. Homo, 26, 263–275.
logia 50 (2012) 612– 620
Schiefenhövel, W. (1991). Eipo. In T. E. Hays (Ed.), Encyclopedia of world cultures, Vol.II. Oceania (pp. 55–59). Boston: G.K. Hall & Co.
Schiefenhövel, W. (1997). Reactions to cultural change. Among the Eipo in the high-lands of West-New Guinea. Civilisations, 44, 220–227. Also in: Joiris, D. V., &Laveleye, D. (Eds.), Les peuples des forêts tropicales. Systèmes traditionelles etdéveloppement rural en Afrique équatoriale, grande Amazonie et Asie du sud-est(pp. 220–227). Guyot, Bruxelles
Steenhuis, R. E., & Bryden, M. P. (1999). The relation between hand preference andhand performance: What you get depends on what you measure. Laterality, 4,3–26.
Triggs, W. J., Calvanio, R., Levine, M., Heaton, R. K., & Heilman, K. M. (2000). Predictinghand preference with performance on motor tasks. Cortex, 36, 679–689.
Volkmann, J., Schnitzler, A., Witte, O. W., & Freund, H.-J. (1998). Handedness andasymmetry of hand representation in human motor cortex. Journal of Neuro-physiology, 79, 2149–2154.
Copyright © 2022 FDOKUMEN