Plasma Simulations and Multibunched Electron Beam Diagnostics
26
Progress of the Multibunch Progress of the Multibunch Plasma Wakefield Experiments Plasma Wakefield Experiments at ATF at ATF Themos Kallos Themos Kallos University of Southern University of Southern California California July 2006ad July 2006ad
Transcript of Plasma Simulations and Multibunched Electron Beam Diagnostics

Progress of the Multibunch Progress of the Multibunch Plasma Wakefield Experiments Plasma Wakefield Experiments
at ATFat ATFThemos KallosThemos Kallos
University of Southern University of Southern CaliforniaCalifornia July 2006adJuly 2006ad

Presentation OutlinePresentation Outline Theoretical MotivationTheoretical Motivation
Basic Principles of Multiple BunchesBasic Principles of Multiple Bunches Simulations of 45MeV eBeam into PlasmaSimulations of 45MeV eBeam into Plasma
Experimental AspectsExperimental Aspects CTR Diagnostics for Microbunched eBeamCTR Diagnostics for Microbunched eBeam Create bunches by selectively blocking eBeam Create bunches by selectively blocking eBeam Gas-Filled Capillary: The road to 10Gas-Filled Capillary: The road to 101919cmcm-3-3 plasma plasma densitydensity
The Double Bunch ExperimentThe Double Bunch Experiment Theoretical ModelTheoretical Model Comparison with Experimental DataComparison with Experimental Data

Principles of multiple Principles of multiple bunches into a Plasmabunches into a Plasma

Principles of multiple Principles of multiple bunches into a Plasmabunches into a Plasma

Principles of multiple Principles of multiple bunches into a Plasmabunches into a Plasma

Principles of multiple Principles of multiple bunches into a Plasmabunches into a Plasma

Principles of multiple Principles of multiple bunches into a Plasmabunches into a Plasma

Principles of multiple Principles of multiple bunches into a Plasmabunches into a Plasma

Principles of multiple Principles of multiple bunches into a Plasmabunches into a Plasma
Principles of multiple Principles of multiple bunches into a Plasmabunches into a Plasma

Principles of multiple Principles of multiple bunches into a Plasmabunches into a Plasma

Bunched VS Non-Bunched eBeamBunched VS Non-Bunched eBeamσσrr=75=75μμm, m, σσzz=1=1μμm Microbunchesm Microbunches
3.8 4 4.2 4.4 4.6
-1
0
1
2
3
x 1013 IFEL M icrobunched eBeam
eBeam Density [cm
-3]
Tim e [ps]

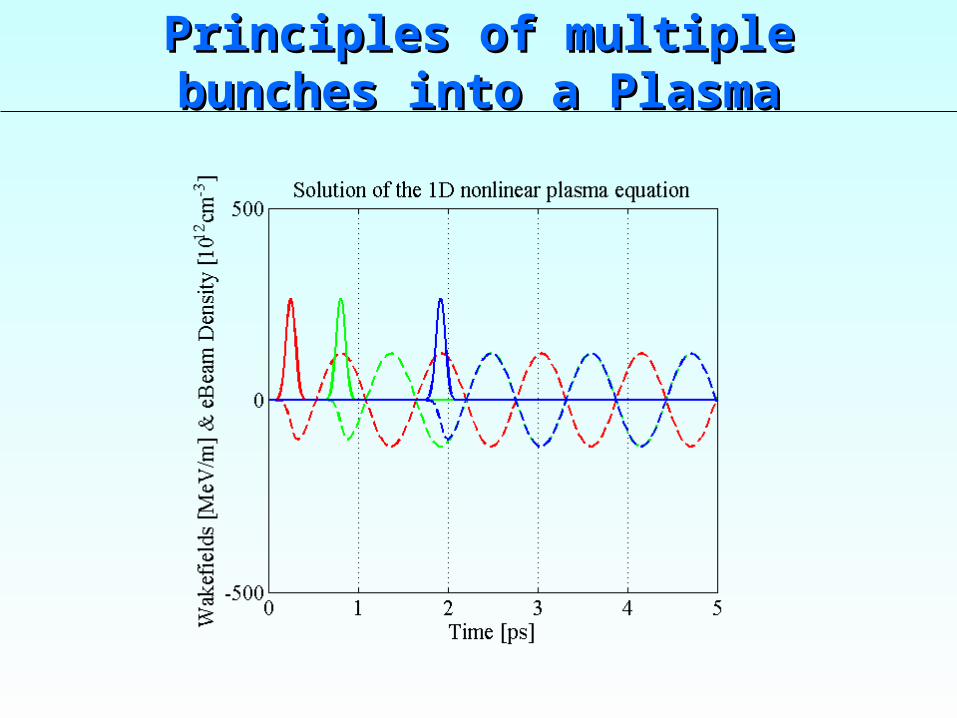
Theory & SimulationTheory & SimulationWakefield Evolution @65MeV – Resonant Case
The electron beam density x100 (1), the theoretical wakefield (2) and the Osiris simulated wakefield (3) after 1mm of propagation in the plasma. Units: 1=300 GeV/m
1 2
3
7GeV/m
Advantages of 1D Code
1000 times faster than 2D Osiris PIC Code
Allows fast plasma density scan
Insensitive to noise (allows longer runs, larger beams)

Predicted Energy SpreadPredicted Energy SpreadAfter 15mm in plasma

CapillaryPlasma
Wiggler
EnergyDiagnostic
np=1019 cm-3
Resonant for λp=10.6μmPpeak≈50MW
λ0=10.6μm, 200psLaser Beam
Experiment OverviewExperiment Overview
IFEL Wiggler
MicrobunchesIpeak≈600AIpeak≈100A
1500μm
45 MeV
Electron Beam
σr=75μm
10.6μm
Establish Microbunching (easy)Establish Microbunching (easy) Establish 10Establish 101919 Plasma Density Plasma Density (hard…)(hard…)

e-
e-
1μm Ti To energy
spectrograph
To plasma
eBeam DiagnosticseBeam DiagnosticsCoherent Transition RadiationCoherent Transition Radiation
Mirror
FocusingLens
IR Detector
22 2 21 forward
3 2 20
d E e sindkd 4 1 cos
k c 1
Beamline Window

eBeam DiagnosticseBeam DiagnosticsCTR Spectrum HarmonicsCTR Spectrum Harmonics
3.8 4 4.2 4.4 4.6
-1
0
1
2
3
x 1013 IFEL M icrobunched eBeameB
eam Density [cm
-3]
Tim e [ps]
FFT

0 0.5 1 1.5 2100
102
104
106
108
z of each microbunch [
m]
Ratio of CTR
harmonics
Ratio of CTR harmonics vs microbunching
Ratio of 1st/2ndRatio of 1st/3rdRatio of 2nd/3rd
Experiment Data Range
Coherent Transition Radiation Coherent Transition Radiation (CTR)(CTR)
DataData comparison with Theorycomparison with Theory
All 3 data sets agree around All 3 data sets agree around σσzz=0.7=0.7μμmm

Creating Microbunches Creating Microbunches By dispersing the eBeam Energy in spaceBy dispersing the eBeam Energy in space
At dispersion plane:At dispersion plane:
Ener
gy
(x)
Time
250μm125μm
1 microbunch every 30μm (15μm on CTR graph)
Energy Slit Clos es
Half the charge is blocked
CTR Interferom etry Signal for different Slit openings
0.4
0.5
0.6
0.7
0.8
0.9
1
1.1
14.1 14.15 14.2 14.25 14.3 14.35 14.4 14.45 14.5 14.55 14.6Single Arm Delay [m m ]
CTR Signal [normalize
d]
Narrow Slit Open Slit

The Plasma SourceThe Plasma Source Past and PresentPast and Present
Past: Ablative Polypropylene Past: Ablative Polypropylene CapillaryCapillary 20kV, 0.7kA Discharge20kV, 0.7kA Discharge 2.3*102.3*101818cmcm-3-3 Max Plasma Density Max Plasma Density
Now: HNow: H22 gas-filled gas-filled CapillaryCapillary 20kV, 1.8kA Discharge20kV, 1.8kA Discharge 5.0*105.0*101818cmcm-3-3 Max Plasma Max Plasma DensityDensity
Plasm a light during 20kV discharge
0
0.1
0.2
0.3
0.4
0.5
0.6
0.7
0.8
0.9
1
-100 100 300 500 700 900
Tim e after peak of m ain discharge [ns]
Norm
alize
d Ligh
t Intens
ity, D
isch
arge
Current
and Ha
Linew
idth [a
u]
FW HM of Ha Line [no back] Discharge Current
Com parison of Stark Broadening inside and outside the capillary20kV Voltage, 1.3kA Current
1.E+16
1.E+17
1.E+18
1.E+19
-200 0 200 400 600 800 1000 1200 1400Discharge Delay [ns]
Plasma De
nsity [cm^-3]
Inside O utside

Density with Laser InterferometryDensity with Laser Interferometry # of current oscillations dependence# of current oscillations dependence
eHeNe p 18
nk L N 2 1.2 10
The phase change introduced from The phase change introduced from the the
plasma is plasma is
Intereference Pattern, 1.3kA Discharge Trace and Plasm a Density 1 cycle = 1.2e18cc
-0.6-0.4-0.20
0.20.40.60.81
1.21.4
0 500 1000 1500 2000 2500Tim e [ns]
Interference Signal [V],
Discharge Cu
rrent and 1e18cc
Plasma Density
Interference Trace Discharge Current Plasm a Density 1e18cc
Intereference Pattern for sim ilar param eters1 cycle = 1.2e18cc
00.050.10.150.20.250.30.350.40.45
0 2000 4000 6000 8000 10000Tim e [ns]
Interference S
ignal [V]
Ideal Modulation Depth is 0.2V
1.28kA, 4 osc. 1.28kA, 6 osc. 1.28kA, 3 osc.

W akefield Evolution versus Tim e (5e16 cm ^-3 density)
-200
-150
-100
-500
50
100
150
200
0 1 2 3 4 5Tim e [ps]
eBeam Density [1e18 cm
^-3] and
Wakefield [M
eV/m
]
eBeam Density W akefield
Double Bunch Experiment Double Bunch Experiment 1D Model Prediction for Wakefield1D Model Prediction for Wakefield
61MeV59MeV

Double Bunch Experiment Double Bunch Experiment Energy Loss and GainEnergy Loss and Gain
Electron Energy (M eV)56 58 60 62 64
Spectrometer Output (arb. units)
0
20
40
60
80
100
120
W ith dischargeDelay = 1.6 s
Nodischarge
Electron Energy (M eV)56 58 60 62 64
Spectrometer Output (arb. units)
0
20
40
60
80
100
120W ith dischargeDelay = ~2 s
Nodischarge
Double Bunch Energy Loss Experim ent
-2-1.5-1
-0.50
0.51
1.52
-1.0 -0.5 0.0 0.5 1.0 1.5 2.0 2.5 3.0 3.5 4.0Discharge Delay [μs]
Energy Loss [MeV]
First Bunch Second Bunch Discharge Current

Double Bunch Experiment Double Bunch Experiment The 2The 2ndnd Bunch samples the wakefield of the Bunch samples the wakefield of the
firstfirst
Assume 5*1016cm-3 Plasma Density at 1μs
Double Bunch In Plasm a - 2nd Bunch DataCharge Ratio 300pC:150pC (1st Bunch:2nd Bunch)
-2-1.5-1
-0.50
0.51
1.52
1E+13 1E+14 1E+15 1E+16 1E+17 1E+18Plasm a Density [cm ^-3]
Energy
Los
s [M
eV]
2nd Bunch LossTheory (Peak W akefield)Theory(W akefield @ Peak of 2nd Bunch

Experimental Progress SummaryExperimental Progress Summary 10.610.6μμm m MicrobunchingMicrobunching confirmed confirmed
HeNe interferometryHeNe interferometry as a plasma density as a plasma density diagnostic is diagnostic is feasible feasible
Awaiting for a Awaiting for a new 5 kA capillarynew 5 kA capillary, aiming , aiming for 10for 101919cmcm-3-3 plasma density plasma density
The The wire meshwire mesh can seems to be creating can seems to be creating microbunches, microbunches, but will there be enough charge left? but will there be enough charge left?
Double BunchDouble Bunch experiment shows dependence on experiment shows dependence on plasma plasma density density

Thank you for Thank you for listening!listening!