Modification of light-acclimation of Pinus sylvestris shoot architecture by site fertility
Upload
independentCategory
view
3download
0
Forest Ecology and Management, 6 (1983) 307--31.7 307 Elsevier Science Publishers B.V., Amsterdam - - Printed in The Netherlands
P L A N T S P E C I E S C O V E R , F R E Q U E N C Y , A N D B I O M A S S : E A R L Y R E S P O N S E S T O C L E A R C U T T I N G , C H O P P I N G , A N D B E D D I N G I N P I N U S E L L I O T T I I F L A T W O O D S
LOUIS F. CONDE z , BENEE F. SWINDEL 2 and JOEL E. SMITH 3
Kalamazoo, MI 49009 (U.S.A.) Southeastern Forest Experiment Station, U.S. Department of Agriculture Forest
Service, Gainesville, FL 32611 (U.S.A.) 3 School o f Forest Resources and Conservation, University of Florida, GainesviUe, FL 32611 (U.S.A.)
(Accepted 20 January 1983)
ABSTRACT
Conde, L.F., Swindel, B.F. and Smith, J.E., 1983. Plant species cover, frequency, and biomass: early responses to clearcutting, chopping, and bedding in Pinus elliottii flatwoods. For. Ecol. Manage., 6: 307--317.
Pinelands in a 67 ha naturally-regenerated, mature flatwoods forest in north Flor ida were clearcut harvested in the fall of 1978, site prepared by double chopping and bed- ding, and planted to slash pine (Pinus eUiottii) in 1979. Three vegetation surveys were conducted; one prior to harvest in the summers of 1977 and 1978, and two subsequent to planting in the summers of 1980 and 1981.
Cover and frequency o f all plant species encountered were assessed on permanent transects. Foliage biomass by species was assessed by destructive sampling of dist inct subplots within permanent plots. The aim was to assess plant species cover, frequency, and biomass responses to the forest operat ions imposed.
Pine was eliminated as a dominant genus by harvesting, and planted pines were a minor component of the vegetat ion at 2 years of age. Previously dominant shrubs were reduced - - of ten by approximate ly one order o f magnitude. Indeed, woody species in general were greatly reduced; woody cover from 151% of surface area prior to har- vest to 26% 2 years after planting; woody biomass from 6927 to 675 kg/ha.
Conversely, herbaceous species were substantially increased: herbaceous cover from 47% of surface area prior to harvest to 50% 2 years after planting; herbaceous biomass from 203 to 1247 kg/ha. Thus, a predominant ly woody ecosystem was converted by forest operat ions to a predominant ly herbaceous one. Andropogon and Panicum were dominant genera for 2 years af ter planting.
Both plant species richness and diversity were increased by forest operat ions and both remained at a level above tha t of the natural stand for 2 years following planting.
INTRODUCTION
Th i s p a p e r is t h e f i r s t o f t w o r e p o r t i n g c l o s e l y r e l a t e d r e s e a r c h . I t de - s c r i b e s in g r e a t e r d e t a i l m o t i v a t i o n s f o r t h e r e s e a r c h , t h e s t u d y s i t e a n d
0378-1127/83/$03.00 © 1983 Elsevier Science Publishers B.V.

308
survey methods, and gives results from one of two concurrent experiments. The second paper will give results from the second experiment, and offer more general conclusions based on this and previously reported research.
Environmentalists, ecologists, and wildlife biologists express consid- erable concern for the effects of forest operations on native forest flora, especially in the very-intensively managed forests of the Lower Coastal Plain of the Southeastern United States. Large-scale forest operations that are common there -- clearcutting, site preparation, and planting -- are spectacularly destructive of natural stands. The concern is that native flora are jeopardized by plantation management which may so discriminate for a few preferred species and against a vast array of others (especially understory species) that many plants could become locally extinct. The feared consequence is that a rich native flora could, in time, be replaced by managed monocultures of preferred tree species, often slash pine (Pinus elliottii) in the Lower Coastal Plain. Concurrent concerns are that native animal species would also be endangered by the disappearance of their native habitat. Finally, geneticists, plant pathologists, and entomologists express apprehension over vulnerability of monocultures to devastation by pest epidemics.
Our aim is not to dismiss these concerns, but to objectively examine evidence on plant responses to intensive management practices in the most important forest type in the Lower Coastal Plain -- as expressed by plant species cover, frequency, and biomass measured immediately before har- vest and site preparation, and during the first and second summer after planting. Permanent transects were remeasured for cover and frequency. Adjacent biomass plots were harvested. The advantage of this approach is that it avoids the much greater variability inherent in simultaneous sur- veys of natural stands and various-aged plantations -- even assuming that such an array on similar sites and plantations treated alike Could be found. The disadvantage is that, even after 4 years, only the natural stand flora and plantation flora at 1 and 2 years of age are characterized -- so this is necessarily a somewhat preliminary report. Still, the most dramatic changes, namely, those at time of harvest and regeneration, are documented.
STUDY SITE
The study site is a 67-ha watershed, one of three contiguous experimen- tal watersheds in Bradford County, FL. Swindel et al. (1982a) described soils, topography, climate, and hydrology, and displayed an aerial photo- graph of these watersheds (their fig. 1). Prior to acquisition by Container Corporation of America, the watersheds were part of a large (24 000 ha) tract of open pineland (68%) and interspersed wooded swamps typical of Coastal Plain flatwoods. The pinelands had been frequently burned and heavily grazed by range cattle. With acquisition in 1938, Container Corporation instituted fire and cattle exclusion policies and seed tree forest

309
management. Recently, maturing pine stands on the tract have been con- vetted to plantations -- the study site pinlands were clearcut harvested, site prepared, and planted to slash pine in 1978--1979.
On the 67-ha watershed, pinelands comprised 49% of the watershed while a shallow, mixed pine and hardwood swamp occupied an interior 51% of the site. Natural stand vegetation in the pinelands consisted of an overstory (16 m2/ha basal area) of predominantly slash pine with oc- casional longleaf pine (Pinus palustris) and laurel oak (Quercus laurifolia). Midstory vegetation was dominated by gallberry (Ilex glabra and I. coria- cea) and saw-palmetto (8erenoa repens). Common understory plants were curtiss dropseed (8porobolus curtissii), panic (Panicum spp.) and bluestem (Andropogon spp.) grasses, and beakrushes (Rhynchospora spp.).
Vegetation in the interior swamp consisted of a mixed overstory of predominantly slash pine, cypress (Taxodium distichum), lobloUy bay (Gordonia lasianthus), blackgum (Nyssa sylvatica), and sweet bay (Mag- nolia virginiana). Fetterbush (Lyonia lucida) dominated the midstory; wax myrtle (Myrica cerifera), greenbriar (Smilax spp.), and myrtleleaved holly (Ilex myrtifolia) were also common. Chain fern (Woodwardia vir- ginica), beakrushes, pipeworts (Eriocaulon spp.), and yellow-eyed grasses (Xyris spp.) appeared commonly in the herb layer, and mosses (Sphagnum spp.) were common as ground cover.
SURVEY DESIGNS
Following isolation of the watershed in 1977 (by completion of a perim- eter forest road) a 100-m square grid was surveyed and permanently marked. Twenty-seven of the resulting grid points were randomly selected for per- manent transects (Fig. 1). Of four equiangular directions at each selected grid point, one was randomly discarded. Three 10-m transects (one in each of the remaining three directions) were surveyed beginning 10 m from the monumented grid point in the summer of 1977. All plant species in- tercepting a vertical projection of these transects were identified. The proport ion of each transect lying within vertically-projected crowns of all plants of each encountered species was recorded to the nearest dm as a measure of crown cover of that species. The proport ion of transects on which the species occurred at least once was taken as a measure of the frequency of that species (Brown, 1954). In making these observa- tions, care was exercised to walk parallel to the transects but not on them, in order not to trample vegetation prior to subsequent resurveys.
Additionally, nine 10 m X 10 m plots -- three within each of three major soil series [Stilson, Mascotte, Surrency (Swindel et al., 1982b)] - - w e r e randomly selected for destructive biomass determinations (Fig. 1). Each overstory tree rooted within these plots was severed as near the ground as practical with a chain saw and parti t ioned by hand into: (i) foliage; (ii) branches (wood and bark); and (iii) bole (wood and bark). Green weights

310
of these component parts were determined immediately in the field. Ran- dom subsamples of each component of each tree were dried to constant weight at 70°C, and the subsample dry-to-green-weight ratio was used to convert componen t green weights to dry weights. Biomass of midstory species: (i) foliage and (ii) stems were determined similary except only a 5 m X 5 m interior plot was harvested and individual plants of the same species were composited. Finally, total aboveground biomass of individ- ual understory species (herbaceous species and reproduction of woody species) was determined by harvesting and compositing five 1 m X 1 m sub- plots within each plot. Biomass sampling was conducted in the summers of 1977 and 1978.
N 0 I(")~m |
Fig. 1. Experimental watershed in f latwoods of Bradford County, Florida. Pinelands (unshaded) were regenerated in 1978--1979. Circles enclose transects surveyed for vegetative cover and frequency; squares are locations of b iomau plots.

311
TREATMENT
Subsequent to the initial surveys of cover, frequency, and biomass, pinelands of the watershed were clearcut harvested and site prepared by methods deemed to minimize destruction of residual vegetation, and soil and litter displacement, while permitting machine planting. In November and December 1978, all merchantable (~ 10 cm dbh) pine trees were felled, delimbed, sectioned, and stacked by hand for transport from the woods by a small (56 kW) rubber-tired tractor with hydraulic grapple and wood rack. Logging debris and residual vegetation were chopped with a roller drum chopper (Fisher, 1981) in April and again in August 1979. Planting beds were formed in September and October by a single pass of a bed- ding harrow (Fisher, 1981), and machine planted in November 1979 with a nominal 1,850 1-0 slash pine seedlings per ha (Fisher, 1981).
The interior swamp was not disturbed (Fig. 1).
RESURVEYS
In the summers of 1980 and 1981, those 26 transects and six biomass plots within the harvested area were twice resurveyed. Surveys for species cover and frequency along the transects were conducted exactly as in 1977. Of course, harvesting and site preparation removed or destroyed the over- story and midstory so that both the 1980 ~nd 1981 biomass surveys were conducted as the 1977--1978 understory sampling -- with only minor modification, namely, four 1 m × 2 m subplots per plot were harvested in 1980 and four I m × 1.5 m subplots per plot were harvested in 1981.
Admittedly, there could have been some pretreatment response on the subplots due to the removal of the overstory in summer biomass harvesting in 1977--1978 prior to the November--December 1978 operational tree harvest. But, the effects of creating a 10 m × 10 m opening prior to harvest in an already irregular canopy was subjectively judged to be probably small if not negligible compared to harvest and site preparation effects, and, in any event, preferable to the increased variation introduced by different microsites that would have attended the alternative, namely, moving the biomass plots. Locations of subplots were moved within the plots so as not to coincide with locations of previously harvested subplots.
RESULTS AND DISCUSSION
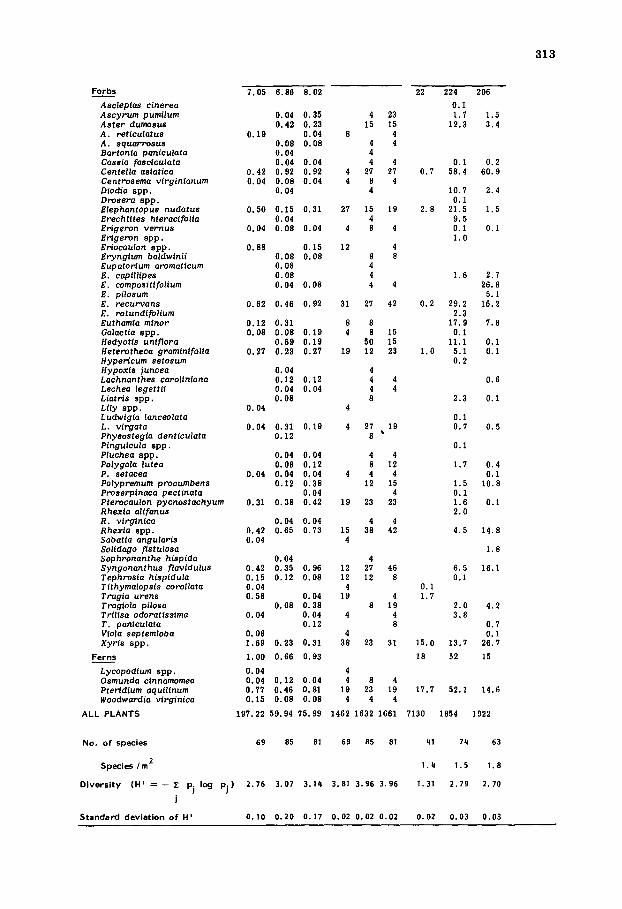
All plant species encountered on either the transects or biomass plots are listed by life form in Table I. [Notice that we occasionally use the word "species" (singular) to refer to several species of the same genus which were not differentiated.] Cover, frequency, and foliage biomass as measured in the 1977--1978, 1980, and 1981 surveys are all tabled for each species identified.

312
Table I. Plant species cover, frequency, and foliage biomess before (1977-78} and after (1980- 1981} clearcutting, chopping, bedding, and planting in flatwoods forests of north Florida.
Cover Frequency Foliage biomass Life form and species '77 '80 '81 '77 '80 '81 '77-78 '80 t81
(percent) (percent) (kg/ ho) WOODY SPECIES 150.55 20.41 25.78 6927 473 675
Trees 67.72 1.93 3.66 5112 12 33
Gordonia lasianthus O. 42 8 l lex cassine 0.42 0.04 0.23 8 4 4 I. myrtifolia 0.81 0.04 0.08 12 4 8 1 Magnolia virginiana O. 08 4 Nyssa sylvotica 3.15 1.54 1.92 8 4 4 13 Persea pa lus t~s 1.38 0.04 O. 27 23 4 8 10 P lnus elliottii 57.15 0.27 0.58 96 23 35 4786 12 22 P. palustris 2.00 12 279 Quercus lout|folio 2.27 O. 46 12 4 34 Q, nigra O. 04 O. 12 4 4
Shrubs 81.45 18.36 21.82 1811 436 634
Aronia arbutifolia 0.19 0.15 0.88 8 12 19 22.6 14.6 Asimino pygmaea 0.50 0.08 0.04 19 8 4 2.0 0,1 0.6 Azalea spp . 0.04 4 Befarla racemosa O. 04 4 Gaylussocla dumosa 1.73 0.38 0.73 38 31 35 9.7 4.7 2.4 G. frondosa 3.77 1.12 1.54 42 42 35 55.5 7.8 8.7 Hyperieum brachyphyl lum 0.04 0,15 0.73 4 12 23 1.7 8,1 H. cistifolium 0.15 8 10.1 9.1 H. myrttfolium 0.15 0.31 15 12 0.1 3.8 1.1 Hypevtcum spp . O. 15 12 O. 1 l lex coriacea 9.50 1,12 1.27 48 31 27 90.1 15.9 38.5 I. glabra 29.58 7.65 7.54 92 88 96 822.0 263.5 391.6 l ieu virg~ntco 1,7 Kolmio hirsuta O. 08 O. 04 8 4 O, 1 O. 1 Lyonia ferr~ginea 0.58 0.15 0.31 35 8 19 12.7 1.2 L. lucida 4.46 0.42 0.69 23 19 19 2.9 13.6 11.8 MyPtca cePtfera 4.38 0.46 0.58 42 23 23 241.2 7.5 8.9 Quercue mimima 0.23 0.12 0.35 4 12 15 3 .9 Q. pumila 0.88 0.50 0.35 31 8 4 3.9 Rubus spp . 0.38 2.88 2.23 19 38 38 0.3 10.0 65.1 Serenoa repens 15.38 1.15 1.19 62 50 42 479.4 40.5 40.0 Vaeclnium fuscutum 4.81 0.35 0.81 31 23 27 7.2 15.1 0.4 V. myrsini tee 4.88 1.38 2.08 81 54 65 78.7 17.9 33.3
.Vines 1.38 0.12 0.30 4 25 8
Gelsemium semperv lrens 2.3 23.1 8.1 Rhus radlcans 2.1 Smilax s p p . 1.0 O. 2 O. 1 Vitis rotundifolia O. 5
HERBACEOUS SPECIES 203 1381 1247
Grasses 148 917 960
Amphicarpum muhlenbergianum 7.3 3.1 Andropogon capilltpes 4.1 207.7 292.5 Andropogon s p p . 2.9 162.9 230.5 Artst ida lanoso A. spiciformis A. s t r l c t o A. virgata Ctenium spp . Panicum rhizomatum Ponlcum spp . Paspalum spp . Sorghostrum secundum Sporobolus curt issi i
Grasslikes
Carex app. Cyperus app . Eleooharls s p p . Flmbristyl is autumnalis F. puberula Juncus s p p . Rhynchoepora spp . Sclerlo baldwinil S. retlcularis Sclerta s p p .
0.15 0.12 0.15 8 12 15 1.23 0.15 12 8
46.67 39.53 50.21
35.66 27.66 39.25
0.27 0.77 12 15 2.69 5.15 13.62 31 92 92 4.12 2.69 4.81 58 92 85 5.31 0.31 1.50
0.08 0.31 8 23 1.62 0.42 0.46 27 12 19 1.04 0.23 0.19 23 19 12 0.15 8
O. 08 0.35 8 23 3.73 15.69 15.08 54 100 100 0.85 1.08 0.62 35 54 35 O. 27 0.04 8 4
15.88 1.62 1.54 58 38 35
2.96 4.35 2.01
0.19 0.08 4 4 0.12 12
0.19 8
0.08 4 0.15 0.08 15 8
2.96 3.12 1.58 50 88 73 0.23 0.08 8 8 O. 38 27 0.08 4
15 15 19 120.0 12.1 80.2 1.7 4.7
12.4 2.4 1.0 13.5 15.7
6 .0 7.0 480.4 308.9 0,2 16.1 2.0
0.6 13.0 16.0
15 188 66
0.1 5.9
26.3 1.8 2.5
4.6 15.3 139.8 61.7
8.2 2.6 0.2
313
Forbs
Asclepias cinerea Ascyrum pumilum Aster dumosus A. reticulatus A. equarresue Bartonia paniculate Cassia faseiculata Centella asiatica Centresema virginianum Diodia s p p . Drosera s p p . Elephentopue nudatus Erechtltes hieracifolia Er'igeren remus Erigeron spp. Eriocaulon s p p . Eryngium baldwinii Eupatorium aromaticum E. capillipes E. compositifolium E. pilosum E. recur'vans E. rotundifolium Euthamia m i n o r Galactic s p p . Hedyotie unfflora Heteretheca greminifolia Hypertcum setosum Hypoxis ~unesa Lachnanthes caroliniana Lechea lsgettii Liatrls spp. Lily s p p . Ludwlgia lanceolata L. virgata Phyeostegia denticulata Pinguieula s p p . Pluchea s p p . Polygala lutea P. setacea Polypremum procumbens Proserpinaca pectineta PtePocaulon pycnostachyum Rhexia alifanus R. virginica Rhexia s p p . Sabatia angularis Solidago fistulosa Sophronanthe hispida Syngonanthus flavidulus Tephrosia hispidula Tithymalopsis corollate Tregia urens Tragiola pilosa Trilisa odoratissima T. paniculate Viola septemloba X y r i s a p p .
Ferns
Lycopodium s p p . Oemunda cinnamomea Ptertdium aquilinurn Woodwardia virginica
ALL PLANTS
No. o f species
Species /m 2
Divers i ty (H' = -- Z pj log p j )
J
Standard deviation o f H ~
7.05 6 ,86 8 .02
0.04 0 .35 4 23 0 .42 0 .23 15 15
0 .19 0.04 8 4 0 .08 0 .08 4 4 O. 04 4 0.04 0.04 4 4
0 .42 0 .92 0.92 4 27 27 0 .04 0 .08 0 .04 4 8 4
0 .04 4
0.50 0.15 0.31 27 15 19 0.04 4
0 .04 0 .08 0.04 4 8 4
O. 88 O. 15 12 4 0.08 0.08 8 8 0.08 4 O. 08 4 0.04 0.08 4 4
0.82 0.46 0.92 31 27 42
0.12 0.31 8 8 0.08 0.08 0.19 4 8 15
0 .69 0 .19 50 15 0 .27 0 .23 0.27 19 12 23
O. 04 4 0.12 0.12 4 4 O. 04 0 . 0 4 4 4 0.08 8
O. 04 4
0 .04 0.31 0 .19 4 27 19 0 .12 8 •
O. 04 0 .04 4 4 0.08 0 .12 8 12
0 .04 0 .04 0.04 4 4 4 0 .12 0 .38 12 15
0.04 4 0.31 0 .38 0 .42 19 23 23
0.04 0 .04 4 4 0 .42 0 .65 0.73 15 38 42 O. 04 4
O, 04 4 0.42 0,35 0.96 12 27 46 0.15 0,12 0.08 12 12 8 O. 04 4 0 .58 0.04 19 4
0.08 0.38 8 19 O. 04 O. 04 4 4
0.12 8 O. 08 4 1.69 0.23 0.31 38 23 31
1.00 0.66 0.03
O. 04 4 0 .04 0.12 0.04 4 8 4 0 .77 0 .46 0.81 19 23 19 0 .15 0 .08 0 .08 4 4 4
197.22 59.94 75.09 1462 1632 1661
69 85 81 69 85 81
2.76 3.07 3.1q 3.81 3.96 3.96
0.10 0.20 0.17 0.02 0.02 0.02
0. I 1.7
15.0
18
17.7
7130
41
1.q
1.31
O. 02
22 224 206
0 .1 1 .7 1.5
12.3 3 .4
0.1 0 .7 58.4
10.7 0 .1
2 .8 21.5 9 .5 0.1 1 .0
0 .2 60 .9
2 .4
1 .5
0.1
1 .6 2 .7 26.8
5.1 0 .2 29.2 16.2
2.3 17.9 7 .8
0.1 11.1 0 .1
1 ,0 5 .1 0.1 0 .2
2 .3
0.1 0 .7
0 .1
1 .7
1.5 0 .1 1 .6 2 .0
4 .5
6 .5 0 . I
2 .0 3 . 8
13.7
52
52.1
1854
7q
1.5
2 .79
0 .03
0 .6
0.1
0 .5
0 .4 0.1
10,8
0 .1
14.8
1 .8
16.1
4 .2
0 .7 0 .1
26.7
15
14.6
1922
63
1.8
2.70
0.03
3 1 4
Of course, clearcutting and removal of pine trees eliminated these spe- cies as dominant plants on the clearcut site. Thus, foliage biomass of slash pine was reduced from an estimated 4786 kg/ha in 1977--1978 to 12 kg/ha in 1980. In general, tree and shrub species were reduced by forest oper- ations (Table I); vines, grasses, grasslikes, forbs, and ferns were all increased by these operations.
Immediate changes (1980 vs. 1977--1978) induced by forest operations: woody species
All measured responses (cover, frequency, biomass) show the general diminution of woody species with forest harvest and site preparation. The dimunition is most consistently expressed in reduced crown cover. Woody crown cover (sum of cover of all tree, shrub, and vine species) diminished from 151 to 20% of surface area; woody foliage biomass was reduced from 6927 to 473 kg/ha (Table I). Dominant shrubs (gallberry, saw-palmetto) were substantially reduced (roughly by one order of mag- nitude).
Immediate changes (1980 vs. 1977--1978) induced by forest operations: herbaceous species
Although herbaceous cover was slightly reduced by forest operations (from 47 to 40% of surface area) and the frequency response was incon- clusive, herbaceous biomass increased substantially: from 203 to 1381 kg/ha (Table I). This increase was fairly consistent over all species so that a forest community was converted by clearcutting and site preparation into a herb<lominated community.
Collective community response to forest operations: species richness and diversity
Of course, clearcutting and site preparation reduces the amount of veg- etation in a forest. In our experiment, total crown cover was reduced from 197 to 60% of surface area, and total foliage biomass from 7130 to 1854 kg/ha (Table I). Characterization of the composition of a plant community is conventionally made via assessments of species richness and diversity (Pielou, 1975), and so compositional changes induced by forest operations may be assessed via these statistics. And, as Pielou (1975) indicated, in- dices of diversity are as applicable to various measures of abundance, such as cover and biomass, as to counts of numbers of individuals.
On our transects, 69 species were discovered prior to treatment - - 85 speices subsequent to treatment. In the (independent) survey of biomass, 41 species were discovered on the plots prior to treatment -- 74 species after treatment. Some of the increase in number of species on the bio-

315
mass plots should be attributed to the larger area surveyed in 1980 -- but not all of it. For the number of species, S, in an area of size A, is widely found to be empirically described by the relation:
S = CA z (I)
and z almost always lies in the range of 0.25 to 0.35 (Poole, 1974, p. 380). Taking z = 0.35 as the fastest likely increase in S as A is increased by 60% (as in the 1980 biomass survey), S would be expected to increase by 18% or less, i.e., to no more than about 48 species in 1980 compared to 41 in 1977--1978, if only variation in area surveyed were involved. More- over, intuition and the relation (1) dictate a decline in the number of spe- cies per unit area surveyed as the area surveyed is increased under uniform conditions. Instead, the number of species per unit area in our surveys increased [from 1.4/m 2 in 1977--1978 to 1.5/m 2 in 1980 (Table I)]. Thus, both our transect data, which are directly comparable, and our biomass data -- discounted for variable plot size -- clearly indicate that an imme- diate effect of clearcutting, chopping, and bedding in a mature, naturally- regenerated flatwoods forest is an increase in species richness.
The most widely applied measure of species diversity is that of Shannon (Shannon and Weaver, 1949), namely, the negative sum over all species of the product of the proportion, pj, of the ]-th species and the logarithm of p1 , that is:
H' ffi -- ~. pj logpj (2) J
Shannon's measure of diversity of cover increased with forest operations from 2.76 in 1977 to 3.07 in 1980; f requency diversity increased from 3.81 to 3.96; and biomass diversity increased f rom 1.31 to 2.79 (Table I). Collectively, the evidence is strong that species diversity, as well as richness, increases with clearcutting, chopping, and bedding in flatwoods forests.
Successional changes (1981 vs. 1980)following forest operations: woody species
In the 2nd year, woody crown cover recovered from 20 to 26% of sur- face area, and the recovery was fairly consistent over all species. Woody foliage biomass recovered from 473 to 675 kg/ha, but was less~consistently measured, part ly due to the necessary movement of biomass subplots. The planted slash pine was not ye t a dominant species by any measure of abundance; crown cover was less than 1% of surface area and foliage biomass comprised little more than 1% of the total (Table I).

316
Successional changes (1981 vs. 1980) following forest operations: herbaceous species
In the 2nd year, herbaceous cover recovered (from 40 to 50% of sur- face area), that is, to its pretreatment level and more. Herbaceous biomass declined slightly (from 1381 to 1247 kg/ha), but the dominance of her- baceous species continued in the 2nd year. In 1981, the dominant genera, as measured by cover and frequency, were Panieum and Andropogon. As measured by biomass, the dominant genera were Andropogon, Ilex (woody), and Panicum (Table I).
Community succession following forest operations: species richness and diversity
A general vegetative recovery was evident the 2nd year following forest operations. Total crown cover increased, from 60 to 76% of surface area. And total foliage biomass increased, from 1854 to 1922 kg/ha (Table I).
Compositional changes were less certain. Number of species declined, from 85 to 81 on the transects, and from 74 to 63 on the biomass plots (Table I). By a simple computat ion analogous to the one above, not all the latter decline would be expected based solely on smaller biomass plot size in 1981. Thus, both surveys suggest that species richness began to decline in 1981. Cover diversity increased slightly (from 3.07 to 3.14), frequency diversity was unchanged (at 3.96), and foliage biomass diver- sity declined slightly (from 2.79 to 2.70) in 1981 (Table I). Thus, no 2nd year trends in species diversity were evident. However, both species rich- ness and diversity were sustained at levels clearly above that of the natural stand into the 2nd year following forest operations (Table I).
SUMMARY AND CONCLUSIONS
Pinelands within an operational (67 ha) naturally-regenerated flatwoods watershed were clearcut harvested, double chopped, bedded, and planted to slash pine. Vegetative surveys conducted before harvest and in 2 suc- cessive years following planting revealed the following.
Woody species (cover, frequency, and biomass) were greatly reduced by forest operations, but began to recover in the 2nd year following plant- ing. Shrubs important in the natural stands (gallberry, palmetto) were reduced roughly by an order of magnitude. Pine was eliminated by har- vesting as a dominant genus. Planted pines at 2 years of age were a minor component of the vegetation.
Herbaceous species (especially the biomass response) were substantially increased by forest operations. No simple trends in the 2nd year were evident, but herbaceous species dominated the site in both the 1st and 2nd year following planting (whether assessed via cover, frequency, or biomass). Andropogon and Panicum were especially abundant genera.

317
Species richness (woody and herbaceous species collectively) was in- creased by forest operations. Number of species apparently began to de- cline the 2nd year following planting, but remained well above that of the natural stand.
Species diversity was increased by forest operations and remained el- evated into the 2nd year following planting.
Second year trends were, of course, small compared to changes induced at harvest, and could be obscured by other sources of variation, for ex- ample, year-to-year differences in weather. Indeed, the year between the 1980 and 1981 surveys was unusually dry (Swindel et al., 1982a). Still, the following conclusions seem assurred.
Clearcutting, chopping, bedding, and planting natural flatwoods forests converts a woody ecosystem into a herb~iominated one. Plant species richness and diversity are initially increased. As the planted pines mature they will again dominate the site. Assessing this ascendancy and its effects on other species, including herbs, and associated trends in species rich- ness and diversity, are worthy subjects for research, which is continuing.
REFERENCES
Brown D., 1954. Methods of surveying and measuring vegetation. Bull. 42, Common- wealth Bureau of Pastures and Field Crops, Hurley, Berks., 223 pp.
Fisher, R.F., 1981. Productivity in Florida's third forest. J. For., 79: 613--615. Pielou, E.C., 1975. Ecological Diversity. Wiley, New York, NY, 165 pp. Poole, R.W., 19"]4. An Introduction to Quantitative Ecology. McGraw-Hill, New York,
NY, 532 pp. Shannon, C.E. and Weaver, W., 1949. The Mathematical Theory of Communication.
University of Illinois Press, Urbana, IL, 11"I pp. Swindel, B.F., Lassiter, C.J. and Riekerk, H., 1982a. Effects of clearcutting and site
preparation on water yields from slash pine forests. For. Ecol. Manage., 4 (2): 101-- 113.
Swindel, B.F., Conde, L.F., Smith, J.E. and Hollis, C.A., 1982b. Green weights of major tree species in north Florida pine flatwoods. South. J. Appl. For., 6 (2): 74--'/8.
Copyright © 2022 FDOKUMEN