Analyses of plant diversity in a sacred grove of Puddukottai ...
Upload
independentCategory
view
0download
0
Journal of Applied Ecology
2004
41
, 1065–1079
© 2004 British Ecological Society
Blackwell Publishing, Ltd.
Plant diversity in a managed temperate deciduous forest: understorey response to two silvicultural systems
GUILLAUME DECOCQ*, MICHAËL AUBERT†, FREDERIC DUPONT‡, DIDIER ALARD†§, ROBERT SAGUEZ*, ANNIE WATTEZ-FRANGER*, BRUNO DE FOUCAULT‡, ANNICK DELELIS-DUSOLLIER‡ and JACQUES BARDAT¶
*
Département de Botanique, Université de Picardie Jules Verne, 1 rue des Louvels, F-80037 Amiens Cedex, France,
†
Laboratoire d’Ecologie, UPRES-EA 1293, Université de Rouen, F-76821 Mont Saint-Aignan Cedex, France,
‡
Département de Botanique, Université de Lille 2, 3 rue du Professeur Laguesse, BP 83, F-59006 Lille Cedex, France,
§
INRA Centre de Toulouse, UMR 1201 DYNAFLOR, BP 27, F-31326 Castanet Tolosan Cedex, France, and
¶
Institut d’Ecologie et de Gestion de la Biodiversité, Service du Patrimoine naturel, Muséum national d’Histoire Naturelle, 57 rue Cuvier, F-75231 Paris Cedex 5, France
Summary
1.
Disturbances and resource availability are key factors affecting plant diversity in managedforests. As disturbance regimes vary among silvicultural systems and may simultaneouslyaffect different types of resources, effects on biodiversity can be unpredictable.
2.
We compared the effects of two silvicultural systems on understorey plant diversity,including species composition, structural attributes and functional organization. Onehundred and thirty-five phytosociological relevés were sampled from 27 forest standsmanaged under either a traditional coppice-with-standards (CWS,
n
= 12) or a ‘close-to-nature’ selective cutting system (SC,
n
= 15), over similar edaphic conditions. Import-ant environmental factors affecting vegetation were deduced using Ellenberg indicatorvalues. Structural diversity was described using traditional indices of
α
and
β
diversity.Guilds were defined within the local pool of species using a set of 14 traits and their rela-tionship with silviculture was assessed using correspondence analysis.
3.
Post-logged CWS stands share some compositional and structural characteristicswith selectively cut stands, including high species richness and a dominance of earlysuccessional species. However the species pool for all coppicing areas was higher thanfor selectively cut areas, suggesting that the high disturbance frequency occurring in thelatter may progressively eliminate the most sensitive species.
4.
Functional diversity strongly differs between the two systems. Although it is con-served through the silvicultural cycle in the coppice-with-standards system, some guildswere lacking in selectively cut stands. The most negatively impacted guilds were tree andshrub saplings, prostrated ruderals, shade-tolerant perennials and vernal geophytes.The latter two comprise ‘true forest species’ which may also be considered as ‘coppicing-maintained species’. To reach the same values of guild richness (i.e. number of guilds) orredundancy (i.e. proportion of the maximal species richness within each guild), largerareas were required in SC compared with CWS systems.
5.
In the SC system, the high proportion of light reaching the forest floor induced aspectacular spread of blackberries
Rubus fruticosus
agg., which decreased speciesrichness. It also caused shifts in guild composition: graminoids and ferns grew stronglyto the detriment of true forest species.
6.
Synthesis and applications
. Our results suggest long-term negative effects of selectivecutting on both structural and functional plant diversity, compared with coppice-with-standards. Cutting intervals are shorter than recovery times, so that early successionalspecies-dominated communities are maintained. Vernal geophytes and shade-tolerant
Correspondence: Guillaume Decocq, Département de Botanique, Université de Picardie Jules Verne, 1 rue des Louvels, F-80037Amiens Cedex, France (e-mail
; fax +33 322827 469).

1066
G. Decocq
et al.
© 2004 British Ecological Society,
Journal of Applied Ecology
,
41
, 1065–1079
perennials seem to be limited by the frequency of disturbance rather than by the severityof disturbance. We conclude that, from a biodiversity point of view, this ‘close-to-nature’system does not cope with the objective of sustainable forest management. The rotationscurrently in use do not match natural disturbances very closely and are applied to amanaged system rather than a natural forest. Retaining remnants of old coppice woodsand extending rotations to at least 50 years are recommended where biodiversity con-servation is a goal of forest management.
Key-words
: biodiversity, disturbance regime, forest management, plant functional types,redundancy, resource availability, true forest species.
Journal of Applied Ecology
(2004)
41
, 1065–1079
Introduction
The mechanisms controlling biodiversity in differentecosystems are outlined by the current theory of spe-cies richness which considers disturbance and resourceavailability as key factors for structuring plant com-munities (e.g., Grime 1979; Huston 1979; Denslow 1980;Brown 1981; Giller 1984; McIntyre, Lavorel & Trémont1995; Begon, Harper & Townsend 1996). As forestmanagement consists of a complex of anthropogenicdisturbances (Picket & White 1985; Van der Maarel1993), it should be a key factor in explaining plantdiversity in managed forests. For example, thinningusually induces an increase in both solar radiation atthe forest floor (Ford & Newbould 1977) and availablewater and mineral nutrients, through formation ofroot gaps (Parsons, Knight & Miller 1994) and stimula-tion of mineralization (Bauhus 1999). These increasedresources have often been reported to enhance com-petitive exclusion among species, which results in adecline in plant species diversity (Huston 1979; Tilman1984; Wilson & Tilman 1993). This mechanism is muchdebated as many authors have found a positive rela-tionship between productivity (i.e., gross primary pro-ductivity, often estimated from limiting resources likelight, water or nutrients for example) and species rich-ness, supporting the species-energy theory (Coleman
et al
. 1982; Rosenzweig 1995). One cause of this con-troversy is probably the variability of the spatial andecological scales at which patterns are detected (Grace1999; Waide
et al
. 1999). Moreover, the vegetationresponse to increasing habitat productivity mightdepend on the type of the resource added. For example,an increase in solar radiation at the forest floor usuallyincreases species richness (Nash Suding 2001), whilefertilization is often associated with a decline in plantdiversity (Tilman 1987). Since forest management maysimultaneously modulate the availability of differenttypes of resource (e.g., light, water and soil nutrients), theireffects on biodiversity are likely to be quite unpredictable.
Biodiversity has often been considered as a structuralcommunity attribute, in terms of species richness andderived informational indices (Samuels & Drake 1997).These indices are scale dependent (Palmer 1994) and
consider all species as equivalent, reducing their abilityto assess the ecological mechanisms affecting biodiver-sity (Huston 1994). It is therefore important to takeinto account the compositional and functional dimen-sions of biodiversity (Noss 1990). Species differ in theirsusceptibility to disturbances, depending on particularlife-history traits and strategies, such as regeneration,growth or dispersal (Grime 1979; Grubb 1985; Lavorel
et al
. 1997; McIntyre
et al
. 1999).Managing forests in ways that sustain biodiversity
and ecosystem functioning has become a major challengefor modern forestry (Hunter 1999; Bengtsson
et al
.2000; Lindenmayer, Margules & Botkin 2000). New silvi-cultural systems have emerged during recent decades,based on the assumption that diversity patterns andecological processes are more likely to persist if dis-turbances occurring through management mimic thepatterns and processes of natural disturbances (Franklin1989; Gillis 1990; Mitchell, Palik & Hunter 2002). InEuropean temperate forests, natural disturbance regimeshave become an exception, since most forests havebeen managed throughout human history. In the 19thcentury, many forests were managed as coppice-with-standards or single coppice and some were high forestsharvested tree-by-tree (Oldeman 1990). As a consequence,long-term effects of forest management on forest com-position and diversity are expected. The current forestflora may be adapted to ‘fit’ the human-induced dis-turbance regime imposed for nearly two millennia.European temperate forests are characterized by a richunderstorey, including herbs, undershrubs and shrubs(Whittaker 1965; Crawley 1986; Halpern & Spies 1995).Observations conducted in the last remnants of Cen-tral European primeval temperate forests, as well as innatural reserves, suggest that natural dynamics mainlyconsist of small-scale disturbances associated with theformation of canopy gaps, soil pits and mounds (Falinski1986; Oldeman 1990; Schnitzler 2002). In the smallestgaps, no new establishment occurs, but neighbouringhigh tree crowns expand laterally into the open space.Transient heliophilic species originating from seed banksor seed rain may establish in the understoreys beforecanopy closure. If the gap exceeds a critical size, a newsuccession would start involving light-demanding trees

1067
Plant diversity in managed forests
© 2004 British Ecological Society,
Journal of Applied
Ecology, 41, 1065–1079
(e.g.,
Populus tremula
,
Salix caprea
and
Betula
spp.) inthe earliest stage. The climax forest is thus consideredas a mosaic of pioneer, mature and senescent patches,including small clearings (Oldeman 1990). Newerselective-cutting systems have been developed to mimicnatural small-scale gap dynamics, using a tree-by-treeharvesting method. The associated moderate thinningis expected to promote understorey species diversity,which was found to decrease under the heavy thinningperformed in many high forest systems (Alaback &Herman 1988; Reader, Taylor & Larson 1991). How-ever, studies supporting this idea reported qualitativedata without statistical support (see Thomas
et al
. 1999).Moreover, most published studies concern managedforests in North America, where forest history andtraditions differ radically from Europe. Finally, thefunctional organization of species assemblages has beenrarely taken into account (see Graae & Sunde 2000 foran exception).
Our study compared two silvicultural systems, ‘tradi-tional’ coppice-with-standards (CWS) versus ‘close-to-nature’ selective cutting (SC), to assess their positiveand negative effects on understorey diversity in a tem-perate deciduous forest. These two systems are widelyapplied throughout Western and Central Europe. Theycan be viewed as two complexes of anthropogenicdisturbances that differ in frequency ( higher in SC thanin CWS), severity (stronger in CWS than in SC) andspatial extent (larger in SC than in CWS). In particular,we test the hypothesis that SC has more beneficialeffects on plant diversity than CWS.
Methods
The study was conducted in Le Nouvion forest in theAisne department, France (50
°
00
′
N, 3
°
50
′
E, 180–220m altitude). It is a former royal forest which has existedsince ancient times. The climate is suboceanic with anaverage annual temperature and precipitation of 9·1
°
Cand 950 mm, respectively. The geological substrate con-sists of cretaceous marls and clays (Turonian), largelycovered by a few metres-deep layer of quaternary loesscontaining a high clay content. Soils are leached brownearths with a moderate internal drainage (Luvisolaccording to the FAO classification). The vegetationconsists of a temperate deciduous forest affiliated to the
Querco roboris–Carpinetum betuli
Tüxen 1930 phyto-sociological association (Decocq 1998). The dominanttree species in the area is oak,
Quercus robur
L
.
, whichis often associated with hornbeam
Carpinus betulus
L.,ash
Fraxinus excelsior
L. and sycamore
Acer pseudopla-tanus
L. The forest was managed as hornbeam coppicewith oak standards (CWS) from the mid-17th to the late20th century. This system had several disadvantages,such as a reduction of shade tree species (e.g.,
Fagussylvatica
), a promotion of woody species able to regen-erate from stumps (e.g.,
Carpinus betulus
and
Corylus
avellana
) and adverse effects on soil properties (e.g.,strong soil compaction and a rise in the level of thewatertable). Moreover it was considered to be unsus-tainable because some phases of the natural cycle weremissing and ageing coppices were less and less able toregenerate. Thus, wood production was progressivelydecreasing. Hence, most of the forest was convertedinto a selective cutting system (SC) at the end of the1970s. SC was expected to be closer to the natural cyclebecause it mimics small-gap natural dynamics with atree-by-tree harvesting method that preserves both thestructural complexity and the woody species diversity.In SC, pre-commercial thinning treatments are con-ducted every 4 years (partial extraction of coppicewood: shrub species and unsuitable tree species at
c.
23 m
3
ha
−
1
) and commercial felling every 8 years (selec-tive cutting of individual mature trees at
c.
10 m
3
ha
−
1
).CWS was maintained in some parts of the forest. InCWS, commercial felling occurs every 30 years, includ-ing the extraction of the whole coppice timber andthree quarters of the standards at
c.
200 m
3
ha
−
1
. Theretained fourth quarter consists at least of 80, 40, 15and 5 trees ha
−
1
of 30, 60, 90 and 120 year-old trees,respectively. The size of the stands was on average 20 hain SC and 8·5 ha in CWS. Herbivore pressure on forestvegetation is mainly due to roe deer
Capreolus capreolus
which was the only ungulate present on the site. Popu-lation density reaches 30 individuals per 100 hectareson average.
Our sampling procedure was designed to record en-vironmental variation due to silviculture rather than to sitevariability. All the forest stands included in this studywere located in similar abiotic conditions, characterizedby the same substrate ( loess, thickness exceeding 5 m)and topographic position (plateau), all the soils beinghaplic luvisol according to the World Reference Base.By comparing the composition and diversity of under-storey vegetation under different silvicultural systemswithin similar abiotic conditions, we should be able toidentify relationships between understorey plant diver-sity and silviculture and to identify functional responsegroups (Lavorel & Garnier 2002). A permanent blockwas randomly placed within the selected stands, con-sisting of a square 400 m
2
core plot, replicated at thefour cardinal points, giving one block of five plots perstand. The distance between the centre of the four rep-licates and the core plot was 50 m. Blocks were placedat a minimum distance of 10 m from forest roads, clear-ings, etc., to minimize edge effects. Characteristics ofthe 27 stands are reported in Table 1. CWS stands(
n
= 12) represented all stages of the coppice cycle, frompost-logged to mature stands. Two ageing CWS stands(i.e. stands which had not been logged for
c
. 50 years)were also included. For SC, the 15 stands were submittedto regular thinning every 4 years and felling ( logging)every 8 years.

1068
G. Decocq
et al.
© 2004 British Ecological Society,
Journal of Applied Ecology
,
41
, 1065–1079
Vegetation surveys and other measurements wereconducted during periods of peak vegetation cover(May–August) from 1999 to 2001. Vascular plants wereassigned to one or more layers based on height: ( i) treelayer, including woody species > 8 m; (ii) shrub layer,including woody species from 2 m to 8 m high; ( iii) sub-shrub layer, including woody species from 0·5 m to 2 mhigh; and (iv) herb layer, including all species < 0·5 m.Cover-abundance of vascular plant species into eachplot was visually estimated in the field as the verticallyprojected area using the Braun-Blanquet scale (1964).The total cover of each layer was estimated as a per-centage of the total plot area. Nomenclature of speciesfollows Lambinon
et al
. (1992).
The floristic relevés were analysed separately for eachof the three understorey vegetation layers following therecommendations of Whittaker (1965) and an earlierstudy (Decocq 2002). Environmental effects on vegeta-tion were investigated using Ellenberg indicator valuesfor light (L), soil moisture (F), soil nutrient (N) and soilreaction (R) (Ellenberg
et al
. 1991). Cover-abundancevalues were transformed according to the ordinal scaleproposed by Van der Maarel (1979) and expressed asweighted averages. This approach offers an alternativeto direct field measurements for defining site charac-
teristics and is easily applicable (e.g. Ter Braak & Wiertz1994; Ertsen, Alkemade & Wassen 1998). For CWS,successional patterns were investigated using the follow-ing age classes: 2 years (
n
= 5), 4 years (
n
= 5), 15 years(
n
= 5), 25 years (
n
= 15), 29 years (
n
= 20) and 50 years(
n
= 10).
Structural diversity
Diversity was measured using three indices: (i) speciesrichness (S), calculated as the total number of speciespresent in the relevé; (ii) Shannon index of diversity(H
′
) calculated as
H
′
=
−Σ
p
i
log
2
p
i
,
where p
i
= C
i
/
Σ
C
i
and C
i
, the mean percentage cover ofspecies
i
, was estimated in the field, and
Σ
C
i
is the sumof all cover values included in the relevé; ( iii ) PielouEquitability index (J
′
) calculated as
J
′
= H
′
/ log
2
S,
where H
′
and S are the values as calculated above.We used Spearman rank correlations (
P <
0·05) toinvestigate the relationships between structural attributes(S, H
′
, J
′
and vegetation cover) and mean Ellenbergindicator values for all the relevés. Vegetation heterogeneity
Table 1. Characteristics of the forest-stands included in the survey
CodeSilvicultural system
Basal area (m2 ha−1)
Mean diameter (cm)
Sprout/total stems ratio
Time since last logging (years)
B8 CWS 16·2 34·2 0·10 4B9 CWS 9·3 28·9 0·22 2B11 CWS nm nm nm 30B12 CWS nm nm nm 29B13 CWS 23·2 27·6 0·55 27B14 CWS 23·0 31·5 0·45 25B24 CWS 22·9 29·7 0·38 28E27a CWS 22·8 26·3 0·50 24E27b CWS 24·6 27·9 0·37 24C5 CWS 19·1 29·0 0·30 15E0 ageing CWS 17·0 32·2 0·22 c. 50T0 ageing CWS 22·2 31·8 0·43 c. 50M14 SC 22·0 29·7 0·33 4M15 SC nm nm nm 4M10a SC 14·8 28·7 0·39 3M10b SC 13·0 29·8 0·29 3M25a SC 12·3 29·6 0·26 4M25b SC 22·3 28·9 0·38 4M30 SC 15·9 28·8 0·23 2M31 SC 18·1 33·2 0·12 2F22 SC 17·5 31·4 0·43 4F23 SC 17·9 36·9 0·29 4C17 SC 18·2 28·8 0·31 8C18 SC 19·1 29·6 0·46 8C22 SC 20·7 33·0 0·28 8C38 SC 20·1 25·8 0·27 8P48 SC 22·2 31·5 0·36 8
Structural data relate to ≥ 15 cm-d.b.h. stems. Sprout/total stems ratio gives the proportion of stems which have regenerate from stumps. CWS, coppice-with-standards system; SC, selective cutting system; nm, not measured.

1069
Plant diversity in managed forests
© 2004 British Ecological Society,
Journal of Applied
Ecology, 41, 1065–1079
was investigated both at the stand scale, i.e. within eachblock, and at the landscape scale, i.e. within parts of theforest submitted to a uniform silvicultural system,using two indices: (i) Whittaker’s index, calculated as
β
= BSt/(S – 1), where BSt is the total species richnessof a block and S the average richness of its constituentplots (intra-block diversity) or as
γ
= TSt/(BSt – 1),where TSt is the cumulative sample richness of the blocksunder a uniform silvicultural system and BSt the averagerichness of its constituent stands (intra-treatment diversity);(ii) community index of Sørensen, calculated as CI = 2a/(b + c), where a is the number of common species betweenthe two samples, b and c the number of species in eachof the two samples assessed. Inter-plot similarity wasmeasured for each block by averaging Sørensen indicesbetween all pairs of 400 m
2
plots. Inter-block similarityis derived from a table of similarity between all pairs of2000 m
2
blocks within each silvicutural treatment.Results are expressed as mean
±
standard deviation.Means and variance were tested for difference betweenthe two silvicultural systems using a Mann–Whitneytest and a Fischer-Snedecor test, respectively (
P <
0·05).Statview® software (Abacus Concepts, Inc., Berkeley,CA, USA) was used for all statistical analyses.
Functional organization
Investigations were restricted to the herb layer becausethis supports the major part of species diversity and isalso less affected by forest management than woodylayers (Whittaker 1965; Crawley 1986; Halpern & Spies1995; Decocq 2000). We first defined plant functionaltypes (PFTs) as the species present in all samples. Forthis purpose a set of 14 traits obtained from the literaturewas chosen for comparative purposes with other similarstudies (Barkman 1988; Grime, Hodgson & Hunt 1988;Graae & Sunde 2000). All species were described interms of these 14 traits (see Appendix S1 in Supplemen-tary Material) and the data matrix (73 species
×
14traits) was submitted to both Correspondence Analysis(CA) and Hierarchical Clustering (HC, Ward’s methodon relative Euclidean distances) to identify PFTs, usingADE-4 software (Thioulouse
et al
. 1997). The optimalPFT number was determined through visual inspec-tion of the cluster dendrogram and the CA diagrams.These PFTs were labelled according to their mostdiscriminant traits. Finally, to investigate effects of sil-viculture on the distribution of PFTs, a data matrix(135 relevés
×
10 PFTs) was constructed. A new CA wascarried out on the average of the mean percentage coverof each species of a PFT. A Chi square test (
P <
0·05)was used to determine the relationship between a silvi-cultural system and a PFT, on both presence–absenceand cover–abundance data.
Two attributes of functional diversity were evaluatedat the 400-m
2
plot level and at the 2000-m
2
block level(i.e. the cumulated plots of a block). As the size of ablock largely exceeds the minimal area of this kind ofherbaceous understorey community (Decocq 1998), the
cumulative species list was considered representative ofthe whole forest herbaceous community. PFT richnesswas measured as the total number of PFTs present inthe sample area. Redundancy was approximated withineach PFT as the number of species of a PFT present inthe sample area divided by the total specific richness ofthis PFT. This simple measure follows previous studieswhich consider that within a PFT the species performsimilar roles in ecosystem functioning (e.g. Walker,Kinzig & Langridge 1999). Redundant species couldthus be lost with minimum impact on ecosystem pro-cesses, but are necessary to ensure ecosystem resilienceto perturbation (Walker
et al.
1999; Wellnitz & Poff2001). Comparison between the treatments was doneby means of a Mann–Whitney test (
P <
0·05) usingStatview® software.
Results
Environmental factors
We found a significant positive correlation betweenthe light value and the cover of the shrub and subshrublayers. This increased cover was associated with anincrease of S and H′ only at the shrub layer level. Theincreased light value had little influence on S and H′ atthe herb layer level and did not correlate with herbcover (Table 2). There was no correlation between soilmoisture and vegetation cover or any structural features.We found contrasting responses of vegetation coverand structural diversity to the variations in soil nutrientlevels, depending on the vegetation layer considered.While structural attributes of diversity of both the shruband the subshrub layers were at most only poorly asso-ciated with changes in soil nutrient levels, soil nutrientlevels were positively correlated with S and H′, as wellas with the vegetation cover within the herb layer.
Comparison between the two silvicultural systems
No significant difference was found between the twosilvicultural systems in the shrub layer, despite signi-ficant differences for light and water resources. Thisindicated a difference in species composition, ratherthan in shrub cover or diversity. Values of inter-blocksimilarity suggest that SC blocks tended to be morehomogeneous at the landscape scale (Table 3).
The highest cover values for the undershrub layer wererecorded in SC stands, but they were associated withthe lowest values for diversity and equitability, due tothe strong competitive dominance of Rubus fruticosusagg. A larger area was required within a SC stand to findthe same number of species as that within CWS stands.
Herb layer cover was significantly higher in CWSstands, which were characterized by a higher richnessbut a lower equitability than the SC stands. Within the

1070G. Decocq et al.
© 2004 British Ecological Society, Journal of Applied Ecology, 41, 1065–1079
CWS, there were consistent increases in herbaceousspecies richness and decreases in dominance phenomena,in response to thinning (Fig. 1). Conversely, within theSC pool, species richness remained quite constant andno phenomenon of dominance occurred.
It must be stressed that standard deviation andextreme values of the different attributes of diversitywere almost always broader for CWS stands comparedwith SC ones. This corresponded to a higher variabilityof vegetation from one stand to another within the CWSpool and thus to a greater heterogeneity at the land-scape scale, whatever the vegetation layer considered.Indeed, diversity seemed to vary as a function of standage and species composition shifted gradually duringstand development (Fig. 1). Species richness was high-est in post-logged CWS stands and then progressivelydecreased with stand age. Both vegetation cover andequitability reached a peak in 15-year-old stands, andsubsequently decreased to stabilize in 25-year-oldand older stands. Conversely, structural attributes ofdiversity remained quite constant and low in SC stands,close to those recorded in mature CWS stands.
The definition of PFTs resulting from CA and HC isgiven in Table 4. Ordination of the herbaceous PFTdata matrix showed that the two first axes resulting from
CA were significant (Fig. 2); their eigenvalues were 0·10and 0·07, respectively, corresponding to a cumulatedexplained variance of 58·7% (total inertia: 0·315). Thefirst axis (Fig. 2a) provided a very good separationbetween the two silvicultural systems. Forest standssubmitted to SC concentrated toward the negative partof the axis, characterized by the two groups of gra-minoids (Fig. 2b), while those under CWS groupedtoward the positive part, characterized by vernal geo-phytes and shade-tolerant perennials. These two latterPFTs were almost exclusively composed of true forestspecies. Consequently, this first axis may be interpretedas a gradient of increasing forest maturity. The dis-tribution of the relevés along the second axis did notclearly depend on the silvicultural system, but corre-lated with the PFT richness. Axis 2 may be consideredas a gradient of decreasing intra-plot heterogeneity.
According to the Chi square test on presence/absenceof PFTs, only two PFTs showed a strong response tothe silvicultural system: tufted graminoids, which char-acterized SC, and vernal geophytes, which were typicalof CWS (Table 4). The same test on cover–abundancevalues indicated that PFTs may be separated into threeresponse groups:• PFTs indifferent to the silvicultural system: ruderalannuals and tall light-requiring forbs.• PFTs associated with SC: ferns, tufted graminoidsand late-flowering graminoids.
Table 2. Correlations between structural attributes of diversity and environmental characteristics of the plots
LightSoil moisture
Soil reaction
Soil nutrient
Tree cover
Shrub cover
Undershrub cover
Shrub layerTotal cover 0·33**** ns ns −0·24* ns – nsPlot species richness (S) 0·45**** ns ns ns ns 0·67**** 0·28**Plot Shannon’s diversity (H′) 0·43**** ns ns ns ns 0·54**** nsPlot Pielou’s equitability (J′) ns ns ns ns ns ns −0·35****Light – ns −0·36*** −0·54**** – – –Soil moisture ns – ns −0·28* – – –Soil reaction −0·36*** ns – 0·50**** – – –Soil nutrient −0·54**** −0·28* 0·50**** – – – –
Sub-shrub layerTotal cover 0·21* ns ns ns −0·28** ns –Plot species richness (S) ns ns −0·63**** −0·22* −0·26** 0·26** nsPlot Shannon’s diversity (H′) ns ns −0·57**** −0·22* ns 0·37**** nsPlot Pielou’s equitability (J′) ns ns −0·22* ns ns 0·34**** nsLight – −0·48**** ns ns – – –Soil moisture −0·48**** – ns −0·22* – – –Soil reaction ns ns – 0·38*** – – –Soil nutrient ns −0·22* 0·38*** – – – –
Herb layerTotal cover ns ns 0·31*** 0·17* ns ns −0·34***Plot species richness (S) 0·28* ns 0·39**** 0·32*** ns ns nsPlot Shannon’s diversity (H′) 0·25* ns 0·28*** 0·24*** ns ns nsPlot Pielou’s equitability (J′) ns ns ns ns ns ns nsLight – 0·34**** −0·28** ns – – –Soil moisture 0·34**** – −0·45**** −0·44**** – – –Soil reaction −0·28** −0·45**** – 0·70**** – – –Soil nutrient ns −0·44**** 0·70**** – – – –
Spearman rank correlations: ns, non significant; *P < 0·05, **P < 0·01, ***P < 0·001, ****P < 0·0001.

1071Plant diversity in managed forests
© 2004 British Ecological Society, Journal of Applied Ecology, 41, 1065–1079
• PFTs associated with CWS: tree and shrub saplings,woody climbers, vernal geophytes, prostrated ruderalsand shade-tolerant perenials.
Attributes of functional diversity showed wide vari-ations between the two silvicultural systems (Fig. 3).PFT richness was found to be maximal in the majorpart of CWS plots (Fig. 3a) although at least two PFTswere lacking in more than half of the SC plots (Fig. 3b),which were in most of the cases vernal geophytes andshade-tolerant perennials. Nevertheless, at the blockscale, PFT richness did not differ among treatments.
Redundancy was relatively high for tree and shrubsaplings, ferns, woody climbers and shade-tolerantperennials, but weak for tufted graminoids, ruderal annuals
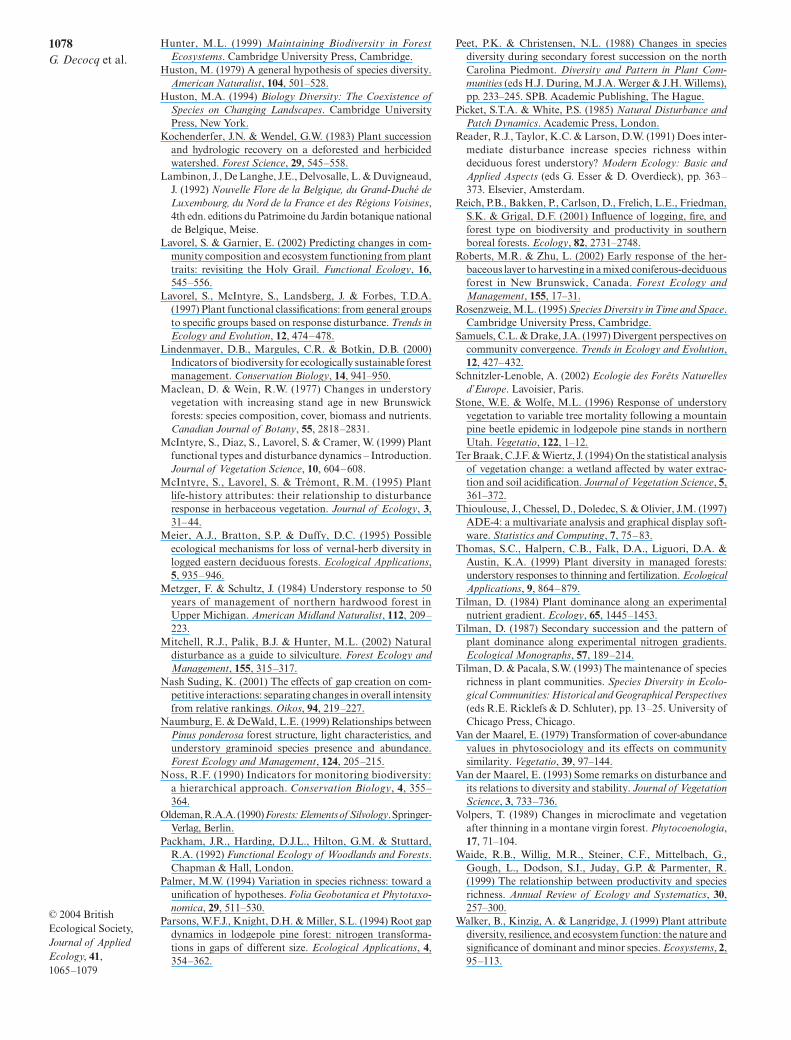
and tall light-requiring forbs (Fig. 3d). Higher valuesof redundancy were recorded in CWS for almost all thePFTs. Only ferns and late-flowering graminoids weremore redundant in SC at the two scales assessed. Nosignificant difference was detected for ruderal annualsand tall light-requiring forbs at both scales, nor fortufted graminoids and prostrated ruderals at the plotscale. As expected, high values of redundancy werealways associated with high values of species richness.Within the CWS species pool, both richness and func-tional redundancy varied as a function of stand age, whilePFT richness remained quite constant (Fig. 4). MostPFTs showed the highest redundancy in post-loggedstands, before canopy closure. Only vernal geophytes
Table 3. Comparison of structural and ecological attributes of plant assemblages between the two silvicultural systems (z-valuesof Mann and Whitney U-test on means and F-values of Fischer–Snedecor test on variance)
SC (n = 75) CWS (n = 60) z F
Shrub layerTotal cover 25·8 ± 15·1 (3–70) 32·2 ± 23·6 (0–90) ns 2·41***Plot species richness (S) 3·9 ± 2·1 (1–9) 3·9 ± 1·9 (0–8) ns nsPlot Shannon’s diversity (H′) 1·22 ± 0·69 (0–2·44) 1·16 ± 0·62 (0–2·42) ns nsPlot Pielou’s equitability (J′) 0·62 ± 0·30 (0–1) 0·58 ± 0·28 (0–1) ns nsBlock species richness (BSt) 8·2 ± 2·3 (3–12) 7·1 ± 2·6 (3–11) ns nsIntra-block diversity 3·90 ± 3·29 (1·94–15·00) 2·54 ± 0·50 (1·85–3·75) ns 0·02****Inter-plot similarity 0·57 ± 0·11 (0·37–0·77) 0·62 ± 0·16 (0·23–0·87) ns nsTreatment species richness (TSt) 17 15 – –Intra-treatment diversity 2·36 2·46 – –Inter-block similarity 0·65 0·59 – –Light 4·9 ± 0·6 (3·8–7·0) 5·1 ± 0·5 (4·0–6·4) −2·60** nsSoil moisture 6·4 ± 0·8 (5·3–8·6) 5·7 ± 0·5 (4·8–7·5) −5·35**** 0·37***Soil reaction 5·1 ± 1·0 (3·0–7·3) 5·0 ± 1·6 (3·0–8·0) ns 2·64**Soil nutrient 6·3 ± 0·8 (3·0–8·0) 6·0 ± 0·8 (4·9–9·0) ns ns
Sub-shrub layertotal cover 37·1 ± 26·0 (0–90) 20·4 ± 19·2 (0–80) −3·54*** 0·56*Plot species richness (S) 3·5 ± 2·0 (0–8) 4·3 ± 2·6 (0–10) ns 1·68*Plot Shannon’s diversity (H′) 0·73 ± 0·54 (0–2·19) 1·27 ± 0·82 (0–2·66) −4·05**** 2·47***Plot Pielou’s equitability (J′) 0·40 ± 0·30 (0–1) 0·60 ± 0·33 (0–1) −3·55*** nsBlock species richness (BSt) 5·9 ± 2·2 (2–10) 7·3 ± 3·4 (2–13) ns nsIntra-block diversity 3·41 ± 2·75 (1·30–10·00) 3·16 ± 2·29 (1·67–10·00) ns nsInter-plot similarity 0·59 ± 0·10 (0·42–0·75) 0·58 ± 0·14 (0·35–0·85) ns nsTreatment species richness (TSt) 16 16 – –Intra-treatment diversity 3·27 2·54 – –Inter-block similarity 0·63 0·62 – –Light 5·6 ± 0·4 (4·0–6·3) 5·7 ± 0·3 (5·0–6·4) ns 0·57*Soil moisture 5·8 ± 0·7 (5·0–9·0) 5·5 ± 0·4 (5·0–7·0) −2·66** 0·33***Soil reaction 7·5 ± 0·6 (6·2–8·0) 7·0 ± 0·9 (4·9–8·0) −2·94** 2·41**Soil nutrient 6·9 ± 0·4 (6·1–7·6) 6·9 ± 0·6 (5·3–8·3) ns ns
Herb layertotal cover 60·3 ± 17·4 (25–95) 78·5 ± 17·2 (10–98) −5·92**** nsPlot species richness (S) 20·3 ± 6·2 (9–35) 23·4 ± 8·8 (6–47) −2·19* 2·01**Plot Shannon’s diversity (H′) 2·92 ± 0·51 (1·6–4·0) 2·86 ± 0·85 (0·51–4·26) ns 2·72****Plot Pielou’s equitability (J′) 0·68 ± 0·07 (0·48–0·80) 0·63 ± 0·14 (0·18–0·97) −2·08* 3·80****Block species richness (BSt) 34·8 ± 7·4 (25–48) 39·5 ± 8·4 (29–57) ns nsIntra-block diversity 1·84 ± 0·20 (1·49–2·17) 1·84 ± 0·36 (1·45–2·79) ns nsInter-plot similarity 0·70 ± 0·05 (0·61–0·79) 0·69 ± 0·08 (0·51–0·83) ns nsTreatment species richness (TSt) 67 72 – –Intra-treatment diversity 1·98 1·87 – –Inter-block similarity 0·72 0·70 – –Light 4·6 ± 0·3 (4·0–5·3) 4·5 ± 0·4 (3·5–5·8) −2·29* 1·80*Soil moisture 6·0 ± 0·2 (5·5–6·4) 5·7 ± 0·2 (5·0–6·3) −6·82**** nsSoil reaction 4·9 ± 0·7 (3·5–6·1) 5·7 ± 0·5 (4·0–6·4) −6·62**** 0·55*Soil nutrient 5·5 ± 0·4 (4·5–6·3) 5·8 ± 0·3 (5·3–6·7) −4·38**** 0·54*
ns, non significant; *P < 0·05, **P < 0·01, ***P < 0·001, ****P < 0·0001.

1072G. Decocq et al.
© 2004 British Ecological Society, Journal of Applied Ecology, 41, 1065–1079
and shade-tolerant perennials were more redundant inthe oldest stands. Ferns and ruderal annuals showed adelayed response to thinning by reaching a maximalredundancy in 15-year-old stands. Woody climbers andtree and shrub saplings reached two peaks of maximalredundancy, first in post-logged stands and second in30-year-old stands.
Discussion
Despite comparable extraction rates (removal rateof c. 7 m3 ha−1 year−1 on average), the two silvicultural
systems differ in their disturbance regimes (severity,frequency and spatial extent) and vertical forest structure.Our results show that the main determining resource islight, as neither soil moisture nor soil fertility appearedto limit diversity patterns. By increasing understoreylight levels, silvicultural thinnings result in increasedoverall cover of understorey vegetation, especially ofthe shrub and sub-shrub layers. This is consistent witha number of previous studies that have shown that theoverall cover and biomass of forest understorey vegeta-tion often dramatically increase with canopy open-ing (Ehrenreich & Crosby 1960; Stone & Wolfe 1996).These studies also reported relatively tight relationshipsbetween canopy opening and herbaceous vegetationcover, in contrast to our results. The strong development
Fig. 1. Evolution of structural attributes of vegetation through the coppice-with-standards cycle. (a) Vegetation cover (%). (b)Species richness. (c) Species equitability. �: tree layer, �: Shrub layer, �: Sub-shrub layer, �: Herb layer.

1073Plant diversity in managed forests
© 2004 British Ecological Society, Journal of Applied Ecology, 41, 1065–1079 T
able
4.
Defi
niti
on o
f pl
ant
func
tion
al t
ypes
and
ass
ocia
tion
to
a si
lvic
ultu
ral s
yste
m P
FT
Defi
niti
onSp
ecie
sSi
lvic
ultu
ral s
yste
mP
rese
nce
Abu
ndan
ce
IT
ree
and
shru
b sa
plin
gsA
cer
pseu
dopl
atan
us, B
etul
a al
ba, C
arpi
nus
betu
lus,
Cor
ylus
ave
llana
, Cra
taeg
us m
onog
yna,
Fag
us s
ylva
tica
, Fra
xinu
s ex
cels
ior,
Pop
ulus
tre
mul
a, P
runu
s av
ium
, Que
rcus
rob
ur, S
ambu
cus
spp.
, Sor
bus
aucu
pari
a,V
ibur
num
opu
lus
CW
Sns
9·79
**
IIF
erns
Ath
yriu
m fi
lix-f
emin
a, D
ryop
teri
s sp
p.SC
ns24
·14*
***
III
Woo
dy c
limbe
rsR
ubus
spp
., L
onic
era
peri
clym
enum
, Hed
era
helix
CW
Sns
17·0
0***
*IV
Tuf
ted
gram
inoi
dsC
arex
pal
lesc
ens,
C. p
endu
la, C
. pilu
lifer
a, C
. syl
vati
ca, M
ilium
eff
usum
, Luz
ula
mul
tiflo
ra, L
. pilo
saSC
10·1
2***
6·99
***
VR
uder
al a
nnua
lsG
aleo
psis
tet
rahi
t, G
aliu
m a
pari
ne, I
mpa
tien
s no
li-ta
nger
e, S
tella
ria
med
ia, P
olyg
onum
hyd
ropi
per
–ns
nsV
IV
erna
l geo
phyt
esH
yaci
ntho
ides
non
scri
pta,
Aru
m m
acul
atum
, Ado
xa m
osch
atel
lina,
Ran
uncu
lus
ficar
ia, P
aris
qua
drif
olia
, C
WS
27·3
8***
*10
8·60
****
Cir
caea
lute
tian
a, P
olyg
onat
um m
ulti
floru
mV
IIT
all l
ight
-dem
andi
ng fo
rbs
Dig
ital
is p
urpu
rea,
Epi
lobi
um a
ngus
tifo
lium
, Fili
pend
ula
ulm
aria
, Hyp
eric
um m
acul
atum
, Scr
ophu
lari
a no
dosa
, –
nsns
Sen
ecio
ova
tus,
Sta
chys
syl
vati
ca, R
ubus
idae
us, U
rtic
a di
oica
, Val
eria
na r
epen
sV
III
Lat
e-flo
wer
ing
gram
inoi
dsA
gros
tis
cani
na, C
arex
rem
ota,
Des
cham
psia
ces
pito
sa, F
estu
ca g
igan
tea,
Hol
cus
mol
lis, J
uncu
s sp
p., P
oa t
rivi
alis
SCns
38·3
9***
*IX
Pro
stra
ted
rude
rals
Car
dam
ine
prat
ensi
s, G
lech
oma
hede
race
a, G
eum
urb
anum
, Lys
imac
hia
nem
orum
, Moe
hryn
gia
trin
ervi
a,
CW
Sns
11·7
9**
Ran
uncu
lus
repe
ns, S
tella
ria
alsi
ne, S
ilene
dio
ica,
Ste
llari
a ho
lost
ea, T
arax
acum
sp.
XSh
ade-
tole
rant
per
enni
als
Ane
mon
e ne
mor
osa,
Lam
ium
gal
eobd
olon
, Oxa
lis a
ceto
sella
, Vio
la r
eich
enba
chia
naC
WS
ns43
·71*
***
CW
S, c
oppi
ce-w
ith-
stan
dard
s sy
stem
; SC
, sel
ecti
ve c
utti
ng s
yste
m. C
hi s
quar
e te
st: n
s, n
on s
igni
fican
t; *
P <
0·0
5, *
*P <
0·0
1, *
**P
< 0
·001
, ***
*P <
0·0
001.
of Rubus fruticosus agg., which particularly benefits fromincreased light, may negatively impact herbaceous spe-cies, of which a few may also reach the subshrub layer.This is consistent with Kochenderfer & Wendel (1983)who reported immediate dominance of the disturbance-maintained blackberries (Rubus spp.) after thinning.We conclude that disturbance may provide opportun-ities for aggressive ruderal species to spread rapidly(Freedman, Woodley & Loo 1994; Beese & Bryant 1999).In CWS, thinning effects on understorey vegetationdecline as stands develop and canopy closure occurs,but in SC stands, the frequency of thinnings do notallow the canopy to close and a high proportion ofsolar radiation permanently reaches the forest floor.
Post-logged CWS stands support a higher richnessand diversity than mature CWS and SC stands. Thisconfirms that disturbance may increase species diver-sity by lowering the dominance of a few species, therebyfreeing resources for early successional species (Connell1978) and by increasing environmental heterogeneity
Fig. 2. Correspondence analysis carried out on the plantfunctional type data matrix. (a) Relevé ordination on thefactorial plan defined by the two first axes. �: selectively cut(SC) plots, �: coppice-with-standards (CWS) plots, �: ageingcoppice-with-standards plots. (b) Plant functional typeordination on the same plan. I: tree and shrub saplings, II:ferns, III: woody climbers, IV: tufted graminoids, V: ruderalannuals, VI: vernal geophytes, VII: tall light-requiring forbs,VIII: late-flowering graminoids, IX: prostrated ruderals, X:shade-tolerant perennials.

1074G. Decocq et al.
© 2004 British Ecological Society, Journal of Applied Ecology, 41, 1065–1079
(Grubb 1977; Denslow 1980; Tilman & Pacala 1993). Ourresults from CWS stands are in accordance with previousstudies focusing on diversity dynamics through silvi-cultural cycles, where species richness typically peaksshortly after catastrophic disturbance (Peet & Christensen1988) and then declines to pre-harvest levels (Metzger &Schultz 1984). The lower diversity recorded in SC sug-gests that despite a low severity of disturbance, the highfrequency of harvesting leads to more intense dis-turbance in SC compared with CWS, even if biomassremoval rates are similar. Mean species richness washigher within the CWS pool than within the SC, whateverthe scale of measurement, suggesting that the recurrentdisturbances of SC progressively decrease species rich-ness in the long term.
We also found consistent differences in PFT com-position between SC and CWS stands. Both ruderal annualsand tall light-requiring forbs were constant and quiteabundant in SC and post-logged CWS stands. Theywere also present in mature CWS stands but usually didnot flower. The gradient of forest maturity (Fig. 2: Axis1) can also be viewed as a gradient of time since the lastdisturbance. Consequently the shifts in PFTs along thisgradient may be treated as equivalent to a successionfrom both post-logged CWS and SC to ageing CWSstands through mature CWS stands. The latter two werecharacterized by vernal geophytes and shade-tolerantperennials, which include true forest species, like Anem-one nemorosa, Paris quadrifolia or Viola reichenbachiana.These species were lacking in the earlier stages of the
succession, where they were replaced by ruderal specieswith a rather large ecological amplitude (i.e. generalists),like Galium aparine, Glechoma hederacea or Deschampsiacespitosa. Woody climbers, mainly represented by Rubusspp., showed spectacular positive responses to thinningby increasing their stature and biomass, so that theyreached the undershrub layer in both SC and post-logged CWS stands. Subsequently, this PFT is rathernegatively impacted by CWS, as the shade of maturestands restricted it to the herb layer where species couldnever reach their optimal development and usually didnot flower. Prostrated ruderals were often found inwheel tracks or trampled zones and more abundantlyin CWS than in SC stands. Roberts & Zhu (2002) alsofound that the total number of true forest species declinedin the first year after harvest and then increased slightlyin the second year, while the richness of ruderalsincreased over the three first years.
We found three major differences between the twosilvicultural systems. First, some PFTs (particularlyshade-tolerant perennials and vernal geophytes) werecompletely lacking in some SC stands, while PFT rich-ness was higher and conserved through the silviculturalcycle in CWS. One explanation for this result may bethe difference in the size of the disturbed area betweenSC and CWS. As these species were found to be absentin the soil seed bank (Decocq et al. 2004), they musteither regenerate from remnant individuals or re-establish from neighbouring undisturbed forest stands.Post-disturbance migration is possible in CWS, where
Fig. 3. Functional diversity among forest stands submitted either to coppice-with-standards treatment (CWS) or to a selectivecutting system (SC). (a) Plant functional type richness within CWS stands. (b) Plant functional type richness within SC stands.(c) Redundancy of plant functional types into 400-m2 plots. (d) Redundancy of plant functional types into 2000-m2 plots. SeeTable 4 for definitions of plant functional types. Mann and Whitney test: ns, non significant; *P < 0·05, **P < 0·01, ***P < 0·001,****P < 0·0001.

1075Plant diversity in managed forests
© 2004 British Ecological Society, Journal of Applied Ecology, 41, 1065–1079
stands remain undisturbed for 30 years after harvestand are surrounded by mature stands which can serveas a reservoir for the shade flora. Conversely, in SC,recurrent disturbances are applied equally to the wholeforest. Stand size is higher than in CWS, preventingpersistence or re-establishment once extirpated.
Secondly, for all but the latter two PFTs, redundancywas maximal in post-logged CWS stands and thenprogressively decreased along the gradient of forestmaturity, as forest canopy was recovering and domin-ance phenomena were developing. This suggests thatenvironmental filters enhance competitive exclusionamong species within each PFT (Walker et al. 1999). Thevalues of redundancy recorded along the CWS cyclewere almost always higher than for SC stands except forferns, tufted graminoids and late-flowering graminoids.Fern species showed large positive responses to thin-ning by increasing their biomass and thus their cover,rather than their number of individuals. GraminoidPFTs strongly reacted to thinning by increasing theirspecies richness, thanks to several heliophilous species
able to colonize gaps. Most of these species were alsofound in post-logged CWS stands. Thomas et al. (1999)also found that tree saplings, as a functional group,showed a negative response to thinning, while fernsand grasses showed the largest positive responses. Thisincrease in the cover of graminoids and ferns followingthinning has often been reported (Naumburg & DeWald1999; Griffis et al. 2001; Roberts & Zhu 2002), even inselective cutting systems (Volpers 1989; Aude & Lawesson1998).
Thirdly, our results suggest that the disturbanceregime associated with SC may reduce the functionalorganization of the species assemblage by suppressingsome PFTs. This may negatively impact ecosystemstability and resilience, at least at a local scale. Both PFTrichness and redundancy are thought to be importantin ecosystem functioning (Walker et al. 1999; Wellnitz& Poff 2001).
As many forests have been managed according to atraditional system quite close to CWS since the Romantimes, vernal geophytes and shade-tolerant perennials
Fig. 4. Evolution of functional diversity through the coppice-with-standards cycle. (a) Species (�) and plant functional types (�)richness. (b) Redundancy within each plant functional type: tree and shrub saplings (�), ferns (�), woody climbers (�), tuftedgrasses and sedges (××××), ruderal annuals ( ), vernal geophytes (�), tall light-demanding forbs (�), late-flowering graminoids (+),prostrated ruderals (�), shade-tolerant perenials (_).

1076G. Decocq et al.
© 2004 British Ecological Society, Journal of Applied Ecology, 41, 1065–1079
may also be species adapted to the CWS-associateddisturbance regime. Maybe the so-called ‘true forestspecies’ may be better labelled ‘coppice-woodland spe-cies’, as some authors have done in the past (e.g., Packhamet al. 1992). Management can be considered as a dis-turbance, deflecting a current succession. However, inmost European temperate forests, ‘traditional’ man-agement (i.e., CWS-like) is also part of the evolutionaryhistory of ecosystems and as such should be regardedas part of normal forest function rather than an externaldisturbance. This equilibrium paradigm is being debatedby ecologists (Briske, Fuhlendorf & Smeins 2003). Inthat context, SC represents a real disturbance (i.e.change in the main trajectory) in a system previouslymaintained by traditional management.
First, understorey vegetation shows a complex responseto thinning. Although forest thinning could theoret-ically allow a greater number of species to persist, theassociated rise of light availability induces an increaseddominance by one species (Rubus fruticosus agg.) inthis situation. This reduces subshrub diversity in CWSstands for a short time, but decreases both subshruband herb diversity in SC stands over the long-term.This is in accordance with previous studies which haveshown that increased resource availability compensatesover time for the disturbance effect (Alaback & Herman1988; Thomas et al. 1999). This also suggests that manyherb species are limited by frequency rather than byseverity of disturbance.
Secondly, our study clearly suggests that SC has long-term negative effects on both structural and functionalplant diversity compared with CWS. The most neg-atively impacted PFTs by SC were the true forest species.These species may not recover quickly once extirpatedor greatly reduced in population numbers because ofaltered environmental conditions, lack of seed banks orslow dispersion (Meier, Bratton & Duffy 1995; Hannerz& Hannell 1997). Thus, even changes in the timing ofmanagement may have dramatic effects on the survivalof the true forest flora that may also reduce the prob-ability of successful restoration of degraded habitats(Hermy et al. 1999).
Thirdly, forest under CWS supported a high land-scape heterogeneity and a high functional diversitycompared with SC. By mimicking natural gap dynamics(e.g., treefalls), SC favours small-scale heterogene-ity. However, tree-by-tree harvesting is applied equallyand simultaneously to all stands, so that the forest as awhole is more homogeneous. Moreover, the rate anddensity of gap creation are much higher than in the nat-ural disturbance regime. This homogenizing effect of‘close-to-nature’ silvicultural systems has been reportedpreviously (Beese & Bryant 1999; Carleton 2000; Reichet al. 2001). Carleton (2000) concluded that conversionto selectively cut forests leads to reduced β diversityamong stands. Conversely CWS leads to stand-scale
homogeneity in a heterogeneous forest landscape, thatis probably close to the catastrophic events occurring inthe natural disturbance regime (e.g., storm-inducedclearings). It is well documented that within a particu-lar wood, different stages of a coppicing cycle provide awide variety of structural and climatic conditions, sothat the wood as a whole supports a high diversity ofspecies (Buckley 1992; Packham et al. 1992). Nevertheless,we found that herbaceous dryads (i.e., late-successionalspecies of old-growth forest, see Decocq & Hermy 2003)were almost exclusively found within ageing CWSstands, i.e. stands older than the length of the normalsilvicultural cycle, and that woody dryads (e.g., Fagussylvatica and Ilex aquifolium) were completely lacking.This suggests that the 30-year rotation may be too shortto allow these species to establish, even in mature stands.This is consistent with Maclean & Wein (1977) whoreported little evidence of recovery of late-successionalherbaceous species several decades after canopyopening. The recovery of understoreys requires at least50 years according to Metzger & Schultz (1984) and atleast 80 years according to Duffy & Meier (1992). In allcases, species of greatest concern are true forest species.
We conclude that in both SC and CWS the rotationscurrently in use do not match well with natural distur-bance regime and will change the natural forest succes-sion. In SC, the short rotation of cuttings does not allowforest maturation to occur, so we may consider thisforest ecosystem as permanently disturbed and thusmaintained in a non-equilibrium state. Conversely, inCWS, coppicing and logging, which occur at the same time,represent a major disturbance, but the longer forestryrotation allows the forest ecosystem to partly recoverbetween two harvests. Based on the results found forageing CWS stands, a rotation of at least 50 years wouldbe recommended. Where the maintenance of forestbiodiversity is a goal of forest management, it is essen-tial to retain remnants of the original shade flora withinold coppice woods, as it has been found to be particu-larly vulnerable when former coppices were convertedto plantations (Packham et al. 1992). Our study showsthat this is also the case when they are converted to SC.Old-growth forest stands accompanying shortenedharvest rotations may be a more suitable strategy for asustainable forest management.
Acknowledgements
This work was possible thanks to the French ‘Officenational des Forêts’ (Division of Hirson and PhilippeGoupil) and the ‘Compagnie forestière du Nouvion’(François Barisien and Michel Martin). We thank RégisCourtecuisse for assistance on the field, StéphaneFresnais and Arnault Lalanne for measures of foreststructure. This study was founded by the GIP ECOFOR(‘Biodiversité et gestion forestière’ program). We alsothank Janne Bengtsson and two anonymous refereesfor their very helpful comments on the initial draft, andKris Verheyen for his advice on the manuscript.

1077Plant diversity in managed forests
© 2004 British Ecological Society, Journal of Applied Ecology, 41, 1065–1079
Supplementary material
The following material is available from http://www.blackwellpublishing.com/products/journals /suppmat/JPE/JPE960/JPE960sm.htm
Appendix S1 List of plant traits used to group speciesinto Plant Functional Types.
ReferencesAlaback, P.B. & Herman, F.R. (1988) Long-term response of
understorey vegetation to stand density in Picea–Tsugaforests. Canadian Journal of Forest Research, 18, 1522–1530.
Aude, E. & Lawesson, J.E. (1998) Vegetation in Danish beechforests: the importance of soil, microclimate and managementfactors, evaluated by variation partitioning. Plant Ecology,134, 53–65.
Barkman, J.J. (1988) New systems of plant growth forms andphenological plant types. Plant Form and Vegetation Structure(eds M.J.A. Werger, P.J.M. van der Aart, H.J. During &J.T.A. Verhoeven), pp. 9–44. SPB. Academy Publications,The Hague, Netherlands.
Bauhus, J. (1996) C and N mineralization in an acid forest soilalong a gap-stand gradient. Soil Biology and Biochemistry,28, 923–932.
Beese, W.J. & Bryant, A.A. (1999) Effect of alternative silvi-cultural systems on vegetation and bird communities incoastal montane forests of British Columbia, Canada. ForestEcology and Management, 115, 231–242.
Begon, M., Harper, J.L. & Towsend, C.R. (1996) Ecology:Individuals, Populations and Communities, 3rd edn. BlackwellScience, Oxford.
Bengtsson, J., Nilsson, S.G., Franc, A. & Menozzi, P. (2000)Biodiversity, disturbances, ecosystem function and manage-ment of European forests. Forest Ecology and Management,132, 39–50.
Braun-Blanquet, J. (1964) Pflanzensoziologie Grünzüge derVegetationsgrunde. Springer, Wien.
Briske, D.D., Fuhlendorf, S.D. & Smeins, F.E. (2003) Vegetationdynamics on rangelands: a critique of the current paradigms.Journal of Applied Ecology, 40, 601–614.
Brown, J.H. (1981) Two decades of homage to Santa Rosalia:toward a general theory of diversity. American Zoologist,21, 877–888.
Buckley, G.P. (1992) Ecology and Management of CoppiceWoodlands. Chapman & Hall, London.
Carleton, T.J. (2000) Vegetation responses to the managedforest landscape of central and northern Ontario. Ecologyof a Managed Terrestrial Landscape (eds A.H. Perera,D.L. Euler & I. Thompson), pp. 178–197. University ofBritish Columbia Press, Vancouver.
Coleman, B.D., Mares, M.A., Willig, M.R. & Hsieh, Y. (1982)Randomness, area and species richness. Ecology, 63, 1121–1133.
Connell, J.H. (1978) Diversity in tropical rain forests andcoral reefs. Science, 199, 1302–1310.
Crawley, M.J. (1986) The structure of plant communities. PlantEcology (ed. M.J. Crawley), pp. 1–50. Blackwell, London.
Decocq, G. (1998) Données phytosociologiques récentes surles forêts de la Thiérache (Aisne, France). I. Les forêtsmésophiles de la Thiérache argilo-calcaire. Acta BotanicaGallica, 145, 125–147.
Decocq, G. (2000) The ‘masking effect’ of silviculture onsubstrate-induced plant diversity in oak–hornbeam forestsfrom northern France. Biodiversity and Conservation, 9,1467–1491.
Decocq, G. (2002) Patterns of plant species and communitydiversity at different organization levels in a forested riparianlandscape. Journal of Vegetation Science, 13, 91–106.
Decocq, G. & Hermy, M. (2003) Are there herbaceous dryadsin temperate deciduous forests? Acta Botanica Gallica, 150,373–382.
Decocq, G., Valentin, B., Toussaint, B., Hendoux, F., Saguez, R.& Bardat, J. (2004) Soil seed bank composition and diversityin a managed temperate deciduous forest. Biodiversity andConservation, in press.
Denslow, J.S. (1980) Patterns of plant species diversity duringsuccession under different disturbance regimes. Oecologia,46, 18–21.
Duffy, D.C. & Meier, A.J. (1992) Do Appalachian herbaceousunderstories ever recover from clearcutting? ConservationBiology, 6, 196–201.
Ehrenreich, J.H. & Crosby, J.S. (1960) Herbage production isrelated to hardwood crown cover. Journal of Forestry, 58,564–565.
Ellenberg, H., Weber, H.E., Düll, R., Wirth, V., Werner, W. &Paulissen, D. (1991) Zeigerwerte der Gefäßpflanzen (ohneRubus). Scripta Geobotanica, 18, 9–166.
Ertsen, A.C.D., Alkemade, J.R.M. & Wassen, M.J. (1998)Calibrating Ellenberg indicator values for moisture, acidity,nutrient availability and salinity in the Netherlands. PlantEcology, 135, 113–124.
Falinski, J.B. (1986) Vegetation dynamics in temperate lowlandprimeval forests. Geobotany, 8, 1–537.
Ford, E.D. & Newbould, P.J. (1977) The biomass and pro-duction of ground vegetation and its relation to tree coverthrough a deciduous woodland cycle. Journal of Ecology,65, 201–212.
Franklin, J.F. (1989) Towards a new forestry. American Forestry,95, 37–44.
Freedman, B., Woodley, S. & Loo, J. (1994) Forestry practicesand biodiversity, with particular reference to the MaritimeProvinces of eastern Canada. Environmental Review, 2, 33–77.
Giller, J. (1984) Community Structure and the Niche. Chapman& Hall, London.
Gillis, A.M. (1990) The new forestry. Bioscience, 40, 558–562.Graae, B.J. & Sunde, P.B. (2000) The impact of forest con-
tinuity and management on forest floor vegetation evaluatedby species traits. Ecography, 23, 720–731.
Grace, J.B. (1999) The factors controlling species density inherbaceous plant communities: an assessment. Perspectivesin Plant Ecology Evolution and Systematics, 2, 1–28.
Griffis, K.L., Crawford, J.A., Wagner, M.R. & Moir, W.H.(2001) Understory response to management treatments innorthern Arizona ponderosa pine forests. Forest Ecologyand Management, 146, 239–245.
Grime, J.P. (1979) Plant Strategies and Vegetation Processes.John Wiley & Sons, London.
Grime, J.P., Hodgson, J.G. & Hunt, R. (1988) ComparativePlant Ecology. A Functional Approach to Common BritishSpecies. Unwin-Hyman Ltd, London.
Grubb, P.J. (1977) The maintenance of species richness inplant communities: the importance of the regenerationniche. Biology Review, 52, 107–145.
Grubb, P.J. (1985) Plant populations and vegetation in rela-tion to habitat disturbance and competition: problems ofgeneralization. The Population Structure of Vegetation (ed.J. White), pp. 595–621. Dr W. Junk Publishers, The Hague,Netherlands.
Halpern, C.B. & Spies, T.A. (1995) Plant species diversity innatural and managed forests of the Pacific Northwest.Ecological Applications, 5, 913–934.
Hannerz, M. & Hannell, B. (1997) Effects on the flora in Norwayspruce forests following clearcutting and shelterwood cutting.Forest Ecology and Management, 90, 29–49.
Hermy, M., Honnay, O., Firbank, L., Grashof-Bokdam, C. &Lawesson, J.E. (1999) An ecological comparison betweenancient and other forest plant species of Europe, and theimplications for forest conservation. Biological Conservation,91, 9–22.
1078G. Decocq et al.
© 2004 British Ecological Society, Journal of Applied Ecology, 41, 1065–1079
Hunter, M.L. (1999) Maintaining Biodiversity in ForestEcosystems. Cambridge University Press, Cambridge.
Huston, M. (1979) A general hypothesis of species diversity.American Naturalist, 104, 501–528.
Huston, M.A. (1994) Biology Diversity: The Coexistence ofSpecies on Changing Landscapes. Cambridge UniversityPress, New York.
Kochenderfer, J.N. & Wendel, G.W. (1983) Plant successionand hydrologic recovery on a deforested and herbicidedwatershed. Forest Science, 29, 545–558.
Lambinon, J., De Langhe, J.E., Delvosalle, L. & Duvigneaud,J. (1992) Nouvelle Flore de la Belgique, du Grand-Duché deLuxembourg, du Nord de la France et des Régions Voisines,4th edn. editions du Patrimoine du Jardin botanique nationalde Belgique, Meise.
Lavorel, S. & Garnier, E. (2002) Predicting changes in com-munity composition and ecosystem functioning from planttraits: revisiting the Holy Grail. Functional Ecology, 16,545–556.
Lavorel, S., McIntyre, S., Landsberg, J. & Forbes, T.D.A.(1997) Plant functional classifications: from general groupsto specific groups based on response disturbance. Trends inEcology and Evolution, 12, 474–478.
Lindenmayer, D.B., Margules, C.R. & Botkin, D.B. (2000)Indicators of biodiversity for ecologically sustainable forestmanagement. Conservation Biology, 14, 941–950.
Maclean, D. & Wein, R.W. (1977) Changes in understoryvegetation with increasing stand age in new Brunswickforests: species composition, cover, biomass and nutrients.Canadian Journal of Botany, 55, 2818–2831.
McIntyre, S., Diaz, S., Lavorel, S. & Cramer, W. (1999) Plantfunctional types and disturbance dynamics – Introduction.Journal of Vegetation Science, 10, 604–608.
McIntyre, S., Lavorel, S. & Trémont, R.M. (1995) Plantlife-history attributes: their relationship to disturbanceresponse in herbaceous vegetation. Journal of Ecology, 3,31–44.
Meier, A.J., Bratton, S.P. & Duffy, D.C. (1995) Possibleecological mechanisms for loss of vernal-herb diversity inlogged eastern deciduous forests. Ecological Applications,5, 935–946.
Metzger, F. & Schultz, J. (1984) Understory response to 50years of management of northern hardwood forest inUpper Michigan. American Midland Naturalist, 112, 209–223.
Mitchell, R.J., Palik, B.J. & Hunter, M.L. (2002) Naturaldisturbance as a guide to silviculture. Forest Ecology andManagement, 155, 315–317.
Nash Suding, K. (2001) The effects of gap creation on com-petitive interactions: separating changes in overall intensityfrom relative rankings. Oikos, 94, 219–227.
Naumburg, E. & DeWald, L.E. (1999) Relationships betweenPinus ponderosa forest structure, light characteristics, andunderstory graminoid species presence and abundance.Forest Ecology and Management, 124, 205–215.
Noss, R.F. (1990) Indicators for monitoring biodiversity:a hierarchical approach. Conservation Biology, 4, 355–364.
Oldeman, R.A.A. (1990) Forests: Elements of Silvology. Springer-Verlag, Berlin.
Packham, J.R., Harding, D.J.L., Hilton, G.M. & Stuttard,R.A. (1992) Functional Ecology of Woodlands and Forests.Chapman & Hall, London.
Palmer, M.W. (1994) Variation in species richness: toward aunification of hypotheses. Folia Geobotanica et Phytotaxo-nomica, 29, 511–530.
Parsons, W.F.J., Knight, D.H. & Miller, S.L. (1994) Root gapdynamics in lodgepole pine forest: nitrogen transforma-tions in gaps of different size. Ecological Applications, 4,354–362.
Peet, P.K. & Christensen, N.L. (1988) Changes in speciesdiversity during secondary forest succession on the northCarolina Piedmont. Diversity and Pattern in Plant Com-munities (eds H.J. During, M.J.A. Werger & J.H. Willems),pp. 233–245. SPB. Academic Publishing, The Hague.
Picket, S.T.A. & White, P.S. (1985) Natural Disturbance andPatch Dynamics. Academic Press, London.
Reader, R.J., Taylor, K.C. & Larson, D.W. (1991) Does inter-mediate disturbance increase species richness withindeciduous forest understory? Modern Ecology: Basic andApplied Aspects (eds G. Esser & D. Overdieck), pp. 363–373. Elsevier, Amsterdam.
Reich, P.B., Bakken, P., Carlson, D., Frelich, L.E., Friedman,S.K. & Grigal, D.F. (2001) Influence of logging, fire, andforest type on biodiversity and productivity in southernboreal forests. Ecology, 82, 2731–2748.
Roberts, M.R. & Zhu, L. (2002) Early response of the her-baceous layer to harvesting in a mixed coniferous-deciduousforest in New Brunswick, Canada. Forest Ecology andManagement, 155, 17–31.
Rosenzweig, M.L. (1995) Species Diversity in Time and Space.Cambridge University Press, Cambridge.
Samuels, C.L. & Drake, J.A. (1997) Divergent perspectives oncommunity convergence. Trends in Ecology and Evolution,12, 427–432.
Schnitzler-Lenoble, A. (2002) Ecologie des Forêts Naturellesd’Europe. Lavoisier, Paris.
Stone, W.E. & Wolfe, M.L. (1996) Response of understoryvegetation to variable tree mortality following a mountainpine beetle epidemic in lodgepole pine stands in northernUtah. Vegetatio, 122, 1–12.
Ter Braak, C.J.F. & Wiertz, J. (1994) On the statistical analysisof vegetation change: a wetland affected by water extrac-tion and soil acidification. Journal of Vegetation Science, 5,361–372.
Thioulouse, J., Chessel, D., Doledec, S. & Olivier, J.M. (1997)ADE-4: a multivariate analysis and graphical display soft-ware. Statistics and Computing, 7, 75–83.
Thomas, S.C., Halpern, C.B., Falk, D.A., Liguori, D.A. &Austin, K.A. (1999) Plant diversity in managed forests:understory responses to thinning and fertilization. EcologicalApplications, 9, 864–879.
Tilman, D. (1984) Plant dominance along an experimentalnutrient gradient. Ecology, 65, 1445–1453.
Tilman, D. (1987) Secondary succession and the pattern ofplant dominance along experimental nitrogen gradients.Ecological Monographs, 57, 189–214.
Tilman, D. & Pacala, S.W. (1993) The maintenance of speciesrichness in plant communities. Species Diversity in Ecolo-gical Communities: Historical and Geographical Perspectives(eds R.E. Ricklefs & D. Schluter), pp. 13–25. University ofChicago Press, Chicago.
Van der Maarel, E. (1979) Transformation of cover-abundancevalues in phytosociology and its effects on communitysimilarity. Vegetatio, 39, 97–144.
Van der Maarel, E. (1993) Some remarks on disturbance andits relations to diversity and stability. Journal of VegetationScience, 3, 733–736.
Volpers, T. (1989) Changes in microclimate and vegetationafter thinning in a montane virgin forest. Phytocoenologia,17, 71–104.
Waide, R.B., Willig, M.R., Steiner, C.F., Mittelbach, G.,Gough, L., Dodson, S.I., Juday, G.P. & Parmenter, R.(1999) The relationship between productivity and speciesrichness. Annual Review of Ecology and Systematics, 30,257–300.
Walker, B., Kinzig, A. & Langridge, J. (1999) Plant attributediversity, resilience, and ecosystem function: the nature andsignificance of dominant and minor species. Ecosystems, 2,95–113.

1079Plant diversity in managed forests
© 2004 British Ecological Society, Journal of Applied Ecology, 41, 1065–1079
Wellnitz, T. & Poff, N.L. (2001) Functional redundancy inheterogeneous environments: implications for conservation.Ecology Letters, 4, 177–179.
Whittaker, R.H. (1965) Dominance and diversity in land plantcommunities. Science, 147, 250–260.
Wilson, S.D. & Tilman, D. (1993) Plant competition andresource availability in response to disturbance and fertil-ization. Ecology, 74, 599–612.
Received 18 March 2004; final copy received 16 July 2004
Copyright © 2022 FDOKUMEN