Planning Support Systems: A Computer-assisted Mass Appraisal (CAMA) System for Ciudad Juarez, Mexico
16
Journal of Property Tax Assessment & Administration • Volume 9, Issue 4 25 T his article describes a project to develop a planning support system linking geographic information sys- tems (GIS) and computer-assisted mass appraisal (CAMA) to estimate prop- erty values in Ciudad Juarez, Mexico. In Mexico, municipalities are struggling to find ways to develop valuation assess- ment techniques for property taxes, one of the main sources of local revenue for financing public infrastructure and ser- vices. Local governments not only need to have the tools to keep property value assessments up to date, but they also re- quire the technical capacity to anticipate where growth will take place and then evaluate the fiscal impact of that growth. Currently, most of the municipalities in Mexico assess property tax values through a mixed method that includes the value of both the land and the im- provements for each piece of property. However, the need to assign more accu- rate property values to parcels that have been improved over many years requires new approaches to property assessment such as CAMA (German, Robinson, and Youngman 2000). The municipality of Juarez is facing rapid urban growth and limited ca- pabilities and resources to keep pace with the demands for public services and infrastructure. In fact, property tax revenues have decreased. In our view, Sergio Peña, Ph.D., is a research scholar affiliated with El Colegio de la Frontera Norte (COLEF) in Mexico. COLEF is an academic think tank whose mission is to study socioeco- nomic phenomena taking place at the U.S.–Mexico border. His research focuses on urban planning and land use policy. César Fuentes, Ph.D., is a professor at El Colegio de la Frontera Norte at the Ciudad Juarez campus. He teaches courses on urban and regional economics and research methods. His research interests include land use management, urban economics, and regional economics. Luis Cervera currently is a research scholar at El Colegio de la Frontera Norte. Cervera teaches courses on geographic information systems (GIS), spatial analysis, and geostatistics. His research focuses on how to apply spatial analysis at the urban, rural, or regional level to social and environmental studies. Vladimir Hernandez, Ph.D., is a researcher and professor at the Universidad Autonoma de Ciudad Juarez (UACJ). Dr. Hernandez teaches courses on urban geography and research methods. His research interests center on GIS and spatial analysis. Planning Support Systems: A Computer-assisted Mass Appraisal (CAMA) System for Ciudad Juarez, Mexico BY SERGIO PEÑA, PH.D.; CÉSAR M. FUENTES, PH.D.; LUIS E. CERVERA, AND VLADIMIR HERNANDEZ, PH.D.
Transcript of Planning Support Systems: A Computer-assisted Mass Appraisal (CAMA) System for Ciudad Juarez, Mexico

Journal of Property Tax Assessment & Administration • Volume 9, Issue 4 25
This article describes a project to develop a planning support system
linking geographic information sys-tems (GIS) and computer-assisted mass appraisal (CAMA) to estimate prop-erty values in Ciudad Juarez, Mexico. In Mexico, municipalities are struggling to find ways to develop valuation assess-ment techniques for property taxes, one of the main sources of local revenue for financing public infrastructure and ser-vices. Local governments not only need to have the tools to keep property value assessments up to date, but they also re-quire the technical capacity to anticipate where growth will take place and then evaluate the fiscal impact of that growth.
Currently, most of the municipalities in Mexico assess property tax values through a mixed method that includes the value of both the land and the im-provements for each piece of property. However, the need to assign more accu-rate property values to parcels that have been improved over many years requires new approaches to property assessment such as CAMA (German, Robinson, and Youngman 2000).
The municipality of Juarez is facing rapid urban growth and limited ca-pabilities and resources to keep pace with the demands for public services and infrastructure. In fact, property tax revenues have decreased. In our view,
Sergio Peña, Ph.D., is a research scholar affiliated with El Colegio de la Frontera Norte (COLEF) in Mexico. COLEF is an academic think tank whose mission is to study socioeco-nomic phenomena taking place at the U.S.–Mexico border. His research focuses on urban planning and land use policy.César Fuentes, Ph.D., is a professor at El Colegio de la Frontera Norte at the Ciudad Juarez campus. He teaches courses on urban and regional economics and research methods. His research interests include land use management, urban economics, and regional economics.Luis Cervera currently is a research scholar at El Colegio de la Frontera Norte. Cervera teaches courses on geographic information systems (GIS), spatial analysis, and geostatistics. His research focuses on how to apply spatial analysis at the urban, rural, or regional level to social and environmental studies. Vladimir Hernandez, Ph.D., is a researcher and professor at the Universidad Autonoma de Ciudad Juarez (UACJ). Dr. Hernandez teaches courses on urban geography and research methods. His research interests center on GIS and spatial analysis.
Planning Support Systems: A Computer-assisted Mass Appraisal (CAMA) System for Ciudad Juarez, Mexico
BY SERGIO PEÑA, PH.D.; CÉSAR M. FUENTES, PH.D.; LUIS E. CERVERA, AND VLADIMIR HERNANDEZ, PH.D.

26 Journal of Property Tax Assessment & Administration • Volume 9, Issue 4
CAMA and GIS can help overcome some of the shortfalls that local municipalities face. We believe that CAMA can help modernize and update the cadastral system, which in turn will allow local mu-nicipalities to not only have the planning tools to be able to assess and capture the incremental value of property due to public policy actions, but also acquire the capability to update property values and capture taxes that can be used to finance public works and services. CAMA also can be perceived by the taxpayer as a more accurate way to assess property tax value (McCluskey 1997).
Developing CAMA models is particu-larly challenging in developing countries because of the lack of information on real estate transactions and the consid-erable number of properties that are not included in the property tax rolls because they are located in squatter settlements where residents lack legal title to the land.
For these reasons, we undertook the challenge of developing a planning sup-port system that links GIS and CAMA with the objective of developing a tool to model urban growth and estimate property values.
The remainder of this article is di-vided in five sections. The first section presents a brief discussion of the CAMA approach and property valuation which is intended to provide the theoretical framework for this effort. The second section is intended to offer a context in which to view the research. This section is divided into two subsections: one fo-cusing on property valuation in Mexico and the other giving a brief account of the demographic dynamic in Ciudad Juarez, which is important to consider. The third section explains the method-ological process of the research. In the fourth section, the findings including an econometric model are presented. In the last section, the main conclusions are offered.
Mass Appraisal: Conceptual Framework Mass appraisal has been defined as the systematic appraisal of groups of proper-ties as of a given date using standardized procedures and statistical testing (IAAO 1978). In mass appraisal modeling, the aim is to construct a representative mathematical model that replicates the market within which the real estate is traded (McCluskey 1997). The objective is an accurate assessment of the value of a property that can be verified through quality control measures such as statisti-cal testing. Developments in computer hardware and software have allowed most property appraisal departments access to relatively inexpensive mass ap-praisal systems.
The development of more rigorous valuation systems for property assess-ment enhances taxpayer understanding and general acceptance of the property tax system through concepts such as fairness and equity (McCluskey 1997, 3). Thus, public officials’ use of discretion in determining values is minimized and public support is enhanced.
According to Arvydas and Deveikis (2006), mass appraisal methodology al-lows property value maps to be updated at a lower cost. According to Linne, Kane, and Dell (2000), unlike the in-dividual valuation of properties, mass appraisal estimates the value of proper-ties that are relatively homogeneous or that are related spatially; on average, though, these assessed values approach those made individually by real estate experts. With CAMA, it is also possible to combine spatial analysis technology, such as GIS, and traditional statistical econometric models.
An important issue in CAMA is the source or the approach used to obtain property value information. Traditional-ly, three approaches exist to estimate the value of property (Linne, Kane, and Dell 2000). The first one is the cost approach, which considers the construction cost of
Journal of Property Tax Assessment & Administration • Volume 9, Issue 4 27
the structures on a piece of land and the land value. The second approach is the income capitalization approach, which is based on the market rental rate that people are willing to pay for a certain property at a certain location. The third approach, perhaps the most common, is the direct sales comparison approach, which relates the price of similar proper-ties and extrapolates an estimate of the value of other properties.
A fourth approach, which is less frequently utilized in CAMA, is the self-assessment approach which often is based on surveys. In the same vein, classified advertisements in the real estate section can be looked upon as self-assessments that an owner or a real estate agent has performed on a prop-erty similar to a survey. Our analysis and model are based on this approach. The municipal appraisal office in Ciu-dad Juarez lacked transaction data on properties and the databases necessary to perform any of the other three ap-proaches. So we built a database from scratch using the classified section of the local newspaper. We gathered as much information as possible from the adver-tisement and then followed up with a phone call to expand the information on the property. The next section explains in more detail the methodology em-ployed in developing our CAMA model that linked spatial analysis and statistical econometric models. It is important to clarify that we only analyzed residential properties in our study.
Mass appraisal modeling techniques can take a number of forms, all of which have the same dual objectives: (1) to attain acceptable standards of predic-tive accuracy and (2) to explain and justify objectively the assessed values. The modeling paradigms most common internationally for determining real estate values for property taxation are: (1) rule-based expert systems, which is a computerized technique representing human expertise which can emulate and perform the functions of an expert
and/or perform tasks which require a certain level of expertise (McCluskey et al. 1997); (2) artificial neural networks, a sub-field of computer science, which is concerned with the use of computers in tasks that are normally considered to require knowledge, perception, reason-ing, learning, understanding, and similar cognitive abilities (Gevarter 1985); (3) regression analysis, a technique applied successfully within the ad valorem as-sessment process; (4) comparable sales analysis in which the system selects com-parables closest to the subject obviating the necessity of an appraiser having to search through sales data to find compa-rables and adjust them for comparability; (5) case-based reasoning, an artificial intelligence paradigm that uses past ex-perience to solve current problems and in this respect, mirrors the comparative method of valuation (O’Roarty 1996); and (6) adaptive procedure, which esti-mates the selling price of real estate by processing sale transactions one at time in the sequence in which the sales took place (McCluskey et al. 1997).
Some of these modeling techniques are being applied mostly in countries with well-developed property markets such as Australia (Kirby 1997; Thomas 1997), Sweden (Sundquist 1997), Cana-da (Pearce 1997), New Zealand (Pegler 1997), Northern Ireland (McCluskey et al. 1997), the Netherlands (ten Have, Veld, and Jansen 1997) and the United States (Riley 1997), or in countries with very dynamic property markets such as Hong Kong (Stevenson 1997) and Sin-gapore (Leng 1997).
The ContextProperty Assessment Valuation in MexicoIn most Mexican municipalities, the property valuation method includes the value of both land and improvements (Perló and Zamorano 1999, 5). The source of information for taxable prop-erty is the cadastre lot map. In Mexico,

28 Journal of Property Tax Assessment & Administration • Volume 9, Issue 4
one of the most serious problems in collecting property taxes is the lack of an updated cadastre system.
According to Perló and Zamorano (1999), “the agencies and offices respon-sible for conducting the assessments vary by state and municipality. The only con-stant in this area is that state congresses are also responsible for approving the value tables or rates assigned in any municipality. However, approval does not mean doing all of the calculations needed to arrive at the proposed values” (p. 7). One of the criticisms is that the value tables, which specify a value range and the rate to be assessed, are devel-oped in a subjective or political way and lack an objective or scientific rationale.
While the congress of each state sets the property tax rates, different states and municipalities participate to varying degrees in the assessment and collec-tion process. In some instances, a state agency is responsible for identifying and assessing property, and for collecting the relevant tax. The state agency then trans-fers the funds due to the municipality, and the municipality can manage their expenditure as it sees fit in accordance with the law. In other instances, the mu-nicipality plays a more active role in tax collection, either by doing the property tax assessment and collection itself or by sharing assessment and collection tasks with the state. The combinations of functions vary widely among the states and municipalities of Mexico because no standardized legislation exists in this area (Perló and Zamorano 1999, 6). Fol-lowing are some examples of the ways in which property has been assessed:
In the Federal District of Mexico City, the cadastre office is responsible for making the valuation proposals, so each year the office sets unit prices for land (by the zone in which it is located) and for buildings (according to the quality of the construction). These unit prices are multiplied by the land area and the building area, and then this total is mul-
tiplied by the applicable rate to arrive at the tax due. Discounts also are applied according to the use of the land in ques-tion. If a taxpayer does not agree with the calculation issued by the appraisal office, the taxpayer can perform a self-appraisal of the property based on the value tables approved by the financial authority (Perló and Zamorano 1999, 7).
In the municipality of Mexicali, a land-based system was adopted so only land is valued. A cadastre board, made up of representatives of various sectors of the population (such as business, ag-riculture, labor, and industry) and the government, creates a zone plan along with the applicable unit rate table. The assessment for any lot can then be calcu-lated by multiplying its surface area by the corresponding unit value (Perló and Zamorano 1999, 7). This cadastre board is considered one of the most advanced in the country for its parsimonious ap-proach which focuses exclusively on land surface and implicitly assumes that build-ing value equals the land value.
The municipality of Juarez uses a more orthodox approach to property valua-tion which includes the cadastral value of land and buildings to estimate the property value to assess the appropriate tax. Recently, however, the local cadastre agency has been under pressure to ex-plain its methodology with the collapse of the real estate market—the result of the economic distress created by the global recession and the escalating crime rate as drug cartels fight for control of distribution routes.
Ciudad Juarez: Population and Urban GrowthThe municipality of Juarez is located at the border of the United States and Mexico. It is separated from El Paso, Texas, by only the river bed of the Rio Grande. In the last three decades, Ciudad Juarez has experienced un-precedented growth. Its location at the U.S.–Mexico border made the city a

Journal of Property Tax Assessment & Administration • Volume 9, Issue 4 29
magnet for assembly plants, known as maquiladoras, as companies sought to relocate to reduce transportation and labor costs. As a result, the city’s popula-tion growth rate was significantly higher during the period 1960–2005. From 1960 to 1970, the population almost doubled from 276,995 to 424,135, but the size of the urban area grew threefold (see table 1). The urban area increased from 1,894 hectares (4,680 acres) in 1960 to 5,608 hectares (13,857 acres) in 1970, for an annual growth rate of 10.8 percent (Fuentes 2009). From 1980 to 1990, the city’s population increased from 567,365 to 798,499 inhabitants. During the same period, the urban land area grew to 9,395 hectares (23,215 acres). By 2000, the population had reached 1,217,818, and the total urban area occupied 21,572 hectares (53,304 acres) of land. In 2005, the city contained 1,313,338 inhabitants (Fuentes and Cervera 2006). In short, along with unprecedented population growth, the city also has experienced urban sprawl.
Urban sprawl has been criticized for a variety of reasons. From an environmen-tal perspective, for example, this form of development has been associated with increased air pollution because of the greater distances between place of work and residence and the overall greater number of miles traveled per vehicle. However, it also is important to consider fiscal impacts because of their link to the cadastre system and the need for methods that provide an effective and fair property tax mechanism. Urban
sprawl generates a higher demand on infrastructure, particularly that related to mobility (roads, bridges, and the like) and sanitation (longer networks for sewer and water), that somehow needs to be financed.
Methods, Data, and Analytical ToolsThe method proposed here combines CAMA and GIS. The former helps to as-sess site characteristics, such as size and location—variables that are important to the mathematical models. The latter helps to develop location-based property records or cadastres and to link self-assessment data with location (German, Robinson, and Youngman 2000).
We performed the CAMA and GIS analysis in four steps. The first step was to gather information from the classified ads in the local newspaper (El Diario de Juarez) and from Web sites of real es-tate companies. We extracted as much information as was available in the ad, such as asking price, building size, lot size, number of bedrooms, number of bathrooms, address, and so forth. When information was missing, we followed up with a phone call. Sometimes the seller provided the additional information over the phone; sometimes the seller refused to provide more information. The data-gathering process took place from October to December 2011. The final database contained a total of 427 properties for which there was sufficient information for inclusion. The three basic attributes were location, price, and
Table 1. Population and urban area growth in Ciudad Juarez (1960–2005)
Year PopulationPopulation
Growth Rate (%)Urban Area in
hectares (acres)Urban Area
Growth RatePopulation Density
(population per hectare)1960 276,995 7.2 1,894 (4,680) 9.0 1461970 424,135 5.2 5,608 (13,857) 11.4 751980 567,365 4.4 9,395 (23,215) 5.2 601990 798,499 3.4 14,049 (34,715) 4.1 572000 1,217,818 4.2 21,572 (53,304) 4.3 562005 1,313,338 1.5 31,246 (77,208) 7.6 42
Source: Fuentes (2009 ); Fuentes and Cervera (2006)
30 Journal of Property Tax Assessment & Administration • Volume 9, Issue 4
physical dimensions (lot size, building size, and so forth).
The second step in the process was to geocode each property in the database. The main criterion we used was the centroid of the neighborhood polygon. After finishing georeferencing each property, we used the ArcMap module in ArcGIS for Desktop 10 (Esri 2010) to obtain the x and y coordinates of each property centroid. The end result was a vector (.shp) file of points.
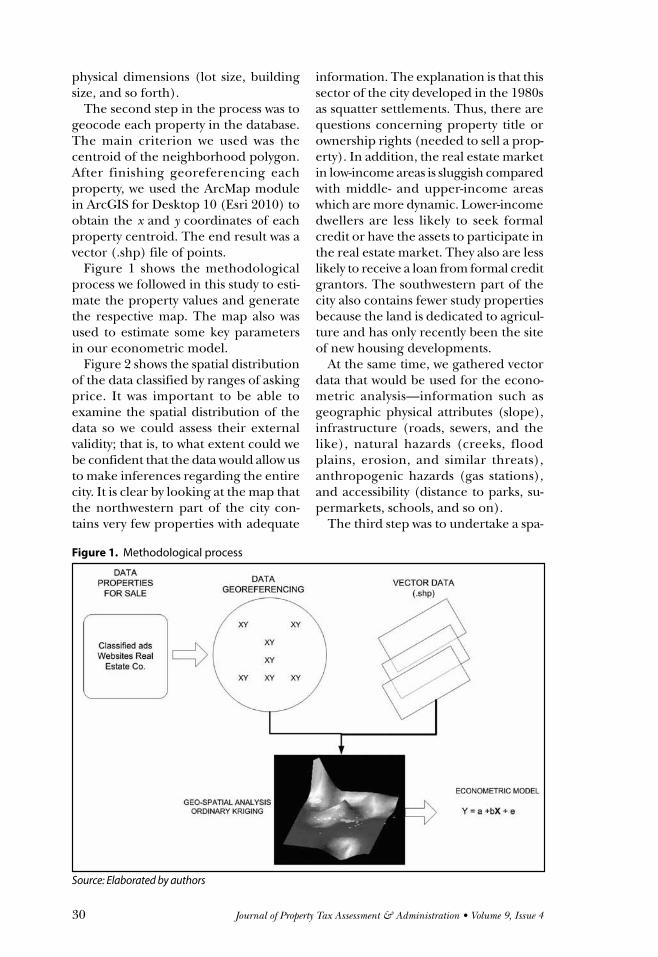
Figure 1 shows the methodological process we followed in this study to esti-mate the property values and generate the respective map. The map also was used to estimate some key parameters in our econometric model.
Figure 2 shows the spatial distribution of the data classified by ranges of asking price. It was important to be able to examine the spatial distribution of the data so we could assess their external validity; that is, to what extent could we be confident that the data would allow us to make inferences regarding the entire city. It is clear by looking at the map that the northwestern part of the city con-tains very few properties with adequate
information. The explanation is that this sector of the city developed in the 1980s as squatter settlements. Thus, there are questions concerning property title or ownership rights (needed to sell a prop-erty). In addition, the real estate market in low-income areas is sluggish compared with middle- and upper-income areas which are more dynamic. Lower-income dwellers are less likely to seek formal credit or have the assets to participate in the real estate market. They also are less likely to receive a loan from formal credit grantors. The southwestern part of the city also contains fewer study properties because the land is dedicated to agricul-ture and has only recently been the site of new housing developments.
At the same time, we gathered vector data that would be used for the econo-metric analysis—information such as geographic physical attributes (slope), infrastructure (roads, sewers, and the like), natural hazards (creeks, flood plains, erosion, and similar threats), anthropogenic hazards (gas stations), and accessibility (distance to parks, su-permarkets, schools, and so on).
The third step was to undertake a spa-
Figure 1. Methodological process
Source: Elaborated by authors

Journal of Property Tax Assessment & Administration • Volume 9, Issue 4 31
tial geostatistical analysis to generate the property value map. This map was used in the following step as the dependent variable in the econometric model. The geostatistical analysis employed to gener-ate the property value map was ordinary kriging (OK) which is part of ArcMap’s geostatistics packages. This methodol-ogy is an interpolation technique first applied in geology and named for its creator Daniel Gerhardus Krige. It predicts values that are unknown from data observed at known locations us-ing a distance-weighted average of the available sample. According to Kauko and d’Amato (2008, 5), “Kriging is an advanced spatial statistical method that builds on parametric MRA [multiple regression analysis]. When the standard hedonic MRA principle is ∑ Xm => Ym, the Kriging principle is ∑Yn => Ym.” In other words, whereas the traditional MRA pre-dicts the values of Ym based on the vector values of independent or explanatory (∑ Xm) variables, kriging predicts the values of Ym through the distance-weighted average of known locations or values known (∑ Yn). Kriging is a deterministic
interpolation that estimates the values of “unsampled (grid) points … as a simple linear weighted average of neighboring measured data points…” (De Smith, Goodchild, and Longley 2007, 323). In layperson’s terms, kriging predicts the value of a property whose value is unknown based on the values of nearby properties whose values are known—To-bler’s first law of geography and a basic principle of spatial autocorrelation.
The fourth and final step in the methodological process was to run a regression model to estimate the param-eters associated with the property values. One of the limitations of kriging is that it generates a map of property values based on interpolation. We still faced with the problem of gauging the effect that certain attributes had on value. The property values of different locations estimated through ordinary kriging were used as the dependent variable, Y. Then for each section or sector, we esti-mated the explanatory or independent variables, X, based on the vector data described previously, plus the spatial term, S. We then estimated several spa-tial regression models (spatially lagged dependent variables) as suggested by Ward and Gleditsch (2008).
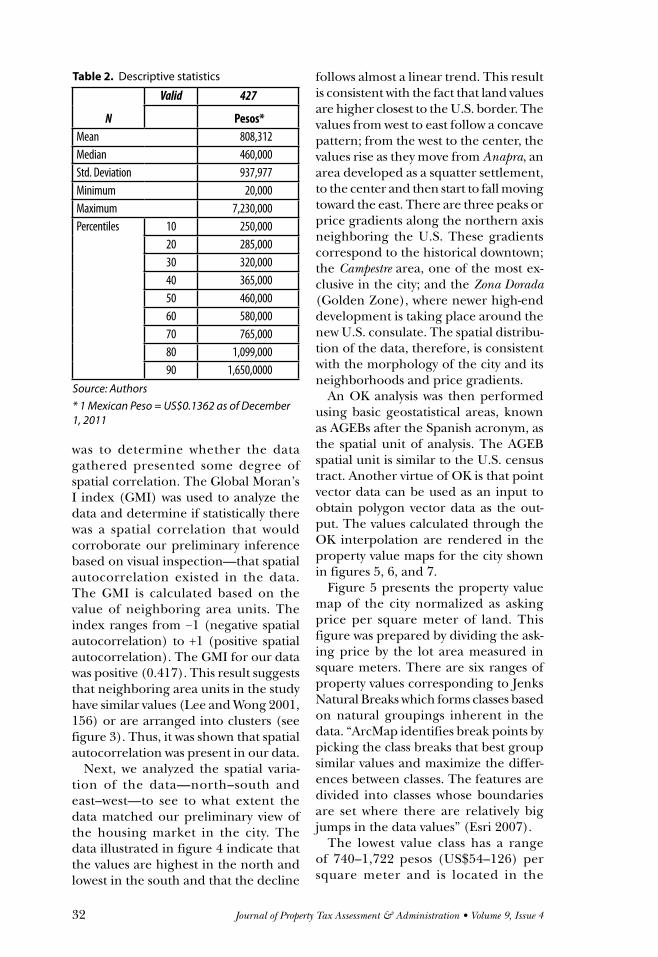
Main FindingsStatistical Analysis The implementation of the methodology allowed us to generate some descriptive statistics regarding the asking price for property in the sample (table 2). The mean value of a property was 808,312 pe-sos (about US$59,347) and the median value was about 460,000 pesos (about US$33,773). The range of values was very wide from as low as 20,000 pesos for a small apartment to as high as 7.2 million pesos. The percentiles give a better sense of the distribution of the values and the range. Some 90 percent of the homes are within a range between 250,000 and 1.6 million pesos (US$18,355–117,474).
One of the first steps in the analysis
Figure 2. Spatial distribution, Ciudad Juarez (2011)
32 Journal of Property Tax Assessment & Administration • Volume 9, Issue 4
was to determine whether the data gathered presented some degree of spatial correlation. The Global Moran’s I index (GMI) was used to analyze the data and determine if statistically there was a spatial correlation that would corroborate our preliminary inference based on visual inspection—that spatial autocorrelation existed in the data. The GMI is calculated based on the value of neighboring area units. The index ranges from −1 (negative spatial autocorrelation) to +1 (positive spatial autocorrelation). The GMI for our data was positive (0.417). This result suggests that neighboring area units in the study have similar values (Lee and Wong 2001, 156) or are arranged into clusters (see figure 3). Thus, it was shown that spatial autocorrelation was present in our data.
Next, we analyzed the spatial varia-tion of the data—north–south and east–west—to see to what extent the data matched our preliminary view of the housing market in the city. The data illustrated in figure 4 indicate that the values are highest in the north and lowest in the south and that the decline
follows almost a linear trend. This result is consistent with the fact that land values are higher closest to the U.S. border. The values from west to east follow a concave pattern; from the west to the center, the values rise as they move from Anapra, an area developed as a squatter settlement, to the center and then start to fall moving toward the east. There are three peaks or price gradients along the northern axis neighboring the U.S. These gradients correspond to the historical downtown; the Campestre area, one of the most ex-clusive in the city; and the Zona Dorada (Golden Zone), where newer high-end development is taking place around the new U.S. consulate. The spatial distribu-tion of the data, therefore, is consistent with the morphology of the city and its neighborhoods and price gradients.
An OK analysis was then performed using basic geostatistical areas, known as AGEBs after the Spanish acronym, as the spatial unit of analysis. The AGEB spatial unit is similar to the U.S. census tract. Another virtue of OK is that point vector data can be used as an input to obtain polygon vector data as the out-put. The values calculated through the OK interpolation are rendered in the property value maps for the city shown in figures 5, 6, and 7.
Figure 5 presents the property value map of the city normalized as asking price per square meter of land. This figure was prepared by dividing the ask-ing price by the lot area measured in square meters. There are six ranges of property values corresponding to Jenks Natural Breaks which forms classes based on natural groupings inherent in the data. “ArcMap identifies break points by picking the class breaks that best group similar values and maximize the differ-ences between classes. The features are divided into classes whose boundaries are set where there are relatively big jumps in the data values” (Esri 2007).
The lowest value class has a range of 740–1,722 pesos (US$54–126) per square meter and is located in the
Table 2. Descriptive statistics
N
Valid 427
Pesos*Mean 808,312Median 460,000Std. Deviation 937,977Minimum 20,000Maximum 7,230,000Percentiles 10 250,000
20 285,00030 320,00040 365,00050 460,00060 580,00070 765,00080 1,099,00090 1,650,0000
Source: Authors * 1 Mexican Peso = US$0.1362 as of December 1, 2011

Journal of Property Tax Assessment & Administration • Volume 9, Issue 4 33
Figure 3. Spatial autocorrelation data
Source: Created by authors using the ArcMap module in ArcGIS for Desktop 10 (Esri 2010)
Figure 4. Three-dimensional spatial variation of property prices
Source: Created by authors using the ArcMap module in ArcGIS for Desktop 10 (Esri 2010)

34 Journal of Property Tax Assessment & Administration • Volume 9, Issue 4
northwestern section of the city also known as Poniente o Anapra. This section contains the squatter settlements which were built in the 1980s. The 1980s rep-resented a boom time for maquiladoras. The factories’ demand for labor brought a large influx of migrants to the city. However, affordable housing for workers was scarce. The only option was squatting which was tolerated in that section of the city because its steep slopes made it undesirable. Eventually, the city legalized the lots and gave title ownership to the residents although questions of owner-ship still remain.
The next class is a range between 1,723 and 2,512 pesos (US$126–184) per square meter. Housing in this value range is located in the southeastern section of the city. This section has been built up by developers in the last decade primarily as affordable housing or vivienda de interes social. Reforms made to Mexico’s federal housing law in 1993 were, to a great extent, the impetus behind the massive affordable housing boom because it enabled thousands of workers to have access to credit. The reforms also transferred the responsi-bility of housing construction from the State to the private sector; the State only
coordinates and finances housing. These changes resulted in developers building massive cookie-cutter-type subdivisions. This mass production of housing has created its own planning problems for the city which is beyond the scope of this article to discuss.
The next three ranges are in the sec-tions that comprise the core of the city. They follow a north–south axis formed by the main highway, known as Carretera Panamericana, which crosses the entire city. The land values diminish along this line from north to south. Location near the U.S. border appears important in determining land value.
The middle category of the three pro-vides a buffer between the two poorest sections of the city. Values range from 3,190 to 3,934 pesos (US$234–288) per square meter. This section is where the city’s middle class residents live—the professionals, small business owners, and managers of maquiladoras. This area is associated with the highest levels of education in the city.
The last range, with the highest value per square meter, is in the Campestre and Zona Dorada sections. The highest value range extends from 5,059 to 6,855 pesos (US$371–503) per square meter.
Figure 5. Juarez property value map—Price per square meter of land (kriging interpolation)
Source: Rendered by authors using the ArcMap module in ArcGIS for Desktop 10 (Esri 2010)Note: 1 Mexican Peso = US$0.1362 as of December 1, 2011

Journal of Property Tax Assessment & Administration • Volume 9, Issue 4 35
These sections are considered the most exclusive residential areas in the city and are where wealthier people live. It is also where all services are in place. The values in these areas are high because residential dwellers compete for land with industrial users; Parque Industrial Bermudez, the first industrial park for as-sembly plants or maquiladoras, was built in this area. Thus, residents in these sec-tions have to compete with a powerful actor—industrial developers.
It is interesting to point out a key difference between the morphology of Mexican cities and those in the U.S. Whereas in the U.S. normally the higher the elevation the higher the value, in Mexico it is the opposite, lower eleva-tions or flatter areas are more expensive.
A pattern similar to that of value per square meter of land exists when the values are normalized by the value per square meter of construction (figure 6). The interesting pattern here oc-curs in the southeastern section of the city where the construction values per square meter are high. Much of the new growth in this area has been driven by a project to cluster all the institutions of higher learning to create La Ciudad del Conocimiento (Knowledge City). Also, the new affordable housing subdivisions are
being built with smaller lots but better quality of the materials compared to the northwestern part of the city where the lots are bigger but the quality of con-struction varies from makeshift materials to brick and concrete.
Econometric Model To analyze the consistency of the data and the sign of the coefficients, we ran a model using the collected asking-price data. We first ran a model without a vari-able (model 1) to take into consideration spatial autocorrelation and then we ran one with a term adjusting for this issue (model 2). To correct for spatial corre-lation, we used a lagged price variable which was estimated by selecting prop-erties within a half-kilometer radius and calculating the average asking price of the properties. The dependent variable (asking price) as well as a few other variables were transformed to natural logarithms (ln).
The results, presented in table 3, are consistent with the hypothesized signs of the coefficients. The only exception occurred for properties located within a zone considered subject to flooding hazards, though the coefficient in both models is not statistically significant. Comparing the coefficients in the two
Figure 6. Juarez property value map: Price per square meter of construction (kriging interpo-lation)
Source: Rendered by authors using the ArcMap module in ArcGIS for Desktop 10 (Esri 2010)Note: 1 Mexican Peso = US$0.1362 as of December 1, 2011

36 Journal of Property Tax Assessment & Administration • Volume 9, Issue 4
models, it is clear that when the term to correct for spatial correlation (ln lagged price) is added the absolute effect on the model of number of baths, hydro-meteorological hazard zone, and square meters of construction (ln m2 construc-tion) diminishes considerably. In model 1, to judge by the t-value, the baths and construction size have the most sig-nificant impact on variations in value. In model 2, the variables that explain to a large extent the variations in the price are construction size and the price of surrounding properties. The first model explains 61 percent of the variation in price (R2) without the spatial correlation term. When the spatial correlation term is added, the model explains 87 percent of the variation in asking price.
Figure 7 shows the spatial distribution of property values classified by housing type according to the typology of the lo-cal cadastre office. The classification was made based on standard deviation. Once the different housing types were assigned to categories, we created a model (model 3) to estimate the premium or difference in the property values. The dependent variable in model 3 (lnPredicted) was the natural logarithm of the value predicted for the zone or sector by the kriging interpolation. For this model, we again considered the physical attributes of the
zone (slope grade) and the presence of hazards (flooding); we again used as the spatial term the average predicted value of the surrounding areas; and we added the five types of housing (using the popular or low-income category as the reference group). The model is statistically significant (F = 755) and the R2 is 0.935.
The coefficients in table 4 have the expected signs for a municipality such as Juarez. As mentioned earlier, the poorest housing is located in areas that are higher or in zones with steep slopes (therefore the coefficient is negative) whereas the better housing is located on lower lands or in flat areas (thus the coefficient is positive). Sometimes, formal housing is built in zones that are prone to flooding—reflecting poor planning and the government’s capac-ity to control urban growth. The signs of the housing type or category also are consistent with the hypothesis; that is, the premium is positive and as housing quality increases, the premium increases for each successive housing category. The term, lnlagpred, is associated with spatial autocorrelation; it is the natural logarithm of predicted property values in the neighboring zones. All the coef-ficients are statistically significant at the alpha level (.05).
Table 3. Econometric model (asking price)
Model 1 t-value Model 2 t-valueConstant 8.690 8.5* 0.312 0.4Baths 0.332 5.7* 0.104 2.8*Flooding Hazard** 0.049 0.4 0.015 0.2Hydro-meteorological Hazards** −0.519 −2.5* −0.215 −1.8ln distance Park Chamizal 0.141 1.7 0.101 2.2*ln m2 construction 0.553 4.6* 0.356 5.1*ln lagged price 0.760 16.5*R2 0.612 0.871Adjusted R2 0.598 0.866
Source: Authors * Statistically significant .05** Flooding hazards are identified by the local planning agency. Hydro-meteorological hazards are defined based on buffers of 50 meters from arroyos.

Journal of Property Tax Assessment & Administration • Volume 9, Issue 4 37
Conclusions In summary, the main explanatory drivers predicting value in the Juarez municipality, to judge by the t-values, are those variables associated with the quality of housing, which at the same time is concentrated in specific clusters of the city (figure 7), and the prices in neighboring zones. Factors such as flooding hazards and/or risks related to unstable soils (such as the steep slopes where the poor live in the city) have
lower explanatory power (smaller t-values). This finding can be explained by the fact that in developing countries, municipalities, although in charge of planning, are weaker in comparison to the political power of developers; often there is a fuzzy line between politicians and real estate developers.
In recent years, Juarez has become infamous for the skyrocketing numbers of killings related to organized crime and drug trafficking. The increasing violence
Figure 7. Property value map sectors and type of housing (kriging interpolation)
Source: Authors

38 Journal of Property Tax Assessment & Administration • Volume 9, Issue 4
has forced residents to leave the city, many moving to El Paso, Texas, across the border or to other cities in Mexico. This situation has had a negative effect on the city’s real estate market. Homeowners have begun requesting adjustments in their property taxes from the municipal appraisal office; complaints often move to the courts. As a result, the appraisal office has been forced to explain its meth-odology for estimating property values to justify the property tax charged. However, the local appraisal office lacked a model and the expertise to sustain a valid argu-ment. We believe a CAMA model like the one developed here can be a useful technical tool for the cadastre office to better explain how it arrives at property values and perhaps dissuade property owners from filing a legal complaint. Also, CAMA can help to start a process of systematically collecting information and developing models that can be fast, cheap, and reliable.
One of the shortcomings of this re-search is that relied on asking price or a self-assessed property value instead of the real transaction price. As part of the project, we hosted a conference on property valuation attended by real estate experts and professional valua-tors. We asked what would be the rule of thumb for making adjustments between the asking price and the selling price of
property. We were unable to obtain an answer. In Mexican culture, it is common practice to bargain over prices of goods. Therefore, in property transactions, the bargaining range can be very wide unlike the U.S. where the difference between the asking price and the negotiated sale price is quite small which reduces the es-timate errors. This area would provide an interesting subject for further research.
AcknowledgmentsThis research was made possible through a grant from Mexico’s National Council of Science and Technology (CONACYT) and the Juarez, Chihuahua, municipality through the Fondo Mixto (#143702). We thank the fund and Juarez’ cadastral of-fice for their support.
References Arvydas, B., and S. Deveikis. 2006. Mo-delos de valoración automatizada en Lituania. Revista CT/Catastro 58:61–72.
De Smith, M.J., M. F. Goodchild, and P.A. Longley. 2007. Geospatial analysis: A comprehensive guide to principles, techniques, and software tools, 2d ed. Winchelsea, UK: Winchelsea Press.
Esri. 2007. Natural breaks (Jenks). http://webhelp.esri.com/arcgisdesktop/9.2/index.cfm?TopicName=Natural_breaks_%28Jenks%29.
Table 4. Regression model—Property values (kriging interpolation)
Model 3Dependent Variable:
lnPredicted
Coefficients
t Sig.Unstandardized Coefficients
Standardized Coefficients
B Std. Error Beta1 (Constant) 7.544 0.342 22.071 0.000
Slope > 5% −0.054 0.017 −0.045 −3.133 0.002Flood hazard 0.043 0.021 0.029 2.052 0.041h_economic 0.276 0.019 0.253 14.193 0.000h_medium 0.725 0.040 0.422 17.985 0.000h_good 1.003 0.056 0.323 17.765 0.000h_highend 1.444 0.055 0.483 26.232 0.000lnlagpred 0.397 0.027 0.381 14.731 0.000
Source: Authors

Journal of Property Tax Assessment & Administration • Volume 9, Issue 4 39
Esri. 2010. ArcGIS for Desktop v.10, ArcMap module. Redlands, CA: Environ-mental Systems Research Institute, Inc.
Fuentes, C. 2009. Estructura espacial urbana y accesibilidad diferenciada a centros de empleo en Ciudad Juárez, Chihuahua. Region y Sociedad 20 (44): 33–67.
Fuentes, C.M., and L.E. Cervera. 2006. Land markets and its effects on the spatial segregation: The case of Ciudad Juarez. Estudios Fronterizos 7(13): 43–62.
German, J.C., D. Robinson, and J. Young-man. 2000. Traditional methods and new approaches to land valuation. Land Lines 12 (4): 4–5.
Gevarter, W.B. 1985. Intelligent ma-chines: Introductory perspective on artificial intelligence and robotics. Englewood Cliffs, NJ: Prentice Hall.
IAAO. 1978. Improving real property as-sessment: A reference manual. Chicago: International Association of Assessing Officers.
Kauko, T., and M. d’Amato, eds. 2008. Mass appraisal methods: An international perspective for property valuers. Chichester, West Sussex, United Kingdom: Blackwell Publishing Ltd.
Kirby, A.1997. Computed assisted mass appraisal: The Queensland experience. In Computer assisted mass appraisal: An international review, ed. W. McCluskey and A. Adair, 187–209. Burlington, VT: Ashgate Publishing Limited.
Lee, J., and D. Wong. 2001. Statistical analysis with ArcView GIS. New York: John Wiley & Sons.
Leng, L.S. 1997. Mass appraisal for property tax purposes in Singapore. In Computer assisted mass appraisal: An inter-national review, ed. W. McCluskey and A. Adair, 339–355. Burlington, VT: Ashgate Publishing Limited.
Linne, M.R., M.S. Kane, and G. Dell. 2000. A guide to appraisal valuation modeling. Chicago: Appraisal Institute.
McCluskey, W.J. 1997. A critical review of computer assisted mass appraisal tech-niques. In Computer assisted mass appraisal: An international review, ed. W. McCluskey and A. Adair, 1–26. Burlington, VT: Ash-gate Publishing Limited.
McCluskey, W., K. Dyson, D. McFall, and S. Anand. 1997. The mass appraisal of residential property in Northern Ireland. In Computer assisted mass appraisal: An in-ternational review, ed. W. McCluskey and A. Adair, 59–77. Burlington, VT: Ashgate Publishing Limited.
O’Roarty, B. 1996. A critical assessment of the rental valuation of retail property. DPhil thesis, University of Ulster.
Pearce, A. 1997. Computer assisted mass appraisal of farm land in British Colum-bia. In Computer assisted mass appraisal: An international review, ed. W. McCluskey and A. Adair, 131–162. Burlington, VT: Ashgate Publishing Limited.
Pegler, A. 1997. The New Zealand experi-ence with computer assisted valuation. In Computer assisted mass appraisal: An international review, ed. W. McCluskey and A. Adair, 211–232. Burlington, VT: Ashgate Publishing Limited.
Perló, M., and L. Zamorano. 1999. Reform of the real estate tax system in Mexicali: 1989–1998, working paper, LP99Z36. Cambridge, MA: Lincoln Insti-tute of Land Policy.
Riley, W. 1997. Mass appraisal of con-dominiums. In Computer assisted mass appraisal: An international review, ed. W. McCluskey and A. Adair, 289–324. Burl-ington, VT: Ashgate Publishing Limited.
Stevenson, R. 1997. The use of mass ap-praisal techniques for rating valuation in Hong Kong. In Computer assisted mass appraisal: An international review, ed. W. McCluskey and A. Adair, 27–58. Burl-ington, VT: Ashgate Publishing Limited.

40 Journal of Property Tax Assessment & Administration • Volume 9, Issue 4
Sundquist, A. 1997. Mass appraisal of agricultural property in Sweden. In Computer assisted mass appraisal: An inter-national review, ed. W. McCluskey and A. Adair, 163–186. Burlington, VT: Ashgate Publishing Limited.
ten Have, G.M.; A.G. op’t Veld, and J.E. Jansen. 1997. Taxes: Residential property valuation for local tax purpose in the Netherlands. In Computer assisted mass appraisal: An international review, ed. W. McCluskey and A. Adair, 325–338. Burl-ington, VT: Ashgate Publishing Limited.
Thomas, D. 1997. Computer assisted valuation in Tasmania. In Computer as-sisted mass appraisal: An international review, ed. W. McCluskey and A. Adair 233–256. Burlington, VT: Ashgate Pub-lishing Limited.
Ward, M.D., and K.S. Gleditsch. 2008. Spatial regression models. Thousand Oaks, CA: Sage Publications.