Planck early results. VII. The Early Release Compact Source Catalogue
26
A&A 536, A7 (2011) DOI: 10.1051/0004-6361/201116474 c ESO 2011 Astronomy & Astrophysics Planck early results Special feature Planck early results. VII. The Early Release Compact Source Catalogue Planck Collaboration: P. A. R. Ade 76 , N. Aghanim 50 , M. Arnaud 63 , M. Ashdown 61,4 , J. Aumont 50 , C. Baccigalupi 74 , A. Balbi 30 , A. J. Banday 82,8,68 , R. B. Barreiro 57 , J. G. Bartlett 3,59 , E. Battaner 84 , K. Benabed 51 , A. Benoît 49 , J.-P. Bernard 82,8 , M. Bersanelli 27,43 , R. Bhatia 5 , A. Bonaldi 39 , L. Bonavera 74,6 , J. R. Bond 7 , J. Borrill 67,78 , F. R. Bouchet 51 , M. Bucher 3 , C. Burigana 42 , R. C. Butler 42 , P. Cabella 30 , C. M. Cantalupo 67 , B. Cappellini 43 , J.-F. Cardoso 64,3,51 , P. Carvalho 4 , A. Catalano 3,62 , L. Cayón 20 , A. Challinor 54,61,11 , A. Chamballu 47 , R.-R. Chary 48 , X. Chen 48 , L.-Y. Chiang 53 , C. Chiang 19 , P. R. Christensen 71,31 , D. L. Clements 47 , S. Colombi 51 , F. Couchot 66 , A. Coulais 62 , B. P. Crill 59,72 , F. Cuttaia 42 , L. Danese 74 , R. J. Davis 60 , P. de Bernardis 26 , A. de Rosa 42 , G. de Zotti 39,74 , J. Delabrouille 3 , J.-M. Delouis 51 , F.-X. Désert 45 , C. Dickinson 60 , J. M. Diego 57 , K. Dolag 68 , H. Dole 50 , S. Donzelli 43,55 , O. Doré 59,9 , U. Dörl 68 , M. Douspis 50 , X. Dupac 34 , G. Efstathiou 54 , T. A. Enßlin 68 , H. K. Eriksen 55 , F. Finelli 42 , O. Forni 82,8 , P. Fosalba 52 , M. Frailis 41 , E. Franceschi 42 , S. Galeotta 41 , K. Ganga 3,48 , M. Giard 82,8 , Y. Giraud-Héraud 3 , J. González-Nuevo 74 , K. M. Górski 59,86 , S. Gratton 61,54 , A. Gregorio 28 , A. Gruppuso 42 , J. Haissinski 66 , F. K. Hansen 55 , D. Harrison 54,61 , G. Helou 9 , S. Henrot-Versillé 66 , C. Hernández-Monteagudo 68 , D. Herranz 57 , S. R. Hildebrandt 9,65,56 , E. Hivon 51 , M. Hobson 4 , W. A. Holmes 59 , A. Hornstrup 13 , W. Hovest 68 , R. J. Hoyland 56 , K. M. Huffenberger 85 , M. Huynh 48 , A. H. Jaffe 47 , W. C. Jones 19 , M. Juvela 18 , E. Keihänen 18 , R. Keskitalo 59,18 , T. S. Kisner 67 , R. Kneissl 33,5 , L. Knox 22 , H. Kurki-Suonio 18,37 , G. Lagache 50 , A. Lähteenmäki 1,37 , J.-M. Lamarre 62 , A. Lasenby 4,61 , R. J. Laureijs 35 , C. R. Lawrence 59 , S. Leach 74 , J. P. Leahy 60 , R. Leonardi 34,35,23 , J. León-Tavares 1 , C. Leroy 50,82,8 , P. B. Lilje 55,10 , M. Linden-Vørnle 13 , M. López-Caniego 57 , P. M. Lubin 23 , J. F. Macías-Pérez 65 , C. J. MacTavish 61 , B. Maffei 60 , G. Maggio 41 , D. Maino 27,43 , N. Mandolesi 42 , R. Mann 75 , M. Maris 41 , F. Marleau 15 , D. J. Marshall 82,8 , E. Martínez-González 57 , S. Masi 26 , M. Massardi 39 , S. Matarrese 25 , F. Matthai 68 , P. Mazzotta 30 , P. McGehee 48 , P. R. Meinhold 23 , A. Melchiorri 26 , J.-B. Melin 12 , L. Mendes 34 , A. Mennella 27,41 , S. Mitra 59 , M.-A. Miville-Deschênes 50,7 , A. Moneti 51 , L. Montier 82,8 , G. Morgante 42 , D. Mortlock 47 , D. Munshi 76,54 , A. Murphy 70 , P. Naselsky 71,31 , P. Natoli 29,2,42 , C. B. Netterfield 15 , H. U. Nørgaard-Nielsen 13 , F. Noviello 50 , D. Novikov 47 , I. Novikov 71 , I. J. O’Dwyer 59 , S. Osborne 80 , F. Pajot 50 , R. Paladini 79,9 , B. Partridge 36 , F. Pasian 41 , G. Patanchon 3 , T. J. Pearson 9,48 , O. Perdereau 66 , L. Perotto 65 , F. Perrotta 74 , F. Piacentini 26 , M. Piat 3 , R. Piffaretti 63,12 , S. Plaszczynski 66 , P. Platania 58 , E. Pointecouteau 82,8 , G. Polenta 2,40 , N. Ponthieu 50 , T. Poutanen 37,18,1 , G. W. Pratt 63 , G. Prézeau 9,59 , S. Prunet 51 , J.-L. Puget 50 , J. P. Rachen 68 , W. T. Reach 83 , R. Rebolo 56,32 , M. Reinecke 68 , C. Renault 65 , S. Ricciardi 42 , T. Riller 68 , I. Ristorcelli 82,8 , G. Rocha 59,9 , C. Rosset 3 , M. Rowan-Robinson 47 , J. A. Rubiño-Martín 56,32 , B. Rusholme 48 , A. Sajina 17 , M. Sandri 42 , D. Santos 65 , G. Savini 73 , B. M. Schaefer 81 , D. Scott 16 , M. D. Seiffert 59,9 , P. Shellard 11 , G. F. Smoot 21,67,3 , J.-L. Starck 63,12 , F. Stivoli 44 , V. Stolyarov 4 , R. Sudiwala 76 , R. Sunyaev 68,77 , J.-F. Sygnet 51 , J. A. Tauber 35 , D. Tavagnacco 41 , L. Terenzi 42 , L. Toffolatti 14 , M. Tomasi 27,43 , J.-P. Torre 50 , M. Tristram 66 , J. Tuovinen 69 , M. Türler 46 , G. Umana 38 , L. Valenziano 42 , J. Valiviita 55 , J. Varis 69 , P. Vielva 57 , F. Villa 42 , N. Vittorio 30 , L. A. Wade 59 , B. D. Wandelt 51,24 , S. D. M. White 68 , A. Wilkinson 60 , D. Yvon 12 , A. Zacchei 41 , and A. Zonca 23 (Affiliations can be found after the references) Received 8 January 2011 / Accepted 30 May 2011 ABSTRACT A brief description of the methodology of construction, contents and usage of the Planck Early Release Compact Source Catalogue (ERCSC), including the Early Cold Cores (ECC) and the Early Sunyaev-Zeldovich (ESZ) cluster catalogue is provided. The catalogue is based on data that consist of mapping the entire sky once and 60% of the sky a second time by Planck, thereby comprising the first high sensitivity radio/submillimetre observations of the entire sky. Four source detection algorithms were run as part of the ERCSC pipeline. A Monte-Carlo algorithm based on the injection and extraction of artificial sources into the Planck maps was implemented to select reliable sources among all extracted candidates such that the cumulative reliability of the catalogue is ≥90%. There is no requirement on completeness for the ERCSC. As a result of the Monte-Carlo assessment of reliability of sources from the different techniques, an implementation of the PowellSnakes source extraction technique was used at the five frequencies between 30 and 143 GHz while the SExtractor technique was used between 217 and 857 GHz. The 10σ photometric flux density limit of the catalogue at |b| > 30 ◦ is 0.49, 1.0, 0.67, 0.5, 0.33, 0.28, 0.25, 0.47 and 0.82 Jy at each of the nine frequencies between 30 and 857 GHz. Sources which are up to a factor of ∼2 fainter than this limit, and which are present in “clean” regions of the Galaxy where the sky background due to emission from the interstellar medium is low, are included in the ERCSC if they meet the high reliability criterion. The Planck ERCSC sources have known associations to stars with dust shells, stellar cores, radio galaxies, blazars, infrared luminous galaxies and Galactic interstellar medium features. A significant fraction of unclassified sources are also present in the catalogs. In addition, two early release catalogs that contain 915 cold molecular cloud core candidates and 189 SZ cluster candidates that have been generated using multifrequency algorithms are presented. The entire source list, with more than 15 000 unique sources, is ripe for follow-up characterisation with Herschel, ATCA, VLA, SOFIA, ALMA and other ground-based observing facilities. Key words. cosmology: observations – surveys – catalogs – radio continuum: general – submillimeter: general Corresponding author: R.-R. Chary, e-mail: [email protected] Article published by EDP Sciences A7, page 1 of 26
-
Upload
independent -
Category
Documents
-
view
0 -
download
0
Transcript of Planck early results. VII. The Early Release Compact Source Catalogue

A&A 536, A7 (2011)DOI: 10.1051/0004-6361/201116474c© ESO 2011
Astronomy&
AstrophysicsPlanck early results Special feature
Planck early results. VII. The Early ReleaseCompact Source Catalogue�
Planck Collaboration: P. A. R. Ade76, N. Aghanim50, M. Arnaud63, M. Ashdown61,4, J. Aumont50, C. Baccigalupi74, A. Balbi30,A. J. Banday82,8,68, R. B. Barreiro57, J. G. Bartlett3,59, E. Battaner84, K. Benabed51, A. Benoît49, J.-P. Bernard82,8, M. Bersanelli27,43, R. Bhatia5,
A. Bonaldi39, L. Bonavera74,6, J. R. Bond7, J. Borrill67,78, F. R. Bouchet51, M. Bucher3, C. Burigana42, R. C. Butler42, P. Cabella30,C. M. Cantalupo67, B. Cappellini43, J.-F. Cardoso64,3,51, P. Carvalho4, A. Catalano3,62, L. Cayón20, A. Challinor54,61,11, A. Chamballu47,
R.-R. Chary48, X. Chen48, L.-Y. Chiang53, C. Chiang19, P. R. Christensen71,31, D. L. Clements47, S. Colombi51, F. Couchot66, A. Coulais62,B. P. Crill59,72, F. Cuttaia42, L. Danese74, R. J. Davis60, P. de Bernardis26, A. de Rosa42, G. de Zotti39,74, J. Delabrouille3, J.-M. Delouis51,F.-X. Désert45, C. Dickinson60, J. M. Diego57, K. Dolag68, H. Dole50, S. Donzelli43,55, O. Doré59,9, U. Dörl68, M. Douspis50, X. Dupac34,
G. Efstathiou54, T. A. Enßlin68, H. K. Eriksen55, F. Finelli42, O. Forni82,8, P. Fosalba52, M. Frailis41, E. Franceschi42, S. Galeotta41, K. Ganga3,48,M. Giard82,8, Y. Giraud-Héraud3, J. González-Nuevo74, K. M. Górski59,86, S. Gratton61,54, A. Gregorio28, A. Gruppuso42, J. Haissinski66,
F. K. Hansen55, D. Harrison54,61, G. Helou9, S. Henrot-Versillé66, C. Hernández-Monteagudo68 , D. Herranz57, S. R. Hildebrandt9,65,56, E. Hivon51,M. Hobson4, W. A. Holmes59, A. Hornstrup13, W. Hovest68, R. J. Hoyland56, K. M. Huffenberger85, M. Huynh48, A. H. Jaffe47, W. C. Jones19,
M. Juvela18, E. Keihänen18, R. Keskitalo59,18, T. S. Kisner67, R. Kneissl33,5, L. Knox22, H. Kurki-Suonio18,37, G. Lagache50, A. Lähteenmäki1,37,J.-M. Lamarre62, A. Lasenby4,61, R. J. Laureijs35, C. R. Lawrence59, S. Leach74, J. P. Leahy60, R. Leonardi34,35,23, J. León-Tavares1, C. Leroy50,82,8,
P. B. Lilje55,10, M. Linden-Vørnle13, M. López-Caniego57, P. M. Lubin23, J. F. Macías-Pérez65, C. J. MacTavish61, B. Maffei60, G. Maggio41,D. Maino27,43, N. Mandolesi42, R. Mann75, M. Maris41, F. Marleau15, D. J. Marshall82,8, E. Martínez-González57, S. Masi26, M. Massardi39,S. Matarrese25, F. Matthai68, P. Mazzotta30, P. McGehee48, P. R. Meinhold23, A. Melchiorri26, J.-B. Melin12, L. Mendes34, A. Mennella27,41,
S. Mitra59, M.-A. Miville-Deschênes50,7, A. Moneti51, L. Montier82,8, G. Morgante42, D. Mortlock47, D. Munshi76,54, A. Murphy70,P. Naselsky71,31, P. Natoli29,2,42, C. B. Netterfield15, H. U. Nørgaard-Nielsen13, F. Noviello50, D. Novikov47, I. Novikov71, I. J. O’Dwyer59,
S. Osborne80, F. Pajot50, R. Paladini79,9, B. Partridge36, F. Pasian41, G. Patanchon3, T. J. Pearson9,48, O. Perdereau66, L. Perotto65, F. Perrotta74,F. Piacentini26, M. Piat3, R. Piffaretti63,12, S. Plaszczynski66, P. Platania58, E. Pointecouteau82,8, G. Polenta2,40, N. Ponthieu50, T. Poutanen37,18,1,
G. W. Pratt63, G. Prézeau9,59, S. Prunet51, J.-L. Puget50, J. P. Rachen68, W. T. Reach83, R. Rebolo56,32, M. Reinecke68, C. Renault65, S. Ricciardi42,T. Riller68, I. Ristorcelli82,8, G. Rocha59,9, C. Rosset3, M. Rowan-Robinson47, J. A. Rubiño-Martín56,32, B. Rusholme48, A. Sajina17, M. Sandri42,
D. Santos65, G. Savini73, B. M. Schaefer81, D. Scott16, M. D. Seiffert59,9, P. Shellard11, G. F. Smoot21,67,3, J.-L. Starck63,12, F. Stivoli44,V. Stolyarov4, R. Sudiwala76, R. Sunyaev68,77, J.-F. Sygnet51, J. A. Tauber35, D. Tavagnacco41, L. Terenzi42, L. Toffolatti14, M. Tomasi27,43,
J.-P. Torre50, M. Tristram66, J. Tuovinen69, M. Türler46, G. Umana38, L. Valenziano42, J. Valiviita55, J. Varis69, P. Vielva57, F. Villa42, N. Vittorio30,L. A. Wade59, B. D. Wandelt51,24, S. D. M. White68, A. Wilkinson60, D. Yvon12, A. Zacchei41, and A. Zonca23
(Affiliations can be found after the references)
Received 8 January 2011 / Accepted 30 May 2011
ABSTRACT
A brief description of the methodology of construction, contents and usage of the Planck Early Release Compact Source Catalogue (ERCSC),including the Early Cold Cores (ECC) and the Early Sunyaev-Zeldovich (ESZ) cluster catalogue is provided. The catalogue is based on data thatconsist of mapping the entire sky once and 60% of the sky a second time by Planck, thereby comprising the first high sensitivity radio/submillimetreobservations of the entire sky. Four source detection algorithms were run as part of the ERCSC pipeline. A Monte-Carlo algorithm based on theinjection and extraction of artificial sources into the Planck maps was implemented to select reliable sources among all extracted candidates suchthat the cumulative reliability of the catalogue is ≥90%. There is no requirement on completeness for the ERCSC. As a result of the Monte-Carloassessment of reliability of sources from the different techniques, an implementation of the PowellSnakes source extraction technique was usedat the five frequencies between 30 and 143 GHz while the SExtractor technique was used between 217 and 857 GHz. The 10σ photometric fluxdensity limit of the catalogue at |b| > 30◦ is 0.49, 1.0, 0.67, 0.5, 0.33, 0.28, 0.25, 0.47 and 0.82 Jy at each of the nine frequencies between 30and 857 GHz. Sources which are up to a factor of ∼2 fainter than this limit, and which are present in “clean” regions of the Galaxy where the skybackground due to emission from the interstellar medium is low, are included in the ERCSC if they meet the high reliability criterion. The PlanckERCSC sources have known associations to stars with dust shells, stellar cores, radio galaxies, blazars, infrared luminous galaxies and Galacticinterstellar medium features. A significant fraction of unclassified sources are also present in the catalogs. In addition, two early release catalogsthat contain 915 cold molecular cloud core candidates and 189 SZ cluster candidates that have been generated using multifrequency algorithmsare presented. The entire source list, with more than 15 000 unique sources, is ripe for follow-up characterisation with Herschel, ATCA, VLA,SOFIA, ALMA and other ground-based observing facilities.
Key words. cosmology: observations – surveys – catalogs – radio continuum: general – submillimeter: general
� Corresponding author: R.-R. Chary,e-mail: [email protected]
Article published by EDP Sciences A7, page 1 of 26

A&A 536, A7 (2011)
1. Introduction
Planck1 (Tauber et al. 2010; Planck Collaboration 2011a) isthe third-generation space mission to measure the anisotropyof the cosmic microwave background (CMB). It observes thesky in nine frequency bands covering 30–857 GHz with highsensitivity and angular resolution from 33 arcmin to 4.2 arcmin(Table 1). The Low Frequency Instrument (LFI; Mandolesi et al.2010; Bersanelli et al. 2010; Mennella et al. 2011) covers the30, 44, and 70 GHz bands with amplifiers cooled to 20 K. TheHigh Frequency Instrument (HFI; Lamarre et al. 2010; PlanckHFI Core Team 2011a) covers the 100, 143, 217, 353, 545, and857 GHz bands with bolometers cooled to 0.1 K. Polarisation ismeasured in all but the highest two bands (Leahy et al. 2010;Rosset et al. 2010). A combination of radiative cooling and threemechanical coolers produces the temperatures needed for the de-tectors and optics (Planck Collaboration 2011b). Two data pro-cessing centres (DPCs) check and calibrate the data and makemaps of the sky (Planck HFI Core Team 2011b; Zacchei et al.2011). Planck’s sensitivity, angular resolution, and frequencycoverage make it a powerful instrument for Galactic and extra-galactic astrophysics as well as cosmology.
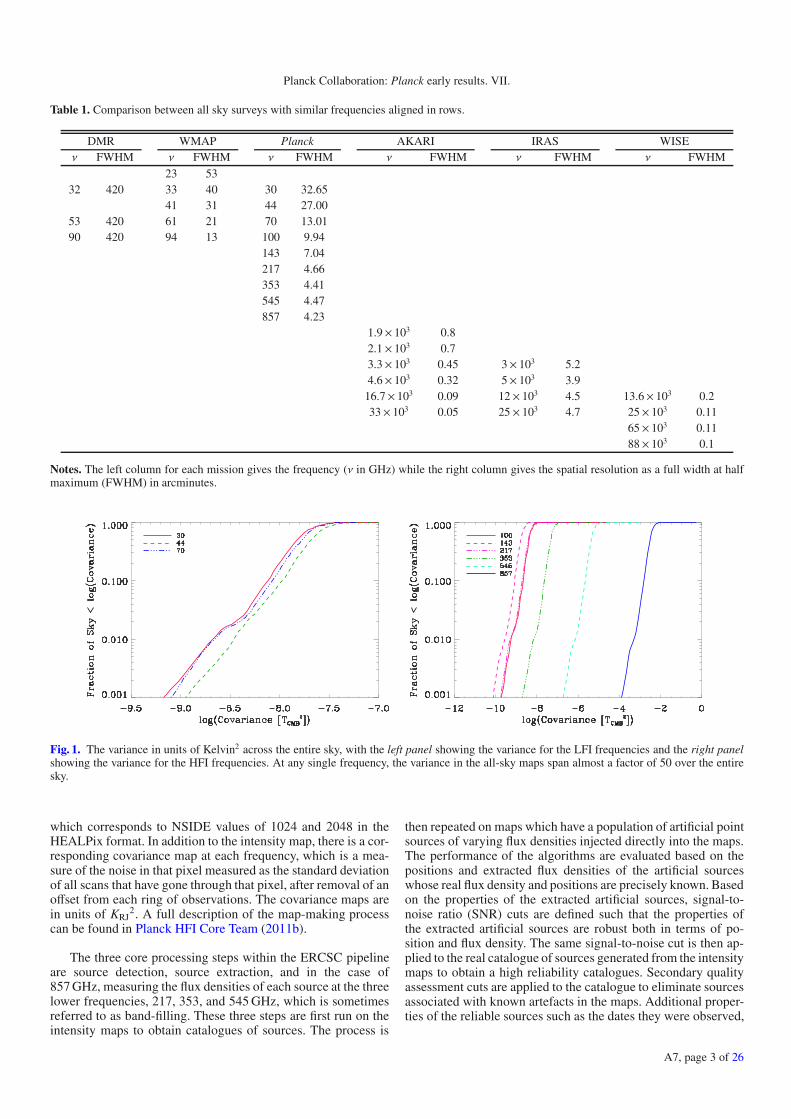
Planck spins around its axis at a rate of one rotation perminute. The focal plane is oriented at an angle of 85◦ to thesatellite spin axis, which tracks the direction of the Sun at ≈1◦per day. The effective Planck scan strategy described in Dupac& Tauber (2005) results in areas near the ecliptic poles be-ing observed several times more frequently than regions of skynear the ecliptic plane. This implies that there is a range ofalmost 50 in instrumental noise between the most- and least-frequently observed areas of the sky (Fig. 1). This scan strat-egy achieved greater than 99.9% coverage of the full sky on1 April 2010 with gaps predominantly resulting from planetcrossings and the masking of associated artefacts. A comparisonbetween the all sky imaging capabilities of Planck, WilkinsonMicrowave Anisotropy Probe (WMAP), COsmic BackgroundExplorer/Differential Microwave Radiometer (COBE/DMR),AKARI, InfraRed Astronomy Satellite (IRAS) and Wide-fieldInfrared Survey Explorer (WISE) is shown in Table 1. Planckstraddles the wavelength range between WMAP (Bennett et al.2003) at one end and AKARI (Murakami et al. 2007) at theother end. At its lowest frequencies Planck improves upon theimaging resolution of WMAP. Although Planck does not havethe high resolution of AKARI or WISE (Wright et al. 2010) athigher frequencies, it matches the capabilities of IRAS at fre-quencies which are more than a factor of three lower than IRAS.The consequence of this unprecedented spatial resolution andwavelength coverage is a unique simultaneous, multiwavelengthview of the sky, enabling the study of a broad class of sources,and facilitating improved separation between Galactic and extra-galactic foregrounds and the CMB.
The Early Release Compact Source Catalogue is a catalogueof all high-reliability sources, both Galactic and extragalactic,detected over the entire sky, in the first Planck all-sky survey.This includes a sample of clusters detected through the Sunyaev-Zeldovich (SZ) effect and a catalogue of cold, molecular cloudcores with far-infrared colour temperatures cooler than the am-bient T ∼ 18 K dust in our Galaxy. No polarisation information
1 Planck (http://www.esa.int/Planck) is a project of theEuropean Space Agency (ESA) with instruments provided by two sci-entific consortia funded by ESA member states (in particular the leadcountries France and Italy), with contributions from NASA (USA) andtelescope reflectors provided in a collaboration between ESA and a sci-entific consortium led and funded by Denmark.
is provided for the sources at this time. One of the primarygoals of the ERCSC is to provide an early catalogue of sourcesfor follow-up observations with existing facilities, in particu-lar Herschel, while they are still in their cryogenic operationalphase. The need for a rapid turnaround (less than nine months)from the end of the first sky coverage to a community-wide re-lease of source lists is the motivating factor behind the reliabilityand flux-density accuracy requirements as well as the choice ofalgorithms that were adopted for the ERCSC.
The sources of noise vary significantly as a function of lo-cation on the sky as well as a function of frequency. Apart fromthe instrumental noise and the Galaxy, at the lowest frequenciesthe dominant astrophysical source of noise is the CMB itself. Atthe highest frequencies, zodiacal dust and emission from the in-terstellar medium dominate. As a result, the flux density limitscorresponding to the same reliability vary widely across the sky(Fig. 1), with the sensitivity typically improving with increasingecliptic latitude. The areas of deepest coverage are centred onthe ecliptic pole regions due to the scan strategy and individualsources in that vicinity may be observed several times by Planckin the course of a single sky survey.
The data obtained from the scans of the sky between 2009August 13 and 2010 June 6, corresponding to Planck opera-tional days 91–389, have been processed and converted into all-sky maps at the HFI and LFI Data Processing Centres (DPCs).The data extend beyond a single sky coverage with 60% of thesecond sky coverage included in the maps. A description of theprocessing can be found in Zacchei et al. (2011); Planck HFICore Team (2011b). Four different implementations of sourcedetection algorithms were run on these maps. The performanceof these algorithms was compared and the single implementa-tion which provides superior source statistics at each frequencywas selected for the final catalogue at that frequency. For theEarly SZ (ESZ) and Early Cold Cores (ECC) catalogues, multi-frequency algorithms described in Melin et al. (2006) and PlanckCollaboration (2011s) respectively, have been run to provide acandidate source list, which has then been culled to maintain thehigh reliability required for the ERCSC. This paper describesthe methodology through which the ERCSC pipeline generatesa high reliability source catalogue as well as presents the con-tents and characteristics of the Planck ERCSC data release.
2. The ERCSC pipeline
This section summarises the steps involved in progressingfrom the initial Planck all-sky maps to the final catalogue.A full description of the entire process can be found inPlanck Collaboration (2011v), which has been released with theERCSC.
The intensity maps on which the ERCSC pipeline is runare in HEALPix format (Górski et al. 2005) in units of KRJ(Kelvin Rayleigh-Jeans, a measure of brightness temperature)in the Galactic coordinate system. Thermodynamic temperature(TCMB) is related to the Rayleigh-Jeans brightness temperatureby:
KRJ = TCMB × x2 exp x(exp x − 1)2
(1)
x =hν
k × 2.725(2)
where h is the Planck constant, k is the Boltzmann constant andν is the frequency. The pixel size is 3.4 arcmin for the LFI bands(30–70 GHz) and 1.7 arcmin for the HFI bands (100–857 GHz)
A7, page 2 of 26
Planck Collaboration: Planck early results. VII.
Table 1. Comparison between all sky surveys with similar frequencies aligned in rows.
DMR WMAP Planck AKARI IRAS WISEν FWHM ν FWHM ν FWHM ν FWHM ν FWHM ν FWHM
23 5332 420 33 40 30 32.65
41 31 44 27.0053 420 61 21 70 13.0190 420 94 13 100 9.94
143 7.04217 4.66353 4.41545 4.47857 4.23
1.9× 10³ 0.82.1× 103 0.73.3× 103 0.45 3× 10³ 5.24.6× 103 0.32 5× 10³ 3.9
16.7× 10³ 0.09 12× 103 4.5 13.6× 10³ 0.233× 10³ 0.05 25× 103 4.7 25× 103 0.11
65× 103 0.1188× 10³ 0.1
Notes. The left column for each mission gives the frequency (ν in GHz) while the right column gives the spatial resolution as a full width at halfmaximum (FWHM) in arcminutes.
Fig. 1. The variance in units of Kelvin2 across the entire sky, with the left panel showing the variance for the LFI frequencies and the right panelshowing the variance for the HFI frequencies. At any single frequency, the variance in the all-sky maps span almost a factor of 50 over the entiresky.
which corresponds to NSIDE values of 1024 and 2048 in theHEALPix format. In addition to the intensity map, there is a cor-responding covariance map at each frequency, which is a mea-sure of the noise in that pixel measured as the standard deviationof all scans that have gone through that pixel, after removal of anoffset from each ring of observations. The covariance maps arein units of KRJ
2. A full description of the map-making processcan be found in Planck HFI Core Team (2011b).
The three core processing steps within the ERCSC pipelineare source detection, source extraction, and in the case of857 GHz, measuring the flux densities of each source at the threelower frequencies, 217, 353, and 545 GHz, which is sometimesreferred to as band-filling. These three steps are first run on theintensity maps to obtain catalogues of sources. The process is
then repeated on maps which have a population of artificial pointsources of varying flux densities injected directly into the maps.The performance of the algorithms are evaluated based on thepositions and extracted flux densities of the artificial sourceswhose real flux density and positions are precisely known. Basedon the properties of the extracted artificial sources, signal-to-noise ratio (SNR) cuts are defined such that the properties ofthe extracted artificial sources are robust both in terms of po-sition and flux density. The same signal-to-noise cut is then ap-plied to the real catalogue of sources generated from the intensitymaps to obtain a high reliability catalogues. Secondary qualityassessment cuts are applied to the catalogue to eliminate sourcesassociated with known artefacts in the maps. Additional proper-ties of the reliable sources such as the dates they were observed,
A7, page 3 of 26

A&A 536, A7 (2011)
their presence in CMB subtracted maps, their flux density esti-mated from point source fitting, and the potential contribution ofGalactic cirrus emission are evaluated in the final stages of thepipeline.
We note that the maps used for the ERCSC are affectedby uncorrected pointing errors of at least two types. Thefirst is due to time-dependent, thermally-driven misalignmentbetween the star tracker and the boresight of the telescope(Planck Collaboration 2011a). The second is due to uncorrectedstellar aberration across the focal plane. Since 70% of the skyis observed at least twice with different orientations, the effectof stellar aberration for the majority of sources is negligible.However, for the remaining 30% of the sky, the effect wouldresult in an offset ranging from 21′′ near the ecliptic poles to avalue close to 0′′ in the ecliptic plane. We do not see this effectclearly in the centroids of sources in the ERCSC, likely becausethe intrinsic uncertainty in the positions is comparable to themaximum offset induced by these pointing errors. Furthermore,since these pointing errors are not factored into the injection ofthe artificial sources into the maps, the positional uncertaintyfrom the Monte-Carlo analysis is an underestimate. The effecton the flux density of the catalogue sources is negligibly small,�2%. Both types of pointing error will be corrected in the mapsused for future Planck catalogues.
2.1. Source detection algorithms
Four specific implementations of source detection algorithmswere run as part of the ERCSC pipeline. These are theParis matched filter (PMF; Melin et al. 2006), IFCA Mexicanhat wavelet filter (IFCAMex; López-Caniego et al. 2007),PowellSnakes (PwS; Carvalho et al. in prep.; Carvalho et al.2009) and SExtractor (Bertin & Arnouts 1996). Some of the al-gorithms are still in development and the results depended onversion of algorithms used and their implementation method-ology in the ERCSC pipeline. Of these, only two were se-lected to generate the final catalogues. The two algorithmswere selected to provide the largest numbers of high reliabilitysources at high Galactic latitude in the Planck maps. These arePwS v2.0 for frequencies 30–143 GHz, and SExtractor for fre-quencies 217–857 GHz.
2.1.1. PowellSnakes
PowellSnakes is a fast Bayesian method for the detection of dis-crete objects immersed in a diffuse background. The applicationof Bayesian model selection and the Bayesian information cri-terion to source detection and extraction have been reviewed byHobson & McLachlan (2003) and Savage & Oliver (2007). PwSbuilds on these ideas and incorporates them in a fast implemen-tation.
The all-sky map is resampled onto a set of overlapping flatpatches using a gnomonic (tangent plane) projection. Each patchis modelled as a set of discrete objects, of known shape, embed-ded in a stochastic background, with added instrumental noise.The object shape is chosen to be a circular Gaussian approx-imation to the effective point spread function (PSF), and thebackground and instrumental noise are modelled as a Gaussianrandom field with power spectrum to be estimated from thedata. Because both the PSF and background vary with sky po-sition, the analysis is performed on overlapping sky patcheswithin which the properties are assumed to be uniform. At highlatitudes and low frequencies the background is dominated by
the CMB, so the Gaussian assumption is a good one; near theGalactic plane, however, the background is dominated by emis-sion from the ISM and the assumption breaks down. In practice,however, PwS gives good results in these cases. At the highestfrequencies SExtractor was found to perform better than PwS,probably because the model of the background statistics is poor,and also because many of the sources are diffuse peaks in theISM emission and are not well represented by the PSF model.
Given these assumptions, PwS estimates source parame-ters by maximising the posterior probability (i.e., the productof the likelihood and an assumed prior), using a simultane-ous multiple maximisation code based on Powell’s directionset algorithm (hence the name) to rapidly locate local maximain the posterior. This novel feature makes PwS substantiallyfaster than Monte-Carlo Markov chain methods used by Hobson& McLachlan (2003). Whether or not a posterior peak corre-sponds to a source is determined by Bayesian model selectionusing an approximate evidence value based on a local Gaussianapproximation to the peak. In this step, PwS minimises the aver-age loss matrix rather than maximising either reliability or com-pleteness: that is, it treats spurious detections and missing detec-tions as equally undesirable.
For detection of sources with high signal-to-noise ratio, PwSis fairly insensitive to the choice of priors. For the version ofthe algorithm which was used for ERCSC, a flat distributionof priors was adopted with the distribution of priors on the in-trinsic source radius being uniform between 0 and 3.′4 for allfrequencies. Since this is smaller than Planck’s spatial resolutionat any frequency, the effect of the priors is to favour pointsources.
After merging the results from each patch, the output of PwSis a set of source positions with estimated flux densities. TheERCSC pipeline photometry algorithms are then applied at eachposition to obtain other measures of flux density and size, takinginto account the instrumental noise in each pixel.
2.1.2. SExtractor
SExtractor (Bertin & Arnouts 1996), as for PwS, requires lo-cal flat patches created from gnomonic projections. Each map ispre-filtered with a Gaussian kernel the same size as the beam ateach frequency (the built-in filtering step within SExtractor is notused as it uses a digitised filtering grid). Typically, a Mexican hatfilter gives slightly more reliable detections of point sources inthe presence of noise and background, although bright extendedsources are often missed. However, a Gaussian filter is adoptedbecause simulations show that it performed almost as well asthe Mexican hat for high-latitude compact sources and is stillsensitive to sources that are extended. The algorithm then findsobjects by isolating connected groups of pixels above a certainn-sigma threshold. Sources which are extremely close to eachother are deblended if a saddle point is found in the intensitydistribution. Spurious detections due to neighbouring bright ob-jects are cleaned, and finally the algorithm determines the cen-troids of each source and performs photometry in an ellipticalKron aperture (Bertin & Arnouts 1996; Kron 1980).
The performance of SExtractor’s own adaptive aperture pho-tometry (MAG_AUTO) is good at high latitudes for all Planckfrequencies, providing flux densities to within 10% accuracy,and errors typically 1–5%. Nevertheless, at low Galactic lat-itudes, particularly at the highest frequencies, the photomet-ric accuracy is significantly degraded. This is because it usesa variable Kron radius, which becomes unstable in crowdedfields with strong residual background fluctuations. To ensure
A7, page 4 of 26

Planck Collaboration: Planck early results. VII.
Table 2. ERCSC catalogue columns.
Column Name DescriptionIdentification
NAME Source nameFLUX Flux density (mJy)FLUX_ERR Flux density error (mJy)CMBSUBTRACT Flag indicating detection of source in CMB subtracted mapsEXTENDED Flag indicating that source is extendedDATESOBS UTC dates at which this source was observedNUMOBS Number of days this source observedCIRRUS Cirrus flag based on 857 GHz source counts
Source positionGLON Galactic longitude (deg) based on extraction algorithmGLAT Galactic latitude (deg) based on extraction algorithmPOS_ERR Standard deviation of positional offsets for sources with this SNR (arcminute)RA Right ascension (J2000) in degrees transformed from (GLON, GLAT)DEC Declination (J2000) in degrees transformed from (GLON, GLAT)
Effective beamBEAM_FWHMMAJ Elliptical Gaussian beam FWHM along major axis (arcmin)BEAM_FWHMMIN Elliptical Gaussian beam FWHM along minor axis (arcmin)BEAM_THETA Orientation of elliptical Gaussian major axis (measured east of Galactic north)
MorphologyELONGATION Ratio of major to minor axis lengths
Source extraction resultsFLUXDET Flux density of source as determined by detection method (mJy)FLUXDET_ERR Uncertainty (1 sigma) of FLUXDET (mJy)MX1 First moment in X (arcmin)MY1 First moment in Y (arcmin)MX2 Second moment in X (arcmin2)MXY Cross moment in X and Y (arcmin2)MY2 Second moment in Y (arcmin2)PSFFLUX Flux density of source as determined from PSF fitting (mJy)PSFFLUX_ERR Uncertainty (1 sigma) of PSFFLUX (mJy)GAUFLUX Flux density of source as determined from 2D Gaussian fitting (mJy)GAUFLUX_ERR Uncertainty (1 sigma) of GAUFLUX (mJy)GAU_FWHMMAJ Gaussian fit FWHM along major axis (arcmin)GAU_FWHMMIN Gaussian fit FWHM along minor axis (arcmin)GAU_THETA Orientation of Gaussian fit major axis
Quality assuranceRELIABILITY Fraction of MC sources that are matched and have photometric errors <30%RELIABILITY_ERR Uncertainty (1 sigma) in reliabiliy based on Poisson statisticsMCQA_FLUX_ERR Standard deviation of photometric error for sources with this SNRMCQA_FLUX_BIAS Median photometric error for sources with this SNRBACKGROUND_RMS Background point source RMS obtained from threshold maps (mJy)
Bandfilling (857 GHz catalogue only)BANDFILL217 217 GHz aperture photometry flux density at 857 GHz source position (mJy)BANDFILL217_ERR Uncertainty in BANDFILL217BANDFILL353 353 GHz aperture photometry flux density at 857 GHz source position (mJy)BANDFILL353_ERR Uncertainty in BANDFILL353BANDFILL545 545 GHz aperture photometry flux density at 857 GHz source position (mJy)BANDFILL545_ERR Uncertainty in BANDFILL545
homogeneous flux density estimates, the primary flux densityestimate is obtained from an external source extraction code, aswas done for PwS.
2.1.3. Flux density estimation
Each source that is extracted has four different measures of fluxdensity associated with it. These are based on aperture photom-etry, PSF fitting, Gaussian fitting and a measure native to thesource detection algorithm (Table 2). Each of these flux densityestimates has a local background subtracted but they have notbeen colour corrected. Colour corrections are available in PlanckCollaboration (2011v).
1. The FLUX and FLUX_ERR columns in the ERCSC FITSfiles give the flux densities measured in a circular aper-ture of radius given by the nominal sky-averaged FWHM.Appropriate corrections have been applied for the flux den-sity outside the aperture, assuming that the source profile isa point source.
2. The PSFFLUX and PSFFLUX_ERR columns give flux den-sities estimated by fitting the source with the Planck pointspread function at the location of the source (Mitra et al.2011). The Planck point spread function is estimated at eachpoint on the sky by combining the individual horn beamswith the scan strategy, where the individual beams are de-rived from when the scans cross planet positions. A 2DGaussian is fit to the PSF and the derived parameters of the
A7, page 5 of 26

A&A 536, A7 (2011)
Gaussian are used to perform a constrained Gaussian fit tothe source.
3. The GAUFLUX and GAUFLUX_ERR columns give fluxdensities estimated by fitting the source with an ellipticalGaussian model whose parameters are free.
4. The FLUXDET and FLUXDET_ERR columns gives theflux densities estimated by the native detection algorithm.For the frequencies at which PwS is used, this is estimatedby utilising the mean of the posterior distribution of all pa-rameters, while for frequencies at which SExtractor is used,it is the flux density in an elliptical Kron aperture, i.e.,FLUX_AUTO. The FLUXDET values at the frequencieswhere PwS is used have been corrected for an average biasthat was seen in the difference between the extracted and in-put flux density of Monte-Carlo sources that were injectedinto the maps. This is most likely due to an inaccurate rep-resentation of the true beam inside the PwS detection algo-rithm. For faint extended sources in the upper HFI frequen-cies, the SExtractor FLUXDET values might be useful.
Once the initial pass of the algorithm generates the list of allsources in the map, the next step is to identify the ones whichare highly reliable, i.e., those that have accurate positions aswell as flux density uncertainties which are less than 30%2. Inthe absence of a “truth” catalogue for the sky, it is not possi-ble to definitively identify reliable sources. The significant fre-quency difference between AKARI, IRAS and Planck at submil-limetre frequencies implies that uncertain extrapolations of thethermal dust spectral energy distribution (SED) need to be madeto force associations between far-infrared sources and Plancksources. At radio frequencies, deeper surveys such as those withthe Green Bank Telescope, Parkes and ATCA have been under-taken (e.g. Gregory et al. 1996; Griffith et al. 1995). However,the flat-spectrum radio sources that dominate the source popu-lation vary significantly even on short time scales. In addition,the high source density of those surveys requires assumptionsabout the thermal and non-thermal spectral indices in order toidentify possible associations between the Planck sources andthe radio sources. Although these ancillary external cataloguesare used for cross-validation of the final ERCSC, the primarymeasure of reliability for the sources uses a Monte-Carlo qualityassessment (MCQA) analysis that is described in the next sec-tion. This is the first application of a Monte-Carlo source char-acterisation algorithm at these frequencies, although the practiseis fairly commonplace at higher frequencies (Chary et al. 2004,and references therein). The process is described below.
2.2. Primary reliability selection: Monte-Carlo analysis
Quality assessment (QA) is an integral step in the validation of acatalogue. It helps quantify flux-density biases and flux-densityuncertainties, positional errors, completeness and reliability ina catalogue. QA metrics based on external (“truth”) cataloguessuffer at the brightest flux densities since source numbers aresparse and resultant QA metrics are dominated by Poisson noise.In addition, generating such a truth catalogue for the sky frompast observational priors, requires uncertain assumptions aboutthe behaviour of sources across a wide range of frequencies. As
2 Spurious sources can be classified as those which have an intrinsicflux density of zero but with some arbitrary extracted flux density, corre-sponding to a flux density error of 100%. The presence of such sourceswould decrease the reliability at the corresponding extracted flux den-sity.
a result, the Monte-Carlo QA approach is adopted as the primarycriterion for selecting high reliability sources.
The goals of the Monte-Carlo QA system are:
1. to quantify flux-density biases and flux-density uncertaintiesas a function of background;
2. to quantify completeness in extracted sources as a functionof flux density;
3. to quantify contamination or “spurious sources” as a functionof flux density;
4. to assess positional offsets between extracted and inputsources;
5. to assess systematic uncertainties associated with beamshape, gaps in coverage, scan strategy, etc.
The first step of the MC QA analysis is to run the ERCSCpipeline on the input maps to generate a source catalogue for thetrue sky. Unresolved point sources, convolved with a circularlysymmetric Gaussian with full-width at half maximum identicalto that of the derived effective beam, are injected into the mapsat random positions and with random flux densities (S ν) and re-run the main ERCSC pipeline. The typical run parameters are1000 sources per iteration, uniformly distributed across the sky.In order to minimise Poisson
√N variation in our estimates of
QA parameters, while keeping confusion low, we execute 10 it-erations. The present set of runs uses a flat dN/dlog S distribu-tion at all flux densities ranging from 100 mJy to 100 Jy. We havepreviously tested Monte-Carlo runs where the injected sourcesfollow a flux-density distribution that is similar to the Plancksky model. No significant differences due to the choice of fluxdensity distribution have been found, particularly because sourceextraction in the Planck maps are not significantly affected bysource confusion.
We note that to precisely assess the performance of thepipeline, including systematic effects associated with the gen-eration of the all-sky maps, the artificial sources should be in-jected into the time-ordered data stream and processed througheach each of the data-processing steps outlined in Zacchei et al.(2011); Planck HFI Core Team (2011b). This however, is pro-hibitively expensive in terms of computational resources andcannot be accomplished at the present time given the rapidturnaround required for the ERCSC.
At the end of the Monte-Carlo runs, we have one cataloguewhich only comprises the sources detected in the original mapand 10 catalogues which have the original sources in additionto the detected fraction of the fake sources that were injectedinto the maps. We first match the sources in the original map toeach of the remaining 10 catalogues with a matching thresholdof twice the FWHM. This leaves only the artificial and spurioussources in the catalogues, whose properties can then be com-pared to the known flux densities and positions of the injectedsources.
Reliability specifies the fraction of extracted sources that dif-fer from their input flux densities to within 30%. This is based onthe flux density accuracy requirement for the ERCSC. Imposingthe requirement implies that the catalogue is equivalent to a cat-alogue with a >5σ cut if the noise were Gaussian. That is, atypical 5σ source would have a flux density error that is smallerthan 20%, 68% of the time, which translates to a flux density er-ror of <30% for 90% of the sources, for a Gaussian distributionof errors. It is well known that the contribution from the Galaxyand the CMB results in a non-Gaussian distribution for the back-ground RMS, at least on large spatial scales. Future work will at-tempt to build upon our increased knowledge of the foregrounds
A7, page 6 of 26

Planck Collaboration: Planck early results. VII.
Fig. 2. Plots showing the results of the Monte-Carlo analysis at 30 GHz with the PwS algorithm. The upper two rows shows the results when theflux density of sources is from FLUXDET while the lower two rows shows the results when the flux density of sources is from FLUX. The setof 3 plots in the top-left and bottom-left corner show the all-sky flux-density uncertainty, differential reliability and differential completeness ofthe Monte-Carlo sources as a function of SNR where signal may be FLUX or FLUXDET and the noise is the background RMS. The set of fourplots at the top right and bottom right show (left to right, top to bottom) the fractional flux density uncertainty, (S in − S out)/S in (see Sect. 5.1), thedistribution of the absolute positional offset, differential positional offset, as well as completeness and contamination (1-reliability converted to apercentage) as a function of flux density for the half of the sky with the lowest sky background RMS. The range of sky background RMS convertedto a point source flux density uncertainty, is shown in the inset in mJy. The primary source selections in the catalogues are based on the reliabilityvs output flux density/background RMS plots such that the cumulative reliability (integral of the differential reliability) is greater than 90%.
from the Planck maps and undertake a more precise characteri-zation of the noise.
The reliability is measured as a function of root-mean-square(RMS) signal-to-background where the signal is a measure ofthe flux density of the source and therefore either FLUX orFLUXDET. The background RMS is derived from the RMSmeasured in a 2◦ radius annulus on the maps after individual
detected sources are masked. The choice of 2◦ was made empir-ically. It was found that if the outer radius were too small, i.e.,tens of minutes of arc, the RMS was similar to the RMS returnedby the detection algorithms which detect sources as peaks abovethe local RMS. These RMS returned by the codes are typicallylower than the RMS measured in the larger annulus used here.If the outer radius were too large (several degrees), background
A7, page 7 of 26

A&A 536, A7 (2011)
structure gets smoothed out. A radius of 2◦ represents a trade-off between these two extremes and yields a background RMSwhich is a combination of substructure in the background andthe instrumental noise in the maps. The RMS is converted to a1σ background RMS for a point source, by integrating over thePlanck beam.
Figure 2 shows the flux-density accuracy, the positional ac-curacy and the differential reliability as a function of SNR at30 GHz based on the artificially injected Monte-Carlo sources.The differential reliability is simply the reliability in each binof SNR while the cumulative reliability is the integral of thedifferential reliability above a particular SNR value. Also shownin Fig. 2 is the flux density accuracy, positional uncertainty, com-pleteness and reliability as a function of flux density for the halfof the sky with the lowest sky background RMS. Due to the dif-ferences between how FLUX and FLUXDET are estimated, thetop panels and lower panels are not the same. First, FLUXDETflux densities have a larger scatter at almost all SNR ratios com-pared to FLUX. This is partly due to the prior assumptions onthe source profile that are made in the estimation of FLUXDET.Deviations from this assumed source profile result in errors inthe derived flux density.
Second, the FLUXDET reliabilities appear to be higher atlow SNR compared to the FLUX based reliability values. At lowvalues, the aperture flux-density based FLUX estimates tend tobecome increasingly affected by sky noise and even the back-ground estimation becomes more uncertain. FLUXDET valuesare derived assuming a fixed source shape and a flat background.As a result, for point sources, the scatter in FLUXDET values atlow SNR is smaller. When the error in the flux density estimateexceeds 30%, the reliability decreases. We note that the uncer-tainty on the reliability estimate is dominated by the Poissonstatistics of the number of sources in the corresponding SNRbins. That is, if the completeness in a particular SNR bin is low,the uncertainty on the reliability is high. The typical uncertaintyon the reliability estimate in a particular SNR bin is about 5%.
Also shown in Fig. 2 is the histogram of separations betweenthe injected and extracted positions. The 1σ positional offset isapproximately 230 arcsec in low background regions, which isalmost FWHM/10 at 30 GHz.
The completeness plots for the Monte-Carlo point sourcesare shown for illustrative purposes for the half of the sky with thelowest background RMS. Without factoring in the source sizedistribution and flux density distribution of the real source pop-ulations, as well as the fraction of sky observed with a particularamount of exposure time, the completeness plot cannot be usedto directly infer the actual completeness of the ERCSC.
Figures 3 and 4 show similar plots for the Monte-Carlosources at 143 and 857 GHz. Interesting trends can be observedby comparing these plots. The obvious one is an improvementin positional accuracy with increasing frequency due to the spa-tial resolution of Planck improving with increasing frequency.Another interesting trend is the evolution in the range of back-ground RMS values for the cleanest half of the sky, which isprovided in mJy in the numbers following “RMS:”. The num-bers indicate that the background RMS is the largest at 857 GHzdue to the enhanced contribution of ISM emission.
The SNR values of the real sources are then estimated fromthe ratio of FLUX/Background RMS or FLUXDET/BackgroundRMS. The reliability of the Monte-Carlo sources shown in theseFigures is applied to the real sources using the SNR value as thecomparison metric. These reliability values are between 0 and 1although the minimum over all frequencies after the cumulativereliability cuts are applied is 0.74. If an arbitrary source has a
reliability of 0.74, it implies that 74% of the time, a source lyingin a patch of sky with similar sky noise will have an estimatedflux density that is accurate to within 30%.
Once the differential reliability of each source in the origi-nal map has been estimated, the sources are sorted in decreas-ing order of SNR. The differential reliability is converted toa cumulative reliability by integrating the differential reliabil-ity over increasing SNR values. We imposed a cumulative re-liability threshold of 90% and a maximum standard deviationin the reliability of 10% for the ERCSC. This is the primarycriterion used to select high reliability sources. The reliabilitycut is applied to both the FLUX/Background RMS as well asthe FLUXDET/Background RMS, since these are two distinctmeasures of flux density and the resultant catalogue is the unionof the two reliability cuts. The union is selected to maximisesource counts since different measures of flux density tend to bemore accurate in different regimes as described in Sect. 5.1.
The technique that is chosen at each frequency is the onethat returns the maximum number of |b| > 30◦ sources above acumulative reliability of 90%. These happen to be our particularimplementation of PwS between 30 and 143 GHz and SExtractorbetween 217 and 857 GHz.
2.3. Secondary cuts in selection of sources
The primary selection criteria described above have been aug-mented by a set of secondary cuts which take into account knownsource artefacts in the maps.
First, the transit of bright sources (especially planets) acrossthe beam results in a pattern of bright and dark patches thatis repeated every 36 arcmin along the scan pattern, in the up-per HFI bands (Planck HFI Core Team 2011b). These are dueto the imprecise removal of an instrumental artefact (the 4 Kcooler spectral line). A subset of these patterns have been vi-sually identified in the maps and masks have been generated forthose patches of sky. These masks are reflected in the incompletesky coverage in Table 3. If more than 5% of the pixels within oneFWHM from the source fall on the mask, the source is rejected.
Second, there are known gaps in the maps associated withthe masking of planets and asteroids3. If sources have any oftheir pixels within one FWHM falling on such a gap, the sourceis rejected. This prevents edge effects due to the side lobes ofbright planets from being classified as sources and also preventsthe introduction of large errors in the photometry of sources.
Third, sources are also required to have either an aperture-photometry S NR ≥ 5 (FLUX/FLUX_ERR ≥ 5) or a detectionmethod photometry S NR ≥ 5 (FLUX/FLUXDET_ERR ≥ 5).The distinction is important, due to the fact that the photometryfrom the PowellSnakes implementation consistently underesti-mates the flux density for even marginally extended sources atthe lower frequencies.
Fourth, due to the requirements on the flux-density accuracyin the ERCSC, the standard deviation in the photometric errorfor the artificial sources with the same SNR as the real source isrequired to be less than 30%.
3 The following objects have been masked in the map making.Asteroids: 10 Hygiea, 11 Parthenope, 128 Nemesis, 12 Victoria,13 Egeria, 14 Irene, 15 Eunomia, 16 Psyche, 18 Melpomene,19 Fortuna, 1 Ceres, 20 Massalia, 29 Amphitrite, 2 Pallas,324 Bamberga, 3 Juno, 41 Daphne, 45 Eugenia, 4 Vesta, 511 Davida,52 Europa, 704 Interamnia, 7 Iris, 88 Thisbe, 8 Flora, 9 Metis.Comets: Broughton, Cardinal, Christensen, d’Arrest, Encke, Garradd,Gunn, Hartley 2, Holmes, Howell, Kopff, Kushida, LINEAR, Lulin,McNaught, NEAT, Shoemaker-Levy 4, SidingSpring, Tempel 2, Wild 2.
A7, page 8 of 26

Planck Collaboration: Planck early results. VII.
Fig. 3. As in Fig. 2 but at 143 GHz with the PwS algorithm.
Fifth, in order to remove extended sources associated withsubstructure in the Galactic ISM, we eliminate non-circularsources (ELONGATION ≤ 3) in the upper HFI bands. Theseare sources whose ratio of major to minor axis is greater thanthree.
As a sixth criterion, we also insist that the aperture flux den-sity is positive (APERFLUX ≥ 0), which alleviates problemsdue to sources whose sky background estimate is biased high bythe presence of bright sources in the sky annulus. These sourceswill have uncertain photometry and are therefore rejected.
The final ERCSC compilation is the list of sources whichhave satisfied the primary Monte-Carlo based reliability criterionas well as all the aforementioned secondary QA criteria. These
cuts imply that about half the sources in the uncut lower fre-quency catalogues and about a third of the sources in the upperfrequency catalogues are classified as high reliability sources.
As mentioned earlier, each source has four different mea-sures of flux density associated with it. These flux density valueshave not been colour corrected. Users should identify appropri-ate colour corrections from Planck Collaboration (2011v) andapply them to the flux densities. The absolute calibration un-certainty of the HFI and LFI instruments is better than 7% at allfrequencies (Zacchei et al. 2011; Planck HFI Core Team 2011b).However, the requirements on the ERCSC are a photometric ac-curacy of 30%.
A7, page 9 of 26

A&A 536, A7 (2011)
Fig. 4. As in Fig. 2 but at 857 GHz with the SExtractor algorithm.
3. Characteristics of the ERCSC
3.1. Sky coverage and sensitivity
Table 3 shows the fraction of sky coverage, the beam FWHM andthe sensitivity of the ERCSC after all cuts have been applied.Although the 10σ values are quoted, sources which are up toa factor of ∼2 fainter and located in regions of low sky back-ground are included in the ERCSC since they meet the highreliability criterion described in the previous section. As an il-lustration, Fig. 5 shows the flux density limit of Planck bothin the Galactic plane (|b| < 10◦) and at high Galactic latitude(|b| > 30◦) relative to other wide area surveys at comparablefrequencies. Also shown are the spectrum of typical sources of
foreground emission. Figures 6 show the all sky distribution ofsources colour coded by flux density.
3.2. Statistical nature of sources
In this section, we characterise the sources detected by Planckat each frequency. A source, called source one, at frequency oneis associated with a source, called source two, at frequency two,if it lies within (FWHM1 + FWHM2) /2, if source two is theclosest source at frequency two to source one, and vice versa.The results are summarised in Table 4. Naturally, at the lowestfrequency, 30 GHz, it is impossible to find associations at a lowerfrequency and hence columns B & C are blank. Similarly, at the
A7, page 10 of 26

Planck Collaboration: Planck early results. VII.
Fig. 5. The Planck ERCSC flux density limit quantified as the faintest ERCSC source at |b| < 10◦ (dashed black line) and at |b| > 30◦ (solid blackline) is shown relative to other wide area surveys. Also shown are the spectra of known sources of foreground emission as red lines; these include aS ν ∼ ν−0.7 synchrotron component, ν−0.1 free-free component, a Rayleigh-Jeans component and a ν2 emissivity blackbody of temperature 18 K. TheERCSC sensitivity is worse in the Galactic plane due to the strong contribution of ISM emission especially at submillimetre wavelengths. In theradio regime, the effect is smaller. The faintest WMAP 7 year 5σ sources are derived from the catalogue of Gold et al. (2011); Wright et al. (2009).Although the flux density limits of WMAP and Planck appear to be comparable at the lowest frequencies, the Planck ERCSC is more completeas discussed in Sect. 4. The GB6 sensitivity value is from Gregory et al. (1996), AT20G flux limit from Murphy et al. (2010), SCUBA-2 All SkySurvey (SASSy) limit from the Joint Astronomy Center website while the IRAS flux density limits are from the IRAS explanatory supplement(Beichman et al. 1988).
Table 3. Planck ERCSC characteristics.
Freq [GHz] 30 44 70 100 143 217 353 545 857λ [μm] 10000 6818 4286 3000 2098 1382 850 550 350Sky coverage in % 99.96 99.98 99.99 99.97 99.82 99.88 99.88 99.80 99.79Beam FWHM [arcmin]a 32.65 27.00 13.01 9.94 7.04 4.66 4.41 4.47 4.23# of sources 705 452 599 1381 1764 5470 6984 7223 8988# of |b| > 30◦ sources 307 143 157 332 420 691 1123 2535 4513
10σb [mJy] 1173 2286 2250 1061 750 807 1613 2074 296110σc [mJy] 487 1023 673 500 328 280 249 471 813Flux density limitd [mJy] 480 585 481 344 206 183 198 381 655
Notes. (a) The precise beam values are presented in Zacchei et al. (2011) and Planck HFI Core Team (2011b). This table shows the values whichwere adopted for the ERCSC. (b) Flux density of the median >10σ source at |b| > 30◦ in the ERCSC where σ is the photometric uncertainty of thesource. (c) Flux density of the faintest >10σ source at |b| > 30◦ in the ERCSC. (d) Faintest source at |b| > 30◦ in the ERCSC.
highest frequency, 857 GHz, it is impossible to find associationsat a higher frequency and hence columns B & D are blank.
We find that at 30 GHz, where the radio spectrum mighthave a significant optically thin synchrotron emission compo-nent (which implies decreasing flux density with increasing
frequency), the number of sources seen in the adjacent passbandis 54%. Similarly, at the highest frequency where the thermaldust emission has a steep spectrum of the form S ν ∼ ν3+β, thefraction of 857 GHz sources seen at 545 GHz is predictably lowdue to the relative sensitivities of the two bands. However, at the
A7, page 11 of 26

A&A 536, A7 (2011)
Fig. 6. Sky distribution of sources in Galactic coordinates at all nine Planck frequencies. Sources are colour coded by flux density. In the Galacticplane, due to strong emission from the ISM, there is a paucity of faint sources. The higher density of sources in the LMC region is also noticeable.
A7, page 12 of 26

Planck Collaboration: Planck early results. VII.
Fig. 7. The distribution of spectral indices (α where S ν ∝ να) for sources within 10◦ of the Galactic plane. Each panel shows the spectral indexdistribution for ERCSC sources at the corresponding Planck band.
Table 4. ERCSC source characterisation.
Frequency A B C D E F30 705 ... ... 379 379 0.5444 452 334 379 388 433 0.9670 599 363 389 520 546 0.91100 1381 496 520 1104 1128 0.82143 1764 929 1106 1357 1534 0.87217 5470 1067 1357 4190 4480 0.82353 6984 2848 4189 4244 5585 0.80545 7223 3404 4245 5363 6204 0.86857 8988 ... 5365 ... 5365 0.60
Notes. (A) Total number of sources detected. (B) Number of sources de-tected both at frequency just below and just above given frequency.(C) Number of sources detected at frequency just below given fre-quency. (D) Number of sources detected at frequency just above givenfrequency. (E) Number of sources detected either at frequency just belowor just above given frequency. (F) Fraction of sources detected either atfrequency just below or just above given frequency.
intermediate frequencies, the fraction of sources which are asso-ciated with sources in the adjacent bandpasses is high. Althoughthe fraction of associations is not 100%, we can use the spectralinformation from these associations to characterise the nature ofsources at each frequency.
The spectral index is calculated by fitting a single powerlaw (S ν ∝ να) to the flux density of sources in adjacent bands.For 30 GHz sources, only the 30 and 44 GHz flux densities of
sources are considered. Similarly, at 857 GHz, only the 545 and857 GHz flux densities of sources are fit. For all the intermediatebands, the frequencies just below and just above are included inthe fit, if the source is detected in the ERCSC.
Figure 7 shows the distribution of spectral indices for thesources within |b| < 10◦ which are likely to be sources withinour Galaxy. At low frequencies, the median SED of sources inthe Galactic plane is an S ν ∝ ν−0.5 spectrum. The distribution ofα values significantly broaden between 30 and 100 GHz, likelydue to varying amounts of free-free emission along differentsightlines. At 100 GHz, the spectrum becomes noticeably flat-ter with a median α = −0.25, partly due to the increasing con-tribution of thermal dust emission and partly due to the largecontribution from the CO line to the 100 GHz flux density. At143 GHz, the spectral index distribution shows the presence ofboth radio sources as well as the dominant contribution fromsources with thermal dust emission. Expectedly, at higher fre-quencies, the distribution of spectral indices is narrow and iscentred between α = 2 and α = 3, tracing the Rayleigh-Jeanscomponent of dust emission. The reason the median α is almost3 at 217 GHz but evolves to 2 at 857 GHz is a selection effect. Ascan be seen in Fig. 5, thermal dust emission with emissivity >0would increase faster with increasing frequency compared to aRayleigh-Jeans spectrum, relative to the Planck sensitivity. As aresult, sources at the intermediate frequencies can span a broaderrange of spectral indices than a faint source at 857 GHz whichwould have an estimated spectral index only if it were detectedat 545 GHz, and thereby preferentially have a spectrum that isless steep.
A7, page 13 of 26

A&A 536, A7 (2011)
Fig. 8. The distribution of spectral indices for sources above 30◦ of the Galactic plane, likely to be dominated by extragalactic sources.
Figure 8 shows the distribution of spectral indices for thesources at |b| > 30◦ which are likely to be extragalactic. Atthe lower frequencies, the distribution of spectral indices iscentred at α = 0. However, unlike the Galactic sources wherethe distribution broadens with increasing frequency, among theextragalactic sources, the spectral index distribution narrowsbetween 30−100 GHz. There are two possible origins for this.One is that the CO contribution is generally negligible for theextragalactic sources and that the larger distribution of spec-tral indices around 100 GHz for the Galactic sources is simplya tracer of variation of the CO contribution to the broadbandphotometry. A second possibility is that the spectral index dis-tribution of Galactic sources is intrinsically broader while theextragalactic sources at 100 GHz are dominated by a power-lawdistribution of electrons produced in relativistic shocks, whichtend to display a more uniform power-law index. At 143 and217 GHz, the radio source population continues to dominate al-though the dusty sources start to become significant. This isin contrast to the Galactic population where the infrared lumi-nous sources are the dominant contributor. It is also striking thateven at 353 GHz, the radio source population continues to makea significant contribution. At the highest frequencies, both theGalactic and extragalactic source populations show similar be-haviour expected from the Rayleigh-Jeans tail of dust emission.
A comparison with the statistical properties of sourcesfound in the South Pole Telescope 1.4 mm and 2 mm surveys(Vieira et al. 2010) is warranted. The SPT surveys found that∼30% of the 1.4 mm sources are dusty while the majority aresynchrotron dominated. This is similar to the results for the high
Galactic latitude ERCSC sources;∼25% of the ERCSC 217 GHzsources show an SED consistent with thermal dust emission. Thedifference however is that the dusty sources observed by the SPTdominate at fainter flux densities (<15 mJy). In contrast, thedusty population in the ERCSC appears to be at brighter fluxdensities with a median FLUX of 2.4 Jy, while the synchrotronsources have a median FLUX of 0.8 Jy. This difference is be-cause the ERCSC 217 GHz dusty sources are associated withthe Large Magellanic Cloud and are thereby brighter than thetypical dusty sources that the SPT has observed.
3.3. Individual case studies
The SED of representative sources of different classes that canbe found in the ERCSC are presented in this sub-section. Theselected sources are a pre-stellar core L1544 (Ward-Thompsonet al. 2002), an extragalactic radio source Centaurus A, a syn-chrotron dominated radio galaxy Pictor A, IRC+10216 whichis the prototype of stars with dust shells, the starbursting ul-traluminous infrared galaxy Arp 220 and the cold stellar coreECC G176.52-09.80. The sensitivity and wavelength coverageof Planck enables synchrotron emission, thermal bremsstrahlungemission, thermal dust emission as well as the transition fre-quencies between the emission processes to be studied. Figure 9shows the SED of these representative sources.
Since some of these sources are extended at the Planck an-gular resolution, the ERCSC Gaussian fit flux densities (i.e.“GAUFLUX”) are shown, except in the cases where the fit failedin the low signal-to-noise regime. In those cases the aperture
A7, page 14 of 26

Planck Collaboration: Planck early results. VII.
Fig. 9. The SED of representative source classes in the ERCSC. The plotshows a pre-stellar core L1544, an extragalactic radio source CentaurusA, a synchrotron dominated radio galaxy Pictor A, IRC+10216 whichis the prototype of stars with dust shells, the starbursting ultraluminousinfrared galaxy Arp 220 and the cold stellar core ECC G176.52-09.80.IRAS or ISO flux densities are shown as solid squares while the Planckflux densities are shown as stars. The Planck ERCSC enables a diverseclass of sources to be studied over a broad range of frequencies and fluxdensities.
photometry values (i.e. “FLUX” in the ERCSC) are plotted.Uncertainties include the Monte-Carlo estimate of flux densityuncertainties. The plotted SED also show IRAS and/or ISO fluxdensities at far-infrared wavelengths. Planck can clearly re-veal the contribution of cold dust at wavelengths longward ofIRAS/ISO and observe the transition from thermal dust emis-sion to synchrotron/free-free radio emission.
4. Validation of the ERCSC
At the three lowest frequencies of Planck, it is possible tovalidate ERCSC source identifications, reliability, positionalaccuracy and flux density accuracy using external data sets,particularly large-area radio surveys. This external validationwas undertaken using the following catalogues and surveys:(1) full sky surveys and catalogues: WMAP 5-year catalogue(Wright et al. 2009) and the NEWPS catalogue, based on earlierWMAP results (Massardi et al. 2009); (2) in the southern hemi-sphere the AT20G survey at 20 GHz (Murphy et al. 2010); (3)in the northern hemisphere, where no large-area, high-frequencysurvey like AT20G is available, we used CRATES (Healey et al.2007).
An ERCSC source was considered reliably identified if itfalls within a circle of radius one half the Planck beam FWHMwhich is centered on a source at the corresponding frequencyin one of the above catalogs. This means of identification wasemployed at |b| > 5◦ where confusion was less of a problemand the majority of the sources were extragalactic. Very fewsuch sources were spatially resolved by Planck. Table 5 showsthe percentage of sources thus identified. For the three lowestPlanck frequencies and for |b| > 5◦, the ERCSC clearly meetsits 90% reliability specification as measured by this external val-idation. Table 5 also displays results of an attempt to assess reli-ability of ERCSC sources in the Galactic plane at |b| < 5◦. Here,an ERCSC source was considered reliably identified if it fallswithin 5 arcmin from Galactic objects like planetary nebulae, su-pernova remnants, HII regions (or in a few cases, extragalactic
sources that happen to be found at low Galactic latitude). Thepercentage of identifications in the Galactic plane is lower, butstill leaves the overall reliability figures at greater than 90%,meeting the ERCSC specification for reliability.
We also examine the positional accuracy of ERCSC sourcesby comparing positions taken from the ERCSC with those deter-mined quasi-simultaneously using the Very Large Array (VLA)of the US National Radio Astronomy Observatory. ERCSCpositions were also compared to the positions of several hun-dred bright quasars (Fig. 10) at frequencies of 353 GHz and be-low where a significant fraction are detected. The median scatterin offset for frequencies 30–217 GHz was 2.0, 1.7, 1.1, 0.8, 0.7,0.3 and 0.35 arcmin. The results of these two tests are consis-tent, and suggest that the ERCSC clearly meets its specificationof RMS scatter in positions being less than FWHM/5.
A comparison between the ERCSC flux densities withVLA measurements of the same source has also been made(Fig. 11) and is discussed in Planck Collaboration (2011j). Atboth 30 and 44 GHz the two flux density scales appear to be ingood overall agreement with any difference attributable partly tonoise in the Planck measurements and partly due to variability inthe radio sources, since the Planck and VLA measurements werenot exactly simultaneous. At 70 GHz however, the comparisonis challenging since the VLA measurements are made at 43 GHzand an extrapolation needs to be made assuming some spectralindex for the source. If a simple extrapolation to a 70 GHz fluxdensity is made based on the VLA 22–43 GHz spectral index,the extrapolated VLA values are either too high or the flux den-sity scale of Planck is too low. The most likely interpretationof this discrepancy is that the spectral index of radio sourcesdetected by Planck steepens at frequencies above 44 or 70 GHz.If, for instance, a spectral index change of α = −0.5 is allowedat frequencies above 43 GHz, the agreement between the extrap-olated and measured 70 GHz fluxes would be entirely acceptable(Planck Collaboration 2011j).
A comparison between the ERCSC sources and theWMAP point source catalogue was also undertaken. TheWMAP seven-year catalogue (Gold et al. 2011) contains a to-tal of 471 sources in the five WMAP bands. We have comparedthe WMAP 5σ sources at 33, 41, 61, 94 GHz with the sourcesin the ERCSC at 30, 44, 70 and 100 GHz, respectively. A searchradius corresponding to the FWHM of the WMAP beam at eachfrequency (0.66◦, 0.51◦, 0.35◦, 0.22◦ at 33 to 94 GHz chan-nels) is used to find a match of WMAP sources in the ERCSC.Figure 12 shows the histogram distribution of WMAP flux den-sities; the WMAP 5σ sources are shown in gray, and the oneswith an ERCSC match are in red. The ERCSC include 88%,62%, 81% and 95% of the WMAP 5σ sources at the four bands,individually. Figure 13 is a similar plot, but shows the histogramdistribution of the ERCSC flux densities: the ERCSC sources areshown in gray, and the ones with a WMAP match are in red. TheWMAP seven-year point source catalogue mask which excludesthe Galactic plane and the LMC/SMC region has been appliedto the ERCSC beforehand to ensure the same sky coverage. It isevident that the ERCSC is a much deeper and more complete cat-alogue than the WMAP 7 year catalog, especially at the 100 GHzchannel.
The WMAP 5σ detections that are missed in the ERCSCat 30, 70 and 100 GHz are further investigated. The 44 GHzchannel is skipped since it is known to have lower sensitiv-ity compared to the WMAP 7-year data. It is found that at100 GHz, all the missed WMAP sources can be explained byeither the WMAP source not having a 5 GHz counterpart oronly being weakly associated with a 5 GHz source suggesting
A7, page 15 of 26

A&A 536, A7 (2011)
Table 5. ERCSC source validation.
Frequency # At |b| > 5◦ # Identified # At |b| < 5◦ # Identified Total # # Identified30 563 547 (97%) 142 95 (67%) 705 642 (91%)44 278 265 (95%) 176 144 (82%) 454 409 (90%)70 320 289 (90%) 280 ... 600 ...
that the WMAP source might be spurious. At 70 GHz, ∼41% ofthe unmatched sources are variable (this is a lower limit as thevariability info was obtained from the WMAP five-year catalog,which is a subset of the WMAP seven-year catalog), ∼13% ofthe unmatched sources have no 5 GHz ID or are only looselyassociated with a 5 GHz source, ∼38% are recovered after theCMB subtraction. At 30 GHz, ∼17% of the unmatched sourcesare variable (again, this is only a lower limit), ∼34% of theunmatched sources have no solid identification, ∼54% are re-covered after the CMB subtraction. This analysis suggests thatthe reason these sources are not detected in Planck is a combi-nation of source variability, map sensitivity (different scanningstrategy of WMAP and Planck result in a difference in the localbackground noise; also the ERCSC is based on 1.6 sky surveyswhereas the WMAP catalogue is based on 14 sky surveys), andincompleteness of the ERCSC.
The similarity between the WMAP frequencies and Planckbands also motivates a comparison between their flux densitieswhich is shown in Fig. 14. Overall we find there is no system-atic difference between the WMAP and ERCSC flux densitiesat the corresponding bands. The significant scatter in Fig. 14again indicates that variability is an issue. There is no variabilityanalysis of the WMAP seven-year point sources, but an analysisof the variability on the five-year WMAP point sources men-tioned above, shows that a high fraction of the sources are vari-able at greater than 99% confidence, and these are in general thebrighter sources (Wright et al. 2009).
5. The ERCSC: access, contents and usage
The ERCSC is available from both the ESA Planck LegacyArchive4 and the NASA Infrared Science Archive5 (IRSA).
The source lists contain 35 columns per source at the LFIbands and 36 columns at the HFI bands. The 857 GHz sourcelist has six additional columns which consist of the band-filledflux densities and flux uncertainties at the three adjacent lowerfrequencies, 217, 353 and 545 GHz for each source detected at857 GHz. The locations of sources are provided in Galactic co-ordinates. In addition, we also provide for each detected source,a postage-stamp cutout of the source from the all sky map ofthe corresponding frequency after the CMB has been subtracted.The size of the cutout is a square of side 4× FWHM at the corre-sponding frequency. The primary purpose of these cutouts is toaid in the visual validation of sources. We also provide notesin a text file, one per frequency, for particular sources in thecatalogues which state associations of the ERCSC source withsources in ancillary catalogues (e.g. IRAS, GB6, WMAP) aswell as potential variability information.
Including the ECC and ESZ, the entire data release thus con-sists of 11 source list files, 11 all-sky source distribution maps,11 notes files and postage-stamp cutouts in JPEG format of allthe sources detected at the nine individual frequencies as well as
4 http://www.sciops.esa.int/index.php?project=planck&page=Planck_Legacy_Archive5 http://irsa.ipac.caltech.edu/Missions/planck.html
in the ECC list. No postage stamp cutouts are provided for theESZ.
5.1. Catalogue contents and usage
The key columns in the catalogues are:
1. source identification: NAME (string);2. position: GLON, GLAT, POS_ERR which gives the Galactic
coordinates in degrees and the estimated 1σ positional un-certainty in arcminutes;
3. flux density: FLUX, FLUX_ERR in mJy measured in a cir-cular aperture with radius equal to the nominal FWHM ofthe beam.
The one additional column for the HFI bands compared to theLFI bands is due to the inclusion of a cirrus estimate, describedbelow.
Individual sources can be searched for in the list either byGalactic coordinates (GLON, GLAT), or by the equivalent J2000equatorial coordinates (RA, DEC). The 1σ positional uncer-tainty for a source, given by POS_ERR in arcminutes, dependson the local background RMS and SNR. This uncertainty is onlya measure of the uncertainty for fitting the location of the sourcein the maps and does not take into account any astrometric off-set in the maps. Furthermore, POS_ERR is measured from thepositional uncertainty of artificial point sources injected into themaps. As a result, sources might have larger positional uncer-tainties which are not reflected in this value (see Sect. 2).
When a source is classified as extended, we setEXTENDED = 1. This implies that the square root of theproduct of the major and minor axis of the source is 1.5 timeslarger than the square root of the major and minor axis of theestimated Planck point spread function at the location of thesource, i.e.,√
GAU_FWHMMAJ × GAU_FWHMMIN >
1.5 ×√
BEAM_FWHMMAJ × BEAM_FWHMMIN. (3)
In the upper HFI bands, sources which are extended tend to beassociated with structure in the Galactic interstellar medium al-though individual nearby galaxies are also extended sources asseen by Planck (see Planck Collaboration 2011l). The choiceof the threshold being set at 1.5 times the beam is motivatedby the accuracy with which source profiles can be measuredfrom maps where the point spread function is critically sampled(1.7′ pixel scale for a ∼4′ FWHM). Naturally, faint sources forwhich the Gaussian profile fit might have failed do not have theEXTENDED tag set.
As described in Sect. 2.1.3, four measures of flux densityare provided in mJy. For extended sources, both FLUX andPSFFLUX will likely be significant underestimates of the truesource flux density. Furthermore, at faint flux densities corre-sponding to low signal-to-noise ratios (less than 20), the PSF fitmight have failed. This would be represented either by a negativeflux density or by a significant difference between the PSFFLUXand FLUX values. In general, for bright extended sources, we
A7, page 16 of 26

Planck Collaboration: Planck early results. VII.
-600 -400 -200 0 200 400 600Δ glon*cos(glat) [arcsec]
-400
-200
0
200
400
Δ gl
at [
arcs
ec]
-600 -400 -200 0 200 400 600Δ glon*cos(glat) [arcsec]
-400
-200
0
200
400
Δ gl
at [
arcs
ec]
-600 -400 -200 0 200 400 600Δ glon*cos(glat) [arcsec]
-400
-200
0
200
400
Δ gl
at [
arcs
ec]
-600 -400 -200 0 200 400 600Δ glon*cos(glat) [arcsec]
-400
-200
0
200
400
Δ gl
at [
arcs
ec]
-600 -400 -200 0 200 400 600Δ glon*cos(glat) [arcsec]
-400
-200
0
200
400
Δ gl
at [
arcs
ec]
-600 -400 -200 0 200 400 600Δ glon*cos(glat) [arcsec]
-400
-200
0
200
400
Δ gl
at [
arcs
ec]
-600 -400 -200 0 200 400 600Δ glon*cos(glat) [arcsec]
-400
-200
0
200
400
Δ gl
at [
arcs
ec]
Fig. 10. Matches to quasars as a measure of positional offsets in the ERCSC 30 to 353 GHz catalogues. The top row shows 30 and 44, the secondrow 70 and 100, the third row 143 and 217, and the final row 353 GHz. There are insufficient numbers of detected quasars at the upper HFIfrequencies.
A7, page 17 of 26

A&A 536, A7 (2011)
Fig. 11. The flux density of a subset of ERCSC sources at 30 and 44 GHz, with color corrections, compared to the flux density obtained fromVLA 22 and 43 GHz observations of the same sources translated to the Planck effective frequency (Planck Collaboration 2011j). The over-plottedlines are the first order polynomial resulting from an uncertainty weighted fit to the VLA and ERCSC flux densities which partially takes intoaccount Eddington bias. The slope of the fit is 1.08 at 30 GHz and 1.02 at 44 GHz indicating that both measurements are in good agreement.The median ratio of the ERCSC flux density to the VLA flux density is 1.15 at both frequencies. The difference is most likely attributable toa combination of effects including cross-calibration uncertainties, contribution from fainter sources within the Planck beam, variability and thefact that the smaller beam VLA measurements would be less sensitive to low surface brightness emission beyond the 2−4′′ primary VLA beamalthough care has been taken to use mainly unresolved sources.
-1.0 -0.5 0.0 0.5 1.0 1.5 2.0LOG10(fWMAP, [Jy])
0
20
40
60
Num
ber
of s
ourc
es
WMAP 5σ sources at 033 GHz: 289Matched ERCSC sources at 030 GHz: 253
-1.0 -0.5 0.0 0.5 1.0 1.5 2.0LOG10(fWMAP, [Jy])
0
10
20
30
40
50
60
Num
ber
of s
ourc
es
WMAP 5σ sources at 041 GHz: 281Matched ERCSC sources at 044 GHz: 175
-1.0 -0.5 0.0 0.5 1.0 1.5 2.0LOG10(fWMAP, [Jy])
0
10
20
30
Num
ber
of s
ourc
es
WMAP 5σ sources at 061 GHz: 166Matched ERCSC sources at 070 GHz: 135
-1.0 -0.5 0.0 0.5 1.0 1.5 2.0LOG10(fWMAP, [Jy])
0
2
4
6
8
Num
ber
of s
ourc
es
WMAP 5σ sources at 094 GHz: 59Matched ERCSC sources at 100 GHz: 56
Fig. 12. Histogram distribution of WMAP flux densities for all WMAP 5σ sources in each band (gray region). The sources that are detected in theERCSC are shown as the red histogram. Some of the WMAP sources have been missed because of source variability.
A7, page 18 of 26

Planck Collaboration: Planck early results. VII.
-1.0 -0.5 0.0 0.5 1.0 1.5 2.0LOG10(fPLANCK, [Jy])
0
20
40
60
80
100
120
Num
ber
of s
ourc
es
ERCSC at 030 GHz: 489Matched WMAP 5σ sources at 033 GHz: 253
-1.0 -0.5 0.0 0.5 1.0 1.5 2.0LOG10(fPLANCK, [Jy])
0
10
20
30
40
50
Num
ber
of s
ourc
es
ERCSC at 044 GHz: 221Matched WMAP 5σ sources at 041 GHz: 175
-1.0 -0.5 0.0 0.5 1.0 1.5 2.0LOG10(fPLANCK, [Jy])
0
10
20
30
40
50
60
Num
ber
of s
ourc
es
ERCSC at 070 GHz: 246Matched WMAP 5σ sources at 061 GHz: 135
-1.0 -0.5 0.0 0.5 1.0 1.5 2.0LOG10(fPLANCK, [Jy])
0
20
40
60
80
100
Num
ber
of s
ourc
es
ERCSC at 100 GHz: 531Matched WMAP 5σ sources at 094 GHz: 56
Fig. 13. Histogram distribution of ERCSC flux densities at each band in gray. ERCSC sources that are matched with WMAP 5σ sources in asimilar band are shown as the red histogram. The WMAP 7 year point source catalogue mask (see text) has been applied to the ERCSC to ensurethe same sky coverage.
recommend using the GAUFLUX and GAUFLUX_ERR valuesalthough even these might be biased high if the source is locatedin a region of complex, diffuse foreground emission.
Uncertainties in the flux density measured by each tech-nique are reflected in the corresponding “_ERR” column. Theflux uncertainties derived from the artificial point sources in-jected into the maps are available in MCQA_FLUX_ERR.MCQA_FLUX_ERR is the standard deviation of the dimension-less (S input − S output)/S input for input and output flux densities Sbased on the aperture flux density (i.e., FLUX) at the signal-to-noise ratio of the source. We believe that the most conservativeflux uncertainty is the quadrature sum of the Monte-Carlo fluxuncertainty and the “_ERR” value relevant for the appropriateflux density (FLUX, PSFFLUX, GAUFLUX or FLUXDET).
MCQA_FLUX_BIAS provides the median in the differencebetween the injected flux and extracted aperture flux of the ar-tificial point sources. In principle, the bias should be close tozero if the aperture corrections are precisely known, the aper-ture is perfectly centred on each source, and the backgroundcan be precisely estimated. In practice, there is an offset of afew percent, which can become large at the lowest signal-to-noise ratios or in high-background regions. This is a medianoffset estimated as a function of SNR from the artificial pointsources, and has already been applied to the FLUX value ofall sources. The bias correction has been applied such that theFLUX in the catalogue is the measured flux density divided by(1-MCQA_FLUX_BIAS) and increases the flux density valuesby about 5%.
The 1σ point source flux uncertainty due to structure in thebackground is given in BACKGROUND_RMS in units of mJy.At the lowest frequencies this is a combination of CMB noise
and instrumental noise, with the latter dominating. At 143 GHz,the noise is dominated by the CMB. At higher frequencies, it isdominated by Galactic ISM. The ratio of source flux density toBACKGROUND_RMS is the primary parameter which is usedto calibrate the RELIABILITY of sources.
The dates on which the source was observed are includedin DATESOBS (UTC) in the yyyymmdd format. This will beuseful in the analysis of time-variable sources. The flux-densityvalue in the ERCSC is an average over all the dates of observa-tions.
Sources in the HFI bands each have a CIRRUS numberwhich is based on the number of sources (both low and highreliability) within a 2◦ radius of the source, in raw 857 GHzcatalogues derived from the maps. The number has beennormalised to a peak value of one. The normalisation factor isin practice, derived from the number density of sources in theLarge Magellanic Cloud region where the maximum number of857 GHz sources is located.
Finally, each source has a CMBSUBTRACT flag. This flaghas values of 0, 1 or 2. The value is 0 if the source is detectedin the CMB-subtracted maps and has an aperture flux difference|S intensity − S nocmb|/S intensity < 0.30. CMBSUBTRACT = 1 if thesource is detected in the CMB subtracted maps but has a flux dif-ference of greater than 30%. CMBSUBTRACT = 2 if the sourceis not detected in the CMB subtracted maps. CMB subtractionresults in artefacts in the maps which might remove real sources.It is recommended that a conservative user who wants a guaran-tee of source detection in follow-up observations neglect sourceswith CMBSUBTRACT = 2.
A7, page 19 of 26

A&A 536, A7 (2011)
1 10fWMAP
-2
-1
0
1
2(f
ER
CSC
- f
WM
AP)
/fW
MA
P
fERCSC = ERCSC 030 GHz flux, [Jy]
fWMAP = WMAP 033 GHz flux, [Jy]
1 10fWMAP
-2
-1
0
1
2
(fE
RC
SC -
fW
MA
P)/f
WM
AP
fERCSC = ERCSC 044 GHz flux, [Jy]
fWMAP = WMAP 041 GHz flux, [Jy]
1 10fWMAP
-2
-1
0
1
2
(fE
RC
SC -
fW
MA
P)/f
WM
AP
fERCSC = ERCSC 070 GHz flux, [Jy]
fWMAP = WMAP 061 GHz flux, [Jy]
1 10fWMAP
-2
-1
0
1
2(f
ER
CSC
- f
WM
AP)
/fW
MA
P
fERCSC = ERCSC 100 GHz flux, [Jy]
fWMAP = WMAP 094 GHz flux, [Jy]
Fig. 14. Fractional difference between the ERCSC flux densities and WMAP flux densities at 30, 44, 70 and 100 GHz. The unit of the abcissa isJy while the ordinate shows the fractional difference. No correction has been applied to the WMAP flux densities to account for the difference inbandpass compared to Planck. The agreement is good but the significant scatter that can be seen is most likely due to source variability.
5.2. Cautionary notes in usage of catalogues
In this section, we list some cautionary notes associated withusage of the ERCSC list.
– Statistical character: the ERCSC list is an early list of highlyreliable sources from the first Planck all sky survey. It is nota flux density limited sample or even a complete sample ofsources and therefore care should be taken before undertak-ing statistical studies such as source counts. This is partlydue to the fact that the scan strategy results in significantvariation in instrumental sensitivity as a function of positionon the sky. In addition, the relative contribution of astrophys-ical sources of “noise” such as the CMB and the emissionfrom the Galactic interstellar medium (ISM) vary across thePlanck frequencies. The CMB contribution peaks between100 and 143 GHz while the ISM contribution peaks above
857 GHz. In conjunction with the varying spatial resolution,this results in varying limits to the sensitivity of sources thatcan be detected both as a function of position on the skyand as a function of frequency. The Monte-Carlo analysispresented does quantify this variation in sensitivity for theoverall catalogue. However, the estimates for the fraction ofsky area above a particular completeness limit, have not beenfactored into the catalogue.
– Variability: at radio frequencies, many of the extragalacticsources are highly variable. A small fraction of them varyeven on time scales of a few hours based on the brightnessof the same source as it passes through the different Planckhorns. Follow-up observations of these sources might showsignificant differences in flux density compared to the valuesin the data products. Although the maps used for the ERCSCare based on 1.6 sky coverages, the ERCSC provides only
A7, page 20 of 26

Planck Collaboration: Planck early results. VII.
Fig. 15. Bandpasses of HFI with the location of bright CO rotationallines (J = 1 → 0, 2 → 1, 3 → 2, 4 → 3, and 5 → 4 from left to right)shown as a horizontal black line with tick marks. The CO lines canintroduce a significant positive bias in the flux density of the sources,particularly those associated with Galactic star-forming regions. Theeffect is the most significant at 100 GHz where the flux density maybe boosted by more than 50%. See Planck HFI Core Team (2011b) fordetails.
a single average flux density estimate over all Planck datasamples that were included in the all sky maps and doesnot contain any measure of the variability of the sources.The Planck Quick Detection System (QDS; Aatrokoski et al.2010) attempts to quantify the variability of sources seen byPlanck. The information from the QDS has been included inthe notes for certain sources.
– Contamination from CO: at infrared/submillimetre frequen-cies (100 GHz and above), the Planck bandpasses straddleenergetically significant CO lines (Fig. 15). The effect is themost significant at 100 GHz, where the line might contributemore than 50% of the measured flux density. Follow-up ob-servations of these sources, especially those associated withGalactic star-forming regions, at a similar frequency but dif-ferent bandpass, should correct for the potential contributionof line emission to the continuum flux density of the source.See Planck HFI Core Team (2011b) for details.
– Photometry: each source has multiple measures of photom-etry FLUX, GAUFLUX, PSFFLUX and FLUXDET as de-fined above. The appropriate photometry to be used dependson the nature of the source. For sources which are unresolvedat the spatial resolution of Planck, FLUX and PSFFLUXare most appropriate. Even in this regime, PSF fits of faintsources fail and consequently these have a PSFFLUX valueof “NaN” (“Not a Number”). For bright resolved sources,GAUFLUX might be most appropriate although GAUFLUXappears to overestimate the flux of sources close to theGalactic plane due to an inability to fit for the contribu-tion of the Galactic background at the spatial resolution ofthe data. For faint resolved sources in the upper HFI bands,FLUXDET, which is the flux density in an elliptical Kronaperture provided by SExtractor, might give the most accu-rate numbers. The user should also note that the absolute cal-ibration of flux-density values are required to be accurate towithin about 30% although the signal-to-noise of the sourcesare much higher.
– Cirrus/ISM: a significant fraction of the sources detected inthe upper HFI bands could be associated with Galactic in-terstellar medium features or cirrus. The IRAS 100 μm sur-face brightness in MJy sr−1 for each of the sources, whichis commonly used as a proxy for cirrus, is available througha search of the ERCSC with IRSA. Candidate ISM featurescan also be selected by choosing objects with EXTENDED=1 although nearby Galactic and extragalactic sources whichare extended at Planck spatial resolution will meet thiscriterion. Alternately, the value of CIRRUS in the cataloguecan be utilised to flag sources which might be clustered to-gether and thereby associated with ISM structure.
6. Astrophysical source classes identifiedby their multifrequency signature
In addition to the single frequency catalogs described in theprevious sections, there are two other source catalogs that areprovided as part of the ERCSC. These two additional catalogsleverage the spectral signature of two specific classes of astro-physical sources through the Planck bands and are generatedusing specialized multifrequency algorithms which have beendeveloped within the Planck Collaboration. These are a list ofgalaxy clusters detected through the Sunyaev-Zeldovich effectand cold pre-stellar cores identified by the derived far-infraredcolor temperature in fits to the Planck photometry.
6.1. The Early Sunyaev-Zeldovich cluster catalogue
The Planck Early Release Sunyaev-Zeldovich (ESZ) clustersample (described in more detail in Planck Collaboration 2011d)is a list of 189 SZ cluster candidates which are detected by theirmulti-frequency signature in the Planck bands. The thermal SZeffect is the result of energetic electrons in the hot intra-clustermedium inverse-Compton scattering off the CMB photons. Thenet result is a distortion in the shape of the CMB spectrum,which results in a deficit of flux density below ∼220 GHz andan increment in flux density at higher frequencies (Sunyaev &Zel’dovich 1972; Carlstrom et al. 2002). By utilising a matchedmulti-frequency filter, the spectral signature of this distortion canbe detected and measured in the Planck all-sky maps, which en-ables cluster candidates to be detected.
The ESZ sample generated as part of the Planck early datarelease is the result of a blind multi-frequency search in the allsky maps, i.e., no prior positional information on clusters de-tected in any existing catalogues was used as input to the detec-tion algorithm. The ESZ sample is produced using one of thefour matched multi-frequency filter (MMF) algorithms availablewithin the Planck Collaboration (hereafter MMF3; see Melinet al. (2010) for details of the comparison of the cluster ex-traction algorithms available within the collaboration). MMF3is an all-sky extension of the algorithm described in Melin et al.(2006) and is run blindly over the six HFI frequency maps. Thetechnique first divides the all-sky maps into a set of overlappingsquare patches. The matched multi-frequency filter then opti-mally combines the six frequencies of each patch, assuming theSZ frequency spectrum and using the Arnaud et al. (2010) pres-sure profile as the cluster profile. Auto- and cross-power spectraused by the MMF are directly estimated from the data. They arethus adapted to the local instrumental noise and astrophysicalcontamination such as ISM emission. For each patch, the scaleradius of the cluster profile is varied to maximise the signal-to-noise ratio of each detection. The algorithm thus assigns to each
A7, page 21 of 26

A&A 536, A7 (2011)
Table 6. ESZ catalogue columns.
Keyword TypeINDEX Index of clusters i.e., 1, 2, 3...NAME Planck name of cluster candidateGLON Galactic longitude from Planck (deg)GLAT Galactic latitude from Planck (deg)RA Right ascension (deg) from Planck (J2000)Dec Declination (deg) from Planck (J2000)SNR Signal-to-noise ratio returned by the matched multi-filter (MMF3)ID External identifier of cluster e.g., Coma, Abell etc.REDSHIFT Redshift of cluster from the MCXC X-ray cluster compilation (Piffaretti et al. 2010) unless stated otherwise in the notesGLON_X Galactic longitude of the associated X-ray cluster (deg)GLAT_X Galactic latitude of the associated X-ray cluster (deg)RA_X Right ascension (deg) of the associated X-ray cluster (J2000)DEC_X Declination (deg) of the associated X-ray cluster (J2000)THETA_X Angular size (arcmin) at 5R500 from X-ray data.Y_PSX Integrated Compton-Y (arcmin2) at X-ray position and within 5R500 (THETA_X)Y_PSX_ERR Uncertainty in Y_PSXTHETA Estimated angular size (arcmin) from matched multi-filter (MMF3)THETA_ERR Uncertainty in THETAY Integrated Compton-Y (arcmin2) at Planck position and within THETA from matched multi-filter (MMF3)Y_ERR Uncertainty in Y
Fig. 16. Plot showing the all sky distribution of the ESZ cluster can-didates colour coded by signal-to-noise ratio. Sources close to theGalactic plane have been excluded since the spurious fraction is high.
detected source an estimated size and an integrated flux. Thedetected sources extracted from individual patches are finallymerged into an all-sky cluster list. Non-SZ sources captured bythe MMF algorithm can contaminate the list and an additionalstep of validation of the detection is needed.
Unlike the individual frequency source list or the ECC list,which are validated through a Monte-Carlo technique, the re-liability of the ESZ list has been estimated through a valida-tion process based on internal checks and on cross-checks withancillary optical/near-infrared and X-ray cluster catalogues orimages. Cross-matches with the Meta-Catalogue of X-ray de-tected Clusters of galaxies (MCXC hereafter; Piffaretti et al.2011), Abell and Zwicky catalogues, SDSS-based catalogues,MAXBCG and Wen et al. (2009) and a compilation of SZ ob-served clusters were undertaken. For each known X-ray cluster,several entries are available among which the identifiers, red-shift, coordinates, total mass M500, and radius R500 were usedduring the external validation process. R500 is the radius thatencompasses a mean matter density which is 500 times thecritical density at the corresponding redshift. R500 is less thanthe virial radius of the cluster. M500 is the mass within R500.Further searches in Virtual Observatory (VO) and in logs ofobservatories were performed. The goal of this search was toidentify cluster candidates which might already have ancillary
Fig. 17. Redshift distribution of ESZ cluster candidates. ESZ clusterswhich do not have a redshift are shown as the hatched region at z = 0.01.
data available for community access. Of the 189 cluster candi-dates, 169 are associated with known X-ray or optical clustersand the Planck data provides the first measure of the SZ signa-ture for the majority of them. In addition to the cross-check withancillary data, follow-up observations with XMM confirmedan additional 11 new clusters which are described in PlanckCollaboration (2011e). 9 other new clusters have not been con-firmed in the X-ray as yet.
A full description of the validation effort is in PlanckCollaboration (2011d). Figure 16 shows the all sky distributionof the clusters and cluster candidates while Fig. 17 shows theirredshift distribution. Table 6 gives the list of columns in the ESZcatalogue.
All clusters have a Planck name which is given in the columnNAME. This name is constructed from GLON and GLAT, thebest estimated Galactic coordinates of the SZ signal. SNR givesthe detection’s signal-to-noise ratio as defined by the matchedmulti-filter method MMF3.
A7, page 22 of 26

Planck Collaboration: Planck early results. VII.
When a Planck SZ cluster candidate is identified as an X-raycluster in the MCXC the coordinates of the X-ray counterpart(i.e., the X-ray centroid) is given. The same positional infor-mation is given for the Planck cluster candidates confirmed byXMM-Newton observation (apart from one candidate identifiedwith a double cluster, see ESZ notes). For those clusters with anX-ray counterpart, the Compton-Y parameter, which is the inte-gral of the Compton-y over the cluster area, is re-extracted fromthe Planck maps using the X-ray centroid coordinates and X-raysize THETA_X as priors, yielding the value Y_PSX and its errorY_PSX_ERR. The Compton-Y parameter measured using theX-ray position and size priors is known to be more robust thanthe blind value estimated without priors (Planck Collaboration2011d).
For cluster candidates without available estimates of X-rayposition or size, the derived SZ parameters THETA, Y, and theassociated errors THETA_ERR and Y_ERR are the values re-turned directly by the matched filter. These are likely to be moreuncertain than cases where the cluster has been confirmed in theX-ray data. THETA and THETA_X are the estimated angularsize of the cluster at 5 times R500.
Notes on individual clusters can be found in PlanckCollaboration (2011v). These notes include cross-matches withERCSC sources as well as the origin of the redshift.
6.2. The Early Cold Cores Catalogue
Pre-stellar cloud cores represent the transition from turbulencedominated large scales to the gravitation dominated protostellarscales and are therefore a crucial step in the process of star for-mation. Imprinted in their structure and statistics is informationof the properties of the parental clouds and the core formationprocesses where interstellar turbulence, magnetic fields, self-gravity, and external triggering all play a role.
The Planck all-sky submillimetre/millimetre survey has boththe very high sensitivity and spatial resolution required for thedetection of compact cores. The highest frequency channelsat 857, 545 and 353 GHz cover the frequencies around andlongwards of the intensity maximum of the cold dust emis-sion: Bν(T = 10K)ν2 peaks at a wavelength close to 300 μmwhile, with a temperature of T ∼ 6 K, the coldest dust in-side the cores has its maximum close to 500 μm. When Planckdata are combined with far-infrared data like the IRAS sur-vey, the observations enable accurate determination of both thedust temperatures and its emissivity index. For historical rea-sons, we use “Cold Cores” to designate the entries in the ECC,since pre-stellar cores were a major scientific goal of this prod-uct. However, as two companion papers (Planck Collaboration2011r,s) demonstrate, most of these entries are more correctlydescribed as “cold clumps”, intermediate in their structure andphysical scale between a true pre-stellar core and a molecularcloud. This is of course to be expected as the Planck effectivebeam dictates a preferred angular scale for ECC detection, andthe selection process places their emission peak in the submmrange.
In order to detect the cold cores, a warm background deter-mined by the scaled IRAS 100 μm emission is subtracted fromthe Planck maps at 217, 353 and 545 GHz (Montier et al. 2010;Planck Collaboration 2011s). The scaling factor is determinedby measuring the sky background in a disk of 15 arcmin outerradius. We search for the presence of a source in the residualemission, and perform photometry at the location of detectedsources. The band-merging process positionally matches objectsin the 353 GHz detection list, which contains the least number
Fig. 18. Sky distribution of ECC detections having S NR ≥ 15 and T ≤14 K is shown. The symbols are colour-coded by temperature using thescale shown on the right.
of entries, against both the 545 and 857 GHz catalogues using a5′ matching radius. Sources only detected in one or two bandsare discarded. The SNR and position of the detection having thegreatest SNR are assigned to the band-merged entry.
Aperture photometry is performed on the IRAS 100μm and353, 545, and 857 GHz maps using a source radius of five ar-cminute and a background annulus spanning radii from five toten arcminutes. An unconstrained three-parameter (T , β, andS 857) greybody is fit to the four-band aperture photometry withthe fitted temperatures used in the source selection process.
As for the ERCSC, a Monte-Carlo process is used to de-fine signal-to-noise thresholds where the derived temperaturesare consistent with being <14 K. A full description of the pro-cess can be found both in Planck Collaboration (2011v). Thedelivered ECC catalogue consists of 915 objects (Fig. 18) meet-ing the ECC selection criteria of S NR ≥ 15 and T ≤ 14 K., afterremoval of selected sources having obviously discrepant SEDsor are closely positionally matched to bright AGN, e.g., 3C 273.The columns in the ECC catalogue are shown in Table 7.
It should be noted that the derived temperatures of the ColdCores are degenerate with the derived emissivity due to the ab-sence of more than one flux-density estimate at wavelengthsshortward of the peak in the blackbody spectrum. This issue isdiscussed in detail in Planck Collaboration (2011s).
Further information on the ECC is given in PlanckCollaboration (2011v,s). Additional remarks on individualsources, including cross-matches with ERCSC sources are pro-vided in the notes file that accompany the individual catalogs(see Sect. 5).
7. Concluding remarks
Planck is the third generation space based CMB experiment withmore than an order of magnitude higher spatial resolution thanCOBE and with a broader range of frequency coverage thanWMAP. The completion of the first sky survey in April 2010yields a unique opportunity to study the classes of astrophys-ical sources that are foreground contributors to the CMB. TheERCSC is a catalogue with >90% reliability and is based on1.6 sky coverages by Planck. It has been produced with a veryrapid turnaround time to facilitate follow up observations withexisting and future telescope facilities. The Planck Collaborationexpects that the diversity of sources present in the ERCSC, rang-ing from protostellar cores to SZ selected clusters, radio galaxiesand luminous star-forming galaxies, will provide a rich opportu-nity for follow-up studies of interesting astrophysical phenom-ena.
A7, page 23 of 26

A&A 536, A7 (2011)
Table 7. ECC catalogue columns
Keyword TypeNAME Source nameSNR Signal to Noise ratio of detection
GLON Galactic longitude (deg) based on bandmerge algorithmGLAT Galactic latitude (deg) based on bandmerge algorithmRA Right Ascension in degrees (J2000)Dec Declination in degrees (J2000)
APFLUX353 Aperture flux density at 353 GHz (mJy)APFLUX545 Aperture flux density at 545 GHz (mJy)APFLUX857 Aperture flux density at 857 GHz (mJy )APFLUX3000 Aperture flux density at 3000 GHz (mJy)APFLUX353_ERR Uncertainty (1 sigma) in APFLUX353APFLUX545_ERR Uncertainty (1 sigma) in APFLUX545APFLUX857_ERR Uncertainty (1 sigma) in APFLUX857APFLUX3000_ERR Uncertainty (1 sigma) in APFLUX3000
TEMPERATURE Temperature from greybody fit (K)BETA Emissivity index from greybody fitS857 Flux density at 857 GHz from greybody fit (mJy)TEMPERATURE_ERR Uncertainty (1 sigma) in TEMPERATURE (K)BETA_ERR Uncertainty (1 sigma) in BETAS857_ERR Uncertainty (1 sigma) in S857BESTNORM Summed squared residuals for best fit (mJy2)
TEMPERATURE_CORE Core Temperature from greybody fit to cold residual emission (K)BETA_CORE Emissivity index from greybody fit to cold residual emissionMAJ_AXIS_FWHM_CORE Ellipse major axis of cold residual emission (arcmin)MIN_AXIS_FWHM_CORE Ellipse minor axis of cold residual emission (arcmin)TEMPERATURE_CORE_ERR Uncertainty (1 sigma) TEMPERATURE_CORE (K)BETA_CORE_ERR Uncertainty (1 sigma) BETA_COREMAJ_AXIS_FWHM_CORE_ERR Uncertainty (1 sigma) MAJ_AXIS_FWHM_COREMIN_AXIS_FWHM_CORE_ERR Uncertainty (1 sigma) MIN_AXIS_FWHM_CORE
Acknowledgements. The production of the Planck Early Release CompactSource Catalogue was funded by NASA and carried out at the US PlanckData Center at the Infrared Processing and Analysis Center (IPAC), CaliforniaInstitute of Technology, on behalf of and in collaboration with the LFI andHFI Data Processing Centers and with many contributions by members ofthe Planck Collaboration. The Planck Collaboration acknowledges the supportof: ESA; CNES and CNRS/INSU-IN2P3-INP (France); ASI, CNR, and INAF(Italy); NASA and DoE (USA); STFC and UKSA (UK); CSIC, MICINN andJA (Spain); Tekes, AoF and CSC (Finland); DLR and MPG (Germany); CSA(Canada); DTU Space (Denmark); SER/SSO (Switzerland); RCN (Norway);SFI (Ireland); FCT/MCTES (Portugal); and DEISA (EU). A description of thePlanck Collaboration and a list of its members with the technical or scientific ac-tivities they have been involved into, can be found at http://www.rssd.esa.int/index.php?project=PLANCK&page=Planck_Collaboration
ReferencesAatrokoski, J., Lähteenmäki, A., Tornikoski, M., et al. 2010, MNRAS, 401, 597Arnaud, M., Pratt, G. W., Piffaretti, R., et al. 2010, A&A, 517, A92Beichman, C. A., Neugebauer, G., Habing, H. J., Clegg, P. E., & Chester, T. J.
1988, Infrared astronomical satellite (IRAS) catalogs and atlases, Vol. 1:Explanatory supplement, 1
Bennett, C. L., Halpern, M., Hinshaw, G., et al. 2003, ApJS, 148, 1Bersanelli, M., Mandolesi, N., Butler, R. C., et al. 2010, A&A, 520, A4Bertin, E., & Arnouts, S. 1996, A&AS, 117, 393Carlstrom, J. E., Holder, G. P., & Reese, E. D. 2002, ARA&A, 40, 643Carvalho, P., Rocha, G., & Hobson, M. P. 2009, MNRAS, 393, 681Chary, R., Casertano, S., Dickinson, M. E., et al., 2004, ApJ, 154, 80Dupac, X., & Tauber, J. 2005, A&A, 430, 363Gold, B., Odegard, N., Weiland, J. L., et al. 2011, ApJS, 192, 15Górski, K. M., Hivon, E., Banday, A. J., et al. 2005, ApJ, 622, 759Gregory, P. C., Scott, W. K., Douglas, K., & Condon, J. J. 1996, ApJS, 103, 427Griffith, M. R., Wright, A. E., Burke, B. F., & Ekers, R. D. 1995, ApJS, 97, 347Healey, S. E., Romani, R. W., Taylor, G. B., et al. 2007, ApJS, 171, 61
Hobson, M. P., & McLachlan, C. 2003, MNRAS, 338, 765Kron, R. G. 1980, ApJS, 43, 305Lamarre, J., Puget, J., Ade, P. A. R., et al. 2010, A&A, 520, A9Leahy, J. P., Bersanelli, M., D’Arcangelo, O., et al. 2010, A&A, 520, A8López-Caniego, M., González-Nuevo, J., Herranz, D., et al. 2007, ApJS, 170,
108Mandolesi, N., Bersanelli, M., Butler, R. C., et al. 2010, A&A, 520, A3Massardi, M., López-Caniego, M., González-Nuevo, et al. 2009, MNRAS, 392,
733Melin, J., Bartlett, J. G., & Delabrouille, J. 2006, A&A, 459, 341Melin, J.-B., Aghanim, N., Bartelman, M., et al. 2010, A&A, submittedMennella, A., Bersanelli, M., Butler, R. C., et al. 2011, A&A, 536, A3Mitra, S., Rocha, G., Górski, K. M., et al. 2011, ApJS, 193, 5Montier, L. A., Pelkonen, V.-M., Juvela, M., Ristorcelli, I., & Marshall, D. J.
2010, A&A, 522, A83Murakami, H., Baba, H., Barthel, P., et al. 2007, PASJ, 59, 369Murphy, T., Sadler, E. M., Ekers, R. D., et al. 2010, MNRAS, 402, 2403Piffaretti, R., Arnaud, M., Pratt, G. W., Pointecouteau, E., & Melin, J.-B. 2011,
A&A, 534, A109Planck Collaboration 2011a, A&A, 536, A1Planck Collaboration 2011b, A&A, 536, A2Planck Collaboration 2011c, A&A, 536, A7Planck Collaboration 2011d, A&A, 536, A8Planck Collaboration 2011e, A&A, 536, A9Planck Collaboration 2011f, A&A, 536, A10Planck Collaboration 2011g, A&A, 536, A11Planck Collaboration 2011h, A&A, 536, A12Planck Collaboration 2011i, A&A, 536, A13Planck Collaboration 2011j, A&A, 536, A14Planck Collaboration 2011k, A&A, 536, A15Planck Collaboration 2011l, A&A, 536, A16Planck Collaboration 2011m, A&A, 536, A17Planck Collaboration 2011n, A&A, 536, A18Planck Collaboration 2011o, A&A, 536, A19Planck Collaboration 2011p, A&A, 536, A20
A7, page 24 of 26

Planck Collaboration: Planck early results. VII.
Planck Collaboration 2011q, A&A, 536, A21Planck Collaboration 2011r, A&A, 536, A22Planck Collaboration 2011s, A&A, 536, A23Planck Collaboration 2011t, A&A, 536, A24Planck Collaboration 2011u, A&A, 536, A25Planck Collaboration 2011v, The Explanatory Supplement to the Planck Early
Release Compact Source Catalogue (ESA)Planck Collaboration 2011w, A&A, 536, A26Planck HFI Core Team 2011a, A&A, 536, A4Planck HFI Core Team 2011b, A&A, 536, A6Rosset, C., Tristram, M., Ponthieu, N., et al. 2010, A&A, 520, A13Savage, R. S., & Oliver, S. 2007, ApJ, 661, 1339Sunyaev, R., & Zeldovich, Ya. 1972, A&A, 20, 189Tauber, J. A., Mandolesi, N., Puget, J., et al. 2010, A&A, 520, A1Vieira, J. D., Crawford, T. M., Switzer, E. R., et al. 2010, ApJ, 719, 763Ward-Thompson, D., André, P., & Kirk, J. M. 2002, MNRAS, 329, 257Wright, E. L., Chen, X., Odegard, N., et al. 2009, ApJS, 180, 283Wright, E. L., et al. 2010, AJ, 140, 1868Zacchei, A., Maino, D., Baccigalupi, C., et al. 2011, A&A, 536, A5
1 Aalto University Metsähovi Radio Observatory, Metsähovintie 114,02540 Kylmälä, Finland
2 Agenzia Spaziale Italiana Science Data Center, c/o ESRIN, viaGalileo Galilei, Frascati, Italy
3 Astroparticule et Cosmologie, CNRS (UMR7164), Université DenisDiderot Paris 7, Bâtiment Condorcet, 10 rue A. Domon et LéonieDuquet, Paris, France
4 Astrophysics Group, Cavendish Laboratory, University ofCambridge, J J Thomson Avenue, Cambridge CB3 0HE, UK
5 Atacama Large Millimeter/submillimeter Array, ALMA SantiagoCentral Offices, Alonso de Cordova 3107, Vitacura, Casilla763 0355, Santiago, Chile
6 Australia Telescope National Facility, CSIRO, PO Box 76, Epping,NSW 1710, Australia
7 CITA, University of Toronto, 60 St. George St., Toronto,ON M5S 3H8, Canada
8 CNRS, IRAP, 9 Av. colonel Roche, BP 44346, 31028 ToulouseCedex 4, France
9 California Institute of Technology, Pasadena, California, USA10 Centre of Mathematics for Applications, University of Oslo,
Blindern, Oslo, Norway11 DAMTP, University of Cambridge, Centre for Mathematical
Sciences, Wilberforce Road, Cambridge CB3 0WA, UK12 DSM/Irfu/SPP, CEA-Saclay, 91191 Gif-sur-Yvette Cedex, France13 DTU Space, National Space Institute, Juliane Mariesvej 30,
Copenhagen, Denmark14 Departamento de Física, Universidad de Oviedo, Avda. Calvo Sotelo
s/n, Oviedo, Spain15 Department of Astronomy and Astrophysics, University of Toronto,
50 Saint George Street, Toronto, Ontario, Canada16 Department of Physics & Astronomy, University of British
Columbia, 6224 Agricultural Road, Vancouver, British Columbia,Canada
17 Department of Physics and Astronomy, Tufts University, Medford,MA 02155, USA
18 Department of Physics, Gustaf Hällströmin katu 2a, University ofHelsinki, Helsinki, Finland
19 Department of Physics, Princeton University, Princeton, New Jersey,USA
20 Department of Physics, Purdue University, 525 NorthwesternAvenue, West Lafayette, Indiana, USA
21 Department of Physics, University of California, Berkeley,California, USA
22 Department of Physics, University of California, One ShieldsAvenue, Davis, California, USA
23 Department of Physics, University of California, Santa Barbara,California, USA
24 Department of Physics, University of Illinois at Urbana-Champaign,1110 West Green Street, Urbana, Illinois, USA
25 Dipartimento di Fisica G. Galilei, Università degli Studi di Padova,via Marzolo 8, 35131 Padova, Italy
26 Dipartimento di Fisica, Università La Sapienza, P. le A. Moro 2,Roma, Italy
27 Dipartimento di Fisica, Università degli Studi di Milano, via Celoria,16, Milano, Italy
28 Dipartimento di Fisica, Università degli Studi di Trieste, via A.Valerio 2, Trieste, Italy
29 Dipartimento di Fisica, Università di Ferrara, via Saragat 1, 44122Ferrara, Italy
30 Dipartimento di Fisica, Università di Roma Tor Vergata, via dellaRicerca Scientifica, 1, Roma, Italy
31 Discovery Center, Niels Bohr Institute, Blegdamsvej 17,Copenhagen, Denmark
32 Dpto. Astrofísica, Universidad de La Laguna (ULL), 38206 LaLaguna, Tenerife, Spain
33 European Southern Observatory, ESO Vitacura, Alonso de Cordova3107, Vitacura, Casilla 19001, Santiago, Chile
34 European Space Agency, ESAC, Planck Science Office, Caminobajo del Castillo, s/n, Urbanización Villafranca del Castillo,Villanueva de la Cañada, Madrid, Spain
35 European Space Agency, ESTEC, Keplerlaan 1, 2201AZ Noordwijk, The Netherlands
36 Haverford College Astronomy Department, 370 Lancaster Avenue,Haverford, Pennsylvania, USA
37 Helsinki Institute of Physics, Gustaf Hällströmin katu 2, Universityof Helsinki, Helsinki, Finland
38 INAF – Osservatorio Astrofisico di Catania, via S. Sofia 78, Catania,Italy
39 INAF – Osservatorio Astronomico di Padova, Vicolodell’Osservatorio 5, Padova, Italy
40 INAF – Osservatorio Astronomico di Roma, via di Frascati 33,Monte Porzio Catone, Italy
41 INAF – Osservatorio Astronomico di Trieste, via G.B. Tiepolo 11,Trieste, Italy
42 INAF/IASF Bologna, via Gobetti 101, Bologna, Italy43 INAF/IASF Milano, via E. Bassini 15, Milano, Italy44 INRIA, Laboratoire de Recherche en Informatique, Université
Paris-Sud 11, Bâtiment 490, 91405 Orsay Cedex, France45 IPAG: Institut de Planétologie et d’Astrophysique de Grenoble,
Université Joseph Fourier, Grenoble 1/CNRS-INSU, UMR 5274,38041 Grenoble, France
46 ISDC Data Centre for Astrophysics, University of Geneva,Ch. d’Écogia 16, Versoix, Switzerland
47 Imperial College London, Astrophysics group, Blackett Laboratory,Prince Consort Road, London, SW7 2AZ, UK
48 Infrared Processing and Analysis Center, California Institute ofTechnology, Pasadena, CA 91125, USAe-mail: [email protected]
49 Institut Néel, CNRS, Université Joseph Fourier Grenoble I, 25 ruedes Martyrs, Grenoble, France
50 Institut d’Astrophysique Spatiale, CNRS (UMR8617) UniversitéParis-Sud 11, Bâtiment 121, Orsay, France
51 Institut d’Astrophysique de Paris, CNRS UMR7095, UniversitéPierre & Marie Curie, 98bis boulevard Arago, Paris, France
52 Institut de Ciències de l’Espai, CSIC/IEEC, Facultat de Ciències,Campus UAB, Torre C5 par-2, Bellaterra 08193, Spain
53 Institute of Astronomy and Astrophysics, Academia Sinica, Taipei,Taiwan
54 Institute of Astronomy, University of Cambridge, Madingley Road,Cambridge CB3 0HA, UK
55 Institute of Theoretical Astrophysics, University of Oslo, Blindern,Oslo, Norway
56 Instituto de Astrofísica de Canarias, C/Vía Láctea s/n, La Laguna,Tenerife, Spain
57 Instituto de Física de Cantabria (CSIC-Universidad de Cantabria),Avda. de los Castros s/n, Santander, Spain
58 Istituto di Fisica del Plasma, CNR-ENEA-EURATOM Association,via R. Cozzi 53, Milano, Italy
A7, page 25 of 26

A&A 536, A7 (2011)
59 Jet Propulsion Laboratory, California Institute of Technology, 4800Oak Grove Drive, Pasadena, California, USA
60 Jodrell Bank Centre for Astrophysics, Alan Turing Building, Schoolof Physics and Astronomy, The University of Manchester, OxfordRoad, Manchester, M13 9PL, UK
61 Kavli Institute for Cosmology Cambridge, Madingley Road,Cambridge, CB3 0HA, UK
62 LERMA, CNRS, Observatoire de Paris, 61 avenue del’Observatoire, Paris, France
63 Laboratoire AIM, IRFU/Service d’Astrophysique – CEA/DSM –CNRS – Université Paris Diderot, Bât. 709, CEA-Saclay, 91191 Gif-sur-Yvette Cedex, France
64 Laboratoire Traitement et Communication de l’Information, CNRS(UMR 5141) and Télécom ParisTech, 46 rue Barrault, 75634 ParisCedex 13, France
65 Laboratoire de Physique Subatomique et de Cosmologie,CNRS/IN2P3, Université Joseph Fourier Grenoble I, InstitutNational Polytechnique de Grenoble, 53 rue des Martyrs, 38026Grenoble Cedex, France
66 Laboratoire de l’Accélérateur Linéaire, Université Paris-Sud 11,CNRS/IN2P3, Orsay, France
67 Lawrence Berkeley National Laboratory, Berkeley, California, USA68 Max-Planck-Institut für Astrophysik, Karl-Schwarzschild-Str. 1,
85741 Garching, Germany69 MilliLab, VTT Technical Research Centre of Finland, Tietotie 3,
Espoo, Finland70 National University of Ireland, Department of Experimental
Physics, Maynooth, Co. Kildare, Ireland71 Niels Bohr Institute, Blegdamsvej 17, Copenhagen, Denmark
72 Observational Cosmology, Mail Stop 367-17, California Institute ofTechnology, Pasadena, CA, 91125, USA
73 Optical Science Laboratory, University College London, GowerStreet, London, UK
74 SISSA, Astrophysics Sector, via Bonomea 265, 34136, Trieste, Italy75 SUPA, Institute for Astronomy, University of Edinburgh, Royal
Observatory, Blackford Hill, Edinburgh EH9 3HJ, UK76 School of Physics and Astronomy, Cardiff University, Queens
Buildings, The Parade, Cardiff, CF24 3AA, UK77 Space Research Institute (IKI), Russian Academy of Sciences,
Profsoyuznaya Str, 84/32, 117997 Moscow, Russia78 Space Sciences Laboratory, University of California, Berkeley,
California, USA79 Spitzer Science Center, 1200 E. California Blvd., Pasadena,
California, USA80 Stanford University, Dept of Physics, Varian Physics Bldg, 382 via
Pueblo Mall, Stanford, California, USA81 Universität Heidelberg, Institut für Theoretische Astrophysik,
Albert-Überle-Str. 2, 69120 Heidelberg, Germany82 Université de Toulouse, UPS-OMP, IRAP, 31028 Toulouse Cedex 4,
France83 Universities Space Research Association, Stratospheric Observatory
for Infrared Astronomy, MS 211-3, Moffett Field, CA 94035, USA84 University of Granada, Departamento de Física Teórica y del
Cosmos, Facultad de Ciencias, Granada, Spain85 University of Miami, Knight Physics Building, 1320 Campo Sano
Dr., Coral Gables, Florida, USA86 Warsaw University Observatory, Aleje Ujazdowskie 4, 00-478
Warszawa, Poland
A7, page 26 of 26