Pittsfield Public Schools
126
PITTSFIELD PUBLIC SCHOOLS Fiscal Year 2019 Budget PITTSFIELD PUBLIC SCHOOLS 269 FIRST STREET PITTSFIELD, MASSACHUSETTS 01201 413-499-9502 WWW.PITTSFIELD.NET 1
-
Upload
khangminh22 -
Category
Documents
-
view
1 -
download
0
Transcript of Pittsfield Public Schools

PITTSFIELD PUBLIC SCHOOLS Fiscal Year 2019 Budget
PITTSFIELD PUBLIC SCHOOLS 269 FIRST STREET PITTSFIELD, MASSACHUSETTS 01201 413-499-9502 WWW.PITTSFIELD.NET
1

Table of Contents
Introductory Section: School Committee Members District Leadership Team Message from the Superintendent Budget Process Timeline School Committee Budget Calendar Pittsfield Schools Administration Organizational Chart The Big Picture: Pittsfield Public Schools Mission Statement History of Budget Staffing Levels & Costs The Budget in Context & Priorities Revenue and Expense Summary by Fund Tax Base Information Tax Rate Information Organizational Section: District Facilities Enrollment Trends by School Enrollment by Race Long Term Enrollment Trends (Pittsfield and State Totals) 10 Year History Free/Reduced Lunch Enrollment Projections
Programs and Services: Career & Technical Education Technology Special Education English Language Learners Athletics School Lunch and Breakfast Program Bus Operations
Financial Section: Expenditure Function and Classification Major Revenue Sources State Revenue Local Revenue Other Revenue Federal Revenue Grant Funding Budgets Revolving Accounts
Informational Section: State Aid Per Pupil Expenditures Grants School Choice/Charter Homeschooling Tuition Rates Career & Technical Education (Enrollment by Program) Custodial Staffing Food Service Program Athletics Organizational Chart District Vehicles Glossary
2

Introduction School Committee
District Leadership Team
Message from the Superintendent
Budget Process Timeline
School Committee Budget Calendar
History of Budget Staffing
3

Pittsfield Public Schools
School Committee Members Katherine Yon ~ Chairperson
Daniel Elias ~ Vice Chairperson
Cynthia Taylor
Joshua Cutler
William Cameron
Dennis Powell
Mayor Linda Tyer ~ Member Ex. Officio
4

Pittsfield Public School District Leadership Team
Superintendent
Jason P. McCandless
Cabinet
Joseph Curtis ~ Deputy Superintendent
Kristen Behnke ~ Asst. Supt. for Business & Finance
Tammy Gage ~ Asst Supt. of Career & Technical Education
Executive Team
Harry Hayes ~ Director of Human Resources
Gretchen West ~ Director of Special Education
Randy McLeod~ Director of Technology
Directors
James Abel ~ Athletics
James Larrow ~ Custodial Services
Judy Rush ~ Curriculum, Title I & Title IIA
Melissa Brites ~ Alternative Education
Paul Gage ~ Adult Learning Center
Susan Donnelly-Wendling ~ Bus Operations
Sylvana Bryan ~ Food Services
Virginia Guglielmo-Brady ~ English Language Learners
Elementary School Principals
Brenda Kelley ~ Allendale Elementary School
Candy Jezewski ~ Capeless Elementary School
Kerry Light ~ Conte Community School
Aaron Dean ~ Crosby Elementary School
Jared Materas ~ Egremont Elementary School
Jennifer Stokes ~ Morningside Community School
Sara Luciani ~ Stearns Elementary School
Lisa Buchinski ~ Williams Elementary School
Middle & High School Principals
Gina Coleman ~ Herberg Middle School
Linda Whitacre ~ Reid Middle School
Matthew Bishop ~ Pittsfield High School
John Vosburgh ~ Taconic High School
5

Pittsfield Public Schools
Administration Center 269 First Street
Pittsfield, MA 01201
www.pittsfield.net
Jason P. McCandless Ed.D. Superintendent
413.499.9512 • Fax 413.448.2643
Dear Pittsfield Public School Community,
Building a budget—a budget that is based on tax dollars earned and paid for by our neighbors near and far—is an almost sacred task. It is sacred in that our students and families have one opportunity to receive a free public education and the importance of our work cannot be overstated. It is approaching sacred in that we understand every dollar counts—as every dollar needs to go toward keeping our entire community safe, secure and well served. We begin work on the FY19 budget as we live through a current budget year that reflects $250,000 fewer educational dollars that we worked with in fiscal 17. We begin work knowing that this work is complex, and incredibly important. As always we be prudent as well as strategic, and keeping the following "must do's" in mind:
� Ensure that curriculum materials and training for teachers are rich, aligned to state
standards and increase student engagement and learning � Ensure that every child in every school receives strong instruction in math and reading so
their future success can be assured � Ensure that the Pittsfield Public Schools are highly responsive to legal mandates, as well as
ethical mandates, including a dedication to diversity and cultural competence in all of its forms
� Ensure that all students, especially graduates of the Pittsfield Public Schools, are ready for what is next.
We know that our best work comes not in isolation, but in working with partners in our City— be those partners governmental, the non-profit community, individuals or our City and County’s wonderful arts organizations. We remain committed to keeping the Pittsfield Public Schools an active partner in creating a better Pittsfield.
Thank you for being one of those partners in the crucial, transformative work of public education in the City of Pittsfield.
Yours in education,
Jason P. McCandless Superintendent of Schools
6

July August September October November December January February March April May June
Student Activity external
audit
Complete End of Year Report and submit to
DESE
Annual external audit
End of Year Report external
audit
SC Finance Subcommittee
meeting
Final Expenditure
Report to SC
Budget workshop and
line item budget
Six-month budget
projection to SC for
acceptance
Seven-month budget
projection to SC
(informational)
Eight-month budget
projection to SC (informational)
Nine-month budget
projection to SC for
acceptance
Ten-month budget
projection to SC
(informational)
Eleven-month budget
projection to SC
(informational)
Projections for enrollment
and grants
SC Public Hearing on
budget
Books close for current fiscal year
Approval of budget
calendar
Budget overview
Budget adoption by SC
Public hearing at City Council
on budget-----
Final approval of City budget by City Council
Previous Fiscal YearSC: School Committee Current Fiscal Year Next Fiscal Year
Annual Budget Processwith
Pittsfield School CommitteeFiscal Year Calendar: July 1st - June 30th
Monitoring of accounts by Business Office
Work on required End of Year Report for previous
fiscal year
Administrative preparation for next fiscal year budget continues; conduct
budget meetings with school principals and leadership team
Administrative preparation for next fiscal year budget begins
Administration recommen-dations for
budget adoption
7

January 30Joint Meeting
City Council and School
Committee
February 14Regular Meeting
State Aid, Enrollment
Projections and Grants
February 28 Regular Meeting
Budget Overview I
March 14 Regular Meeting
Budget Overview II
March 28 Regular MeetingLine Item Budget
April 11Public Meeting
Regular Meeting (immediately
following)
School Committee Recommendations
for Budget Adoption
April 25Regular Meeting
FY19 Budget Adoption
*Finance Subcommittee meeting dates to be determined.
January 10Regular Meeting
Budget Calendar Review
January February March April
Pittsfield School Committee2019 Budget Calendar*
8

School Committee
tittsfield tublic Schools Administration hrganizational Chart – 2018
Superintendent of Schools
Deputy Superintendent
Assistant Superintendent of Career and Technical
Education
Career and Vocational Technical Educators
Assistant Superintendent for Business and Finance
Director of Food Services
Director of Human Resources
Athletics Director
Director of Special Education
Coordinator of English for Speakersof Other Languages
Director of Transportation Services
Director of Custodial Services
Business Office
City Hall Administration
Director of Technology
Coordinator of Attendance
School Nurse Leader
Director of Adult Basic Education
Director, Curriculum, Title I, Title II
Alternative Education Programs
Coordinator of 21st Century Programs
Principals
9
Our Mission:
To serve our community and its children by creating a school environment where lifelong learning is valued, excellence is expected, and improvement is continuous; to meet the needs
of each student by providing the information, encouragement, support, and instruction required to meet or to exceed the district’s high expectations and rigorous academic
demands; to prepare every student for postsecondary education, career satisfaction, and lifelong economic, social, and civic success.
10

The Big Picture Our Mission
History of Budget Staffing
Budget in Context, Smarter School Spending & Budget Priorities
Revenue and Expense Summary by Fund
Tax Rate Information
Capital Improvement Request by Schools
11

History of Budget Staffing
Function FY08 FY09 FY10 FY11 FY12 FY13 FY14 FY15 FY16 FY17 FY18Total Staffing FTE 900.50 950.90 937.40 933.75 973.25 935.75 955.35 958.45 925.35 938.50 873.20Instructional 744.25 782.25 769.50 765.85 803.35 770.15 790.65 792.25 766.65 783.50 721.20Other School Services (Bus Op and Attendance) 79.00 90.40 90.40 91.40 93.40 93.10 92.20 92.20 84.20 83.50 82.50Operations/Maintenance 58.75 58.75 58.00 56.00 55.00 52.00 52.00 53.00 53.00 52.00 52.00Central Administration 18.50 19.50 19.50 20.50 21.50 20.50 20.50 21.00 21.50 19.50 17.50Total Cost of Wages $41,279,754 $43,754,566 $44,267,466 $44,950,604 $45,917,029 $46,713,363 $47,600,833 $48,533,877 $49,955,524 $51,410,314 $50,689,864including revolving account FTEs
Local Budget and Education Jobs and Grant only - Does not include other grants
0.00
200.00
400.00
600.00
800.00
1000.00
1200.00
FY08 FY09 FY10 FY11 FY12 FY13 FY14 FY15 FY16 FY17 FY18
Total Staffing FTE
Instructional
Other School Services (BusOp and Attendance)Operations/Maintenance
12

The Budget in Context The City of Pittsfield is facing tight fiscal constraints in FY19, and likely for several years beyond next year. Known cost increases in the city ledger, including health insurance premiums have put the city extremely close to the levy ceiling.
The Pittsfield Public Schools, as part of the City of Pittsfield, made significant staffing reductions in FY18 which have also served to contain costs in FY19. In making these difficult choices, the district has relied on several guiding principles:
• Are we legally obligated to provide this service, program or a specific level of service? • Are we morally obligated to provide this service, program or a specific level of service? • Does our community expect this service for its annual investment in our schools? • Are students making gains commensurate with the $$$ spent on programs and/or staff? • Is there a partner in the Community who can do the work more efficiently, to a higher
degree or more cost effectively? • Remembering that we are a part of the City of Pittsfield, which provides a host of
services to its residents, services that are vital, affect every one of us, and promote the general well-being of every person who calls Pittsfield home.
Smarter School Spending
A school budget can directly impact students if it is aligned to student need. Traditional models tend to be trying to catch up where you once were as opposed to aligning your budget with where you want to go. -- Quote from Dr. Jeff Rose, who was Superintendent at Beaverton school district in Oregon.
In October 2016, the Pittsfield Public Schools administration applied for and was accepted into the Alliance for Excellence in School Budgeting. The Alliance is an initiative of the Government Finance Officers Association, a well-regarded national organization of federal, state and municipal finance officials that provides training and professional development for its members. The initiative is funded by the Government Finance Officers Association with support from the Bill and Melinda Gates Foundation. The goal of the Alliance is to more closely align district resources with student learning goals by creating a partnership between the academic and finance staff. Through better planning and decision making, the district is working to put money where it will do the most good for kids.
There are currently 80 member districts nationwide. A list of the member districts is below:
13

Arizona Amphitheater Public Schools California Education for Change Public Schools Hayward Unified School District Pomona Unified School District Santa Ana Unified School District San Francisco Unified School District Tracy Unified School District Colorado Boulder Valley School District Eagle County School District RE50J Jeffco Public Schools Moffat County School District Florida Lake County Schools Miami-Dade County Public Schools School District of Palm Beach County Volusia County Schools Georgia Atlanta Public Schools Fulton County School System Idaho Nampa School District Illinois River Trails School District 26 Rockford Public School District 205 St. Charles Community Unit School District 303 Thornton Township High School District 205 Iowa Des Moines Public Schools Kentucky Fayette County Public Schools Louisiana DeSoto Parish School System Maryland Howard County Public School System Massachusetts Cambridge Public Schools Pittsfield Public Schools Michigan Glen Lake Community Schools St. Johns Public Schools Traverse City Area Public Schools Troy School District Wayne-Westland Community Schools Montana Billings School District Nebraska Beatrice Public Schools
Omaha Public Schools Nevada Carson City School District New Jersey Elizabeth Public Schools New York Rochester City School District Ohio Bexley City School District Columbus City Schools Dayton City School District Lakota Local School District Springfield City School District Toledo Public Schools Trotwood-Madison School District Oregon Beaverton School District Hillsboro School District 1J North Bend School District Portland Public Schools Tigard-Tualatin School District Willamette Education Service District Pennsylvania Upper Moreland School District Rhode Island Bristol Warren Regional School District South Carolina Greenville County Schools Texas DeSoto Independent School District Fort Worth Independent School District Lamar Consolidated Independent School District Wylie Independent School District Virginia Goochland County Public Schools Hanover County Public Schools Washington Auburn School District Bellevue School District Central Kitsap School District Organization North Mason School District Olympic Educational Service District 114 Pasco School District Shoreline School District No. 412 Wisconsin Milwaukee Public Schools School District of Fort Atkinson School District of Menomonee Falls
14

Budget Priorities Although we are facing difficult fiscal challenges, the district will continue to put student learning goals at the forefront. The Pittsfield Public Schools administration identified two primary budget priorities for the fiscal year 2019 budget: 1) funding contractual obligations and returning full time Kindergarten paraprofessionals to the classroom; and 2) creating a well-supported therapeutic program for elementary school students. The current program has two classrooms at Morningside Community School and three classrooms at Crosby Elementary School. The new program will house all five classrooms at Crosby Elementary School under the leadership of a therapeutic program director. The program will also undergo staff changes with a reduction in the number of paraprofessionals and the addition of five regular education teachers, one per classroom, to create a co-teaching model. The regular education teacher will focus on classroom instruction with the special education teacher focusing on social emotional learning and specialized instruction.
15

Orginal Actual Actual Actual Actual BudgetFY2014 FY2015 FY2016 FY2017 FY2018
General $62,063,045 $62,745,641 $64,868,169 $67,027,607 $69,346,355Revolving $2,636,566 $2,686,973 $2,832,637 $2,593,421 $2,581,658State Grants $1,429,832 $1,335,378 $1,159,455 $923,600 $874,179Federal Grants $5,871,281 $6,075,817 $4,716,854 $4,958,383 $6,587,999Food Services $2,885,625 $2,770,290 $3,024,583 $3,053,903 $3,276,155Student Activities $509,528 $533,753 $488,155 $506,070 $495,000
Total $75,395,876 $76,147,852 $77,089,853 $79,062,984 $83,161,346
OriginalActual Actual Actual Actual BudgetFY2014 FY2015 FY2016 FY2017 FY2018
General $55,697,123 $56,301,333 $58,081,442 $57,544,713 $69,346,355Revolving $2,281,660 $3,134,565 $2,442,583 $2,508,036 $2,581,658State Grants $1,546,675 $1,333,308 $1,147,875 $915,389 $874,179Federal Grants $5,712,597 $5,694,345 $4,783,662 $4,811,124 $6,587,999Food Services $2,600,866 $2,855,869 $2,912,454 $3,017,510 $3,276,155Student Activities $265,991 $288,633 $246,490 $242,544 $495,000
Total $68,104,912 $69,608,053 $69,614,506 $69,039,316 $83,161,346
Revenue Summary by Fund FY14-18
Expense Summary by Fund FY14-FY18
$0
$10,000,000
$20,000,000
$30,000,000
$40,000,000
$50,000,000
$60,000,000
$70,000,000
$80,000,000
$90,000,000
FY2014 FY2015 FY2016 FY2017 FY2018
Actual Actual Actual Actual Budget
Revenue Expendiutures
16

Tax Rate Trend by Class
20.24
15.65
15.65
14.25
13.15 13.67 14.20 15.19 16.11 16.70 17.15 18.06 18.76 19.63 20.01
29.58
25.05
27.66 27.31 28.35 28.88 29.41
30.95 32.85
34.47 35.17 36.63
38.06 39.78 39.98
0.00
5.00
10.00
15.00
20.00
25.00
30.00
35.00
40.00
45.00
2004 2005 2006 2007 2008 2009 2010 2011 2012 2013 2014 2015 2016 2017 2018
Tax
Rate
per
$1,
000
Fiscal Year
City of Pittsfield History of Tax Rate Trend by Class
Residential, Open Space
Commerical, Industrial,Personal Property
17

Capital Improvement Requests- Schools
BMD Capital 5 YR Request Plan-Schools
SCHOOL PROJECT FY19 FY20 FY21 FY22 FY23 Total
All Door Replacements $ - $ 20,000 $ 20,000 $ 20,000 $ 20,000 $ 80,000
All Environmental-Abatements $ 65,000 $ 75,000 $ 75,000 $ 75,000 $ 75,000 $ 365,000
MSCS Rooftop Unit Replacement $ 100,000
$ 100,000
PHS Boiler Replacement
$ 50,000 $ 750,000
$ 800,000
Herberg/Reid Boiler Tube Replacement $ 35,000 $ 35,000 $ 35,000 $ 35,000
$ 140,000
Various Heating Control Upgrades
$ 270,000
$ 270,000
Carpet Removal/Replacement
PHS Library
$ 65,000
$ 65,000
Herberg Boiler Exhaust Repairs $ 50,000
$ 50,000
Various School Roof Repairs $ 75,000 $ 750,000 $ 750,000 $ 750,000 $ 750,000 $ 3,075,000
PHS Stage Rigging Upgrades
$ 75,000
$ 75,000
Schools Security/Safety Upgrades/Design $ 50,000 $ 25,000 $ 25,000 $ 25,000 $ 25,000 $ 150,000
$ 375,000 $ 1,365,000 $ 1,655,000 $ 905,000 $ 870,000 $ 5,170,000
18
Organization and Planning School Accelerated Improvement Plan
Area Served and School Zones
District Families
19

2017-2018 Pittsfield Public Schools Improvement Plan Click here to view the 2016-2017 Pittsfield Public Schools Improvement Plan
Click here to view the 2017-2018 District Professional Development Plan WHY? The purpose of the 2017-2018 District Improvement Plan is to develop, improve, and sustain a student-centered academic and social emotional learning experience anchored in high leverage practices.
Strategic Objective One In order to create an effective infrastructure to drive key planning and decision making, the district will create District and School-Based Implementation Teams to support high fidelity implementation of high leveraged strategies. Objective Champion: Joseph Curtis, Deputy Superintendent
Outcomes for 2017-2018 Timeline
Outcome Key Activities
By November 2017
The district will form a District Implementation Team that is representative of all stakeholders.
● Administrators and principals will utilize our Implementation Science consultant to form a District Implementation team that is lead by building principals, but includes faculty members, principals, and administrators from across the district.
The district will utilize the District Implementation Team and a formal process to evaluate value and district capacity before beginning a new initiative.
● The District Implementation Team leaders and our Implementation Science Consultant will plan all District Implementation meeting agendas for the 2017-2018 school year.
● The District will use the District Implementation Team and Implementation Science to research and explore an instructional model for district installation.
2017 2018
School Year
School Leadership Implementation Teams will use implementation science to explore, install and implement change in the school and district.
● The District Implementation Team will form a Communication Plan that details a direct line of communication to school based teams that will facilitate two way communication during the decision making process and after the decision has been made to inform all stakeholders.
● School Leadership Teams will receive professional development to strengthen their understanding of implementation science.
2017 2018
School Year
The district will maintain district professional learning committees to inform the focus of the District Implementation Team and ultimately the District Improvement Plan.
● The District will maintain and grow Shared Decision Making Committees: ○ Topic-Based Committees - (Science, Technology & Engineering; Mathematics) ○ Professional Development, Assessment & Curriculum Committee ○ Teacher and Parent/Guardian Advisory Committees ○ Report Card Development Committee ○ District Leadership Group on Positive Behavior Support ○ District Leadership Group on Attendance
2017 2018
School Year
20
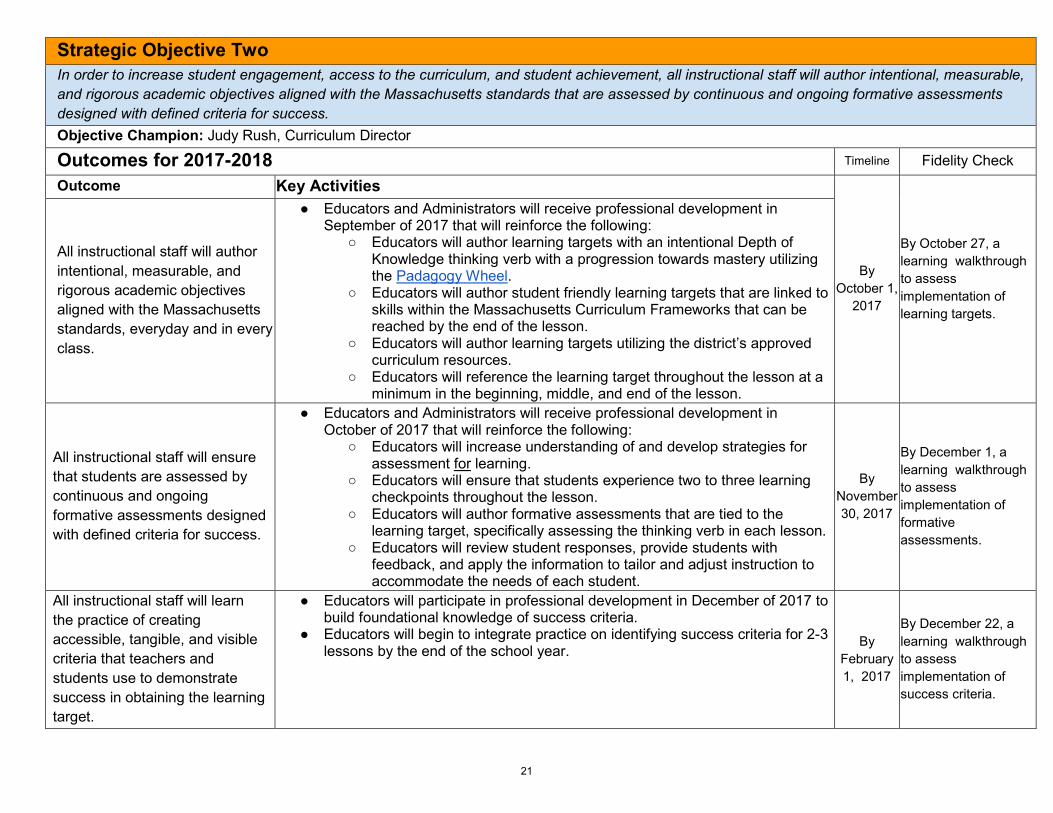
Strategic Objective Two In order to increase student engagement, access to the curriculum, and student achievement, all instructional staff will author intentional, measurable, and rigorous academic objectives aligned with the Massachusetts standards that are assessed by continuous and ongoing formative assessments designed with defined criteria for success. Objective Champion: Judy Rush, Curriculum Director
Outcomes for 2017-2018 Timeline Fidelity Check
Outcome Key Activities
By October 1,
2017
By October 27, a learning walkthrough to assess implementation of learning targets.
All instructional staff will author intentional, measurable, and rigorous academic objectives aligned with the Massachusetts standards, everyday and in every class.
● Educators and Administrators will receive professional development in September of 2017 that will reinforce the following:
○ Educators will author learning targets with an intentional Depth of Knowledge thinking verb with a progression towards mastery utilizing the Padagogy Wheel.
○ Educators will author student friendly learning targets that are linked to skills within the Massachusetts Curriculum Frameworks that can be reached by the end of the lesson.
○ Educators will author learning targets utilizing the district’s approved curriculum resources.
○ Educators will reference the learning target throughout the lesson at a minimum in the beginning, middle, and end of the lesson.
All instructional staff will ensure that students are assessed by continuous and ongoing formative assessments designed with defined criteria for success.
● Educators and Administrators will receive professional development in October of 2017 that will reinforce the following:
○ Educators will increase understanding of and develop strategies for assessment for learning.
○ Educators will ensure that students experience two to three learning checkpoints throughout the lesson.
○ Educators will author formative assessments that are tied to the learning target, specifically assessing the thinking verb in each lesson.
○ Educators will review student responses, provide students with feedback, and apply the information to tailor and adjust instruction to accommodate the needs of each student.
By November 30, 2017
By December 1, a learning walkthrough to assess implementation of formative assessments.
All instructional staff will learn the practice of creating accessible, tangible, and visible criteria that teachers and students use to demonstrate success in obtaining the learning target.
● Educators will participate in professional development in December of 2017 to build foundational knowledge of success criteria.
● Educators will begin to integrate practice on identifying success criteria for 2-3 lessons by the end of the school year.
By February 1, 2017
By December 22, a learning walkthrough to assess implementation of success criteria.
21

Strategic Objective Three
In order to increase student engagement, access to the curriculum, and student achievement, instructional staff will administer common assessments, analyze the assessment data, report and adjust instruction based on the data a minimum of three times a year. Objective Champion: Judy Rush, Curriculum Director
Outcomes for 2017-2018 Timeline
Outcome Key Activities
Faculty members will have a clear understanding of how and when to administer each common assessment stated in the district and school district common assessments plan.
● Professional Development will be provided to targeted educators to support a “Train-the-Trainer” model to administer the common assessments throughout the year.
● A District Assessment Calendar will be created and shared with all stakeholders. ● All schools will be provided a copy their school assessments calendar to specifically tailor
the calendar to meet school resources and schedules.
By October 2017
Faculty, principals, and district administrators will have a minimum of three or four meetings (depending on school level) a year specifically related to school level data analysis, reporting, and an action plan to address adjustments to instruction.
● Professional Development (Click here to view the District Professional Development Schedule) will be provided to educators that includes:
○ Purpose/meaning of testing measures ○ How to schedule and administer the assessments ○ How to pull reports ○ How to adjust instruction for students based on the data ○ How to provide feedback to students and families
● A Data Presentation Schedule will be created that includes: ○ Principal Data Presentations to Staff ○ Principal Data Presentations to District Leadership Team
● District School Psychologists will support building teams with data analysis ● A Professional Development Plan has been drafted that includes ongoing support for
principals/educators in data analysis
2017- 2018 School Year
22

Strategic Objective Four In order to increase student academic, social and emotional success, faculty and administrators will use engaging instructional practices, positive behavioral interventions, and social emotional learning strategies designed to identify needs, develop skills, and support students within safe learning environments. Objective Champion: Ann Marie Carpenter, School Adjustment Counselor Unit Leader
Outcomes for 2017-2018 Timeline Fidelity Check
Outcome Key Activities
The Pittsfield Public Schools will Increase the intentional use of student, family and staff voice in improvement planning to improve academic and nonacademic outcomes for students.
1. All school leadership teams will participate in professional development that will assist the analysis and reporting of school and district surveying data.
2. SfSS Team, in collaboration with stakeholders and interested parties, will select question content for three annual surveys for each audience..
3. Deputy Superintendent and Principals will collaboratively author annual district data calendar during the June and September district leadership council meetings that will detail the distribution, analysis, and dissemination of data
4. Administer student, faculty, and family surveys as written in the district assessment calendar.
5. Create template that outlines minimal data reporting requirements at both the school and district level. Explore use of reporting features within Panorama tool itself.
6. District and school based teams will author action plans based on survey results.
By August 2017
Fall 2017, Winter 2018, Spring 2018 Survey Results and
action plans
All Pittsfield Public Schools will implement Positive Behavior Supports (PBIS) with fidelity will create a systematic approach to increase student social/emotional/behavior competence, provide a consistent framework for recognizing positive behavior and responding to rule violating behavior and create an orderly, positive school climate.
1. All school leadership teams will participate in the August 2017 positive behavior support planning day to plan their monthly PBIS activities.
2. All school leadership teams will participate in the January and June PBIS Leadership Team Summit to review and refresh their school year PBIS plan and to finalize their PBIS Family Manual.
3. Each school-based PBIS Team facilitators will attend a monthly district planning meeting.
4. Every school has a written PBIS implementation plan and manual that includes key components of the PBIS framework that is reviewed and updated annually.
5. Consistent data points will be identified, analyzed and then reported out three times annually at both school and district level data meetings to inform improvement planning at the school and district level.
6. Student voice survey results will show improved student perceptions of their social and behavioral competence, as well as increased sense of school as a place where they are engaged and have a sense of belonging.
2017 2018 School Year
By June of 2018,
each school
will publish a
PBIS Staff
Manual
In January and June of 2018,
data points will
be analyzed
and action plan
23
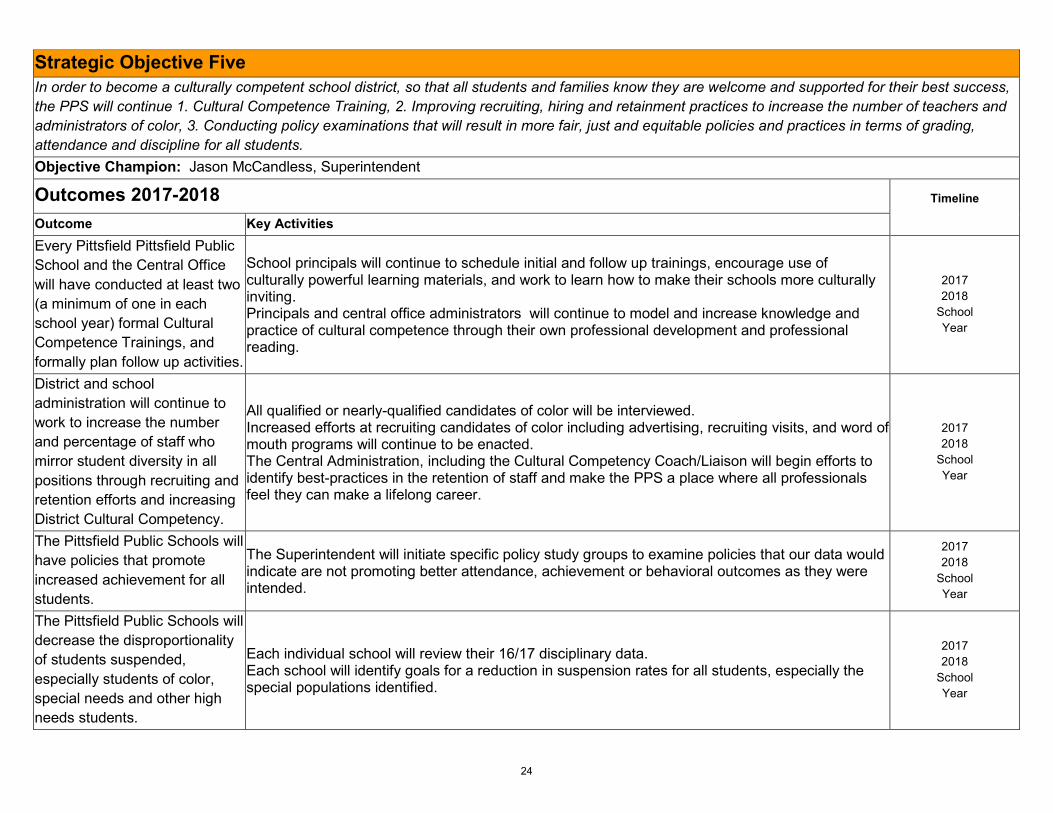
Strategic Objective Five In order to become a culturally competent school district, so that all students and families know they are welcome and supported for their best success, the PPS will continue 1. Cultural Competence Training, 2. Improving recruiting, hiring and retainment practices to increase the number of teachers and administrators of color, 3. Conducting policy examinations that will result in more fair, just and equitable policies and practices in terms of grading, attendance and discipline for all students. Objective Champion: Jason McCandless, Superintendent
Outcomes 2017-2018 Timeline
Outcome Key Activities Every Pittsfield Pittsfield Public School and the Central Office will have conducted at least two (a minimum of one in each school year) formal Cultural Competence Trainings, and formally plan follow up activities.
School principals will continue to schedule initial and follow up trainings, encourage use of culturally powerful learning materials, and work to learn how to make their schools more culturally inviting. Principals and central office administrators will continue to model and increase knowledge and practice of cultural competence through their own professional development and professional reading.
2017 2018
School Year
District and school administration will continue to work to increase the number and percentage of staff who mirror student diversity in all positions through recruiting and retention efforts and increasing District Cultural Competency.
All qualified or nearly-qualified candidates of color will be interviewed. Increased efforts at recruiting candidates of color including advertising, recruiting visits, and word of mouth programs will continue to be enacted. The Central Administration, including the Cultural Competency Coach/Liaison will begin efforts to identify best-practices in the retention of staff and make the PPS a place where all professionals feel they can make a lifelong career.
2017 2018
School Year
The Pittsfield Public Schools will have policies that promote increased achievement for all students.
The Superintendent will initiate specific policy study groups to examine policies that our data would indicate are not promoting better attendance, achievement or behavioral outcomes as they were intended.
2017 2018
School Year
The Pittsfield Public Schools will decrease the disproportionality of students suspended, especially students of color, special needs and other high needs students.
Each individual school will review their 16/17 disciplinary data. Each school will identify goals for a reduction in suspension rates for all students, especially the special populations identified.
2017 2018
School Year
24

Area Served Pittsfield, the largest city within Berkshire County, Massachusetts with an estimated population of 42,846 operates a public school system which has over 5,488 students.
The quality of Pittsfield's educational experience is enriched by the diversity of educational choices in Pittsfield. The Pittsfield Public Schools strives to serve its community and its children by creating an environment where life-long learning is valued, excellence is expected and improvement is continuous.
Pittsfield operates a public school system which serves 5500 students throughout eight elementary schools, two middle schools, and two high schools. Pittsfield schools prepare every student for postsecondary education, career and lifelong economic, social, and civic success.
According to the United States Census Bureau, the city has a total area of 42.5 square miles (110.0 km2), of which 40.5 square miles (104.8 km2) is land and 2.0 square miles (5.2 km2), or 4.70%, is water.
See the maps of the School Zones in the City on the next 3 pages
25

Elementary Schools
26

Middle Schools
27

High Schools
28

Elementary Schools
Allendale Elementary
Address: 180 Connecticut Avenue Year Built: 1951 10.9 acres Addition: 1999 Square Footage: 48,133
Grades: K – 5 FY 2018 Enrollment: 288 Principal: Brenda Kelley Capeless Elementary Address: 86 Brooks Avenue Year Built: 1951 7.9 acres Addition: 2001 Square Footage: 38,654 Grades: K – 5 FY 2018 Enrollment: 216 Principal: Candy Jezewski Conte Community School Address: 200 West Union Street Year Built: 1974 15.0 acres Square Footage: 69,518 Grades: Pre-k – 5 FY 2018 Enrollment: 362 Principal: Kerry Light Crosby Elementary
Address: 517 West Street Year Built: 1962 37.5 acres Square Footage: 69,826 Grades: 442 FY 2018 Enrollment: 446 Principal: Aaron Dean Egremont Elementary Address: 84 Egremont Avenue Year Built: 1951 10.6 acres Addition: 1999 Square Footage: 63,879 Grades: K – 5 FY 2018 Enrollment: 423 Principal: Jared Materas
29
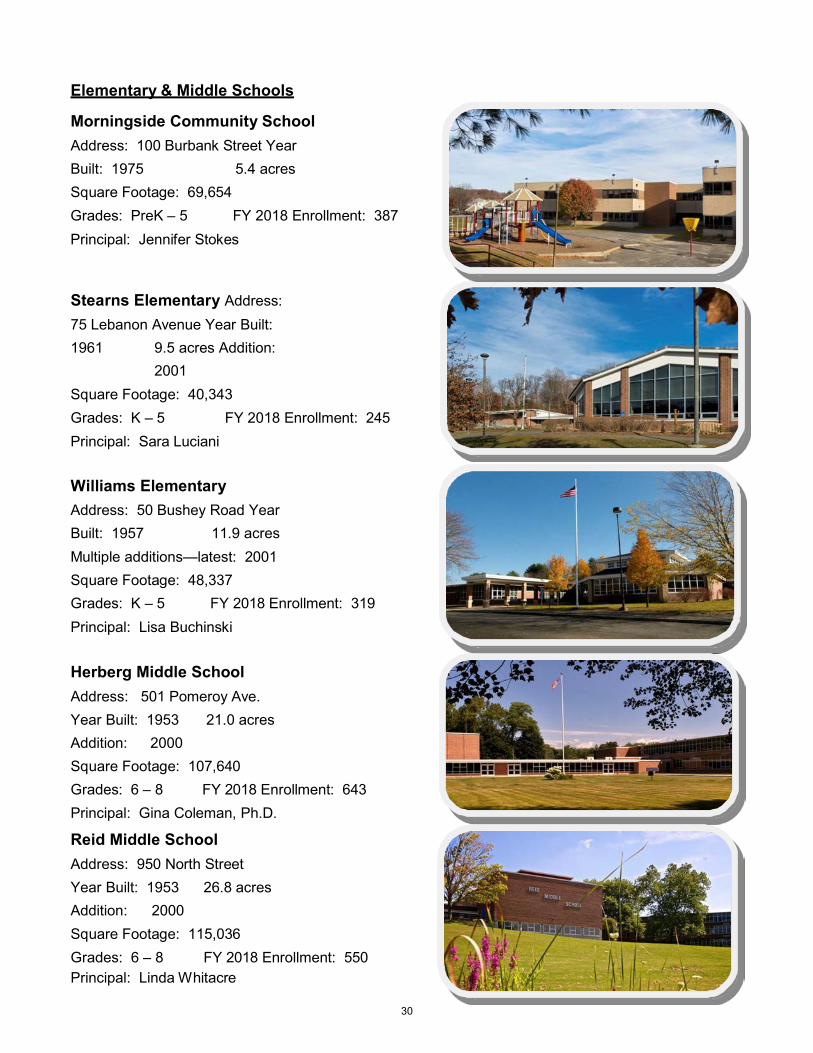
Elementary & Middle Schools Morningside Community School
Address: 100 Burbank Street Year Built: 1975 5.4 acres Square Footage: 69,654 Grades: PreK – 5 FY 2018 Enrollment: 387 Principal: Jennifer Stokes Stearns Elementary Address: 75 Lebanon Avenue Year Built: 1961 9.5 acres Addition: 2001 Square Footage: 40,343 Grades: K – 5 FY 2018 Enrollment: 245 Principal: Sara Luciani Williams Elementary Address: 50 Bushey Road Year Built: 1957 11.9 acres Multiple additions—latest: 2001 Square Footage: 48,337 Grades: K – 5 FY 2018 Enrollment: 319 Principal: Lisa Buchinski Herberg Middle School Address: 501 Pomeroy Ave. Year Built: 1953 21.0 acres Addition: 2000 Square Footage: 107,640 Grades: 6 – 8 FY 2018 Enrollment: 643 Principal: Gina Coleman, Ph.D.
Reid Middle School Address: 950 North Street Year Built: 1953 26.8 acres Addition: 2000 Square Footage: 115,036 Grades: 6 – 8 FY 2018 Enrollment: 550 Principal: Linda Whitacre
30

High Schools & Other Facilities Pittsfield High School Address: 300 East Street Year Built: 1931 8.7 acres Addition: 1975 Square Footage: 203,051 Grades: 9 – 12 FY 2018 Enrollment: 852 Principal: Matthew Bishop Taconic High School Address: 96 Valentine Road Year Built: 1969 50.0 acres Square Footage: 189,686 Grades: 9 – 12 FY 2018 Enrollment: 733
Principal: John Vosburgh William Stickney Adult Learning Center Address: 141 North Street Leased Space: 2013 Square Footage: 10,000 FY 2018 Enrollment: 90+/- Director: Paul Gage Mercer Administration Building
Address: 269 First Street Year Built: 1905 .90 acres Square Footage: 17,653 Superintendent: Dr. Jason P. McCandless
31
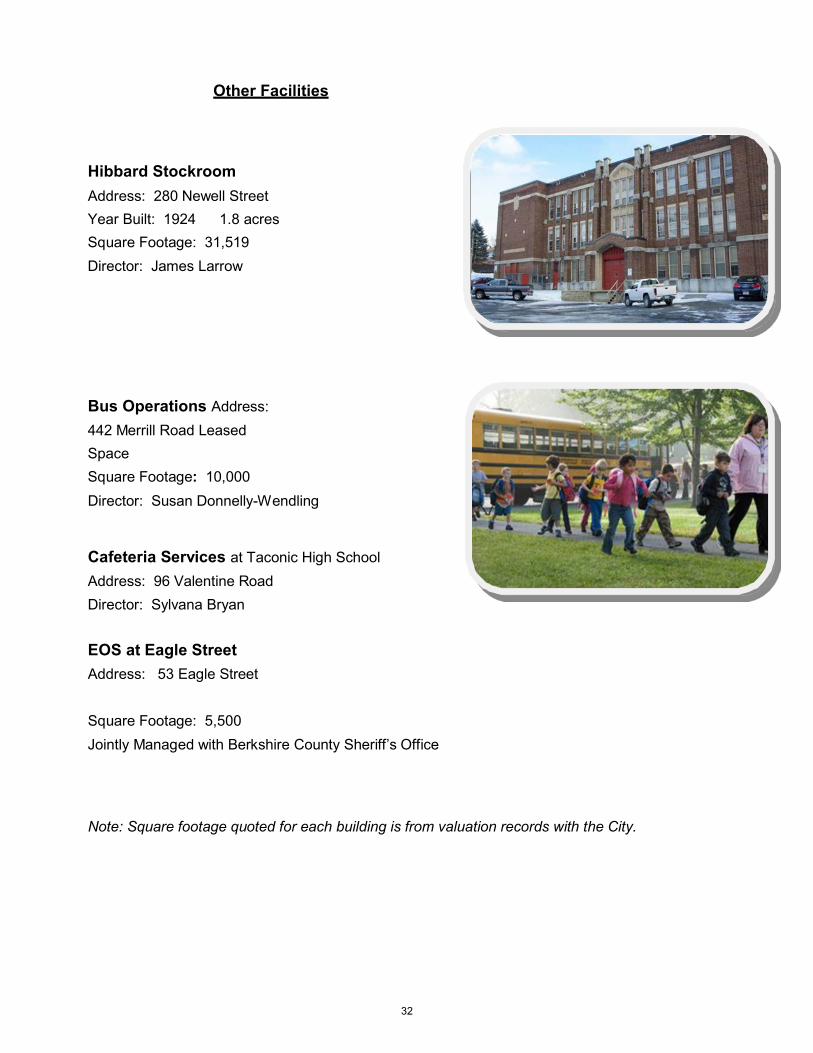
Other Facilities
Hibbard Stockroom Address: 280 Newell Street Year Built: 1924 1.8 acres Square Footage: 31,519 Director: James Larrow Bus Operations Address: 442 Merrill Road Leased Space Square Footage: 10,000
Director: Susan Donnelly-Wendling Cafeteria Services at Taconic High School
Address: 96 Valentine Road Director: Sylvana Bryan EOS at Eagle Street
Address: 53 Eagle Street Square Footage: 5,500 Jointly Managed with Berkshire County Sheriff’s Office Note: Square footage quoted for each building is from valuation records with the City.
32

Enrollment Enrollment Data
Enrollment Projections
33

Enrollment Data Enrollment Trends by Elementary School Grade Level
Enrollment Trends by Middle School Grade Level
150
200
250
300
350
400
450
500
550
600
2002 2003 2004 2005 2006 2007 2008 2009 2010 2011 2012 2013 2014 2015 2016 2017
Elementary School Enrollment Trends Based on October 1 Data of Each Year
Allendale
Capeless
Conte
Crosby
Egremont
Morningside
Stearns
Williams
400
450
500
550
600
650
700
750
800
850
2002200320042005200620072008200920102011201220132014201520162017
Middle School Enrollment Trends Based on October 1 Data of Each Year
Herberg
Reid
34

Enrollment Trends by High School Grade Level
Total Enrollment by Race
600
650
700
750
800
850
900
950
1000
1050
1100
1150
1200High School Enrollment Trends
Based on October 1 Data of Each Year
Pittsfield High
Taconic High
White, 65.90%
Black or African American,
10.67%
Asian, 1.39%
American Indian or Alaska Native,
26.00%
Native Hawaiian or Other Pacific Islander, 0.05%
Hispanic, 13.07% Multi-Race Total, 8.66%
35

Long Term Trends in Enrollment
Long Term Enrollment Trends. Statistical Comparisons - School Finance. Massachusetts Department of Elementary and Secondary Education. 3 Dec. 2014. <http://www.doe.mass.edu/finance/statistics/>
10-Year History – Free/Reduced Lunch (through 2014)
7000
6000
6472 6352 6234
6120 6072 5978 5985 5992 5883
65.32%
5744
70.00% 60.00%
5000
4000
43.52%
40.59% 40.54%
56.49% 55.69% 54.67% 55.17%
49.65%
46.03% 3752
3268 3302 3385 3276 3015
50.00% 40.00%
District Enrollment as pf October 1 each year as reported by DESE Number of Students
3000
2000
2627 2575 2713 2817 30.00%
20.00%
Receiving Free/Reduced Lunch as of 10/31 of each year as reported by Food Services Dept.* % Free/Reduced Lunch
1000 10.00%
0 2005 2006 2007 2008 2009 2010 2011 2012 2013 2014
Year
36

See State Revenue, Chapter 70 section regarding the new Federal Community Eligibility Program for breakfast and lunch. This new metric allocates different levels of funding for economically disadvantaged students based on Medicaid or Supplemental Nutrition Assistance Program eligibility.
0
100
200
300
400
500
600
SY 2018 Average Daily Student and Adult Meals
Student Lunch Strudent Breakfast Student Double Lunch Adut Lunch Ala Carte (Meal Equivalent)
0
100
200
300
400
500
600
SY 18 Average Daily Free and Paid Lunch
Free Lunch Paid Lunch
37

Directly
Student Student Student Double Adult ALA Total Meals Free Reduced Paid Certified
School Lunch Breakfast Lunch Lunch Carte Per Site Lunch Lunch Lunch Students Enrollment(Meal Equivalents)
ALLENDALE 227 76 0 2 0 305 227 45.45% 286
CAPELESS 176 68 0 1 0 245 176 46.08% 217
CONTE 341 237 1 10 0 589 341 77.32% 388
CROSBY 362 337 5 2 1 707 362 67.84% 454
EGREMONT 305 90 2 4 1 402 305 39.25% 428
HERBERG 484 177 24 11 4 700 484 39.72% 652
MORNINGSIDE 346 189 0 5 2 542 346 67.42% 396
PHS 274 80 9 2 20 385 179 35 60 35.08% 861
REID 431 109 12 4 4 560 431 49.00% 549
STEARNS 204 136 0 3 0 343 204 38.43% 242
TACONIC HS 408 114 31 1 50 604 232 43 132 43.66% 733
WILLIAMS 253 59 1 2 1 316 253 27.67% 318
HEAD START 134 135 0 16 0 285 134 100.00% 145
GRAND TOTAL 3945 1807 85 63 83 5983 3674 78 192 5669
Meal Prices:Free and Reduced
Rate Paid AdultBreakfast $0.00 $0.75 $1.75Lunch $0.00 $2.20 $3.75Milk Only $0.40
FISCAL YEAR 2018Daily Average of Meals Served to Students and Adults
Daily Average
38

Total Meals
School Student Lunch Strudent Breakfast Double Lunch Adut Lunch Ala Carte Per Site
Equivalent)
ALLENDALE 227 76 0 2 0 305
CAPELESS 176 68 0 1 0 245
CONTE 341 237 1 10 0 589
CROSBY 362 337 5 2 1 707
EGREMONT 305 90 2 4 1 402
HERBERG 484 177 24 11 4 700
MORNINGSIDE 346 189 0 5 2 542
PHS 274 80 9 2 20 385
REID 431 109 12 4 4 560
STEARNS 204 136 0 3 0 343
TACONIC HS 408 114 31 1 50 604
WILLIAMS 253 59 1 2 1 316
HEAD START 134 135 0 16 0 285
GRAND TOTAL 3945 1807 85 63 83 5983
Meal Prices:
Free/ Reduced
Rate Paid Adult Breakfast $0.00 $0.75 $1.75 Lunch $0.00 $2.20 $3.75 Milk Only $0.40
39

Pittsfield Public Schools FY2019 Enrollment Projections
Class Size Guidelines
Grades K-3 18 Students/Class
Grades 4 and 5 22 Students/Class
NAEYC Kindergarten 1:12 Adults/Students
MS/HS Academic Courses 1:24 Adults/Students
Allendale Elementary School
Grade FY 16
Enrollment
FY 17 Enrollme
nt
FY 18 Enrollment
FY 18 Sections
FY 18 Class Size
Anticipated FY 19
Enrollment Sections Class
Size
K 42 51 57 3 19.0 60 3 20 1 50 40 49 3 16.3 57 3 19 2 46 50 44 3 14.7 47 3 15.6 3 51 41 46 3 15.3 42 3 14 4 48 49 42 2 21.0 47 2 23.5 5 55 51 51 3 17.00 43 3 14.3
Total 292 282 289 296
Robert T. Capeless Elementary School
Grade FY 16 Enroll- ment
FY 17 Enroll- ment
FY 18 Enrollment
FY 18 Sections
FY 18 Class Size
Anticipated FY 19
Enrollment Sections Class
Size
K 25 34 37 2 18.5 40 2 20 1 31 28 33 2 16.5 38 2 18.5 2 35 31 28 2 14.0 32 2 16 3 27 33 31 2 15.5 29 2 14.5 4 37 31 35 2 17.5 31 2 15.5 5 35 35 30 2 15.0 35 2 17.5
Integrated PreK
25 17 26 2 half-day sessions
13 25 2 half-day sessions 12.5
Total 215 209 220 229
40

Silvio O. Conte Community School
Grade FY 16 Enroll- ment
FY 17 Enroll- ment
FY 18 Enroll- ment
FY 18 Sections
FY 18 Class Size
Anticipated FY 19 Enrollment Sections Class Size
PreK 34 33 18 1 18 18 1 18 K 61 58 74 4 18.5 75 4 18.5 1 74 55 58 4 14.5 70 4 17.5 2 56 68 52 3 17.3 62 3 21 3 53 51 60 4 15 53 3 13 4 43 53 53 3 17.6 62 4 21 5 53 39 52 3 17.3 56 3 19
Transitional Kindergarten 8 5 0 0 0 0 0 0
*Head Start 15 12 15 1 15 15 3 30 Total 382 362 367 396
* These students are not included in state reporting.
John C. Crosby Elementary School
Grade FY 16 Enroll- ment
FY 17 Enroll- ment
FY 18 Enroll- ment
FY 18 Sections
FY 18 Class Size
Anticipated FY 19 Enrollment Sections Class Size
K 45 53 63 3 **21 60 3 **20 1 54 41 59 3 **19.6 68 3 **22.6 2 37 54 58 3 **19.3 54 3 **18 3 58 33 74 3 **24.6 59 3 **19.6 4 46 54 55 2 **27.5 75 2 **37.5 5 31 51 76 3 **25.3 52 3 **17.3
Substantially Separate 88
75 *79 4 19.7 *80 4 20
Substantially Separate
PreK 83 78 67 4 16.75 70 4 17.5
Total 442 439 452
* Students listed in grade level totals
** Grade level class size varies slightly due to substantially
separate classrooms
438
* Students listed in grade level totals
** Grade level class size varies slightly due to
substantially separate classrooms
41

Egremont Elementary School
Grade FY 16 Enroll- ment
FY 17 Enroll- ment
FY 18 Enroll- ment
FY 18 Sections
FY 18 Class Size
Anticipated FY 19
Enrollment Sections Class Size
K 66 70 71 4 **17.8 70 4 **17.5 1 80 64 64 4 **21 73 4 **18.25 2 74 78 60 4 **15 65 4 **16.25 3 83 78 77 4 **19.3 62 3 **20.6 4 94 80 72 4 **18 77 4 **19.25 5 95 89 80 4 **20 73 4 **18.25
Intellectually Impaired 11 10 *11 1 11 *11 1 11
Total 503 469 435
* Students listed in grade level totals
** Grade level class size varies slightly due
to intellectually impaired classroom
420
* Students listed in grade level totals
** Grade level class size varies slightly due to intellectually impaired classroom
Morningside Community School
Grade FY 16 Enroll- ment
FY 17 Enroll- ment
FY 18 Enroll- ment
FY 18 Sections
FY 18 Class Size
Anticipated FY 19
Enrollment Sections Class Size
PreK 30 33 18 1 18 18 1 18 K 62 49 74 4 18.5 75 4 18.75 1 61 57 51 3 17 76 4 19 2 70 59 50 4 12.5 52 4 13 3 78 59 56 3 18.6 50 3 16.6 4 72 79 56 4 **14 57 4 **14.25 5 68 63 87 4 **21.74 58 4 **14.5
Therapeutic 3-5 16 18 *16 2 8 *18 2 9
Total 457 417 374
* Students listed in grade level totals
** Grade level class size varies slightly due
to substantially separate classrooms
386
* Students listed in grade level totals
** Grade level class size varies slightly due to substantially
separate classrooms
42

Stearns Elementary School
Grade FY 16 Enroll- ment
FY 17 Enroll- ment
FY 18 Enroll- ment
FY 18 Sections
FY 18 Class Size
Anticipated FY 19
Enrollment Sections Class Size
K 36 39 51 2 ** 25.5 40 2 **20
1 46 39 39 2 ** 19.5 52 2 **26 2 30 44 42 2 ** 21 39 2 19.5 3 29 30 49 2 ** 24.5 38 2 **19 4 32 28 30 2 ** 15 48 2 **24 5 39 33 34 2 ** 17 29 2 **14.5
Substantially Separate 15 22 *25 2 12.5 *25 2 **12.5
Total 227 235 245
* Students listed in grade level totals
** Grade level class size varies slightly due to
substantially separate classrooms
246
* Students listed in grade level totals
** Grade level class size varies slightly due to
substantially separate classrooms
Williams Elementary School
Grade FY 16 Enrollment
FY 17 Enrollment
FY 18 Enrollment
FY 18 Sections
FY 18 Class Size
Anticipated FY 19 Enrollment Sections Class Size
K 44 53 49 3 16.3 55 3 18.3 1 59 48 51 3 17 45 3 15 2 47 58 49 3 16.3 50 3 16.6 3 64 50 57 3 19 49 3 16.3 4 53 61 52 3 17.3 57 3 19 5 48 53 63 3 21 52 3 17.3
Total 315 323 321 308
43

Theodore Herberg Middle School
John T. Reid Middle School
Grade FY 16 Enroll
- ment
FY 17 Enroll- ment
FY 18 Enroll- ment
FY 19 Anticipated Enrollment
Grade FY 16 Enroll- ment
FY 17 Enroll-ment
FY 18 Enroll- ment
FY 19 Anticipate
d Enrollment
6 212 205 222 236 6 201 182 179 236 7 208 214 202 228 7 189 194 179 177 8 218 210 220 205 8 159 179 194 176
Total 638 629 644 669 Total 549 555 552 589
Pittsfield High School
Taconic High School
Grade FY 16 Enroll- ment
FY 17 Enroll- ment
FY 18 Enrollmen
t FY 19
Enrollment Grade FY 16 Enroll- ment
FY 17 Enroll- ment
FY 18 Enrollmen
t
FY 19 Enroll- ment
9 234 216 223 208 9 176 169 225 209 10 215 226 216 227 10 179 168 170 221 11 228 202 212 211 11 210 163 173 171 12 222 217 189 211 12 166 206 167 178
Total 899 861 840 857 Total 731 706 735 779
44

Programs & Services Educational Programs
Technology
Co-Curricular Programs
Operational Services
45

Educational Programs
Curriculum
Pittsfield Public Schools has a strong commitment to continuously strengthening curriculum and instruction. Students in our district receive a rich and diverse academic program. We promote a balanced education that meets students' intellectual, social, and personal needs to help them continue their pursuit of lifelong learning. We strive to prepare our students to be thoughtful, active citizens who can function productively in a multi-cultural, rapidly changing, interdependent world.
Pittsfield Public Schools is committed to developing and implementing a rigorous course of studies with an intentional alignment to the Massachusetts Curriculum Frameworks, also referred to as “the standards.” The standards define the knowledge and skills students should have within their K-12 education careers so that they will graduate high school able to succeed in entry-level, credit-bearing academic college courses and in workforce training programs. The standards are:
• Aligned with college and work expectations • Clear, understandable and consistent • Include rigorous content and application of knowledge through high-order skills • Build upon strengths and lessons of current state standards • Informed by other top performing countries, so that all students are prepared to succeed in
our global economy and society • Evidence-based
Numerous opportunities for learning also extend beyond the school day and school walls. Students participate in trips to other cities, countries and places that directly connect to their studies. Pittsfield Public Schools’ partnerships with local businesses offer high school students real-world situations to apply their knowledge and problem-solving skills. These examples of three-dimensional learning experiences (classroom, text, real-life) stretch and enrich children in immeasurable ways.
46

English Language Learners The Pittsfield Public Schools currently serves students designated as English Learners (EL) across grades K-12. In addition to providing EL instruction, the Pittsfield Public Schools provides translation and interpretation services to bilingual families, as required by law, for parent meetings and documents related to a student’s education. The most common primary language of EL students is Spanish, followed by Chinese and French as our second and third common languages represented.
Special Education The vision of the Special Education department is to minimize the disability and to maximize the opportunities of Special Education students to receive a free and appropriate education in the least restrictive environment. All students will have access to standards-based curriculum and will be provided with research-based interventions to ensure that they graduate from high school and have adequate transition plans. Special Education staff works with teachers, administrators and families to ensure that Individual Education Programs (IEPs) are implemented with integrity. As part of the goal of serving students in the least restrictive environment, Pittsfield Public Schools has developed a continuum of services and placements as detailed in the list below. Providing many of the required services within the district has proven to be cost effective, as most services can be delivered at a lower cost than if the same services were contracted to an outside agency: ● Integrated Early Childhood Preschool Programs at Capeless and Crosby Elementary Schools ● Resource room programs at all eight elementary schools, as well as the middle schools and high schools ● Resource suite programs at Reid and Herberg Middle School ● Psycholinguistic class at Crosby Elementary ● Classrooms that support developmental, intellectual impairments and autism spectrum disorders in self-contained classes at Crosby, Egremont and Stearns Elementary Schools, as well as Reid Middle School and Pittsfield High School ● Services that support autism spectrum disabilities, developmental, intellectual and learning disabilities across the district at all levels ● Therapeutic self-contained classes at Morningside Community School and Crosby Elementary School ● Adolescent Support Program at Pittsfield High School for students with emotional disabilities and who qualify for the Department of Mental Health (DMH) eligibility ● Educational Options for Success (EOS) programs at Reid and Herberg Middle Schools o Tiers 1 and 2 at Reid Middle School o Tiers 1, 2 and 3 at Herberg Middle School ● Educational Options for Success (EOS) programs at Pittsfield High School and Taconic High School (Tiers 1 and 2) ● Educational Options for Success (EOS) program (Tier 3) ● Positive Options Program at Berkshire Community College ● Career Exploratory program at Pittsfield High School and Taconic High School ● Vocational programs at Pittsfield High School and Taconic High School ● Learning Lab, house at RMS for middle and high school student who struggle with anxiety ● Work Study program at Pittsfield High School ● Work Based Learning ● Service Learning ● Speech and language services at all levels ● Occupational therapy services at all levels ● Physical therapy services at all levels ● Sensory services at all levels ● Services for hearing impaired students at all levels
47

● Services for visually impaired students at all levels (Braille, orientation & mobility) ● School adjustment counseling services at all levels ● Tutorial services at all levels ● School psychologist services (assessment) at all levels ● Registered Behavioral Technician in a cognitive classroom at Crosby ● BCBA (Board Certified Behavior Analyst) contracted services at all levels ● Augmentative/alternative communication and learning services at all levels ● Vocational evaluations are provided to students for transition purposes: The Special Education Department utilizes outside resources when needed for transition services ● Assistive technology evaluations, as needed ● Assistive technology to support student learning at all levels ● Paraprofessional supports at all levels ● Community Access to the Arts (CATA) contracted services at the SRC, RMS, PHS and ASP ● Special education services provided to students who live in Pittsfield, but who attend private schools (Miss Hall’s, St. Joseph, St. Agnes Academy, the Steiner School) who are determined eligible ● Related services (speech and others as needed) provided at Head Start, Meadow Lane ● 18-22 year old Transition Program housed at the Boys’ & Girls’ Club The services provided and placements made must be based on individual students’ needs and not on what currently exists in the district. Special education services are mandated by Massachusetts State and Federal laws under 603 CMR 28.05 (7)(b) and the Federal Individuals with Disabilities Education Act. Some students require services that are best provided at separate schools, such as private day or residential schools. The district is responsible for the tuition and residential costs of such placements unless fiscal responsibility is deemed to be shared with a state agency or another school district. The Special Education Department annually files with the Department of Elementary and Secondary Education to receive Circuit Breaker reimbursement for all high cost placements and services. For more information on this reimbursement process, see the state revenue and revolving accounts section.
Career and Technical Education
Pittsfield Public Schools offers 10 Career and Technical Education programs that provide students with the technical knowledge and skills needed to be successful and better prepared for post-secondary education, including apprenticeships and immediate productive employment.
Our CTE instructors teach the latest curriculum frameworks that include current and emerging industry trends and expectations. Taconic and Pittsfield High School’s CTE programs provide unique and rigorous curriculum, which includes cooperative education opportunities that ensures both academic success and career technical education mastery, as well as promotes enthusiasm for lifelong learning.
In order to for students to hone the soft skills that employers demand, we partner with Skills USA, a national membership association serving high school, and college students who are preparing for careers in trade, technical and skilled service occupations. In addition, our students earn an industry-recognized certification within each program to demonstrate a students’ subject mastery.
We partner with innovative industries to develop programs that provide our students with the skills and work habits to be successful in a dynamic 21st century work environment. Striving to make our programs relevant to local employers and throughout the region, each program has an advisory committee that
48
includes members of the business community. The involvement of industry and business guides and improves our programs.
We work closely with post-secondary institutions whose representatives serve as members of our advisory committees so that our students are knowledgeable about opportunities beyond high school. With our partners, we will continue to develop articulation agreements that create seamless pathways to advanced training and education for our students.
Pittsfield Public Schools’ CTE programs are open to Pittsfield students as well as to other students from surrounding communities in Berkshire County.
Alternative Education The Alternative Education programs offered by Pittsfield Public Schools are built upon the belief that all students can learn and succeed in a variety of ways. We strive to offer programs that provide students with the opportunities to develop the skills needed for college and career readiness. Our Alternative Education offerings serve at-risk, vulnerable and disengaged students. They include programs that are district run and those that are contracted with community providers. The goal of each program is to prepare students academically, socially and emotionally by first meeting their immediate needs, and then by identifying alternative strategies to improve learning. Approximately 800 students receive alternative education services and can include short-term interventions like summer school and/or long-term placement into structured settings or programs.
Students may have characteristics that range from having poor attendance, discipline issues, failing grades or are credit deficient. Additionally, they may be in family crisis; referred for assistance and do not qualify for special educational services; may have drug/alcohol abuse or social/emotional/medical issues; or have poor peer relationships.
A variety of strategies and options are utilized by the Pittsfield Public Schools, including building-based and offsite programs. These programs assist students through transition, suspension, tutoring, programs for special populations, credit recovery, and an early college model.
49

Technology The Pittsfield Public School district is committed to preparing children for this rapidly changing world by teaching them the skills they need to be proficient and safe users of information, media and technology. We strive to engage students in meaningful curriculum content through the purposeful and effective use of technology.
Teachers are provided technology resources to assist them in creating lessons that reflect the personal learning styles, needs, and interests of their students. Administrative efficiency depends on technology. The many instructional and operational systems within the district rely on technology platforms. The functions supported by IT range from student information management, transportation, food services and library systems to personnel and health services, accounting, payroll and benefits.
Our investment in technology enables every member of the Pittsfield Public School community to communicate, learn, share, collaborate and create; to think and solve problems; to assist with managing their work and lives. More importantly, we see technology as both the driver of an evolution in teaching and learning, and the means to achieve that innovation.
When implemented well, technology is virtually transparent—a tool used to improve learning. Nevertheless, the infrastructure is essential towards meeting that goal, and the district has invested accordingly:
• All teachers are issued an Apple laptop • Every classroom in the district has both wired and wireless connectivity to the local
network and the Internet • All buildings have a high-speed, broadband connection to the Internet • Computer labs and/or mobile carts are available for student use in all schools • Every student and teacher has a local computer account and a district email account • Digital projectors are available in every school to enable computer shared content for
collaborative learning and exercises All teachers are given the opportunity and training to create a website for their classrooms. Simply making technology available does not ensure that it will be used to maximum effect – support staff is as critical as the hardware and software. The district has an 8-person Technology Department that supports 14 buildings and networks, 7000 users, and nearly 5000 devices. A Help Desk is staffed full-time to address questions promptly, resolve problems and repair equipment. The department encourages teacher innovation by offering professional development in after-school workshops, during in-service days, as online tutorials, and through classroom modeling.
Developing a long-range plan for educational technology is difficult – if not impossible – given the quickly evolving nature of that technology. Nevertheless, we have a framework for moving forward that includes:
• Continued investment in technology to support teaching and learning – specifically
establishing a fully funded renewal cycle • Increased professional development opportunities for teachers, including an online self- paced
curriculum for technology integration skills • Progressive addition of mobile student computing devices as we move closer to a 1:1
model
50

• Establishing “Innovation Classrooms” in every school that are equipped with cutting- edge equipment that will offer teachers a laboratory for experimenting with tech integration
Education in the 21st century is a complex system, and in Pittsfield, technology will be the primary tool in meeting that challenge.
School Technology Device Distribution
Graph includes all student devices currently in use, regardless of funding sources. (This includes local operating budget, grants and private donations.)
51

52

Co-Curricular Programs After School – 21st Century Programs The Pittsfield Public Schools’ 21st Century Community Learning Centers programs incorporate four learning principles into its efforts – learning that is meaningful, collaborative, supports mastery, and expands horizons. 21st Century programs are currently operating at five schools: Reid Middle, Herberg Middle, Conte Community, Morningside Community, and Crosby Elementary Schools.
Our programs support these learning principles by:
• Enabling young people to apply their academic skills to areas of interest and real world problems
• Promoting effective partnerships between schools, community-based agencies, and other public and private entities
• Providing creative and innovative out-of-school time programs that give young people hands-on project-based learning experiences that stimulate curiosity and enhance critical thinking skills
• Creating opportunities for young people to develop leadership skills • Addressing the multiple needs of children, youth and their families
These principles are well aligned with the 21st century learning skills and workforce skills that young people will need to succeed in the years ahead. Summer Programs A variety of summer programs are offered by Pittsfield Public Schools. Approximately 1,000 students participate each year.
Programs include:
• Academic summer school at the middle and high school levels • Transition programs for incoming 6th graders and 9th graders (high school freshmen) • 21st Century Programs • Adolescent Support Program • Academic Enrichment for English Language Learners (ELL) students • Programming at Conte and Morningside Schools • Summer Special Education programs • Tryouts and practice for fall athletic teams and summer athletic conditioning
State and federal funds, local grants and the district budget support summer programming. Most programs offer bussing. A federally funded summer food program serves free breakfast and lunch to children in our summer programs and in the community at open sites throughout the City of Pittsfield.
53

Athletics Pittsfield Public Schools offers the widest selection of varsity sports of any district in Berkshire County. A total of 16 different sports are offered, including many programs with junior varsity level teams, as well as varsity teams. PPS offers 11 sports for girls, 11 sports for boys, and three co-educational teams (ice hockey, golf, and wrestling).
Pittsfield High School and Taconic High School field a combined 60+ teams each school year, with the goal of enriching and enhancing the educational experience of student athletes by providing activities that offer lifelong and life quality learning experiences. The highest participation rates traditionally include the football and track programs.
Student athletic programs are funded through the district operating budget and student fees that fund the athletic revolving account. The operating budget funds the athletic director’s and coaches’ salaries, athletic transportation through the district’s bus operations department, and facility rental fees for the ice hockey and swim teams. The city budget supports athletic programs with field maintenance and preparation through the City buildings and grounds maintenance department.
All other costs are funded through the athletic revolving account, including replacement of safety equipment, Berkshire County and other league fees, game officials, medical coverage, event management, and police security presence at games. Athletic teams receive significant financial support for uniform replacement and additional equipment through booster clubs for individual teams. Adult Learning Center Programs and Services Pittsfield’s Adult Learning Center is the largest provider of Adult Basic Education (ABE) programs in Berkshire County. Since 1976, the Pittsfield Adult Learning Center has been offering free education classes and support services for adults whohave either not completed their high school education or speak English with limited proficiency. The main funding for these programs comes from Massachusetts Department of Elementary and Secondary Education (ESE) grants and matching fundsfrom the Pittsfield Public Schools.
The Pittsfield Adult Learning Center offers eight different programs that meet the needs of a diverse student population. The following programs are open to all eligible students during the academic year:
• High School Equivalency (HiSet/GED Prep) • Adult Diploma • Adult Basic Education • Adult Secondary Education • Adult Career Pathways • Digital Literacy • ABE Distance Learning • English for Speakers of Other Languages (ESOL) Currently, the Pittsfield Adult Learning Center offers 14 core and non-core classes that are scheduled throughout the school week (Monday - Friday, 8 am – 3 pm). Overall, 129 students were officially enrolled in at least one of the Pittsfield Adult Learning Center programs in FY17 and another 50
54

students attended at least one academic class. In FY18, it is expected that the total student enrollment will increase by 5%.
In FY18, 26 students passed the high school equivalency exam (HiSET or GED) and another 6 students completed the requirements for the Adult Diploma Program. Overall, 46% of the students were able to make at least Educational Functioning Level (EFL) gain during the year. Based on the FY17 Massachusetts ESE Measurable Skills Gains (MSG) Performance Report, the Pittsfield Adult Learning Center was ranked #17 out of 95 programs in Massachusetts
School Lunch and Breakfast Programs All Pittsfield Public Schools participate in the national school lunch and breakfast program. The programs serve an average of 5,983 meals per day. The schools’ food service program serves students and staff. Current prices are $2.20 for lunch and $0.75 for breakfast for student meals, and $3.75 for lunch and $1.75 for breakfast for adult meals. In addition to the paid meal prices, the school food service program receives state and federal reimbursement revenue for each meal served. The charts below detail the current reimbursement rates.
Lunch Reimbursement Rates
State Share Federal Share Total Paid $.06 $0.37 $0.43 Reduced $.06 $2.89 $2.95 Free $.06 $3.29 $3.35
Breakfast Reimbursement Rates
Federal Non- Severe Need or Federal Severe Need
Paid $0.30 $0.30 Reduced $1.45 $1.79 Free $1.75 $2.09 NOTE: Schools qualify for one reimbursement rate – either severe or non-severe depending on percentage of free/reduced students in school.
School food service programs are required to follow detailed nutritional guidelines in order to qualify for state and federal reimbursement. We continue to implement new federal requirements that increase the amount of whole grains, fruits and vegetables that students consume. The changes were implemented slowly over a couple of years in Pittsfield in anticipation of the full implementation year. Still, as with all programs that encourage students (and adults!) to eat their vegetables, the meal plan changes have been received to varying fanfare by participants. It may take a number of years for students to become accustomed to the new meal plan and for participation in the program to even out after these sweeping changes.
55
Pittsfield Elementary Schools continue to participate in the free breakfast and lunch program under the Community Eligibility Provision (CEP). Schools participating in CEP provide healthy breakfasts and lunches to their students free of charge. It also allows the Pittsfield School Food Service to receive full federal reimbursement for up to 100% of meals served. Currently, 85.5% of our elementary students participate in the lunch program and 46.25% participate in breakfast; a slight increase from last year with 84% and 46% respectively. In addition, Crosby Elementary School Breakfast in the Classroom Program has also seen a slight increase currently at 78.4% participation up from 77% last year. The biggest change this year is the implementation of CEP at the Middle Schools. Starting September 2017 all Middle school students can receive a breakfast and lunch free of charge. This has been received very well. Currently lunch participation is at 81%, up from 75% last year and breakfast is up to 25% from 17% last year.
In addition to the lunch and breakfast programs, the District’s Food Services Department runs a fresh fruit and vegetable program, as well as the summer breakfast and lunch program. The fresh fruit and vegetable offerings expose elementary students at Conte and Morningside Community Schools and Crosby Elementary School to a wide variety of fresh fruits and vegetables. Students are provided a fresh vegetable or fruit during snack time several times a week.
The summer food service program is a federally funded program that the Pittsfield Public Schools has operated for 38 years. This offering provides free meals to children under age 18 and low cost meals for accompanying adults. The program serves many of the district’s summer educational programs for students as well as providing meals at open sites in several locations throughout the community, typically at Morningside Community School, Conte Community School, Dower Square Apartments and the First United Church on Fenn Street. Additionally, it serves students at the YMCA summer camp, the Gladys Allen Brigham Center summer camp, and the Boys and Girls Club summer camp.
The Food Services Department seeks to source food locally whenever possible and practical. For example, we purchase specialty breads and rolls through Sky Blue Bakery located in nearby Agawam, and apples through Hilltop Orchards in Richmond. Other examples of local produce sought to purchase whenever possible include sweet potatoes, butternut squash and greens. This year we’ve introduced local mushroom burgers to our high school students from Arnold’s Beef in nearby Chicopee, MA. These burgers are made using local beef and mushrooms from area farms. Participation in the Department of Defense fresh produce program allows us to procure regional fresh produce using our entitlement dollars. Additionally, a partnership with the school gardens and student summer programs at Conte and Crosby schools has provided the ability to serve the fresh garden produce to summer school students. Recent grants with the Massachusetts Farm to School program have helped to provide equipment and supplies to these school gardens to support this partnership.
56

Custodial Services The Custodial Department of the Pittsfield Public Schools is responsible for cleaning and minor maintenance of the school department’s 12 schools, Mercer Administration building and the Hibbard stockroom. All schools have a day shift and second shift, with an additional third shift at each high school.
The senior custodian at each school works with its respective staff to ensure a safe and healthy environment for students, staff and community. The custodial department works closely with the City maintenance department and City grounds maintenance department. Bus Operations The Pittsfield Public Schools operates an in-house transportation services department. Bus Operations provides daily transportation to and from school for approximately 3,500 students. Additionally, students are transported for field trips, athletic events, work study programs and extra-curricular activities. The operation of transportation services in-house allows the district to alter services as needed, such as for students moving between special education placements, and to develop emergency bus routes for walkers on extremely cold winter days – referred to as the “Polar Express”. The “Polar Express”, introduced during the winter of 2015, operates when temperatures in winter are extreme. Designated stops along normal walk routes have been established to provide shelter and transportation for those who are exposed to frigid conditions while walking to school. Additionally, Bus Operations has traditionally provided services for community events, including transportation for parades, “Welcome Home” celebrations for the boys’ Little League All-Stars team, girls’ softball team, and other events. Bus Operations also serves as an integral part of the city and school district’s emergency planning for flooding and other emergencies. The transportation services department operates a fleet of buses, a truck equipped with plow and sander, and five other passenger vehicles primarily used for transportation to out-of-district special education placements.
57

Financial Information
Expenditure Function and Classification
Major Revenue Sources
Budgets
Program-Specific Revolving Accounts
58

Expenditure Function and Classification As a municipal school district the Pittsfield Public Schools utilizes the expenditure function and classification system proscribed by the Massachusetts Department of Elementary and Secondary Education (DESE). Under this system, district and municipal expenditures are classified by their function: administrative, instructional, support services, etc. The classification descriptions below are adapted from DESE guidance for state reporting on the financial end of year report.
1000 DISTRICT LEADERSHIP & ADMINISTRATION: Activities which have as their purpose the general direction, execution, and control of the affairs of the school district that are system wide and not confined to one school, subject, or narrow phase of school activity. The 1000 series includes expenditures for school committee, central administration and the administration of district wide informational technology.
2000 INSTRUCTIONAL SERVICES: Instructional activities involving the teaching of students, supervising of staff, developing and utilizing curriculum materials and related services. Instructional services directly attributable to schools must be reported on a school basis, while district-wide services, such as supervisory may be reported on a district-wide basis. Expenditures in this classification include salaries for teachers, guidance counselors, librarians, occupational and physical therapists, school adjustment counselors, school administrators, and school expenses, e.g. textbooks and supplies.
3000 OTHER SCHOOL SERVICES: Other than instructional services, includes expenditures for attendance and parent liaison services, nurses and nursing supplies, school transportation services, and athletics.
4000 OPERATION & MAINTENANCE OF PLANT: Housekeeping activities relating to the physical plant and maintenance activities for grounds, buildings and equipment. Expenditures classified as a 4000 expenditure must not exceed the per project dollar limit for extraordinary maintenance or for non- instructional equipment. This series includes custodial operations expenses, heating of buildings, electricity, telephone, and information technology networking expenses.
5000 FIXED CHARGES: Retirement and insurance programs, rental of land and buildings, debt service for current loans, and other recurring items, which are not generally provided for under another function. The 5000 series includes employee separation costs such as contractual vacation and/or sick leave buyback.
6000 COMMUNITY SERVICES: Services provided by the school district for the community as a whole, or some segment of the community.
7000 ACQUISITION, IMPROVEMENT & REPLACEMENT OF FIXED ASSETS: Acquisition of land or existing buildings, improvements of grounds, construction of buildings, additions to buildings, remodeling of buildings, or acquisition of initial or additional non instructional equipment exceeding the $5,000 unit cost and $100,000 extraordinary maintenance cost as defined in 603 CMR 10.00. The 7000 series includes the cost of school buses and other non-instructional vehicles.
8000 DEBT RETIREMENT & SERVICE: Retirement of debt and payment of interest and other debt costs. Principal and interest on current loans are not part of this function, but are reported in fixed charges (5400/5450). 9000 PROGRAMS WITH OTHER SCHOOL DISTRICTS: Transfers of payments to other school districts or to non-public schools for services provided to students residing in the sending city or town. The 9000 series includes the cost of private day and residential special education tuition costs.
59

Major Revenue Sources Education funding, ultimately, comes from the taxpayers, whether from businesses or individuals through individual income taxes, corporate taxes, capital gains, sales tax, local business or residential property taxes. The Pittsfield Public Schools receives revenue from a number of different sources to support the mission of educating all students.
FY17 Pittsfield Total Spending on Education is $94,538,725. Information from Pittsfield Public Schools as reported to the Massachusetts Department of Elementary and Secondary Education, End of Year Report 2017.
State Revenue
Chapter 70 The primary source of revenue is state revenue from the Chapter 70 program, which is the Commonwealth of Massachusetts funding statute for public education. The Chapter 70 program was established in 1993 as part of the Education Reform Act. Chapter 70 has three main components: (1) it sets a foundation budget for each district based on its enrollment and student demographics; (2) it determines a district’s local contribution based on its relative wealth; and (3) the difference between a district’s foundation budget and its local contribution is its state aid amount.
60

The Chapter 70 program is funded annually through the state budget process. The formula is sensitive to enrollment changes and utilizes enrollment information as of October 1 of the current school year in setting a district’s foundation budget for the next school year. There can also be significant differences between the level of funding a district will receive from Chapter 70 through the state budget proposals submitted by the governor, house and senate. These fluctuations may be the result of a change in the inflation percentage used in the formula, the addition of a hold harmless clause for districts or a minimum amount of increase per student, or because of a proposed change to the formula. In 2007, the state legislature amended Chapter 70 to include the aggregate wealth model which sets a target minimum and maximum level of state funding for school districts. Before the 2008 recession the state legislature had intended to fully implement these targets over five years. How much progress is made towards implementing these targets is still a part of the Chapter 70 funding formula and may account for some of the differences that the district will see in state aid under various budget proposals.
Pittsfield Public Schools is a municipal school system. As such, any aid received through the state Chapter 70 program is allocated to the City of Pittsfield and appropriated to the district through the local budget process.
In Fiscal Year 2017 the state changed the metric for low income students. As part of the Chapter 70 formula, districts previously received additional state aid for each student who qualifies for free or reduced lunch through the federal national school lunch program. A number of districts in the state, including Pittsfield at the elementary and middle school level, have implemented the federal Community Eligibility Program for breakfast and lunch, which provides no cost meals to students who attend. Part of the funding for this program comes from the savings from paperwork reduction; school districts and state and federal agencies no longer verify incomes and families no longer complete and submit free and reduced lunch applications. As a result, the state does not have current information for all districts on the number of students who qualify for free and reduced lunch. The federal government has moved to direct certification for Medicaid or the Supplemental Nutrition Assistance Program as the metric for low income for Title I grants. As part of the new metric for low income students, the state began using direct certification for certain state and federal programs with income requirements in place of free and reduced lunch applications. The new metric, termed “economically disadvantaged,” allocates different levels of funding for economically disadvantaged students based on the relative concentration of poverty in the district. As one of the state’s urban districts, Pittsfield is in the 10th decile and receives the highest increment of per pupil funding for low income students through the Chapter 70 state aid program.
Circuit Breaker The state also provides direct funding to school districts through the special education reserve account. Commonly known as the circuit breaker, the program funds particularly high cost services to special education students. The district submits cost information to the state on the services provided to special education students, as proscribed in their individual education plans. The district is eligible to receive reimbursement on services for an individual student that exceed four times the state foundation per pupil spending rate for a given year, or approximately $44,000.
The statute that authorizes circuit breaker states that reimbursement will be 75% of this excess cost amount over $44K, subject to appropriation. In recent years, as state revenues have fluctuated, the appropriated amount has been projected by the state to reimburse as low as 40% or closer to the 75% mark at 72%. In Pittsfield, this has meant a variance of approximately $500K. In addition to the historical volatility in this account through the annual state budget process, this account has also been cut mid-year several times in
61
recent years as part of the governor’s 9C cuts to balance the state budget. In FY15 this account was cut by over $4M as part of mid-year 9C cuts.
In addition to the regular circuit breaker program, the state also funds a circuit breaker extraordinary relief program. This program provides additional funds to districts with circuit breaker claims that are 25% higher than the previous year claims. Funds are received in the same year as the higher costs are occurring and must be used within that year. Districts are notified about qualification and the amount of funds to be received in late May or June.
For more information on circuit breaker funds, please turn to the revolving accounts section of this budget book.
Other Revenue
Tuition Revenue The district also generates revenue through tuition-based fees for students who attend Pittsfield schools from other area school districts for college preparatory programs, special education programs, and career and technical education programs. Pittsfield Public Schools has a five-year tuition agreement for Richmond students for fiscal years 2015-2019. The Massachusetts Department of Elementary and Secondary Education annually sets the rate for vocational tuition for students participating in career and technical education programs in Pittsfield. Tuition rates for regular education, special education and other programs are set annually by the Pittsfield School Committee.
Tuition revenue for all students is deposited into the City of Pittsfield General Fund with three exceptions. In accordance with an agreement between the city and the school district, revenue from Richmond students is deposited into the Richmond tuition account. A second agreement stipulates that if more than twenty out-of-district students enroll in the Pittsfield career and technical education programs, revenue for twelve vocational students will be transferred to the district’s revolving accounts. Finally, revenue for students entering the district through the school choice program is deposited into the school choice account in compliance with Massachusetts General Law Ch. 76 §12B(o). More information on the tuition accounts is included in the revolving accounts section of this book.
Federal Revenue Federal funding of public education averages approximately nine percent of total spending in the Pittsfield Public Schools, although that number has been lower in recent years, and is primarily in the form of federal grants. Additional revenue is generated to the city’s general fund through the federal Center for Medicaid Services.
Medicaid Reimbursement The Pittsfield Public Schools receives federal revenue in the form of Medicaid reimbursement for health related supplies and services provided to students, e.g. occupational and physical therapy. The documentation requirements for this federal reimbursement program are labor intensive, including random time moment studies for district staff providing services and reporting of all eligible non-federal spending on supplies and transportation. However, Medicaid reimbursement to the city’s general fund has exceeded $15 million since 1996 and averaged approximately $400K per year for a number of years through FY15, but has increased more recently. In FY16 the
62

school district brought in $608K in Medicaid revenue and $743K in FY17. In FY18 and FY19 the Medicaid revenue is estimated to be approximately $675K.
Grant Funding In addition to state and local aid, the Pittsfield Public Schools also receives a significant amount of funding through federal, state and private grants. Federal grant funding consists of entitlement grants and competitive grants. In recent years there has been a decline in entitlement grants, and more federal grants are beginning to be offered on a competitive basis. The Pittsfield Public Schools has applied for and received a number of large, multi-year competitive grants, including Twenty-first Century grants, the Carol M. White grant for Physical Education, the grant to Reduce Alcohol Abuse, and the Safe Schools Healthy Students grant. The district will continue to seek competitive grants that align with the mission of educating and engaging all students.
The district’s largest federal grants are the Title I grant which funds additional supports for economically disadvantaged students, the Special Education 94-142 grant, and the Perkins Vocational grant. Additionally, the district receives a number of state grants that fund salaries for special education pre-school teachers, school nurses, programs that encourage student engagement and advancement in school, and the Adult Basic Education grant which funds non K-12 students at the William Stickney Pittsfield Adult Learning Center.
Pittsfield Public Schools has increased its portfolio of private grants over the past few years with new grants for summer programming through the Berkshire United Way, equipment grants through the Mass Life Sciences Center and support for various programs and activities through generous local donors and school business partners. More information on grant funding, including a complete list of grants received in the current fiscal year is available in the informational section of this budget book.
Budgets Total spending on education in the City of Pittsfield is through two primary budgets: the school district’s operating budget and the city budget. Additional spending on education also comes through direct grants to the Pittsfield Public Schools.
Operating Budget The Pittsfield Public Schools operating budget is approved annually by the Pittsfield School Committee. The operating budget includes the city appropriation, which is a bottom-line figure approved annually by the City Council, and an additional allocation from the district’s tuition revolving accounts.
Budget planning for the next fiscal year often begins with conversations over the summer, just as the current fiscal year is underway. The expanded Cabinet, which includes the Superintendent and members of the administrative team, began discussions on the FY19 budget in September. The Smarter School Spending work that the district began in FY18 to better align district resources with student goals continued in the Fall into the Spring. A budget staffing exercise was sent to district leadership council members in January. The Superintendent, Deputy Superintendent, Assistant Superintendent for Business and Finance, and Directors of Curriculum, Special Education and Career & Technical Education also met with principals and directors to review budget requests as part of individual budget
63
meetings. Follow up meetings with the district leadership council are held in March and April as the budget process continues into the spring.
The Pittsfield charter changes from a few years ago have significantly altered the budget timeline. Previously, the school committee approved a budget in early June. In accordance with the new charter, school committee approval of the budget must take place before May 1. In order to meet this deadline, approval of the budget is scheduled to take place prior to the May 1 deadline in late April, approximately two months before the budget was approved in previous fiscal years. Information regarding the budget and budget hearings will similarly take place much earlier than in years past. More information on the budget timeline, including meeting dates for the current year budget process, is included in the budget calendar section of this book.
Net School Spending In addition to the operating budget, the city supports education in Pittsfield by providing services to schools. The city maintenance department is responsible for maintenance on all school buildings. Emergency services are provided through the city police and fire departments. Health insurance for school employees and retirees is funded with other city employees in the city budget. Costs are allocated for all of these services in accordance with the net school spending agreement approved in 2005 between the city and school district. Charges are determined on an annual basis by the city finance department and reported to the state by the school business office as part of total education spending in the school district’s annual financial end of year report. In preparation for FY19 the district is working with the Mayor and city finance director to review the net school spending agreement.
Revolving Accounts The Pittsfield Public Schools has a number of revolving accounts that were set up to fund specific programs and services. These accounts fall into a few different categories: tuition accounts; special education circuit breaker account; donation accounts; accounts that fund specific programs such as athletic programs, career and technical education programs, and school food service programs; and accounts for restitution of instructional equipment and textbooks such as the lost book account and insurance reimbursement accounts.
Tuition Revolving Accounts As stated previously in the revenue section of this book, Pittsfield Public Schools has three main tuition accounts:
1. Richmond tuition account for students enrolled in Pittsfield Public Schools from the Town of Richmond; 2. Vocational tuition account for revenue generated through the city agreement to allocate the revenue generated from twelve
vocational tuitions if a minimum threshold of twenty vocational out-of-district students enroll in district programs; and 3. School choice account for revenue generated from students enrolling in the district through the school choice program.
Revenue from these sources was fairly stable several years ago, with some fluctuation year to year as student enrollment from school choice, for example, increased or decreased due to the number of incoming choice students in a given year. More recently, Richmond tuition revenue has declined, and vocational tuition revenue to the district has been reduced to zero. In the case of vocational tuition, if enrollment does not meet the threshold of twenty out-of-district students, no revenue will be allocated to the vocational tuition revolving account from the City of Pittsfield. In this scenario, the city retains the full amount of the vocational tuition revenue.
64

Tuition Revenue FY15 FY16 FY17 FY18* FY19* Richmond Tuition 57,258 85,736 37,196 61,224 62,448 Vocational Tuition 0** 0** 0** 0** 0** School Choice 534,879 564,099 636,391 582,776 582,776
Total 592,137 649,835 673,587 644,000 645,224 *FY18 and FY19 revenues are projected, preceding years are actual revenues. **Vocational out of district student enrollment below City reimbursement level.
Budget Assumptions Richmond tuition revenue decreased from FY14 to FY15 as seven seniors out of 14 students attending Pittsfield schools from Richmond graduated in the prior year, FY14. A total of seven students, including one senior, were enrolled in FY15, and six students (including two seniors) in FY16. The revenue assumptions projected a total of five students enrolling from Richmond in FY17, but only four students are currently attending in FY17. Two of these students are graduating seniors. Five students from Richmond attend Taconic in FY18. There are three students from Richmond in this year’s eighth grade who may potentially attend high school in Pittsfield. A total of five students are projected to attend from Richmond in FY19. The tuition rate will increase by two percent in FY19 based on the Richmond tuition agreement, which is tied to the Consumer Price Index. According to Richmond officials, most students enroll in the Berkshire Hills School District for high school.
Vocational tuition revenue dropped to zero in FY14 and stayed at zero through FY18 due to enrollment figures just below the threshold of allocating funds to the school district. Twenty students were enrolled in vocational programs from out of the district in FY14; however, two students left the program in the spring and did not complete the year. As a result, vocational tuition funds were not allocated to the district in FY14. Eighteen out-of-district students were enrolled in the program in FY15, twelve in FY16, nine in FY17 and seven out-of-district students are enrolled in FY18. Vocational tuition revenue is not anticipated at the district level in FY18 or FY19, however the city’s out of district vocational tuition revenue will likely increase over the next few years as the new Taconic high school opens and out of district enrollment increases.
Per pupil vocational tuition rates increased significantly in FY16 and decreased slightly from this new higher rate in FY17 due to changes in the state method of calculating vocational tuition. The vocational tuition rate set by the state has been increasing at a rate of ten percent per year for the past several years. A number of years ago the state changed the way it calculated the vocational tuition rate for districts. As a result, Pittsfield altered the cost allocation method on the annual financial report submitted to the state to more accurately reflect total vocational spending in the district. The tuition rate increased by 1.6% in FY18 to $16,728 per pupil and is anticipated to stay about the same in the next fiscal year.
The Pittsfield Public Schools has utilized an increasingly larger amount of funding as part of the district operating budget from the three tuition accounts five years ago, and decreased by $90K in FY17 due to available funds. The district is budgeting to use the same total expenditure amount of $620K in FY19 as was used in FY17 and FY18. The funding from each individual account has varied during this time period, based on revenue.
65

Tuition Expenditures FY15 FY16 FY17 FY18* FY19* Richmond Tuition 209,795 119,538 82,401 61,224 30,988 Vocational Tuition 13,068 0 0 0 0 School Choice 487,137 590,462 537,599 558,776 589,012 Total 710,000 710,000 620,000 620,000 620,000
*FY18 and FY19 expenditures are projected, preceding years are actual expenditures.
The year-end balance is the account balance in a given account as of June 30, the end of the fiscal year. For revolving accounts, this year-end balance is also the starting balance for the next fiscal year as the accounts continue from year to year. The year-end balances in the tuition revolving accounts are projected to increase slightly in FY18 and FY19 from the low in FY16 based on the revenue and expenditure projections outlined above.
Year End Balance FY15 FY16 FY17 FY18* FY19* Richmond Tuition 109,996 76,194 30,989 57,515 51,652 Vocational Tuition 0 0 0 0 0 School Choice 615,448 589,086 687,877 711,776 705,540
Total 725,444 665,280 718,866 769,291 757,192 *FY18 and FY19 balances are projected, preceding years are actual balances.
Program Specific Revolving Accounts
Adult Learning Center Pittsfield Public Schools operates several programs at the Adult Learning Center, including classes for students interested in pursuing an adult diploma or GED and programs for English Language Learners. The Center also operates a program in connection with a grant through Berkshire County Regional Employment Board. Revenue from the BCREB grant funds Adult Learning Center program instruction and expenses. Beginning in FY15 a private grant account was opened for BCREB grant funds in the 158XX string for each grant fiscal year to facilitate the tracking of expenses and revenues for each grant year. The revolving account had increased over the past several years so funds were used to offset the cost of the director’s salary in FY14 and partially offset the director’s salary along with other program expenses in FY15, FY16 and FY17. All available funds are projected to be spent in this account in FY18.
Adult Learning Center FY15 FY16 FY17 FY18* Revenue (15,884) 0 0 0 Expenditures 63,171 (1,012) 2,845 554 Year End Balance 2,387 3,399 554 0
*FY18 figures are projected, preceding years are actual amounts.
66

Athletic Revolving Account The student athletics program in Pittsfield generates revenue primarily through student participation fees. Students are charged $125 for each sport in which they participate, up to $375 per student if participating in fall, winter and spring sports. Fee waivers are available upon request for families based on financial need. The program also generates revenue through gate fees at athletic games and events. The athletic department has historically maintained a balance of approximately $50K in the revolving account. More recently, this balance has decreased significantly due to the increasing number of participants qualifying for fee waivers. In FY12 and FY13 the Athletic account paid for custodial overtime for athletic events. The additional expense was not sustainable given the declining revenues and these costs were returned to a district operating expense in FY14. In FY19 the district anticipates supporting additional athletic program costs on local budget due to the decrease in fee revenue. Expenses include the cost of game and meet officials, field rentals during construction of the new Taconic high school, and police detail at athletic games.
Athletics FY15 FY16 FY17 FY18* FY19* Revenue 126,355 132,095 106,685 93,700 90,000 Expenditures 132,421 136,401 107,362 90,000 93,356 Year End Balance 12,638 8,333 7656 11,356 8,000
*FY18 and FY19 figures are projected, preceding years are actual amounts.
Career and Technical Education Revolving Accounts The Career and Technical Education programs provide services to local residents through several district programs. Community members and staff purchase lunch created and served by students through the culinary programs at Pittsfield and Taconic High Schools. The automotive repair program at Taconic trains students through work on community members’ vehicles. Similarly, the cosmetology program provides hands on training and course hours required for licensure through cosmetology services offered to the public. The programs accept donations from community members to fund the cost of supplies and parts needed to further the educational training of students.
The career and technical education revolving accounts consist of a total of six accounts. The two culinary accounts strive to maintain a beginning and ending balance of $10K for cash flow purposes throughout the school year. The two vocational program accounts typically have much lower balances within individual sub accounts by program, but the main accounts total between $7K and $10K. Both accounts are projected to be lower in FY19 as programs are encouraged to direct all available funds to the classroom. There are two cosmetology revolving accounts. One revolving account is used for the cosmetology retail store that is operated by cosmetology students. The second account is for adult post-graduate education in cosmetology. Program revenue is generated through fees and offsets cosmetology program costs. Post-graduate student participation has declined in recent years so the revenue projections for this program are
67

correspondingly lower than in previous years. Funds that accumulated in the tuition account are budgeted to be spent in FY19 with a smaller year-end balance projected for FY19. Information on specific accounts is below.
Career and Technical Education Accounts Year End Balances
FY15
FY16
FY17
FY18*
FY19*
Cosmetology 29,085 41,297 46,781 48,550 2,000 PHS Vocational Tech 8,690 10,641 7,267 5,000 2,000 THS Vocational Tech 7,361 7,676 8,001 7,562 5,000 PHS Culinary Arts 7,875 7,380 10,791 10,000 10,000 THS Culinary Arts 4,532 8,234 9,183 10,000 10,000 Total Year End Balances 57,593 75,228 82,023 81,112 29,000
*FY18 and FY19 balances are projected, preceding years are actual balances.
Circuit Breaker Revolving Account Revenue for the circuit breaker revolving account is generated by state reimbursement for students who are mandated to receive particularly high cost special education services based upon their individual education plan. More detail on this reimbursement mechanism is available in the preceding state revenue section.
State revenue for circuit breaker is specific to the cost of services provided to individual students within the previous fiscal year. Reporting is completed annually at the end of each school year in July and certified by the state in November for receipts for that year. In the aftermath of the 2008 recession, the state has cut this revenue source mid-year to balance the budget. In FY15 the Governor cut this line item through 9C cuts twice, once in November in the amount of $3.86M and again in February by $250K. For this reason, and because receipts are not certified by the state until halfway through a given year, revenue received in one fiscal year is used to offset local budget expenses in the next fiscal year.
At the close of FY16 the district received $38K in additional funds from the state through the circuit breaker extraordinary relief program as reimbursement for the additional costs incurred due to the closure of Eagleton school. Eagleton school was a special education residential school closed by the state in Spring 2016. Due to the timing of the receipts and late notice of the additional aid, this additional payment was closed to the city’s general fund.
Circuit Breaker FY15 FY16 FY17 FY18* FY19* Revenue 1,299,352 1,412,266 1,334,759 1,406,941 1,410,000 Expenditures 1,230,582 1,084,526 1,413,856 1,342,997 1,406,941 Year End Balance 1,084,166 1,413,856 1,334,759 1,398,703 1,401,762
*FY18 and FY19 figures are projected, preceding years are actual amounts.
68

Continuing Education Account The Adult Learning Center operated continuing education programs for the community for a number of years. In FY15 enrollment and course offerings declined, in part due to the proliferation of course offerings through OLLI at Berkshire Community College, online courses and other programming in the community. No expenditures were made from this account in FY16 as the ALC explored options for continuing education support for the community. In FY18 and FY19 the Adult Learning Center will utilize continuing education funds to augment career pathways for students living and working in our community. Additional revenue is not anticipated in this account and so the year-end balances are projected to decrease.
*FY18 and FY19 figures are projected, preceding years are actual amounts.
Custodial Revolving Account The district permits school-related organizations such as parent teacher organizations or athletic booster clubs to hold school events on school property without building use fees. These organizations are responsible for paying for custodial overtime fees. The custodial revolving account was set up in FY13 to better account for payment of custodial overtime fees. Charges for overtime fees are transferred to this account, thus relieving local budget from these costs. In late FY16 the collective bargaining language regarding mandatory custodial overtime was clarified, thereby reducing the amount of mandatory overtime and the associated revenue. Year-end balances in this account are due to the timing of payments; balances are not anticipated to accrue in this account.
Custodial Revolving Account
FY15
FY16
FY17
FY18*
FY19*
Revenue 18,952 13,696 8,045 7,000 7,000 Expenditures 17,669 13,171 10,668 6,822 7,000 Year End Balance 2,920 3,445 822 1,000 1,000
*FY18 and FY19 figures are projected, preceding years are actual amounts.
Donation Account Donations for individual schools and school programs are deposited into a single donation revolving account and earmarked for use by the school or program. Gifts are made by businesses as well as individuals and fund everything from technology and furniture for a school language lab to school field trips. In total, these accounts summed to $65K a couple of years ago, but most individual accounts were in the $5K to $10K range.
Continuing Education FY15 FY16 FY17 FY18* FY19* Revenue 6,655 0 0 0 0 Expenditures 6,541 0 919 14,972 12,000 Year End Balance 38,829 38,829 37,910 22,938 10,938
69

In recent years, the school donation revolving account has appeared to increase significantly due to the increase in private grants. In the past, private grants had been accounted for in a state grant fund number, but were moved to the donation account at the city’s direction a couple of years ago. Recent private grants include $88K from the Mass Life Sciences Center, $25K for technology purchases for Morningside Community School from Best Buy, and $30K from the United Way for summer school programming at Conte, Crosby and Morningside. The totals from these private grants, as well as others, artificially inflate the donation revolving account balance. Private grants are more restrictive than gifts to schools and the district requested a separate fund number from the city to better reflect the private grant activity. Beginning in FY15 the district moved new private grants to separate accounts with an account number that begins with 158XX. It is anticipated that the donation account will decrease as existing private grants in this account are fully expended.
Donations FY15 FY16 FY17 FY18* FY19* Revenue 126,986 144,680 71,153 52,000 50,000 Expenditures 139,157 137,697 105,288 67,000 72,000 Year End Balance 130,033 137,016 102,881 87,881 65,881
*FY18 and FY19 figures are projected, preceding years are actual amounts.
Driver’s Education Revolving Account The driver’s education program provides both classroom hours and on the road instruction to students pursuing a driver’s license. Classroom instruction fees are offered at a reduced rate to students as a way to encourage driver’s education and safe driving. Fees for on the road instruction are competitive with area driver’s education programs and fund expenses associated with instruction, including payments to instructors, insurance costs, and vehicle maintenance and replacement costs. The balance in this account is projected to increase over the next several years to fund the replacement of the current vehicle.
Driver's Education Account FY15 FY16 FY17 FY18* FY19* Revenue 11,340 10,330 6,850 7,865 8,000 Expenditures 6,849 8,982 7,547 6,100 6,000
Year End Balance 20,280 21,628 20,931 22,696 24,696 *FY18 and FY19 figures are projected, preceding years are actual amounts.
Enrichment Revolving Account Pittsfield has organized enrichment programs for students seeking additional preparation for SAT testing. In the past, this program has been fully funded by student fees. In spring 2014, the district was able to provide free SAT preparation for interested students. A total of six instructors provided evening classes in Math and English. Eighty students were enrolled in the program. The total cost to the district in FY14 was $12,000 which reduced the balance that had accrued in this account. In FY15 the district returned to a fee-based program for one year. Beginning in FY16 free online SAT preparation programs were offered through Pearson, and students were able to take
70

advantage of this program. Remaining funds in this account were used for additional summer school programs during the summer of 2016. The account was fully expended in FY17. The district is currently exploring options for additional enrichment programming.
Enrichment Account FY15 FY16 FY17 FY18* FY19* Revenue 6,000 0 0 0 2,000 Expenditures 4,599 0 4,127 0 2,000
Year End Balance 4,127 4,127 0 0 1,000 *FY18 and FY19 figures are projected, preceding years are actual amounts.
Insurance Revolving Accounts The district maintains two insurance restitution revolving accounts, one for technology and a second for other items. The district receives reimbursement for damaged items through the city insurance carrier. Checks for the value of the item, less any deductible, are deposited into the revolving accounts. Replacement items are then purchased, and the insurance reimbursement amount is used to offset the cost to the local budget. Per state finance law, replacement funds are to be used within the same fiscal year; funds may extend beyond June 30 only for projects that are started before year-end. Any funds not used are returned to the city’s general fund.
Insurance Account FY15 FY16 FY17 FY18* FY19* Revenue 120,816 15,476 10,975 8,000 6,000 Expenditures 117,703 17,447 8,590 8,000 6,000
Year End Balance 3,160 1,189 3574 0 0
Insurance - Technology Account
FY15
FY16
FY17*
FY18*
FY19*
Revenue 1,667 14,843 4,376 0 2,000 Expenditures 1,667 14,836 4,383 0 2,000 Year End Balance 0 0 0 0 0
*FY18 and FY19 figures are projected, preceding years are actual amounts.
Lost Book Revolving Account Schools receive restitution fees from students for lost or damaged instructional materials. Deposits are made throughout the year, but collections typically peak at the end of the school year. Schools order replacement books and materials on an ongoing basis, with larger orders coinciding with the end of both the school and fiscal year as balances increase and in time for books to be received by the following school year. As with the donation account, revenues are deposited into a single revolving account with individual sub accounts earmarked for the individual schools. The total revolving account balance at the start of FY18 was $2,695 with individual school accounts ranging from less than $1.00 to $711. Year-end balances in this account are due to the timing of payments; balances are not anticipated to accrue in this account.
71

Lost Books FY15 FY16 FY17 FY18* FY19* Revenue 1,263 531 568 300 500 Expenditures 671 154 287 1,000 1,000 Year End Balance 2,037 2,414 2,695 1,995 1,495
*FY18 and FY19 figures are projected, preceding years are actual amounts.
Professional Development Revolving Account As the largest district in Berkshire County, other school districts will occasionally participate in adult and continuing education professional development programs provided by the Pittsfield Public Schools. This account is showing augmented utilization as cooperative programming increases. Revenue is generated through fees and is used to offset professional development program costs. The revenue and expenditures increased significantly in this account in FY16 and FY17 due to state mandated educator professional development that was provided by the district and reimbursed by the state. Robust activity is projected to continue in this account with professional development programming targeted to the many state initiatives, particularly in the area of educating English learners.
Professional Development FY15 FY16 FY17 FY18* FY19* Revenue 5,783 21,440 22,453 10,000 10,000 Expenditures 2,689 18,460 21,924 11,500 12,000 Year End Balance 6,074 9,054 9,583 8,083 6,083
*FY18 and FY19 figures are projected, preceding years are actual amounts.
School Nutrition Service Program Account Often referred to as a revolving account, the school nutrition service program account is a federal grant, primarily funded through the federal school lunch grant and the universal breakfast program. As allowed under federal regulations, other food service programs are also included in the school food service account, including the fresh fruit and vegetable program and the summer breakfast and lunch programs.
The school food service program is required by the Massachusetts Department of Elementary and Secondary Education to maintain a minimum balance of six weeks operating costs in the program account, and a maximum of three months operating costs. For Pittsfield, this range in FY18 is a minimum of $436K and maximum of $871K. The balance in the Pittsfield food service account fluctuates based on the timing of receipts and overall profit or loss for that year.
Along with many other districts across the state, the school food service program experienced its first operating loss in FY13. The $40K operating loss was tied to decreased revenue, particularly from a la carte sales of snack foods and other items that are no longer able to be offered under the federal Healthy, Hunger-Free Kids Act enacted in 2010 and fully implemented in FY13. Snack companies have modified many of their recipes in compliance with the new law and a la carte sales are increasing from FY13 but are not expected to reach previous levels.
72
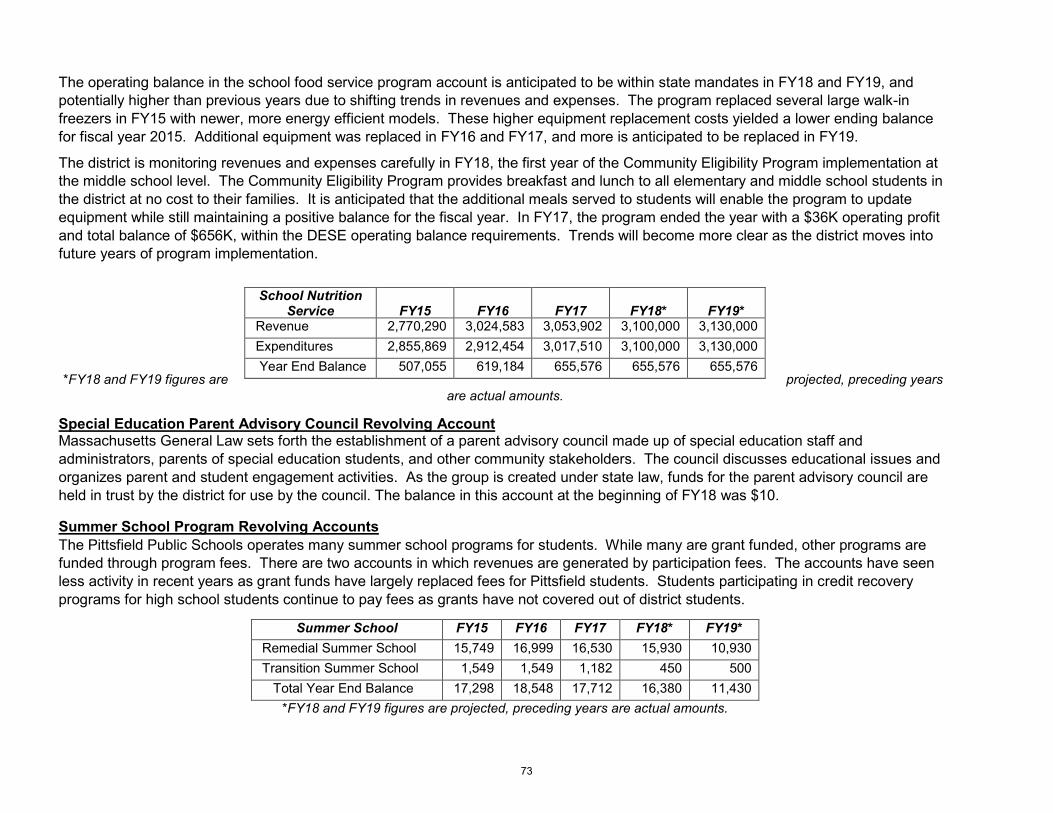
The operating balance in the school food service program account is anticipated to be within state mandates in FY18 and FY19, and potentially higher than previous years due to shifting trends in revenues and expenses. The program replaced several large walk-in freezers in FY15 with newer, more energy efficient models. These higher equipment replacement costs yielded a lower ending balance for fiscal year 2015. Additional equipment was replaced in FY16 and FY17, and more is anticipated to be replaced in FY19.
The district is monitoring revenues and expenses carefully in FY18, the first year of the Community Eligibility Program implementation at the middle school level. The Community Eligibility Program provides breakfast and lunch to all elementary and middle school students in the district at no cost to their families. It is anticipated that the additional meals served to students will enable the program to update equipment while still maintaining a positive balance for the fiscal year. In FY17, the program ended the year with a $36K operating profit and total balance of $656K, within the DESE operating balance requirements. Trends will become more clear as the district moves into future years of program implementation.
*FY18 and FY19 figures are projected, preceding years are actual amounts.
Special Education Parent Advisory Council Revolving Account Massachusetts General Law sets forth the establishment of a parent advisory council made up of special education staff and administrators, parents of special education students, and other community stakeholders. The council discusses educational issues and organizes parent and student engagement activities. As the group is created under state law, funds for the parent advisory council are held in trust by the district for use by the council. The balance in this account at the beginning of FY18 was $10.
Summer School Program Revolving Accounts The Pittsfield Public Schools operates many summer school programs for students. While many are grant funded, other programs are funded through program fees. There are two accounts in which revenues are generated by participation fees. The accounts have seen less activity in recent years as grant funds have largely replaced fees for Pittsfield students. Students participating in credit recovery programs for high school students continue to pay fees as grants have not covered out of district students.
Summer School FY15 FY16 FY17 FY18* FY19* Remedial Summer School 15,749 16,999 16,530 15,930 10,930 Transition Summer School 1,549 1,549 1,182 450 500 Total Year End Balance 17,298 18,548 17,712 16,380 11,430
*FY18 and FY19 figures are projected, preceding years are actual amounts.
School Nutrition Service
FY15
FY16
FY17
FY18*
FY19*
Revenue 2,770,290 3,024,583 3,053,902 3,100,000 3,130,000 Expenditures 2,855,869 2,912,454 3,017,510 3,100,000 3,130,000 Year End Balance 507,055 619,184 655,576 655,576 655,576
73

Testing Revolving Accounts Students who participate in SAT testing and Advanced Placement (AP) exams pay a fee to cover the cost of the exam. Through the high schools’ involvement with Mass Insight, formerly the Mass Math and Science Initiative, the district receives revenue for students participating in AP programs. These funds are used to defray the cost of the tests for students, including students who qualify for free or reduced lunch or who are enrolled in multiple AP courses. The amount to be used in FY18 is an estimate based on the estimated number of exams taken. Any funding remaining at the end of FY18 will be used towards this same end the following year. Funds remaining in this account are due to the timing of receipts and payments; balances are not anticipated to accrue in this account.
Testing FY15 FY16 FY17 FY18* FY19* Revenue 47,407 33,211 49,541 34,000 34,000 Expenditures 45,711 46,872 48,447 34,500 34,500 Year End Balance 18,987 5,326 6,420 5,920 5,920
*FY18 and FY19 figures are projected, preceding years are actual amounts.
Transportation Revolving Account The district has collected fees for a number of years for ticket transportation services. Students who live within the mileage limits set by school committee policy for free transportation may pay a fee to ride the bus on a space available basis. Previously the district collected approximately $40K per year in fees. The law changed in 2005 and under Massachusetts General Law Chapter 71, Section 68 transportation fees may no longer be assessed to students who qualify for free or reduced lunch. Currently the district collects approximately $20K in transportation fees. In FY15 the district utilized $370K from the balance that had accumulated in this account to fund the first year payment for the new bus fleet.
In FY13, to better track transportation offsets from external organizations that provide transportation funding for programs, e.g. PTOs and grant funded school programs, the district began depositing transportation reimbursement into the transportation revolving account. The revenue in this account increased in FY13 and is projected to continue to increase in as a result of this accounting change. Due to the timing of receipts the year-end balance was higher in FY16. The district’s budget includes use of all available funds in this account in FY19 and FY20 to offset the costs of bus maintenance and bus driver pay for PTO and grant funded trips and other programs.
74

Transportation Account FY15 FY16 FY17 FY18* FY19* Revenue 96,333 206,759 176,534 180,000 160,000 Expenditures 444,707 106,850 33,130 212,375 298,000 Year End Balance 24,466 124,375 267,779 235,404 97,404
*FY18 and FY19 figures are projected, preceding years are actual amounts.
75

Informational Section State and Local Aid
Grants
School Choice, Charter Schools, Homeschooling
Tuition Rates
Custodial
Food Service- Meals Data
Athletics
Career and Technical Education
Vehicle Inventory
Glossary
76

Massachusetts Department of Elementary and Secondary Education FY19 Chapter 70 Summary
236 Pittsfield
Aid Calculation FY19 Comparison to FY18
FY18 FY19 Change Pct Chg
Prior Year Aid Enrollment 6,192 6,115 -77 -1.24% 1 Chapter 70 FY18 39,818,894 Foundation budget 68,905,112 68,494,174 -410,937 -0.60%
Required district contribution 29,086,218 28,579,116 -507,102 -1.74%
Foundation Aid Chapter 70 aid 39,818,894 39,941,194 122,300 0.31%
2 Foundation budget FY19 68,494,174 Required net school spending (NSS) 68,905,112 68,520,310 -384,802 -0.56%
3 Required district contribution FY19 28,579,116
4 Foundation aid (2 -3) 39,915,058 Target aid share 58.69% 58.67%
5 Increase over FY18 (4 - 1) 96,164 C70 % of
foundation 57.79% 58.31%
Minimum Aid Required NSS % of foundation 100.00% 100.04%
6 Minimum $20 per pupil increase 26,136
Non-Operating District Reduction to Foundation
7 Reduction to foundation 0
FY19 Chapter 70 Aid 8 sum of line 1, 5 minus 7 39,941,194
78

http://www.doe.mass.edu/finance/chapter70/chapter-17p.html
79

FY2019 Local Aid Estimates Pittsfield
FY2018 Cherry Sheet Estimate
FY2019 Governor's
Budget Proposal FY2019 House
Budget Proposal FY2019 Senate
Budget Proposal
FY2019 Conference Committee
Education:
Chapter 70 40,545,642 41,697,360 42,562,378 42,665,381 School Transportation 0 0 0 0 Charter Tuition Reimbursement 140,201 237,982 326,965 354,881 Smart Growth School Reimbursement 0 0 0 0 Offset Receipts:
School Choice Receiving Tuition 636,391 678,518 678,518 678,518
Sub-total, All Education Items: 41,322,234 42,613,860 43,567,861 43,698,780
General Government:
Unrestricted Gen Gov't Aid 8,625,330 8,927,217 8,927,217 8,927,217 Local Sh of Racing Taxes 0 0 0 0 Regional Public Libraries 0 0 0 0 Urban Revitalization 0 0 0 0 Veterans Benefits 697,629 563,887 563,887 563,887 State Owned Land
96,728 88,999 88,999 96,728 Exemp: VBS and Elderly 175,378 177,564 177,564 177,564
Offset Receipts: Public Libraries 67,328 65,543 66,743 66,914
Sub-Total, All General Government 9,662,393 9,823,210 9,824,410 9,832,310
Total Estimated Receipts 50,984,627 52,437,070 53,392,271 53,531,090
kshields
Typewritten Text
80
kshields
Typewritten Text
kshields
Typewritten Text
kshields
Typewritten Text
kshields
Typewritten Text
kshields
Typewritten Text
kshields
Typewritten Text

FY2019 Local Aid Assessments Pittsfield
FY2018 Cherry Sheet Estimate
FY2019 Governor's
Budget Proposal FY2019 House
Budget Proposal FY2019 Senate
Budget Proposal
FY2019 Conference Committee
County Assessments: County Tax 0 0 0 0 Suffolk County Retirement 0 0 0 0 Essex County Reg Comm Center 0 0 0 0
Sub-Total, County Assessments: 0 0 0 0
State Assessments and Charges: Retired Employees Health Insurance 0 0 0 0 Retired Teachers Health Insurance 0 0 0 0 Mosquito Control Projects 137,473 143,541 143,529 143,529 Air Pollution Districts 10,755 10,921 10,921 10,921 Metropolitan Area Planning Council 0 0 0 0 Old Colony Planning Council 0 0 0 0 RMV Non-Renewal Surcharge 88,480 88,480 88,480 88,480
Sub-Total, State Assessments: 236,708 242,942 242,930 242,930
Transportation Authorities: MBTA 0 0 0 0 Boston Metro. Transit District 0 0 0 0 Regional Transit 404,278 416,651 416,651 416,651
Sub-Total, Transp Authorities: 404,278 416,651 416,651 416,651
Annual Charges Against Receipts: Multi-Year Repayment Program 0 0 0 0 Special Education 36,388 85,526 85,526 85,526 STRAP Repayments 0 0 0 0
Sub-Total, Annual Charges: 36,388 85,526 85,526 85,526
Tution Assessments: School Choice Sending Tuition 2,908,613 2,918,548 2,918,548 2,918,548 Charter School Sending Tuition 2,131,760 2,329,103 2,423,766 2,425,426
Sub-Total, Tution Assessments: 5,040,373 5,247,651 5,342,314 5,343,974
Total Estimated Charges: 5,717,747 5,992,770 6,087,421 6,089,081
kshields
Typewritten Text
81

http://www.doe.mass.edu/finance/chapter70/fy2019/prelim.html
236 tittsfield
Effort Goal FY19 Increments Toward Goal
1) 2016 equalized valuation 3,465,640,800 13) Required local contribution FY18 28,025,3162) Property percentage 0.3642% 14) Municipal revenue growth factor (DOR) 0.34%3) Local effort from property wealth 12,622,538 15) FY19 preliminary contribution (13 x 14) 28,120,602
16) Preliminary contribution pct of foundation (15/8) 40.28%4) 2015 income 1,111,994,0005) Income percentage 1.4174% If preliminary contribution is above the target share:
6) Local effort from income 15,761,523 17) Excess local effort (15 - 10) 18) 85% reduction toward target (17 x 85%)
7) Combined effort yield (row 3+ row 6) 28,384,060 19) FY19 required local contribution (15 - 18), capped at 90% of foundation 20) Contribution as percentage of foundation (19 / 8)
8) Foundation budget FY19 69,817,9629) Maximum local contribution (82.5% * row 8) 57,599,819 If preliminary contribution is below the target share:
21) Shortfall from target local share (11 - 16) 0.37%10) Target local contribution (lesser of row 7 or row 9) 28,384,060 22) Added increment toward target (13 x 1% or 2%)* 0
*1% if shortfall is between 2.5% and 7.5%; 2% if shortfall > 7.5%11) Target local share (row 10 as % of row 8) 40.65% 23) Shortfall from target after adding increment (10 - 15 - 22) 263,45812) Target aid share (100% minus row 11) 59.35% 24) FY19 required local contribution (15 + 22) 28,120,602
25) Contribution as percentage of foundation (24 / 8) 40.28%
Massachusetts Department of Elementary and Secondary Education
FY19 Determination of City and Town Total Required Contribution
82
kshields
Typewritten Text

http://www.doe.mass.edu/finance/chapter70/fy2019/prelim.html
tittsfield
(1) (2) (3) (4) (5) (6) (7) (8) (9) (10) (11) (12) (13)
tre- Jr High/ High ELL ELL ELL Voca- Special Ed Special Ed EconomicallySchool Half-Day Full-Day Elementary Middle School tK K Half KF - 12 tional In District Out of Dist Disadvantaged TOTAL*
Foundation Enrollment 122 0 462 2,073 1,347 1,436 2 0 229 324 223 55 3,172 5,933
1 Administration 23,045 0 174,525 783,096 508,843 542,463 378 0 86,507 122,394 581,408 143,397 0 2,966,0562 Instructional Leadership 41,619 0 315,209 1,414,346 919,018 979,740 682 0 156,240 221,055 0 0 0 4,047,9093 Classroom and Specialist Teachers 190,835 0 1,445,339 6,485,173 3,708,304 5,813,675 4,712 0 1,078,936 2,229,940 1,918,498 0 9,846,078 32,721,4904 Other Teaching Services 48,944 0 370,700 1,663,334 778,014 690,501 642 0 146,922 155,795 1,791,276 2,191 0 5,648,3185 Professional Development 7,547 0 57,186 256,637 180,781 186,867 168 0 38,374 69,705 92,547 0 252,459 1,142,2716 Instructional Equipment & Tech 27,621 0 209,194 938,654 609,922 1,040,353 453 0 103,691 410,777 80,780 0 0 3,421,4447 Guidance and Psychological 13,885 0 105,174 471,918 408,168 545,465 303 0 69,392 123,071 0 0 0 1,737,3768 Pupil Services 5,522 0 41,843 281,596 298,886 734,744 136 0 31,107 165,778 0 0 0 1,559,6129 Operations and Maintenance 52,993 0 401,349 1,800,857 1,268,618 1,311,341 1,176 0 269,318 553,735 649,461 0 1,514,789 7,823,636
10 Employee Benefits/Fixed Charges 57,258 0 433,647 1,945,863 1,277,481 1,246,592 1,100 0 246,269 423,001 747,295 0 1,009,870 7,388,37611 Special Ed Tuition 0 0 0 0 0 0 0 0 0 0 0 1,361,474 0 1,361,474
12 Total 469,268 0 3,554,166 16,041,475 9,958,034 13,091,739 9,748 0 2,226,755 4,475,253 5,861,265 1,507,062 12,623,196 69,817,962
13 Wage Adjustment Factor 100.0% 11,76814 Economically Disadvantaged Decile 10
* Total foundation enrollment does not include columns 11 through 13, because those columns represent increments above the base. The pupils are already counted in columns 1 to 10.Total foundation enrollment assigns pupils in pre-kindergarten and half-time kindergarten an enrollment count of .5.Special education in-district headcount is an assumed percentage, representing 3.75 percent of K to 12 non-vocational enrollment and 4.75 percent of vocational enrollment.Special education out-of-district headcount is also an assumed percentage, representing 1 percent of non-vocational K-12 enrollment.Economically disadvantaged headcounts are the number of pupils in columns 1 through 10 who are directly certified as eligible for the Supplemental Nutrition Assistance Program (SNAP); the Transitional Assistance for Families with Dependent Children (TAFDC); and MassHealth (Medicaid). Each component of the foundation budget represents the enrollment on line 1 multiplied by the appropriate state-wide foundation allotment.The wage adjustment factor is applied to underlying rates in all functions except instructional equipment, benefits and special education tuition.The foundation budget shown on this page may differ from the final number used in the formula, due to rounding error.
Base Foundation Components Incremental Costs Above The Base
------ Kindergarten -----
Foundation Budget per tupil
FY19 Chapter 70 Foundation Budget
Massachusetts Department of Elementary and Secondary EducationOffice of School Finance
83

FY19 Foundation Budget Rates
http://www.doe.mass.edu/finance/chapter70
84

Per Pupil Expenditures Comparisons Urban School Comparison
Massachusetts Department of Elementary and Secondary Education FY16 Per Pupil Expenditures
Pittsfield Compared to Small Urban Districts
In-District
Out-of-
District FTE
Total FTE
Admi-
Instructional
Other
Teaching
tro- fessional Develop-
Instructional Materials,
Equipment and
Guidance,
Counseling
tupil
Insurance, Retirement
Operations and trograms and
Total
In-District
Total
Expenditures District FTE tupils tupils tupils nistration Leadership Teachers Services ment Technology and Testing Services Maintenance Other Expenditures per tupil
Cambridge 6,521.4 655.7 7,177.1 $1,244.29 $1,940.15 $8,234.33 $2,376.39 $970.87 $897.31 $911.79 $2,337.70 $1,779.95 $6,293.11 $26,985.89 $28,399.47 Chelsea 6,362.5 885.5 7,248.0 $487.68 $925.05 $4,384.46 $887.01 $545.99 $495.17 $388.91 $1,520.84 $1,117.07 $2,581.48 $13,333.65 $14,329.29 Chicopee 7,578.6 364.1 7,942.7 $504.94 $1,134.41 $5,521.34 $1,134.23 $297.08 $163.68 $254.09 $1,797.56 $1,001.13 $2,065.84 $13,874.30 $14,249.74 Everett 7,083.3 680.5 7,763.8 $324.61 $1,227.07 $5,669.79 $1,083.90 $235.43 $342.01 $302.38 $1,470.47 $894.47 $2,029.06 $13,579.18 $14,260.24 Fitchburg 5,070.2 741.5 5,811.7 $512.99 $808.65 $5,008.27 $884.91 $326.97 $525.80 $364.12 $1,658.80 $825.32 $2,381.62 $13,297.45 $13,936.60 Haverhill 7,308.5 1,224.9 8,533.4 $457.32 $683.92 $4,716.09 $944.48 $101.05 $412.02 $524.28 $1,364.87 $792.74 $2,631.23 $12,627.99 $12,642.69 Holyoke 5,340.6 1,265.7 6,606.3 $543.84 $1,490.03 $5,067.53 $1,974.44 $651.92 $512.19 $457.53 $2,274.44 $1,482.79 $2,270.95 $16,725.65 $16,568.16 Leominster 6,028.6 504.3 6,532.9 $442.18 $734.39 $5,062.61 $1,206.43 $208.97 $369.36 $405.01 $1,232.18 $730.15 $2,428.74 $12,820.02 $13,301.37 Malden 6,576.1 967.5 7,543.6 $437.59 $963.65 $5,812.50 $956.60 $15.47 $462.13 $426.25 $980.85 $887.49 $2,155.20 $13,097.73 $13,887.61 Pittsfield 5,666.2 717.7 6,383.9 $338.90 $685.76 $5,685.72 $1,429.57 $202.58 $506.32 $473.05 $1,141.92 $1,180.82 $3,158.76 $14,803.40 $14,450.81 Salem 3,762.5 877.8 4,640.3 $897.59 $1,063.49 $8,404.91 $870.78 $329.99 $674.43 $720.60 $1,487.70 $922.96 $3,764.67 $19,137.12 $18,841.60 Somerville 4,859.9 563.5 5,423.4 $608.58 $1,306.83 $6,261.85 $1,348.81 $597.02 $543.49 $712.44 $1,667.95 $1,984.31 $2,915.75 $17,947.03 $18,843.12 Taunton 8,031.5 258.8 8,290.3 $276.89 $662.66 $4,963.57 $508.59 $217.86 $445.47 $419.70 $1,481.70 $799.58 $2,658.76 $12,434.78 $13,123.05
MA TOTALS 905,677.2 73,250.6 978,927.8 $545.36 $1,016.07 $5,831.96 $1,240.11 $207.18 $466.69 $461.50 $1,502.53 $1,124.35 $2,598.82 $14,994.57 $15,511.26 FY15 Total, 2/16 891,513.2 67,874.3 959,387.5 $530.11 $971.81 $5,607.52 $1,168.44 $198.11 $430.36 $438.96 $1,435.42 $1,144.31 $2,490.06 $14,415.10 $14,919.84
FY16 Total Expenditures per Pupil, Massachusetts Department of Elementary and Secondary Education, March 3, 2017. http://www.doe.mass.edu/finance/statistics
This report shows per pupil expenditures by major functional categories, total in-district expenditures, and total expenditures for all districts based on the fiscal
year selected onthe detail report.Total expenditures per pupil average across all expenditures and pupils, both in-district and out-of-district. The out-of-district expenditure functions (9000 series) are not included on this report because we are not able to calculate per pupil expenditures consistently for all of these functional categories. Districts with incomplete fiscal year 2016
data are not displayed. Non-operating districts are not included.
http://www.doe.mass.edu/finance/chapter70
85

http://www.doe.mass.edu/finance/chapter70
FY expenditures FY pupils07 76,527,386 07 6,662 08 79,916,262 08 6,699 09 80,803,444 09 6,623 10 82,195,166 10 6,589 11 83,826,713 11 6,567 12 84,120,620 12 6,619 13 85,430,077 13 6,603 14 89,359,525 14 6,497 15 93,439,283 15 6,462 16 92,252,552 16 6,384
FY district MA Average07 11,487 11,858 08 11,930 12,448 09 12,200 13,006 10 12,474 13,047 11 12,765 13,354 12 12,709 13,637 13 12,937 14,022 14 13,755 14,521 15 14,460 14,942 16 14,451 15,545
Massachusetts Department of Elementary and Secondary EducationOffice of School Finance
Trends in Total Enrollment and Expenditures
ter tupil Expenditure
- 20,000,000 40,000,000 60,000,000 80,000,000
100,000,000
07 08 09 10 11 12 13 14 15 16
Fiscal Year
expenditures
6,200 6,300 6,400 6,500 6,600 6,700 6,800
07 08 09 10 11 12 13 14 15 16
Fiscal Year
pupils
- 2,000 4,000 6,000 8,000
10,000 12,000 14,000 16,000 18,000
07 08 09 10 11 12 13 14 15 16
Fiscal Year
per pupil expenditure
Per Pupil Expenditure district Per Pupil Expenditure MA Average
86

GRANT AWARDS FOR FY 2018
State Grants
ADULT BASIC EDUCATION
State Funds 345
Purpose: To assist adult students to achieve their educational and career goal as family members, workers, and community members, and prepare them to successfully take their next steps toward those goals, in college and further training, at work, and in the community.
Administrator 34,455 (FTE: 0.41)
Instructional 162,156 (FTE: 3.35)
Non-Instructional 31,998 (FTE: 1.10)
Fringe Benefits 60,069
Contracted Services 500
Other 22,200
Total 311,378
DSAC STATE TARGETED ASSISTANCE - SUMMER
State Funds 220-E
Purpose: To support improvement in DSAC-Served districts and their eligible schools through participation in regionally-based professional development and assistance initiatives associated with the District and School Assistance Centers (DSACs). DSAC regional assistance is designed to enhance district and regional capacity to plan, implement and sustain research-based practices to improve student performance and is aligned with the Massachusetts District Accountability and Assistance Framework.
Administrator 3,000
Total 3,000
87

DSAC STATE TARGETED ASSISTANCE
State Funds 220-E
Purpose: To support improvement in DSAC-Served districts and their eligible schools through participation in regionally-based professional development and assistance initiatives associated with the District and School Assistance Centers (DSACs). DSAC regional assistance is designed to enhance district and regional capacity to plan, implement and sustain research-based practices to improve student performance and is aligned with the Massachusetts District Accountability and Assistance Framework.
Instructional 10,200
Contracted Services 42,300
Supplies 202
Total 52,702
State Grants – Other
COORDINATED FAMILY & COMMUNITY ENGAGEMENT
State Funds 237
Purpose: To provide all families with access to locally available comprehensive services and support that strengthens families and promotes optimal child development.
Non Instructional 1,300 (FTE: 0.06)
Fringe Benefits 225
Contracted Services 149,240
Total 150,665
DEPARTMENT OF MENTAL HEALTH/A.S.P.
State Contract
Purpose: To provide programs for students with learning and emotional disabilities.
Instructional 112,271 (FTE: 2.0)
88

Fringe Benefits 1,628
Supplies 485.84
Total 114,384.84
DEPT. OF PUBLIC HEALTH/ESSENTIAL SCHOOL HEALTH-NURSES
State Contract
Purpose: To provide school health services to all students preschool through grade 12.
Instructional 94,150 (FTE: 2.00)
Non-Instructional 1,430 (FTE: 0.07)
Fringe Benefits 1,257
Contracted Services 5,400
Supplies 2,863
Travel 1,500
Total 106,600
SPED INCLUSIVE PRESCHOOL LEARNING ENVIRONMENTS
State Funds 391
Purpose: To support preschool learning environments serving preschool-aged children with and without disabilities in high quality, inclusive early education and care settings.
Instructional 53,560 (FTE: 0.70)
Non-Instructional 12,235 (FTE: 0.50)
Fringe Benefits 1,000
Total 66,795
MASS CULTURAL COUNCIL - BIG YELLOW SCHOOL BUS
State Contract – Williams, Conte
Purpose: To fund field trips for students.
Other 400
Total 400
MASS CULTURAL COUNCIL – STARS RESIDENCIES
89
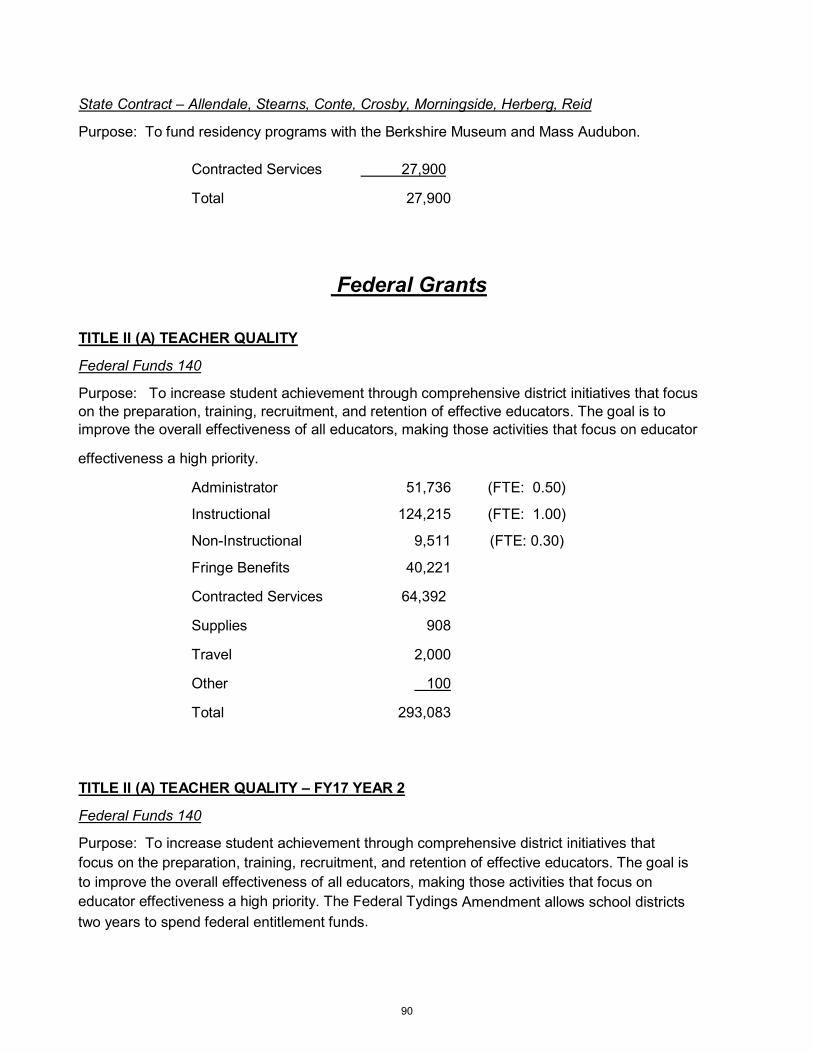
State Contract – Allendale, Stearns, Conte, Crosby, Morningside, Herberg, Reid
Purpose: To fund residency programs with the Berkshire Museum and Mass Audubon.
Contracted Services 27,900
Total 27,900
Federal Grants
TITLE II (A) TEACHER QUALITY
Federal Funds 140
Purpose: To increase student achievement through comprehensive district initiatives that focus on the preparation, training, recruitment, and retention of effective educators. The goal is to improve the overall effectiveness of all educators, making those activities that focus on educator
effectiveness a high priority.
Administrator 51,736 (FTE: 0.50)
Instructional 124,215 (FTE: 1.00)
Non-Instructional 9,511 (FTE: 0.30)
Fringe Benefits 40,221
Contracted Services 64,392
Supplies 908
Travel 2,000
Other 100
Total 293,083
TITLE II (A) TEACHER QUALITY – FY17 YEAR 2
Federal Funds 140
Purpose: To increase student achievement through comprehensive district initiatives that focus on the preparation, training, recruitment, and retention of effective educators. The goal is to improve the overall effectiveness of all educators, making those activities that focus on educator effectiveness a high priority. The Federal Tydings Amendment allows school districts two years to spend federal entitlement funds.
90

Instructional 1,082
Non-Instructional 690
Fringe Benefits 19,136
Contracted Services 107,306
Total 128,214
TITLE I
Federal Funds 305
Purpose: To provide supplemental resources to local school districts to help low-achieving students in high-poverty schools meet the State's academic standards.
Administrator 51,736 (FTE: 0.50)
Instructional 904,002 (FTE: 13.0)
Non-Instructional 225,874 (FTE: 10.4)
Fringe Benefits 438,551
Contracted Services 244,494
Supplies 1,000
Travel 2,042
Other 30,000
Total 1,897,699
TITLE I – FY17 YEAR 2
Federal Funds 305
Purpose: To provide supplemental resources to local school districts to help low-achieving students in high-poverty schools meet the State's academic standards. The Federal Tydings
Amendment allows school districts two years to spend federal entitlement funds.
Instructional 81,792
Non-Instructional 31,409
Fringe Benefits 48,976
Contracted Services 47,479
Travel 1,078
Total 210,734
91

TITLE III: ENGLISH LANGUAGE LEARNERS
Federal Funds 180
Purpose: To provide supplemental funds to improve the education of English Language Learners (ELLs), including immigrant children and youth, by assisting the children and youth to learn English and meet challenging state academic content and student academic achievement
standards.
Instructional 24,100 (FTE: 3.00)
Supplies 2,679
Other 6,000
Total 32,779
TITLE III: ENGLISH LANGUAGE LEARNERS – FY17 YEAR 2
Federal Funds 180
Purpose: To provide supplemental funds to improve the education of English Language Learners (ELLs), including immigrant children and youth, by assisting the children and youth to learn English and meet challenging state academic content and student academic achievement
standards. The Federal Tydings Amendment allows school districts two years to spend federal entitlement funds
Instructional 24,834
Supplies 445
Other 7,300
Total 32,579
TITLE III: ENGLISH LANGUAGE ACQUISITION AND ACADEMIC ACHIEVEMENT PROGRAM FOR LIMITED ENGLISH PROFICIENT STUDENTS
Federal Funds 184
Purpose: To create supplemental summer programs and activities in districts with a currently approved Title III grant.
Supplies 811
Total 811
92

TITLE IV, PART A: STUDENT SUPPORT AND ACADEMIC ENRICHMENT
Federal Funds 309
Purpose: To provide supplemental resources to local school districts to build capacity to help ensure that all students have equitable access to high quality educational experiences.
Instructional 19,200
Contracted Services 15,104
Supplies 394
Other 13,000
Total 47,698
SPED INDIVIDUALS WITH DISABILITIES EDUCATION ACT (IDEA)
Federal Funds 240
Purpose: To provide funds to ensure that eligible students with disabilities receive a free and appropriate public education that includes special education and related services designed to meet their individual needs.
Administrator 34,901
Instructional 444,000 (FTE: 6.60)
Non-Instructional 595,308 (FTE: 25.0)
Fringe Benefits 140,143
Contracted Services 291,000
Supplies 267,714
Travel 10,000
Total 1,783,066
SPED INDIVIDUALS WITH DISABILITIES EDUCATION ACT (IDEA) – FY17 YEAR 2
Federal Funds 240
Purpose: To provide funds to ensure that eligible students with disabilities receive a free and appropriate public education that includes special education and related services designed to meet their individual needs. The Federal Tydings Amendment allows school districts two years to spend federal entitlement funds
Instructional 251,110
Non-Instructional 273,497
Fringe Benefits 28,243
93
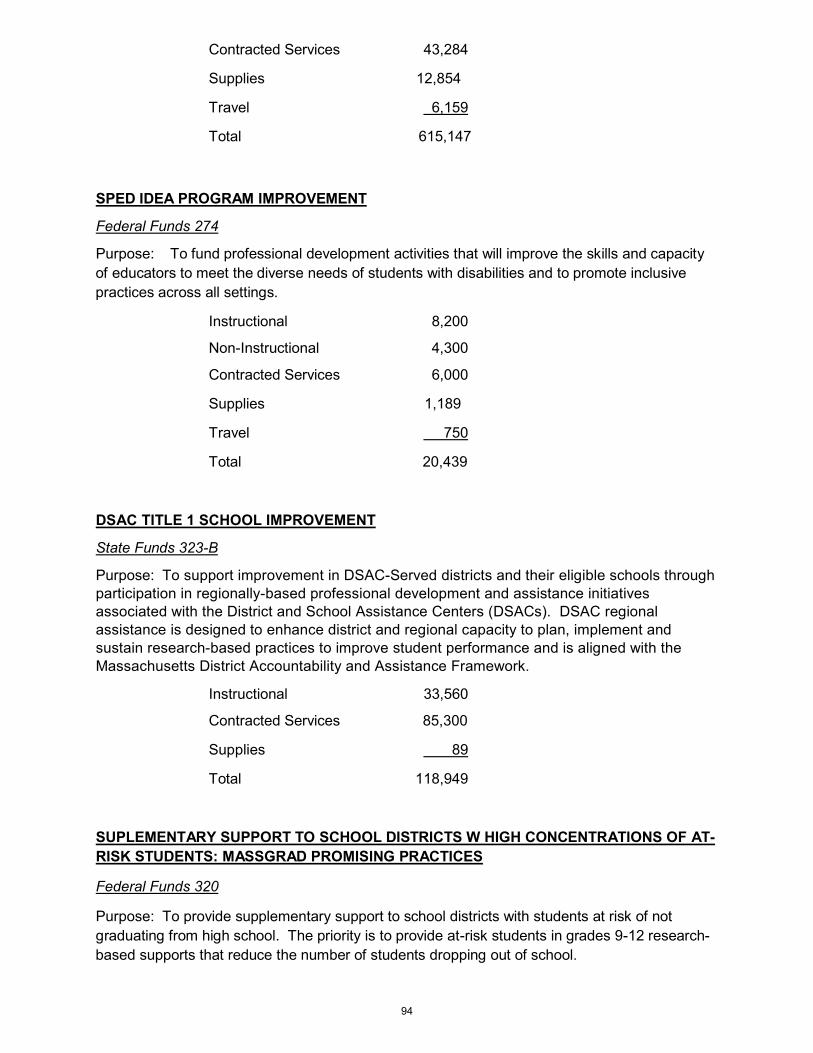
Contracted Services 43,284
Supplies 12,854
Travel 6,159
Total 615,147
SPED IDEA PROGRAM IMPROVEMENT
Federal Funds 274
Purpose: To fund professional development activities that will improve the skills and capacity of educators to meet the diverse needs of students with disabilities and to promote inclusive practices across all settings.
Instructional 8,200
Non-Instructional 4,300
Contracted Services 6,000
Supplies 1,189
Travel 750
Total 20,439
DSAC TITLE 1 SCHOOL IMPROVEMENT
State Funds 323-B
Purpose: To support improvement in DSAC-Served districts and their eligible schools through participation in regionally-based professional development and assistance initiatives associated with the District and School Assistance Centers (DSACs). DSAC regional assistance is designed to enhance district and regional capacity to plan, implement and sustain research-based practices to improve student performance and is aligned with the Massachusetts District Accountability and Assistance Framework.
Instructional 33,560
Contracted Services 85,300
Supplies 89
Total 118,949
SUPLEMENTARY SUPPORT TO SCHOOL DISTRICTS W HIGH CONCENTRATIONS OF AT- RISK STUDENTS: MASSGRAD PROMISING PRACTICES
Federal Funds 320
Purpose: To provide supplementary support to school districts with students at risk of not graduating from high school. The priority is to provide at-risk students in grades 9-12 research- based supports that reduce the number of students dropping out of school.
94
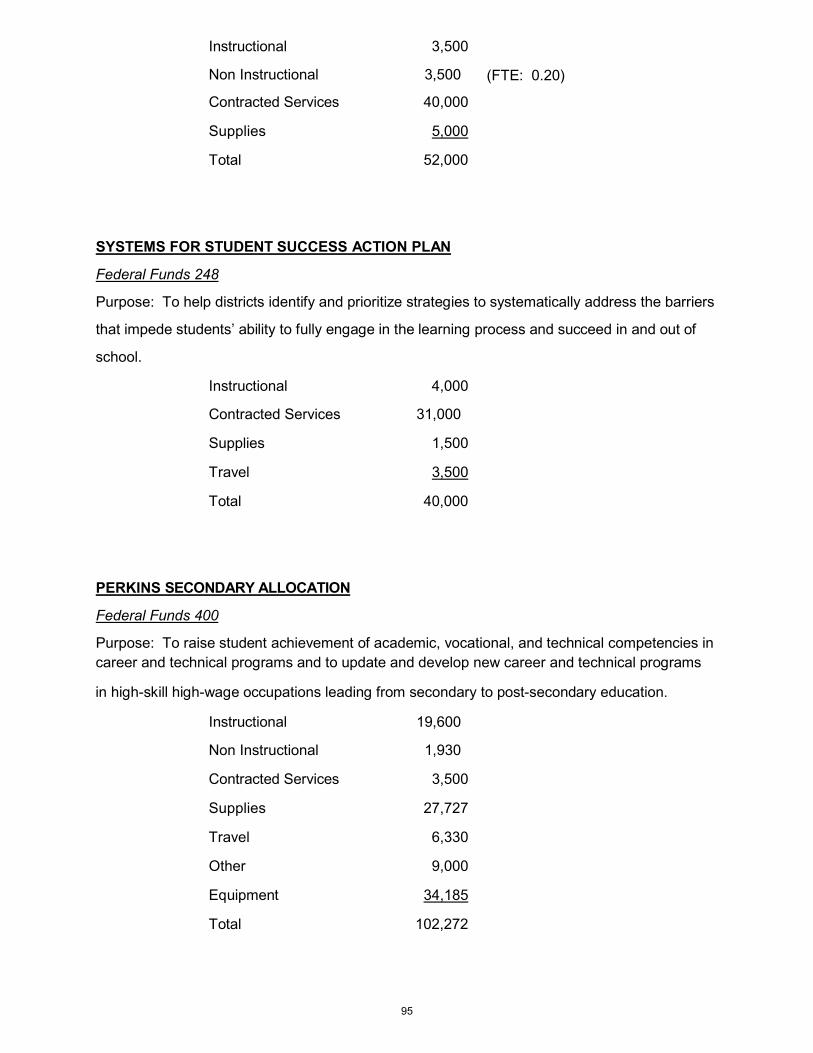
Instructional 3,500
Non Instructional 3,500 (FTE: 0.20)
Contracted Services 40,000
Supplies 5,000
Total 52,000
SYSTEMS FOR STUDENT SUCCESS ACTION PLAN
Federal Funds 248
Purpose: To help districts identify and prioritize strategies to systematically address the barriers
that impede students’ ability to fully engage in the learning process and succeed in and out of
school.
Instructional 4,000
Contracted Services 31,000
Supplies 1,500
Travel 3,500
Total 40,000
PERKINS SECONDARY ALLOCATION
Federal Funds 400
Purpose: To raise student achievement of academic, vocational, and technical competencies in career and technical programs and to update and develop new career and technical programs
in high-skill high-wage occupations leading from secondary to post-secondary education.
Instructional 19,600
Non Instructional 1,930
Contracted Services 3,500
Supplies 27,727
Travel 6,330
Other 9,000
Equipment 34,185
Total 102,272
95

LEVEL 3 TURNAROUND – CONTE COMMUNITY
Federal Funds 539
Purpose: To provide funding for Local Education Agencies (LEAs) to implement Turnaround Plans in their lowest performing Level 3 schools.
Instructional 182,789
Non Instructional 2,080 (FTE: 0.10)
Contracted Services 94,000
Supplies 12,272
Travel 5,809
Other 3,050
Total 300,000
MASSACHUSETTS 21ST CENTURY COMMUNITY LEARNING CENTER – HMS SUMMER
Federal Funds 647-B2
Purpose: To establish or expand community learning centers that operate during out-of-school hours and provide students with academic enrichment opportunities along with other activities
designed to complement the students' regular academic program.
Administrator 1,305
Instructional 16,833
Non Instructional 2,243
Fringe 118
Contracted Services 1,100
Supplies 1,745
Other 4,330
Total 27,674
MASSACHUSETTS 21ST CENTURY COMMUNITY LEARNING CENTERS – CCS/RMS/PHS SUMMER
Federal Funds 647-A
Purpose: To establish or expand community learning centers that operate during out-of-school hours and provide students with academic enrichment opportunities, along with other activities designed to complement the students' regular academic program.
96
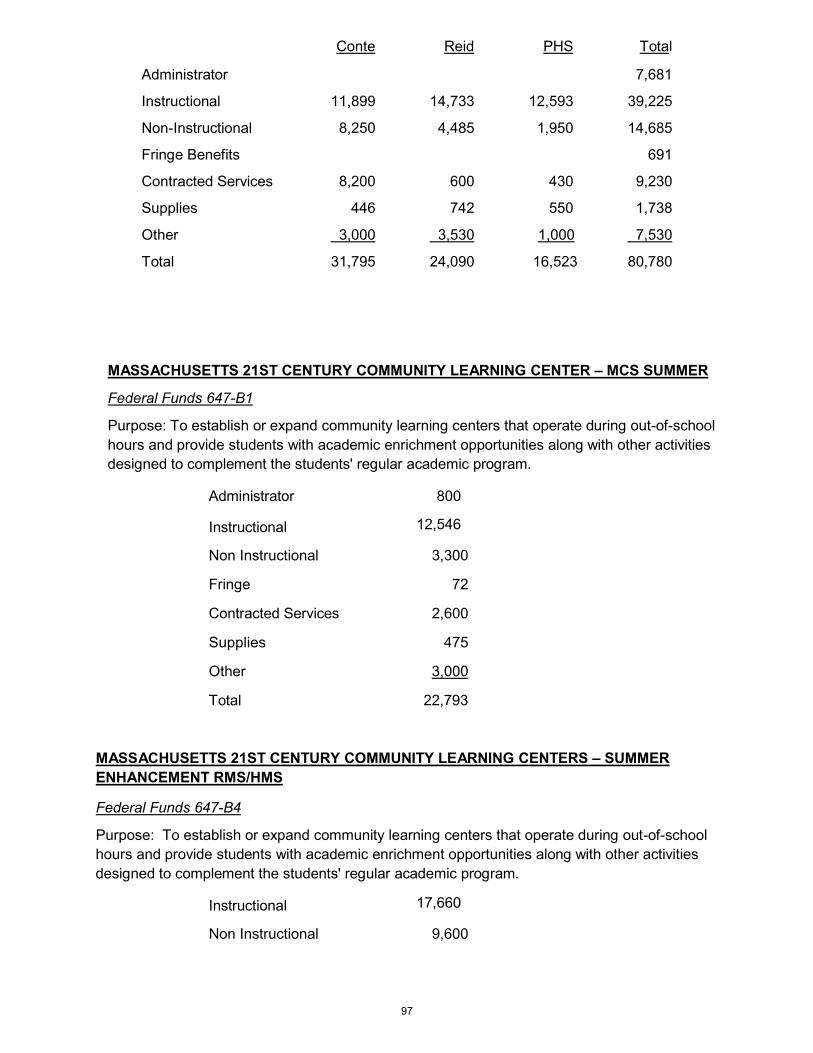
Conte Reid PHS Total
Administrator 7,681
Instructional 11,899 14,733 12,593 39,225
Non-Instructional 8,250 4,485 1,950 14,685
Fringe Benefits 691
Contracted Services 8,200 600 430 9,230
Supplies 446 742 550 1,738
Other 3,000 3,530 1,000 7,530
Total 31,795 24,090 16,523 80,780
MASSACHUSETTS 21ST CENTURY COMMUNITY LEARNING CENTER – MCS SUMMER
Federal Funds 647-B1
Purpose: To establish or expand community learning centers that operate during out-of-school hours and provide students with academic enrichment opportunities along with other activities designed to complement the students' regular academic program.
Administrator 800
Instructional 12,546
Non Instructional 3,300
Fringe 72
Contracted Services 2,600
Supplies 475
Other 3,000
Total 22,793
MASSACHUSETTS 21ST CENTURY COMMUNITY LEARNING CENTERS – SUMMER ENHANCEMENT RMS/HMS
Federal Funds 647-B4
Purpose: To establish or expand community learning centers that operate during out-of-school hours and provide students with academic enrichment opportunities along with other activities designed to complement the students' regular academic program.
Instructional 17,660
Non Instructional 9,600
97

Supplies 1,217
Other 1,100
Total 29,577
MASSACHUSETTS 21ST CENTURY COMMUNITY LEARNING CENTER – CROSBY
Federal Funds 647
Purpose: To establish or expand community learning centers that operate during out-of-school hours and provide students with academic enrichment opportunities along with other activities designed to complement the students' regular academic program.
Administrator 13,000
Instructional 48,270
Non Instructional 33,374
Fringe 1,170
Contracted Services 26,167
Supplies 4,198
Travel 1,200
Other 22,621
Total 150,000
MASSACHUSETTS 21ST CENTURY COMMUNITY LEARNING CENTER – MCS/RMS/HMS
Federal Funds 647
Purpose: To establish or expand community learning centers that operate during out-of-school hours and provide students with academic enrichment opportunities along with other activities designed to complement the students' regular academic program.
Morningside Reid Herberg Total
Administrator 37,198
Instructional 55,354 58,180 58,682 172,216
Non-Instructional 11,754 13,492 13,642 38,888
Fringe Benefits 14,165
98

Contracted Services 19,493 32,508 12,274 64,275
Supplies 3,964 4,550 5,304 13,818
Travel 630 630 630 1,890
Other 16,950 15,075 16,575 48,600
Total 108,145 124,435 107,107 391,050
MASSACHUSETTS 21ST CENTURY COMMUNITY LEARNING CENTER – CONTE
Federal Funds 647
Purpose: To establish or expand community learning centers that operate during out-of-school hours and provide students with academic enrichment opportunities along with other activities designed to complement the students' regular academic program.
Administrator 17,614
Instructional 44,923
Non Instructional 21,400
Fringe 5,948
Contracted Services 30,791
Supplies 2,374
Travel 300
Other 16,900
Total 140,250
99

Federal Grants - Other
SPED EARLY CHILDHOOD ALLOCATION
Federal Funds 262
Purpose: To provide funds to school districts and charter school districts to build capacity and
to ensure that eligible 3, 4, and 5 year-old children with disabilities are appropriately identified as eligible for special education and receive developmentally appropriate special education and related services designed to meet their individual needs in accordance with the Individuals with Disabilities Education Act - 2004 (IDEA-2004) and Massachusetts Special Education laws and
regulations.
Instructional 57,704 FTE: (0.88)
Fringe Benefits 12,701
Total 70,405
ADULT CAREER PATHWAYS
State Funds 541
Purpose: To support the on-going effort to provide increased services to Berkshire County residents and to strengthen the connection between the Adult Basic Education/ESOL providers
and the workforce system.
Administrator 7,502 (FTE: 0.09)
Instructional 22,503 (FTE: 0.55)
Fringe Benefits 435
Contracted Services 500
Supplies 1,500
Travel 1,500
Other 914
Total 34,854
CONNECTING ACTIVITIES
State Contract: PHS $2750 ; THS $2750
100
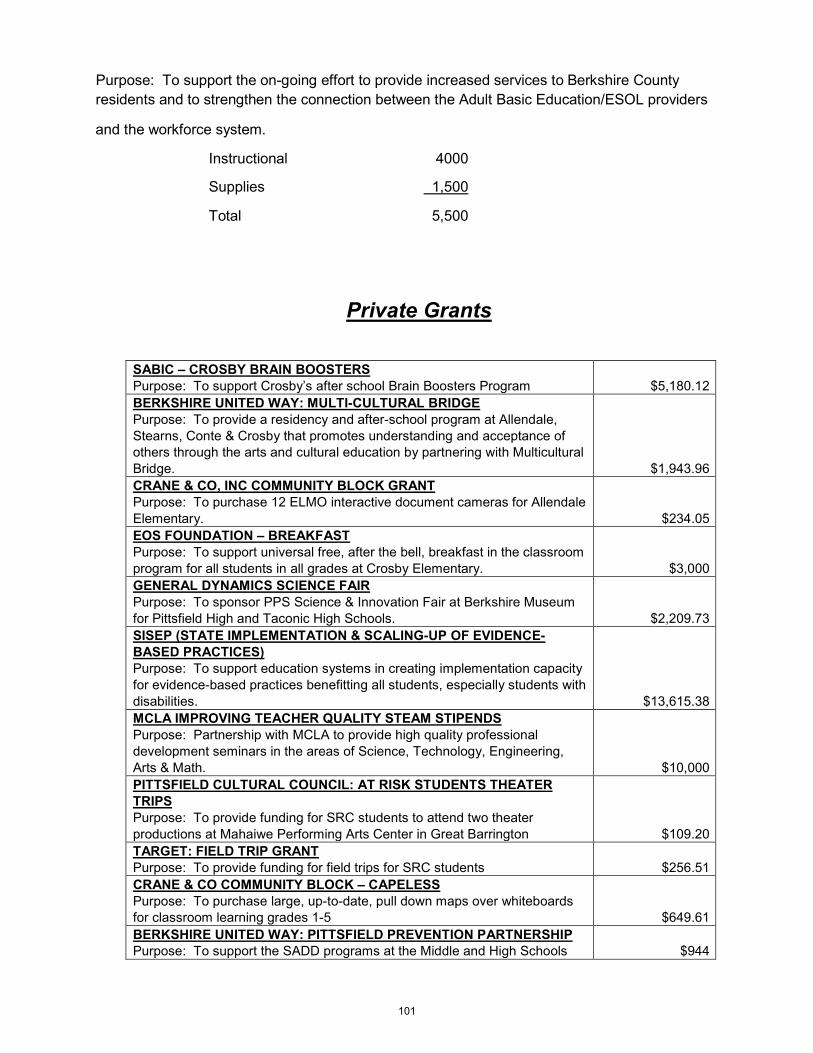
Purpose: To support the on-going effort to provide increased services to Berkshire County residents and to strengthen the connection between the Adult Basic Education/ESOL providers
and the workforce system.
Instructional 4000
Supplies 1,500
Total 5,500
Private Grants
SABIC – CROSBY BRAIN BOOSTERS Purpose: To support Crosby’s after school Brain Boosters Program
$5,180.12
BERKSHIRE UNITED WAY: MULTI-CULTURAL BRIDGE Purpose: To provide a residency and after-school program at Allendale, Stearns, Conte & Crosby that promotes understanding and acceptance of others through the arts and cultural education by partnering with Multicultural Bridge.
$1,943.96 CRANE & CO, INC COMMUNITY BLOCK GRANT Purpose: To purchase 12 ELMO interactive document cameras for Allendale Elementary.
$234.05 EOS FOUNDATION – BREAKFAST Purpose: To support universal free, after the bell, breakfast in the classroom program for all students in all grades at Crosby Elementary.
$3,000 GENERAL DYNAMICS SCIENCE FAIR Purpose: To sponsor PPS Science & Innovation Fair at Berkshire Museum for Pittsfield High and Taconic High Schools.
$2,209.73 SISEP (STATE IMPLEMENTATION & SCALING-UP OF EVIDENCE-BASED PRACTICES) Purpose: To support education systems in creating implementation capacity for evidence-based practices benefitting all students, especially students with disabilities.
$13,615.38 MCLA IMPROVING TEACHER QUALITY STEAM STIPENDS Purpose: Partnership with MCLA to provide high quality professional development seminars in the areas of Science, Technology, Engineering, Arts & Math.
$10,000 PITTSFIELD CULTURAL COUNCIL: AT RISK STUDENTS THEATER TRIPS Purpose: To provide funding for SRC students to attend two theater productions at Mahaiwe Performing Arts Center in Great Barrington
$109.20 TARGET: FIELD TRIP GRANT Purpose: To provide funding for field trips for SRC students
$256.51
CRANE & CO COMMUNITY BLOCK – CAPELESS Purpose: To purchase large, up-to-date, pull down maps over whiteboards for classroom learning grades 1-5
$649.61 BERKSHIRE UNITED WAY: PITTSFIELD PREVENTION PARTNERSHIP Purpose: To support the SADD programs at the Middle and High Schools
$944
101

FINANCIAL EDUCATON INNOVATION FUND Purpose: To support a “Credit For Life” fair at Pittsfield High School to help students learn how to make real world personal finance decisions on saving, spending and budgeting based upon career and lifestyle decisions
$2,184.66 REVEREND HOWE YOUTH LEADERSHIP Purpose: To support the Youth Leadership program at Taconic High
$7,000
GENE HAAS CVTE Purpose: To support scholarships and NIMS credentialing for students in the manufacturing program at Taconic High.
$7,500 BERKSHIRE BANK CREATING A SCIENCE EXPERIENCE Purpose: To support the Science Classrooms at Morningside
$5,000
NELLIE MAE TRANSFORMATIVE EDUCATION GOVERNANCE Purpose: A one-year planning grant to identify and implement ways to better provide equitable access for all students, to receive superior delivery of student-centered, personalized learning in preparation for career and college readiness.
$100,000 BERKSHIRE UNITED WAY STEP AHEAD Purpose: To support the Step Ahead Summer Program, a transition program for all students entering 6th grade Middle School.
$3,500 C.A.S.IT (CENTRO ATTIVITA SCOLASTICHE ITALIANE) Purpose: To support the Italian curriculum programs at the Middle and High Schools and provide funding for textbooks and other curriculum.
$3,626.01 BERKSHIRE BANK FOUNDATION: MULTI-CULTURAL BRIDGE Purpose: To support the after school program at Reid Middle School on diversity that promotes understanding and acceptance of others through the arts and cultural education by partnering with Multicultural Bridge.
$557.93 PITTSFIELD CULTURAL COUNCIL: JAZZ NIGHT Purpose: To support the annual Jazz Night Concert at Herberg Middle.
$450
TOTAL GRANT AWARD AMOUNTS: $7,630,139.00
102

Summary of Grant Awards
FY 2017
Grant.32
103

Per Pupil Expenditure Comparison to State
FY2015 Total expenditures per pupil , Massachusetts Department of Elementary and Secondary Education. http://www.doe.mass.edu/finance/statistics/ppx15.html
236 PITTSFIELD
expenditures pupilsFY06 72,181,283 6,769.4FY07 76,527,386 6,662.0FY08 79,916,262 6,698.7FY09 80,803,444 6,623.3FY10 82,195,166 6,589.3FY11 83,826,713 6,566.9FY12 84,120,620 6,619.0FY13 85,430,077 6,603.4FY14 89,359,525 6,496.7FY15 93,439,283 6,462.0
----per pupil expenditure----district MA average
FY06 10,663 11,210FY07 11,487 11,858FY08 11,930 12,448FY09 12,200 13,006FY10 12,474 13,047FY11 12,765 13,354FY12 12,709 13,637FY13 12,937 14,022FY14 13,755 14,521FY15 14,460 14,936
note: all in-district and out-of-district pupils and expenditures are included
FY2015 Total expenditures per pupil , Massachusetts Department of Elementary and Secondary Education. http://www.doe.mass.edu/finance/statistics/ppx15.html
Massachusetts Department of Elementary and Secondary EducationOffice of School Finance
0
10,000,000
20,000,000
30,000,000
40,000,000
50,000,000
60,000,000
70,000,000
80,000,000
90,000,000
100,000,000
FY06 FY07 FY08 FY09 FY10 FY11 FY12 FY13 FY14 FY15
Trends in Total Membership and Expenditures
expenditures pupils
0
2,000
4,000
6,000
8,000
10,000
12,000
14,000
16,000
FY06 FY07 FY08 FY09 FY10 FY11 FY12 FY13 FY14 FY15
Per Pupil Expenditure Trends District and Massachusetts Average
district MA average
104

Preliminary FY18 School Choice and Charter School “Out” by Grade (as of 12/20/17) Receiving District K 1 2 3 4 5 6 7 8 9 10 11 12 Adams-Cheshire 1 1 2 Berkshire Hills 1 3 1 1 1 3 4 4 4 Central Berkshire 8 7 6 6 7 9 10 12 12 9 19 10 11 Lanesborough 3 4 Lee 9 3 3 6 4 2 4 2 7 3 8 7 1 Lenox 9 12 6 14 12 17 12 24 11 19 22 12 13 MAVA (MA Virtual Academy)
3 1 2 2
Mount Greylock 2 3 3 2 4 8 North Adams 1 1 3 Richmond 5 7 6 8 5 9 5 9 Southern Berkshire 1 1 TECCA Commonwealth Virtual School
2 2 1 2 2 1 3 6 2
Subtotals 29 30 29 35 31 38 40 52 46 43 64 43 33 BART (Berkshire Arts and Technology Charter School)
19 29 25 34 16 20 13
Totals 29 30 29 35 31 38 59 81 71 77 80 63 46 Massachusetts Department of Elementary and Secondary Education, FY18 School Choice Rosters, December 20, 2017. Available to school administrators via secure web portal.
105

Pittsfield Students Gained by School Choice
Students Attending Pittsfield through School Choice
Home Districts of Students Attending Pittsfield FY17 FY18 (preliminary) Change
Adams-Cheshire 12.7 12.0 -0.6 Becket 0.0 1.0 1.0 Berkshire Hills 2.6 2.0 -0.6 Central Berkshire 47.5 48.0 1.5 Farmington River 0.6 0.0 -0.6 Hancock 4.0 5.0 1.0 Lanesborough 11.7 9.0 -2.7 Lee 1.0 2.0 1.0 Lenox 3.4 5.0 1.6 Mount Greylock 19.9 17.0 -2.9 North Adams 1.9 3.0 1.1 Northern Berkshire 0.0 2.0 2.0 Richmond 0.0 4.0 4.0 Southern Berkshire 0.8 0.0 -0.8 Tyringham 0.0 1.0 1.0 Totals 106.1 111 5.0
Massachusetts Department of Elementary and Secondary Education, www.doe.mass.edu/finance/schoolchoice.
Preliminary FY18 School Choice “In” by Grade (as of 12/20/17)
Sending District K 1 2 3 4 5 6 7 8 9 10 11 12 Total
Adams-Cheshire 1 2 1 2 2 2 2 12 Becket 1 1 Berkshire Hills 1 1 2 Central Berkshire 2 1 5 4 5 4 4 1 2 5 3 4 8 48
Hancock 1 3 1 5 Lanesborough 1 2 3 2 1 9 Lee 1 1 2 Lenox 1 1 3 5 Mount Greylock 2 4 4 2 2 3 17 North Adams 1 1 1 3 Northern Berkshire 1 1 2
Richmond 2 1 1 4 Tyringham 1 1 Totals 6 4 11 9 6 9 6 3 8 11 12 11 15 111 Massachusetts Department of Elementary and Secondary Education, FY18 School Choice Rosters, December 20, 2017. Available to school administrators via secure web portal.
106

School Choice Comparisons
Comparison of Pittsfield to Other Small Urban Districts, 12/17 District FY18
Receiving FTE
FY18 Receiving Tuition
FY18 Sending FTE
FY18 Sending Tuition
Cambridge - - 8 53,600 Chelsea - - 6 43,422 Chicopee 189 1,010,976 196 1,233,209 Everett - - 19 138,775 Fitchburg 173 1,071,987 402 2,435,538 Haverhill 29 200,417 163 933,860 Holyoke 122 735,114 383 2,276,900 Leominster 243 1,423,301 249 1,448,454 Malden - - 17 101,360 Pittsfield 112 678,518 514 2,918,548 Salem 9 61,000 83 518,884 Somerville - - 8 50,200 Taunton 87 480,486 154 901,339
Comparison of Pittsfield to Other Berkshire County Districts, 12/17
District FY18 Receiving FTE
FY18 Receiving Tuition
FY18 Sending FTE
FY18 Sending Tuition
Adams Cheshire 36 213,969 111 665,117 Berkshire Hills 196 1,153,587 100 598,174 Central Berkshire 188 1,145,853 189 1,110,102 Clarksburg 53 320,850 26 189,126 Florida 11 85,124 9 50,002 Hancock 4 20,000 9 45,000 Lanesboro 16 86,428 19 97,241 Lee 134 781,761 104 609,077 Lenox 271 1,434,685 35 212,856 Mount Greylock 62 333,394 25 159,576 North Adams 50 375,513 124 731,439 Pittsfield 112 678,518 514 2,918,548 Richmond 80 402,419 12 60,000 Savoy 24 132,452 15 79,000 Southern Berkshire 111 670,317 102 552,405 Williamstown 35 180,593 3 19,000 www.doe.mass.edu/finance/schoolchoice Massachusetts Department of Elementary and Secondary Education, School Choice, Pupils and Tuition - FY18 Preliminary as of 12/17
107

School Choice Students Outgoing FY14-FY18 District FY14
Sending FTEs
FY15 Sending FTEs
FY16 Sending FTEs
FY17 Sending FTEs
FY18 Sending FTEs (preliminary)
FY14-FY18 %Change
Adams Cheshire
69.1 79.4 79.16 73.2 111 61%
Berkshire Hills 100 102.9 103.19 112.6 100 0 Central Berkshire
133.2 147.8 167.42 184.1 189 42%
Clarksburg 8.5 13 17.78 24.2 25.5 200% Florida 3.5 4 7 6 9 157% Hancock 9.7 11 4.69 4 9 -7% Lanesboro 21.2 21.3 24.09 22.2 19 -10% Lee 90.4 89.7 98.38 106 104 15% Lenox 53.8 51.7 47.02 37 35 -35% Mount Greylock 20.5 18.8 22.51 32.3 25 22% North Adams 121.4 117.9 112.9 119.2 123.5 2% Pittsfield 373.2 443.3 477.73 511.3 514 38% Richmond 19.5 16.2 15.74 13 12 -38% Savoy 25 25.5 24.15 12.1 15 -40% Southern Berkshire
152 133.2 133.74 101 102 -33%
Williamstown 4.3 4.5 2 3.8 3 -30% School Choice Students Incoming FY14-FY18 District FY14
Sending FTEs
FY15 Sending FTEs
FY16 Sending FTEs
FY17 Sending FTEs
FY18 Sending FTEs (preliminary)
FY14-FY18 %Change
Adams Cheshire
66.5 58.2 54.5 44.7 36 -46%
Berkshire Hills 288.2 242.2 225.2 211 196 -32% Central Berkshire
130.2 152.8 162.89 167.8 188 44%
Clarksburg 22 27 35.39 46 53 141% Florida 7 2 3.42 4.9 11 57% Hancock 4 3 5 8 4 0 Lanesboro 15 20 19 14.5 16 7% Lee 112.7 128 128.54 131.4 134 19% Lenox 222 246.8 253.16 277.8 271 22% Mount Greylock 58.5 61.4 62.64 60.1 62 6% North Adams 40.3 44.2 44.17 35.1 50 24% Pittsfield 87.4 99.1 101.66 106.1 112 28% Richmond 59.5 76 79.5 84.2 80 34% Savoy 7.8 14 11 13 15 92% Southern Berkshire
122.5 123.6 121.53 127 111 -9%
Williamstown 38.9 42.1 31.92 35.1 35 -10% www.doe.mass.edu/finance/schoolchoice Massachusetts Department of Elementary and Secondary Education, School Choice
108

Charter School Summary Summary of Charter School FTE, Tuition and Reimbursements (FY11 to Present *)
236 Pittsfield FY11 FY12 FY13 FY14 FY15 FY16 FY17 FY18 FTE 70.72 87.01 113.42 157.83 176.02 174.79 172.3 156 Tuition 785,734 968,758 1,319,901 1,783,054 2,195,773 2,167,992 2,280,635 2,163,720 Facilities Aid 60,646 75,375 101,242 138,267 155,894 152,516 151,683 139,308 Chapter 46 Aid 256,523 209,928 391,419 575,541 380,112 -332 99,606 0
Total Aid 317,169 285,303 492,661 713,808 536,006 152,184 251,289 139,308 Net Cost to District 468,565 683,455 827,240 1,069,246 1,659,767 2,015,808 2,029,346 2,024,412
* FY18 figures are preliminary
Massachusetts Department of Elementary and Secondary Education, December 19, 2017. http://www.doe.mass.edu/charter/finance/tuition/
Homeschooling Students may be approved for homeschooling from grade 1 (6 years old by December 1) until age 16. The Deputy Superintendent reviews the family’s curriculum materials and plans before giving initial approval for homeschooling, as well as at the beginning of transition years (entering grades 6 and 9).
Students either take standardized tests at the end of the school year and submit the results to the Deputy Superintendent or give portfolios of their year’s work to the Deputy Superintendent to review. These basic requirements must be met before approval for homeschooling will be granted for the succeeding year.
The following chart illustrates the number of homeschooling plans approved by Pittsfield Public Schools for school years 2005-2006 through 2017-2018.
Homeschooled Students
by Grade and Year
109

Approved by School Committee August 16, 2017
Tuition Rates Pittsfield Public Schools
FY2018 Tuition Rates
Regular Education Rates Elementary Middle High 2016-2017 Annual Rate $12,552 $12,562 $12,656 2017-2018 Annual Rate $12,928 $12,939 $13,035 Rate of Increase 3% 3% 3% Special Education Rates DOE 034-40 treschool Hearing Impaired 2016-2017 Annual Rate $34,546 $26,758 $47,774 2017-2018 Annual Rate $35,583 $27,561 $49,208 Rate of Increase 3% 3% 3% Other trograms Rates EOS tositive Options ELL 2016-2017 Annual Rate $21,493 $21,493 $21,493 2017-2018 Annual Rate $22,138 $22,138 $22,138 Rate of Increase 3% 3% 3% Vocational Education Rate* High
2016-2017 Annual Rate $16,464 2017-2018 Annual Rate $16,728 Rate of Increase 1.6% *All vocational rates are set annually by DESE
Richmond Tuition Rate**
2016-2017 Annual Rate $9,929 2017-2018 Annual Rate $10,128 Rate of Increase 2%
**In June 2014, the Pittsfield School Committee approved Richmond Tuition Rates for a five-year period indexed to the 12-month percent change in Consumer Price Index for the Northeast Urban Area as of December of the previous year with a floor of 2% and a cap of 3%. The FY18 rates represent the fourth year of the current tuition agreement with Richmond.
110

Career and Technical Education – Taconic High School Program Enrollment by School Year 2008 through Oct. 2017 Year/Grade 08/09 09/10 10/11 11/12 12/13 13/14 14/15 15/16 16/17 17/18 Auto Body Grade 10 5 9 7 12 10 3 7 5 0 0 Grade 11 7 4 9 6 8 8 2 6 3 0 Grade 12 19 7 4 6 6 8 9 5 0 Total 31 20 20 24 22 17 17 20 8 0 Auto Mechanics Grade 10 7 10 11 7 11 7 8 10 5 7 Grade 11 6 4 9 9 5 7 6 8 6 6 Grade 12 9 7 2 7 8 7 7 5 6 6 Total 22 21 22 23 24 21 21 23 17 19 Allied Health Grade 10 9 17 13 16 13 10 13 6 18 7 Grade 11 13 9 21 12 12 11 12 12 4 15 Grade 12 20 11 8 10 7 8 10 11 10 4 Total 42 37 42 38 32 29 35 29 32 26 Carpentry Grade 10 10 4 8 10 8 12 7 9 9 2 Grade 11 8 6 4 8 17 5 9 2 8 10 Grade 12 12 6 6 1 12 8 4 10 2 8 Total 30 16 18 19 37 25 20 21 19 20 Culinary Arts Grade 10 13 19 13 9 11 11 14 9 12 9 Grade 11 12 10 13 14 10 11 10 15 6 9 Grade 12 10 12 9 10 14 9 11 11 12 6 Total 35 41 35 33 35 31 35 35 30 24
111
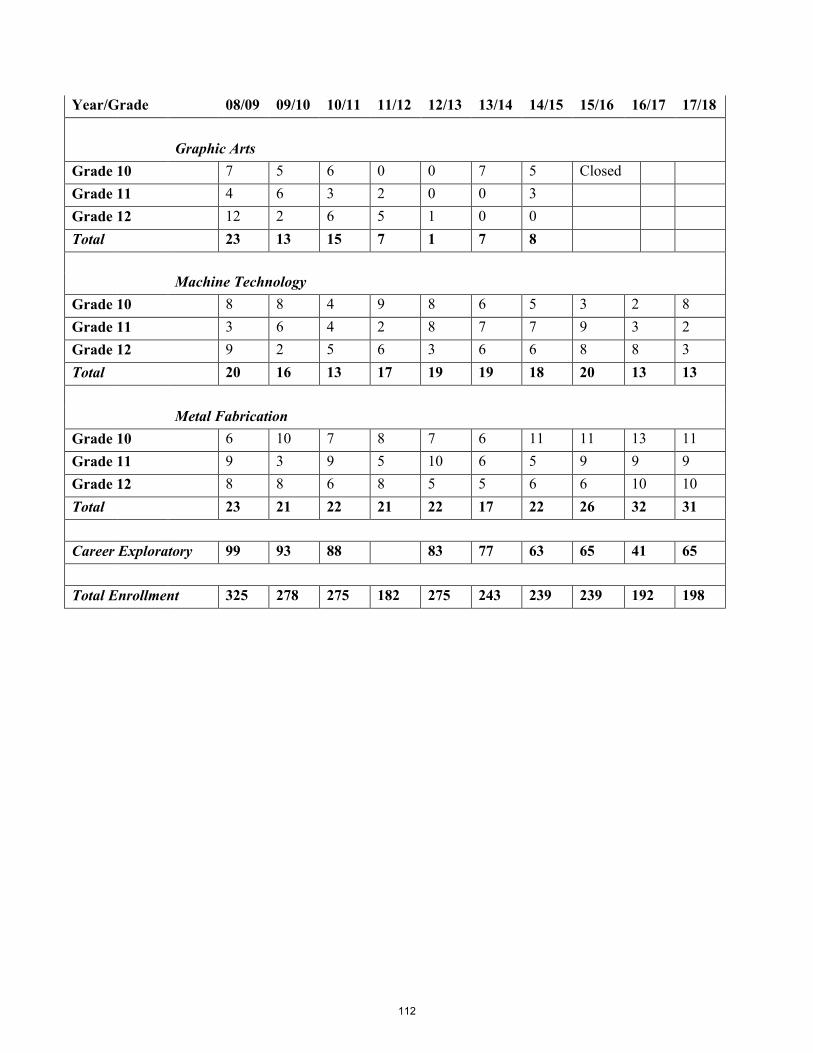
Year/Grade 08/09 09/10 10/11 11/12 12/13 13/14 14/15 15/16 16/17 17/18 Graphic Arts Grade 10 7 5 6 0 0 7 5 Closed Grade 11 4 6 3 2 0 0 3 Grade 12 12 2 6 5 1 0 0 Total 23 13 15 7 1 7 8 Machine Technology Grade 10 8 8 4 9 8 6 5 3 2 8 Grade 11 3 6 4 2 8 7 7 9 3 2 Grade 12 9 2 5 6 3 6 6 8 8 3 Total 20 16 13 17 19 19 18 20 13 13 Metal Fabrication Grade 10 6 10 7 8 7 6 11 11 13 11 Grade 11 9 3 9 5 10 6 5 9 9 9 Grade 12 8 8 6 8 5 5 6 6 10 10 Total 23 21 22 21 22 17 22 26 32 31 Career Exploratory 99 93 88 83 77 63 65 41 65 Total Enrollment 325 278 275 182 275 243 239 239 192 198
112
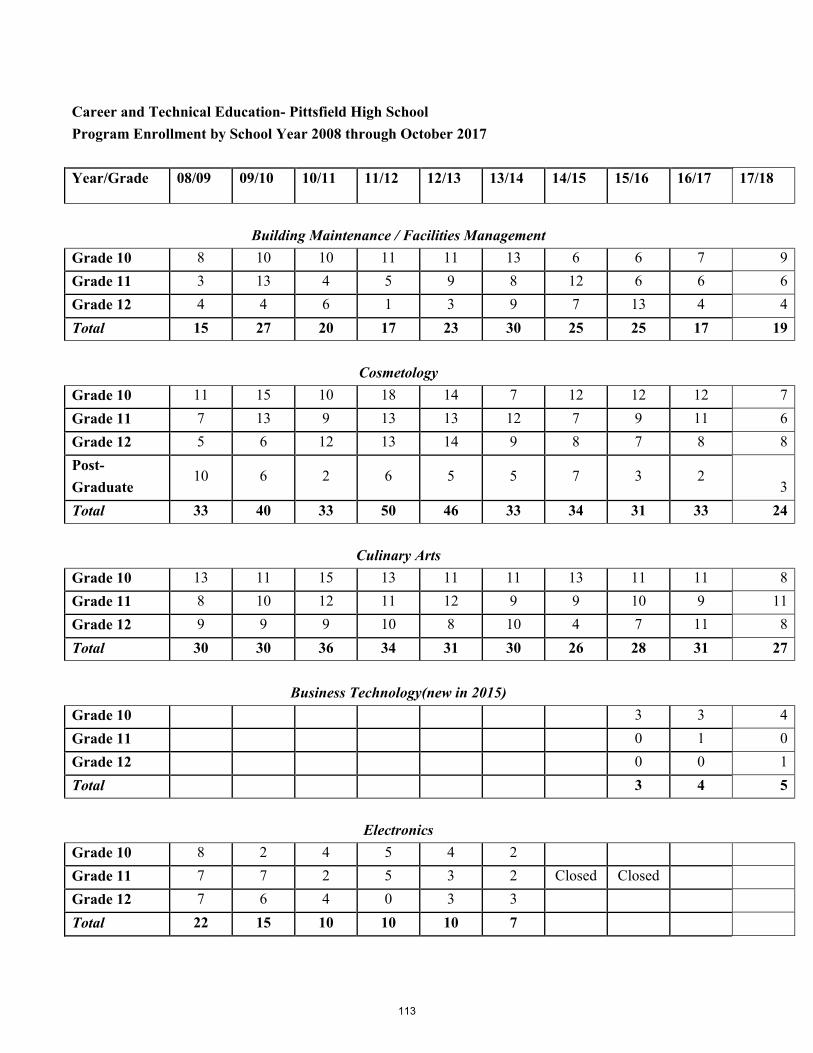
Career and Technical Education- Pittsfield High School
Program Enrollment by School Year 2008 through October 2017
Year/Grade 08/09 09/10 10/11 11/12 12/13 13/14 14/15 15/16 16/17 17/18
Building Maintenance / Facilities Management
Grade 10 8 10 10 11 11 13 6 6 7 9 Grade 11 3 13 4 5 9 8 12 6 6 6 Grade 12 4 4 6 1 3 9 7 13 4 4 Total 15 27 20 17 23 30 25 25 17 19
Cosmetology
Grade 10 11 15 10 18 14 7 12 12 12 7 Grade 11 7 13 9 13 13 12 7 9 11 6 Grade 12 5 6 12 13 14 9 8 7 8 8 Post-Graduate
10 6 2 6 5 5 7 3 2 3
Total 33 40 33 50 46 33 34 31 33 24
Culinary Arts Grade 10 13 11 15 13 11 11 13 11 11 8 Grade 11 8 10 12 11 12 9 9 10 9 11 Grade 12 9 9 9 10 8 10 4 7 11 8 Total 30 30 36 34 31 30 26 28 31 27
Business Technology(new in 2015)
Grade 10 3 3 4 Grade 11 0 1 0 Grade 12 0 0 1 Total 3 4 5
Electronics
Grade 10 8 2 4 5 4 2 Grade 11 7 7 2 5 3 2 Closed Closed Grade 12 7 6 4 0 3 3 Total 22 15 10 10 10 7
113

Year/Grade 08/09 09/10 10/11 11/12 12/13 13/14 14/15 15/16 16/17 17/18
Health Assisting
Grade 10 8 13 11 11 9 13 0 0 Closed Grade 11 12 6 8 10 5 5 9 0 Grade 12 2 13 5 4 6 6 4 9 Total 22 32 24 25 20 24 13 9
Health Assisting is no longer accepting new students at Pittsfield High School. The program is relocating to Taconic High School. Current Students will complete their studies at PHS.
Horticulture
Grade 10 2 0 10 5 4 6 2 7 4 7 Grade 11 2 4 1 4 2 5 7 1 6 3 Grade 12 5 3 1 4 5 1 4 5 1 6 Total 9 7 12 13 11 12 13 13 11 16
Small Engine/Power Technology
Grade 10 8 5 13 10 14 11 8 11 12 10 Grade 11 4 6 5 13 6 12 7 4 7 9 Grade 12 3 3 6 3 8 3 10 6 4 5 Total 15 14 24 26 28 26 25 21 23 24
Career Exploratory
88 108 96 0 105 61 58 54 52 44
Total Enrollment
234 273 255 175 274 223 194 184 171 159
114

Athletics
2017-2018 Athletic Participation
Sport
PHS # of Athletes
THS # of Athletes
Football 62 56 Boys Soccer 38 23 Girls Soccer 36 34 Boys Cross Country 26 24 Girls Cross Country 32 19 Volleyball 27 25 Golf 4 7
Total Fall Participation 225 188 Boys Basketball 25 26 Girls Basketball 21 20 Hockey (Co-Op Team) 4 12 Cross Country Ski (Co-Op Team) 6 5 Wrestling (Co-Op Team) 6 13 Alpine Ski 19 11 Swimming 23 16
Total Winter Participation 104 103 Baseball – Projected 28 28 Softball – Projected 24 24 Boys Track – Projected 35 24 Girls Track – Projected 45 30 Boys Tennis (Co-Op Team) – Projected 8 2 Girls Tennis (Co-Op Team) – Projected 8 4 Boys Lacrosse – Projected 32 26 Girls Lacrosse (Co-Op Team) – Projected
12
18
Projected Spring Participation 192 156 Total Projected Annual Participation
521
447 Approx. Multi-Sport Athletes 162/521 182/447
115

Historical Participation by High School
Year/School PHS THS Total
2009-2010 460 478 938 2010-2011 434 466 900 2011-2012 521 522 1043 2012-2013 535 475 1010 2013-2014 536 475 1011 2014-2015 559 445 1004 2015-2016 559 445 1004 2016-2017 537 445 982 2017-2018 521 447 968
116

Budget and Expenses
Athletics – Revolving and Local Accounts FY17 Actuals and FY18 Projected
Revolving – Expenses
Category FY17 FY18 Projected Assignor Fees $6,246 $6,600 On-site Medical Coverage $6,390 $5,570 Game Officials $51,456 $54,550 Medical Supplies $1,775 $2,150 Event Staff $14,770 $14,500 Equipment $13,920 $15,700 Printing $1,260 $1,050 Port-O/Storage $6,078 $6,000 Coach Ed/Leader $1,960 $2,000 Electric $600 $625 Facility Maintenance $1,250 $4,400 Custodial $250 $250 Miscellaneous $4,880 $4,500 Police $7,372 $11,500 Total Program Expenses (Revolving) $118,207 $129,395
Revolving – Revenues
Category FY17 FY18 Projected User Fees $67,500 $60,000 Tickets $38,140 $33,700 Total Revenue (Revolving) $105,640 $93,700
School Committee – Operating Budget
Category FY17 FY18 Projected Transportation $55,400 $57,700 Coaches’ Salaries $272,035 $275,500 Facility Rentals $17,775 $17,775
Total Operating Budget $344,810 $350,975
User Fees – Ticket Revenue
Year/Category User Fees Ticket Revenue
2012-2013 $97,595 $29,087 2013-2014 $93,480 $39,813 2014-2015 $84,420 $38,947 2015-2016 $78,500 $39,200 2016-2017 $67,500 $38,140 2017-2018 $60,000 $33,700
*FY18 figures are projected, preceding years are actual amounts
117

District Facilities Vehicle Inventory Division: Bus Operations
Buses (43 School Buses): • 36 - 2015 77-passenger, type “C” school buses • 3 - 2015 279” wheelbase buses with air conditioning, each with wheelchair
lift, and each with tie downs for three wheelchairs • 2 - 2015 270” wheelbase buses with air conditioning, each with wheelchair
lift, and each with tie downs for two wheelchairs • 2 - 2015 193” wheelbase buses with air conditioning, each with wheelchair
lift, and each with tie downs for four wheelchairs Other:
• 4 - 2006 GMC Yukons • 1 - 2011 Ford F350 Pickup • 1 - 2010 Ford Escape
Division: Special Education • 1 - 2010 Ford Explorer
Division: Vocational • 1 - 2004 GMC Sierra Pickup Truck (Carpentry/general vocational use) • 2 - 2003 Savanna Vans (PHS Health and Carpentry) • 1 - 2014 Ford E350 Mini Bus/Cargo Van (THS Health) • 2 - EZ Hauler Trailers (Horticulture and Carpentry)
Division: Custodial • 1 - 2005 Toyota Matrix • 1 - 2008 Chevrolet Colorado
Division: Food Service • 1 - 2011 International Truck • 1 - 2015 Ford Cargo Van
Division: Technology • 1 - 2006 GMC Savana Cargo Van • 1 - 2014 Ford E150 Cargo Van
Division: Driver Education • 1 - 2004 Pontiac Grand AM F69
2018 Inventory Total - 63 Vehicles
118

Glossary 504 Plan – A 504 plan is a legal document falling under the provisions of the Rehabilitation Act of 1973. It is designed to plan a program of instructional services to assist students with special needs who are in a regular education setting. A 504 plan is not an Individualized Education Plan (IEP) as is required for special education students.
21st CCLC (21st Century Community Learning Centers) – The Massachusetts Department of Elementary and Secondary Education has distributed 21st CCLC grants under Title IVB of the 2001 No Child Left Behind Act (NCLB). The purpose of the program is to offer students academic enrichment opportunities, along with other activities designed to complement the students’ regular academic program.
CCR -- College and Career Ready is a term used to encompass the knowledge and skills that students must master by the end of high school in order to be prepared for post-secondary education or the workforce.
Capital Budget – An annual appropriation or spending plan for capital expenditures. Capital expenditures are usually associated with acquiring tangible assets or completing projects that have a useful life of at least five years.
Cherry Sheet – Detailed report on local aid for each city and town, plus regional school districts. Named for the cherry-colored paper on which they were originally printed, the Cherry Sheets are the official means by which the Department of Revenue (DOR) notifies a municipality or regional school district of the next fiscal year’s state aid (receipts) and assessments.
Chapter 70 Aid – The primary category of state aid for education. The aid amount is calculated each year and voted on by the legislature.
Charter School – Charter schools are a type of public school which operates independently of the conventional school district structure. A charter school is a separate, legally autonomous public entity with all the powers necessary to carry out its school program. A charter is a contract, between the state and a charter school’s board of trustees, which holds the school accountable to parents, the state, and the public at large. Charters are granted for a period of 5 years and are subject to renewal, contingent upon the school’s ability to deliver quality educational results and successfully meet the goals of its charter. Charter schools may not charge tuition to their students. Funding for charter schools comes from the district in which the student resides in the form of per-pupil tuition that follows the student to the charter school.
Circuit Breaker Law – A law designed to reimburse school districts for high cost special education students. The Circuit Breaker Law reimburses instructional and tuition costs for special education students both in-district and out-of-district.
Collective Bargaining – The negotiations between an employer and union representative regarding wages, hours and working conditions.
Common Core State Standards (CCSS) – The Common Core State Standards Initiative was a state-led effort coordinated by the National Governors Association Center for Best Practices and the Council of Chief State School Officers. The standards for literacy and mathematics were developed in collaboration with teachers, school administrators and experts to provide a clear and consistent framework to prepare our children for college and the workforce. The standards are informed by the highest, most effective models from states across the country and countries around
119

the world and provide teachers and parents with a common understanding of what students are expected to learn. Consistent standards will provide appropriate benchmarks for all students. The Board of Education for the Commonwealth of Massachusetts adopted the Common Core State Standards (CCSS) as the Curriculum Frameworks with a few additional standards in English language arts and mathematics in 2010.
Commonwealth Virtual Schools – A Commonwealth of Massachusetts Virtual School (CMVS) is a public school operated by a board of trustees where teachers primarily teach from a remote location using the Internet or other computer-based methods, and students are not required to be located at the physical premises of the school. Each CMVS determines what grade levels it will serve and what particular programs it will offer. Massachusetts Virtual Schools are: Massachusetts Virtual Academy at Greenfield Commonwealth Virtual School (K-12) and TEC Connections Academy (TECCA) Commonwealth Virtual School (K-12). Any student in the state can apply for admission to a virtual school. If more students apply to a CMVS than there is space available, the school will hold a lottery to determine which students will be admitted. Once a student is admitted to a CMVS, he or she is entitled to attend in subsequent years without reapplying.
CEP – Community Eligibility Provision provides an alternative approach for offering school meals to local educational agencies (LEAs) and schools in low income areas, instead of collecting individual applications for free and reduced price meals. The CEP allows schools that predominantly serve low-income children to offer free, nutritious school meals to all students through the National School Lunch and School Breakfast Programs. The CEP uses information from other direct-certify programs, including the Supplemental Nutrition Assistance Program (SNAP) and the Temporary Assistance Program for Needy Families (TANF) instead of traditional paper applications.
CPI – Consumer Price Index. This index is often called the “cost-of-living index”.
CPI – Composite Performance Index. The Composite Performance Index (CPI) is a measure of the extent to which students are progressing toward proficiency in English language arts (ELA) and mathematics, respectively. The CPI is a 100-point index that combines the scores of students who take standard MCAS tests (the Proficiency Index) with the scores of those who take the MCAS-Alternate Assessment (MCAS-Alt) (the MCAS-Alt Index).
CPI Change – Composite Performance Index (CPI) Change. This figure represents the difference between a group's baseline CPI and its performance CPI for the current cycle. The CPI Change figure is compared to a group's Gain Target to establish whether the group met its Improvement Target.
CTE – Career and Technical Education
DESE – The Massachusetts Department of Elementary and Secondary Education, formerly the Department of Education
DIBELS – Dynamic Indicators of Basic Early Literacy Skills are a set of standardized, individually administered measures of early literacy development. They are designed to be short (one minute) fluency measures used to regularly monitor the development of pre-reading and early reading skills.
District or School District – A municipal school department or regional school district, acting through its school committee or superintendent of schools; a county agricultural school, acting through its board of trustees or superintendent/director; any other public school established by statute or charter, acting through its governing board or director.
120

DSAC – District and School Assistance Centers. Regional centers of the assistance arm of the Department of Elementary and Secondary Education.
ELL – English Language Learner. A national-origin or linguistic minority student who is limited-English proficient.
Encumbrance – Obligation in the form of purchase order, contract or salary commitment that is chargeable to an appropriation and for which a part of the appropriation is reserved.
End of Year Report – Each city, town and regional school district shall submit an End-of-Year Pupil and Financial Report to the Massachusetts Department of Elementary and Secondary Education after the close of each fiscal year. At the discretion of the Commissioner of Education, the Department may withhold release of all or some part of a district or municipality’s quarterly state school aid if the school district has not filed the reports as required under 603 CMR 10.03 in an acceptable form by the required filing deadlines or any extensions of those deadlines granted by the Commissioner.
EPIMS – Education Personnel Information Management System. Statewide data collection system mandated by DESE beginning in 2007. EPIMS collects demographic data and work assignment information on individual public school educators in Massachusetts in compliance with NCLB reporting on highly qualified teachers.
E-Rate - In the 1996 Telecommunications Deregulations Act, Congress instructed the Federal Communications Commission (FCC) to create regulations and procedures for the E-Rate program. The E-Rate (“Education Rate”) program gives schools and libraries discounts of 20% to 90% on purchases of telecommunications services, Internet access, internal building connections, data networks, and more. Almost all K-12 public and private, not for-profit schools are eligible.
Every Student Succeeds - The Every Student Succeeds Act (ESSA) is a US law passed in December 2015 that governs the country's K–12 public education policy and replaced the No Child Left Behind Act (NCLB). ESSA modified but did not eliminate provisions relating to the periodic standardized tests given to students and generally gives more control of education to the States, rather than the federal government.
Extraordinary Maintenance - The periodic servicing, repair or reconditioning of school buildings, grounds, or equipment to extend the useful life of an existing asset, provided that the total cost per project per school of an extraordinary maintenance project shall not exceed $100,000.
Fiscal Year – Since 1974, the Commonwealth and municipalities have operated on a budget cycle that begins July 1 and ends June 30. The designation of the fiscal year is that of the calendar year in which the fiscal year ends. For example, the 2016 fiscal year is July 1, 2015 to June 30, 2016 and is usually written as FY2016.
Fixed Cost – Municipal costs that are legally or contractually mandated, such as retirement, FICA/Social Security, insurance, debt service or interest costs.
Foundation Budget – A budget for each school district established by the Education Reform Act. This budget represents the minimum level of spending needed to provide an adequate education for the district’s students. The foundation budget is made up of 19 separate categories, such as teaching salaries, books and equipment, extracurricular activities, utilities and maintenance.
121

Significant variations between local spending and the foundation budget, or between local spending and the state-wide averages, occur.
Foundation Enrollment – The total number of students who reside in the district and who attend public school in that district or in another district for which the district or town of residence pays tuition. On or before October 15 of every year, every school district within the Commonwealth shall report the total number of students for whom the district is fiscally responsible as of October 1.
FTE – Full Time Equivalent. Used by the Department of Elementary and Secondary Education to calculate the number of staff positions. Example: A full time position is 1 FTE; two half-time positions equal 1 FTE.
General Fund Receipts – Funds received by a school district or municipality that are not granted or contributed to the district or municipality for a designated purpose and are not, by statute, set aside in a special account for expenditure at the discretion of the school committee.
IDEA – Individuals with Disabilities Education Act
IEP – Individualized Education Program is a written document that serves multiple purposes: it is a teacher planning aid, an administrative form and a parent involvement tool. Primarily, it delineates a child’s special needs and the educational services designed to meet those needs.
Improvement Rating - A school’s or district’s improvement rating is determined by comparing baseline performance to end-of-cycle performance. The amount of Composite Performance Index increase a school or district is expected to achieve during a particular rating cycle, called the Gain Target, is based on the gap between that school’s or district's baseline Composite Performance Index and a Composite Performance Index of 100 (the year 2014 performance target for all Massachusetts schools and districts). Improvement ratings are only issued in even-numbered years, at the end of each 2-year cycle. Once the amount of improvement is calculated for each content area and the appropriate error band have been applied, the resulting score is matched to one of five improvement rating categories: Above Target, On Target, Improved Below Target, No Change, Declined.
Integrated Per Pupil Costs – The amount of money a city or town spends on a per pupil basis for all students who reside in that particular city or town. This spending includes funds appropriated to the school committee budget; assessments to member regional school districts; municipal indirect costs to support education; tuition payments to other public or private schools and federal impact aid funds.
LEA – Local Educational Agency
LEP – Limited English Proficient is a term used to identify those students who have insufficient English to succeed in English-only classrooms.
Levy – The property tax levy is the revenue a community can raise through real and personal property taxes. In Massachusetts, municipal revenues to support local spending for schools, public safety and other public services are raised through the property tax levy, state aid, local receipts and other sources. The property tax levy is the largest source of revenue for most cities and towns.
Levy Ceiling – A community cannot levy more than 2.5% of the total full and fair cash value of all taxable real and personal property in the community. The full and fair cash value limit is the levy ceiling.
122

Levy Limit – Proposition 2½ places constraints on the amount of the levy raised by a city or town and on how much the levy can be increased from year to year. A levy limit is a restriction on the amount of property taxes a community can levy. A community’s levy is also constrained in that it can only increase by a certain amount from year to year. The maximum amount a community can levy in a given year is the levy limit. The levy limit will always be below or, at most, equal to the levy ceiling. The levy limit may not exceed the levy ceiling.
Line-Item Budget – A budget based on expenditure types, such as supplies, equipment, maintenance or salaries, as opposed to a program budget that groups all expenditures for each program.
Maintenance of Effort (MOE) – MOE requires that each year school districts expend combined local and state funds or just local funds for special education services at least at the same level (computed on either a per capita basis or an aggregate basis) that the district spent during the previous year, unless the district has an allowable reason for reducing its expenditures. The purpose of the MOE requirement is to ensure that federal special education funds are used to supplement and not supplant local or state funds
MassCore – MassCore is the recommended Massachusetts High School Program of Studies intended to help high school graduates arrive at college or the workplace well prepared, as well as reduce the number of students taking remedial courses in college. MassCore recommends a comprehensive set of subject area courses and units, as well as other learning opportunities, to complete before graduating from high school. The recommended program of studies includes: four years of English, four years of math, three years of a lab-based science, three years of history, two years of the same foreign language, one year of an arts program and five additional "core" courses, such as business education, health, and/or technology. MassCore includes additional learning opportunities such as AP classes, dual enrollment, a senior project, on-line courses for high school or college credit, and service or work-based learning.
MCAS – Massachusetts Comprehensive Assessment System. MCAS was implemented in response to the Education Reform Law of 1993 which required that MCAS be designed to:
• Test all public school students across the Commonwealth, including students with disabilities and students with limited English proficiency
• Be administered annually in selected grades • Measure performance based on the Massachusetts Curriculum Framework learning
standards • Report on the performance of individual students, schools, and districts • Serve as one basis of accountability for students, schools, and districts.
MCAS 2.0 – The Board of Elementary and Secondary Education voted on November 17, 2015, to transition to a next-generation MCAS that will be given for the first time in spring 2017 and will use both PARCC and MCAS items, along with items developed specifically for the Massachusetts tests. For spring 2016, districts that administered PARCC in spring 2015 will do so again in grades 3-8, and the remainder of districts will continue with MCAS unless they choose to administer PARCC. The MCAS tests in spring 2016 will be augmented with a limited number of PARCC items in order to help make statewide comparisons easier and to offer students and staff the opportunity to experience PARCC items while the new assessment is being developed.
123
Medicaid Reimbursement Program – Following Congress’s passage of the Medicare Catastrophic Coverage Act of 1988, which clarified Medicaid’s responsibility to pay for health-related services provided to handicapped children pursuant to an Individualized Education Plan, the John W. McCormack Institute, University of Massachusetts at Boston, at the request of the Department of Public Welfare’s Medicaid Division and the State Department of Education began an exhaustive study to identify health-related services eligible for Medicaid reimbursement in Massachusetts. Programs providing health-related services to Medicaid students are eligible for federal reimbursement of a portion of the cost of qualified program expenses, known as Federal Financial Participation (FFP). The rate of FFP for each state is dependent upon its per capita income as compared to the federal per capita average. The cost of health-related services can be attributed to several factors, among which are the expanding scope of health-related services that schools are required to provide (ranging from speech, physical and occupational therapy to gastro-tube feedings); students requiring 24-hour special education in Chapter 766 approved private Residential Schools due to social and behavioral needs; and the high cost of specialized programs that serve children with low-incidence disabilities. Medicaid Reimbursement Program for the school-based health services is divided into two categories: direct services and administrative services. Massachusetts General Law requires that all revenues received as a result of the Medicaid Reimbursement Program must be directly deposited in the municipality’s General Fund.
Minimum Local Contribution – This is the minimum dollar amount that a municipality must appropriate from property taxes and other local revenues for the support of schools as determined by the Education Reform Act of 1993.
MRGF (Municipal Revenue Growth Factor) – Each municipality is expected to increase its required local spending from the previous year based on its MRGF. The MRGF is calculated annually by the Department of Revenue and represents the percentage increase in total unrestricted revenues available to the city or town. This factor is applied against the prior year’s preliminary contribution.
MSBA (Massachusetts School Building Authority) – MSBA is a quasi-independent government authority created to reform the process of funding capital improvement projects in the Commonwealth’s public schools. The MSBA strives to work with local communities to create affordable, sustainable and energy-efficient schools across Massachusetts.
Municipal Expenditures – Commonly referred to as the “Schedule 19” numbers, these represent the amount spent on specific school expenditures that are appropriated to the city departments. Examples include employee insurance costs, maintenance and financial/data processing costs.
NCLB – No Child Left Behind - On January 8, 2002 President Bush signed into law the No Child Left Behind Act of 2001. This new law contained the most sweeping changes to the Elementary and Secondary Education Act (ESEA) since it was enacted in 1965. It changed the federal government’s role in kindergarten-through-grade-12 education by asking America’s schools to describe their success in terms of what each student accomplishes. The act contained the President’s four basic education reform principles: stronger accountability for results, increased flexibility and local control, expanded options for parents, and an emphasis on teaching methods that have been proven to work. Under the act, families of students who attend Title I-supported schools that had not made adequate yearly progress in increasing student academic achievement over a period of at least two years had other options to pursue a quality education for their child. On December 10, 2015, President Barack Obama signed legislation replacing NCLB with the Every Student Succeeds Act.
124

Net School Spending – The larger portion of the school budget, which contains costs directly related to the education of students. The amount of community’s “required net school spending” (i.e. minimum net spending) is set each year by the Department of Elementary and Secondary Education.
New Growth – Proposition 2½ allows a community to increase its levy limit annually by an amount based on the increased value of new development and other growth in the tax base that is not the result of revaluation. New growth includes:
• Properties that have increased in assessed valuation since the prior year because of development or other changes
• Exempt real property returned to the tax roll and new personal property • New subdivision parcels and condominium conversions
Non Net School Spending – This is the smaller portion of the school budget. The primary components are busing, the costs of community usage of school buildings and capital improvements. Although the state does not establish a minimum appropriation amount, there are laws and regulations that impact some of the amounts required, such as minimum busing mileage requirements.
October 1 Enrollment – The total number of students enrolled in the school district. On or before October 15 of every year, every school district within the Commonwealth reports its student enrollment as of October 1. The data required for this report is used for fund allocation, statistical analysis and monitoring educational equity.
Operating Budget – The operating budget is a plan of proposed expenditures for personnel, supplies and other expenses for the coming fiscal year.
PARCC – The Partnership for Assessment of Readiness for College and Careers (PARCC) is a consortium of states working together to develop a common set of K-12 assessments in English and math anchored in what it takes to be ready for college and careers. These new K-12 assessments will build a pathway to college and career readiness by the end of high school, mark students’ progress toward this goal from 3rd grade up, and provide teachers with timely information to inform instruction and provide student support. PARCC assessments were administered in several schools during the 2014-15 school year.
PDP – Professional Development Point is a unit of measurement of professional development activities. One clock hour is equivalent to one professional development point. One semester hour is equivalent to 15 PDPs.
Performance Rating - A school’s or district's performance rating is a descriptive representation of that school’s or district's aggregate student performance on Massachusetts Comprehensive Assessment System (MCAS) tests for a given cycle. The Composite Performance Index (CPI) is a measure of the extent to which students are progressing toward proficiency in English language arts (ELA) and mathematics, respectively. A CPI of 100 in a given content area means that all students have reached proficiency. Performance ratings are only issued in even numbered years, at the end of each 2-year cycle.
Progress and Performance Index (PPI) – PPI is a new performance measure that replaced AYP in Massachusetts in 2012. The cumulative PPI is a four-year measure of progress toward narrowing proficiency gaps. The PPI incorporates MCAS scores in English language arts, mathematics, and
125

science and technology/engineering; growth in ELA and math; graduation rates; and dropout rates. The cumulative PPI represents a group’s performance over multiple years, weighted to give more credit to more recent years. The most recent year is weighted by a factor of four, the year before by three, the year before that by two, and the first year by one. Federal rules require the use of the equivalent of AYP in Title III AMAO determinations. Although AYP and the cumulative PPI are not the same measure, the PPI is a more fair measure of performance than AYP for a number of reasons: the targets are more attainable; it gives schools and districts credit for student growth; it incorporates data over four years across a variety of indicators thus providing a better sense of a school’s trajectory; it does not require year-to-year linear improvement; and it does not require schools and groups to hit all targets in all subject areas to be considered to be making progress.
Required Local Contribution – The amount set by the Department of Elementary and Secondary Education as the minimum amount a community must contribute for educational expenses. This amount plus state aid equals the minimum net spending requirement.
Restructuring – The accountability status of a school that has failed to make AYP in English language arts, mathematics, or both subjects in the aggregate or for student subgroups for five or more consecutive years or for one or more additional years after being identified for Corrective Action.
RETELL – Strengthening teaching and learning for English language learners is central to closing the proficiency gap. Rethinking Equity and Teaching for English Language Learners (RETELL) is a Department initiative to improve and support the academic achievement of English language learners in our Commonwealth. RETELL brings a systemic approach that combines professional development for Sheltered English Immersion (SEI) teachers designed to enable them to make rigorous content accessible to their English learners. Moreover, new curriculum standards and assessment for ELLs will undergird RETELL. RETELL will require that Sheltered English Immersion (SEI) teachers and the administrators who supervise them to complete updated SEI professional development or its equivalent, with high priority placed on teachers with ELL students currently in their classes.
Revolving Fund – Fund within a municipal accounting system used for revenues from a specific service. Revenues in a revolving fund can be used to support the associated service without appropriation.
RTTT – Race to the Top is a federal grant initiative from the US Department of Education funded through the American Recovery and Reinvestment Act.
Rubrics – Specific sets of criteria that clearly define for both student and teacher what a range of acceptable and unacceptable performance looks like. Criteria define descriptors of ability at each level of performance and assign values to each level. Levels referred to are proficiency levels which describe a continuum from excellent to unacceptable product.
SASID (State Assigned Student Identifier) – The SASID number is issued by the Massachusetts Department of Elementary and Secondary Education and remains with the student throughout his/her educational life in grades pre-K through 12, even as the student transfers from one district or school to another. If the student leaves the state and returns, the student will receive his/her original SASID.
126

School Choice – The school choice program allows parents to send their children to schools in communities other than the city or town in which they reside. Tuition is paid by the sending district to the receiving district. Districts may elect not to enroll school choice students if no space is available.
• Receiving district: any city, town or regional school district within the Commonwealth in which a child does not reside, but in which that child attends public school under the provisions of Massachusetts General Laws, C. 72, and S.12B.
• Sending district: any city, town or regional school district within the Commonwealth in which a child resides, but in which that child does not attend public school under the provisions of Massachusetts General Laws, C. 72, and S.12B.
SIFE (Students with Interrupted Formal Education) – These are students who come to U.S. schools without a history of stable schooling in their own language. SIFE differ from ELLs as they have low or no literacy in their native language, little acquaintance with school culture, few or no academic literacy skills and little academic knowledge.
SIMS (Student Information Management System) -- SIMS is a statewide data collection system that includes a unique student identifier for all students receiving a publicly funded education in Massachusetts. DESE utilizes the information to meet federal and state reporting requirements and to inform policy and programmatic decisions.
Vocational Technical Programs – These are specific educational programs approved by the Commissioner of Education which lead to employment or continuing preparation for employment associated with agriculture, allied health, automotive, construction, marketing, service occupations, industrial-manufacturing programs and technical programs.
Warrant – A warrant is an authorization for an action by municipal personnel or voters. For example, a town meeting warrant establishes the matters that may be acted on by voters at town meeting. A treasury warrant authorizes the treasurer to pay specific bills.
WIDA - World-class Instructional Design and Assessment advances academic language development and academic achievement for linguistically diverse students through high quality standards, assessments, research, and professional development for educators. Twenty-seven U.S. states now belong to the WIDA Consortium, and many other schools nationally and internationally have adopted WIDA resources for use in their English language development programs.
127