Scientific and Technical Report 2001 - International Atomic ...
Upload
khangminh22Category
view
0download
0
PIRLS 2001 International ReportIEA’s Study of Reading Literacy Achievement in Primary School in 35 Countries
PIRLS

PIRLS 2001 International ReportIEA’s Study of Reading Literacy Achievement in Primary School in 35 Countries
PIRLS
Ina V.S. Mullis
Michael O. Martin
Eugenio J. Gonzalez
Ann M. Kennedy
International Associationfor the Evaluation ofEducational Achievement
International Study Center

© 2003 International Associationfor the Evaluation of EducationalAchievement (IEA)
PIRLS 2001 International Report / by InaV.S. Mullis, Michael O. Martin, Eugene J.Gonzalez, and Ann M. Kennedy.
Publisher: International Study Center,Lynch School of Education, Boston College
Library of CongressCatalog Card Number: 2003103114
ISBN: 1-889938-28-9
For more information about PIRLS contact:
PIRLS International Study CenterLynch School of EducationManresa HouseBoston CollegeChestnut Hill, MA 02467United States
tel: +1-617-552-1600fax: +1-617-552-1203
e-mail: [email protected]
http://pirls.bc.edu
Boston College is an equal opportunity,affirmative action employer.
Printed and bound in the United States.
[Contents]
3 Executive Summary
15 Introduction
17 Which Countries Participated?
18 Map of Countries Participatingin PIRLS 2001
20 The PIRLS 2001 Encyclopedia
20 Quality Control
21 Funding
23 Chapter 1International StudentAchievement in Reading
24 How Do Countries Differ in ReadingAchievement?
26 Exhibit 1.1Distribution of Reading Achievement
27 Exhibit 1.2Multiple Comparisons of AverageReading Achievement
28 What Are the Gender Differences inReading Literacy Achievement?
30 Exhibit 1.3Average Reading Achievement by Gender
31 Exhibit 1.4Percentages of Girls and Boys ReachingQuartiles of Reading Achievement inEach Country
33 Chapter 2Achievement in Reading for LiteraryExperience and Reading To Acquireand Use Information
35 How Does Achievement Differ AcrossReading Literacy Purposes?
36 Exhibit 2.1Distribution of Reading Achievementfor Literary Purposes
37 Exhibit 2.2Multiple Comparisons of Average ReadingAchievement for Literary Purposes
38 Exhibit 2.3Distribution of Reading Achievementfor Informational Purposes
39 Exhibit 2.4Multiple Comparisons of Average ReadingAchievement for Informational Purposes
41 In Which Reading Purposes AreCountries Relatively Strong or Weak?
41 What Are the Gender Differences inAchievement for the Content Areas?
42 Exhibit 2.5Relative Difference in Performance BetweenLiterary and Informational Purposes
43 Exhibit 2.6Reading for Literary and InformationalPurposes by Gender
45 Chapter 3Performance atInternational Benchmarks
47 How Do Countries Compare withInternational Benchmarks ofPerformance Reading Achievement?
48 Exhibit 3.1Percentages of Students Reaching PIRLSInternational Benchmarks in ReadingAchievement
49 What Was the Nature of the PIRLSReading Test?
51 How Were the BenchmarkDescriptions Developed?
52 How Should the BenchmarkDescriptions Be Interpreted?
54 Achievement at theLower Quarter Benchmark
57 Exhibit 3.2Description of Lower Quarter PIRLSInternational Benchmark of ReadingAchievement
58 Exhibit 3.3–3.8Lower Quarter PIRLS International BenchmarkExample Items
64 Achievement at theMedian Benchmark
66 Exhibit 3.9:Description of Median PIRLS InternationalBenchmark of Reading Achievement
67 Exhibit 3.10–3.15Median PIRLS International Benchmark Example Items
73 Achievement at theUpper Quarter Benchmark
75 Exhibit 3.16Description of Upper Quarter PIRLSInternational Benchmark of ReadingAchievement
76 Exhibit 3.17–3.22Upper Quarter PIRLS International BenchmarkExample Items
82 Achievement at theTop 10% Benchmark
84 Exhibit 3.23Description of Top 10% PIRLS InternationalBenchmark of Reading Achievement
85 Exhibit 3.24–29Top 10% PIRLS International BenchmarkExample Items
94 Chapter 4Literacy-Related Activitiesin the Home
95 What Activities FosteringLiteracy Did Parents Engagein with Their Child?
97 Exhibit 4.1Index of Early Home Literacy Activities (EHLA)
98 Exhibit 4.2Parents Read Books with Their Children Beforethe Children Began Primary School
99 What Language Do Students Speakat Home?
100 Exhibit 4.3Parents Did Early Reading Activities on theComputer with Their Children
101 Exhibit 4.4Students Speak Language of the Test at Home
103 Exhibit 4.5Students’ Parents Born in Country
104 What Literacy Resources Do StudentsHave in Their Homes?
105 Exhibit 4.6Index of Home Educational Resources (HER)
107 Exhibit 4.7Parents’ Reports of Books in the Home
108 Exhibit 4.8Students’ Reports of Books in the Home
110 Exhibit 4.9Parents’ Reports of Children’s Books in theHome
112 Exhibit 4.10Educational Resources in the Home
114 Exhibit 4.11Highest Level of Education of Either Parent
115 Exhibit 4.12Parents’ Employment Situations
116 Exhibit 4.13Fathers’ Occupation
118 Exhibit 4.14Mothers’ Occupation
120 How Often Do Parents Read?
122 Exhibit 4.15Parents Read at Home
123 Exhibit 4.16Parents Read for Enjoyment
124 Exhibit 4.17Index of Parents’ Attitudes TowardReading (PATR)
[Contents]
127 Chapter 5School Curriculum and Organizationfor Teaching Reading
128 How Well-Prepared Are Students toLearn to Read?
130 Exhibit 5.1Number of Years Children Attended PreprimaryEducation (Preschool, Kindergarten, and OtherSimilar Programs)
131 Exhibit 5.2Age Students Began Primary School
132 Exhibit 5.3Students in Schools Categorized by Principals’Estimate of the Percentage of StudentsBeginning School With Early Literacy Skills
134 Exhibit 5.4Students in Schools Where Principals EstimateThat Most Students (More than 75%) BeginSchool with Specific Early Literacy Skill
135 Exhibit 5.5Students Based on Parents’ Reports of HowWell They Could Do Early Literacy ActivitiesBeginning School
136 How Much Is Reading Emphasized inthe School Curriculum?
137 Exhibit 5.6Students Whose Parents Reported TheyCould Do Specific Early Literacy ActivitiesBeginning School
138 Exhibit 5.7Schools’ Grade-by-Grade Emphaseson Reading Comprehension Skillsor Strategies
141 Exhibit 5.8Teachers Ask Students to Do Classroom Activities at Least Weekly to Develop ReadingComprehension Skills or Strategies
142 Exhibit 5.9Emphasis on Reading Curriculumin the Schools
144 Exhibit 5.10Influence of Various Factors onSchools’ Curriculum
145 Exhibit 5.11Instructional Time for Reading(Formal and Integrated)
146 How Much Instructional Time IsDevoted to Reading?
147 Exhibit 5.12Number of Hours Reading is Taught Weekly(Formal and Integrated)
148 Exhibit 5.13Teachers Spend Time for FormalReading Instruction
149 How Are Classes Organized forReading Instruction?
150 Exhibit 5.14Frequency of Reading Instruction Duringthe Week
151 Exhibit 5.15Schools’ Reading Instructional Programs
152 Exhibit 5.16Teachers’ Reports of Their Students’Reading Level
154 Exhibit 5.17Use of Instructional Materials for Studentsat Different Reading Levels
155 Exhibit 5.18Teachers Teach Reading Across CurriculumAreas or Separately
156 Exhibit 5.19Organization of Students for ReadingInstruction
157 How Big Are Classes for Reading andLanguage Instruction?
158 Exhibit 5.20Class Size for Reading and LanguageInstruction
159 Exhibit 5.21Average Number of Students in Class NeedingSpecial Instruction
160 How Do Schools Help Students withReading Difficulties?
161 Exhibit 5.22Availability of Specialists
163 Exhibit 5.23Teachers’ Approaches to Dealing with StudentsFalling Behind in Reading
165 Chapter 6Teachers andReading Instruction
167 What Preparation Do Teachers Havefor Teaching Reading?
169 Exhibit 6.1Teachers’ Gender, Age, and Average Number ofYears Teaching
170 Exhibit 6.2Number of Years Students Typically Stay withthe Same Classroom Teacher
171 Exhibit 6.3Teachers’ General or Specialized TeachingResponsibilities
172 Exhibit 6.4Preparation to Teach Reading
173 Exhibit 6.5Areas of Emphasis in Teachers’ FormalEducation and/or Training
174 What Instructional ResourcesDo Teachers Use?
177 Exhibit 6.6Materials Schools Used as a Basis for TheirReading Instructional Programs
178 Exhibit 6.7Materials Schools Used as a Supplement toTheir Reading Instructional Programs
179 Exhibit 6.8Teachers’ Use of Textbooks/Reading Series andWorkbooks/Worksheets for ReadingInstruction
180 Exhibit 6.9Teachers’ Use of Workbooks or Worksheets
181 Exhibit 6.10Use of Materials for Reading Instruction OtherThan Textbooks or a Reading Series,Workbooks or Worksheets
182 Exhibit 6.11Teachers’ Use of Fiction for Reading Instruction
183 Exhibit 6.12Types of Fiction Used for Reading Instruction
184 Exhibit 6.13Use of Nonfiction for Reading Instruction
185 Exhibit 6.14Use of Films and Other Mediafor Reading Instruction
186 How Often Do Students Read Aloudand Independently in Class?
188 Exhibit 6.15Emphasis on Decoding and Vocabulary
189 Exhibit 6.16Students’ Reports About Teachers ReadingAloud in Class
190 Exhibit 6.17Students’ Reports About Students ReadingAloud in Class
191 Exhibit 6.18Students’ Reports About Independent Reading
192 Exhibit 6.19Teachers’ Reports About Reading Aloud orSilently in Class
194 What Activities Do Students Do inResponse to Class Reading?
196 Exhibit 6.20Students Answer Questions Aloud AboutClass Reading
197 Exhibit 6.21Students Answer Questions in Writing AboutClass Reading
198 Exhibit 6.22Students Talk in Class with Peers AboutReading
199 Exhibit 6.23Students Do Projects About Class Reading
200 Exhibit 6.24Teachers’ Reports About ReadingComprehension Activities After Instruction
201 Exhibit 6.25Students’ Reports on Taking a Quiz or TestAfter Reading
202 Exhibit 6.26Teachers’ Reports on Giving a Written Quiz orTest After Students Read
205 Exhibit 6.27Access to Libraries in School
206 Exhibit 6.28Students’ Use of Classroom Libraries
207 Exhibit 6.29Frequency of Students’ School Library Visits
208 Exhibit 6.30Students’ Overall Library Use in School
[Contents]
209 How Are Computers Usedfor Reading Instruction?
211 Exhibit 6.31Computer Availability and Instructional Use
212 Exhibit 6.32Students’ Reports on Computer Use
213 What Is the Roleof Reading Homework?
214 Exhibit 6.33Students Assigned Reading for Homework
215 Exhibit 6.34Index of Reading for Homework (RFH)
216 How Do Teachers AssessReading Progress?
218 Exhibit 6.35Emphasis on Sources to Monitor Students’Progress in Reading
219 Exhibit 6.36Use of Portfolios (Collections of Students’Work) to Monitor Students’ Progress inReading
220 Exhibit 6.37Approaches to Assessing Students’Performance in Reading
223 Chapter 7School Contexts
224 What Are the Schools’ DemographicCharacteristics?
226 Exhibit 7.1Principals’ Reports on Their Schools’ Locations
227 Exhibit 7.2Principals’ Reports on Their Primary-GradeStudents Coming from EconomicallyDisadvantaged Homes
228 Exhibit 7.3Principals’ Reports on Their Primary-GradeStudents Not Speaking the Language of theTest as Their First Language
229 What Is the Role of the SchoolPrincipal?
230 Exhibit 7.4Principals’ Time Spent on Various School-Related Activities
231 How Often Do Teachers Collaborateor Participate in Workshopsor Seminars?
232 Exhibit 7.5Schools’ Policies on Teacher Collaboration
233 Exhibit 7.6Teachers Meet to Discuss Instruction
234 Exhibit 7.7Teachers Meet to Plan Reading Curriculum orTeaching Approaches
235 Exhibit 7.8Teachers’ Recent Participationin Workshops or Seminars
236 What Is the Level of Home-SchoolInvolvement?
238 Exhibit 7.9Index of Home-School Involvement (HSI)
239 Exhibit 7.10Teachers Send Home Examples of Students’Classroom Work in Language
240 Exhibit 7.11Schools Ask Parents to Review Child’sLanguage Progress
241 Exhibit 7.12Parents Discuss Child’s Classroom ReadingWork with Him or Her
242 How Serious Is Absenteeismin Schools?
242 What Are the Perceptions ofSchool Climate?
243 Exhibit 7.13Seriousness of Absenteeism in Schools
244 Exhibit 7.14Index of Principals’ Perceptions of SchoolClimate (PPSC)
245 How Safe Are Schools?
247 Exhibit 7.15How Much Students Agree with Feeling Safeat School
248 Exhibit 7.16Students Answering “Yes” to Incidentsof Stealing, Bullying, and Hitting at SchoolDuring the Last Month
250 Exhibit 7.17Index of Principals’ Perceptions of SchoolSafety (PPSS)
251 What School Resources Are Availableto Support Reading?
253 Exhibit 7.18Index of Availability of School Resources (ASR)
254 Exhibit 7.19Availability of Computers forInstructional Purposes
255 Exhibit 7.20Schools’ Reports on Number of Computersand How Many Have Access to the Internet
257 Chapter 8Students’ Reading Attitudes, Self-Concept, and Out-of-School Activities
258 What Are Students’ Attitudes TowardReading?
259 What Are Students’ Perceptionsof Their Reading Ability?
261 Exhibit 8.1Index of Students’ Attitudes TowardReading (SATR)
262 Exhibit 8.2Index of Students’ Attitudes Toward Reading(SATR) by Gender
263 Exhibit 8.3Index of Students’ Reading Self Concept(SRSC)
264 Exhibit 8.4Index of Students’ Reading Self Concept(SRSC)by Gender
265 How Often Do Students Engage inLiteracy Activities Outside of School?
267 How Often Do Students WatchTelevision or Videos?
268 Exhibit 8.5Students Read for Fun Outside of School
269 Exhibit 8.6Students Read Stories or Novels Outsideof School
270 Exhibit 8.7Students Read Stories or Novels Outsideof School by Gender
271 Exhibit 8.8Students Read for Information Outsideof School
272 Exhibit 8.9Students Read for Information Outsideof School by Gender
273 Exhibit 8.10Parents Talk with Their Child About What theChild is Reading
274 Exhibit 8.11Students Talk with Their Families About Whatthe Students are Reading
275 Exhibit 8.12Students Spend Time Watching Television orVideos on a Normal School Day
[Contents]
277 Appendix AOverview ofPIRLS Procedures
277 History
278 Participants in PIRLS
278 Developing the PIRLS Tests
279 Exhibit A.1Countries Participating in PIRLS 2001 andthe Trends in IEA’s Reading Literacy Study
282 Exhibit A.2Aspects of Reading Literacy
283 Exhibit A.3Distribution of Items by Reading Purpose andProcess Category
284 PIRLS Test Design
284 Background Questionnaires
285 Translation Verification
286 Sample Implementation andParticipation Rates
287 Exhibit A.4Coverage of PIRLS Target Population
288 Data Collection
289 Exhibit A.5School Sample Sizes
290 Exhibit A.6Student Sample Sizes (Unweighted)
291 Exhibit A.7Participation Rates (Weighted)
292 Exhibit A.8Percentage of Students with Any AvailableStudent, Parent, Teacher,and Principal Questionnaire Data
293 Scoring the Constructed-ResponseItems
294 Test Reliability
295 Data Processing
295 IRT Scaling and Data Analysis
296 Exhibit A.9PIRLS Within-Country Constructed-ResponseScoring Reliability Data
297 Exhibit A.10PIRLS Cross-Country Constructed-ResponseScoring Reliability
298 Exhibit A.11Cronbach’s Alpha Reliability Coefficient –PIRLS 2001
300 Exhibit A.12Correlation Between Reading for LiteraryPurposes and Reading for InformationalPurposes
301 Estimating Sampling Error
301 Setting International Benchmarksof Student Achievement
305 Appendix BPercentiles and Standard Deviationsof Reading Achievement
306 Exhibit B.1Percentiles of Achievement in Reading
307 Exhibit B.2Standard Deviations of Achievementin Reading
308 Exhibit B.3Percentiles of Achievementin Literary Reading
309 Exhibit B.4Standard Deviations of Achievementin Literary Reading
310 Exhibit B.5Percentiles of Achievementin Informational Reading
311 Exhibit B.6Standard Deviations of Achievementin Informational Reading
313 Appendix CSample Passages, Questions,and Scoring Guides
357 Appendix DReading Items Used for Describing Each Benchmark
365 Appendix ESweden - Grade 3Reading Achievement
366 Exhibit E.1Sweden – Selected ReadingAchievement Results
369 Appendix FAcknowledgements


[3]
Executive SummarySince its inception in 1959, the International Association forthe Evaluation of Educational Achievement (IEA) has conducted a seriesof internationally comparative studies designed to provide policy makers,educators, researchers, and practitioners with information about educa-tional achievement and learning contexts. The Progress in InternationalReading Literacy Study (PIRLS) is IEA’s newly-developed assessment ofstudents’ reading achievement at fourth grade. Thirty-five countries par-ticipated in PIRLS 2001. Its success depended on a collaborative effortamong the research centers in each country responsible for implement-ing the steps of the project and the network of international centersresponsible for managing the across-country tasks, such as trainingcountry representatives in standardized procedures, selecting compara-ble samples of schools and students, developing instruments, andconducting the various steps required for data processing and analysis.
PIRLS assessed a range of reading comprehension strategies fortwo major reading purposes – literary and informational. More than halfof the questions were in the constructed-response format, requiring stu-dents to generate and write their answers. Example passages, questions,and scoring guides can be found in the back pocket of the report andin Appendix C.
[4]
Because the home, school, and national context within which stu-dents learn to read play such important roles, PIRLS collected extensive infor-mation about these influences. The students who participated in PIRLScompleted questionnaires about their home and school experiences relatedto learning to read. Of special interest, their parents and caregivers com-pleted questionnaires about activities used to foster early literacy activities.Also, teachers and school administrators completed questionnaires aboutinstructional practices. System level information was provided by each par-ticipating country and published in the PIRLS 2001 Encyclopedia.
All aspects of PIRLS were conducted with concerted attention toquality. Countries met rigorous standards for sampling designed to preventbias and ensure comparability. Translating the tests and questionnaires involveda detailed iterative review process, and numerous training sessions were heldin data-collection and scoring procedures. Prior to analysis, each country’sdata were subjected to exhaustive checks for consistency and comparabilityacross countries.
Students’ Reading Achievement
F Sweden had the highest reading literacy achievement of all the countriesparticipating in PIRLS 2001. The Netherlands, England, and Bulgaria wereoutperformed only by Sweden. Latvia, Canada, Lithuania, Hungary, theUnited States, Germany, and Italy also performed better than most of theother countries.
F In all countries, fourth-grade girls had significantly higher reading achieve-ment than boys.
F Sweden and England had the highest average achievement in reading forliterary purposes, with Sweden having significantly higher mean achieve-ment than the rest of the other participating countries and England per-forming significantly better than all the other countries except TheNetherlands, the United States, and Bulgaria. Only Sweden outperformedThe Netherlands, the United States, and Bulgaria.
executive summary
[5]executive summary
In all countries,fourth-grade girlshad significantlyhigher readingachievementthan boys.
[6] executive summary
F In reading for informational purposes, Sweden, The Netherlands, and Bul-garia had the highest average achievement. Sweden had significantly higherachievement than the rest of the countries and The Netherlands and Bul-garia performed significantly better than all the other countries exceptLatvia and England, who were outperformed only by Sweden.
Home Activities Fostering Literacy
F In every country, there was a positive relationship between reading achieve-ment at fourth grade and students having engaged in early literacy activi-ties before starting school (e.g., reading books, telling stories, singing songs,playing with alphabet toys, and playing word games). Parents generallyreported a fairly high level of engagement, with England and Scotlandreporting the highest levels.
F On average across countries, there was a strong relationship betweenspeaking the language of the PIRLS test at home and performance on thePIRLS test.
F In every country, fourth-grade students from homes with many children’sbooks (more than 100) had higher reading achievement than those fromhomes with few children’s books (10 or less). Internationally, on average,the majority of students (58%) were in homes with more than 25 children’sbooks.
F Across countries, on average, students with the highest reading achieve-ment had parents who spent time reading (more than six hours per week) andtheir parents had favorable attitudes toward reading.

[7]executive summary
Students with thehighest readingachievement hadparents who spenttime reading.
[8]
Curriculum and School Organization
F In most countries, principals reported that less than half (and in many casesless than one-quarter) of students beginning their schools had early literacyskills (i.e., recognize most of the alphabet, read some words, read sentences,write letters of the alphabet, and write some words). Exceptions were England,Singapore, Slovenia, Canada, France, Sweden, and the United States.
F More than half the students (54%), on average, across countries had parentsthat reported their child could do early literacy activities (see above) mod-erately or very well at the time they began school, and only 17 percent hadparents reporting they could not do them at all.
F According to principals across the countries, reading was emphasized morethan other areas of the curriculum in grades one through four. Almost four-fifths (78%) of students, on average, were in schools where reading receivedmore emphasis than other areas of the curriculum.
F Teachers reported spending as much as nine hours per week, on average,on language instruction in Canada, Colombia, Cyprus, France, Greece, NewZealand, and the United States, and as little as three hours in Macedonia;the average across all countries was seven hours. On average, across countries,28 percent of fourth-grade students had teachers reporting more than sixhours each week specifically on reading instruction.
F Teaching reading as a whole-class activity was the most popular approachinternationally, with 38 percent of students, on average, in classes wherethe teacher always or almost always chose this method.
F Internationally, on average, about half the students (56%) were in class-rooms where all students were reading the same materials but at their ownspeeds, and another one-third (32%) were reading different materials accord-ing to their reading level. The remainder were reading the same materialsat the same speed, often because they had the same reading level.
executive summary
[9]executive summary
F On average, across countries, teachers reported that the most commonlyused classroom activities were asking students to identify the main ideaand explain or support their understanding of what they had read (used atleast weekly with 90% of students).
F Almost two-thirds (63%) of fourth-grade students internationally, on average,were in classes where the teacher reported never having access to a remedialor reading specialist. Twelve percent were in classes where the teacherreported having a remedial or reading specialist always available to dealwith students with reading difficulties and 25 percent in classes where suchspecialists were sometimes available.
F When asked what they usually do when a student begins to fall behind inreading, in almost every country, teachers’ most common response was tospend more time working on reading with that student (internationally, for88% of students on average).
Reading Instruction
F On average, internationally, two-thirds of students had daily reading instruc-tion based on a textbook or reading series. Almost all students (95% ormore) had such instruction in Bulgaria, Cyprus, Greece, Hungary, Latvia,the Russian Federation, and the Slovak Republic. Workbooks were used ona daily basis for about one-third of students (32%) and on a weekly basisfor nearly half the students (46%).
F Across countries, the instructional approach used for the majority of stu-dents (international average 53%) was daily instruction based on a text-book or reading series accompanied by at least weekly exercises inworkbooks or worksheets. Three-fourths of students (international average76%) were given at least two of the following on a monthly basis to sup-plement their weekly instructional program – children’s books, newspa-pers/magazines, computerized activities, or Internet assignments.
[10] executive summary
F On average, internationally, using fiction in classrooms is much more wide-spread than using non-fiction. Teachers reported using fiction for readinginstruction at least weekly for 84 percent of students compared to non-fiction for 56 percent of students.
F Both teachers and students agreed that independent silent reading was afrequent classroom activity, particularly for students with higher readingachievement. On average, internationally, two-thirds of fourth-grade stu-dents (66%) reported reading silently on their own daily, and a further27 percent at least weekly.
F Across countries, on average, teachers reported asking the majority of fourth-grade students to read aloud to the whole class on a daily basis (56%), aswell as assigning some reading aloud in small groups or pairs. Studentsreported reading aloud themselves somewhat less frequently – about one-fourth (23%) daily and one-third (36%) weekly. Interestingly, students withthe highest reading achievement reported frequent independent reading(daily) and less frequent reading aloud (monthly). Presumably, teachers wereable to allow the better readers more time on their own.
F In many countries, oral questioning by the teacher was an everyday activ-ity and in all countries it happened with the majority of fourth-grade stu-dents at least weekly. Students also reported frequently answering questionsin writing about what they had read in class.
F Almost all fourth-grade students (international average 85%) attendedschools with a school library, and the majority (65%) with large holdings –more than 500 books. Many students also had access to classroom libraries.On average, internationally, 57 percent of students were in schools wheremost or all classrooms had classroom libraries. These were most often reportedin Cyprus, Hong Kong, New Zealand, and Scotland.
F Despite the widespread availability of classroom libraries, teachers reportedusing them relatively infrequently. On average, across countries, the major-ity of fourth-grade students (62%) were given time to use the classroomlibrary only weekly or less often.

[11]executive summary
F Computer availability for reading instruction varied dramatically fromcountry to country. Whereas almost all students (more than 90%) in Canada, England, Iceland, The Netherlands, New Zealand, Scotland, Singapore, Sweden, and the United States had computers available in theclassroom or elsewhere in the school, the large majority (more than 80%)had no access to computers in Belize, Bulgaria, Colombia, Greece, Iran,Kuwait, Macedonia, Moldova, the Russian Federation, the Slovak Republic,and Turkey.
F Internationally, teachers relied most on their own professional opinion whenmonitoring student progress. On average, 70 percent of students were inclasses where teachers reported placing major emphasis on professionalopinion, compared to 55 percent where the emphasis was on classroom tests,39 percent on diagnostic tests, 23 percent on national or regional examina-tions, and 16 percent on standardized tests.
School Contexts
F On average, internationally, average reading achievement was considerablyhigher – 40 scale-score points – for students in schools with few studentsfrom disadvantaged homes (less than 10%) than with the majority from dis-advantaged homes. According to principals, one-third of the studentsattended schools with relatively few disadvantaged students but one-fourth(23%) were in schools where more than 50 percent of the students camefrom economically disadvantaged homes.
F At least half of the fourth-grade students in Canada, France, Hong Kong,Iceland, Iran, Israel, Kuwait, The Netherlands, New Zealand, Singapore, andthe United States, were in schools emphasizing communication with parents.
F Absenteeism does not appear to be prevalent among fourth graders. Onaverage, internationally, almost 80 percent of students attended schools whereprincipals reported absenteeism was not a problem or only a minor one.
[12] executive summary
F Internationally, on average, about one-third of students (36%) attended schoolsperceived by principals to have high morale, high academic expectations, regardfor school property, and a high level of parental support, and these students hadhigher reading achievement than those in less positive school climates.
F Across countries, on average, 43 percent of students attended schools reportingadequate availability of resources, and only 18 percent were in schools affected bythe lack of availability. Students in schools reporting no shortage or inadequacyof resources generally had higher reading achievement than those affected “a lot”by shortages.
Students’ Attitudes and Reading Habits
F Within all countries, students’ attitudes toward reading were generally positive, andstudents with the most positive attitudes had the highest reading achievement.Internationally, about half the students, on average, agreed with each of five state-ments about enjoying reading and appreciating books. More girls than boys had pos-itive attitudes in all countries.
F On average, internationally, 63 percent of fourth-grade students reported readingstories or novels at least once a week. More girls (70%) than boys (55%) so reported.Similarly, 61 percent internationally, on average, reported reading for informationat least weekly. However, comparable percentages of girls (62%) and boys (59%)read weekly for information.

[13]executive summary


[15]
IntroductionPIRLS 2001 International Report
Since a literate population provides the foundation
for any nation’s social and economic health and the
ability to read is essential for the personal growth
of its citizens, it is crucial to have easily accessible
information about students’ achievement in reading.
The Progress in International Reading Literacy
Study (PIRLS) provides a vehicle for countries to
obtain internationally comparative data about the
reading achievement of their primary school students
(the fourth grade in most participating countries).
[16]
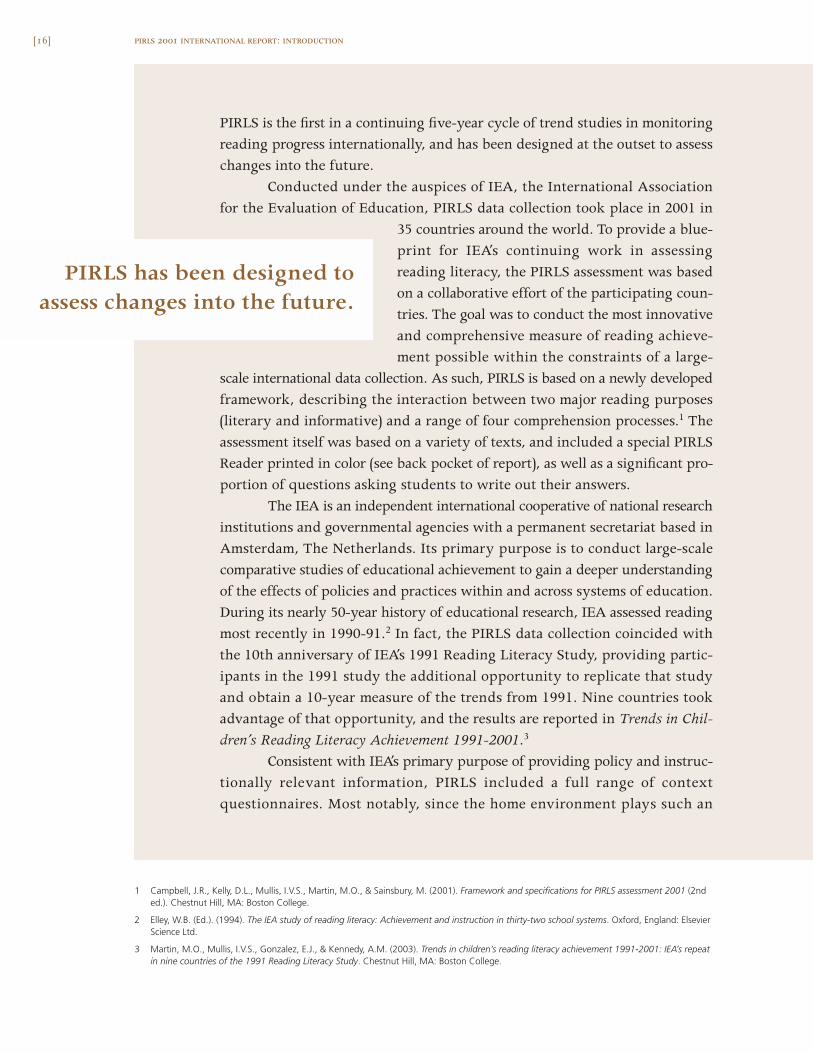
PIRLS is the first in a continuing five-year cycle of trend studies in monitoringreading progress internationally, and has been designed at the outset to assesschanges into the future.
Conducted under the auspices of IEA, the International Associationfor the Evaluation of Education, PIRLS data collection took place in 2001 in
35 countries around the world. To provide a blue-print for IEA’s continuing work in assessingreading literacy, the PIRLS assessment was basedon a collaborative effort of the participating coun-tries. The goal was to conduct the most innovativeand comprehensive measure of reading achieve-ment possible within the constraints of a large-
scale international data collection. As such, PIRLS is based on a newly developedframework, describing the interaction between two major reading purposes(literary and informative) and a range of four comprehension processes.1 Theassessment itself was based on a variety of texts, and included a special PIRLSReader printed in color (see back pocket of report), as well as a significant pro-portion of questions asking students to write out their answers.
The IEA is an independent international cooperative of national researchinstitutions and governmental agencies with a permanent secretariat based inAmsterdam, The Netherlands. Its primary purpose is to conduct large-scalecomparative studies of educational achievement to gain a deeper understandingof the effects of policies and practices within and across systems of education.During its nearly 50-year history of educational research, IEA assessed readingmost recently in 1990-91.2 In fact, the PIRLS data collection coincided withthe 10th anniversary of IEA’s 1991 Reading Literacy Study, providing partic-ipants in the 1991 study the additional opportunity to replicate that studyand obtain a 10-year measure of the trends from 1991. Nine countries tookadvantage of that opportunity, and the results are reported in Trends in Chil-dren’s Reading Literacy Achievement 1991-2001.3
Consistent with IEA’s primary purpose of providing policy and instruc-tionally relevant information, PIRLS included a full range of context questionnaires. Most notably, since the home environment plays such an
pirls 2001 international report: introduction
1 Campbell, J.R., Kelly, D.L., Mullis, I.V.S., Martin, M.O., & Sainsbury, M. (2001). Framework and specifications for PIRLS assessment 2001 (2nded.). Chestnut Hill, MA: Boston College.
2 Elley, W.B. (Ed.). (1994). The IEA study of reading literacy: Achievement and instruction in thirty-two school systems. Oxford, England: ElsevierScience Ltd.
3 Martin, M.O., Mullis, I.V.S., Gonzalez, E.J., & Kennedy, A.M. (2003). Trends in children’s reading literacy achievement 1991-2001: IEA’s repeatin nine countries of the 1991 Reading Literacy Study. Chestnut Hill, MA: Boston College.
PIRLS has been designed toassess changes into the future.

[17]pirls 2001 international report: introduction
important role in providing children with early language and literacy expe-riences, parents and caregivers were asked to complete a questionnaire aboutvarious aspects of fostering reading development. Additionally, school admin-istrators were asked about their reading curricula, programs, and resources;teachers about their professional development and different types of readinginstruction; and the students, themselves, about their reading, in and outsideof school. By gathering information about children’s experiences in learningto read, together with reading achievement on the PIRLS test, it is possibleto identify factors or combinations of factors associated with high levels ofreading literacy.
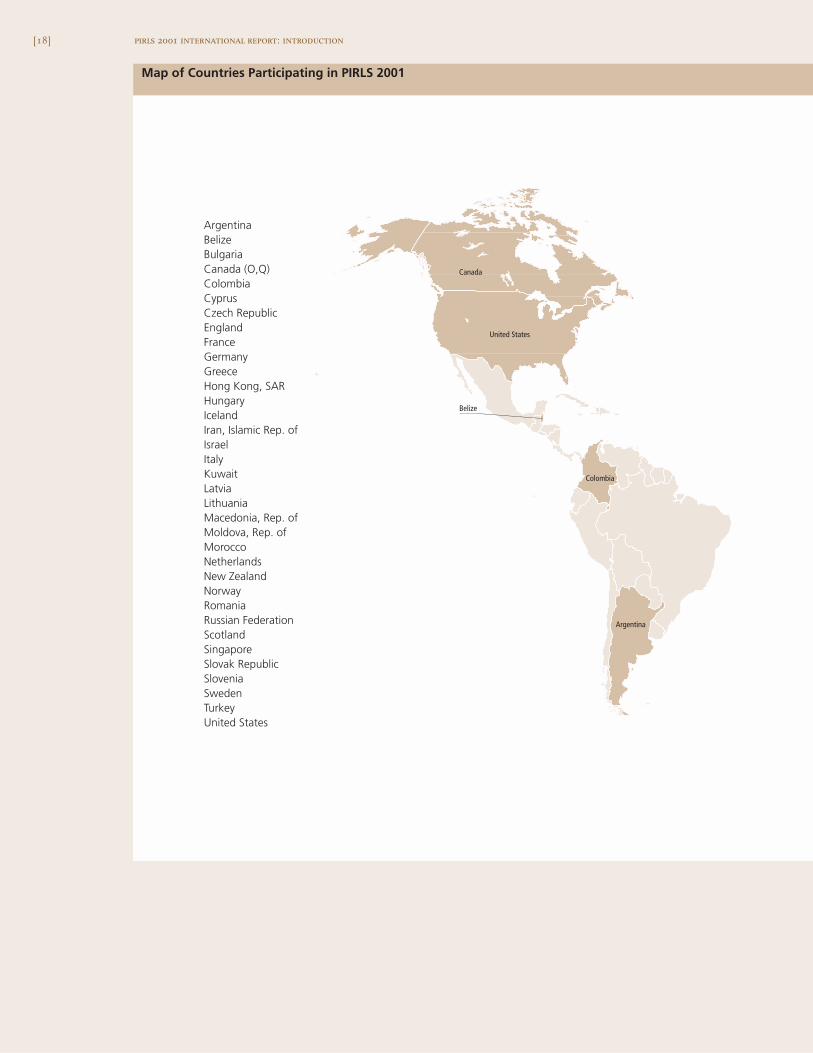
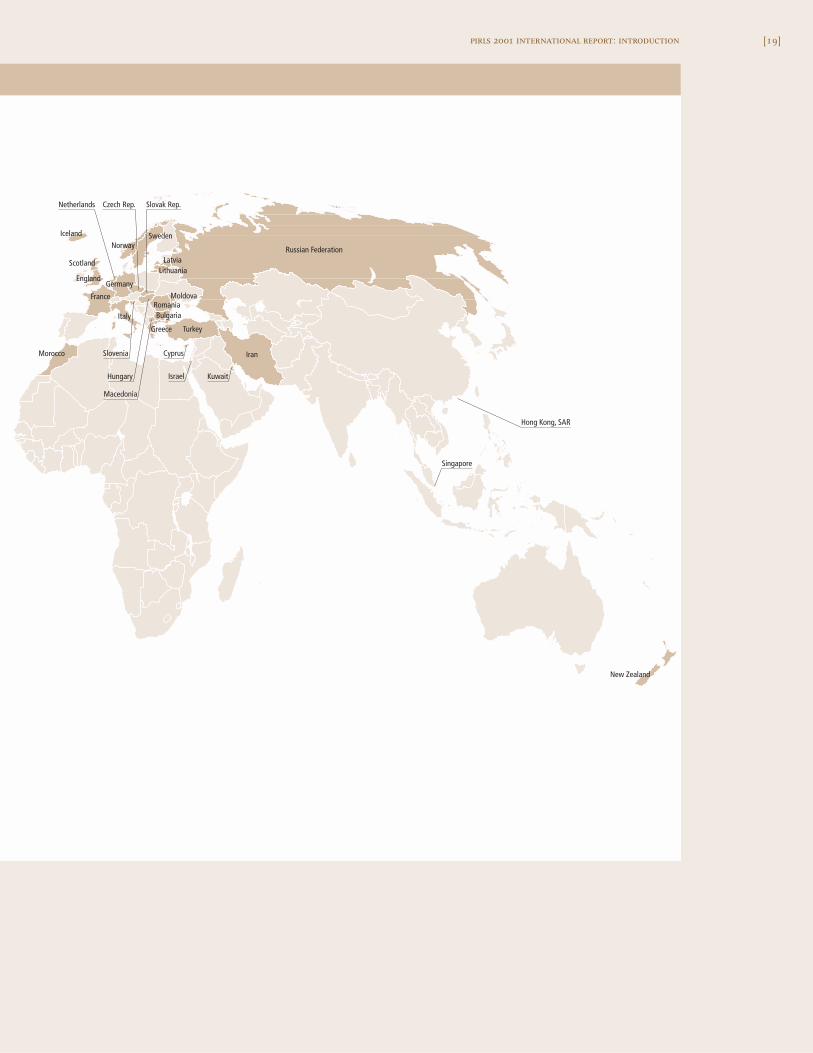
Which Countries Participated?
The map on the next page shows the 35 countries that participated in PIRLS2001. The decision to participate in any IEA study is made solely by eachmember country according to its own data needs and resources, and is coor-dinated through IEA’s secretariat in Amsterdam. Each participating countrydesignated a national center to conduct the activ-ities of the study and a National Research Coordi-nator (NRC) to implement it in accordance withinternational procedures – a considerable respon-sibility given the complexity of the data collec-tion and the measurement instruments. The qualityof the study depends on the work of the NRCs andtheir colleagues, and all those involved deservedeep appreciation for their continued commitmentto the project. Appendix F contains a list of thePIRLS 2001 National Research Coordinators andadvisory committees.
Most, but not all, countries tested studentsin the fourth year of formal schooling (typically,10-year-olds). Thus, solely for convenience, thereport usually refers to the grade tested as the fourth grade. PIRLS workedvery hard to take years of schooling, students’ ages, and curriculum covered
[18] pirls 2001 international report: introduction
Argentina
Belize
Colombia
Canada
United States
ArgentinaBelizeBulgariaCanada (O,Q)ColombiaCyprusCzech RepublicEnglandFranceGermanyGreeceHong Kong, SARHungaryIcelandIran, Islamic Rep. ofIsraelItalyKuwaitLatviaLithuaniaMacedonia, Rep. ofMoldova, Rep. ofMoroccoNetherlandsNew ZealandNorwayRomaniaRussian FederationScotlandSingaporeSlovak RepublicSloveniaSwedenTurkeyUnited States
Map of Countries Participating in PIRLS 2001
[19]pirls 2001 international report: introduction
Iran
Russian Federation
Hong Kong, SAR
New Zealand
Singapore
Morocco
Italy
England
Slovenia
Hungary
Romania
Macedonia
Bulgaria
Cyprus
Turkey
Moldova
Israel
France
Kuwait
Greece
Netherlands
LatviaLithuania
Slovak Rep.Czech Rep.
Germany
Iceland
Norway
Scotland
Sweden

[20]
into consideration to maximize comparability across the grades tested in eachcountry, the effect being that a few students were in the third grade whilesome were in the fifth grade. Exhibit 1.1 in Chapter 1 contains informationfor each country about the years of formal schooling and average age of thestudents tested.
For the sake of comparability across countries, all testing was con-ducted toward the end of the school year, most often in April through Juneof 2001, for countries in the Northern Hemisphere. The four countries on aSouthern Hemisphere school schedule (Argentina, Colombia, New Zealand,and Singapore) tested in September through December 2001, which was theend of the school year there.
The PIRLS 2001 Encyclopedia
To provide a rich context for interpreting the results, the NRCs for PIRLS 2001agreed at an early stage of the project to work together to produce a publica-tion to complement the data collected by the study. Entitled the PIRLS 2001Encyclopedia,4 the resulting volume provides general information on the cul-tural, societal, and economic situation in each country, as well as a more focusedperspective on the structure and organization of the education system as itpertains specifically to the promotion of reading literacy. The PIRLS 2001Encyclopedia describes primary/elementary schooling as it pertains to readingwithin each country: including teacher education and training, reading cur-ricula, classroom organization and instruction, and assessment practices. Assuch, it is an extremely valuable companion publication to this internationalreport, providing insights and detailed information about the policies, practices,and resources within each country.
Quality Control
International studies of student achievement provide valuable comparativeinformation about students’ performance in the context of varying curriculaand instructional practices. Accompanying the benefits of international studies,though, are the challenges associated with comparing achievement acrosscountries, cultures, and languages. PIRLS made every effort to attend to these
pirls 2001 international report: introduction
4 Mullis, I.V.S., Martin, M.O., Kennedy, A.M., & Flaherty, C.L. (Eds.). (2002). PIRLS 2001 encyclopedia: A reference guide to reading education inthe countries participating in IEA’s Progress in International Reading Literacy Study (PIRLS). Chestnut Hill, MA: Boston College.
[21]pirls 2001 international report: introduction
issues through careful planning and documentation, cooperation among theparticipating countries, standardized procedures, and rigorous attention toquality control throughout. For example, an extensive series of verificationchecks was conducted to ensure the comparability of the test translations, anddetailed documentation was required to satisfy adherence to the samplingstandards. Appendix A contains an overview of the procedures used. Moredetailed information is provided in the PIRLS Technical Report.5
The PIRLS International Study Center at Boston College, directed byIna V.S. Mullis and Michael O. Martin, was responsible for all aspects of thedesign, development, and implementation of the study, working closely withthe PIRLS advisory committees, the NRCs, and partner organizations respon-sible for particular aspects of the study. These included the IEA Secretariat,which provided guidance in all aspects of the study and was responsible for ver-ification of all translations produced by participating countries; StatisticsCanada, which was responsible for school and student sampling activities; theNational Foundation for Educational Research in England and Wales, whichhad major responsibility for developing the reading assessment; the IEA DataProcessing Center, responsible for processing and verifying the data from the35 countries; and Educational Testing Service, which provided software andsupport for scaling the achievement data.
Funding
A project of this magnitude requires considerable financial support. IEA’s majorfunding partners for PIRLS included the World Bank, the U.S. Department ofEducation through the National Center for Education Statistics, and thosecountries that contributed by way of fees.
5 Martin, M.O., Mullis, I.V.S., & Kennedy, A.M. (Eds.). (2003). PIRLS 2001 technical report. Chestnut Hill, MA: Boston College.

1
[23]
Chapter 1International StudentAchievement in Reading
Chapter 1 summarizes reading achievement
at the fourth grade for each of the countries
that participated in pirls 2001. The average
and range in performance are presented for
participating countries, and gender differences
also are provided.
[24]
How Do Countries Differ in Reading Achievement?
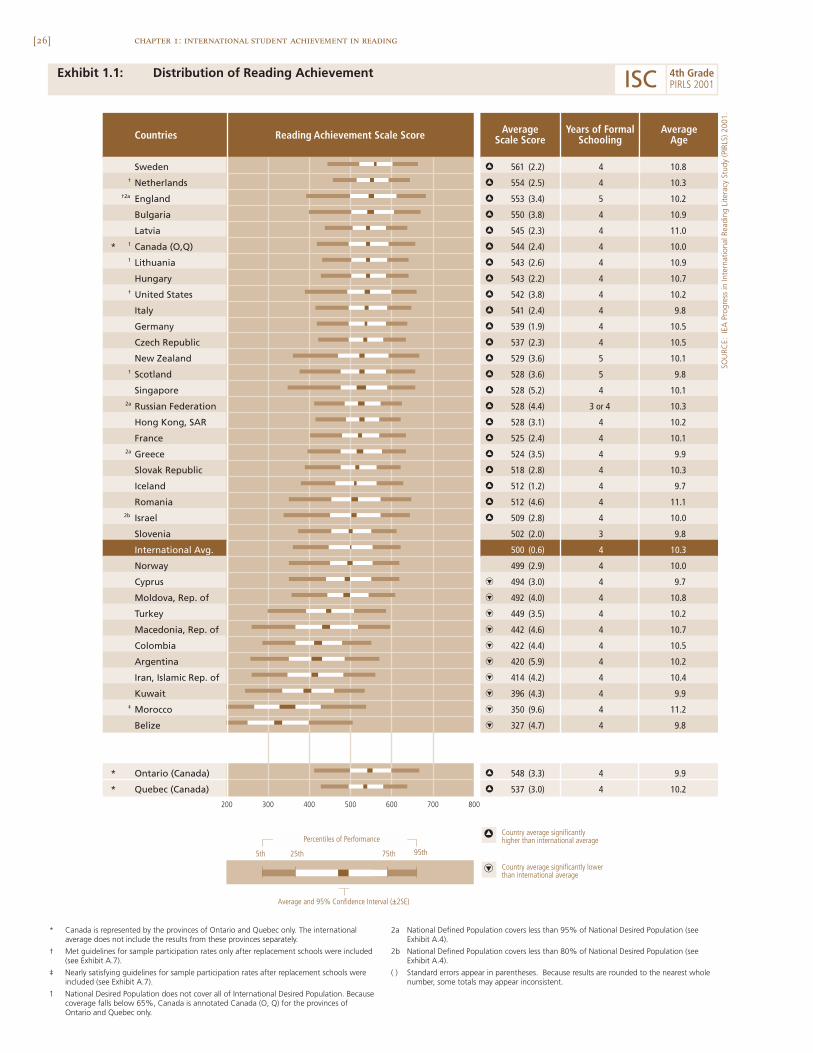
Exhibit 1.1 presents the distribution of student achievement in reading forthe 35 countries that participated in PIRLS 2001. Countries are shown indecreasing order of average (mean) scale score, together with an indication ofwhether the country average is significantly higher or lower than the inter-national average.1 The international average of 500 is the mean of the averagescale scores of each of the participating countries. Beginning with top-per-forming Sweden, it can be seen that 23 countries had average reading literacyachievement that was significantly above the international average. Two coun-tries, Slovenia and Norway, had reading literacy achievement about at theinternational average, and the remaining 10 countries had average achieve-ment below the international average.
PIRLS devoted considerable effort to maximizing comparability acrossthe grades and ages tested, but it is difficult given that students start formalschooling at different ages.2 Exhibit 1.1 shows that the grade tested in mostcountries represented the fourth year of formal schooling. Thus, solely for
convenience, the report usually refers to the grade tested as thefourth grade. Students in Slovenia, in particular, had one yearless of formal schooling than students in the other participat-ing countries, and also some students in the Russian Federationwere in their third year of formal schooling. Although at theyounger end of the age distribution, students in England, NewZealand, and Scotland were in their fifth year of schooling. Onaverage, students in most countries were 10 years old (aged from10.0 to 10.9 years). Students in some countries were slightlyyounger (from 9.7 to 9.9 years), including Italy, Scotland, Greece,Iceland, Slovenia, Cyprus, Kuwait, and Belize; in several othersstudents were slightly older (from 11.0 to 11.2 years old), includ-ing Latvia, Romania, and Morocco.
PIRLS found substantial differences in performanceacross and within countries. As graphically represented in
Exhibit 1.1, performance generally differed very little between one country
chapter 1: international student achievement in reading
1 PIRLS used item response theory (IRT) methods to summarize the achievement results on a scale with a mean of 500 (international average)and a standard deviation of 100. Given the matrix-sampling approach, scaling averages students’ responses in a way that accounts for differ-ences in the difficulty of different subsets of items. It allows students’ performance to be summarized on a common metric even though indi-vidual students responded to different items in the reading test. For more detailed information, see the “IRT Scaling and Data Analysis”section of Appendix A.
2 For a description of educational systems and reading literacy curricula in the PIRLS countries, see Mullis, I.V.S., Martin, M.O., Kennedy, A.M.,& Flaherty, C.L. (Eds.). (2002). PIRLS 2001 encyclopedia: A reference guide to reading education in the countries participating in IEA’s Progressin International Reading Literacy Study (PIRLS). Chestnut Hill, MA: Boston College.
[25]chapter 1: international student achievement in reading
and the next higher- or lower-performing country, but the range in perform-ance across the 35 countries was very large. Across countries, achievement inreading literacy ranged from an average of 561 for Sweden to 327 for Belize. Thedark boxes at the midpoints of the distributionsshow the 95 percent confidence intervals aroundthe average achievement in each country.3
Achievement for each country is shownfor the 25th and 75th percentiles as well as for the5th and 95th percentiles.4 Each percentile pointindicates the percentages of students performingbelow and above that point on the scale. Forexample, 25 percent of the fourth-grade students in each country performedbelow the 25th percentile for that country, and 75 percent performed abovethe 25th percentile. The range between the 25th and 75th percentiles repre-sents performance by the middle half of the students. In most countries, therange of performance for the middle group was around 100 scale-score points.In contrast, performance at the 5th and 95th percentiles represents the extremesin both lower and higher achievement. The range of performance betweenthese two score points, which includes 90 percent of the population, was 200to 300 points in most countries – approximately the same as the difference inaverage performance across countries.
Exhibit 1.2 compares overall mean achievement among individualcountries. This figure shows whether or not the differences in average achieve-ment between pairs of countries are statistically significant. Selecting a countryof interest and reading across the table, a triangle pointing up indicates sig-nificantly higher performance than the comparison country listed across thetop; absence of a symbol indicates no significant difference in performance;and a triangle pointing down indicates significantly lower performance.
The data in Exhibit 1.2 further illustrate that, when ordered by averageachievement, adjacent countries often did not significantly differ from each other,although the differences in achievement between the high-performing and low-performing countries were very large. Because of this wide range in perform-
3 See the “IRT Scaling and Data Analysis” section of Appendix A for more details about calculating standard errorsand confidence intervals for the PIRLS statistics.
4 Tables of the percentile values and standard deviations for all countries are presented in Appendix B.
PIRLS found substantialdifferences in performanceacross and within countries.
[26] chapter 1: international student achievement in reading
Exhibit 1.1: Distribution of Reading Achievement
Countries Reading Achievement Scale Score Years of FormalSchooling
AverageAge
Sweden h 561 (2.2) 4 10.8† Netherlands h 554 (2.5) 4 10.3
†2a England h 553 (3.4) 5 10.2
Bulgaria h 550 (3.8) 4 10.9
Latvia h 545 (2.3) 4 11.0
* 1 Canada (O,Q) h 544 (2.4) 4 10.01 Lithuania h 543 (2.6) 4 10.9
Hungary h 543 (2.2) 4 10.7† United States h 542 (3.8) 4 10.2
Italy h 541 (2.4) 4 9.8
Germany h 539 (1.9) 4 10.5
Czech Republic h 537 (2.3) 4 10.5
New Zealand h 529 (3.6) 5 10.1† Scotland h 528 (3.6) 5 9.8
Singapore h 528 (5.2) 4 10.12a Russian Federation h 528 (4.4) 3 or 4 10.3
Hong Kong, SAR h 528 (3.1) 4 10.2
France h 525 (2.4) 4 10.12a Greece h 524 (3.5) 4 9.9
Slovak Republic h 518 (2.8) 4 10.3
Iceland h 512 (1.2) 4 9.7
Romania h 512 (4.6) 4 11.12b Israel h 509 (2.8) 4 10.0
Slovenia 502 (2.0) 3 9.8
International Avg. 500 (0.6) 4 10.3
Norway 499 (2.9) 4 10.0
Cyprus i 494 (3.0) 4 9.7
Moldova, Rep. of i 492 (4.0) 4 10.8
Turkey i 449 (3.5) 4 10.2
Macedonia, Rep. of i 442 (4.6) 4 10.7
Colombia i 422 (4.4) 4 10.5
Argentina i 420 (5.9) 4 10.2
Iran, Islamic Rep. of i 414 (4.2) 4 10.4
Kuwait i 396 (4.3) 4 9.9‡ Morocco i 350 (9.6) 4 11.2
Belize i 327 (4.7) 4 9.8
* Ontario (Canada) h 548 (3.3) 4 9.9
* Quebec (Canada) h 537 (3.0) 4 10.2
AverageScale Score
200 300 400 500 600 700 800
5th 25th 75th 95th
Average and 95% Confidence Interval (±2SE)
Percentiles of Performance
Country average significantly lowerthan international average
Country average significantlyhigher than international average
h
i
* Canada is represented by the provinces of Ontario and Quebec only. The internationalaverage does not include the results from these provinces separately.
† Met guidelines for sample participation rates only after replacement schools were included(see Exhibit A.7).
‡ Nearly satisfying guidelines for sample participation rates after replacement schools wereincluded (see Exhibit A.7).
1 National Desired Population does not cover all of International Desired Population. Becausecoverage falls below 65%, Canada is annotated Canada (O, Q) for the provinces ofOntario and Quebec only.
2a National Defined Population covers less than 95% of National Desired Population (seeExhibit A.4).
2b National Defined Population covers less than 80% of National Desired Population (seeExhibit A.4).
( ) Standard errors appear in parentheses. Because results are rounded to the nearest wholenumber, some totals may appear inconsistent.
SOU
RCE:
IEA
Pro
gres
s in
Inte
rnat
iona
l Rea
ding
Lite
racy
Stu
dy (P
IRLS
) 200
1.
ISC 4th GradePIRLS 2001

[27]chapter 1: international student achievement in reading
Exhibit 1.2: Multiple Comparisons of Average Reading Achievement
SOU
RCE:
IEA
Pro
gres
s in
Inte
rnat
iona
l Rea
ding
Lite
racy
Stu
dy (P
IRLS
) 200
1.
Average achievement significantlyhigher than comparison country
Average achievement significantlylower than comparison country
h
i
Sweden h h h h h h h h h h h h h h h h h h h h h h h h h h h h h h h h h h
Netherlands i h h h h h h h h h h h h h h h h h h h h h h h h h h h h h h h
England i h h h h h h h h h h h h h h h h h h h h h h h h h h h h h h h
Bulgaria i h h h h h h h h h h h h h h h h h h h h h h h h h h
Latvia i i i h h h h h h h h h h h h h h h h h h h h h h h h
* Canada (O,Q) i i i h h h h h h h h h h h h h h h h h h h h h h h h
Lithuania i i i h h h h h h h h h h h h h h h h h h h h h h h
Hungary i i i h h h h h h h h h h h h h h h h h h h h h h h h
United States i i i h h h h h h h h h h h h h h h h h h h h h h h
Italy i i i i h h h h h h h h h h h h h h h h h h h h h h h
Germany i i i i h h h h h h h h h h h h h h h h h h h h h h h
Czech Republic i i i i i i i h h h h h h h h h h h h h h h h h h h h
New Zealand i i i i i i i i i i i h h h h h h h h h h h h h h h h
Scotland i i i i i i i i i i i i h h h h h h h h h h h h h h h h
Singapore i i i i i i i i i i i h h h h h h h h h h h h h h h
Russian Federation i i i i i i i i i i i h h h h h h h h h h h h h h h
Hong Kong, SAR i i i i i i i i i i i i h h h h h h h h h h h h h h h h
France i i i i i i i i i i i i h h h h h h h h h h h h h h h
Greece i i i i i i i i i i i i h h h h h h h h h h h h h h h
Slovak Republic i i i i i i i i i i i i i i i h h h h h h h h h h h h h
Iceland i i i i i i i i i i i i i i i i i i i h h h h h h h h h h h h
Romania i i i i i i i i i i i i i i i i i i i h h h h h h h h h h h h
Israel i i i i i i i i i i i i i i i i i i i i h h h h h h h h h h h h
Slovenia i i i i i i i i i i i i i i i i i i i i i i i h h h h h h h h h h
Norway i i i i i i i i i i i i i i i i i i i i i i i h h h h h h h h
Cyprus i i i i i i i i i i i i i i i i i i i i i i i i h h h h h h h h
Moldova, Rep. of i i i i i i i i i i i i i i i i i i i i i i i i h h h h h h h h
Turkey i i i i i i i i i i i i i i i i i i i i i i i i i i i h h h h h h
Macedonia, Rep. of i i i i i i i i i i i i i i i i i i i i i i i i i i i h h h h h h
Colombia i i i i i i i i i i i i i i i i i i i i i i i i i i i i i h h h
Argentina i i i i i i i i i i i i i i i i i i i i i i i i i i i i i h h h
Iran, Islamic Rep. of i i i i i i i i i i i i i i i i i i i i i i i i i i i i i h h h
Kuwait i i i i i i i i i i i i i i i i i i i i i i i i i i i i i i i i h h
Morocco i i i i i i i i i i i i i i i i i i i i i i i i i i i i i i i i i h
Belize i i i i i i i i i i i i i i i i i i i i i i i i i i i i i i i i i i
* Ontario (Canada) i h h h h h h h h h h h h h h h h h h h h h h h h h
* Quebec (Canada) i i i i i h h h h h h h h h h h h h h h h h h h
Swed
en
Net
her
lan
ds
Eng
lan
d
Bu
lgar
ia
Latv
ia
Can
ada
(O,Q
)
Lith
uan
ia
Hu
ng
ary
Un
ited
Sta
tes
Ital
y
Ger
man
y
Cze
ch R
epu
blic
New
Zea
lan
d
Sco
tlan
d
Sin
gap
ore
Ru
ssia
n F
eder
atio
n
Ho
ng
Ko
ng
, SA
R
Fran
ce
Gre
ece
Slo
vak
Rep
ub
lic
Icel
and
Ro
man
ia
Isra
el
Slo
ven
ia
No
rway
Cyp
rus
Mo
ldo
va, R
ep. o
f
Turk
ey
Mac
edo
nia
, Rep
. of
Co
lom
bia
Arg
enti
na
Iran
, Isl
amic
Rep
. of
Ku
wai
t
Mo
rocc
o
Bel
ize
* Canada is represented by the provinces of Ontario and Quebec only. The international average does not include the results from these provinces separately.
ISC 4th GradePIRLS 2001
Instructions: Read across the row for a country to compare performance with the countries listed along the top of the chart. Thesymbols indicate whether the average achievement of the country in the row is significantly lower than that of the comparison country,significantly higher than that of the comparison country, or if there is no statistically significant difference between the average achieve-ment of the two countries.
[28]
ance, the pattern for a number of countries was one of having lower mean achieve-ment than some countries, about the same mean achievement as other countries,and higher mean achievement than a third group of countries.
Sweden had the highest reading literacyachievement of all the countries participating inPIRLS 2001. The Netherlands and England hadhigher achievement than the rest of the other coun-tries except Bulgaria. Bulgaria was outperformedonly by Sweden and had higher average achieve-ment than many participating countries. Latvia,Canada (O,Q), Lithuania, Hungary, and the UnitedStates also performed well. They had significantlylower average performance than Sweden, The
Netherlands, and England, but performance as high or higher than the remain-ing participants. Italy and Germany also had high average achievement havingbeen outperformed only by four countries – Bulgaria in addition to the three topperformers. The Czech Republic was outperformed by seven countries, but hadsignificantly higher achievement than 20 countries. As a next group, NewZealand, Scotland, Singapore, the Russian Federation, Hong Kong, France, andGreece all performed very similarly, generally having average achievement lowerthan about 10 countries, the same as about 10 countries, and higher than about15 countries. For the remaining countries, there was a pattern of each, in turn,having significantly lower achievement than one or two more countries.
What Are the Gender Differences in Reading LiteracyAchievement?
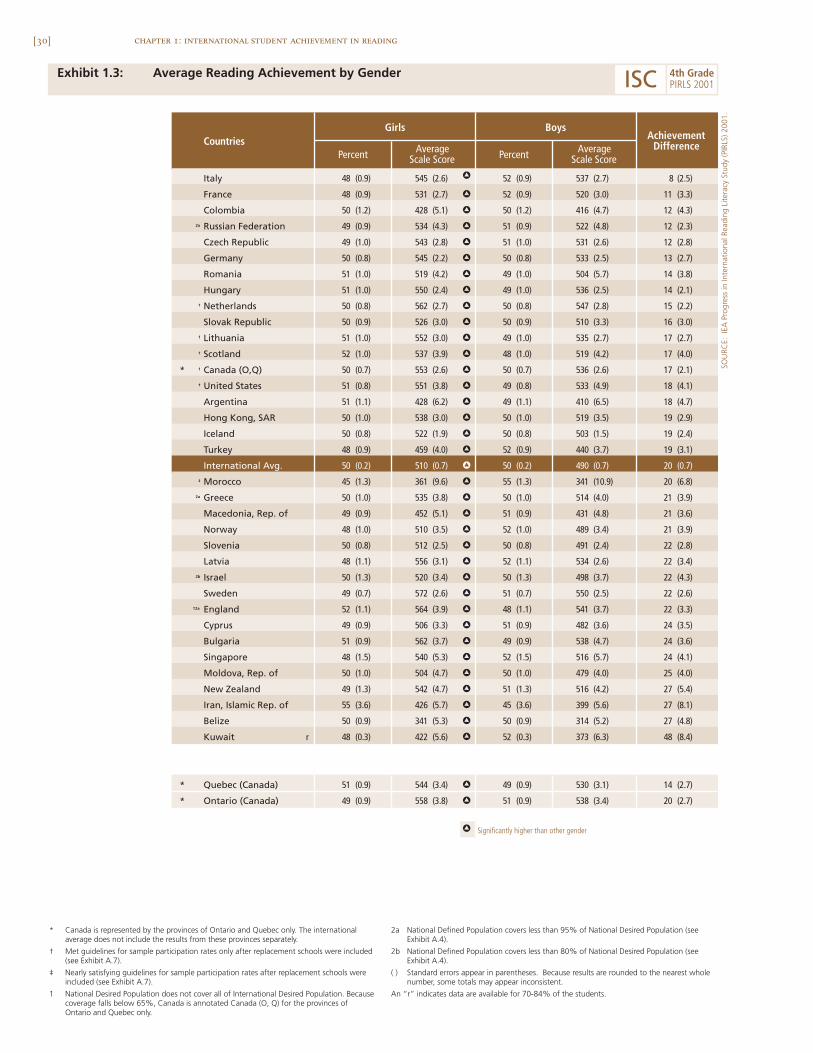
Exhibit 1.3 shows gender differences in fourth-grade students’ reading achieve-ment for each of the participating countries, presenting average achievementseparately for girls and boys as well as the difference between the means.Countries are shown in increasing order of this gender difference. The genderdifference for each country is shown by a bar, indicating the amount of thedifference, whether the direction of the difference favored girls or boys, andwhether the difference is statistically significant (indicated by the bar being
chapter 1: international student achievement in reading
Sweden had the highestreading literacy achievement
of all the countriesparticipating in PIRLS 2001.
[29]chapter 1: international student achievement in reading
darkened). In all countries, girls had significantly higher achievementthan boys. Italy had an 8-point difference and all other countries had dif-ferences of 11 points or more. The international average was 20 points.Countries with a difference of 25 points or more included Moldova (25points), New Zealand, Iran, and Belize (27 points), and Kuwait (48 points).
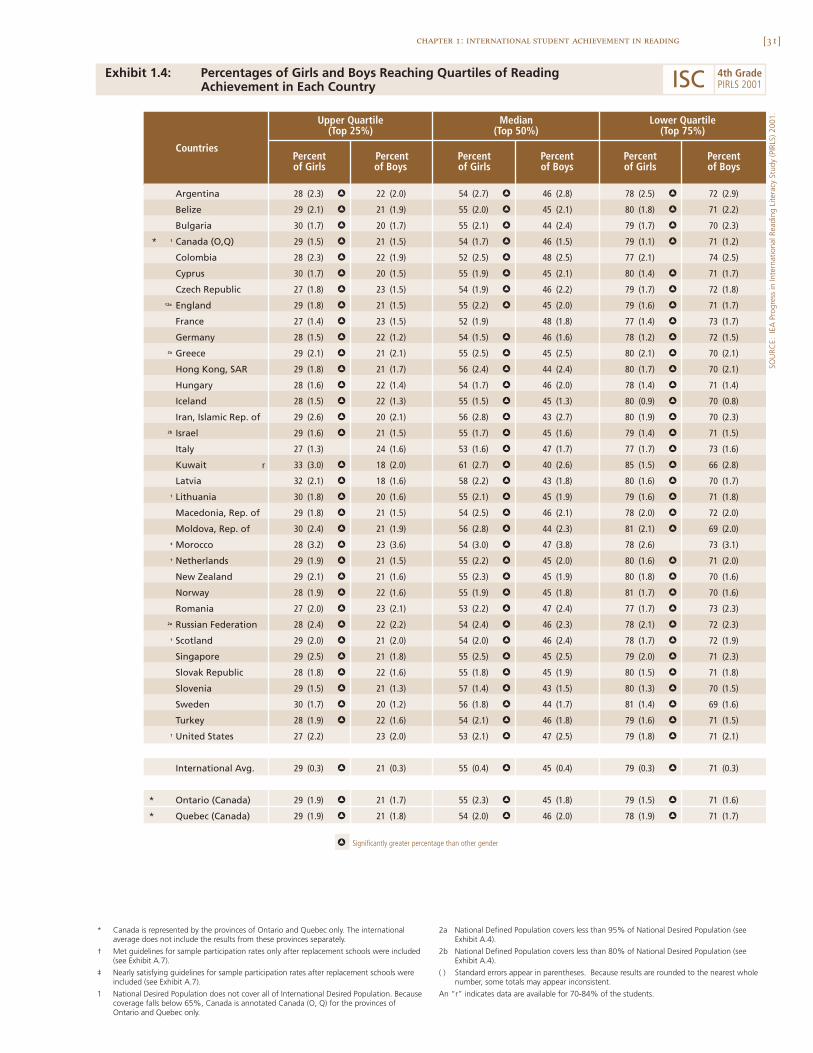
Exhibit 1.4 provides information on gender differences in readingachievement among students with high performance compared to thosein the middle of the achievement distribution. For each country, scorelevels were computed for the highest-scoring 25 percent of students, calledthe upper quartile; for the top-scoring 50 percent of students, called themedian (or top half) level; and for the top-scoring 75 percent, comprisingstudents reaching the lower quartile and higher. The percentages of girlsand boys in each country reaching each of the three levels were computed.For equitable performance, 25 percent each of girls and boys should havereached the upper quartile, 50 percent each the median level, and 75percent each the lower quartile.
On average, across countries, significantly more girlsthan boys reached each quartile of their country’s achievementdistribution. More specifically, 29 percent of girls comparedwith 21 percent of boys reached the upper quartile, 55 percentcompared with 45 percent reached the median level, and 79percent compared with 71 percent reached the lower quartile. Bysubtraction, it can be determined that fewer boys (8 percent,on average) than girls reach the lowest quartile of achievement,and that 29 percent of boys are below the lowest quartile com-pared to 21 percent of girls. Statistically significant gender dif-ferences favoring girls at each quartile were consistent acrosscountries, with only a few exceptions (Italy and the UnitedStates at the upper quartile, France at the median level, andColombia and Morocco at the lower quartile).
[30] chapter 1: international student achievement in reading
Exhibit 1.3: Average Reading Achievement by Gender
Italy 48 (0.9) 545 (2.6) h 52 (0.9) 537 (2.7) 8 (2.5)
France 48 (0.9) 531 (2.7) h 52 (0.9) 520 (3.0) 11 (3.3)
Colombia 50 (1.2) 428 (5.1) h 50 (1.2) 416 (4.7) 12 (4.3)2a Russian Federation 49 (0.9) 534 (4.3) h 51 (0.9) 522 (4.8) 12 (2.3)
Czech Republic 49 (1.0) 543 (2.8) h 51 (1.0) 531 (2.6) 12 (2.8)
Germany 50 (0.8) 545 (2.2) h 50 (0.8) 533 (2.5) 13 (2.7)
Romania 51 (1.0) 519 (4.2) h 49 (1.0) 504 (5.7) 14 (3.8)
Hungary 51 (1.0) 550 (2.4) h 49 (1.0) 536 (2.5) 14 (2.1)† Netherlands 50 (0.8) 562 (2.7) h 50 (0.8) 547 (2.8) 15 (2.2)
Slovak Republic 50 (0.9) 526 (3.0) h 50 (0.9) 510 (3.3) 16 (3.0)1 Lithuania 51 (1.0) 552 (3.0) h 49 (1.0) 535 (2.7) 17 (2.7)† Scotland 52 (1.0) 537 (3.9) h 48 (1.0) 519 (4.2) 17 (4.0)
* 1 Canada (O,Q) 50 (0.7) 553 (2.6) h 50 (0.7) 536 (2.6) 17 (2.1)† United States 51 (0.8) 551 (3.8) h 49 (0.8) 533 (4.9) 18 (4.1)
Argentina 51 (1.1) 428 (6.2) h 49 (1.1) 410 (6.5) 18 (4.7)
Hong Kong, SAR 50 (1.0) 538 (3.0) h 50 (1.0) 519 (3.5) 19 (2.9)
Iceland 50 (0.8) 522 (1.9) h 50 (0.8) 503 (1.5) 19 (2.4)
Turkey 48 (0.9) 459 (4.0) h 52 (0.9) 440 (3.7) 19 (3.1)
International Avg. 50 (0.2) 510 (0.7) h 50 (0.2) 490 (0.7) 20 (0.7)‡ Morocco 45 (1.3) 361 (9.6) h 55 (1.3) 341 (10.9) 20 (6.8)
2a Greece 50 (1.0) 535 (3.8) h 50 (1.0) 514 (4.0) 21 (3.9)
Macedonia, Rep. of 49 (0.9) 452 (5.1) h 51 (0.9) 431 (4.8) 21 (3.6)
Norway 48 (1.0) 510 (3.5) h 52 (1.0) 489 (3.4) 21 (3.9)
Slovenia 50 (0.8) 512 (2.5) h 50 (0.8) 491 (2.4) 22 (2.8)
Latvia 48 (1.1) 556 (3.1) h 52 (1.1) 534 (2.6) 22 (3.4)2b Israel 50 (1.3) 520 (3.4) h 50 (1.3) 498 (3.7) 22 (4.3)
Sweden 49 (0.7) 572 (2.6) h 51 (0.7) 550 (2.5) 22 (2.6)†2a England 52 (1.1) 564 (3.9) h 48 (1.1) 541 (3.7) 22 (3.3)
Cyprus 49 (0.9) 506 (3.3) h 51 (0.9) 482 (3.6) 24 (3.5)
Bulgaria 51 (0.9) 562 (3.7) h 49 (0.9) 538 (4.7) 24 (3.6)
Singapore 48 (1.5) 540 (5.3) h 52 (1.5) 516 (5.7) 24 (4.1)
Moldova, Rep. of 50 (1.0) 504 (4.7) h 50 (1.0) 479 (4.0) 25 (4.0)
New Zealand 49 (1.3) 542 (4.7) h 51 (1.3) 516 (4.2) 27 (5.4)
Iran, Islamic Rep. of 55 (3.6) 426 (5.7) h 45 (3.6) 399 (5.6) 27 (8.1)
Belize 50 (0.9) 341 (5.3) h 50 (0.9) 314 (5.2) 27 (4.8)
Kuwait r 48 (0.3) 422 (5.6) h 52 (0.3) 373 (6.3) 48 (8.4)
* Quebec (Canada) 51 (0.9) 544 (3.4) h 49 (0.9) 530 (3.1) 14 (2.7)
* Ontario (Canada) 49 (0.9) 558 (3.8) h 51 (0.9) 538 (3.4) 20 (2.7)
h Significantly higher than other gender
Girls
Percent AverageScale Score
BoysCountries Achievement
DifferenceAverageScale Score Percent
* Canada is represented by the provinces of Ontario and Quebec only. The internationalaverage does not include the results from these provinces separately.
† Met guidelines for sample participation rates only after replacement schools were included(see Exhibit A.7).
‡ Nearly satisfying guidelines for sample participation rates after replacement schools wereincluded (see Exhibit A.7).
1 National Desired Population does not cover all of International Desired Population. Becausecoverage falls below 65%, Canada is annotated Canada (O, Q) for the provinces ofOntario and Quebec only.
2a National Defined Population covers less than 95% of National Desired Population (seeExhibit A.4).
2b National Defined Population covers less than 80% of National Desired Population (seeExhibit A.4).
( ) Standard errors appear in parentheses. Because results are rounded to the nearest wholenumber, some totals may appear inconsistent.
An “r” indicates data are available for 70-84% of the students.
SOU
RCE:
IEA
Pro
gres
s in
Inte
rnat
iona
l Rea
ding
Lite
racy
Stu
dy (P
IRLS
) 200
1.
ISC 4th GradePIRLS 2001
[31]chapter 1: international student achievement in reading
Exhibit 1.4: Percentages of Girls and Boys Reaching Quartiles of ReadingAchievement in Each Country
SOU
RCE:
IEA
Pro
gres
s in
Inte
rnat
iona
l Rea
ding
Lite
racy
Stu
dy (P
IRLS
) 200
1.
Argentina 28 (2.3) h 22 (2.0) 54 (2.7) h 46 (2.8) 78 (2.5) h 72 (2.9)
Belize 29 (2.1) h 21 (1.9) 55 (2.0) h 45 (2.1) 80 (1.8) h 71 (2.2)
Bulgaria 30 (1.7) h 20 (1.7) 55 (2.1) h 44 (2.4) 79 (1.7) h 70 (2.3)
* 1 Canada (O,Q) 29 (1.5) h 21 (1.5) 54 (1.7) h 46 (1.5) 79 (1.1) h 71 (1.2)
Colombia 28 (2.3) h 22 (1.9) 52 (2.5) h 48 (2.5) 77 (2.1) 74 (2.5)
Cyprus 30 (1.7) h 20 (1.5) 55 (1.9) h 45 (2.1) 80 (1.4) h 71 (1.7)
Czech Republic 27 (1.8) h 23 (1.5) 54 (1.9) h 46 (2.2) 79 (1.7) h 72 (1.8)†2a England 29 (1.8) h 21 (1.5) 55 (2.2) h 45 (2.0) 79 (1.6) h 71 (1.7)
France 27 (1.4) h 23 (1.5) 52 (1.9) 48 (1.8) 77 (1.4) h 73 (1.7)
Germany 28 (1.5) h 22 (1.2) 54 (1.5) h 46 (1.6) 78 (1.2) h 72 (1.5)2a Greece 29 (2.1) h 21 (2.1) 55 (2.5) h 45 (2.5) 80 (2.1) h 70 (2.1)
Hong Kong, SAR 29 (1.8) h 21 (1.7) 56 (2.4) h 44 (2.4) 80 (1.7) h 70 (2.1)
Hungary 28 (1.6) h 22 (1.4) 54 (1.7) h 46 (2.0) 78 (1.4) h 71 (1.4)
Iceland 28 (1.5) h 22 (1.3) 55 (1.5) h 45 (1.3) 80 (0.9) h 70 (0.8)
Iran, Islamic Rep. of 29 (2.6) h 20 (2.1) 56 (2.8) h 43 (2.7) 80 (1.9) h 70 (2.3)2b Israel 29 (1.6) h 21 (1.5) 55 (1.7) h 45 (1.6) 79 (1.4) h 71 (1.5)
Italy 27 (1.3) 24 (1.6) 53 (1.6) h 47 (1.7) 77 (1.7) h 73 (1.6)
Kuwait 33 (3.0) h 18 (2.0) 61 (2.7) h 40 (2.6) 85 (1.5) h 66 (2.8)
Latvia 32 (2.1) h 18 (1.6) 58 (2.2) h 43 (1.8) 80 (1.6) h 70 (1.7)1 Lithuania 30 (1.8) h 20 (1.6) 55 (2.1) h 45 (1.9) 79 (1.6) h 71 (1.8)
Macedonia, Rep. of 29 (1.8) h 21 (1.5) 54 (2.5) h 46 (2.1) 78 (2.0) h 72 (2.0)
Moldova, Rep. of 30 (2.4) h 21 (1.9) 56 (2.8) h 44 (2.3) 81 (2.1) h 69 (2.0)‡ Morocco 28 (3.2) h 23 (3.6) 54 (3.0) h 47 (3.8) 78 (2.6) 73 (3.1)† Netherlands 29 (1.9) h 21 (1.5) 55 (2.2) h 45 (2.0) 80 (1.6) h 71 (2.0)
New Zealand 29 (2.1) h 21 (1.6) 55 (2.3) h 45 (1.9) 80 (1.8) h 70 (1.6)
Norway 28 (1.9) h 22 (1.6) 55 (1.9) h 45 (1.8) 81 (1.7) h 70 (1.6)
Romania 27 (2.0) h 23 (2.1) 53 (2.2) h 47 (2.4) 77 (1.7) h 73 (2.3)2a Russian Federation 28 (2.4) h 22 (2.2) 54 (2.4) h 46 (2.3) 78 (2.1) h 72 (2.3)
† Scotland 29 (2.0) h 21 (2.0) 54 (2.0) h 46 (2.4) 78 (1.7) h 72 (1.9)
Singapore 29 (2.5) h 21 (1.8) 55 (2.5) h 45 (2.5) 79 (2.0) h 71 (2.3)
Slovak Republic 28 (1.8) h 22 (1.6) 55 (1.8) h 45 (1.9) 80 (1.5) h 71 (1.8)
Slovenia 29 (1.5) h 21 (1.3) 57 (1.4) h 43 (1.5) 80 (1.3) h 70 (1.5)
Sweden 30 (1.7) h 20 (1.2) 56 (1.8) h 44 (1.7) 81 (1.4) h 69 (1.6)
Turkey 28 (1.9) h 22 (1.6) 54 (2.1) h 46 (1.8) 79 (1.6) h 71 (1.5)† United States 27 (2.2) 23 (2.0) 53 (2.1) h 47 (2.5) 79 (1.8) h 71 (2.1)
International Avg. 29 (0.3) h 21 (0.3) 55 (0.4) h 45 (0.4) 79 (0.3) h 71 (0.3)
* Ontario (Canada) 29 (1.9) h 21 (1.7) 55 (2.3) h 45 (1.8) 79 (1.5) h 71 (1.6)
* Quebec (Canada) 29 (1.9) h 21 (1.8) 54 (2.0) h 46 (2.0) 78 (1.9) h 71 (1.7)
h Significantly greater percentage than other gender
Lower Quartile(Top 75%)
Percentof Girls
Percentof Boys
Countries
Upper Quartile(Top 25%)
Median(Top 50%)
Percentof Girls
Percentof Boys
Percentof Girls
Percentof Boys
r
* Canada is represented by the provinces of Ontario and Quebec only. The internationalaverage does not include the results from these provinces separately.
† Met guidelines for sample participation rates only after replacement schools were included(see Exhibit A.7).
‡ Nearly satisfying guidelines for sample participation rates after replacement schools wereincluded (see Exhibit A.7).
1 National Desired Population does not cover all of International Desired Population. Becausecoverage falls below 65%, Canada is annotated Canada (O, Q) for the provinces ofOntario and Quebec only.
2a National Defined Population covers less than 95% of National Desired Population (seeExhibit A.4).
2b National Defined Population covers less than 80% of National Desired Population (seeExhibit A.4).
( ) Standard errors appear in parentheses. Because results are rounded to the nearest wholenumber, some totals may appear inconsistent.
An “r” indicates data are available for 70-84% of the students.
ISC 4th GradePIRLS 2001

2

[33]
Chapter 2Achievement in Readingfor Literary Experienceand Reading To Acquireand Use Information
For PIRLS, reading literacy is defined as:
the ability to understand and use those written
language forms required by society and/or
valued by the individual. Young readers can
construct meaning from a variety of texts. They
read to learn, to participate in communities
of readers, and for enjoyment.
[34]
Based on this definition, purposes for reading and processes of comprehen-sion formed the foundation for the PIRLS written assessment and students’attitudes and reading habits were addressed through questionnaires.
Chapter 2 presents results by the two overarching purposes for readingassessed by PIRLS:
• reading for literary experience, and
• reading to acquire and use information.1
Essentially, the PIRLS assessment was designed so that half the pas-sages, time, and questions tested reading for literary purposes and half testedfor informational purposes. The comprehension processes were assessed withineach purpose (see Chapter 3). In literary reading, the reader becomes involvedin imagined events, settings, actions, consequences, characters, atmospheres,feelings, and ideas; bringing his or her own experiences, feelings, apprecia-tion of language, and knowledge of literary forms to the text. In reading forinformation, the reader engages not with imagined worlds, but with aspects ofthe real universe. Through informational texts, one can understand how theworld is and has been, and why things work as they do. These texts take manyforms, but one major distinction is between chronological and non-chrono-logical organization.
Each of these purposes for reading is often associated with certaintypes of texts. For example, reading for literary experience is often accom-plished through reading fiction, while reading to acquire and use information
is generally associated with informative articlesand instructional texts. The early reading of mostyoung children centers on literary and narrativetext types. In addition, many young readers alsoenjoy acquiring information from books and othertypes of reading material. This kind of readingbecomes more important as students develop theirliteracy abilities, and is increasingly required inorder to learn across the curriculum.
chapter 2: achievement in reading for literary experience and reading to acquire and use information
1 For a full description see Campbell, J.R., Kelly, D.L., Mullis, I.V.S., Martin, M.O., & Sainsbury, M. (2001). Framework and specifications forPIRLS assessment 2001 (2nd ed.). Chestnut Hill, MA: Boston College.
The texts were selected from sources typical of those
available to students in andout of school.
[35]chapter 2: achievement in reading for literary experience and reading to acquire and use information
In PIRLS, the assessment contained an equal proportion of materialassessing each purpose. The literary texts were narrative fiction in the formof short stories. The informational texts represented a variety of chronologicaland non-chronological texts. The texts, submitted by andexhaustively reviewed by the participating countries, wereselected from sources typical of those available to students inand out of school. Three of the texts accompany this report in theback pocket, a fourth text is available in Appendix C, andexample items are presented in Chapter 3.
How Does Achievement Differ Across ReadingLiteracy Purposes?
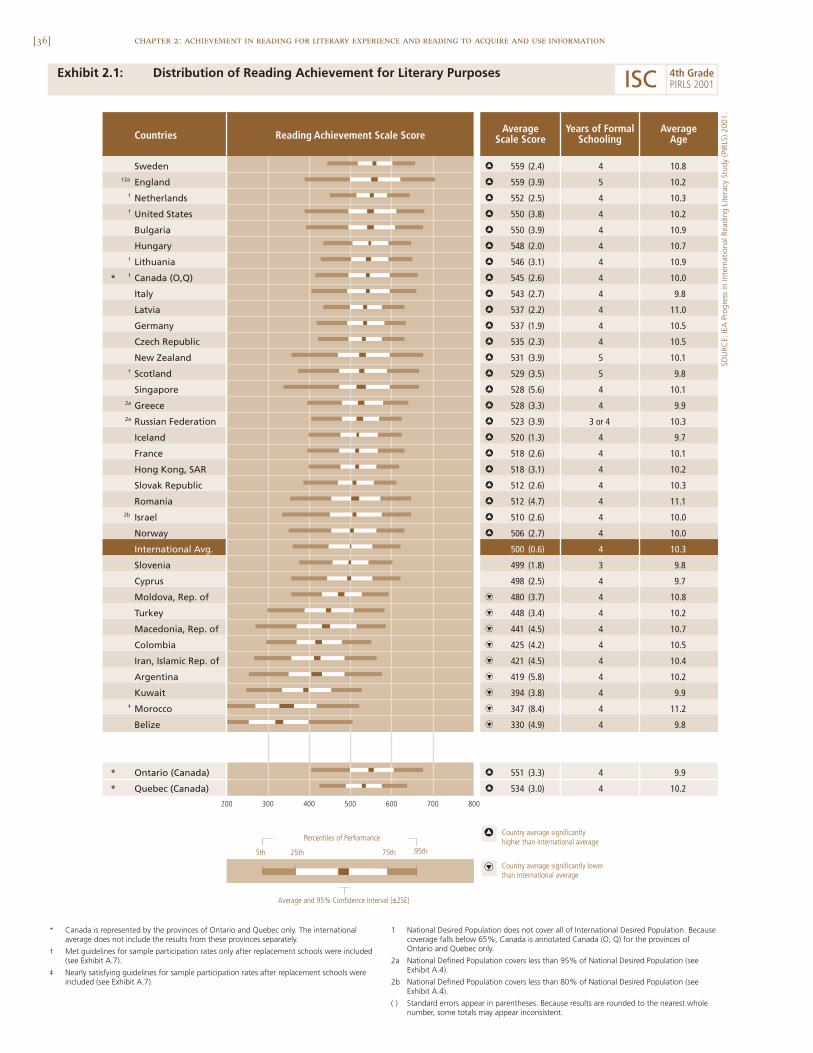
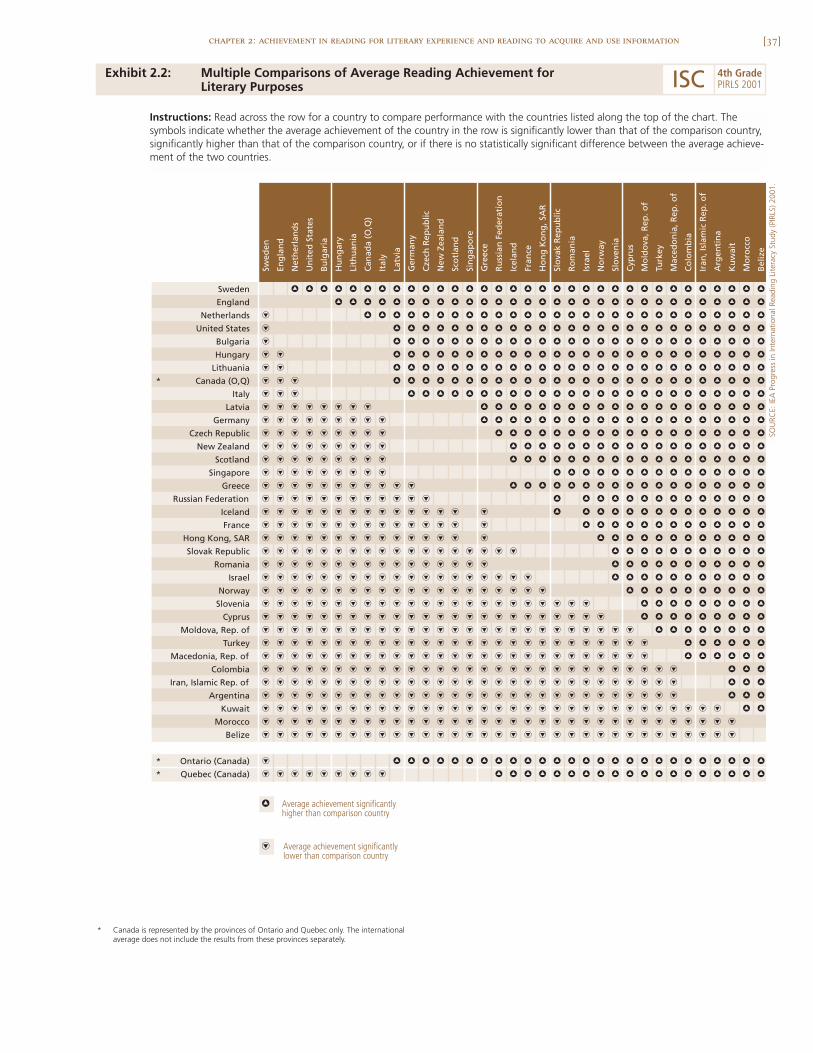
Performance in reading for literary purposes is presented foreach of the participating countries in Exhibits 2.1 and 2.2. Theseexhibits, respectively, present the distributions of studentachievement in reading for literary purposes and the compar-isons in mean achievement among pairs of individual countries.Exhibits 2.3 and 2.4 contain the corresponding data for student achievementin reading for informational purposes.
Exhibits 2.1 and 2.3 for literary and informational purposes are graph-ically consistent with the display of distributions in overall reading achieve-ment (Exhibit 1.1). For each of the two major reading purposes, countries areshown in decreasing order of average achievement, together with an indica-tion of whether the country average is significantly higher or lower than theinternational average. To allow comparison of the relative performance of eachcountry for each purpose, the international average for each purpose wasscaled to be 500, the same as the overall international average.
The range in performance across the participating countries was nearlyidentical for the two purposes (229 scale-score points for literary compared to227 for informational), and approximately the same number of countries per-formed significantly above and below the international average. In reading forliterary purposes, 24 countries performed above the international average, 2similar to it, and 9 below it. In reading for informational purposes, 23 countries
[36] chapter 2: achievement in reading for literary experience and reading to acquire and use information
Exhibit 2.1: Distribution of Reading Achievement for Literary Purposes
Countries Reading Achievement Scale ScoreYears of Formal
SchoolingAverage
Age
Sweden h 559 (2.4) 4 10.8†2a England h 559 (3.9) 5 10.2
† Netherlands h 552 (2.5) 4 10.3† United States h 550 (3.8) 4 10.2
Bulgaria h 550 (3.9) 4 10.9
Hungary h 548 (2.0) 4 10.71 Lithuania h 546 (3.1) 4 10.9
* 1 Canada (O,Q) h 545 (2.6) 4 10.0
Italy h 543 (2.7) 4 9.8
Latvia h 537 (2.2) 4 11.0
Germany h 537 (1.9) 4 10.5
Czech Republic h 535 (2.3) 4 10.5
New Zealand h 531 (3.9) 5 10.1† Scotland h 529 (3.5) 5 9.8
Singapore h 528 (5.6) 4 10.12a Greece h 528 (3.3) 4 9.92a Russian Federation h 523 (3.9) 3 or 4 10.3
Iceland h 520 (1.3) 4 9.7
France h 518 (2.6) 4 10.1
Hong Kong, SAR h 518 (3.1) 4 10.2
Slovak Republic h 512 (2.6) 4 10.3
Romania h 512 (4.7) 4 11.12b Israel h 510 (2.6) 4 10.0
Norway h 506 (2.7) 4 10.0
International Avg. 500 (0.6) 4 10.3
Slovenia 499 (1.8) 3 9.8
Cyprus 498 (2.5) 4 9.7
Moldova, Rep. of i 480 (3.7) 4 10.8
Turkey i 448 (3.4) 4 10.2
Macedonia, Rep. of i 441 (4.5) 4 10.7
Colombia i 425 (4.2) 4 10.5
Iran, Islamic Rep. of i 421 (4.5) 4 10.4
Argentina i 419 (5.8) 4 10.2
Kuwait i 394 (3.8) 4 9.9‡ Morocco i 347 (8.4) 4 11.2
Belize i 330 (4.9) 4 9.8
* Ontario (Canada) h 551 (3.3) 4 9.9
* Quebec (Canada) h 534 (3.0) 4 10.2
AverageScale Score
200 300 400 500 600 700 800
5th 25th 75th 95th
Average and 95% Confidence Interval (±2SE)
Percentiles of Performance
Country average significantly lowerthan international average
Country average significantlyhigher than international average
h
i
* Canada is represented by the provinces of Ontario and Quebec only. The internationalaverage does not include the results from these provinces separately.
† Met guidelines for sample participation rates only after replacement schools were included(see Exhibit A.7).
‡ Nearly satisfying guidelines for sample participation rates after replacement schools wereincluded (see Exhibit A.7).
1 National Desired Population does not cover all of International Desired Population. Becausecoverage falls below 65%, Canada is annotated Canada (O, Q) for the provinces ofOntario and Quebec only.
2a National Defined Population covers less than 95% of National Desired Population (seeExhibit A.4).
2b National Defined Population covers less than 80% of National Desired Population (seeExhibit A.4).
( ) Standard errors appear in parentheses. Because results are rounded to the nearest wholenumber, some totals may appear inconsistent.
SOU
RCE:
IEA
Pro
gres
s in
Inte
rnat
iona
l Rea
ding
Lite
racy
Stu
dy (P
IRLS
) 200
1.
ISC 4th GradePIRLS 2001
[37]chapter 2: achievement in reading for literary experience and reading to acquire and use information
Exhibit 2.2: Multiple Comparisons of Average Reading Achievement forLiterary Purposes
SOU
RCE:
IEA
Pro
gres
s in
Inte
rnat
iona
l Rea
ding
Lite
racy
Stu
dy (P
IRLS
) 200
1.
Average achievement significantlyhigher than comparison country
Average achievement significantlylower than comparison country
h
i
Sweden h h h h h h h h h h h h h h h h h h h h h h h h h h h h h h h h h
England h h h h h h h h h h h h h h h h h h h h h h h h h h h h h h
Netherlands i h h h h h h h h h h h h h h h h h h h h h h h h h h h h
United States i h h h h h h h h h h h h h h h h h h h h h h h h h h
Bulgaria i h h h h h h h h h h h h h h h h h h h h h h h h h h
Hungary i i h h h h h h h h h h h h h h h h h h h h h h h h h h
Lithuania i i h h h h h h h h h h h h h h h h h h h h h h h h h h
* Canada (O,Q) i i i h h h h h h h h h h h h h h h h h h h h h h h h h h
Italy i i i h h h h h h h h h h h h h h h h h h h h h h h h h
Latvia i i i i i i i i h h h h h h h h h h h h h h h h h h h h
Germany i i i i i i i i i h h h h h h h h h h h h h h h h h h h h
Czech Republic i i i i i i i i i h h h h h h h h h h h h h h h h h h h
New Zealand i i i i i i i i i h h h h h h h h h h h h h h h h h h
Scotland i i i i i i i i i h h h h h h h h h h h h h h h h h h
Singapore i i i i i i i i i h h h h h h h h h h h h h h h
Greece i i i i i i i i i i i h h h h h h h h h h h h h h h h h h
Russian Federation i i i i i i i i i i i i h h h h h h h h h h h h h h
Iceland i i i i i i i i i i i i i i i h h h h h h h h h h h h h h
France i i i i i i i i i i i i i i i h h h h h h h h h h h h h
Hong Kong, SAR i i i i i i i i i i i i i i i h h h h h h h h h h h h
Slovak Republic i i i i i i i i i i i i i i i i i i h h h h h h h h h h h
Romania i i i i i i i i i i i i i i i i h h h h h h h h h h h
Israel i i i i i i i i i i i i i i i i i i i h h h h h h h h h h h
Norway i i i i i i i i i i i i i i i i i i i i h h h h h h h h h h
Slovenia i i i i i i i i i i i i i i i i i i i i i i i h h h h h h h h h
Cyprus i i i i i i i i i i i i i i i i i i i i i i i i h h h h h h h h h
Moldova, Rep. of i i i i i i i i i i i i i i i i i i i i i i i i i i h h h h h h h h
Turkey i i i i i i i i i i i i i i i i i i i i i i i i i i i h h h h h h
Macedonia, Rep. of i i i i i i i i i i i i i i i i i i i i i i i i i i i h h h h h h
Colombia i i i i i i i i i i i i i i i i i i i i i i i i i i i i i h h h
Iran, Islamic Rep. of i i i i i i i i i i i i i i i i i i i i i i i i i i i i i h h h
Argentina i i i i i i i i i i i i i i i i i i i i i i i i i i i i i h h h
Kuwait i i i i i i i i i i i i i i i i i i i i i i i i i i i i i i i i h h
Morocco i i i i i i i i i i i i i i i i i i i i i i i i i i i i i i i i i
Belize i i i i i i i i i i i i i i i i i i i i i i i i i i i i i i i i i
* Ontario (Canada) i h h h h h h h h h h h h h h h h h h h h h h h h h h
* Quebec (Canada) i i i i i i i i i h h h h h h h h h h h h h h h h h h h
Bel
ize
Swed
en
Eng
lan
d
Net
her
lan
ds
Un
ited
Sta
tes
Bu
lgar
ia
Hu
ng
ary
Lith
uan
ia
Can
ada
(O,Q
)
Ital
y
Latv
ia
Ger
man
y
Cze
ch R
epu
blic
New
Zea
lan
d
Sco
tlan
d
Sin
gap
ore
Gre
ece
Ru
ssia
n F
eder
atio
n
Icel
and
Fran
ce
Ho
ng
Ko
ng
, SA
R
Slo
vak
Rep
ub
lic
Ro
man
ia
Isra
el
No
rway
Slo
ven
ia
Cyp
rus
Mo
ldo
va, R
ep. o
f
Turk
ey
Mac
edo
nia
, Rep
. of
Co
lom
bia
Iran
, Isl
amic
Rep
. of
Arg
enti
na
Ku
wai
t
Mo
rocc
o
* Canada is represented by the provinces of Ontario and Quebec only. The internationalaverage does not include the results from these provinces separately.
ISC 4th GradePIRLS 2001
Instructions: Read across the row for a country to compare performance with the countries listed along the top of the chart. Thesymbols indicate whether the average achievement of the country in the row is significantly lower than that of the comparison country,significantly higher than that of the comparison country, or if there is no statistically significant difference between the average achieve-ment of the two countries.
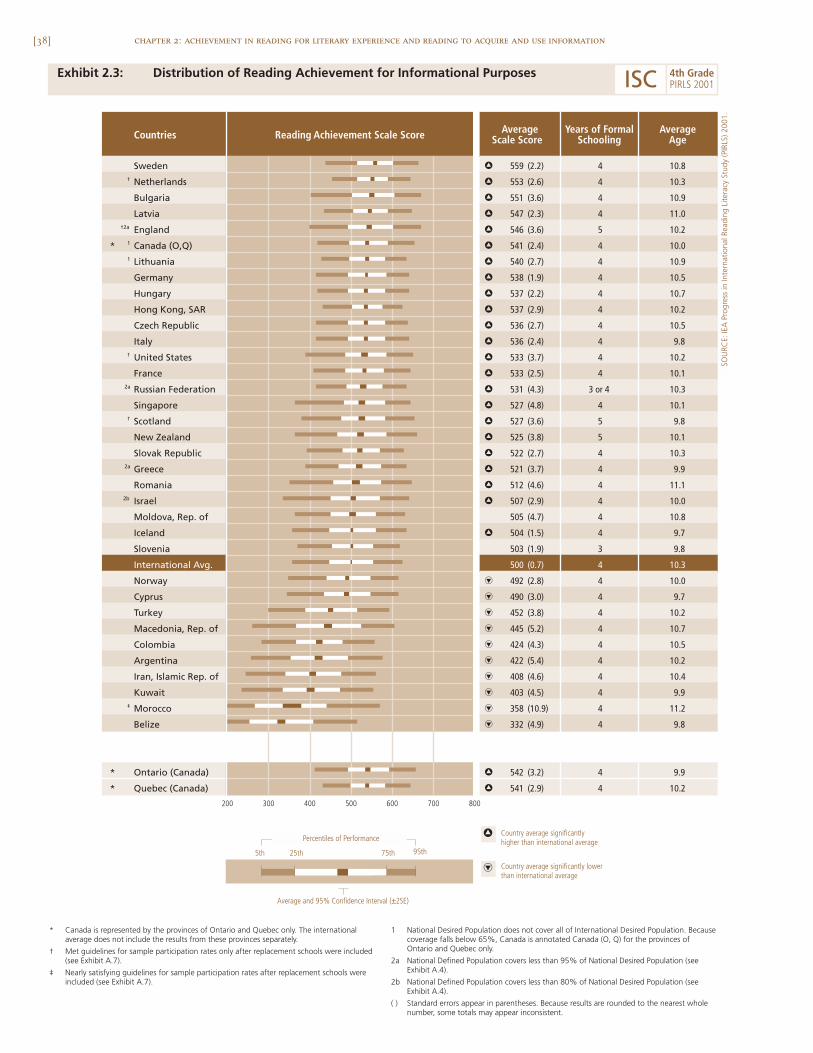
[38] chapter 2: achievement in reading for literary experience and reading to acquire and use information
Exhibit 2.3: Distribution of Reading Achievement for Informational Purposes
Countries Reading Achievement Scale Score Years of FormalSchooling
AverageAge
Sweden h 559 (2.2) 4 10.8† Netherlands h 553 (2.6) 4 10.3
Bulgaria h 551 (3.6) 4 10.9
Latvia h 547 (2.3) 4 11.0†2a England h 546 (3.6) 5 10.2
* 1 Canada (O,Q) h 541 (2.4) 4 10.01 Lithuania h 540 (2.7) 4 10.9
Germany h 538 (1.9) 4 10.5
Hungary h 537 (2.2) 4 10.7
Hong Kong, SAR h 537 (2.9) 4 10.2
Czech Republic h 536 (2.7) 4 10.5
Italy h 536 (2.4) 4 9.8† United States h 533 (3.7) 4 10.2
France h 533 (2.5) 4 10.12a Russian Federation h 531 (4.3) 3 or 4 10.3
Singapore h 527 (4.8) 4 10.1† Scotland h 527 (3.6) 5 9.8
New Zealand h 525 (3.8) 5 10.1
Slovak Republic h 522 (2.7) 4 10.32a Greece h 521 (3.7) 4 9.9
Romania h 512 (4.6) 4 11.12b Israel h 507 (2.9) 4 10.0
Moldova, Rep. of 505 (4.7) 4 10.8
Iceland h 504 (1.5) 4 9.7
Slovenia 503 (1.9) 3 9.8
International Avg. 500 (0.7) 4 10.3
Norway i 492 (2.8) 4 10.0
Cyprus i 490 (3.0) 4 9.7
Turkey i 452 (3.8) 4 10.2
Macedonia, Rep. of i 445 (5.2) 4 10.7
Colombia i 424 (4.3) 4 10.5
Argentina i 422 (5.4) 4 10.2
Iran, Islamic Rep. of i 408 (4.6) 4 10.4
Kuwait i 403 (4.5) 4 9.9‡ Morocco i 358 (10.9) 4 11.2
Belize i 332 (4.9) 4 9.8
* Ontario (Canada) h 542 (3.2) 4 9.9
* Quebec (Canada) h 541 (2.9) 4 10.2
AverageScale Score
200 300 400 500 600 700 800
5th 25th 75th 95th
Average and 95% Confidence Interval (±2SE)
Percentiles of Performance
Country average significantly lowerthan international average
Country average significantlyhigher than international average
h
i
* Canada is represented by the provinces of Ontario and Quebec only. The internationalaverage does not include the results from these provinces separately.
† Met guidelines for sample participation rates only after replacement schools were included(see Exhibit A.7).
‡ Nearly satisfying guidelines for sample participation rates after replacement schools wereincluded (see Exhibit A.7).
1 National Desired Population does not cover all of International Desired Population. Becausecoverage falls below 65%, Canada is annotated Canada (O, Q) for the provinces ofOntario and Quebec only.
2a National Defined Population covers less than 95% of National Desired Population (seeExhibit A.4).
2b National Defined Population covers less than 80% of National Desired Population (seeExhibit A.4).
( ) Standard errors appear in parentheses. Because results are rounded to the nearest wholenumber, some totals may appear inconsistent.
SOU
RCE:
IEA
Pro
gres
s in
Inte
rnat
iona
l Rea
ding
Lite
racy
Stu
dy (P
IRLS
) 200
1.
ISC 4th GradePIRLS 2001

[39]chapter 2: achievement in reading for literary experience and reading to acquire and use information
Exhibit 2.4: Multiple Comparisons of Average Reading Achievement forInformational Purposes
SOU
RCE:
IEA
Pro
gres
s in
Inte
rnat
iona
l Rea
ding
Lite
racy
Stu
dy (P
IRLS
) 200
1.
Sweden h h h h h h h h h h h h h h h h h h h h h h h h h h h h h h h h
Netherlands h h h h h h h h h h h h h h h h h h h h h h h h h h h h h h
Bulgaria h h h h h h h h h h h h h h h h h h h h h h h h h h h h h h
Latvia i h h h h h h h h h h h h h h h h h h h h h h h h h h h h h
England i h h h h h h h h h h h h h h h h h h h h h h h h h h
* Canada (O,Q) i i i h h h h h h h h h h h h h h h h h h h h h h
Lithuania i i i i h h h h h h h h h h h h h h h h h h h h
Germany i i i i h h h h h h h h h h h h h h h h h h h h
Hungary i i i i i h h h h h h h h h h h h h h h h h h h
Hong Kong, SAR i i i i h h h h h h h h h h h h h h h h h h h
Czech Republic i i i i i h h h h h h h h h h h h h h h h h h h
Italy i i i i i h h h h h h h h h h h h h h h h h h h
United States i i i i i h h h h h h h h h h h h h h h h h
France i i i i i i h h h h h h h h h h h h h h h h h
Russian Federation i i i i i i h h h h h h h h h h h h h h h
Singapore i i i i i i i i h h h h h h h h h h h h h h h
Scotland i i i i i i i i i i i i h h h h h h h h h h h h h h h
New Zealand i i i i i i i i i i i i h h h h h h h h h h h h h h h
Slovak Republic i i i i i i i i i i i i i i h h h h h h h h h h h h h h
Greece i i i i i i i i i i i i i i h h h h h h h h h h h h h h
Romania i i i i i i i i i i i i i i i i i i h h h h h h h h h h
Israel i i i i i i i i i i i i i i i i i i i i h h h h h h h h h h
Moldova, Rep. of i i i i i i i i i i i i i i i i i i i i h h h h h h h h h h
Iceland i i i i i i i i i i i i i i i i i i i i h h h h h h h h h h
Slovenia i i i i i i i i i i i i i i i i i i i i h h h h h h h h h h
Norway i i i i i i i i i i i i i i i i i i i i i i i i i h h h h h h h h
Cyprus i i i i i i i i i i i i i i i i i i i i i i i i i h h h h h h h h
Turkey i i i i i i i i i i i i i i i i i i i i i i i i i i i h h h h h h
Macedonia, Rep. of i i i i i i i i i i i i i i i i i i i i i i i i i i i h h h h h h
Colombia i i i i i i i i i i i i i i i i i i i i i i i i i i i i i h h h h
Argentina i i i i i i i i i i i i i i i i i i i i i i i i i i i i i h h h
Iran, Islamic Rep. of i i i i i i i i i i i i i i i i i i i i i i i i i i i i i i h h
Kuwait i i i i i i i i i i i i i i i i i i i i i i i i i i i i i i i h h
Morocco i i i i i i i i i i i i i i i i i i i i i i i i i i i i i i i i i h
Belize i i i i i i i i i i i i i i i i i i i i i i i i i i i i i i i i i i
* Ontario (Canada) i i i h h h h h h h h h h h h h h h h h h h h h
* Quebec (Canada) i i i h h h h h h h h h h h h h h h h h h h h h
Average achievement significantlyhigher than comparison country
Average achievement significantlylower than comparison country
h
i
Bel
ize
Swed
en
Net
her
lan
ds
Bu
lgar
ia
Latv
ia
Eng
lan
d
Can
ada
(O,Q
)
Lith
uan
ia
Ger
man
y
Hu
ng
ary
Ho
ng
Ko
ng
, SA
R
Cze
ch R
epu
blic
Ital
y
Un
ited
Sta
tes
Fran
ce
Ru
ssia
n F
eder
atio
n
Sin
gap
ore
Sco
tlan
d
New
Zea
lan
d
Slo
vak
Rep
ub
lic
Gre
ece
Ro
man
ia
Isra
el
Mo
ldo
va, R
ep. o
f
Icel
and
Slo
ven
ia
No
rway
Cyp
rus
Turk
ey
Mac
edo
nia
, Rep
. of
Co
lom
bia
Arg
enti
na
Iran
, Isl
amic
Rep
. of
Ku
wai
t
Mo
rocc
o
* Canada is represented by the provinces of Ontario and Quebec only. The internationalaverage does not include the results from these provinces separately.
ISC 4th GradePIRLS 2001
Instructions: Read across the row for a country to compare performance with the countries listed along the top of the chart. Thesymbols indicate whether the average achievement of the country in the row is significantly lower than that of the comparison country,significantly higher than that of the comparison country, or if there is no statistically significant difference between the average achieve-ment of the two countries.
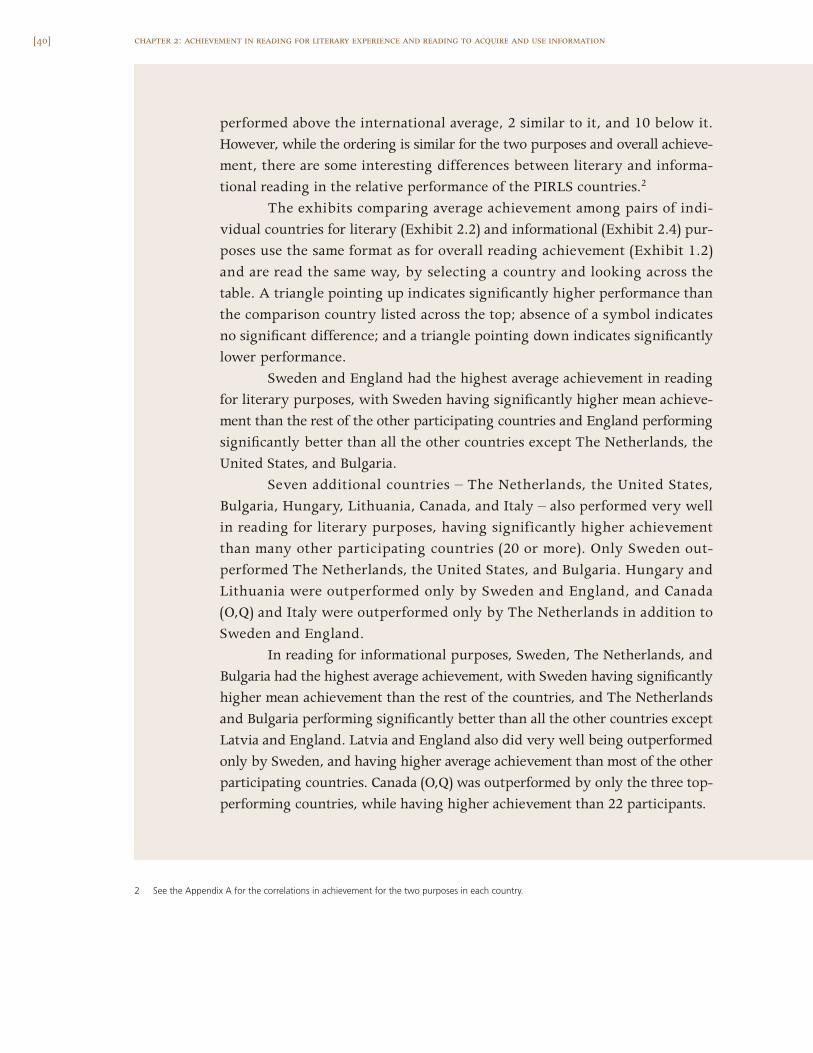
[40]
performed above the international average, 2 similar to it, and 10 below it.However, while the ordering is similar for the two purposes and overall achieve-ment, there are some interesting differences between literary and informa-tional reading in the relative performance of the PIRLS countries.2
The exhibits comparing average achievement among pairs of indi-vidual countries for literary (Exhibit 2.2) and informational (Exhibit 2.4) pur-poses use the same format as for overall reading achievement (Exhibit 1.2)and are read the same way, by selecting a country and looking across thetable. A triangle pointing up indicates significantly higher performance thanthe comparison country listed across the top; absence of a symbol indicatesno significant difference; and a triangle pointing down indicates significantlylower performance.
Sweden and England had the highest average achievement in readingfor literary purposes, with Sweden having significantly higher mean achieve-ment than the rest of the other participating countries and England performingsignificantly better than all the other countries except The Netherlands, theUnited States, and Bulgaria.
Seven additional countries – The Netherlands, the United States,Bulgaria, Hungary, Lithuania, Canada, and Italy – also performed very wellin reading for literary purposes, having significantly higher achievementthan many other participating countries (20 or more). Only Sweden out-performed The Netherlands, the United States, and Bulgaria. Hungary andLithuania were outperformed only by Sweden and England, and Canada(O,Q) and Italy were outperformed only by The Netherlands in addition toSweden and England.
In reading for informational purposes, Sweden, The Netherlands, andBulgaria had the highest average achievement, with Sweden having significantlyhigher mean achievement than the rest of the countries, and The Netherlandsand Bulgaria performing significantly better than all the other countries exceptLatvia and England. Latvia and England also did very well being outperformedonly by Sweden, and having higher average achievement than most of the otherparticipating countries. Canada (O,Q) was outperformed by only the three top-performing countries, while having higher achievement than 22 participants.
chapter 2: achievement in reading for literary experience and reading to acquire and use information
2 See the Appendix A for the correlations in achievement for the two purposes in each country.
[41]chapter 2: achievement in reading for literary experience and reading to acquire and use information
In Which Reading Purposes Are Countries RelativelyStrong or Weak?
Exhibit 2.5 displays the difference between average achievement in the literaryand informational purposes for each country.3 The results reveal that many coun-tries performed relatively better or worse in one purpose compared to the other(darkened bar indicates difference is statistically significant). Differences in rel-ative performance may be related to one or more of a number of factors, suchas emphases in intended curricula or widely used textbooks, strengths or weak-nesses in curriculum implementation, and the grade level at which certain readingcomprehension strategies are introduced.
Countries with significantly higher relative performance in reading forliterary purposes included the United States, Iceland, Norway, England, Iran,Hungary, Cyprus, Italy, Greece, New Zealand, Lithuania, Israel, and Canada (O,Q).Countries with higher relative performance in reading for informational pur-poses included Moldova, Hong Kong, France, Morocco, the Slovak Republic,Latvia, Kuwait, the Russian Federation, Macedonia, Slovenia, and Turkey.
What Are the Gender Differences in Achievement for the Content Areas?
Listed alphabetically by country, Exhibit 2.6 shows average achievement bygender in reading for literary and informational purposes. Mirroring theoverall results, girls had significantly higher achievement than boys for bothoverarching reading purposes in each country. In some countries, however, thegender differences appeared to be somewhat more pronounced for the liter-ary than the informational purposes. This is consistent with the previous IEAreading literacy study4 and research in other countries5 showing that thelargest differences between girls and boys were found in the narrative domain,in almost every case.
3 Since the PIRLS scales were developed using Item Response Theory (IRT) technology (see Procedural Appendix), like all such scales theLiterary and Informational scales cannot be described in absolute terms. While the scales are expressed in the same numerical units, theyare not directly comparable in terms of being able to say how much achievement or learning in one equals how much achievement orlearning in the other.
4 Wagemaker, H. (Ed.). (1996). Are girls better readers? Amsterdam: International Association for the Evaluation of Educational Achievement.
5 For example, grade 4 assessments in the United States have found larger gender differences favoring girls in reading for literary experiencethan reading to gain information (see NAEP 1994 Reading Report Card for the Nation and the States).
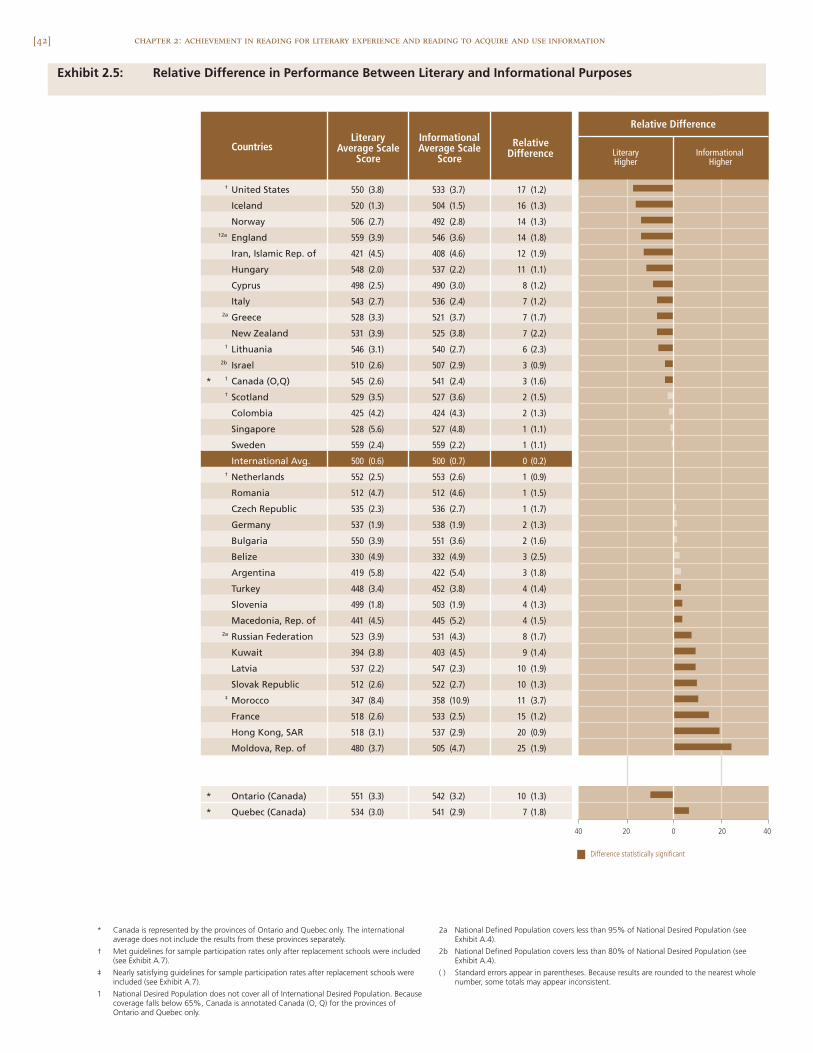
[42] chapter 2: achievement in reading for literary experience and reading to acquire and use information
SOU
RCE:
IEA
Pro
gres
s in
Inte
rnat
iona
l Rea
ding
Lite
racy
Stu
dy (P
IRLS
) 200
1.
ISC 4th GradePIRLS 2001
Exhibit 2.5: Relative Difference in Performance Between Literary and Informational Purposes
LiteraryHigher
InformationalHigher
† United States 550 (3.8) 533 (3.7) 17 (1.2)
Iceland 520 (1.3) 504 (1.5) 16 (1.3)
Norway 506 (2.7) 492 (2.8) 14 (1.3)†2a England 559 (3.9) 546 (3.6) 14 (1.8)
Iran, Islamic Rep. of 421 (4.5) 408 (4.6) 12 (1.9)
Hungary 548 (2.0) 537 (2.2) 11 (1.1)
Cyprus 498 (2.5) 490 (3.0) 8 (1.2)
Italy 543 (2.7) 536 (2.4) 7 (1.2)2a Greece 528 (3.3) 521 (3.7) 7 (1.7)
New Zealand 531 (3.9) 525 (3.8) 7 (2.2)1 Lithuania 546 (3.1) 540 (2.7) 6 (2.3)
2b Israel 510 (2.6) 507 (2.9) 3 (0.9)
* 1 Canada (O,Q) 545 (2.6) 541 (2.4) 3 (1.6)† Scotland 529 (3.5) 527 (3.6) 2 (1.5)
Colombia 425 (4.2) 424 (4.3) 2 (1.3)
Singapore 528 (5.6) 527 (4.8) 1 (1.1)
Sweden 559 (2.4) 559 (2.2) 1 (1.1)
International Avg. 500 (0.6) 500 (0.7) 0 (0.2)† Netherlands 552 (2.5) 553 (2.6) 1 (0.9)
Romania 512 (4.7) 512 (4.6) 1 (1.5)
Czech Republic 535 (2.3) 536 (2.7) 1 (1.7)
Germany 537 (1.9) 538 (1.9) 2 (1.3)
Bulgaria 550 (3.9) 551 (3.6) 2 (1.6)
Belize 330 (4.9) 332 (4.9) 3 (2.5)
Argentina 419 (5.8) 422 (5.4) 3 (1.8)
Turkey 448 (3.4) 452 (3.8) 4 (1.4)
Slovenia 499 (1.8) 503 (1.9) 4 (1.3)
Macedonia, Rep. of 441 (4.5) 445 (5.2) 4 (1.5)2a Russian Federation 523 (3.9) 531 (4.3) 8 (1.7)
Kuwait 394 (3.8) 403 (4.5) 9 (1.4)
Latvia 537 (2.2) 547 (2.3) 10 (1.9)
Slovak Republic 512 (2.6) 522 (2.7) 10 (1.3)‡ Morocco 347 (8.4) 358 (10.9) 11 (3.7)
France 518 (2.6) 533 (2.5) 15 (1.2)
Hong Kong, SAR 518 (3.1) 537 (2.9) 20 (0.9)
Moldova, Rep. of 480 (3.7) 505 (4.7) 25 (1.9)
* Ontario (Canada) 551 (3.3) 542 (3.2) 10 (1.3)
* Quebec (Canada) 534 (3.0) 541 (2.9) 7 (1.8)
Relative DifferenceLiterary
Average ScaleScore
InformationalAverage Scale
Score
RelativeDifference
Countries
Difference statistically significant
40 0 402020
* Canada is represented by the provinces of Ontario and Quebec only. The internationalaverage does not include the results from these provinces separately.
† Met guidelines for sample participation rates only after replacement schools were included(see Exhibit A.7).
‡ Nearly satisfying guidelines for sample participation rates after replacement schools wereincluded (see Exhibit A.7).
1 National Desired Population does not cover all of International Desired Population. Becausecoverage falls below 65%, Canada is annotated Canada (O, Q) for the provinces ofOntario and Quebec only.
2a National Defined Population covers less than 95% of National Desired Population (seeExhibit A.4).
2b National Defined Population covers less than 80% of National Desired Population (seeExhibit A.4).
( ) Standard errors appear in parentheses. Because results are rounded to the nearest wholenumber, some totals may appear inconsistent.
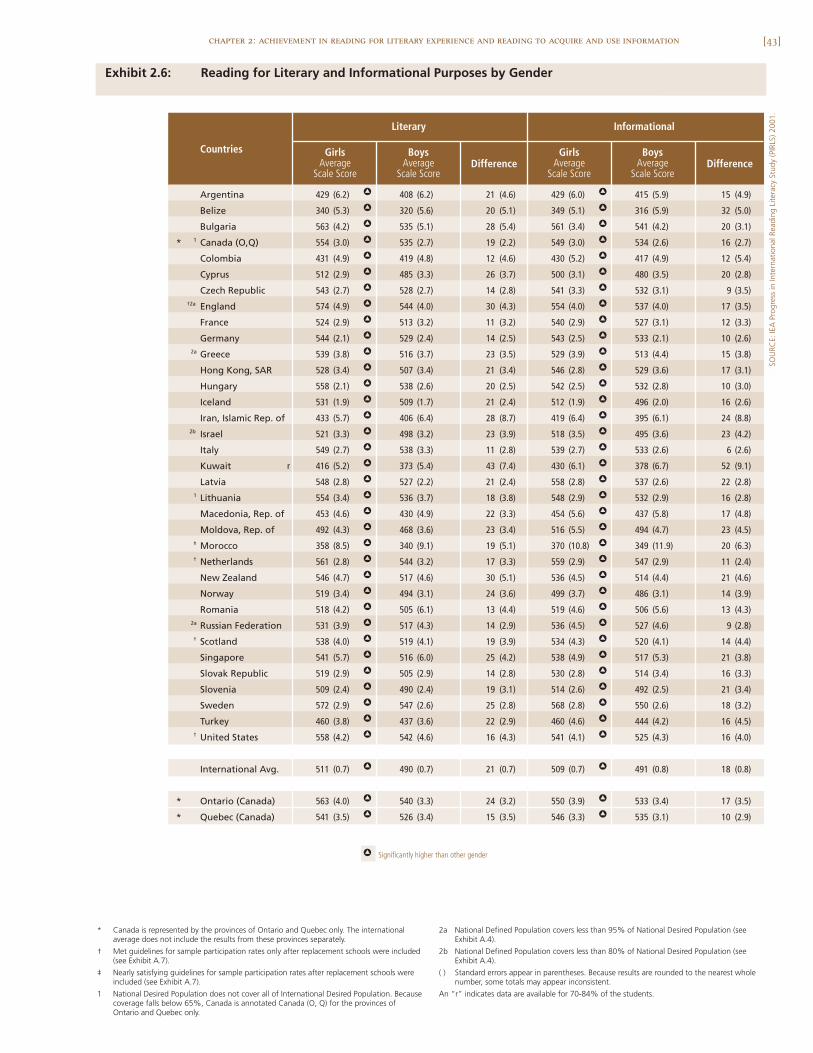
[43]chapter 2: achievement in reading for literary experience and reading to acquire and use information
SOU
RCE:
IEA
Pro
gres
s in
Inte
rnat
iona
l Rea
ding
Lite
racy
Stu
dy (P
IRLS
) 200
1.
ISC 4th GradePIRLS 2001
Exhibit 2.6: Reading for Literary and Informational Purposes by Gender
Argentina 429 (6.2) h 408 (6.2) 21 (4.6) 429 (6.0) h 415 (5.9) 15 (4.9)
Belize 340 (5.3) h 320 (5.6) 20 (5.1) 349 (5.1) h 316 (5.9) 32 (5.0)
Bulgaria 563 (4.2) h 535 (5.1) 28 (5.4) 561 (3.4) h 541 (4.2) 20 (3.1)
* 1 Canada (O,Q) 554 (3.0) h 535 (2.7) 19 (2.2) 549 (3.0) h 534 (2.6) 16 (2.7)
Colombia 431 (4.9) h 419 (4.8) 12 (4.6) 430 (5.2) h 417 (4.9) 12 (5.4)
Cyprus 512 (2.9) h 485 (3.3) 26 (3.7) 500 (3.1) h 480 (3.5) 20 (2.8)
Czech Republic 543 (2.7) h 528 (2.7) 14 (2.8) 541 (3.3) h 532 (3.1) 9 (3.5)†2a England 574 (4.9) h 544 (4.0) 30 (4.3) 554 (4.0) h 537 (4.0) 17 (3.5)
France 524 (2.9) h 513 (3.2) 11 (3.2) 540 (2.9) h 527 (3.1) 12 (3.3)
Germany 544 (2.1) h 529 (2.4) 14 (2.5) 543 (2.5) h 533 (2.1) 10 (2.6)2a Greece 539 (3.8) h 516 (3.7) 23 (3.5) 529 (3.9) h 513 (4.4) 15 (3.8)
Hong Kong, SAR 528 (3.4) h 507 (3.4) 21 (3.4) 546 (2.8) h 529 (3.6) 17 (3.1)
Hungary 558 (2.1) h 538 (2.6) 20 (2.5) 542 (2.5) h 532 (2.8) 10 (3.0)
Iceland 531 (1.9) h 509 (1.7) 21 (2.4) 512 (1.9) h 496 (2.0) 16 (2.6)
Iran, Islamic Rep. of 433 (5.7) h 406 (6.4) 28 (8.7) 419 (6.4) h 395 (6.1) 24 (8.8)2b Israel 521 (3.3) h 498 (3.2) 23 (3.9) 518 (3.5) h 495 (3.6) 23 (4.2)
Italy 549 (2.7) h 538 (3.3) 11 (2.8) 539 (2.7) h 533 (2.6) 6 (2.6)
Kuwait 416 (5.2) h 373 (5.4) 43 (7.4) 430 (6.1) h 378 (6.7) 52 (9.1)
Latvia 548 (2.8) h 527 (2.2) 21 (2.4) 558 (2.8) h 537 (2.6) 22 (2.8)1 Lithuania 554 (3.4) h 536 (3.7) 18 (3.8) 548 (2.9) h 532 (2.9) 16 (2.8)
Macedonia, Rep. of 453 (4.6) h 430 (4.9) 22 (3.3) 454 (5.6) h 437 (5.8) 17 (4.8)
Moldova, Rep. of 492 (4.3) h 468 (3.6) 23 (3.4) 516 (5.5) h 494 (4.7) 23 (4.5)‡ Morocco 358 (8.5) h 340 (9.1) 19 (5.1) 370 (10.8) h 349 (11.9) 20 (6.3)† Netherlands 561 (2.8) h 544 (3.2) 17 (3.3) 559 (2.9) h 547 (2.9) 11 (2.4)
New Zealand 546 (4.7) h 517 (4.6) 30 (5.1) 536 (4.5) h 514 (4.4) 21 (4.6)
Norway 519 (3.4) h 494 (3.1) 24 (3.6) 499 (3.7) h 486 (3.1) 14 (3.9)
Romania 518 (4.2) h 505 (6.1) 13 (4.4) 519 (4.6) h 506 (5.6) 13 (4.3)2a Russian Federation 531 (3.9) h 517 (4.3) 14 (2.9) 536 (4.5) h 527 (4.6) 9 (2.8)† Scotland 538 (4.0) h 519 (4.1) 19 (3.9) 534 (4.3) h 520 (4.1) 14 (4.4)
Singapore 541 (5.7) h 516 (6.0) 25 (4.2) 538 (4.9) h 517 (5.3) 21 (3.8)
Slovak Republic 519 (2.9) h 505 (2.9) 14 (2.8) 530 (2.8) h 514 (3.4) 16 (3.3)
Slovenia 509 (2.4) h 490 (2.4) 19 (3.1) 514 (2.6) h 492 (2.5) 21 (3.4)
Sweden 572 (2.9) h 547 (2.6) 25 (2.8) 568 (2.8) h 550 (2.6) 18 (3.2)
Turkey 460 (3.8) h 437 (3.6) 22 (2.9) 460 (4.6) h 444 (4.2) 16 (4.5)† United States 558 (4.2) h 542 (4.6) 16 (4.3) 541 (4.1) h 525 (4.3) 16 (4.0)
International Avg. 511 (0.7) h 490 (0.7) 21 (0.7) 509 (0.7) h 491 (0.8) 18 (0.8)
* Ontario (Canada) 563 (4.0) h 540 (3.3) 24 (3.2) 550 (3.9) h 533 (3.4) 17 (3.5)
* Quebec (Canada) 541 (3.5) h 526 (3.4) 15 (3.5) 546 (3.3) h 535 (3.1) 10 (2.9)
h Significantly higher than other gender
Countries GirlsAverage
Scale ScoreDifference
InformationalLiterary
DifferenceBoys
AverageScale Score
GirlsAverage
Scale Score
BoysAverage
Scale Score
r
* Canada is represented by the provinces of Ontario and Quebec only. The internationalaverage does not include the results from these provinces separately.
† Met guidelines for sample participation rates only after replacement schools were included(see Exhibit A.7).
‡ Nearly satisfying guidelines for sample participation rates after replacement schools wereincluded (see Exhibit A.7).
1 National Desired Population does not cover all of International Desired Population. Becausecoverage falls below 65%, Canada is annotated Canada (O, Q) for the provinces ofOntario and Quebec only.
2a National Defined Population covers less than 95% of National Desired Population (seeExhibit A.4).
2b National Defined Population covers less than 80% of National Desired Population (seeExhibit A.4).
( ) Standard errors appear in parentheses. Because results are rounded to the nearest wholenumber, some totals may appear inconsistent.
An “r” indicates data are available for 70-84% of the students.
3
[45]
Chapter 3Performance at InternationalBenchmarks
The PIRLS 2001 reading achievement scale
summarizes student performance on test questions
(items) designed to assess a wide range of reading
skills and strategies. More specifically, PIRLS
focused on assessing processes of comprehension as
they functioned and interacted within literary and
informational reading purposes.
[46]
In order to provide meaningful descriptions of what performance on the scaleindicates in terms of students’ reading proficiency, PIRLS identified four pointson the scale as international benchmarks, and conducted an ambitious scaleanchoring exercise to describe performance at these benchmarks in terms of thecomprehension processes demonstrated by students.
Chapter 3 presents the achievement results for each of the followinginternational benchmarks:
• The Lower Quarter Benchmark. Defined as the 25th percentile and cor-responding to a scale score of 435, this is the point above which the top 75percent of students scored.
• The Median Benchmark. Defined as the 50th percentile or median andcorresponding to a scale score of 510, this is the point above which the tophalf of the students scored.
• The Upper Quarter Benchmark. Defined as the 75th percentile and cor-responding to a scale score of 570, this is the point above which the top 25percent of students scored.
• The Top 10% Benchmark. Defined as the 90th percentile and correspon-ding to a scale score of 615, this is the point above which the top 10 percentof the students scored.
As countries around the world strive to teach their children to becomeavid and successful readers, it is important to learn as much as possible aboutstudents’ strengths and weaknesses in reading comprehension. To help inter-pret the PIRLS 2001 achievement results, the chapter describes the types ofreading skills and strategies displayed by fourth-grade students at each of theinternational benchmarks together with examples of the types of items typi-cally answered acceptably by those students.
chapter 3: performance at international benchmarks
[47]chapter 3: performance at international benchmarks
How Do Countries Compare with International Benchmarks ofPerformance Reading Achievement?
Exhibit 3.1 displays the percentage of students in each participating countrythat reached each international benchmark, in decreasing order by percent-age reaching the Top 10% Benchmark. If students’ reading achievement wasdistributed in the same way in every country, then each country would beexpected to have approximately 10 percent of its students reaching the Top10% Benchmark, 25 percent the Upper Quarter Benchmark, 50 percent theMedian Benchmark, and 75 percent the Lower Quarter Benchmark. AlthoughIsrael and Romania came fairly close, no country followed this pattern exactly.
Looking at the top of Exhibit 3.1, the results show that England andBulgaria performed similarly. In both countries, 21 to 23 percent of the stu-dents reached the Top 10% Benchmark, 44 to 45 percent the Upper QuarterBenchmark, 71 to 72 percent the Median Benchmark, and 90 to 91 percent theLower Quarter Benchmark. In Sweden, approximately the same percentage ofstudents reached the Top 10% Benchmark, but somewhat more studentsthan in England and Bulgaria attained each of the successively lower bench-marks. Sweden had one-fifth of its students reaching the Top 10% Bench-mark, nearly half (47%) reaching the Upper Quarter Benchmark, four-fifthsreaching the Median Benchmark, and nearly all students (96%) reaching theLower Quarter Benchmark.
Although Exhibit 3.1 is organized to draw particular attention to thepercentage of high-achieving students in each country, it conveys importantinformation about the distribution of middle and lower performers also. Forexample, even though The Netherlands, Lithuania, and Latvia had fewer stu-dents reaching the Top 10% Benchmark than England, they had nearly all oftheir fourth-grade students (95% or more) reaching the Lower Quarter Bench-mark. The Czech Republic had the anticipated 10 percent of students reachingthe Top 10% Benchmark, but more than the anticipated amount reaching theother three benchmarks – about one-third at the Upper Quarter, two-thirdsat the Median, and 93 percent at the Lower Quarter.
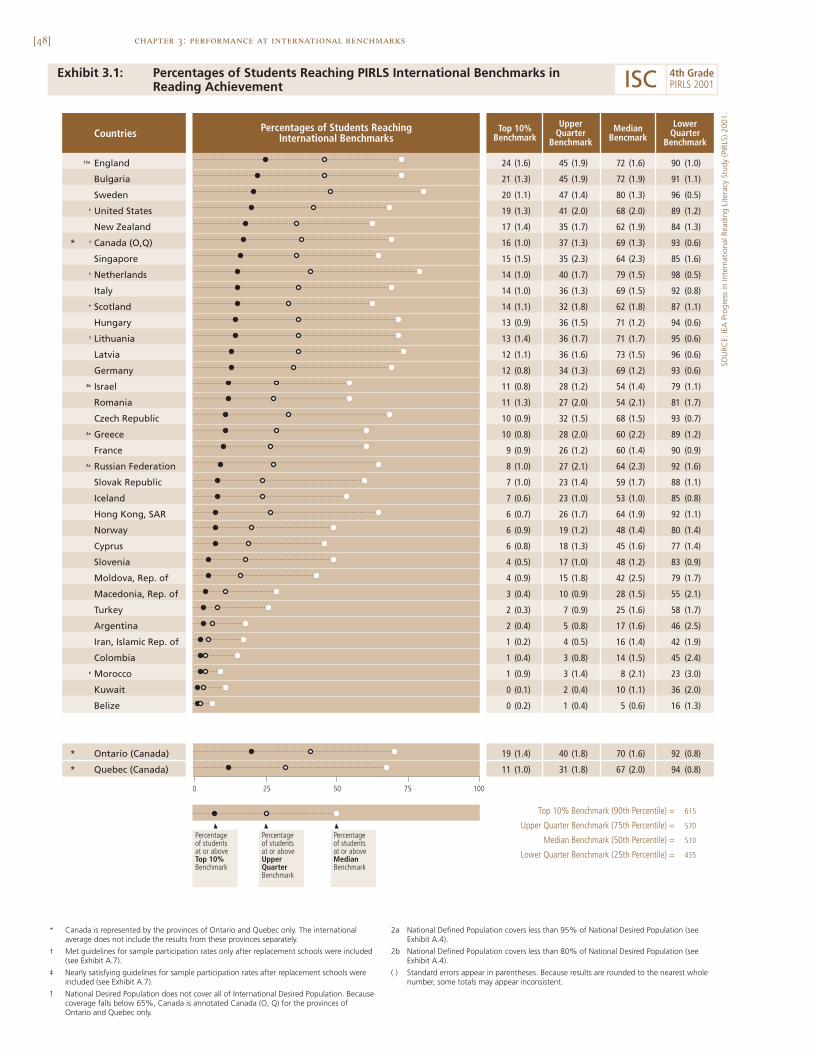
[48] chapter 3: performance at international benchmarks
Exhibit 3.1: Percentages of Students Reaching PIRLS International Benchmarks inReading Achievement
Countries Percentages of Students ReachingInternational Benchmarks
†2a England 24 (1.6) 45 (1.9) 72 (1.6) 90 (1.0)
Bulgaria 21 (1.3) 45 (1.9) 72 (1.9) 91 (1.1)
Sweden 20 (1.1) 47 (1.4) 80 (1.3) 96 (0.5)† United States 19 (1.3) 41 (2.0) 68 (2.0) 89 (1.2)
New Zealand 17 (1.4) 35 (1.7) 62 (1.9) 84 (1.3)
* 1 Canada (O,Q) 16 (1.0) 37 (1.3) 69 (1.3) 93 (0.6)
Singapore 15 (1.5) 35 (2.3) 64 (2.3) 85 (1.6)† Netherlands 14 (1.0) 40 (1.7) 79 (1.5) 98 (0.5)
Italy 14 (1.0) 36 (1.3) 69 (1.5) 92 (0.8)† Scotland 14 (1.1) 32 (1.8) 62 (1.8) 87 (1.1)
Hungary 13 (0.9) 36 (1.5) 71 (1.2) 94 (0.6)1 Lithuania 13 (1.4) 36 (1.7) 71 (1.7) 95 (0.6)
Latvia 12 (1.1) 36 (1.6) 73 (1.5) 96 (0.6)
Germany 12 (0.8) 34 (1.3) 69 (1.2) 93 (0.6)2b Israel 11 (0.8) 28 (1.2) 54 (1.4) 79 (1.1)
Romania 11 (1.3) 27 (2.0) 54 (2.1) 81 (1.7)
Czech Republic 10 (0.9) 32 (1.5) 68 (1.5) 93 (0.7)2a Greece 10 (0.8) 28 (2.0) 60 (2.2) 89 (1.2)
France 9 (0.9) 26 (1.2) 60 (1.4) 90 (0.9)2a Russian Federation 8 (1.0) 27 (2.1) 64 (2.3) 92 (1.6)
Slovak Republic 7 (1.0) 23 (1.4) 59 (1.7) 88 (1.1)
Iceland 7 (0.6) 23 (1.0) 53 (1.0) 85 (0.8)
Hong Kong, SAR 6 (0.7) 26 (1.7) 64 (1.9) 92 (1.1)
Norway 6 (0.9) 19 (1.2) 48 (1.4) 80 (1.4)
Cyprus 6 (0.8) 18 (1.3) 45 (1.6) 77 (1.4)
Slovenia 4 (0.5) 17 (1.0) 48 (1.2) 83 (0.9)
Moldova, Rep. of 4 (0.9) 15 (1.8) 42 (2.5) 79 (1.7)
Macedonia, Rep. of 3 (0.4) 10 (0.9) 28 (1.5) 55 (2.1)
Turkey 2 (0.3) 7 (0.9) 25 (1.6) 58 (1.7)
Argentina 2 (0.4) 5 (0.8) 17 (1.6) 46 (2.5)
Iran, Islamic Rep. of 1 (0.2) 4 (0.5) 16 (1.4) 42 (1.9)
Colombia 1 (0.4) 3 (0.8) 14 (1.5) 45 (2.4)‡ Morocco 1 (0.9) 3 (1.4) 8 (2.1) 23 (3.0)
Kuwait 0 (0.1) 2 (0.4) 10 (1.1) 36 (2.0)
Belize 0 (0.2) 1 (0.4) 5 (0.6) 16 (1.3)
* Ontario (Canada) 19 (1.4) 40 (1.8) 70 (1.6) 92 (0.8)
* Quebec (Canada) 11 (1.0) 31 (1.8) 67 (2.0) 94 (0.8)
Top 10%Benchmark
UpperQuarter
Benchmark
MedianBencmark
LowerQuarter
Benchmark
0 10050 7525
Percentageof studentsat or aboveTop 10%Benchmark
Percentageof studentsat or aboveMedianBenchmark
Percentageof studentsat or aboveUpperQuarterBenchmark
Lower Quarter Benchmark (25th Percentile) = 435
Median Benchmark (50th Percentile) = 510
Upper Quarter Benchmark (75th Percentile) = 570
Top 10% Benchmark (90th Percentile) = 615
* Canada is represented by the provinces of Ontario and Quebec only. The internationalaverage does not include the results from these provinces separately.
† Met guidelines for sample participation rates only after replacement schools were included(see Exhibit A.7).
‡ Nearly satisfying guidelines for sample participation rates after replacement schools wereincluded (see Exhibit A.7).
1 National Desired Population does not cover all of International Desired Population. Becausecoverage falls below 65%, Canada is annotated Canada (O, Q) for the provinces ofOntario and Quebec only.
2a National Defined Population covers less than 95% of National Desired Population (seeExhibit A.4).
2b National Defined Population covers less than 80% of National Desired Population (seeExhibit A.4).
( ) Standard errors appear in parentheses. Because results are rounded to the nearest wholenumber, some totals may appear inconsistent.
SOU
RCE:
IEA
Pro
gres
s in
Inte
rnat
iona
l Rea
ding
Lite
racy
Stu
dy (P
IRLS
) 200
1.
ISC 4th GradePIRLS 2001
[49]chapter 3: performance at international benchmarks
What Was the Nature of the PIRLS Reading Test?
The PIRLS 2001 assessment was based on eight different texts of 400 to 700words in length – four literary and four informational. Four of these texts havebeen released to the public and are included in this report to provide a basisfor understanding the achievement results. The remaining four texts andaccompanying item sets are being held secure for use in measuring trends inreading achievement in PIRLS 2006. Three of the released texts are in the backpocket of the report, including the “River Trail” activities leaflet and the twopassages presented in the PIRLS Reader (“Hare” story and “Pufflings” article).The fourth released text (“Mice” story), all fouritem sets corresponding to the released texts, andthe scoring guides for the constructed-responseitems are found in Appendix C.
Since the descriptions of students’ readingat the four international benchmarks are derivedfrom the PIRLS 2001 assessment, the followingsection briefly summarizes the full set of texts anditems included in the test. As children participate in their daily lives at homeand in school, they are faced with a broad range of literacy demands and PIRLS2001 attempted to mirror this environment as much as possible by includinga variety of text types and a broad range of test items.
To help ensure that the materials selected would be appropriate forfourth-grade students, countries participating in PIRLS 2001 contributed a sub-stantial number of “authentic” (from existing sources) stories, articles, and othertypes of reading materials for review. The texts underwent extensive reviewby the National Research Coordinators and reading experts from the PIRLS2001 countries, the PIRLS 2001 expert development group (the RDG), and staffmembers from the consortium of organizations responsible for implementingPIRLS 2001. From the texts selected for further development, eventually 16text and item sets (twice the requisite number for the actual assessment) werefield tested in the participating countries.
The four literary texts selected for the PIRLS 2001 assessment all werenarrative in form. As illustrated by the “Hare” and “Mice” stories, the texts
PIRLS included a varietyof text types and a broadrange of test items.
[50]
were selected to represent a range of traditional and contemporary short stories.The four informational texts are representative of continuous and noncontin-uous texts, with the continuous texts being chronologically or topically organ-ized (or both). One is the “River Trail” recreational leaflet, but the other three– represented by the “Pufflings” article – are nonfiction in a narrative form(e.g., historical biography) typical of articles found in informational books orchildren’s school magazines.
Within reading for literary and informational purposes, the test ques-tions or items were designed to measure the four major processes of readingcomprehension briefly described below:1
• Focus on and Retrieve Explicitly Stated Information. The student neededto recognize the relevance of the information or ideas presented in the textin relation to the information sought, but looking for specific information orideas typically involved locating a sentence or phrase (approximately 20%of the assessment).
• Make Straightforward Inferences. Based mostly on information containedin the texts, usually these types of questions required students to connecttwo ideas presented in adjacent sentences and fill in a “gap” in meaning.Skilled readers often make these kinds of inferences automatically, recog-nizing the relationship even though it is not stated in the text (approxi-mately 40%).
• Interpret and Integrate Ideas and Information. For these questions, students needed to process the text beyond the phrase or sentence level.Sometimes they were asked to make connections that were not only implicit,but needed to draw on their own knowledge and experiences (approxi-mately 25%).
• Examine and Evaluate Content, Language, and Textual Elements. Thesequestions required students to draw on their knowledge of text genre andstructure, as well as their understanding of language conventions and devices(approximately 15%).
chapter 3: performance at international benchmarks
1 For a more detailed description of the processes of reading comprehension assessed in PIRLS 2001, please see Campbell, J.R., Kelly, D.L.,Mullis, I.V.S., Martin, M.O., & Sainsbury, M. (2001). Framework and specifications for PIRLS assessment 2001 (2nd ed.). Chestnut Hill, MA:Boston College.
[51]chapter 3: performance at international benchmarks
About half the items required students to construct their own answersto the questions. The constructed-response questions took three different forms:
• For one-point items, responses were scored as acceptable if they includedall elements required by the question and were determined to be accuratebased on ideas of information in the text.
• For two-point items, responses were given full credit (2 points) that demon-strated complete comprehension by providing appropriate inferences andinterpretations consistent with text and adequate textually-based supportif required. They were given partial credit (1 point) if they included onlysome of the information or demonstrated only a literal understanding whenan inference or interpretation was required.
• For three-point items, responses were given full credit (3 points) if theydemonstrated extensive comprehension by presenting relatively complex,abstract ideas or by providing substantial textual support for inferencesand interpretations. Responses were given two different levels of partialcredit – satisfactory responses (2 points) contained all the required ele-ments but did not provide complex or abstract ideas, were more literal thaninterpretive, or were weak in textually-based support; and minimalresponses (1 point) contained some but not all of the required elements.
How Were the Benchmark Descriptions Developed?
To develop descriptions of achievement at the PIRLS 2001 international bench-marks, the PIRLS International Study Center used the scale anchoring method.Scale anchoring is a way of describing students’ performance at different pointson the reading achievement scale in terms of the types of texts they were askedto read and the types of items they answered successfully. It involved an empir-ical component in which items that discriminate between successive pointson the scale were identified, and a judgmental component in which readingexperts examined the content of the texts and items and generalized to stu-dents’ comprehension skills and strategies.
[52]
For the scale anchoring analysis, the results of students from all theparticipating countries were pooled, so that the benchmark descriptionsrefer to all students achieving at that level. That is, it does not matter whichcountry the students are from, only how they performed on the test. Crite-ria were applied to the reading achievement scale results to identify the setsof items that students reaching each international benchmark were likely toanswer correctly and that those at the next lower benchmark were unlikelyto answer correctly.2
The sets of items produced by the analysis represented the accom-plishments of students reaching each successively higher benchmark, andwere used by the PIRLS Reading Development Group (RDG) consisting ofreading experts from countries around the world3 to develop the benchmarkdescriptions. The work of the panel involved developing a short description foreach item characterizing the reading skills and strategies demonstrated bystudents answering it partially or fully, and then summarizing students’ readingproficiency across the set of items for each benchmark to provide more generalstatements of achievement. Since the students reaching a particular bench-mark demonstrated the proficiency characterizing that benchmark as well asthe proficiency of students at the lower benchmarks, the description ofachievement at each benchmark is cumulative. The description of each bench-mark builds on the description of achievement demonstrated by students at thenext lower benchmark.
How Should the Benchmark Descriptions Be Interpreted?
In thinking of the difficulty of any reading task, there is, of course, a sub-stantial interaction between the length and complexity of the text and thesophistication of the comprehension processes required. In looking at theprocesses assessed by PIRLS 2001, it may initially seem that locating andextracting explicitly stated information would be less difficult than, forexample, making interpretations across a whole text and integrating thosewith external ideas and experiences. All texts are not equal, however, varyingenormously in numerous features such as length, syntactic complexity, abstract-ness of ideas, and organizational structure. For example, some informational
chapter 3: performance at international benchmarks
2 For example, at the Top 10% Benchmark, a multiple-choice item anchored if at least 65 percent of students scoring at the scale point corre-sponding to this benchmark (615) answered the item correctly and less than 50 percent of students scoring at the Upper Quarter Benchmarkanswered it correctly. Similarly, for the Upper Quarter Benchmark, a multiple-choice item anchored if at least 65 percent of students scoring atthat point (570) answered the item correctly and less than 50 percent of students at the Median Benchmark answered it correctly. Sinceguessing is greatly reduced, the criteria for the constructed-response items was simply 50 percent at the particular benchmark, and the analy-sis included partial-credit responses as well as those receiving full credit. See Procedural Appendix for more detail.
3 The PIRLS Reading Development Group (RDG) is listed in Appendix F.
[53]chapter 3: performance at international benchmarks
texts are organized in short, clearly-labeled subsections by discrete topics,while others are not. In some literary stories, characters’ feelings or intentionsare described directly while in other stories they are suggested through dialogor action.
Because of the interplay between text and question, the benchmarkdescriptions at each of the four levels are presented specifically in terms ofthe literary and informational texts given fourth-grade students in the PIRLS2001 assessment:
• Literary texts included four short stories with one or two episodes ofproblem/resolution and essentially two central characters.
• Informational texts included four sets of short informational materials involv-ing text, maps, illustrations, diagrams, and photographs organized topicallyor chronologically.
Given a limited set of relatively short texts, students with higher per-formance on the PIRLS reading achievement scale were more likely than thoseat lower levels to successfully complete questions requiring interpretationand integration of information. Because of the extremely wide range of textsavailable to fourth-grade students, this does not mean, however, that suchinterpretive reading tasks are always more difficult than tasks requiringretrieval of explicit information. The descriptions of reading skills and strate-gies developed based on the PIRLS reading achievement scale are intendedto explain differences in achievement on the PIRLS 2001 assessment, and inno way purport to be comprehensive of all reading situations encounteredby fourth-grade students.
The remainder of this chapter describes fourth-grade students’ readingachievement at each of the four benchmarks beginning with the Lower QuarterBenchmark and working up the scale cumulatively. The description of achieve-ment at each benchmark is accompanied by six example items representingstudents’ reading proficiency at that level. For each example item, the percentacceptable for each of the PIRLS 2001 countries is displayed in one of threecolumns according to whether the country’s achievement on the item was sta-tistically significantly different from the international average. The first column
[54]
presents countries above the international average, the second column con-tains countries with no statistically significant difference, and the third columncountries below the international average. The international average can befound in the middle column.
The correct answer is circled for multiple-choice items. For constructed-response items, the answers shown exemplify the types of student responsesthat were given for either partial or full credit. That is, since the achievementdescriptions are cumulative, students at one benchmark may have provideda partial response, while those at the next higher benchmark provided a com-plete or even extensive response.
In general, the countries scoring highest on the overall PIRLS assess-ment also scored highest on many of the items used to illustrate the bench-marks. Likewise, the countries with the lowest average achievement alsotended to have consistently low percentages of successful responses on theillustrative items. This, however, was not strictly the case and countries canbenefit from a scrutiny of their students’ performance item by item.
Achievement at the Lower Quarter Benchmark
As shown in Exhibit 3.2, students at the Lower Quarter Benchmark demon-strated the most success on items requiring retrieval of explicitly stated detailsfrom the various literary and informational texts. In retrieving explicitly statedinformation, focus on the text typically remains at the sentence or phrase level.Generally, this process needs little or no inferring or interpreting. However,students reaching this benchmark also demonstrated success with some itemsrequiring straightforward inferences, that is, based mostly on informationbased on the text.
Exhibits 3.3, 3.4, and 3.5 present Example Items 1, 2, and 3, respec-tively, which were based on literary texts and were likely to be answered cor-rectly by students reaching the Lower Quarter Benchmark. Example Item 1 isbased on the “Hare” story in the PIRLS reader (see back pocket of report).Essentially, the hare mistakenly thinks a falling fruit is an earthquake andthe lion calms the hare down. The results show that students reaching thisbenchmark correctly answered what made the earth shake in the story about
chapter 3: performance at international benchmarks
[55]chapter 3: performance at international benchmarks
the lion and the hare. With an international average of 86 percent correctresponses, this multiple-choice item was relatively easy for students in thePIRLS countries. In 20 countries, 90 percent or more of the students selectedthe right answer.
Example Items 2 and 3 are based on the “Mice” story found in Appen-dix C. In summary, an old man named Labon gets rid of mice by fooling themice into thinking the ceiling is the floor. This makes the mice do things upsidedown so that they become dizzy and fall to the floor. The results to ExampleItem 2 indicate that students understood why Labon wanted to get rid of themice. This item was slightly more difficult than Example Item 1, with an inter-national average of 79 percent correct and 90 percent or more of studentsanswering correctly in five countries (The Netherlands, Sweden, Latvia, theCzech Republic, and Italy). In Example Item 3, students reaching the LowerQuarter Benchmark retrieved and reproduced the information from the “Mice”story that Labon put the mice in a basket after he picked them up from thefloor. Even though in an constructed-response format, the international averagewas quite high (84%).
In reading informational texts, students reaching the Lower QuarterBenchmark correctly answered a multiple-choice question based on the“Pufflings” article. As can be seen from the PIRLS Reader in the back pocketof the report, the “Pufflings” article featured the activities of Halla and herfriends to explain how children save baby puffins that accidentally land intheir town. It is in a narrative form, but has relatively sophisticated syntaxand no section headings or markers. As shown in Example Item 4 (see Exhibit3.6), students at or above the Lower Quarter Benchmark were able to locateand retrieve the information that the puffins came to the island to lay eggs(international average 78%). Ninety percent or more of students answered cor-rectly in Germany, Sweden, and The Netherlands.
Exhibits 3.7 and 3.8 contain Example Items 5 and 6, respectively, bothbased on the “River Trail” leaflet (see back pocket of report). Briefly, the leafletprovides a map, some information about places to visit, and a section onrenting bikes. The results show that students attaining the Lower QuarterBenchmark could locate information and retrieve facts from various types of
[56]
informational material. In Example Item 5, students at the Lower Quarterbenchmark demonstrated that they were able to read the map in the “RiverTrail” leaflet to determine that the River Trail started in Altenburg (interna-tional average 82%). In Example Item 6, they correctly specified the order ofthe places encountered along the trail (international average 76%). HongKong was the top-performing country on both of these River Trail items, but90 percent or more of students answered correctly in several other countries.
chapter 3: performance at international benchmarks
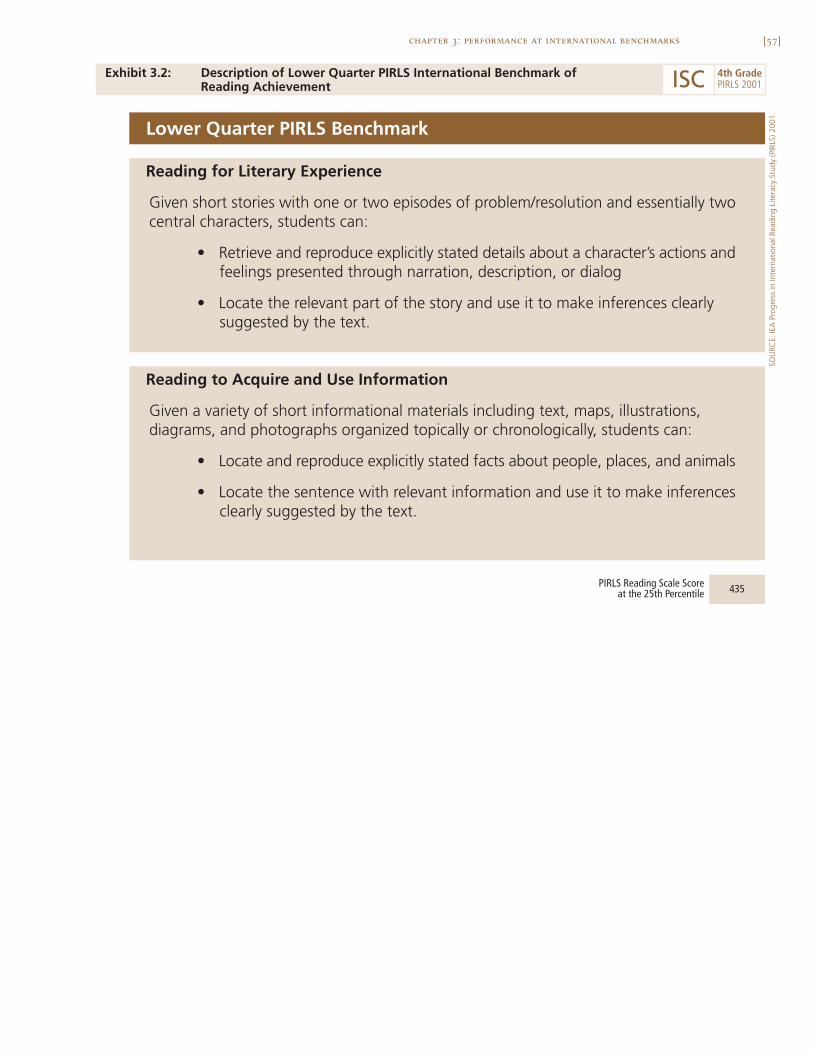
[57]chapter 3: performance at international benchmarks
Exhibit 3.2: Description of Lower Quarter PIRLS International Benchmark ofReading Achievement
SOU
RCE:
IEA
Pro
gres
s in
Inte
rnat
iona
l Rea
ding
Lite
racy
Stu
dy (P
IRLS
) 200
1.
Lower Quarter PIRLS Benchmark
Reading for Literary Experience
Given short stories with one or two episodes of problem/resolution and essentially twocentral characters, students can:
• Retrieve and reproduce explicitly stated details about a character’s actions andfeelings presented through narration, description, or dialog
• Locate the relevant part of the story and use it to make inferences clearlysuggested by the text.
Reading to Acquire and Use Information
Given a variety of short informational materials including text, maps, illustrations,diagrams, and photographs organized topically or chronologically, students can:
• Locate and reproduce explicitly stated facts about people, places, and animals
• Locate the sentence with relevant information and use it to make inferencesclearly suggested by the text.
435PIRLS Reading Scale Score at the 25th Percentile
ISC 4th GradePIRLS 2001
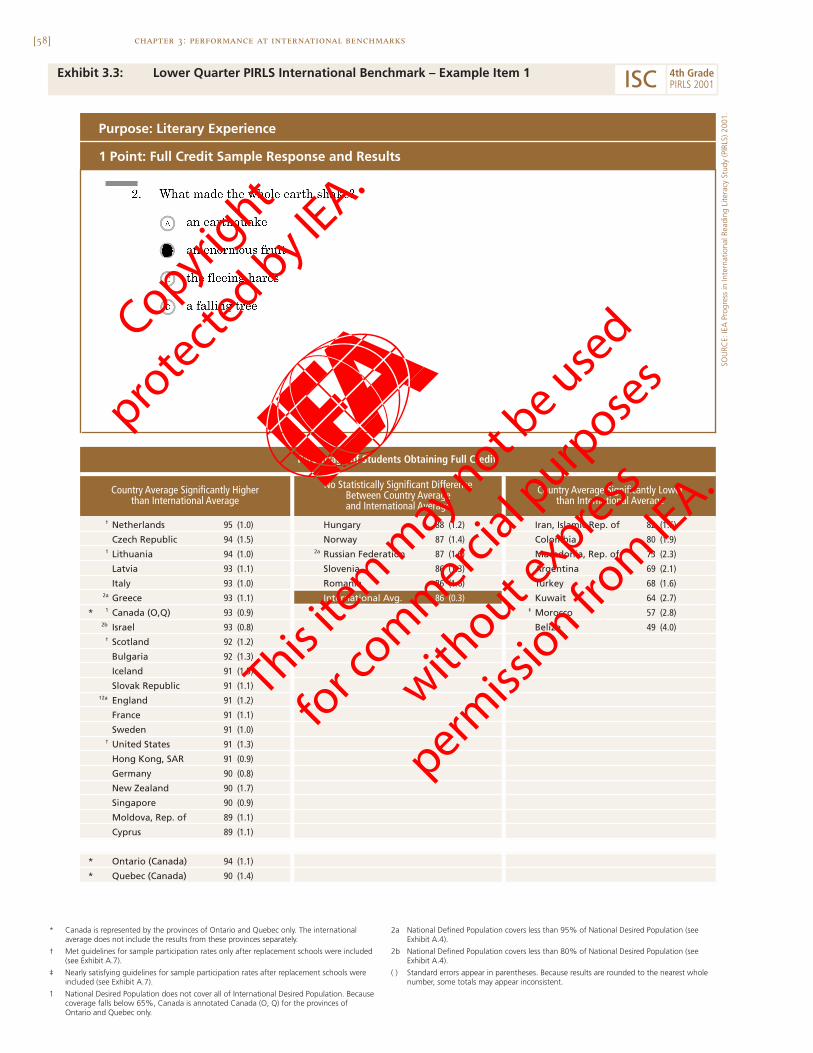
[58] chapter 3: performance at international benchmarks
Exhibit 3.3: Lower Quarter PIRLS International Benchmark – Example Item 1
† Netherlands 95 (1.0) Hungary 88 (1.2) Iran, Islamic Rep. of 82 (1.6)
Czech Republic 94 (1.5) Norway 87 (1.4) Colombia 80 (1.9)1 Lithuania 94 (1.0) 2a Russian Federation 87 (1.6) Macedonia, Rep. of 73 (2.3)
Latvia 93 (1.1) Slovenia 86 (1.3) Argentina 69 (2.1)
Italy 93 (1.0) Romania 86 (1.6) Turkey 68 (1.6)2a Greece 93 (1.1) International Avg. 86 (0.3) Kuwait 64 (2.7)
* 1 Canada (O,Q) 93 (0.9) ‡ Morocco 57 (2.8)2b Israel 93 (0.8) Belize 49 (4.0)
† Scotland 92 (1.2)
Bulgaria 92 (1.3)
Iceland 91 (1.5)
Slovak Republic 91 (1.1)†2a England 91 (1.2)
France 91 (1.1)
Sweden 91 (1.0)† United States 91 (1.3)
Hong Kong, SAR 91 (0.9)
Germany 90 (0.8)
New Zealand 90 (1.7)
Singapore 90 (0.9)
Moldova, Rep. of 89 (1.1)
Cyprus 89 (1.1)
* Ontario (Canada) 94 (1.1)
* Quebec (Canada) 90 (1.4)
Purpose: Literary Experience
1 Point: Full Credit Sample Response and Results
Percentage of Students Obtaining Full Credit
Country Average Significantly Higherthan International Average
No Statistically Significant DifferenceBetween Country Averageand International Average
Country Average Significantly Lowerthan International Average
* Canada is represented by the provinces of Ontario and Quebec only. The internationalaverage does not include the results from these provinces separately.
† Met guidelines for sample participation rates only after replacement schools were included(see Exhibit A.7).
‡ Nearly satisfying guidelines for sample participation rates after replacement schools wereincluded (see Exhibit A.7).
1 National Desired Population does not cover all of International Desired Population. Becausecoverage falls below 65%, Canada is annotated Canada (O, Q) for the provinces ofOntario and Quebec only.
2a National Defined Population covers less than 95% of National Desired Population (seeExhibit A.4).
2b National Defined Population covers less than 80% of National Desired Population (seeExhibit A.4).
( ) Standard errors appear in parentheses. Because results are rounded to the nearest wholenumber, some totals may appear inconsistent.
SOU
RCE:
IEA
Pro
gres
s in
Inte
rnat
iona
l Rea
ding
Lite
racy
Stu
dy (P
IRLS
) 200
1.
ISC 4th GradePIRLS 2001
Copyright
prote
cted by IE
A.
This ite
m m
ay not be use
d
for c
omm
ercial p
urpose
s
without e
xpress
permiss
ion from
IEA.
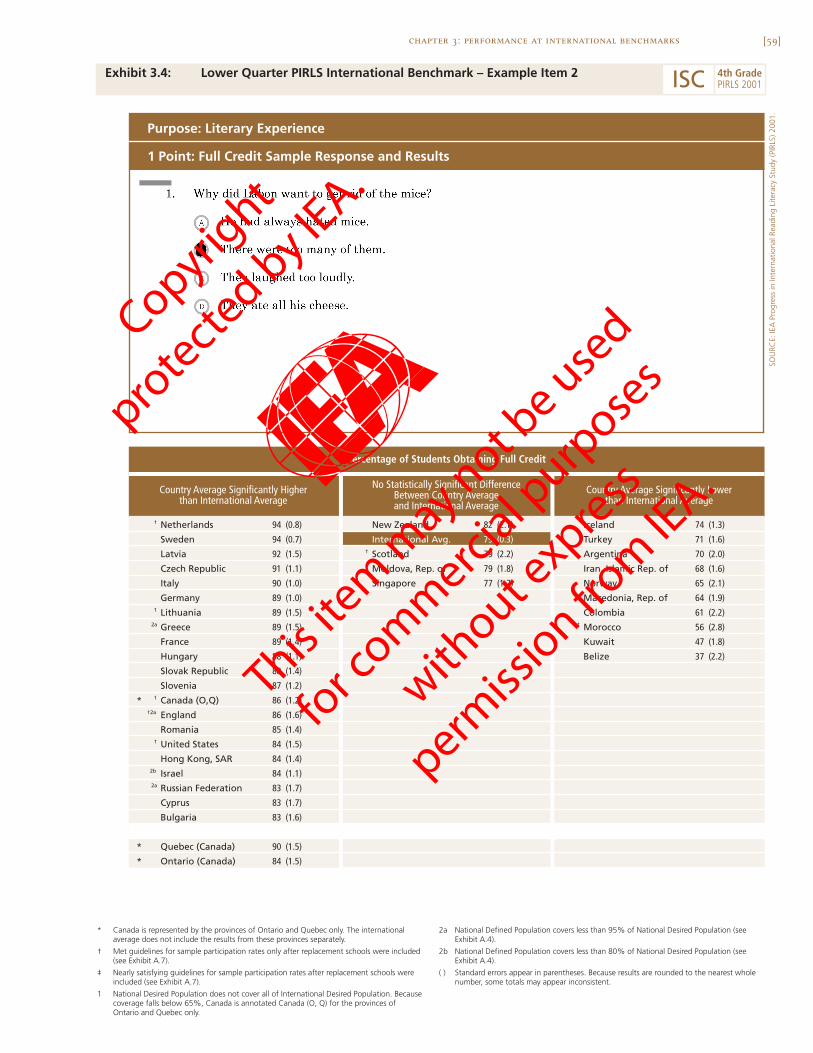
[59]chapter 3: performance at international benchmarks
Exhibit 3.4: Lower Quarter PIRLS International Benchmark – Example Item 2
SOU
RCE:
IEA
Pro
gres
s in
Inte
rnat
iona
l Rea
ding
Lite
racy
Stu
dy (P
IRLS
) 200
1.
Purpose: Literary Experience
1 Point: Full Credit Sample Response and Results
Percentage of Students Obtaining Full Credit
Country Average Significantly Higherthan International Average
No Statistically Significant DifferenceBetween Country Averageand International Average
Country Average Significantly Lowerthan International Average
† Netherlands 94 (0.8) New Zealand 82 (2.1) Iceland 74 (1.3)
Sweden 94 (0.7) International Avg. 79 (0.3) Turkey 71 (1.6)
Latvia 92 (1.5) † Scotland 79 (2.2) Argentina 70 (2.0)
Czech Republic 91 (1.1) Moldova, Rep. of 79 (1.8) Iran, Islamic Rep. of 68 (1.6)
Italy 90 (1.0) Singapore 77 (1.7) Norway 65 (2.1)
Germany 89 (1.0) Macedonia, Rep. of 64 (1.9)1 Lithuania 89 (1.5) Colombia 61 (2.2)
2a Greece 89 (1.5) ‡ Morocco 56 (2.8)
France 89 (1.4) Kuwait 47 (1.8)
Hungary 88 (1.1) Belize 37 (2.2)
Slovak Republic 88 (1.4)
Slovenia 87 (1.2)
* 1 Canada (O,Q) 86 (1.2)†2a England 86 (1.6)
Romania 85 (1.4)† United States 84 (1.5)
Hong Kong, SAR 84 (1.4)2b Israel 84 (1.1)2a Russian Federation 83 (1.7)
Cyprus 83 (1.7)
Bulgaria 83 (1.6)
* Quebec (Canada) 90 (1.5)
* Ontario (Canada) 84 (1.5)
* Canada is represented by the provinces of Ontario and Quebec only. The internationalaverage does not include the results from these provinces separately.
† Met guidelines for sample participation rates only after replacement schools were included(see Exhibit A.7).
‡ Nearly satisfying guidelines for sample participation rates after replacement schools wereincluded (see Exhibit A.7).
1 National Desired Population does not cover all of International Desired Population. Becausecoverage falls below 65%, Canada is annotated Canada (O, Q) for the provinces ofOntario and Quebec only.
2a National Defined Population covers less than 95% of National Desired Population (seeExhibit A.4).
2b National Defined Population covers less than 80% of National Desired Population (seeExhibit A.4).
( ) Standard errors appear in parentheses. Because results are rounded to the nearest wholenumber, some totals may appear inconsistent.
ISC 4th GradePIRLS 2001
Copyright
prote
cted by IE
A.
This ite
m m
ay not be use
d
for c
omm
ercial p
urpose
s
without e
xpress
permiss
ion from
IEA.
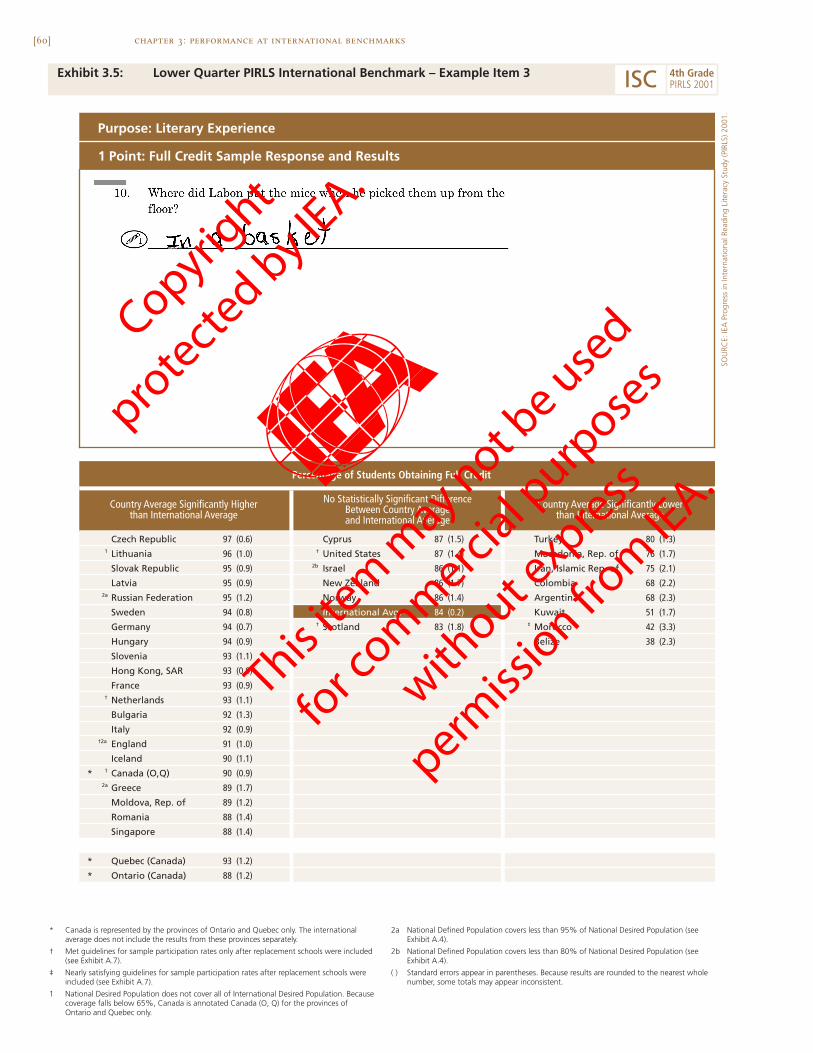
[60] chapter 3: performance at international benchmarks
Exhibit 3.5: Lower Quarter PIRLS International Benchmark – Example Item 3
Czech Republic 97 (0.6) Cyprus 87 (1.5) Turkey 80 (1.3)1 Lithuania 96 (1.0) † United States 87 (1.4) Macedonia, Rep. of 76 (1.7)
Slovak Republic 95 (0.9) 2b Israel 86 (1.1) Iran, Islamic Rep. of 75 (2.1)
Latvia 95 (0.9) New Zealand 86 (1.7) Colombia 68 (2.2)2a Russian Federation 95 (1.2) Norway 86 (1.4) Argentina 68 (2.3)
Sweden 94 (0.8) International Avg. 84 (0.2) Kuwait 51 (1.7)
Germany 94 (0.7) † Scotland 83 (1.8) ‡ Morocco 42 (3.3)
Hungary 94 (0.9) Belize 38 (2.3)
Slovenia 93 (1.1)
Hong Kong, SAR 93 (0.9)
France 93 (0.9)† Netherlands 93 (1.1)
Bulgaria 92 (1.3)
Italy 92 (0.9)†2a England 91 (1.0)
Iceland 90 (1.1)
* 1 Canada (O,Q) 90 (0.9)2a Greece 89 (1.7)
Moldova, Rep. of 89 (1.2)
Romania 88 (1.4)
Singapore 88 (1.4)
* Quebec (Canada) 93 (1.2)
* Ontario (Canada) 88 (1.2)
Purpose: Literary Experience
1 Point: Full Credit Sample Response and Results
No Statistically Significant DifferenceBetween Country Averageand International Average
Country Average Significantly Lowerthan International Average
Percentage of Students Obtaining Full Credit
Country Average Significantly Higherthan International Average
* Canada is represented by the provinces of Ontario and Quebec only. The internationalaverage does not include the results from these provinces separately.
† Met guidelines for sample participation rates only after replacement schools were included(see Exhibit A.7).
‡ Nearly satisfying guidelines for sample participation rates after replacement schools wereincluded (see Exhibit A.7).
1 National Desired Population does not cover all of International Desired Population. Becausecoverage falls below 65%, Canada is annotated Canada (O, Q) for the provinces ofOntario and Quebec only.
2a National Defined Population covers less than 95% of National Desired Population (seeExhibit A.4).
2b National Defined Population covers less than 80% of National Desired Population (seeExhibit A.4).
( ) Standard errors appear in parentheses. Because results are rounded to the nearest wholenumber, some totals may appear inconsistent.
SOU
RCE:
IEA
Pro
gres
s in
Inte
rnat
iona
l Rea
ding
Lite
racy
Stu
dy (P
IRLS
) 200
1.
ISC 4th GradePIRLS 2001
Copyright
prote
cted by IE
A.
This ite
m m
ay not be use
d
for c
omm
ercial p
urpose
s
without e
xpress
permiss
ion from
IEA.

[61]chapter 3: performance at international benchmarks
Exhibit 3.6: Lower Quarter PIRLS International Benchmark – Example Item 4
SOU
RCE:
IEA
Pro
gres
s in
Inte
rnat
iona
l Rea
ding
Lite
racy
Stu
dy (P
IRLS
) 200
1.
Germany 93 (0.8) Iceland 81 (2.0) Cyprus 74 (1.7)
Sweden 92 (0.8) New Zealand 81 (1.8) Turkey 69 (1.5)† Netherlands 91 (1.4) France 80 (1.4) Argentina 63 (2.6)
†2a England 88 (1.4) 2b Israel 80 (1.4) Iran, Islamic Rep. of 62 (1.9)
Hong Kong, SAR 88 (1.1) Romania 78 (2.2) Macedonia, Rep. of 61 (1.9)2a Greece 87 (1.5) International Avg. 78 (0.3) Colombia 57 (1.9)1 Lithuania 87 (1.3) Slovenia 76 (1.7) Kuwait 54 (2.1)
Hungary 87 (1.2) Moldova, Rep. of 76 (2.5) Belize 53 (3.5)2a Russian Federation 86 (1.4) ‡ Morocco 47 (2.5)
Latvia 86 (1.5)
Singapore 86 (1.2)
Czech Republic 85 (1.8)
Bulgaria 85 (1.4)
Slovak Republic 85 (1.3)
Italy 85 (1.5)
* 1 Canada (O,Q) 84 (1.1)
Norway 84 (1.3)† Scotland 83 (1.6)† United States 83 (1.5)
* Ontario (Canada) 86 (1.4) * Quebec (Canada) 81 (1.5)
Country Average Significantly Higherthan International Average
Country Average Significantly Lowerthan International Average
No Statistically Significant DifferenceBetween Country Averageand International Average
Purpose: Acquire and Use Information
1 Point: Full Credit Sample Response and Results
Percentage of Students Obtaining Full Credit
ISC 4th GradePIRLS 2001
* Canada is represented by the provinces of Ontario and Quebec only. The internationalaverage does not include the results from these provinces separately.
† Met guidelines for sample participation rates only after replacement schools were included(see Exhibit A.7).
‡ Nearly satisfying guidelines for sample participation rates after replacement schools wereincluded (see Exhibit A.7).
1 National Desired Population does not cover all of International Desired Population. Becausecoverage falls below 65%, Canada is annotated Canada (O, Q) for the provinces ofOntario and Quebec only.
2a National Defined Population covers less than 95% of National Desired Population (seeExhibit A.4).
2b National Defined Population covers less than 80% of National Desired Population (seeExhibit A.4).
( ) Standard errors appear in parentheses. Because results are rounded to the nearest wholenumber, some totals may appear inconsistent.
Copyright
prote
cted by IE
A.
This ite
m m
ay not be use
d
for c
omm
ercial p
urpose
s
without e
xpress
permiss
ion from
IEA.
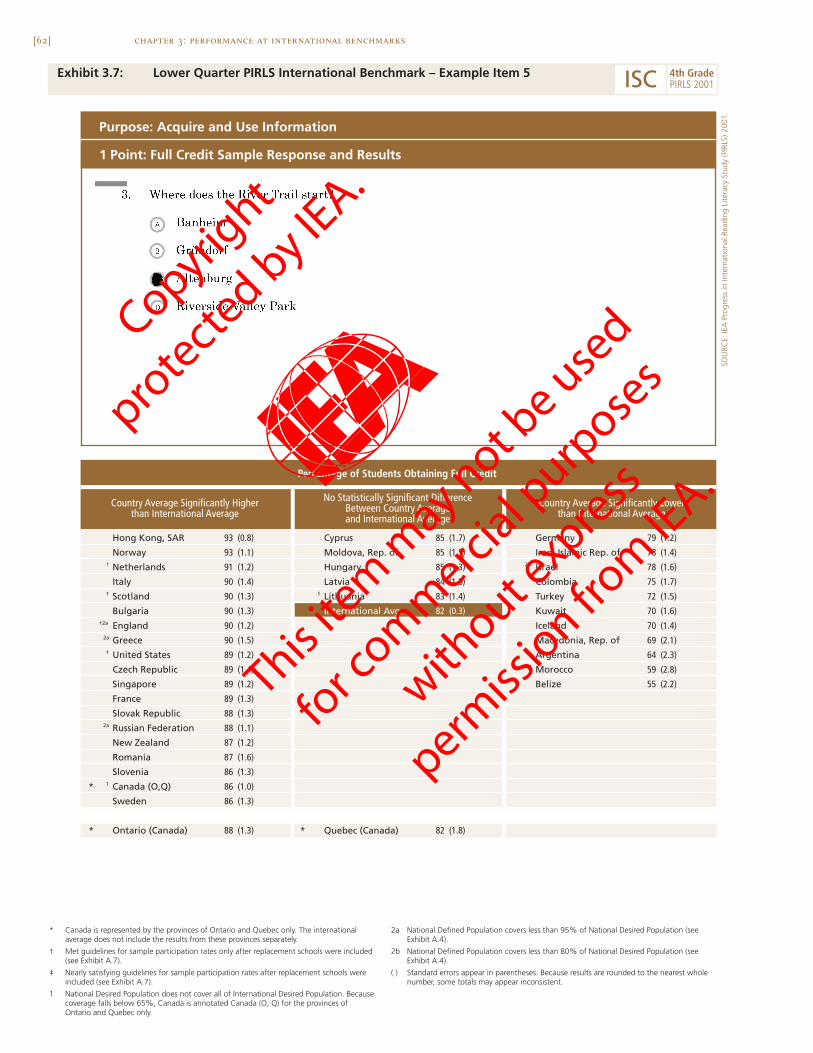
[62] chapter 3: performance at international benchmarks
Exhibit 3.7: Lower Quarter PIRLS International Benchmark – Example Item 5
Hong Kong, SAR 93 (0.8) Cyprus 85 (1.7) Germany 79 (1.2)
Norway 93 (1.1) Moldova, Rep. of 85 (1.5) Iran, Islamic Rep. of 78 (1.4)† Netherlands 91 (1.2) Hungary 85 (1.3) 2b Israel 78 (1.6)
Italy 90 (1.4) Latvia 84 (1.8) Colombia 75 (1.7)† Scotland 90 (1.3) 1 Lithuania 83 (1.4) Turkey 72 (1.5)
Bulgaria 90 (1.3) International Avg. 82 (0.3) Kuwait 70 (1.6)†2a England 90 (1.2) Iceland 70 (1.4)
2a Greece 90 (1.5) Macedonia, Rep. of 69 (2.1)† United States 89 (1.2) Argentina 64 (2.3)
Czech Republic 89 (1.4) ‡ Morocco 59 (2.8)
Singapore 89 (1.2) Belize 55 (2.2)
France 89 (1.3)
Slovak Republic 88 (1.3)2a Russian Federation 88 (1.1)
New Zealand 87 (1.2)
Romania 87 (1.6)
Slovenia 86 (1.3)
* 1 Canada (O,Q) 86 (1.0)
Sweden 86 (1.3)
* Ontario (Canada) 88 (1.3) * Quebec (Canada) 82 (1.8)
Percentage of Students Obtaining Full Credit
Purpose: Acquire and Use Information
1 Point: Full Credit Sample Response and Results
Country Average Significantly Lowerthan International Average
No Statistically Significant DifferenceBetween Country Averageand International Average
Country Average Significantly Higherthan International Average
SOU
RCE:
IEA
Pro
gres
s in
Inte
rnat
iona
l Rea
ding
Lite
racy
Stu
dy (P
IRLS
) 200
1.
ISC 4th GradePIRLS 2001
* Canada is represented by the provinces of Ontario and Quebec only. The internationalaverage does not include the results from these provinces separately.
† Met guidelines for sample participation rates only after replacement schools were included(see Exhibit A.7).
‡ Nearly satisfying guidelines for sample participation rates after replacement schools wereincluded (see Exhibit A.7).
1 National Desired Population does not cover all of International Desired Population. Becausecoverage falls below 65%, Canada is annotated Canada (O, Q) for the provinces ofOntario and Quebec only.
2a National Defined Population covers less than 95% of National Desired Population (seeExhibit A.4).
2b National Defined Population covers less than 80% of National Desired Population (seeExhibit A.4).
( ) Standard errors appear in parentheses. Because results are rounded to the nearest wholenumber, some totals may appear inconsistent.
Copyright
prote
cted by IE
A.
This ite
m m
ay not be use
d
for c
omm
ercial p
urpose
s
without e
xpress
permiss
ion from
IEA.

[63]chapter 3: performance at international benchmarks
Exhibit 3.8: Lower Quarter PIRLS International Benchmark – Example Item 6
SOU
RCE:
IEA
Pro
gres
s in
Inte
rnat
iona
l Rea
ding
Lite
racy
Stu
dy (P
IRLS
) 200
1.
Hong Kong, SAR 92 (1.0) Cyprus 79 (1.8) 2a Greece 66 (3.1)
France 90 (1.5) Romania 77 (2.6) Argentina 65 (2.1)
Sweden 90 (1.0) Norway 77 (1.5) Moldova, Rep. of 60 (2.7)
Singapore 90 (1.1) Slovenia 76 (1.7) Kuwait 58 (1.7)
* 1 Canada (O,Q) 90 (1.0) International Avg. 76 (0.3) Macedonia, Rep. of 57 (2.4)
Germany 90 (0.8) Colombia 54 (2.1)
Italy 89 (1.2) Turkey 53 (1.8)†2a England 89 (1.2) Iran, Islamic Rep. of 47 (1.7)
Hungary 89 (1.1) Belize 38 (2.1)† Netherlands 88 (1.5) ‡ Morocco 37 (3.5)† United States 88 (1.4)† Scotland 86 (1.5)
Czech Republic 86 (1.4)
Latvia 85 (1.3)
Bulgaria 84 (1.6)2a Russian Federation 84 (1.3)1 Lithuania 83 (1.6)
2b Israel 82 (1.4)
New Zealand 81 (1.8)
Iceland 80 (1.3)
Slovak Republic 79 (1.6)
* Quebec (Canada) 90 (1.4)
* Ontario (Canada) 90 (1.4)
Purpose: Acquire and Use Information
1 Point: Full Credit Sample Response and Results
Percentage of Students Obtaining Full Credit
Country Average Significantly Higherthan International Average
No Statistically Significant DifferenceBetween Country Average and
International Average
Country Average Significantly Lowerthan International Average
ISC 4th GradePIRLS 2001
* Canada is represented by the provinces of Ontario and Quebec only. The internationalaverage does not include the results from these provinces separately.
† Met guidelines for sample participation rates only after replacement schools were included(see Exhibit A.7).
‡ Nearly satisfying guidelines for sample participation rates after replacement schools wereincluded (see Exhibit A.7).
1 National Desired Population does not cover all of International Desired Population. Becausecoverage falls below 65%, Canada is annotated Canada (O, Q) for the provinces ofOntario and Quebec only.
2a National Defined Population covers less than 95% of National Desired Population (seeExhibit A.4).
2b National Defined Population covers less than 80% of National Desired Population (seeExhibit A.4).
( ) Standard errors appear in parentheses. Because results are rounded to the nearest wholenumber, some totals may appear inconsistent.
Copyright
prote
cted by IE
A.
This ite
m m
ay not be use
d
for c
omm
ercial p
urpose
s
without e
xpress
permiss
ion from
IEA.
[64] chapter 3: performance at international benchmarks
Achievement at the Median Benchmark
Exhibit 3.9 describes reading skills and strategies demonstrated by studentsreaching the Median Benchmark. These students demonstrated the ability tomake elementary inferences and interpretations. In contrast to the LowerQuarter Benchmark, inferences based on literary texts went beyond singlephrases or sentences to sets of clearly related sentences or even different partsof the text. In informational texts, students reaching the Median Benchmarkwere able to locate specific sections of text to retrieve information. In someinstances, they were able to provide textually-based support for their ideas.Another advance for students reaching this level was the ability to make obser-vations about whole texts such as recognizing the overall message or givinga general reaction. Finally, students achieving at or above the Median Bench-mark showed initial understanding of elements of story structure.
As shown in Exhibit 3.10, presenting Example Item 7 from the “Hare”story, students reaching the Median Benchmark were able to give a story-based reason for why the lion liked the hare (full credit, 1 point). In ExampleItem 8 (Exhibit 3.11), they described how the hare’s feelings changed duringthe story by providing an appropriate feeling and explanation for both thebeginning and the ending of the story (full credit, 2 points). On average, inter-nationally, about half the students received full credit on these two questions(51% and 56%, respectively). Romanian students (77% full credit) had thehighest achievement on Example Item 7. Especially Swedish students, but alsothose in the United States and The Netherlands, were successful on ExampleItem 8 with four-fifths or more providing a complete answer.
Exhibit 3.12 contains Example Item 9 illustrating that students at theMedian Benchmark were able to identify the mood of an entire story. ExampleItem 9 is a multiple-choice question asking students to characterize the entire“Mice” story as “funny and clever.” In general, students did relatively wellon this item (international average 68%), especially in Greece (90%), Cyprus(87%), and The Netherlands (87%).
In reading informative texts, students at or above the Median Bench-mark were likely to correctly answer a multiple-choice item based on the“Pufflings” article (see Example Item 10 in Exhibit 3.13). To answer correctly,
[65]chapter 3: performance at international benchmarks
students needed to locate a specific part of the text without the aid of sectionheadings and make an inference about the pufflings being in danger of beingrun over by cars and trucks. The international average was 71 percent. Sweden,Germany, The Netherlands, France, and the Russian Federation had 85 percentor more of their students answering correctly.
As illustrated by Example Item 11 in Exhibit 3.14, students reachingthe Median Benchmark demonstrated the ability to locate specific informa-tion in tabular form in the River Trail leaflet and then correctly infer the costof hiring a bike (full credit, 1 point). The international average was 70 percent.Only in Sweden did 90 percent or more of students (91%) answer correctly;85 to 89 percent did so in France, Hong Kong, England, and The Netherlands.
As shown in Example Item 12 (Exhibit 3.15), students reaching theMedian level also were able to identify at least one type of rental bike equip-ment appropriate for children (partial credit, 1 point). The international averagewas 64 percent for students providing at least one type of equipment. It shouldbe noted that students providing two types of equipment (full credit, 2 points)also would have reached the Median Benchmark. The results show that exceptin the lower-performing countries, students providing one type of children’srental equipment also gave a second type.
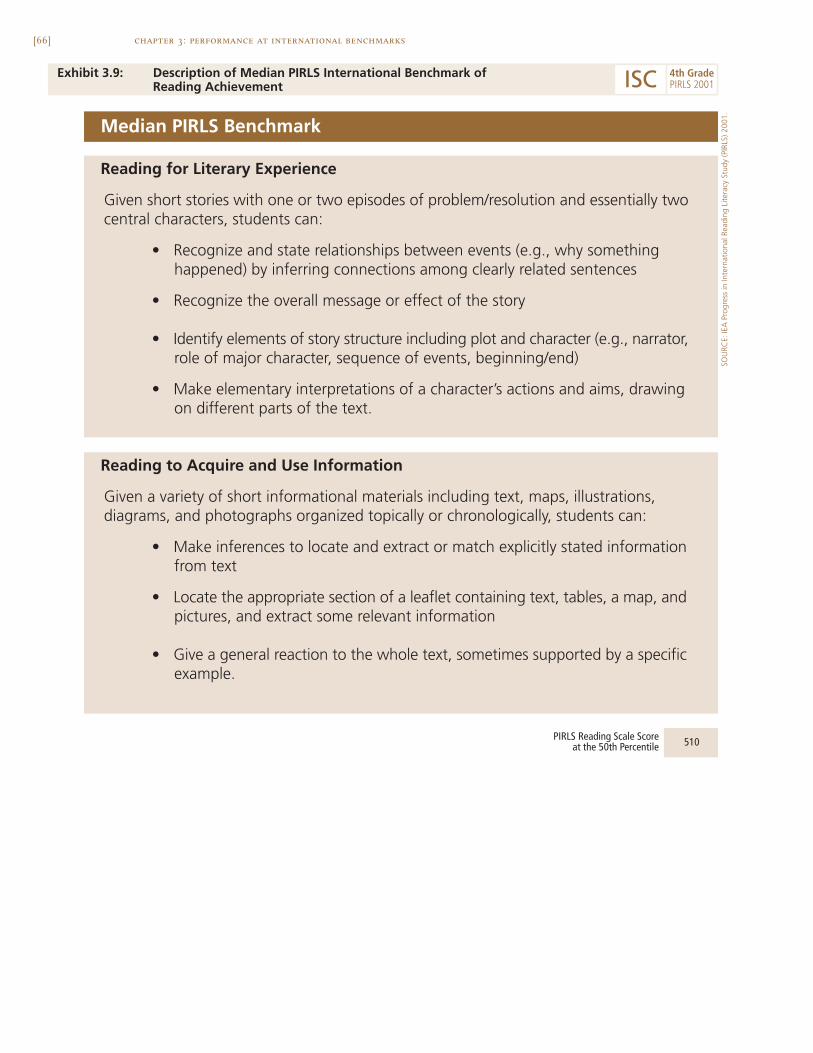
[66] chapter 3: performance at international benchmarks
Exhibit 3.9: Description of Median PIRLS International Benchmark of Reading Achievement
Median PIRLS Benchmark
Reading for Literary Experience
Given short stories with one or two episodes of problem/resolution and essentially twocentral characters, students can:
• Recognize and state relationships between events (e.g., why somethinghappened) by inferring connections among clearly related sentences
• Recognize the overall message or effect of the story
• Identify elements of story structure including plot and character (e.g., narrator,role of major character, sequence of events, beginning/end)
• Make elementary interpretations of a character’s actions and aims, drawingon different parts of the text.
510PIRLS Reading Scale Score at the 50th Percentile
Reading to Acquire and Use Information
Given a variety of short informational materials including text, maps, illustrations,diagrams, and photographs organized topically or chronologically, students can:
• Make inferences to locate and extract or match explicitly stated informationfrom text
• Locate the appropriate section of a leaflet containing text, tables, a map, andpictures, and extract some relevant information
• Give a general reaction to the whole text, sometimes supported by a specificexample.
SOU
RCE:
IEA
Pro
gres
s in
Inte
rnat
iona
l Rea
ding
Lite
racy
Stu
dy (P
IRLS
) 200
1.
ISC 4th GradePIRLS 2001
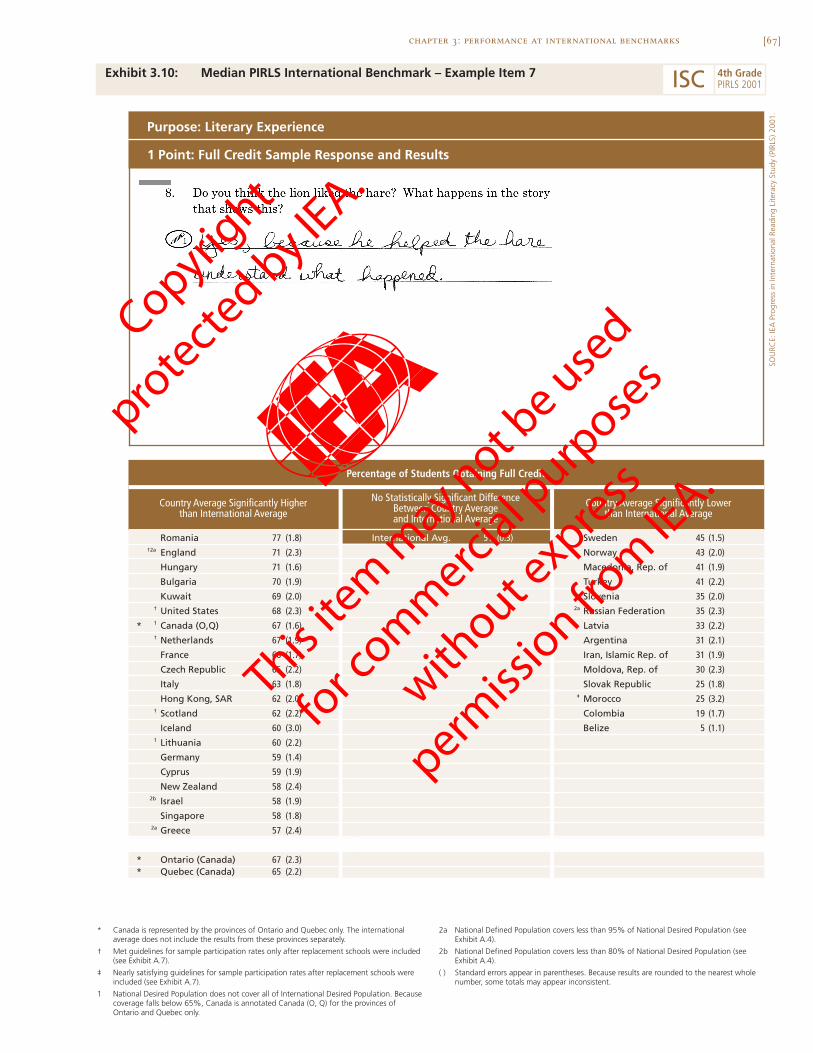
[67]chapter 3: performance at international benchmarks
Exhibit 3.10: Median PIRLS International Benchmark – Example Item 7
SOU
RCE:
IEA
Pro
gres
s in
Inte
rnat
iona
l Rea
ding
Lite
racy
Stu
dy (P
IRLS
) 200
1.
Romania 77 (1.8) International Avg. 51 (0.3) Sweden 45 (1.5)†2a England 71 (2.3) Norway 43 (2.0)
Hungary 71 (1.6) Macedonia, Rep. of 41 (1.9)
Bulgaria 70 (1.9) Turkey 41 (2.2)
Kuwait 69 (2.0) Slovenia 35 (2.0)† United States 68 (2.3) 2a Russian Federation 35 (2.3)
* 1 Canada (O,Q) 67 (1.6) Latvia 33 (2.2)† Netherlands 67 (1.9) Argentina 31 (2.1)
France 66 (1.7) Iran, Islamic Rep. of 31 (1.9)
Czech Republic 65 (2.2) Moldova, Rep. of 30 (2.3)
Italy 63 (1.8) Slovak Republic 25 (1.8)
Hong Kong, SAR 62 (2.0) ‡ Morocco 25 (3.2)† Scotland 62 (2.2) Colombia 19 (1.7)
Iceland 60 (3.0) Belize 5 (1.1)1 Lithuania 60 (2.2)
Germany 59 (1.4)
Cyprus 59 (1.9)
New Zealand 58 (2.4)2b Israel 58 (1.9)
Singapore 58 (1.8)2a Greece 57 (2.4)
* Ontario (Canada) 67 (2.3)* Quebec (Canada) 65 (2.2)
Purpose: Literary Experience
Percentage of Students Obtaining Full Credit
Country Average Significantly Lowerthan International Average
No Statistically Significant DifferenceBetween Country Averageand International Average
1 Point: Full Credit Sample Response and Results
Country Average Significantly Higherthan International Average
ISC 4th GradePIRLS 2001
* Canada is represented by the provinces of Ontario and Quebec only. The internationalaverage does not include the results from these provinces separately.
† Met guidelines for sample participation rates only after replacement schools were included(see Exhibit A.7).
‡ Nearly satisfying guidelines for sample participation rates after replacement schools wereincluded (see Exhibit A.7).
1 National Desired Population does not cover all of International Desired Population. Becausecoverage falls below 65%, Canada is annotated Canada (O, Q) for the provinces ofOntario and Quebec only.
2a National Defined Population covers less than 95% of National Desired Population (seeExhibit A.4).
2b National Defined Population covers less than 80% of National Desired Population (seeExhibit A.4).
( ) Standard errors appear in parentheses. Because results are rounded to the nearest wholenumber, some totals may appear inconsistent.
Copyright
prote
cted by IE
A.
This ite
m m
ay not be use
d
for c
omm
ercial p
urpose
s
without e
xpress
permiss
ion from
IEA.
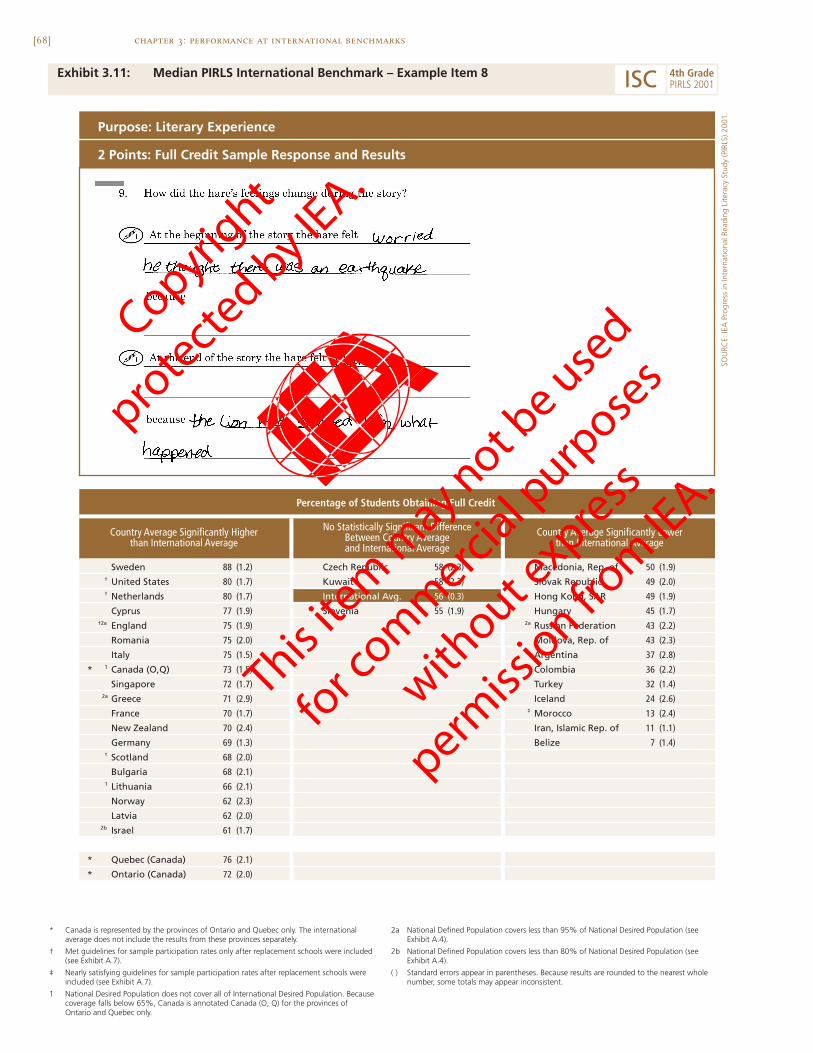
[68] chapter 3: performance at international benchmarks
Exhibit 3.11: Median PIRLS International Benchmark – Example Item 8
Sweden 88 (1.2) Czech Republic 58 (2.3) Macedonia, Rep. of 50 (1.9)† United States 80 (1.7) Kuwait 58 (2.3) Slovak Republic 49 (2.0)† Netherlands 80 (1.7) International Avg. 56 (0.3) Hong Kong, SAR 49 (1.9)
Cyprus 77 (1.9) Slovenia 55 (1.9) Hungary 45 (1.7)†2a England 75 (1.9) 2a Russian Federation 43 (2.2)
Romania 75 (2.0) Moldova, Rep. of 43 (2.3)
Italy 75 (1.5) Argentina 37 (2.8)
* 1 Canada (O,Q) 73 (1.5) Colombia 36 (2.2)
Singapore 72 (1.7) Turkey 32 (1.4)2a Greece 71 (2.9) Iceland 24 (2.6)
France 70 (1.7) ‡ Morocco 13 (2.4)
New Zealand 70 (2.4) Iran, Islamic Rep. of 11 (1.1)
Germany 69 (1.3) Belize 7 (1.4)† Scotland 68 (2.0)
Bulgaria 68 (2.1)1 Lithuania 66 (2.1)
Norway 62 (2.3)
Latvia 62 (2.0)2b Israel 61 (1.7)
* Quebec (Canada) 76 (2.1)
* Ontario (Canada) 72 (2.0)
Purpose: Literary Experience
2 Points: Full Credit Sample Response and Results
Country Average Significantly Higherthan International Average
Percentage of Students Obtaining Full Credit
Country Average Significantly Lowerthan International Average
No Statistically Significant DifferenceBetween Country Averageand International Average
SOU
RCE:
IEA
Pro
gres
s in
Inte
rnat
iona
l Rea
ding
Lite
racy
Stu
dy (P
IRLS
) 200
1.
ISC 4th GradePIRLS 2001
* Canada is represented by the provinces of Ontario and Quebec only. The internationalaverage does not include the results from these provinces separately.
† Met guidelines for sample participation rates only after replacement schools were included(see Exhibit A.7).
‡ Nearly satisfying guidelines for sample participation rates after replacement schools wereincluded (see Exhibit A.7).
1 National Desired Population does not cover all of International Desired Population. Becausecoverage falls below 65%, Canada is annotated Canada (O, Q) for the provinces ofOntario and Quebec only.
2a National Defined Population covers less than 95% of National Desired Population (seeExhibit A.4).
2b National Defined Population covers less than 80% of National Desired Population (seeExhibit A.4).
( ) Standard errors appear in parentheses. Because results are rounded to the nearest wholenumber, some totals may appear inconsistent.
Copyright
prote
cted by IE
A.
This ite
m m
ay not be use
d
for c
omm
ercial p
urpose
s
without e
xpress
permiss
ion from
IEA.
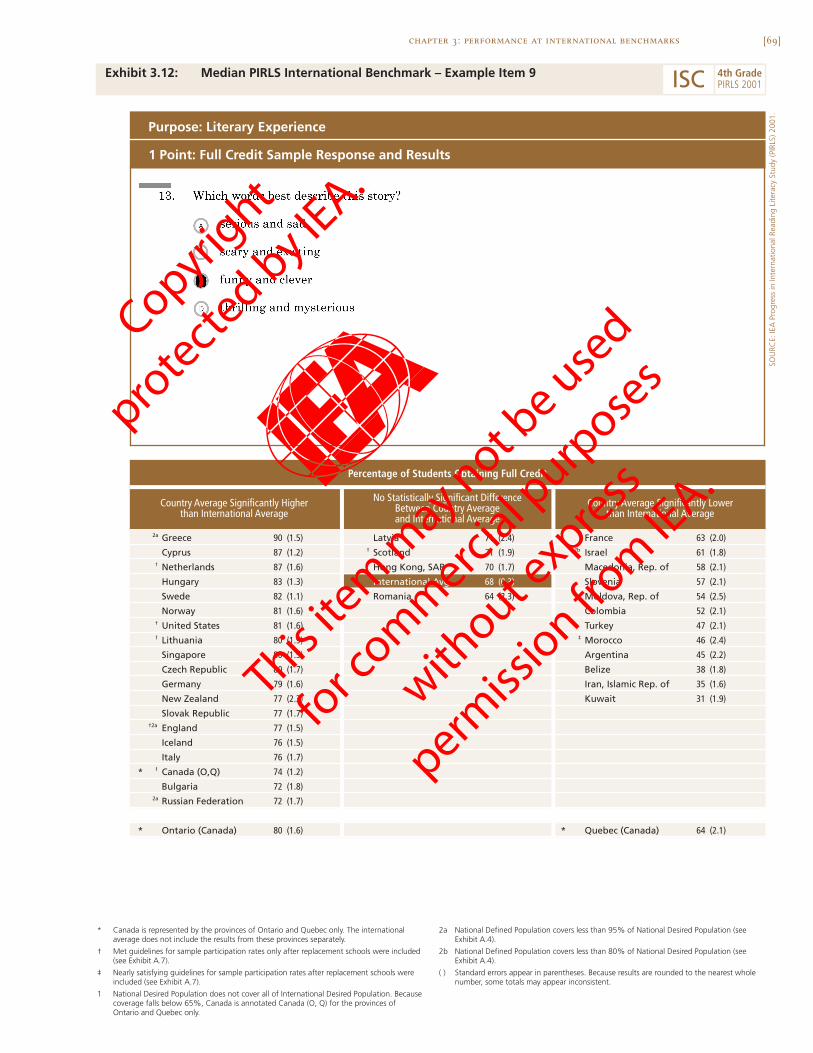
[69]chapter 3: performance at international benchmarks
Exhibit 3.12: Median PIRLS International Benchmark – Example Item 9
SOU
RCE:
IEA
Pro
gres
s in
Inte
rnat
iona
l Rea
ding
Lite
racy
Stu
dy (P
IRLS
) 200
1.
2a Greece 90 (1.5) Latvia 71 (2.4) France 63 (2.0)
Cyprus 87 (1.2) † Scotland 71 (1.9) 2b Israel 61 (1.8)† Netherlands 87 (1.6) Hong Kong, SAR 70 (1.7) Macedonia, Rep. of 58 (2.1)
Hungary 83 (1.3) International Avg. 68 (0.3) Slovenia 57 (2.1)
Swede 82 (1.1) Romania 64 (2.3) Moldova, Rep. of 54 (2.5)
Norway 81 (1.6) Colombia 52 (2.1)† United States 81 (1.6) Turkey 47 (2.1)1 Lithuania 80 (1.9) ‡ Morocco 46 (2.4)
Singapore 80 (1.5) Argentina 45 (2.2)
Czech Republic 80 (1.7) Belize 38 (1.8)
Germany 79 (1.6) Iran, Islamic Rep. of 35 (1.6)
New Zealand 77 (2.3) Kuwait 31 (1.9)
Slovak Republic 77 (1.7)†2a England 77 (1.5)
Iceland 76 (1.5)
Italy 76 (1.7)
* 1 Canada (O,Q) 74 (1.2)
Bulgaria 72 (1.8)2a Russian Federation 72 (1.7)
* Ontario (Canada) 80 (1.6) * Quebec (Canada) 64 (2.1)
1 Point: Full Credit Sample Response and Results
Purpose: Literary Experience
No Statistically Significant DifferenceBetween Country Averageand International Average
Country Average Significantly Lowerthan International Average
Percentage of Students Obtaining Full Credit
Country Average Significantly Higherthan International Average
ISC 4th GradePIRLS 2001
* Canada is represented by the provinces of Ontario and Quebec only. The internationalaverage does not include the results from these provinces separately.
† Met guidelines for sample participation rates only after replacement schools were included(see Exhibit A.7).
‡ Nearly satisfying guidelines for sample participation rates after replacement schools wereincluded (see Exhibit A.7).
1 National Desired Population does not cover all of International Desired Population. Becausecoverage falls below 65%, Canada is annotated Canada (O, Q) for the provinces ofOntario and Quebec only.
2a National Defined Population covers less than 95% of National Desired Population (seeExhibit A.4).
2b National Defined Population covers less than 80% of National Desired Population (seeExhibit A.4).
( ) Standard errors appear in parentheses. Because results are rounded to the nearest wholenumber, some totals may appear inconsistent.
Copyright
prote
cted by IE
A.
This ite
m m
ay not be use
d
for c
omm
ercial p
urpose
s
without e
xpress
permiss
ion from
IEA.
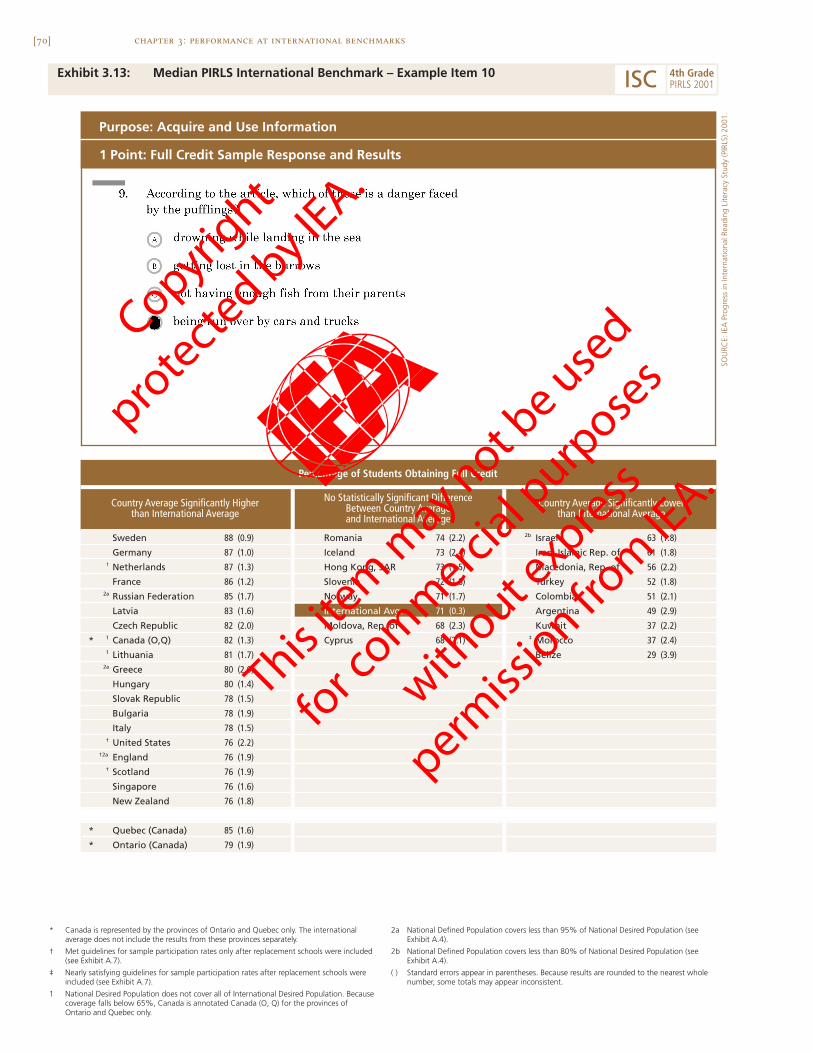
[70] chapter 3: performance at international benchmarks
Exhibit 3.13: Median PIRLS International Benchmark – Example Item 10
Sweden 88 (0.9) Romania 74 (2.2) 2b Israel 63 (1.8)
Germany 87 (1.0) Iceland 73 (2.4) Iran, Islamic Rep. of 61 (1.8)† Netherlands 87 (1.3) Hong Kong, SAR 73 (1.5) Macedonia, Rep. of 56 (2.2)
France 86 (1.2) Slovenia 72 (1.8) Turkey 52 (1.8)2a Russian Federation 85 (1.7) Norway 71 (1.7) Colombia 51 (2.1)
Latvia 83 (1.6) International Avg. 71 (0.3) Argentina 49 (2.9)
Czech Republic 82 (2.0) Moldova, Rep. of 68 (2.3) Kuwait 37 (2.2)
* 1 Canada (O,Q) 82 (1.3) Cyprus 68 (2.1) ‡ Morocco 37 (2.4)1 Lithuania 81 (1.7) Belize 29 (3.9)
2a Greece 80 (2.0)
Hungary 80 (1.4)
Slovak Republic 78 (1.5)
Bulgaria 78 (1.9)
Italy 78 (1.5)† United States 76 (2.2)
†2a England 76 (1.9)† Scotland 76 (1.9)
Singapore 76 (1.6)
New Zealand 76 (1.8)
* Quebec (Canada) 85 (1.6)
* Ontario (Canada) 79 (1.9)
Purpose: Acquire and Use Information
1 Point: Full Credit Sample Response and Results
Percentage of Students Obtaining Full Credit
Country Average Significantly Higherthan International Average
No Statistically Significant DifferenceBetween Country Averageand International Average
Country Average Significantly Lowerthan International Average
SOU
RCE:
IEA
Pro
gres
s in
Inte
rnat
iona
l Rea
ding
Lite
racy
Stu
dy (P
IRLS
) 200
1.
ISC 4th GradePIRLS 2001
* Canada is represented by the provinces of Ontario and Quebec only. The internationalaverage does not include the results from these provinces separately.
† Met guidelines for sample participation rates only after replacement schools were included(see Exhibit A.7).
‡ Nearly satisfying guidelines for sample participation rates after replacement schools wereincluded (see Exhibit A.7).
1 National Desired Population does not cover all of International Desired Population. Becausecoverage falls below 65%, Canada is annotated Canada (O, Q) for the provinces ofOntario and Quebec only.
2a National Defined Population covers less than 95% of National Desired Population (seeExhibit A.4).
2b National Defined Population covers less than 80% of National Desired Population (seeExhibit A.4).
( ) Standard errors appear in parentheses. Because results are rounded to the nearest wholenumber, some totals may appear inconsistent.
Copyright
prote
cted by IE
A.
This ite
m m
ay not be use
d
for c
omm
ercial p
urpose
s
without e
xpress
permiss
ion from
IEA.

[71]chapter 3: performance at international benchmarks
Exhibit 3.14: Median PIRLS International Benchmark – Example Item 11
SOU
RCE:
IEA
Pro
gres
s in
Inte
rnat
iona
l Rea
ding
Lite
racy
Stu
dy (P
IRLS
) 200
1.
Sweden 91 (1.1) International Avg. 70 (0.3) Slovenia 63 (2.2)
France 89 (1.1) Moldova, Rep. of 69 (2.5) Argentina 51 (2.5)
Hong Kong, SAR 87 (1.4) 2a Greece 68 (2.3) Turkey 49 (2.1)†2a England 85 (1.4) Cyprus 68 (2.2) Kuwait 46 (2.2)
† Netherlands 85 (1.6) Macedonia, Rep. of 45 (2.4)† Scotland 84 (1.5) Colombia 44 (2.6)
* 1 Canada (O,Q) 84 (1.1) Iran, Islamic Rep. of 35 (1.7)
Germany 84 (1.0) ‡ Morocco 30 (3.8)
Singapore 84 (1.6) Belize 18 (2.0)
Bulgaria 82 (1.6)† United States 82 (1.4)
Czech Republic 81 (1.7)
Latvia 80 (1.8)
Hungary 79 (1.7)1 Lithuania 78 (1.7)
New Zealand 76 (1.7)
Norway 76 (1.7)2b Israel 75 (1.5)
Romania 75 (2.1)2a Russian Federation 75 (2.3)
Slovak Republic 74 (1.7)
Italy 74 (1.9)
Iceland 72 (1.4)
* Quebec (Canada) 89 (1.1)
* Ontario (Canada) 81 (1.7)
Purpose: Acquire and Use Information
1 Point: Full Credit Sample Response and Results
Country Average Significantly Lowerthan International Average
No Statistically Significant DifferenceBetween Country Averageand International Average
Country Average Significantly Higherthan International Average
Percentage of Students Obtaining Full Credit
ISC 4th GradePIRLS 2001
* Canada is represented by the provinces of Ontario and Quebec only. The internationalaverage does not include the results from these provinces separately.
† Met guidelines for sample participation rates only after replacement schools were included(see Exhibit A.7).
‡ Nearly satisfying guidelines for sample participation rates after replacement schools wereincluded (see Exhibit A.7).
1 National Desired Population does not cover all of International Desired Population. Becausecoverage falls below 65%, Canada is annotated Canada (O, Q) for the provinces ofOntario and Quebec only.
2a National Defined Population covers less than 95% of National Desired Population (seeExhibit A.4).
2b National Defined Population covers less than 80% of National Desired Population (seeExhibit A.4).
( ) Standard errors appear in parentheses. Because results are rounded to the nearest wholenumber, some totals may appear inconsistent.
Copyright
prote
cted by IE
A.
This ite
m m
ay not be use
d
for c
omm
ercial p
urpose
s
without e
xpress
permiss
ion from
IEA.
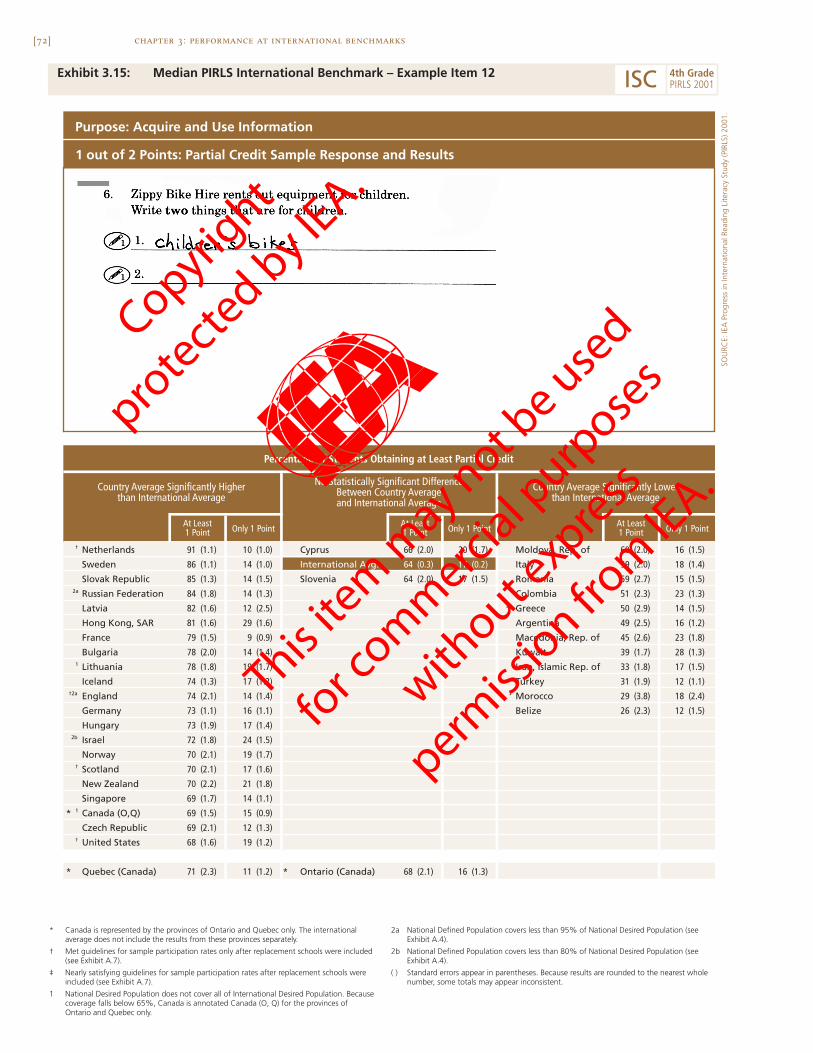
[72] chapter 3: performance at international benchmarks
Exhibit 3.15: Median PIRLS International Benchmark – Example Item 12
† Netherlands 91 (1.1) 10 (1.0) Cyprus 66 (2.0) 20 (1.7) Moldova, Rep. of 60 (2.0) 16 (1.5)
Sweden 86 (1.1) 14 (1.0) International Avg. 64 (0.3) 17 (0.2) Italy 59 (2.0) 18 (1.4)
Slovak Republic 85 (1.3) 14 (1.5) Slovenia 64 (2.0) 17 (1.5) Romania 59 (2.7) 15 (1.5)2a Russian Federation 84 (1.8) 14 (1.3) Colombia 51 (2.3) 23 (1.3)
Latvia 82 (1.6) 12 (2.5) 2a Greece 50 (2.9) 14 (1.5)
Hong Kong, SAR 81 (1.6) 29 (1.6) Argentina 49 (2.5) 16 (1.2)
France 79 (1.5) 9 (0.9) Macedonia, Rep. of 45 (2.6) 23 (1.8)
Bulgaria 78 (2.0) 14 (1.4) Kuwait 39 (1.7) 28 (1.3)1 Lithuania 78 (1.8) 19 (1.7) Iran, Islamic Rep. of 33 (1.8) 17 (1.5)
Iceland 74 (1.3) 17 (1.2) Turkey 31 (1.9) 12 (1.1)†2a England 74 (2.1) 14 (1.4) ‡ Morocco 29 (3.8) 18 (2.4)
Germany 73 (1.1) 16 (1.1) Belize 26 (2.3) 12 (1.5)
Hungary 73 (1.9) 17 (1.4)2b Israel 72 (1.8) 24 (1.5)
Norway 70 (2.1) 19 (1.7)† Scotland 70 (2.1) 17 (1.6)
New Zealand 70 (2.2) 21 (1.8)
Singapore 69 (1.7) 14 (1.1)
* 1 Canada (O,Q) 69 (1.5) 15 (0.9)
Czech Republic 69 (2.1) 12 (1.3)† United States 68 (1.6) 19 (1.2)
* Quebec (Canada) 71 (2.3) 11 (1.2) * Ontario (Canada) 68 (2.1) 16 (1.3)
Percentage of Students Obtaining at Least Partial Credit
Country Average Significantly Higherthan International Average
No Statistically Significant DifferenceBetween Country Averageand International Average
Purpose: Acquire and Use Information
1 out of 2 Points: Partial Credit Sample Response and Results
Country Average Significantly Lowerthan International Average
Only 1 PointAt Least1 Point
At Least1 Point
At Least1 PointOnly 1 Point Only 1 Point
SOU
RCE:
IEA
Pro
gres
s in
Inte
rnat
iona
l Rea
ding
Lite
racy
Stu
dy (P
IRLS
) 200
1.
ISC 4th GradePIRLS 2001
* Canada is represented by the provinces of Ontario and Quebec only. The internationalaverage does not include the results from these provinces separately.
† Met guidelines for sample participation rates only after replacement schools were included(see Exhibit A.7).
‡ Nearly satisfying guidelines for sample participation rates after replacement schools wereincluded (see Exhibit A.7).
1 National Desired Population does not cover all of International Desired Population. Becausecoverage falls below 65%, Canada is annotated Canada (O, Q) for the provinces ofOntario and Quebec only.
2a National Defined Population covers less than 95% of National Desired Population (seeExhibit A.4).
2b National Defined Population covers less than 80% of National Desired Population (seeExhibit A.4).
( ) Standard errors appear in parentheses. Because results are rounded to the nearest wholenumber, some totals may appear inconsistent.
Copyright
prote
cted by IE
A.
This ite
m m
ay not be use
d
for c
omm
ercial p
urpose
s
without e
xpress
permiss
ion from
IEA.
[73]chapter 3: performance at international benchmarks
Achievement at the Upper Quarter Benchmark
At the Upper Quarter Benchmark, in reading the literary texts students demon-strated that they could make inferences based on different aspects of charac-ters and events, and support the inferences with evidence from the text. Inparticular, they could make inferences to describe and contrast characters’actions. They also could recognize some text features in literary texts.
As shown in Exhibit 3.17 containing Example Item 13, students at orabove the Upper Quarter Benchmark received full credit (2 points) by identi-fying two pieces of information in the story about the lion and hare from whichone could infer the lion’s concern for the hare. Similarly, in Example Item 14(see Exhibit 3.18) students reaching the Upper Quarter Benchmark demon-strated at least satisfactory comprehension (2 out of 3 points) by providing adescription of the difference between the lion and the hare. Students reach-ing the Upper Quarter Benchmarks also would include those demonstratingextensive comprehension (3 points).
Across countries, performance was very similar on these two itemsabout the “Hare” story, with international averages of 47 to 48 percent. OnExample Item 13, Hungary had the highest performance with about three-fourths of students answering completely (77%), followed by about two-thirdsin Sweden (68%), the Russian Federation (68%), and the Czech Republic(67%). The highest achievement on Example Item 14 was in the three countrieswhere about three-fourths of the students answered satisfactorily or better:Latvia (76%), Lithuania (74%), and Hungary (74%).
Example Item 15 shown in Exhibit 3.19, based on the “Mice” story,asked students for a plausible interpretation of the mice’s character. To receivefull credit (1 point), students needed to provide a textually-based reasonsupporting their opinion about whether or not the mice were easy to fool.Even though students reaching the Upper Quarter Benchmark demonstratedunderstanding by answering acceptably, students in general had some dif-ficulty with this question. While 72 percent of the Swedish students answeredacceptably, the next highest performance was by Canada (O,Q) with 62percent. The international average was 37 percent.
[74]
Considering the informational texts, students reaching the UpperQuarter Benchmark showed significant advances compared to their counterpartsreaching the Median Benchmark. For example, they demonstrated the abilityto make inferences and interpretations based on information across severalsentences as well as integrating their own knowledge and experiences. Similarto processing the literary texts, they were able to distinguish some textual fea-tures and understand simple metaphors.
As shown in Exhibit 3.20, Example Item 16 is based on the “Pufflings”article. Students at or above the Upper Quarter Benchmark were likely toreceive full credit by providing textually-based support to explain why theywould or would not have liked to have gone with Halla and her friends torescue the pufflings. Internationally, 45 percent of students provided fullresponses. Only in Greece and Cyprus did two-thirds or more of students (67to 69%) provide such responses.
As shown in Exhibits 3.21 and 3.22, Example Items 17 and 18 based onthe “River Trail” leaflet also illustrate the types of inferences made by studentsat the Upper Quarter Benchmark. In Example Item 17, students received fullcredit by inferring that the bikes for rent were well maintained because theywere regularly serviced and replaced (1 point). In Example Item 18, studentsreceived full credit (2 points) by interpreting information in the leaflet aboutplaces for a family to visit. Complete responses needed to identify a specificplace along the river described in the leaflet and then integrate ideas from stu-dents’ own experiences to explain an appropriate activity for the family to enjoyat that place. On average, internationally, the textually-based inference was lessdifficult for the students (international average of 46%) than the one based ontheir own experience (international average 37%). The top-performing countryon Example Item 17 was Bulgaria (70%); while Sweden (66%), England (65%),and New Zealand (64%) had the highest performance on Example Item 18.
chapter 3: performance at international benchmarks
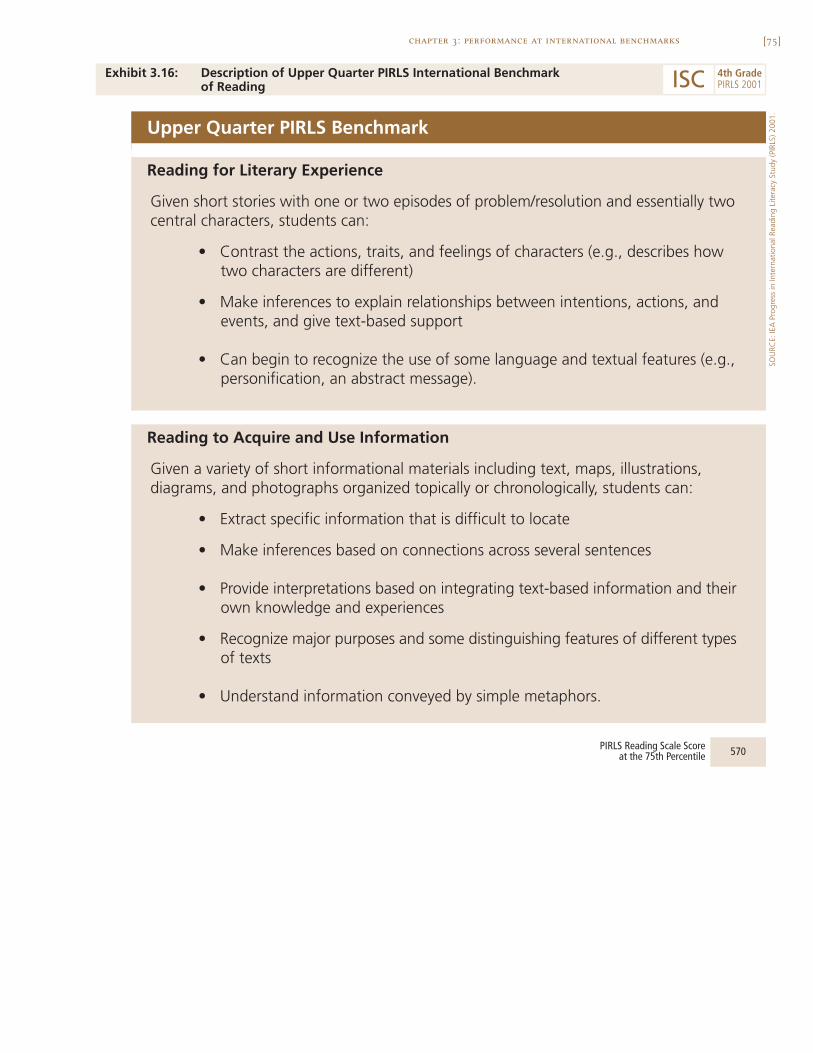
[75]chapter 3: performance at international benchmarks
Exhibit 3.16: Description of Upper Quarter PIRLS International Benchmark of Reading
SOU
RCE:
IEA
Pro
gres
s in
Inte
rnat
iona
l Rea
ding
Lite
racy
Stu
dy (P
IRLS
) 200
1.
Upper Quarter PIRLS Benchmark
Reading for Literary Experience
Given short stories with one or two episodes of problem/resolution and essentially twocentral characters, students can:
• Contrast the actions, traits, and feelings of characters (e.g., describes howtwo characters are different)
• Make inferences to explain relationships between intentions, actions, andevents, and give text-based support
• Can begin to recognize the use of some language and textual features (e.g.,personification, an abstract message).
570PIRLS Reading Scale Score at the 75th Percentile
Reading to Acquire and Use Information
Given a variety of short informational materials including text, maps, illustrations,diagrams, and photographs organized topically or chronologically, students can:
• Extract specific information that is difficult to locate
• Make inferences based on connections across several sentences
• Provide interpretations based on integrating text-based information and theirown knowledge and experiences
• Recognize major purposes and some distinguishing features of different typesof texts
• Understand information conveyed by simple metaphors.
ISC 4th GradePIRLS 2001
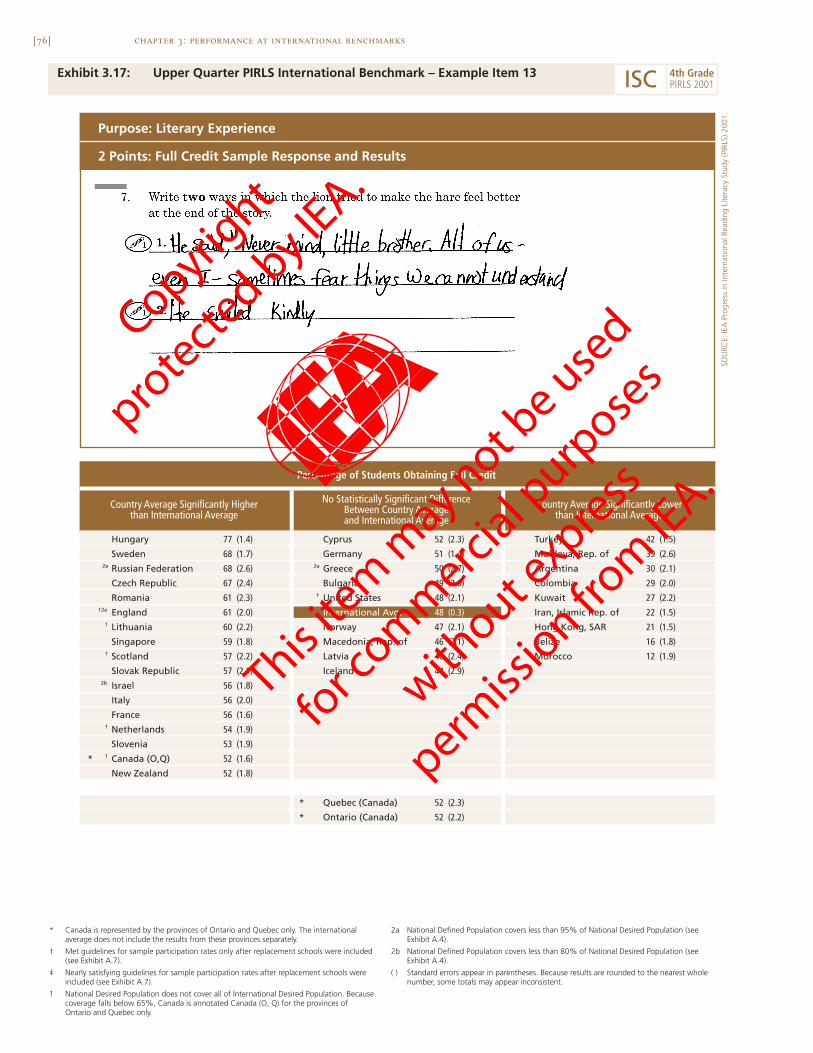
[76] chapter 3: performance at international benchmarks
Exhibit 3.17: Upper Quarter PIRLS International Benchmark – Example Item 13
Hungary 77 (1.4) Cyprus 52 (2.3) Turkey 42 (1.5)
Sweden 68 (1.7) Germany 51 (1.4) Moldova, Rep. of 39 (2.6)2a Russian Federation 68 (2.6) 2a Greece 50 (2.7) Argentina 30 (2.1)
Czech Republic 67 (2.4) Bulgaria 49 (2.0) Colombia 29 (2.0)
Romania 61 (2.3) † United States 48 (2.1) Kuwait 27 (2.2)†2a England 61 (2.0) International Avg. 48 (0.3) Iran, Islamic Rep. of 22 (1.5)
1 Lithuania 60 (2.2) Norway 47 (2.1) Hong Kong, SAR 21 (1.5)
Singapore 59 (1.8) Macedonia, Rep. of 46 (2.1) Belize 16 (1.8)† Scotland 57 (2.2) Latvia 46 (2.4) ‡ Morocco 12 (1.9)
Slovak Republic 57 (2.1) Iceland 44 (2.9)2b Israel 56 (1.8)
Italy 56 (2.0)
France 56 (1.6)† Netherlands 54 (1.9)
Slovenia 53 (1.9)
* 1 Canada (O,Q) 52 (1.6)
New Zealand 52 (1.8)
* Quebec (Canada) 52 (2.3)
* Ontario (Canada) 52 (2.2)
Percentage of Students Obtaining Full Credit
Purpose: Literary Experience
2 Points: Full Credit Sample Response and Results
Country Average Significantly Higherthan International Average
No Statistically Significant DifferenceBetween Country Averageand International Average
Country Average Significantly Lowerthan International Average
SOU
RCE:
IEA
Pro
gres
s in
Inte
rnat
iona
l Rea
ding
Lite
racy
Stu
dy (P
IRLS
) 200
1.
ISC 4th GradePIRLS 2001
* Canada is represented by the provinces of Ontario and Quebec only. The internationalaverage does not include the results from these provinces separately.
† Met guidelines for sample participation rates only after replacement schools were included(see Exhibit A.7).
‡ Nearly satisfying guidelines for sample participation rates after replacement schools wereincluded (see Exhibit A.7).
1 National Desired Population does not cover all of International Desired Population. Becausecoverage falls below 65%, Canada is annotated Canada (O, Q) for the provinces ofOntario and Quebec only.
2a National Defined Population covers less than 95% of National Desired Population (seeExhibit A.4).
2b National Defined Population covers less than 80% of National Desired Population (seeExhibit A.4).
( ) Standard errors appear in parentheses. Because results are rounded to the nearest wholenumber, some totals may appear inconsistent.
Copyright
prote
cted by IE
A.
This ite
m m
ay not be use
d
for c
omm
ercial p
urpose
s
without e
xpress
permiss
ion from
IEA.
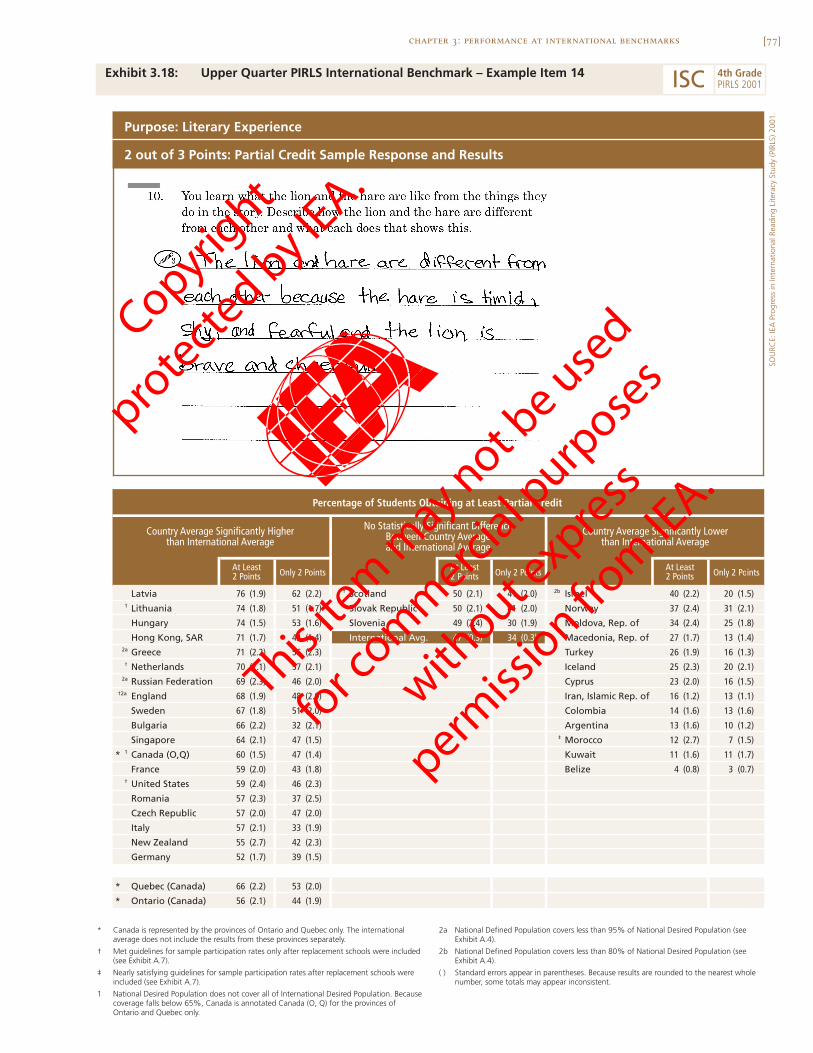
[77]chapter 3: performance at international benchmarks
Exhibit 3.18: Upper Quarter PIRLS International Benchmark – Example Item 14
SOU
RCE:
IEA
Pro
gres
s in
Inte
rnat
iona
l Rea
ding
Lite
racy
Stu
dy (P
IRLS
) 200
1.
Latvia 76 (1.9) 62 (2.2) † Scotland 50 (2.1) 41 (2.0) 2b Israel 40 (2.2) 20 (1.5)1 Lithuania 74 (1.8) 51 (1.7) Slovak Republic 50 (2.1) 41 (2.0) Norway 37 (2.4) 31 (2.1)
Hungary 74 (1.5) 53 (1.6) Slovenia 49 (2.4) 30 (1.9) Moldova, Rep. of 34 (2.4) 25 (1.8)
Hong Kong, SAR 71 (1.7) 42 (1.4) International Avg. 47 (0.3) 34 (0.3) Macedonia, Rep. of 27 (1.7) 13 (1.4)2a Greece 71 (2.2) 56 (2.3) Turkey 26 (1.9) 16 (1.3)† Netherlands 70 (2.1) 57 (2.1) Iceland 25 (2.3) 20 (2.1)
2a Russian Federation 69 (2.3) 46 (2.0) Cyprus 23 (2.0) 16 (1.5)†2a England 68 (1.9) 48 (2.0) Iran, Islamic Rep. of 16 (1.2) 13 (1.1)
Sweden 67 (1.8) 51 (2.0) Colombia 14 (1.6) 13 (1.6)
Bulgaria 66 (2.2) 32 (2.1) Argentina 13 (1.6) 10 (1.2)
Singapore 64 (2.1) 47 (1.5) ‡ Morocco 12 (2.7) 7 (1.5)
* 1 Canada (O,Q) 60 (1.5) 47 (1.4) Kuwait 11 (1.6) 11 (1.7)
France 59 (2.0) 43 (1.8) Belize 4 (0.8) 3 (0.7)† United States 59 (2.4) 46 (2.3)
Romania 57 (2.3) 37 (2.5)
Czech Republic 57 (2.0) 47 (2.0)
Italy 57 (2.1) 33 (1.9)
New Zealand 55 (2.7) 42 (2.3)
Germany 52 (1.7) 39 (1.5)
* Quebec (Canada) 66 (2.2) 53 (2.0)
* Ontario (Canada) 56 (2.1) 44 (1.9)
At Least2 PointsOnly 2 Points Only 2 PointsOnly 2 PointsAt Least
2 PointsAt Least2 Points
Percentage of Students Obtaining at Least Partial Credit
Country Average Significantly Higherthan International Average
No Statistically Significant DifferenceBetween Country Averageand International Average
Purpose: Literary Experience
2 out of 3 Points: Partial Credit Sample Response and Results
Country Average Significantly Lowerthan International Average
ISC 4th GradePIRLS 2001
* Canada is represented by the provinces of Ontario and Quebec only. The internationalaverage does not include the results from these provinces separately.
† Met guidelines for sample participation rates only after replacement schools were included(see Exhibit A.7).
‡ Nearly satisfying guidelines for sample participation rates after replacement schools wereincluded (see Exhibit A.7).
1 National Desired Population does not cover all of International Desired Population. Becausecoverage falls below 65%, Canada is annotated Canada (O, Q) for the provinces ofOntario and Quebec only.
2a National Defined Population covers less than 95% of National Desired Population (seeExhibit A.4).
2b National Defined Population covers less than 80% of National Desired Population (seeExhibit A.4).
( ) Standard errors appear in parentheses. Because results are rounded to the nearest wholenumber, some totals may appear inconsistent.
Copyright
prote
cted by IE
A.
This ite
m m
ay not be use
d
for c
omm
ercial p
urpose
s
without e
xpress
permiss
ion from
IEA.
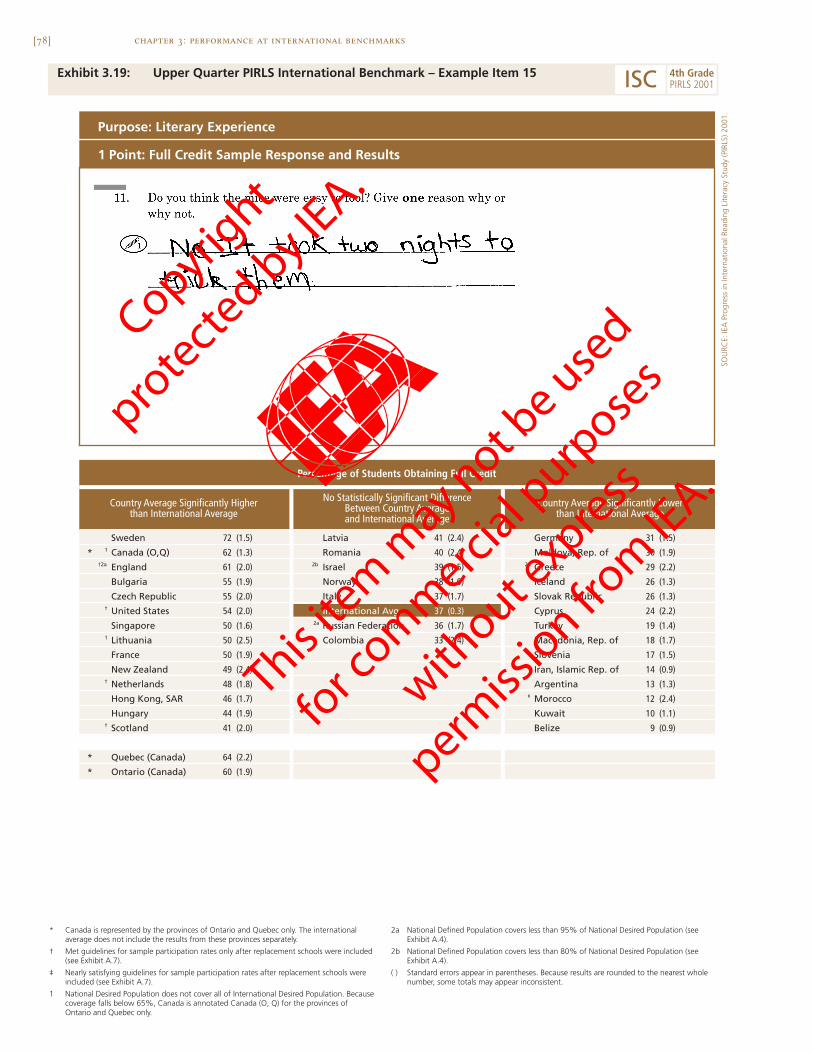
[78] chapter 3: performance at international benchmarks
Exhibit 3.19: Upper Quarter PIRLS International Benchmark – Example Item 15
Sweden 72 (1.5) Latvia 41 (2.4) Germany 31 (1.5)
* 1 Canada (O,Q) 62 (1.3) Romania 40 (2.4) Moldova, Rep. of 30 (1.9)†2a England 61 (2.0) 2b Israel 39 (1.5) 2a Greece 29 (2.2)
Bulgaria 55 (1.9) Norway 38 (1.9) Iceland 26 (1.3)
Czech Republic 55 (2.0) Italy 37 (1.7) Slovak Republic 26 (1.3)† United States 54 (2.0) International Avg. 37 (0.3) Cyprus 24 (2.2)
Singapore 50 (1.6) 2a Russian Federation 36 (1.7) Turkey 19 (1.4)1 Lithuania 50 (2.5) Colombia 33 (2.4) Macedonia, Rep. of 18 (1.7)
France 50 (1.9) Slovenia 17 (1.5)
New Zealand 49 (2.4) Iran, Islamic Rep. of 14 (0.9)† Netherlands 48 (1.8) Argentina 13 (1.3)
Hong Kong, SAR 46 (1.7) ‡ Morocco 12 (2.4)
Hungary 44 (1.9) Kuwait 10 (1.1)† Scotland 41 (2.0) Belize 9 (0.9)
* Quebec (Canada) 64 (2.2)
* Ontario (Canada) 60 (1.9)
1 Point: Full Credit Sample Response and Results
Purpose: Literary Experience
Percentage of Students Obtaining Full Credit
Country Average Significantly Higherthan International Average
No Statistically Significant DifferenceBetween Country Averageand International Average
Country Average Significantly Lowerthan International Average
SOU
RCE:
IEA
Pro
gres
s in
Inte
rnat
iona
l Rea
ding
Lite
racy
Stu
dy (P
IRLS
) 200
1.
ISC 4th GradePIRLS 2001
* Canada is represented by the provinces of Ontario and Quebec only. The internationalaverage does not include the results from these provinces separately.
† Met guidelines for sample participation rates only after replacement schools were included(see Exhibit A.7).
‡ Nearly satisfying guidelines for sample participation rates after replacement schools wereincluded (see Exhibit A.7).
1 National Desired Population does not cover all of International Desired Population. Becausecoverage falls below 65%, Canada is annotated Canada (O, Q) for the provinces ofOntario and Quebec only.
2a National Defined Population covers less than 95% of National Desired Population (seeExhibit A.4).
2b National Defined Population covers less than 80% of National Desired Population (seeExhibit A.4).
( ) Standard errors appear in parentheses. Because results are rounded to the nearest wholenumber, some totals may appear inconsistent.
Copyright
prote
cted by IE
A.
This ite
m m
ay not be use
d
for c
omm
ercial p
urpose
s
without e
xpress
permiss
ion from
IEA.
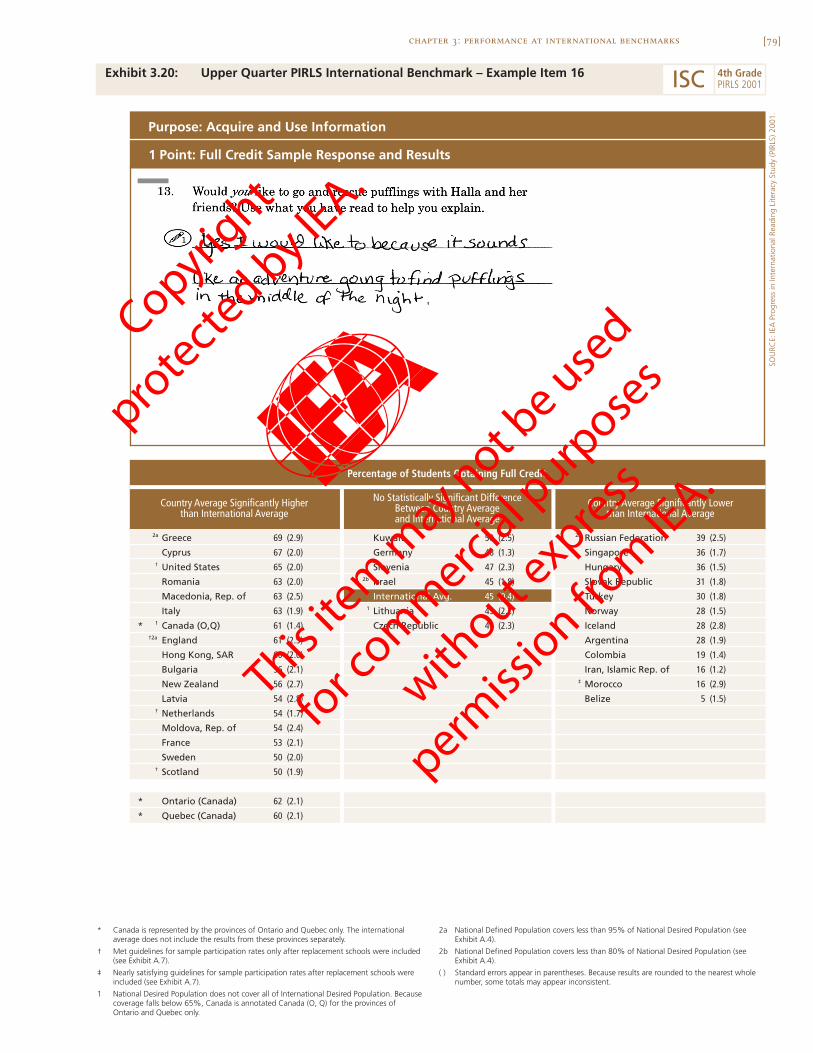
[79]chapter 3: performance at international benchmarks
Exhibit 3.20: Upper Quarter PIRLS International Benchmark – Example Item 16
SOU
RCE:
IEA
Pro
gres
s in
Inte
rnat
iona
l Rea
ding
Lite
racy
Stu
dy (P
IRLS
) 200
1.
2a Greece 69 (2.9) Kuwait 50 (2.5) 2a Russian Federation 39 (2.5)
Cyprus 67 (2.0) Germany 48 (1.3) Singapore 36 (1.7)† United States 65 (2.0) Slovenia 47 (2.3) Hungary 36 (1.5)
Romania 63 (2.0) 2b Israel 45 (1.8) Slovak Republic 31 (1.8)
Macedonia, Rep. of 63 (2.5) International Avg. 45 (0.4) Turkey 30 (1.8)
Italy 63 (1.9) 1 Lithuania 45 (2.2) Norway 28 (1.5)
* 1 Canada (O,Q) 61 (1.4) Czech Republic 41 (2.3) Iceland 28 (2.8)†2a England 61 (2.5) Argentina 28 (1.9)
Hong Kong, SAR 60 (2.0) Colombia 19 (1.4)
Bulgaria 56 (2.1) Iran, Islamic Rep. of 16 (1.2)
New Zealand 56 (2.7) ‡ Morocco 16 (2.9)
Latvia 54 (2.8) Belize 5 (1.5)† Netherlands 54 (1.7)
Moldova, Rep. of 54 (2.4)
France 53 (2.1)
Sweden 50 (2.0)† Scotland 50 (1.9)
* Ontario (Canada) 62 (2.1)
* Quebec (Canada) 60 (2.1)
1 Point: Full Credit Sample Response and Results
Purpose: Acquire and Use Information
Percentage of Students Obtaining Full Credit
Country Average Significantly Higherthan International Average
No Statistically Significant DifferenceBetween Country Averageand International Average
Country Average Significantly Lowerthan International Average
ISC 4th GradePIRLS 2001
* Canada is represented by the provinces of Ontario and Quebec only. The internationalaverage does not include the results from these provinces separately.
† Met guidelines for sample participation rates only after replacement schools were included(see Exhibit A.7).
‡ Nearly satisfying guidelines for sample participation rates after replacement schools wereincluded (see Exhibit A.7).
1 National Desired Population does not cover all of International Desired Population. Becausecoverage falls below 65%, Canada is annotated Canada (O, Q) for the provinces ofOntario and Quebec only.
2a National Defined Population covers less than 95% of National Desired Population (seeExhibit A.4).
2b National Defined Population covers less than 80% of National Desired Population (seeExhibit A.4).
( ) Standard errors appear in parentheses. Because results are rounded to the nearest wholenumber, some totals may appear inconsistent.
Copyright
prote
cted by IE
A.
This ite
m m
ay not be use
d
for c
omm
ercial p
urpose
s
without e
xpress
permiss
ion from
IEA.
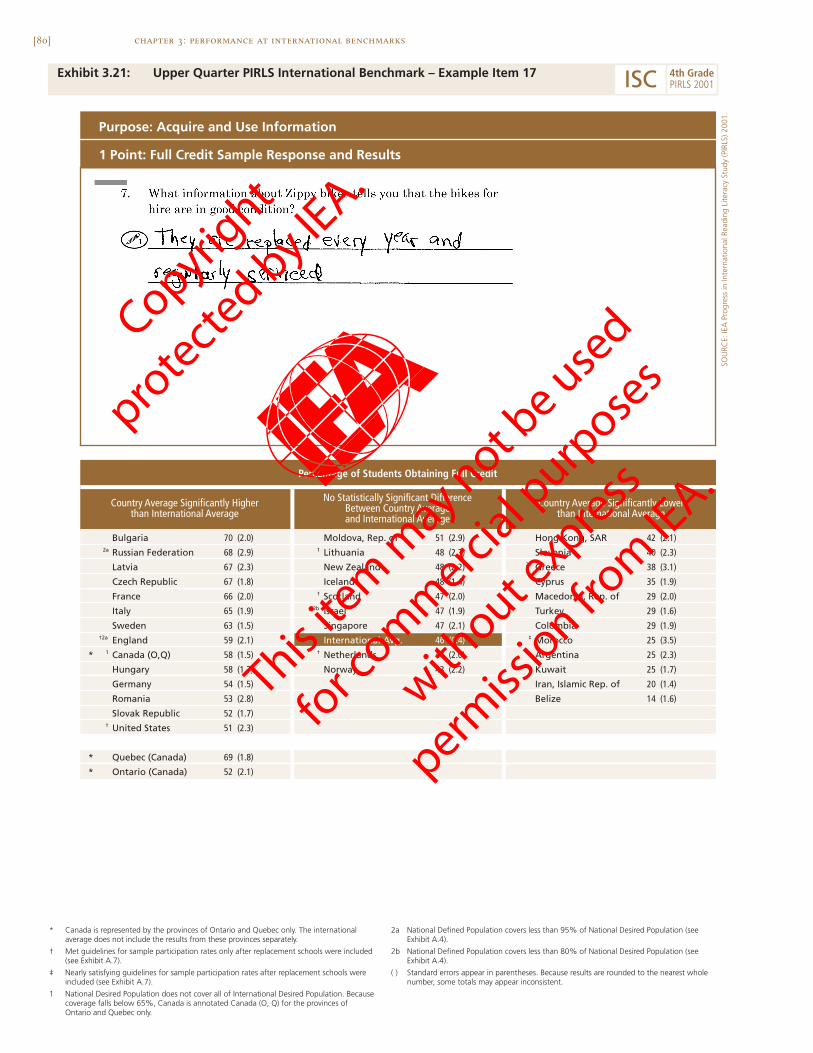
[80] chapter 3: performance at international benchmarks
Exhibit 3.21: Upper Quarter PIRLS International Benchmark – Example Item 17
Bulgaria 70 (2.0) Moldova, Rep. of 51 (2.9) Hong Kong, SAR 42 (2.1)2a Russian Federation 68 (2.9) 1 Lithuania 48 (2.3) Slovenia 40 (2.3)
Latvia 67 (2.3) New Zealand 48 (2.2) 2a Greece 38 (3.1)
Czech Republic 67 (1.8) Iceland 48 (1.4) Cyprus 35 (1.9)
France 66 (2.0) † Scotland 47 (2.0) Macedonia, Rep. of 29 (2.0)
Italy 65 (1.9) 2b Israel 47 (1.9) Turkey 29 (1.6)
Sweden 63 (1.5) Singapore 47 (2.1) Colombia 29 (1.9)†2a England 59 (2.1) International Avg. 46 (0.4) ‡ Morocco 25 (3.5)
* 1 Canada (O,Q) 58 (1.5) † Netherlands 44 (2.0) Argentina 25 (2.3)
Hungary 58 (1.7) Norway 43 (2.2) Kuwait 25 (1.7)
Germany 54 (1.5) Iran, Islamic Rep. of 20 (1.4)
Romania 53 (2.8) Belize 14 (1.6)
Slovak Republic 52 (1.7)† United States 51 (2.3)
* Quebec (Canada) 69 (1.8)
* Ontario (Canada) 52 (2.1)
Purpose: Acquire and Use Information
1 Point: Full Credit Sample Response and Results
Percentage of Students Obtaining Full Credit
Country Average Significantly Higherthan International Average
No Statistically Significant DifferenceBetween Country Averageand International Average
Country Average Significantly Lowerthan International Average
SOU
RCE:
IEA
Pro
gres
s in
Inte
rnat
iona
l Rea
ding
Lite
racy
Stu
dy (P
IRLS
) 200
1.
ISC 4th GradePIRLS 2001
* Canada is represented by the provinces of Ontario and Quebec only. The internationalaverage does not include the results from these provinces separately.
† Met guidelines for sample participation rates only after replacement schools were included(see Exhibit A.7).
‡ Nearly satisfying guidelines for sample participation rates after replacement schools wereincluded (see Exhibit A.7).
1 National Desired Population does not cover all of International Desired Population. Becausecoverage falls below 65%, Canada is annotated Canada (O, Q) for the provinces ofOntario and Quebec only.
2a National Defined Population covers less than 95% of National Desired Population (seeExhibit A.4).
2b National Defined Population covers less than 80% of National Desired Population (seeExhibit A.4).
( ) Standard errors appear in parentheses. Because results are rounded to the nearest wholenumber, some totals may appear inconsistent.
Copyright
prote
cted by IE
A.
This ite
m m
ay not be use
d
for c
omm
ercial p
urpose
s
without e
xpress
permiss
ion from
IEA.
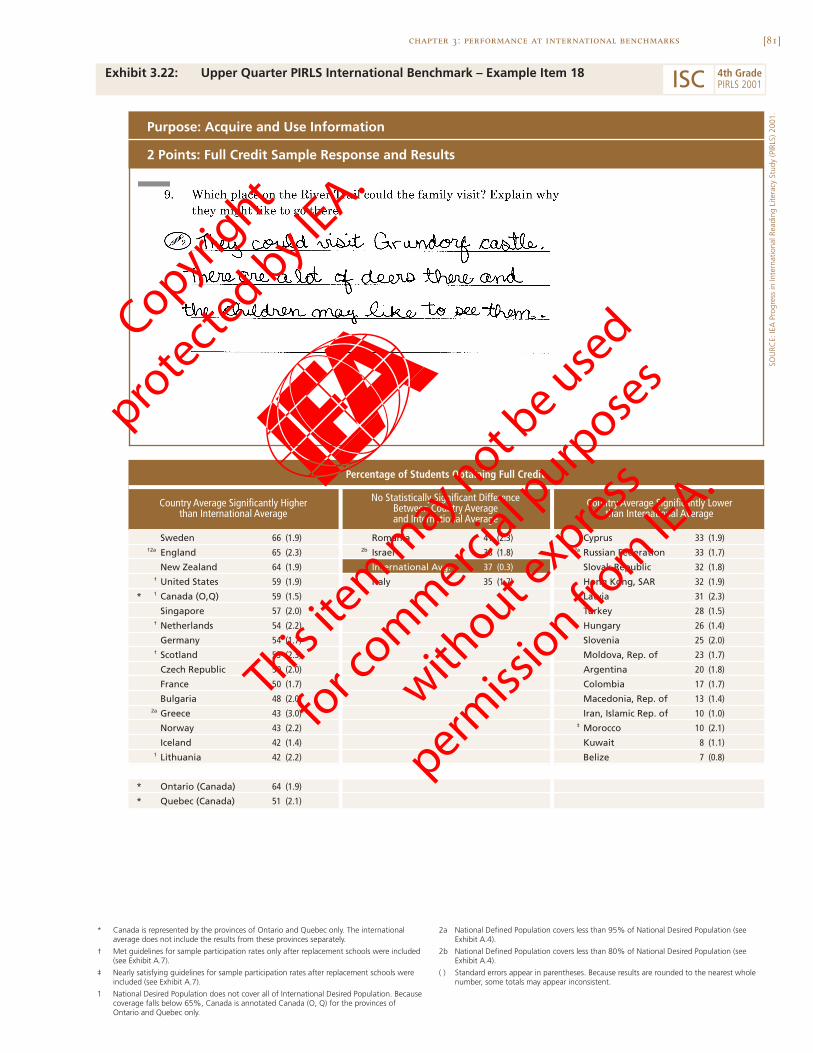
[81]chapter 3: performance at international benchmarks
Exhibit 3.22: Upper Quarter PIRLS International Benchmark – Example Item 18
SOU
RCE:
IEA
Pro
gres
s in
Inte
rnat
iona
l Rea
ding
Lite
racy
Stu
dy (P
IRLS
) 200
1.
Sweden 66 (1.9) Romania 41 (2.3) Cyprus 33 (1.9)†2a England 65 (2.3) 2b Israel 38 (1.8) 2a Russian Federation 33 (1.7)
New Zealand 64 (1.9) International Avg. 37 (0.3) Slovak Republic 32 (1.8)† United States 59 (1.9) Italy 35 (1.7) Hong Kong, SAR 32 (1.9)
* 1 Canada (O,Q) 59 (1.5) Latvia 31 (2.3)
Singapore 57 (2.0) Turkey 28 (1.5)† Netherlands 54 (2.2) Hungary 26 (1.4)
Germany 54 (1.7) Slovenia 25 (2.0)† Scotland 53 (2.3) Moldova, Rep. of 23 (1.7)
Czech Republic 50 (2.0) Argentina 20 (1.8)
France 50 (1.7) Colombia 17 (1.7)
Bulgaria 48 (2.0) Macedonia, Rep. of 13 (1.4)2a Greece 43 (3.0) Iran, Islamic Rep. of 10 (1.0)
Norway 43 (2.2) ‡ Morocco 10 (2.1)
Iceland 42 (1.4) Kuwait 8 (1.1)1 Lithuania 42 (2.2) Belize 7 (0.8)
* Ontario (Canada) 64 (1.9)
* Quebec (Canada) 51 (2.1)
Purpose: Acquire and Use Information
2 Points: Full Credit Sample Response and Results
Percentage of Students Obtaining Full Credit
Country Average Significantly Higherthan International Average
No Statistically Significant DifferenceBetween Country Averageand International Average
Country Average Significantly Lowerthan International Average
ISC 4th GradePIRLS 2001
* Canada is represented by the provinces of Ontario and Quebec only. The internationalaverage does not include the results from these provinces separately.
† Met guidelines for sample participation rates only after replacement schools were included(see Exhibit A.7).
‡ Nearly satisfying guidelines for sample participation rates after replacement schools wereincluded (see Exhibit A.7).
1 National Desired Population does not cover all of International Desired Population. Becausecoverage falls below 65%, Canada is annotated Canada (O, Q) for the provinces ofOntario and Quebec only.
2a National Defined Population covers less than 95% of National Desired Population (seeExhibit A.4).
2b National Defined Population covers less than 80% of National Desired Population (seeExhibit A.4).
( ) Standard errors appear in parentheses. Because results are rounded to the nearest wholenumber, some totals may appear inconsistent.
Copyright
prote
cted by IE
A.
This ite
m m
ay not be use
d
for c
omm
ercial p
urpose
s
without e
xpress
permiss
ion from
IEA.
[82]
Achievement at the Top 10% Benchmark
Exhibit 3.23 describes performance at the Top 10% Benchmark for the liter-ary and informational texts in PIRLS 2001. The hallmark of performance atthis level was students’ demonstrating their ability to integrate ideas and infor-mation. Students reaching this level demonstrated their understanding of theshort stories in the assessment by providing interpretations about characters’feelings and behaviors with textually-based support. They also integratedideas across the text to explain the broader significance or theme of the story.They demonstrated their understanding of the informational materials by inte-grating information across various different sections and types of materialsand successfully applying it to real-world situations.
For the literary texts, Example Item 19 presented in Exhibit 3.24required an extended response contrasting the lion and the hare. To receivefull credit on this 3-point item, the students needed to integrate ideas fromacross the text to fully support an interpretation of the difference betweenthe two characters. More specifically, the students needed to describe a con-trasting character trait and provide a specific action of each character to supportthat trait. As can be seen, with an international average of 14 percent, receiv-ing full credit on this task was very difficult for fourth-grade students. Thehighest performance was in Bulgaria, where about one-third (34%) of studentsanswered fully.
Exhibits 3.25 and 3.26 present Example Items 20 and 21, based on the“Mice” story. Example Item 20 asked students to interpret Labon’s reaction atone point in the story. To receive full credit (1 point), the response needed tocommunicate that Labon was not surprised by the empty traps. With an inter-national average of 31 percent, this question was somewhat less difficult forstudents than Example Item 19, requiring a comparison between the lion andhare characters. More than half the students in Bulgaria and England (57 and51%, respectively) answered acceptably.
Example Item 21 asked students to explain what Labon was like, basedon his actions. This question was difficult even for students achieving at theTop 10% Benchmark. They were likely to respond at the satisfactory level (2points out of 3) rather than at the extensive level, although students receiving
chapter 3: performance at international benchmarks
[83]chapter 3: performance at international benchmarks
full credit also would have reached the Top 10% Benchmark. More specifi-cally, to receive at least 2 out of 3 points, the response described one plausiblecharacter trait and one action as an example of the trait. In general, not verymany students across countries provided satisfactory or extensive responses.The international average was 30 percent. The two top-performing countrieswere England (56%) and Sweden (55%).
For the informational texts, two items from the “Pufflings” article illus-trate students’ success in integrating information at the Top 10% Benchmark.They are Example Item 22 and Example Item 23, shown in Exhibits 3.27 and3.28, respectively. Example Item 22 asked why it needed to be daylight whenthe children released the pufflings. Full credit (1 point) required making infer-ences from the text to explain that pufflings can become confused at night orsee their target more clearly in daylight. Example Item 23 also required infor-mation beyond that found in the text, asking students to integrate ideas fromthe text and their own experiences to explain how Halla might have felt aftersetting the pufflings free. Students at the Top 10% Benchmark received fullcredit (2 points), identifying two different feelings and providing an appro-priate explanation for each feeling. Interestingly, the international average forboth items was 25 percent, but the range was broader on the second one. Thebest performance on Example Item 22 was in Hungary, Latvia, and Iceland(37 to 38%), but in answering Example Item 23, more than half the students(51 to 53%) in England, the United States, and Canada (O,Q) responded com-pletely about how Halla might have felt.
Example Item 24, presented in Exhibit 3.29, was based on the “RiverTrail” leaflet. It is a task based in a real-world situation, asking students to inte-grate information from across the leaflet to identify the rental bike equipmentappropriate for an entire family of four with two children, one being a 3-year-old.Fourth-grade students reaching the Top 10% Benchmark were likely to provideresponses receiving full credit. In general, however, with an international averageof only 26 percent providing a complete response, this item was difficult forstudents. Sweden (58%) and The Netherlands (53%) were the only two countrieswhere the majority of students answered correctly.
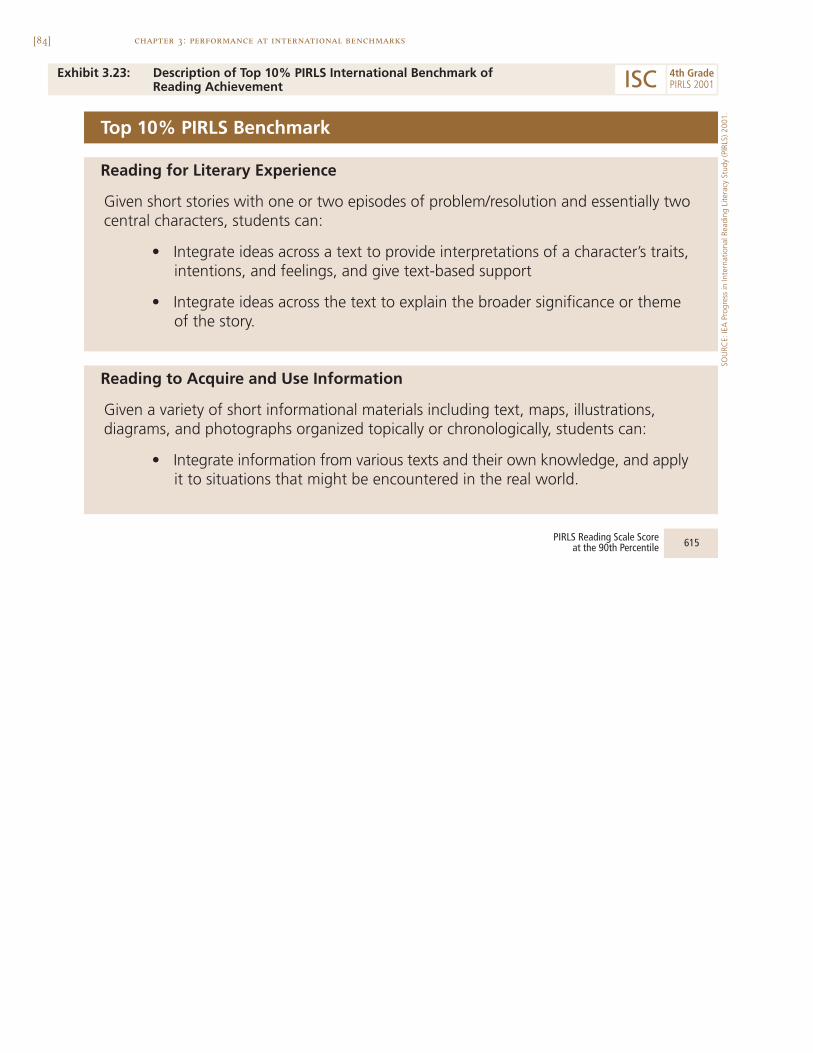
[84] chapter 3: performance at international benchmarks
Exhibit 3.23: Description of Top 10% PIRLS International Benchmark of Reading Achievement
Top 10% PIRLS Benchmark
Reading for Literary Experience
Given short stories with one or two episodes of problem/resolution and essentially twocentral characters, students can:
• Integrate ideas across a text to provide interpretations of a character’s traits,intentions, and feelings, and give text-based support
• Integrate ideas across the text to explain the broader significance or themeof the story.
Reading to Acquire and Use Information
Given a variety of short informational materials including text, maps, illustrations,diagrams, and photographs organized topically or chronologically, students can:
• Integrate information from various texts and their own knowledge, and applyit to situations that might be encountered in the real world.
615PIRLS Reading Scale Score at the 90th Percentile
SOU
RCE:
IEA
Pro
gres
s in
Inte
rnat
iona
l Rea
ding
Lite
racy
Stu
dy (P
IRLS
) 200
1.
ISC 4th GradePIRLS 2001

[85]chapter 3: performance at international benchmarks
Exhibit 3.24: Top 10% PIRLS International Benchmark – Example Item 19
SOU
RCE:
IEA
Pro
gres
s in
Inte
rnat
iona
l Rea
ding
Lite
racy
Stu
dy (P
IRLS
) 200
1.
Bulgaria 34 (1.9) Sweden 16 (1.4) Turkey 11 (1.2)
Hong Kong, SAR 29 (1.9) 2a Greece 16 (1.7) Czech Republic 10 (1.2)
Italy 23 (1.7) Latvia 14 (1.5) † Scotland 10 (1.4)1 Lithuania 23 (1.6) Macedonia, Rep. of 14 (1.2) Moldova, Rep. of 10 (1.5)
2a Russian Federation 23 (1.7) † Netherlands 14 (1.5) Slovak Republic 9 (1.1)
Hungary 20 (1.3) Germany 14 (1.1) Cyprus 7 (0.9)†2a England 20 (1.5) International Avg. 14 (0.2) Norway 7 (1.1)
Romania 20 (2.4) New Zealand 13 (1.6) ‡ Morocco 5 (2.2)2b Israel 20 (1.4) * 1 Canada (O,Q) 13 (1.0) Iceland 5 (1.0)
Slovenia 19 (1.6) † United States 13 (1.3) Argentina 4 (0.8)
Singapore 17 (1.5) Iran, Islamic Rep. of 3 (0.6)
France 17 (1.3) Colombia 2 (0.3)
Kuwait 1 (0.4)
Belize 1 (0.4)
* Quebec (Canada) 13 (1.3)
* Ontario (Canada) 13 (1.3)
Country Average Significantly Lowerthan International Average
Purpose: Literary Experience
3 Points: Full Credit Sample Response and Results
Percentage of Students Obtaining Full Credit
Country Average Significantly Higherthan International Average
No Statistically Significant DifferenceBetween Country Averageand International Average
ISC 4th GradePIRLS 2001
* Canada is represented by the provinces of Ontario and Quebec only. The internationalaverage does not include the results from these provinces separately.
† Met guidelines for sample participation rates only after replacement schools were included(see Exhibit A.7).
‡ Nearly satisfying guidelines for sample participation rates after replacement schools wereincluded (see Exhibit A.7).
1 National Desired Population does not cover all of International Desired Population. Becausecoverage falls below 65%, Canada is annotated Canada (O, Q) for the provinces ofOntario and Quebec only.
2a National Defined Population covers less than 95% of National Desired Population (seeExhibit A.4).
2b National Defined Population covers less than 80% of National Desired Population (seeExhibit A.4).
( ) Standard errors appear in parentheses. Because results are rounded to the nearest wholenumber, some totals may appear inconsistent.
Copyright
prote
cted by IE
A.
This ite
m m
ay not be use
d
for c
omm
ercial p
urpose
s
without e
xpress
permiss
ion from
IEA.

[86] chapter 3: performance at international benchmarks
Exhibit 3.25: Top 10% PIRLS International Benchmark – Example Item 20
Bulgaria 57 (1.9) 2a Greece 34 (2.5) Germany 28 (1.4)†2a England 51 (2.2) Hungary 34 (2.0) Macedonia, Rep. of 27 (1.3)
* 1 Canada (O,Q) 48 (1.5) † Scotland 34 (2.4) Romania 27 (2.0)† United States 47 (2.3) Cyprus 33 (1.8) Slovak Republic 26 (1.8)
Iceland 46 (1.6) International Avg. 31 (0.3) Moldova, Rep. of 22 (1.4)
New Zealand 45 (2.6) Czech Republic 30 (2.1) 2a Russian Federation 21 (1.9)† Netherlands 43 (1.5) Slovenia 21 (1.5)
2b Israel 41 (1.6) Turkey 15 (1.2)
Singapore 41 (1.6) ‡ Morocco 15 (2.6)1 Lithuania 41 (2.4) Argentina 15 (1.6)
Hong Kong, SAR 39 (1.9) Colombia 11 (1.1)
Latvia 38 (2.0) Iran, Islamic Rep. of 9 (0.8)
Norway 37 (2.1) Kuwait 8 (0.9)
Italy 36 (1.8) Belize 6 (0.9)
Sweden 36 (1.5)
France 35 (1.9)
* Ontario (Canada) 51 (1.9)
* Quebec (Canada) 43 (2.1)
1 Point: Full Credit Sample Response and Results
Purpose: Literary Experience
Percentage of Students Obtaining Full Credit
Country Average Significantly Higherthan International Average
No Statistically Significant DifferenceBetween Country Averageand International Average
Country Average Significantly Lowerthan International Average
SOU
RCE:
IEA
Pro
gres
s in
Inte
rnat
iona
l Rea
ding
Lite
racy
Stu
dy (P
IRLS
) 200
1.
ISC 4th GradePIRLS 2001
* Canada is represented by the provinces of Ontario and Quebec only. The internationalaverage does not include the results from these provinces separately.
† Met guidelines for sample participation rates only after replacement schools were included(see Exhibit A.7).
‡ Nearly satisfying guidelines for sample participation rates after replacement schools wereincluded (see Exhibit A.7).
1 National Desired Population does not cover all of International Desired Population. Becausecoverage falls below 65%, Canada is annotated Canada (O, Q) for the provinces ofOntario and Quebec only.
2a National Defined Population covers less than 95% of National Desired Population (seeExhibit A.4).
2b National Defined Population covers less than 80% of National Desired Population (seeExhibit A.4).
( ) Standard errors appear in parentheses. Because results are rounded to the nearest wholenumber, some totals may appear inconsistent.
Copyright
prote
cted by IE
A.
This ite
m m
ay not be use
d
for c
omm
ercial p
urpose
s
without e
xpress
permiss
ion from
IEA.
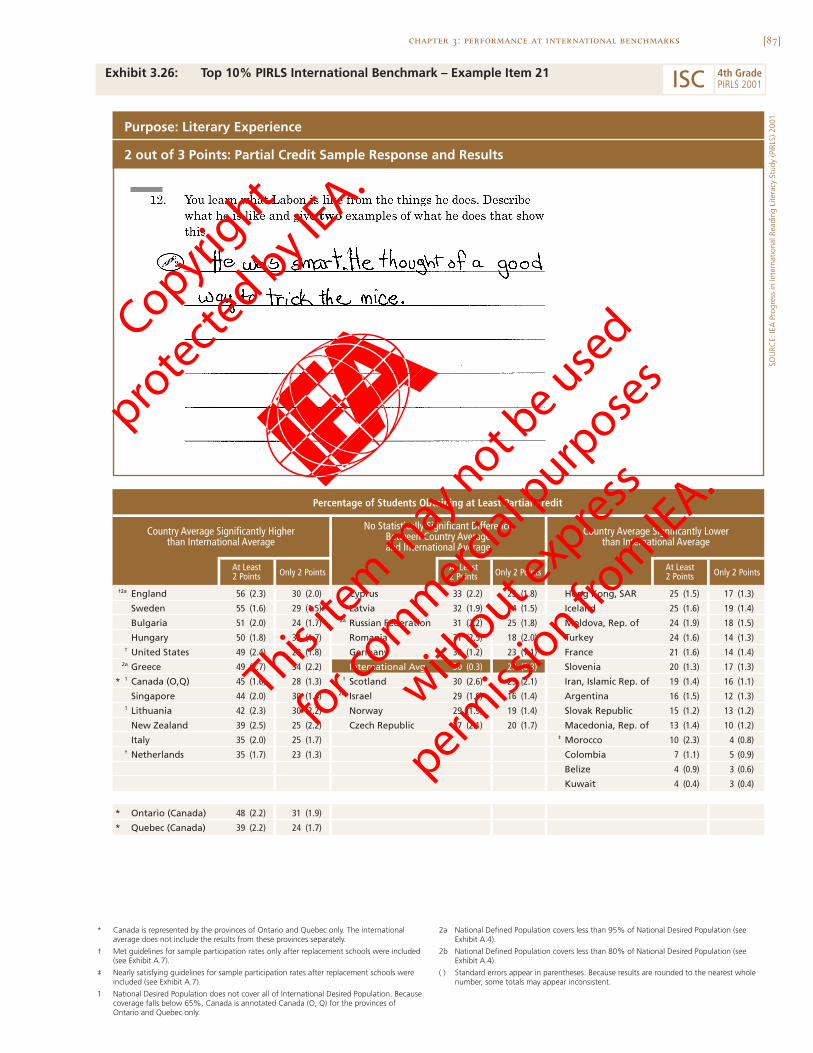
[87]chapter 3: performance at international benchmarks
Exhibit 3.26: Top 10% PIRLS International Benchmark – Example Item 21
SOU
RCE:
IEA
Pro
gres
s in
Inte
rnat
iona
l Rea
ding
Lite
racy
Stu
dy (P
IRLS
) 200
1.
†2a England 56 (2.3) 30 (2.0) Cyprus 33 (2.2) 23 (1.8) Hong Kong, SAR 25 (1.5) 17 (1.3)
Sweden 55 (1.6) 29 (1.5) Latvia 32 (1.9) 24 (1.5) Iceland 25 (1.6) 19 (1.4)
Bulgaria 51 (2.0) 24 (1.7) 2a Russian Federation 31 (2.2) 25 (1.8) Moldova, Rep. of 24 (1.9) 18 (1.5)
Hungary 50 (1.8) 33 (1.7) Romania 31 (2.5) 18 (2.0) Turkey 24 (1.6) 14 (1.3)† United States 49 (2.4) 28 (1.8) Germany 30 (1.2) 23 (1.1) France 21 (1.6) 14 (1.4)
2a Greece 49 (2.7) 34 (2.2) International Avg. 30 (0.3) 20 (0.3) Slovenia 20 (1.3) 17 (1.3)
* 1 Canada (O,Q) 45 (1.6) 28 (1.3) † Scotland 30 (2.6) 23 (2.1) Iran, Islamic Rep. of 19 (1.4) 16 (1.1)
Singapore 44 (2.0) 30 (1.4) 2b Israel 29 (1.6) 16 (1.4) Argentina 16 (1.5) 12 (1.3)1 Lithuania 42 (2.3) 30 (2.2) Norway 29 (1.9) 19 (1.4) Slovak Republic 15 (1.2) 13 (1.2)
New Zealand 39 (2.5) 25 (2.2) Czech Republic 27 (2.1) 20 (1.7) Macedonia, Rep. of 13 (1.4) 10 (1.2)
Italy 35 (2.0) 25 (1.7) ‡ Morocco 10 (2.3) 4 (0.8)† Netherlands 35 (1.7) 23 (1.3) Colombia 7 (1.1) 5 (0.9)
Belize 4 (0.9) 3 (0.6)
Kuwait 4 (0.4) 3 (0.4)
* Ontario (Canada) 48 (2.2) 31 (1.9)
* Quebec (Canada) 39 (2.2) 24 (1.7)
Percentage of Students Obtaining at Least Partial Credit
Country Average Significantly Higherthan International Average
No Statistically Significant DifferenceBetween Country Averageand International Average
Purpose: Literary Experience
2 out of 3 Points: Partial Credit Sample Response and Results
Country Average Significantly Lowerthan International Average
Only 2 PointsAt Least2 Points Only 2 PointsAt Least
2 Points Only 2 PointsAt Least2 Points
ISC 4th GradePIRLS 2001
* Canada is represented by the provinces of Ontario and Quebec only. The internationalaverage does not include the results from these provinces separately.
† Met guidelines for sample participation rates only after replacement schools were included(see Exhibit A.7).
‡ Nearly satisfying guidelines for sample participation rates after replacement schools wereincluded (see Exhibit A.7).
1 National Desired Population does not cover all of International Desired Population. Becausecoverage falls below 65%, Canada is annotated Canada (O, Q) for the provinces ofOntario and Quebec only.
2a National Defined Population covers less than 95% of National Desired Population (seeExhibit A.4).
2b National Defined Population covers less than 80% of National Desired Population (seeExhibit A.4).
( ) Standard errors appear in parentheses. Because results are rounded to the nearest wholenumber, some totals may appear inconsistent.
Copyright
prote
cted by IE
A.
This ite
m m
ay not be use
d
for c
omm
ercial p
urpose
s
without e
xpress
permiss
ion from
IEA.
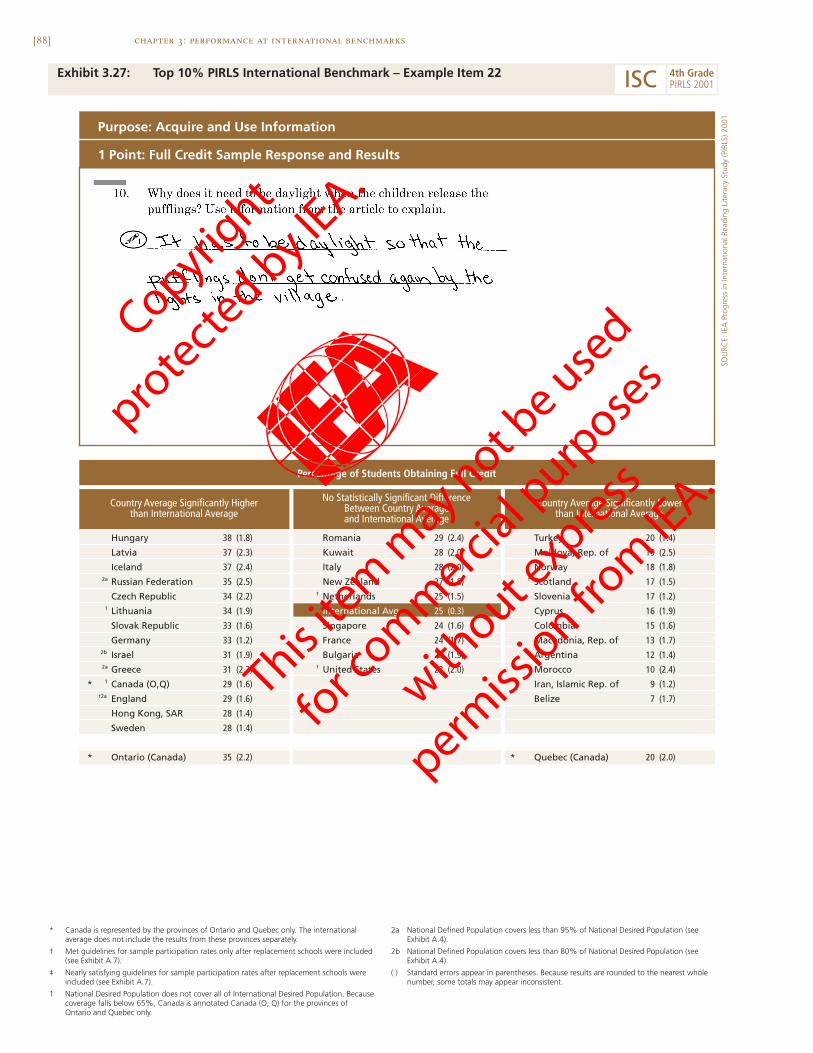
[88] chapter 3: performance at international benchmarks
Exhibit 3.27: Top 10% PIRLS International Benchmark – Example Item 22
Hungary 38 (1.8) Romania 29 (2.4) Turkey 20 (1.4)
Latvia 37 (2.3) Kuwait 28 (2.0) Moldova, Rep. of 19 (2.5)
Iceland 37 (2.4) Italy 28 (2.0) Norway 18 (1.8)2a Russian Federation 35 (2.5) New Zealand 27 (1.8) † Scotland 17 (1.5)
Czech Republic 34 (2.2) † Netherlands 25 (1.5) Slovenia 17 (1.2)1 Lithuania 34 (1.9) International Avg. 25 (0.3) Cyprus 16 (1.9)
Slovak Republic 33 (1.6) Singapore 24 (1.6) Colombia 15 (1.6)
Germany 33 (1.2) France 24 (1.7) Macedonia, Rep. of 13 (1.7)2b Israel 31 (1.9) Bulgaria 23 (1.9) Argentina 12 (1.4)2a Greece 31 (2.3) † United States 22 (2.0) ‡ Morocco 10 (2.4)
* 1 Canada (O,Q) 29 (1.6) Iran, Islamic Rep. of 9 (1.2)†2a England 29 (1.6) Belize 7 (1.7)
Hong Kong, SAR 28 (1.4)
Sweden 28 (1.4)
* Ontario (Canada) 35 (2.2) * Quebec (Canada) 20 (2.0)
1 Point: Full Credit Sample Response and Results
Purpose: Acquire and Use Information
Percentage of Students Obtaining Full Credit
Country Average Significantly Higherthan International Average
No Statistically Significant DifferenceBetween Country Averageand International Average
Country Average Significantly Lowerthan International Average
SOU
RCE:
IEA
Pro
gres
s in
Inte
rnat
iona
l Rea
ding
Lite
racy
Stu
dy (P
IRLS
) 200
1.
ISC 4th GradePIRLS 2001
* Canada is represented by the provinces of Ontario and Quebec only. The internationalaverage does not include the results from these provinces separately.
† Met guidelines for sample participation rates only after replacement schools were included(see Exhibit A.7).
‡ Nearly satisfying guidelines for sample participation rates after replacement schools wereincluded (see Exhibit A.7).
1 National Desired Population does not cover all of International Desired Population. Becausecoverage falls below 65%, Canada is annotated Canada (O, Q) for the provinces ofOntario and Quebec only.
2a National Defined Population covers less than 95% of National Desired Population (seeExhibit A.4).
2b National Defined Population covers less than 80% of National Desired Population (seeExhibit A.4).
( ) Standard errors appear in parentheses. Because results are rounded to the nearest wholenumber, some totals may appear inconsistent.
Copyright
prote
cted by IE
A.
This ite
m m
ay not be use
d
for c
omm
ercial p
urpose
s
without e
xpress
permiss
ion from
IEA.
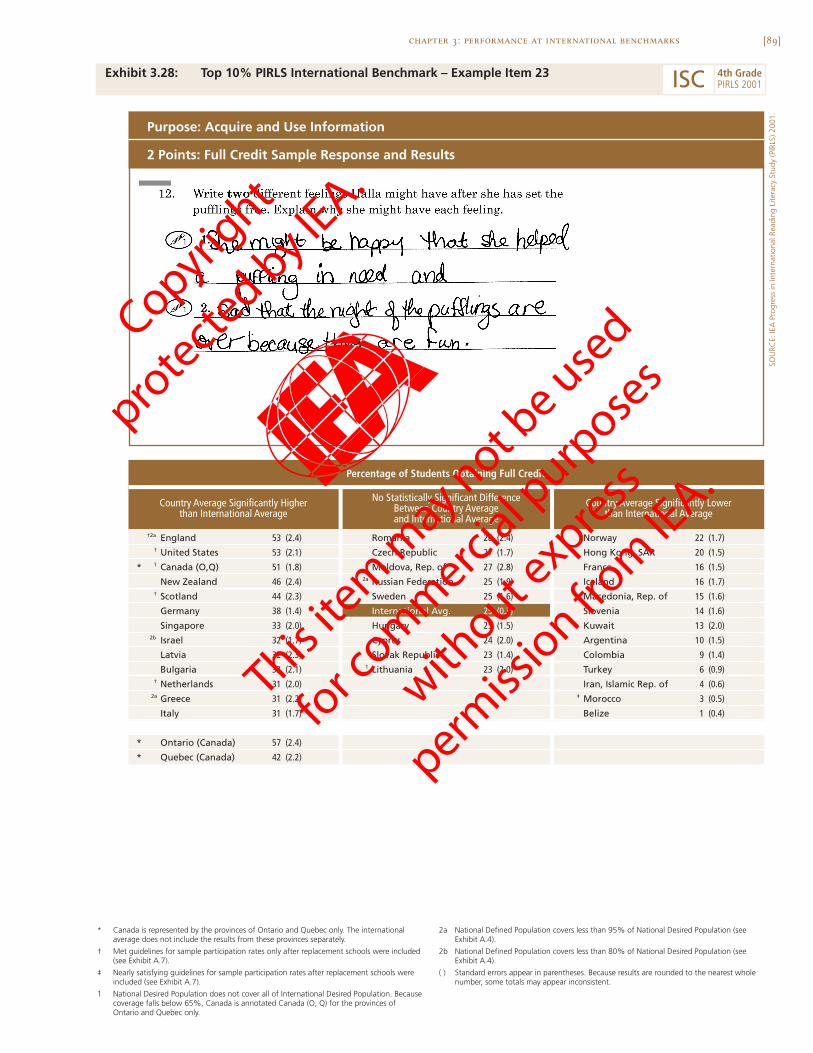
[89]chapter 3: performance at international benchmarks
Exhibit 3.28: Top 10% PIRLS International Benchmark – Example Item 23
SOU
RCE:
IEA
Pro
gres
s in
Inte
rnat
iona
l Rea
ding
Lite
racy
Stu
dy (P
IRLS
) 200
1.
†2a England 53 (2.4) Romania 28 (2.4) Norway 22 (1.7)† United States 53 (2.1) Czech Republic 27 (1.7) Hong Kong, SAR 20 (1.5)
* 1 Canada (O,Q) 51 (1.8) Moldova, Rep. of 27 (2.8) France 16 (1.5)
New Zealand 46 (2.4) 2a Russian Federation 25 (1.9) Iceland 16 (1.7)† Scotland 44 (2.3) Sweden 25 (1.6) Macedonia, Rep. of 15 (1.6)
Germany 38 (1.4) International Avg. 25 (0.3) Slovenia 14 (1.6)
Singapore 33 (2.0) Hungary 25 (1.5) Kuwait 13 (2.0)2b Israel 32 (1.7) Cyprus 24 (2.0) Argentina 10 (1.5)
Latvia 32 (2.3) Slovak Republic 23 (1.4) Colombia 9 (1.4)
Bulgaria 32 (2.1) 1 Lithuania 23 (2.0) Turkey 6 (0.9)† Netherlands 31 (2.0) Iran, Islamic Rep. of 4 (0.6)
2a Greece 31 (2.2) ‡ Morocco 3 (0.5)
Italy 31 (1.7) Belize 1 (0.4)
* Ontario (Canada) 57 (2.4)
* Quebec (Canada) 42 (2.2)
2 Points: Full Credit Sample Response and Results
Purpose: Acquire and Use Information
Percentage of Students Obtaining Full Credit
Country Average Significantly Higherthan International Average
No Statistically Significant DifferenceBetween Country Averageand International Average
Country Average Significantly Lowerthan International Average
ISC 4th GradePIRLS 2001
* Canada is represented by the provinces of Ontario and Quebec only. The internationalaverage does not include the results from these provinces separately.
† Met guidelines for sample participation rates only after replacement schools were included(see Exhibit A.7).
‡ Nearly satisfying guidelines for sample participation rates after replacement schools wereincluded (see Exhibit A.7).
1 National Desired Population does not cover all of International Desired Population. Becausecoverage falls below 65%, Canada is annotated Canada (O, Q) for the provinces ofOntario and Quebec only.
2a National Defined Population covers less than 95% of National Desired Population (seeExhibit A.4).
2b National Defined Population covers less than 80% of National Desired Population (seeExhibit A.4).
( ) Standard errors appear in parentheses. Because results are rounded to the nearest wholenumber, some totals may appear inconsistent.
Copyright
prote
cted by IE
A.
This ite
m m
ay not be use
d
for c
omm
ercial p
urpose
s
without e
xpress
permiss
ion from
IEA.
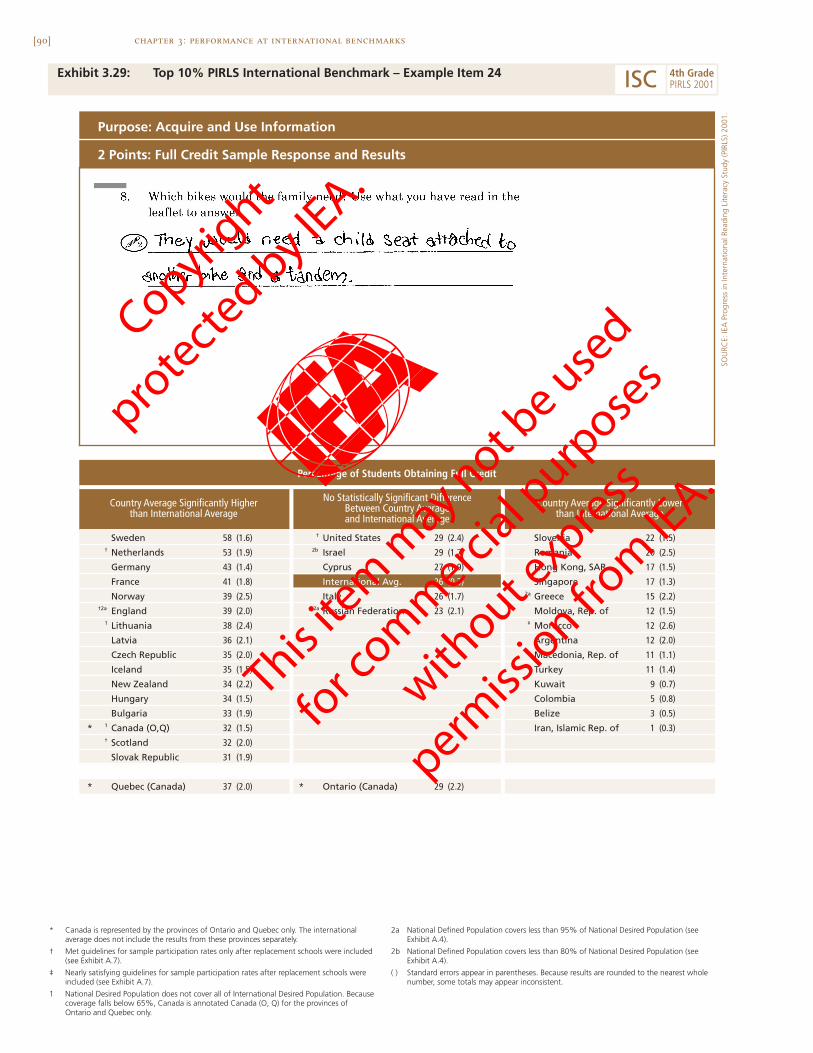
[90] chapter 3: performance at international benchmarks
Exhibit 3.29: Top 10% PIRLS International Benchmark – Example Item 24
Sweden 58 (1.6) † United States 29 (2.4) Slovenia 22 (1.5)† Netherlands 53 (1.9) 2b Israel 29 (1.7) Romania 20 (2.5)
Germany 43 (1.4) Cyprus 27 (1.9) Hong Kong, SAR 17 (1.5)
France 41 (1.8) International Avg. 26 (0.3) Singapore 17 (1.3)
Norway 39 (2.5) Italy 26 (1.7) 2a Greece 15 (2.2)†2a England 39 (2.0) 2a Russian Federation 23 (2.1) Moldova, Rep. of 12 (1.5)
1 Lithuania 38 (2.4) ‡ Morocco 12 (2.6)
Latvia 36 (2.1) Argentina 12 (2.0)
Czech Republic 35 (2.0) Macedonia, Rep. of 11 (1.1)
Iceland 35 (1.5) Turkey 11 (1.4)
New Zealand 34 (2.2) Kuwait 9 (0.7)
Hungary 34 (1.5) Colombia 5 (0.8)
Bulgaria 33 (1.9) Belize 3 (0.5)
* 1 Canada (O,Q) 32 (1.5) Iran, Islamic Rep. of 1 (0.3)† Scotland 32 (2.0)
Slovak Republic 31 (1.9)
* Quebec (Canada) 37 (2.0) * Ontario (Canada) 29 (2.2)
2 Points: Full Credit Sample Response and Results
Purpose: Acquire and Use Information
Percentage of Students Obtaining Full Credit
Country Average Significantly Higherthan International Average
No Statistically Significant DifferenceBetween Country Averageand International Average
Country Average Significantly Lowerthan International Average
SOU
RCE:
IEA
Pro
gres
s in
Inte
rnat
iona
l Rea
ding
Lite
racy
Stu
dy (P
IRLS
) 200
1.
ISC 4th GradePIRLS 2001
* Canada is represented by the provinces of Ontario and Quebec only. The internationalaverage does not include the results from these provinces separately.
† Met guidelines for sample participation rates only after replacement schools were included(see Exhibit A.7).
‡ Nearly satisfying guidelines for sample participation rates after replacement schools wereincluded (see Exhibit A.7).
1 National Desired Population does not cover all of International Desired Population. Becausecoverage falls below 65%, Canada is annotated Canada (O, Q) for the provinces ofOntario and Quebec only.
2a National Defined Population covers less than 95% of National Desired Population (seeExhibit A.4).
2b National Defined Population covers less than 80% of National Desired Population (seeExhibit A.4).
( ) Standard errors appear in parentheses. Because results are rounded to the nearest wholenumber, some totals may appear inconsistent.
Copyright
prote
cted by IE
A.
This ite
m m
ay not be use
d
for c
omm
ercial p
urpose
s
without e
xpress
permiss
ion from
IEA.

[91]chapter 3: performance at international benchmarks
4
[93]
Chapter 4Literacy-RelatedActivities in the Home
Although formal instruction in reading is a school
activity, there is little doubt that the foundation
for future literacy is laid in the early years, and
considerable evidence that exposure to literacy
activities from an early age is a key element of this
foundation. PIRLS collected information from
parents about their child’s experiences in learning
to read, about their own reading, and about literacy
resources in the home.

[94]
PIRLS also asked the fourth-grade students themselves about their readingactivities both at home and in school. Chapter 4 presents parents’ and stu-dents’ responses to a subset of these questions. More specifically, information
is provided about activities fostering literacy beforethe child began school, the language spoken in thehome, literacy resources in the home, and aspectsof parents’ reading.
The parents’ data were collected via a ques-tionnaire in which PIRLS asked the parents orprimary caregivers of each child participating inthe PIRLS assessment to provide information abouttheir child’s experiences in learning to read.1
Because the sampling for the parents’ question-naires was based on participating students, the parents are representative ofparents of fourth-grade students. It is important to note that when informa-tion from the parents’ questionnaire is being reported, the student is always theunit of analysis. That is, the data shown are the percentages of students whoseparents reported on various activities or characteristics. Using the student asthe unit of analysis makes it possible to describe students’ early literacy expe-riences and is consistent with the PIRLS goals of providing information aboutthe educational contexts and performance of students.
For reporting purposes, the information provided by parents is tieddirectly to the students tested. Sometimes, however, parents did not completethe questionnaire assigned to them, so most countries had some percentage ofstudents for whom no parents’ questionnaire information is available. Theexhibits in this chapter have special notations on this point. For a countrywhere parent responses are available for 70 to 84 percent of students, an “r” isincluded next to its data. Where parent responses are available for 50 to 69percent of students, an “s” is included. Where parent responses are availablefor less than 50 percent, an “x” replaces the data.
In an effort to summarize this information concisely and focus atten-tion on educationally-relevant support and practice, PIRLS sometimes hascombined information from individual questions to form an index that is
chapter 4: literacy-related activities in the home
1 The PIRLS Learning to Read survey was completed by parents of fourth-grade students in all PIRLS countries with the exception of Moroccoand the United States.
Parents generally reporteda fairly high level of
engagement with theirchild in preschoolliteracy activities.
[95]chapter 4: literacy-related activities in the home
more global and reliable than the component questions (e.g., early home lit-eracy activities). According to their responses, students were placed in a“high,” “medium,” or “low” category. Cutoff points were established so thatthe high level of an index corresponds to conditions or activities generallyassociated with good educational practice and high reading achievement. Foreach index, the percentages of students in each category are presented in rela-tion to their reading achievement.
What Activities Fostering Literacy Did Parents Engage in withTheir Child?
To examine early literacy experiences, PIRLS asked parents how often they(or someone else in the home) engaged in a range of activities with their childbefore the child began primary school. The Index of Early Home LiteracyActivities summarizes parents’ responses to six of these activities:
• Read books
• Tell stories
• Sing songs
• Play with alphabet toys (e.g., blocks with letters of the alphabet)
• Play word games
• Read aloud signs and labels.
Responses about each activity were on a three-point scale – Often,Sometimes, and Never or Almost Never. To construct the index, parents’responses were averaged across the six activities and then students wereassigned to one of three categories (high, medium, or low) on the basis of theirparents’ average responses. Students in the high category had parents whoreported often engaging in the six activities, on average; whereas those in thelow category never or almost never did so. Students in the medium categoryhad parents reporting in between these extremes.
[96] chapter 4: literacy-related activities in the home
Exhibit 4.1 presents the percentage of students at each level of theindex for each country, together with the average reading achievement forthose students. Standard errors also are shown. Countries are ordered by thepercentage of students at the high level of the index, which is also displayedgraphically for each country at the right hand side of the exhibit. The inter-national average across all countries is shown at the bottom of each column.
Parents generally reported a fairly high level of engagement with theirchild in preschool literacy activities, with more than half (52%) of studentsin the high category of the index, on average, across all countries. Highestlevels of engagement were reported in England and Scotland, where more than80 percent of students had parents reporting often reading books, tellingstories, singing songs, playing with alphabet toys, playing word games, andreading aloud signs and labels with their child before the child began school.Among the countries where parents reported lower levels of engagement wereTurkey, Iran, and Hong Kong, with 30 percent or more of students in the lowcategory, where parents reported never or almost never doing these activitieswith them before they began school.
Although the countries with the highest average reading achievementwere not necessarily those with the highest percentages of students in thehigh category of the Index of Early Home Literacy Activities (Sweden, thehighest performing country, had just 41%; and The Netherlands, the nexthighest, had 55%), there was a positive relationship between engaging in earlyliteracy activities and performance on the PIRLS reading assessment in everycountry. On average, internationally, students in the high index categoryenjoyed a 20-point advantage in reading performance over their peers in themedium category, who in turn scored about 20 points above the students inthe low category. Countries where the students in the high category had thegreatest advantage over those in the medium category (30 points or more)included England, New Zealand, Belize, Singapore, and Iran.
Exhibit 4.2 provides more information on how often parents read booksto their child before the child began school, one of the key elements of theIndex of Early Home Literacy Activities. Although the pattern of results isgenerally similar to the previous exhibit, with just over half the students (51%)

( ) Standard errors appear in parentheses. Because results are rounded to the nearest wholenumber, some totals may appear inconsistent.
An “r” indicates data are available for 70-84% of the students. An “s” indicates data are avail-able for 50-69% of the students. An “x” indicates data are available for less than 50% of thestudents.
A dash (–) indicates data are not available. A tilde (~) indicates insufficient data to reportachievement.
Exhibit 4.1: Index of Early Home Literacy Activities (EHLA)
[97]chapter 4: literacy-related activities in the home
SOU
RCE:
IEA
Pro
gres
s in
Inte
rnat
iona
l Rea
ding
Lite
racy
Stu
dy (P
IRLS
) 200
1.
ISC 4th GradePIRLS 2001
Index of Early HomeLiteracy Activities (EHLA)
England s 83 (1.2) 578 (3.6) 14 (1.0) 546 (6.3) 3 (0.4) 513 (15.9)
Scotland s 82 (1.1) 546 (4.4) 16 (1.0) 529 (5.3) 2 (0.4) ~ ~
New Zealand r 68 (1.2) 551 (3.5) 26 (1.1) 515 (4.8) 6 (0.6) 475 (8.8)
Canada (O,Q) r 67 (0.7) 559 (2.3) 27 (0.7) 535 (2.9) 6 (0.4) 526 (5.5)
Russian Federation 66 (1.3) 536 (4.6) 27 (1.1) 514 (4.6) 7 (0.7) 507 (9.3)
Italy 62 (1.0) 551 (2.5) 30 (0.9) 536 (3.2) 8 (0.5) 524 (4.9)
Slovak Republic 62 (1.0) 525 (2.9) 32 (0.9) 514 (3.4) 5 (0.5) 502 (8.1)
Bulgaria 62 (1.7) 569 (3.2) 25 (1.0) 541 (5.0) 12 (1.6) 503 (10.1)
Macedonia, Rep. of r 62 (1.4) 460 (5.3) 31 (1.0) 433 (6.1) 7 (0.9) 432 (11.9)
Hungary 61 (1.0) 554 (2.6) 32 (1.0) 533 (2.5) 7 (0.5) 528 (5.2)
Latvia 58 (1.4) 555 (2.9) 34 (1.4) 539 (3.1) 8 (0.5) 529 (5.5)
Slovenia 57 (1.1) 515 (2.2) 37 (1.0) 490 (2.9) 6 (0.5) 479 (6.3)
Cyprus s 57 (1.3) 506 (4.3) 33 (1.2) 478 (4.6) 9 (0.6) 460 (7.1)
Greece 57 (1.4) 540 (3.8) 33 (1.2) 514 (4.1) 11 (1.1) 493 (7.1)
France 56 (1.1) 537 (2.6) 34 (1.0) 521 (3.2) 9 (0.6) 505 (4.8)
Netherlands s 55 (1.1) 566 (2.8) 37 (1.0) 561 (2.8) 8 (0.6) 555 (5.5)
Romania 55 (1.4) 527 (4.6) 31 (1.1) 505 (5.5) 15 (1.2) 485 (10.8)
Iceland r 53 (0.9) 529 (2.0) 39 (0.9) 506 (2.3) 8 (0.6) 492 (4.5)
Czech Republic 52 (1.1) 548 (2.4) 41 (1.0) 535 (3.1) 8 (0.6) 517 (5.6)
Argentina s 50 (1.5) 447 (6.6) 35 (1.1) 418 (6.9) 16 (1.4) 400 (7.8)
Lithuania 48 (1.3) 553 (2.9) 39 (1.1) 540 (3.3) 13 (0.9) 528 (4.3)
Norway 47 (1.2) 518 (3.5) 41 (1.1) 493 (3.4) 13 (1.0) 474 (6.5)
Germany 43 (0.8) 550 (2.0) 43 (0.7) 542 (2.4) 14 (0.6) 526 (3.6)
Moldova, Rep. of 42 (1.3) 511 (4.9) 39 (1.1) 486 (4.3) 19 (1.2) 469 (5.6)
Sweden 41 (0.8) 572 (2.6) 45 (0.7) 561 (2.5) 14 (0.5) 548 (3.5)
Belize s 40 (2.0) 364 (6.3) 38 (1.5) 320 (7.1) 22 (2.0) 289 (6.4)
Colombia r 40 (1.9) 435 (6.1) 39 (1.3) 426 (4.8) 21 (1.4) 410 (5.0)
Singapore 37 (1.0) 556 (4.6) 41 (0.7) 526 (5.0) 21 (0.8) 498 (6.4)
Kuwait r 30 (0.7) 418 (4.8) 48 (0.7) 400 (4.5) 22 (0.6) 381 (6.0)
Turkey 26 (1.1) 474 (5.2) 39 (1.2) 450 (4.3) 35 (1.6) 435 (3.6)
Iran, Islamic Rep. of 18 (1.1) 455 (7.8) 35 (1.0) 425 (5.7) 47 (1.8) 391 (4.1)
Hong Kong, SAR r 16 (0.8) 544 (3.3) 54 (0.9) 531 (2.8) 30 (1.2) 528 (3.9)
Israel x x x x x x x x x x x x
Morocco – – – – – – – – – – – –
United States – – – – – – – – – – – –
International Avg. 52 (0.2) 520 (0.7) 35 (0.2) 499 (0.8) 13 (0.2) 481 (1.3)
Percentage of Students atHigh Level of EHLAPercent of
StudentsAverage
Achievement
Countries
HighEHLA
MediumEHLA
LowEHLA
0 10050 7525
Percent ofStudents
AverageAchievement
Percent ofStudents
AverageAchievement
Based on parents’ responses to the frequency of the followingactivities they engaged in with their child prior to entry intoprimary school: read books; tell stories; sing songs; play withalphabet toys (e.g., blocks with letters of the alphabet); playword games; or read aloud signs and labels. Average is
computed across the 6 items based on a 3-point scale: Neveror almost never = 1, Sometimes = 2, and Often = 3. High levelindicates an average of greater than 2.33 through 3. Mediumlevel indicates an average of 1.67 through 2.33. Low level indi-cates an average of 1 to less than 1.67.
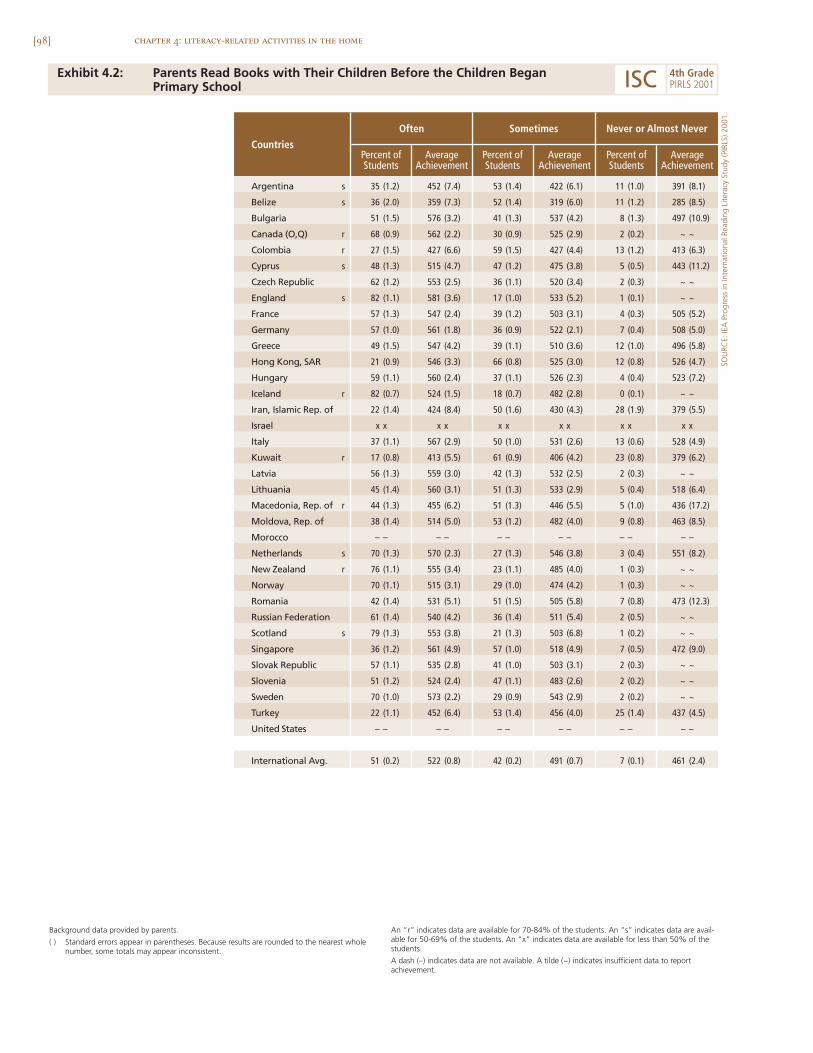
[98] chapter 4: literacy-related activities in the home
Exhibit 4.2: Parents Read Books with Their Children Before the Children BeganPrimary School
Argentina s 35 (1.2) 452 (7.4) 53 (1.4) 422 (6.1) 11 (1.0) 391 (8.1)
Belize s 36 (2.0) 359 (7.3) 52 (1.4) 319 (6.0) 11 (1.2) 285 (8.5)
Bulgaria 51 (1.5) 576 (3.2) 41 (1.3) 537 (4.2) 8 (1.3) 497 (10.9)
Canada (O,Q) r 68 (0.9) 562 (2.2) 30 (0.9) 525 (2.9) 2 (0.2) ~ ~
Colombia r 27 (1.5) 427 (6.6) 59 (1.5) 427 (4.4) 13 (1.2) 413 (6.3)
Cyprus s 48 (1.3) 515 (4.7) 47 (1.2) 475 (3.8) 5 (0.5) 443 (11.2)
Czech Republic 62 (1.2) 553 (2.5) 36 (1.1) 520 (3.4) 2 (0.3) ~ ~
England s 82 (1.1) 581 (3.6) 17 (1.0) 533 (5.2) 1 (0.1) ~ ~
France 57 (1.3) 547 (2.4) 39 (1.2) 503 (3.1) 4 (0.3) 505 (5.2)
Germany 57 (1.0) 561 (1.8) 36 (0.9) 522 (2.1) 7 (0.4) 508 (5.0)
Greece 49 (1.5) 547 (4.2) 39 (1.1) 510 (3.6) 12 (1.0) 496 (5.8)
Hong Kong, SAR 21 (0.9) 546 (3.3) 66 (0.8) 525 (3.0) 12 (0.8) 526 (4.7)
Hungary 59 (1.1) 560 (2.4) 37 (1.1) 526 (2.3) 4 (0.4) 523 (7.2)
Iceland r 82 (0.7) 524 (1.5) 18 (0.7) 482 (2.8) 0 (0.1) ~ ~
Iran, Islamic Rep. of 22 (1.4) 424 (8.4) 50 (1.6) 430 (4.3) 28 (1.9) 379 (5.5)
Israel x x x x x x x x x x x x
Italy 37 (1.1) 567 (2.9) 50 (1.0) 531 (2.6) 13 (0.6) 528 (4.9)
Kuwait r 17 (0.8) 413 (5.5) 61 (0.9) 406 (4.2) 23 (0.8) 379 (6.2)
Latvia 56 (1.3) 559 (3.0) 42 (1.3) 532 (2.5) 2 (0.3) ~ ~
Lithuania 45 (1.4) 560 (3.1) 51 (1.3) 533 (2.9) 5 (0.4) 518 (6.4)
Macedonia, Rep. of r 44 (1.3) 455 (6.2) 51 (1.3) 446 (5.5) 5 (1.0) 436 (17.2)
Moldova, Rep. of 38 (1.4) 514 (5.0) 53 (1.2) 482 (4.0) 9 (0.8) 463 (8.5)
Morocco – – – – – – – – – – – –
Netherlands s 70 (1.3) 570 (2.3) 27 (1.3) 546 (3.8) 3 (0.4) 551 (8.2)
New Zealand r 76 (1.1) 555 (3.4) 23 (1.1) 485 (4.0) 1 (0.3) ~ ~
Norway 70 (1.1) 515 (3.1) 29 (1.0) 474 (4.2) 1 (0.3) ~ ~
Romania 42 (1.4) 531 (5.1) 51 (1.5) 505 (5.8) 7 (0.8) 473 (12.3)
Russian Federation 61 (1.4) 540 (4.2) 36 (1.4) 511 (5.4) 2 (0.5) ~ ~
Scotland s 79 (1.3) 553 (3.8) 21 (1.3) 503 (6.8) 1 (0.2) ~ ~
Singapore 36 (1.2) 561 (4.9) 57 (1.0) 518 (4.9) 7 (0.5) 472 (9.0)
Slovak Republic 57 (1.1) 535 (2.8) 41 (1.0) 503 (3.1) 2 (0.3) ~ ~
Slovenia 51 (1.2) 524 (2.4) 47 (1.1) 483 (2.6) 2 (0.2) ~ ~
Sweden 70 (1.0) 573 (2.2) 29 (0.9) 543 (2.9) 2 (0.2) ~ ~
Turkey 22 (1.1) 452 (6.4) 53 (1.4) 456 (4.0) 25 (1.4) 437 (4.5)
United States – – – – – – – – – – – –
International Avg. 51 (0.2) 522 (0.8) 42 (0.2) 491 (0.7) 7 (0.1) 461 (2.4)
AverageAchievement
Countries
Often
Percent ofStudents
Sometimes Never or Almost Never
AverageAchievement
Percent ofStudents
AverageAchievement
Percent ofStudents
Background data provided by parents.
( ) Standard errors appear in parentheses. Because results are rounded to the nearest wholenumber, some totals may appear inconsistent.
An “r” indicates data are available for 70-84% of the students. An “s” indicates data are avail-able for 50-69% of the students. An “x” indicates data are available for less than 50% of thestudents.
A dash (–) indicates data are not available. A tilde (~) indicates insufficient data to reportachievement.
SOU
RCE:
IEA
Pro
gres
s in
Inte
rnat
iona
l Rea
ding
Lite
racy
Stu
dy (P
IRLS
) 200
1.
ISC 4th GradePIRLS 2001

[99]chapter 4: literacy-related activities in the home
being read to often, on average, there were a number of countries wherereading books was more common than the other activities that make up theindex. In addition to England, Iceland, and Scotland, countries where 70percent or more of students had parents reporting that they often read booksto their child included The Netherlands, New Zealand, Norway, and Sweden.Also, the association between often having been read a book and highreading performance was more clear-cut than with the index, with a readingachievement difference of more than 30 points, on average, across coun-tries, between students who sometimes read books with their parents andthose who did so often.
Whereas the traditional parent-child activity of enjoying a booktogether was quite common in most countries, parents reported far less involve-ment with newer forms of literacy activities. Almost 80 percent of students,on average, had parents who reported never or almost never doing readingactivities on the computer with them before they reached school-going age(see Exhibit 4.3). Only in Canada (O,Q) and France were there as many as 10percent of students with parents reporting often using the computer for readingactivities with their child. There was no clear relationship between doingreading activities on the computer and performance on the PIRLS readingassessment. Unlike the book reading, this activity was not part of the Indexof Early Home Literacy Activities.
What Language Do Students Speak at Home?
Although there may be some benefits to being multilingual, students whoalways speak a language at home different from the language in school may beat a disadvantage in some learning situations, particularly in the early grades,when reading is a focus of instruction. Exhibit 4.4 shows students’ reports ofhow often they spoke the language of the PIRLS test at home in relation to theirreading performance. Most students (79% on average, internationally) reportedalways or almost always speaking the language of the test at home, but therewere significant percentages who reported sometimes (16% on average) or never(6% on average) speaking it. In contrast to the general picture, less than halfof students in Belize, Hong Kong, Morocco, and Singapore reported alwaysspeaking the PIRLS language at home, and just over half in Iran and Kuwait.
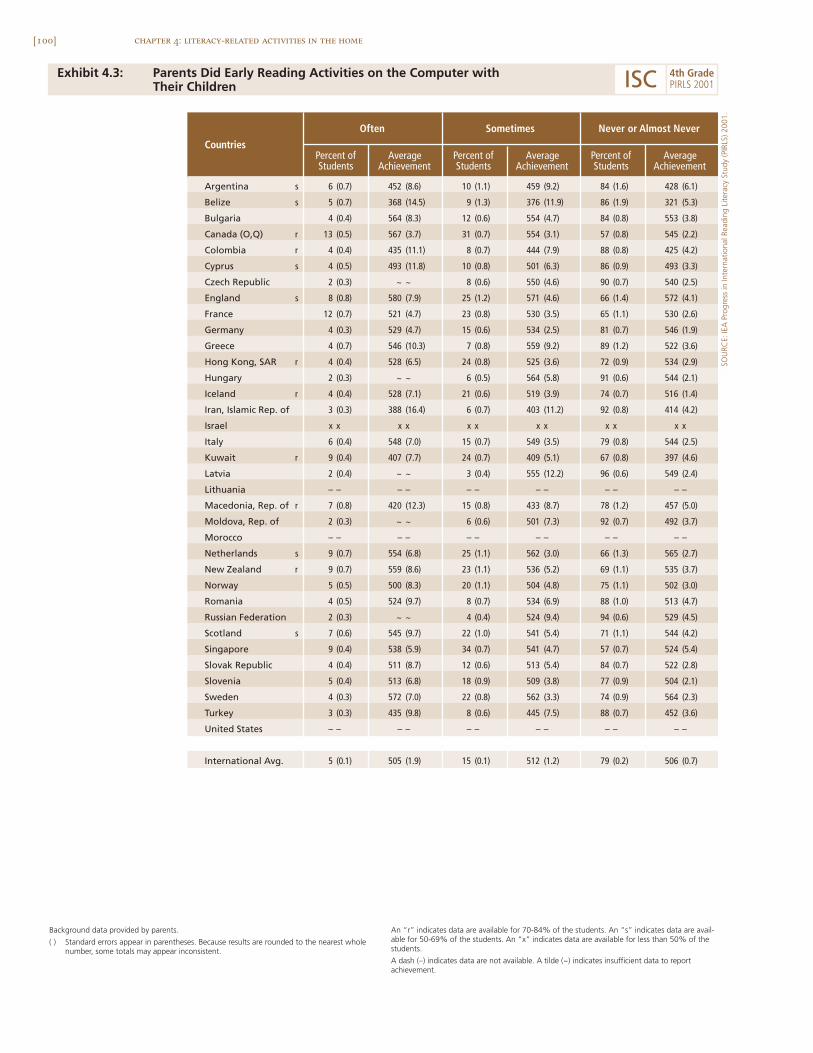
[100] chapter 4: literacy-related activities in the home
Exhibit 4.3: Parents Did Early Reading Activities on the Computer with Their Children
SOU
RCE:
IEA
Pro
gres
s in
Inte
rnat
iona
l Rea
ding
Lite
racy
Stu
dy (P
IRLS
) 200
1.
ISC 4th GradePIRLS 2001
Argentina s 6 (0.7) 452 (8.6) 10 (1.1) 459 (9.2) 84 (1.6) 428 (6.1)
Belize s 5 (0.7) 368 (14.5) 9 (1.3) 376 (11.9) 86 (1.9) 321 (5.3)
Bulgaria 4 (0.4) 564 (8.3) 12 (0.6) 554 (4.7) 84 (0.8) 553 (3.8)
Canada (O,Q) r 13 (0.5) 567 (3.7) 31 (0.7) 554 (3.1) 57 (0.8) 545 (2.2)
Colombia r 4 (0.4) 435 (11.1) 8 (0.7) 444 (7.9) 88 (0.8) 425 (4.2)
Cyprus s 4 (0.5) 493 (11.8) 10 (0.8) 501 (6.3) 86 (0.9) 493 (3.3)
Czech Republic 2 (0.3) ~ ~ 8 (0.6) 550 (4.6) 90 (0.7) 540 (2.5)
England s 8 (0.8) 580 (7.9) 25 (1.2) 571 (4.6) 66 (1.4) 572 (4.1)
France 12 (0.7) 521 (4.7) 23 (0.8) 530 (3.5) 65 (1.1) 530 (2.6)
Germany 4 (0.3) 529 (4.7) 15 (0.6) 534 (2.5) 81 (0.7) 546 (1.9)
Greece 4 (0.7) 546 (10.3) 7 (0.8) 559 (9.2) 89 (1.2) 522 (3.6)
Hong Kong, SAR r 4 (0.4) 528 (6.5) 24 (0.8) 525 (3.6) 72 (0.9) 534 (2.9)
Hungary 2 (0.3) ~ ~ 6 (0.5) 564 (5.8) 91 (0.6) 544 (2.1)
Iceland r 4 (0.4) 528 (7.1) 21 (0.6) 519 (3.9) 74 (0.7) 516 (1.4)
Iran, Islamic Rep. of 3 (0.3) 388 (16.4) 6 (0.7) 403 (11.2) 92 (0.8) 414 (4.2)
Israel x x x x x x x x x x x x
Italy 6 (0.4) 548 (7.0) 15 (0.7) 549 (3.5) 79 (0.8) 544 (2.5)
Kuwait r 9 (0.4) 407 (7.7) 24 (0.7) 409 (5.1) 67 (0.8) 397 (4.6)
Latvia 2 (0.4) ~ ~ 3 (0.4) 555 (12.2) 96 (0.6) 549 (2.4)
Lithuania – – – – – – – – – – – –
Macedonia, Rep. of r 7 (0.8) 420 (12.3) 15 (0.8) 433 (8.7) 78 (1.2) 457 (5.0)
Moldova, Rep. of 2 (0.3) ~ ~ 6 (0.6) 501 (7.3) 92 (0.7) 492 (3.7)
Morocco – – – – – – – – – – – –
Netherlands s 9 (0.7) 554 (6.8) 25 (1.1) 562 (3.0) 66 (1.3) 565 (2.7)
New Zealand r 9 (0.7) 559 (8.6) 23 (1.1) 536 (5.2) 69 (1.1) 535 (3.7)
Norway 5 (0.5) 500 (8.3) 20 (1.1) 504 (4.8) 75 (1.1) 502 (3.0)
Romania 4 (0.5) 524 (9.7) 8 (0.7) 534 (6.9) 88 (1.0) 513 (4.7)
Russian Federation 2 (0.3) ~ ~ 4 (0.4) 524 (9.4) 94 (0.6) 529 (4.5)
Scotland s 7 (0.6) 545 (9.7) 22 (1.0) 541 (5.4) 71 (1.1) 544 (4.2)
Singapore 9 (0.4) 538 (5.9) 34 (0.7) 541 (4.7) 57 (0.7) 524 (5.4)
Slovak Republic 4 (0.4) 511 (8.7) 12 (0.6) 513 (5.4) 84 (0.7) 522 (2.8)
Slovenia 5 (0.4) 513 (6.8) 18 (0.9) 509 (3.8) 77 (0.9) 504 (2.1)
Sweden 4 (0.3) 572 (7.0) 22 (0.8) 562 (3.3) 74 (0.9) 564 (2.3)
Turkey 3 (0.3) 435 (9.8) 8 (0.6) 445 (7.5) 88 (0.7) 452 (3.6)
United States – – – – – – – – – – – –
International Avg. 5 (0.1) 505 (1.9) 15 (0.1) 512 (1.2) 79 (0.2) 506 (0.7)
Percent ofStudents
AverageAchievement
Countries
Often Sometimes Never or Almost Never
Percent ofStudents
AverageAchievement
Percent ofStudents
AverageAchievement
Background data provided by parents.
( ) Standard errors appear in parentheses. Because results are rounded to the nearest wholenumber, some totals may appear inconsistent.
An “r” indicates data are available for 70-84% of the students. An “s” indicates data are avail-able for 50-69% of the students. An “x” indicates data are available for less than 50% of thestudents.
A dash (–) indicates data are not available. A tilde (~) indicates insufficient data to reportachievement.
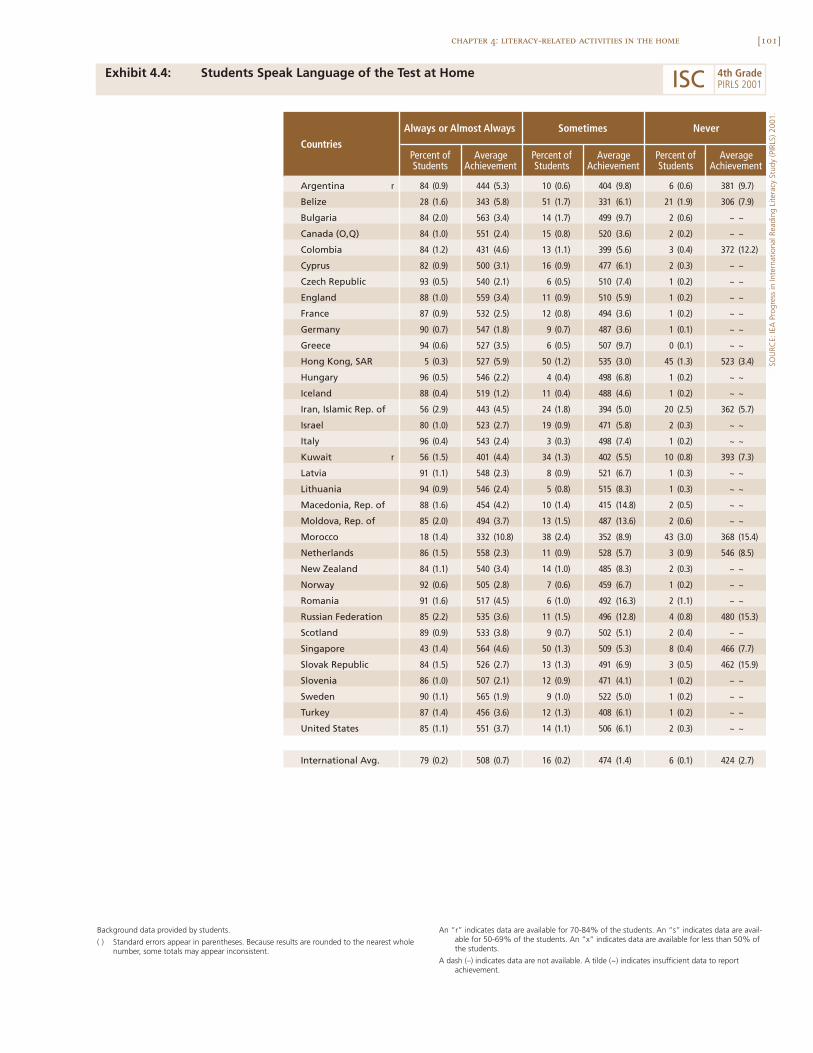
[101]chapter 4: literacy-related activities in the home
Exhibit 4.4: Students Speak Language of the Test at Home
SOU
RCE:
IEA
Pro
gres
s in
Inte
rnat
iona
l Rea
ding
Lite
racy
Stu
dy (P
IRLS
) 200
1.
ISC 4th GradePIRLS 2001
Background data provided by students.
( ) Standard errors appear in parentheses. Because results are rounded to the nearest wholenumber, some totals may appear inconsistent.
An “r” indicates data are available for 70-84% of the students. An “s” indicates data are avail-able for 50-69% of the students. An “x” indicates data are available for less than 50% ofthe students.
A dash (–) indicates data are not available. A tilde (~) indicates insufficient data to reportachievement.
Argentina r 84 (0.9) 444 (5.3) 10 (0.6) 404 (9.8) 6 (0.6) 381 (9.7)
Belize 28 (1.6) 343 (5.8) 51 (1.7) 331 (6.1) 21 (1.9) 306 (7.9)
Bulgaria 84 (2.0) 563 (3.4) 14 (1.7) 499 (9.7) 2 (0.6) ~ ~
Canada (O,Q) 84 (1.0) 551 (2.4) 15 (0.8) 520 (3.6) 2 (0.2) ~ ~
Colombia 84 (1.2) 431 (4.6) 13 (1.1) 399 (5.6) 3 (0.4) 372 (12.2)
Cyprus 82 (0.9) 500 (3.1) 16 (0.9) 477 (6.1) 2 (0.3) ~ ~
Czech Republic 93 (0.5) 540 (2.1) 6 (0.5) 510 (7.4) 1 (0.2) ~ ~
England 88 (1.0) 559 (3.4) 11 (0.9) 510 (5.9) 1 (0.2) ~ ~
France 87 (0.9) 532 (2.5) 12 (0.8) 494 (3.6) 1 (0.2) ~ ~
Germany 90 (0.7) 547 (1.8) 9 (0.7) 487 (3.6) 1 (0.1) ~ ~
Greece 94 (0.6) 527 (3.5) 6 (0.5) 507 (9.7) 0 (0.1) ~ ~
Hong Kong, SAR 5 (0.3) 527 (5.9) 50 (1.2) 535 (3.0) 45 (1.3) 523 (3.4)
Hungary 96 (0.5) 546 (2.2) 4 (0.4) 498 (6.8) 1 (0.2) ~ ~
Iceland 88 (0.4) 519 (1.2) 11 (0.4) 488 (4.6) 1 (0.2) ~ ~
Iran, Islamic Rep. of 56 (2.9) 443 (4.5) 24 (1.8) 394 (5.0) 20 (2.5) 362 (5.7)
Israel 80 (1.0) 523 (2.7) 19 (0.9) 471 (5.8) 2 (0.3) ~ ~
Italy 96 (0.4) 543 (2.4) 3 (0.3) 498 (7.4) 1 (0.2) ~ ~
Kuwait r 56 (1.5) 401 (4.4) 34 (1.3) 402 (5.5) 10 (0.8) 393 (7.3)
Latvia 91 (1.1) 548 (2.3) 8 (0.9) 521 (6.7) 1 (0.3) ~ ~
Lithuania 94 (0.9) 546 (2.4) 5 (0.8) 515 (8.3) 1 (0.3) ~ ~
Macedonia, Rep. of 88 (1.6) 454 (4.2) 10 (1.4) 415 (14.8) 2 (0.5) ~ ~
Moldova, Rep. of 85 (2.0) 494 (3.7) 13 (1.5) 487 (13.6) 2 (0.6) ~ ~
Morocco 18 (1.4) 332 (10.8) 38 (2.4) 352 (8.9) 43 (3.0) 368 (15.4)
Netherlands 86 (1.5) 558 (2.3) 11 (0.9) 528 (5.7) 3 (0.9) 546 (8.5)
New Zealand 84 (1.1) 540 (3.4) 14 (1.0) 485 (8.3) 2 (0.3) ~ ~
Norway 92 (0.6) 505 (2.8) 7 (0.6) 459 (6.7) 1 (0.2) ~ ~
Romania 91 (1.6) 517 (4.5) 6 (1.0) 492 (16.3) 2 (1.1) ~ ~
Russian Federation 85 (2.2) 535 (3.6) 11 (1.5) 496 (12.8) 4 (0.8) 480 (15.3)
Scotland 89 (0.9) 533 (3.8) 9 (0.7) 502 (5.1) 2 (0.4) ~ ~
Singapore 43 (1.4) 564 (4.6) 50 (1.3) 509 (5.3) 8 (0.4) 466 (7.7)
Slovak Republic 84 (1.5) 526 (2.7) 13 (1.3) 491 (6.9) 3 (0.5) 462 (15.9)
Slovenia 86 (1.0) 507 (2.1) 12 (0.9) 471 (4.1) 1 (0.2) ~ ~
Sweden 90 (1.1) 565 (1.9) 9 (1.0) 522 (5.0) 1 (0.2) ~ ~
Turkey 87 (1.4) 456 (3.6) 12 (1.3) 408 (6.1) 1 (0.2) ~ ~
United States 85 (1.1) 551 (3.7) 14 (1.1) 506 (6.1) 2 (0.3) ~ ~
International Avg. 79 (0.2) 508 (0.7) 16 (0.2) 474 (1.4) 6 (0.1) 424 (2.7)
Countries
Sometimes NeverAlways or Almost Always
AverageAchievement
Percent ofStudents
AverageAchievement
Percent ofStudents
AverageAchievement
Percent ofStudents
[102] chapter 4: literacy-related activities in the home
On average, across countries, there was a strong relationship betweenfrequency of speaking the language of the PIRLS test at home and perform-ance on the PIRLS test, with the average score for those always speaking thePIRLS language at home (508 points) considerably higher than that for thosespeaking it only sometimes (474 points) or never (424 points). The principalexception to this pattern was Morocco, where French is often the language ofmore affluent homes. These more affluent Francophone students, who reportednever speaking Arabic (the PIRLS language) at home, had higher achievementthan those who sometimes or always speak Arabic.
Many countries tested in more than one language in order to covertheir whole student population. These included Canada (O,Q) (English andFrench), Israel (Hebrew and Arabic), Italy (Italian and German), Latvia (Latvianand Russian), Macedonia (Macedonian and Albanian), Moldova (Romanianand Russian), New Zealand (English and Maori), Norway (Bokmaal andNynorsk), and Romania (Romanian and Hungarian).
Related to the question of the language spoken in the home is thesize of the immigrant population in a country. Exhibit 4.5 shows students’reports about where their parents were born, together with average readingachievement. On average, across countries, more than three-quarters ofstudents (77%) reported that both parents were born in the country, with afurther 13 percent reporting that one parent and 9 percent that neither parentwas born there. Within the overall pattern, however, there was considerablevariation. Some countries, such as Bulgaria, Hungary, Iran, Romania,and Turkey, have very little immigration with more than 90 percent of stu-dents reporting that both parents were born in the country. Others, includ-ing Belize, Canada (O,Q), France, Germany, Hong Kong, Israel, New Zealand,and the United States, had at least 15 percent of students reporting that neitherparent was born in the country. Although performance on the PIRLS readingassessment, on average, was highest among students reporting both parentsborn in the country (506), in-between for students with one parent born in thecountry (491), and lowest for those with neither (476), Hong Kong, Israel,Kuwait, Latvia, Moldova, New Zealand, and Singapore had performance among
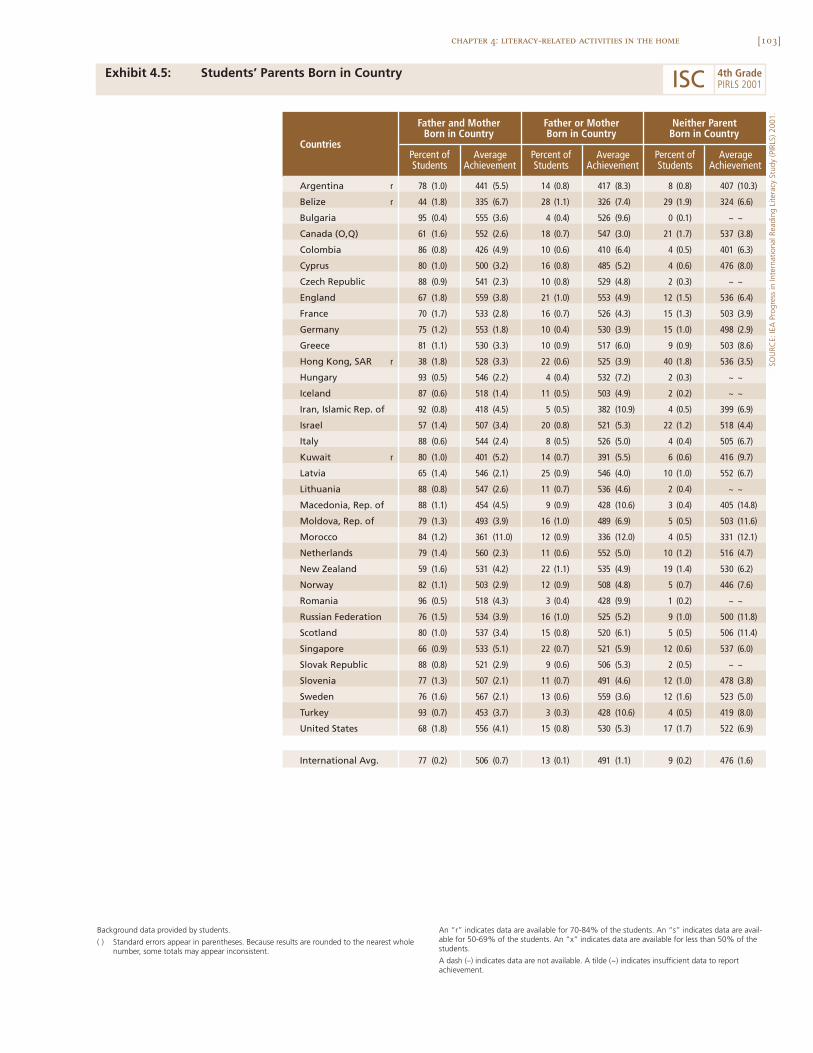
[103]chapter 4: literacy-related activities in the home
Exhibit 4.5: Students’ Parents Born in Country
SOU
RCE:
IEA
Pro
gres
s in
Inte
rnat
iona
l Rea
ding
Lite
racy
Stu
dy (P
IRLS
) 200
1.
Argentina r 78 (1.0) 441 (5.5) 14 (0.8) 417 (8.3) 8 (0.8) 407 (10.3)
Belize r 44 (1.8) 335 (6.7) 28 (1.1) 326 (7.4) 29 (1.9) 324 (6.6)
Bulgaria 95 (0.4) 555 (3.6) 4 (0.4) 526 (9.6) 0 (0.1) ~ ~
Canada (O,Q) 61 (1.6) 552 (2.6) 18 (0.7) 547 (3.0) 21 (1.7) 537 (3.8)
Colombia 86 (0.8) 426 (4.9) 10 (0.6) 410 (6.4) 4 (0.5) 401 (6.3)
Cyprus 80 (1.0) 500 (3.2) 16 (0.8) 485 (5.2) 4 (0.6) 476 (8.0)
Czech Republic 88 (0.9) 541 (2.3) 10 (0.8) 529 (4.8) 2 (0.3) ~ ~
England 67 (1.8) 559 (3.8) 21 (1.0) 553 (4.9) 12 (1.5) 536 (6.4)
France 70 (1.7) 533 (2.8) 16 (0.7) 526 (4.3) 15 (1.3) 503 (3.9)
Germany 75 (1.2) 553 (1.8) 10 (0.4) 530 (3.9) 15 (1.0) 498 (2.9)
Greece 81 (1.1) 530 (3.3) 10 (0.9) 517 (6.0) 9 (0.9) 503 (8.6)
Hong Kong, SAR r 38 (1.8) 528 (3.3) 22 (0.6) 525 (3.9) 40 (1.8) 536 (3.5)
Hungary 93 (0.5) 546 (2.2) 4 (0.4) 532 (7.2) 2 (0.3) ~ ~
Iceland 87 (0.6) 518 (1.4) 11 (0.5) 503 (4.9) 2 (0.2) ~ ~
Iran, Islamic Rep. of 92 (0.8) 418 (4.5) 5 (0.5) 382 (10.9) 4 (0.5) 399 (6.9)
Israel 57 (1.4) 507 (3.4) 20 (0.8) 521 (5.3) 22 (1.2) 518 (4.4)
Italy 88 (0.6) 544 (2.4) 8 (0.5) 526 (5.0) 4 (0.4) 505 (6.7)
Kuwait r 80 (1.0) 401 (5.2) 14 (0.7) 391 (5.5) 6 (0.6) 416 (9.7)
Latvia 65 (1.4) 546 (2.1) 25 (0.9) 546 (4.0) 10 (1.0) 552 (6.7)
Lithuania 88 (0.8) 547 (2.6) 11 (0.7) 536 (4.6) 2 (0.4) ~ ~
Macedonia, Rep. of 88 (1.1) 454 (4.5) 9 (0.9) 428 (10.6) 3 (0.4) 405 (14.8)
Moldova, Rep. of 79 (1.3) 493 (3.9) 16 (1.0) 489 (6.9) 5 (0.5) 503 (11.6)
Morocco 84 (1.2) 361 (11.0) 12 (0.9) 336 (12.0) 4 (0.5) 331 (12.1)
Netherlands 79 (1.4) 560 (2.3) 11 (0.6) 552 (5.0) 10 (1.2) 516 (4.7)
New Zealand 59 (1.6) 531 (4.2) 22 (1.1) 535 (4.9) 19 (1.4) 530 (6.2)
Norway 82 (1.1) 503 (2.9) 12 (0.9) 508 (4.8) 5 (0.7) 446 (7.6)
Romania 96 (0.5) 518 (4.3) 3 (0.4) 428 (9.9) 1 (0.2) ~ ~
Russian Federation 76 (1.5) 534 (3.9) 16 (1.0) 525 (5.2) 9 (1.0) 500 (11.8)
Scotland 80 (1.0) 537 (3.4) 15 (0.8) 520 (6.1) 5 (0.5) 506 (11.4)
Singapore 66 (0.9) 533 (5.1) 22 (0.7) 521 (5.9) 12 (0.6) 537 (6.0)
Slovak Republic 88 (0.8) 521 (2.9) 9 (0.6) 506 (5.3) 2 (0.5) ~ ~
Slovenia 77 (1.3) 507 (2.1) 11 (0.7) 491 (4.6) 12 (1.0) 478 (3.8)
Sweden 76 (1.6) 567 (2.1) 13 (0.6) 559 (3.6) 12 (1.6) 523 (5.0)
Turkey 93 (0.7) 453 (3.7) 3 (0.3) 428 (10.6) 4 (0.5) 419 (8.0)
United States 68 (1.8) 556 (4.1) 15 (0.8) 530 (5.3) 17 (1.7) 522 (6.9)
International Avg. 77 (0.2) 506 (0.7) 13 (0.1) 491 (1.1) 9 (0.2) 476 (1.6)
Countries
Father or MotherBorn in Country
Neither ParentBorn in Country
Father and MotherBorn in Country
AverageAchievement
Percent ofStudents
AverageAchievement
Percent ofStudents
AverageAchievement
Percent ofStudents
Background data provided by students.
( ) Standard errors appear in parentheses. Because results are rounded to the nearest wholenumber, some totals may appear inconsistent.
An “r” indicates data are available for 70-84% of the students. An “s” indicates data are avail-able for 50-69% of the students. An “x” indicates data are available for less than 50% of thestudents.
A dash (–) indicates data are not available. A tilde (~) indicates insufficient data to reportachievement.
ISC 4th GradePIRLS 2001
[104] chapter 4: literacy-related activities in the home
2 Elley, W.B. (1992). How in the world do students read? The Hague: International Association for the Evaluation of Educational Achievement (IEA).
3 See, for example, Mullis, I.V.S., Martin, M.O., Gonzalez, E.J., Gregory, K.D., Garden, R.A., O’Connor, K.M., Chrostowski, S.J., & Smith, T.A.(2000). TIMSS 1999 international mathematics report: Findings from IEA’s repeat of the Third International Mathematics and Science Study atthe eighth grade. Chestnut Hill, MA: Boston College.
children reporting neither parent born in the country that was as good as orbetter than that of children with native-born parents.
What Literacy Resources Do Students Have in Their Homes?
Earlier IEA studies have shown that students from homes with extensive lit-eracy resources have higher achievement in reading and other subjects thanthose from less-advantaged backgrounds. For example, IEA’s 1991 study ofreading literacy in 32 countries found a clear-cut relationship between thenumber of books students reported in their homes and their reading achieve-ment levels.2 Furthermore, TIMSS has shown that eighth-grade students fromhomes with large numbers of books, with a range of educational study aids,or with parents with university-level education also had higher achievementin mathematics and science.3 Building on the TIMSS work, PIRLS has developed an Index of Home Educational Resources based on parents’ andstudents’ reports of the number of books, the number of children’s books,and the presence of four educational aids (computer, study desk for own use,books of their own, and access to a daily newspaper) in the home, and onparents’ education.
Students assigned to the high level of this index reported coming fromhomes with more than 100 books, more than 25 children’s books, at least threeof the four educational aids, and where at least one parent finished university.Students assigned to the low level had 25 or fewer books in the home, 25 orfewer children’s books, no more than two of the four educational aids, andparents that had not completed secondary education. The remaining studentswere assigned to the medium level. Exhibit 4.6 presents the percentage of stu-dents at each level of the index for each country, together with the averagereading achievement for those students. Standard errors also are shown. Coun-tries are ordered by the percentage of students at the high level of the index,which also is displayed graphically for each country at the right hand side ofthe exhibit. The international average across all countries is shown at thebottom of each column.
On average, internationally, there were 13 percent of students at thehigh level of the index, 74 percent at the medium level, and 13 percent at the

[105]chapter 4: literacy-related activities in the home
Exhibit 4.6: Index of Home Educational Resources (HER)
SOU
RCE:
IEA
Pro
gres
s in
Inte
rnat
iona
l Rea
ding
Lite
racy
Stu
dy (P
IRLS
) 200
1.
United States 37 (1.7) 570 (3.9) 52 (1.0) 538 (3.3) 11 (1.0) 486 (6.3)
Norway 33 (1.5) 531 (3.7) 66 (1.5) 487 (2.8) 1 (0.2) ~ ~
England 27 (1.1) 584 (4.5) 69 (1.0) 547 (3.1) 4 (0.4) 479 (8.4)
Sweden 26 (1.4) 586 (2.6) 74 (1.4) 553 (2.2) 1 (0.2) ~ ~
Iceland 23 (0.7) 547 (2.4) 76 (0.7) 508 (1.4) 1 (0.2) ~ ~
New Zealand 21 (1.3) 575 (5.2) 75 (1.4) 525 (3.3) 3 (0.4) 445 (11.0)
Hungary 21 (1.2) 586 (3.4) 75 (1.1) 537 (1.8) 4 (0.5) 473 (6.7)
Scotland 20 (1.0) 562 (5.7) 74 (1.0) 528 (3.2) 6 (0.5) 460 (7.3)
Canada (O,Q) 19 (1.0) 579 (3.7) 78 (1.0) 540 (2.1) 2 (0.3) ~ ~
Israel 19 (1.1) 550 (4.6) 76 (1.2) 515 (3.0) 5 (0.4) 454 (8.1)
Germany 17 (0.8) 577 (2.7) 79 (0.8) 538 (1.7) 4 (0.4) 472 (5.7)
Latvia 15 (0.9) 578 (3.7) 83 (0.9) 541 (2.4) 2 (0.5) ~ ~
Czech Republic 15 (1.2) 570 (3.8) 83 (1.2) 535 (2.2) 2 (0.3) ~ ~
France 14 (1.0) 571 (4.3) 79 (0.9) 523 (2.1) 7 (0.5) 477 (5.6)
Cyprus 13 (0.9) 532 (5.2) 80 (0.9) 496 (2.7) 8 (0.7) 456 (8.8)
Netherlands 12 (0.7) 573 (3.8) 84 (0.7) 555 (2.3) 4 (0.5) 506 (5.9)
Kuwait r 12 (0.7) 428 (6.2) 65 (1.0) 405 (4.0) 23 (1.3) 382 (7.7)
Singapore 12 (0.8) 600 (5.1) 86 (0.8) 524 (4.8) 3 (0.3) 409 (8.0)
Slovenia 11 (0.7) 547 (3.8) 86 (0.7) 499 (1.8) 3 (0.4) 427 (13.0)
Greece 11 (1.1) 575 (5.2) 83 (1.2) 525 (3.4) 6 (0.7) 477 (7.8)
Bulgaria 11 (0.9) 605 (4.2) 75 (1.7) 558 (3.1) 14 (1.8) 493 (10.5)
Slovak Republic 10 (1.0) 561 (4.6) 86 (1.3) 519 (2.7) 4 (0.9) 429 (14.4)
Russian Federation 8 (0.6) 563 (5.4) 90 (0.7) 527 (4.4) 2 (0.4) ~ ~
Italy 7 (0.6) 585 (5.2) 86 (0.8) 542 (2.2) 7 (0.6) 498 (5.7)
Romania 5 (0.9) 575 (6.9) 78 (1.1) 520 (4.3) 17 (1.2) 469 (8.3)
Argentina r 4 (0.7) 503 (11.5) 55 (2.3) 451 (5.9) 40 (2.5) 416 (5.7)
Macedonia, Rep. of 4 (0.5) 476 (9.7) 81 (1.2) 462 (4.3) 15 (1.0) 403 (9.3)
Hong Kong, SAR 4 (0.5) 549 (6.2) 81 (0.9) 531 (3.0) 15 (1.0) 514 (5.2)
Moldova, Rep. of 4 (0.7) 568 (6.8) 89 (1.1) 492 (3.9) 7 (0.9) 459 (8.0)
Belize 3 (0.7) 406 (17.0) 58 (2.0) 346 (5.0) 39 (2.0) 301 (6.1)
Morocco r 3 (0.5) 379 (17.8) 21 (1.8) 366 (9.1) 76 (2.1) 362 (12.2)
Turkey 2 (0.5) ~ ~ 56 (1.9) 465 (4.0) 41 (2.1) 425 (3.9)
Colombia 1 (0.3) ~ ~ 50 (1.8) 439 (6.0) 48 (1.8) 407 (4.1)
Iran, Islamic Rep. of 1 (0.2) ~ ~ 61 (2.1) 443 (4.4) 38 (2.1) 369 (3.8)
Lithuania 0 (0.1) ~ ~ 98 (0.3) 545 (2.5) 1 (0.3) ~ ~
International Avg. 13 (0.2) 548 (1.3) 74 (0.2) 504 (0.6) 13 (0.2) 443 (1.5)
Percentage of Students atHigh Level of HERCountries
HighHER
MediumHER
LowHER
0 50 7525 100
Percent ofStudents
AverageAchievement
Percent ofStudents
AverageAchievement
Percent ofStudents
AverageAchievement
ISC 4th GradePIRLS 2001
Based on students’ responses to two questions about homeeducational resources: number of books in the home, and edu-cational aids in the home (computer, study desk/table for ownuse, books of their own, access to a daily newspaper); andparents’ responses to two questions: number of children’sbooks in the home, and parents’ education. High level indi-cates more than 100 books in the home; more than 25
children’s books; 3 or 4 educational aids; and highest level ofeducation for either parent is finished university. Low level indi-cates 25 or fewer books in the home; 25 or fewer children’sbooks; 2 or fewer educational aids; and highest level of educa-tion for either parent is some secondary or less. Medium levelincludes all other combinations of responses.
Index of Home Educational Resources (HER)
Background data provided by students.
( ) Standard errors appear in parentheses. Because results are rounded to the nearest wholenumber, some totals may appear inconsistent.
An “r” indicates data are available for 70-84% of the students. An “s” indicates data are avail-able for 50-69% of the students. An “x” indicates data are available for less than 50% of thestudents.
A dash (–) indicates data are not available. A tilde (~) indicates insufficient data to reportachievement.
[106] chapter 4: literacy-related activities in the home
low level, but this distribution varied considerably from country to country.While most countries had from 60 to 80 percent of students at the middle level,the most striking differences were in the high and low levels. Countries withrelatively high proportions of students from well-resourced homes (more than20% of students at the high level of the index) included the United States,Norway, England, Sweden, Iceland, New Zealand, Hungary, and Scotland.These countries all had average student performance on the PIRLS readingassessment that was at or above the international average (as shown in Exhibit 1.1).At the other extreme, Argentina, Belize, Morocco, Turkey, Colombia, and Iranhad more than one-third of their students at the low level of the index, andvery few at the high level. These countries also had average student reading per-formance that was below the international average.
Although across countries there is a rough correspondence betweenthe percentage of students at the high level of the index of home educationalresources and a country’s average reading achievement, more significant werethe differences in average reading achievement within each country betweenstudents at the three levels of the index. There was a substantial difference inthe average reading achievement of students at the three index levels for everycountry for which data were available. The difference between the interna-tional average for those at the high level (548) and those at the low level (443)amounted to 105 score points, which is more than one and one-half times thedifference between the highest-performing country (Sweden) and the inter-national average.
Because books are probably the most important literacy resource,Exhibits 4.7 through 4.9 provide more detail about the number of books instudents’ homes. Parents’ reports on the number of books in the home andassociated average reading performance are presented in Exhibit 4.7, and stu-dents’ reports on the same topic in Exhibit 4.8. Both provide a very similarpicture, although the parents’ reported a somewhat higher level of book own-ership. Students’ reports include data from more countries, however, andtherefore are more comprehensive. Both reports indicated a wide range withineach country. For example, according to students, countries with most booksin the home included Bulgaria, Canada (O,Q), the Czech Republic, England,
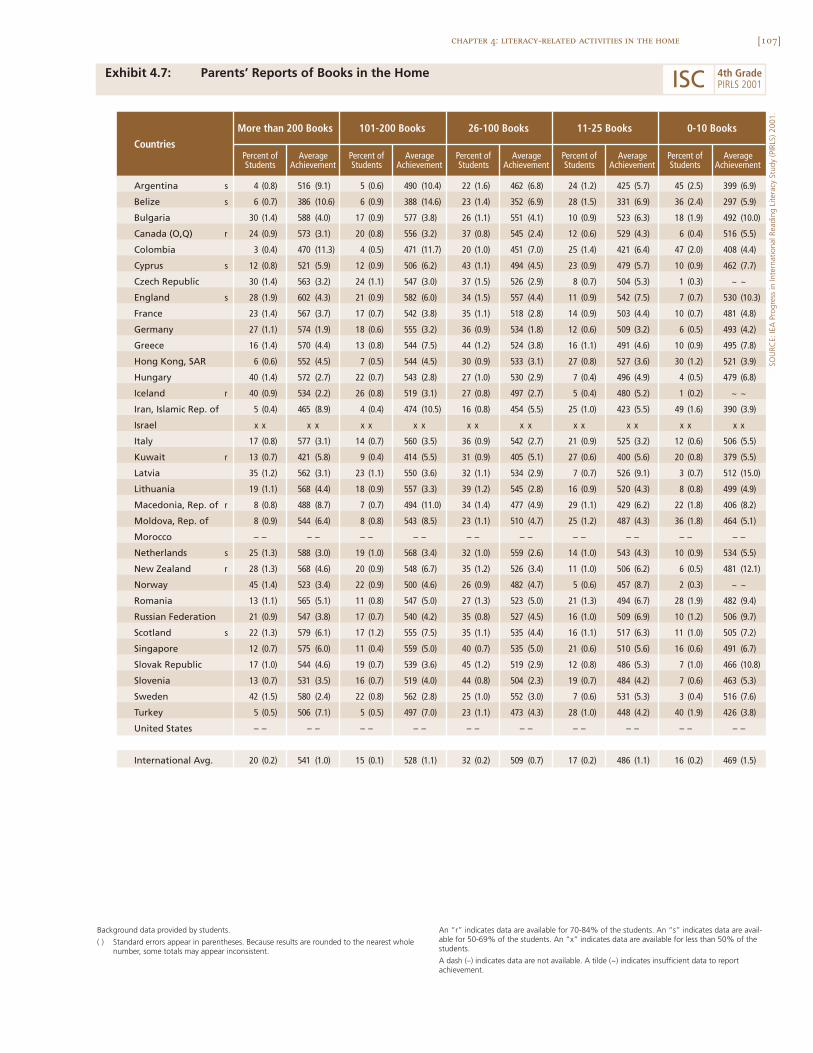
[107]chapter 4: literacy-related activities in the home
Exhibit 4.7: Parents’ Reports of Books in the Home
SOU
RCE:
IEA
Pro
gres
s in
Inte
rnat
iona
l Rea
ding
Lite
racy
Stu
dy (P
IRLS
) 200
1.
Argentina s 4 (0.8) 516 (9.1) 5 (0.6) 490 (10.4) 22 (1.6) 462 (6.8) 24 (1.2) 425 (5.7) 45 (2.5) 399 (6.9)
Belize s 6 (0.7) 386 (10.6) 6 (0.9) 388 (14.6) 23 (1.4) 352 (6.9) 28 (1.5) 331 (6.9) 36 (2.4) 297 (5.9)
Bulgaria 30 (1.4) 588 (4.0) 17 (0.9) 577 (3.8) 26 (1.1) 551 (4.1) 10 (0.9) 523 (6.3) 18 (1.9) 492 (10.0)
Canada (O,Q) r 24 (0.9) 573 (3.1) 20 (0.8) 556 (3.2) 37 (0.8) 545 (2.4) 12 (0.6) 529 (4.3) 6 (0.4) 516 (5.5)
Colombia 3 (0.4) 470 (11.3) 4 (0.5) 471 (11.7) 20 (1.0) 451 (7.0) 25 (1.4) 421 (6.4) 47 (2.0) 408 (4.4)
Cyprus s 12 (0.8) 521 (5.9) 12 (0.9) 506 (6.2) 43 (1.1) 494 (4.5) 23 (0.9) 479 (5.7) 10 (0.9) 462 (7.7)
Czech Republic 30 (1.4) 563 (3.2) 24 (1.1) 547 (3.0) 37 (1.5) 526 (2.9) 8 (0.7) 504 (5.3) 1 (0.3) ~ ~
England s 28 (1.9) 602 (4.3) 21 (0.9) 582 (6.0) 34 (1.5) 557 (4.4) 11 (0.9) 542 (7.5) 7 (0.7) 530 (10.3)
France 23 (1.4) 567 (3.7) 17 (0.7) 542 (3.8) 35 (1.1) 518 (2.8) 14 (0.9) 503 (4.4) 10 (0.7) 481 (4.8)
Germany 27 (1.1) 574 (1.9) 18 (0.6) 555 (3.2) 36 (0.9) 534 (1.8) 12 (0.6) 509 (3.2) 6 (0.5) 493 (4.2)
Greece 16 (1.4) 570 (4.4) 13 (0.8) 544 (7.5) 44 (1.2) 524 (3.8) 16 (1.1) 491 (4.6) 10 (0.9) 495 (7.8)
Hong Kong, SAR 6 (0.6) 552 (4.5) 7 (0.5) 544 (4.5) 30 (0.9) 533 (3.1) 27 (0.8) 527 (3.6) 30 (1.2) 521 (3.9)
Hungary 40 (1.4) 572 (2.7) 22 (0.7) 543 (2.8) 27 (1.0) 530 (2.9) 7 (0.4) 496 (4.9) 4 (0.5) 479 (6.8)
Iceland r 40 (0.9) 534 (2.2) 26 (0.8) 519 (3.1) 27 (0.8) 497 (2.7) 5 (0.4) 480 (5.2) 1 (0.2) ~ ~
Iran, Islamic Rep. of 5 (0.4) 465 (8.9) 4 (0.4) 474 (10.5) 16 (0.8) 454 (5.5) 25 (1.0) 423 (5.5) 49 (1.6) 390 (3.9)
Israel x x x x x x x x x x x x x x x x x x x x
Italy 17 (0.8) 577 (3.1) 14 (0.7) 560 (3.5) 36 (0.9) 542 (2.7) 21 (0.9) 525 (3.2) 12 (0.6) 506 (5.5)
Kuwait r 13 (0.7) 421 (5.8) 9 (0.4) 414 (5.5) 31 (0.9) 405 (5.1) 27 (0.6) 400 (5.6) 20 (0.8) 379 (5.5)
Latvia 35 (1.2) 562 (3.1) 23 (1.1) 550 (3.6) 32 (1.1) 534 (2.9) 7 (0.7) 526 (9.1) 3 (0.7) 512 (15.0)
Lithuania 19 (1.1) 568 (4.4) 18 (0.9) 557 (3.3) 39 (1.2) 545 (2.8) 16 (0.9) 520 (4.3) 8 (0.8) 499 (4.9)
Macedonia, Rep. of r 8 (0.8) 488 (8.7) 7 (0.7) 494 (11.0) 34 (1.4) 477 (4.9) 29 (1.1) 429 (6.2) 22 (1.8) 406 (8.2)
Moldova, Rep. of 8 (0.9) 544 (6.4) 8 (0.8) 543 (8.5) 23 (1.1) 510 (4.7) 25 (1.2) 487 (4.3) 36 (1.8) 464 (5.1)
Morocco – – – – – – – – – – – – – – – – – – – –
Netherlands s 25 (1.3) 588 (3.0) 19 (1.0) 568 (3.4) 32 (1.0) 559 (2.6) 14 (1.0) 543 (4.3) 10 (0.9) 534 (5.5)
New Zealand r 28 (1.3) 568 (4.6) 20 (0.9) 548 (6.7) 35 (1.2) 526 (3.4) 11 (1.0) 506 (6.2) 6 (0.5) 481 (12.1)
Norway 45 (1.4) 523 (3.4) 22 (0.9) 500 (4.6) 26 (0.9) 482 (4.7) 5 (0.6) 457 (8.7) 2 (0.3) ~ ~
Romania 13 (1.1) 565 (5.1) 11 (0.8) 547 (5.0) 27 (1.3) 523 (5.0) 21 (1.3) 494 (6.7) 28 (1.9) 482 (9.4)
Russian Federation 21 (0.9) 547 (3.8) 17 (0.7) 540 (4.2) 35 (0.8) 527 (4.5) 16 (1.0) 509 (6.9) 10 (1.2) 506 (9.7)
Scotland s 22 (1.3) 579 (6.1) 17 (1.2) 555 (7.5) 35 (1.1) 535 (4.4) 16 (1.1) 517 (6.3) 11 (1.0) 505 (7.2)
Singapore 12 (0.7) 575 (6.0) 11 (0.4) 559 (5.0) 40 (0.7) 535 (5.0) 21 (0.6) 510 (5.6) 16 (0.6) 491 (6.7)
Slovak Republic 17 (1.0) 544 (4.6) 19 (0.7) 539 (3.6) 45 (1.2) 519 (2.9) 12 (0.8) 486 (5.3) 7 (1.0) 466 (10.8)
Slovenia 13 (0.7) 531 (3.5) 16 (0.7) 519 (4.0) 44 (0.8) 504 (2.3) 19 (0.7) 484 (4.2) 7 (0.6) 463 (5.3)
Sweden 42 (1.5) 580 (2.4) 22 (0.8) 562 (2.8) 25 (1.0) 552 (3.0) 7 (0.6) 531 (5.3) 3 (0.4) 516 (7.6)
Turkey 5 (0.5) 506 (7.1) 5 (0.5) 497 (7.0) 23 (1.1) 473 (4.3) 28 (1.0) 448 (4.2) 40 (1.9) 426 (3.8)
United States – – – – – – – – – – – – – – – – – – – –
International Avg. 20 (0.2) 541 (1.0) 15 (0.1) 528 (1.1) 32 (0.2) 509 (0.7) 17 (0.2) 486 (1.1) 16 (0.2) 469 (1.5)
0-10 BooksMore than 200 Books 101-200 Books 26-100 Books
Countries
11-25 Books
Percent ofStudents
AverageAchievement
Percent ofStudents
AverageAchievement
Percent ofStudents
AverageAchievement
Percent ofStudents
AverageAchievement
Percent ofStudents
AverageAchievement
Background data provided by students.
( ) Standard errors appear in parentheses. Because results are rounded to the nearest wholenumber, some totals may appear inconsistent.
An “r” indicates data are available for 70-84% of the students. An “s” indicates data are avail-able for 50-69% of the students. An “x” indicates data are available for less than 50% of thestudents.
A dash (–) indicates data are not available. A tilde (~) indicates insufficient data to reportachievement.
ISC 4th GradePIRLS 2001
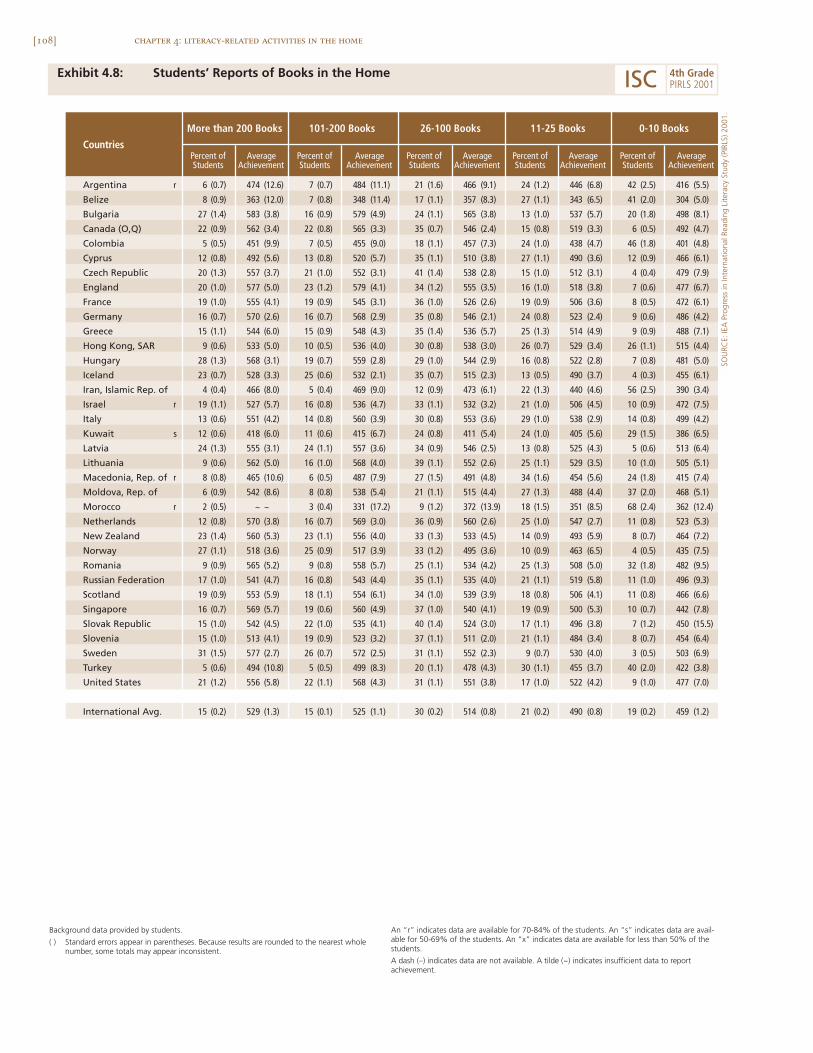
[108] chapter 4: literacy-related activities in the home
Exhibit 4.8: Students’ Reports of Books in the Home
Argentina r 6 (0.7) 474 (12.6) 7 (0.7) 484 (11.1) 21 (1.6) 466 (9.1) 24 (1.2) 446 (6.8) 42 (2.5) 416 (5.5)
Belize 8 (0.9) 363 (12.0) 7 (0.8) 348 (11.4) 17 (1.1) 357 (8.3) 27 (1.1) 343 (6.5) 41 (2.0) 304 (5.0)
Bulgaria 27 (1.4) 583 (3.8) 16 (0.9) 579 (4.9) 24 (1.1) 565 (3.8) 13 (1.0) 537 (5.7) 20 (1.8) 498 (8.1)
Canada (O,Q) 22 (0.9) 562 (3.4) 22 (0.8) 565 (3.3) 35 (0.7) 546 (2.4) 15 (0.8) 519 (3.3) 6 (0.5) 492 (4.7)
Colombia 5 (0.5) 451 (9.9) 7 (0.5) 455 (9.0) 18 (1.1) 457 (7.3) 24 (1.0) 438 (4.7) 46 (1.8) 401 (4.8)
Cyprus 12 (0.8) 492 (5.6) 13 (0.8) 520 (5.7) 35 (1.1) 510 (3.8) 27 (1.1) 490 (3.6) 12 (0.9) 466 (6.1)
Czech Republic 20 (1.3) 557 (3.7) 21 (1.0) 552 (3.1) 41 (1.4) 538 (2.8) 15 (1.0) 512 (3.1) 4 (0.4) 479 (7.9)
England 20 (1.0) 577 (5.0) 23 (1.2) 579 (4.1) 34 (1.2) 555 (3.5) 16 (1.0) 518 (3.8) 7 (0.6) 477 (6.7)
France 19 (1.0) 555 (4.1) 19 (0.9) 545 (3.1) 36 (1.0) 526 (2.6) 19 (0.9) 506 (3.6) 8 (0.5) 472 (6.1)
Germany 16 (0.7) 570 (2.6) 16 (0.7) 568 (2.9) 35 (0.8) 546 (2.1) 24 (0.8) 523 (2.4) 9 (0.6) 486 (4.2)
Greece 15 (1.1) 544 (6.0) 15 (0.9) 548 (4.3) 35 (1.4) 536 (5.7) 25 (1.3) 514 (4.9) 9 (0.9) 488 (7.1)
Hong Kong, SAR 9 (0.6) 533 (5.0) 10 (0.5) 536 (4.0) 30 (0.8) 538 (3.0) 26 (0.7) 529 (3.4) 26 (1.1) 515 (4.4)
Hungary 28 (1.3) 568 (3.1) 19 (0.7) 559 (2.8) 29 (1.0) 544 (2.9) 16 (0.8) 522 (2.8) 7 (0.8) 481 (5.0)
Iceland 23 (0.7) 528 (3.3) 25 (0.6) 532 (2.1) 35 (0.7) 515 (2.3) 13 (0.5) 490 (3.7) 4 (0.3) 455 (6.1)
Iran, Islamic Rep. of 4 (0.4) 466 (8.0) 5 (0.4) 469 (9.0) 12 (0.9) 473 (6.1) 22 (1.3) 440 (4.6) 56 (2.5) 390 (3.4)
Israel r 19 (1.1) 527 (5.7) 16 (0.8) 536 (4.7) 33 (1.1) 532 (3.2) 21 (1.0) 506 (4.5) 10 (0.9) 472 (7.5)
Italy 13 (0.6) 551 (4.2) 14 (0.8) 560 (3.9) 30 (0.8) 553 (3.6) 29 (1.0) 538 (2.9) 14 (0.8) 499 (4.2)
Kuwait s 12 (0.6) 418 (6.0) 11 (0.6) 415 (6.7) 24 (0.8) 411 (5.4) 24 (1.0) 405 (5.6) 29 (1.5) 386 (6.5)
Latvia 24 (1.3) 555 (3.1) 24 (1.1) 557 (3.6) 34 (0.9) 546 (2.5) 13 (0.8) 525 (4.3) 5 (0.6) 513 (6.4)
Lithuania 9 (0.6) 562 (5.0) 16 (1.0) 568 (4.0) 39 (1.1) 552 (2.6) 25 (1.1) 529 (3.5) 10 (1.0) 505 (5.1)
Macedonia, Rep. of r 8 (0.8) 465 (10.6) 6 (0.5) 487 (7.9) 27 (1.5) 491 (4.8) 34 (1.6) 454 (5.6) 24 (1.8) 415 (7.4)
Moldova, Rep. of 6 (0.9) 542 (8.6) 8 (0.8) 538 (5.4) 21 (1.1) 515 (4.4) 27 (1.3) 488 (4.4) 37 (2.0) 468 (5.1)
Morocco r 2 (0.5) ~ ~ 3 (0.4) 331 (17.2) 9 (1.2) 372 (13.9) 18 (1.5) 351 (8.5) 68 (2.4) 362 (12.4)
Netherlands 12 (0.8) 570 (3.8) 16 (0.7) 569 (3.0) 36 (0.9) 560 (2.6) 25 (1.0) 547 (2.7) 11 (0.8) 523 (5.3)
New Zealand 23 (1.4) 560 (5.3) 23 (1.1) 556 (4.0) 33 (1.3) 533 (4.5) 14 (0.9) 493 (5.9) 8 (0.7) 464 (7.2)
Norway 27 (1.1) 518 (3.6) 25 (0.9) 517 (3.9) 33 (1.2) 495 (3.6) 10 (0.9) 463 (6.5) 4 (0.5) 435 (7.5)
Romania 9 (0.9) 565 (5.2) 9 (0.8) 558 (5.7) 25 (1.1) 534 (4.2) 25 (1.3) 508 (5.0) 32 (1.8) 482 (9.5)
Russian Federation 17 (1.0) 541 (4.7) 16 (0.8) 543 (4.4) 35 (1.1) 535 (4.0) 21 (1.1) 519 (5.8) 11 (1.0) 496 (9.3)
Scotland 19 (0.9) 553 (5.9) 18 (1.1) 554 (6.1) 34 (1.0) 539 (3.9) 18 (0.8) 506 (4.1) 11 (0.8) 466 (6.6)
Singapore 16 (0.7) 569 (5.7) 19 (0.6) 560 (4.9) 37 (1.0) 540 (4.1) 19 (0.9) 500 (5.3) 10 (0.7) 442 (7.8)
Slovak Republic 15 (1.0) 542 (4.5) 22 (1.0) 535 (4.1) 40 (1.4) 524 (3.0) 17 (1.1) 496 (3.8) 7 (1.2) 450 (15.5)
Slovenia 15 (1.0) 513 (4.1) 19 (0.9) 523 (3.2) 37 (1.1) 511 (2.0) 21 (1.1) 484 (3.4) 8 (0.7) 454 (6.4)
Sweden 31 (1.5) 577 (2.7) 26 (0.7) 572 (2.5) 31 (1.1) 552 (2.3) 9 (0.7) 530 (4.0) 3 (0.5) 503 (6.9)
Turkey 5 (0.6) 494 (10.8) 5 (0.5) 499 (8.3) 20 (1.1) 478 (4.3) 30 (1.1) 455 (3.7) 40 (2.0) 422 (3.8)
United States 21 (1.2) 556 (5.8) 22 (1.1) 568 (4.3) 31 (1.1) 551 (3.8) 17 (1.0) 522 (4.2) 9 (1.0) 477 (7.0)
International Avg. 15 (0.2) 529 (1.3) 15 (0.1) 525 (1.1) 30 (0.2) 514 (0.8) 21 (0.2) 490 (0.8) 19 (0.2) 459 (1.2)
Countries
0-10 BooksMore than 200 Books 101-200 Books 26-100 Books 11-25 Books
Percent ofStudents
AverageAchievement
Percent ofStudents
AverageAchievement
Percent ofStudents
AverageAchievement
Percent ofStudents
AverageAchievement
Percent ofStudents
AverageAchievement
Background data provided by students.
( ) Standard errors appear in parentheses. Because results are rounded to the nearest wholenumber, some totals may appear inconsistent.
An “r” indicates data are available for 70-84% of the students. An “s” indicates data are avail-able for 50-69% of the students. An “x” indicates data are available for less than 50% of thestudents.
A dash (–) indicates data are not available. A tilde (~) indicates insufficient data to reportachievement.
SOU
RCE:
IEA
Pro
gres
s in
Inte
rnat
iona
l Rea
ding
Lite
racy
Stu
dy (P
IRLS
) 200
1.
ISC 4th GradePIRLS 2001
[109]chapter 4: literacy-related activities in the home
Hungary, Iceland, Latvia, New Zealand, Norway, Sweden, and the UnitedStates, all of which had at least 20 percent of students reporting more than200 books in the home. Countries where students reported having fewer booksincluded Argentina, Belize, Colombia, Iran, Morocco, and Turkey, where 40percent or more reported having no more than 10 books at home. On average,across countries, and in most countries individually, the more books reportedin the home the higher the reading achievement.
Having children’s books in the home may be more important for fos-tering literacy among young children than having books in general. Parents’reports of the number of children’s books in the home (Exhibit 4.9) indicateda fairly high level of ownership. On average, across countries, the majority ofchildren (58%) were in homes with more than 25 children’s books. Countrieswhere parents reported the greatest number of children’s books includedCanada (O,Q), England, Iceland, New Zealand, Norway, and Sweden, where30 percent or more of students had parents reporting more than 100 children’sbooks in the home. However, according to parents there were also countrieswith relatively few children’s books in homes, including Argentina, Colombia,Iran, Moldova, and Turkey, where the majority of students were in homeswith no more than 10 children’s books. The average reading achievement dif-ference between students from homes with lots of children’s books and thosefrom homes with few books was very large. Students from homes with morethan 100 children’s books had an average score of 552 points, whereas thosefrom homes with 10 books or less had an average of just 466 score points – adifference of 86 points.
To provide further information on the educational resources in thehome included in the Index of Home Educational Resources, Exhibit 4.10 pres-ents the percent of students that reported having in their homes a computer,a study desk or table for their own use, books of their very own (not schoolbooks), and a daily newspaper. On average, 86 percent of students reportedhaving books of their own, 78 percent a study desk or table, 58 percent a dailynewspaper, and 57 percent a computer. For each of the four items, studentsreporting having them had higher average reading achievement than those
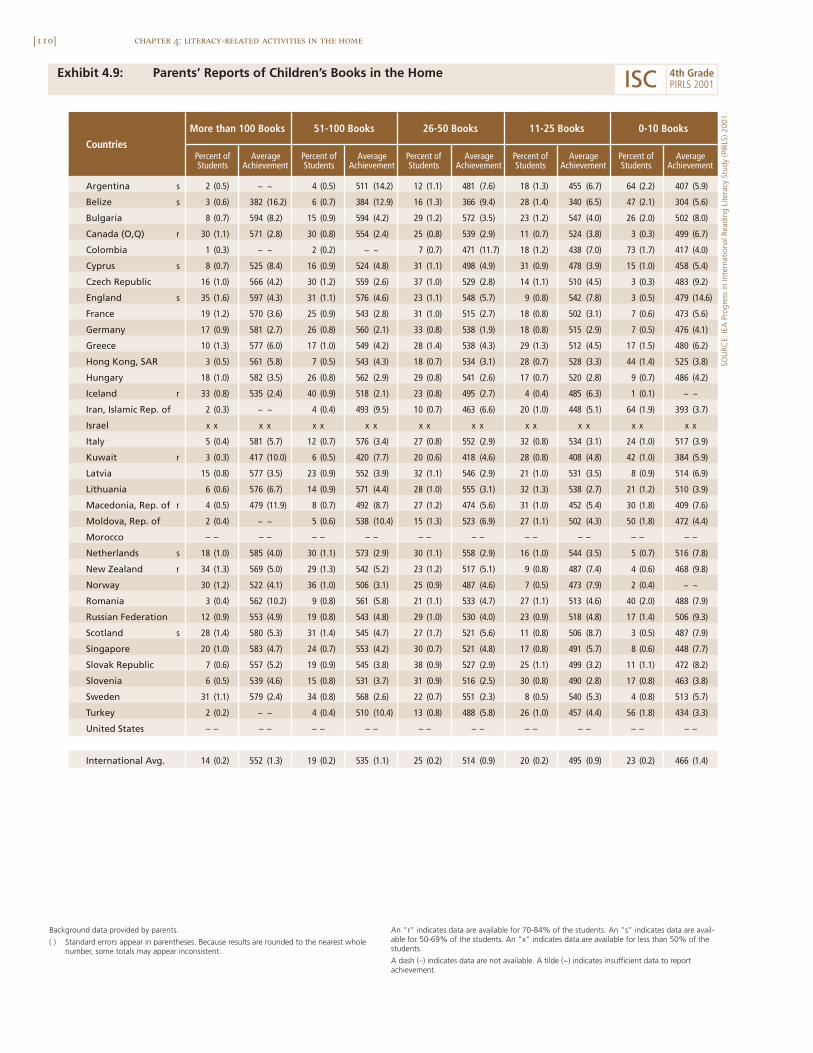
[110] chapter 4: literacy-related activities in the home
Exhibit 4.9: Parents’ Reports of Children’s Books in the Home
Argentina s 2 (0.5) ~ ~ 4 (0.5) 511 (14.2) 12 (1.1) 481 (7.6) 18 (1.3) 455 (6.7) 64 (2.2) 407 (5.9)
Belize s 3 (0.6) 382 (16.2) 6 (0.7) 384 (12.9) 16 (1.3) 366 (9.4) 28 (1.4) 340 (6.5) 47 (2.1) 304 (5.6)
Bulgaria 8 (0.7) 594 (8.2) 15 (0.9) 594 (4.2) 29 (1.2) 572 (3.5) 23 (1.2) 547 (4.0) 26 (2.0) 502 (8.0)
Canada (O,Q) r 30 (1.1) 571 (2.8) 30 (0.8) 554 (2.4) 25 (0.8) 539 (2.9) 11 (0.7) 524 (3.8) 3 (0.3) 499 (6.7)
Colombia 1 (0.3) ~ ~ 2 (0.2) ~ ~ 7 (0.7) 471 (11.7) 18 (1.2) 438 (7.0) 73 (1.7) 417 (4.0)
Cyprus s 8 (0.7) 525 (8.4) 16 (0.9) 524 (4.8) 31 (1.1) 498 (4.9) 31 (0.9) 478 (3.9) 15 (1.0) 458 (5.4)
Czech Republic 16 (1.0) 566 (4.2) 30 (1.2) 559 (2.6) 37 (1.0) 529 (2.8) 14 (1.1) 510 (4.5) 3 (0.3) 483 (9.2)
England s 35 (1.6) 597 (4.3) 31 (1.1) 576 (4.6) 23 (1.1) 548 (5.7) 9 (0.8) 542 (7.8) 3 (0.5) 479 (14.6)
France 19 (1.2) 570 (3.6) 25 (0.9) 543 (2.8) 31 (1.0) 515 (2.7) 18 (0.8) 502 (3.1) 7 (0.6) 473 (5.6)
Germany 17 (0.9) 581 (2.7) 26 (0.8) 560 (2.1) 33 (0.8) 538 (1.9) 18 (0.8) 515 (2.9) 7 (0.5) 476 (4.1)
Greece 10 (1.3) 577 (6.0) 17 (1.0) 549 (4.2) 28 (1.4) 538 (4.3) 29 (1.3) 512 (4.5) 17 (1.5) 480 (6.2)
Hong Kong, SAR 3 (0.5) 561 (5.8) 7 (0.5) 543 (4.3) 18 (0.7) 534 (3.1) 28 (0.7) 528 (3.3) 44 (1.4) 525 (3.8)
Hungary 18 (1.0) 582 (3.5) 26 (0.8) 562 (2.9) 29 (0.8) 541 (2.6) 17 (0.7) 520 (2.8) 9 (0.7) 486 (4.2)
Iceland r 33 (0.8) 535 (2.4) 40 (0.9) 518 (2.1) 23 (0.8) 495 (2.7) 4 (0.4) 485 (6.3) 1 (0.1) ~ ~
Iran, Islamic Rep. of 2 (0.3) ~ ~ 4 (0.4) 493 (9.5) 10 (0.7) 463 (6.6) 20 (1.0) 448 (5.1) 64 (1.9) 393 (3.7)
Israel x x x x x x x x x x x x x x x x x x x x
Italy 5 (0.4) 581 (5.7) 12 (0.7) 576 (3.4) 27 (0.8) 552 (2.9) 32 (0.8) 534 (3.1) 24 (1.0) 517 (3.9)
Kuwait r 3 (0.3) 417 (10.0) 6 (0.5) 420 (7.7) 20 (0.6) 418 (4.6) 28 (0.8) 408 (4.8) 42 (1.0) 384 (5.9)
Latvia 15 (0.8) 577 (3.5) 23 (0.9) 552 (3.9) 32 (1.1) 546 (2.9) 21 (1.0) 531 (3.5) 8 (0.9) 514 (6.9)
Lithuania 6 (0.6) 576 (6.7) 14 (0.9) 571 (4.4) 28 (1.0) 555 (3.1) 32 (1.3) 538 (2.7) 21 (1.2) 510 (3.9)
Macedonia, Rep. of r 4 (0.5) 479 (11.9) 8 (0.7) 492 (8.7) 27 (1.2) 474 (5.6) 31 (1.0) 452 (5.4) 30 (1.8) 409 (7.6)
Moldova, Rep. of 2 (0.4) ~ ~ 5 (0.6) 538 (10.4) 15 (1.3) 523 (6.9) 27 (1.1) 502 (4.3) 50 (1.8) 472 (4.4)
Morocco – – – – – – – – – – – – – – – – – – – –
Netherlands s 18 (1.0) 585 (4.0) 30 (1.1) 573 (2.9) 30 (1.1) 558 (2.9) 16 (1.0) 544 (3.5) 5 (0.7) 516 (7.8)
New Zealand r 34 (1.3) 569 (5.0) 29 (1.3) 542 (5.2) 23 (1.2) 517 (5.1) 9 (0.8) 487 (7.4) 4 (0.6) 468 (9.8)
Norway 30 (1.2) 522 (4.1) 36 (1.0) 506 (3.1) 25 (0.9) 487 (4.6) 7 (0.5) 473 (7.9) 2 (0.4) ~ ~
Romania 3 (0.4) 562 (10.2) 9 (0.8) 561 (5.8) 21 (1.1) 533 (4.7) 27 (1.1) 513 (4.6) 40 (2.0) 488 (7.9)
Russian Federation 12 (0.9) 553 (4.9) 19 (0.8) 543 (4.8) 29 (1.0) 530 (4.0) 23 (0.9) 518 (4.8) 17 (1.4) 506 (9.3)
Scotland s 28 (1.4) 580 (5.3) 31 (1.4) 545 (4.7) 27 (1.7) 521 (5.6) 11 (0.8) 506 (8.7) 3 (0.5) 487 (7.9)
Singapore 20 (1.0) 583 (4.7) 24 (0.7) 553 (4.2) 30 (0.7) 521 (4.8) 17 (0.8) 491 (5.7) 8 (0.6) 448 (7.7)
Slovak Republic 7 (0.6) 557 (5.2) 19 (0.9) 545 (3.8) 38 (0.9) 527 (2.9) 25 (1.1) 499 (3.2) 11 (1.1) 472 (8.2)
Slovenia 6 (0.5) 539 (4.6) 15 (0.8) 531 (3.7) 31 (0.9) 516 (2.5) 30 (0.8) 490 (2.8) 17 (0.8) 463 (3.8)
Sweden 31 (1.1) 579 (2.4) 34 (0.8) 568 (2.6) 22 (0.7) 551 (2.3) 8 (0.5) 540 (5.3) 4 (0.8) 513 (5.7)
Turkey 2 (0.2) ~ ~ 4 (0.4) 510 (10.4) 13 (0.8) 488 (5.8) 26 (1.0) 457 (4.4) 56 (1.8) 434 (3.3)
United States – – – – – – – – – – – – – – – – – – – –
International Avg. 14 (0.2) 552 (1.3) 19 (0.2) 535 (1.1) 25 (0.2) 514 (0.9) 20 (0.2) 495 (0.9) 23 (0.2) 466 (1.4)
Countries
0-10 BooksMore than 100 Books 51-100 Books 26-50 Books 11-25 Books
Percent ofStudents
AverageAchievement
Percent ofStudents
AverageAchievement
Percent ofStudents
AverageAchievement
Percent ofStudents
AverageAchievement
Percent ofStudents
AverageAchievement
Background data provided by parents.
( ) Standard errors appear in parentheses. Because results are rounded to the nearest wholenumber, some totals may appear inconsistent.
An “r” indicates data are available for 70-84% of the students. An “s” indicates data are avail-able for 50-69% of the students. An “x” indicates data are available for less than 50% of thestudents.
A dash (–) indicates data are not available. A tilde (~) indicates insufficient data to reportachievement.
SOU
RCE:
IEA
Pro
gres
s in
Inte
rnat
iona
l Rea
ding
Lite
racy
Stu
dy (P
IRLS
) 200
1.
ISC 4th GradePIRLS 2001
[111]chapter 4: literacy-related activities in the home
reporting not having them. The biggest achievement difference (54 score points)was between those having and not having books of their own.
The final component of the Index of Home Educational Resources,parents’ highest level of education, is presented in detail in Exhibit 4.11. Onaverage, 23 percent of students came from homes where parents reported thatone or both of them had finished university, 15 percent where one or both fin-ished post-secondary school but not university, 36 percent where one or bothfinished upper-secondary school, 17 percent where one or both finished lower-secondary school, and 9 percent where parents finished some primary or lowersecondary school, or did not go to school. The average reading achievementdifference between students whose parents finished university and those inthe lowest educational category was almost 100 score points.
Because educational resources are dependent to a large extent on eco-nomic considerations, Exhibits 4.12 through 4.14 present information onparents’ employment situations and on fathers’ and mothers’ occupations. Asshown in Exhibit 4.12, about one-third of students internationally (34%) werefrom homes where both parents were working full-time for pay, almost half(49%) where one but not both were working full-time, and just 7 percentwhere both parents were working less than full-time. One-tenth of the stu-dents were from homes with other situations. Average student reading achieve-ment was highest among students from homes where both parents were workingfull-time for pay, and lowest where both were working less than full-time.
As shown in Exhibits 4.13 and 4.14, parents’ responses to a questionabout the kind of work they did for their main job were grouped into seven cat-egories: professional, small business owner, clerical, skilled, general laborer,never worked outside the home for pay, and not applicable. The distributionof responses for fathers and mothers was similar across several of the cate-gories, including professional, small business owner, and laborer. For example,25 percent of students had fathers in the professional category and 22 percenthad mothers in this category. However, a greater percentage of students hadfathers in the skilled category than mothers (34% vs. 8%), and greater per-centages had mothers in the clerical category (28% vs. 12%) or who had neverworked outside the home for pay (12% vs. 2%). Average student reading
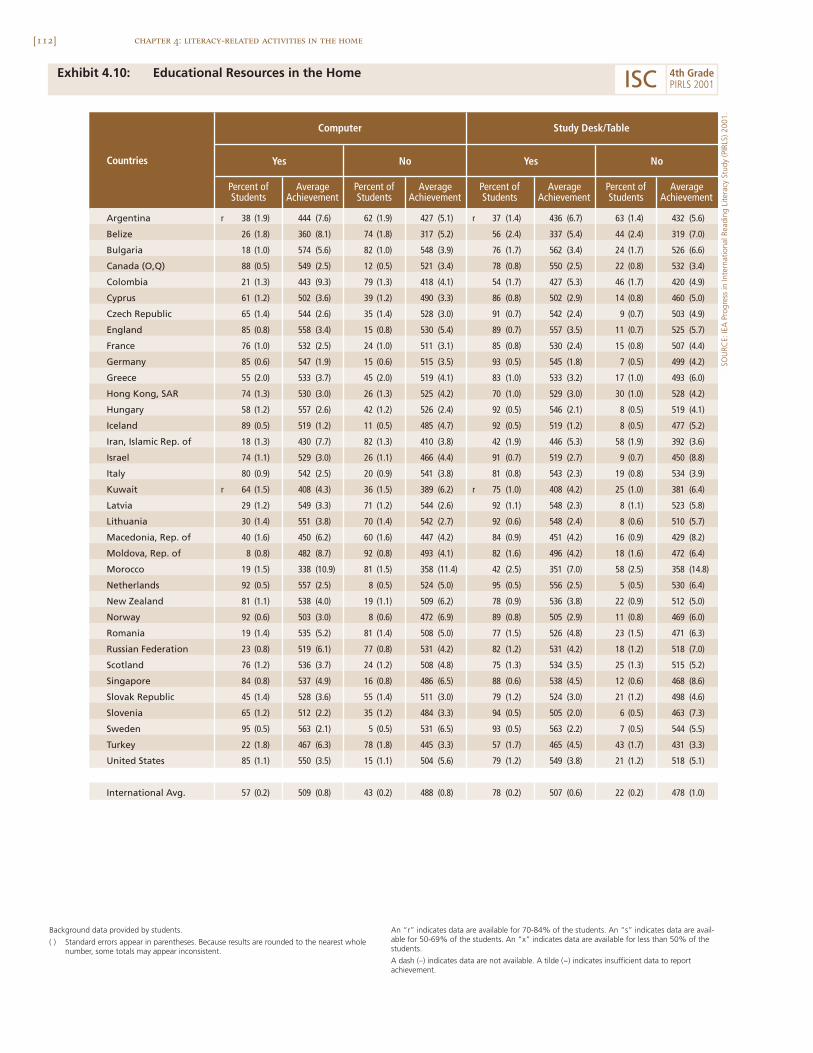
[112] chapter 4: literacy-related activities in the home
Exhibit 4.10: Educational Resources in the Home
Argentina
Belize
Bulgaria
Canada (O,Q)
Colombia
Cyprus
Czech Republic
England
France
Germany
Greece
Hong Kong, SAR
Hungary
Iceland
Iran, Islamic Rep. of
Israel
Italy
Kuwait
Latvia
Lithuania
Macedonia, Rep. of
Moldova, Rep. of
Morocco
Netherlands
New Zealand
Norway
Romania
Russian Federation
Scotland
Singapore
Slovak Republic
Slovenia
Sweden
Turkey
United States
International Avg.
Countries
Study Desk/TableComputer
NoYes NoYes
AverageAchievement
Percent ofStudents
AverageAchievement
Percent ofStudents
AverageAchievement
Percent ofStudents
AverageAchievement
Percent ofStudents
r 38 (1.9) 444 (7.6) 62 (1.9) 427 (5.1) r 37 (1.4) 436 (6.7) 63 (1.4) 432 (5.6)
26 (1.8) 360 (8.1) 74 (1.8) 317 (5.2) 56 (2.4) 337 (5.4) 44 (2.4) 319 (7.0)
18 (1.0) 574 (5.6) 82 (1.0) 548 (3.9) 76 (1.7) 562 (3.4) 24 (1.7) 526 (6.6)
88 (0.5) 549 (2.5) 12 (0.5) 521 (3.4) 78 (0.8) 550 (2.5) 22 (0.8) 532 (3.4)
21 (1.3) 443 (9.3) 79 (1.3) 418 (4.1) 54 (1.7) 427 (5.3) 46 (1.7) 420 (4.9)
61 (1.2) 502 (3.6) 39 (1.2) 490 (3.3) 86 (0.8) 502 (2.9) 14 (0.8) 460 (5.0)
65 (1.4) 544 (2.6) 35 (1.4) 528 (3.0) 91 (0.7) 542 (2.4) 9 (0.7) 503 (4.9)
85 (0.8) 558 (3.4) 15 (0.8) 530 (5.4) 89 (0.7) 557 (3.5) 11 (0.7) 525 (5.7)
76 (1.0) 532 (2.5) 24 (1.0) 511 (3.1) 85 (0.8) 530 (2.4) 15 (0.8) 507 (4.4)
85 (0.6) 547 (1.9) 15 (0.6) 515 (3.5) 93 (0.5) 545 (1.8) 7 (0.5) 499 (4.2)
55 (2.0) 533 (3.7) 45 (2.0) 519 (4.1) 83 (1.0) 533 (3.2) 17 (1.0) 493 (6.0)
74 (1.3) 530 (3.0) 26 (1.3) 525 (4.2) 70 (1.0) 529 (3.0) 30 (1.0) 528 (4.2)
58 (1.2) 557 (2.6) 42 (1.2) 526 (2.4) 92 (0.5) 546 (2.1) 8 (0.5) 519 (4.1)
89 (0.5) 519 (1.2) 11 (0.5) 485 (4.7) 92 (0.5) 519 (1.2) 8 (0.5) 477 (5.2)
18 (1.3) 430 (7.7) 82 (1.3) 410 (3.8) 42 (1.9) 446 (5.3) 58 (1.9) 392 (3.6)
74 (1.1) 529 (3.0) 26 (1.1) 466 (4.4) 91 (0.7) 519 (2.7) 9 (0.7) 450 (8.8)
80 (0.9) 542 (2.5) 20 (0.9) 541 (3.8) 81 (0.8) 543 (2.3) 19 (0.8) 534 (3.9)
r 64 (1.5) 408 (4.3) 36 (1.5) 389 (6.2) r 75 (1.0) 408 (4.2) 25 (1.0) 381 (6.4)
29 (1.2) 549 (3.3) 71 (1.2) 544 (2.6) 92 (1.1) 548 (2.3) 8 (1.1) 523 (5.8)
30 (1.4) 551 (3.8) 70 (1.4) 542 (2.7) 92 (0.6) 548 (2.4) 8 (0.6) 510 (5.7)
40 (1.6) 450 (6.2) 60 (1.6) 447 (4.2) 84 (0.9) 451 (4.2) 16 (0.9) 429 (8.2)
8 (0.8) 482 (8.7) 92 (0.8) 493 (4.1) 82 (1.6) 496 (4.2) 18 (1.6) 472 (6.4)
19 (1.5) 338 (10.9) 81 (1.5) 358 (11.4) 42 (2.5) 351 (7.0) 58 (2.5) 358 (14.8)
92 (0.5) 557 (2.5) 8 (0.5) 524 (5.0) 95 (0.5) 556 (2.5) 5 (0.5) 530 (6.4)
81 (1.1) 538 (4.0) 19 (1.1) 509 (6.2) 78 (0.9) 536 (3.8) 22 (0.9) 512 (5.0)
92 (0.6) 503 (3.0) 8 (0.6) 472 (6.9) 89 (0.8) 505 (2.9) 11 (0.8) 469 (6.0)
19 (1.4) 535 (5.2) 81 (1.4) 508 (5.0) 77 (1.5) 526 (4.8) 23 (1.5) 471 (6.3)
23 (0.8) 519 (6.1) 77 (0.8) 531 (4.2) 82 (1.2) 531 (4.2) 18 (1.2) 518 (7.0)
76 (1.2) 536 (3.7) 24 (1.2) 508 (4.8) 75 (1.3) 534 (3.5) 25 (1.3) 515 (5.2)
84 (0.8) 537 (4.9) 16 (0.8) 486 (6.5) 88 (0.6) 538 (4.5) 12 (0.6) 468 (8.6)
45 (1.4) 528 (3.6) 55 (1.4) 511 (3.0) 79 (1.2) 524 (3.0) 21 (1.2) 498 (4.6)
65 (1.2) 512 (2.2) 35 (1.2) 484 (3.3) 94 (0.5) 505 (2.0) 6 (0.5) 463 (7.3)
95 (0.5) 563 (2.1) 5 (0.5) 531 (6.5) 93 (0.5) 563 (2.2) 7 (0.5) 544 (5.5)
22 (1.8) 467 (6.3) 78 (1.8) 445 (3.3) 57 (1.7) 465 (4.5) 43 (1.7) 431 (3.3)
85 (1.1) 550 (3.5) 15 (1.1) 504 (5.6) 79 (1.2) 549 (3.8) 21 (1.2) 518 (5.1)
57 (0.2) 509 (0.8) 43 (0.2) 488 (0.8) 78 (0.2) 507 (0.6) 22 (0.2) 478 (1.0)
Background data provided by students.
( ) Standard errors appear in parentheses. Because results are rounded to the nearest wholenumber, some totals may appear inconsistent.
An “r” indicates data are available for 70-84% of the students. An “s” indicates data are avail-able for 50-69% of the students. An “x” indicates data are available for less than 50% of thestudents.
A dash (–) indicates data are not available. A tilde (~) indicates insufficient data to reportachievement.
SOU
RCE:
IEA
Pro
gres
s in
Inte
rnat
iona
l Rea
ding
Lite
racy
Stu
dy (P
IRLS
) 200
1.
ISC 4th GradePIRLS 2001
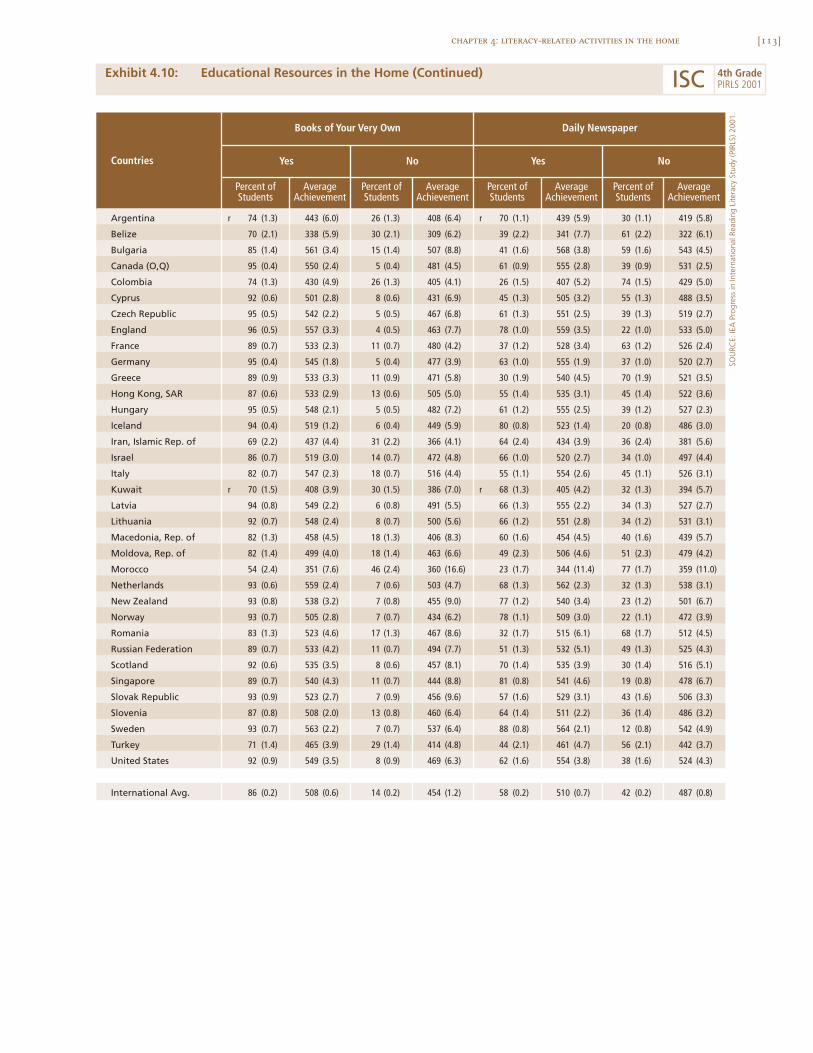
[113]chapter 4: literacy-related activities in the home
Exhibit 4.10: Educational Resources in the Home (Continued)
SOU
RCE:
IEA
Pro
gres
s in
Inte
rnat
iona
l Rea
ding
Lite
racy
Stu
dy (P
IRLS
) 200
1.
Argentina r 74 (1.3) 443 (6.0) 26 (1.3) 408 (6.4) r 70 (1.1) 439 (5.9) 30 (1.1) 419 (5.8)
Belize 70 (2.1) 338 (5.9) 30 (2.1) 309 (6.2) 39 (2.2) 341 (7.7) 61 (2.2) 322 (6.1)
Bulgaria 85 (1.4) 561 (3.4) 15 (1.4) 507 (8.8) 41 (1.6) 568 (3.8) 59 (1.6) 543 (4.5)
Canada (O,Q) 95 (0.4) 550 (2.4) 5 (0.4) 481 (4.5) 61 (0.9) 555 (2.8) 39 (0.9) 531 (2.5)
Colombia 74 (1.3) 430 (4.9) 26 (1.3) 405 (4.1) 26 (1.5) 407 (5.2) 74 (1.5) 429 (5.0)
Cyprus 92 (0.6) 501 (2.8) 8 (0.6) 431 (6.9) 45 (1.3) 505 (3.2) 55 (1.3) 488 (3.5)
Czech Republic 95 (0.5) 542 (2.2) 5 (0.5) 467 (6.8) 61 (1.3) 551 (2.5) 39 (1.3) 519 (2.7)
England 96 (0.5) 557 (3.3) 4 (0.5) 463 (7.7) 78 (1.0) 559 (3.5) 22 (1.0) 533 (5.0)
France 89 (0.7) 533 (2.3) 11 (0.7) 480 (4.2) 37 (1.2) 528 (3.4) 63 (1.2) 526 (2.4)
Germany 95 (0.4) 545 (1.8) 5 (0.4) 477 (3.9) 63 (1.0) 555 (1.9) 37 (1.0) 520 (2.7)
Greece 89 (0.9) 533 (3.3) 11 (0.9) 471 (5.8) 30 (1.9) 540 (4.5) 70 (1.9) 521 (3.5)
Hong Kong, SAR 87 (0.6) 533 (2.9) 13 (0.6) 505 (5.0) 55 (1.4) 535 (3.1) 45 (1.4) 522 (3.6)
Hungary 95 (0.5) 548 (2.1) 5 (0.5) 482 (7.2) 61 (1.2) 555 (2.5) 39 (1.2) 527 (2.3)
Iceland 94 (0.4) 519 (1.2) 6 (0.4) 449 (5.9) 80 (0.8) 523 (1.4) 20 (0.8) 486 (3.0)
Iran, Islamic Rep. of 69 (2.2) 437 (4.4) 31 (2.2) 366 (4.1) 64 (2.4) 434 (3.9) 36 (2.4) 381 (5.6)
Israel 86 (0.7) 519 (3.0) 14 (0.7) 472 (4.8) 66 (1.0) 520 (2.7) 34 (1.0) 497 (4.4)
Italy 82 (0.7) 547 (2.3) 18 (0.7) 516 (4.4) 55 (1.1) 554 (2.6) 45 (1.1) 526 (3.1)
Kuwait r 70 (1.5) 408 (3.9) 30 (1.5) 386 (7.0) r 68 (1.3) 405 (4.2) 32 (1.3) 394 (5.7)
Latvia 94 (0.8) 549 (2.2) 6 (0.8) 491 (5.5) 66 (1.3) 555 (2.2) 34 (1.3) 527 (2.7)
Lithuania 92 (0.7) 548 (2.4) 8 (0.7) 500 (5.6) 66 (1.2) 551 (2.8) 34 (1.2) 531 (3.1)
Macedonia, Rep. of 82 (1.3) 458 (4.5) 18 (1.3) 406 (8.3) 60 (1.6) 454 (4.5) 40 (1.6) 439 (5.7)
Moldova, Rep. of 82 (1.4) 499 (4.0) 18 (1.4) 463 (6.6) 49 (2.3) 506 (4.6) 51 (2.3) 479 (4.2)
Morocco 54 (2.4) 351 (7.6) 46 (2.4) 360 (16.6) 23 (1.7) 344 (11.4) 77 (1.7) 359 (11.0)
Netherlands 93 (0.6) 559 (2.4) 7 (0.6) 503 (4.7) 68 (1.3) 562 (2.3) 32 (1.3) 538 (3.1)
New Zealand 93 (0.8) 538 (3.2) 7 (0.8) 455 (9.0) 77 (1.2) 540 (3.4) 23 (1.2) 501 (6.7)
Norway 93 (0.7) 505 (2.8) 7 (0.7) 434 (6.2) 78 (1.1) 509 (3.0) 22 (1.1) 472 (3.9)
Romania 83 (1.3) 523 (4.6) 17 (1.3) 467 (8.6) 32 (1.7) 515 (6.1) 68 (1.7) 512 (4.5)
Russian Federation 89 (0.7) 533 (4.2) 11 (0.7) 494 (7.7) 51 (1.3) 532 (5.1) 49 (1.3) 525 (4.3)
Scotland 92 (0.6) 535 (3.5) 8 (0.6) 457 (8.1) 70 (1.4) 535 (3.9) 30 (1.4) 516 (5.1)
Singapore 89 (0.7) 540 (4.3) 11 (0.7) 444 (8.8) 81 (0.8) 541 (4.6) 19 (0.8) 478 (6.7)
Slovak Republic 93 (0.9) 523 (2.7) 7 (0.9) 456 (9.6) 57 (1.6) 529 (3.1) 43 (1.6) 506 (3.3)
Slovenia 87 (0.8) 508 (2.0) 13 (0.8) 460 (6.4) 64 (1.4) 511 (2.2) 36 (1.4) 486 (3.2)
Sweden 93 (0.7) 563 (2.2) 7 (0.7) 537 (6.4) 88 (0.8) 564 (2.1) 12 (0.8) 542 (4.9)
Turkey 71 (1.4) 465 (3.9) 29 (1.4) 414 (4.8) 44 (2.1) 461 (4.7) 56 (2.1) 442 (3.7)
United States 92 (0.9) 549 (3.5) 8 (0.9) 469 (6.3) 62 (1.6) 554 (3.8) 38 (1.6) 524 (4.3)
International Avg. 86 (0.2) 508 (0.6) 14 (0.2) 454 (1.2) 58 (0.2) 510 (0.7) 42 (0.2) 487 (0.8)
Countries
Books of Your Very Own Daily Newspaper
NoYes NoYes
AverageAchievement
Percent ofStudents
AverageAchievement
Percent ofStudents
AverageAchievement
Percent ofStudents
AverageAchievement
Percent ofStudents
ISC 4th GradePIRLS 2001
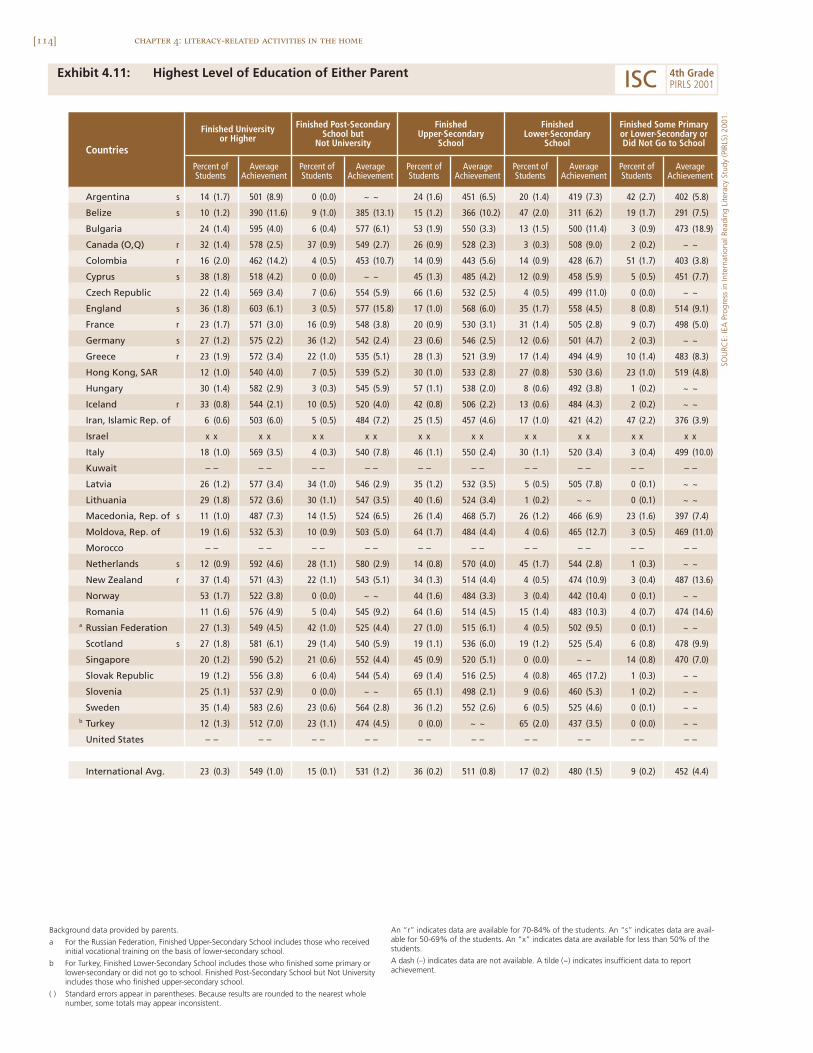
[114] chapter 4: literacy-related activities in the home
Exhibit 4.11: Highest Level of Education of Either Parent
Countries
Finished Post-SecondarySchool but
Not University
FinishedUpper-Secondary
School
FinishedLower-Secondary
School
Percent ofStudents
AverageAchievement
Finished Some Primaryor Lower-Secondary orDid Not Go to School
Finished Universityor Higher
Percent ofStudents
AverageAchievement
Percent ofStudents
AverageAchievement
Percent ofStudents
AverageAchievement
Percent ofStudents
AverageAchievement
Argentina s 14 (1.7) 501 (8.9) 0 (0.0) ~ ~ 24 (1.6) 451 (6.5) 20 (1.4) 419 (7.3) 42 (2.7) 402 (5.8)
Belize s 10 (1.2) 390 (11.6) 9 (1.0) 385 (13.1) 15 (1.2) 366 (10.2) 47 (2.0) 311 (6.2) 19 (1.7) 291 (7.5)
Bulgaria 24 (1.4) 595 (4.0) 6 (0.4) 577 (6.1) 53 (1.9) 550 (3.3) 13 (1.5) 500 (11.4) 3 (0.9) 473 (18.9)
Canada (O,Q) r 32 (1.4) 578 (2.5) 37 (0.9) 549 (2.7) 26 (0.9) 528 (2.3) 3 (0.3) 508 (9.0) 2 (0.2) ~ ~
Colombia r 16 (2.0) 462 (14.2) 4 (0.5) 453 (10.7) 14 (0.9) 443 (5.6) 14 (0.9) 428 (6.7) 51 (1.7) 403 (3.8)
Cyprus s 38 (1.8) 518 (4.2) 0 (0.0) ~ ~ 45 (1.3) 485 (4.2) 12 (0.9) 458 (5.9) 5 (0.5) 451 (7.7)
Czech Republic 22 (1.4) 569 (3.4) 7 (0.6) 554 (5.9) 66 (1.6) 532 (2.5) 4 (0.5) 499 (11.0) 0 (0.0) ~ ~
England s 36 (1.8) 603 (6.1) 3 (0.5) 577 (15.8) 17 (1.0) 568 (6.0) 35 (1.7) 558 (4.5) 8 (0.8) 514 (9.1)
France r 23 (1.7) 571 (3.0) 16 (0.9) 548 (3.8) 20 (0.9) 530 (3.1) 31 (1.4) 505 (2.8) 9 (0.7) 498 (5.0)
Germany s 27 (1.2) 575 (2.2) 36 (1.2) 542 (2.4) 23 (0.6) 546 (2.5) 12 (0.6) 501 (4.7) 2 (0.3) ~ ~
Greece r 23 (1.9) 572 (3.4) 22 (1.0) 535 (5.1) 28 (1.3) 521 (3.9) 17 (1.4) 494 (4.9) 10 (1.4) 483 (8.3)
Hong Kong, SAR 12 (1.0) 540 (4.0) 7 (0.5) 539 (5.2) 30 (1.0) 533 (2.8) 27 (0.8) 530 (3.6) 23 (1.0) 519 (4.8)
Hungary 30 (1.4) 582 (2.9) 3 (0.3) 545 (5.9) 57 (1.1) 538 (2.0) 8 (0.6) 492 (3.8) 1 (0.2) ~ ~
Iceland r 33 (0.8) 544 (2.1) 10 (0.5) 520 (4.0) 42 (0.8) 506 (2.2) 13 (0.6) 484 (4.3) 2 (0.2) ~ ~
Iran, Islamic Rep. of 6 (0.6) 503 (6.0) 5 (0.5) 484 (7.2) 25 (1.5) 457 (4.6) 17 (1.0) 421 (4.2) 47 (2.2) 376 (3.9)
Israel x x x x x x x x x x x x x x x x x x x x
Italy 18 (1.0) 569 (3.5) 4 (0.3) 540 (7.8) 46 (1.1) 550 (2.4) 30 (1.1) 520 (3.4) 3 (0.4) 499 (10.0)
Kuwait – – – – – – – – – – – – – – – – – – – –
Latvia 26 (1.2) 577 (3.4) 34 (1.0) 546 (2.9) 35 (1.2) 532 (3.5) 5 (0.5) 505 (7.8) 0 (0.1) ~ ~
Lithuania 29 (1.8) 572 (3.6) 30 (1.1) 547 (3.5) 40 (1.6) 524 (3.4) 1 (0.2) ~ ~ 0 (0.1) ~ ~
Macedonia, Rep. of s 11 (1.0) 487 (7.3) 14 (1.5) 524 (6.5) 26 (1.4) 468 (5.7) 26 (1.2) 466 (6.9) 23 (1.6) 397 (7.4)
Moldova, Rep. of 19 (1.6) 532 (5.3) 10 (0.9) 503 (5.0) 64 (1.7) 484 (4.4) 4 (0.6) 465 (12.7) 3 (0.5) 469 (11.0)
Morocco – – – – – – – – – – – – – – – – – – – –
Netherlands s 12 (0.9) 592 (4.6) 28 (1.1) 580 (2.9) 14 (0.8) 570 (4.0) 45 (1.7) 544 (2.8) 1 (0.3) ~ ~
New Zealand r 37 (1.4) 571 (4.3) 22 (1.1) 543 (5.1) 34 (1.3) 514 (4.4) 4 (0.5) 474 (10.9) 3 (0.4) 487 (13.6)
Norway 53 (1.7) 522 (3.8) 0 (0.0) ~ ~ 44 (1.6) 484 (3.3) 3 (0.4) 442 (10.4) 0 (0.1) ~ ~
Romania 11 (1.6) 576 (4.9) 5 (0.4) 545 (9.2) 64 (1.6) 514 (4.5) 15 (1.4) 483 (10.3) 4 (0.7) 474 (14.6)a Russian Federation 27 (1.3) 549 (4.5) 42 (1.0) 525 (4.4) 27 (1.0) 515 (6.1) 4 (0.5) 502 (9.5) 0 (0.1) ~ ~
Scotland s 27 (1.8) 581 (6.1) 29 (1.4) 540 (5.9) 19 (1.1) 536 (6.0) 19 (1.2) 525 (5.4) 6 (0.8) 478 (9.9)
Singapore 20 (1.2) 590 (5.2) 21 (0.6) 552 (4.4) 45 (0.9) 520 (5.1) 0 (0.0) ~ ~ 14 (0.8) 470 (7.0)
Slovak Republic 19 (1.2) 556 (3.8) 6 (0.4) 544 (5.4) 69 (1.4) 516 (2.5) 4 (0.8) 465 (17.2) 1 (0.3) ~ ~
Slovenia 25 (1.1) 537 (2.9) 0 (0.0) ~ ~ 65 (1.1) 498 (2.1) 9 (0.6) 460 (5.3) 1 (0.2) ~ ~
Sweden 35 (1.4) 583 (2.6) 23 (0.6) 564 (2.8) 36 (1.2) 552 (2.6) 6 (0.5) 525 (4.6) 0 (0.1) ~ ~b Turkey 12 (1.3) 512 (7.0) 23 (1.1) 474 (4.5) 0 (0.0) ~ ~ 65 (2.0) 437 (3.5) 0 (0.0) ~ ~
United States – – – – – – – – – – – – – – – – – – – –
International Avg. 23 (0.3) 549 (1.0) 15 (0.1) 531 (1.2) 36 (0.2) 511 (0.8) 17 (0.2) 480 (1.5) 9 (0.2) 452 (4.4)
Background data provided by parents.
a For the Russian Federation, Finished Upper-Secondary School includes those who receivedinitial vocational training on the basis of lower-secondary school.
b For Turkey, Finished Lower-Secondary School includes those who finished some primary orlower-secondary or did not go to school. Finished Post-Secondary School but Not Universityincludes those who finished upper-secondary school.
( ) Standard errors appear in parentheses. Because results are rounded to the nearest wholenumber, some totals may appear inconsistent.
An “r” indicates data are available for 70-84% of the students. An “s” indicates data are avail-able for 50-69% of the students. An “x” indicates data are available for less than 50% of thestudents.
A dash (–) indicates data are not available. A tilde (~) indicates insufficient data to reportachievement.
SOU
RCE:
IEA
Pro
gres
s in
Inte
rnat
iona
l Rea
ding
Lite
racy
Stu
dy (P
IRLS
) 200
1.
ISC 4th GradePIRLS 2001
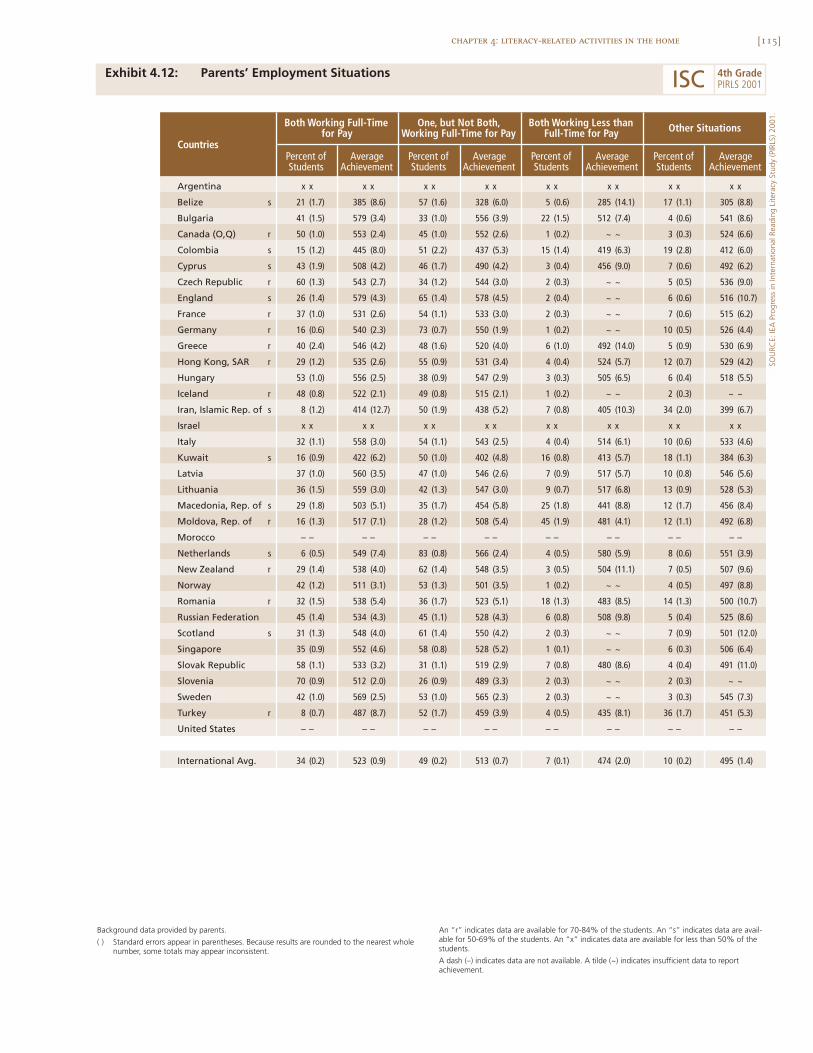
[115]chapter 4: literacy-related activities in the home
Exhibit 4.12: Parents’ Employment Situations
SOU
RCE:
IEA
Pro
gres
s in
Inte
rnat
iona
l Rea
ding
Lite
racy
Stu
dy (P
IRLS
) 200
1.
Argentina x x x x x x x x x x x x x x x x
Belize s 21 (1.7) 385 (8.6) 57 (1.6) 328 (6.0) 5 (0.6) 285 (14.1) 17 (1.1) 305 (8.8)
Bulgaria 41 (1.5) 579 (3.4) 33 (1.0) 556 (3.9) 22 (1.5) 512 (7.4) 4 (0.6) 541 (8.6)
Canada (O,Q) r 50 (1.0) 553 (2.4) 45 (1.0) 552 (2.6) 1 (0.2) ~ ~ 3 (0.3) 524 (6.6)
Colombia s 15 (1.2) 445 (8.0) 51 (2.2) 437 (5.3) 15 (1.4) 419 (6.3) 19 (2.8) 412 (6.0)
Cyprus s 43 (1.9) 508 (4.2) 46 (1.7) 490 (4.2) 3 (0.4) 456 (9.0) 7 (0.6) 492 (6.2)
Czech Republic r 60 (1.3) 543 (2.7) 34 (1.2) 544 (3.0) 2 (0.3) ~ ~ 5 (0.5) 536 (9.0)
England s 26 (1.4) 579 (4.3) 65 (1.4) 578 (4.5) 2 (0.4) ~ ~ 6 (0.6) 516 (10.7)
France r 37 (1.0) 531 (2.6) 54 (1.1) 533 (3.0) 2 (0.3) ~ ~ 7 (0.6) 515 (6.2)
Germany r 16 (0.6) 540 (2.3) 73 (0.7) 550 (1.9) 1 (0.2) ~ ~ 10 (0.5) 526 (4.4)
Greece r 40 (2.4) 546 (4.2) 48 (1.6) 520 (4.0) 6 (1.0) 492 (14.0) 5 (0.9) 530 (6.9)
Hong Kong, SAR r 29 (1.2) 535 (2.6) 55 (0.9) 531 (3.4) 4 (0.4) 524 (5.7) 12 (0.7) 529 (4.2)
Hungary 53 (1.0) 556 (2.5) 38 (0.9) 547 (2.9) 3 (0.3) 505 (6.5) 6 (0.4) 518 (5.5)
Iceland r 48 (0.8) 522 (2.1) 49 (0.8) 515 (2.1) 1 (0.2) ~ ~ 2 (0.3) ~ ~
Iran, Islamic Rep. of s 8 (1.2) 414 (12.7) 50 (1.9) 438 (5.2) 7 (0.8) 405 (10.3) 34 (2.0) 399 (6.7)
Israel x x x x x x x x x x x x x x x x
Italy 32 (1.1) 558 (3.0) 54 (1.1) 543 (2.5) 4 (0.4) 514 (6.1) 10 (0.6) 533 (4.6)
Kuwait s 16 (0.9) 422 (6.2) 50 (1.0) 402 (4.8) 16 (0.8) 413 (5.7) 18 (1.1) 384 (6.3)
Latvia 37 (1.0) 560 (3.5) 47 (1.0) 546 (2.6) 7 (0.9) 517 (5.7) 10 (0.8) 546 (5.6)
Lithuania 36 (1.5) 559 (3.0) 42 (1.3) 547 (3.0) 9 (0.7) 517 (6.8) 13 (0.9) 528 (5.3)
Macedonia, Rep. of s 29 (1.8) 503 (5.1) 35 (1.7) 454 (5.8) 25 (1.8) 441 (8.8) 12 (1.7) 456 (8.4)
Moldova, Rep. of r 16 (1.3) 517 (7.1) 28 (1.2) 508 (5.4) 45 (1.9) 481 (4.1) 12 (1.1) 492 (6.8)
Morocco – – – – – – – – – – – – – – – –
Netherlands s 6 (0.5) 549 (7.4) 83 (0.8) 566 (2.4) 4 (0.5) 580 (5.9) 8 (0.6) 551 (3.9)
New Zealand r 29 (1.4) 538 (4.0) 62 (1.4) 548 (3.5) 3 (0.5) 504 (11.1) 7 (0.5) 507 (9.6)
Norway 42 (1.2) 511 (3.1) 53 (1.3) 501 (3.5) 1 (0.2) ~ ~ 4 (0.5) 497 (8.8)
Romania r 32 (1.5) 538 (5.4) 36 (1.7) 523 (5.1) 18 (1.3) 483 (8.5) 14 (1.3) 500 (10.7)
Russian Federation 45 (1.4) 534 (4.3) 45 (1.1) 528 (4.3) 6 (0.8) 508 (9.8) 5 (0.4) 525 (8.6)
Scotland s 31 (1.3) 548 (4.0) 61 (1.4) 550 (4.2) 2 (0.3) ~ ~ 7 (0.9) 501 (12.0)
Singapore 35 (0.9) 552 (4.6) 58 (0.8) 528 (5.2) 1 (0.1) ~ ~ 6 (0.3) 506 (6.4)
Slovak Republic 58 (1.1) 533 (3.2) 31 (1.1) 519 (2.9) 7 (0.8) 480 (8.6) 4 (0.4) 491 (11.0)
Slovenia 70 (0.9) 512 (2.0) 26 (0.9) 489 (3.3) 2 (0.3) ~ ~ 2 (0.3) ~ ~
Sweden 42 (1.0) 569 (2.5) 53 (1.0) 565 (2.3) 2 (0.3) ~ ~ 3 (0.3) 545 (7.3)
Turkey r 8 (0.7) 487 (8.7) 52 (1.7) 459 (3.9) 4 (0.5) 435 (8.1) 36 (1.7) 451 (5.3)
United States – – – – – – – – – – – – – – – –
International Avg. 34 (0.2) 523 (0.9) 49 (0.2) 513 (0.7) 7 (0.1) 474 (2.0) 10 (0.2) 495 (1.4)
Countries
One, but Not Both,Working Full-Time for Pay
Both Working Less thanFull-Time for Pay Other SituationsBoth Working Full-Time
for Pay
AverageAchievement
Percent ofStudents
AverageAchievement
Percent ofStudents
AverageAchievement
Percent ofStudents
AverageAchievement
Percent ofStudents
Background data provided by parents.
( ) Standard errors appear in parentheses. Because results are rounded to the nearest wholenumber, some totals may appear inconsistent.
An “r” indicates data are available for 70-84% of the students. An “s” indicates data are avail-able for 50-69% of the students. An “x” indicates data are available for less than 50% of thestudents.
A dash (–) indicates data are not available. A tilde (~) indicates insufficient data to reportachievement.
ISC 4th GradePIRLS 2001
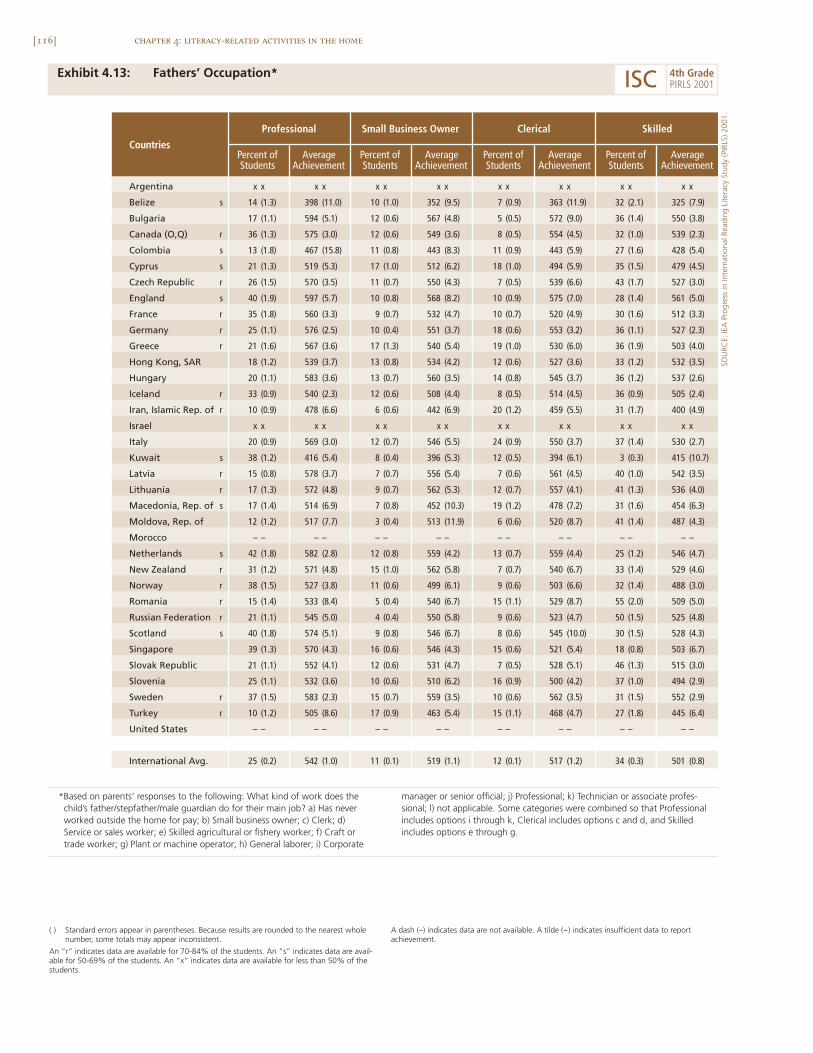
[116] chapter 4: literacy-related activities in the home
Exhibit 4.13: Fathers’ Occupation*
Argentina x x x x x x x x x x x x x x x x
Belize s 14 (1.3) 398 (11.0) 10 (1.0) 352 (9.5) 7 (0.9) 363 (11.9) 32 (2.1) 325 (7.9)
Bulgaria 17 (1.1) 594 (5.1) 12 (0.6) 567 (4.8) 5 (0.5) 572 (9.0) 36 (1.4) 550 (3.8)
Canada (O,Q) r 36 (1.3) 575 (3.0) 12 (0.6) 549 (3.6) 8 (0.5) 554 (4.5) 32 (1.0) 539 (2.3)
Colombia s 13 (1.8) 467 (15.8) 11 (0.8) 443 (8.3) 11 (0.9) 443 (5.9) 27 (1.6) 428 (5.4)
Cyprus s 21 (1.3) 519 (5.3) 17 (1.0) 512 (6.2) 18 (1.0) 494 (5.9) 35 (1.5) 479 (4.5)
Czech Republic r 26 (1.5) 570 (3.5) 11 (0.7) 550 (4.3) 7 (0.5) 539 (6.6) 43 (1.7) 527 (3.0)
England s 40 (1.9) 597 (5.7) 10 (0.8) 568 (8.2) 10 (0.9) 575 (7.0) 28 (1.4) 561 (5.0)
France r 35 (1.8) 560 (3.3) 9 (0.7) 532 (4.7) 10 (0.7) 520 (4.9) 30 (1.6) 512 (3.3)
Germany r 25 (1.1) 576 (2.5) 10 (0.4) 551 (3.7) 18 (0.6) 553 (3.2) 36 (1.1) 527 (2.3)
Greece r 21 (1.6) 567 (3.6) 17 (1.3) 540 (5.4) 19 (1.0) 530 (6.0) 36 (1.9) 503 (4.0)
Hong Kong, SAR 18 (1.2) 539 (3.7) 13 (0.8) 534 (4.2) 12 (0.6) 527 (3.6) 33 (1.2) 532 (3.5)
Hungary 20 (1.1) 583 (3.6) 13 (0.7) 560 (3.5) 14 (0.8) 545 (3.7) 36 (1.2) 537 (2.6)
Iceland r 33 (0.9) 540 (2.3) 12 (0.6) 508 (4.4) 8 (0.5) 514 (4.5) 36 (0.9) 505 (2.4)
Iran, Islamic Rep. of r 10 (0.9) 478 (6.6) 6 (0.6) 442 (6.9) 20 (1.2) 459 (5.5) 31 (1.7) 400 (4.9)
Israel x x x x x x x x x x x x x x x x
Italy 20 (0.9) 569 (3.0) 12 (0.7) 546 (5.5) 24 (0.9) 550 (3.7) 37 (1.4) 530 (2.7)
Kuwait s 38 (1.2) 416 (5.4) 8 (0.4) 396 (5.3) 12 (0.5) 394 (6.1) 3 (0.3) 415 (10.7)
Latvia r 15 (0.8) 578 (3.7) 7 (0.7) 556 (5.4) 7 (0.6) 561 (4.5) 40 (1.0) 542 (3.5)
Lithuania r 17 (1.3) 572 (4.8) 9 (0.7) 562 (5.3) 12 (0.7) 557 (4.1) 41 (1.3) 536 (4.0)
Macedonia, Rep. of s 17 (1.4) 514 (6.9) 7 (0.8) 452 (10.3) 19 (1.2) 478 (7.2) 31 (1.6) 454 (6.3)
Moldova, Rep. of 12 (1.2) 517 (7.7) 3 (0.4) 513 (11.9) 6 (0.6) 520 (8.7) 41 (1.4) 487 (4.3)
Morocco – – – – – – – – – – – – – – – –
Netherlands s 42 (1.8) 582 (2.8) 12 (0.8) 559 (4.2) 13 (0.7) 559 (4.4) 25 (1.2) 546 (4.7)
New Zealand r 31 (1.2) 571 (4.8) 15 (1.0) 562 (5.8) 7 (0.7) 540 (6.7) 33 (1.4) 529 (4.6)
Norway r 38 (1.5) 527 (3.8) 11 (0.6) 499 (6.1) 9 (0.6) 503 (6.6) 32 (1.4) 488 (3.0)
Romania r 15 (1.4) 533 (8.4) 5 (0.4) 540 (6.7) 15 (1.1) 529 (8.7) 55 (2.0) 509 (5.0)
Russian Federation r 21 (1.1) 545 (5.0) 4 (0.4) 550 (5.8) 9 (0.6) 523 (4.7) 50 (1.5) 525 (4.8)
Scotland s 40 (1.8) 574 (5.1) 9 (0.8) 546 (6.7) 8 (0.6) 545 (10.0) 30 (1.5) 528 (4.3)
Singapore 39 (1.3) 570 (4.3) 16 (0.6) 546 (4.3) 15 (0.6) 521 (5.4) 18 (0.8) 503 (6.7)
Slovak Republic 21 (1.1) 552 (4.1) 12 (0.6) 531 (4.7) 7 (0.5) 528 (5.1) 46 (1.3) 515 (3.0)
Slovenia 25 (1.1) 532 (3.6) 10 (0.6) 510 (6.2) 16 (0.9) 500 (4.2) 37 (1.0) 494 (2.9)
Sweden r 37 (1.5) 583 (2.3) 15 (0.7) 559 (3.5) 10 (0.6) 562 (3.5) 31 (1.5) 552 (2.9)
Turkey r 10 (1.2) 505 (8.6) 17 (0.9) 463 (5.4) 15 (1.1) 468 (4.7) 27 (1.8) 445 (6.4)
United States – – – – – – – – – – – – – – – –
International Avg. 25 (0.2) 542 (1.0) 11 (0.1) 519 (1.1) 12 (0.1) 517 (1.2) 34 (0.3) 501 (0.8)
Countries
Small Business Owner Clerical SkilledProfessional
AverageAchievement
Percent ofStudents
AverageAchievement
Percent ofStudents
AverageAchievement
Percent ofStudents
AverageAchievement
Percent ofStudents
( ) Standard errors appear in parentheses. Because results are rounded to the nearest wholenumber, some totals may appear inconsistent.
An “r” indicates data are available for 70-84% of the students. An “s” indicates data are avail-able for 50-69% of the students. An “x” indicates data are available for less than 50% of thestudents.
A dash (–) indicates data are not available. A tilde (~) indicates insufficient data to reportachievement.
SOU
RCE:
IEA
Pro
gres
s in
Inte
rnat
iona
l Rea
ding
Lite
racy
Stu
dy (P
IRLS
) 200
1.
ISC 4th GradePIRLS 2001
*Based on parents’ responses to the following: What kind of work does thechild’s father/stepfather/male guardian do for their main job? a) Has neverworked outside the home for pay; b) Small business owner; c) Clerk; d)Service or sales worker; e) Skilled agricultural or fishery worker; f) Craft ortrade worker; g) Plant or machine operator; h) General laborer; i) Corporate
manager or senior official; j) Professional; k) Technician or associate profes-sional; l) not applicable. Some categories were combined so that Professionalincludes options i through k, Clerical includes options c and d, and Skilledincludes options e through g.
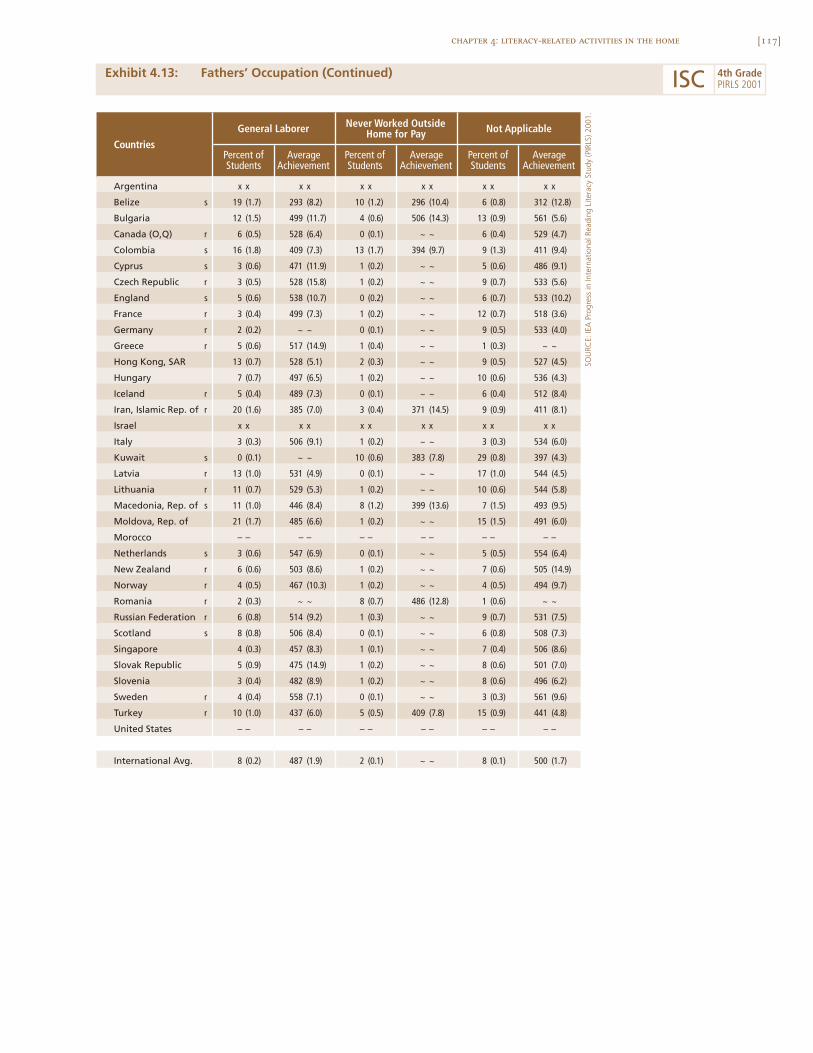
[117]chapter 4: literacy-related activities in the home
Exhibit 4.13: Fathers’ Occupation (Continued)
SOU
RCE:
IEA
Pro
gres
s in
Inte
rnat
iona
l Rea
ding
Lite
racy
Stu
dy (P
IRLS
) 200
1.
Argentina x x x x x x x x x x x x
Belize s 19 (1.7) 293 (8.2) 10 (1.2) 296 (10.4) 6 (0.8) 312 (12.8)
Bulgaria 12 (1.5) 499 (11.7) 4 (0.6) 506 (14.3) 13 (0.9) 561 (5.6)
Canada (O,Q) r 6 (0.5) 528 (6.4) 0 (0.1) ~ ~ 6 (0.4) 529 (4.7)
Colombia s 16 (1.8) 409 (7.3) 13 (1.7) 394 (9.7) 9 (1.3) 411 (9.4)
Cyprus s 3 (0.6) 471 (11.9) 1 (0.2) ~ ~ 5 (0.6) 486 (9.1)
Czech Republic r 3 (0.5) 528 (15.8) 1 (0.2) ~ ~ 9 (0.7) 533 (5.6)
England s 5 (0.6) 538 (10.7) 0 (0.2) ~ ~ 6 (0.7) 533 (10.2)
France r 3 (0.4) 499 (7.3) 1 (0.2) ~ ~ 12 (0.7) 518 (3.6)
Germany r 2 (0.2) ~ ~ 0 (0.1) ~ ~ 9 (0.5) 533 (4.0)
Greece r 5 (0.6) 517 (14.9) 1 (0.4) ~ ~ 1 (0.3) ~ ~
Hong Kong, SAR 13 (0.7) 528 (5.1) 2 (0.3) ~ ~ 9 (0.5) 527 (4.5)
Hungary 7 (0.7) 497 (6.5) 1 (0.2) ~ ~ 10 (0.6) 536 (4.3)
Iceland r 5 (0.4) 489 (7.3) 0 (0.1) ~ ~ 6 (0.4) 512 (8.4)
Iran, Islamic Rep. of r 20 (1.6) 385 (7.0) 3 (0.4) 371 (14.5) 9 (0.9) 411 (8.1)
Israel x x x x x x x x x x x x
Italy 3 (0.3) 506 (9.1) 1 (0.2) ~ ~ 3 (0.3) 534 (6.0)
Kuwait s 0 (0.1) ~ ~ 10 (0.6) 383 (7.8) 29 (0.8) 397 (4.3)
Latvia r 13 (1.0) 531 (4.9) 0 (0.1) ~ ~ 17 (1.0) 544 (4.5)
Lithuania r 11 (0.7) 529 (5.3) 1 (0.2) ~ ~ 10 (0.6) 544 (5.8)
Macedonia, Rep. of s 11 (1.0) 446 (8.4) 8 (1.2) 399 (13.6) 7 (1.5) 493 (9.5)
Moldova, Rep. of 21 (1.7) 485 (6.6) 1 (0.2) ~ ~ 15 (1.5) 491 (6.0)
Morocco – – – – – – – – – – – –
Netherlands s 3 (0.6) 547 (6.9) 0 (0.1) ~ ~ 5 (0.5) 554 (6.4)
New Zealand r 6 (0.6) 503 (8.6) 1 (0.2) ~ ~ 7 (0.6) 505 (14.9)
Norway r 4 (0.5) 467 (10.3) 1 (0.2) ~ ~ 4 (0.5) 494 (9.7)
Romania r 2 (0.3) ~ ~ 8 (0.7) 486 (12.8) 1 (0.6) ~ ~
Russian Federation r 6 (0.8) 514 (9.2) 1 (0.3) ~ ~ 9 (0.7) 531 (7.5)
Scotland s 8 (0.8) 506 (8.4) 0 (0.1) ~ ~ 6 (0.8) 508 (7.3)
Singapore 4 (0.3) 457 (8.3) 1 (0.1) ~ ~ 7 (0.4) 506 (8.6)
Slovak Republic 5 (0.9) 475 (14.9) 1 (0.2) ~ ~ 8 (0.6) 501 (7.0)
Slovenia 3 (0.4) 482 (8.9) 1 (0.2) ~ ~ 8 (0.6) 496 (6.2)
Sweden r 4 (0.4) 558 (7.1) 0 (0.1) ~ ~ 3 (0.3) 561 (9.6)
Turkey r 10 (1.0) 437 (6.0) 5 (0.5) 409 (7.8) 15 (0.9) 441 (4.8)
United States – – – – – – – – – – – –
International Avg. 8 (0.2) 487 (1.9) 2 (0.1) ~ ~ 8 (0.1) 500 (1.7)
Countries
Never Worked OutsideHome for Pay Not ApplicableGeneral Laborer
AverageAchievement
Percent ofStudents
AverageAchievement
Percent ofStudents
AverageAchievement
Percent ofStudents
ISC 4th GradePIRLS 2001
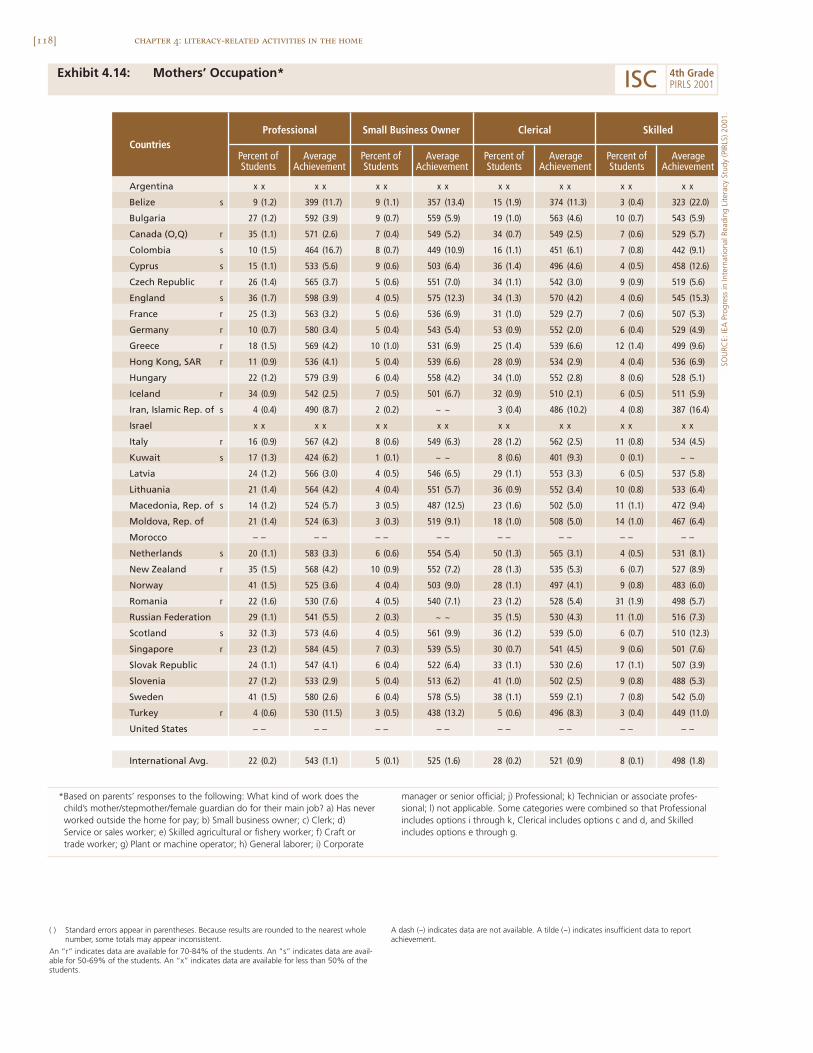
[118] chapter 4: literacy-related activities in the home
Exhibit 4.14: Mothers’ Occupation*
Argentina x x x x x x x x x x x x x x x x
Belize s 9 (1.2) 399 (11.7) 9 (1.1) 357 (13.4) 15 (1.9) 374 (11.3) 3 (0.4) 323 (22.0)
Bulgaria 27 (1.2) 592 (3.9) 9 (0.7) 559 (5.9) 19 (1.0) 563 (4.6) 10 (0.7) 543 (5.9)
Canada (O,Q) r 35 (1.1) 571 (2.6) 7 (0.4) 549 (5.2) 34 (0.7) 549 (2.5) 7 (0.6) 529 (5.7)
Colombia s 10 (1.5) 464 (16.7) 8 (0.7) 449 (10.9) 16 (1.1) 451 (6.1) 7 (0.8) 442 (9.1)
Cyprus s 15 (1.1) 533 (5.6) 9 (0.6) 503 (6.4) 36 (1.4) 496 (4.6) 4 (0.5) 458 (12.6)
Czech Republic r 26 (1.4) 565 (3.7) 5 (0.6) 551 (7.0) 34 (1.1) 542 (3.0) 9 (0.9) 519 (5.6)
England s 36 (1.7) 598 (3.9) 4 (0.5) 575 (12.3) 34 (1.3) 570 (4.2) 4 (0.6) 545 (15.3)
France r 25 (1.3) 563 (3.2) 5 (0.6) 536 (6.9) 31 (1.0) 529 (2.7) 7 (0.6) 507 (5.3)
Germany r 10 (0.7) 580 (3.4) 5 (0.4) 543 (5.4) 53 (0.9) 552 (2.0) 6 (0.4) 529 (4.9)
Greece r 18 (1.5) 569 (4.2) 10 (1.0) 531 (6.9) 25 (1.4) 539 (6.6) 12 (1.4) 499 (9.6)
Hong Kong, SAR r 11 (0.9) 536 (4.1) 5 (0.4) 539 (6.6) 28 (0.9) 534 (2.9) 4 (0.4) 536 (6.9)
Hungary 22 (1.2) 579 (3.9) 6 (0.4) 558 (4.2) 34 (1.0) 552 (2.8) 8 (0.6) 528 (5.1)
Iceland r 34 (0.9) 542 (2.5) 7 (0.5) 501 (6.7) 32 (0.9) 510 (2.1) 6 (0.5) 511 (5.9)
Iran, Islamic Rep. of s 4 (0.4) 490 (8.7) 2 (0.2) ~ ~ 3 (0.4) 486 (10.2) 4 (0.8) 387 (16.4)
Israel x x x x x x x x x x x x x x x x
Italy r 16 (0.9) 567 (4.2) 8 (0.6) 549 (6.3) 28 (1.2) 562 (2.5) 11 (0.8) 534 (4.5)
Kuwait s 17 (1.3) 424 (6.2) 1 (0.1) ~ ~ 8 (0.6) 401 (9.3) 0 (0.1) ~ ~
Latvia 24 (1.2) 566 (3.0) 4 (0.5) 546 (6.5) 29 (1.1) 553 (3.3) 6 (0.5) 537 (5.8)
Lithuania 21 (1.4) 564 (4.2) 4 (0.4) 551 (5.7) 36 (0.9) 552 (3.4) 10 (0.8) 533 (6.4)
Macedonia, Rep. of s 14 (1.2) 524 (5.7) 3 (0.5) 487 (12.5) 23 (1.6) 502 (5.0) 11 (1.1) 472 (9.4)
Moldova, Rep. of 21 (1.4) 524 (6.3) 3 (0.3) 519 (9.1) 18 (1.0) 508 (5.0) 14 (1.0) 467 (6.4)
Morocco – – – – – – – – – – – – – – – –
Netherlands s 20 (1.1) 583 (3.3) 6 (0.6) 554 (5.4) 50 (1.3) 565 (3.1) 4 (0.5) 531 (8.1)
New Zealand r 35 (1.5) 568 (4.2) 10 (0.9) 552 (7.2) 28 (1.3) 535 (5.3) 6 (0.7) 527 (8.9)
Norway 41 (1.5) 525 (3.6) 4 (0.4) 503 (9.0) 28 (1.1) 497 (4.1) 9 (0.8) 483 (6.0)
Romania r 22 (1.6) 530 (7.6) 4 (0.5) 540 (7.1) 23 (1.2) 528 (5.4) 31 (1.9) 498 (5.7)
Russian Federation 29 (1.1) 541 (5.5) 2 (0.3) ~ ~ 35 (1.5) 530 (4.3) 11 (1.0) 516 (7.3)
Scotland s 32 (1.3) 573 (4.6) 4 (0.5) 561 (9.9) 36 (1.2) 539 (5.0) 6 (0.7) 510 (12.3)
Singapore r 23 (1.2) 584 (4.5) 7 (0.3) 539 (5.5) 30 (0.7) 541 (4.5) 9 (0.6) 501 (7.6)
Slovak Republic 24 (1.1) 547 (4.1) 6 (0.4) 522 (6.4) 33 (1.1) 530 (2.6) 17 (1.1) 507 (3.9)
Slovenia 27 (1.2) 533 (2.9) 5 (0.4) 513 (6.2) 41 (1.0) 502 (2.5) 9 (0.8) 488 (5.3)
Sweden 41 (1.5) 580 (2.6) 6 (0.4) 578 (5.5) 38 (1.1) 559 (2.1) 7 (0.8) 542 (5.0)
Turkey r 4 (0.6) 530 (11.5) 3 (0.5) 438 (13.2) 5 (0.6) 496 (8.3) 3 (0.4) 449 (11.0)
United States – – – – – – – – – – – – – – – –
International Avg. 22 (0.2) 543 (1.1) 5 (0.1) 525 (1.6) 28 (0.2) 521 (0.9) 8 (0.1) 498 (1.8)
CountriesSmall Business Owner Clerical SkilledProfessional
AverageAchievement
Percent ofStudents
AverageAchievement
Percent ofStudents
AverageAchievement
Percent ofStudents
AverageAchievement
Percent ofStudents
( ) Standard errors appear in parentheses. Because results are rounded to the nearest wholenumber, some totals may appear inconsistent.
An “r” indicates data are available for 70-84% of the students. An “s” indicates data are avail-able for 50-69% of the students. An “x” indicates data are available for less than 50% of thestudents.
A dash (–) indicates data are not available. A tilde (~) indicates insufficient data to reportachievement.
SOU
RCE:
IEA
Pro
gres
s in
Inte
rnat
iona
l Rea
ding
Lite
racy
Stu
dy (P
IRLS
) 200
1.
ISC 4th GradePIRLS 2001
*Based on parents’ responses to the following: What kind of work does thechild’s mother/stepmother/female guardian do for their main job? a) Has neverworked outside the home for pay; b) Small business owner; c) Clerk; d)Service or sales worker; e) Skilled agricultural or fishery worker; f) Craft ortrade worker; g) Plant or machine operator; h) General laborer; i) Corporate
manager or senior official; j) Professional; k) Technician or associate profes-sional; l) not applicable. Some categories were combined so that Professionalincludes options i through k, Clerical includes options c and d, and Skilledincludes options e through g.
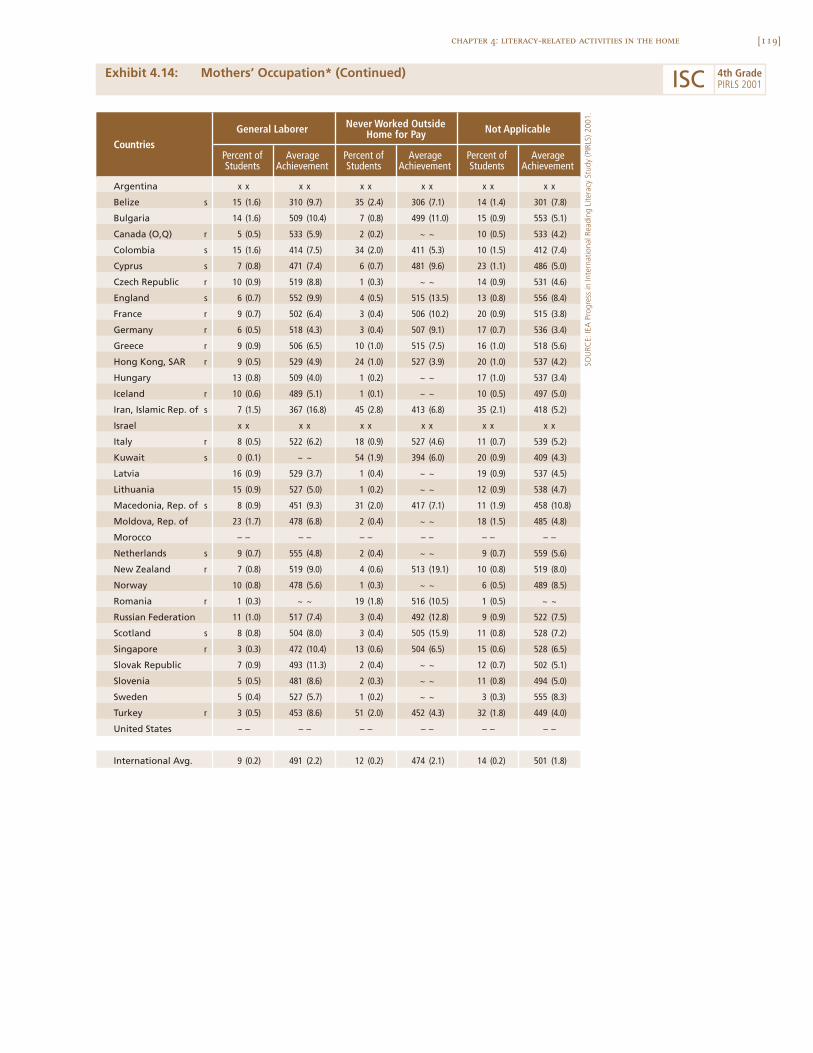
[119]chapter 4: literacy-related activities in the home
Exhibit 4.14: Mothers’ Occupation* (Continued)
SOU
RCE:
IEA
Pro
gres
s in
Inte
rnat
iona
l Rea
ding
Lite
racy
Stu
dy (P
IRLS
) 200
1.
Argentina x x x x x x x x x x x x
Belize s 15 (1.6) 310 (9.7) 35 (2.4) 306 (7.1) 14 (1.4) 301 (7.8)
Bulgaria 14 (1.6) 509 (10.4) 7 (0.8) 499 (11.0) 15 (0.9) 553 (5.1)
Canada (O,Q) r 5 (0.5) 533 (5.9) 2 (0.2) ~ ~ 10 (0.5) 533 (4.2)
Colombia s 15 (1.6) 414 (7.5) 34 (2.0) 411 (5.3) 10 (1.5) 412 (7.4)
Cyprus s 7 (0.8) 471 (7.4) 6 (0.7) 481 (9.6) 23 (1.1) 486 (5.0)
Czech Republic r 10 (0.9) 519 (8.8) 1 (0.3) ~ ~ 14 (0.9) 531 (4.6)
England s 6 (0.7) 552 (9.9) 4 (0.5) 515 (13.5) 13 (0.8) 556 (8.4)
France r 9 (0.7) 502 (6.4) 3 (0.4) 506 (10.2) 20 (0.9) 515 (3.8)
Germany r 6 (0.5) 518 (4.3) 3 (0.4) 507 (9.1) 17 (0.7) 536 (3.4)
Greece r 9 (0.9) 506 (6.5) 10 (1.0) 515 (7.5) 16 (1.0) 518 (5.6)
Hong Kong, SAR r 9 (0.5) 529 (4.9) 24 (1.0) 527 (3.9) 20 (1.0) 537 (4.2)
Hungary 13 (0.8) 509 (4.0) 1 (0.2) ~ ~ 17 (1.0) 537 (3.4)
Iceland r 10 (0.6) 489 (5.1) 1 (0.1) ~ ~ 10 (0.5) 497 (5.0)
Iran, Islamic Rep. of s 7 (1.5) 367 (16.8) 45 (2.8) 413 (6.8) 35 (2.1) 418 (5.2)
Israel x x x x x x x x x x x x
Italy r 8 (0.5) 522 (6.2) 18 (0.9) 527 (4.6) 11 (0.7) 539 (5.2)
Kuwait s 0 (0.1) ~ ~ 54 (1.9) 394 (6.0) 20 (0.9) 409 (4.3)
Latvia 16 (0.9) 529 (3.7) 1 (0.4) ~ ~ 19 (0.9) 537 (4.5)
Lithuania 15 (0.9) 527 (5.0) 1 (0.2) ~ ~ 12 (0.9) 538 (4.7)
Macedonia, Rep. of s 8 (0.9) 451 (9.3) 31 (2.0) 417 (7.1) 11 (1.9) 458 (10.8)
Moldova, Rep. of 23 (1.7) 478 (6.8) 2 (0.4) ~ ~ 18 (1.5) 485 (4.8)
Morocco – – – – – – – – – – – –
Netherlands s 9 (0.7) 555 (4.8) 2 (0.4) ~ ~ 9 (0.7) 559 (5.6)
New Zealand r 7 (0.8) 519 (9.0) 4 (0.6) 513 (19.1) 10 (0.8) 519 (8.0)
Norway 10 (0.8) 478 (5.6) 1 (0.3) ~ ~ 6 (0.5) 489 (8.5)
Romania r 1 (0.3) ~ ~ 19 (1.8) 516 (10.5) 1 (0.5) ~ ~
Russian Federation 11 (1.0) 517 (7.4) 3 (0.4) 492 (12.8) 9 (0.9) 522 (7.5)
Scotland s 8 (0.8) 504 (8.0) 3 (0.4) 505 (15.9) 11 (0.8) 528 (7.2)
Singapore r 3 (0.3) 472 (10.4) 13 (0.6) 504 (6.5) 15 (0.6) 528 (6.5)
Slovak Republic 7 (0.9) 493 (11.3) 2 (0.4) ~ ~ 12 (0.7) 502 (5.1)
Slovenia 5 (0.5) 481 (8.6) 2 (0.3) ~ ~ 11 (0.8) 494 (5.0)
Sweden 5 (0.4) 527 (5.7) 1 (0.2) ~ ~ 3 (0.3) 555 (8.3)
Turkey r 3 (0.5) 453 (8.6) 51 (2.0) 452 (4.3) 32 (1.8) 449 (4.0)
United States – – – – – – – – – – – –
International Avg. 9 (0.2) 491 (2.2) 12 (0.2) 474 (2.1) 14 (0.2) 501 (1.8)
Countries
Never Worked OutsideHome for Pay Not ApplicableGeneral Laborer
AverageAchievement
Percent ofStudents
AverageAchievement
Percent ofStudents
AverageAchievement
Percent ofStudents
ISC 4th GradePIRLS 2001
[120] chapter 4: literacy-related activities in the home
achievement varied across the occupational categories, with the highest amongstudents with parents in professional occupations and the lowest in the skilledcategory for fathers and in the never worked outside the home for pay cate-gory for mothers.
How Often Do Parents Read?
To examine the association between parents’ reading and students’ readingachievement, PIRLS asked parents how much time they spent reading for them-selves at home, including books, magazines, newspapers, and materials forwork. Exhibit 4.15 summarizes their responses, together with the averagereading achievement of the students. On average, 17 percent of students hada parent that reported reading for more than 10 hours a week, 24 percent hada parent reporting 6-10 hours a week, 41 percent had a parent reporting 1-5hours a week, and 19 percent less than one hour a week. Reading achieve-ment was highest among students whose parents read for 6-10 hours (520 scorepoints) or for more than 10 hours per week (524 score points), lower amongthose whose parents read for 1-5 hours (505 points), and lowest among thosewhose parents read for less than one hour per week (478 points).
Almost half the students (45%) had parents reporting reading for enjoy-ment every day or almost every day, about one-third (34%) once or twice aweek, 13 percent once or twice a week, and just 8 percent never or almostnever (Exhibit 4.16). Students’ average reading achievement was associatedwith parents’ reports of reading for enjoyment, with the highest achievement(516 score points) among students of parents that read most frequently andthe lowest (484 score points) among students whose parents never or almostnever read for enjoyment.
To summarize parents’ attitudes towards reading, PIRLS constructedan Index of Parents’ Attitudes Toward Reading based on parents’ agreementwith five statements about reading:
• I read only if I have to (reverse-coded).
• I like talking about books with other people.
[121]chapter 4: literacy-related activities in the home
• I like to spend my spare time reading.
• I read only if I need information (reverse-coded).
• Reading is an important activity in my home.
Parents were asked if they agree a lot, agree a little, disagree a little, ordisagree a lot with each of the statements. To construct the index, parents’responses were assigned a numeric code that was averaged across the five state-ments, and then students were assigned to one of three categories, high,medium, or low, on the basis of their parents’ average response. Students inthe high category had parents that reported agreeing a little or a lot with thefive statements, on average, whereas those in the low category, on average, dis-agreed a lot. Students in the medium category had parents reporting in betweenthese extremes.
Exhibit 4.17 presents the percentage of students at each level of theindex for each country, together with the average reading achievement forthose students. Standard errors also are shown. Countries are ordered by thepercentage of students at the high level of the index, which is also displayedgraphically for each country at the right hand side of the exhibit. The inter-national average across all countries is shown at the bottom of each column.The exhibit also describes in detail how the index was computed.
Parents’ responses generally indicated very favorable attitudes towardreading, with more than half the students (53%), on average, at the high levelof the index and 42 percent at the medium level. Just 5 percent were at thelow level. Countries with the highest percentages of students with parentsholding positive attitudes toward reading included Hungary, Norway, andSweden, where more than 70 percent of students were at the high level of theindex. Countries where fewer parents expressed positive attitudes includedTurkey, Hong Kong, and Moldova, each of which had less than 30 percent ofstudents at the high level. On average, internationally, students at the highlevel of the index had higher average reading achievement (524 points) than stu-dents at the medium (492 points) or low level (482 points).
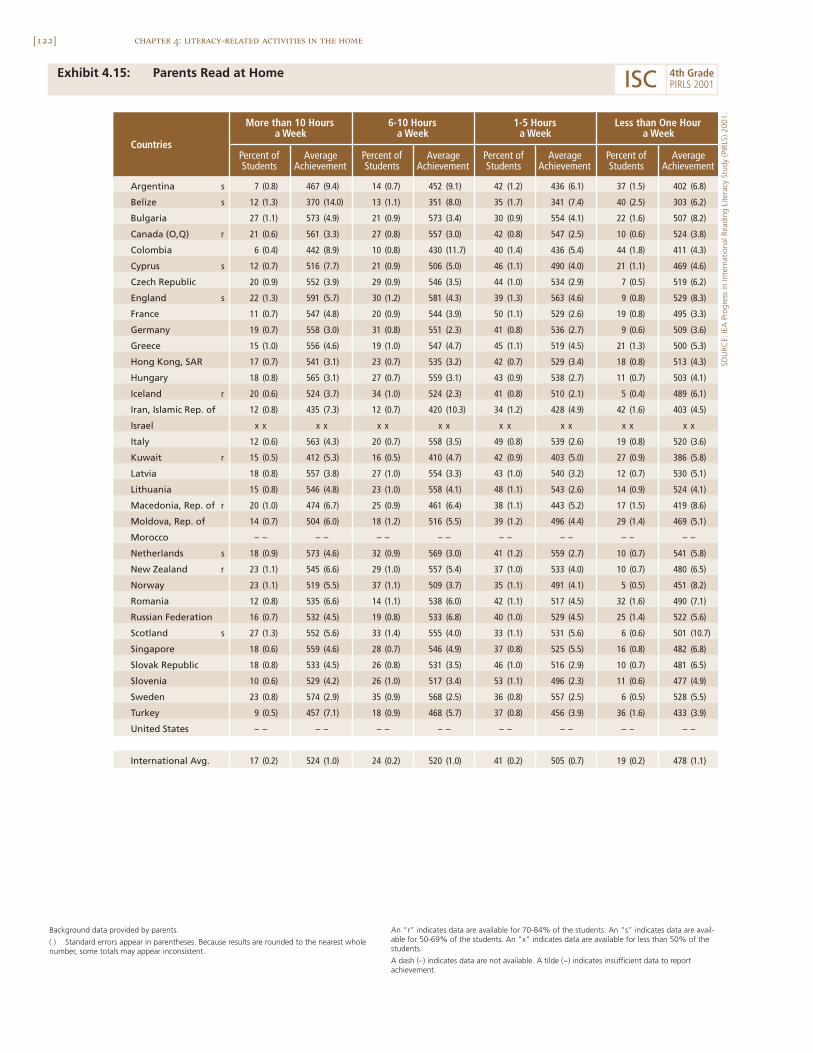
[122] chapter 4: literacy-related activities in the home
Exhibit 4.15: Parents Read at Home
Argentina s 7 (0.8) 467 (9.4) 14 (0.7) 452 (9.1) 42 (1.2) 436 (6.1) 37 (1.5) 402 (6.8)
Belize s 12 (1.3) 370 (14.0) 13 (1.1) 351 (8.0) 35 (1.7) 341 (7.4) 40 (2.5) 303 (6.2)
Bulgaria 27 (1.1) 573 (4.9) 21 (0.9) 573 (3.4) 30 (0.9) 554 (4.1) 22 (1.6) 507 (8.2)
Canada (O,Q) r 21 (0.6) 561 (3.3) 27 (0.8) 557 (3.0) 42 (0.8) 547 (2.5) 10 (0.6) 524 (3.8)
Colombia 6 (0.4) 442 (8.9) 10 (0.8) 430 (11.7) 40 (1.4) 436 (5.4) 44 (1.8) 411 (4.3)
Cyprus s 12 (0.7) 516 (7.7) 21 (0.9) 506 (5.0) 46 (1.1) 490 (4.0) 21 (1.1) 469 (4.6)
Czech Republic 20 (0.9) 552 (3.9) 29 (0.9) 546 (3.5) 44 (1.0) 534 (2.9) 7 (0.5) 519 (6.2)
England s 22 (1.3) 591 (5.7) 30 (1.2) 581 (4.3) 39 (1.3) 563 (4.6) 9 (0.8) 529 (8.3)
France 11 (0.7) 547 (4.8) 20 (0.9) 544 (3.9) 50 (1.1) 529 (2.6) 19 (0.8) 495 (3.3)
Germany 19 (0.7) 558 (3.0) 31 (0.8) 551 (2.3) 41 (0.8) 536 (2.7) 9 (0.6) 509 (3.6)
Greece 15 (1.0) 556 (4.6) 19 (1.0) 547 (4.7) 45 (1.1) 519 (4.5) 21 (1.3) 500 (5.3)
Hong Kong, SAR 17 (0.7) 541 (3.1) 23 (0.7) 535 (3.2) 42 (0.7) 529 (3.4) 18 (0.8) 513 (4.3)
Hungary 18 (0.8) 565 (3.1) 27 (0.7) 559 (3.1) 43 (0.9) 538 (2.7) 11 (0.7) 503 (4.1)
Iceland r 20 (0.6) 524 (3.7) 34 (1.0) 524 (2.3) 41 (0.8) 510 (2.1) 5 (0.4) 489 (6.1)
Iran, Islamic Rep. of 12 (0.8) 435 (7.3) 12 (0.7) 420 (10.3) 34 (1.2) 428 (4.9) 42 (1.6) 403 (4.5)
Israel x x x x x x x x x x x x x x x x
Italy 12 (0.6) 563 (4.3) 20 (0.7) 558 (3.5) 49 (0.8) 539 (2.6) 19 (0.8) 520 (3.6)
Kuwait r 15 (0.5) 412 (5.3) 16 (0.5) 410 (4.7) 42 (0.9) 403 (5.0) 27 (0.9) 386 (5.8)
Latvia 18 (0.8) 557 (3.8) 27 (1.0) 554 (3.3) 43 (1.0) 540 (3.2) 12 (0.7) 530 (5.1)
Lithuania 15 (0.8) 546 (4.8) 23 (1.0) 558 (4.1) 48 (1.1) 543 (2.6) 14 (0.9) 524 (4.1)
Macedonia, Rep. of r 20 (1.0) 474 (6.7) 25 (0.9) 461 (6.4) 38 (1.1) 443 (5.2) 17 (1.5) 419 (8.6)
Moldova, Rep. of 14 (0.7) 504 (6.0) 18 (1.2) 516 (5.5) 39 (1.2) 496 (4.4) 29 (1.4) 469 (5.1)
Morocco – – – – – – – – – – – – – – – –
Netherlands s 18 (0.9) 573 (4.6) 32 (0.9) 569 (3.0) 41 (1.2) 559 (2.7) 10 (0.7) 541 (5.8)
New Zealand r 23 (1.1) 545 (6.6) 29 (1.0) 557 (5.4) 37 (1.0) 533 (4.0) 10 (0.7) 480 (6.5)
Norway 23 (1.1) 519 (5.5) 37 (1.1) 509 (3.7) 35 (1.1) 491 (4.1) 5 (0.5) 451 (8.2)
Romania 12 (0.8) 535 (6.6) 14 (1.1) 538 (6.0) 42 (1.1) 517 (4.5) 32 (1.6) 490 (7.1)
Russian Federation 16 (0.7) 532 (4.5) 19 (0.8) 533 (6.8) 40 (1.0) 529 (4.5) 25 (1.4) 522 (5.6)
Scotland s 27 (1.3) 552 (5.6) 33 (1.4) 555 (4.0) 33 (1.1) 531 (5.6) 6 (0.6) 501 (10.7)
Singapore 18 (0.6) 559 (4.6) 28 (0.7) 546 (4.9) 37 (0.8) 525 (5.5) 16 (0.8) 482 (6.8)
Slovak Republic 18 (0.8) 533 (4.5) 26 (0.8) 531 (3.5) 46 (1.0) 516 (2.9) 10 (0.7) 481 (6.5)
Slovenia 10 (0.6) 529 (4.2) 26 (1.0) 517 (3.4) 53 (1.1) 496 (2.3) 11 (0.6) 477 (4.9)
Sweden 23 (0.8) 574 (2.9) 35 (0.9) 568 (2.5) 36 (0.8) 557 (2.5) 6 (0.5) 528 (5.5)
Turkey 9 (0.5) 457 (7.1) 18 (0.9) 468 (5.7) 37 (0.8) 456 (3.9) 36 (1.6) 433 (3.9)
United States – – – – – – – – – – – – – – – –
International Avg. 17 (0.2) 524 (1.0) 24 (0.2) 520 (1.0) 41 (0.2) 505 (0.7) 19 (0.2) 478 (1.1)
6-10 Hoursa Week
More than 10 Hoursa Week
Countries
1-5 Hoursa Week
Less than One Houra Week
AverageAchievement
Percent ofStudents
AverageAchievement
Percent ofStudents
AverageAchievement
Percent ofStudents
AverageAchievement
Percent ofStudents
Background data provided by parents.
( ) Standard errors appear in parentheses. Because results are rounded to the nearest wholenumber, some totals may appear inconsistent.
An “r” indicates data are available for 70-84% of the students. An “s” indicates data are avail-able for 50-69% of the students. An “x” indicates data are available for less than 50% of thestudents.
A dash (–) indicates data are not available. A tilde (~) indicates insufficient data to reportachievement.
SOU
RCE:
IEA
Pro
gres
s in
Inte
rnat
iona
l Rea
ding
Lite
racy
Stu
dy (P
IRLS
) 200
1.
ISC 4th GradePIRLS 2001
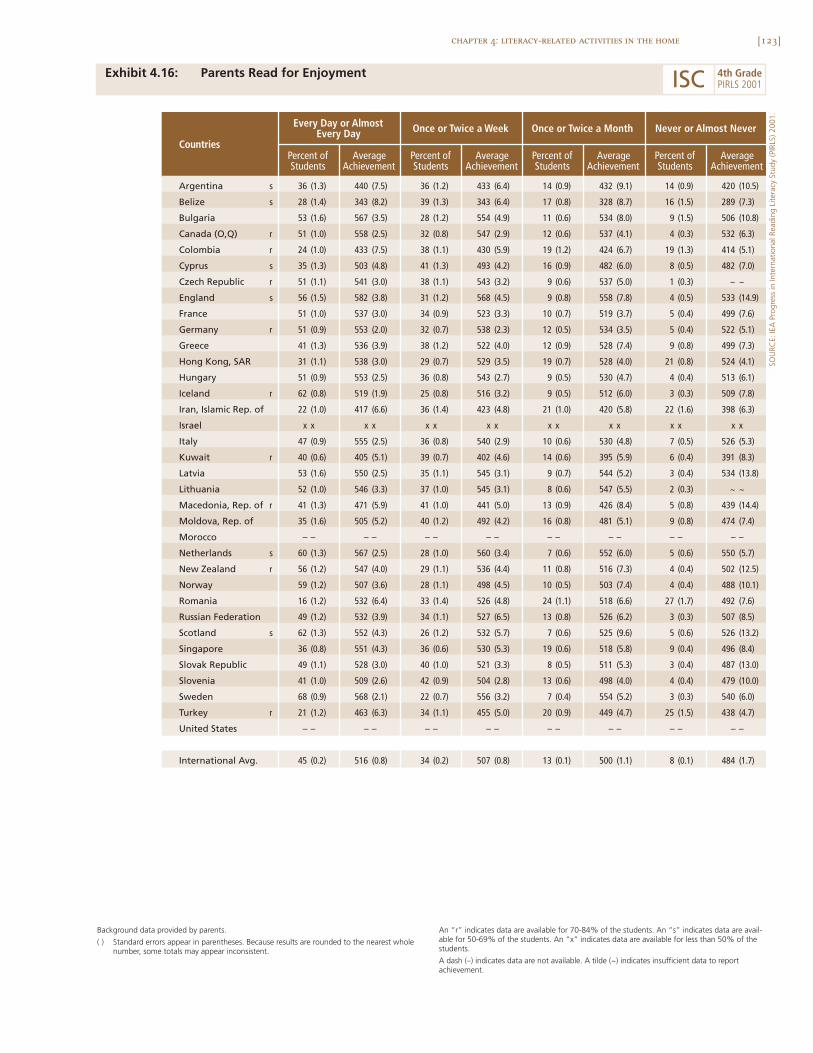
[123]chapter 4: literacy-related activities in the home
Exhibit 4.16: Parents Read for Enjoyment
SOU
RCE:
IEA
Pro
gres
s in
Inte
rnat
iona
l Rea
ding
Lite
racy
Stu
dy (P
IRLS
) 200
1.
Argentina s 36 (1.3) 440 (7.5) 36 (1.2) 433 (6.4) 14 (0.9) 432 (9.1) 14 (0.9) 420 (10.5)
Belize s 28 (1.4) 343 (8.2) 39 (1.3) 343 (6.4) 17 (0.8) 328 (8.7) 16 (1.5) 289 (7.3)
Bulgaria 53 (1.6) 567 (3.5) 28 (1.2) 554 (4.9) 11 (0.6) 534 (8.0) 9 (1.5) 506 (10.8)
Canada (O,Q) r 51 (1.0) 558 (2.5) 32 (0.8) 547 (2.9) 12 (0.6) 537 (4.1) 4 (0.3) 532 (6.3)
Colombia r 24 (1.0) 433 (7.5) 38 (1.1) 430 (5.9) 19 (1.2) 424 (6.7) 19 (1.3) 414 (5.1)
Cyprus s 35 (1.3) 503 (4.8) 41 (1.3) 493 (4.2) 16 (0.9) 482 (6.0) 8 (0.5) 482 (7.0)
Czech Republic r 51 (1.1) 541 (3.0) 38 (1.1) 543 (3.2) 9 (0.6) 537 (5.0) 1 (0.3) ~ ~
England s 56 (1.5) 582 (3.8) 31 (1.2) 568 (4.5) 9 (0.8) 558 (7.8) 4 (0.5) 533 (14.9)
France 51 (1.0) 537 (3.0) 34 (0.9) 523 (3.3) 10 (0.7) 519 (3.7) 5 (0.4) 499 (7.6)
Germany r 51 (0.9) 553 (2.0) 32 (0.7) 538 (2.3) 12 (0.5) 534 (3.5) 5 (0.4) 522 (5.1)
Greece 41 (1.3) 536 (3.9) 38 (1.2) 522 (4.0) 12 (0.9) 528 (7.4) 9 (0.8) 499 (7.3)
Hong Kong, SAR 31 (1.1) 538 (3.0) 29 (0.7) 529 (3.5) 19 (0.7) 528 (4.0) 21 (0.8) 524 (4.1)
Hungary 51 (0.9) 553 (2.5) 36 (0.8) 543 (2.7) 9 (0.5) 530 (4.7) 4 (0.4) 513 (6.1)
Iceland r 62 (0.8) 519 (1.9) 25 (0.8) 516 (3.2) 9 (0.5) 512 (6.0) 3 (0.3) 509 (7.8)
Iran, Islamic Rep. of 22 (1.0) 417 (6.6) 36 (1.4) 423 (4.8) 21 (1.0) 420 (5.8) 22 (1.6) 398 (6.3)
Israel x x x x x x x x x x x x x x x x
Italy 47 (0.9) 555 (2.5) 36 (0.8) 540 (2.9) 10 (0.6) 530 (4.8) 7 (0.5) 526 (5.3)
Kuwait r 40 (0.6) 405 (5.1) 39 (0.7) 402 (4.6) 14 (0.6) 395 (5.9) 6 (0.4) 391 (8.3)
Latvia 53 (1.6) 550 (2.5) 35 (1.1) 545 (3.1) 9 (0.7) 544 (5.2) 3 (0.4) 534 (13.8)
Lithuania 52 (1.0) 546 (3.3) 37 (1.0) 545 (3.1) 8 (0.6) 547 (5.5) 2 (0.3) ~ ~
Macedonia, Rep. of r 41 (1.3) 471 (5.9) 41 (1.0) 441 (5.0) 13 (0.9) 426 (8.4) 5 (0.8) 439 (14.4)
Moldova, Rep. of 35 (1.6) 505 (5.2) 40 (1.2) 492 (4.2) 16 (0.8) 481 (5.1) 9 (0.8) 474 (7.4)
Morocco – – – – – – – – – – – – – – – –
Netherlands s 60 (1.3) 567 (2.5) 28 (1.0) 560 (3.4) 7 (0.6) 552 (6.0) 5 (0.6) 550 (5.7)
New Zealand r 56 (1.2) 547 (4.0) 29 (1.1) 536 (4.4) 11 (0.8) 516 (7.3) 4 (0.4) 502 (12.5)
Norway 59 (1.2) 507 (3.6) 28 (1.1) 498 (4.5) 10 (0.5) 503 (7.4) 4 (0.4) 488 (10.1)
Romania 16 (1.2) 532 (6.4) 33 (1.4) 526 (4.8) 24 (1.1) 518 (6.6) 27 (1.7) 492 (7.6)
Russian Federation 49 (1.2) 532 (3.9) 34 (1.1) 527 (6.5) 13 (0.8) 526 (6.2) 3 (0.3) 507 (8.5)
Scotland s 62 (1.3) 552 (4.3) 26 (1.2) 532 (5.7) 7 (0.6) 525 (9.6) 5 (0.6) 526 (13.2)
Singapore 36 (0.8) 551 (4.3) 36 (0.6) 530 (5.3) 19 (0.6) 518 (5.8) 9 (0.4) 496 (8.4)
Slovak Republic 49 (1.1) 528 (3.0) 40 (1.0) 521 (3.3) 8 (0.5) 511 (5.3) 3 (0.4) 487 (13.0)
Slovenia 41 (1.0) 509 (2.6) 42 (0.9) 504 (2.8) 13 (0.6) 498 (4.0) 4 (0.4) 479 (10.0)
Sweden 68 (0.9) 568 (2.1) 22 (0.7) 556 (3.2) 7 (0.4) 554 (5.2) 3 (0.3) 540 (6.0)
Turkey r 21 (1.2) 463 (6.3) 34 (1.1) 455 (5.0) 20 (0.9) 449 (4.7) 25 (1.5) 438 (4.7)
United States – – – – – – – – – – – – – – – –
International Avg. 45 (0.2) 516 (0.8) 34 (0.2) 507 (0.8) 13 (0.1) 500 (1.1) 8 (0.1) 484 (1.7)
Every Day or AlmostEvery Day
Countries
Once or Twice a Week Once or Twice a Month Never or Almost Never
AverageAchievement
Percent ofStudents
AverageAchievement
Percent ofStudents
AverageAchievement
Percent ofStudents
AverageAchievement
Percent ofStudents
ISC 4th GradePIRLS 2001
Background data provided by parents.
( ) Standard errors appear in parentheses. Because results are rounded to the nearest wholenumber, some totals may appear inconsistent.
An “r” indicates data are available for 70-84% of the students. An “s” indicates data are avail-able for 50-69% of the students. An “x” indicates data are available for less than 50% of thestudents.
A dash (–) indicates data are not available. A tilde (~) indicates insufficient data to reportachievement.
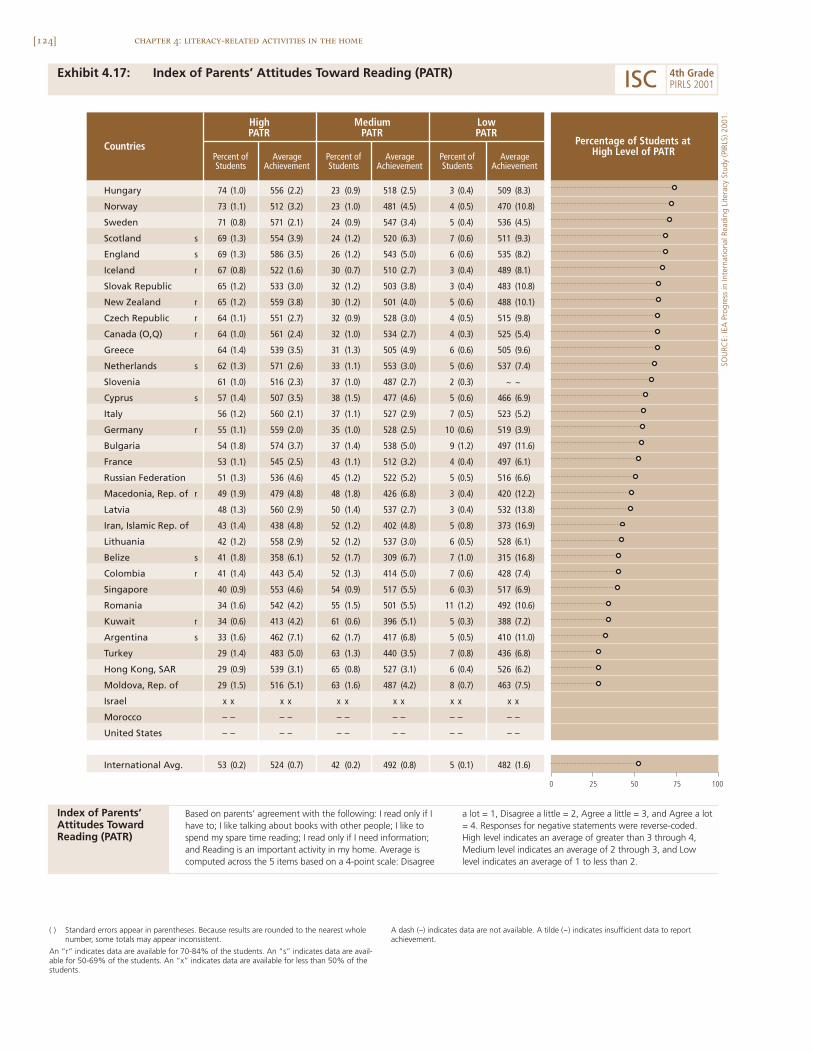
[124] chapter 4: literacy-related activities in the home
Exhibit 4.17: Index of Parents’ Attitudes Toward Reading (PATR)
Hungary 74 (1.0) 556 (2.2) 23 (0.9) 518 (2.5) 3 (0.4) 509 (8.3)
Norway 73 (1.1) 512 (3.2) 23 (1.0) 481 (4.5) 4 (0.5) 470 (10.8)
Sweden 71 (0.8) 571 (2.1) 24 (0.9) 547 (3.4) 5 (0.4) 536 (4.5)
Scotland s 69 (1.3) 554 (3.9) 24 (1.2) 520 (6.3) 7 (0.6) 511 (9.3)
England s 69 (1.3) 586 (3.5) 26 (1.2) 543 (5.0) 6 (0.6) 535 (8.2)
Iceland r 67 (0.8) 522 (1.6) 30 (0.7) 510 (2.7) 3 (0.4) 489 (8.1)
Slovak Republic 65 (1.2) 533 (3.0) 32 (1.2) 503 (3.8) 3 (0.4) 483 (10.8)
New Zealand r 65 (1.2) 559 (3.8) 30 (1.2) 501 (4.0) 5 (0.6) 488 (10.1)
Czech Republic r 64 (1.1) 551 (2.7) 32 (0.9) 528 (3.0) 4 (0.5) 515 (9.8)
Canada (O,Q) r 64 (1.0) 561 (2.4) 32 (1.0) 534 (2.7) 4 (0.3) 525 (5.4)
Greece 64 (1.4) 539 (3.5) 31 (1.3) 505 (4.9) 6 (0.6) 505 (9.6)
Netherlands s 62 (1.3) 571 (2.6) 33 (1.1) 553 (3.0) 5 (0.6) 537 (7.4)
Slovenia 61 (1.0) 516 (2.3) 37 (1.0) 487 (2.7) 2 (0.3) ~ ~
Cyprus s 57 (1.4) 507 (3.5) 38 (1.5) 477 (4.6) 5 (0.6) 466 (6.9)
Italy 56 (1.2) 560 (2.1) 37 (1.1) 527 (2.9) 7 (0.5) 523 (5.2)
Germany r 55 (1.1) 559 (2.0) 35 (1.0) 528 (2.5) 10 (0.6) 519 (3.9)
Bulgaria 54 (1.8) 574 (3.7) 37 (1.4) 538 (5.0) 9 (1.2) 497 (11.6)
France 53 (1.1) 545 (2.5) 43 (1.1) 512 (3.2) 4 (0.4) 497 (6.1)
Russian Federation 51 (1.3) 536 (4.6) 45 (1.2) 522 (5.2) 5 (0.5) 516 (6.6)
Macedonia, Rep. of r 49 (1.9) 479 (4.8) 48 (1.8) 426 (6.8) 3 (0.4) 420 (12.2)
Latvia 48 (1.3) 560 (2.9) 50 (1.4) 537 (2.7) 3 (0.4) 532 (13.8)
Iran, Islamic Rep. of 43 (1.4) 438 (4.8) 52 (1.2) 402 (4.8) 5 (0.8) 373 (16.9)
Lithuania 42 (1.2) 558 (2.9) 52 (1.2) 537 (3.0) 6 (0.5) 528 (6.1)
Belize s 41 (1.8) 358 (6.1) 52 (1.7) 309 (6.7) 7 (1.0) 315 (16.8)
Colombia r 41 (1.4) 443 (5.4) 52 (1.3) 414 (5.0) 7 (0.6) 428 (7.4)
Singapore 40 (0.9) 553 (4.6) 54 (0.9) 517 (5.5) 6 (0.3) 517 (6.9)
Romania 34 (1.6) 542 (4.2) 55 (1.5) 501 (5.5) 11 (1.2) 492 (10.6)
Kuwait r 34 (0.6) 413 (4.2) 61 (0.6) 396 (5.1) 5 (0.3) 388 (7.2)
Argentina s 33 (1.6) 462 (7.1) 62 (1.7) 417 (6.8) 5 (0.5) 410 (11.0)
Turkey 29 (1.4) 483 (5.0) 63 (1.3) 440 (3.5) 7 (0.8) 436 (6.8)
Hong Kong, SAR 29 (0.9) 539 (3.1) 65 (0.8) 527 (3.1) 6 (0.4) 526 (6.2)
Moldova, Rep. of 29 (1.5) 516 (5.1) 63 (1.6) 487 (4.2) 8 (0.7) 463 (7.5)
Israel x x x x x x x x x x x x
Morocco – – – – – – – – – – – –
United States – – – – – – – – – – – –
International Avg. 53 (0.2) 524 (0.7) 42 (0.2) 492 (0.8) 5 (0.1) 482 (1.6)
Countries
HighPATR
MediumPATR
LowPATR
Percentage of Students atHigh Level of PATR
0 10050 7525
Percent ofStudents
AverageAchievement
Percent ofStudents
AverageAchievement
Percent ofStudents
AverageAchievement
( ) Standard errors appear in parentheses. Because results are rounded to the nearest wholenumber, some totals may appear inconsistent.
An “r” indicates data are available for 70-84% of the students. An “s” indicates data are avail-able for 50-69% of the students. An “x” indicates data are available for less than 50% of thestudents.
A dash (–) indicates data are not available. A tilde (~) indicates insufficient data to reportachievement.
SOU
RCE:
IEA
Pro
gres
s in
Inte
rnat
iona
l Rea
ding
Lite
racy
Stu
dy (P
IRLS
) 200
1.
ISC 4th GradePIRLS 2001
Index of Parents’Attitudes TowardReading (PATR)
Based on parents’ agreement with the following: I read only if Ihave to; I like talking about books with other people; I like tospend my spare time reading; I read only if I need information;and Reading is an important activity in my home. Average iscomputed across the 5 items based on a 4-point scale: Disagree
a lot = 1, Disagree a little = 2, Agree a little = 3, and Agree a lot= 4. Responses for negative statements were reverse-coded.High level indicates an average of greater than 3 through 4,Medium level indicates an average of 2 through 3, and Lowlevel indicates an average of 1 to less than 2.

[125]chapter 4: literacy-related activities in the home
5

[127]
Chapter 5School Curriculumand Organization forTeaching Reading
As described in the PIRLS 2001 Encyclopedia,1
there is a great deal of diversity in how countries
arrange their educational systems to provide
reading instruction in the primary school. Chapter 5
brings together reports from the teachers and
parents of fourth-grade students and from school
principals to describe, in particular, the school
curriculum and organization for teaching reading.
[128]
Specifically, this chapter summarizes the emphasis of preprimary educationand reading readiness, schools’ emphasis on reading in the curriculum, theamount of time devoted to language and reading instruction, the organiza-
tion and sizes of classes for reading instruction,and strategies for working with students havingdifficulties learning to read.
The information reported in this chapterwas collected via questionnaires to the parents,teachers, and school principals of the students par-ticipating in PIRLS. Because the sampling wasbased on participating students, when the infor-
mation from the parents, teachers, or principals is being reported, the studentis always the unit of analysis. That is, the data shown are the percentages ofstudents whose parents, teachers, or school principals reported on variousactivities or characteristics. Using the student as the unit of analysis makes itpossible to focus on students’ experiences in learning to read in school, and isconsistent with the PIRLS goals of providing information about the educa-tional contexts and performance of students.
For reporting purposes, the information provided by parents, teach-ers, and school principals is tied directly to the students tested. Sometimes,however, respondents did not complete the questionnaire assigned to them,so most countries had some percentage of students for whom no questionnaireinformation is available. The exhibits in this chapter have special notations onthis point. For a country where responses are available for 70 to 84 percent ofstudents, an “r” is included next to its data. Where responses are available for50 to 69 percent of students, an “s” is included. Where responses are avail-able for less than 50 percent, an “x” replaces the data.
How Well-Prepared Are Students to Learn to Read?
Countries adopt a variety of strategies for helping children make the transitionfrom home to a school environment. Such preprimary education programs,known also as preschool, kindergarten, and early childhood education, can beup to three years, and are intended to prepare children for primary education.
chapter 5: school curriculum and organization for teaching reading
1 For a description of educational systems and reading literacy curricula in the PIRLS countries, see Mullis, I.V.S., Martin, M.O., Kennedy, A.M.,& Flaherty, C.L. (Eds.). (2002). PIRLS 2001 Encyclopedia: A reference guide to reading education in the countries participating in IEA’s Progressin International Reading Literacy Study (PIRLS). Chestnut Hill, MA: Boston College.
Average reading achievementwas lowest among students
not attending preschool.
[129]chapter 5: school curriculum and organization for teaching reading
Parents’ reports on the number of years their fourth-grade child attended pre-school or kindergarten are summarized in Exhibit 5.1. Almost all countriesmake provision for at least one year of preprimary education – only in Iranand Turkey did the majority of students not attend preschool. Two-fifths ofthe students, on average, had parents reporting that the student had at least twoyears of preprimary education. Countries where two-thirds or more of the stu-dents were in this category included France, Germany, Hong Kong, Hungary,and Italy. Internationally, average reading achievement was lowest among stu-dents not attending preschool (491 score points), and highest among thosewho attended for more than two years (523 points).
Students in the PIRLS countries mostly began primary education whenthey were six or seven years old, as shown in Exhibit 5.2, although in England,New Zealand, and Scotland almost all students began when they were five oryounger. There is no clear relationship between age of entry to primary school-ing and fourth-grade reading achievement. Among the top-performing coun-tries on the PIRLS reading assessment, for example, the students in TheNetherlands started primary school when theywere six, and those in England when they werefive. Among low-performing countries there wasalso a range of starting ages, with students in Belizemostly starting when they were five or younger,those in Argentina when they were six, and thosein Iran when they were six or seven.
Regardless of when they begin primaryschool, a more important issue from the perspectiveof the school is whether incoming students areready to begin learning in a formal setting. PIRLSasked school principals to estimate how many stu-dents beginning the first year of school could:
• Recognize most of the alphabet
• Read some words
• Read sentences
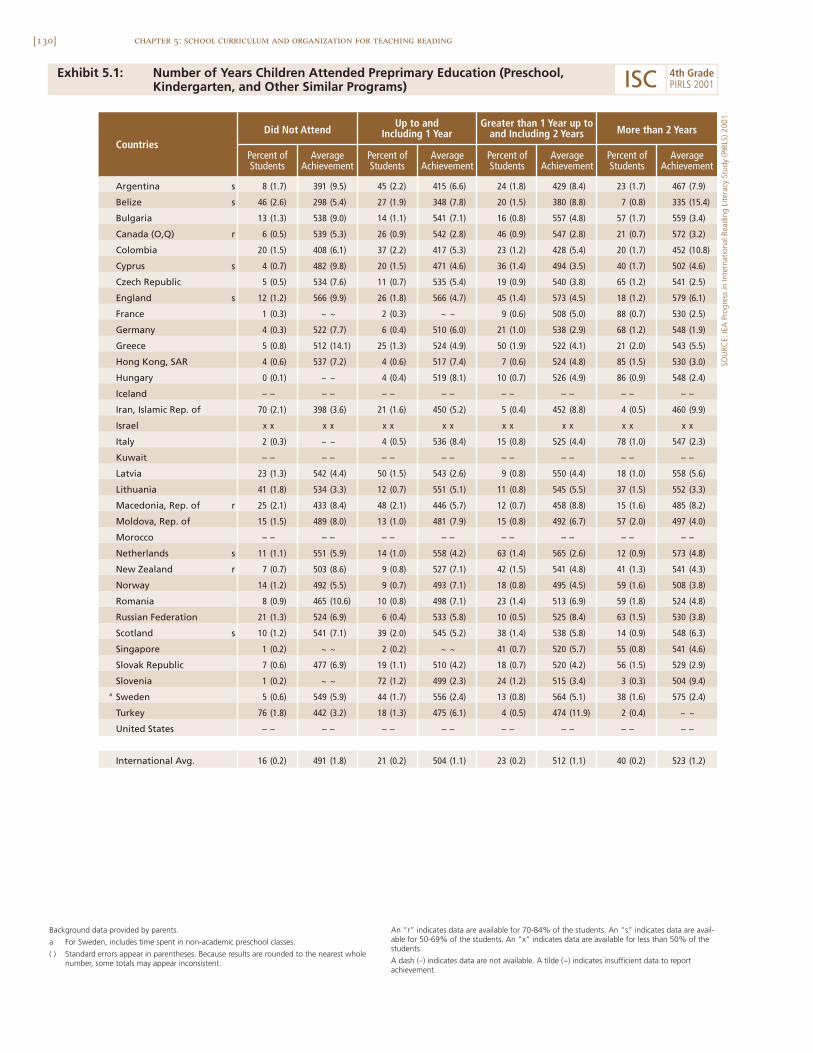
Background data provided by parents.
a For Sweden, includes time spent in non-academic preschool classes.
( ) Standard errors appear in parentheses. Because results are rounded to the nearest wholenumber, some totals may appear inconsistent.
An “r” indicates data are available for 70-84% of the students. An “s” indicates data are avail-able for 50-69% of the students. An “x” indicates data are available for less than 50% of thestudents.
A dash (–) indicates data are not available. A tilde (~) indicates insufficient data to reportachievement.
[130] chapter 5: school curriculum and organization for teaching reading
Exhibit 5.1: Number of Years Children Attended Preprimary Education (Preschool,Kindergarten, and Other Similar Programs)
Argentina s 8 (1.7) 391 (9.5) 45 (2.2) 415 (6.6) 24 (1.8) 429 (8.4) 23 (1.7) 467 (7.9)
Belize s 46 (2.6) 298 (5.4) 27 (1.9) 348 (7.8) 20 (1.5) 380 (8.8) 7 (0.8) 335 (15.4)
Bulgaria 13 (1.3) 538 (9.0) 14 (1.1) 541 (7.1) 16 (0.8) 557 (4.8) 57 (1.7) 559 (3.4)
Canada (O,Q) r 6 (0.5) 539 (5.3) 26 (0.9) 542 (2.8) 46 (0.9) 547 (2.8) 21 (0.7) 572 (3.2)
Colombia 20 (1.5) 408 (6.1) 37 (2.2) 417 (5.3) 23 (1.2) 428 (5.4) 20 (1.7) 452 (10.8)
Cyprus s 4 (0.7) 482 (9.8) 20 (1.5) 471 (4.6) 36 (1.4) 494 (3.5) 40 (1.7) 502 (4.6)
Czech Republic 5 (0.5) 534 (7.6) 11 (0.7) 535 (5.4) 19 (0.9) 540 (3.8) 65 (1.2) 541 (2.5)
England s 12 (1.2) 566 (9.9) 26 (1.8) 566 (4.7) 45 (1.4) 573 (4.5) 18 (1.2) 579 (6.1)
France 1 (0.3) ~ ~ 2 (0.3) ~ ~ 9 (0.6) 508 (5.0) 88 (0.7) 530 (2.5)
Germany 4 (0.3) 522 (7.7) 6 (0.4) 510 (6.0) 21 (1.0) 538 (2.9) 68 (1.2) 548 (1.9)
Greece 5 (0.8) 512 (14.1) 25 (1.3) 524 (4.9) 50 (1.9) 522 (4.1) 21 (2.0) 543 (5.5)
Hong Kong, SAR 4 (0.6) 537 (7.2) 4 (0.6) 517 (7.4) 7 (0.6) 524 (4.8) 85 (1.5) 530 (3.0)
Hungary 0 (0.1) ~ ~ 4 (0.4) 519 (8.1) 10 (0.7) 526 (4.9) 86 (0.9) 548 (2.4)
Iceland – – – – – – – – – – – – – – – –
Iran, Islamic Rep. of 70 (2.1) 398 (3.6) 21 (1.6) 450 (5.2) 5 (0.4) 452 (8.8) 4 (0.5) 460 (9.9)
Israel x x x x x x x x x x x x x x x x
Italy 2 (0.3) ~ ~ 4 (0.5) 536 (8.4) 15 (0.8) 525 (4.4) 78 (1.0) 547 (2.3)
Kuwait – – – – – – – – – – – – – – – –
Latvia 23 (1.3) 542 (4.4) 50 (1.5) 543 (2.6) 9 (0.8) 550 (4.4) 18 (1.0) 558 (5.6)
Lithuania 41 (1.8) 534 (3.3) 12 (0.7) 551 (5.1) 11 (0.8) 545 (5.5) 37 (1.5) 552 (3.3)
Macedonia, Rep. of r 25 (2.1) 433 (8.4) 48 (2.1) 446 (5.7) 12 (0.7) 458 (8.8) 15 (1.6) 485 (8.2)
Moldova, Rep. of 15 (1.5) 489 (8.0) 13 (1.0) 481 (7.9) 15 (0.8) 492 (6.7) 57 (2.0) 497 (4.0)
Morocco – – – – – – – – – – – – – – – –
Netherlands s 11 (1.1) 551 (5.9) 14 (1.0) 558 (4.2) 63 (1.4) 565 (2.6) 12 (0.9) 573 (4.8)
New Zealand r 7 (0.7) 503 (8.6) 9 (0.8) 527 (7.1) 42 (1.5) 541 (4.8) 41 (1.3) 541 (4.3)
Norway 14 (1.2) 492 (5.5) 9 (0.7) 493 (7.1) 18 (0.8) 495 (4.5) 59 (1.6) 508 (3.8)
Romania 8 (0.9) 465 (10.6) 10 (0.8) 498 (7.1) 23 (1.4) 513 (6.9) 59 (1.8) 524 (4.8)
Russian Federation 21 (1.3) 524 (6.9) 6 (0.4) 533 (5.8) 10 (0.5) 525 (8.4) 63 (1.5) 530 (3.8)
Scotland s 10 (1.2) 541 (7.1) 39 (2.0) 545 (5.2) 38 (1.4) 538 (5.8) 14 (0.9) 548 (6.3)
Singapore 1 (0.2) ~ ~ 2 (0.2) ~ ~ 41 (0.7) 520 (5.7) 55 (0.8) 541 (4.6)
Slovak Republic 7 (0.6) 477 (6.9) 19 (1.1) 510 (4.2) 18 (0.7) 520 (4.2) 56 (1.5) 529 (2.9)
Slovenia 1 (0.2) ~ ~ 72 (1.2) 499 (2.3) 24 (1.2) 515 (3.4) 3 (0.3) 504 (9.4)a Sweden 5 (0.6) 549 (5.9) 44 (1.7) 556 (2.4) 13 (0.8) 564 (5.1) 38 (1.6) 575 (2.4)
Turkey 76 (1.8) 442 (3.2) 18 (1.3) 475 (6.1) 4 (0.5) 474 (11.9) 2 (0.4) ~ ~
United States – – – – – – – – – – – – – – – –
International Avg. 16 (0.2) 491 (1.8) 21 (0.2) 504 (1.1) 23 (0.2) 512 (1.1) 40 (0.2) 523 (1.2)
CountriesAverage
AchievementPercent ofStudents
Did Not AttendUp to and
Including 1 YearGreater than 1 Year up to
and Including 2 Years More than 2 Years
AverageAchievement
Percent ofStudents
AverageAchievement
Percent ofStudents
AverageAchievement
Percent ofStudents
SOU
RCE:
IEA
Pro
gres
s in
Inte
rnat
iona
l Rea
ding
Lite
racy
Stu
dy (P
IRLS
) 200
1.
ISC 4th GradePIRLS 2001
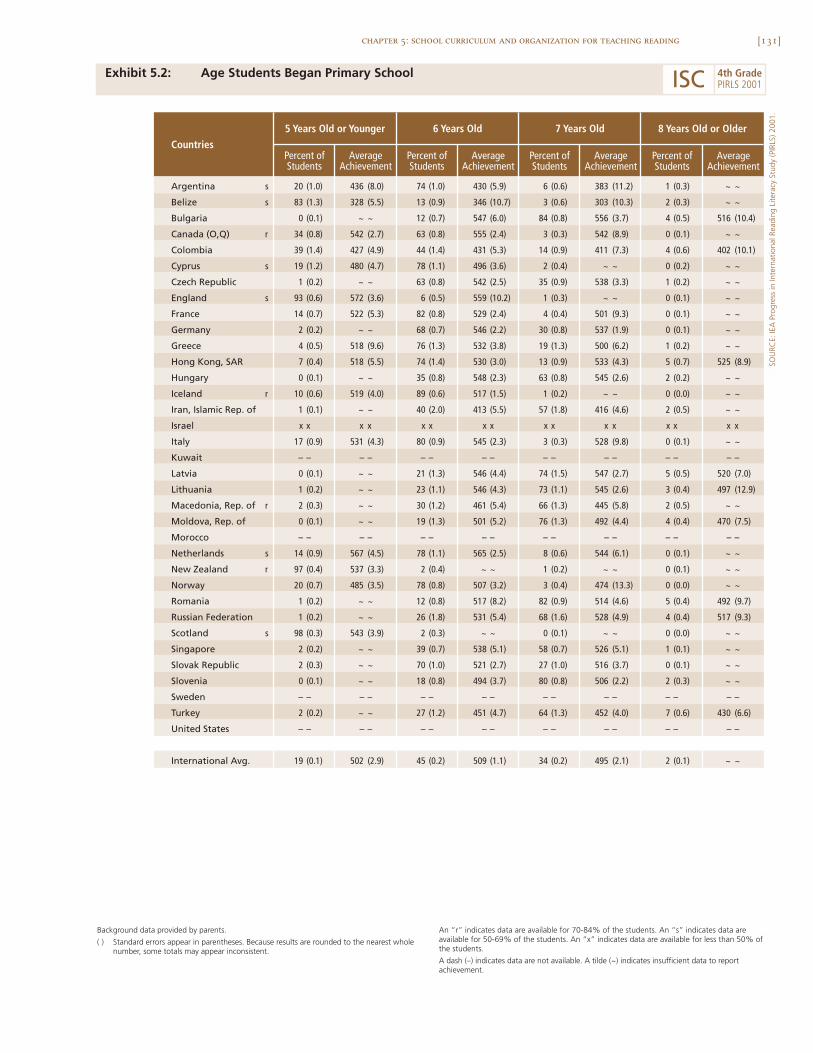
[131]chapter 5: school curriculum and organization for teaching reading
Exhibit 5.2: Age Students Began Primary School
SOU
RCE:
IEA
Pro
gres
s in
Inte
rnat
iona
l Rea
ding
Lite
racy
Stu
dy (P
IRLS
) 200
1.
Argentina s
Belize s
Bulgaria
Canada (O,Q) r
Colombia
Cyprus s
Czech Republic
England s
France
Germany
Greece
Hong Kong, SAR
Hungary
Iceland r
Iran, Islamic Rep. of
Israel
Italy
Kuwait
Latvia
Lithuania
Macedonia, Rep. of r
Moldova, Rep. of
Morocco
Netherlands s
New Zealand r
Norway
Romania
Russian Federation
Scotland s
Singapore
Slovak Republic
Slovenia
Sweden
Turkey
United States
International Avg.
5 Years Old or Younger
Countries
6 Years Old 7 Years Old 8 Years Old or Older
Percent ofStudents
AverageAchievement
Percent ofStudents
AverageAchievement
Percent ofStudents
AverageAchievement
Percent ofStudents
AverageAchievement
20 (1.0) 436 (8.0) 74 (1.0) 430 (5.9) 6 (0.6) 383 (11.2) 1 (0.3) ~ ~
83 (1.3) 328 (5.5) 13 (0.9) 346 (10.7) 3 (0.6) 303 (10.3) 2 (0.3) ~ ~
0 (0.1) ~ ~ 12 (0.7) 547 (6.0) 84 (0.8) 556 (3.7) 4 (0.5) 516 (10.4)
34 (0.8) 542 (2.7) 63 (0.8) 555 (2.4) 3 (0.3) 542 (8.9) 0 (0.1) ~ ~
39 (1.4) 427 (4.9) 44 (1.4) 431 (5.3) 14 (0.9) 411 (7.3) 4 (0.6) 402 (10.1)
19 (1.2) 480 (4.7) 78 (1.1) 496 (3.6) 2 (0.4) ~ ~ 0 (0.2) ~ ~
1 (0.2) ~ ~ 63 (0.8) 542 (2.5) 35 (0.9) 538 (3.3) 1 (0.2) ~ ~
93 (0.6) 572 (3.6) 6 (0.5) 559 (10.2) 1 (0.3) ~ ~ 0 (0.1) ~ ~
14 (0.7) 522 (5.3) 82 (0.8) 529 (2.4) 4 (0.4) 501 (9.3) 0 (0.1) ~ ~
2 (0.2) ~ ~ 68 (0.7) 546 (2.2) 30 (0.8) 537 (1.9) 0 (0.1) ~ ~
4 (0.5) 518 (9.6) 76 (1.3) 532 (3.8) 19 (1.3) 500 (6.2) 1 (0.2) ~ ~
7 (0.4) 518 (5.5) 74 (1.4) 530 (3.0) 13 (0.9) 533 (4.3) 5 (0.7) 525 (8.9)
0 (0.1) ~ ~ 35 (0.8) 548 (2.3) 63 (0.8) 545 (2.6) 2 (0.2) ~ ~
10 (0.6) 519 (4.0) 89 (0.6) 517 (1.5) 1 (0.2) ~ ~ 0 (0.0) ~ ~
1 (0.1) ~ ~ 40 (2.0) 413 (5.5) 57 (1.8) 416 (4.6) 2 (0.5) ~ ~
x x x x x x x x x x x x x x x x
17 (0.9) 531 (4.3) 80 (0.9) 545 (2.3) 3 (0.3) 528 (9.8) 0 (0.1) ~ ~
– – – – – – – – – – – – – – – –
0 (0.1) ~ ~ 21 (1.3) 546 (4.4) 74 (1.5) 547 (2.7) 5 (0.5) 520 (7.0)
1 (0.2) ~ ~ 23 (1.1) 546 (4.3) 73 (1.1) 545 (2.6) 3 (0.4) 497 (12.9)
2 (0.3) ~ ~ 30 (1.2) 461 (5.4) 66 (1.3) 445 (5.8) 2 (0.5) ~ ~
0 (0.1) ~ ~ 19 (1.3) 501 (5.2) 76 (1.3) 492 (4.4) 4 (0.4) 470 (7.5)
– – – – – – – – – – – – – – – –
14 (0.9) 567 (4.5) 78 (1.1) 565 (2.5) 8 (0.6) 544 (6.1) 0 (0.1) ~ ~
97 (0.4) 537 (3.3) 2 (0.4) ~ ~ 1 (0.2) ~ ~ 0 (0.1) ~ ~
20 (0.7) 485 (3.5) 78 (0.8) 507 (3.2) 3 (0.4) 474 (13.3) 0 (0.0) ~ ~
1 (0.2) ~ ~ 12 (0.8) 517 (8.2) 82 (0.9) 514 (4.6) 5 (0.4) 492 (9.7)
1 (0.2) ~ ~ 26 (1.8) 531 (5.4) 68 (1.6) 528 (4.9) 4 (0.4) 517 (9.3)
98 (0.3) 543 (3.9) 2 (0.3) ~ ~ 0 (0.1) ~ ~ 0 (0.0) ~ ~
2 (0.2) ~ ~ 39 (0.7) 538 (5.1) 58 (0.7) 526 (5.1) 1 (0.1) ~ ~
2 (0.3) ~ ~ 70 (1.0) 521 (2.7) 27 (1.0) 516 (3.7) 0 (0.1) ~ ~
0 (0.1) ~ ~ 18 (0.8) 494 (3.7) 80 (0.8) 506 (2.2) 2 (0.3) ~ ~
– – – – – – – – – – – – – – – –
2 (0.2) ~ ~ 27 (1.2) 451 (4.7) 64 (1.3) 452 (4.0) 7 (0.6) 430 (6.6)
– – – – – – – – – – – – – – – –
19 (0.1) 502 (2.9) 45 (0.2) 509 (1.1) 34 (0.2) 495 (2.1) 2 (0.1) ~ ~
ISC 4th GradePIRLS 2001
Background data provided by parents.
( ) Standard errors appear in parentheses. Because results are rounded to the nearest wholenumber, some totals may appear inconsistent.
An “r” indicates data are available for 70-84% of the students. An “s” indicates data areavailable for 50-69% of the students. An “x” indicates data are available for less than 50% ofthe students.
A dash (–) indicates data are not available. A tilde (~) indicates insufficient data to reportachievement.
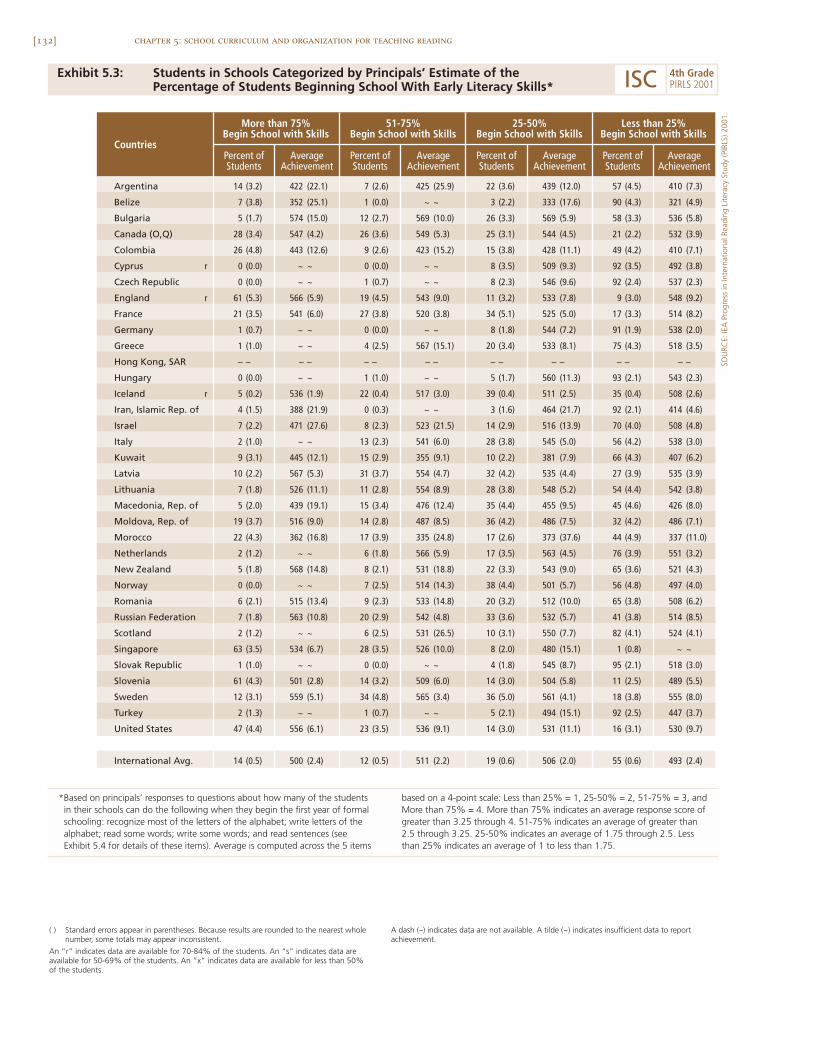
[132] chapter 5: school curriculum and organization for teaching reading
Exhibit 5.3: Students in Schools Categorized by Principals’ Estimate of thePercentage of Students Beginning School With Early Literacy Skills*
Argentina 14 (3.2) 422 (22.1) 7 (2.6) 425 (25.9) 22 (3.6) 439 (12.0) 57 (4.5) 410 (7.3)
Belize 7 (3.8) 352 (25.1) 1 (0.0) ~ ~ 3 (2.2) 333 (17.6) 90 (4.3) 321 (4.9)
Bulgaria 5 (1.7) 574 (15.0) 12 (2.7) 569 (10.0) 26 (3.3) 569 (5.9) 58 (3.3) 536 (5.8)
Canada (O,Q) 28 (3.4) 547 (4.2) 26 (3.6) 549 (5.3) 25 (3.1) 544 (4.5) 21 (2.2) 532 (3.9)
Colombia 26 (4.8) 443 (12.6) 9 (2.6) 423 (15.2) 15 (3.8) 428 (11.1) 49 (4.2) 410 (7.1)
Cyprus r 0 (0.0) ~ ~ 0 (0.0) ~ ~ 8 (3.5) 509 (9.3) 92 (3.5) 492 (3.8)
Czech Republic 0 (0.0) ~ ~ 1 (0.7) ~ ~ 8 (2.3) 546 (9.6) 92 (2.4) 537 (2.3)
England r 61 (5.3) 566 (5.9) 19 (4.5) 543 (9.0) 11 (3.2) 533 (7.8) 9 (3.0) 548 (9.2)
France 21 (3.5) 541 (6.0) 27 (3.8) 520 (3.8) 34 (5.1) 525 (5.0) 17 (3.3) 514 (8.2)
Germany 1 (0.7) ~ ~ 0 (0.0) ~ ~ 8 (1.8) 544 (7.2) 91 (1.9) 538 (2.0)
Greece 1 (1.0) ~ ~ 4 (2.5) 567 (15.1) 20 (3.4) 533 (8.1) 75 (4.3) 518 (3.5)
Hong Kong, SAR – – – – – – – – – – – – – – – –
Hungary 0 (0.0) ~ ~ 1 (1.0) ~ ~ 5 (1.7) 560 (11.3) 93 (2.1) 543 (2.3)
Iceland r 5 (0.2) 536 (1.9) 22 (0.4) 517 (3.0) 39 (0.4) 511 (2.5) 35 (0.4) 508 (2.6)
Iran, Islamic Rep. of 4 (1.5) 388 (21.9) 0 (0.3) ~ ~ 3 (1.6) 464 (21.7) 92 (2.1) 414 (4.6)
Israel 7 (2.2) 471 (27.6) 8 (2.3) 523 (21.5) 14 (2.9) 516 (13.9) 70 (4.0) 508 (4.8)
Italy 2 (1.0) ~ ~ 13 (2.3) 541 (6.0) 28 (3.8) 545 (5.0) 56 (4.2) 538 (3.0)
Kuwait 9 (3.1) 445 (12.1) 15 (2.9) 355 (9.1) 10 (2.2) 381 (7.9) 66 (4.3) 407 (6.2)
Latvia 10 (2.2) 567 (5.3) 31 (3.7) 554 (4.7) 32 (4.2) 535 (4.4) 27 (3.9) 535 (3.9)
Lithuania 7 (1.8) 526 (11.1) 11 (2.8) 554 (8.9) 28 (3.8) 548 (5.2) 54 (4.4) 542 (3.8)
Macedonia, Rep. of 5 (2.0) 439 (19.1) 15 (3.4) 476 (12.4) 35 (4.4) 455 (9.5) 45 (4.6) 426 (8.0)
Moldova, Rep. of 19 (3.7) 516 (9.0) 14 (2.8) 487 (8.5) 36 (4.2) 486 (7.5) 32 (4.2) 486 (7.1)
Morocco 22 (4.3) 362 (16.8) 17 (3.9) 335 (24.8) 17 (2.6) 373 (37.6) 44 (4.9) 337 (11.0)
Netherlands 2 (1.2) ~ ~ 6 (1.8) 566 (5.9) 17 (3.5) 563 (4.5) 76 (3.9) 551 (3.2)
New Zealand 5 (1.8) 568 (14.8) 8 (2.1) 531 (18.8) 22 (3.3) 543 (9.0) 65 (3.6) 521 (4.3)
Norway 0 (0.0) ~ ~ 7 (2.5) 514 (14.3) 38 (4.4) 501 (5.7) 56 (4.8) 497 (4.0)
Romania 6 (2.1) 515 (13.4) 9 (2.3) 533 (14.8) 20 (3.2) 512 (10.0) 65 (3.8) 508 (6.2)
Russian Federation 7 (1.8) 563 (10.8) 20 (2.9) 542 (4.8) 33 (3.6) 532 (5.7) 41 (3.8) 514 (8.5)
Scotland 2 (1.2) ~ ~ 6 (2.5) 531 (26.5) 10 (3.1) 550 (7.7) 82 (4.1) 524 (4.1)
Singapore 63 (3.5) 534 (6.7) 28 (3.5) 526 (10.0) 8 (2.0) 480 (15.1) 1 (0.8) ~ ~
Slovak Republic 1 (1.0) ~ ~ 0 (0.0) ~ ~ 4 (1.8) 545 (8.7) 95 (2.1) 518 (3.0)
Slovenia 61 (4.3) 501 (2.8) 14 (3.2) 509 (6.0) 14 (3.0) 504 (5.8) 11 (2.5) 489 (5.5)
Sweden 12 (3.1) 559 (5.1) 34 (4.8) 565 (3.4) 36 (5.0) 561 (4.1) 18 (3.8) 555 (8.0)
Turkey 2 (1.3) ~ ~ 1 (0.7) ~ ~ 5 (2.1) 494 (15.1) 92 (2.5) 447 (3.7)
United States 47 (4.4) 556 (6.1) 23 (3.5) 536 (9.1) 14 (3.0) 531 (11.1) 16 (3.1) 530 (9.7)
International Avg. 14 (0.5) 500 (2.4) 12 (0.5) 511 (2.2) 19 (0.6) 506 (2.0) 55 (0.6) 493 (2.4)
More than 75%Begin School with Skills
51-75%Begin School with Skills
Countries
Less than 25%Begin School with Skills
25-50%Begin School with Skills
Percent ofStudents
AverageAchievement
Percent ofStudents
AverageAchievement
Percent ofStudents
AverageAchievement
Percent ofStudents
AverageAchievement
( ) Standard errors appear in parentheses. Because results are rounded to the nearest wholenumber, some totals may appear inconsistent.
An “r” indicates data are available for 70-84% of the students. An “s” indicates data areavailable for 50-69% of the students. An “x” indicates data are available for less than 50% of the students.
A dash (–) indicates data are not available. A tilde (~) indicates insufficient data to reportachievement.
SOU
RCE:
IEA
Pro
gres
s in
Inte
rnat
iona
l Rea
ding
Lite
racy
Stu
dy (P
IRLS
) 200
1.
ISC 4th GradePIRLS 2001
*Based on principals’ responses to questions about how many of the studentsin their schools can do the following when they begin the first year of formalschooling: recognize most of the letters of the alphabet; write letters of thealphabet; read some words; write some words; and read sentences (seeExhibit 5.4 for details of these items). Average is computed across the 5 items
based on a 4-point scale: Less than 25% = 1, 25-50% = 2, 51-75% = 3, andMore than 75% = 4. More than 75% indicates an average response score ofgreater than 3.25 through 4. 51-75% indicates an average of greater than2.5 through 3.25. 25-50% indicates an average of 1.75 through 2.5. Lessthan 25% indicates an average of 1 to less than 1.75.
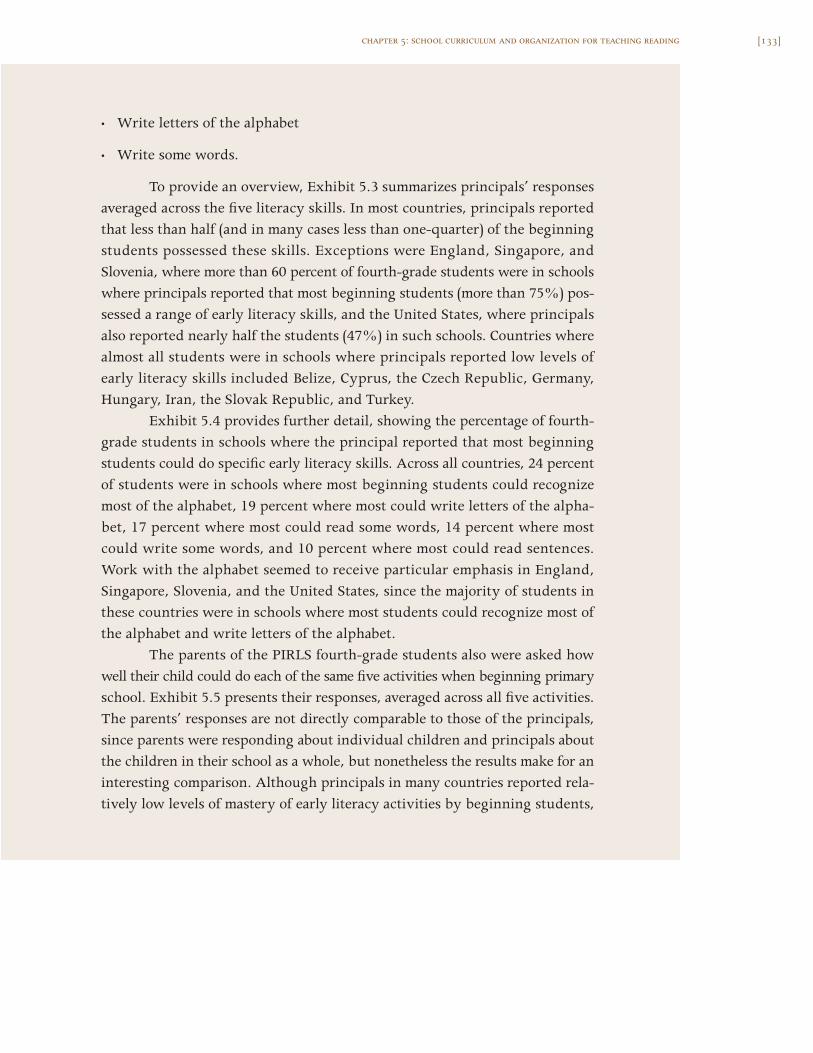
[133]chapter 5: school curriculum and organization for teaching reading
• Write letters of the alphabet
• Write some words.
To provide an overview, Exhibit 5.3 summarizes principals’ responsesaveraged across the five literacy skills. In most countries, principals reportedthat less than half (and in many cases less than one-quarter) of the beginningstudents possessed these skills. Exceptions were England, Singapore, andSlovenia, where more than 60 percent of fourth-grade students were in schoolswhere principals reported that most beginning students (more than 75%) pos-sessed a range of early literacy skills, and the United States, where principalsalso reported nearly half the students (47%) in such schools. Countries wherealmost all students were in schools where principals reported low levels ofearly literacy skills included Belize, Cyprus, the Czech Republic, Germany,Hungary, Iran, the Slovak Republic, and Turkey.
Exhibit 5.4 provides further detail, showing the percentage of fourth-grade students in schools where the principal reported that most beginningstudents could do specific early literacy skills. Across all countries, 24 percentof students were in schools where most beginning students could recognizemost of the alphabet, 19 percent where most could write letters of the alpha-bet, 17 percent where most could read some words, 14 percent where mostcould write some words, and 10 percent where most could read sentences.Work with the alphabet seemed to receive particular emphasis in England,Singapore, Slovenia, and the United States, since the majority of students inthese countries were in schools where most students could recognize most ofthe alphabet and write letters of the alphabet.
The parents of the PIRLS fourth-grade students also were asked howwell their child could do each of the same five activities when beginning primaryschool. Exhibit 5.5 presents their responses, averaged across all five activities.The parents’ responses are not directly comparable to those of the principals,since parents were responding about individual children and principals aboutthe children in their school as a whole, but nonetheless the results make for aninteresting comparison. Although principals in many countries reported rela-tively low levels of mastery of early literacy activities by beginning students,
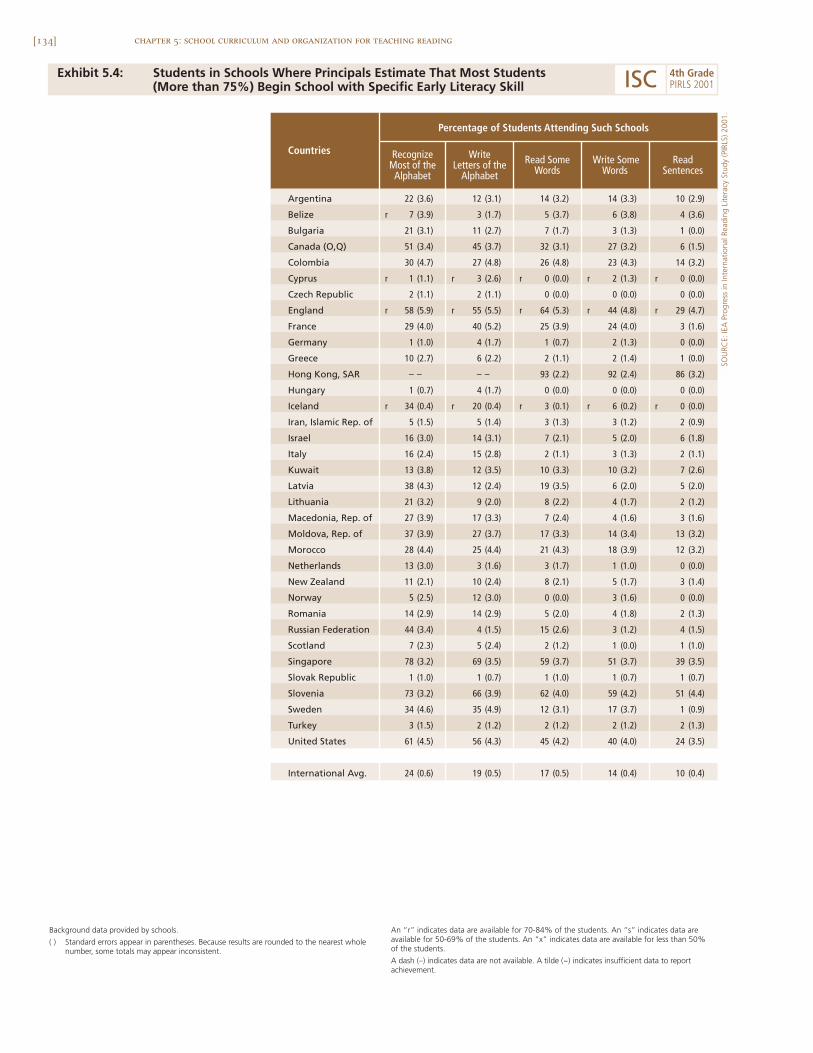
[134] chapter 5: school curriculum and organization for teaching reading
Exhibit 5.4: Students in Schools Where Principals Estimate That Most Students(More than 75%) Begin School with Specific Early Literacy Skill
Argentina 22 (3.6) 12 (3.1) 14 (3.2) 14 (3.3) 10 (2.9)
Belize r 7 (3.9) 3 (1.7) 5 (3.7) 6 (3.8) 4 (3.6)
Bulgaria 21 (3.1) 11 (2.7) 7 (1.7) 3 (1.3) 1 (0.0)
Canada (O,Q) 51 (3.4) 45 (3.7) 32 (3.1) 27 (3.2) 6 (1.5)
Colombia 30 (4.7) 27 (4.8) 26 (4.8) 23 (4.3) 14 (3.2)
Cyprus r 1 (1.1) r 3 (2.6) r 0 (0.0) r 2 (1.3) r 0 (0.0)
Czech Republic 2 (1.1) 2 (1.1) 0 (0.0) 0 (0.0) 0 (0.0)
England r 58 (5.9) r 55 (5.5) r 64 (5.3) r 44 (4.8) r 29 (4.7)
France 29 (4.0) 40 (5.2) 25 (3.9) 24 (4.0) 3 (1.6)
Germany 1 (1.0) 4 (1.7) 1 (0.7) 2 (1.3) 0 (0.0)
Greece 10 (2.7) 6 (2.2) 2 (1.1) 2 (1.4) 1 (0.0)
Hong Kong, SAR – – – – 93 (2.2) 92 (2.4) 86 (3.2)
Hungary 1 (0.7) 4 (1.7) 0 (0.0) 0 (0.0) 0 (0.0)
Iceland r 34 (0.4) r 20 (0.4) r 3 (0.1) r 6 (0.2) r 0 (0.0)
Iran, Islamic Rep. of 5 (1.5) 5 (1.4) 3 (1.3) 3 (1.2) 2 (0.9)
Israel 16 (3.0) 14 (3.1) 7 (2.1) 5 (2.0) 6 (1.8)
Italy 16 (2.4) 15 (2.8) 2 (1.1) 3 (1.3) 2 (1.1)
Kuwait 13 (3.8) 12 (3.5) 10 (3.3) 10 (3.2) 7 (2.6)
Latvia 38 (4.3) 12 (2.4) 19 (3.5) 6 (2.0) 5 (2.0)
Lithuania 21 (3.2) 9 (2.0) 8 (2.2) 4 (1.7) 2 (1.2)
Macedonia, Rep. of 27 (3.9) 17 (3.3) 7 (2.4) 4 (1.6) 3 (1.6)
Moldova, Rep. of 37 (3.9) 27 (3.7) 17 (3.3) 14 (3.4) 13 (3.2)
Morocco 28 (4.4) 25 (4.4) 21 (4.3) 18 (3.9) 12 (3.2)
Netherlands 13 (3.0) 3 (1.6) 3 (1.7) 1 (1.0) 0 (0.0)
New Zealand 11 (2.1) 10 (2.4) 8 (2.1) 5 (1.7) 3 (1.4)
Norway 5 (2.5) 12 (3.0) 0 (0.0) 3 (1.6) 0 (0.0)
Romania 14 (2.9) 14 (2.9) 5 (2.0) 4 (1.8) 2 (1.3)
Russian Federation 44 (3.4) 4 (1.5) 15 (2.6) 3 (1.2) 4 (1.5)
Scotland 7 (2.3) 5 (2.4) 2 (1.2) 1 (0.0) 1 (1.0)
Singapore 78 (3.2) 69 (3.5) 59 (3.7) 51 (3.7) 39 (3.5)
Slovak Republic 1 (1.0) 1 (0.7) 1 (1.0) 1 (0.7) 1 (0.7)
Slovenia 73 (3.2) 66 (3.9) 62 (4.0) 59 (4.2) 51 (4.4)
Sweden 34 (4.6) 35 (4.9) 12 (3.1) 17 (3.7) 1 (0.9)
Turkey 3 (1.5) 2 (1.2) 2 (1.2) 2 (1.2) 2 (1.3)
United States 61 (4.5) 56 (4.3) 45 (4.2) 40 (4.0) 24 (3.5)
International Avg. 24 (0.6) 19 (0.5) 17 (0.5) 14 (0.4) 10 (0.4)
WriteLetters of the
Alphabet
Percentage of Students Attending Such Schools
Countries RecognizeMost of theAlphabet
Read SomeWords
Write SomeWords
ReadSentences
Background data provided by schools.
( ) Standard errors appear in parentheses. Because results are rounded to the nearest wholenumber, some totals may appear inconsistent.
An “r” indicates data are available for 70-84% of the students. An “s” indicates data areavailable for 50-69% of the students. An “x” indicates data are available for less than 50% of the students.
A dash (–) indicates data are not available. A tilde (~) indicates insufficient data to reportachievement.
SOU
RCE:
IEA
Pro
gres
s in
Inte
rnat
iona
l Rea
ding
Lite
racy
Stu
dy (P
IRLS
) 200
1.
ISC 4th GradePIRLS 2001

[135]chapter 5: school curriculum and organization for teaching reading
Exhibit 5.5: Students Based on Parents’ Reports of How Well They Could Do EarlyLiteracy Activities Beginning School*
SOU
RCE:
IEA
Pro
gres
s in
Inte
rnat
iona
l Rea
ding
Lite
racy
Stu
dy (P
IRLS
) 200
1.
( ) Standard errors appear in parentheses. Because results are rounded to the nearest wholenumber, some totals may appear inconsistent.
An “r” indicates data are available for 70-84% of the students. An “s” indicates data areavailable for 50-69% of the students. An “x” indicates data are available for less than 50% of the students.
A dash (–) indicates data are not available. A tilde (~) indicates insufficient data to reportachievement.
ISC 4th GradePIRLS 2001
Argentina s 18 (0.9) 464 (7.0) 37 (1.5) 440 (6.7) 31 (1.3) 413 (6.9) 13 (1.9) 393 (9.1)
Belize s 17 (1.1) 392 (8.6) 30 (1.3) 344 (6.8) 34 (1.4) 316 (6.1) 19 (1.6) 276 (6.5)
Bulgaria 29 (1.1) 590 (4.0) 32 (1.0) 559 (3.5) 23 (1.0) 538 (4.3) 16 (1.8) 501 (9.4)
Canada (O,Q) r 32 (1.0) 579 (2.8) 38 (0.8) 546 (2.5) 24 (0.8) 527 (3.0) 6 (0.4) 519 (6.0)
Colombia r 23 (1.2) 456 (6.7) 33 (1.3) 434 (5.0) 28 (1.2) 411 (5.2) 16 (1.2) 395 (5.3)
Cyprus s 21 (0.9) 515 (5.1) 29 (0.9) 490 (4.3) 29 (1.2) 481 (5.3) 21 (1.1) 490 (6.7)
Czech Republic 8 (0.5) 568 (5.6) 19 (0.8) 552 (3.7) 36 (1.0) 536 (2.8) 37 (1.1) 532 (3.0)
England s 29 (1.3) 602 (5.3) 43 (1.3) 572 (3.9) 22 (1.2) 543 (6.5) 6 (0.7) 523 (8.2)
France 24 (0.9) 548 (3.8) 41 (1.1) 530 (2.5) 28 (1.0) 514 (4.2) 6 (0.5) 498 (6.7)
Germany 11 (0.4) 554 (3.5) 29 (0.8) 543 (2.4) 35 (0.7) 542 (2.2) 24 (0.7) 541 (3.2)
Greece 39 (1.0) 540 (3.4) 31 (1.3) 518 (5.5) 19 (1.2) 518 (4.4) 11 (0.9) 513 (7.4)
Hong Kong, SAR – – – – – – – – – – – – – – – –
Hungary 9 (0.6) 585 (5.1) 17 (0.7) 553 (4.1) 33 (0.9) 541 (2.6) 41 (0.9) 538 (2.6)
Iceland r 17 (0.7) 565 (3.4) 28 (0.9) 523 (2.5) 37 (0.9) 505 (2.3) 18 (0.6) 487 (2.9)
Iran, Islamic Rep. of 25 (0.9) 451 (4.9) 30 (1.1) 417 (4.9) 20 (0.9) 411 (6.7) 25 (1.7) 381 (6.3)
Israel x x x x x x x x x x x x x x x x
Italy 16 (0.9) 568 (4.0) 36 (0.9) 546 (3.1) 32 (0.9) 534 (3.1) 16 (0.6) 535 (3.4)
Kuwait r 14 (0.5) 430 (5.6) 25 (0.7) 412 (5.0) 32 (0.6) 399 (4.5) 29 (0.6) 381 (5.6)
Latvia 23 (1.1) 580 (3.1) 42 (0.9) 550 (2.8) 28 (1.1) 525 (3.8) 6 (0.7) 503 (6.5)
Lithuania 23 (1.1) 578 (3.5) 39 (1.3) 550 (2.7) 26 (1.0) 523 (3.6) 12 (0.6) 500 (4.8)
Macedonia, Rep. of r 39 (1.2) 471 (5.9) 34 (1.2) 452 (6.0) 19 (0.9) 426 (7.9) 7 (1.0) 406 (12.5)
Moldova, Rep. of 12 (0.8) 520 (5.3) 28 (1.1) 511 (5.4) 36 (1.3) 483 (4.4) 23 (1.6) 471 (5.6)
Morocco – – – – – – – – – – – – – – – –
Netherlands s 11 (0.7) 585 (5.3) 29 (1.0) 565 (3.3) 37 (1.0) 559 (3.0) 23 (1.1) 559 (3.3)
New Zealand r 23 (1.1) 558 (5.4) 40 (1.3) 543 (4.6) 28 (1.1) 526 (5.4) 9 (0.8) 497 (8.2)
Norway 19 (0.7) 551 (4.9) 37 (1.2) 511 (2.9) 31 (1.1) 480 (4.2) 13 (0.7) 459 (6.1)
Romania 18 (1.2) 551 (5.6) 29 (1.3) 529 (4.9) 32 (1.4) 503 (6.7) 21 (1.4) 479 (7.4)
Russian Federation 14 (0.9) 566 (3.6) 30 (1.3) 543 (3.7) 33 (1.1) 517 (4.5) 24 (1.7) 501 (9.1)
Scotland s 11 (0.7) 565 (7.6) 41 (1.1) 545 (4.9) 35 (1.2) 538 (4.6) 13 (1.0) 527 (8.2)
Singapore 50 (1.6) 569 (4.0) 38 (1.0) 511 (4.4) 11 (0.8) 440 (7.8) 1 (0.2) ~ ~
Slovak Republic 7 (0.5) 546 (5.7) 19 (0.8) 535 (5.0) 38 (0.8) 519 (3.0) 36 (1.0) 511 (3.4)
Slovenia 27 (1.0) 543 (2.9) 37 (1.1) 504 (2.2) 26 (1.0) 477 (3.6) 11 (0.7) 469 (5.3)
Sweden 28 (0.7) 595 (2.8) 35 (0.6) 563 (2.6) 28 (0.8) 545 (2.9) 9 (0.5) 530 (4.6)
Turkey 22 (1.1) 474 (4.9) 29 (1.1) 451 (4.2) 25 (1.1) 444 (4.9) 24 (1.4) 437 (6.0)
United States – – – – – – – – – – – – – – – –
International Avg. 21 (0.2) 537 (0.9) 33 (0.2) 511 (0.7) 29 (0.2) 491 (0.9) 17 (0.2) 478 (1.2)
Countries
Not Very Well Not at AllVery Well Moderately Well
Percent ofStudents
AverageAchievement
Percent ofStudents
AverageAchievement
Percent ofStudents
AverageAchievement
Percent ofStudents
AverageAchievement
*Based on parents’ responses to questions about how well their child could dothe following when he/she began primary school: Recognize most of the lettersof the alphabet; write letters of the alphabet; read some words; write somewords; and read sentences (see Exhibit 5.6 for details of these items). Averageis computed across the 5 items based on a 4-point scale: Not at all = 1,
Not very well = 2, Moderately well = 3, and Very well = 4. Very well indicatesan average response score of greater than 3.25 through 4. Moderately wellindicates an average of greater than 2.5 through 3.25. Not very well indicatesan average of 1.75 through 2.5. Not at all indicates an average of 1 to lessthan 1.75.
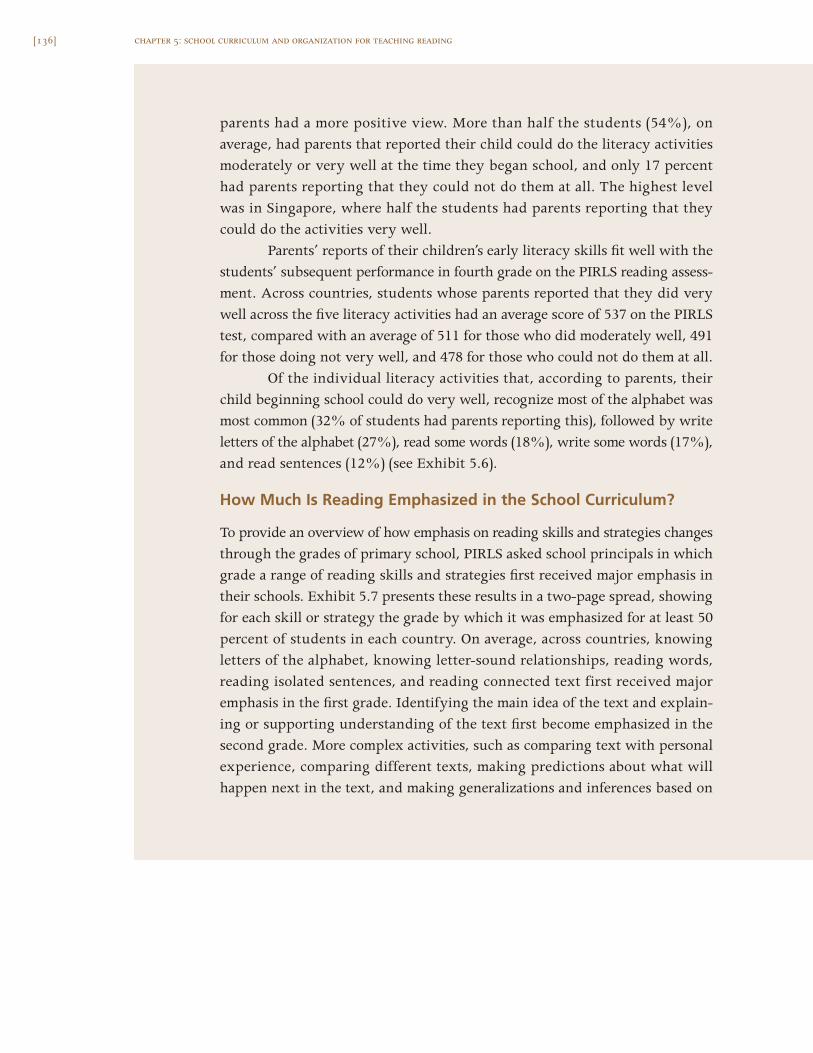
[136] chapter 5: school curriculum and organization for teaching reading
parents had a more positive view. More than half the students (54%), onaverage, had parents that reported their child could do the literacy activitiesmoderately or very well at the time they began school, and only 17 percenthad parents reporting that they could not do them at all. The highest levelwas in Singapore, where half the students had parents reporting that theycould do the activities very well.
Parents’ reports of their children’s early literacy skills fit well with thestudents’ subsequent performance in fourth grade on the PIRLS reading assess-ment. Across countries, students whose parents reported that they did verywell across the five literacy activities had an average score of 537 on the PIRLStest, compared with an average of 511 for those who did moderately well, 491for those doing not very well, and 478 for those who could not do them at all.
Of the individual literacy activities that, according to parents, theirchild beginning school could do very well, recognize most of the alphabet wasmost common (32% of students had parents reporting this), followed by writeletters of the alphabet (27%), read some words (18%), write some words (17%),and read sentences (12%) (see Exhibit 5.6).
How Much Is Reading Emphasized in the School Curriculum?
To provide an overview of how emphasis on reading skills and strategies changesthrough the grades of primary school, PIRLS asked school principals in whichgrade a range of reading skills and strategies first received major emphasis intheir schools. Exhibit 5.7 presents these results in a two-page spread, showingfor each skill or strategy the grade by which it was emphasized for at least 50percent of students in each country. On average, across countries, knowingletters of the alphabet, knowing letter-sound relationships, reading words,reading isolated sentences, and reading connected text first received majoremphasis in the first grade. Identifying the main idea of the text and explain-ing or supporting understanding of the text first become emphasized in thesecond grade. More complex activities, such as comparing text with personalexperience, comparing different texts, making predictions about what willhappen next in the text, and making generalizations and inferences based on
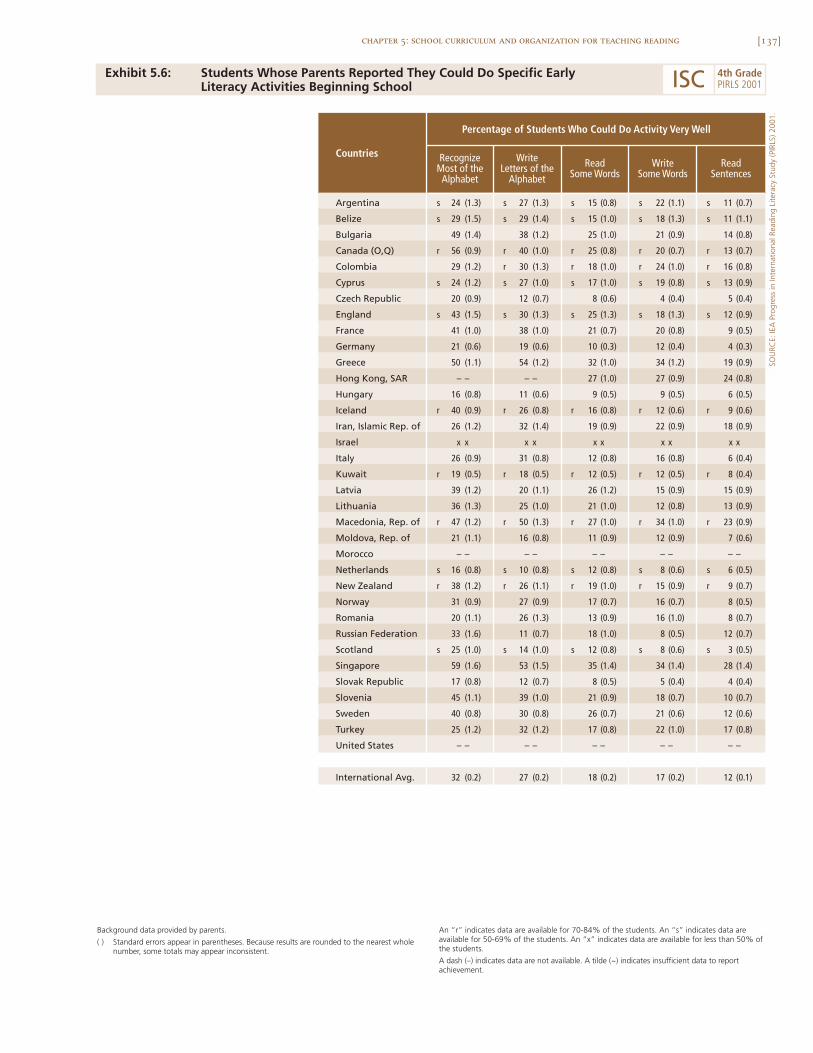
[137]chapter 5: school curriculum and organization for teaching reading
Exhibit 5.6: Students Whose Parents Reported They Could Do Specific EarlyLiteracy Activities Beginning School
SOU
RCE:
IEA
Pro
gres
s in
Inte
rnat
iona
l Rea
ding
Lite
racy
Stu
dy (P
IRLS
) 200
1.
Argentina s 24 (1.3) s 27 (1.3) s 15 (0.8) s 22 (1.1) s 11 (0.7)
Belize s 29 (1.5) s 29 (1.4) s 15 (1.0) s 18 (1.3) s 11 (1.1)
Bulgaria 49 (1.4) 38 (1.2) 25 (1.0) 21 (0.9) 14 (0.8)
Canada (O,Q) r 56 (0.9) r 40 (1.0) r 25 (0.8) r 20 (0.7) r 13 (0.7)
Colombia 29 (1.2) r 30 (1.3) r 18 (1.0) r 24 (1.0) r 16 (0.8)
Cyprus s 24 (1.2) s 27 (1.0) s 17 (1.0) s 19 (0.8) s 13 (0.9)
Czech Republic 20 (0.9) 12 (0.7) 8 (0.6) 4 (0.4) 5 (0.4)
England s 43 (1.5) s 30 (1.3) s 25 (1.3) s 18 (1.3) s 12 (0.9)
France 41 (1.0) 38 (1.0) 21 (0.7) 20 (0.8) 9 (0.5)
Germany 21 (0.6) 19 (0.6) 10 (0.3) 12 (0.4) 4 (0.3)
Greece 50 (1.1) 54 (1.2) 32 (1.0) 34 (1.2) 19 (0.9)
Hong Kong, SAR – – – – 27 (1.0) 27 (0.9) 24 (0.8)
Hungary 16 (0.8) 11 (0.6) 9 (0.5) 9 (0.5) 6 (0.5)
Iceland r 40 (0.9) r 26 (0.8) r 16 (0.8) r 12 (0.6) r 9 (0.6)
Iran, Islamic Rep. of 26 (1.2) 32 (1.4) 19 (0.9) 22 (0.9) 18 (0.9)
Israel x x x x x x x x x x
Italy 26 (0.9) 31 (0.8) 12 (0.8) 16 (0.8) 6 (0.4)
Kuwait r 19 (0.5) r 18 (0.5) r 12 (0.5) r 12 (0.5) r 8 (0.4)
Latvia 39 (1.2) 20 (1.1) 26 (1.2) 15 (0.9) 15 (0.9)
Lithuania 36 (1.3) 25 (1.0) 21 (1.0) 12 (0.8) 13 (0.9)
Macedonia, Rep. of r 47 (1.2) r 50 (1.3) r 27 (1.0) r 34 (1.0) r 23 (0.9)
Moldova, Rep. of 21 (1.1) 16 (0.8) 11 (0.9) 12 (0.9) 7 (0.6)
Morocco – – – – – – – – – –
Netherlands s 16 (0.8) s 10 (0.8) s 12 (0.8) s 8 (0.6) s 6 (0.5)
New Zealand r 38 (1.2) r 26 (1.1) r 19 (1.0) r 15 (0.9) r 9 (0.7)
Norway 31 (0.9) 27 (0.9) 17 (0.7) 16 (0.7) 8 (0.5)
Romania 20 (1.1) 26 (1.3) 13 (0.9) 16 (1.0) 8 (0.7)
Russian Federation 33 (1.6) 11 (0.7) 18 (1.0) 8 (0.5) 12 (0.7)
Scotland s 25 (1.0) s 14 (1.0) s 12 (0.8) s 8 (0.6) s 3 (0.5)
Singapore 59 (1.6) 53 (1.5) 35 (1.4) 34 (1.4) 28 (1.4)
Slovak Republic 17 (0.8) 12 (0.7) 8 (0.5) 5 (0.4) 4 (0.4)
Slovenia 45 (1.1) 39 (1.0) 21 (0.9) 18 (0.7) 10 (0.7)
Sweden 40 (0.8) 30 (0.8) 26 (0.7) 21 (0.6) 12 (0.6)
Turkey 25 (1.2) 32 (1.2) 17 (0.8) 22 (1.0) 17 (0.8)
United States – – – – – – – – – –
International Avg. 32 (0.2) 27 (0.2) 18 (0.2) 17 (0.2) 12 (0.1)
WriteLetters of the
Alphabet
Percentage of Students Who Could Do Activity Very Well
Countries RecognizeMost of theAlphabet
ReadSome Words
WriteSome Words
ReadSentences
ISC 4th GradePIRLS 2001
Background data provided by parents.
( ) Standard errors appear in parentheses. Because results are rounded to the nearest wholenumber, some totals may appear inconsistent.
An “r” indicates data are available for 70-84% of the students. An “s” indicates data areavailable for 50-69% of the students. An “x” indicates data are available for less than 50% ofthe students.
A dash (–) indicates data are not available. A tilde (~) indicates insufficient data to reportachievement.
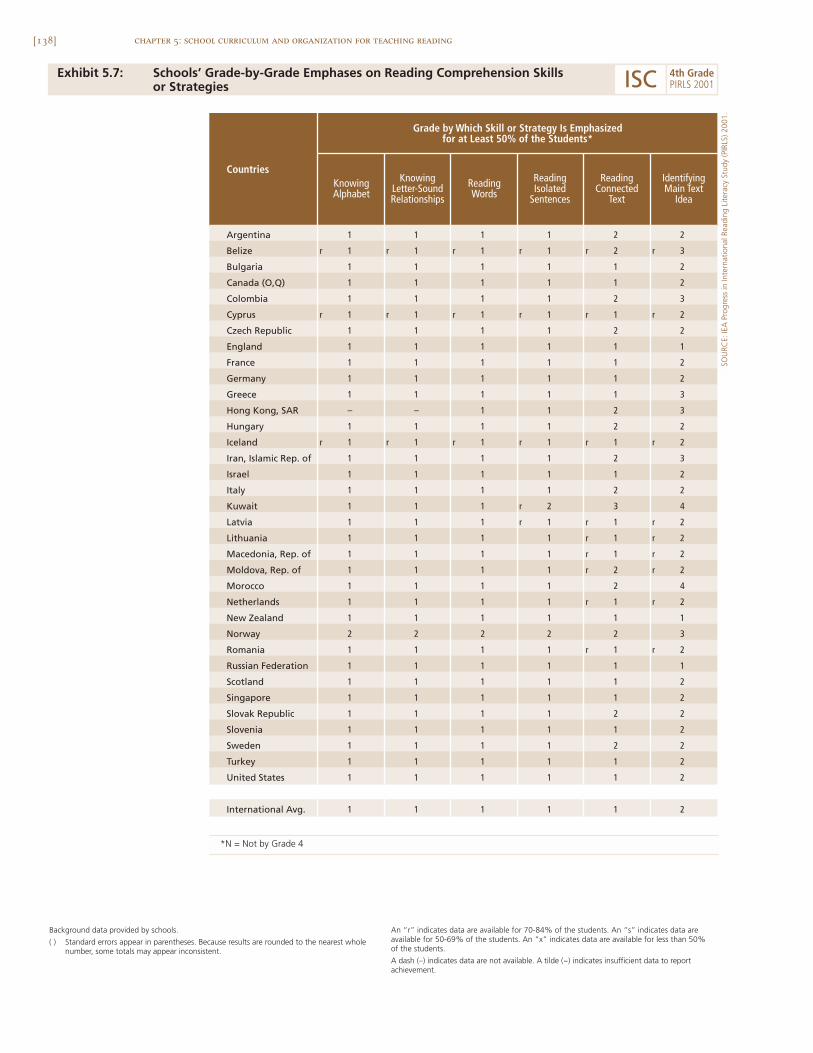
[138] chapter 5: school curriculum and organization for teaching reading
Exhibit 5.7: Schools’ Grade-by-Grade Emphases on Reading Comprehension Skillsor Strategies
Argentina
Belize
Bulgaria
Canada (O,Q)
Colombia
Cyprus
Czech Republic
England
France
Germany
Greece
Hong Kong, SAR
Hungary
Iceland
Iran, Islamic Rep. of
Israel
Italy
Kuwait
Latvia
Lithuania
Macedonia, Rep. of
Moldova, Rep. of
Morocco
Netherlands
New Zealand
Norway
Romania
Russian Federation
Scotland
Singapore
Slovak Republic
Slovenia
Sweden
Turkey
United States
International Avg.
Grade by Which Skill or Strategy Is Emphasizedfor at Least 50% of the Students*
Countries
1 1 1 1 2 2
r 1 r 1 r 1 r 1 r 2 r 3
1 1 1 1 1 2
1 1 1 1 1 2
1 1 1 1 2 3
r 1 r 1 r 1 r 1 r 1 r 2
1 1 1 1 2 2
1 1 1 1 1 1
1 1 1 1 1 2
1 1 1 1 1 2
1 1 1 1 1 3
– – 1 1 2 3
1 1 1 1 2 2
r 1 r 1 r 1 r 1 r 1 r 2
1 1 1 1 2 3
1 1 1 1 1 2
1 1 1 1 2 2
1 1 1 r 2 3 4
1 1 1 r 1 r 1 r 2
1 1 1 1 r 1 r 2
1 1 1 1 r 1 r 2
1 1 1 1 r 2 r 2
1 1 1 1 2 4
1 1 1 1 r 1 r 2
1 1 1 1 1 1
2 2 2 2 2 3
1 1 1 1 r 1 r 2
1 1 1 1 1 1
1 1 1 1 1 2
1 1 1 1 1 2
1 1 1 1 2 2
1 1 1 1 1 2
1 1 1 1 2 2
1 1 1 1 1 2
1 1 1 1 1 2
1 1 1 1 1 2
IdentifyingMain Text
Idea
KnowingAlphabet
KnowingLetter-SoundRelationships
ReadingWords
ReadingIsolated
Sentences
ReadingConnected
Text
Background data provided by schools.
( ) Standard errors appear in parentheses. Because results are rounded to the nearest wholenumber, some totals may appear inconsistent.
An “r” indicates data are available for 70-84% of the students. An “s” indicates data areavailable for 50-69% of the students. An “x” indicates data are available for less than 50% of the students.
A dash (–) indicates data are not available. A tilde (~) indicates insufficient data to reportachievement.
SOU
RCE:
IEA
Pro
gres
s in
Inte
rnat
iona
l Rea
ding
Lite
racy
Stu
dy (P
IRLS
) 200
1.
ISC 4th GradePIRLS 2001
*N = Not by Grade 4
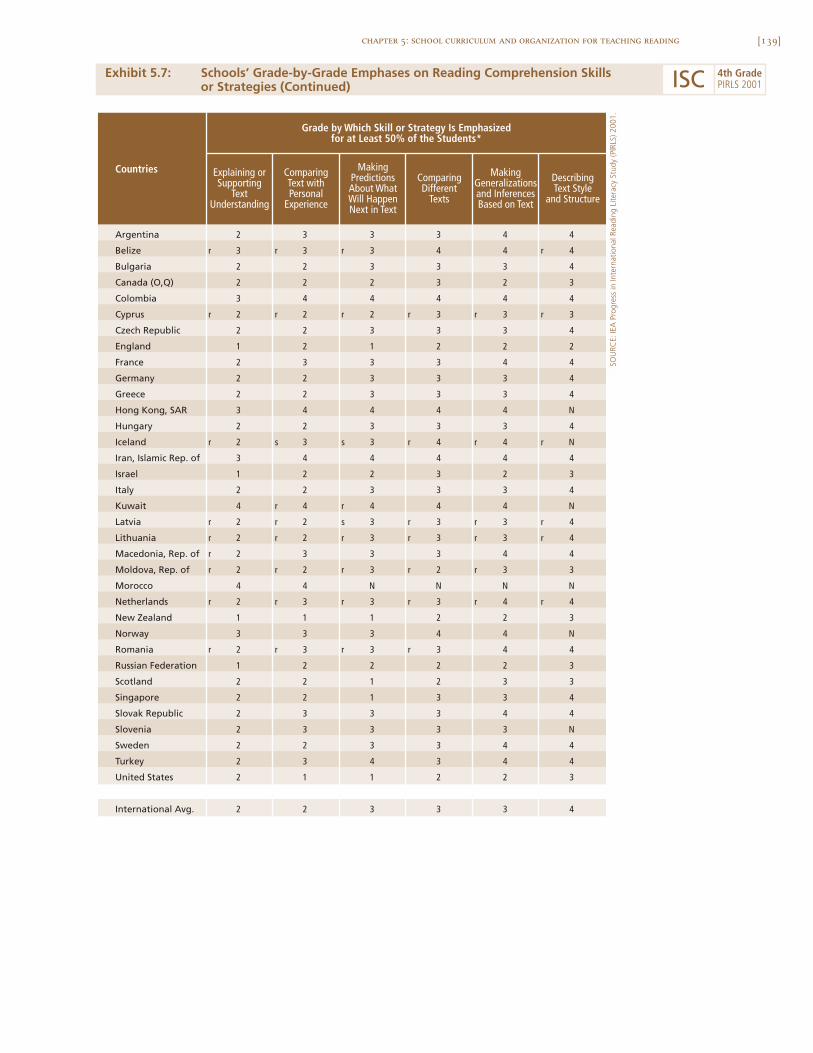
[139]chapter 5: school curriculum and organization for teaching reading
Exhibit 5.7: Schools’ Grade-by-Grade Emphases on Reading Comprehension Skillsor Strategies (Continued)
SOU
RCE:
IEA
Pro
gres
s in
Inte
rnat
iona
l Rea
ding
Lite
racy
Stu
dy (P
IRLS
) 200
1.
Argentina 2 3
Belize r 3 r 3 r r
Bulgaria 2 2
Canada (O,Q) 2 2
Colombia 3 4
Cyprus r 2 r 2 r r r r
Czech Republic 2 2
England 1 2
France 2 3
Germany 2 2
Greece 2 2
Hong Kong, SAR 3 4 N
Hungary 2 2
Iceland r 2 s 3 s r r r N
Iran, Islamic Rep. of 3 4
Israel 1 2
Italy 2 2
Kuwait 4 r 4 r N
Latvia r 2 r 2 s r r r
Lithuania r 2 r 2 r r r r
Macedonia, Rep. of r 2 3
Moldova, Rep. of r 2 r 2 r r r
Morocco 4 4 N N N N
Netherlands r 2 r 3 r r r r
New Zealand 1 1
Norway 3 3 N
Romania r 2 r 3 r r
Russian Federation 1 2
Scotland 2 2
Singapore 2 2
Slovak Republic 2 3
Slovenia 2 3 N
Sweden 2 2
Turkey 2 3
United States 2 1
International Avg. 2 2 3
Grade by Which Skill or Strategy Is Emphasizedfor at Least 50% of the Students*
Explaining orSupporting
TextUnderstanding
ComparingText withPersonal
Experience
Countries MakingPredictionsAbout WhatWill HappenNext in Text
ComparingDifferent
Texts
MakingGeneralizationsand InferencesBased on Text
DescribingText Style
and Structure
3
3
3
2
4
2
3
1
3
3
3
4
3
3
4
2
3
4
3
3
3
3
3
1
3
3
2
1
1
3
3
3
4
1
3
2
4
3
2
2
3
3
3
3
3
2
3
3
4
3
3
4
3
3
2
3
3
3
4
3
4
4
3
3
4
3
3
3
2
4
2
4
4
2
3
3
4
3
4
4
2
3
4
4
3
2
4
3
3
2
4
3
3
4
3
4
4
2
3
4
3
3
4
3
4
4
3
4
4
4
4
3
4
3
4
3
3
4
4
4
4
3
4
4
4
4
3
4
3
4
2
4
4
4
ISC 4th GradePIRLS 2001
[140] chapter 5: school curriculum and organization for teaching reading
the text did not receive major emphasis until the third grade in most coun-tries. Describing text style and structure first got major emphasis in some coun-tries at fourth grade, but for many others it was an activity that occurred moreoften at higher grade levels.
To further explore schools’ emphasis on reading in the curriculum,PIRLS asked teachers how often they had their fourth-grade students do arange of classroom activities to help develop reading comprehension skills orstrategies. Exhibit 5.8 presents the percent of students in classes where teach-ers asked them to do these activities at least weekly. On average, across coun-tries, the most commonly used classroom activities for students were identifyingthe main idea and explaining or supporting their understanding of what theyhad read, with 90 percent of students in classes where the teacher asked themto do each of these at least weekly. Next most common was comparing whatthey had read with their own experiences (73%), and making generalizationsand drawing inferences (71%), followed by making predictions about whatwill happen next (61%), compare what they had read with other things theyhad read (59%), and describing text style or structure (52%).
Schools may have a range of policies and procedures in place to promotereading instruction throughout the school. According to principals’ reportssummarized in Exhibit 5.9, schools varied widely in the extent to which theyhad a policy to coordinate reading instruction across the primary school grades(grades 4 and below). In Argentina, Bulgaria, England, Hungary, Iceland,Macedonia, the Russian Federation, Scotland, and the United States a policyof coordination was quite common, with more than 70 percent of students inschools that coordinate reading instruction, whereas coordination across thegrades was much less frequently reported in Germany, Norway, and the SlovakRepublic, where less than 30 percent of students attended such schools.
Having its own written statement of the reading curriculum to betaught in the school was not very common except in England, Israel, NewZealand, Scotland, and the United States, where more than 70 percent of stu-dents attended schools with such a statement, compared with just 37 percentof students, on average, internationally. A more usual practice was to haveinformal initiatives such as book clubs, independent reading contests, and
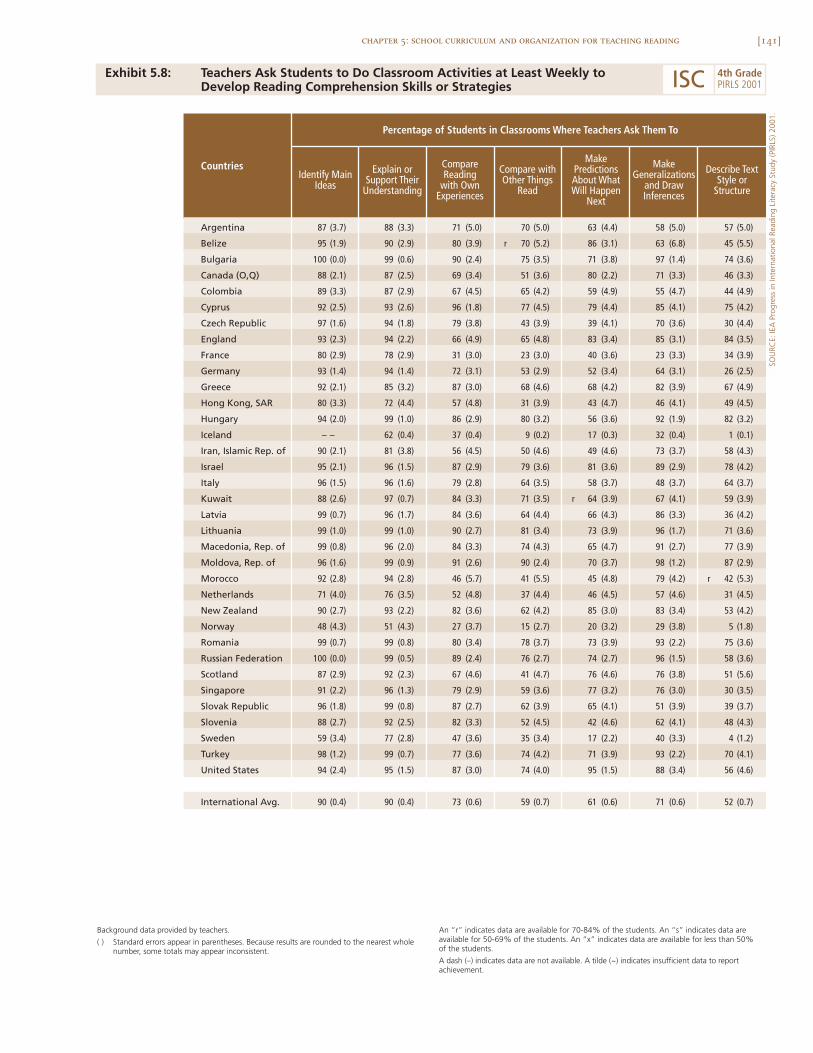
[141]chapter 5: school curriculum and organization for teaching reading
Exhibit 5.8: Teachers Ask Students to Do Classroom Activities at Least Weekly toDevelop Reading Comprehension Skills or Strategies
SOU
RCE:
IEA
Pro
gres
s in
Inte
rnat
iona
l Rea
ding
Lite
racy
Stu
dy (P
IRLS
) 200
1.
Argentina 87 (3.7) 88 (3.3) 71 (5.0) 70 (5.0) 63 (4.4) 58 (5.0) 57 (5.0)
Belize 95 (1.9) 90 (2.9) 80 (3.9) r 70 (5.2) 86 (3.1) 63 (6.8) 45 (5.5)
Bulgaria 100 (0.0) 99 (0.6) 90 (2.4) 75 (3.5) 71 (3.8) 97 (1.4) 74 (3.6)
Canada (O,Q) 88 (2.1) 87 (2.5) 69 (3.4) 51 (3.6) 80 (2.2) 71 (3.3) 46 (3.3)
Colombia 89 (3.3) 87 (2.9) 67 (4.5) 65 (4.2) 59 (4.9) 55 (4.7) 44 (4.9)
Cyprus 92 (2.5) 93 (2.6) 96 (1.8) 77 (4.5) 79 (4.4) 85 (4.1) 75 (4.2)
Czech Republic 97 (1.6) 94 (1.8) 79 (3.8) 43 (3.9) 39 (4.1) 70 (3.6) 30 (4.4)
England 93 (2.3) 94 (2.2) 66 (4.9) 65 (4.8) 83 (3.4) 85 (3.1) 84 (3.5)
France 80 (2.9) 78 (2.9) 31 (3.0) 23 (3.0) 40 (3.6) 23 (3.3) 34 (3.9)
Germany 93 (1.4) 94 (1.4) 72 (3.1) 53 (2.9) 52 (3.4) 64 (3.1) 26 (2.5)
Greece 92 (2.1) 85 (3.2) 87 (3.0) 68 (4.6) 68 (4.2) 82 (3.9) 67 (4.9)
Hong Kong, SAR 80 (3.3) 72 (4.4) 57 (4.8) 31 (3.9) 43 (4.7) 46 (4.1) 49 (4.5)
Hungary 94 (2.0) 99 (1.0) 86 (2.9) 80 (3.2) 56 (3.6) 92 (1.9) 82 (3.2)
Iceland – – 62 (0.4) 37 (0.4) 9 (0.2) 17 (0.3) 32 (0.4) 1 (0.1)
Iran, Islamic Rep. of 90 (2.1) 81 (3.8) 56 (4.5) 50 (4.6) 49 (4.6) 73 (3.7) 58 (4.3)
Israel 95 (2.1) 96 (1.5) 87 (2.9) 79 (3.6) 81 (3.6) 89 (2.9) 78 (4.2)
Italy 96 (1.5) 96 (1.6) 79 (2.8) 64 (3.5) 58 (3.7) 48 (3.7) 64 (3.7)
Kuwait 88 (2.6) 97 (0.7) 84 (3.3) 71 (3.5) r 64 (3.9) 67 (4.1) 59 (3.9)
Latvia 99 (0.7) 96 (1.7) 84 (3.6) 64 (4.4) 66 (4.3) 86 (3.3) 36 (4.2)
Lithuania 99 (1.0) 99 (1.0) 90 (2.7) 81 (3.4) 73 (3.9) 96 (1.7) 71 (3.6)
Macedonia, Rep. of 99 (0.8) 96 (2.0) 84 (3.3) 74 (4.3) 65 (4.7) 91 (2.7) 77 (3.9)
Moldova, Rep. of 96 (1.6) 99 (0.9) 91 (2.6) 90 (2.4) 70 (3.7) 98 (1.2) 87 (2.9)
Morocco 92 (2.8) 94 (2.8) 46 (5.7) 41 (5.5) 45 (4.8) 79 (4.2) r 42 (5.3)
Netherlands 71 (4.0) 76 (3.5) 52 (4.8) 37 (4.4) 46 (4.5) 57 (4.6) 31 (4.5)
New Zealand 90 (2.7) 93 (2.2) 82 (3.6) 62 (4.2) 85 (3.0) 83 (3.4) 53 (4.2)
Norway 48 (4.3) 51 (4.3) 27 (3.7) 15 (2.7) 20 (3.2) 29 (3.8) 5 (1.8)
Romania 99 (0.7) 99 (0.8) 80 (3.4) 78 (3.7) 73 (3.9) 93 (2.2) 75 (3.6)
Russian Federation 100 (0.0) 99 (0.5) 89 (2.4) 76 (2.7) 74 (2.7) 96 (1.5) 58 (3.6)
Scotland 87 (2.9) 92 (2.3) 67 (4.6) 41 (4.7) 76 (4.6) 76 (3.8) 51 (5.6)
Singapore 91 (2.2) 96 (1.3) 79 (2.9) 59 (3.6) 77 (3.2) 76 (3.0) 30 (3.5)
Slovak Republic 96 (1.8) 99 (0.8) 87 (2.7) 62 (3.9) 65 (4.1) 51 (3.9) 39 (3.7)
Slovenia 88 (2.7) 92 (2.5) 82 (3.3) 52 (4.5) 42 (4.6) 62 (4.1) 48 (4.3)
Sweden 59 (3.4) 77 (2.8) 47 (3.6) 35 (3.4) 17 (2.2) 40 (3.3) 4 (1.2)
Turkey 98 (1.2) 99 (0.7) 77 (3.6) 74 (4.2) 71 (3.9) 93 (2.2) 70 (4.1)
United States 94 (2.4) 95 (1.5) 87 (3.0) 74 (4.0) 95 (1.5) 88 (3.4) 56 (4.6)
International Avg. 90 (0.4) 90 (0.4) 73 (0.6) 59 (0.7) 61 (0.6) 71 (0.6) 52 (0.7)
Percentage of Students in Classrooms Where Teachers Ask Them To
Compare withOther Things
Read
MakePredictionsAbout WhatWill Happen
Next
Describe TextStyle or
Structure
MakeGeneralizations
and DrawInferences
CountriesIdentify Main
Ideas
Explain orSupport Their
Understanding
CompareReading
with OwnExperiences
Background data provided by teachers.
( ) Standard errors appear in parentheses. Because results are rounded to the nearest wholenumber, some totals may appear inconsistent.
An “r” indicates data are available for 70-84% of the students. An “s” indicates data areavailable for 50-69% of the students. An “x” indicates data are available for less than 50% of the students.
A dash (–) indicates data are not available. A tilde (~) indicates insufficient data to reportachievement.
ISC 4th GradePIRLS 2001
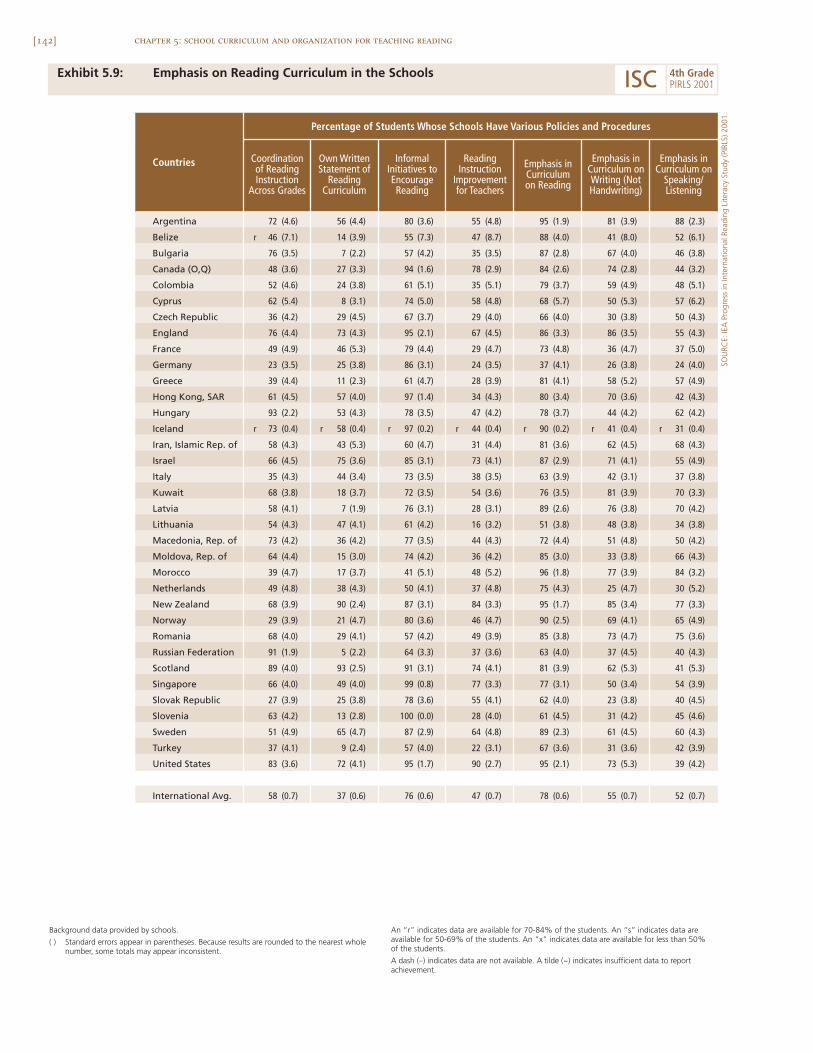
[142] chapter 5: school curriculum and organization for teaching reading
Exhibit 5.9: Emphasis on Reading Curriculum in the Schools
Argentina 72 (4.6) 56 (4.4) 80 (3.6) 55 (4.8) 95 (1.9) 81 (3.9) 88 (2.3)
Belize r 46 (7.1) 14 (3.9) 55 (7.3) 47 (8.7) 88 (4.0) 41 (8.0) 52 (6.1)
Bulgaria 76 (3.5) 7 (2.2) 57 (4.2) 35 (3.5) 87 (2.8) 67 (4.0) 46 (3.8)
Canada (O,Q) 48 (3.6) 27 (3.3) 94 (1.6) 78 (2.9) 84 (2.6) 74 (2.8) 44 (3.2)
Colombia 52 (4.6) 24 (3.8) 61 (5.1) 35 (5.1) 79 (3.7) 59 (4.9) 48 (5.1)
Cyprus 62 (5.4) 8 (3.1) 74 (5.0) 58 (4.8) 68 (5.7) 50 (5.3) 57 (6.2)
Czech Republic 36 (4.2) 29 (4.5) 67 (3.7) 29 (4.0) 66 (4.0) 30 (3.8) 50 (4.3)
England 76 (4.4) 73 (4.3) 95 (2.1) 67 (4.5) 86 (3.3) 86 (3.5) 55 (4.3)
France 49 (4.9) 46 (5.3) 79 (4.4) 29 (4.7) 73 (4.8) 36 (4.7) 37 (5.0)
Germany 23 (3.5) 25 (3.8) 86 (3.1) 24 (3.5) 37 (4.1) 26 (3.8) 24 (4.0)
Greece 39 (4.4) 11 (2.3) 61 (4.7) 28 (3.9) 81 (4.1) 58 (5.2) 57 (4.9)
Hong Kong, SAR 61 (4.5) 57 (4.0) 97 (1.4) 34 (4.3) 80 (3.4) 70 (3.6) 42 (4.3)
Hungary 93 (2.2) 53 (4.3) 78 (3.5) 47 (4.2) 78 (3.7) 44 (4.2) 62 (4.2)
Iceland r 73 (0.4) r 58 (0.4) r 97 (0.2) r 44 (0.4) r 90 (0.2) r 41 (0.4) r 31 (0.4)
Iran, Islamic Rep. of 58 (4.3) 43 (5.3) 60 (4.7) 31 (4.4) 81 (3.6) 62 (4.5) 68 (4.3)
Israel 66 (4.5) 75 (3.6) 85 (3.1) 73 (4.1) 87 (2.9) 71 (4.1) 55 (4.9)
Italy 35 (4.3) 44 (3.4) 73 (3.5) 38 (3.5) 63 (3.9) 42 (3.1) 37 (3.8)
Kuwait 68 (3.8) 18 (3.7) 72 (3.5) 54 (3.6) 76 (3.5) 81 (3.9) 70 (3.3)
Latvia 58 (4.1) 7 (1.9) 76 (3.1) 28 (3.1) 89 (2.6) 76 (3.8) 70 (4.2)
Lithuania 54 (4.3) 47 (4.1) 61 (4.2) 16 (3.2) 51 (3.8) 48 (3.8) 34 (3.8)
Macedonia, Rep. of 73 (4.2) 36 (4.2) 77 (3.5) 44 (4.3) 72 (4.4) 51 (4.8) 50 (4.2)
Moldova, Rep. of 64 (4.4) 15 (3.0) 74 (4.2) 36 (4.2) 85 (3.0) 33 (3.8) 66 (4.3)
Morocco 39 (4.7) 17 (3.7) 41 (5.1) 48 (5.2) 96 (1.8) 77 (3.9) 84 (3.2)
Netherlands 49 (4.8) 38 (4.3) 50 (4.1) 37 (4.8) 75 (4.3) 25 (4.7) 30 (5.2)
New Zealand 68 (3.9) 90 (2.4) 87 (3.1) 84 (3.3) 95 (1.7) 85 (3.4) 77 (3.3)
Norway 29 (3.9) 21 (4.7) 80 (3.6) 46 (4.7) 90 (2.5) 69 (4.1) 65 (4.9)
Romania 68 (4.0) 29 (4.1) 57 (4.2) 49 (3.9) 85 (3.8) 73 (4.7) 75 (3.6)
Russian Federation 91 (1.9) 5 (2.2) 64 (3.3) 37 (3.6) 63 (4.0) 37 (4.5) 40 (4.3)
Scotland 89 (4.0) 93 (2.5) 91 (3.1) 74 (4.1) 81 (3.9) 62 (5.3) 41 (5.3)
Singapore 66 (4.0) 49 (4.0) 99 (0.8) 77 (3.3) 77 (3.1) 50 (3.4) 54 (3.9)
Slovak Republic 27 (3.9) 25 (3.8) 78 (3.6) 55 (4.1) 62 (4.0) 23 (3.8) 40 (4.5)
Slovenia 63 (4.2) 13 (2.8) 100 (0.0) 28 (4.0) 61 (4.5) 31 (4.2) 45 (4.6)
Sweden 51 (4.9) 65 (4.7) 87 (2.9) 64 (4.8) 89 (2.3) 61 (4.5) 60 (4.3)
Turkey 37 (4.1) 9 (2.4) 57 (4.0) 22 (3.1) 67 (3.6) 31 (3.6) 42 (3.9)
United States 83 (3.6) 72 (4.1) 95 (1.7) 90 (2.7) 95 (2.1) 73 (5.3) 39 (4.2)
International Avg. 58 (0.7) 37 (0.6) 76 (0.6) 47 (0.7) 78 (0.6) 55 (0.7) 52 (0.7)
ReadingInstruction
Improvementfor Teachers
Emphasis inCurriculumon Reading
Emphasis inCurriculum on
Speaking/Listening
Emphasis inCurriculum onWriting (NotHandwriting)
Countries Coordinationof ReadingInstruction
Across Grades
Own WrittenStatement of
ReadingCurriculum
InformalInitiatives toEncourageReading
Percentage of Students Whose Schools Have Various Policies and Procedures
Background data provided by schools.
( ) Standard errors appear in parentheses. Because results are rounded to the nearest wholenumber, some totals may appear inconsistent.
An “r” indicates data are available for 70-84% of the students. An “s” indicates data areavailable for 50-69% of the students. An “x” indicates data are available for less than 50% of the students.
A dash (–) indicates data are not available. A tilde (~) indicates insufficient data to reportachievement.
SOU
RCE:
IEA
Pro
gres
s in
Inte
rnat
iona
l Rea
ding
Lite
racy
Stu
dy (P
IRLS
) 200
1.
ISC 4th GradePIRLS 2001
[143]chapter 5: school curriculum and organization for teaching reading
school-wide recreational reading periods to encourage students to read. Onaverage, across the PIRLS countries, 76 percent of students were in schoolswith such initiatives, as were almost all students (more than 90%) inCanada (O,Q), England, Hong Kong, Iceland, Scotland, Singapore, Slovenia,and the United States. Almost half the students (47%) internationally attendedschools that provided school-based programs for teachers geared towardsthe improvement of reading instruction. This practice was more common inCanada (O,Q), Israel, New Zealand, Scotland, Singapore, and the UnitedStates, where more than 70 percent of students were in schools providingsuch teacher programs.
Exhibit 5.9 also shows principals’ reports on placing more emphasis, rel-ative to other areas of the curriculum, on teaching reading, writing, and speak-ing/listening in the primary school grades (one through four). Of the three,reading was most often emphasized more than other areas of the curriculumaccording to principals. Almost four-fifths (78%) of students, on average, werein schools where reading received more emphasis than other areas of the cur-riculum. Fifty-five percent were in schools where writing received more empha-sis, and 52 percent where listening/speaking was emphasized more.
According to principals’ reports presented in Exhibit 5.10, in mostcountries the national or regional curriculum was by far the greatest influenceon their schools’ fourth-grade curriculum. On average, internationally, 80percent of students attended schools where the principal reported that thenational or regional curriculum had a lot of influence, and in several coun-tries the figure was more than 90 percent. National or regional examinations orassessments of student achievement had an important influence on the schoolcurriculum in several countries, including England, Iran, Moldova, Scotland,Singapore, and the United States. Standardized tests other than national orregional examinations or assessments, parents’ wishes, and students’ wisheswere less often reported to have a major influence on the school curriculum.
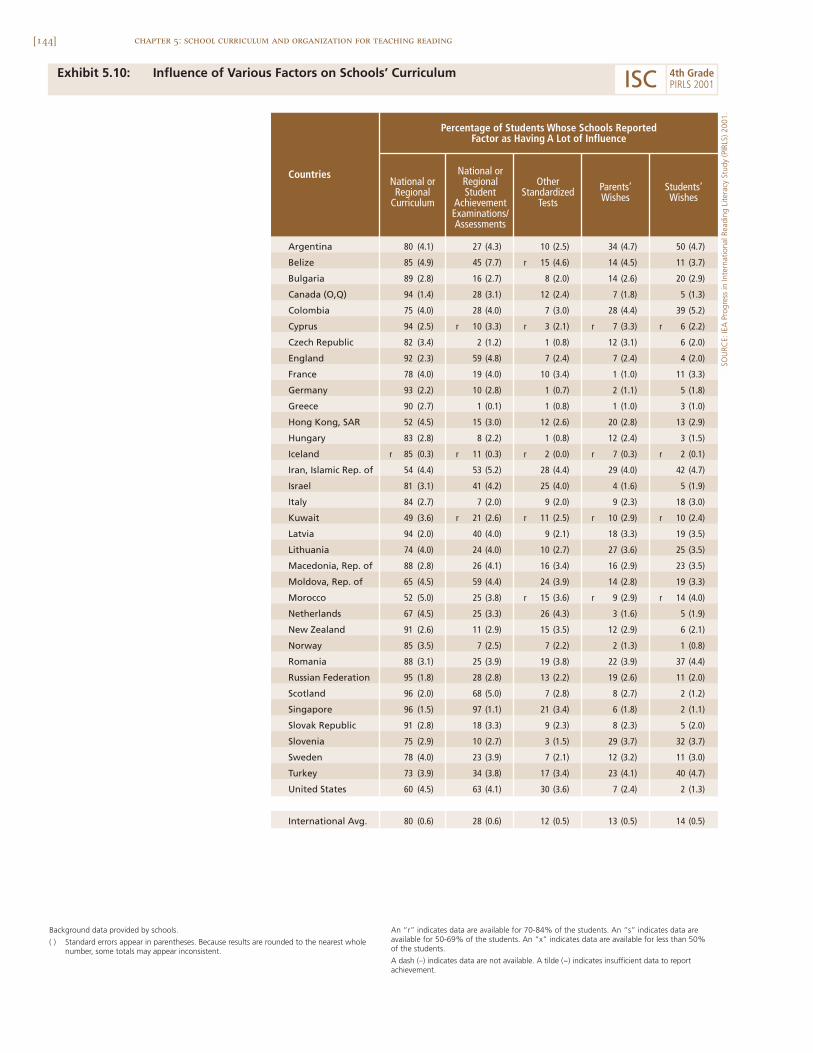
[144] chapter 5: school curriculum and organization for teaching reading
Exhibit 5.10: Influence of Various Factors on Schools’ Curriculum
Argentina 80 (4.1) 27 (4.3) 10 (2.5) 34 (4.7) 50 (4.7)
Belize 85 (4.9) 45 (7.7) r 15 (4.6) 14 (4.5) 11 (3.7)
Bulgaria 89 (2.8) 16 (2.7) 8 (2.0) 14 (2.6) 20 (2.9)
Canada (O,Q) 94 (1.4) 28 (3.1) 12 (2.4) 7 (1.8) 5 (1.3)
Colombia 75 (4.0) 28 (4.0) 7 (3.0) 28 (4.4) 39 (5.2)
Cyprus 94 (2.5) r 10 (3.3) r 3 (2.1) r 7 (3.3) r 6 (2.2)
Czech Republic 82 (3.4) 2 (1.2) 1 (0.8) 12 (3.1) 6 (2.0)
England 92 (2.3) 59 (4.8) 7 (2.4) 7 (2.4) 4 (2.0)
France 78 (4.0) 19 (4.0) 10 (3.4) 1 (1.0) 11 (3.3)
Germany 93 (2.2) 10 (2.8) 1 (0.7) 2 (1.1) 5 (1.8)
Greece 90 (2.7) 1 (0.1) 1 (0.8) 1 (1.0) 3 (1.0)
Hong Kong, SAR 52 (4.5) 15 (3.0) 12 (2.6) 20 (2.8) 13 (2.9)
Hungary 83 (2.8) 8 (2.2) 1 (0.8) 12 (2.4) 3 (1.5)
Iceland r 85 (0.3) r 11 (0.3) r 2 (0.0) r 7 (0.3) r 2 (0.1)
Iran, Islamic Rep. of 54 (4.4) 53 (5.2) 28 (4.4) 29 (4.0) 42 (4.7)
Israel 81 (3.1) 41 (4.2) 25 (4.0) 4 (1.6) 5 (1.9)
Italy 84 (2.7) 7 (2.0) 9 (2.0) 9 (2.3) 18 (3.0)
Kuwait 49 (3.6) r 21 (2.6) r 11 (2.5) r 10 (2.9) r 10 (2.4)
Latvia 94 (2.0) 40 (4.0) 9 (2.1) 18 (3.3) 19 (3.5)
Lithuania 74 (4.0) 24 (4.0) 10 (2.7) 27 (3.6) 25 (3.5)
Macedonia, Rep. of 88 (2.8) 26 (4.1) 16 (3.4) 16 (2.9) 23 (3.5)
Moldova, Rep. of 65 (4.5) 59 (4.4) 24 (3.9) 14 (2.8) 19 (3.3)
Morocco 52 (5.0) 25 (3.8) r 15 (3.6) r 9 (2.9) r 14 (4.0)
Netherlands 67 (4.5) 25 (3.3) 26 (4.3) 3 (1.6) 5 (1.9)
New Zealand 91 (2.6) 11 (2.9) 15 (3.5) 12 (2.9) 6 (2.1)
Norway 85 (3.5) 7 (2.5) 7 (2.2) 2 (1.3) 1 (0.8)
Romania 88 (3.1) 25 (3.9) 19 (3.8) 22 (3.9) 37 (4.4)
Russian Federation 95 (1.8) 28 (2.8) 13 (2.2) 19 (2.6) 11 (2.0)
Scotland 96 (2.0) 68 (5.0) 7 (2.8) 8 (2.7) 2 (1.2)
Singapore 96 (1.5) 97 (1.1) 21 (3.4) 6 (1.8) 2 (1.1)
Slovak Republic 91 (2.8) 18 (3.3) 9 (2.3) 8 (2.3) 5 (2.0)
Slovenia 75 (2.9) 10 (2.7) 3 (1.5) 29 (3.7) 32 (3.7)
Sweden 78 (4.0) 23 (3.9) 7 (2.1) 12 (3.2) 11 (3.0)
Turkey 73 (3.9) 34 (3.8) 17 (3.4) 23 (4.1) 40 (4.7)
United States 60 (4.5) 63 (4.1) 30 (3.6) 7 (2.4) 2 (1.3)
International Avg. 80 (0.6) 28 (0.6) 12 (0.5) 13 (0.5) 14 (0.5)
Percentage of Students Whose Schools ReportedFactor as Having A Lot of Influence
CountriesNational orRegional
Curriculum
National orRegionalStudent
AchievementExaminations/Assessments
OtherStandardized
Tests
Parents’Wishes
Students’Wishes
Background data provided by schools.
( ) Standard errors appear in parentheses. Because results are rounded to the nearest wholenumber, some totals may appear inconsistent.
An “r” indicates data are available for 70-84% of the students. An “s” indicates data areavailable for 50-69% of the students. An “x” indicates data are available for less than 50% of the students.
A dash (–) indicates data are not available. A tilde (~) indicates insufficient data to reportachievement.
SOU
RCE:
IEA
Pro
gres
s in
Inte
rnat
iona
l Rea
ding
Lite
racy
Stu
dy (P
IRLS
) 200
1.
ISC 4th GradePIRLS 2001
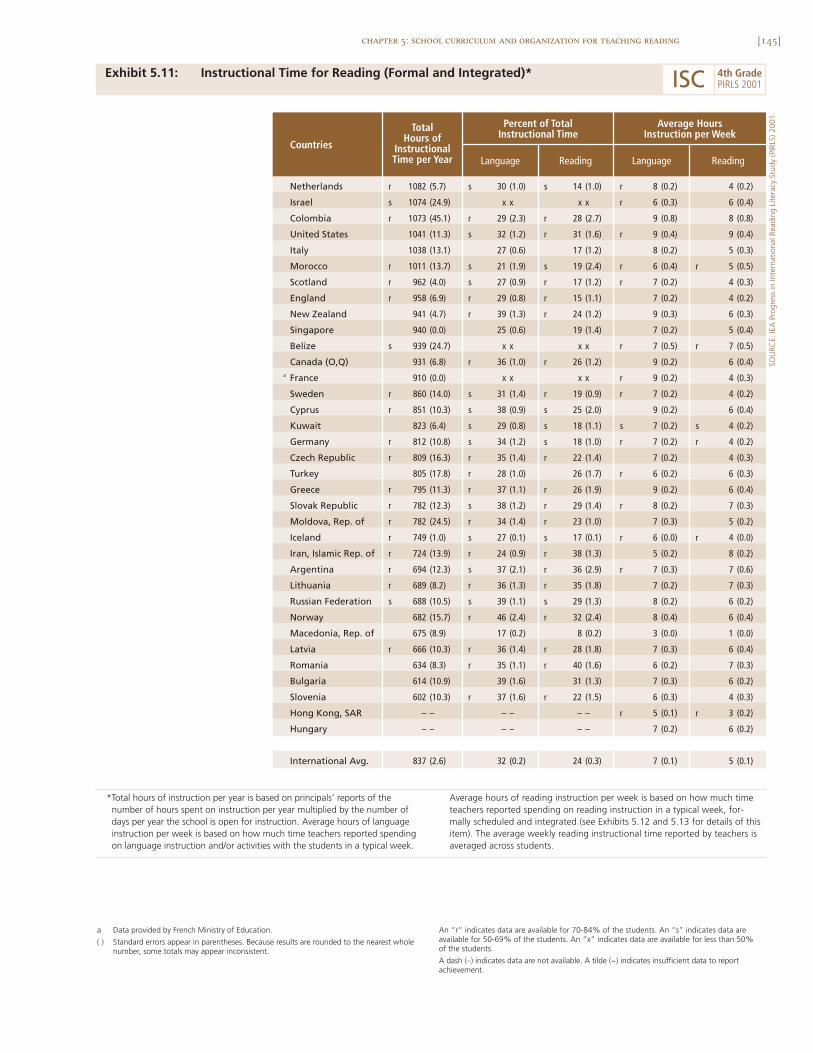
[145]chapter 5: school curriculum and organization for teaching reading
Exhibit 5.11: Instructional Time for Reading (Formal and Integrated)*
SOU
RCE:
IEA
Pro
gres
s in
Inte
rnat
iona
l Rea
ding
Lite
racy
Stu
dy (P
IRLS
) 200
1.
Netherlands r 1082 (5.7) s 30 (1.0) s 14 (1.0) r 8 (0.2) 4 (0.2)
Israel s 1074 (24.9) x x x x r 6 (0.3) 6 (0.4)
Colombia r 1073 (45.1) r 29 (2.3) r 28 (2.7) 9 (0.8) 8 (0.8)
United States 1041 (11.3) s 32 (1.2) r 31 (1.6) r 9 (0.4) 9 (0.4)
Italy 1038 (13.1) 27 (0.6) 17 (1.2) 8 (0.2) 5 (0.3)
Morocco r 1011 (13.7) s 21 (1.9) s 19 (2.4) r 6 (0.4) r 5 (0.5)
Scotland r 962 (4.0) s 27 (0.9) r 17 (1.2) r 7 (0.2) 4 (0.3)
England r 958 (6.9) r 29 (0.8) r 15 (1.1) 7 (0.2) 4 (0.2)
New Zealand 941 (4.7) r 39 (1.3) r 24 (1.2) 9 (0.3) 6 (0.3)
Singapore 940 (0.0) 25 (0.6) 19 (1.4) 7 (0.2) 5 (0.4)
Belize s 939 (24.7) x x x x r 7 (0.5) r 7 (0.5)
Canada (O,Q) 931 (6.8) r 36 (1.0) r 26 (1.2) 9 (0.2) 6 (0.4)a France 910 (0.0) x x x x r 9 (0.2) 4 (0.3)
Sweden r 860 (14.0) s 31 (1.4) r 19 (0.9) r 7 (0.2) 4 (0.2)
Cyprus r 851 (10.3) s 38 (0.9) s 25 (2.0) 9 (0.2) 6 (0.4)
Kuwait 823 (6.4) s 29 (0.8) s 18 (1.1) s 7 (0.2) s 4 (0.2)
Germany r 812 (10.8) s 34 (1.2) s 18 (1.0) r 7 (0.2) r 4 (0.2)
Czech Republic r 809 (16.3) r 35 (1.4) r 22 (1.4) 7 (0.2) 4 (0.3)
Turkey 805 (17.8) r 28 (1.0) 26 (1.7) r 6 (0.2) 6 (0.3)
Greece r 795 (11.3) r 37 (1.1) r 26 (1.9) 9 (0.2) 6 (0.4)
Slovak Republic r 782 (12.3) s 38 (1.2) r 29 (1.4) r 8 (0.2) 7 (0.3)
Moldova, Rep. of r 782 (24.5) r 34 (1.4) r 23 (1.0) 7 (0.3) 5 (0.2)
Iceland r 749 (1.0) s 27 (0.1) s 17 (0.1) r 6 (0.0) r 4 (0.0)
Iran, Islamic Rep. of r 724 (13.9) r 24 (0.9) r 38 (1.3) 5 (0.2) 8 (0.2)
Argentina r 694 (12.3) s 37 (2.1) r 36 (2.9) r 7 (0.3) 7 (0.6)
Lithuania r 689 (8.2) r 36 (1.3) r 35 (1.8) 7 (0.2) 7 (0.3)
Russian Federation s 688 (10.5) s 39 (1.1) s 29 (1.3) 8 (0.2) 6 (0.2)
Norway 682 (15.7) r 46 (2.4) r 32 (2.4) 8 (0.4) 6 (0.4)
Macedonia, Rep. of 675 (8.9) 17 (0.2) 8 (0.2) 3 (0.0) 1 (0.0)
Latvia r 666 (10.3) r 36 (1.4) r 28 (1.8) 7 (0.3) 6 (0.4)
Romania 634 (8.3) r 35 (1.1) r 40 (1.6) 6 (0.2) 7 (0.3)
Bulgaria 614 (10.9) 39 (1.6) 31 (1.3) 7 (0.3) 6 (0.2)
Slovenia 602 (10.3) r 37 (1.6) r 22 (1.5) 6 (0.3) 4 (0.3)
Hong Kong, SAR – – – – – – r 5 (0.1) r 3 (0.2)
Hungary – – – – – – 7 (0.2) 6 (0.2)
International Avg. 837 (2.6) 32 (0.2) 24 (0.3) 7 (0.1) 5 (0.1)
Average HoursInstruction per Week
Percent of TotalInstructional Time
TotalHours of
InstructionalTime per Year Language Reading
Countries
Language Reading
a Data provided by French Ministry of Education.
( ) Standard errors appear in parentheses. Because results are rounded to the nearest wholenumber, some totals may appear inconsistent.
An “r” indicates data are available for 70-84% of the students. An “s” indicates data areavailable for 50-69% of the students. An “x” indicates data are available for less than 50% of the students.
A dash (–) indicates data are not available. A tilde (~) indicates insufficient data to reportachievement.
ISC 4th GradePIRLS 2001
*Total hours of instruction per year is based on principals’ reports of thenumber of hours spent on instruction per year multiplied by the number ofdays per year the school is open for instruction. Average hours of languageinstruction per week is based on how much time teachers reported spendingon language instruction and/or activities with the students in a typical week.
Average hours of reading instruction per week is based on how much timeteachers reported spending on reading instruction in a typical week, for-mally scheduled and integrated (see Exhibits 5.12 and 5.13 for details of thisitem). The average weekly reading instructional time reported by teachers isaveraged across students.
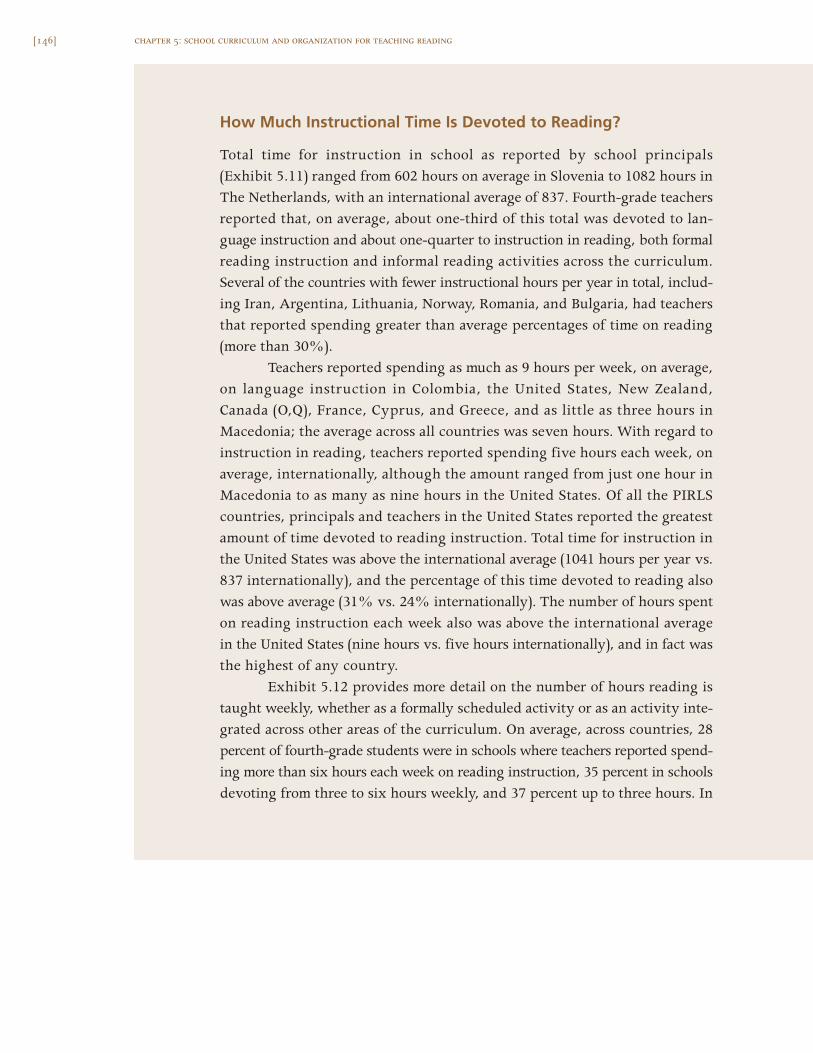
[146] chapter 5: school curriculum and organization for teaching reading
How Much Instructional Time Is Devoted to Reading?
Total time for instruction in school as reported by school principals(Exhibit 5.11) ranged from 602 hours on average in Slovenia to 1082 hours inThe Netherlands, with an international average of 837. Fourth-grade teachersreported that, on average, about one-third of this total was devoted to lan-guage instruction and about one-quarter to instruction in reading, both formalreading instruction and informal reading activities across the curriculum.Several of the countries with fewer instructional hours per year in total, includ-ing Iran, Argentina, Lithuania, Norway, Romania, and Bulgaria, had teachersthat reported spending greater than average percentages of time on reading(more than 30%).
Teachers reported spending as much as 9 hours per week, on average,on language instruction in Colombia, the United States, New Zealand,Canada (O,Q), France, Cyprus, and Greece, and as little as three hours inMacedonia; the average across all countries was seven hours. With regard toinstruction in reading, teachers reported spending five hours each week, onaverage, internationally, although the amount ranged from just one hour inMacedonia to as many as nine hours in the United States. Of all the PIRLScountries, principals and teachers in the United States reported the greatestamount of time devoted to reading instruction. Total time for instruction inthe United States was above the international average (1041 hours per year vs.837 internationally), and the percentage of this time devoted to reading alsowas above average (31% vs. 24% internationally). The number of hours spenton reading instruction each week also was above the international averagein the United States (nine hours vs. five hours internationally), and in fact wasthe highest of any country.
Exhibit 5.12 provides more detail on the number of hours reading istaught weekly, whether as a formally scheduled activity or as an activity inte-grated across other areas of the curriculum. On average, across countries, 28percent of fourth-grade students were in schools where teachers reported spend-ing more than six hours each week on reading instruction, 35 percent in schoolsdevoting from three to six hours weekly, and 37 percent up to three hours. In
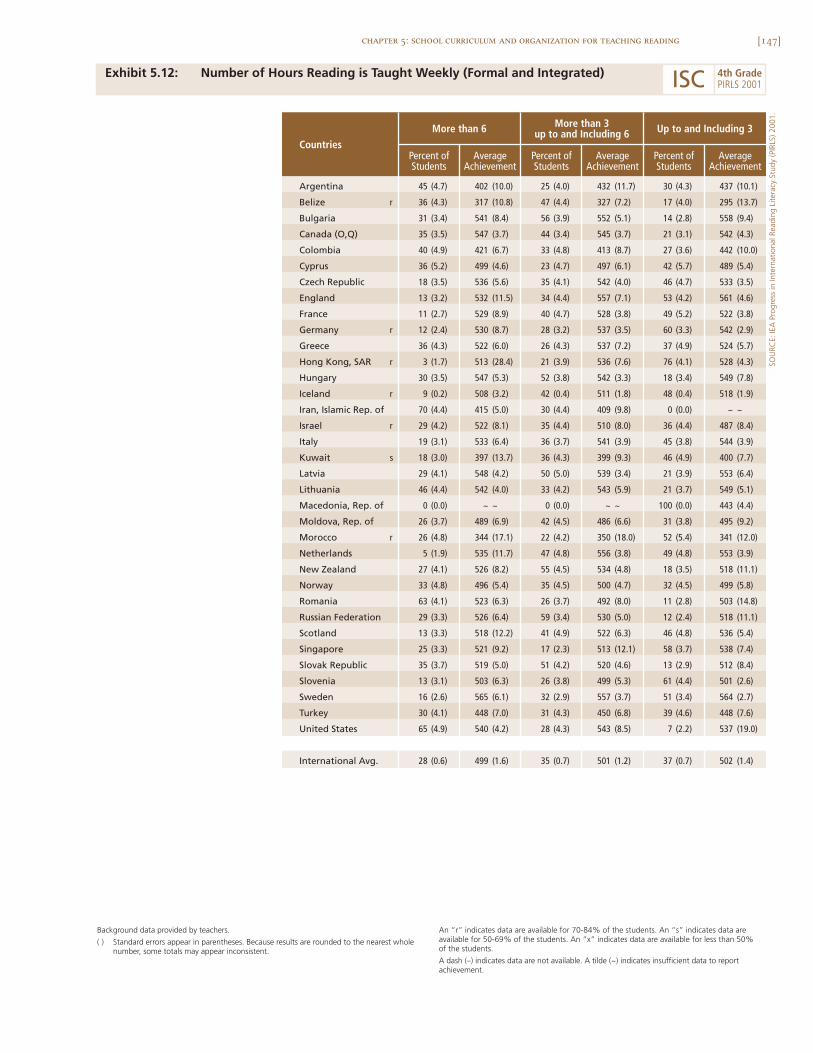
[147]chapter 5: school curriculum and organization for teaching reading
Exhibit 5.12: Number of Hours Reading is Taught Weekly (Formal and Integrated)
SOU
RCE:
IEA
Pro
gres
s in
Inte
rnat
iona
l Rea
ding
Lite
racy
Stu
dy (P
IRLS
) 200
1.
Argentina 45 (4.7) 402 (10.0) 25 (4.0) 432 (11.7) 30 (4.3) 437 (10.1)
Belize r 36 (4.3) 317 (10.8) 47 (4.4) 327 (7.2) 17 (4.0) 295 (13.7)
Bulgaria 31 (3.4) 541 (8.4) 56 (3.9) 552 (5.1) 14 (2.8) 558 (9.4)
Canada (O,Q) 35 (3.5) 547 (3.7) 44 (3.4) 545 (3.7) 21 (3.1) 542 (4.3)
Colombia 40 (4.9) 421 (6.7) 33 (4.8) 413 (8.7) 27 (3.6) 442 (10.0)
Cyprus 36 (5.2) 499 (4.6) 23 (4.7) 497 (6.1) 42 (5.7) 489 (5.4)
Czech Republic 18 (3.5) 536 (5.6) 35 (4.1) 542 (4.0) 46 (4.7) 533 (3.5)
England 13 (3.2) 532 (11.5) 34 (4.4) 557 (7.1) 53 (4.2) 561 (4.6)
France 11 (2.7) 529 (8.9) 40 (4.7) 528 (3.8) 49 (5.2) 522 (3.8)
Germany r 12 (2.4) 530 (8.7) 28 (3.2) 537 (3.5) 60 (3.3) 542 (2.9)
Greece 36 (4.3) 522 (6.0) 26 (4.3) 537 (7.2) 37 (4.9) 524 (5.7)
Hong Kong, SAR r 3 (1.7) 513 (28.4) 21 (3.9) 536 (7.6) 76 (4.1) 528 (4.3)
Hungary 30 (3.5) 547 (5.3) 52 (3.8) 542 (3.3) 18 (3.4) 549 (7.8)
Iceland r 9 (0.2) 508 (3.2) 42 (0.4) 511 (1.8) 48 (0.4) 518 (1.9)
Iran, Islamic Rep. of 70 (4.4) 415 (5.0) 30 (4.4) 409 (9.8) 0 (0.0) ~ ~
Israel r 29 (4.2) 522 (8.1) 35 (4.4) 510 (8.0) 36 (4.4) 487 (8.4)
Italy 19 (3.1) 533 (6.4) 36 (3.7) 541 (3.9) 45 (3.8) 544 (3.9)
Kuwait s 18 (3.0) 397 (13.7) 36 (4.3) 399 (9.3) 46 (4.9) 400 (7.7)
Latvia 29 (4.1) 548 (4.2) 50 (5.0) 539 (3.4) 21 (3.9) 553 (6.4)
Lithuania 46 (4.4) 542 (4.0) 33 (4.2) 543 (5.9) 21 (3.7) 549 (5.1)
Macedonia, Rep. of 0 (0.0) ~ ~ 0 (0.0) ~ ~ 100 (0.0) 443 (4.4)
Moldova, Rep. of 26 (3.7) 489 (6.9) 42 (4.5) 486 (6.6) 31 (3.8) 495 (9.2)
Morocco r 26 (4.8) 344 (17.1) 22 (4.2) 350 (18.0) 52 (5.4) 341 (12.0)
Netherlands 5 (1.9) 535 (11.7) 47 (4.8) 556 (3.8) 49 (4.8) 553 (3.9)
New Zealand 27 (4.1) 526 (8.2) 55 (4.5) 534 (4.8) 18 (3.5) 518 (11.1)
Norway 33 (4.8) 496 (5.4) 35 (4.5) 500 (4.7) 32 (4.5) 499 (5.8)
Romania 63 (4.1) 523 (6.3) 26 (3.7) 492 (8.0) 11 (2.8) 503 (14.8)
Russian Federation 29 (3.3) 526 (6.4) 59 (3.4) 530 (5.0) 12 (2.4) 518 (11.1)
Scotland 13 (3.3) 518 (12.2) 41 (4.9) 522 (6.3) 46 (4.8) 536 (5.4)
Singapore 25 (3.3) 521 (9.2) 17 (2.3) 513 (12.1) 58 (3.7) 538 (7.4)
Slovak Republic 35 (3.7) 519 (5.0) 51 (4.2) 520 (4.6) 13 (2.9) 512 (8.4)
Slovenia 13 (3.1) 503 (6.3) 26 (3.8) 499 (5.3) 61 (4.4) 501 (2.6)
Sweden 16 (2.6) 565 (6.1) 32 (2.9) 557 (3.7) 51 (3.4) 564 (2.7)
Turkey 30 (4.1) 448 (7.0) 31 (4.3) 450 (6.8) 39 (4.6) 448 (7.6)
United States 65 (4.9) 540 (4.2) 28 (4.3) 543 (8.5) 7 (2.2) 537 (19.0)
International Avg. 28 (0.6) 499 (1.6) 35 (0.7) 501 (1.2) 37 (0.7) 502 (1.4)
Countries
More than 3up to and Including 6 Up to and Including 3More than 6
Percent ofStudents
AverageAchievement
Percent ofStudents
AverageAchievement
Percent ofStudents
AverageAchievement
Background data provided by teachers.
( ) Standard errors appear in parentheses. Because results are rounded to the nearest wholenumber, some totals may appear inconsistent.
An “r” indicates data are available for 70-84% of the students. An “s” indicates data areavailable for 50-69% of the students. An “x” indicates data are available for less than 50% of the students.
A dash (–) indicates data are not available. A tilde (~) indicates insufficient data to reportachievement.
ISC 4th GradePIRLS 2001
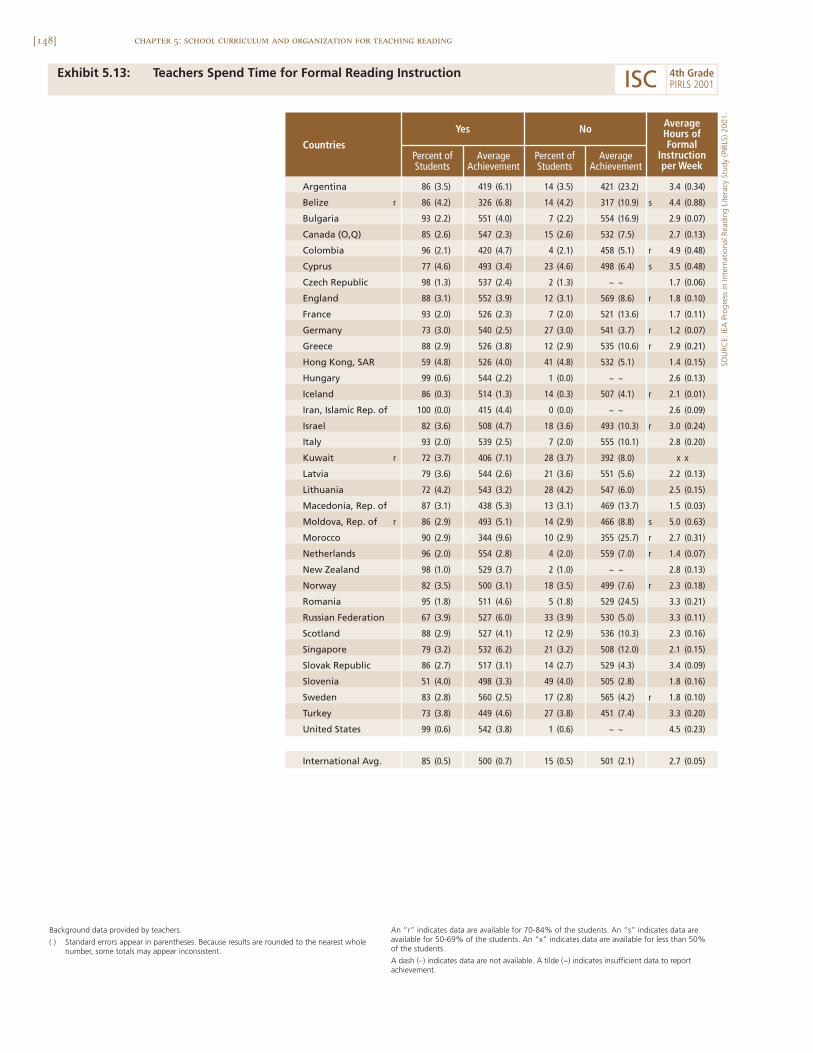
[148] chapter 5: school curriculum and organization for teaching reading
Exhibit 5.13: Teachers Spend Time for Formal Reading Instruction
Argentina 86 (3.5) 419 (6.1) 14 (3.5) 421 (23.2) 3.4 (0.34)
Belize r 86 (4.2) 326 (6.8) 14 (4.2) 317 (10.9) s 4.4 (0.88)
Bulgaria 93 (2.2) 551 (4.0) 7 (2.2) 554 (16.9) 2.9 (0.07)
Canada (O,Q) 85 (2.6) 547 (2.3) 15 (2.6) 532 (7.5) 2.7 (0.13)
Colombia 96 (2.1) 420 (4.7) 4 (2.1) 458 (5.1) r 4.9 (0.48)
Cyprus 77 (4.6) 493 (3.4) 23 (4.6) 498 (6.4) s 3.5 (0.48)
Czech Republic 98 (1.3) 537 (2.4) 2 (1.3) ~ ~ 1.7 (0.06)
England 88 (3.1) 552 (3.9) 12 (3.1) 569 (8.6) r 1.8 (0.10)
France 93 (2.0) 526 (2.3) 7 (2.0) 521 (13.6) 1.7 (0.11)
Germany 73 (3.0) 540 (2.5) 27 (3.0) 541 (3.7) r 1.2 (0.07)
Greece 88 (2.9) 526 (3.8) 12 (2.9) 535 (10.6) r 2.9 (0.21)
Hong Kong, SAR 59 (4.8) 526 (4.0) 41 (4.8) 532 (5.1) 1.4 (0.15)
Hungary 99 (0.6) 544 (2.2) 1 (0.0) ~ ~ 2.6 (0.13)
Iceland 86 (0.3) 514 (1.3) 14 (0.3) 507 (4.1) r 2.1 (0.01)
Iran, Islamic Rep. of 100 (0.0) 415 (4.4) 0 (0.0) ~ ~ 2.6 (0.09)
Israel 82 (3.6) 508 (4.7) 18 (3.6) 493 (10.3) r 3.0 (0.24)
Italy 93 (2.0) 539 (2.5) 7 (2.0) 555 (10.1) 2.8 (0.20)
Kuwait r 72 (3.7) 406 (7.1) 28 (3.7) 392 (8.0) x x
Latvia 79 (3.6) 544 (2.6) 21 (3.6) 551 (5.6) 2.2 (0.13)
Lithuania 72 (4.2) 543 (3.2) 28 (4.2) 547 (6.0) 2.5 (0.15)
Macedonia, Rep. of 87 (3.1) 438 (5.3) 13 (3.1) 469 (13.7) 1.5 (0.03)
Moldova, Rep. of r 86 (2.9) 493 (5.1) 14 (2.9) 466 (8.8) s 5.0 (0.63)
Morocco 90 (2.9) 344 (9.6) 10 (2.9) 355 (25.7) r 2.7 (0.31)
Netherlands 96 (2.0) 554 (2.8) 4 (2.0) 559 (7.0) r 1.4 (0.07)
New Zealand 98 (1.0) 529 (3.7) 2 (1.0) ~ ~ 2.8 (0.13)
Norway 82 (3.5) 500 (3.1) 18 (3.5) 499 (7.6) r 2.3 (0.18)
Romania 95 (1.8) 511 (4.6) 5 (1.8) 529 (24.5) 3.3 (0.21)
Russian Federation 67 (3.9) 527 (6.0) 33 (3.9) 530 (5.0) 3.3 (0.11)
Scotland 88 (2.9) 527 (4.1) 12 (2.9) 536 (10.3) 2.3 (0.16)
Singapore 79 (3.2) 532 (6.2) 21 (3.2) 508 (12.0) 2.1 (0.15)
Slovak Republic 86 (2.7) 517 (3.1) 14 (2.7) 529 (4.3) 3.4 (0.09)
Slovenia 51 (4.0) 498 (3.3) 49 (4.0) 505 (2.8) 1.8 (0.16)
Sweden 83 (2.8) 560 (2.5) 17 (2.8) 565 (4.2) r 1.8 (0.10)
Turkey 73 (3.8) 449 (4.6) 27 (3.8) 451 (7.4) 3.3 (0.20)
United States 99 (0.6) 542 (3.8) 1 (0.6) ~ ~ 4.5 (0.23)
International Avg. 85 (0.5) 500 (0.7) 15 (0.5) 501 (2.1) 2.7 (0.05)
NoYes AverageHours ofFormal
Instructionper Week
CountriesPercent ofStudents
AverageAchievement
Percent ofStudents
AverageAchievement
Background data provided by teachers.
( ) Standard errors appear in parentheses. Because results are rounded to the nearest wholenumber, some totals may appear inconsistent.
An “r” indicates data are available for 70-84% of the students. An “s” indicates data areavailable for 50-69% of the students. An “x” indicates data are available for less than 50% of the students.
A dash (–) indicates data are not available. A tilde (~) indicates insufficient data to reportachievement.
SOU
RCE:
IEA
Pro
gres
s in
Inte
rnat
iona
l Rea
ding
Lite
racy
Stu
dy (P
IRLS
) 200
1.
ISC 4th GradePIRLS 2001

[149]chapter 5: school curriculum and organization for teaching reading
addition to Iran, where 70 percent of students were in schools spending morethan six hours weekly, other countries devoting a lot of time to reading instruc-tion each week included Romania and the United States.
Because reading in fourth grade may be taught both as a formal teach-ing activity and more informally as students read for other subjects, PIRLSasked teachers if any of the time they spent on reading instruction was explic-itly for formal reading instruction designed to develop or enhance readingcomprehension skills. Exhibit 5.13 shows that such formal reading instructionwas very much a part of reading in fourth grade in all countries. On average,85 percent of students were in schools with such formal reading instruction,and in many countries almost all students were in such schools. The numberof hours spent on formal reading instruction ranged from 1.2 hours per weekin Germany to 5.0 hours in Moldova.
According to teachers’ reports (Exhibit 5.14), reading instruction wasa daily or almost daily activity in most countries, with 54 percent of stu-dents internationally in schools where instruction takes place daily, and 35percent in schools where it happens on three or four days each week. InHong Kong, Iceland, Macedonia, Singapore, and Slovenia, 20 percent or moreof students were in schools were reading instruction took place on fewerthan three days each week.
How Are Classes Organized for Reading Instruction?
In implementing the school reading instructional program for students at dif-ferent reading levels, the most common approach was to have all students followthe same instructional program but at different speeds. As shown in Exhibit 5.15,60 percent of students, on average, internationally, were in schools that followthis practice, and in Bulgaria, Colombia, Cyprus, the Czech Republic, France,Germany, Hungary, Italy, Latvia, Lithuania, Moldova, the Russian Federation,and Slovenia, more than 70 percent of fourth-grade students were in suchschools. A less common approach was to have students at different readinglevels follow different reading instructional programs. However, although just29 percent of students, on average, across countries, were in schools follow-ing this approach, it was the approach used in schools with the majority of
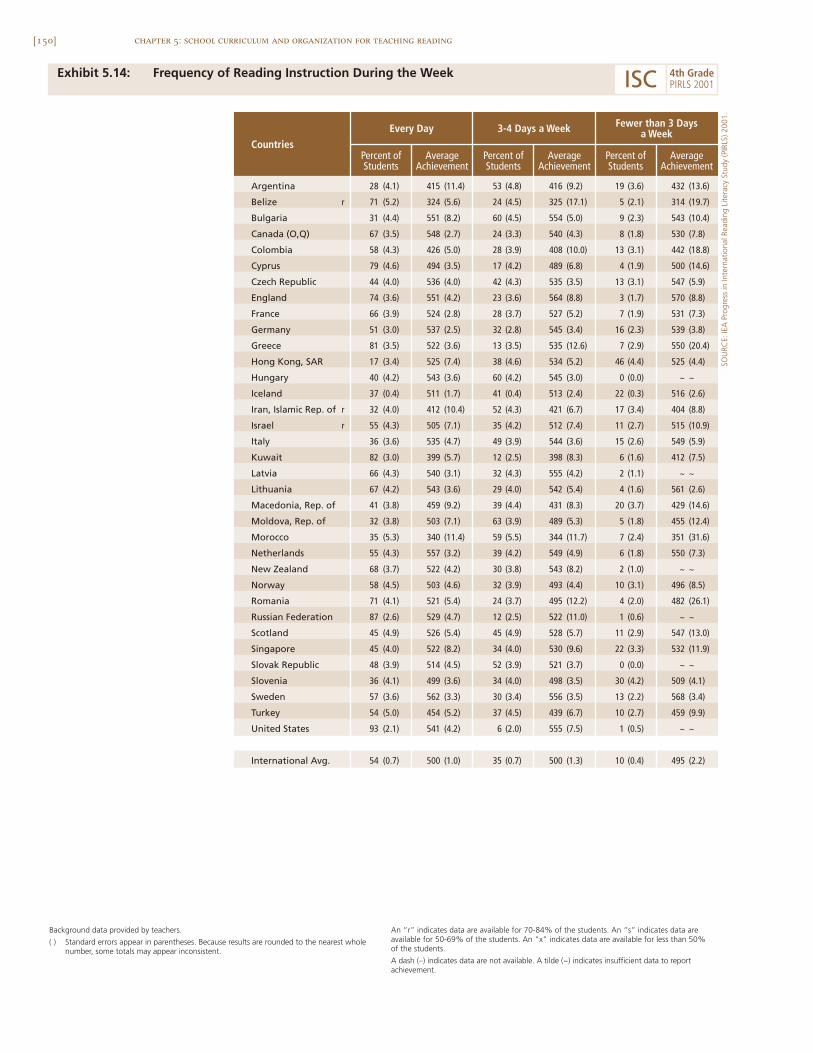
[150] chapter 5: school curriculum and organization for teaching reading
Exhibit 5.14: Frequency of Reading Instruction During the Week
Argentina 28 (4.1) 415 (11.4) 53 (4.8) 416 (9.2) 19 (3.6) 432 (13.6)
Belize r 71 (5.2) 324 (5.6) 24 (4.5) 325 (17.1) 5 (2.1) 314 (19.7)
Bulgaria 31 (4.4) 551 (8.2) 60 (4.5) 554 (5.0) 9 (2.3) 543 (10.4)
Canada (O,Q) 67 (3.5) 548 (2.7) 24 (3.3) 540 (4.3) 8 (1.8) 530 (7.8)
Colombia 58 (4.3) 426 (5.0) 28 (3.9) 408 (10.0) 13 (3.1) 442 (18.8)
Cyprus 79 (4.6) 494 (3.5) 17 (4.2) 489 (6.8) 4 (1.9) 500 (14.6)
Czech Republic 44 (4.0) 536 (4.0) 42 (4.3) 535 (3.5) 13 (3.1) 547 (5.9)
England 74 (3.6) 551 (4.2) 23 (3.6) 564 (8.8) 3 (1.7) 570 (8.8)
France 66 (3.9) 524 (2.8) 28 (3.7) 527 (5.2) 7 (1.9) 531 (7.3)
Germany 51 (3.0) 537 (2.5) 32 (2.8) 545 (3.4) 16 (2.3) 539 (3.8)
Greece 81 (3.5) 522 (3.6) 13 (3.5) 535 (12.6) 7 (2.9) 550 (20.4)
Hong Kong, SAR 17 (3.4) 525 (7.4) 38 (4.6) 534 (5.2) 46 (4.4) 525 (4.4)
Hungary 40 (4.2) 543 (3.6) 60 (4.2) 545 (3.0) 0 (0.0) ~ ~
Iceland 37 (0.4) 511 (1.7) 41 (0.4) 513 (2.4) 22 (0.3) 516 (2.6)
Iran, Islamic Rep. of r 32 (4.0) 412 (10.4) 52 (4.3) 421 (6.7) 17 (3.4) 404 (8.8)
Israel r 55 (4.3) 505 (7.1) 35 (4.2) 512 (7.4) 11 (2.7) 515 (10.9)
Italy 36 (3.6) 535 (4.7) 49 (3.9) 544 (3.6) 15 (2.6) 549 (5.9)
Kuwait 82 (3.0) 399 (5.7) 12 (2.5) 398 (8.3) 6 (1.6) 412 (7.5)
Latvia 66 (4.3) 540 (3.1) 32 (4.3) 555 (4.2) 2 (1.1) ~ ~
Lithuania 67 (4.2) 543 (3.6) 29 (4.0) 542 (5.4) 4 (1.6) 561 (2.6)
Macedonia, Rep. of 41 (3.8) 459 (9.2) 39 (4.4) 431 (8.3) 20 (3.7) 429 (14.6)
Moldova, Rep. of 32 (3.8) 503 (7.1) 63 (3.9) 489 (5.3) 5 (1.8) 455 (12.4)
Morocco 35 (5.3) 340 (11.4) 59 (5.5) 344 (11.7) 7 (2.4) 351 (31.6)
Netherlands 55 (4.3) 557 (3.2) 39 (4.2) 549 (4.9) 6 (1.8) 550 (7.3)
New Zealand 68 (3.7) 522 (4.2) 30 (3.8) 543 (8.2) 2 (1.0) ~ ~
Norway 58 (4.5) 503 (4.6) 32 (3.9) 493 (4.4) 10 (3.1) 496 (8.5)
Romania 71 (4.1) 521 (5.4) 24 (3.7) 495 (12.2) 4 (2.0) 482 (26.1)
Russian Federation 87 (2.6) 529 (4.7) 12 (2.5) 522 (11.0) 1 (0.6) ~ ~
Scotland 45 (4.9) 526 (5.4) 45 (4.9) 528 (5.7) 11 (2.9) 547 (13.0)
Singapore 45 (4.0) 522 (8.2) 34 (4.0) 530 (9.6) 22 (3.3) 532 (11.9)
Slovak Republic 48 (3.9) 514 (4.5) 52 (3.9) 521 (3.7) 0 (0.0) ~ ~
Slovenia 36 (4.1) 499 (3.6) 34 (4.0) 498 (3.5) 30 (4.2) 509 (4.1)
Sweden 57 (3.6) 562 (3.3) 30 (3.4) 556 (3.5) 13 (2.2) 568 (3.4)
Turkey 54 (5.0) 454 (5.2) 37 (4.5) 439 (6.7) 10 (2.7) 459 (9.9)
United States 93 (2.1) 541 (4.2) 6 (2.0) 555 (7.5) 1 (0.5) ~ ~
International Avg. 54 (0.7) 500 (1.0) 35 (0.7) 500 (1.3) 10 (0.4) 495 (2.2)
Countries
3-4 Days a Week Fewer than 3 Daysa WeekEvery Day
Percent ofStudents
AverageAchievement
Percent ofStudents
AverageAchievement
Percent ofStudents
AverageAchievement
Background data provided by teachers.
( ) Standard errors appear in parentheses. Because results are rounded to the nearest wholenumber, some totals may appear inconsistent.
An “r” indicates data are available for 70-84% of the students. An “s” indicates data areavailable for 50-69% of the students. An “x” indicates data are available for less than 50% of the students.
A dash (–) indicates data are not available. A tilde (~) indicates insufficient data to reportachievement.
SOU
RCE:
IEA
Pro
gres
s in
Inte
rnat
iona
l Rea
ding
Lite
racy
Stu
dy (P
IRLS
) 200
1.
ISC 4th GradePIRLS 2001
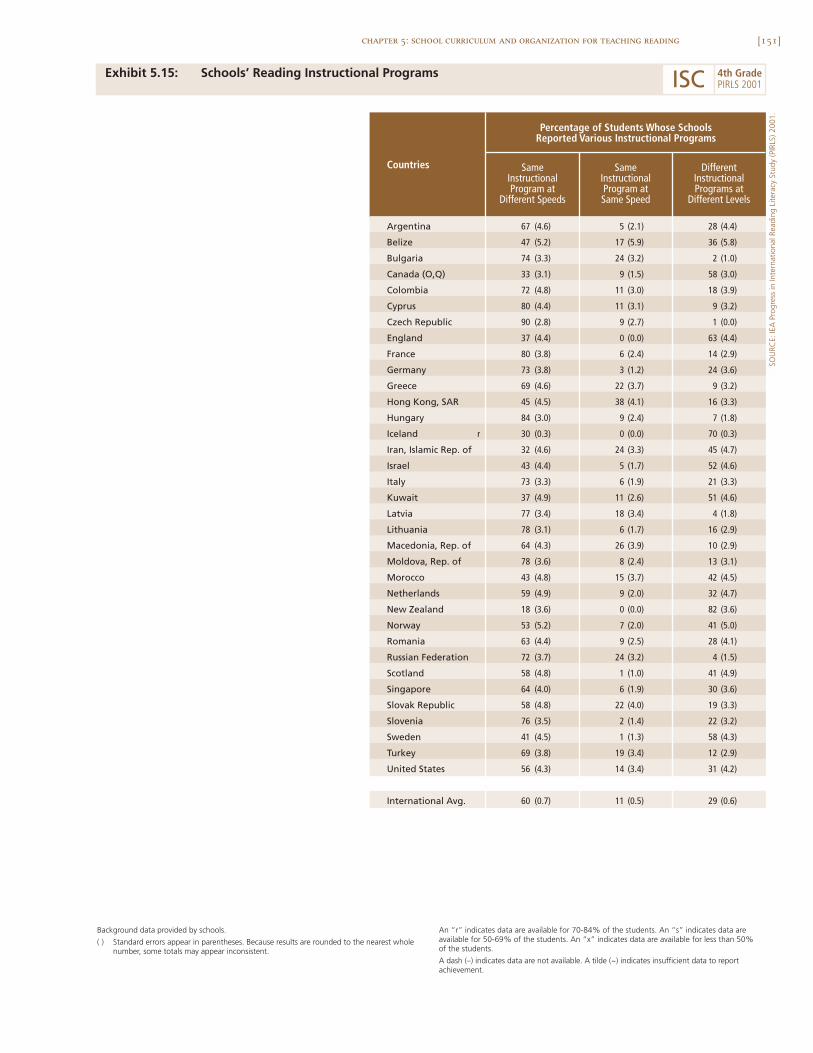
[151]chapter 5: school curriculum and organization for teaching reading
Exhibit 5.15: Schools’ Reading Instructional Programs
SOU
RCE:
IEA
Pro
gres
s in
Inte
rnat
iona
l Rea
ding
Lite
racy
Stu
dy (P
IRLS
) 200
1.
Argentina 67 (4.6) 5 (2.1) 28 (4.4)
Belize 47 (5.2) 17 (5.9) 36 (5.8)
Bulgaria 74 (3.3) 24 (3.2) 2 (1.0)
Canada (O,Q) 33 (3.1) 9 (1.5) 58 (3.0)
Colombia 72 (4.8) 11 (3.0) 18 (3.9)
Cyprus 80 (4.4) 11 (3.1) 9 (3.2)
Czech Republic 90 (2.8) 9 (2.7) 1 (0.0)
England 37 (4.4) 0 (0.0) 63 (4.4)
France 80 (3.8) 6 (2.4) 14 (2.9)
Germany 73 (3.8) 3 (1.2) 24 (3.6)
Greece 69 (4.6) 22 (3.7) 9 (3.2)
Hong Kong, SAR 45 (4.5) 38 (4.1) 16 (3.3)
Hungary 84 (3.0) 9 (2.4) 7 (1.8)
Iceland r 30 (0.3) 0 (0.0) 70 (0.3)
Iran, Islamic Rep. of 32 (4.6) 24 (3.3) 45 (4.7)
Israel 43 (4.4) 5 (1.7) 52 (4.6)
Italy 73 (3.3) 6 (1.9) 21 (3.3)
Kuwait 37 (4.9) 11 (2.6) 51 (4.6)
Latvia 77 (3.4) 18 (3.4) 4 (1.8)
Lithuania 78 (3.1) 6 (1.7) 16 (2.9)
Macedonia, Rep. of 64 (4.3) 26 (3.9) 10 (2.9)
Moldova, Rep. of 78 (3.6) 8 (2.4) 13 (3.1)
Morocco 43 (4.8) 15 (3.7) 42 (4.5)
Netherlands 59 (4.9) 9 (2.0) 32 (4.7)
New Zealand 18 (3.6) 0 (0.0) 82 (3.6)
Norway 53 (5.2) 7 (2.0) 41 (5.0)
Romania 63 (4.4) 9 (2.5) 28 (4.1)
Russian Federation 72 (3.7) 24 (3.2) 4 (1.5)
Scotland 58 (4.8) 1 (1.0) 41 (4.9)
Singapore 64 (4.0) 6 (1.9) 30 (3.6)
Slovak Republic 58 (4.8) 22 (4.0) 19 (3.3)
Slovenia 76 (3.5) 2 (1.4) 22 (3.2)
Sweden 41 (4.5) 1 (1.3) 58 (4.3)
Turkey 69 (3.8) 19 (3.4) 12 (2.9)
United States 56 (4.3) 14 (3.4) 31 (4.2)
International Avg. 60 (0.7) 11 (0.5) 29 (0.6)
Percentage of Students Whose SchoolsReported Various Instructional Programs
Countries SameInstructionalProgram at
Different Speeds
DifferentInstructionalPrograms at
Different Levels
SameInstructionalProgram atSame Speed
Background data provided by schools.
( ) Standard errors appear in parentheses. Because results are rounded to the nearest wholenumber, some totals may appear inconsistent.
An “r” indicates data are available for 70-84% of the students. An “s” indicates data areavailable for 50-69% of the students. An “x” indicates data are available for less than 50% of the students.
A dash (–) indicates data are not available. A tilde (~) indicates insufficient data to reportachievement.
ISC 4th GradePIRLS 2001
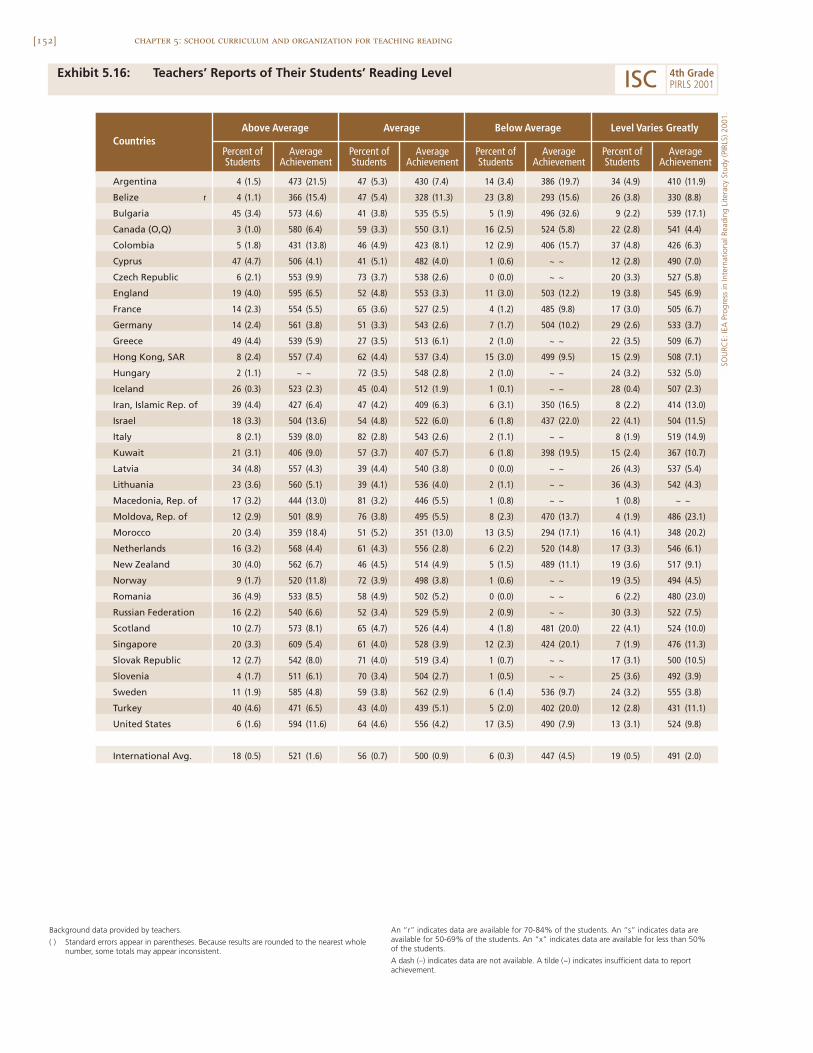
[152] chapter 5: school curriculum and organization for teaching reading
Exhibit 5.16: Teachers’ Reports of Their Students’ Reading Level
Argentina 4 (1.5) 473 (21.5) 47 (5.3) 430 (7.4) 14 (3.4) 386 (19.7) 34 (4.9) 410 (11.9)
Belize r 4 (1.1) 366 (15.4) 47 (5.4) 328 (11.3) 23 (3.8) 293 (15.6) 26 (3.8) 330 (8.8)
Bulgaria 45 (3.4) 573 (4.6) 41 (3.8) 535 (5.5) 5 (1.9) 496 (32.6) 9 (2.2) 539 (17.1)
Canada (O,Q) 3 (1.0) 580 (6.4) 59 (3.3) 550 (3.1) 16 (2.5) 524 (5.8) 22 (2.8) 541 (4.4)
Colombia 5 (1.8) 431 (13.8) 46 (4.9) 423 (8.1) 12 (2.9) 406 (15.7) 37 (4.8) 426 (6.3)
Cyprus 47 (4.7) 506 (4.1) 41 (5.1) 482 (4.0) 1 (0.6) ~ ~ 12 (2.8) 490 (7.0)
Czech Republic 6 (2.1) 553 (9.9) 73 (3.7) 538 (2.6) 0 (0.0) ~ ~ 20 (3.3) 527 (5.8)
England 19 (4.0) 595 (6.5) 52 (4.8) 553 (3.3) 11 (3.0) 503 (12.2) 19 (3.8) 545 (6.9)
France 14 (2.3) 554 (5.5) 65 (3.6) 527 (2.5) 4 (1.2) 485 (9.8) 17 (3.0) 505 (6.7)
Germany 14 (2.4) 561 (3.8) 51 (3.3) 543 (2.6) 7 (1.7) 504 (10.2) 29 (2.6) 533 (3.7)
Greece 49 (4.4) 539 (5.9) 27 (3.5) 513 (6.1) 2 (1.0) ~ ~ 22 (3.5) 509 (6.7)
Hong Kong, SAR 8 (2.4) 557 (7.4) 62 (4.4) 537 (3.4) 15 (3.0) 499 (9.5) 15 (2.9) 508 (7.1)
Hungary 2 (1.1) ~ ~ 72 (3.5) 548 (2.8) 2 (1.0) ~ ~ 24 (3.2) 532 (5.0)
Iceland 26 (0.3) 523 (2.3) 45 (0.4) 512 (1.9) 1 (0.1) ~ ~ 28 (0.4) 507 (2.3)
Iran, Islamic Rep. of 39 (4.4) 427 (6.4) 47 (4.2) 409 (6.3) 6 (3.1) 350 (16.5) 8 (2.2) 414 (13.0)
Israel 18 (3.3) 504 (13.6) 54 (4.8) 522 (6.0) 6 (1.8) 437 (22.0) 22 (4.1) 504 (11.5)
Italy 8 (2.1) 539 (8.0) 82 (2.8) 543 (2.6) 2 (1.1) ~ ~ 8 (1.9) 519 (14.9)
Kuwait 21 (3.1) 406 (9.0) 57 (3.7) 407 (5.7) 6 (1.8) 398 (19.5) 15 (2.4) 367 (10.7)
Latvia 34 (4.8) 557 (4.3) 39 (4.4) 540 (3.8) 0 (0.0) ~ ~ 26 (4.3) 537 (5.4)
Lithuania 23 (3.6) 560 (5.1) 39 (4.1) 536 (4.0) 2 (1.1) ~ ~ 36 (4.3) 542 (4.3)
Macedonia, Rep. of 17 (3.2) 444 (13.0) 81 (3.2) 446 (5.5) 1 (0.8) ~ ~ 1 (0.8) ~ ~
Moldova, Rep. of 12 (2.9) 501 (8.9) 76 (3.8) 495 (5.5) 8 (2.3) 470 (13.7) 4 (1.9) 486 (23.1)
Morocco 20 (3.4) 359 (18.4) 51 (5.2) 351 (13.0) 13 (3.5) 294 (17.1) 16 (4.1) 348 (20.2)
Netherlands 16 (3.2) 568 (4.4) 61 (4.3) 556 (2.8) 6 (2.2) 520 (14.8) 17 (3.3) 546 (6.1)
New Zealand 30 (4.0) 562 (6.7) 46 (4.5) 514 (4.9) 5 (1.5) 489 (11.1) 19 (3.6) 517 (9.1)
Norway 9 (1.7) 520 (11.8) 72 (3.9) 498 (3.8) 1 (0.6) ~ ~ 19 (3.5) 494 (4.5)
Romania 36 (4.9) 533 (8.5) 58 (4.9) 502 (5.2) 0 (0.0) ~ ~ 6 (2.2) 480 (23.0)
Russian Federation 16 (2.2) 540 (6.6) 52 (3.4) 529 (5.9) 2 (0.9) ~ ~ 30 (3.3) 522 (7.5)
Scotland 10 (2.7) 573 (8.1) 65 (4.7) 526 (4.4) 4 (1.8) 481 (20.0) 22 (4.1) 524 (10.0)
Singapore 20 (3.3) 609 (5.4) 61 (4.0) 528 (3.9) 12 (2.3) 424 (20.1) 7 (1.9) 476 (11.3)
Slovak Republic 12 (2.7) 542 (8.0) 71 (4.0) 519 (3.4) 1 (0.7) ~ ~ 17 (3.1) 500 (10.5)
Slovenia 4 (1.7) 511 (6.1) 70 (3.4) 504 (2.7) 1 (0.5) ~ ~ 25 (3.6) 492 (3.9)
Sweden 11 (1.9) 585 (4.8) 59 (3.8) 562 (2.9) 6 (1.4) 536 (9.7) 24 (3.2) 555 (3.8)
Turkey 40 (4.6) 471 (6.5) 43 (4.0) 439 (5.1) 5 (2.0) 402 (20.0) 12 (2.8) 431 (11.1)
United States 6 (1.6) 594 (11.6) 64 (4.6) 556 (4.2) 17 (3.5) 490 (7.9) 13 (3.1) 524 (9.8)
International Avg. 18 (0.5) 521 (1.6) 56 (0.7) 500 (0.9) 6 (0.3) 447 (4.5) 19 (0.5) 491 (2.0)
Average Below Average Level Varies GreatlyAbove Average
Percent ofStudents
AverageAchievement
Percent ofStudents
AverageAchievement
Percent ofStudents
AverageAchievement
Percent ofStudents
AverageAchievement
Countries
Background data provided by teachers.
( ) Standard errors appear in parentheses. Because results are rounded to the nearest wholenumber, some totals may appear inconsistent.
An “r” indicates data are available for 70-84% of the students. An “s” indicates data areavailable for 50-69% of the students. An “x” indicates data are available for less than 50% of the students.
A dash (–) indicates data are not available. A tilde (~) indicates insufficient data to reportachievement.
SOU
RCE:
IEA
Pro
gres
s in
Inte
rnat
iona
l Rea
ding
Lite
racy
Stu
dy (P
IRLS
) 200
1.
ISC 4th GradePIRLS 2001

[153]chapter 5: school curriculum and organization for teaching reading
students in Canada (O,Q), England, Iceland, Israel, Kuwait, New Zealand, andSweden. All students following the reading instructional program at the samespeed was relatively rare, with just 11 percent of students internationally inschools where this was reported to be the practice.
Teachers’ reports about the reading level of the fourth-grade students inthe PIRLS class indicate that most students (56%) were in classes that the teacherconsidered to be of average ability (Exhibit 5.16). Countries with relativelyhigher percentages in average classes included the Czech Republic, Hungary,Italy, Macedonia, Moldova, Norway, the Slovak Republic, and Slovenia, where70 percent or more of students were in such classes. Although only 18 percentof students internationally were in above average classes in their teachers’ esti-mation, in countries such as Bulgaria, Cyprus, Greece, and Turkey, there were40 percent or more of students in above average classes. Students’ averagereading performance on the PIRLS assessment were generally in line withteachers’ reports, with students in above-average classes performing abovethose in average classes, and those in average classes scoring above those inbelow-average classes. Students in classes where the teacher reported that thereading level varies greatly had average reading performance just below theinternational average.
As shown in Exhibit 5.17, on average, internationally, about half thestudents (56%) were in classrooms where all students were reading the samematerials but at their own speeds and another one-third (32%) were readingdifferent materials according to their reading levels. Hong Kong is the onlycountry where a substantial percentage of the students – 38 percent – usedthe same materials at the same speed regardless of their reading levels.
When teaching language to their fourth-grade students, the preferredapproach of the PIRLS teachers was to combine the teaching of language as aseparate subject with doing reading instruction or language activities as partof teaching other curricular areas. Exhibit 5.18 shows that, on average, 58percent of students were in schools combining the separate and integratedapproaches, compared with 21 percent in schools doing language instructionas part of instruction in other curricular areas, and 20 percent where languagewas taught as a separate subject.
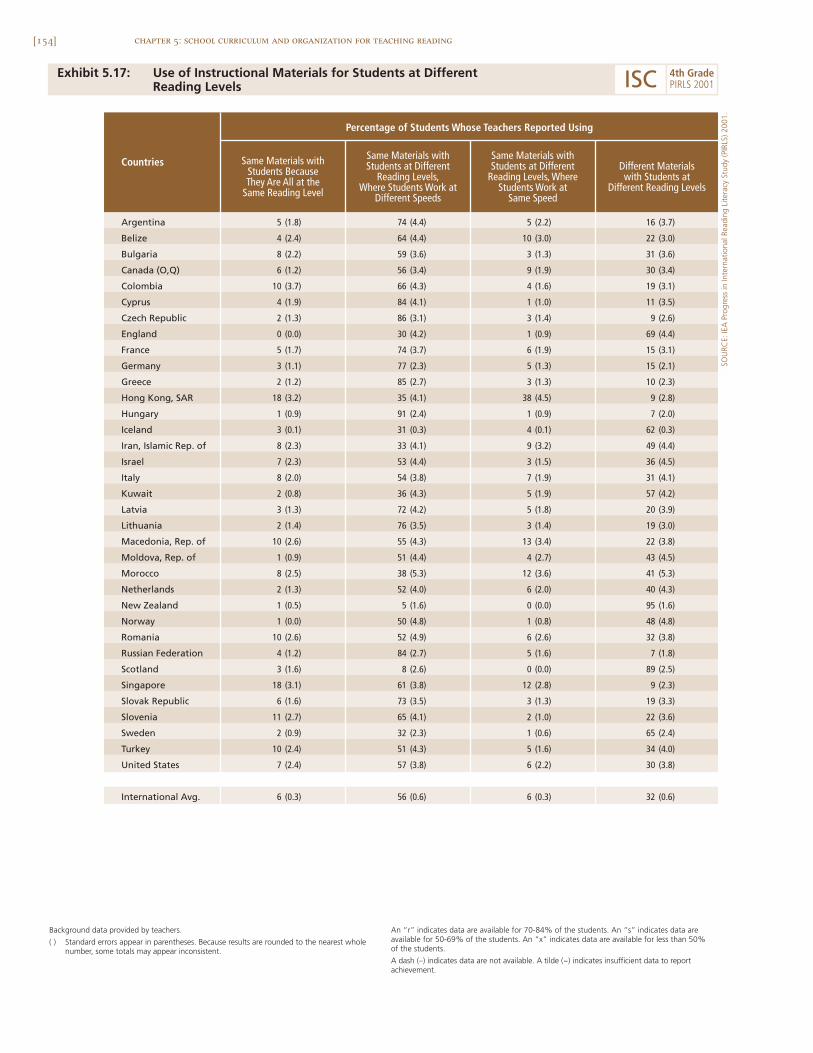
[154] chapter 5: school curriculum and organization for teaching reading
Exhibit 5.17: Use of Instructional Materials for Students at Different Reading Levels
Argentina 5 (1.8) 74 (4.4) 5 (2.2) 16 (3.7)
Belize 4 (2.4) 64 (4.4) 10 (3.0) 22 (3.0)
Bulgaria 8 (2.2) 59 (3.6) 3 (1.3) 31 (3.6)
Canada (O,Q) 6 (1.2) 56 (3.4) 9 (1.9) 30 (3.4)
Colombia 10 (3.7) 66 (4.3) 4 (1.6) 19 (3.1)
Cyprus 4 (1.9) 84 (4.1) 1 (1.0) 11 (3.5)
Czech Republic 2 (1.3) 86 (3.1) 3 (1.4) 9 (2.6)
England 0 (0.0) 30 (4.2) 1 (0.9) 69 (4.4)
France 5 (1.7) 74 (3.7) 6 (1.9) 15 (3.1)
Germany 3 (1.1) 77 (2.3) 5 (1.3) 15 (2.1)
Greece 2 (1.2) 85 (2.7) 3 (1.3) 10 (2.3)
Hong Kong, SAR 18 (3.2) 35 (4.1) 38 (4.5) 9 (2.8)
Hungary 1 (0.9) 91 (2.4) 1 (0.9) 7 (2.0)
Iceland 3 (0.1) 31 (0.3) 4 (0.1) 62 (0.3)
Iran, Islamic Rep. of 8 (2.3) 33 (4.1) 9 (3.2) 49 (4.4)
Israel 7 (2.3) 53 (4.4) 3 (1.5) 36 (4.5)
Italy 8 (2.0) 54 (3.8) 7 (1.9) 31 (4.1)
Kuwait 2 (0.8) 36 (4.3) 5 (1.9) 57 (4.2)
Latvia 3 (1.3) 72 (4.2) 5 (1.8) 20 (3.9)
Lithuania 2 (1.4) 76 (3.5) 3 (1.4) 19 (3.0)
Macedonia, Rep. of 10 (2.6) 55 (4.3) 13 (3.4) 22 (3.8)
Moldova, Rep. of 1 (0.9) 51 (4.4) 4 (2.7) 43 (4.5)
Morocco 8 (2.5) 38 (5.3) 12 (3.6) 41 (5.3)
Netherlands 2 (1.3) 52 (4.0) 6 (2.0) 40 (4.3)
New Zealand 1 (0.5) 5 (1.6) 0 (0.0) 95 (1.6)
Norway 1 (0.0) 50 (4.8) 1 (0.8) 48 (4.8)
Romania 10 (2.6) 52 (4.9) 6 (2.6) 32 (3.8)
Russian Federation 4 (1.2) 84 (2.7) 5 (1.6) 7 (1.8)
Scotland 3 (1.6) 8 (2.6) 0 (0.0) 89 (2.5)
Singapore 18 (3.1) 61 (3.8) 12 (2.8) 9 (2.3)
Slovak Republic 6 (1.6) 73 (3.5) 3 (1.3) 19 (3.3)
Slovenia 11 (2.7) 65 (4.1) 2 (1.0) 22 (3.6)
Sweden 2 (0.9) 32 (2.3) 1 (0.6) 65 (2.4)
Turkey 10 (2.4) 51 (4.3) 5 (1.6) 34 (4.0)
United States 7 (2.4) 57 (3.8) 6 (2.2) 30 (3.8)
International Avg. 6 (0.3) 56 (0.6) 6 (0.3) 32 (0.6)
Percentage of Students Whose Teachers Reported Using
Countries Same Materials withStudents BecauseThey Are All at the
Same Reading Level
Same Materials withStudents at Different
Reading Levels,Where Students Work at
Different Speeds
Different Materialswith Students at
Different Reading Levels
Same Materials withStudents at Different
Reading Levels, WhereStudents Work at
Same Speed
Background data provided by teachers.
( ) Standard errors appear in parentheses. Because results are rounded to the nearest wholenumber, some totals may appear inconsistent.
An “r” indicates data are available for 70-84% of the students. An “s” indicates data areavailable for 50-69% of the students. An “x” indicates data are available for less than 50% of the students.
A dash (–) indicates data are not available. A tilde (~) indicates insufficient data to reportachievement.
SOU
RCE:
IEA
Pro
gres
s in
Inte
rnat
iona
l Rea
ding
Lite
racy
Stu
dy (P
IRLS
) 200
1.
ISC 4th GradePIRLS 2001
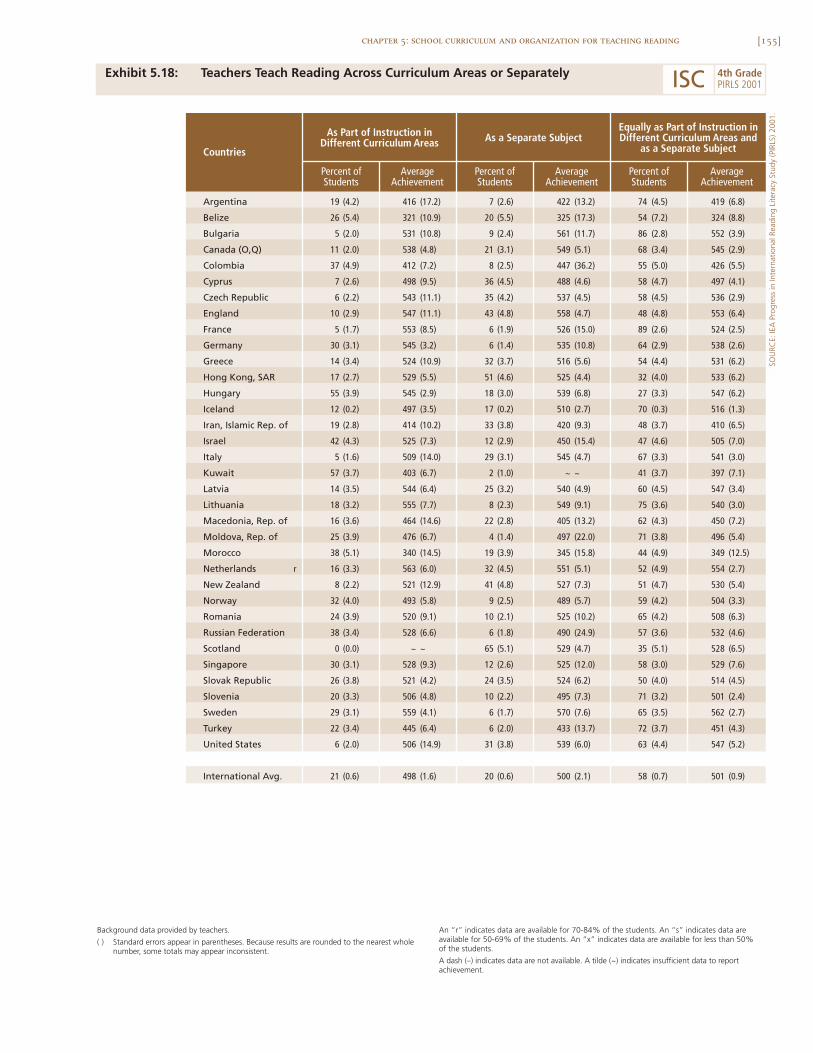
[155]chapter 5: school curriculum and organization for teaching reading
Exhibit 5.18: Teachers Teach Reading Across Curriculum Areas or Separately
SOU
RCE:
IEA
Pro
gres
s in
Inte
rnat
iona
l Rea
ding
Lite
racy
Stu
dy (P
IRLS
) 200
1.
Argentina 19 (4.2) 416 (17.2) 7 (2.6) 422 (13.2) 74 (4.5) 419 (6.8)
Belize 26 (5.4) 321 (10.9) 20 (5.5) 325 (17.3) 54 (7.2) 324 (8.8)
Bulgaria 5 (2.0) 531 (10.8) 9 (2.4) 561 (11.7) 86 (2.8) 552 (3.9)
Canada (O,Q) 11 (2.0) 538 (4.8) 21 (3.1) 549 (5.1) 68 (3.4) 545 (2.9)
Colombia 37 (4.9) 412 (7.2) 8 (2.5) 447 (36.2) 55 (5.0) 426 (5.5)
Cyprus 7 (2.6) 498 (9.5) 36 (4.5) 488 (4.6) 58 (4.7) 497 (4.1)
Czech Republic 6 (2.2) 543 (11.1) 35 (4.2) 537 (4.5) 58 (4.5) 536 (2.9)
England 10 (2.9) 547 (11.1) 43 (4.8) 558 (4.7) 48 (4.8) 553 (6.4)
France 5 (1.7) 553 (8.5) 6 (1.9) 526 (15.0) 89 (2.6) 524 (2.5)
Germany 30 (3.1) 545 (3.2) 6 (1.4) 535 (10.8) 64 (2.9) 538 (2.6)
Greece 14 (3.4) 524 (10.9) 32 (3.7) 516 (5.6) 54 (4.4) 531 (6.2)
Hong Kong, SAR 17 (2.7) 529 (5.5) 51 (4.6) 525 (4.4) 32 (4.0) 533 (6.2)
Hungary 55 (3.9) 545 (2.9) 18 (3.0) 539 (6.8) 27 (3.3) 547 (6.2)
Iceland 12 (0.2) 497 (3.5) 17 (0.2) 510 (2.7) 70 (0.3) 516 (1.3)
Iran, Islamic Rep. of 19 (2.8) 414 (10.2) 33 (3.8) 420 (9.3) 48 (3.7) 410 (6.5)
Israel 42 (4.3) 525 (7.3) 12 (2.9) 450 (15.4) 47 (4.6) 505 (7.0)
Italy 5 (1.6) 509 (14.0) 29 (3.1) 545 (4.7) 67 (3.3) 541 (3.0)
Kuwait 57 (3.7) 403 (6.7) 2 (1.0) ~ ~ 41 (3.7) 397 (7.1)
Latvia 14 (3.5) 544 (6.4) 25 (3.2) 540 (4.9) 60 (4.5) 547 (3.4)
Lithuania 18 (3.2) 555 (7.7) 8 (2.3) 549 (9.1) 75 (3.6) 540 (3.0)
Macedonia, Rep. of 16 (3.6) 464 (14.6) 22 (2.8) 405 (13.2) 62 (4.3) 450 (7.2)
Moldova, Rep. of 25 (3.9) 476 (6.7) 4 (1.4) 497 (22.0) 71 (3.8) 496 (5.4)
Morocco 38 (5.1) 340 (14.5) 19 (3.9) 345 (15.8) 44 (4.9) 349 (12.5)
Netherlands r 16 (3.3) 563 (6.0) 32 (4.5) 551 (5.1) 52 (4.9) 554 (2.7)
New Zealand 8 (2.2) 521 (12.9) 41 (4.8) 527 (7.3) 51 (4.7) 530 (5.4)
Norway 32 (4.0) 493 (5.8) 9 (2.5) 489 (5.7) 59 (4.2) 504 (3.3)
Romania 24 (3.9) 520 (9.1) 10 (2.1) 525 (10.2) 65 (4.2) 508 (6.3)
Russian Federation 38 (3.4) 528 (6.6) 6 (1.8) 490 (24.9) 57 (3.6) 532 (4.6)
Scotland 0 (0.0) ~ ~ 65 (5.1) 529 (4.7) 35 (5.1) 528 (6.5)
Singapore 30 (3.1) 528 (9.3) 12 (2.6) 525 (12.0) 58 (3.0) 529 (7.6)
Slovak Republic 26 (3.8) 521 (4.2) 24 (3.5) 524 (6.2) 50 (4.0) 514 (4.5)
Slovenia 20 (3.3) 506 (4.8) 10 (2.2) 495 (7.3) 71 (3.2) 501 (2.4)
Sweden 29 (3.1) 559 (4.1) 6 (1.7) 570 (7.6) 65 (3.5) 562 (2.7)
Turkey 22 (3.4) 445 (6.4) 6 (2.0) 433 (13.7) 72 (3.7) 451 (4.3)
United States 6 (2.0) 506 (14.9) 31 (3.8) 539 (6.0) 63 (4.4) 547 (5.2)
International Avg. 21 (0.6) 498 (1.6) 20 (0.6) 500 (2.1) 58 (0.7) 501 (0.9)
Equally as Part of Instruction inDifferent Curriculum Areas and
as a Separate Subject
As Part of Instruction inDifferent Curriculum Areas As a Separate Subject
Countries
AverageAchievement
Percent ofStudents
AverageAchievement
Percent ofStudents
AverageAchievement
Percent ofStudents
Background data provided by teachers.
( ) Standard errors appear in parentheses. Because results are rounded to the nearest wholenumber, some totals may appear inconsistent.
An “r” indicates data are available for 70-84% of the students. An “s” indicates data areavailable for 50-69% of the students. An “x” indicates data are available for less than 50% of the students.
A dash (–) indicates data are not available. A tilde (~) indicates insufficient data to reportachievement.
ISC 4th GradePIRLS 2001
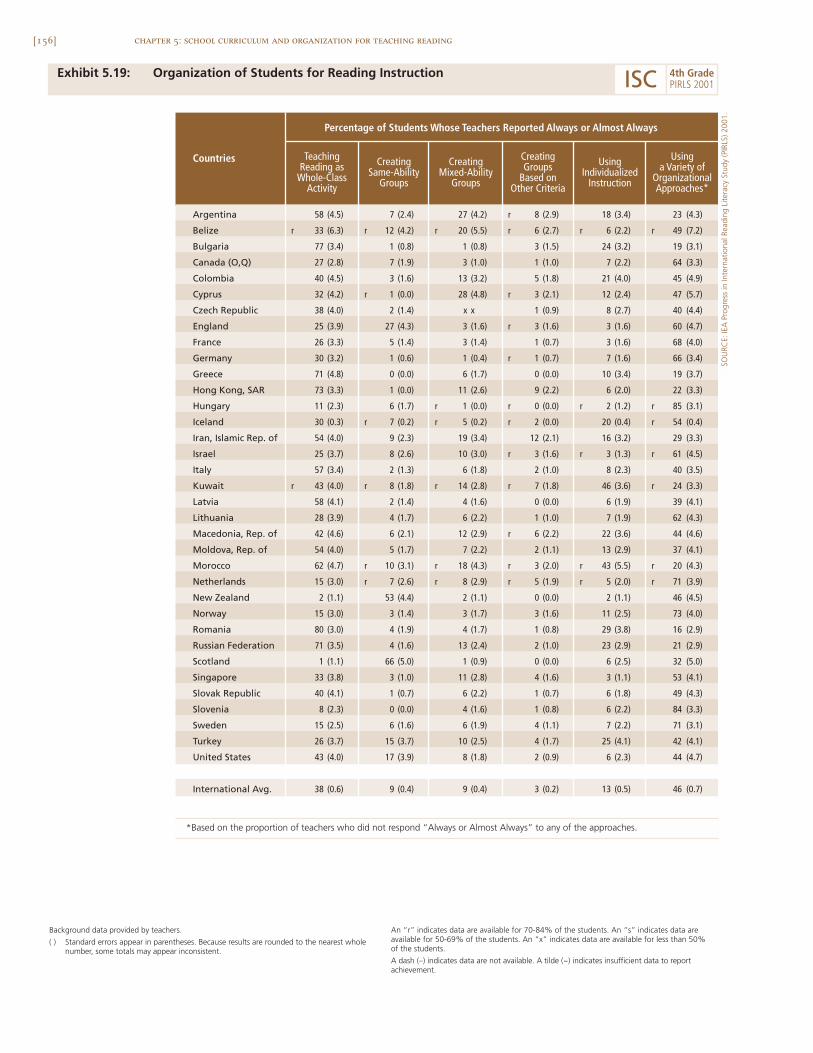
[156] chapter 5: school curriculum and organization for teaching reading
Exhibit 5.19: Organization of Students for Reading Instruction
Argentina 58 (4.5) 7 (2.4) 27 (4.2) r 8 (2.9) 18 (3.4) 23 (4.3)
Belize r 33 (6.3) r 12 (4.2) r 20 (5.5) r 6 (2.7) r 6 (2.2) r 49 (7.2)
Bulgaria 77 (3.4) 1 (0.8) 1 (0.8) 3 (1.5) 24 (3.2) 19 (3.1)
Canada (O,Q) 27 (2.8) 7 (1.9) 3 (1.0) 1 (1.0) 7 (2.2) 64 (3.3)
Colombia 40 (4.5) 3 (1.6) 13 (3.2) 5 (1.8) 21 (4.0) 45 (4.9)
Cyprus 32 (4.2) r 1 (0.0) 28 (4.8) r 3 (2.1) 12 (2.4) 47 (5.7)
Czech Republic 38 (4.0) 2 (1.4) x x 1 (0.9) 8 (2.7) 40 (4.4)
England 25 (3.9) 27 (4.3) 3 (1.6) r 3 (1.6) 3 (1.6) 60 (4.7)
France 26 (3.3) 5 (1.4) 3 (1.4) 1 (0.7) 3 (1.6) 68 (4.0)
Germany 30 (3.2) 1 (0.6) 1 (0.4) r 1 (0.7) 7 (1.6) 66 (3.4)
Greece 71 (4.8) 0 (0.0) 6 (1.7) 0 (0.0) 10 (3.4) 19 (3.7)
Hong Kong, SAR 73 (3.3) 1 (0.0) 11 (2.6) 9 (2.2) 6 (2.0) 22 (3.3)
Hungary 11 (2.3) 6 (1.7) r 1 (0.0) r 0 (0.0) r 2 (1.2) r 85 (3.1)
Iceland 30 (0.3) r 7 (0.2) r 5 (0.2) r 2 (0.0) 20 (0.4) r 54 (0.4)
Iran, Islamic Rep. of 54 (4.0) 9 (2.3) 19 (3.4) 12 (2.1) 16 (3.2) 29 (3.3)
Israel 25 (3.7) 8 (2.6) 10 (3.0) r 3 (1.6) r 3 (1.3) r 61 (4.5)
Italy 57 (3.4) 2 (1.3) 6 (1.8) 2 (1.0) 8 (2.3) 40 (3.5)
Kuwait r 43 (4.0) r 8 (1.8) r 14 (2.8) r 7 (1.8) 46 (3.6) r 24 (3.3)
Latvia 58 (4.1) 2 (1.4) 4 (1.6) 0 (0.0) 6 (1.9) 39 (4.1)
Lithuania 28 (3.9) 4 (1.7) 6 (2.2) 1 (1.0) 7 (1.9) 62 (4.3)
Macedonia, Rep. of 42 (4.6) 6 (2.1) 12 (2.9) r 6 (2.2) 22 (3.6) 44 (4.6)
Moldova, Rep. of 54 (4.0) 5 (1.7) 7 (2.2) 2 (1.1) 13 (2.9) 37 (4.1)
Morocco 62 (4.7) r 10 (3.1) r 18 (4.3) r 3 (2.0) r 43 (5.5) r 20 (4.3)
Netherlands 15 (3.0) r 7 (2.6) r 8 (2.9) r 5 (1.9) r 5 (2.0) r 71 (3.9)
New Zealand 2 (1.1) 53 (4.4) 2 (1.1) 0 (0.0) 2 (1.1) 46 (4.5)
Norway 15 (3.0) 3 (1.4) 3 (1.7) 3 (1.6) 11 (2.5) 73 (4.0)
Romania 80 (3.0) 4 (1.9) 4 (1.7) 1 (0.8) 29 (3.8) 16 (2.9)
Russian Federation 71 (3.5) 4 (1.6) 13 (2.4) 2 (1.0) 23 (2.9) 21 (2.9)
Scotland 1 (1.1) 66 (5.0) 1 (0.9) 0 (0.0) 6 (2.5) 32 (5.0)
Singapore 33 (3.8) 3 (1.0) 11 (2.8) 4 (1.6) 3 (1.1) 53 (4.1)
Slovak Republic 40 (4.1) 1 (0.7) 6 (2.2) 1 (0.7) 6 (1.8) 49 (4.3)
Slovenia 8 (2.3) 0 (0.0) 4 (1.6) 1 (0.8) 6 (2.2) 84 (3.3)
Sweden 15 (2.5) 6 (1.6) 6 (1.9) 4 (1.1) 7 (2.2) 71 (3.1)
Turkey 26 (3.7) 15 (3.7) 10 (2.5) 4 (1.7) 25 (4.1) 42 (4.1)
United States 43 (4.0) 17 (3.9) 8 (1.8) 2 (0.9) 6 (2.3) 44 (4.7)
International Avg. 38 (0.6) 9 (0.4) 9 (0.4) 3 (0.2) 13 (0.5) 46 (0.7)
Usinga Variety of
OrganizationalApproaches*
CreatingSame-Ability
Groups
CreatingMixed-Ability
Groups
CreatingGroups
Based onOther Criteria
UsingIndividualized
Instruction
Countries
Percentage of Students Whose Teachers Reported Always or Almost Always
TeachingReading as
Whole-ClassActivity
Background data provided by teachers.
( ) Standard errors appear in parentheses. Because results are rounded to the nearest wholenumber, some totals may appear inconsistent.
An “r” indicates data are available for 70-84% of the students. An “s” indicates data areavailable for 50-69% of the students. An “x” indicates data are available for less than 50% of the students.
A dash (–) indicates data are not available. A tilde (~) indicates insufficient data to reportachievement.
SOU
RCE:
IEA
Pro
gres
s in
Inte
rnat
iona
l Rea
ding
Lite
racy
Stu
dy (P
IRLS
) 200
1.
ISC 4th GradePIRLS 2001
*Based on the proportion of teachers who did not respond “Always or Almost Always” to any of the approaches.
[157]chapter 5: school curriculum and organization for teaching reading
Exhibit 5.19 presents teachers’ reports of how they grouped theirfourth-grade students for reading instruction or reading activities. Teachingreading as a whole-class activity was the most popular approach, with 38percent of students, on average, in classes where the teacher always or almostalways chose this method. The whole-class approach was particularly commonin Bulgaria, Greece, Hong Kong, Romania, and the Russian Federation, wheremore than 70 percent of students were taught by teachers preferring this strat-egy. Creating groups on the basis of the same ability, mixed ability, or indeedany other basis were less frequent occurrences, although in New Zealand andScotland the majority of students were taught by teachers that always createdsame-ability groups for reading instruction. Although teaching the whole classwas the most usual single organizational approach to teaching reading, in manycountries teachers reported that they used different grouping strategies at dif-ferent times. For example, in 13 countries (Canada (O,Q), England, France,Germany, Hungary, Iceland, Israel, Lithuania, The Netherlands, Norway, Sin-gapore, Slovenia, and Sweden) the majority of students were taught by teach-ers using a variety of grouping arrangements.
How Big Are Classes for Reading and Language Instruction?
The number of students in the class can have a significant impact on howteachers arrange students for reading instruction and on the teaching strate-gies they adopt. Exhibit 5.20 presents teachers’ reports on the size of theirfourth-grade class for reading and language instruction.2 Across all PIRLScountries the average class size was 26 students, with the majority of students(54%) in classes with between 21 and 30 students. However, there was con-siderable variation around this average. In Greece, Iceland, Italy, and Norway,50 percent or more of students were in classes with no more than 20 students,while in Colombia, Hong Kong, Israel, Morocco, Singapore, and Turkey, themajority of student were in classes containing 31 or more students. The rela-tionship between class size and reading achievement is difficult to interpretand is complicated by the fact that small classes are sometimes used both forremedial students and for students receiving advanced instruction.
2 Class size was taken to be the total number of students in the class. For multi-grade classes (classes with students from more than one gradelevel) this included students from other grades. There was little difference in most countries between the size of entire classes and classescounting only fourth-graders. Compared to 26 for the average class size for entire classes (see Exhibit 5.20), the average number of fourth-grade students in classrooms across countries was 24.
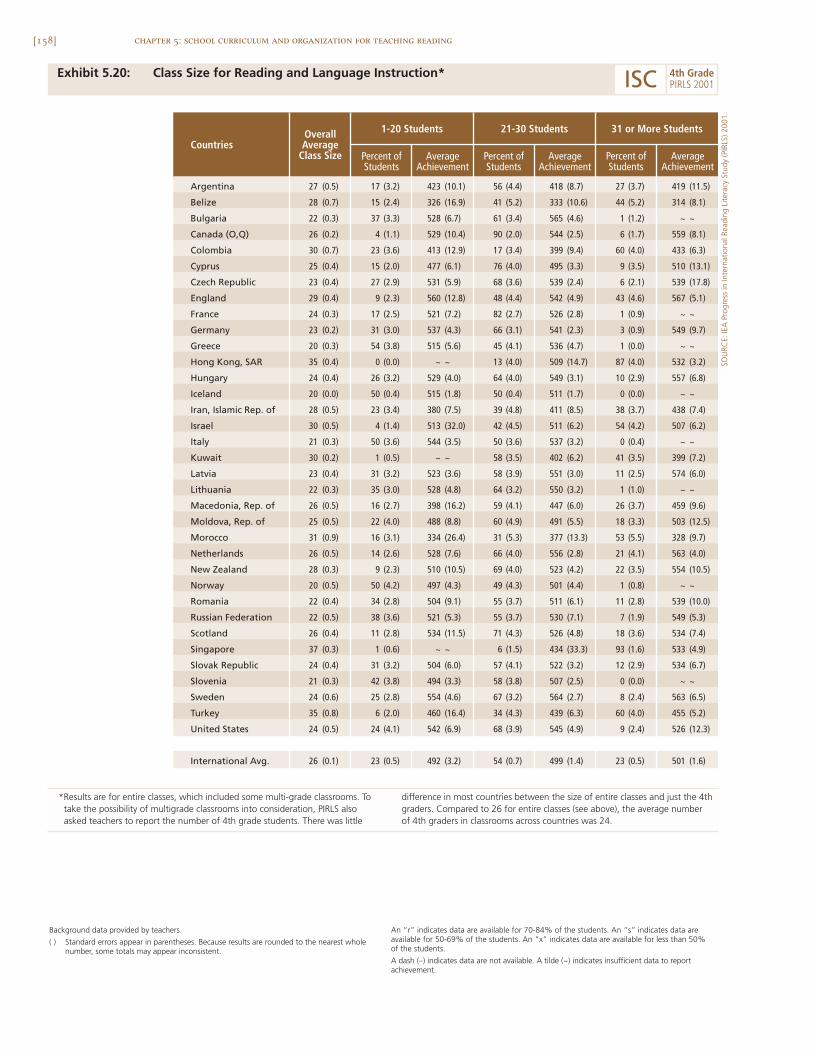
[158] chapter 5: school curriculum and organization for teaching reading
Exhibit 5.20: Class Size for Reading and Language Instruction*
Argentina 27 (0.5) 17 (3.2) 423 (10.1) 56 (4.4) 418 (8.7) 27 (3.7) 419 (11.5)
Belize 28 (0.7) 15 (2.4) 326 (16.9) 41 (5.2) 333 (10.6) 44 (5.2) 314 (8.1)
Bulgaria 22 (0.3) 37 (3.3) 528 (6.7) 61 (3.4) 565 (4.6) 1 (1.2) ~ ~
Canada (O,Q) 26 (0.2) 4 (1.1) 529 (10.4) 90 (2.0) 544 (2.5) 6 (1.7) 559 (8.1)
Colombia 30 (0.7) 23 (3.6) 413 (12.9) 17 (3.4) 399 (9.4) 60 (4.0) 433 (6.3)
Cyprus 25 (0.4) 15 (2.0) 477 (6.1) 76 (4.0) 495 (3.3) 9 (3.5) 510 (13.1)
Czech Republic 23 (0.4) 27 (2.9) 531 (5.9) 68 (3.6) 539 (2.4) 6 (2.1) 539 (17.8)
England 29 (0.4) 9 (2.3) 560 (12.8) 48 (4.4) 542 (4.9) 43 (4.6) 567 (5.1)
France 24 (0.3) 17 (2.5) 521 (7.2) 82 (2.7) 526 (2.8) 1 (0.9) ~ ~
Germany 23 (0.2) 31 (3.0) 537 (4.3) 66 (3.1) 541 (2.3) 3 (0.9) 549 (9.7)
Greece 20 (0.3) 54 (3.8) 515 (5.6) 45 (4.1) 536 (4.7) 1 (0.0) ~ ~
Hong Kong, SAR 35 (0.4) 0 (0.0) ~ ~ 13 (4.0) 509 (14.7) 87 (4.0) 532 (3.2)
Hungary 24 (0.4) 26 (3.2) 529 (4.0) 64 (4.0) 549 (3.1) 10 (2.9) 557 (6.8)
Iceland 20 (0.0) 50 (0.4) 515 (1.8) 50 (0.4) 511 (1.7) 0 (0.0) ~ ~
Iran, Islamic Rep. of 28 (0.5) 23 (3.4) 380 (7.5) 39 (4.8) 411 (8.5) 38 (3.7) 438 (7.4)
Israel 30 (0.5) 4 (1.4) 513 (32.0) 42 (4.5) 511 (6.2) 54 (4.2) 507 (6.2)
Italy 21 (0.3) 50 (3.6) 544 (3.5) 50 (3.6) 537 (3.2) 0 (0.4) ~ ~
Kuwait 30 (0.2) 1 (0.5) ~ ~ 58 (3.5) 402 (6.2) 41 (3.5) 399 (7.2)
Latvia 23 (0.4) 31 (3.2) 523 (3.6) 58 (3.9) 551 (3.0) 11 (2.5) 574 (6.0)
Lithuania 22 (0.3) 35 (3.0) 528 (4.8) 64 (3.2) 550 (3.2) 1 (1.0) ~ ~
Macedonia, Rep. of 26 (0.5) 16 (2.7) 398 (16.2) 59 (4.1) 447 (6.0) 26 (3.7) 459 (9.6)
Moldova, Rep. of 25 (0.5) 22 (4.0) 488 (8.8) 60 (4.9) 491 (5.5) 18 (3.3) 503 (12.5)
Morocco 31 (0.9) 16 (3.1) 334 (26.4) 31 (5.3) 377 (13.3) 53 (5.5) 328 (9.7)
Netherlands 26 (0.5) 14 (2.6) 528 (7.6) 66 (4.0) 556 (2.8) 21 (4.1) 563 (4.0)
New Zealand 28 (0.3) 9 (2.3) 510 (10.5) 69 (4.0) 523 (4.2) 22 (3.5) 554 (10.5)
Norway 20 (0.5) 50 (4.2) 497 (4.3) 49 (4.3) 501 (4.4) 1 (0.8) ~ ~
Romania 22 (0.4) 34 (2.8) 504 (9.1) 55 (3.7) 511 (6.1) 11 (2.8) 539 (10.0)
Russian Federation 22 (0.5) 38 (3.6) 521 (5.3) 55 (3.7) 530 (7.1) 7 (1.9) 549 (5.3)
Scotland 26 (0.4) 11 (2.8) 534 (11.5) 71 (4.3) 526 (4.8) 18 (3.6) 534 (7.4)
Singapore 37 (0.3) 1 (0.6) ~ ~ 6 (1.5) 434 (33.3) 93 (1.6) 533 (4.9)
Slovak Republic 24 (0.4) 31 (3.2) 504 (6.0) 57 (4.1) 522 (3.2) 12 (2.9) 534 (6.7)
Slovenia 21 (0.3) 42 (3.8) 494 (3.3) 58 (3.8) 507 (2.5) 0 (0.0) ~ ~
Sweden 24 (0.6) 25 (2.8) 554 (4.6) 67 (3.2) 564 (2.7) 8 (2.4) 563 (6.5)
Turkey 35 (0.8) 6 (2.0) 460 (16.4) 34 (4.3) 439 (6.3) 60 (4.0) 455 (5.2)
United States 24 (0.5) 24 (4.1) 542 (6.9) 68 (3.9) 545 (4.9) 9 (2.4) 526 (12.3)
International Avg. 26 (0.1) 23 (0.5) 492 (3.2) 54 (0.7) 499 (1.4) 23 (0.5) 501 (1.6)
Countries
1-20 Students 21-30 Students 31 or More StudentsOverallAverage
Class Size AverageAchievement
Percent ofStudents
AverageAchievement
Percent ofStudents
AverageAchievement
Percent ofStudents
Background data provided by teachers.
( ) Standard errors appear in parentheses. Because results are rounded to the nearest wholenumber, some totals may appear inconsistent.
An “r” indicates data are available for 70-84% of the students. An “s” indicates data areavailable for 50-69% of the students. An “x” indicates data are available for less than 50% of the students.
A dash (–) indicates data are not available. A tilde (~) indicates insufficient data to reportachievement.
SOU
RCE:
IEA
Pro
gres
s in
Inte
rnat
iona
l Rea
ding
Lite
racy
Stu
dy (P
IRLS
) 200
1.
ISC 4th GradePIRLS 2001
*Results are for entire classes, which included some multi-grade classrooms. Totake the possibility of multigrade classrooms into consideration, PIRLS alsoasked teachers to report the number of 4th grade students. There was little
difference in most countries between the size of entire classes and just the 4thgraders. Compared to 26 for entire classes (see above), the average numberof 4th graders in classrooms across countries was 24.
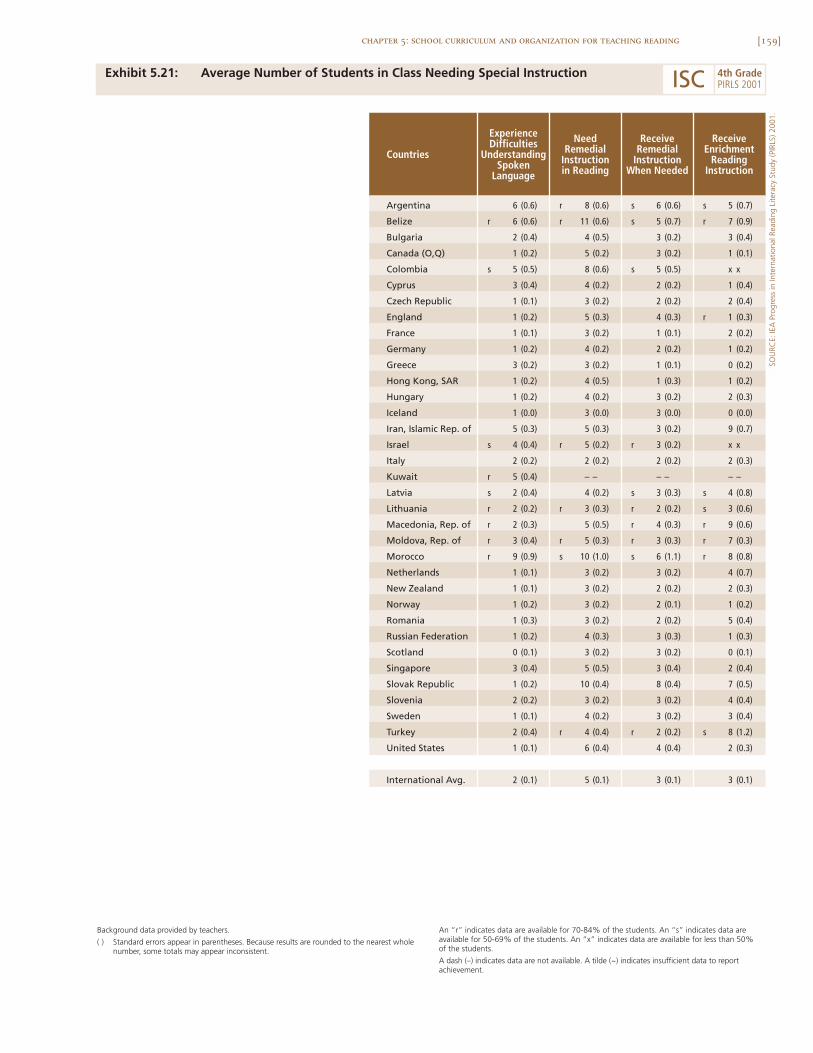
[159]chapter 5: school curriculum and organization for teaching reading
Exhibit 5.21: Average Number of Students in Class Needing Special Instruction
SOU
RCE:
IEA
Pro
gres
s in
Inte
rnat
iona
l Rea
ding
Lite
racy
Stu
dy (P
IRLS
) 200
1.
Countries
Argentina 6 (0.6) r 8 (0.6) s 6 (0.6) s 5 (0.7)
Belize r 6 (0.6) r 11 (0.6) s 5 (0.7) r 7 (0.9)
Bulgaria 2 (0.4) 4 (0.5) 3 (0.2) 3 (0.4)
Canada (O,Q) 1 (0.2) 5 (0.2) 3 (0.2) 1 (0.1)
Colombia s 5 (0.5) 8 (0.6) s 5 (0.5) x x
Cyprus 3 (0.4) 4 (0.2) 2 (0.2) 1 (0.4)
Czech Republic 1 (0.1) 3 (0.2) 2 (0.2) 2 (0.4)
England 1 (0.2) 5 (0.3) 4 (0.3) r 1 (0.3)
France 1 (0.1) 3 (0.2) 1 (0.1) 2 (0.2)
Germany 1 (0.2) 4 (0.2) 2 (0.2) 1 (0.2)
Greece 3 (0.2) 3 (0.2) 1 (0.1) 0 (0.2)
Hong Kong, SAR 1 (0.2) 4 (0.5) 1 (0.3) 1 (0.2)
Hungary 1 (0.2) 4 (0.2) 3 (0.2) 2 (0.3)
Iceland 1 (0.0) 3 (0.0) 3 (0.0) 0 (0.0)
Iran, Islamic Rep. of 5 (0.3) 5 (0.3) 3 (0.2) 9 (0.7)
Israel s 4 (0.4) r 5 (0.2) r 3 (0.2) x x
Italy 2 (0.2) 2 (0.2) 2 (0.2) 2 (0.3)
Kuwait r 5 (0.4) – – – – – –
Latvia s 2 (0.4) 4 (0.2) s 3 (0.3) s 4 (0.8)
Lithuania r 2 (0.2) r 3 (0.3) r 2 (0.2) s 3 (0.6)
Macedonia, Rep. of r 2 (0.3) 5 (0.5) r 4 (0.3) r 9 (0.6)
Moldova, Rep. of r 3 (0.4) r 5 (0.3) r 3 (0.3) r 7 (0.3)
Morocco r 9 (0.9) s 10 (1.0) s 6 (1.1) r 8 (0.8)
Netherlands 1 (0.1) 3 (0.2) 3 (0.2) 4 (0.7)
New Zealand 1 (0.1) 3 (0.2) 2 (0.2) 2 (0.3)
Norway 1 (0.2) 3 (0.2) 2 (0.1) 1 (0.2)
Romania 1 (0.3) 3 (0.2) 2 (0.2) 5 (0.4)
Russian Federation 1 (0.2) 4 (0.3) 3 (0.3) 1 (0.3)
Scotland 0 (0.1) 3 (0.2) 3 (0.2) 0 (0.1)
Singapore 3 (0.4) 5 (0.5) 3 (0.4) 2 (0.4)
Slovak Republic 1 (0.2) 10 (0.4) 8 (0.4) 7 (0.5)
Slovenia 2 (0.2) 3 (0.2) 3 (0.2) 4 (0.4)
Sweden 1 (0.1) 4 (0.2) 3 (0.2) 3 (0.4)
Turkey 2 (0.4) r 4 (0.4) r 2 (0.2) s 8 (1.2)
United States 1 (0.1) 6 (0.4) 4 (0.4) 2 (0.3)
International Avg. 2 (0.1) 5 (0.1) 3 (0.1) 3 (0.1)
ExperienceDifficulties
UnderstandingSpoken
Language
NeedRemedial
Instructionin Reading
ReceiveRemedial
InstructionWhen Needed
ReceiveEnrichment
ReadingInstruction
Background data provided by teachers.
( ) Standard errors appear in parentheses. Because results are rounded to the nearest wholenumber, some totals may appear inconsistent.
An “r” indicates data are available for 70-84% of the students. An “s” indicates data areavailable for 50-69% of the students. An “x” indicates data are available for less than 50% of the students.
A dash (–) indicates data are not available. A tilde (~) indicates insufficient data to reportachievement.
ISC 4th GradePIRLS 2001
[160] chapter 5: school curriculum and organization for teaching reading
How Do Schools Help Students with Reading Difficulties?
To gain an appreciation of the challenges faced by teachers in teaching readingto their fourth-grade students, PIRLS asked teachers about students in theirclass with difficulties with spoken language or with reading. Exhibit 5.21presents teachers’ reports of the number of students in their class who expe-rienced difficulty understanding spoken language, how many needed reme-dial instruction in reading and how many received it, and how many receivedenrichment reading instruction because they were advanced readers.Although in most countries teachers reported very few students with diffi-culty understanding the language of instruction as spoken language, therewere a number of countries, including Argentina, Belize, Colombia, Iran,Kuwait, and Morocco, with five or more such students, on average, in theirfourth-grade reading class.
Students needing remedial instruction in reading posed a more per-vasive problem, with teachers reporting that, on average, five students in theirfourth-grade class were in need of remedial teaching but that only three stu-dents were receiving it. The countries with most students needing remedialreading instruction were essentially those having most students with spokenlanguage difficulties, (i.e., Argentina, Belize, Colombia, and Morocco, althoughthe Slovak Republic also should be included). In general, about as many stu-dents were receiving reading instruction for enrichment because they wereadvanced readers (three students per class, on average) as were receiving reme-dial instruction because they had difficulty keeping up with the rest of theclass. Countries where enrichment instruction for advanced students was mostpopular included Belize, Iran, Macedonia, Moldova, Morocco, the SlovakRepublic, and Turkey, where, on average, seven or more students in each classwere reported to be receiving such instruction.
To find out how they deal with reading difficulties among their fourth-grade students, PIRLS asked teachers about access to remedial or reading spe-cialists or other professionals. Exhibit 5.22 shows that 11 percent of studentswere in classes where the teacher reported having a remedial or reading spe-cialist always available to deal with students having difficulty with reading, and26 percent in classes where such specialists were sometimes available. Almost
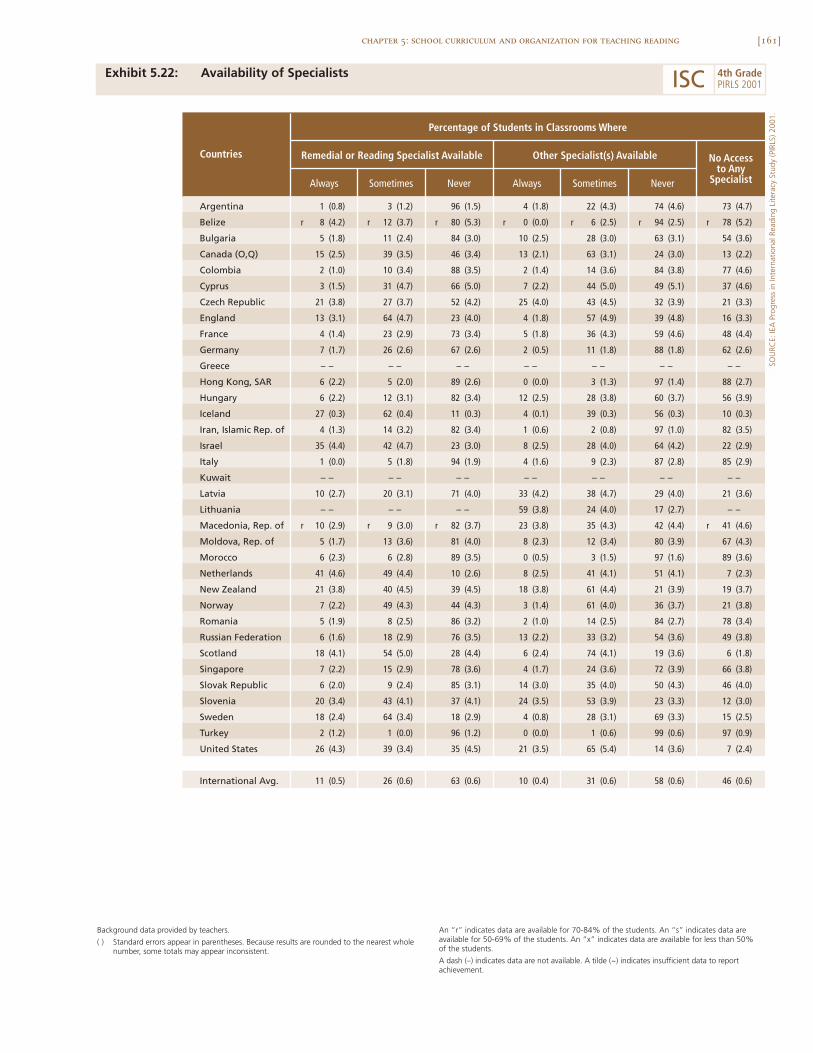
[161]chapter 5: school curriculum and organization for teaching reading
Exhibit 5.22: Availability of Specialists
SOU
RCE:
IEA
Pro
gres
s in
Inte
rnat
iona
l Rea
ding
Lite
racy
Stu
dy (P
IRLS
) 200
1.
Remedial or Reading Specialist Available No Accessto Any
Specialist
Percentage of Students in Classrooms Where
Other Specialist(s) AvailableCountries
Always Sometimes Never Always Sometimes Never
Argentina (0.8) 3 (1.2) 96 (1.5) 4 (1.8) 22 (4.3) 74 (4.6) 73 (4.7)
Belize r (4.2) r 12 (3.7) r 80 (5.3) r 0 (0.0) r 6 (2.5) r 94 (2.5) r 78 (5.2)
Bulgaria (1.8) 11 (2.4) 84 (3.0) 10 (2.5) 28 (3.0) 63 (3.1) 54 (3.6)
Canada (O,Q) 15 (2.5) 39 (3.5) 46 (3.4) 13 (2.1) 63 (3.1) 24 (3.0) 13 (2.2)
Colombia (1.0) 10 (3.4) 88 (3.5) 2 (1.4) 14 (3.6) 84 (3.8) 77 (4.6)
Cyprus (1.5) 31 (4.7) 66 (5.0) 7 (2.2) 44 (5.0) 49 (5.1) 37 (4.6)
Czech Republic (3.8) 27 (3.7) 52 (4.2) 25 (4.0) 43 (4.5) 32 (3.9) 21 (3.3)
England (3.1) 64 (4.7) 23 (4.0) 4 (1.8) 57 (4.9) 39 (4.8) 16 (3.3)
France (1.4) 23 (2.9) 73 (3.4) 5 (1.8) 36 (4.3) 59 (4.6) 48 (4.4)
Germany (1.7) 26 (2.6) 67 (2.6) 2 (0.5) 11 (1.8) 88 (1.8) 62 (2.6)
Greece – – – – – – – – – – – – – –
Hong Kong, SAR (2.2) 5 (2.0) 89 (2.6) 0 (0.0) 3 (1.3) 97 (1.4) 88 (2.7)
Hungary (2.2) 12 (3.1) 82 (3.4) 12 (2.5) 28 (3.8) 60 (3.7) 56 (3.9)
Iceland (0.3) 62 (0.4) 11 (0.3) 4 (0.1) 39 (0.3) 56 (0.3) 10 (0.3)
Iran, Islamic Rep. of (1.3) 14 (3.2) 82 (3.4) 1 (0.6) 2 (0.8) 97 (1.0) 82 (3.5)
Israel (4.4) 42 (4.7) 23 (3.0) 8 (2.5) 28 (4.0) 64 (4.2) 22 (2.9)
Italy (0.0) 5 (1.8) 94 (1.9) 4 (1.6) 9 (2.3) 87 (2.8) 85 (2.9)
Kuwait – – – – – – – – – – – – – –
Latvia (2.7) 20 (3.1) 71 (4.0) 33 (4.2) 38 (4.7) 29 (4.0) 21 (3.6)
Lithuania – – – – – – 59 (3.8) 24 (4.0) 17 (2.7) – –
Macedonia, Rep. of r (2.9) r 9 (3.0) r 82 (3.7) 23 (3.8) 35 (4.3) 42 (4.4) r 41 (4.6)
Moldova, Rep. of (1.7) 13 (3.6) 81 (4.0) 8 (2.3) 12 (3.4) 80 (3.9) 67 (4.3)
Morocco (2.3) 6 (2.8) 89 (3.5) 0 (0.5) 3 (1.5) 97 (1.6) 89 (3.6)
Netherlands (4.6) 49 (4.4) 10 (2.6) 8 (2.5) 41 (4.1) 51 (4.1) 7 (2.3)
New Zealand (3.8) 40 (4.5) 39 (4.5) 18 (3.8) 61 (4.4) 21 (3.9) 19 (3.7)
Norway (2.2) 49 (4.3) 44 (4.3) 3 (1.4) 61 (4.0) 36 (3.7) 21 (3.8)
Romania (1.9) 8 (2.5) 86 (3.2) 2 (1.0) 14 (2.5) 84 (2.7) 78 (3.4)
Russian Federation (1.6) 18 (2.9) 76 (3.5) 13 (2.2) 33 (3.2) 54 (3.6) 49 (3.8)
Scotland (4.1) 54 (5.0) 28 (4.4) 6 (2.4) 74 (4.1) 19 (3.6) 6 (1.8)
Singapore (2.2) 15 (2.9) 78 (3.6) 4 (1.7) 24 (3.6) 72 (3.9) 66 (3.8)
Slovak Republic (2.0) 9 (2.4) 85 (3.1) 14 (3.0) 35 (4.0) 50 (4.3) 46 (4.0)
Slovenia (3.4) 43 (4.1) 37 (4.1) 24 (3.5) 53 (3.9) 23 (3.3) 12 (3.0)
Sweden (2.4) 64 (3.4) 18 (2.9) 4 (0.8) 28 (3.1) 69 (3.3) 15 (2.5)
Turkey (1.2) 1 (0.0) 96 (1.2) 0 (0.0) 1 (0.6) 99 (0.6) 97 (0.9)
United States (4.3) 39 (3.4) 35 (4.5) 21 (3.5) 65 (5.4) 14 (3.6) 7 (2.4)
International Avg. (0.5) 26 (0.6) 63 (0.6) 10 (0.4) 31 (0.6) 58 (0.6) 46 (0.6)
1
8
5
2
3
21
13
4
7
6
6
27
4
35
1
10
10
5
6
41
21
7
5
6
18
7
6
20
18
2
26
11
Background data provided by teachers.
( ) Standard errors appear in parentheses. Because results are rounded to the nearest wholenumber, some totals may appear inconsistent.
An “r” indicates data are available for 70-84% of the students. An “s” indicates data areavailable for 50-69% of the students. An “x” indicates data are available for less than 50% of the students.
A dash (–) indicates data are not available. A tilde (~) indicates insufficient data to reportachievement.
ISC 4th GradePIRLS 2001
[162] chapter 5: school curriculum and organization for teaching reading
two-thirds (63%) were in classes where the teacher reported never havingaccess to a remedial or reading specialist. Countries with most access to reme-dial or reading specialists (i.e., where 20 percent or more of the students werein classes where such specialists were always available) included the CzechRepublic, Iceland, Israel, The Netherlands, New Zealand, Slovenia, and theUnited States. In general, countries with access to reading specialists had accessto other professionals (learning specialists, speech therapists, etc.) also.
Almost all students in Iceland, The Netherlands, Scotland, and theUnited States were in classes where the teacher could call on some kind ofprofessional assistance to help students having reading difficulties, whereasmore than 70 percent of students in Argentina, Belize, Colombia, Hong Kong,Iran, Italy, Morocco, Romania, and Turkey were in classes with no access toprofessional assistance at all.
Exhibit 5.23 presents teachers’ reports on what they usually do if astudent begins to fall behind in reading. In almost every country, the teachers’most common response was to spend more time working on reading individ-ually with that student. On average, 88 percent of students were taught byteachers reporting that this was their practice. Another common response wasto have other students work on reading with the student having difficulty.This approach was most often reported in Belize, Colombia, Iran, Italy, Moldova,Morocco, Singapore, and the United States, where more than 80 percent ofstudents had teachers adopting this approach, compared to 62 percent onaverage. Other, less common, strategies included waiting to see if performanceimproves with maturation (most common in Hong Kong and Latvia), havingthe student work with a reading specialist (a frequent approach in Icelandand Sweden), and having students work with a teacher aide (a common prac-tice in England, Israel, and Norway). In many of the PIRLS countries, partic-ularly England, Iran, Israel, The Netherlands, New Zealand, and the UnitedStates, teachers reported that they used a combination (three or more) of theaforementioned strategies.
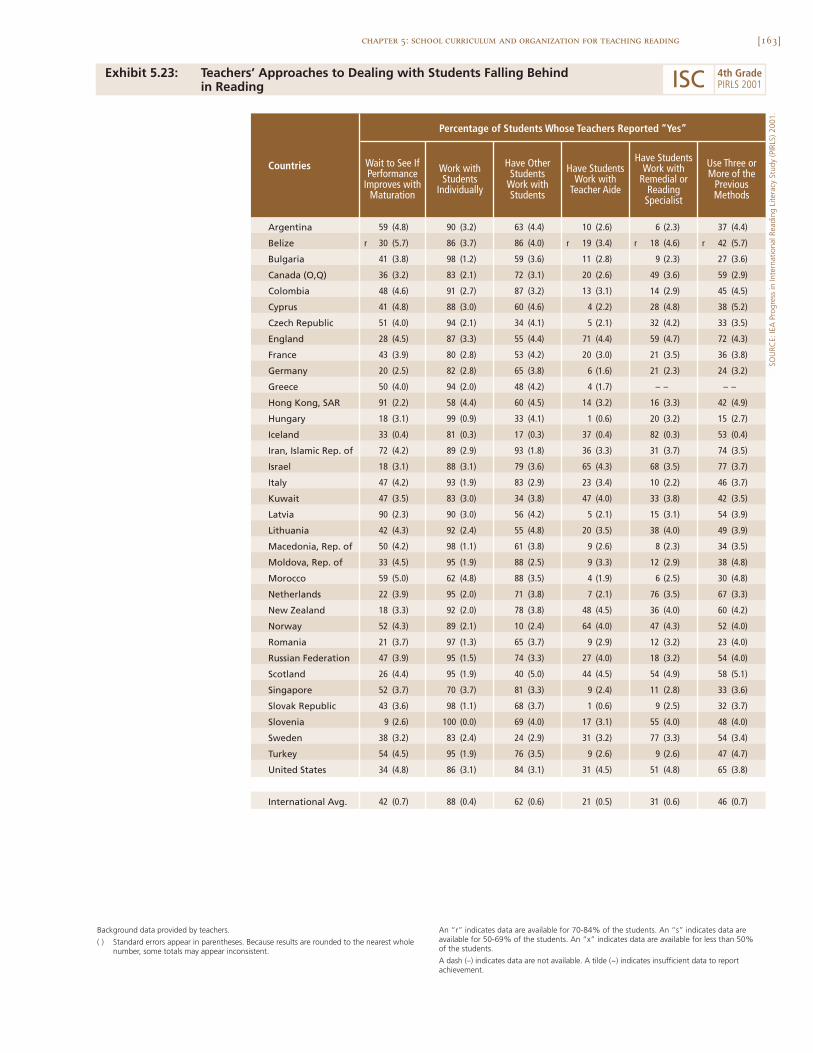
[163]chapter 5: school curriculum and organization for teaching reading
Exhibit 5.23: Teachers’ Approaches to Dealing with Students Falling Behind in Reading
SOU
RCE:
IEA
Pro
gres
s in
Inte
rnat
iona
l Rea
ding
Lite
racy
Stu
dy (P
IRLS
) 200
1.
Argentina
Belize
Bulgaria
Canada (O,Q)
Colombia
Cyprus
Czech Republic
England
France
Germany
Greece
Hong Kong, SAR
Hungary
Iceland
Iran, Islamic Rep. of
Israel
Italy
Kuwait
Latvia
Lithuania
Macedonia, Rep. of
Moldova, Rep. of
Morocco
Netherlands
New Zealand
Norway
Romania
Russian Federation
Scotland
Singapore
Slovak Republic
Slovenia
Sweden
Turkey
United States
International Avg.
Have StudentsWork with
Teacher Aide
Have StudentsWork with
Remedial orReadingSpecialist
Use Three orMore of the
PreviousMethods
Percentage of Students Whose Teachers Reported “Yes”
Countries Wait to See IfPerformance
Improves withMaturation
Work withStudents
Individually
Have OtherStudents
Work withStudents
59 (4.8) 90 (3.2) 63 (4.4) 10 (2.6) 6 (2.3) 37 (4.4)
r 30 (5.7) 86 (3.7) 86 (4.0) r 19 (3.4) r 18 (4.6) r 42 (5.7)
41 (3.8) 98 (1.2) 59 (3.6) 11 (2.8) 9 (2.3) 27 (3.6)
36 (3.2) 83 (2.1) 72 (3.1) 20 (2.6) 49 (3.6) 59 (2.9)
48 (4.6) 91 (2.7) 87 (3.2) 13 (3.1) 14 (2.9) 45 (4.5)
41 (4.8) 88 (3.0) 60 (4.6) 4 (2.2) 28 (4.8) 38 (5.2)
51 (4.0) 94 (2.1) 34 (4.1) 5 (2.1) 32 (4.2) 33 (3.5)
28 (4.5) 87 (3.3) 55 (4.4) 71 (4.4) 59 (4.7) 72 (4.3)
43 (3.9) 80 (2.8) 53 (4.2) 20 (3.0) 21 (3.5) 36 (3.8)
20 (2.5) 82 (2.8) 65 (3.8) 6 (1.6) 21 (2.3) 24 (3.2)
50 (4.0) 94 (2.0) 48 (4.2) 4 (1.7) – – – –
91 (2.2) 58 (4.4) 60 (4.5) 14 (3.2) 16 (3.3) 42 (4.9)
18 (3.1) 99 (0.9) 33 (4.1) 1 (0.6) 20 (3.2) 15 (2.7)
33 (0.4) 81 (0.3) 17 (0.3) 37 (0.4) 82 (0.3) 53 (0.4)
72 (4.2) 89 (2.9) 93 (1.8) 36 (3.3) 31 (3.7) 74 (3.5)
18 (3.1) 88 (3.1) 79 (3.6) 65 (4.3) 68 (3.5) 77 (3.7)
47 (4.2) 93 (1.9) 83 (2.9) 23 (3.4) 10 (2.2) 46 (3.7)
47 (3.5) 83 (3.0) 34 (3.8) 47 (4.0) 33 (3.8) 42 (3.5)
90 (2.3) 90 (3.0) 56 (4.2) 5 (2.1) 15 (3.1) 54 (3.9)
42 (4.3) 92 (2.4) 55 (4.8) 20 (3.5) 38 (4.0) 49 (3.9)
50 (4.2) 98 (1.1) 61 (3.8) 9 (2.6) 8 (2.3) 34 (3.5)
33 (4.5) 95 (1.9) 88 (2.5) 9 (3.3) 12 (2.9) 38 (4.8)
59 (5.0) 62 (4.8) 88 (3.5) 4 (1.9) 6 (2.5) 30 (4.8)
22 (3.9) 95 (2.0) 71 (3.8) 7 (2.1) 76 (3.5) 67 (3.3)
18 (3.3) 92 (2.0) 78 (3.8) 48 (4.5) 36 (4.0) 60 (4.2)
52 (4.3) 89 (2.1) 10 (2.4) 64 (4.0) 47 (4.3) 52 (4.0)
21 (3.7) 97 (1.3) 65 (3.7) 9 (2.9) 12 (3.2) 23 (4.0)
47 (3.9) 95 (1.5) 74 (3.3) 27 (4.0) 18 (3.2) 54 (4.0)
26 (4.4) 95 (1.9) 40 (5.0) 44 (4.5) 54 (4.9) 58 (5.1)
52 (3.7) 70 (3.7) 81 (3.3) 9 (2.4) 11 (2.8) 33 (3.6)
43 (3.6) 98 (1.1) 68 (3.7) 1 (0.6) 9 (2.5) 32 (3.7)
9 (2.6) 100 (0.0) 69 (4.0) 17 (3.1) 55 (4.0) 48 (4.0)
38 (3.2) 83 (2.4) 24 (2.9) 31 (3.2) 77 (3.3) 54 (3.4)
54 (4.5) 95 (1.9) 76 (3.5) 9 (2.6) 9 (2.6) 47 (4.7)
34 (4.8) 86 (3.1) 84 (3.1) 31 (4.5) 51 (4.8) 65 (3.8)
42 (0.7) 88 (0.4) 62 (0.6) 21 (0.5) 31 (0.6) 46 (0.7)
Background data provided by teachers.
( ) Standard errors appear in parentheses. Because results are rounded to the nearest wholenumber, some totals may appear inconsistent.
An “r” indicates data are available for 70-84% of the students. An “s” indicates data areavailable for 50-69% of the students. An “x” indicates data are available for less than 50% of the students.
A dash (–) indicates data are not available. A tilde (~) indicates insufficient data to reportachievement.
ISC 4th GradePIRLS 2001
6

[165]
Chapter 6Teachers andReading Instruction
Even though the home plays an important part in
children’s early literacy activities, there is no doubt
that teachers and the instructional approaches they
use are central in helping students learn to read.
Teachers assign the materials to be read, select
various instructional activities, monitor the
development of students’ comprehension skills and
strategies, and provide opportunities for students
to respond to what they have read.
[166]
Teachers often help students learn to use the library and to use technology toaccess and exchange information and ideas. They may also assign homeworkand conduct informal as well as formal assessments.
Chapter 6 presents teachers’ reports ontheir background and training and theirinstructional practices. Information also is pre-sented about the types of materials used ininstruction, the activities students do in class,the use of libraries and technology, the role ofhomework, and the frequency of various assess-ment approaches.
The data were collected via a question-naire in which PIRLS asked teachers to provide information about their prepa-ration to teach and how they teach reading. Because the sampling for theteacher questionnaires was based on participating students, the teachers arerepresentative of those who teach reading to the students assessed. It is impor-tant to note that when information from the teacher questionnaire is beingreported, the student is always the unit of analysis. That is, the data shown arethe percentages of students whose teachers reported on various characteris-tics or instructional strategies. Using the student as the unit of analysis makesit possible to describe the instruction received by students. Although thisperspective may differ from that obtained by simply collecting and report-ing the information provided by teachers, it is consistent with the PIRLSgoals of providing information about the educational contexts and perform-ance of students.
Since the teachers who completed the questionnaire were the readingteachers of the students who took the PIRLS test, the information aboutinstruction is tied directly to the students tested. Sometimes, however, teach-ers did not complete the questionnaire assigned to them, so most countrieshad some percentage of students for whom no teachers questionnaire infor-mation is available. The exhibits in this chapter have special notations on thispoint. For a country where teacher responses are available for 70 to 84 percentof students, an “r” is included next to its data. Where teacher responses are
chapter 6: teachers and reading instruction
On average, about half thestudents were taught
reading by teachers with auniversity degree.
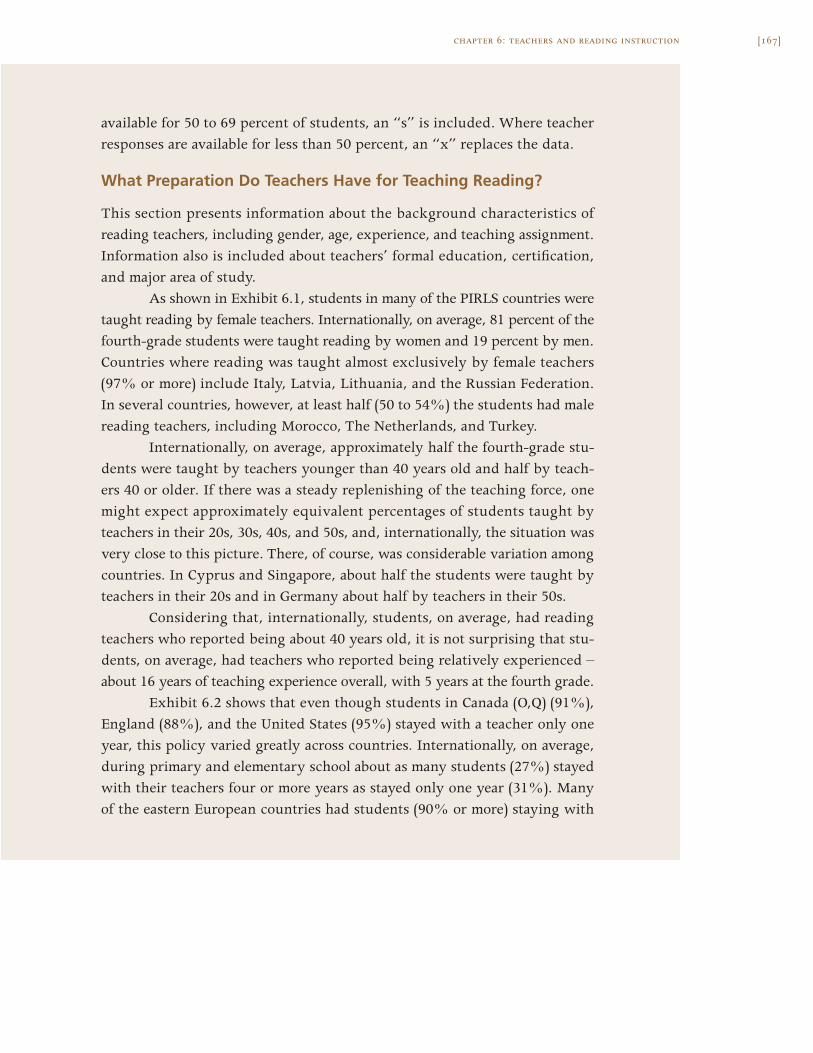
[167]chapter 6: teachers and reading instruction
available for 50 to 69 percent of students, an “s” is included. Where teacherresponses are available for less than 50 percent, an “x” replaces the data.
What Preparation Do Teachers Have for Teaching Reading?
This section presents information about the background characteristics ofreading teachers, including gender, age, experience, and teaching assignment.Information also is included about teachers’ formal education, certification,and major area of study.
As shown in Exhibit 6.1, students in many of the PIRLS countries weretaught reading by female teachers. Internationally, on average, 81 percent of thefourth-grade students were taught reading by women and 19 percent by men.Countries where reading was taught almost exclusively by female teachers(97% or more) include Italy, Latvia, Lithuania, and the Russian Federation.In several countries, however, at least half (50 to 54%) the students had malereading teachers, including Morocco, The Netherlands, and Turkey.
Internationally, on average, approximately half the fourth-grade stu-dents were taught by teachers younger than 40 years old and half by teach-ers 40 or older. If there was a steady replenishing of the teaching force, onemight expect approximately equivalent percentages of students taught byteachers in their 20s, 30s, 40s, and 50s, and, internationally, the situation wasvery close to this picture. There, of course, was considerable variation amongcountries. In Cyprus and Singapore, about half the students were taught byteachers in their 20s and in Germany about half by teachers in their 50s.
Considering that, internationally, students, on average, had readingteachers who reported being about 40 years old, it is not surprising that stu-dents, on average, had teachers who reported being relatively experienced –about 16 years of teaching experience overall, with 5 years at the fourth grade.
Exhibit 6.2 shows that even though students in Canada (O,Q) (91%),England (88%), and the United States (95%) stayed with a teacher only oneyear, this policy varied greatly across countries. Internationally, on average,during primary and elementary school about as many students (27%) stayedwith their teachers four or more years as stayed only one year (31%). Manyof the eastern European countries had students (90% or more) staying with
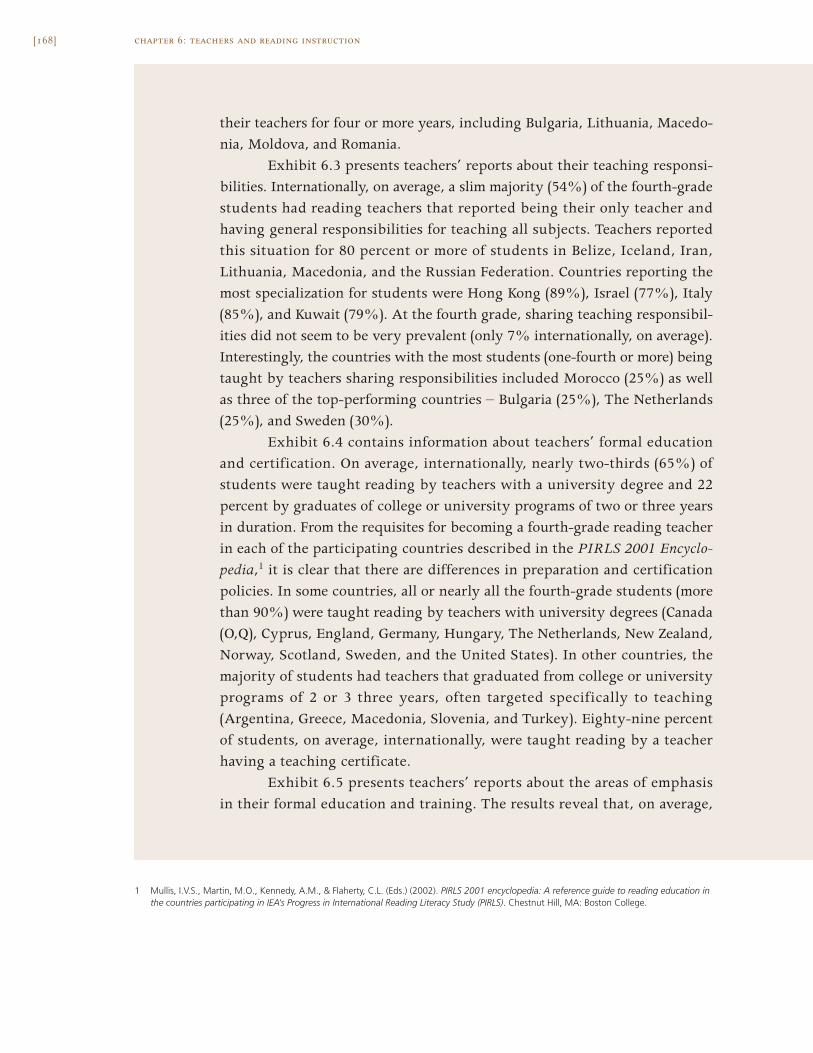
[168]
their teachers for four or more years, including Bulgaria, Lithuania, Macedo-nia, Moldova, and Romania.
Exhibit 6.3 presents teachers’ reports about their teaching responsi-bilities. Internationally, on average, a slim majority (54%) of the fourth-gradestudents had reading teachers that reported being their only teacher andhaving general responsibilities for teaching all subjects. Teachers reportedthis situation for 80 percent or more of students in Belize, Iceland, Iran,Lithuania, Macedonia, and the Russian Federation. Countries reporting themost specialization for students were Hong Kong (89%), Israel (77%), Italy(85%), and Kuwait (79%). At the fourth grade, sharing teaching responsibil-ities did not seem to be very prevalent (only 7% internationally, on average).Interestingly, the countries with the most students (one-fourth or more) beingtaught by teachers sharing responsibilities included Morocco (25%) as wellas three of the top-performing countries – Bulgaria (25%), The Netherlands(25%), and Sweden (30%).
Exhibit 6.4 contains information about teachers’ formal educationand certification. On average, internationally, nearly two-thirds (65%) ofstudents were taught reading by teachers with a university degree and 22percent by graduates of college or university programs of two or three yearsin duration. From the requisites for becoming a fourth-grade reading teacherin each of the participating countries described in the PIRLS 2001 Encyclo-pedia,1 it is clear that there are differences in preparation and certificationpolicies. In some countries, all or nearly all the fourth-grade students (morethan 90%) were taught reading by teachers with university degrees (Canada(O,Q), Cyprus, England, Germany, Hungary, The Netherlands, New Zealand,Norway, Scotland, Sweden, and the United States). In other countries, themajority of students had teachers that graduated from college or universityprograms of 2 or 3 three years, often targeted specifically to teaching(Argentina, Greece, Macedonia, Slovenia, and Turkey). Eighty-nine percentof students, on average, internationally, were taught reading by a teacherhaving a teaching certificate.
Exhibit 6.5 presents teachers’ reports about the areas of emphasis in their formal education and training. The results reveal that, on average,
chapter 6: teachers and reading instruction
1 Mullis, I.V.S., Martin, M.O., Kennedy, A.M., & Flaherty, C.L. (Eds.) (2002). PIRLS 2001 encyclopedia: A reference guide to reading education inthe countries participating in IEA’s Progress in International Reading Literacy Study (PIRLS). Chestnut Hill, MA: Boston College.
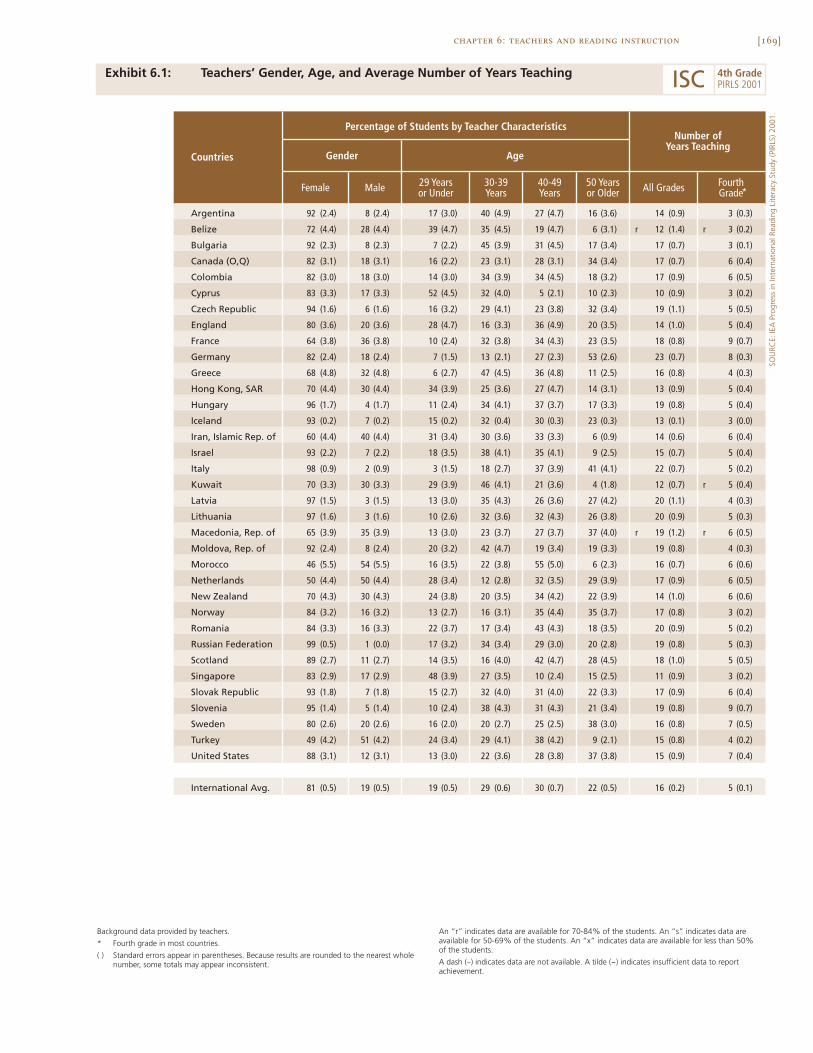
[169]chapter 6: teachers and reading instruction
Exhibit 6.1: Teachers’ Gender, Age, and Average Number of Years Teaching
SOU
RCE:
IEA
Pro
gres
s in
Inte
rnat
iona
l Rea
ding
Lite
racy
Stu
dy (P
IRLS
) 200
1.
Argentina 92 (2.4) 8 (2.4) 17 (3.0) 40 (4.9) 27 (4.7) 16 (3.6) 14 (0.9) 3 (0.3)
Belize 72 (4.4) 28 (4.4) 39 (4.7) 35 (4.5) 19 (4.7) 6 (3.1) r 12 (1.4) r 3 (0.2)
Bulgaria 92 (2.3) 8 (2.3) 7 (2.2) 45 (3.9) 31 (4.5) 17 (3.4) 17 (0.7) 3 (0.1)
Canada (O,Q) 82 (3.1) 18 (3.1) 16 (2.2) 23 (3.1) 28 (3.1) 34 (3.4) 17 (0.7) 6 (0.4)
Colombia 82 (3.0) 18 (3.0) 14 (3.0) 34 (3.9) 34 (4.5) 18 (3.2) 17 (0.9) 6 (0.5)
Cyprus 83 (3.3) 17 (3.3) 52 (4.5) 32 (4.0) 5 (2.1) 10 (2.3) 10 (0.9) 3 (0.2)
Czech Republic 94 (1.6) 6 (1.6) 16 (3.2) 29 (4.1) 23 (3.8) 32 (3.4) 19 (1.1) 5 (0.5)
England 80 (3.6) 20 (3.6) 28 (4.7) 16 (3.3) 36 (4.9) 20 (3.5) 14 (1.0) 5 (0.4)
France 64 (3.8) 36 (3.8) 10 (2.4) 32 (3.8) 34 (4.3) 23 (3.5) 18 (0.8) 9 (0.7)
Germany 82 (2.4) 18 (2.4) 7 (1.5) 13 (2.1) 27 (2.3) 53 (2.6) 23 (0.7) 8 (0.3)
Greece 68 (4.8) 32 (4.8) 6 (2.7) 47 (4.5) 36 (4.8) 11 (2.5) 16 (0.8) 4 (0.3)
Hong Kong, SAR 70 (4.4) 30 (4.4) 34 (3.9) 25 (3.6) 27 (4.7) 14 (3.1) 13 (0.9) 5 (0.4)
Hungary 96 (1.7) 4 (1.7) 11 (2.4) 34 (4.1) 37 (3.7) 17 (3.3) 19 (0.8) 5 (0.4)
Iceland 93 (0.2) 7 (0.2) 15 (0.2) 32 (0.4) 30 (0.3) 23 (0.3) 13 (0.1) 3 (0.0)
Iran, Islamic Rep. of 60 (4.4) 40 (4.4) 31 (3.4) 30 (3.6) 33 (3.3) 6 (0.9) 14 (0.6) 6 (0.4)
Israel 93 (2.2) 7 (2.2) 18 (3.5) 38 (4.1) 35 (4.1) 9 (2.5) 15 (0.7) 5 (0.4)
Italy 98 (0.9) 2 (0.9) 3 (1.5) 18 (2.7) 37 (3.9) 41 (4.1) 22 (0.7) 5 (0.2)
Kuwait 70 (3.3) 30 (3.3) 29 (3.9) 46 (4.1) 21 (3.6) 4 (1.8) 12 (0.7) r 5 (0.4)
Latvia 97 (1.5) 3 (1.5) 13 (3.0) 35 (4.3) 26 (3.6) 27 (4.2) 20 (1.1) 4 (0.3)
Lithuania 97 (1.6) 3 (1.6) 10 (2.6) 32 (3.6) 32 (4.3) 26 (3.8) 20 (0.9) 5 (0.3)
Macedonia, Rep. of 65 (3.9) 35 (3.9) 13 (3.0) 23 (3.7) 27 (3.7) 37 (4.0) r 19 (1.2) r 6 (0.5)
Moldova, Rep. of 92 (2.4) 8 (2.4) 20 (3.2) 42 (4.7) 19 (3.4) 19 (3.3) 19 (0.8) 4 (0.3)
Morocco 46 (5.5) 54 (5.5) 16 (3.5) 22 (3.8) 55 (5.0) 6 (2.3) 16 (0.7) 6 (0.6)
Netherlands 50 (4.4) 50 (4.4) 28 (3.4) 12 (2.8) 32 (3.5) 29 (3.9) 17 (0.9) 6 (0.5)
New Zealand 70 (4.3) 30 (4.3) 24 (3.8) 20 (3.5) 34 (4.2) 22 (3.9) 14 (1.0) 6 (0.6)
Norway 84 (3.2) 16 (3.2) 13 (2.7) 16 (3.1) 35 (4.4) 35 (3.7) 17 (0.8) 3 (0.2)
Romania 84 (3.3) 16 (3.3) 22 (3.7) 17 (3.4) 43 (4.3) 18 (3.5) 20 (0.9) 5 (0.2)
Russian Federation 99 (0.5) 1 (0.0) 17 (3.2) 34 (3.4) 29 (3.0) 20 (2.8) 19 (0.8) 5 (0.3)
Scotland 89 (2.7) 11 (2.7) 14 (3.5) 16 (4.0) 42 (4.7) 28 (4.5) 18 (1.0) 5 (0.5)
Singapore 83 (2.9) 17 (2.9) 48 (3.9) 27 (3.5) 10 (2.4) 15 (2.5) 11 (0.9) 3 (0.2)
Slovak Republic 93 (1.8) 7 (1.8) 15 (2.7) 32 (4.0) 31 (4.0) 22 (3.3) 17 (0.9) 6 (0.4)
Slovenia 95 (1.4) 5 (1.4) 10 (2.4) 38 (4.3) 31 (4.3) 21 (3.4) 19 (0.8) 9 (0.7)
Sweden 80 (2.6) 20 (2.6) 16 (2.0) 20 (2.7) 25 (2.5) 38 (3.0) 16 (0.8) 7 (0.5)
Turkey 49 (4.2) 51 (4.2) 24 (3.4) 29 (4.1) 38 (4.2) 9 (2.1) 15 (0.8) 4 (0.2)
United States 88 (3.1) 12 (3.1) 13 (3.0) 22 (3.6) 28 (3.8) 37 (3.8) 15 (0.9) 7 (0.4)
International Avg. 81 (0.5) 19 (0.5) 19 (0.5) 29 (0.6) 30 (0.7) 22 (0.5) 16 (0.2) 5 (0.1)
All Grades FourthGrade
Countries Gender Age
Number ofYears Teaching
Female 50 Yearsor Older
Percentage of Students by Teacher Characteristics
Male 29 Yearsor Under
30-39Years
40-49Years *
Background data provided by teachers.
* Fourth grade in most countries.
( ) Standard errors appear in parentheses. Because results are rounded to the nearest wholenumber, some totals may appear inconsistent.
An “r” indicates data are available for 70-84% of the students. An “s” indicates data areavailable for 50-69% of the students. An “x” indicates data are available for less than 50% of the students.
A dash (–) indicates data are not available. A tilde (~) indicates insufficient data to reportachievement.
ISC 4th GradePIRLS 2001

[170] chapter 6: teachers and reading instruction
Exhibit 6.2: Number of Years Students Typically Stay with the Same Classroom Teacher
Argentina 45 (4.4) 39 (4.6) 12 (2.8) 1 (0.7) 3 (1.3)
Belize 69 (4.3) 11 (3.0) 1 (0.4) 0 (0.0) 20 (4.0)
Bulgaria 0 (0.0) 2 (0.7) 8 (2.0) 90 (2.1) 0 (0.0)
Canada (O,Q) 91 (1.9) 7 (1.6) 0 (0.0) 0 (0.0) 2 (1.0)
Colombia 37 (4.2) 20 (4.0) 12 (2.9) 19 (4.1) 12 (2.6)
Cyprus 43 (4.8) 22 (4.2) 2 (0.1) 0 (0.0) 33 (4.8)
Czech Republic 1 (0.9) 40 (4.4) 34 (4.2) 14 (3.1) 11 (2.9)
England 88 (2.7) 9 (2.0) 0 (0.0) 1 (0.0) 2 (1.7)
France 62 (4.3) 12 (2.4) 3 (0.7) 1 (0.3) 22 (3.8)
Germany 0 (0.0) 37 (2.7) 7 (1.5) 53 (2.9) 4 (1.3)
Greece 15 (2.8) 41 (4.5) 11 (3.5) 2 (0.1) 32 (4.1)
Hong Kong, SAR 29 (3.9) 16 (3.6) 0 (0.0) 0 (0.0) 55 (4.8)
Hungary 0 (0.0) 29 (3.7) 16 (2.5) 53 (3.6) 2 (1.1)
Iceland r 0 (0.0) 15 (0.3) 50 (0.4) 10 (0.2) 26 (0.4)
Iran, Islamic Rep. of 78 (3.8) 5 (1.3) 0 (0.1) 4 (1.8) 13 (3.2)
Israel 16 (3.4) 68 (3.8) 2 (1.3) 1 (0.0) 12 (2.8)
Italy 1 (0.6) 1 (0.9) 14 (2.5) 78 (3.1) 6 (1.9)
Kuwait 27 (3.6) 7 (2.4) 0 (0.0) 1 (0.0) 65 (4.3)
Latvia 2 (1.1) 3 (1.6) 19 (3.6) 74 (4.0) 2 (1.2)
Lithuania 0 (0.0) 0 (0.0) 0 (0.0) 98 (1.3) 2 (1.3)
Macedonia, Rep. of 0 (0.0) 1 (0.7) 0 (0.0) 99 (0.7) 0 (0.3)
Moldova, Rep. of 2 (1.0) 0 (0.0) 4 (1.8) 91 (2.5) 3 (1.4)
Morocco 61 (4.9) 9 (3.1) 3 (2.1) 3 (2.2) 24 (4.2)
Netherlands 75 (4.1) 14 (2.8) 2 (1.2) 0 (0.0) 8 (2.8)
New Zealand 76 (3.5) 15 (2.9) 2 (0.9) 2 (1.4) 4 (2.3)
Norway 0 (0.0) 3 (1.1) 47 (5.0) 39 (4.3) 12 (3.3)
Romania 0 (0.0) 3 (1.3) 3 (1.5) 91 (2.4) 3 (1.7)
Russian Federation 0 (0.0) 0 (0.0) 53 (4.6) 43 (4.4) 4 (1.2)
Scotland 74 (4.2) 21 (3.4) 1 (0.4) 0 (0.0) 5 (2.2)
Singapore 49 (3.6) 48 (3.6) 0 (0.0) 0 (0.0) 2 (1.2)
Slovak Republic 4 (1.6) 32 (3.8) 11 (2.6) 22 (3.3) 31 (3.9)
Slovenia 21 (3.8) 68 (4.2) 4 (1.7) 0 (0.0) 7 (2.2)
Sweden 1 (0.8) 25 (4.0) 70 (4.2) 3 (1.4) 2 (1.2)
Turkey 6 (2.0) 14 (3.1) 22 (4.0) 56 (4.6) 2 (1.2)
United States 95 (2.0) 3 (1.8) 0 (0.0) 0 (0.0) 2 (1.0)
International Avg. 31 (0.5) 18 (0.5) 12 (0.4) 27 (0.4) 12 (0.4)
Percentage of StudentsCountries
VariesGreatly
One SchoolYear or Less Two Years Three Years Four or
More Years
a
Background data provided by schools.
a In the Russian Federation, primary schools have a duration of 3 or 4 years. Students staywith the same primary teacher all though primary school.
( ) Standard errors appear in parentheses. Because results are rounded to the nearest wholenumber, some totals may appear inconsistent.
An “r” indicates data are available for 70-84% of the students. An “s” indicates data are avail-able for 50-69% of the students. An “x” indicates data are available for less than 50% of thestudents.
A dash (–) indicates data are not available. A tilde (~) indicates insufficient data to reportachievement.
SOU
RCE:
IEA
Pro
gres
s in
Inte
rnat
iona
l Rea
ding
Lite
racy
Stu
dy (P
IRLS
) 200
1.
ISC 4th GradePIRLS 2001
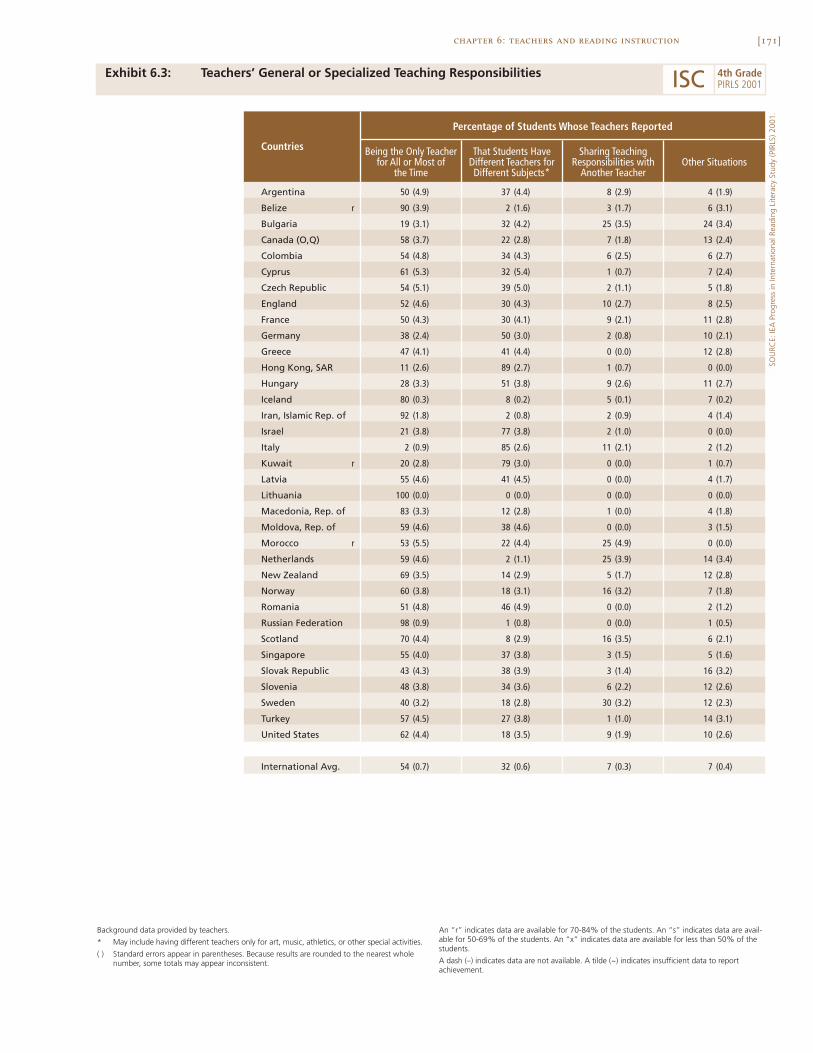
[171]chapter 6: teachers and reading instruction
Exhibit 6.3: Teachers’ General or Specialized Teaching Responsibilities
SOU
RCE:
IEA
Pro
gres
s in
Inte
rnat
iona
l Rea
ding
Lite
racy
Stu
dy (P
IRLS
) 200
1.
Argentina 50 (4.9) 37 (4.4) 8 (2.9) 4 (1.9)
Belize r 90 (3.9) 2 (1.6) 3 (1.7) 6 (3.1)
Bulgaria 19 (3.1) 32 (4.2) 25 (3.5) 24 (3.4)
Canada (O,Q) 58 (3.7) 22 (2.8) 7 (1.8) 13 (2.4)
Colombia 54 (4.8) 34 (4.3) 6 (2.5) 6 (2.7)
Cyprus 61 (5.3) 32 (5.4) 1 (0.7) 7 (2.4)
Czech Republic 54 (5.1) 39 (5.0) 2 (1.1) 5 (1.8)
England 52 (4.6) 30 (4.3) 10 (2.7) 8 (2.5)
France 50 (4.3) 30 (4.1) 9 (2.1) 11 (2.8)
Germany 38 (2.4) 50 (3.0) 2 (0.8) 10 (2.1)
Greece 47 (4.1) 41 (4.4) 0 (0.0) 12 (2.8)
Hong Kong, SAR 11 (2.6) 89 (2.7) 1 (0.7) 0 (0.0)
Hungary 28 (3.3) 51 (3.8) 9 (2.6) 11 (2.7)
Iceland 80 (0.3) 8 (0.2) 5 (0.1) 7 (0.2)
Iran, Islamic Rep. of 92 (1.8) 2 (0.8) 2 (0.9) 4 (1.4)
Israel 21 (3.8) 77 (3.8) 2 (1.0) 0 (0.0)
Italy 2 (0.9) 85 (2.6) 11 (2.1) 2 (1.2)
Kuwait r 20 (2.8) 79 (3.0) 0 (0.0) 1 (0.7)
Latvia 55 (4.6) 41 (4.5) 0 (0.0) 4 (1.7)
Lithuania 100 (0.0) 0 (0.0) 0 (0.0) 0 (0.0)
Macedonia, Rep. of 83 (3.3) 12 (2.8) 1 (0.0) 4 (1.8)
Moldova, Rep. of 59 (4.6) 38 (4.6) 0 (0.0) 3 (1.5)
Morocco r 53 (5.5) 22 (4.4) 25 (4.9) 0 (0.0)
Netherlands 59 (4.6) 2 (1.1) 25 (3.9) 14 (3.4)
New Zealand 69 (3.5) 14 (2.9) 5 (1.7) 12 (2.8)
Norway 60 (3.8) 18 (3.1) 16 (3.2) 7 (1.8)
Romania 51 (4.8) 46 (4.9) 0 (0.0) 2 (1.2)
Russian Federation 98 (0.9) 1 (0.8) 0 (0.0) 1 (0.5)
Scotland 70 (4.4) 8 (2.9) 16 (3.5) 6 (2.1)
Singapore 55 (4.0) 37 (3.8) 3 (1.5) 5 (1.6)
Slovak Republic 43 (4.3) 38 (3.9) 3 (1.4) 16 (3.2)
Slovenia 48 (3.8) 34 (3.6) 6 (2.2) 12 (2.6)
Sweden 40 (3.2) 18 (2.8) 30 (3.2) 12 (2.3)
Turkey 57 (4.5) 27 (3.8) 1 (1.0) 14 (3.1)
United States 62 (4.4) 18 (3.5) 9 (1.9) 10 (2.6)
International Avg. 54 (0.7) 32 (0.6) 7 (0.3) 7 (0.4)
Other Situations
Percentage of Students Whose Teachers Reported
Countries Being the Only Teacherfor All or Most of
the Time
That Students HaveDifferent Teachers forDifferent Subjects*
Sharing TeachingResponsibilities with
Another Teacher
Background data provided by teachers.
* May include having different teachers only for art, music, athletics, or other special activities.
( ) Standard errors appear in parentheses. Because results are rounded to the nearest wholenumber, some totals may appear inconsistent.
An “r” indicates data are available for 70-84% of the students. An “s” indicates data are avail-able for 50-69% of the students. An “x” indicates data are available for less than 50% of thestudents.
A dash (–) indicates data are not available. A tilde (~) indicates insufficient data to reportachievement.
ISC 4th GradePIRLS 2001

[172] chapter 6: teachers and reading instruction
Exhibit 6.4: Preparation to Teach Reading
Argentina
Belize r
Bulgaria
Canada (O,Q)
Colombia
Cyprus
Czech Republic
England
France
Germany
Greece
Hong Kong, SAR
Hungary
Iceland
Iran, Islamic Rep. of
Israel
Italy
Kuwait
Latvia
Lithuania
Macedonia, Rep. of
Moldova, Rep. of
Morocco
Netherlands
New Zealand
Norway
Romania
Russian Federation
Scotland
Singapore
Slovak Republic
Slovenia
Sweden
Turkey
United States
International Avg.
Percentage of Students by TeachersHighest Level of Formal Education
Percent ofStudents Taught
by CertifiedTeachers
Did NotComplete
Upper-SecondarySchool
CompletedOnly
Upper-SecondarySchool
College orUniversity
Program* of2 or 3 Years
UniversityDegree
Countries
’
2 (1.0) 89 (2.5) 9 (2.6) 0 (0.0) 94 (2.5)
8 (2.7) 21 (3.8) 60 (4.7) 11 (3.0) r 74 (4.4)
76 (3.0) 24 (2.9) 1 (0.0) 0 (0.0) 100 (0.0)
92 (2.1) 6 (1.8) 1 (1.1) 0 (0.0) 100 (0.1)
86 (2.9) 5 (1.5) 10 (2.4) 0 (0.0) 94 (1.7)
94 (2.5) 0 (0.0) 6 (2.5) 0 (0.0) 94 (2.8)
77 (4.0) 10 (3.0) 12 (2.8) 0 (0.0) – –
100 (0.0) 0 (0.0) 0 (0.0) 0 (0.0) 98 (1.2)
34 (3.3) 23 (2.7) 41 (3.8) 1 (1.0) 93 (2.1)
92 (0.8) 1 (0.6) 5 (0.9) 1 (0.6) 92 (1.2)
21 (3.9) 79 (3.9) 0 (0.0) 0 (0.0) – –
50 (4.0) 36 (3.9) 13 (3.0) 0 (0.0) 95 (1.9)
99 (0.7) 1 (0.7) 0 (0.0) 0 (0.0) 73 (3.9)
76 (0.4) 10 (0.3) 11 (0.2) 3 (0.1) 91 (0.2)
23 (3.6) 15 (2.4) 52 (4.1) 10 (2.5) 57 (4.3)
73 (3.3) 27 (3.3) 0 (0.0) 0 (0.0) 97 (1.4)
26 (3.4) 7 (2.0) 68 (3.3) 0 (0.0) 78 (3.1)
– – – – – – – – 53 (4.0)
87 (2.6) 8 (2.0) 5 (1.5) 0 (0.0) 92 (2.3)
87 (2.9) 12 (2.7) 1 (0.9) 0 (0.0) 85 (3.1)
26 (4.2) 68 (4.3) 7 (1.8) 0 (0.0) 99 (0.7)
51 (4.2) 46 (4.3) 2 (1.0) 1 (0.6) 43 (4.6)
– – – – – – – – 89 (2.8)
99 (0.6) 0 (0.0) 1 (0.6) 0 (0.0) 99 (0.9)
100 (0.0) 0 (0.0) 0 (0.0) 0 (0.0) 100 (0.0)
99 (0.8) 1 (0.6) 1 (0.5) 0 (0.0) 97 (1.1)
5 (1.8) 24 (3.4) 71 (3.7) 0 (0.3) 82 (3.0)
62 (4.0) 37 (4.0) 1 (0.7) 0 (0.0) 96 (1.4)
94 (2.3) 0 (0.0) 6 (2.3) 0 (0.0) 99 (0.8)
49 (4.4) 38 (4.2) 13 (2.6) 0 (0.0) 95 (1.8)
83 (3.5) 0 (0.0) 17 (3.5) 0 (0.0) 94 (2.1)
25 (3.3) 75 (3.4) 1 (0.0) 0 (0.0) 95 (1.9)
93 (2.0) 0 (0.0) 7 (2.0) 0 (0.0) 93 (1.6)
45 (3.9) 54 (4.0) 1 (0.9) 0 (0.0) 98 (1.2)
100 (0.5) 0 (0.5) 0 (0.0) 0 (0.0) 95 (1.4)
65 (0.5) 22 (0.5) 13 (0.4) 1 (0.1) 89 (0.4)
Background data provided by teachers.
* Includes technical/occupational/vocational programs. For a detailed description of teachertraining in PIRLS countries, see Mullis, I.V.S., Martin, M.D., Kennedy, A.M., & Flaherty, C.L.(Eds.) (2002). PIRLS 2001 encyclopedia: A reference guide to reading educationin the countries participating in IEA’s Progress in International Reading LiteracyStudy (PIRLS). Chestnut Hill, MA: Boston College.
( ) Standard errors appear in parentheses. Because results are rounded to the nearest wholenumber, some totals may appear inconsistent.
An “r” indicates data are available for 70-84% of the students. An “s” indicates data are avail-able for 50-69% of the students. An “x” indicates data are available for less than 50% of thestudents.
A dash (–) indicates data are not available. A tilde (~) indicates insufficient data to reportachievement.
SOU
RCE:
IEA
Pro
gres
s in
Inte
rnat
iona
l Rea
ding
Lite
racy
Stu
dy (P
IRLS
) 200
1.
ISC 4th GradePIRLS 2001
[173]chapter 6: teachers and reading instruction
Exhibit 6.5: Areas of Emphasis in Teachers’ Formal Education and/or Training
SOU
RCE:
IEA
Pro
gres
s in
Inte
rnat
iona
l Rea
ding
Lite
racy
Stu
dy (P
IRLS
) 200
1.
Argentina 50 (5.0) 36 (4.8) 46 (4.8) r 32 (5.0) 34 (4.6) 22 (4.3) 37 (4.7) 8 (2.8)
Belize r 76 (4.1) r 46 (5.9) r 33 (5.7) r 41 (5.8) r 15 (5.2) r 14 (4.4) r 18 (4.0) r 22 (5.4)
Bulgaria 96 (1.7) 93 (2.1) 94 (2.3) 87 (2.3) 29 (3.8) 58 (4.6) 59 (4.5) 48 (4.1)
Canada (O,Q) 72 (3.0) 46 (3.7) 51 (3.4) 44 (3.4) 17 (2.5) 22 (3.1) 26 (3.3) 22 (2.9)
Colombia 37 (4.6) 28 (4.2) 30 (4.5) 17 (3.7) 10 (3.0) 18 (3.2) 24 (3.2) 10 (2.5)
Cyprus 79 (3.3) 49 (5.0) 62 (4.3) 60 (4.8) 15 (3.9) 29 (4.3) 43 (4.3) 13 (3.1)
Czech Republic 86 (3.3) 71 (4.1) 74 (3.8) 65 (4.4) 32 (4.6) 31 (4.4) 23 (3.9) 27 (4.3)
England 66 (4.6) 59 (4.8) 41 (5.1) 32 (4.3) 13 (3.2) 20 (4.2) 36 (4.9) 12 (3.2)
France 53 (4.6) 26 (3.2) 32 (3.9) 15 (3.1) 11 (2.3) 14 (2.7) 12 (2.6) 2 (1.0)
Germany 51 (3.1) 38 (2.8) 57 (3.2) 47 (3.3) 14 (2.3) 14 (2.3) 25 (3.1) 2 (1.0)
Greece 69 (4.0) 48 (4.8) 47 (5.4) 49 (5.2) 16 (3.9) r 16 (3.4) 36 (4.7) 10 (2.5)
Hong Kong, SAR 64 (4.2) 35 (4.3) 54 (4.3) 31 (3.8) 7 (2.1) 10 (2.6) 15 (3.3) 10 (2.7)
Hungary 91 (2.4) 81 (3.3) 79 (3.7) 68 (3.7) 10 (2.6) 23 (3.5) 38 (4.1) 5 (2.0)
Iceland 54 (0.4) 47 (0.4) 52 (0.4) 45 (0.4) r 9 (0.2) 26 (0.4) 33 (0.4) r 9 (0.2)
Iran, Islamic Rep. of 39 (3.7) 31 (4.0) 50 (4.0) 23 (3.3) 19 (3.2) 18 (3.2) 23 (3.1) 7 (2.0)
Israel 32 (3.8) 41 (5.2) 37 (4.4) r 8 (2.3) 16 (3.2) 28 (4.2) 19 (3.3) 16 (3.2)
Italy 86 (2.5) 61 (3.7) 34 (2.9) 35 (3.3) 19 (2.5) 18 (2.7) 27 (3.5) 23 (3.3)
Kuwait 84 (2.9) 59 (4.2) 69 (3.8) 37 (4.2) 36 (4.0) 29 (3.9) 35 (3.8) 16 (3.4)
Latvia 74 (3.5) 63 (4.2) 82 (3.5) 61 (4.7) 12 (2.8) 33 (4.4) 37 (4.4) 20 (3.7)
Lithuania 85 (3.1) 65 (3.7) 78 (3.6) 68 (4.2) 17 (3.4) 36 (4.1) 39 (4.2) 32 (4.4)
Macedonia, Rep. of 80 (3.6) 82 (3.3) 81 (3.8) 78 (3.8) 36 (4.2) 42 (4.3) 50 (4.6) r 21 (3.8)
Moldova, Rep. of 77 (3.9) 62 (4.3) 81 (3.1) 63 (4.4) 27 (4.0) 44 (4.8) 49 (4.7) 33 (4.2)
Morocco 87 (3.7) 67 (5.2) r 41 (5.2) r 45 (5.5) r 29 (5.1) r 26 (4.7) r 30 (5.4) 36 (4.6)
Netherlands 47 (4.2) 24 (4.2) 45 (4.5) 21 (3.7) 16 (3.0) 23 (4.0) 27 (4.1) 10 (2.7)
New Zealand 65 (4.4) 54 (4.3) 59 (4.5) 24 (4.2) 17 (2.8) 36 (4.7) 37 (4.2) 11 (2.6)
Norway 74 (3.4) 67 (4.0) 73 (3.9) 34 (4.2) 25 (3.8) 37 (4.0) 56 (4.3) 31 (3.8)
Romania 94 (1.9) 92 (2.6) 90 (2.5) 81 (3.4) 62 (4.1) 54 (4.5) 79 (3.7) 21 (3.4)
Russian Federation 90 (1.8) 80 (3.8) 93 (1.7) 78 (3.2) 9 (2.3) 49 (3.3) 51 (3.4) 5 (1.2)
Scotland 83 (4.0) 53 (5.5) 52 (5.3) 52 (5.0) 11 (3.4) 26 (4.9) 54 (5.2) 11 (3.4)
Singapore 82 (3.2) 45 (3.8) 65 (4.0) 33 (3.5) 7 (2.3) 20 (3.3) 33 (4.2) 5 (1.8)
Slovak Republic 88 (2.9) 82 (2.8) 69 (3.8) 63 (4.0) 9 (2.5) 45 (4.3) 22 (3.7) 9 (2.6)
Slovenia 71 (4.2) 48 (4.1) 45 (4.4) 50 (4.2) 10 (2.5) 18 (3.3) 19 (3.0) 12 (2.3)
Sweden 79 (2.4) 67 (2.7) 46 (3.6) 37 (3.4) 9 (2.0) 24 (3.1) 45 (3.4) 13 (2.5)
Turkey 44 (5.1) 33 (4.3) 63 (4.5) 48 (4.4) 8 (2.6) 29 (4.5) 32 (4.7) 16 (3.3)
United States 70 (3.6) 60 (3.6) 60 (3.7) 25 (4.0) 27 (4.2) 37 (4.0) 47 (4.2) 11 (2.9)
International Avg. 71 (0.6) 55 (0.7) 59 (0.7) 46 (0.7) 19 (0.6) 28 (0.7) 35 (0.7) 16 (0.5)
ReadingTheory
Children'sLanguage
Development
SpecialEducation
Percentage of Students Whose Teachers Studied as an Area of Emphasis
CountriesLanguage Literature
Pedagogy/TeachingReading
Psychology RemedialReading
Background data provided by teachers.
( ) Standard errors appear in parentheses. Because results are rounded to the nearest wholenumber, some totals may appear inconsistent.
An “r” indicates data are available for 70-84% of the students. An “s” indicates data are avail-able for 50-69% of the students. An “x” indicates data are available for less than 50% of thestudents.
A dash (–) indicates data are not available. A tilde (~) indicates insufficient data to reportachievement.
ISC 4th GradePIRLS 2001
[174]
internationally, the majority of students in the PIRLS countries had teacherswith some specialized training in language (71%), literature (55%), and readingpedagogy (59%).
What Instructional Resources Do Teachers Use?
Exhibits 6.6 and 6.7 contain reports from principals or school heads about thetypes of materials forming the basis of their schools’ instructional program inreading and the types used as supplements. On average, internationally, schoolprincipals reported students primarily had reading series (49%) and textbooks(75%) as the basis of their reading instructional programs. In several coun-tries, most fourth-grade students (85% or more) had a reading series as thebasis of their reading instructional program in the Czech Republic, Iceland,and Scotland. In comparison, however, the textbook was used more frequentlyin quite a few countries. Most students (85% or more) had textbooks as thebasis of their reading instructional program in Bulgaria, Cyprus, the CzechRepublic, Germany, Greece, Hong Kong, Hungary, Iran, Italy, Kuwait, Latvia,Lithuania, Macedonia, Norway, Romania, the Russian Federation, Singapore,the Slovak Republic, and Turkey. Interestingly, it can be noted that in theCzech Republic most students had both a series and textbook as the basis oftheir reading instructional program. Several of the other countries using pre-dominantly textbooks supplemented their instructional programs with a readingseries for more than half the students, including Cyprus, Germany, Italy,Norway, Romania, Singapore, and Turkey (see Exhibit 6.7).
Schools seldom reported using a variety of children’s books as thebasis of many students’ reading programs, with the highest percentages inEngland (48%) and France (46%). However, 69 percent of students, on average,internationally, had a variety of children’s books as supplementary materi-als. Most students (85% or more) had children’s books as supplementary mate-rials in the Czech Republic, Germany, Hungary, Latvia, Lithuania, the RussianFederation, Singapore, the Slovak Republic, and Slovenia.
Children’s newspapers and magazines were used as supplementarymaterials for the majority of children, on average, internationally. The onlycountry to report much use of children’s newspapers and magazines as the
chapter 6: teachers and reading instruction
[175]chapter 6: teachers and reading instruction
basis of reading instruction was France (32%), but most programs relied onthese materials as supplements for about half of their students. The most sup-plementary use of children’s newspapers and magazines was in Slovenia (85%).
Reading across the curriculum was encouraged in a number of countries,but rarely formed the basis of reading instructional programs at the fourthgrade. School principals in Morocco reported that materials from differentcurricular areas formed the basis of the reading instructional program for 64percent of their students, but the next highest use was for 47 percent of stu-dents in France and 35 percent in Colombia. On average, internationally,however, 57 percent of students had materials from different curricular areasas supplements to their reading program. Supplementary use was pervasiveacross countries, with the most extensive use in Scotland (86%).
Exhibit 6.8 presents teachers’ reports about how often they used atextbook or a reading series in reading instruction and how often this wasaccompanied by workbooks and worksheets. On average, internationally,two-thirds of the students had daily reading instruction based on a textbookor reading series. Almost all students (95% or more) had such instruction inBulgaria, Cyprus, Greece, Hungary, Latvia, the Russian Federation, and theSlovak Republic. On average, internationally, workbooks were used on a dailybasis for about one-third of the students (32%) and on a weekly basis fornearly half the students (46%). The most popular instructional approach usedfor the majority of students (international average 53%) was daily instructionbased on a textbook or reading series, accompanied by at least weekly exercisesin workbooks or worksheets. As shown in Exhibit 6.9, teachers who reportedusing workbooks and worksheets reported using them less frequently for stu-dents with higher achievement in reading.
As shown in Exhibit 6.10, three-fourths of students (76%) were givenat least two of the following on a monthly basis to supplement their reading instructional program – children’s books, newspapers/magazines, com-puterized activities, or Internet assignments. Nearly all students in all coun-tries (international average 95%) had at least a monthly opportunity to readchildren’s books, and many (international average 72%) to read children’snewspapers and magazines. Although used hardly at all in some countries,
[176]
teachers reported at least monthly use of computerized reading instructionfor 63 to 64 percent of students in Singapore and the United States. Similarly,reading material on the Internet was infrequent in more than half the coun-tries. Monthly use for 50 percent or more of students was reported by Canada(O,Q) (54%), New Zealand (56%), and the United States (50%).
Since PIRLS 2001 assessed two major purposes for reading – literaryand informational, teachers were asked how often they asked their students toread fiction and nonfiction. The results for use of fiction are presented in Exhibit6.11 and for nonfiction in Exhibit 6.13. On average, internationally, the use offiction was much more widespread than the use of nonfiction. Fiction was beingused for reading instruction at least weekly for 84 percent of students com-pared to nonfiction for 56 percent of students. Exhibit 6.12 provides furtherdetail about the different types of fiction used for reading instruction. Onaverage, internationally, teachers reported asking about two-thirds of students(65%) to read stories on at least a weekly basis. Approximately one-third tohalf also were asked to read fables/fairy tales (45%), poems (41%), and longerbooks (31%). Countries reporting the lowest percentages of students readingfiction at least weekly were Greece (58%), Hong Kong (43%), and Kuwait (51%).
Nonfiction reading included descriptions and explanations about things,people or events; instruction or manuals about how things work; and charts,diagrams, and graphs. The countries where teachers reported asking the highestpercentages of students to read nonfiction on at least a weekly basis wereArgentina and the United States (both 88%), with Colombia, Germany, andItaly next (74 to 77%). Countries with the lowest percentages were the CzechRepublic, France, Hong Kong, Iceland, and the Slovak Republic (28 to 34%).
Exhibit 6.14 contains teachers’ reports about using films, videos, andtelevision in their reading instruction. On average, internationally, 43 percentof students were asked to watch a film version of a children’s book or story atleast monthly, 60 percent to watch movies, videos or television to obtaininformation, and 56 percent to compare material presented in different media.Watching movies of stories and to obtain information was especially prevalentfor students (90% or more) in Bulgaria, Macedonia, and Romania.
chapter 6: teachers and reading instruction
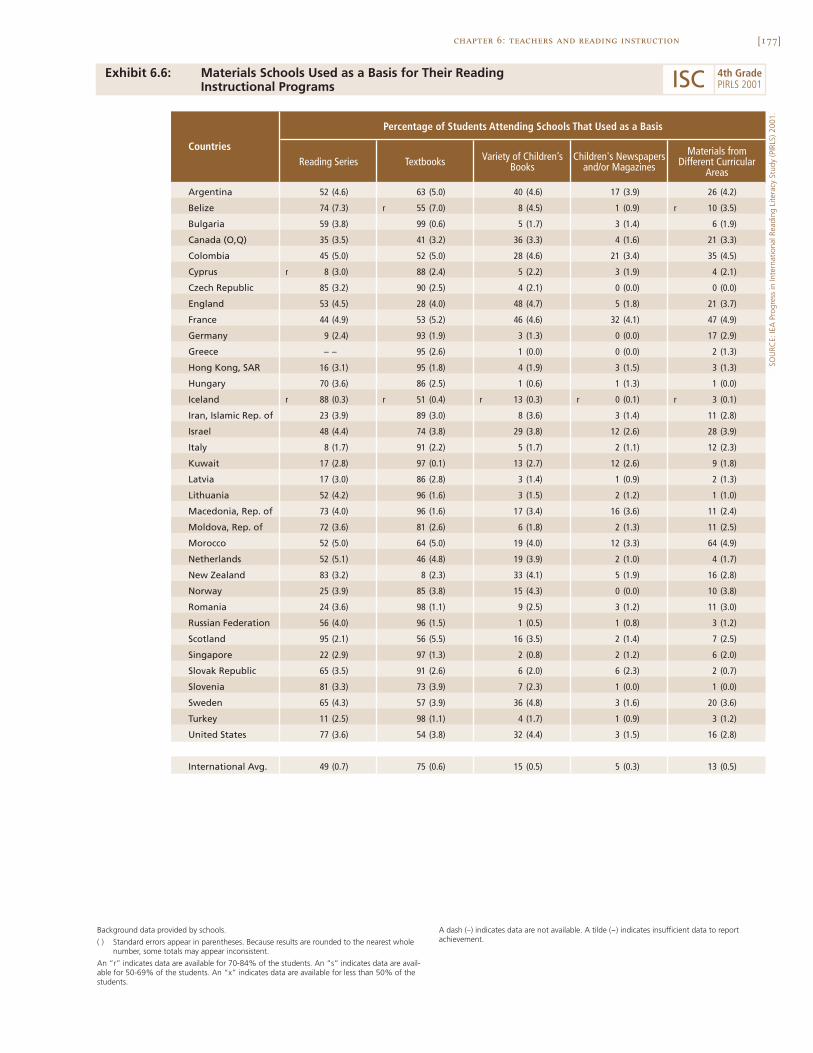
[177]chapter 6: teachers and reading instruction
Exhibit 6.6: Materials Schools Used as a Basis for Their Reading Instructional Programs
SOU
RCE:
IEA
Pro
gres
s in
Inte
rnat
iona
l Rea
ding
Lite
racy
Stu
dy (P
IRLS
) 200
1.
Argentina 52 (4.6) 63 (5.0) 40 (4.6) 17 (3.9) 26 (4.2)
Belize 74 (7.3) r 55 (7.0) 8 (4.5) 1 (0.9) r 10 (3.5)
Bulgaria 59 (3.8) 99 (0.6) 5 (1.7) 3 (1.4) 6 (1.9)
Canada (O,Q) 35 (3.5) 41 (3.2) 36 (3.3) 4 (1.6) 21 (3.3)
Colombia 45 (5.0) 52 (5.0) 28 (4.6) 21 (3.4) 35 (4.5)
Cyprus r 8 (3.0) 88 (2.4) 5 (2.2) 3 (1.9) 4 (2.1)
Czech Republic 85 (3.2) 90 (2.5) 4 (2.1) 0 (0.0) 0 (0.0)
England 53 (4.5) 28 (4.0) 48 (4.7) 5 (1.8) 21 (3.7)
France 44 (4.9) 53 (5.2) 46 (4.6) 32 (4.1) 47 (4.9)
Germany 9 (2.4) 93 (1.9) 3 (1.3) 0 (0.0) 17 (2.9)
Greece – – 95 (2.6) 1 (0.0) 0 (0.0) 2 (1.3)
Hong Kong, SAR 16 (3.1) 95 (1.8) 4 (1.9) 3 (1.5) 3 (1.3)
Hungary 70 (3.6) 86 (2.5) 1 (0.6) 1 (1.3) 1 (0.0)
Iceland r 88 (0.3) r 51 (0.4) r 13 (0.3) r 0 (0.1) r 3 (0.1)
Iran, Islamic Rep. of 23 (3.9) 89 (3.0) 8 (3.6) 3 (1.4) 11 (2.8)
Israel 48 (4.4) 74 (3.8) 29 (3.8) 12 (2.6) 28 (3.9)
Italy 8 (1.7) 91 (2.2) 5 (1.7) 2 (1.1) 12 (2.3)
Kuwait 17 (2.8) 97 (0.1) 13 (2.7) 12 (2.6) 9 (1.8)
Latvia 17 (3.0) 86 (2.8) 3 (1.4) 1 (0.9) 2 (1.3)
Lithuania 52 (4.2) 96 (1.6) 3 (1.5) 2 (1.2) 1 (1.0)
Macedonia, Rep. of 73 (4.0) 96 (1.6) 17 (3.4) 16 (3.6) 11 (2.4)
Moldova, Rep. of 72 (3.6) 81 (2.6) 6 (1.8) 2 (1.3) 11 (2.5)
Morocco 52 (5.0) 64 (5.0) 19 (4.0) 12 (3.3) 64 (4.9)
Netherlands 52 (5.1) 46 (4.8) 19 (3.9) 2 (1.0) 4 (1.7)
New Zealand 83 (3.2) 8 (2.3) 33 (4.1) 5 (1.9) 16 (2.8)
Norway 25 (3.9) 85 (3.8) 15 (4.3) 0 (0.0) 10 (3.8)
Romania 24 (3.6) 98 (1.1) 9 (2.5) 3 (1.2) 11 (3.0)
Russian Federation 56 (4.0) 96 (1.5) 1 (0.5) 1 (0.8) 3 (1.2)
Scotland 95 (2.1) 56 (5.5) 16 (3.5) 2 (1.4) 7 (2.5)
Singapore 22 (2.9) 97 (1.3) 2 (0.8) 2 (1.2) 6 (2.0)
Slovak Republic 65 (3.5) 91 (2.6) 6 (2.0) 6 (2.3) 2 (0.7)
Slovenia 81 (3.3) 73 (3.9) 7 (2.3) 1 (0.0) 1 (0.0)
Sweden 65 (4.3) 57 (3.9) 36 (4.8) 3 (1.6) 20 (3.6)
Turkey 11 (2.5) 98 (1.1) 4 (1.7) 1 (0.9) 3 (1.2)
United States 77 (3.6) 54 (3.8) 32 (4.4) 3 (1.5) 16 (2.8)
International Avg. 49 (0.7) 75 (0.6) 15 (0.5) 5 (0.3) 13 (0.5)
Children's Newspapersand/or Magazines
Materials fromDifferent Curricular
Areas
Percentage of Students Attending Schools That Used as a Basis
CountriesReading Series Textbooks Variety of Children’s
Books
Background data provided by schools.
( ) Standard errors appear in parentheses. Because results are rounded to the nearest wholenumber, some totals may appear inconsistent.
An “r” indicates data are available for 70-84% of the students. An “s” indicates data are avail-able for 50-69% of the students. An “x” indicates data are available for less than 50% of thestudents.
A dash (–) indicates data are not available. A tilde (~) indicates insufficient data to reportachievement.
ISC 4th GradePIRLS 2001
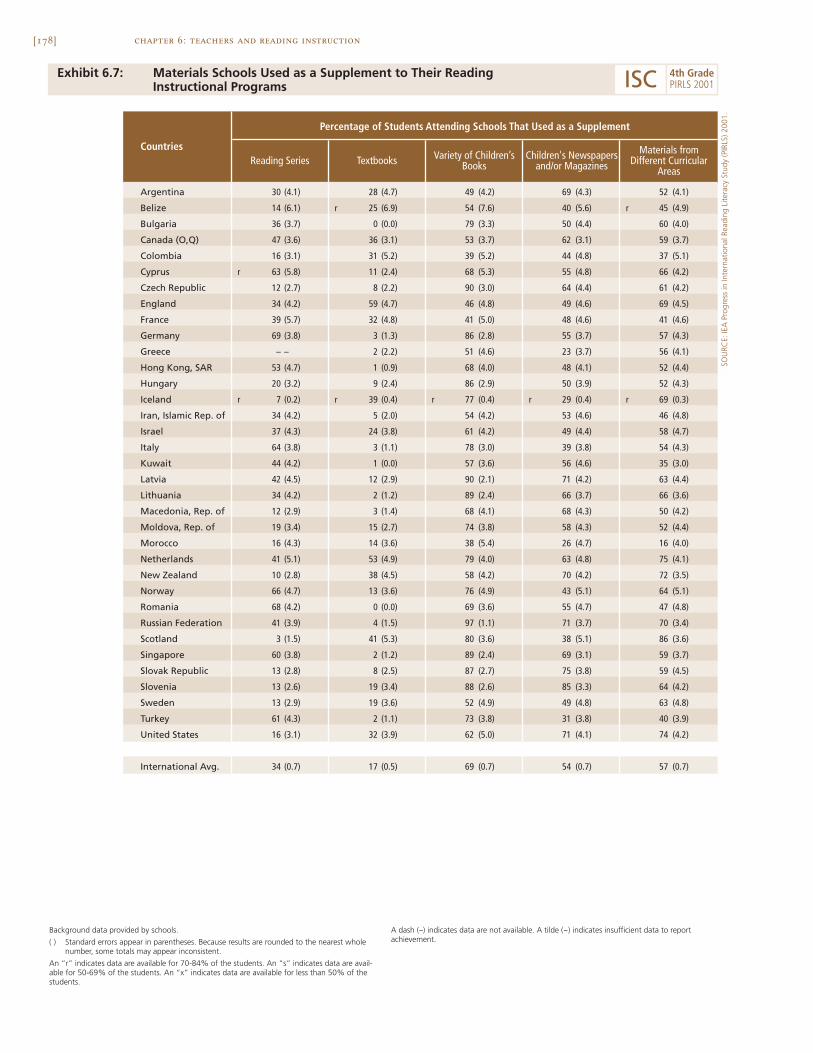
[178] chapter 6: teachers and reading instruction
Exhibit 6.7: Materials Schools Used as a Supplement to Their ReadingInstructional Programs
Argentina 30 (4.1) 28 (4.7) 49 (4.2) 69 (4.3) 52 (4.1)
Belize 14 (6.1) r 25 (6.9) 54 (7.6) 40 (5.6) r 45 (4.9)
Bulgaria 36 (3.7) 0 (0.0) 79 (3.3) 50 (4.4) 60 (4.0)
Canada (O,Q) 47 (3.6) 36 (3.1) 53 (3.7) 62 (3.1) 59 (3.7)
Colombia 16 (3.1) 31 (5.2) 39 (5.2) 44 (4.8) 37 (5.1)
Cyprus r 63 (5.8) 11 (2.4) 68 (5.3) 55 (4.8) 66 (4.2)
Czech Republic 12 (2.7) 8 (2.2) 90 (3.0) 64 (4.4) 61 (4.2)
England 34 (4.2) 59 (4.7) 46 (4.8) 49 (4.6) 69 (4.5)
France 39 (5.7) 32 (4.8) 41 (5.0) 48 (4.6) 41 (4.6)
Germany 69 (3.8) 3 (1.3) 86 (2.8) 55 (3.7) 57 (4.3)
Greece – – 2 (2.2) 51 (4.6) 23 (3.7) 56 (4.1)
Hong Kong, SAR 53 (4.7) 1 (0.9) 68 (4.0) 48 (4.1) 52 (4.4)
Hungary 20 (3.2) 9 (2.4) 86 (2.9) 50 (3.9) 52 (4.3)
Iceland r 7 (0.2) r 39 (0.4) r 77 (0.4) r 29 (0.4) r 69 (0.3)
Iran, Islamic Rep. of 34 (4.2) 5 (2.0) 54 (4.2) 53 (4.6) 46 (4.8)
Israel 37 (4.3) 24 (3.8) 61 (4.2) 49 (4.4) 58 (4.7)
Italy 64 (3.8) 3 (1.1) 78 (3.0) 39 (3.8) 54 (4.3)
Kuwait 44 (4.2) 1 (0.0) 57 (3.6) 56 (4.6) 35 (3.0)
Latvia 42 (4.5) 12 (2.9) 90 (2.1) 71 (4.2) 63 (4.4)
Lithuania 34 (4.2) 2 (1.2) 89 (2.4) 66 (3.7) 66 (3.6)
Macedonia, Rep. of 12 (2.9) 3 (1.4) 68 (4.1) 68 (4.3) 50 (4.2)
Moldova, Rep. of 19 (3.4) 15 (2.7) 74 (3.8) 58 (4.3) 52 (4.4)
Morocco 16 (4.3) 14 (3.6) 38 (5.4) 26 (4.7) 16 (4.0)
Netherlands 41 (5.1) 53 (4.9) 79 (4.0) 63 (4.8) 75 (4.1)
New Zealand 10 (2.8) 38 (4.5) 58 (4.2) 70 (4.2) 72 (3.5)
Norway 66 (4.7) 13 (3.6) 76 (4.9) 43 (5.1) 64 (5.1)
Romania 68 (4.2) 0 (0.0) 69 (3.6) 55 (4.7) 47 (4.8)
Russian Federation 41 (3.9) 4 (1.5) 97 (1.1) 71 (3.7) 70 (3.4)
Scotland 3 (1.5) 41 (5.3) 80 (3.6) 38 (5.1) 86 (3.6)
Singapore 60 (3.8) 2 (1.2) 89 (2.4) 69 (3.1) 59 (3.7)
Slovak Republic 13 (2.8) 8 (2.5) 87 (2.7) 75 (3.8) 59 (4.5)
Slovenia 13 (2.6) 19 (3.4) 88 (2.6) 85 (3.3) 64 (4.2)
Sweden 13 (2.9) 19 (3.6) 52 (4.9) 49 (4.8) 63 (4.8)
Turkey 61 (4.3) 2 (1.1) 73 (3.8) 31 (3.8) 40 (3.9)
United States 16 (3.1) 32 (3.9) 62 (5.0) 71 (4.1) 74 (4.2)
International Avg. 34 (0.7) 17 (0.5) 69 (0.7) 54 (0.7) 57 (0.7)
Children's Newspapersand/or Magazines
Materials fromDifferent Curricular
Areas
Percentage of Students Attending Schools That Used as a Supplement
CountriesReading Series Textbooks Variety of Children’s
Books
Background data provided by schools.
( ) Standard errors appear in parentheses. Because results are rounded to the nearest wholenumber, some totals may appear inconsistent.
An “r” indicates data are available for 70-84% of the students. An “s” indicates data are avail-able for 50-69% of the students. An “x” indicates data are available for less than 50% of thestudents.
A dash (–) indicates data are not available. A tilde (~) indicates insufficient data to reportachievement.
SOU
RCE:
IEA
Pro
gres
s in
Inte
rnat
iona
l Rea
ding
Lite
racy
Stu
dy (P
IRLS
) 200
1.
ISC 4th GradePIRLS 2001
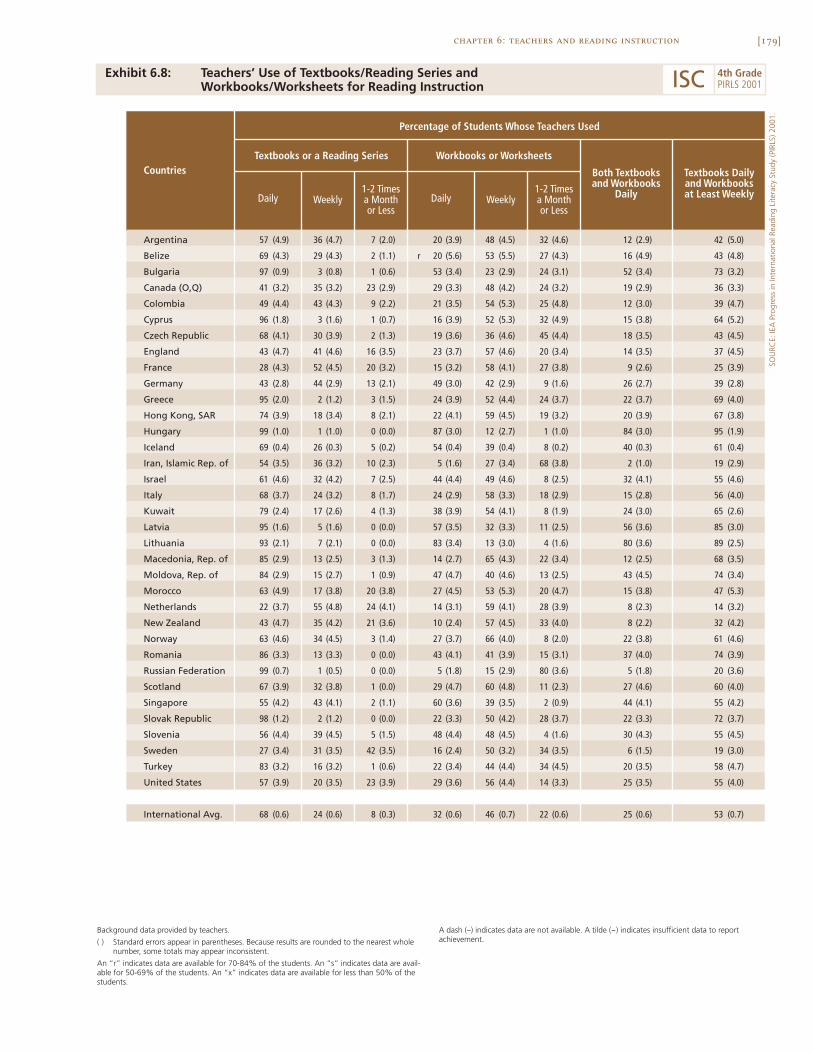
[179]chapter 6: teachers and reading instruction
Exhibit 6.8: Teachers’ Use of Textbooks/Reading Series andWorkbooks/Worksheets for Reading Instruction
SOU
RCE:
IEA
Pro
gres
s in
Inte
rnat
iona
l Rea
ding
Lite
racy
Stu
dy (P
IRLS
) 200
1.
Argentina 57 (4.9) 36 (4.7) 7 (2.0) 20 (3.9) 48 (4.5) 32 (4.6) 12 (2.9) 42 (5.0)
Belize 69 (4.3) 29 (4.3) 2 (1.1) r 20 (5.6) 53 (5.5) 27 (4.3) 16 (4.9) 43 (4.8)
Bulgaria 97 (0.9) 3 (0.8) 1 (0.6) 53 (3.4) 23 (2.9) 24 (3.1) 52 (3.4) 73 (3.2)
Canada (O,Q) 41 (3.2) 35 (3.2) 23 (2.9) 29 (3.3) 48 (4.2) 24 (3.2) 19 (2.9) 36 (3.3)
Colombia 49 (4.4) 43 (4.3) 9 (2.2) 21 (3.5) 54 (5.3) 25 (4.8) 12 (3.0) 39 (4.7)
Cyprus 96 (1.8) 3 (1.6) 1 (0.7) 16 (3.9) 52 (5.3) 32 (4.9) 15 (3.8) 64 (5.2)
Czech Republic 68 (4.1) 30 (3.9) 2 (1.3) 19 (3.6) 36 (4.6) 45 (4.4) 18 (3.5) 43 (4.5)
England 43 (4.7) 41 (4.6) 16 (3.5) 23 (3.7) 57 (4.6) 20 (3.4) 14 (3.5) 37 (4.5)
France 28 (4.3) 52 (4.5) 20 (3.2) 15 (3.2) 58 (4.1) 27 (3.8) 9 (2.6) 25 (3.9)
Germany 43 (2.8) 44 (2.9) 13 (2.1) 49 (3.0) 42 (2.9) 9 (1.6) 26 (2.7) 39 (2.8)
Greece 95 (2.0) 2 (1.2) 3 (1.5) 24 (3.9) 52 (4.4) 24 (3.7) 22 (3.7) 69 (4.0)
Hong Kong, SAR 74 (3.9) 18 (3.4) 8 (2.1) 22 (4.1) 59 (4.5) 19 (3.2) 20 (3.9) 67 (3.8)
Hungary 99 (1.0) 1 (1.0) 0 (0.0) 87 (3.0) 12 (2.7) 1 (1.0) 84 (3.0) 95 (1.9)
Iceland 69 (0.4) 26 (0.3) 5 (0.2) 54 (0.4) 39 (0.4) 8 (0.2) 40 (0.3) 61 (0.4)
Iran, Islamic Rep. of 54 (3.5) 36 (3.2) 10 (2.3) 5 (1.6) 27 (3.4) 68 (3.8) 2 (1.0) 19 (2.9)
Israel 61 (4.6) 32 (4.2) 7 (2.5) 44 (4.4) 49 (4.6) 8 (2.5) 32 (4.1) 55 (4.6)
Italy 68 (3.7) 24 (3.2) 8 (1.7) 24 (2.9) 58 (3.3) 18 (2.9) 15 (2.8) 56 (4.0)
Kuwait 79 (2.4) 17 (2.6) 4 (1.3) 38 (3.9) 54 (4.1) 8 (1.9) 24 (3.0) 65 (2.6)
Latvia 95 (1.6) 5 (1.6) 0 (0.0) 57 (3.5) 32 (3.3) 11 (2.5) 56 (3.6) 85 (3.0)
Lithuania 93 (2.1) 7 (2.1) 0 (0.0) 83 (3.4) 13 (3.0) 4 (1.6) 80 (3.6) 89 (2.5)
Macedonia, Rep. of 85 (2.9) 13 (2.5) 3 (1.3) 14 (2.7) 65 (4.3) 22 (3.4) 12 (2.5) 68 (3.5)
Moldova, Rep. of 84 (2.9) 15 (2.7) 1 (0.9) 47 (4.7) 40 (4.6) 13 (2.5) 43 (4.5) 74 (3.4)
Morocco 63 (4.9) 17 (3.8) 20 (3.8) 27 (4.5) 53 (5.3) 20 (4.7) 15 (3.8) 47 (5.3)
Netherlands 22 (3.7) 55 (4.8) 24 (4.1) 14 (3.1) 59 (4.1) 28 (3.9) 8 (2.3) 14 (3.2)
New Zealand 43 (4.7) 35 (4.2) 21 (3.6) 10 (2.4) 57 (4.5) 33 (4.0) 8 (2.2) 32 (4.2)
Norway 63 (4.6) 34 (4.5) 3 (1.4) 27 (3.7) 66 (4.0) 8 (2.0) 22 (3.8) 61 (4.6)
Romania 86 (3.3) 13 (3.3) 0 (0.0) 43 (4.1) 41 (3.9) 15 (3.1) 37 (4.0) 74 (3.9)
Russian Federation 99 (0.7) 1 (0.5) 0 (0.0) 5 (1.8) 15 (2.9) 80 (3.6) 5 (1.8) 20 (3.6)
Scotland 67 (3.9) 32 (3.8) 1 (0.0) 29 (4.7) 60 (4.8) 11 (2.3) 27 (4.6) 60 (4.0)
Singapore 55 (4.2) 43 (4.1) 2 (1.1) 60 (3.6) 39 (3.5) 2 (0.9) 44 (4.1) 55 (4.2)
Slovak Republic 98 (1.2) 2 (1.2) 0 (0.0) 22 (3.3) 50 (4.2) 28 (3.7) 22 (3.3) 72 (3.7)
Slovenia 56 (4.4) 39 (4.5) 5 (1.5) 48 (4.4) 48 (4.5) 4 (1.6) 30 (4.3) 55 (4.5)
Sweden 27 (3.4) 31 (3.5) 42 (3.5) 16 (2.4) 50 (3.2) 34 (3.5) 6 (1.5) 19 (3.0)
Turkey 83 (3.2) 16 (3.2) 1 (0.6) 22 (3.4) 44 (4.4) 34 (4.5) 20 (3.5) 58 (4.7)
United States 57 (3.9) 20 (3.5) 23 (3.9) 29 (3.6) 56 (4.4) 14 (3.3) 25 (3.5) 55 (4.0)
International Avg. 68 (0.6) 24 (0.6) 8 (0.3) 32 (0.6) 46 (0.7) 22 (0.6) 25 (0.6) 53 (0.7)
Both Textbooksand Workbooks
Daily
Textbooks Dailyand Workbooksat Least Weekly
Percentage of Students Whose Teachers Used
Countries
Daily Weekly1-2 Timesa Monthor Less
Textbooks or a Reading Series Workbooks or Worksheets
Daily Weekly1-2 Timesa Monthor Less
Background data provided by teachers.
( ) Standard errors appear in parentheses. Because results are rounded to the nearest wholenumber, some totals may appear inconsistent.
An “r” indicates data are available for 70-84% of the students. An “s” indicates data are avail-able for 50-69% of the students. An “x” indicates data are available for less than 50% of thestudents.
A dash (–) indicates data are not available. A tilde (~) indicates insufficient data to reportachievement.
ISC 4th GradePIRLS 2001
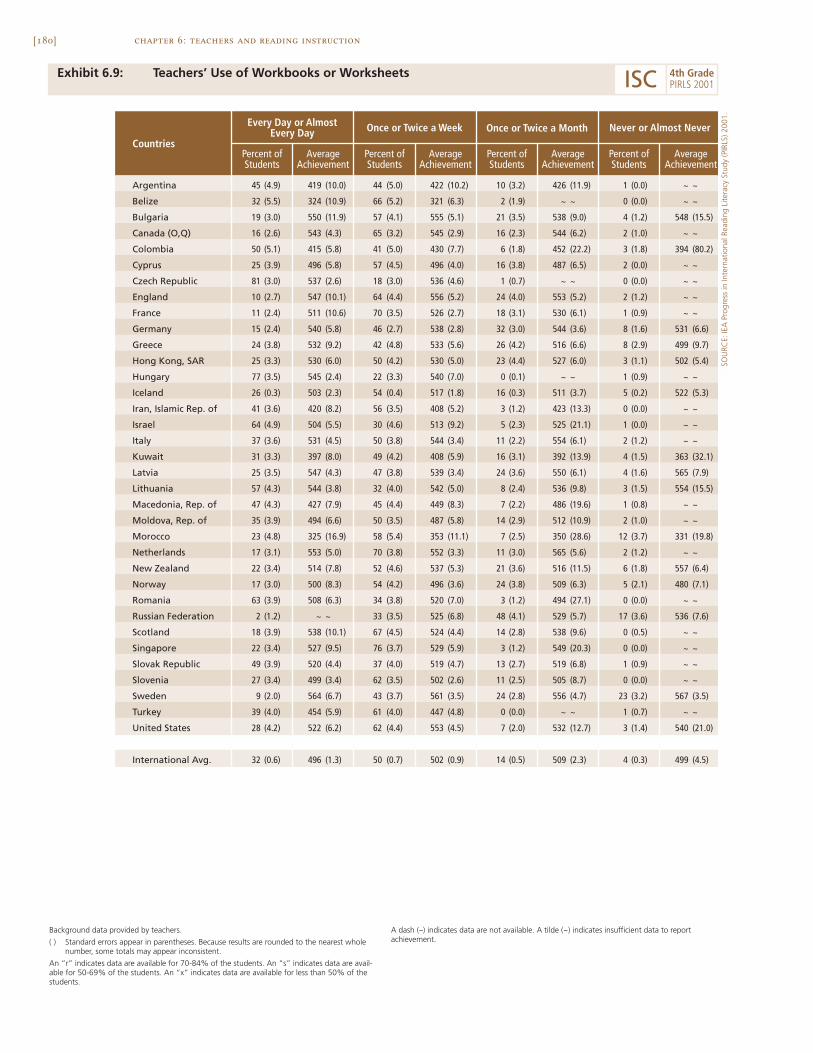
[180] chapter 6: teachers and reading instruction
Exhibit 6.9: Teachers’ Use of Workbooks or Worksheets
Argentina 45 (4.9) 419 (10.0) 44 (5.0) 422 (10.2) 10 (3.2) 426 (11.9) 1 (0.0) ~ ~
Belize 32 (5.5) 324 (10.9) 66 (5.2) 321 (6.3) 2 (1.9) ~ ~ 0 (0.0) ~ ~
Bulgaria 19 (3.0) 550 (11.9) 57 (4.1) 555 (5.1) 21 (3.5) 538 (9.0) 4 (1.2) 548 (15.5)
Canada (O,Q) 16 (2.6) 543 (4.3) 65 (3.2) 545 (2.9) 16 (2.3) 544 (6.2) 2 (1.0) ~ ~
Colombia 50 (5.1) 415 (5.8) 41 (5.0) 430 (7.7) 6 (1.8) 452 (22.2) 3 (1.8) 394 (80.2)
Cyprus 25 (3.9) 496 (5.8) 57 (4.5) 496 (4.0) 16 (3.8) 487 (6.5) 2 (0.0) ~ ~
Czech Republic 81 (3.0) 537 (2.6) 18 (3.0) 536 (4.6) 1 (0.7) ~ ~ 0 (0.0) ~ ~
England 10 (2.7) 547 (10.1) 64 (4.4) 556 (5.2) 24 (4.0) 553 (5.2) 2 (1.2) ~ ~
France 11 (2.4) 511 (10.6) 70 (3.5) 526 (2.7) 18 (3.1) 530 (6.1) 1 (0.9) ~ ~
Germany 15 (2.4) 540 (5.8) 46 (2.7) 538 (2.8) 32 (3.0) 544 (3.6) 8 (1.6) 531 (6.6)
Greece 24 (3.8) 532 (9.2) 42 (4.8) 533 (5.6) 26 (4.2) 516 (6.6) 8 (2.9) 499 (9.7)
Hong Kong, SAR 25 (3.3) 530 (6.0) 50 (4.2) 530 (5.0) 23 (4.4) 527 (6.0) 3 (1.1) 502 (5.4)
Hungary 77 (3.5) 545 (2.4) 22 (3.3) 540 (7.0) 0 (0.1) ~ ~ 1 (0.9) ~ ~
Iceland 26 (0.3) 503 (2.3) 54 (0.4) 517 (1.8) 16 (0.3) 511 (3.7) 5 (0.2) 522 (5.3)
Iran, Islamic Rep. of 41 (3.6) 420 (8.2) 56 (3.5) 408 (5.2) 3 (1.2) 423 (13.3) 0 (0.0) ~ ~
Israel 64 (4.9) 504 (5.5) 30 (4.6) 513 (9.2) 5 (2.3) 525 (21.1) 1 (0.0) ~ ~
Italy 37 (3.6) 531 (4.5) 50 (3.8) 544 (3.4) 11 (2.2) 554 (6.1) 2 (1.2) ~ ~
Kuwait 31 (3.3) 397 (8.0) 49 (4.2) 408 (5.9) 16 (3.1) 392 (13.9) 4 (1.5) 363 (32.1)
Latvia 25 (3.5) 547 (4.3) 47 (3.8) 539 (3.4) 24 (3.6) 550 (6.1) 4 (1.6) 565 (7.9)
Lithuania 57 (4.3) 544 (3.8) 32 (4.0) 542 (5.0) 8 (2.4) 536 (9.8) 3 (1.5) 554 (15.5)
Macedonia, Rep. of 47 (4.3) 427 (7.9) 45 (4.4) 449 (8.3) 7 (2.2) 486 (19.6) 1 (0.8) ~ ~
Moldova, Rep. of 35 (3.9) 494 (6.6) 50 (3.5) 487 (5.8) 14 (2.9) 512 (10.9) 2 (1.0) ~ ~
Morocco 23 (4.8) 325 (16.9) 58 (5.4) 353 (11.1) 7 (2.5) 350 (28.6) 12 (3.7) 331 (19.8)
Netherlands 17 (3.1) 553 (5.0) 70 (3.8) 552 (3.3) 11 (3.0) 565 (5.6) 2 (1.2) ~ ~
New Zealand 22 (3.4) 514 (7.8) 52 (4.6) 537 (5.3) 21 (3.6) 516 (11.5) 6 (1.8) 557 (6.4)
Norway 17 (3.0) 500 (8.3) 54 (4.2) 496 (3.6) 24 (3.8) 509 (6.3) 5 (2.1) 480 (7.1)
Romania 63 (3.9) 508 (6.3) 34 (3.8) 520 (7.0) 3 (1.2) 494 (27.1) 0 (0.0) ~ ~
Russian Federation 2 (1.2) ~ ~ 33 (3.5) 525 (6.8) 48 (4.1) 529 (5.7) 17 (3.6) 536 (7.6)
Scotland 18 (3.9) 538 (10.1) 67 (4.5) 524 (4.4) 14 (2.8) 538 (9.6) 0 (0.5) ~ ~
Singapore 22 (3.4) 527 (9.5) 76 (3.7) 529 (5.9) 3 (1.2) 549 (20.3) 0 (0.0) ~ ~
Slovak Republic 49 (3.9) 520 (4.4) 37 (4.0) 519 (4.7) 13 (2.7) 519 (6.8) 1 (0.9) ~ ~
Slovenia 27 (3.4) 499 (3.4) 62 (3.5) 502 (2.6) 11 (2.5) 505 (8.7) 0 (0.0) ~ ~
Sweden 9 (2.0) 564 (6.7) 43 (3.7) 561 (3.5) 24 (2.8) 556 (4.7) 23 (3.2) 567 (3.5)
Turkey 39 (4.0) 454 (5.9) 61 (4.0) 447 (4.8) 0 (0.0) ~ ~ 1 (0.7) ~ ~
United States 28 (4.2) 522 (6.2) 62 (4.4) 553 (4.5) 7 (2.0) 532 (12.7) 3 (1.4) 540 (21.0)
International Avg. 32 (0.6) 496 (1.3) 50 (0.7) 502 (0.9) 14 (0.5) 509 (2.3) 4 (0.3) 499 (4.5)
Every Day or AlmostEvery Day Once or Twice a Week Once or Twice a Month Never or Almost Never
Percent ofStudents
AverageAchievement
CountriesPercent ofStudents
AverageAchievement
Percent ofStudents
AverageAchievement
Percent ofStudents
AverageAchievement
Background data provided by teachers.
( ) Standard errors appear in parentheses. Because results are rounded to the nearest wholenumber, some totals may appear inconsistent.
An “r” indicates data are available for 70-84% of the students. An “s” indicates data are avail-able for 50-69% of the students. An “x” indicates data are available for less than 50% of thestudents.
A dash (–) indicates data are not available. A tilde (~) indicates insufficient data to reportachievement.
SOU
RCE:
IEA
Pro
gres
s in
Inte
rnat
iona
l Rea
ding
Lite
racy
Stu
dy (P
IRLS
) 200
1.
ISC 4th GradePIRLS 2001
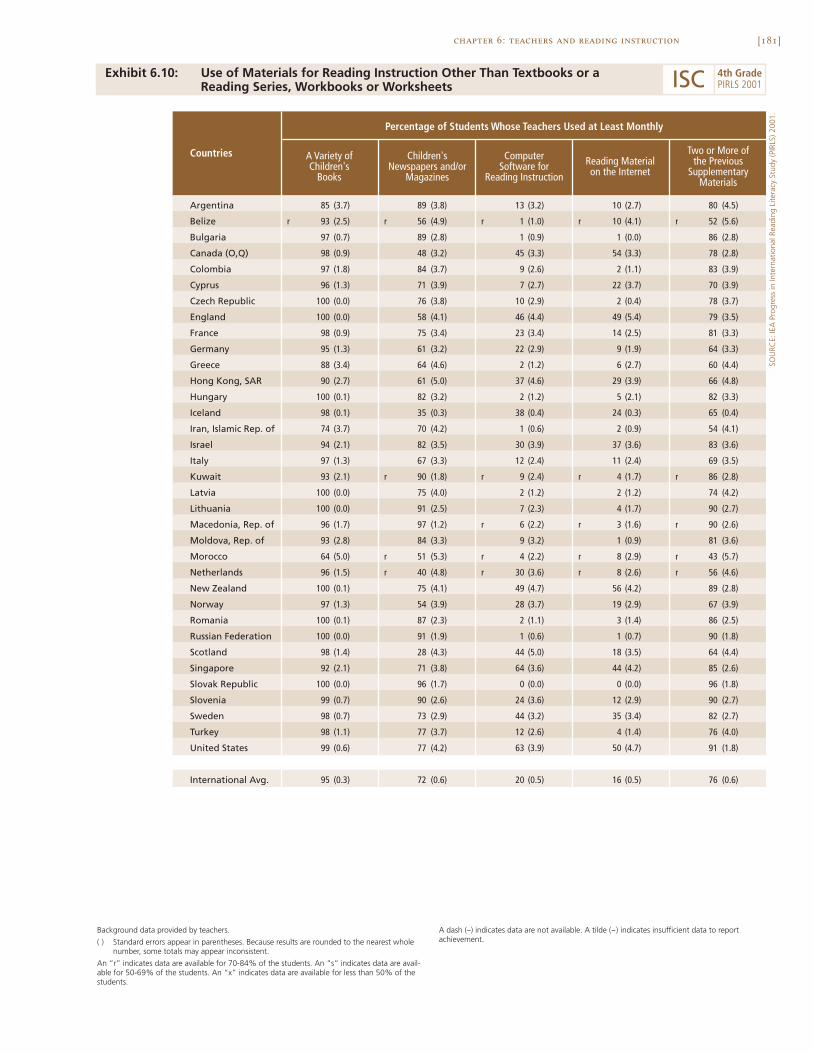
[181]chapter 6: teachers and reading instruction
Exhibit 6.10: Use of Materials for Reading Instruction Other Than Textbooks or aReading Series, Workbooks or Worksheets
SOU
RCE:
IEA
Pro
gres
s in
Inte
rnat
iona
l Rea
ding
Lite
racy
Stu
dy (P
IRLS
) 200
1.
Argentina 85 (3.7) 89 (3.8) 13 (3.2) 10 (2.7) 80 (4.5)
Belize r 93 (2.5) r 56 (4.9) r 1 (1.0) r 10 (4.1) r 52 (5.6)
Bulgaria 97 (0.7) 89 (2.8) 1 (0.9) 1 (0.0) 86 (2.8)
Canada (O,Q) 98 (0.9) 48 (3.2) 45 (3.3) 54 (3.3) 78 (2.8)
Colombia 97 (1.8) 84 (3.7) 9 (2.6) 2 (1.1) 83 (3.9)
Cyprus 96 (1.3) 71 (3.9) 7 (2.7) 22 (3.7) 70 (3.9)
Czech Republic 100 (0.0) 76 (3.8) 10 (2.9) 2 (0.4) 78 (3.7)
England 100 (0.0) 58 (4.1) 46 (4.4) 49 (5.4) 79 (3.5)
France 98 (0.9) 75 (3.4) 23 (3.4) 14 (2.5) 81 (3.3)
Germany 95 (1.3) 61 (3.2) 22 (2.9) 9 (1.9) 64 (3.3)
Greece 88 (3.4) 64 (4.6) 2 (1.2) 6 (2.7) 60 (4.4)
Hong Kong, SAR 90 (2.7) 61 (5.0) 37 (4.6) 29 (3.9) 66 (4.8)
Hungary 100 (0.1) 82 (3.2) 2 (1.2) 5 (2.1) 82 (3.3)
Iceland 98 (0.1) 35 (0.3) 38 (0.4) 24 (0.3) 65 (0.4)
Iran, Islamic Rep. of 74 (3.7) 70 (4.2) 1 (0.6) 2 (0.9) 54 (4.1)
Israel 94 (2.1) 82 (3.5) 30 (3.9) 37 (3.6) 83 (3.6)
Italy 97 (1.3) 67 (3.3) 12 (2.4) 11 (2.4) 69 (3.5)
Kuwait 93 (2.1) r 90 (1.8) r 9 (2.4) r 4 (1.7) r 86 (2.8)
Latvia 100 (0.0) 75 (4.0) 2 (1.2) 2 (1.2) 74 (4.2)
Lithuania 100 (0.0) 91 (2.5) 7 (2.3) 4 (1.7) 90 (2.7)
Macedonia, Rep. of 96 (1.7) 97 (1.2) r 6 (2.2) r 3 (1.6) r 90 (2.6)
Moldova, Rep. of 93 (2.8) 84 (3.3) 9 (3.2) 1 (0.9) 81 (3.6)
Morocco 64 (5.0) r 51 (5.3) r 4 (2.2) r 8 (2.9) r 43 (5.7)
Netherlands 96 (1.5) r 40 (4.8) r 30 (3.6) r 8 (2.6) r 56 (4.6)
New Zealand 100 (0.1) 75 (4.1) 49 (4.7) 56 (4.2) 89 (2.8)
Norway 97 (1.3) 54 (3.9) 28 (3.7) 19 (2.9) 67 (3.9)
Romania 100 (0.1) 87 (2.3) 2 (1.1) 3 (1.4) 86 (2.5)
Russian Federation 100 (0.0) 91 (1.9) 1 (0.6) 1 (0.7) 90 (1.8)
Scotland 98 (1.4) 28 (4.3) 44 (5.0) 18 (3.5) 64 (4.4)
Singapore 92 (2.1) 71 (3.8) 64 (3.6) 44 (4.2) 85 (2.6)
Slovak Republic 100 (0.0) 96 (1.7) 0 (0.0) 0 (0.0) 96 (1.8)
Slovenia 99 (0.7) 90 (2.6) 24 (3.6) 12 (2.9) 90 (2.7)
Sweden 98 (0.7) 73 (2.9) 44 (3.2) 35 (3.4) 82 (2.7)
Turkey 98 (1.1) 77 (3.7) 12 (2.6) 4 (1.4) 76 (4.0)
United States 99 (0.6) 77 (4.2) 63 (3.9) 50 (4.7) 91 (1.8)
International Avg. 95 (0.3) 72 (0.6) 20 (0.5) 16 (0.5) 76 (0.6)
Percentage of Students Whose Teachers Used at Least Monthly
Countries A Variety ofChildren's
Books
Children'sNewspapers and/or
Magazines
ComputerSoftware for
Reading Instruction
Reading Materialon the Internet
Two or More ofthe Previous
SupplementaryMaterials
Background data provided by teachers.
( ) Standard errors appear in parentheses. Because results are rounded to the nearest wholenumber, some totals may appear inconsistent.
An “r” indicates data are available for 70-84% of the students. An “s” indicates data are avail-able for 50-69% of the students. An “x” indicates data are available for less than 50% of thestudents.
A dash (–) indicates data are not available. A tilde (~) indicates insufficient data to reportachievement.
ISC 4th GradePIRLS 2001
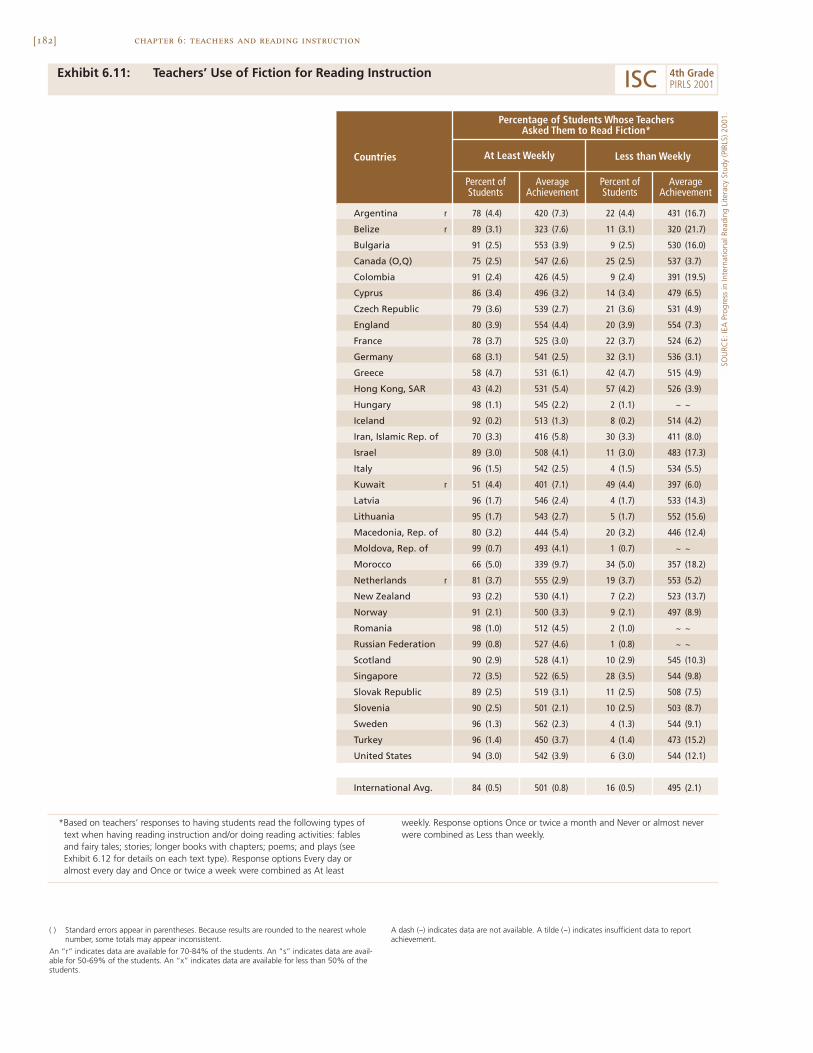
[182] chapter 6: teachers and reading instruction
Exhibit 6.11: Teachers’ Use of Fiction for Reading Instruction
Argentina r 78 (4.4) 420 (7.3) 22 (4.4) 431 (16.7)
Belize r 89 (3.1) 323 (7.6) 11 (3.1) 320 (21.7)
Bulgaria 91 (2.5) 553 (3.9) 9 (2.5) 530 (16.0)
Canada (O,Q) 75 (2.5) 547 (2.6) 25 (2.5) 537 (3.7)
Colombia 91 (2.4) 426 (4.5) 9 (2.4) 391 (19.5)
Cyprus 86 (3.4) 496 (3.2) 14 (3.4) 479 (6.5)
Czech Republic 79 (3.6) 539 (2.7) 21 (3.6) 531 (4.9)
England 80 (3.9) 554 (4.4) 20 (3.9) 554 (7.3)
France 78 (3.7) 525 (3.0) 22 (3.7) 524 (6.2)
Germany 68 (3.1) 541 (2.5) 32 (3.1) 536 (3.1)
Greece 58 (4.7) 531 (6.1) 42 (4.7) 515 (4.9)
Hong Kong, SAR 43 (4.2) 531 (5.4) 57 (4.2) 526 (3.9)
Hungary 98 (1.1) 545 (2.2) 2 (1.1) ~ ~
Iceland 92 (0.2) 513 (1.3) 8 (0.2) 514 (4.2)
Iran, Islamic Rep. of 70 (3.3) 416 (5.8) 30 (3.3) 411 (8.0)
Israel 89 (3.0) 508 (4.1) 11 (3.0) 483 (17.3)
Italy 96 (1.5) 542 (2.5) 4 (1.5) 534 (5.5)
Kuwait r 51 (4.4) 401 (7.1) 49 (4.4) 397 (6.0)
Latvia 96 (1.7) 546 (2.4) 4 (1.7) 533 (14.3)
Lithuania 95 (1.7) 543 (2.7) 5 (1.7) 552 (15.6)
Macedonia, Rep. of 80 (3.2) 444 (5.4) 20 (3.2) 446 (12.4)
Moldova, Rep. of 99 (0.7) 493 (4.1) 1 (0.7) ~ ~
Morocco 66 (5.0) 339 (9.7) 34 (5.0) 357 (18.2)
Netherlands r 81 (3.7) 555 (2.9) 19 (3.7) 553 (5.2)
New Zealand 93 (2.2) 530 (4.1) 7 (2.2) 523 (13.7)
Norway 91 (2.1) 500 (3.3) 9 (2.1) 497 (8.9)
Romania 98 (1.0) 512 (4.5) 2 (1.0) ~ ~
Russian Federation 99 (0.8) 527 (4.6) 1 (0.8) ~ ~
Scotland 90 (2.9) 528 (4.1) 10 (2.9) 545 (10.3)
Singapore 72 (3.5) 522 (6.5) 28 (3.5) 544 (9.8)
Slovak Republic 89 (2.5) 519 (3.1) 11 (2.5) 508 (7.5)
Slovenia 90 (2.5) 501 (2.1) 10 (2.5) 503 (8.7)
Sweden 96 (1.3) 562 (2.3) 4 (1.3) 544 (9.1)
Turkey 96 (1.4) 450 (3.7) 4 (1.4) 473 (15.2)
United States 94 (3.0) 542 (3.9) 6 (3.0) 544 (12.1)
International Avg. 84 (0.5) 501 (0.8) 16 (0.5) 495 (2.1)
At Least WeeklyCountries
Percentage of Students Whose TeachersAsked Them to Read Fiction*
Less than Weekly
Percent ofStudents
AverageAchievement
Percent ofStudents
AverageAchievement
( ) Standard errors appear in parentheses. Because results are rounded to the nearest wholenumber, some totals may appear inconsistent.
An “r” indicates data are available for 70-84% of the students. An “s” indicates data are avail-able for 50-69% of the students. An “x” indicates data are available for less than 50% of thestudents.
A dash (–) indicates data are not available. A tilde (~) indicates insufficient data to reportachievement.
SOU
RCE:
IEA
Pro
gres
s in
Inte
rnat
iona
l Rea
ding
Lite
racy
Stu
dy (P
IRLS
) 200
1.
ISC 4th GradePIRLS 2001
*Based on teachers’ responses to having students read the following types oftext when having reading instruction and/or doing reading activities: fablesand fairy tales; stories; longer books with chapters; poems; and plays (seeExhibit 6.12 for details on each text type). Response options Every day oralmost every day and Once or twice a week were combined as At least
weekly. Response options Once or twice a month and Never or almost neverwere combined as Less than weekly.

[183]chapter 6: teachers and reading instruction
Exhibit 6.12: Types of Fiction Used for Reading Instruction
SOU
RCE:
IEA
Pro
gres
s in
Inte
rnat
iona
l Rea
ding
Lite
racy
Stu
dy (P
IRLS
) 200
1.
Argentina 57 (4.9) 59 (4.9) r 7 (2.4) 37 (4.2) r 7 (2.3)
Belize r 73 (5.5) r 70 (5.9) r 13 (4.1) 53 (6.6) r 20 (5.5)
Bulgaria 74 (3.7) 85 (3.1) 22 (3.4) 58 (3.9) 2 (1.0)
Canada (O,Q) 16 (2.4) 65 (2.8) 57 (3.1) 12 (2.2) 3 (1.2)
Colombia 84 (3.5) 42 (4.3) 15 (3.2) 47 (4.8) 11 (2.8)
Cyprus 71 (3.8) 66 (4.9) 14 (3.8) 48 (5.0) 6 (2.3)
Czech Republic 41 (4.4) 62 (4.0) 38 (4.2) 23 (3.4) 13 (3.2)
England 11 (3.4) 72 (4.6) 56 (4.6) 29 (4.2) 12 (3.2)
France 18 (2.7) 44 (3.9) 45 (4.3) 35 (3.7) 7 (1.8)
Germany 9 (1.7) 64 (3.0) 13 (1.9) 12 (2.0) 3 (1.2)
Greece 27 (3.7) 42 (4.2) 7 (1.8) 27 (4.0) 3 (1.5)
Hong Kong, SAR 37 (4.3) 26 (4.0) 8 (2.5) 12 (2.9) 3 (1.6)
Hungary 73 (3.7) 91 (2.2) 20 (2.9) 51 (4.0) 1 (0.6)
Iceland 24 (0.3) 77 (0.4) 62 (0.4) 60 (0.4) 5 (0.2)
Iran, Islamic Rep. of 45 (4.3) 22 (3.2) 17 (2.7) 50 (4.3) 8 (1.9)
Israel 61 (5.0) 76 (4.1) 35 (4.1) 43 (4.9) 12 (2.9)
Italy 50 (3.7) 94 (1.9) 25 (3.5) 37 (3.7) 2 (1.2)
Kuwait r 19 (3.8) r 29 (4.1) r 6 (2.3) r 30 (3.8) r 9 (2.1)
Latvia 54 (3.5) 93 (2.3) 32 (4.0) 53 (4.2) 3 (1.5)
Lithuania 69 (4.1) 77 (3.8) 21 (3.8) 64 (4.0) 11 (2.6)
Macedonia, Rep. of 59 (4.2) 40 (4.3) 8 (2.5) 61 (3.8) 27 (4.0)
Moldova, Rep. of 73 (3.8) 82 (3.2) 19 (3.9) 87 (2.9) 19 (3.8)
Morocco 28 (5.2) 17 (4.6) r 20 (4.8) 53 (4.9) r 6 (2.6)
Netherlands 8 (2.5) r 51 (5.0) r 76 (3.9) 12 (2.8) r 0 (0.0)
New Zealand 22 (3.3) 88 (2.9) 63 (4.2) 54 (4.3) 21 (3.6)
Norway 29 (3.9) 78 (3.5) 52 (4.0) 33 (4.0) 3 (1.3)
Romania 78 (3.5) 74 (3.8) 7 (2.1) 75 (3.5) 5 (1.9)
Russian Federation 44 (2.9) 99 (0.7) 45 (3.5) 66 (3.2) 5 (1.6)
Scotland 10 (3.1) 77 (4.1) 72 (4.5) 21 (4.7) 1 (0.0)
Singapore 49 (4.1) 58 (3.9) 20 (3.1) 26 (3.6) 5 (1.7)
Slovak Republic 65 (3.6) 53 (3.6) 14 (3.2) 63 (4.1) 1 (0.5)
Slovenia 86 (3.1) 69 (3.8) 11 (2.6) 29 (3.8) 14 (3.0)
Sweden 28 (3.1) 80 (2.9) 90 (1.8) 4 (1.6) 2 (0.7)
Turkey 71 (3.4) 60 (4.3) 13 (2.9) 64 (4.0) 23 (3.3)
United States 22 (3.9) 88 (3.3) 74 (4.8) 22 (4.0) 6 (2.2)
International Avg. 45 (0.6) 65 (0.6) 31 (0.6) 41 (0.7) 8 (0.4)
Plays
Percentage of Students Whose TeachersAsked Them to Read at Least Weekly
CountriesFables andFairy Tales Stories Longer Books
with Chapters Poems
Background data provided by teachers.
( ) Standard errors appear in parentheses. Because results are rounded to the nearest wholenumber, some totals may appear inconsistent.
An “r” indicates data are available for 70-84% of the students. An “s” indicates data are avail-able for 50-69% of the students. An “x” indicates data are available for less than 50% of thestudents.
A dash (–) indicates data are not available. A tilde (~) indicates insufficient data to reportachievement.
ISC 4th GradePIRLS 2001
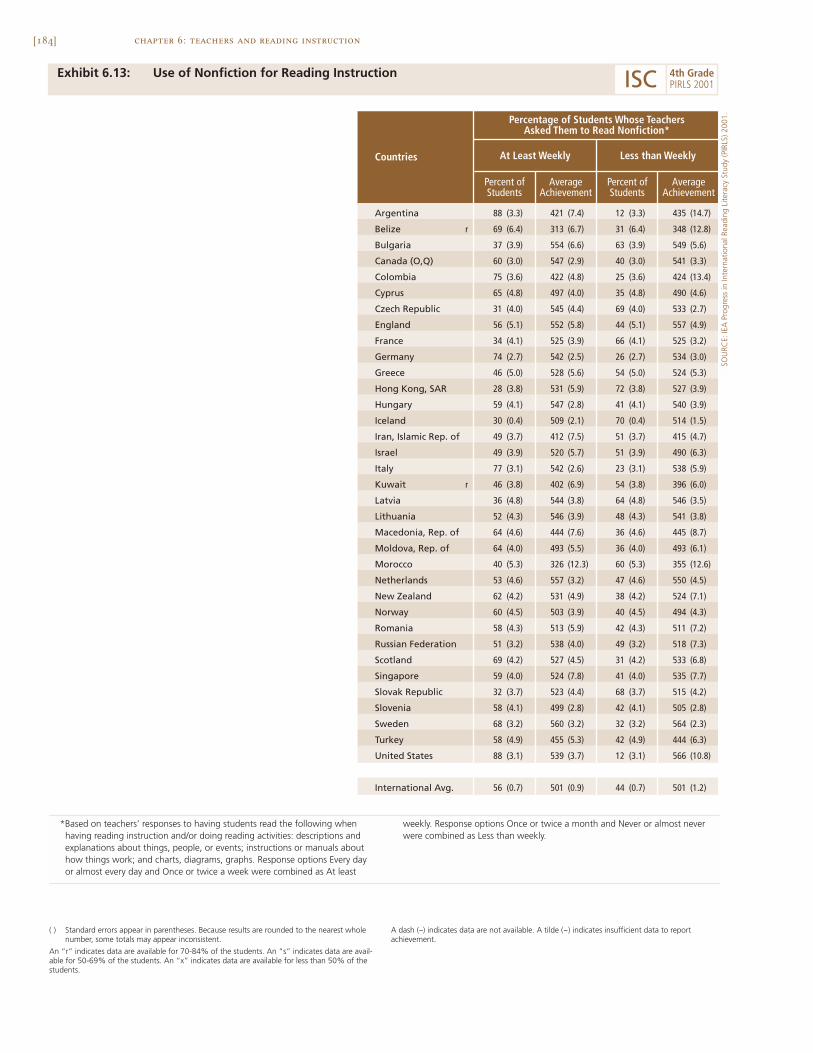
[184] chapter 6: teachers and reading instruction
Exhibit 6.13: Use of Nonfiction for Reading Instruction
Argentina 88 (3.3) 421 (7.4) 12 (3.3) 435 (14.7)
Belize r 69 (6.4) 313 (6.7) 31 (6.4) 348 (12.8)
Bulgaria 37 (3.9) 554 (6.6) 63 (3.9) 549 (5.6)
Canada (O,Q) 60 (3.0) 547 (2.9) 40 (3.0) 541 (3.3)
Colombia 75 (3.6) 422 (4.8) 25 (3.6) 424 (13.4)
Cyprus 65 (4.8) 497 (4.0) 35 (4.8) 490 (4.6)
Czech Republic 31 (4.0) 545 (4.4) 69 (4.0) 533 (2.7)
England 56 (5.1) 552 (5.8) 44 (5.1) 557 (4.9)
France 34 (4.1) 525 (3.9) 66 (4.1) 525 (3.2)
Germany 74 (2.7) 542 (2.5) 26 (2.7) 534 (3.0)
Greece 46 (5.0) 528 (5.6) 54 (5.0) 524 (5.3)
Hong Kong, SAR 28 (3.8) 531 (5.9) 72 (3.8) 527 (3.9)
Hungary 59 (4.1) 547 (2.8) 41 (4.1) 540 (3.9)
Iceland 30 (0.4) 509 (2.1) 70 (0.4) 514 (1.5)
Iran, Islamic Rep. of 49 (3.7) 412 (7.5) 51 (3.7) 415 (4.7)
Israel 49 (3.9) 520 (5.7) 51 (3.9) 490 (6.3)
Italy 77 (3.1) 542 (2.6) 23 (3.1) 538 (5.9)
Kuwait r 46 (3.8) 402 (6.9) 54 (3.8) 396 (6.0)
Latvia 36 (4.8) 544 (3.8) 64 (4.8) 546 (3.5)
Lithuania 52 (4.3) 546 (3.9) 48 (4.3) 541 (3.8)
Macedonia, Rep. of 64 (4.6) 444 (7.6) 36 (4.6) 445 (8.7)
Moldova, Rep. of 64 (4.0) 493 (5.5) 36 (4.0) 493 (6.1)
Morocco 40 (5.3) 326 (12.3) 60 (5.3) 355 (12.6)
Netherlands 53 (4.6) 557 (3.2) 47 (4.6) 550 (4.5)
New Zealand 62 (4.2) 531 (4.9) 38 (4.2) 524 (7.1)
Norway 60 (4.5) 503 (3.9) 40 (4.5) 494 (4.3)
Romania 58 (4.3) 513 (5.9) 42 (4.3) 511 (7.2)
Russian Federation 51 (3.2) 538 (4.0) 49 (3.2) 518 (7.3)
Scotland 69 (4.2) 527 (4.5) 31 (4.2) 533 (6.8)
Singapore 59 (4.0) 524 (7.8) 41 (4.0) 535 (7.7)
Slovak Republic 32 (3.7) 523 (4.4) 68 (3.7) 515 (4.2)
Slovenia 58 (4.1) 499 (2.8) 42 (4.1) 505 (2.8)
Sweden 68 (3.2) 560 (3.2) 32 (3.2) 564 (2.3)
Turkey 58 (4.9) 455 (5.3) 42 (4.9) 444 (6.3)
United States 88 (3.1) 539 (3.7) 12 (3.1) 566 (10.8)
International Avg. 56 (0.7) 501 (0.9) 44 (0.7) 501 (1.2)
Countries
Percentage of Students Whose TeachersAsked Them to Read Nonfiction*
Less than Weekly
Percent ofStudents
AverageAchievement
At Least Weekly
Percent ofStudents
AverageAchievement
( ) Standard errors appear in parentheses. Because results are rounded to the nearest wholenumber, some totals may appear inconsistent.
An “r” indicates data are available for 70-84% of the students. An “s” indicates data are avail-able for 50-69% of the students. An “x” indicates data are available for less than 50% of thestudents.
A dash (–) indicates data are not available. A tilde (~) indicates insufficient data to reportachievement.
SOU
RCE:
IEA
Pro
gres
s in
Inte
rnat
iona
l Rea
ding
Lite
racy
Stu
dy (P
IRLS
) 200
1.
ISC 4th GradePIRLS 2001
*Based on teachers’ responses to having students read the following whenhaving reading instruction and/or doing reading activities: descriptions andexplanations about things, people, or events; instructions or manuals abouthow things work; and charts, diagrams, graphs. Response options Every dayor almost every day and Once or twice a week were combined as At least
weekly. Response options Once or twice a month and Never or almost neverwere combined as Less than weekly.
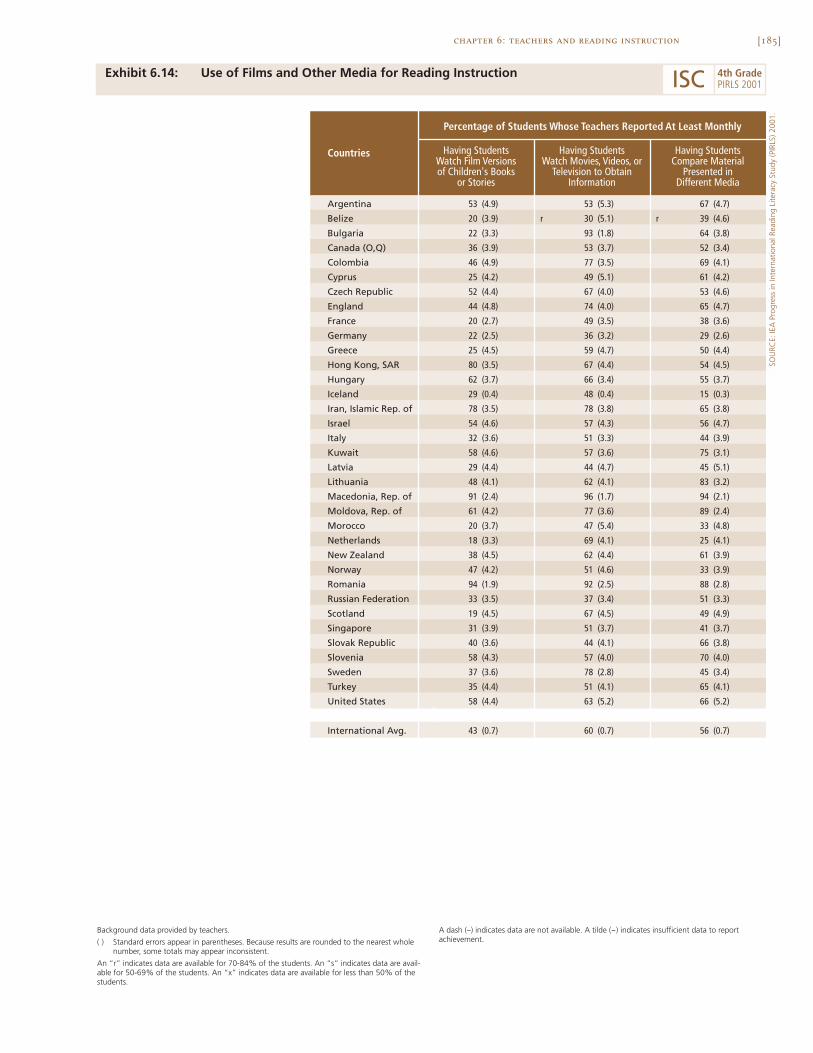
[185]chapter 6: teachers and reading instruction
Exhibit 6.14: Use of Films and Other Media for Reading Instruction
SOU
RCE:
IEA
Pro
gres
s in
Inte
rnat
iona
l Rea
ding
Lite
racy
Stu
dy (P
IRLS
) 200
1.
Argentina 53 (4.9) 53 (5.3) 67 (4.7)
Belize 20 (3.9) r 30 (5.1) r 39 (4.6)
Bulgaria 22 (3.3) 93 (1.8) 64 (3.8)
Canada (O,Q) 36 (3.9) 53 (3.7) 52 (3.4)
Colombia 46 (4.9) 77 (3.5) 69 (4.1)
Cyprus 25 (4.2) 49 (5.1) 61 (4.2)
Czech Republic 52 (4.4) 67 (4.0) 53 (4.6)
England 44 (4.8) 74 (4.0) 65 (4.7)
France 20 (2.7) 49 (3.5) 38 (3.6)
Germany 22 (2.5) 36 (3.2) 29 (2.6)
Greece 25 (4.5) 59 (4.7) 50 (4.4)
Hong Kong, SAR 80 (3.5) 67 (4.4) 54 (4.5)
Hungary 62 (3.7) 66 (3.4) 55 (3.7)
Iceland 29 (0.4) 48 (0.4) 15 (0.3)
Iran, Islamic Rep. of 78 (3.5) 78 (3.8) 65 (3.8)
Israel 54 (4.6) 57 (4.3) 56 (4.7)
Italy 32 (3.6) 51 (3.3) 44 (3.9)
Kuwait 58 (4.6) 57 (3.6) 75 (3.1)
Latvia 29 (4.4) 44 (4.7) 45 (5.1)
Lithuania 48 (4.1) 62 (4.1) 83 (3.2)
Macedonia, Rep. of 91 (2.4) 96 (1.7) 94 (2.1)
Moldova, Rep. of 61 (4.2) 77 (3.6) 89 (2.4)
Morocco 20 (3.7) 47 (5.4) 33 (4.8)
Netherlands 18 (3.3) 69 (4.1) 25 (4.1)
New Zealand 38 (4.5) 62 (4.4) 61 (3.9)
Norway 47 (4.2) 51 (4.6) 33 (3.9)
Romania 94 (1.9) 92 (2.5) 88 (2.8)
Russian Federation 33 (3.5) 37 (3.4) 51 (3.3)
Scotland 19 (4.5) 67 (4.5) 49 (4.9)
Singapore 31 (3.9) 51 (3.7) 41 (3.7)
Slovak Republic 40 (3.6) 44 (4.1) 66 (3.8)
Slovenia 58 (4.3) 57 (4.0) 70 (4.0)
Sweden 37 (3.6) 78 (2.8) 45 (3.4)
Turkey 35 (4.4) 51 (4.1) 65 (4.1)
United States 58 (4.4) 63 (5.2) 66 (5.2)
International Avg. 43 (0.7) 60 (0.7) 56 (0.7)
Percentage of Students Whose Teachers Reported At Least Monthly
Countries Having StudentsWatch Film Versionsof Children's Books
or Stories
Having StudentsWatch Movies, Videos, or
Television to ObtainInformation
Having StudentsCompare Material
Presented inDifferent Media
Background data provided by teachers.
( ) Standard errors appear in parentheses. Because results are rounded to the nearest wholenumber, some totals may appear inconsistent.
An “r” indicates data are available for 70-84% of the students. An “s” indicates data are avail-able for 50-69% of the students. An “x” indicates data are available for less than 50% of thestudents.
A dash (–) indicates data are not available. A tilde (~) indicates insufficient data to reportachievement.
ISC 4th GradePIRLS 2001
[186]
How Often Do Students Read Aloud and Independently in Class?
This section primarily describes teachers’ and students’ reports about class-room activities related to actually reading, including teachers reading aloudto the class, students reading aloud to the class, and students doing inde-pendent reading.
Regarding instruction in two specific reading skills and strategies –decoding and vocabulary – teachers reported little emphasis on decodingbut considerable attention to vocabulary (see Exhibit 6.15). Presumablybecause these are older students who have by and large mastered decodingskills, on average, internationally, teachers reported daily attention to decod-ing for 23 percent of students and weekly attention for 30 percent of stu-dents. The largest percentages of students receiving daily attention were inHong Kong (53%) and Italy (46%). For vocabulary, on average, internation-ally, according to their teachers 72 percent of students were helped dailyand 24 percent weekly. In Bulgaria, Greece, Lithuania, and Moldova, teach-ers reported that almost all students (97 to 99 percent) received help dailywith vocabulary.
Exhibits 6.16, 6.17, and 6.18 provide students’ reports about how oftenteachers read aloud to the class, students read aloud in class, and studentsengaged in independent reading, respectively. On average, internationally,most students (63%) reported that their teachers read aloud on a daily basis,and about one in four (24%) on a weekly basis (Exhibit 6.16). Interestingly,the few students (8%) who reported being read to only on a monthly basishad the highest achievement.
As shown in Exhibit 6.17, students reported that they themselvesspend rather less time reading aloud in class than do their teachers – 23 percentreported reading aloud daily and 36 percent weekly, on average, across coun-tries. More than 40 percent of students reported reading aloud daily inArgentina, Colombia, Kuwait, Macedonia, Moldova, Morocco, and Romania.Similar to the results for teachers reading aloud, students with the highestachievement reported reading aloud on a monthly basis.
According to students’ reports (Exhibit 6.18), independent silentreading was a more frequent activity in fourth-grade classrooms than reading
chapter 6: teachers and reading instruction
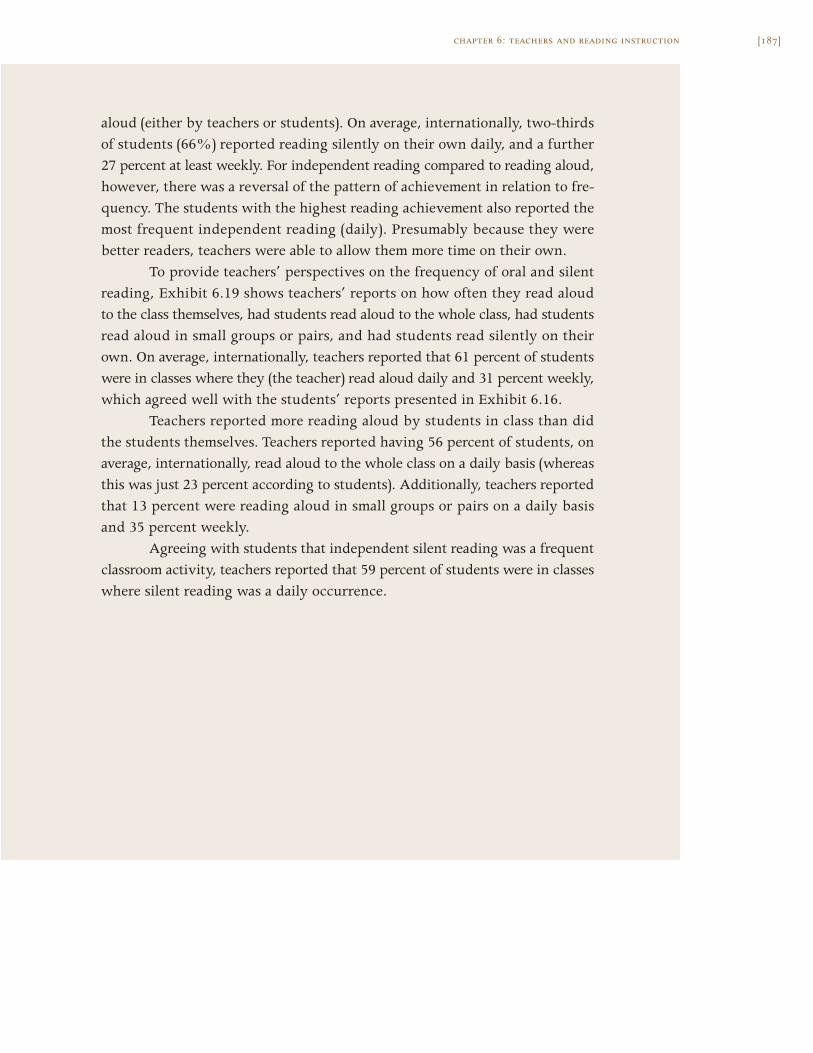
[187]chapter 6: teachers and reading instruction
aloud (either by teachers or students). On average, internationally, two-thirdsof students (66%) reported reading silently on their own daily, and a further27 percent at least weekly. For independent reading compared to reading aloud,however, there was a reversal of the pattern of achievement in relation to fre-quency. The students with the highest reading achievement also reported themost frequent independent reading (daily). Presumably because they werebetter readers, teachers were able to allow them more time on their own.
To provide teachers’ perspectives on the frequency of oral and silentreading, Exhibit 6.19 shows teachers’ reports on how often they read aloudto the class themselves, had students read aloud to the whole class, had studentsread aloud in small groups or pairs, and had students read silently on theirown. On average, internationally, teachers reported that 61 percent of studentswere in classes where they (the teacher) read aloud daily and 31 percent weekly,which agreed well with the students’ reports presented in Exhibit 6.16.
Teachers reported more reading aloud by students in class than didthe students themselves. Teachers reported having 56 percent of students, onaverage, internationally, read aloud to the whole class on a daily basis (whereasthis was just 23 percent according to students). Additionally, teachers reportedthat 13 percent were reading aloud in small groups or pairs on a daily basisand 35 percent weekly.
Agreeing with students that independent silent reading was a frequentclassroom activity, teachers reported that 59 percent of students were in classeswhere silent reading was a daily occurrence.
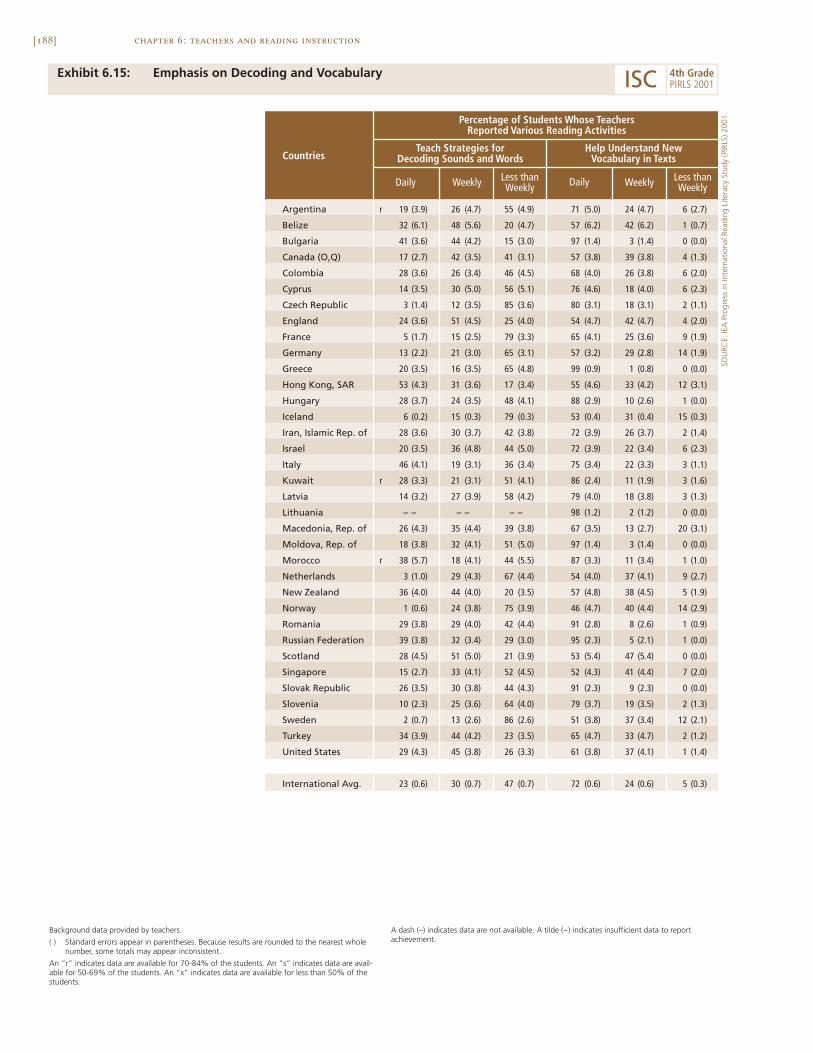
[188] chapter 6: teachers and reading instruction
Exhibit 6.15: Emphasis on Decoding and Vocabulary
Argentina r 19 (3.9) 26 (4.7) 55 (4.9) 71 (5.0) 24 (4.7) 6 (2.7)
Belize 32 (6.1) 48 (5.6) 20 (4.7) 57 (6.2) 42 (6.2) 1 (0.7)
Bulgaria 41 (3.6) 44 (4.2) 15 (3.0) 97 (1.4) 3 (1.4) 0 (0.0)
Canada (O,Q) 17 (2.7) 42 (3.5) 41 (3.1) 57 (3.8) 39 (3.8) 4 (1.3)
Colombia 28 (3.6) 26 (3.4) 46 (4.5) 68 (4.0) 26 (3.8) 6 (2.0)
Cyprus 14 (3.5) 30 (5.0) 56 (5.1) 76 (4.6) 18 (4.0) 6 (2.3)
Czech Republic 3 (1.4) 12 (3.5) 85 (3.6) 80 (3.1) 18 (3.1) 2 (1.1)
England 24 (3.6) 51 (4.5) 25 (4.0) 54 (4.7) 42 (4.7) 4 (2.0)
France 5 (1.7) 15 (2.5) 79 (3.3) 65 (4.1) 25 (3.6) 9 (1.9)
Germany 13 (2.2) 21 (3.0) 65 (3.1) 57 (3.2) 29 (2.8) 14 (1.9)
Greece 20 (3.5) 16 (3.5) 65 (4.8) 99 (0.9) 1 (0.8) 0 (0.0)
Hong Kong, SAR 53 (4.3) 31 (3.6) 17 (3.4) 55 (4.6) 33 (4.2) 12 (3.1)
Hungary 28 (3.7) 24 (3.5) 48 (4.1) 88 (2.9) 10 (2.6) 1 (0.0)
Iceland 6 (0.2) 15 (0.3) 79 (0.3) 53 (0.4) 31 (0.4) 15 (0.3)
Iran, Islamic Rep. of 28 (3.6) 30 (3.7) 42 (3.8) 72 (3.9) 26 (3.7) 2 (1.4)
Israel 20 (3.5) 36 (4.8) 44 (5.0) 72 (3.9) 22 (3.4) 6 (2.3)
Italy 46 (4.1) 19 (3.1) 36 (3.4) 75 (3.4) 22 (3.3) 3 (1.1)
Kuwait r 28 (3.3) 21 (3.1) 51 (4.1) 86 (2.4) 11 (1.9) 3 (1.6)
Latvia 14 (3.2) 27 (3.9) 58 (4.2) 79 (4.0) 18 (3.8) 3 (1.3)
Lithuania – – – – – – 98 (1.2) 2 (1.2) 0 (0.0)
Macedonia, Rep. of 26 (4.3) 35 (4.4) 39 (3.8) 67 (3.5) 13 (2.7) 20 (3.1)
Moldova, Rep. of 18 (3.8) 32 (4.1) 51 (5.0) 97 (1.4) 3 (1.4) 0 (0.0)
Morocco r 38 (5.7) 18 (4.1) 44 (5.5) 87 (3.3) 11 (3.4) 1 (1.0)
Netherlands 3 (1.0) 29 (4.3) 67 (4.4) 54 (4.0) 37 (4.1) 9 (2.7)
New Zealand 36 (4.0) 44 (4.0) 20 (3.5) 57 (4.8) 38 (4.5) 5 (1.9)
Norway 1 (0.6) 24 (3.8) 75 (3.9) 46 (4.7) 40 (4.4) 14 (2.9)
Romania 29 (3.8) 29 (4.0) 42 (4.4) 91 (2.8) 8 (2.6) 1 (0.9)
Russian Federation 39 (3.8) 32 (3.4) 29 (3.0) 95 (2.3) 5 (2.1) 1 (0.0)
Scotland 28 (4.5) 51 (5.0) 21 (3.9) 53 (5.4) 47 (5.4) 0 (0.0)
Singapore 15 (2.7) 33 (4.1) 52 (4.5) 52 (4.3) 41 (4.4) 7 (2.0)
Slovak Republic 26 (3.5) 30 (3.8) 44 (4.3) 91 (2.3) 9 (2.3) 0 (0.0)
Slovenia 10 (2.3) 25 (3.6) 64 (4.0) 79 (3.7) 19 (3.5) 2 (1.3)
Sweden 2 (0.7) 13 (2.6) 86 (2.6) 51 (3.8) 37 (3.4) 12 (2.1)
Turkey 34 (3.9) 44 (4.2) 23 (3.5) 65 (4.7) 33 (4.7) 2 (1.2)
United States 29 (4.3) 45 (3.8) 26 (3.3) 61 (3.8) 37 (4.1) 1 (1.4)
International Avg. 23 (0.6) 30 (0.7) 47 (0.7) 72 (0.6) 24 (0.6) 5 (0.3)
Less thanWeeklyDaily Weekly
Percentage of Students Whose TeachersReported Various Reading Activities
Countries
Daily Weekly Less thanWeekly
Teach Strategies forDecoding Sounds and Words
Help Understand NewVocabulary in Texts
Background data provided by teachers.
( ) Standard errors appear in parentheses. Because results are rounded to the nearest wholenumber, some totals may appear inconsistent.
An “r” indicates data are available for 70-84% of the students. An “s” indicates data are avail-able for 50-69% of the students. An “x” indicates data are available for less than 50% of thestudents.
A dash (–) indicates data are not available. A tilde (~) indicates insufficient data to reportachievement.
SOU
RCE:
IEA
Pro
gres
s in
Inte
rnat
iona
l Rea
ding
Lite
racy
Stu
dy (P
IRLS
) 200
1.
ISC 4th GradePIRLS 2001

[189]chapter 6: teachers and reading instruction
Exhibit 6.16: Students’ Reports About Teachers Reading Aloud in Class
SOU
RCE:
IEA
Pro
gres
s in
Inte
rnat
iona
l Rea
ding
Lite
racy
Stu
dy (P
IRLS
) 200
1.
Argentina 78 (1.4) 423 (5.7) 16 (1.0) 438 (8.0) 3 (0.4) 421 (14.8) 3 (0.6) 434 (20.7)
Belize 73 (2.3) 331 (5.5) 18 (1.8) 332 (9.7) 5 (0.7) 312 (21.1) 4 (0.5) 294 (13.4)
Bulgaria 79 (1.4) 552 (3.7) 17 (1.1) 557 (5.1) 2 (0.3) ~ ~ 2 (0.5) ~ ~
Canada (O,Q) 58 (1.8) 542 (2.9) 27 (1.4) 548 (3.0) 11 (0.7) 550 (4.0) 5 (0.5) 539 (6.1)
Colombia 89 (1.0) 422 (4.4) 8 (0.8) 450 (8.0) 1 (0.2) ~ ~ 1 (0.3) ~ ~
Cyprus 85 (1.2) 495 (3.1) 11 (1.0) 506 (6.9) 2 (0.3) ~ ~ 2 (0.3) ~ ~
Czech Republic 35 (1.8) 530 (3.2) 39 (1.8) 540 (3.4) 18 (1.2) 544 (4.0) 8 (1.2) 538 (5.1)
England 50 (2.1) 548 (4.8) 36 (2.0) 554 (4.6) 11 (1.3) 576 (6.4) 4 (0.9) 551 (9.6)
France 51 (2.0) 518 (3.0) 25 (1.2) 534 (3.0) 12 (1.0) 541 (4.3) 11 (1.0) 531 (4.6)
Germany 20 (1.3) 520 (3.9) 36 (1.0) 541 (2.2) 28 (1.0) 551 (2.3) 16 (0.8) 543 (3.2)
Greece 86 (1.5) 524 (3.6) 10 (1.3) 528 (10.8) 2 (0.4) ~ ~ 2 (0.5) ~ ~
Hong Kong, SAR 37 (1.6) 532 (3.8) 28 (1.3) 533 (3.8) 14 (0.7) 531 (4.0) 22 (1.1) 516 (3.8)
Hungary 45 (2.5) 537 (3.2) 36 (2.0) 548 (2.3) 15 (1.2) 555 (4.5) 4 (0.6) 539 (8.6)
Iceland 72 (0.8) 514 (1.5) 18 (0.7) 519 (2.7) 5 (0.3) 505 (6.2) 5 (0.4) 494 (5.0)
Iran, Islamic Rep. of 80 (1.1) 417 (4.4) 13 (0.8) 417 (6.3) 2 (0.3) ~ ~ 5 (0.5) 389 (7.0)
Israel 75 (0.9) 508 (2.8) 17 (0.7) 523 (5.2) 5 (0.4) 535 (8.9) 3 (0.4) 487 (12.9)
Italy 61 (1.4) 535 (2.7) 26 (1.2) 553 (3.4) 7 (0.6) 559 (5.4) 5 (0.6) 531 (6.1)
Kuwait r 85 (0.9) 403 (4.6) 8 (0.5) 383 (5.5) 2 (0.2) ~ ~ 5 (0.5) 395 (6.1)
Latvia 39 (1.7) 535 (3.3) 40 (1.3) 550 (2.7) 16 (1.0) 560 (3.7) 6 (0.6) 537 (5.6)
Lithuania 55 (2.1) 536 (2.8) 33 (1.5) 553 (3.5) 9 (0.9) 560 (5.9) 3 (0.5) 523 (9.4)
Macedonia, Rep. of 87 (0.9) 447 (4.5) 10 (0.9) 427 (9.1) 1 (0.2) ~ ~ 2 (0.4) ~ ~
Moldova, Rep. of 76 (3.1) 490 (4.1) 19 (3.0) 497 (9.1) 3 (0.8) 516 (28.4) 2 (0.4) ~ ~
Morocco 86 (1.5) 354 (10.1) 10 (1.1) 335 (16.1) 1 (0.2) ~ ~ 2 (0.6) ~ ~
Netherlands 51 (2.7) 550 (3.2) 30 (1.8) 560 (2.7) 10 (1.0) 560 (5.5) 9 (1.3) 554 (4.7)
New Zealand 58 (2.9) 528 (5.1) 31 (2.2) 536 (4.8) 8 (1.0) 546 (8.4) 3 (0.5) 497 (11.3)
Norway 63 (2.5) 497 (3.5) 25 (1.6) 505 (4.4) 7 (1.0) 507 (7.0) 4 (0.7) 489 (9.5)
Romania 80 (1.6) 512 (4.9) 16 (1.4) 521 (6.3) 3 (0.4) 502 (16.6) 1 (0.4) ~ ~
Russian Federation 68 (1.9) 525 (5.1) 24 (1.3) 534 (5.0) 6 (0.7) 535 (6.3) 2 (0.4) ~ ~
Scotland 52 (3.0) 521 (4.1) 36 (2.5) 538 (5.0) 8 (0.9) 544 (7.9) 3 (0.4) 522 (14.2)
Singapore 66 (1.2) 527 (4.9) 20 (0.6) 534 (6.0) 7 (0.8) 542 (13.9) 7 (0.4) 510 (8.6)
Slovak Republic 49 (2.4) 510 (3.8) 33 (2.1) 526 (3.7) 13 (1.1) 529 (5.1) 5 (0.6) 520 (7.3)
Slovenia 48 (2.0) 495 (2.7) 37 (1.6) 508 (2.6) 12 (1.1) 514 (5.1) 3 (0.5) 508 (8.2)
Sweden 41 (2.3) 560 (3.0) 42 (1.8) 562 (2.7) 13 (1.2) 561 (3.6) 4 (0.8) 552 (7.5)
Turkey 65 (2.4) 447 (4.0) 26 (1.8) 456 (5.3) 5 (0.7) 452 (10.8) 3 (0.8) 447 (8.2)
United States 57 (3.0) 540 (4.5) 25 (1.9) 544 (5.5) 11 (1.2) 556 (6.2) 6 (0.6) 536 (8.1)
International Avg. 63 (0.3) 498 (0.7) 24 (0.3) 505 (1.1) 8 (0.1) 525 (2.1) 5 (0.1) 499 (2.0)
Once or Twice a Week Once or Twice a Month Never or Almost Never
Percent ofStudents
AverageAchievement
Every Day or AlmostEvery Day
CountriesPercent ofStudents
AverageAchievement
Percent ofStudents
AverageAchievement
Percent ofStudents
AverageAchievement
Background data provided by students.
( ) Standard errors appear in parentheses. Because results are rounded to the nearest wholenumber, some totals may appear inconsistent.
An “r” indicates data are available for 70-84% of the students. An “s” indicates data are avail-able for 50-69% of the students. An “x” indicates data are available for less than 50% of thestudents.
A dash (–) indicates data are not available. A tilde (~) indicates insufficient data to reportachievement.
ISC 4th GradePIRLS 2001
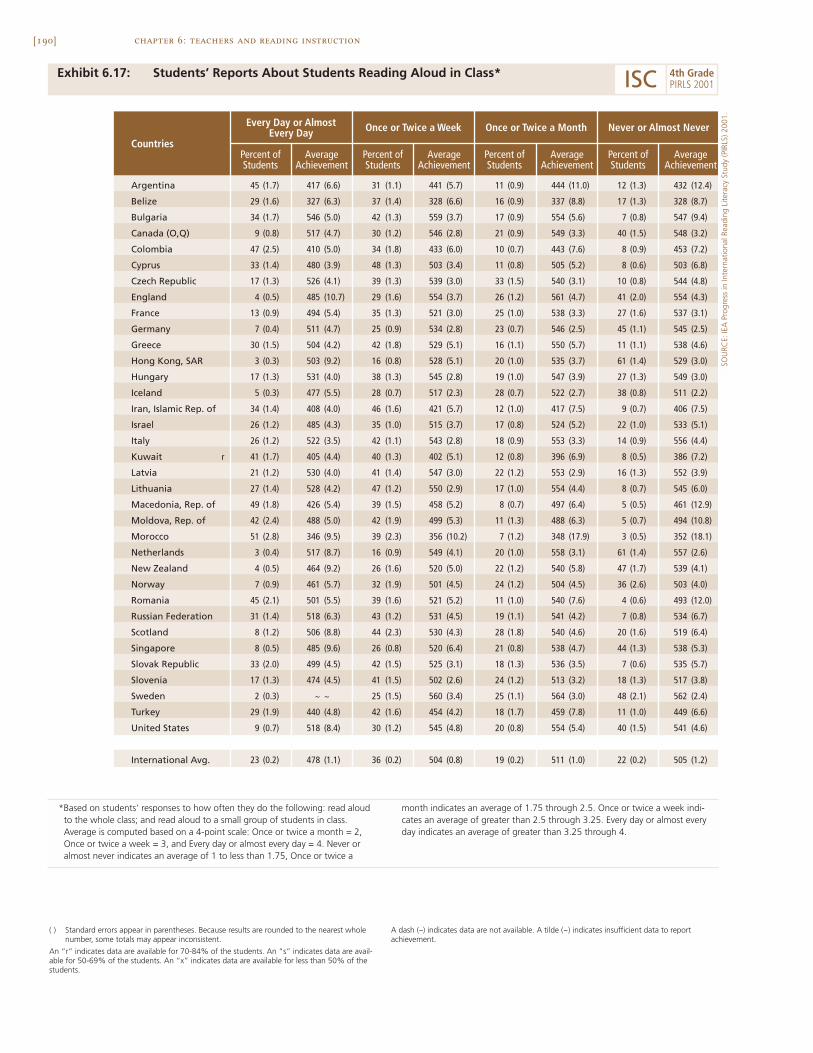
[190] chapter 6: teachers and reading instruction
Exhibit 6.17: Students’ Reports About Students Reading Aloud in Class*
Argentina 45 (1.7) 417 (6.6) 31 (1.1) 441 (5.7) 11 (0.9) 444 (11.0) 12 (1.3) 432 (12.4)
Belize 29 (1.6) 327 (6.3) 37 (1.4) 328 (6.6) 16 (0.9) 337 (8.8) 17 (1.3) 328 (8.7)
Bulgaria 34 (1.7) 546 (5.0) 42 (1.3) 559 (3.7) 17 (0.9) 554 (5.6) 7 (0.8) 547 (9.4)
Canada (O,Q) 9 (0.8) 517 (4.7) 30 (1.2) 546 (2.8) 21 (0.9) 549 (3.3) 40 (1.5) 548 (3.2)
Colombia 47 (2.5) 410 (5.0) 34 (1.8) 433 (6.0) 10 (0.7) 443 (7.6) 8 (0.9) 453 (7.2)
Cyprus 33 (1.4) 480 (3.9) 48 (1.3) 503 (3.4) 11 (0.8) 505 (5.2) 8 (0.6) 503 (6.8)
Czech Republic 17 (1.3) 526 (4.1) 39 (1.3) 539 (3.0) 33 (1.5) 540 (3.1) 10 (0.8) 544 (4.8)
England 4 (0.5) 485 (10.7) 29 (1.6) 554 (3.7) 26 (1.2) 561 (4.7) 41 (2.0) 554 (4.3)
France 13 (0.9) 494 (5.4) 35 (1.3) 521 (3.0) 25 (1.0) 538 (3.3) 27 (1.6) 537 (3.1)
Germany 7 (0.4) 511 (4.7) 25 (0.9) 534 (2.8) 23 (0.7) 546 (2.5) 45 (1.1) 545 (2.5)
Greece 30 (1.5) 504 (4.2) 42 (1.8) 529 (5.1) 16 (1.1) 550 (5.7) 11 (1.1) 538 (4.6)
Hong Kong, SAR 3 (0.3) 503 (9.2) 16 (0.8) 528 (5.1) 20 (1.0) 535 (3.7) 61 (1.4) 529 (3.0)
Hungary 17 (1.3) 531 (4.0) 38 (1.3) 545 (2.8) 19 (1.0) 547 (3.9) 27 (1.3) 549 (3.0)
Iceland 5 (0.3) 477 (5.5) 28 (0.7) 517 (2.3) 28 (0.7) 522 (2.7) 38 (0.8) 511 (2.2)
Iran, Islamic Rep. of 34 (1.4) 408 (4.0) 46 (1.6) 421 (5.7) 12 (1.0) 417 (7.5) 9 (0.7) 406 (7.5)
Israel 26 (1.2) 485 (4.3) 35 (1.0) 515 (3.7) 17 (0.8) 524 (5.2) 22 (1.0) 533 (5.1)
Italy 26 (1.2) 522 (3.5) 42 (1.1) 543 (2.8) 18 (0.9) 553 (3.3) 14 (0.9) 556 (4.4)
Kuwait r 41 (1.7) 405 (4.4) 40 (1.3) 402 (5.1) 12 (0.8) 396 (6.9) 8 (0.5) 386 (7.2)
Latvia 21 (1.2) 530 (4.0) 41 (1.4) 547 (3.0) 22 (1.2) 553 (2.9) 16 (1.3) 552 (3.9)
Lithuania 27 (1.4) 528 (4.2) 47 (1.2) 550 (2.9) 17 (1.0) 554 (4.4) 8 (0.7) 545 (6.0)
Macedonia, Rep. of 49 (1.8) 426 (5.4) 39 (1.5) 458 (5.2) 8 (0.7) 497 (6.4) 5 (0.5) 461 (12.9)
Moldova, Rep. of 42 (2.4) 488 (5.0) 42 (1.9) 499 (5.3) 11 (1.3) 488 (6.3) 5 (0.7) 494 (10.8)
Morocco 51 (2.8) 346 (9.5) 39 (2.3) 356 (10.2) 7 (1.2) 348 (17.9) 3 (0.5) 352 (18.1)
Netherlands 3 (0.4) 517 (8.7) 16 (0.9) 549 (4.1) 20 (1.0) 558 (3.1) 61 (1.4) 557 (2.6)
New Zealand 4 (0.5) 464 (9.2) 26 (1.6) 520 (5.0) 22 (1.2) 540 (5.8) 47 (1.7) 539 (4.1)
Norway 7 (0.9) 461 (5.7) 32 (1.9) 501 (4.5) 24 (1.2) 504 (4.5) 36 (2.6) 503 (4.0)
Romania 45 (2.1) 501 (5.5) 39 (1.6) 521 (5.2) 11 (1.0) 540 (7.6) 4 (0.6) 493 (12.0)
Russian Federation 31 (1.4) 518 (6.3) 43 (1.2) 531 (4.5) 19 (1.1) 541 (4.2) 7 (0.8) 534 (6.7)
Scotland 8 (1.2) 506 (8.8) 44 (2.3) 530 (4.3) 28 (1.8) 540 (4.6) 20 (1.6) 519 (6.4)
Singapore 8 (0.5) 485 (9.6) 26 (0.8) 520 (6.4) 21 (0.8) 538 (4.7) 44 (1.3) 538 (5.3)
Slovak Republic 33 (2.0) 499 (4.5) 42 (1.5) 525 (3.1) 18 (1.3) 536 (3.5) 7 (0.6) 535 (5.7)
Slovenia 17 (1.3) 474 (4.5) 41 (1.5) 502 (2.6) 24 (1.2) 513 (3.2) 18 (1.3) 517 (3.8)
Sweden 2 (0.3) ~ ~ 25 (1.5) 560 (3.4) 25 (1.1) 564 (3.0) 48 (2.1) 562 (2.4)
Turkey 29 (1.9) 440 (4.8) 42 (1.6) 454 (4.2) 18 (1.7) 459 (7.8) 11 (1.0) 449 (6.6)
United States 9 (0.7) 518 (8.4) 30 (1.2) 545 (4.8) 20 (0.8) 554 (5.4) 40 (1.5) 541 (4.6)
International Avg. 23 (0.2) 478 (1.1) 36 (0.2) 504 (0.8) 19 (0.2) 511 (1.0) 22 (0.2) 505 (1.2)
Once or Twice a Week Once or Twice a Month Never or Almost Never
Percent ofStudents
AverageAchievement
Every Day or AlmostEvery Day
CountriesPercent ofStudents
AverageAchievement
Percent ofStudents
AverageAchievement
Percent ofStudents
AverageAchievement
( ) Standard errors appear in parentheses. Because results are rounded to the nearest wholenumber, some totals may appear inconsistent.
An “r” indicates data are available for 70-84% of the students. An “s” indicates data are avail-able for 50-69% of the students. An “x” indicates data are available for less than 50% of thestudents.
A dash (–) indicates data are not available. A tilde (~) indicates insufficient data to reportachievement.
SOU
RCE:
IEA
Pro
gres
s in
Inte
rnat
iona
l Rea
ding
Lite
racy
Stu
dy (P
IRLS
) 200
1.
ISC 4th GradePIRLS 2001
*Based on students’ responses to how often they do the following: read aloudto the whole class; and read aloud to a small group of students in class.Average is computed based on a 4-point scale: Once or twice a month = 2,Once or twice a week = 3, and Every day or almost every day = 4. Never oralmost never indicates an average of 1 to less than 1.75, Once or twice a
month indicates an average of 1.75 through 2.5. Once or twice a week indi-cates an average of greater than 2.5 through 3.25. Every day or almost everyday indicates an average of greater than 3.25 through 4.

[191]chapter 6: teachers and reading instruction
Exhibit 6.18: Students’ Reports About Independent Reading*
SOU
RCE:
IEA
Pro
gres
s in
Inte
rnat
iona
l Rea
ding
Lite
racy
Stu
dy (P
IRLS
) 200
1.
Argentina 68 (1.2) 434 (5.6) 26 (0.9) 422 (6.7) 4 (0.4) 420 (12.1) 3 (0.4) 390 (17.2)
Belize 53 (1.9) 349 (6.2) 32 (1.7) 320 (7.0) 9 (0.5) 287 (7.1) 6 (0.6) 266 (11.6)
Bulgaria 69 (1.5) 560 (3.8) 26 (1.3) 546 (4.9) 3 (0.4) 498 (12.7) 2 (0.4) ~ ~
Canada (O,Q) 82 (0.8) 549 (2.4) 14 (0.7) 530 (4.3) 2 (0.2) ~ ~ 1 (0.1) ~ ~
Colombia 70 (1.7) 426 (5.3) 24 (1.6) 422 (5.4) 4 (0.5) 426 (9.7) 2 (0.3) ~ ~
Cyprus 66 (1.2) 504 (3.2) 28 (1.1) 487 (4.1) 4 (0.4) 456 (9.7) 2 (0.2) ~ ~
Czech Republic 51 (1.4) 539 (2.6) 36 (1.1) 535 (3.0) 8 (0.7) 541 (5.5) 5 (0.5) 532 (7.7)
England 83 (1.1) 558 (3.4) 14 (0.9) 535 (5.4) 1 (0.2) ~ ~ 1 (0.2) ~ ~
France 68 (1.1) 528 (2.7) 25 (1.0) 522 (3.1) 4 (0.3) 522 (7.7) 3 (0.3) 506 (10.0)
Germany 62 (0.7) 537 (1.9) 28 (0.6) 545 (2.8) 6 (0.3) 546 (4.4) 4 (0.3) 536 (6.3)
Greece 57 (1.7) 526 (4.2) 33 (1.3) 523 (4.2) 6 (0.6) 526 (8.1) 4 (0.6) 530 (7.4)
Hong Kong, SAR 45 (1.0) 538 (3.2) 42 (0.9) 527 (3.0) 9 (0.5) 507 (4.9) 4 (0.3) 493 (6.3)
Hungary 53 (1.5) 547 (2.2) 38 (1.4) 542 (2.9) 6 (0.5) 542 (6.7) 3 (0.4) 526 (7.7)
Iceland 74 (0.7) 517 (1.6) 20 (0.7) 508 (3.0) 4 (0.3) 502 (8.0) 3 (0.3) 482 (9.6)
Iran, Islamic Rep. of 54 (1.0) 428 (4.2) 35 (1.1) 406 (5.3) 7 (0.6) 383 (6.8) 3 (0.3) 370 (9.2)
Israel 70 (1.1) 525 (2.6) 24 (0.9) 493 (5.1) 4 (0.3) 468 (9.8) 3 (0.2) 442 (12.6)
Italy 57 (1.0) 546 (2.6) 31 (0.9) 537 (3.1) 7 (0.6) 534 (5.9) 5 (0.4) 526 (6.7)
Kuwait r 46 (1.4) 412 (3.6) 38 (1.1) 396 (5.2) 9 (0.6) 388 (7.9) 7 (0.5) 378 (9.9)
Latvia 68 (1.0) 547 (2.5) 26 (0.9) 544 (2.9) 3 (0.6) 535 (10.2) 2 (0.3) ~ ~
Lithuania 73 (1.0) 544 (2.8) 24 (1.0) 549 (3.6) 3 (0.3) 528 (9.9) 1 (0.2) ~ ~
Macedonia, Rep. of 73 (1.4) 453 (4.5) 23 (1.2) 431 (7.1) 3 (0.6) 409 (16.3) 2 (0.3) ~ ~
Moldova, Rep. of 78 (1.7) 497 (4.1) 19 (1.6) 484 (5.8) 2 (0.3) ~ ~ 1 (0.2) ~ ~
Morocco 34 (1.9) 357 (8.7) 47 (2.1) 342 (8.3) 13 (2.2) 351 (19.2) 7 (0.9) 346 (12.1)
Netherlands 68 (1.7) 556 (2.7) 26 (1.3) 555 (2.8) 3 (0.3) 540 (6.4) 3 (0.5) 537 (9.1)
New Zealand 86 (0.8) 538 (3.5) 12 (0.6) 497 (7.0) 1 (0.3) ~ ~ 1 (0.3) ~ ~
Norway 57 (1.6) 499 (3.3) 33 (1.4) 503 (3.5) 6 (0.5) 499 (8.2) 3 (0.4) 482 (8.6)
Romania 63 (1.4) 520 (4.6) 30 (1.3) 511 (6.8) 4 (0.5) 488 (12.3) 3 (0.4) 457 (15.1)
Russian Federation 69 (1.2) 531 (4.1) 25 (1.1) 525 (5.8) 3 (0.3) 520 (9.5) 2 (0.3) ~ ~
Scotland 71 (2.0) 533 (3.8) 23 (1.8) 527 (5.3) 3 (0.4) 494 (13.2) 2 (0.4) ~ ~
Singapore 78 (0.9) 543 (4.7) 18 (0.6) 493 (6.2) 3 (0.3) 441 (11.6) 2 (0.2) ~ ~
Slovak Republic 63 (1.5) 521 (3.1) 32 (1.2) 516 (3.7) 4 (0.4) 514 (7.2) 2 (0.3) ~ ~
Slovenia 76 (1.1) 507 (2.2) 21 (1.0) 491 (3.6) 2 (0.3) ~ ~ 1 (0.2) ~ ~
Sweden 74 (1.1) 562 (2.4) 23 (0.9) 559 (3.0) 2 (0.3) ~ ~ 1 (0.2) ~ ~
Turkey 71 (1.5) 459 (3.7) 24 (1.1) 437 (5.4) 3 (0.5) 396 (8.9) 2 (0.3) ~ ~
United States 84 (0.9) 549 (3.6) 14 (0.8) 518 (6.1) 2 (0.3) ~ ~ 1 (0.1) ~ ~
International Avg. 66 (0.2) 507 (0.6) 27 (0.2) 494 (0.8) 4 (0.1) 474 (1.8) 3 (0.1) 459 (2.3)
Every Day or AlmostEvery Day Once or Twice a Week Once or Twice a Month Never or Almost Never
CountriesPercent ofStudents
AverageAchievement
Percent ofStudents
AverageAchievement
Percent ofStudents
AverageAchievement
Percent ofStudents
AverageAchievement
( ) Standard errors appear in parentheses. Because results are rounded to the nearest wholenumber, some totals may appear inconsistent.
An “r” indicates data are available for 70-84% of the students. An “s” indicates data are avail-able for 50-69% of the students. An “x” indicates data are available for less than 50% of thestudents.
A dash (–) indicates data are not available. A tilde (~) indicates insufficient data to reportachievement.
ISC 4th GradePIRLS 2001
*Based on students’ responses to how often they did the following: readsilently on own; and read books of own choosing. Average is computed basedon 4-point scale: Never or almost never = 1, Once or twice a month = 2, Onceor twice a week = 3, and Every day or almost every day = 4. Never or almostnever indicates an average of 1 to less than 1.75. Once or twice a month
indicates an average of 1.75 through 2.5. Once or twice a week indicates anaverage response of greater than 2.5 through 3.25. Every day or almost everyday indicates an average of greater than 3.25 through 4.
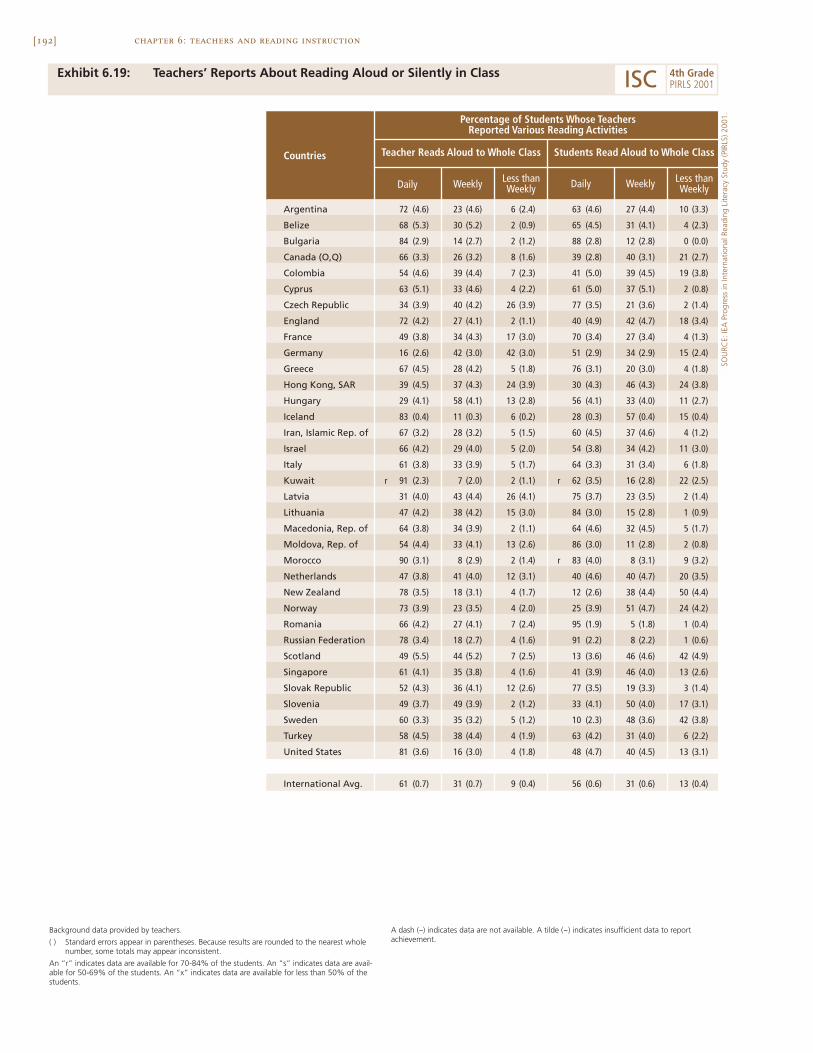
[192] chapter 6: teachers and reading instruction
Exhibit 6.19: Teachers’ Reports About Reading Aloud or Silently in Class
Argentina 72 (4.6) 23 (4.6) 6 (2.4) 63 (4.6) 27 (4.4) 10 (3.3)
Belize 68 (5.3) 30 (5.2) 2 (0.9) 65 (4.5) 31 (4.1) 4 (2.3)
Bulgaria 84 (2.9) 14 (2.7) 2 (1.2) 88 (2.8) 12 (2.8) 0 (0.0)
Canada (O,Q) 66 (3.3) 26 (3.2) 8 (1.6) 39 (2.8) 40 (3.1) 21 (2.7)
Colombia 54 (4.6) 39 (4.4) 7 (2.3) 41 (5.0) 39 (4.5) 19 (3.8)
Cyprus 63 (5.1) 33 (4.6) 4 (2.2) 61 (5.0) 37 (5.1) 2 (0.8)
Czech Republic 34 (3.9) 40 (4.2) 26 (3.9) 77 (3.5) 21 (3.6) 2 (1.4)
England 72 (4.2) 27 (4.1) 2 (1.1) 40 (4.9) 42 (4.7) 18 (3.4)
France 49 (3.8) 34 (4.3) 17 (3.0) 70 (3.4) 27 (3.4) 4 (1.3)
Germany 16 (2.6) 42 (3.0) 42 (3.0) 51 (2.9) 34 (2.9) 15 (2.4)
Greece 67 (4.5) 28 (4.2) 5 (1.8) 76 (3.1) 20 (3.0) 4 (1.8)
Hong Kong, SAR 39 (4.5) 37 (4.3) 24 (3.9) 30 (4.3) 46 (4.3) 24 (3.8)
Hungary 29 (4.1) 58 (4.1) 13 (2.8) 56 (4.1) 33 (4.0) 11 (2.7)
Iceland 83 (0.4) 11 (0.3) 6 (0.2) 28 (0.3) 57 (0.4) 15 (0.4)
Iran, Islamic Rep. of 67 (3.2) 28 (3.2) 5 (1.5) 60 (4.5) 37 (4.6) 4 (1.2)
Israel 66 (4.2) 29 (4.0) 5 (2.0) 54 (3.8) 34 (4.2) 11 (3.0)
Italy 61 (3.8) 33 (3.9) 5 (1.7) 64 (3.3) 31 (3.4) 6 (1.8)
Kuwait r 91 (2.3) 7 (2.0) 2 (1.1) r 62 (3.5) 16 (2.8) 22 (2.5)
Latvia 31 (4.0) 43 (4.4) 26 (4.1) 75 (3.7) 23 (3.5) 2 (1.4)
Lithuania 47 (4.2) 38 (4.2) 15 (3.0) 84 (3.0) 15 (2.8) 1 (0.9)
Macedonia, Rep. of 64 (3.8) 34 (3.9) 2 (1.1) 64 (4.6) 32 (4.5) 5 (1.7)
Moldova, Rep. of 54 (4.4) 33 (4.1) 13 (2.6) 86 (3.0) 11 (2.8) 2 (0.8)
Morocco 90 (3.1) 8 (2.9) 2 (1.4) r 83 (4.0) 8 (3.1) 9 (3.2)
Netherlands 47 (3.8) 41 (4.0) 12 (3.1) 40 (4.6) 40 (4.7) 20 (3.5)
New Zealand 78 (3.5) 18 (3.1) 4 (1.7) 12 (2.6) 38 (4.4) 50 (4.4)
Norway 73 (3.9) 23 (3.5) 4 (2.0) 25 (3.9) 51 (4.7) 24 (4.2)
Romania 66 (4.2) 27 (4.1) 7 (2.4) 95 (1.9) 5 (1.8) 1 (0.4)
Russian Federation 78 (3.4) 18 (2.7) 4 (1.6) 91 (2.2) 8 (2.2) 1 (0.6)
Scotland 49 (5.5) 44 (5.2) 7 (2.5) 13 (3.6) 46 (4.6) 42 (4.9)
Singapore 61 (4.1) 35 (3.8) 4 (1.6) 41 (3.9) 46 (4.0) 13 (2.6)
Slovak Republic 52 (4.3) 36 (4.1) 12 (2.6) 77 (3.5) 19 (3.3) 3 (1.4)
Slovenia 49 (3.7) 49 (3.9) 2 (1.2) 33 (4.1) 50 (4.0) 17 (3.1)
Sweden 60 (3.3) 35 (3.2) 5 (1.2) 10 (2.3) 48 (3.6) 42 (3.8)
Turkey 58 (4.5) 38 (4.4) 4 (1.9) 63 (4.2) 31 (4.0) 6 (2.2)
United States 81 (3.6) 16 (3.0) 4 (1.8) 48 (4.7) 40 (4.5) 13 (3.1)
International Avg. 61 (0.7) 31 (0.7) 9 (0.4) 56 (0.6) 31 (0.6) 13 (0.4)
Daily Weekly
Percentage of Students Whose TeachersReported Various Reading Activities
Countries
Daily Weekly Less thanWeekly
Teacher Reads Aloud to Whole Class Students Read Aloud to Whole Class
Less thanWeekly
Background data provided by teachers.
( ) Standard errors appear in parentheses. Because results are rounded to the nearest wholenumber, some totals may appear inconsistent.
An “r” indicates data are available for 70-84% of the students. An “s” indicates data are avail-able for 50-69% of the students. An “x” indicates data are available for less than 50% of thestudents.
A dash (–) indicates data are not available. A tilde (~) indicates insufficient data to reportachievement.
SOU
RCE:
IEA
Pro
gres
s in
Inte
rnat
iona
l Rea
ding
Lite
racy
Stu
dy (P
IRLS
) 200
1.
ISC 4th GradePIRLS 2001
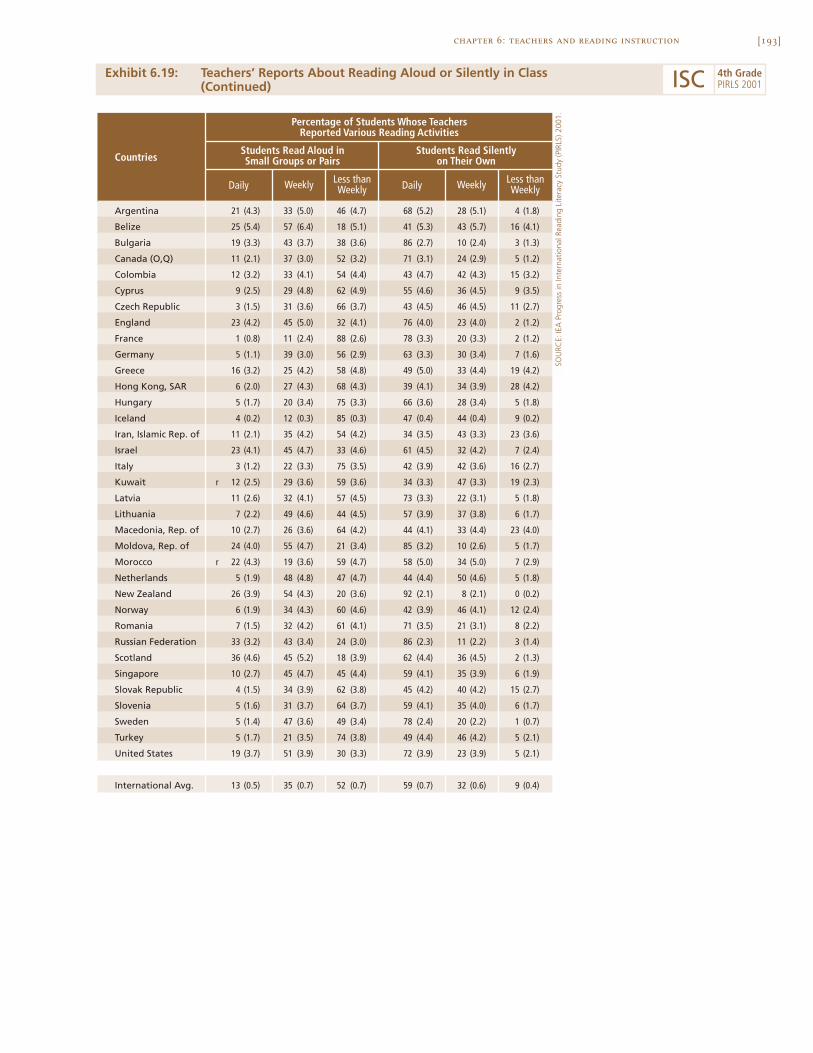
[193]chapter 6: teachers and reading instruction
Exhibit 6.19: Teachers’ Reports About Reading Aloud or Silently in Class(Continued)
SOU
RCE:
IEA
Pro
gres
s in
Inte
rnat
iona
l Rea
ding
Lite
racy
Stu
dy (P
IRLS
) 200
1.
Argentina 21 (4.3) 33 (5.0) 46 (4.7) 68 (5.2) 28 (5.1) 4 (1.8)
Belize 25 (5.4) 57 (6.4) 18 (5.1) 41 (5.3) 43 (5.7) 16 (4.1)
Bulgaria 19 (3.3) 43 (3.7) 38 (3.6) 86 (2.7) 10 (2.4) 3 (1.3)
Canada (O,Q) 11 (2.1) 37 (3.0) 52 (3.2) 71 (3.1) 24 (2.9) 5 (1.2)
Colombia 12 (3.2) 33 (4.1) 54 (4.4) 43 (4.7) 42 (4.3) 15 (3.2)
Cyprus 9 (2.5) 29 (4.8) 62 (4.9) 55 (4.6) 36 (4.5) 9 (3.5)
Czech Republic 3 (1.5) 31 (3.6) 66 (3.7) 43 (4.5) 46 (4.5) 11 (2.7)
England 23 (4.2) 45 (5.0) 32 (4.1) 76 (4.0) 23 (4.0) 2 (1.2)
France 1 (0.8) 11 (2.4) 88 (2.6) 78 (3.3) 20 (3.3) 2 (1.2)
Germany 5 (1.1) 39 (3.0) 56 (2.9) 63 (3.3) 30 (3.4) 7 (1.6)
Greece 16 (3.2) 25 (4.2) 58 (4.8) 49 (5.0) 33 (4.4) 19 (4.2)
Hong Kong, SAR 6 (2.0) 27 (4.3) 68 (4.3) 39 (4.1) 34 (3.9) 28 (4.2)
Hungary 5 (1.7) 20 (3.4) 75 (3.3) 66 (3.6) 28 (3.4) 5 (1.8)
Iceland 4 (0.2) 12 (0.3) 85 (0.3) 47 (0.4) 44 (0.4) 9 (0.2)
Iran, Islamic Rep. of 11 (2.1) 35 (4.2) 54 (4.2) 34 (3.5) 43 (3.3) 23 (3.6)
Israel 23 (4.1) 45 (4.7) 33 (4.6) 61 (4.5) 32 (4.2) 7 (2.4)
Italy 3 (1.2) 22 (3.3) 75 (3.5) 42 (3.9) 42 (3.6) 16 (2.7)
Kuwait r 12 (2.5) 29 (3.6) 59 (3.6) 34 (3.3) 47 (3.3) 19 (2.3)
Latvia 11 (2.6) 32 (4.1) 57 (4.5) 73 (3.3) 22 (3.1) 5 (1.8)
Lithuania 7 (2.2) 49 (4.6) 44 (4.5) 57 (3.9) 37 (3.8) 6 (1.7)
Macedonia, Rep. of 10 (2.7) 26 (3.6) 64 (4.2) 44 (4.1) 33 (4.4) 23 (4.0)
Moldova, Rep. of 24 (4.0) 55 (4.7) 21 (3.4) 85 (3.2) 10 (2.6) 5 (1.7)
Morocco r 22 (4.3) 19 (3.6) 59 (4.7) 58 (5.0) 34 (5.0) 7 (2.9)
Netherlands 5 (1.9) 48 (4.8) 47 (4.7) 44 (4.4) 50 (4.6) 5 (1.8)
New Zealand 26 (3.9) 54 (4.3) 20 (3.6) 92 (2.1) 8 (2.1) 0 (0.2)
Norway 6 (1.9) 34 (4.3) 60 (4.6) 42 (3.9) 46 (4.1) 12 (2.4)
Romania 7 (1.5) 32 (4.2) 61 (4.1) 71 (3.5) 21 (3.1) 8 (2.2)
Russian Federation 33 (3.2) 43 (3.4) 24 (3.0) 86 (2.3) 11 (2.2) 3 (1.4)
Scotland 36 (4.6) 45 (5.2) 18 (3.9) 62 (4.4) 36 (4.5) 2 (1.3)
Singapore 10 (2.7) 45 (4.7) 45 (4.4) 59 (4.1) 35 (3.9) 6 (1.9)
Slovak Republic 4 (1.5) 34 (3.9) 62 (3.8) 45 (4.2) 40 (4.2) 15 (2.7)
Slovenia 5 (1.6) 31 (3.7) 64 (3.7) 59 (4.1) 35 (4.0) 6 (1.7)
Sweden 5 (1.4) 47 (3.6) 49 (3.4) 78 (2.4) 20 (2.2) 1 (0.7)
Turkey 5 (1.7) 21 (3.5) 74 (3.8) 49 (4.4) 46 (4.2) 5 (2.1)
United States 19 (3.7) 51 (3.9) 30 (3.3) 72 (3.9) 23 (3.9) 5 (2.1)
International Avg. 13 (0.5) 35 (0.7) 52 (0.7) 59 (0.7) 32 (0.6) 9 (0.4)
CountriesStudents Read Aloud inSmall Groups or Pairs
Students Read Silentlyon Their Own
Percentage of Students Whose TeachersReported Various Reading Activities
Daily Weekly Daily WeeklyLess thanWeekly
Less thanWeekly
ISC 4th GradePIRLS 2001
[194]
What Activities Do Students Do in Response to Class Reading?
To provide information on what students do to strengthen and extend theirunderstanding of what they have read, PIRLS asked students and teachersabout activities students engage in after reading something in class. In manycountries, oral questioning by the teacher about students’ reading was aneveryday activity (see Exhibit 6.20), and in all countries it happened with themajority of students at least once a week. Students also reported frequentlyanswering questions in writing about what they had read in class. Exhibit 6.21shows that 80 percent of students, on average, internationally, were in classeswhere this happens at least weekly. Another common activity was to have stu-dents talk with each other about what they have read (Exhibit 6.22). The major-ity of students (55%) were in classes where students reported talking withpeers about their classroom reading at least once a week.
A less frequent activity after reading in class was to do a project aboutwhat was read. As shown in Exhibit 6.23, student projects about their reading,including drawing pictures or doing art work, acting in a play or drama, anddoing a group project with other students, were no more than an occasionalactivity in most countries. Only 31 percent of students were in classes wherestudents reported doing such projects about their reading as often as once aweek. In about one-third of the countries, including the Czech Republic,England, Germany, Hong Kong, Iceland, The Netherlands, Norway, Singapore,Sweden, and the United States, the majority of students were in classes whereprojects about reading were never or almost never done.
Teachers’ reports about the activities they asked their students to doafter they have read something in class are summarized in Exhibit 6.24. Inevery country (except Iceland), most if not all students were in classes whereteachers reported oral questioning about reading at least weekly. Having stu-dents write something about or in response to what they have read, and havingstudents talk to each other about their reading also were frequently reportedactivities, with about two-thirds of students on average in classes where teach-ers reported doing these at least weekly. Drawing pictures, doing a play ordrama, or doing a group project were all activities reported less frequently byfourth-grade teachers. Most teachers reported asking students to engage in
chapter 6: teachers and reading instruction
[195]chapter 6: teachers and reading instruction
several different activities after they had read something in class. On average,59 percent of students were in classes where teachers reported that they hadstudents do at least three of the six activities (write something, answer ques-tions orally, talk to one another, draw pictures or do an art project, do a playor dramatization, or do a group project) after they had read something in class.
Although not an everyday activity in most classes, students did some-times take a written quiz or test about what they had read. Less than half(45%) the students were in classes that took a quiz about what they had readas often as once a week (see Exhibit 6.25), and in the Czech Republic, England,and Iceland, 50 percent or more of the students reported never or almost nevertaking a quiz about their reading. Teachers agreed that they gave a writtenquiz or test about what students had read relatively infrequently. As presentedin Exhibit 6.26, the majority of students (52%) were in classes where teachersreported giving a quiz about reading only once or twice a month, and a further26 percent were in classes where quizzes were almost never given. In Iceland,New Zealand, Norway, Scotland, and Sweden, the majority of students were insuch classes.
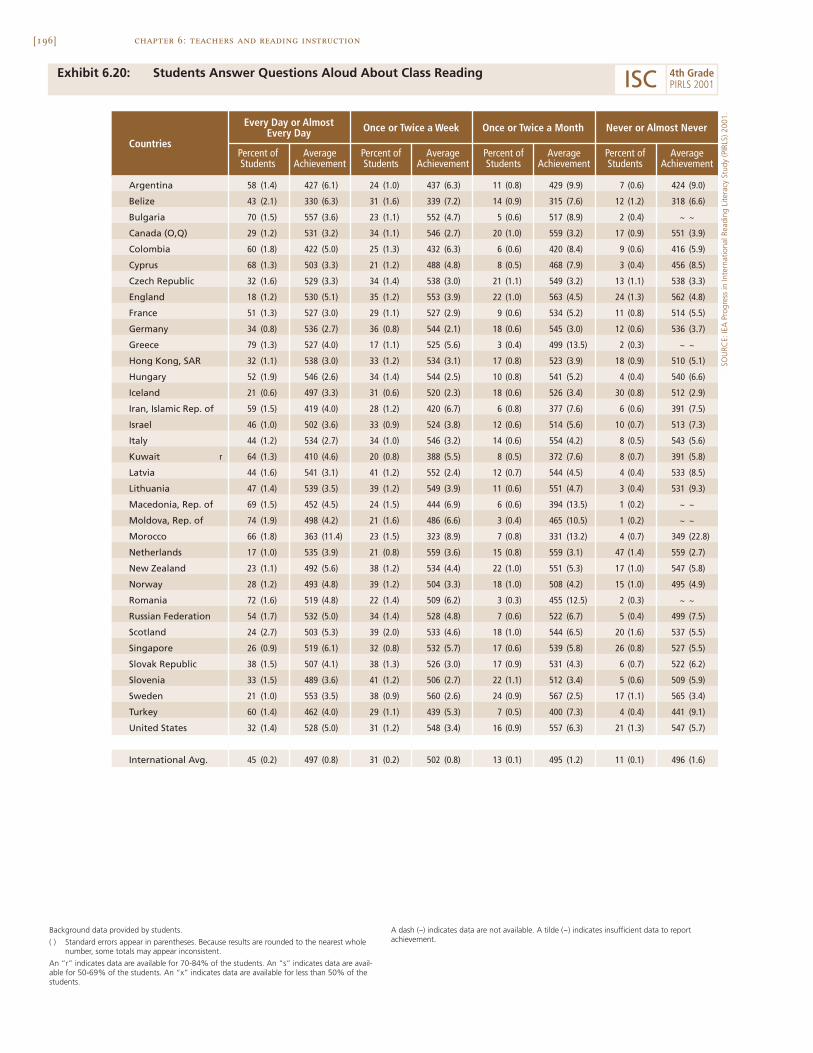
[196] chapter 6: teachers and reading instruction
Exhibit 6.20: Students Answer Questions Aloud About Class Reading
Argentina 58 (1.4) 427 (6.1) 24 (1.0) 437 (6.3) 11 (0.8) 429 (9.9) 7 (0.6) 424 (9.0)
Belize 43 (2.1) 330 (6.3) 31 (1.6) 339 (7.2) 14 (0.9) 315 (7.6) 12 (1.2) 318 (6.6)
Bulgaria 70 (1.5) 557 (3.6) 23 (1.1) 552 (4.7) 5 (0.6) 517 (8.9) 2 (0.4) ~ ~
Canada (O,Q) 29 (1.2) 531 (3.2) 34 (1.1) 546 (2.7) 20 (1.0) 559 (3.2) 17 (0.9) 551 (3.9)
Colombia 60 (1.8) 422 (5.0) 25 (1.3) 432 (6.3) 6 (0.6) 420 (8.4) 9 (0.6) 416 (5.9)
Cyprus 68 (1.3) 503 (3.3) 21 (1.2) 488 (4.8) 8 (0.5) 468 (7.9) 3 (0.4) 456 (8.5)
Czech Republic 32 (1.6) 529 (3.3) 34 (1.4) 538 (3.0) 21 (1.1) 549 (3.2) 13 (1.1) 538 (3.3)
England 18 (1.2) 530 (5.1) 35 (1.2) 553 (3.9) 22 (1.0) 563 (4.5) 24 (1.3) 562 (4.8)
France 51 (1.3) 527 (3.0) 29 (1.1) 527 (2.9) 9 (0.6) 534 (5.2) 11 (0.8) 514 (5.5)
Germany 34 (0.8) 536 (2.7) 36 (0.8) 544 (2.1) 18 (0.6) 545 (3.0) 12 (0.6) 536 (3.7)
Greece 79 (1.3) 527 (4.0) 17 (1.1) 525 (5.6) 3 (0.4) 499 (13.5) 2 (0.3) ~ ~
Hong Kong, SAR 32 (1.1) 538 (3.0) 33 (1.2) 534 (3.1) 17 (0.8) 523 (3.9) 18 (0.9) 510 (5.1)
Hungary 52 (1.9) 546 (2.6) 34 (1.4) 544 (2.5) 10 (0.8) 541 (5.2) 4 (0.4) 540 (6.6)
Iceland 21 (0.6) 497 (3.3) 31 (0.6) 520 (2.3) 18 (0.6) 526 (3.4) 30 (0.8) 512 (2.9)
Iran, Islamic Rep. of 59 (1.5) 419 (4.0) 28 (1.2) 420 (6.7) 6 (0.8) 377 (7.6) 6 (0.6) 391 (7.5)
Israel 46 (1.0) 502 (3.6) 33 (0.9) 524 (3.8) 12 (0.6) 514 (5.6) 10 (0.7) 513 (7.3)
Italy 44 (1.2) 534 (2.7) 34 (1.0) 546 (3.2) 14 (0.6) 554 (4.2) 8 (0.5) 543 (5.6)
Kuwait r 64 (1.3) 410 (4.6) 20 (0.8) 388 (5.5) 8 (0.5) 372 (7.6) 8 (0.7) 391 (5.8)
Latvia 44 (1.6) 541 (3.1) 41 (1.2) 552 (2.4) 12 (0.7) 544 (4.5) 4 (0.4) 533 (8.5)
Lithuania 47 (1.4) 539 (3.5) 39 (1.2) 549 (3.9) 11 (0.6) 551 (4.7) 3 (0.4) 531 (9.3)
Macedonia, Rep. of 69 (1.5) 452 (4.5) 24 (1.5) 444 (6.9) 6 (0.6) 394 (13.5) 1 (0.2) ~ ~
Moldova, Rep. of 74 (1.9) 498 (4.2) 21 (1.6) 486 (6.6) 3 (0.4) 465 (10.5) 1 (0.2) ~ ~
Morocco 66 (1.8) 363 (11.4) 23 (1.5) 323 (8.9) 7 (0.8) 331 (13.2) 4 (0.7) 349 (22.8)
Netherlands 17 (1.0) 535 (3.9) 21 (0.8) 559 (3.6) 15 (0.8) 559 (3.1) 47 (1.4) 559 (2.7)
New Zealand 23 (1.1) 492 (5.6) 38 (1.2) 534 (4.4) 22 (1.0) 551 (5.3) 17 (1.0) 547 (5.8)
Norway 28 (1.2) 493 (4.8) 39 (1.2) 504 (3.3) 18 (1.0) 508 (4.2) 15 (1.0) 495 (4.9)
Romania 72 (1.6) 519 (4.8) 22 (1.4) 509 (6.2) 3 (0.3) 455 (12.5) 2 (0.3) ~ ~
Russian Federation 54 (1.7) 532 (5.0) 34 (1.4) 528 (4.8) 7 (0.6) 522 (6.7) 5 (0.4) 499 (7.5)
Scotland 24 (2.7) 503 (5.3) 39 (2.0) 533 (4.6) 18 (1.0) 544 (6.5) 20 (1.6) 537 (5.5)
Singapore 26 (0.9) 519 (6.1) 32 (0.8) 532 (5.7) 17 (0.6) 539 (5.8) 26 (0.8) 527 (5.5)
Slovak Republic 38 (1.5) 507 (4.1) 38 (1.3) 526 (3.0) 17 (0.9) 531 (4.3) 6 (0.7) 522 (6.2)
Slovenia 33 (1.5) 489 (3.6) 41 (1.2) 506 (2.7) 22 (1.1) 512 (3.4) 5 (0.6) 509 (5.9)
Sweden 21 (1.0) 553 (3.5) 38 (0.9) 560 (2.6) 24 (0.9) 567 (2.5) 17 (1.1) 565 (3.4)
Turkey 60 (1.4) 462 (4.0) 29 (1.1) 439 (5.3) 7 (0.5) 400 (7.3) 4 (0.4) 441 (9.1)
United States 32 (1.4) 528 (5.0) 31 (1.2) 548 (3.4) 16 (0.9) 557 (6.3) 21 (1.3) 547 (5.7)
International Avg. 45 (0.2) 497 (0.8) 31 (0.2) 502 (0.8) 13 (0.1) 495 (1.2) 11 (0.1) 496 (1.6)
Percent ofStudents
AverageAchievement
Countries
Every Day or AlmostEvery Day Once or Twice a Week Once or Twice a Month Never or Almost Never
Percent ofStudents
AverageAchievement
Percent ofStudents
AverageAchievement
Percent ofStudents
AverageAchievement
Background data provided by students.
( ) Standard errors appear in parentheses. Because results are rounded to the nearest wholenumber, some totals may appear inconsistent.
An “r” indicates data are available for 70-84% of the students. An “s” indicates data are avail-able for 50-69% of the students. An “x” indicates data are available for less than 50% of thestudents.
A dash (–) indicates data are not available. A tilde (~) indicates insufficient data to reportachievement.
SOU
RCE:
IEA
Pro
gres
s in
Inte
rnat
iona
l Rea
ding
Lite
racy
Stu
dy (P
IRLS
) 200
1.
ISC 4th GradePIRLS 2001
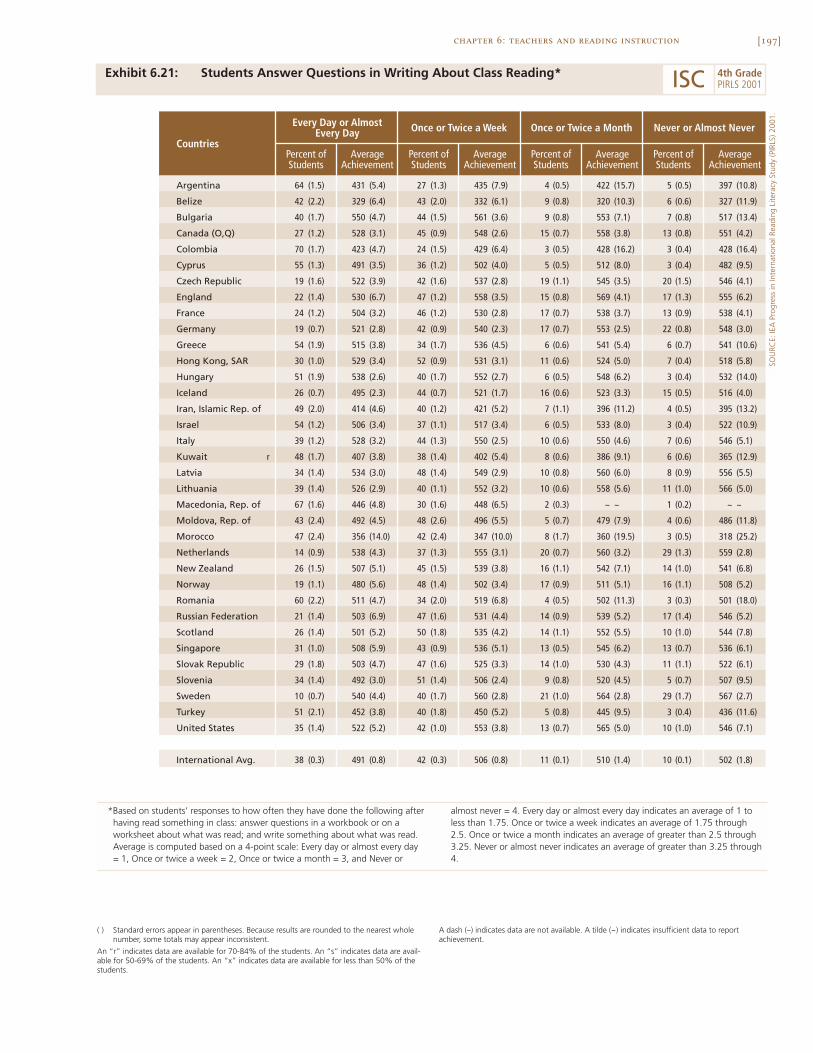
[197]chapter 6: teachers and reading instruction
Exhibit 6.21: Students Answer Questions in Writing About Class Reading*
SOU
RCE:
IEA
Pro
gres
s in
Inte
rnat
iona
l Rea
ding
Lite
racy
Stu
dy (P
IRLS
) 200
1.
Argentina 64 (1.5) 431 (5.4) 27 (1.3) 435 (7.9) 4 (0.5) 422 (15.7) 5 (0.5) 397 (10.8)
Belize 42 (2.2) 329 (6.4) 43 (2.0) 332 (6.1) 9 (0.8) 320 (10.3) 6 (0.6) 327 (11.9)
Bulgaria 40 (1.7) 550 (4.7) 44 (1.5) 561 (3.6) 9 (0.8) 553 (7.1) 7 (0.8) 517 (13.4)
Canada (O,Q) 27 (1.2) 528 (3.1) 45 (0.9) 548 (2.6) 15 (0.7) 558 (3.8) 13 (0.8) 551 (4.2)
Colombia 70 (1.7) 423 (4.7) 24 (1.5) 429 (6.4) 3 (0.5) 428 (16.2) 3 (0.4) 428 (16.4)
Cyprus 55 (1.3) 491 (3.5) 36 (1.2) 502 (4.0) 5 (0.5) 512 (8.0) 3 (0.4) 482 (9.5)
Czech Republic 19 (1.6) 522 (3.9) 42 (1.6) 537 (2.8) 19 (1.1) 545 (3.5) 20 (1.5) 546 (4.1)
England 22 (1.4) 530 (6.7) 47 (1.2) 558 (3.5) 15 (0.8) 569 (4.1) 17 (1.3) 555 (6.2)
France 24 (1.2) 504 (3.2) 46 (1.2) 530 (2.8) 17 (0.7) 538 (3.7) 13 (0.9) 538 (4.1)
Germany 19 (0.7) 521 (2.8) 42 (0.9) 540 (2.3) 17 (0.7) 553 (2.5) 22 (0.8) 548 (3.0)
Greece 54 (1.9) 515 (3.8) 34 (1.7) 536 (4.5) 6 (0.6) 541 (5.4) 6 (0.7) 541 (10.6)
Hong Kong, SAR 30 (1.0) 529 (3.4) 52 (0.9) 531 (3.1) 11 (0.6) 524 (5.0) 7 (0.4) 518 (5.8)
Hungary 51 (1.9) 538 (2.6) 40 (1.7) 552 (2.7) 6 (0.5) 548 (6.2) 3 (0.4) 532 (14.0)
Iceland 26 (0.7) 495 (2.3) 44 (0.7) 521 (1.7) 16 (0.6) 523 (3.3) 15 (0.5) 516 (4.0)
Iran, Islamic Rep. of 49 (2.0) 414 (4.6) 40 (1.2) 421 (5.2) 7 (1.1) 396 (11.2) 4 (0.5) 395 (13.2)
Israel 54 (1.2) 506 (3.4) 37 (1.1) 517 (3.4) 6 (0.5) 533 (8.0) 3 (0.4) 522 (10.9)
Italy 39 (1.2) 528 (3.2) 44 (1.3) 550 (2.5) 10 (0.6) 550 (4.6) 7 (0.6) 546 (5.1)
Kuwait r 48 (1.7) 407 (3.8) 38 (1.4) 402 (5.4) 8 (0.6) 386 (9.1) 6 (0.6) 365 (12.9)
Latvia 34 (1.4) 534 (3.0) 48 (1.4) 549 (2.9) 10 (0.8) 560 (6.0) 8 (0.9) 556 (5.5)
Lithuania 39 (1.4) 526 (2.9) 40 (1.1) 552 (3.2) 10 (0.6) 558 (5.6) 11 (1.0) 566 (5.0)
Macedonia, Rep. of 67 (1.6) 446 (4.8) 30 (1.6) 448 (6.5) 2 (0.3) ~ ~ 1 (0.2) ~ ~
Moldova, Rep. of 43 (2.4) 492 (4.5) 48 (2.6) 496 (5.5) 5 (0.7) 479 (7.9) 4 (0.6) 486 (11.8)
Morocco 47 (2.4) 356 (14.0) 42 (2.4) 347 (10.0) 8 (1.7) 360 (19.5) 3 (0.5) 318 (25.2)
Netherlands 14 (0.9) 538 (4.3) 37 (1.3) 555 (3.1) 20 (0.7) 560 (3.2) 29 (1.3) 559 (2.8)
New Zealand 26 (1.5) 507 (5.1) 45 (1.5) 539 (3.8) 16 (1.1) 542 (7.1) 14 (1.0) 541 (6.8)
Norway 19 (1.1) 480 (5.6) 48 (1.4) 502 (3.4) 17 (0.9) 511 (5.1) 16 (1.1) 508 (5.2)
Romania 60 (2.2) 511 (4.7) 34 (2.0) 519 (6.8) 4 (0.5) 502 (11.3) 3 (0.3) 501 (18.0)
Russian Federation 21 (1.4) 503 (6.9) 47 (1.6) 531 (4.4) 14 (0.9) 539 (5.2) 17 (1.4) 546 (5.2)
Scotland 26 (1.4) 501 (5.2) 50 (1.8) 535 (4.2) 14 (1.1) 552 (5.5) 10 (1.0) 544 (7.8)
Singapore 31 (1.0) 508 (5.9) 43 (0.9) 536 (5.1) 13 (0.5) 545 (6.2) 13 (0.7) 536 (6.1)
Slovak Republic 29 (1.8) 503 (4.7) 47 (1.6) 525 (3.3) 14 (1.0) 530 (4.3) 11 (1.1) 522 (6.1)
Slovenia 34 (1.4) 492 (3.0) 51 (1.4) 506 (2.4) 9 (0.8) 520 (4.5) 5 (0.7) 507 (9.5)
Sweden 10 (0.7) 540 (4.4) 40 (1.7) 560 (2.8) 21 (1.0) 564 (2.8) 29 (1.7) 567 (2.7)
Turkey 51 (2.1) 452 (3.8) 40 (1.8) 450 (5.2) 5 (0.8) 445 (9.5) 3 (0.4) 436 (11.6)
United States 35 (1.4) 522 (5.2) 42 (1.0) 553 (3.8) 13 (0.7) 565 (5.0) 10 (1.0) 546 (7.1)
International Avg. 38 (0.3) 491 (0.8) 42 (0.3) 506 (0.8) 11 (0.1) 510 (1.4) 10 (0.1) 502 (1.8)
Every Day or AlmostEvery Day Once or Twice a Week Once or Twice a Month Never or Almost Never
CountriesPercent ofStudents
AverageAchievement
Percent ofStudents
AverageAchievement
Percent ofStudents
AverageAchievement
Percent ofStudents
AverageAchievement
( ) Standard errors appear in parentheses. Because results are rounded to the nearest wholenumber, some totals may appear inconsistent.
An “r” indicates data are available for 70-84% of the students. An “s” indicates data are avail-able for 50-69% of the students. An “x” indicates data are available for less than 50% of thestudents.
A dash (–) indicates data are not available. A tilde (~) indicates insufficient data to reportachievement.
ISC 4th GradePIRLS 2001
*Based on students’ responses to how often they have done the following afterhaving read something in class: answer questions in a workbook or on aworksheet about what was read; and write something about what was read.Average is computed based on a 4-point scale: Every day or almost every day= 1, Once or twice a week = 2, Once or twice a month = 3, and Never or
almost never = 4. Every day or almost every day indicates an average of 1 toless than 1.75. Once or twice a week indicates an average of 1.75 through2.5. Once or twice a month indicates an average of greater than 2.5 through3.25. Never or almost never indicates an average of greater than 3.25 through4.
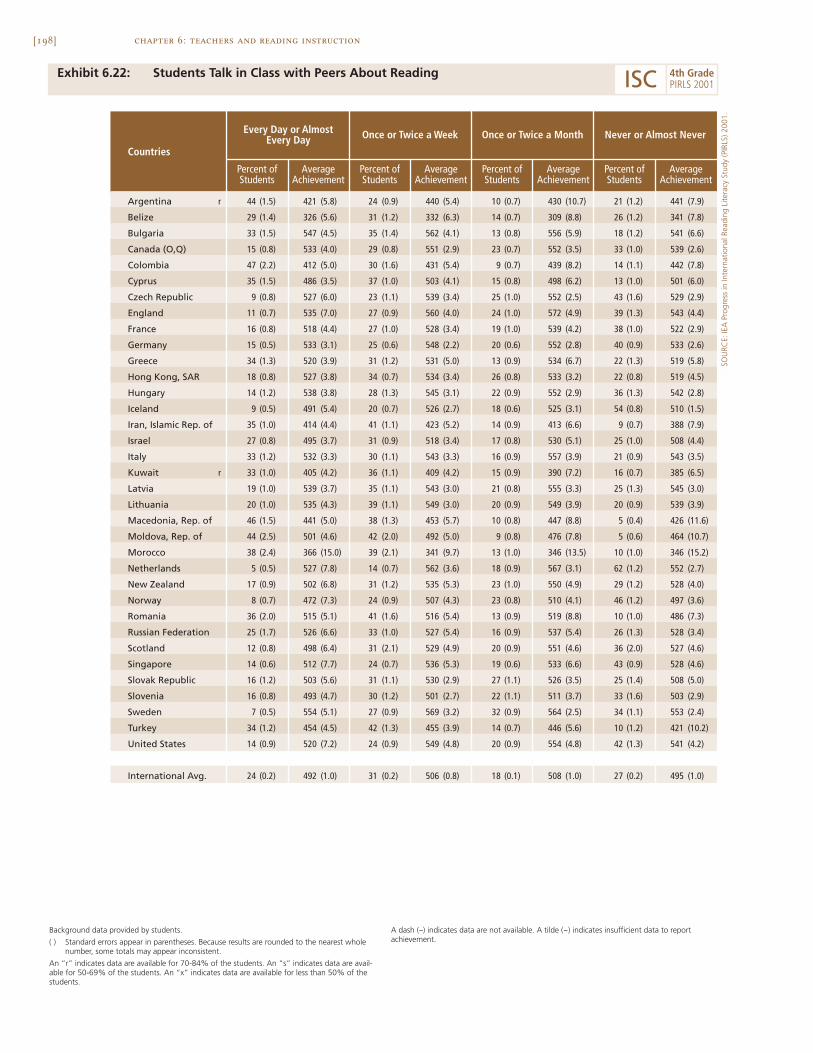
[198] chapter 6: teachers and reading instruction
Exhibit 6.22: Students Talk in Class with Peers About Reading
Argentina r 44 (1.5) 421 (5.8) 24 (0.9) 440 (5.4) 10 (0.7) 430 (10.7) 21 (1.2) 441 (7.9)
Belize 29 (1.4) 326 (5.6) 31 (1.2) 332 (6.3) 14 (0.7) 309 (8.8) 26 (1.2) 341 (7.8)
Bulgaria 33 (1.5) 547 (4.5) 35 (1.4) 562 (4.1) 13 (0.8) 556 (5.9) 18 (1.2) 541 (6.6)
Canada (O,Q) 15 (0.8) 533 (4.0) 29 (0.8) 551 (2.9) 23 (0.7) 552 (3.5) 33 (1.0) 539 (2.6)
Colombia 47 (2.2) 412 (5.0) 30 (1.6) 431 (5.4) 9 (0.7) 439 (8.2) 14 (1.1) 442 (7.8)
Cyprus 35 (1.5) 486 (3.5) 37 (1.0) 503 (4.1) 15 (0.8) 498 (6.2) 13 (1.0) 501 (6.0)
Czech Republic 9 (0.8) 527 (6.0) 23 (1.1) 539 (3.4) 25 (1.0) 552 (2.5) 43 (1.6) 529 (2.9)
England 11 (0.7) 535 (7.0) 27 (0.9) 560 (4.0) 24 (1.0) 572 (4.9) 39 (1.3) 543 (4.4)
France 16 (0.8) 518 (4.4) 27 (1.0) 528 (3.4) 19 (1.0) 539 (4.2) 38 (1.0) 522 (2.9)
Germany 15 (0.5) 533 (3.1) 25 (0.6) 548 (2.2) 20 (0.6) 552 (2.8) 40 (0.9) 533 (2.6)
Greece 34 (1.3) 520 (3.9) 31 (1.2) 531 (5.0) 13 (0.9) 534 (6.7) 22 (1.3) 519 (5.8)
Hong Kong, SAR 18 (0.8) 527 (3.8) 34 (0.7) 534 (3.4) 26 (0.8) 533 (3.2) 22 (0.8) 519 (4.5)
Hungary 14 (1.2) 538 (3.8) 28 (1.3) 545 (3.1) 22 (0.9) 552 (2.9) 36 (1.3) 542 (2.8)
Iceland 9 (0.5) 491 (5.4) 20 (0.7) 526 (2.7) 18 (0.6) 525 (3.1) 54 (0.8) 510 (1.5)
Iran, Islamic Rep. of 35 (1.0) 414 (4.4) 41 (1.1) 423 (5.2) 14 (0.9) 413 (6.6) 9 (0.7) 388 (7.9)
Israel 27 (0.8) 495 (3.7) 31 (0.9) 518 (3.4) 17 (0.8) 530 (5.1) 25 (1.0) 508 (4.4)
Italy 33 (1.2) 532 (3.3) 30 (1.1) 543 (3.3) 16 (0.9) 557 (3.9) 21 (0.9) 543 (3.5)
Kuwait r 33 (1.0) 405 (4.2) 36 (1.1) 409 (4.2) 15 (0.9) 390 (7.2) 16 (0.7) 385 (6.5)
Latvia 19 (1.0) 539 (3.7) 35 (1.1) 543 (3.0) 21 (0.8) 555 (3.3) 25 (1.3) 545 (3.0)
Lithuania 20 (1.0) 535 (4.3) 39 (1.1) 549 (3.0) 20 (0.9) 549 (3.9) 20 (0.9) 539 (3.9)
Macedonia, Rep. of 46 (1.5) 441 (5.0) 38 (1.3) 453 (5.7) 10 (0.8) 447 (8.8) 5 (0.4) 426 (11.6)
Moldova, Rep. of 44 (2.5) 501 (4.6) 42 (2.0) 492 (5.0) 9 (0.8) 476 (7.8) 5 (0.6) 464 (10.7)
Morocco 38 (2.4) 366 (15.0) 39 (2.1) 341 (9.7) 13 (1.0) 346 (13.5) 10 (1.0) 346 (15.2)
Netherlands 5 (0.5) 527 (7.8) 14 (0.7) 562 (3.6) 18 (0.9) 567 (3.1) 62 (1.2) 552 (2.7)
New Zealand 17 (0.9) 502 (6.8) 31 (1.2) 535 (5.3) 23 (1.0) 550 (4.9) 29 (1.2) 528 (4.0)
Norway 8 (0.7) 472 (7.3) 24 (0.9) 507 (4.3) 23 (0.8) 510 (4.1) 46 (1.2) 497 (3.6)
Romania 36 (2.0) 515 (5.1) 41 (1.6) 516 (5.4) 13 (0.9) 519 (8.8) 10 (1.0) 486 (7.3)
Russian Federation 25 (1.7) 526 (6.6) 33 (1.0) 527 (5.4) 16 (0.9) 537 (5.4) 26 (1.3) 528 (3.4)
Scotland 12 (0.8) 498 (6.4) 31 (2.1) 529 (4.9) 20 (0.9) 551 (4.6) 36 (2.0) 527 (4.6)
Singapore 14 (0.6) 512 (7.7) 24 (0.7) 536 (5.3) 19 (0.6) 533 (6.6) 43 (0.9) 528 (4.6)
Slovak Republic 16 (1.2) 503 (5.6) 31 (1.1) 530 (2.9) 27 (1.1) 526 (3.5) 25 (1.4) 508 (5.0)
Slovenia 16 (0.8) 493 (4.7) 30 (1.2) 501 (2.7) 22 (1.1) 511 (3.7) 33 (1.6) 503 (2.9)
Sweden 7 (0.5) 554 (5.1) 27 (0.9) 569 (3.2) 32 (0.9) 564 (2.5) 34 (1.1) 553 (2.4)
Turkey 34 (1.2) 454 (4.5) 42 (1.3) 455 (3.9) 14 (0.7) 446 (5.6) 10 (1.2) 421 (10.2)
United States 14 (0.9) 520 (7.2) 24 (0.9) 549 (4.8) 20 (0.9) 554 (4.8) 42 (1.3) 541 (4.2)
International Avg. 24 (0.2) 492 (1.0) 31 (0.2) 506 (0.8) 18 (0.1) 508 (1.0) 27 (0.2) 495 (1.0)
Countries
Every Day or AlmostEvery Day Once or Twice a Week Once or Twice a Month Never or Almost Never
Percent ofStudents
AverageAchievement
Percent ofStudents
AverageAchievement
Percent ofStudents
AverageAchievement
Percent ofStudents
AverageAchievement
Background data provided by students.
( ) Standard errors appear in parentheses. Because results are rounded to the nearest wholenumber, some totals may appear inconsistent.
An “r” indicates data are available for 70-84% of the students. An “s” indicates data are avail-able for 50-69% of the students. An “x” indicates data are available for less than 50% of thestudents.
A dash (–) indicates data are not available. A tilde (~) indicates insufficient data to reportachievement.
SOU
RCE:
IEA
Pro
gres
s in
Inte
rnat
iona
l Rea
ding
Lite
racy
Stu
dy (P
IRLS
) 200
1.
ISC 4th GradePIRLS 2001
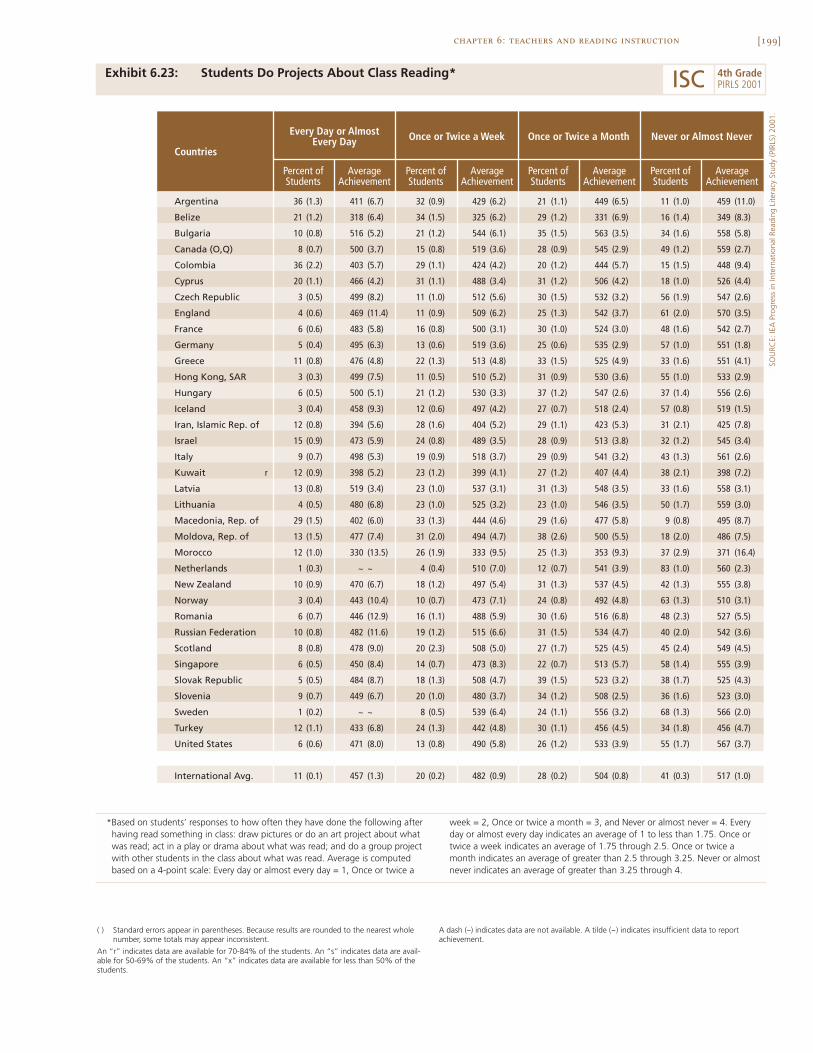
[199]chapter 6: teachers and reading instruction
Exhibit 6.23: Students Do Projects About Class Reading*
SOU
RCE:
IEA
Pro
gres
s in
Inte
rnat
iona
l Rea
ding
Lite
racy
Stu
dy (P
IRLS
) 200
1.
Argentina 36 (1.3) 411 (6.7) 32 (0.9) 429 (6.2) 21 (1.1) 449 (6.5) 11 (1.0) 459 (11.0)
Belize 21 (1.2) 318 (6.4) 34 (1.5) 325 (6.2) 29 (1.2) 331 (6.9) 16 (1.4) 349 (8.3)
Bulgaria 10 (0.8) 516 (5.2) 21 (1.2) 544 (6.1) 35 (1.5) 563 (3.5) 34 (1.6) 558 (5.8)
Canada (O,Q) 8 (0.7) 500 (3.7) 15 (0.8) 519 (3.6) 28 (0.9) 545 (2.9) 49 (1.2) 559 (2.7)
Colombia 36 (2.2) 403 (5.7) 29 (1.1) 424 (4.2) 20 (1.2) 444 (5.7) 15 (1.5) 448 (9.4)
Cyprus 20 (1.1) 466 (4.2) 31 (1.1) 488 (3.4) 31 (1.2) 506 (4.2) 18 (1.0) 526 (4.4)
Czech Republic 3 (0.5) 499 (8.2) 11 (1.0) 512 (5.6) 30 (1.5) 532 (3.2) 56 (1.9) 547 (2.6)
England 4 (0.6) 469 (11.4) 11 (0.9) 509 (6.2) 25 (1.3) 542 (3.7) 61 (2.0) 570 (3.5)
France 6 (0.6) 483 (5.8) 16 (0.8) 500 (3.1) 30 (1.0) 524 (3.0) 48 (1.6) 542 (2.7)
Germany 5 (0.4) 495 (6.3) 13 (0.6) 519 (3.6) 25 (0.6) 535 (2.9) 57 (1.0) 551 (1.8)
Greece 11 (0.8) 476 (4.8) 22 (1.3) 513 (4.8) 33 (1.5) 525 (4.9) 33 (1.6) 551 (4.1)
Hong Kong, SAR 3 (0.3) 499 (7.5) 11 (0.5) 510 (5.2) 31 (0.9) 530 (3.6) 55 (1.0) 533 (2.9)
Hungary 6 (0.5) 500 (5.1) 21 (1.2) 530 (3.3) 37 (1.2) 547 (2.6) 37 (1.4) 556 (2.6)
Iceland 3 (0.4) 458 (9.3) 12 (0.6) 497 (4.2) 27 (0.7) 518 (2.4) 57 (0.8) 519 (1.5)
Iran, Islamic Rep. of 12 (0.8) 394 (5.6) 28 (1.6) 404 (5.2) 29 (1.1) 423 (5.3) 31 (2.1) 425 (7.8)
Israel 15 (0.9) 473 (5.9) 24 (0.8) 489 (3.5) 28 (0.9) 513 (3.8) 32 (1.2) 545 (3.4)
Italy 9 (0.7) 498 (5.3) 19 (0.9) 518 (3.7) 29 (0.9) 541 (3.2) 43 (1.3) 561 (2.6)
Kuwait r 12 (0.9) 398 (5.2) 23 (1.2) 399 (4.1) 27 (1.2) 407 (4.4) 38 (2.1) 398 (7.2)
Latvia 13 (0.8) 519 (3.4) 23 (1.0) 537 (3.1) 31 (1.3) 548 (3.5) 33 (1.6) 558 (3.1)
Lithuania 4 (0.5) 480 (6.8) 23 (1.0) 525 (3.2) 23 (1.0) 546 (3.5) 50 (1.7) 559 (3.0)
Macedonia, Rep. of 29 (1.5) 402 (6.0) 33 (1.3) 444 (4.6) 29 (1.6) 477 (5.8) 9 (0.8) 495 (8.7)
Moldova, Rep. of 13 (1.5) 477 (7.4) 31 (2.0) 494 (4.7) 38 (2.6) 500 (5.5) 18 (2.0) 486 (7.5)
Morocco 12 (1.0) 330 (13.5) 26 (1.9) 333 (9.5) 25 (1.3) 353 (9.3) 37 (2.9) 371 (16.4)
Netherlands 1 (0.3) ~ ~ 4 (0.4) 510 (7.0) 12 (0.7) 541 (3.9) 83 (1.0) 560 (2.3)
New Zealand 10 (0.9) 470 (6.7) 18 (1.2) 497 (5.4) 31 (1.3) 537 (4.5) 42 (1.3) 555 (3.8)
Norway 3 (0.4) 443 (10.4) 10 (0.7) 473 (7.1) 24 (0.8) 492 (4.8) 63 (1.3) 510 (3.1)
Romania 6 (0.7) 446 (12.9) 16 (1.1) 488 (5.9) 30 (1.6) 516 (6.8) 48 (2.3) 527 (5.5)
Russian Federation 10 (0.8) 482 (11.6) 19 (1.2) 515 (6.6) 31 (1.5) 534 (4.7) 40 (2.0) 542 (3.6)
Scotland 8 (0.8) 478 (9.0) 20 (2.3) 508 (5.0) 27 (1.7) 525 (4.5) 45 (2.4) 549 (4.5)
Singapore 6 (0.5) 450 (8.4) 14 (0.7) 473 (8.3) 22 (0.7) 513 (5.7) 58 (1.4) 555 (3.9)
Slovak Republic 5 (0.5) 484 (8.7) 18 (1.3) 508 (4.7) 39 (1.5) 523 (3.2) 38 (1.7) 525 (4.3)
Slovenia 9 (0.7) 449 (6.7) 20 (1.0) 480 (3.7) 34 (1.2) 508 (2.5) 36 (1.6) 523 (3.0)
Sweden 1 (0.2) ~ ~ 8 (0.5) 539 (6.4) 24 (1.1) 556 (3.2) 68 (1.3) 566 (2.0)
Turkey 12 (1.1) 433 (6.8) 24 (1.3) 442 (4.8) 30 (1.1) 456 (4.5) 34 (1.8) 456 (4.7)
United States 6 (0.6) 471 (8.0) 13 (0.8) 490 (5.8) 26 (1.2) 533 (3.9) 55 (1.7) 567 (3.7)
International Avg. 11 (0.1) 457 (1.3) 20 (0.2) 482 (0.9) 28 (0.2) 504 (0.8) 41 (0.3) 517 (1.0)
Countries
Every Day or AlmostEvery Day Once or Twice a Week Once or Twice a Month Never or Almost Never
Percent ofStudents
AverageAchievement
Percent ofStudents
AverageAchievement
Percent ofStudents
AverageAchievement
Percent ofStudents
AverageAchievement
( ) Standard errors appear in parentheses. Because results are rounded to the nearest wholenumber, some totals may appear inconsistent.
An “r” indicates data are available for 70-84% of the students. An “s” indicates data are avail-able for 50-69% of the students. An “x” indicates data are available for less than 50% of thestudents.
A dash (–) indicates data are not available. A tilde (~) indicates insufficient data to reportachievement.
ISC 4th GradePIRLS 2001
*Based on students’ responses to how often they have done the following afterhaving read something in class: draw pictures or do an art project about whatwas read; act in a play or drama about what was read; and do a group projectwith other students in the class about what was read. Average is computedbased on a 4-point scale: Every day or almost every day = 1, Once or twice a
week = 2, Once or twice a month = 3, and Never or almost never = 4. Everyday or almost every day indicates an average of 1 to less than 1.75. Once ortwice a week indicates an average of 1.75 through 2.5. Once or twice amonth indicates an average of greater than 2.5 through 3.25. Never or almostnever indicates an average of greater than 3.25 through 4.
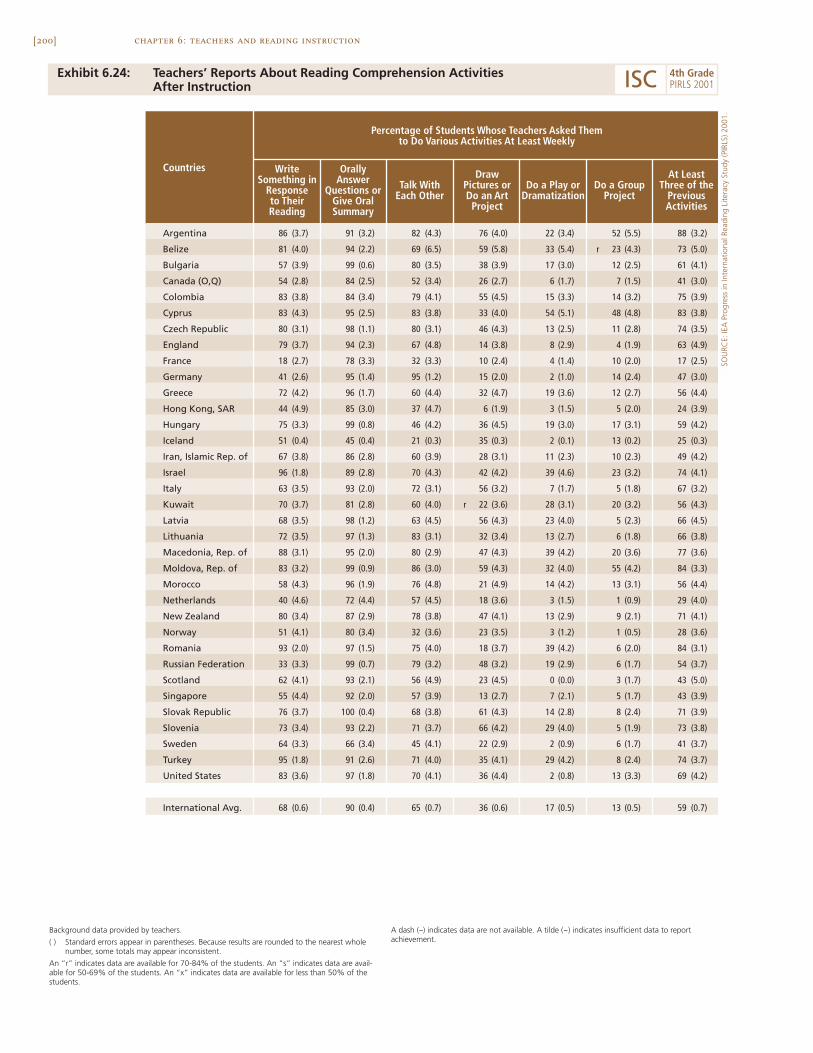
[200] chapter 6: teachers and reading instruction
Exhibit 6.24: Teachers’ Reports About Reading Comprehension Activities After Instruction
Argentina 86 (3.7) 91 (3.2) 82 (4.3) 76 (4.0) 22 (3.4) 52 (5.5) 88 (3.2)
Belize 81 (4.0) 94 (2.2) 69 (6.5) 59 (5.8) 33 (5.4) r 23 (4.3) 73 (5.0)
Bulgaria 57 (3.9) 99 (0.6) 80 (3.5) 38 (3.9) 17 (3.0) 12 (2.5) 61 (4.1)
Canada (O,Q) 54 (2.8) 84 (2.5) 52 (3.4) 26 (2.7) 6 (1.7) 7 (1.5) 41 (3.0)
Colombia 83 (3.8) 84 (3.4) 79 (4.1) 55 (4.5) 15 (3.3) 14 (3.2) 75 (3.9)
Cyprus 83 (4.3) 95 (2.5) 83 (3.8) 33 (4.0) 54 (5.1) 48 (4.8) 83 (3.8)
Czech Republic 80 (3.1) 98 (1.1) 80 (3.1) 46 (4.3) 13 (2.5) 11 (2.8) 74 (3.5)
England 79 (3.7) 94 (2.3) 67 (4.8) 14 (3.8) 8 (2.9) 4 (1.9) 63 (4.9)
France 18 (2.7) 78 (3.3) 32 (3.3) 10 (2.4) 4 (1.4) 10 (2.0) 17 (2.5)
Germany 41 (2.6) 95 (1.4) 95 (1.2) 15 (2.0) 2 (1.0) 14 (2.4) 47 (3.0)
Greece 72 (4.2) 96 (1.7) 60 (4.4) 32 (4.7) 19 (3.6) 12 (2.7) 56 (4.4)
Hong Kong, SAR 44 (4.9) 85 (3.0) 37 (4.7) 6 (1.9) 3 (1.5) 5 (2.0) 24 (3.9)
Hungary 75 (3.3) 99 (0.8) 46 (4.2) 36 (4.5) 19 (3.0) 17 (3.1) 59 (4.2)
Iceland 51 (0.4) 45 (0.4) 21 (0.3) 35 (0.3) 2 (0.1) 13 (0.2) 25 (0.3)
Iran, Islamic Rep. of 67 (3.8) 86 (2.8) 60 (3.9) 28 (3.1) 11 (2.3) 10 (2.3) 49 (4.2)
Israel 96 (1.8) 89 (2.8) 70 (4.3) 42 (4.2) 39 (4.6) 23 (3.2) 74 (4.1)
Italy 63 (3.5) 93 (2.0) 72 (3.1) 56 (3.2) 7 (1.7) 5 (1.8) 67 (3.2)
Kuwait 70 (3.7) 81 (2.8) 60 (4.0) r 22 (3.6) 28 (3.1) 20 (3.2) 56 (4.3)
Latvia 68 (3.5) 98 (1.2) 63 (4.5) 56 (4.3) 23 (4.0) 5 (2.3) 66 (4.5)
Lithuania 72 (3.5) 97 (1.3) 83 (3.1) 32 (3.4) 13 (2.7) 6 (1.8) 66 (3.8)
Macedonia, Rep. of 88 (3.1) 95 (2.0) 80 (2.9) 47 (4.3) 39 (4.2) 20 (3.6) 77 (3.6)
Moldova, Rep. of 83 (3.2) 99 (0.9) 86 (3.0) 59 (4.3) 32 (4.0) 55 (4.2) 84 (3.3)
Morocco 58 (4.3) 96 (1.9) 76 (4.8) 21 (4.9) 14 (4.2) 13 (3.1) 56 (4.4)
Netherlands 40 (4.6) 72 (4.4) 57 (4.5) 18 (3.6) 3 (1.5) 1 (0.9) 29 (4.0)
New Zealand 80 (3.4) 87 (2.9) 78 (3.8) 47 (4.1) 13 (2.9) 9 (2.1) 71 (4.1)
Norway 51 (4.1) 80 (3.4) 32 (3.6) 23 (3.5) 3 (1.2) 1 (0.5) 28 (3.6)
Romania 93 (2.0) 97 (1.5) 75 (4.0) 18 (3.7) 39 (4.2) 6 (2.0) 84 (3.1)
Russian Federation 33 (3.3) 99 (0.7) 79 (3.2) 48 (3.2) 19 (2.9) 6 (1.7) 54 (3.7)
Scotland 62 (4.1) 93 (2.1) 56 (4.9) 23 (4.5) 0 (0.0) 3 (1.7) 43 (5.0)
Singapore 55 (4.4) 92 (2.0) 57 (3.9) 13 (2.7) 7 (2.1) 5 (1.7) 43 (3.9)
Slovak Republic 76 (3.7) 100 (0.4) 68 (3.8) 61 (4.3) 14 (2.8) 8 (2.4) 71 (3.9)
Slovenia 73 (3.4) 93 (2.2) 71 (3.7) 66 (4.2) 29 (4.0) 5 (1.9) 73 (3.8)
Sweden 64 (3.3) 66 (3.4) 45 (4.1) 22 (2.9) 2 (0.9) 6 (1.7) 41 (3.7)
Turkey 95 (1.8) 91 (2.6) 71 (4.0) 35 (4.1) 29 (4.2) 8 (2.4) 74 (3.7)
United States 83 (3.6) 97 (1.8) 70 (4.1) 36 (4.4) 2 (0.8) 13 (3.3) 69 (4.2)
International Avg. 68 (0.6) 90 (0.4) 65 (0.7) 36 (0.6) 17 (0.5) 13 (0.5) 59 (0.7)
Countries
Percentage of Students Whose Teachers Asked Themto Do Various Activities At Least Weekly
WriteSomething in
Responseto TheirReading
OrallyAnswer
Questions orGive OralSummary
Talk WithEach Other
DrawPictures orDo an ArtProject
Do a Play orDramatization
Do a GroupProject
At LeastThree of the
PreviousActivities
Background data provided by teachers.
( ) Standard errors appear in parentheses. Because results are rounded to the nearest wholenumber, some totals may appear inconsistent.
An “r” indicates data are available for 70-84% of the students. An “s” indicates data are avail-able for 50-69% of the students. An “x” indicates data are available for less than 50% of thestudents.
A dash (–) indicates data are not available. A tilde (~) indicates insufficient data to reportachievement.
SOU
RCE:
IEA
Pro
gres
s in
Inte
rnat
iona
l Rea
ding
Lite
racy
Stu
dy (P
IRLS
) 200
1.
ISC 4th GradePIRLS 2001
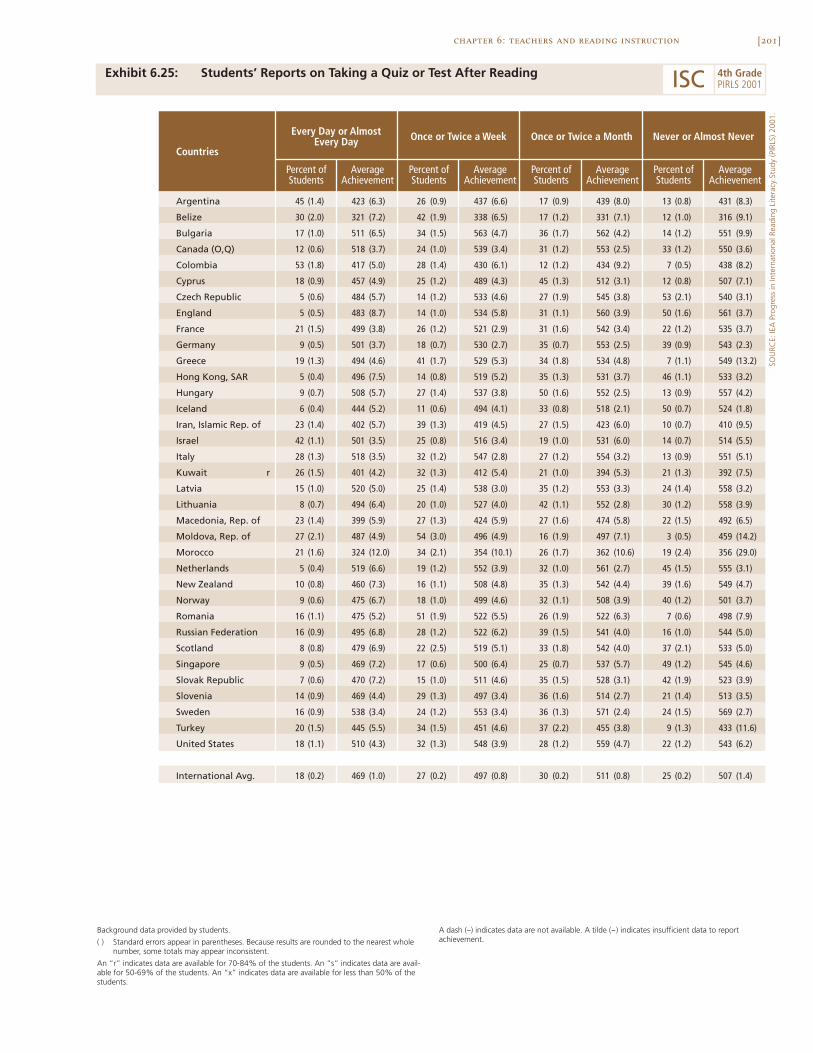
[201]chapter 6: teachers and reading instruction
Exhibit 6.25: Students’ Reports on Taking a Quiz or Test After Reading
SOU
RCE:
IEA
Pro
gres
s in
Inte
rnat
iona
l Rea
ding
Lite
racy
Stu
dy (P
IRLS
) 200
1.
Argentina 45 (1.4) 423 (6.3) 26 (0.9) 437 (6.6) 17 (0.9) 439 (8.0) 13 (0.8) 431 (8.3)
Belize 30 (2.0) 321 (7.2) 42 (1.9) 338 (6.5) 17 (1.2) 331 (7.1) 12 (1.0) 316 (9.1)
Bulgaria 17 (1.0) 511 (6.5) 34 (1.5) 563 (4.7) 36 (1.7) 562 (4.2) 14 (1.2) 551 (9.9)
Canada (O,Q) 12 (0.6) 518 (3.7) 24 (1.0) 539 (3.4) 31 (1.2) 553 (2.5) 33 (1.2) 550 (3.6)
Colombia 53 (1.8) 417 (5.0) 28 (1.4) 430 (6.1) 12 (1.2) 434 (9.2) 7 (0.5) 438 (8.2)
Cyprus 18 (0.9) 457 (4.9) 25 (1.2) 489 (4.3) 45 (1.3) 512 (3.1) 12 (0.8) 507 (7.1)
Czech Republic 5 (0.6) 484 (5.7) 14 (1.2) 533 (4.6) 27 (1.9) 545 (3.8) 53 (2.1) 540 (3.1)
England 5 (0.5) 483 (8.7) 14 (1.0) 534 (5.8) 31 (1.1) 560 (3.9) 50 (1.6) 561 (3.7)
France 21 (1.5) 499 (3.8) 26 (1.2) 521 (2.9) 31 (1.6) 542 (3.4) 22 (1.2) 535 (3.7)
Germany 9 (0.5) 501 (3.7) 18 (0.7) 530 (2.7) 35 (0.7) 553 (2.5) 39 (0.9) 543 (2.3)
Greece 19 (1.3) 494 (4.6) 41 (1.7) 529 (5.3) 34 (1.8) 534 (4.8) 7 (1.1) 549 (13.2)
Hong Kong, SAR 5 (0.4) 496 (7.5) 14 (0.8) 519 (5.2) 35 (1.3) 531 (3.7) 46 (1.1) 533 (3.2)
Hungary 9 (0.7) 508 (5.7) 27 (1.4) 537 (3.8) 50 (1.6) 552 (2.5) 13 (0.9) 557 (4.2)
Iceland 6 (0.4) 444 (5.2) 11 (0.6) 494 (4.1) 33 (0.8) 518 (2.1) 50 (0.7) 524 (1.8)
Iran, Islamic Rep. of 23 (1.4) 402 (5.7) 39 (1.3) 419 (4.5) 27 (1.5) 423 (6.0) 10 (0.7) 410 (9.5)
Israel 42 (1.1) 501 (3.5) 25 (0.8) 516 (3.4) 19 (1.0) 531 (6.0) 14 (0.7) 514 (5.5)
Italy 28 (1.3) 518 (3.5) 32 (1.2) 547 (2.8) 27 (1.2) 554 (3.2) 13 (0.9) 551 (5.1)
Kuwait r 26 (1.5) 401 (4.2) 32 (1.3) 412 (5.4) 21 (1.0) 394 (5.3) 21 (1.3) 392 (7.5)
Latvia 15 (1.0) 520 (5.0) 25 (1.4) 538 (3.0) 35 (1.2) 553 (3.3) 24 (1.4) 558 (3.2)
Lithuania 8 (0.7) 494 (6.4) 20 (1.0) 527 (4.0) 42 (1.1) 552 (2.8) 30 (1.2) 558 (3.9)
Macedonia, Rep. of 23 (1.4) 399 (5.9) 27 (1.3) 424 (5.9) 27 (1.6) 474 (5.8) 22 (1.5) 492 (6.5)
Moldova, Rep. of 27 (2.1) 487 (4.9) 54 (3.0) 496 (4.9) 16 (1.9) 497 (7.1) 3 (0.5) 459 (14.2)
Morocco 21 (1.6) 324 (12.0) 34 (2.1) 354 (10.1) 26 (1.7) 362 (10.6) 19 (2.4) 356 (29.0)
Netherlands 5 (0.4) 519 (6.6) 19 (1.2) 552 (3.9) 32 (1.0) 561 (2.7) 45 (1.5) 555 (3.1)
New Zealand 10 (0.8) 460 (7.3) 16 (1.1) 508 (4.8) 35 (1.3) 542 (4.4) 39 (1.6) 549 (4.7)
Norway 9 (0.6) 475 (6.7) 18 (1.0) 499 (4.6) 32 (1.1) 508 (3.9) 40 (1.2) 501 (3.7)
Romania 16 (1.1) 475 (5.2) 51 (1.9) 522 (5.5) 26 (1.9) 522 (6.3) 7 (0.6) 498 (7.9)
Russian Federation 16 (0.9) 495 (6.8) 28 (1.2) 522 (6.2) 39 (1.5) 541 (4.0) 16 (1.0) 544 (5.0)
Scotland 8 (0.8) 479 (6.9) 22 (2.5) 519 (5.1) 33 (1.8) 542 (4.0) 37 (2.1) 533 (5.0)
Singapore 9 (0.5) 469 (7.2) 17 (0.6) 500 (6.4) 25 (0.7) 537 (5.7) 49 (1.2) 545 (4.6)
Slovak Republic 7 (0.6) 470 (7.2) 15 (1.0) 511 (4.6) 35 (1.5) 528 (3.1) 42 (1.9) 523 (3.9)
Slovenia 14 (0.9) 469 (4.4) 29 (1.3) 497 (3.4) 36 (1.6) 514 (2.7) 21 (1.4) 513 (3.5)
Sweden 16 (0.9) 538 (3.4) 24 (1.2) 553 (3.4) 36 (1.3) 571 (2.4) 24 (1.5) 569 (2.7)
Turkey 20 (1.5) 445 (5.5) 34 (1.5) 451 (4.6) 37 (2.2) 455 (3.8) 9 (1.3) 433 (11.6)
United States 18 (1.1) 510 (4.3) 32 (1.3) 548 (3.9) 28 (1.2) 559 (4.7) 22 (1.2) 543 (6.2)
International Avg. 18 (0.2) 469 (1.0) 27 (0.2) 497 (0.8) 30 (0.2) 511 (0.8) 25 (0.2) 507 (1.4)
Countries
Every Day or AlmostEvery Day Once or Twice a Week Once or Twice a Month Never or Almost Never
Percent ofStudents
AverageAchievement
Percent ofStudents
AverageAchievement
Percent ofStudents
AverageAchievement
Percent ofStudents
AverageAchievement
Background data provided by students.
( ) Standard errors appear in parentheses. Because results are rounded to the nearest wholenumber, some totals may appear inconsistent.
An “r” indicates data are available for 70-84% of the students. An “s” indicates data are avail-able for 50-69% of the students. An “x” indicates data are available for less than 50% of thestudents.
A dash (–) indicates data are not available. A tilde (~) indicates insufficient data to reportachievement.
ISC 4th GradePIRLS 2001

[202] chapter 6: teachers and reading instruction
Exhibit 6.26: Teachers’ Reports on Giving a Written Quiz or Test After Students Read
Argentina 15 (3.2) 431 (16.0) 36 (4.8) 414 (11.7) 34 (4.8) 424 (11.2) 15 (3.6) 415 (13.3)
Belize 11 (3.3) 323 (20.6) 68 (5.4) 322 (6.2) 21 (4.2) 331 (14.8) 1 (0.5) ~ ~
Bulgaria 2 (1.0) ~ ~ 13 (2.4) 547 (13.3) 72 (3.5) 551 (5.1) 13 (2.6) 552 (7.3)
Canada (O,Q) 0 (0.4) ~ ~ 15 (2.1) 540 (5.4) 62 (3.2) 545 (2.8) 23 (2.7) 548 (6.1)
Colombia 14 (3.5) 398 (13.2) 33 (4.6) 424 (7.8) 42 (4.8) 425 (7.2) 12 (3.0) 439 (21.0)
Cyprus 1 (0.0) ~ ~ 14 (3.8) 507 (6.9) 49 (5.7) 490 (4.4) 35 (4.8) 493 (4.6)
Czech Republic 0 (0.4) ~ ~ 15 (3.3) 538 (6.3) 62 (4.6) 536 (3.6) 23 (3.6) 539 (4.1)
England 0 (0.0) ~ ~ 5 (2.1) 551 (28.1) 45 (4.4) 553 (5.6) 50 (4.5) 556 (4.9)
France 2 (1.0) ~ ~ 21 (3.3) 528 (5.8) 62 (3.8) 524 (2.9) 16 (2.8) 528 (6.3)
Germany 0 (0.0) ~ ~ 3 (1.1) 548 (6.8) 50 (3.8) 537 (2.8) 47 (3.9) 541 (3.7)
Greece 0 (0.0) ~ ~ 22 (4.2) 538 (7.6) 64 (4.5) 520 (4.4) 14 (3.3) 533 (10.4)
Hong Kong, SAR 0 (0.0) ~ ~ 11 (2.6) 514 (9.6) 55 (4.4) 526 (4.6) 34 (4.5) 538 (3.9)
Hungary 1 (0.6) ~ ~ 4 (1.6) 518 (16.2) 84 (3.2) 545 (2.7) 12 (2.7) 550 (9.5)
Iceland 1 (0.0) ~ ~ 3 (0.1) 474 (6.5) 30 (0.4) 501 (2.7) 67 (0.4) 518 (1.3)
Iran, Islamic Rep. of 6 (1.5) 389 (13.4) 34 (4.1) 410 (7.7) 49 (3.9) 417 (6.4) 12 (2.8) 422 (18.9)
Israel 2 (1.4) ~ ~ 17 (3.2) 499 (10.9) 68 (3.9) 508 (4.7) 12 (2.8) 528 (11.5)
Italy 11 (2.3) 529 (7.9) 43 (3.1) 538 (4.6) 40 (3.3) 545 (3.1) 6 (1.7) 555 (15.8)
Kuwait 12 (2.8) 388 (12.5) 39 (3.6) 403 (6.6) 32 (3.6) 400 (9.8) 17 (2.9) 397 (11.3)
Latvia 1 (1.1) ~ ~ 12 (3.1) 547 (9.1) 76 (4.1) 545 (2.9) 11 (2.9) 548 (5.7)
Lithuania 0 (0.0) ~ ~ 12 (2.4) 532 (10.6) 69 (3.7) 544 (3.0) 19 (3.3) 549 (5.7)
Macedonia, Rep. of 3 (1.6) 432 (27.4) 14 (3.0) 428 (16.1) 66 (4.1) 447 (7.1) 16 (3.3) 445 (13.3)
Moldova, Rep. of 10 (2.5) 484 (14.1) 48 (4.5) 490 (5.7) 40 (4.2) 495 (7.4) 2 (1.1) ~ ~
Morocco 1 (1.0) ~ ~ 16 (3.6) 348 (13.1) 48 (5.0) 353 (13.9) 35 (4.9) 329 (16.7)
Netherlands 3 (1.6) 556 (10.1) 24 (3.9) 549 (5.2) 62 (4.5) 554 (3.4) 10 (2.8) 562 (5.7)
New Zealand 0 (0.0) ~ ~ 4 (1.7) 498 (33.2) 20 (3.3) 532 (8.5) 76 (3.6) 530 (4.8)
Norway 0 (0.0) ~ ~ 5 (1.2) 495 (6.4) 30 (3.7) 496 (5.0) 66 (4.0) 501 (3.8)
Romania 2 (1.0) ~ ~ 28 (3.4) 507 (9.7) 68 (3.6) 512 (5.6) 3 (1.4) 506 (22.7)
Russian Federation 2 (1.0) ~ ~ 6 (1.4) 538 (7.1) 67 (2.9) 529 (6.1) 25 (2.8) 525 (4.9)
Scotland 0 (0.0) ~ ~ 4 (1.8) 545 (24.5) 37 (5.2) 524 (6.3) 60 (5.3) 530 (4.4)
Singapore 2 (1.0) ~ ~ 10 (2.0) 507 (15.8) 42 (3.9) 533 (8.6) 46 (3.7) 529 (7.2)
Slovak Republic 1 (0.6) ~ ~ 9 (2.2) 524 (9.2) 48 (3.8) 521 (3.8) 42 (3.7) 513 (5.5)
Slovenia 1 (0.7) ~ ~ 18 (3.3) 496 (5.8) 63 (4.0) 503 (2.6) 18 (3.3) 506 (5.5)
Sweden 1 (0.5) ~ ~ 8 (1.7) 558 (5.9) 35 (3.7) 561 (3.9) 57 (3.6) 562 (2.8)
Turkey 2 (1.0) ~ ~ 18 (3.5) 452 (10.9) 74 (3.9) 450 (4.2) 6 (1.8) 457 (14.1)
United States 2 (1.1) ~ ~ 49 (3.9) 538 (5.1) 40 (3.9) 551 (6.0) 9 (2.1) 529 (10.4)
International Avg. 3 (0.2) 437 (3.6) 19 (0.5) 496 (2.1) 52 (0.7) 501 (1.1) 26 (0.5) 508 (5.6)
Countries
Every Day or AlmostEvery Day Once or Twice a Week Once or Twice a Month Never or Almost Never
Percent ofStudents
AverageAchievement
Percent ofStudents
AverageAchievement
Percent ofStudents
AverageAchievement
Percent ofStudents
AverageAchievement
Background data provided by teachers.
( ) Standard errors appear in parentheses. Because results are rounded to the nearest wholenumber, some totals may appear inconsistent.
An “r” indicates data are available for 70-84% of the students. An “s” indicates data are avail-able for 50-69% of the students. An “x” indicates data are available for less than 50% of thestudents.
A dash (–) indicates data are not available. A tilde (~) indicates insufficient data to reportachievement.
SOU
RCE:
IEA
Pro
gres
s in
Inte
rnat
iona
l Rea
ding
Lite
racy
Stu
dy (P
IRLS
) 200
1.
ISC 4th GradePIRLS 2001
[203]chapter 6: teachers and reading instruction
What Library Resources Are Available and How Are They Used?
Since there is ample evidence that access to books and other print resources isan important support for the process of learning to read,2 PIRLS asked prin-cipals if their schools had a library and if individual classrooms had classroomlibraries or reading corners. As shown in Exhibit 6.27, almost all students(85%) attended schools with a school library, and the majority (65%) withlarge holdings – more than 500 books. Many students also had access to class-room libraries. Only five countries, Belize, Cyprus, Germany, Morocco, TheNetherlands, and Turkey, had less than 70 percent of students in schools withschool libraries, but Cyprus, Germany, The Netherlands, and Turkey com-pensated for this by having large percentages of students in schools where allor most classrooms had a library or reading corner. In some of these countries,also, students make frequent use of mobile libraries, village libraries, and doc-umentation centers. On average, 57 percent of students were in schools wheremost or all classrooms had classroom libraries. These were most often reportedin Cyprus, Hong Kong, New Zealand, and Scotland, in each of which morethan 80 percent of students were in schools where most or all classrooms hadsuch facilities. According to teacher reports, classroom libraries were rela-tively rare in Colombia, Iran, Macedonia, and Morocco.
In addition to asking principals about school and classroom libraries,PIRLS asked teachers about the situation in their own fourth-grade classroom– whether they had a classroom library or reading corner and, if so, how manybooks and magazines it contained, how often they gave students time to use itand whether they could borrow books from it to take home. Exhibit 6.28shows that 69 percent of students, on average, internationally, were in classeswhere the teacher reported having a classroom library, and in some countries,notably Cyprus, Hong Kong, New Zealand, and the United States, almost allstudents (more than 95%) were in such classes.
Despite the widespread availability of classroom libraries, studentswere allowed to use them relatively infrequently, with 62 percent of stu-dents, on average, in classes where the teacher reported giving students timeto use the classroom library no more than weekly. Highest levels of use werereported in New Zealand and the United States, where 85 percent or more
2 For example, IEA’s 1991 Reading Literacy Study found that countries with higher average student reading achievement had larger schoollibraries and especially large classroom libraries (Elley, W.B. (1992). How in the world do students read? The Hague: International Associationfor the Evaluation of Educational Achievement (IEA)).
[204]
of students were taught by teachers reporting daily use. Mostly, where therewere classroom libraries students were allowed to borrow books to take home(82% on average). Borrowing was least often reported in The Netherlands,where only 16 percent of students were allowed to borrow from the class-room library.
Exhibit 6.28 also presents the average number of books and maga-zines in classroom libraries as reported by teachers. Although the data areincomplete because of low response rates in some countries, it is clear thatclassroom library holdings varied considerably in size across countries.Canada (O,Q), England, and the United States, with more than 200 books onaverage per library, were well above the international average of 60 books,while Argentina, Bulgaria, the Czech Republic, Iceland, Kuwait, and Moroccoreported less than 20 books per library. Countries with the highest reportedholdings of magazines in classroom libraries included Canada (O,Q), France,Latvia, and the Russian Federation.
Teachers reported that visits to the school library, for those schoolsthat had a school library, were made by the majority of fourth-grade students(53%, on average, internationally) at least once or twice a week (seeExhibit 6.29). In Moldova, New Zealand, Slovenia, and the United States, 90percent or more of students were in classes where teachers reported this levelof library visits.
Exhibit 6.30 summarizes teachers’ reports on students’ overall libraryuse, including both school and classroom libraries. On average, students werein classes where the teacher reported library use either daily (44%), or once ortwice a week (40%). Students using the library less than weekly had the lowestaverage reading achievement.
chapter 6: teachers and reading instruction
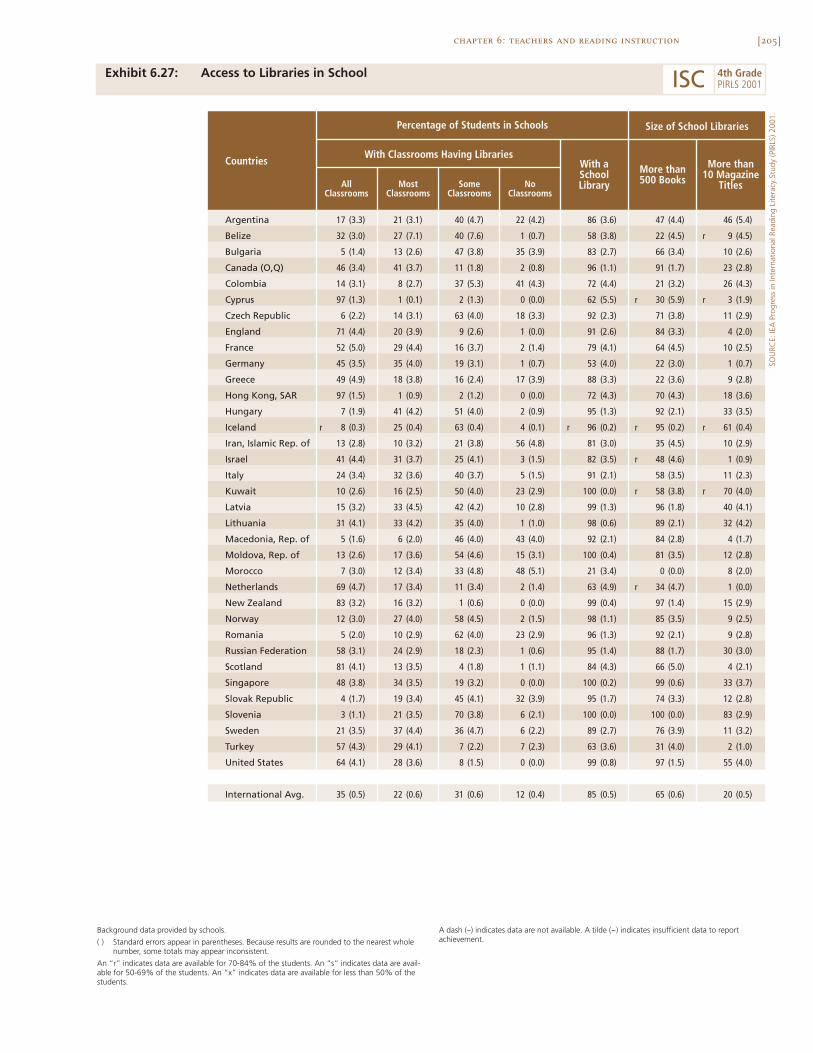
[205]chapter 6: teachers and reading instruction
Exhibit 6.27: Access to Libraries in School
SOU
RCE:
IEA
Pro
gres
s in
Inte
rnat
iona
l Rea
ding
Lite
racy
Stu
dy (P
IRLS
) 200
1.
Argentina 17 (3.3) 21 (3.1) 40 (4.7) 22 (4.2) 86 (3.6) 47 (4.4) 46 (5.4)
Belize 32 (3.0) 27 (7.1) 40 (7.6) 1 (0.7) 58 (3.8) 22 (4.5) r 9 (4.5)
Bulgaria 5 (1.4) 13 (2.6) 47 (3.8) 35 (3.9) 83 (2.7) 66 (3.4) 10 (2.6)
Canada (O,Q) 46 (3.4) 41 (3.7) 11 (1.8) 2 (0.8) 96 (1.1) 91 (1.7) 23 (2.8)
Colombia 14 (3.1) 8 (2.7) 37 (5.3) 41 (4.3) 72 (4.4) 21 (3.2) 26 (4.3)
Cyprus 97 (1.3) 1 (0.1) 2 (1.3) 0 (0.0) 62 (5.5) r 30 (5.9) r 3 (1.9)
Czech Republic 6 (2.2) 14 (3.1) 63 (4.0) 18 (3.3) 92 (2.3) 71 (3.8) 11 (2.9)
England 71 (4.4) 20 (3.9) 9 (2.6) 1 (0.0) 91 (2.6) 84 (3.3) 4 (2.0)
France 52 (5.0) 29 (4.4) 16 (3.7) 2 (1.4) 79 (4.1) 64 (4.5) 10 (2.5)
Germany 45 (3.5) 35 (4.0) 19 (3.1) 1 (0.7) 53 (4.0) 22 (3.0) 1 (0.7)
Greece 49 (4.9) 18 (3.8) 16 (2.4) 17 (3.9) 88 (3.3) 22 (3.6) 9 (2.8)
Hong Kong, SAR 97 (1.5) 1 (0.9) 2 (1.2) 0 (0.0) 72 (4.3) 70 (4.3) 18 (3.6)
Hungary 7 (1.9) 41 (4.2) 51 (4.0) 2 (0.9) 95 (1.3) 92 (2.1) 33 (3.5)
Iceland r 8 (0.3) 25 (0.4) 63 (0.4) 4 (0.1) r 96 (0.2) r 95 (0.2) r 61 (0.4)
Iran, Islamic Rep. of 13 (2.8) 10 (3.2) 21 (3.8) 56 (4.8) 81 (3.0) 35 (4.5) 10 (2.9)
Israel 41 (4.4) 31 (3.7) 25 (4.1) 3 (1.5) 82 (3.5) r 48 (4.6) 1 (0.9)
Italy 24 (3.4) 32 (3.6) 40 (3.7) 5 (1.5) 91 (2.1) 58 (3.5) 11 (2.3)
Kuwait 10 (2.6) 16 (2.5) 50 (4.0) 23 (2.9) 100 (0.0) r 58 (3.8) r 70 (4.0)
Latvia 15 (3.2) 33 (4.5) 42 (4.2) 10 (2.8) 99 (1.3) 96 (1.8) 40 (4.1)
Lithuania 31 (4.1) 33 (4.2) 35 (4.0) 1 (1.0) 98 (0.6) 89 (2.1) 32 (4.2)
Macedonia, Rep. of 5 (1.6) 6 (2.0) 46 (4.0) 43 (4.0) 92 (2.1) 84 (2.8) 4 (1.7)
Moldova, Rep. of 13 (2.6) 17 (3.6) 54 (4.6) 15 (3.1) 100 (0.4) 81 (3.5) 12 (2.8)
Morocco 7 (3.0) 12 (3.4) 33 (4.8) 48 (5.1) 21 (3.4) 0 (0.0) 8 (2.0)
Netherlands 69 (4.7) 17 (3.4) 11 (3.4) 2 (1.4) 63 (4.9) r 34 (4.7) 1 (0.0)
New Zealand 83 (3.2) 16 (3.2) 1 (0.6) 0 (0.0) 99 (0.4) 97 (1.4) 15 (2.9)
Norway 12 (3.0) 27 (4.0) 58 (4.5) 2 (1.5) 98 (1.1) 85 (3.5) 9 (2.5)
Romania 5 (2.0) 10 (2.9) 62 (4.0) 23 (2.9) 96 (1.3) 92 (2.1) 9 (2.8)
Russian Federation 58 (3.1) 24 (2.9) 18 (2.3) 1 (0.6) 95 (1.4) 88 (1.7) 30 (3.0)
Scotland 81 (4.1) 13 (3.5) 4 (1.8) 1 (1.1) 84 (4.3) 66 (5.0) 4 (2.1)
Singapore 48 (3.8) 34 (3.5) 19 (3.2) 0 (0.0) 100 (0.2) 99 (0.6) 33 (3.7)
Slovak Republic 4 (1.7) 19 (3.4) 45 (4.1) 32 (3.9) 95 (1.7) 74 (3.3) 12 (2.8)
Slovenia 3 (1.1) 21 (3.5) 70 (3.8) 6 (2.1) 100 (0.0) 100 (0.0) 83 (2.9)
Sweden 21 (3.5) 37 (4.4) 36 (4.7) 6 (2.2) 89 (2.7) 76 (3.9) 11 (3.2)
Turkey 57 (4.3) 29 (4.1) 7 (2.2) 7 (2.3) 63 (3.6) 31 (4.0) 2 (1.0)
United States 64 (4.1) 28 (3.6) 8 (1.5) 0 (0.0) 99 (0.8) 97 (1.5) 55 (4.0)
International Avg. 35 (0.5) 22 (0.6) 31 (0.6) 12 (0.4) 85 (0.5) 65 (0.6) 20 (0.5)
Countries
Percentage of Students in Schools
With aSchoolLibrary
More than500 Books
With Classrooms Having Libraries
AllClassrooms
MostClassrooms
SomeClassrooms
NoClassrooms
Size of School Libraries
More than10 Magazine
Titles
Background data provided by schools.
( ) Standard errors appear in parentheses. Because results are rounded to the nearest wholenumber, some totals may appear inconsistent.
An “r” indicates data are available for 70-84% of the students. An “s” indicates data are avail-able for 50-69% of the students. An “x” indicates data are available for less than 50% of thestudents.
A dash (–) indicates data are not available. A tilde (~) indicates insufficient data to reportachievement.
ISC 4th GradePIRLS 2001
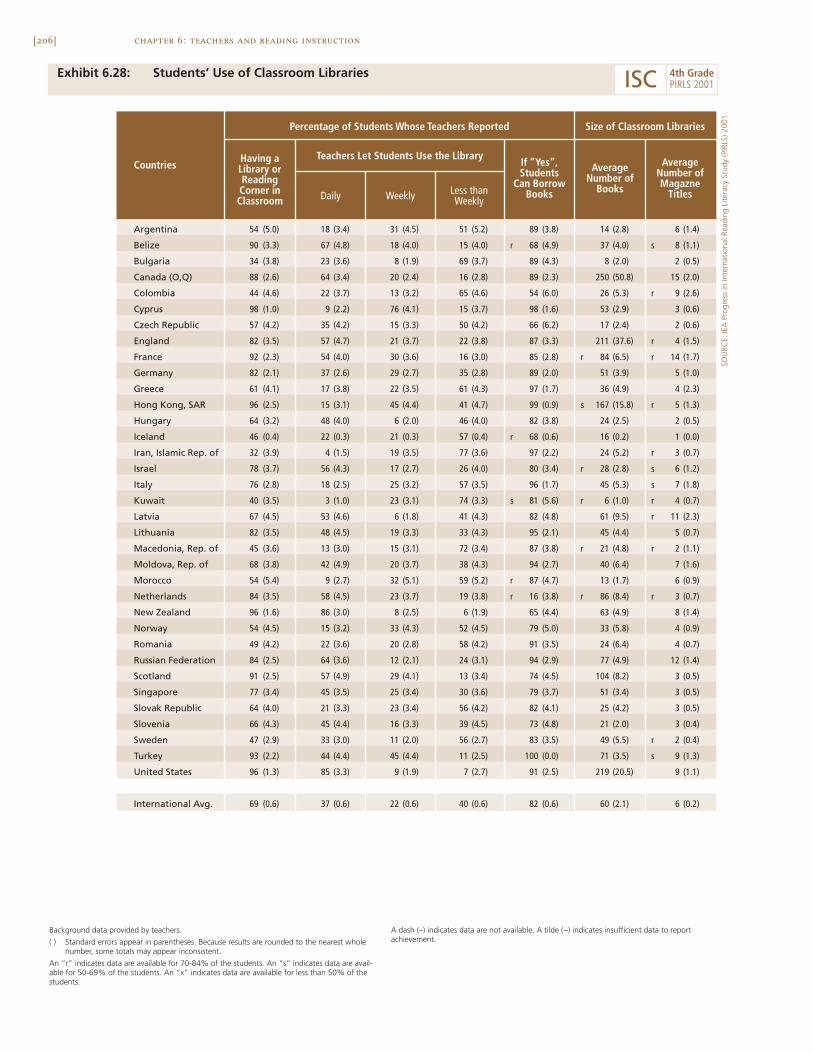
[206] chapter 6: teachers and reading instruction
Exhibit 6.28: Students’ Use of Classroom Libraries
Argentina 54 (5.0) 18 (3.4) 31 (4.5) 51 (5.2) 89 (3.8) 14 (2.8) 6 (1.4)
Belize 90 (3.3) 67 (4.8) 18 (4.0) 15 (4.0) r 68 (4.9) 37 (4.0) s 8 (1.1)
Bulgaria 34 (3.8) 23 (3.6) 8 (1.9) 69 (3.7) 89 (4.3) 8 (2.0) 2 (0.5)
Canada (O,Q) 88 (2.6) 64 (3.4) 20 (2.4) 16 (2.8) 89 (2.3) 250 (50.8) 15 (2.0)
Colombia 44 (4.6) 22 (3.7) 13 (3.2) 65 (4.6) 54 (6.0) 26 (5.3) r 9 (2.6)
Cyprus 98 (1.0) 9 (2.2) 76 (4.1) 15 (3.7) 98 (1.6) 53 (2.9) 3 (0.6)
Czech Republic 57 (4.2) 35 (4.2) 15 (3.3) 50 (4.2) 66 (6.2) 17 (2.4) 2 (0.6)
England 82 (3.5) 57 (4.7) 21 (3.7) 22 (3.8) 87 (3.3) 211 (37.6) r 4 (1.5)
France 92 (2.3) 54 (4.0) 30 (3.6) 16 (3.0) 85 (2.8) r 84 (6.5) r 14 (1.7)
Germany 82 (2.1) 37 (2.6) 29 (2.7) 35 (2.8) 89 (2.0) 51 (3.9) 5 (1.0)
Greece 61 (4.1) 17 (3.8) 22 (3.5) 61 (4.3) 97 (1.7) 36 (4.9) 4 (2.3)
Hong Kong, SAR 96 (2.5) 15 (3.1) 45 (4.4) 41 (4.7) 99 (0.9) s 167 (15.8) r 5 (1.3)
Hungary 64 (3.2) 48 (4.0) 6 (2.0) 46 (4.0) 82 (3.8) 24 (2.5) 2 (0.5)
Iceland 46 (0.4) 22 (0.3) 21 (0.3) 57 (0.4) r 68 (0.6) 16 (0.2) 1 (0.0)
Iran, Islamic Rep. of 32 (3.9) 4 (1.5) 19 (3.5) 77 (3.6) 97 (2.2) 24 (5.2) r 3 (0.7)
Israel 78 (3.7) 56 (4.3) 17 (2.7) 26 (4.0) 80 (3.4) r 28 (2.8) s 6 (1.2)
Italy 76 (2.8) 18 (2.5) 25 (3.2) 57 (3.5) 96 (1.7) 45 (5.3) s 7 (1.8)
Kuwait 40 (3.5) 3 (1.0) 23 (3.1) 74 (3.3) s 81 (5.6) r 6 (1.0) r 4 (0.7)
Latvia 67 (4.5) 53 (4.6) 6 (1.8) 41 (4.3) 82 (4.8) 61 (9.5) r 11 (2.3)
Lithuania 82 (3.5) 48 (4.5) 19 (3.3) 33 (4.3) 95 (2.1) 45 (4.4) 5 (0.7)
Macedonia, Rep. of 45 (3.6) 13 (3.0) 15 (3.1) 72 (3.4) 87 (3.8) r 21 (4.8) r 2 (1.1)
Moldova, Rep. of 68 (3.8) 42 (4.9) 20 (3.7) 38 (4.3) 94 (2.7) 40 (6.4) 7 (1.6)
Morocco 54 (5.4) 9 (2.7) 32 (5.1) 59 (5.2) r 87 (4.7) 13 (1.7) 6 (0.9)
Netherlands 84 (3.5) 58 (4.5) 23 (3.7) 19 (3.8) r 16 (3.8) r 86 (8.4) r 3 (0.7)
New Zealand 96 (1.6) 86 (3.0) 8 (2.5) 6 (1.9) 65 (4.4) 63 (4.9) 8 (1.4)
Norway 54 (4.5) 15 (3.2) 33 (4.3) 52 (4.5) 79 (5.0) 33 (5.8) 4 (0.9)
Romania 49 (4.2) 22 (3.6) 20 (2.8) 58 (4.2) 91 (3.5) 24 (6.4) 4 (0.7)
Russian Federation 84 (2.5) 64 (3.6) 12 (2.1) 24 (3.1) 94 (2.9) 77 (4.9) 12 (1.4)
Scotland 91 (2.5) 57 (4.9) 29 (4.1) 13 (3.4) 74 (4.5) 104 (8.2) 3 (0.5)
Singapore 77 (3.4) 45 (3.5) 25 (3.4) 30 (3.6) 79 (3.7) 51 (3.4) 3 (0.5)
Slovak Republic 64 (4.0) 21 (3.3) 23 (3.4) 56 (4.2) 82 (4.1) 25 (4.2) 3 (0.5)
Slovenia 66 (4.3) 45 (4.4) 16 (3.3) 39 (4.5) 73 (4.8) 21 (2.0) 3 (0.4)
Sweden 47 (2.9) 33 (3.0) 11 (2.0) 56 (2.7) 83 (3.5) 49 (5.5) r 2 (0.4)
Turkey 93 (2.2) 44 (4.4) 45 (4.4) 11 (2.5) 100 (0.0) 71 (3.5) s 9 (1.3)
United States 96 (1.3) 85 (3.3) 9 (1.9) 7 (2.7) 91 (2.5) 219 (20.5) 9 (1.1)
International Avg. 69 (0.6) 37 (0.6) 22 (0.6) 40 (0.6) 82 (0.6) 60 (2.1) 6 (0.2)
AverageNumber ofMagazne
Titles
Size of Classroom Libraries
Countries AverageNumber of
Books
Having aLibrary orReadingCorner inClassroom
Percentage of Students Whose Teachers Reported
If “Yes”,Students
Can BorrowBooks
Teachers Let Students Use the Library
Daily Weekly Less thanWeekly
Background data provided by teachers.
( ) Standard errors appear in parentheses. Because results are rounded to the nearest wholenumber, some totals may appear inconsistent.
An “r” indicates data are available for 70-84% of the students. An “s” indicates data are avail-able for 50-69% of the students. An “x” indicates data are available for less than 50% of thestudents.
A dash (–) indicates data are not available. A tilde (~) indicates insufficient data to reportachievement.
SOU
RCE:
IEA
Pro
gres
s in
Inte
rnat
iona
l Rea
ding
Lite
racy
Stu
dy (P
IRLS
) 200
1.
ISC 4th GradePIRLS 2001
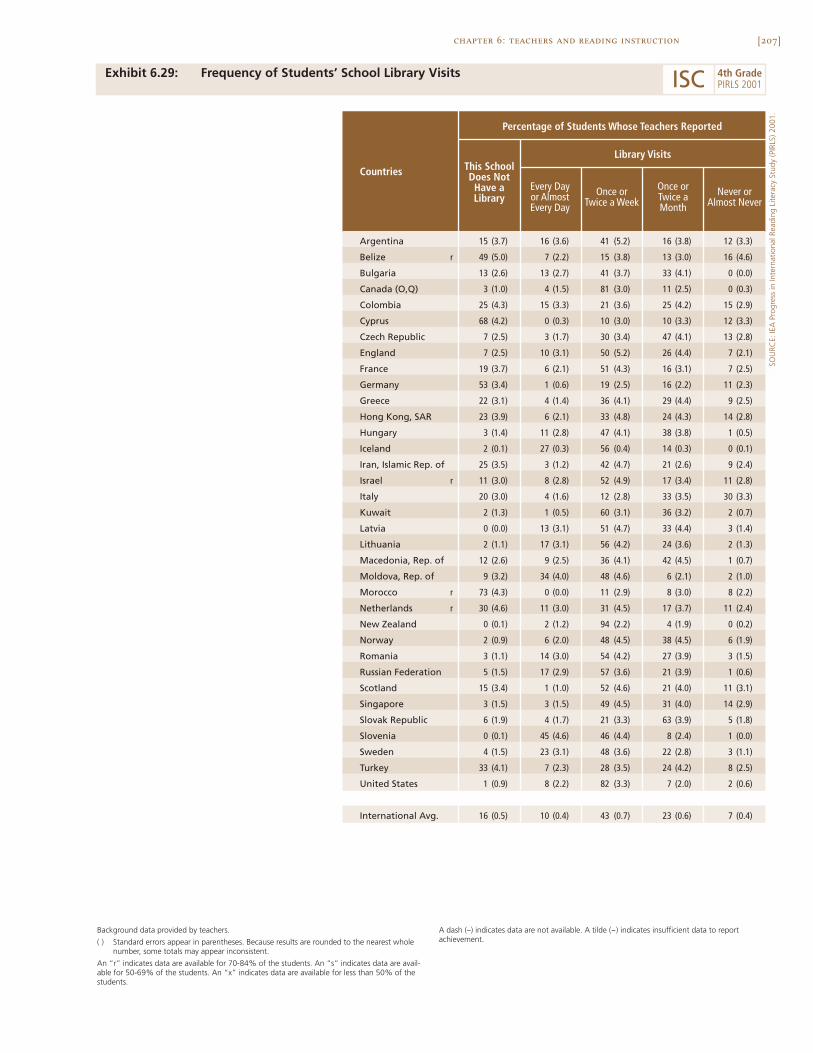
[207]chapter 6: teachers and reading instruction
Exhibit 6.29: Frequency of Students’ School Library Visits
SOU
RCE:
IEA
Pro
gres
s in
Inte
rnat
iona
l Rea
ding
Lite
racy
Stu
dy (P
IRLS
) 200
1.
Argentina 15 (3.7) 16 (3.6) 41 (5.2) 16 (3.8) 12 (3.3)
Belize r 49 (5.0) 7 (2.2) 15 (3.8) 13 (3.0) 16 (4.6)
Bulgaria 13 (2.6) 13 (2.7) 41 (3.7) 33 (4.1) 0 (0.0)
Canada (O,Q) 3 (1.0) 4 (1.5) 81 (3.0) 11 (2.5) 0 (0.3)
Colombia 25 (4.3) 15 (3.3) 21 (3.6) 25 (4.2) 15 (2.9)
Cyprus 68 (4.2) 0 (0.3) 10 (3.0) 10 (3.3) 12 (3.3)
Czech Republic 7 (2.5) 3 (1.7) 30 (3.4) 47 (4.1) 13 (2.8)
England 7 (2.5) 10 (3.1) 50 (5.2) 26 (4.4) 7 (2.1)
France 19 (3.7) 6 (2.1) 51 (4.3) 16 (3.1) 7 (2.5)
Germany 53 (3.4) 1 (0.6) 19 (2.5) 16 (2.2) 11 (2.3)
Greece 22 (3.1) 4 (1.4) 36 (4.1) 29 (4.4) 9 (2.5)
Hong Kong, SAR 23 (3.9) 6 (2.1) 33 (4.8) 24 (4.3) 14 (2.8)
Hungary 3 (1.4) 11 (2.8) 47 (4.1) 38 (3.8) 1 (0.5)
Iceland 2 (0.1) 27 (0.3) 56 (0.4) 14 (0.3) 0 (0.1)
Iran, Islamic Rep. of 25 (3.5) 3 (1.2) 42 (4.7) 21 (2.6) 9 (2.4)
Israel r 11 (3.0) 8 (2.8) 52 (4.9) 17 (3.4) 11 (2.8)
Italy 20 (3.0) 4 (1.6) 12 (2.8) 33 (3.5) 30 (3.3)
Kuwait 2 (1.3) 1 (0.5) 60 (3.1) 36 (3.2) 2 (0.7)
Latvia 0 (0.0) 13 (3.1) 51 (4.7) 33 (4.4) 3 (1.4)
Lithuania 2 (1.1) 17 (3.1) 56 (4.2) 24 (3.6) 2 (1.3)
Macedonia, Rep. of 12 (2.6) 9 (2.5) 36 (4.1) 42 (4.5) 1 (0.7)
Moldova, Rep. of 9 (3.2) 34 (4.0) 48 (4.6) 6 (2.1) 2 (1.0)
Morocco r 73 (4.3) 0 (0.0) 11 (2.9) 8 (3.0) 8 (2.2)
Netherlands r 30 (4.6) 11 (3.0) 31 (4.5) 17 (3.7) 11 (2.4)
New Zealand 0 (0.1) 2 (1.2) 94 (2.2) 4 (1.9) 0 (0.2)
Norway 2 (0.9) 6 (2.0) 48 (4.5) 38 (4.5) 6 (1.9)
Romania 3 (1.1) 14 (3.0) 54 (4.2) 27 (3.9) 3 (1.5)
Russian Federation 5 (1.5) 17 (2.9) 57 (3.6) 21 (3.9) 1 (0.6)
Scotland 15 (3.4) 1 (1.0) 52 (4.6) 21 (4.0) 11 (3.1)
Singapore 3 (1.5) 3 (1.5) 49 (4.5) 31 (4.0) 14 (2.9)
Slovak Republic 6 (1.9) 4 (1.7) 21 (3.3) 63 (3.9) 5 (1.8)
Slovenia 0 (0.1) 45 (4.6) 46 (4.4) 8 (2.4) 1 (0.0)
Sweden 4 (1.5) 23 (3.1) 48 (3.6) 22 (2.8) 3 (1.1)
Turkey 33 (4.1) 7 (2.3) 28 (3.5) 24 (4.2) 8 (2.5)
United States 1 (0.9) 8 (2.2) 82 (3.3) 7 (2.0) 2 (0.6)
International Avg. 16 (0.5) 10 (0.4) 43 (0.7) 23 (0.6) 7 (0.4)
This SchoolDoes NotHave aLibrary
Never orAlmost Never
Once orTwice aMonth
Every Dayor AlmostEvery Day
Once orTwice a Week
Countries
Percentage of Students Whose Teachers Reported
Library Visits
Background data provided by teachers.
( ) Standard errors appear in parentheses. Because results are rounded to the nearest wholenumber, some totals may appear inconsistent.
An “r” indicates data are available for 70-84% of the students. An “s” indicates data are avail-able for 50-69% of the students. An “x” indicates data are available for less than 50% of thestudents.
A dash (–) indicates data are not available. A tilde (~) indicates insufficient data to reportachievement.
ISC 4th GradePIRLS 2001
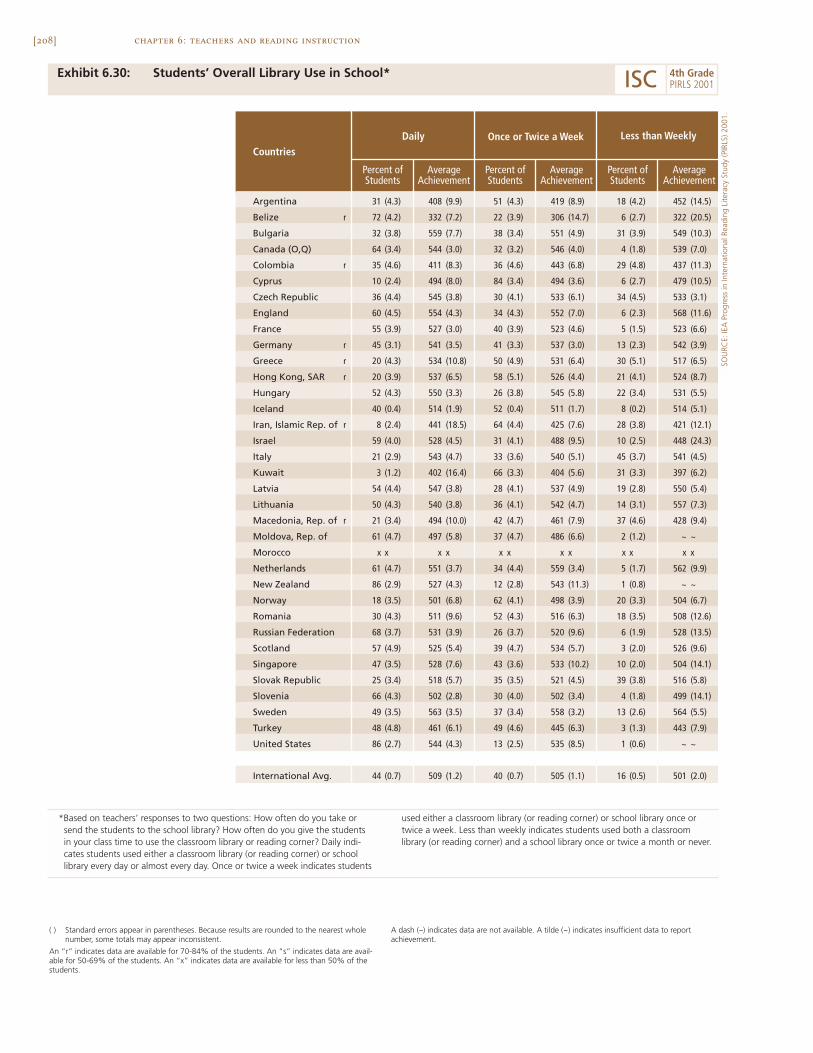
[208] chapter 6: teachers and reading instruction
Exhibit 6.30: Students’ Overall Library Use in School*
Argentina 31 (4.3) 408 (9.9) 51 (4.3) 419 (8.9) 18 (4.2) 452 (14.5)
Belize r 72 (4.2) 332 (7.2) 22 (3.9) 306 (14.7) 6 (2.7) 322 (20.5)
Bulgaria 32 (3.8) 559 (7.7) 38 (3.4) 551 (4.9) 31 (3.9) 549 (10.3)
Canada (O,Q) 64 (3.4) 544 (3.0) 32 (3.2) 546 (4.0) 4 (1.8) 539 (7.0)
Colombia r 35 (4.6) 411 (8.3) 36 (4.6) 443 (6.8) 29 (4.8) 437 (11.3)
Cyprus 10 (2.4) 494 (8.0) 84 (3.4) 494 (3.6) 6 (2.7) 479 (10.5)
Czech Republic 36 (4.4) 545 (3.8) 30 (4.1) 533 (6.1) 34 (4.5) 533 (3.1)
England 60 (4.5) 554 (4.3) 34 (4.3) 552 (7.0) 6 (2.3) 568 (11.6)
France 55 (3.9) 527 (3.0) 40 (3.9) 523 (4.6) 5 (1.5) 523 (6.6)
Germany r 45 (3.1) 541 (3.5) 41 (3.3) 537 (3.0) 13 (2.3) 542 (3.9)
Greece r 20 (4.3) 534 (10.8) 50 (4.9) 531 (6.4) 30 (5.1) 517 (6.5)
Hong Kong, SAR r 20 (3.9) 537 (6.5) 58 (5.1) 526 (4.4) 21 (4.1) 524 (8.7)
Hungary 52 (4.3) 550 (3.3) 26 (3.8) 545 (5.8) 22 (3.4) 531 (5.5)
Iceland 40 (0.4) 514 (1.9) 52 (0.4) 511 (1.7) 8 (0.2) 514 (5.1)
Iran, Islamic Rep. of r 8 (2.4) 441 (18.5) 64 (4.4) 425 (7.6) 28 (3.8) 421 (12.1)
Israel 59 (4.0) 528 (4.5) 31 (4.1) 488 (9.5) 10 (2.5) 448 (24.3)
Italy 21 (2.9) 543 (4.7) 33 (3.6) 540 (5.1) 45 (3.7) 541 (4.5)
Kuwait 3 (1.2) 402 (16.4) 66 (3.3) 404 (5.6) 31 (3.3) 397 (6.2)
Latvia 54 (4.4) 547 (3.8) 28 (4.1) 537 (4.9) 19 (2.8) 550 (5.4)
Lithuania 50 (4.3) 540 (3.8) 36 (4.1) 542 (4.7) 14 (3.1) 557 (7.3)
Macedonia, Rep. of r 21 (3.4) 494 (10.0) 42 (4.7) 461 (7.9) 37 (4.6) 428 (9.4)
Moldova, Rep. of 61 (4.7) 497 (5.8) 37 (4.7) 486 (6.6) 2 (1.2) ~ ~
Morocco x x x x x x x x x x x x
Netherlands 61 (4.7) 551 (3.7) 34 (4.4) 559 (3.4) 5 (1.7) 562 (9.9)
New Zealand 86 (2.9) 527 (4.3) 12 (2.8) 543 (11.3) 1 (0.8) ~ ~
Norway 18 (3.5) 501 (6.8) 62 (4.1) 498 (3.9) 20 (3.3) 504 (6.7)
Romania 30 (4.3) 511 (9.6) 52 (4.3) 516 (6.3) 18 (3.5) 508 (12.6)
Russian Federation 68 (3.7) 531 (3.9) 26 (3.7) 520 (9.6) 6 (1.9) 528 (13.5)
Scotland 57 (4.9) 525 (5.4) 39 (4.7) 534 (5.7) 3 (2.0) 526 (9.6)
Singapore 47 (3.5) 528 (7.6) 43 (3.6) 533 (10.2) 10 (2.0) 504 (14.1)
Slovak Republic 25 (3.4) 518 (5.7) 35 (3.5) 521 (4.5) 39 (3.8) 516 (5.8)
Slovenia 66 (4.3) 502 (2.8) 30 (4.0) 502 (3.4) 4 (1.8) 499 (14.1)
Sweden 49 (3.5) 563 (3.5) 37 (3.4) 558 (3.2) 13 (2.6) 564 (5.5)
Turkey 48 (4.8) 461 (6.1) 49 (4.6) 445 (6.3) 3 (1.3) 443 (7.9)
United States 86 (2.7) 544 (4.3) 13 (2.5) 535 (8.5) 1 (0.6) ~ ~
International Avg. 44 (0.7) 509 (1.2) 40 (0.7) 505 (1.1) 16 (0.5) 501 (2.0)
Once or Twice a Week Less than Weekly
Countries
Percent ofStudents
AverageAchievement
Daily
Percent ofStudents
AverageAchievement
Percent ofStudents
AverageAchievement
( ) Standard errors appear in parentheses. Because results are rounded to the nearest wholenumber, some totals may appear inconsistent.
An “r” indicates data are available for 70-84% of the students. An “s” indicates data are avail-able for 50-69% of the students. An “x” indicates data are available for less than 50% of thestudents.
A dash (–) indicates data are not available. A tilde (~) indicates insufficient data to reportachievement.
SOU
RCE:
IEA
Pro
gres
s in
Inte
rnat
iona
l Rea
ding
Lite
racy
Stu
dy (P
IRLS
) 200
1.
ISC 4th GradePIRLS 2001
*Based on teachers’ responses to two questions: How often do you take orsend the students to the school library? How often do you give the studentsin your class time to use the classroom library or reading corner? Daily indi-cates students used either a classroom library (or reading corner) or schoollibrary every day or almost every day. Once or twice a week indicates students
used either a classroom library (or reading corner) or school library once ortwice a week. Less than weekly indicates students used both a classroomlibrary (or reading corner) and a school library once or twice a month or never.
[209]chapter 6: teachers and reading instruction
How Are Computers Used for Reading Instruction?
To explore the use of information technology in teaching reading, PIRLS askedteachers and students about the availability of computers and how they wereused. According to their teachers, half the fourth-grade students across allcountries had access to computers, but computer availability varied dramati-cally from country to country, as shown in Exhibit 6.31. Whereas almost all stu-dents (more than 90%) in Canada (O,Q), England, Iceland, The Netherlands,New Zealand, Scotland, Singapore, Sweden, and the United States had com-puters available in the classroom or elsewhere in the school, the large majority(more than 80%) in Belize, Bulgaria, Colombia, Greece, Iran, Kuwait, Mace-donia, Moldova, the Russian Federation, the Slovak Republic, and Turkey hadno access to computers. Among students with access, less than one-third (29%)were in classes with a computer in the classroom, and less than half (45%)had computers available somewhere else in the school. Classroom computerswere most common in Canada (O,Q), England, The Netherlands, New Zealand,Scotland, Sweden, and the United States.
Internet access for classes with computers available also varied con-siderably. Countries with high levels of computer availability and high levelsof Internet access included Canada (O,Q), Iceland, New Zealand, Sweden, andthe United States, where almost all students had access to computers withInternet connections, according to their teachers.
Exhibit 6.31 also presents teachers’ reports of students’ use of the com-puter for developing reading skills and strategies, reading stories, and writingstories. On average, less than one-third (32%) of students in classes with accessto computers used them for writing stories or other texts at least once a month.Among countries with high levels of computer availability, use of the com-puter for writing was most common in England and New Zealand, where morethan 90 percent of students were in classes where this occurred at least monthly,but Canada (O,Q), Iceland, Scotland, Sweden, and the United States also hadhigh percentages of students in this category. Teachers generally reported lessfrequently asking students to use the computer for reading stories or developingreading skills and strategies – these activities were most common inCanada (O,Q), New Zealand, Singapore, and the United States.
[210]
On average, across countries, 70 percent of students reported that theyhad used a computer at some time, and in about one-third of the countries thisapplied to almost all students (more than 90%). Computer use was more fre-quent at home than in school, on average, but relatively high use both at homeand school was reported in Canada (O,Q), England, Hong Kong, Scotland, andthe United States (Exhibit 6.32).
chapter 6: teachers and reading instruction
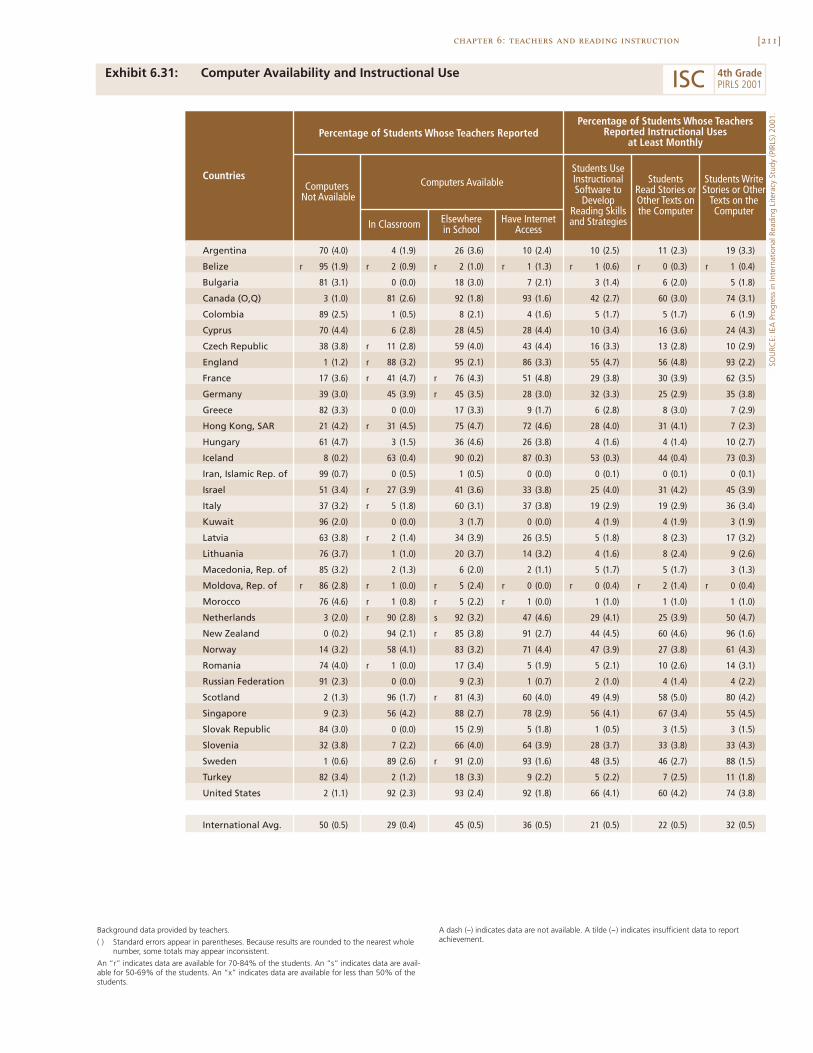
[211]chapter 6: teachers and reading instruction
Exhibit 6.31: Computer Availability and Instructional Use
SOU
RCE:
IEA
Pro
gres
s in
Inte
rnat
iona
l Rea
ding
Lite
racy
Stu
dy (P
IRLS
) 200
1.
Argentina 70 (4.0) 4 (1.9) 26 (3.6) 10 (2.4) 10 (2.5) 11 (2.3) 19 (3.3)
Belize r 95 (1.9) r 2 (0.9) r 2 (1.0) r 1 (1.3) r 1 (0.6) r 0 (0.3) r 1 (0.4)
Bulgaria 81 (3.1) 0 (0.0) 18 (3.0) 7 (2.1) 3 (1.4) 6 (2.0) 5 (1.8)
Canada (O,Q) 3 (1.0) 81 (2.6) 92 (1.8) 93 (1.6) 42 (2.7) 60 (3.0) 74 (3.1)
Colombia 89 (2.5) 1 (0.5) 8 (2.1) 4 (1.6) 5 (1.7) 5 (1.7) 6 (1.9)
Cyprus 70 (4.4) 6 (2.8) 28 (4.5) 28 (4.4) 10 (3.4) 16 (3.6) 24 (4.3)
Czech Republic 38 (3.8) r 11 (2.8) 59 (4.0) 43 (4.4) 16 (3.3) 13 (2.8) 10 (2.9)
England 1 (1.2) r 88 (3.2) 95 (2.1) 86 (3.3) 55 (4.7) 56 (4.8) 93 (2.2)
France 17 (3.6) r 41 (4.7) r 76 (4.3) 51 (4.8) 29 (3.8) 30 (3.9) 62 (3.5)
Germany 39 (3.0) 45 (3.9) r 45 (3.5) 28 (3.0) 32 (3.3) 25 (2.9) 35 (3.8)
Greece 82 (3.3) 0 (0.0) 17 (3.3) 9 (1.7) 6 (2.8) 8 (3.0) 7 (2.9)
Hong Kong, SAR 21 (4.2) r 31 (4.5) 75 (4.7) 72 (4.6) 28 (4.0) 31 (4.1) 7 (2.3)
Hungary 61 (4.7) 3 (1.5) 36 (4.6) 26 (3.8) 4 (1.6) 4 (1.4) 10 (2.7)
Iceland 8 (0.2) 63 (0.4) 90 (0.2) 87 (0.3) 53 (0.3) 44 (0.4) 73 (0.3)
Iran, Islamic Rep. of 99 (0.7) 0 (0.5) 1 (0.5) 0 (0.0) 0 (0.1) 0 (0.1) 0 (0.1)
Israel 51 (3.4) r 27 (3.9) 41 (3.6) 33 (3.8) 25 (4.0) 31 (4.2) 45 (3.9)
Italy 37 (3.2) r 5 (1.8) 60 (3.1) 37 (3.8) 19 (2.9) 19 (2.9) 36 (3.4)
Kuwait 96 (2.0) 0 (0.0) 3 (1.7) 0 (0.0) 4 (1.9) 4 (1.9) 3 (1.9)
Latvia 63 (3.8) r 2 (1.4) 34 (3.9) 26 (3.5) 5 (1.8) 8 (2.3) 17 (3.2)
Lithuania 76 (3.7) 1 (1.0) 20 (3.7) 14 (3.2) 4 (1.6) 8 (2.4) 9 (2.6)
Macedonia, Rep. of 85 (3.2) 2 (1.3) 6 (2.0) 2 (1.1) 5 (1.7) 5 (1.7) 3 (1.3)
Moldova, Rep. of r 86 (2.8) r 1 (0.0) r 5 (2.4) r 0 (0.0) r 0 (0.4) r 2 (1.4) r 0 (0.4)
Morocco 76 (4.6) r 1 (0.8) r 5 (2.2) r 1 (0.0) 1 (1.0) 1 (1.0) 1 (1.0)
Netherlands 3 (2.0) r 90 (2.8) s 92 (3.2) 47 (4.6) 29 (4.1) 25 (3.9) 50 (4.7)
New Zealand 0 (0.2) 94 (2.1) r 85 (3.8) 91 (2.7) 44 (4.5) 60 (4.6) 96 (1.6)
Norway 14 (3.2) 58 (4.1) 83 (3.2) 71 (4.4) 47 (3.9) 27 (3.8) 61 (4.3)
Romania 74 (4.0) r 1 (0.0) 17 (3.4) 5 (1.9) 5 (2.1) 10 (2.6) 14 (3.1)
Russian Federation 91 (2.3) 0 (0.0) 9 (2.3) 1 (0.7) 2 (1.0) 4 (1.4) 4 (2.2)
Scotland 2 (1.3) 96 (1.7) r 81 (4.3) 60 (4.0) 49 (4.9) 58 (5.0) 80 (4.2)
Singapore 9 (2.3) 56 (4.2) 88 (2.7) 78 (2.9) 56 (4.1) 67 (3.4) 55 (4.5)
Slovak Republic 84 (3.0) 0 (0.0) 15 (2.9) 5 (1.8) 1 (0.5) 3 (1.5) 3 (1.5)
Slovenia 32 (3.8) 7 (2.2) 66 (4.0) 64 (3.9) 28 (3.7) 33 (3.8) 33 (4.3)
Sweden 1 (0.6) 89 (2.6) r 91 (2.0) 93 (1.6) 48 (3.5) 46 (2.7) 88 (1.5)
Turkey 82 (3.4) 2 (1.2) 18 (3.3) 9 (2.2) 5 (2.2) 7 (2.5) 11 (1.8)
United States 2 (1.1) 92 (2.3) 93 (2.4) 92 (1.8) 66 (4.1) 60 (4.2) 74 (3.8)
International Avg. 50 (0.5) 29 (0.4) 45 (0.5) 36 (0.5) 21 (0.5) 22 (0.5) 32 (0.5)
Countries
Percentage of Students Whose Teachers Reported
In Classroom Elsewherein School
Computers Not Available
Computers Available
Have InternetAccess
Percentage of Students Whose TeachersReported Instructional Uses
at Least Monthly
Students UseInstructionalSoftware to
DevelopReading Skillsand Strategies
StudentsRead Stories orOther Texts onthe Computer
Students WriteStories or Other
Texts on theComputer
Background data provided by teachers.
( ) Standard errors appear in parentheses. Because results are rounded to the nearest wholenumber, some totals may appear inconsistent.
An “r” indicates data are available for 70-84% of the students. An “s” indicates data are avail-able for 50-69% of the students. An “x” indicates data are available for less than 50% of thestudents.
A dash (–) indicates data are not available. A tilde (~) indicates insufficient data to reportachievement.
ISC 4th GradePIRLS 2001

[212] chapter 6: teachers and reading instruction
Exhibit 6.32: Students’ Reports on Computer Use
Argentina r 62 (2.0) r 33 (1.8) r 28 (2.4) r 29 (1.6)
Belize r 47 (3.6) r 24 (2.4) r 10 (1.6) r 20 (1.5)
Bulgaria 60 (2.1) 21 (1.2) r 10 (1.5) 32 (1.4)
Canada (O,Q) 94 (0.4) 76 (0.8) 69 (1.7) 31 (1.0)
Colombia 54 (3.2) 18 (1.6) 37 (3.4) 19 (1.5)
Cyprus 59 (1.7) 44 (1.6) 15 (1.7) 19 (1.1)
Czech Republic 75 (1.3) 50 (1.4) 18 (1.8) 22 (1.0)
England 97 (0.4) 74 (1.0) 67 (2.7) 29 (1.0)
France 95 (0.5) 60 (1.0) 38 (2.8) 24 (0.9)
Germany 85 (0.6) 66 (0.8) 17 (1.5) 19 (0.7)
Greece 62 (2.0) 37 (1.8) 13 (2.4) 26 (1.2)
Hong Kong, SAR 95 (0.5) 61 (1.3) 68 (2.6) 19 (0.6)
Hungary 77 (1.5) 52 (1.2) 28 (3.1) 23 (1.0)
Iceland 91 (0.5) 69 (0.9) 59 (0.8) 28 (0.9)
Iran, Islamic Rep. of 11 (1.1) 7 (0.8) 1 (0.3) 5 (0.5)
Israel 93 (0.6) 78 (0.8) 59 (2.6) 43 (1.0)
Italy 75 (1.2) 53 (1.0) 24 (2.5) 17 (0.7)
Kuwait r 64 (1.7) s 48 (1.6) s 9 (0.9) s 23 (1.1)
Latvia 58 (1.7) 25 (1.2) 17 (2.3) 20 (0.9)
Lithuania 53 (1.7) 29 (1.3) 7 (1.3) 19 (1.0)
Macedonia, Rep. of 60 (2.1) 32 (1.7) 8 (0.9) 28 (1.4)
Moldova, Rep. of r 21 (1.9) r 6 (0.8) r 5 (1.1) r 7 (0.8)
Morocco 32 (3.1) r 18 (2.1) r 9 (1.7) r 12 (1.6)
Netherlands 93 (0.5) 76 (0.9) 50 (2.9) 24 (0.8)
New Zealand 94 (0.6) 70 (1.2) 59 (2.2) 38 (1.4)
Norway 92 (0.7) 70 (1.0) 22 (2.3) 27 (1.2)
Romania 42 (2.4) 18 (1.5) 13 (2.3) 17 (1.4)
Russian Federation 37 (1.8) 12 (0.7) 6 (1.1) 16 (0.8)
Scotland 95 (0.7) 68 (0.9) 63 (3.0) 34 (1.1)
Singapore 94 (0.4) 70 (0.7) 39 (1.9) 25 (0.8)
Slovak Republic 54 (1.6) 34 (1.2) 5 (0.9) 17 (0.9)
Slovenia 78 (1.1) 58 (1.2) 16 (1.5) 28 (1.2)
Sweden 97 (0.3) 75 (0.7) 35 (2.0) 25 (0.8)
Turkey 44 (3.0) 15 (1.3) 22 (3.4) 18 (1.3)
United States 94 (0.5) 71 (1.2) 70 (2.2) 32 (1.3)
International Avg. 70 (0.3) 46 (0.2) 29 (0.4) 23 (0.2)
At Home At School At SomeOther Place
Countries
Percentage ofStudents WhoReported Ever
Using aComputer
Percentage of Students Who ReportedUsing a Computer at Least Weekly
Background data provided by students.
( ) Standard errors appear in parentheses. Because results are rounded to the nearest wholenumber, some totals may appear inconsistent.
An “r” indicates data are available for 70-84% of the students. An “s” indicates data are avail-able for 50-69% of the students. An “x” indicates data are available for less than 50% of thestudents.
A dash (–) indicates data are not available. A tilde (~) indicates insufficient data to reportachievement.
SOU
RCE:
IEA
Pro
gres
s in
Inte
rnat
iona
l Rea
ding
Lite
racy
Stu
dy (P
IRLS
) 200
1.
ISC 4th GradePIRLS 2001
[213]chapter 6: teachers and reading instruction
What Is the Role of Reading Homework?
According to students’ reports presented in Exhibit 6.33, most students (82%)were given reading for homework at least once a week, and 60 percent at leastthree times a week. When they have reading homework, students reportedspending, on average, just over half an hour on it. Countries where studentsreported the greatest amounts of reading homework included Cyprus, Greece,Lithuania, Moldova, Romania, the Russian Federation, and the Slovak Republic,where more than 80 percent reported having homework three or more times aweek. Students in The Netherlands, one of the highest-performing countries,reported being assigned the least homework – 55 percent of students were inclasses where reading homework was assigned less than once a week or never.
To provide the teacher’s perspective on homework, PIRLS developed anIndex of Reading for Homework that combined the amount of reading home-work teachers reported assigning with the frequency with which they assignedit. Students at the high level of the index were expected to spend more than30 minutes on reading homework at least once a week, those at the low levelno more than 30 minutes less than once a week, and those at the medium levelall other combinations. As shown in Exhibit 6.34, reading homework assign-ment practice varies enormously across the PIRLS countries, from 90 percentof students at the high level in Hungary to just 5 percent in The Netherlands.On average, internationally, 44 percent of students were at the high level, 46percent at the medium, and just 10 percent at the low level.
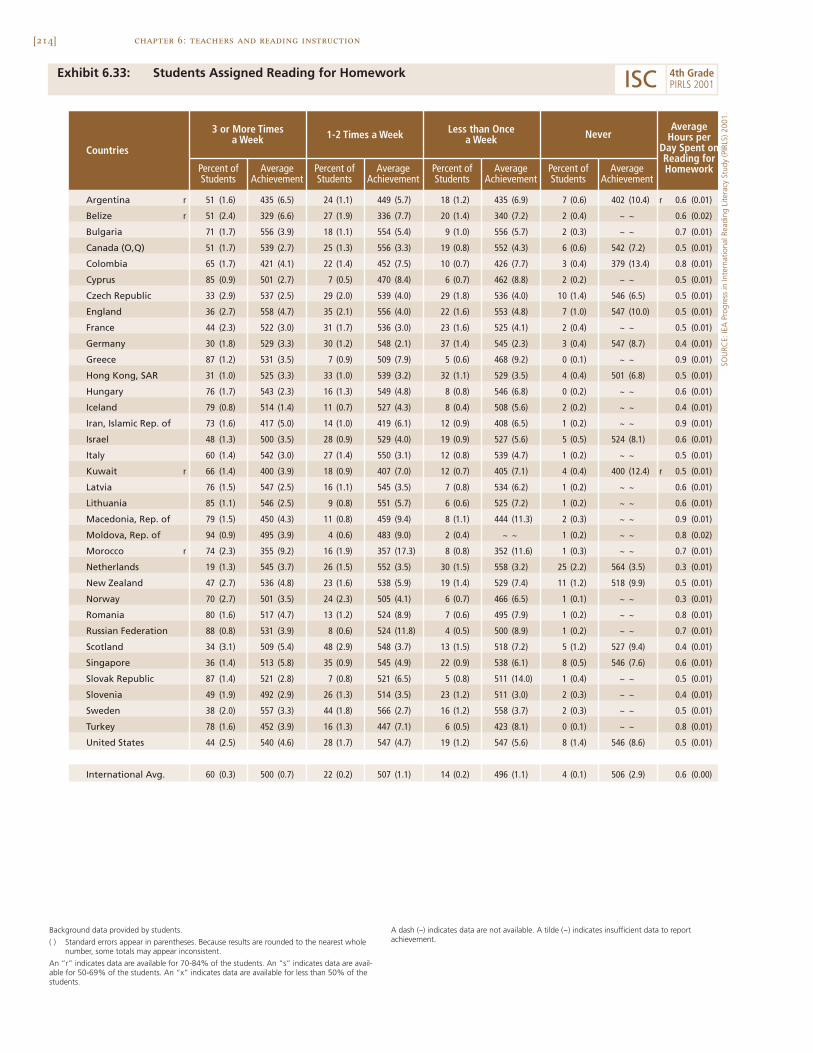
[214] chapter 6: teachers and reading instruction
Exhibit 6.33: Students Assigned Reading for Homework
Argentina r 51 (1.6) 435 (6.5) 24 (1.1) 449 (5.7) 18 (1.2) 435 (6.9) 7 (0.6) 402 (10.4) r 0.6 (0.01)
Belize r 51 (2.4) 329 (6.6) 27 (1.9) 336 (7.7) 20 (1.4) 340 (7.2) 2 (0.4) ~ ~ 0.6 (0.02)
Bulgaria 71 (1.7) 556 (3.9) 18 (1.1) 554 (5.4) 9 (1.0) 556 (5.7) 2 (0.3) ~ ~ 0.7 (0.01)
Canada (O,Q) 51 (1.7) 539 (2.7) 25 (1.3) 556 (3.3) 19 (0.8) 552 (4.3) 6 (0.6) 542 (7.2) 0.5 (0.01)
Colombia 65 (1.7) 421 (4.1) 22 (1.4) 452 (7.5) 10 (0.7) 426 (7.7) 3 (0.4) 379 (13.4) 0.8 (0.01)
Cyprus 85 (0.9) 501 (2.7) 7 (0.5) 470 (8.4) 6 (0.7) 462 (8.8) 2 (0.2) ~ ~ 0.5 (0.01)
Czech Republic 33 (2.9) 537 (2.5) 29 (2.0) 539 (4.0) 29 (1.8) 536 (4.0) 10 (1.4) 546 (6.5) 0.5 (0.01)
England 36 (2.7) 558 (4.7) 35 (2.1) 556 (4.0) 22 (1.6) 553 (4.8) 7 (1.0) 547 (10.0) 0.5 (0.01)
France 44 (2.3) 522 (3.0) 31 (1.7) 536 (3.0) 23 (1.6) 525 (4.1) 2 (0.4) ~ ~ 0.5 (0.01)
Germany 30 (1.8) 529 (3.3) 30 (1.2) 548 (2.1) 37 (1.4) 545 (2.3) 3 (0.4) 547 (8.7) 0.4 (0.01)
Greece 87 (1.2) 531 (3.5) 7 (0.9) 509 (7.9) 5 (0.6) 468 (9.2) 0 (0.1) ~ ~ 0.9 (0.01)
Hong Kong, SAR 31 (1.0) 525 (3.3) 33 (1.0) 539 (3.2) 32 (1.1) 529 (3.5) 4 (0.4) 501 (6.8) 0.5 (0.01)
Hungary 76 (1.7) 543 (2.3) 16 (1.3) 549 (4.8) 8 (0.8) 546 (6.8) 0 (0.2) ~ ~ 0.6 (0.01)
Iceland 79 (0.8) 514 (1.4) 11 (0.7) 527 (4.3) 8 (0.4) 508 (5.6) 2 (0.2) ~ ~ 0.4 (0.01)
Iran, Islamic Rep. of 73 (1.6) 417 (5.0) 14 (1.0) 419 (6.1) 12 (0.9) 408 (6.5) 1 (0.2) ~ ~ 0.9 (0.01)
Israel 48 (1.3) 500 (3.5) 28 (0.9) 529 (4.0) 19 (0.9) 527 (5.6) 5 (0.5) 524 (8.1) 0.6 (0.01)
Italy 60 (1.4) 542 (3.0) 27 (1.4) 550 (3.1) 12 (0.8) 539 (4.7) 1 (0.2) ~ ~ 0.5 (0.01)
Kuwait r 66 (1.4) 400 (3.9) 18 (0.9) 407 (7.0) 12 (0.7) 405 (7.1) 4 (0.4) 400 (12.4) r 0.5 (0.01)
Latvia 76 (1.5) 547 (2.5) 16 (1.1) 545 (3.5) 7 (0.8) 534 (6.2) 1 (0.2) ~ ~ 0.6 (0.01)
Lithuania 85 (1.1) 546 (2.5) 9 (0.8) 551 (5.7) 6 (0.6) 525 (7.2) 1 (0.2) ~ ~ 0.6 (0.01)
Macedonia, Rep. of 79 (1.5) 450 (4.3) 11 (0.8) 459 (9.4) 8 (1.1) 444 (11.3) 2 (0.3) ~ ~ 0.9 (0.01)
Moldova, Rep. of 94 (0.9) 495 (3.9) 4 (0.6) 483 (9.0) 2 (0.4) ~ ~ 1 (0.2) ~ ~ 0.8 (0.02)
Morocco r 74 (2.3) 355 (9.2) 16 (1.9) 357 (17.3) 8 (0.8) 352 (11.6) 1 (0.3) ~ ~ 0.7 (0.01)
Netherlands 19 (1.3) 545 (3.7) 26 (1.5) 552 (3.5) 30 (1.5) 558 (3.2) 25 (2.2) 564 (3.5) 0.3 (0.01)
New Zealand 47 (2.7) 536 (4.8) 23 (1.6) 538 (5.9) 19 (1.4) 529 (7.4) 11 (1.2) 518 (9.9) 0.5 (0.01)
Norway 70 (2.7) 501 (3.5) 24 (2.3) 505 (4.1) 6 (0.7) 466 (6.5) 1 (0.1) ~ ~ 0.3 (0.01)
Romania 80 (1.6) 517 (4.7) 13 (1.2) 524 (8.9) 7 (0.6) 495 (7.9) 1 (0.2) ~ ~ 0.8 (0.01)
Russian Federation 88 (0.8) 531 (3.9) 8 (0.6) 524 (11.8) 4 (0.5) 500 (8.9) 1 (0.2) ~ ~ 0.7 (0.01)
Scotland 34 (3.1) 509 (5.4) 48 (2.9) 548 (3.7) 13 (1.5) 518 (7.2) 5 (1.2) 527 (9.4) 0.4 (0.01)
Singapore 36 (1.4) 513 (5.8) 35 (0.9) 545 (4.9) 22 (0.9) 538 (6.1) 8 (0.5) 546 (7.6) 0.6 (0.01)
Slovak Republic 87 (1.4) 521 (2.8) 7 (0.8) 521 (6.5) 5 (0.8) 511 (14.0) 1 (0.4) ~ ~ 0.5 (0.01)
Slovenia 49 (1.9) 492 (2.9) 26 (1.3) 514 (3.5) 23 (1.2) 511 (3.0) 2 (0.3) ~ ~ 0.4 (0.01)
Sweden 38 (2.0) 557 (3.3) 44 (1.8) 566 (2.7) 16 (1.2) 558 (3.7) 2 (0.3) ~ ~ 0.5 (0.01)
Turkey 78 (1.6) 452 (3.9) 16 (1.3) 447 (7.1) 6 (0.5) 423 (8.1) 0 (0.1) ~ ~ 0.8 (0.01)
United States 44 (2.5) 540 (4.6) 28 (1.7) 547 (4.7) 19 (1.2) 547 (5.6) 8 (1.4) 546 (8.6) 0.5 (0.01)
International Avg. 60 (0.3) 500 (0.7) 22 (0.2) 507 (1.1) 14 (0.2) 496 (1.1) 4 (0.1) 506 (2.9) 0.6 (0.00)
AverageAchievement
3 or More Timesa Week
Percent ofStudents
NeverAverage
Hours perDay Spent onReading forHomework
Countries1-2 Times a Week Less than Once
a Week
AverageAchievement
Percent ofStudents
AverageAchievement
Percent ofStudents
AverageAchievement
Percent ofStudents
Background data provided by students.
( ) Standard errors appear in parentheses. Because results are rounded to the nearest wholenumber, some totals may appear inconsistent.
An “r” indicates data are available for 70-84% of the students. An “s” indicates data are avail-able for 50-69% of the students. An “x” indicates data are available for less than 50% of thestudents.
A dash (–) indicates data are not available. A tilde (~) indicates insufficient data to reportachievement.
SOU
RCE:
IEA
Pro
gres
s in
Inte
rnat
iona
l Rea
ding
Lite
racy
Stu
dy (P
IRLS
) 200
1.
ISC 4th GradePIRLS 2001
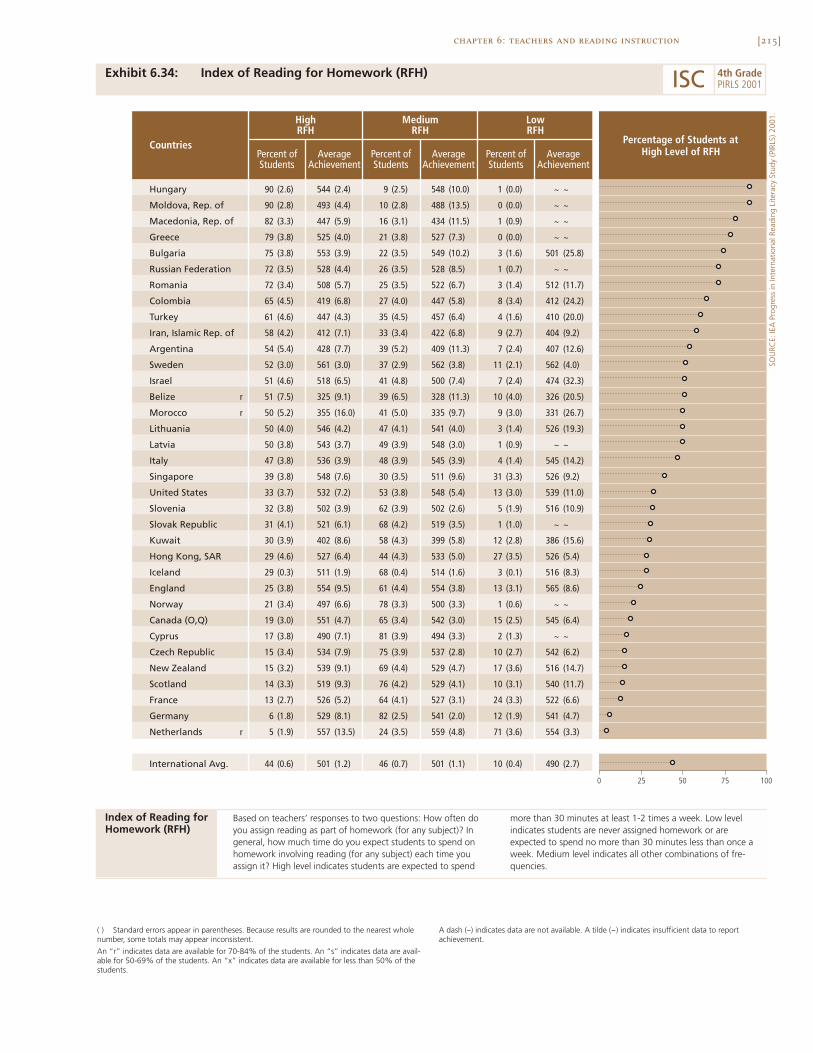
[215]chapter 6: teachers and reading instruction
Exhibit 6.34: Index of Reading for Homework (RFH)
SOU
RCE:
IEA
Pro
gres
s in
Inte
rnat
iona
l Rea
ding
Lite
racy
Stu
dy (P
IRLS
) 200
1.
Hungary 90 (2.6) 544 (2.4) 9 (2.5) 548 (10.0) 1 (0.0) ~ ~
Moldova, Rep. of 90 (2.8) 493 (4.4) 10 (2.8) 488 (13.5) 0 (0.0) ~ ~
Macedonia, Rep. of 82 (3.3) 447 (5.9) 16 (3.1) 434 (11.5) 1 (0.9) ~ ~
Greece 79 (3.8) 525 (4.0) 21 (3.8) 527 (7.3) 0 (0.0) ~ ~
Bulgaria 75 (3.8) 553 (3.9) 22 (3.5) 549 (10.2) 3 (1.6) 501 (25.8)
Russian Federation 72 (3.5) 528 (4.4) 26 (3.5) 528 (8.5) 1 (0.7) ~ ~
Romania 72 (3.4) 508 (5.7) 25 (3.5) 522 (6.7) 3 (1.4) 512 (11.7)
Colombia 65 (4.5) 419 (6.8) 27 (4.0) 447 (5.8) 8 (3.4) 412 (24.2)
Turkey 61 (4.6) 447 (4.3) 35 (4.5) 457 (6.4) 4 (1.6) 410 (20.0)
Iran, Islamic Rep. of 58 (4.2) 412 (7.1) 33 (3.4) 422 (6.8) 9 (2.7) 404 (9.2)
Argentina 54 (5.4) 428 (7.7) 39 (5.2) 409 (11.3) 7 (2.4) 407 (12.6)
Sweden 52 (3.0) 561 (3.0) 37 (2.9) 562 (3.8) 11 (2.1) 562 (4.0)
Israel 51 (4.6) 518 (6.5) 41 (4.8) 500 (7.4) 7 (2.4) 474 (32.3)
Belize r 51 (7.5) 325 (9.1) 39 (6.5) 328 (11.3) 10 (4.0) 326 (20.5)
Morocco r 50 (5.2) 355 (16.0) 41 (5.0) 335 (9.7) 9 (3.0) 331 (26.7)
Lithuania 50 (4.0) 546 (4.2) 47 (4.1) 541 (4.0) 3 (1.4) 526 (19.3)
Latvia 50 (3.8) 543 (3.7) 49 (3.9) 548 (3.0) 1 (0.9) ~ ~
Italy 47 (3.8) 536 (3.9) 48 (3.9) 545 (3.9) 4 (1.4) 545 (14.2)
Singapore 39 (3.8) 548 (7.6) 30 (3.5) 511 (9.6) 31 (3.3) 526 (9.2)
United States 33 (3.7) 532 (7.2) 53 (3.8) 548 (5.4) 13 (3.0) 539 (11.0)
Slovenia 32 (3.8) 502 (3.9) 62 (3.9) 502 (2.6) 5 (1.9) 516 (10.9)
Slovak Republic 31 (4.1) 521 (6.1) 68 (4.2) 519 (3.5) 1 (1.0) ~ ~
Kuwait 30 (3.9) 402 (8.6) 58 (4.3) 399 (5.8) 12 (2.8) 386 (15.6)
Hong Kong, SAR 29 (4.6) 527 (6.4) 44 (4.3) 533 (5.0) 27 (3.5) 526 (5.4)
Iceland 29 (0.3) 511 (1.9) 68 (0.4) 514 (1.6) 3 (0.1) 516 (8.3)
England 25 (3.8) 554 (9.5) 61 (4.4) 554 (3.8) 13 (3.1) 565 (8.6)
Norway 21 (3.4) 497 (6.6) 78 (3.3) 500 (3.3) 1 (0.6) ~ ~
Canada (O,Q) 19 (3.0) 551 (4.7) 65 (3.4) 542 (3.0) 15 (2.5) 545 (6.4)
Cyprus 17 (3.8) 490 (7.1) 81 (3.9) 494 (3.3) 2 (1.3) ~ ~
Czech Republic 15 (3.4) 534 (7.9) 75 (3.9) 537 (2.8) 10 (2.7) 542 (6.2)
New Zealand 15 (3.2) 539 (9.1) 69 (4.4) 529 (4.7) 17 (3.6) 516 (14.7)
Scotland 14 (3.3) 519 (9.3) 76 (4.2) 529 (4.1) 10 (3.1) 540 (11.7)
France 13 (2.7) 526 (5.2) 64 (4.1) 527 (3.1) 24 (3.3) 522 (6.6)
Germany 6 (1.8) 529 (8.1) 82 (2.5) 541 (2.0) 12 (1.9) 541 (4.7)
Netherlands r 5 (1.9) 557 (13.5) 24 (3.5) 559 (4.8) 71 (3.6) 554 (3.3)
International Avg. 44 (0.6) 501 (1.2) 46 (0.7) 501 (1.1) 10 (0.4) 490 (2.7)
Percentage of Students atHigh Level of RFH
HighRFH
MediumRFH
Countries
LowRFH
AverageAchievement
Percent ofStudents
AverageAchievement
Percent ofStudents
AverageAchievement
Percent ofStudents
0 50 7525 100
( ) Standard errors appear in parentheses. Because results are rounded to the nearest wholenumber, some totals may appear inconsistent.
An “r” indicates data are available for 70-84% of the students. An “s” indicates data are avail-able for 50-69% of the students. An “x” indicates data are available for less than 50% of thestudents.
A dash (–) indicates data are not available. A tilde (~) indicates insufficient data to reportachievement.
ISC 4th GradePIRLS 2001
Index of Reading for Homework (RFH)
Based on teachers’ responses to two questions: How often doyou assign reading as part of homework (for any subject)? Ingeneral, how much time do you expect students to spend onhomework involving reading (for any subject) each time youassign it? High level indicates students are expected to spend
more than 30 minutes at least 1-2 times a week. Low levelindicates students are never assigned homework or areexpected to spend no more than 30 minutes less than once aweek. Medium level indicates all other combinations of fre-quencies.
[216]
How Do Teachers Assess Reading Progress?
Teachers have a range of options available to them when it comes to moni-toring students’ progress in reading, including a variety of classroom, stan-dardized and diagnostic tests, external examinations, and other less formalmethods such as portfolios of students’ work, and observation of performancein class. As may be seen from Exhibit 6.35, teachers relied most on their ownprofessional opinion when monitoring student progress. On average, 70percent of students were in classes where teachers reported placing majoremphasis on professional opinion, compared to 55 percent where the empha-sis was on classroom tests, 39 percent on diagnostic tests, 23 percent onnational or regional examinations, and 16 percent on standardized tests. InCyprus, Greece, Scotland, and Sweden, more than 90 percent of studentswere taught by teachers placing major emphasis on professional opinion formonitoring progress.
Assembling samples of a student’s work into a collection or portfoliohas become a popular approach to tracking student progress in recent years.Portfolios have the advantage that they serve as a positive record of thestudent’s accomplishments that is readily understood by the student andeasily communicated to parents and to other professionals. Exhibit 6.36 showsthat, internationally, portfolios were a popular supplementary source forassessing student progress in reading, with more than half the students (55%),on average, taught by teachers that used portfolios in this way. In addition, 25percent of students had teachers that reported using portfolios as a majorresource in assessing their students. Teachers in France relied particularly onportfolios for assessment – 72 percent of French students had teachers usingportfolios as a major source of information.
Exhibit 6.37 presents teachers’ reports on their use of a range of otherapproaches for assessing fourth-grade student performance in reading. Oralquestioning of students and listening to students read aloud were most fre-quently reported, with 82 percent and 79 percent of students, respectively,in classes where teachers reported using these methods at least weekly. Theemphasis on oral assessment was particularly strong in Bulgaria, Cyprus,Greece, Iran, Moldova, Morocco, Romania, the Russian Federation, Scotland,
chapter 6: teachers and reading instruction
[217]chapter 6: teachers and reading instruction
and Turkey, where essentially all students were in classes where it was atleast a weekly occurrence.
Next in popularity among teachers for assessment were short answerwritten questions on the material read, and students giving an oral summaryor report of what they have read. More than half the students, internation-ally, on average, had teachers reporting that they used these techniques atleast weekly. Teachers reported using multiple-choice questions and para-graph-length written responses about what they had read for 40 percent and30 percent of students, respectively.
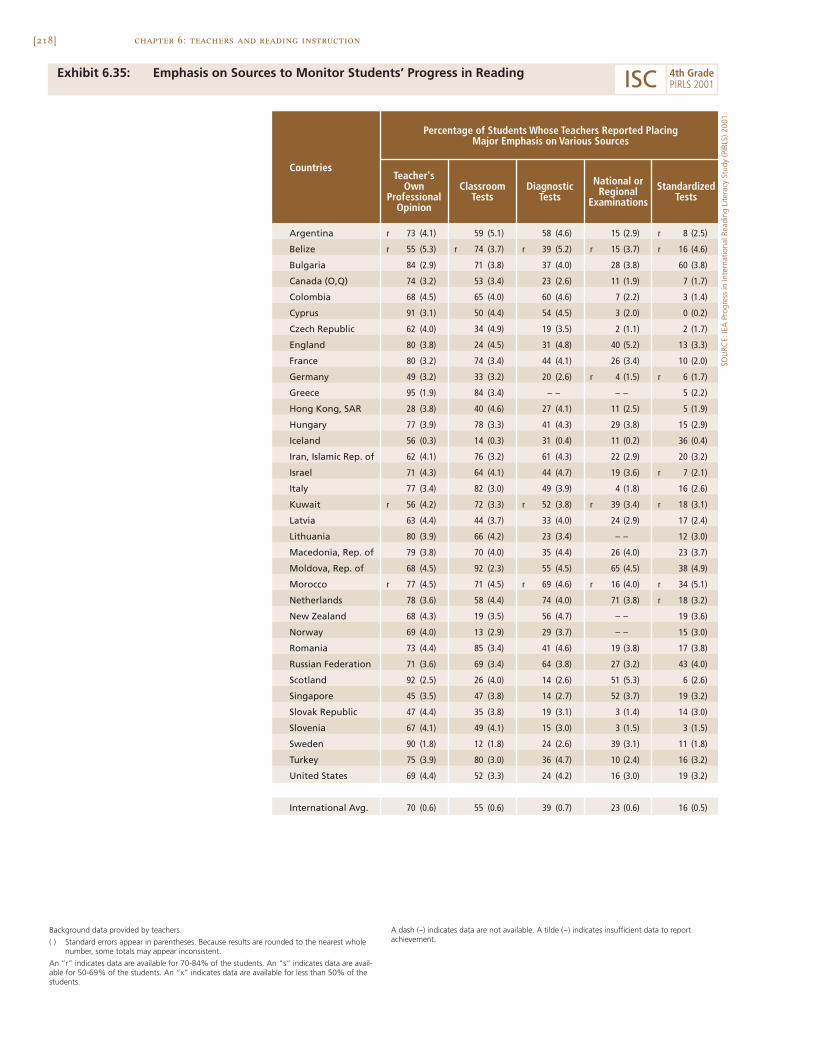
[218] chapter 6: teachers and reading instruction
Exhibit 6.35: Emphasis on Sources to Monitor Students’ Progress in Reading
Argentina r 73 (4.1) 59 (5.1) 58 (4.6) 15 (2.9) r 8 (2.5)
Belize r 55 (5.3) r 74 (3.7) r 39 (5.2) r 15 (3.7) r 16 (4.6)
Bulgaria 84 (2.9) 71 (3.8) 37 (4.0) 28 (3.8) 60 (3.8)
Canada (O,Q) 74 (3.2) 53 (3.4) 23 (2.6) 11 (1.9) 7 (1.7)
Colombia 68 (4.5) 65 (4.0) 60 (4.6) 7 (2.2) 3 (1.4)
Cyprus 91 (3.1) 50 (4.4) 54 (4.5) 3 (2.0) 0 (0.2)
Czech Republic 62 (4.0) 34 (4.9) 19 (3.5) 2 (1.1) 2 (1.7)
England 80 (3.8) 24 (4.5) 31 (4.8) 40 (5.2) 13 (3.3)
France 80 (3.2) 74 (3.4) 44 (4.1) 26 (3.4) 10 (2.0)
Germany 49 (3.2) 33 (3.2) 20 (2.6) r 4 (1.5) r 6 (1.7)
Greece 95 (1.9) 84 (3.4) – – – – 5 (2.2)
Hong Kong, SAR 28 (3.8) 40 (4.6) 27 (4.1) 11 (2.5) 5 (1.9)
Hungary 77 (3.9) 78 (3.3) 41 (4.3) 29 (3.8) 15 (2.9)
Iceland 56 (0.3) 14 (0.3) 31 (0.4) 11 (0.2) 36 (0.4)
Iran, Islamic Rep. of 62 (4.1) 76 (3.2) 61 (4.3) 22 (2.9) 20 (3.2)
Israel 71 (4.3) 64 (4.1) 44 (4.7) 19 (3.6) r 7 (2.1)
Italy 77 (3.4) 82 (3.0) 49 (3.9) 4 (1.8) 16 (2.6)
Kuwait r 56 (4.2) 72 (3.3) r 52 (3.8) r 39 (3.4) r 18 (3.1)
Latvia 63 (4.4) 44 (3.7) 33 (4.0) 24 (2.9) 17 (2.4)
Lithuania 80 (3.9) 66 (4.2) 23 (3.4) – – 12 (3.0)
Macedonia, Rep. of 79 (3.8) 70 (4.0) 35 (4.4) 26 (4.0) 23 (3.7)
Moldova, Rep. of 68 (4.5) 92 (2.3) 55 (4.5) 65 (4.5) 38 (4.9)
Morocco r 77 (4.5) 71 (4.5) r 69 (4.6) r 16 (4.0) r 34 (5.1)
Netherlands 78 (3.6) 58 (4.4) 74 (4.0) 71 (3.8) r 18 (3.2)
New Zealand 68 (4.3) 19 (3.5) 56 (4.7) – – 19 (3.6)
Norway 69 (4.0) 13 (2.9) 29 (3.7) – – 15 (3.0)
Romania 73 (4.4) 85 (3.4) 41 (4.6) 19 (3.8) 17 (3.8)
Russian Federation 71 (3.6) 69 (3.4) 64 (3.8) 27 (3.2) 43 (4.0)
Scotland 92 (2.5) 26 (4.0) 14 (2.6) 51 (5.3) 6 (2.6)
Singapore 45 (3.5) 47 (3.8) 14 (2.7) 52 (3.7) 19 (3.2)
Slovak Republic 47 (4.4) 35 (3.8) 19 (3.1) 3 (1.4) 14 (3.0)
Slovenia 67 (4.1) 49 (4.1) 15 (3.0) 3 (1.5) 3 (1.5)
Sweden 90 (1.8) 12 (1.8) 24 (2.6) 39 (3.1) 11 (1.8)
Turkey 75 (3.9) 80 (3.0) 36 (4.7) 10 (2.4) 16 (3.2)
United States 69 (4.4) 52 (3.3) 24 (4.2) 16 (3.0) 19 (3.2)
International Avg. 70 (0.6) 55 (0.6) 39 (0.7) 23 (0.6) 16 (0.5)
Countries
Percentage of Students Whose Teachers Reported PlacingMajor Emphasis on Various Sources
StandardizedTests
Teacher'sOwn
ProfessionalOpinion
ClassroomTests
DiagnosticTests
National orRegional
Examinations
Background data provided by teachers.
( ) Standard errors appear in parentheses. Because results are rounded to the nearest wholenumber, some totals may appear inconsistent.
An “r” indicates data are available for 70-84% of the students. An “s” indicates data are avail-able for 50-69% of the students. An “x” indicates data are available for less than 50% of thestudents.
A dash (–) indicates data are not available. A tilde (~) indicates insufficient data to reportachievement.
SOU
RCE:
IEA
Pro
gres
s in
Inte
rnat
iona
l Rea
ding
Lite
racy
Stu
dy (P
IRLS
) 200
1.
ISC 4th GradePIRLS 2001
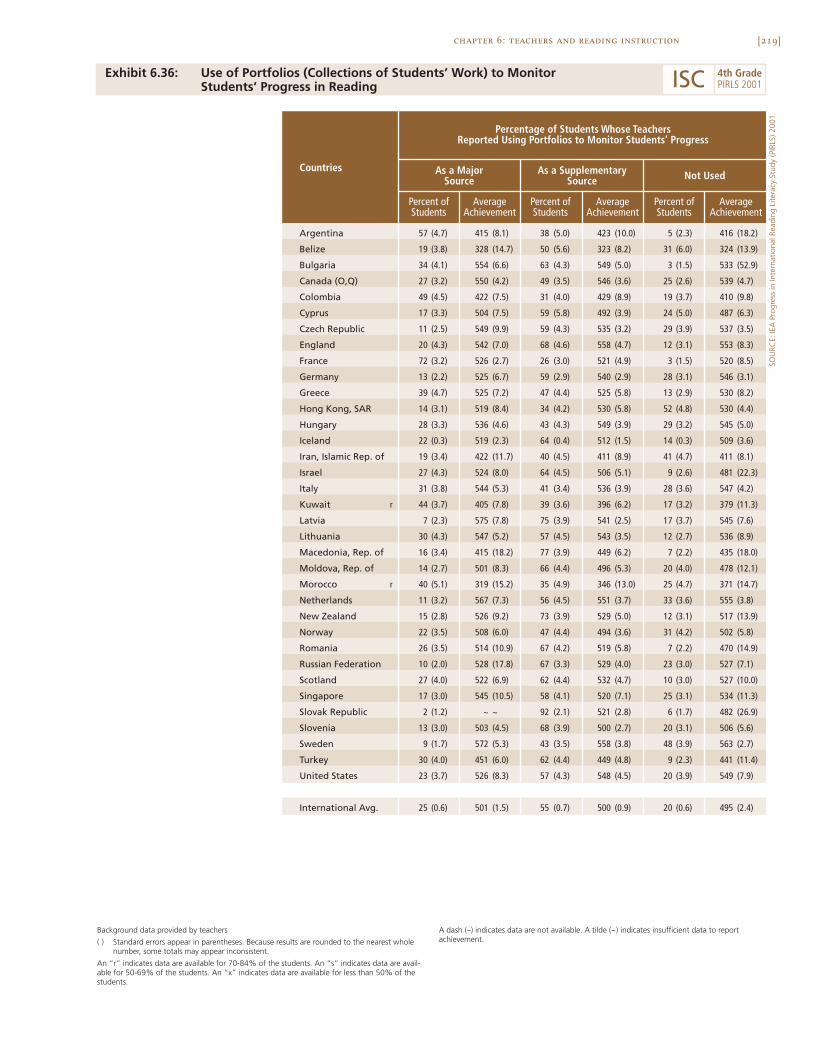
[219]chapter 6: teachers and reading instruction
Exhibit 6.36: Use of Portfolios (Collections of Students’ Work) to MonitorStudents’ Progress in Reading
SOU
RCE:
IEA
Pro
gres
s in
Inte
rnat
iona
l Rea
ding
Lite
racy
Stu
dy (P
IRLS
) 200
1.
Argentina 57 (4.7) 415 (8.1) 38 (5.0) 423 (10.0) 5 (2.3) 416 (18.2)
Belize 19 (3.8) 328 (14.7) 50 (5.6) 323 (8.2) 31 (6.0) 324 (13.9)
Bulgaria 34 (4.1) 554 (6.6) 63 (4.3) 549 (5.0) 3 (1.5) 533 (52.9)
Canada (O,Q) 27 (3.2) 550 (4.2) 49 (3.5) 546 (3.6) 25 (2.6) 539 (4.7)
Colombia 49 (4.5) 422 (7.5) 31 (4.0) 429 (8.9) 19 (3.7) 410 (9.8)
Cyprus 17 (3.3) 504 (7.5) 59 (5.8) 492 (3.9) 24 (5.0) 487 (6.3)
Czech Republic 11 (2.5) 549 (9.9) 59 (4.3) 535 (3.2) 29 (3.9) 537 (3.5)
England 20 (4.3) 542 (7.0) 68 (4.6) 558 (4.7) 12 (3.1) 553 (8.3)
France 72 (3.2) 526 (2.7) 26 (3.0) 521 (4.9) 3 (1.5) 520 (8.5)
Germany 13 (2.2) 525 (6.7) 59 (2.9) 540 (2.9) 28 (3.1) 546 (3.1)
Greece 39 (4.7) 525 (7.2) 47 (4.4) 525 (5.8) 13 (2.9) 530 (8.2)
Hong Kong, SAR 14 (3.1) 519 (8.4) 34 (4.2) 530 (5.8) 52 (4.8) 530 (4.4)
Hungary 28 (3.3) 536 (4.6) 43 (4.3) 549 (3.9) 29 (3.2) 545 (5.0)
Iceland 22 (0.3) 519 (2.3) 64 (0.4) 512 (1.5) 14 (0.3) 509 (3.6)
Iran, Islamic Rep. of 19 (3.4) 422 (11.7) 40 (4.5) 411 (8.9) 41 (4.7) 411 (8.1)
Israel 27 (4.3) 524 (8.0) 64 (4.5) 506 (5.1) 9 (2.6) 481 (22.3)
Italy 31 (3.8) 544 (5.3) 41 (3.4) 536 (3.9) 28 (3.6) 547 (4.2)
Kuwait r 44 (3.7) 405 (7.8) 39 (3.6) 396 (6.2) 17 (3.2) 379 (11.3)
Latvia 7 (2.3) 575 (7.8) 75 (3.9) 541 (2.5) 17 (3.7) 545 (7.6)
Lithuania 30 (4.3) 547 (5.2) 57 (4.5) 543 (3.5) 12 (2.7) 536 (8.9)
Macedonia, Rep. of 16 (3.4) 415 (18.2) 77 (3.9) 449 (6.2) 7 (2.2) 435 (18.0)
Moldova, Rep. of 14 (2.7) 501 (8.3) 66 (4.4) 496 (5.3) 20 (4.0) 478 (12.1)
Morocco r 40 (5.1) 319 (15.2) 35 (4.9) 346 (13.0) 25 (4.7) 371 (14.7)
Netherlands 11 (3.2) 567 (7.3) 56 (4.5) 551 (3.7) 33 (3.6) 555 (3.8)
New Zealand 15 (2.8) 526 (9.2) 73 (3.9) 529 (5.0) 12 (3.1) 517 (13.9)
Norway 22 (3.5) 508 (6.0) 47 (4.4) 494 (3.6) 31 (4.2) 502 (5.8)
Romania 26 (3.5) 514 (10.9) 67 (4.2) 519 (5.8) 7 (2.2) 470 (14.9)
Russian Federation 10 (2.0) 528 (17.8) 67 (3.3) 529 (4.0) 23 (3.0) 527 (7.1)
Scotland 27 (4.0) 522 (6.9) 62 (4.4) 532 (4.7) 10 (3.0) 527 (10.0)
Singapore 17 (3.0) 545 (10.5) 58 (4.1) 520 (7.1) 25 (3.1) 534 (11.3)
Slovak Republic 2 (1.2) ~ ~ 92 (2.1) 521 (2.8) 6 (1.7) 482 (26.9)
Slovenia 13 (3.0) 503 (4.5) 68 (3.9) 500 (2.7) 20 (3.1) 506 (5.6)
Sweden 9 (1.7) 572 (5.3) 43 (3.5) 558 (3.8) 48 (3.9) 563 (2.7)
Turkey 30 (4.0) 451 (6.0) 62 (4.4) 449 (4.8) 9 (2.3) 441 (11.4)
United States 23 (3.7) 526 (8.3) 57 (4.3) 548 (4.5) 20 (3.9) 549 (7.9)
International Avg. 25 (0.6) 501 (1.5) 55 (0.7) 500 (0.9) 20 (0.6) 495 (2.4)
AverageAchievement
Countries As a MajorSource
As a SupplementarySource
Percentage of Students Whose TeachersReported Using Portfolios to Monitor Students’ Progress
Not Used
Percent ofStudents
AverageAchievement
Percent ofStudents
AverageAchievement
Percent ofStudents
Background data provided by teachers
( ) Standard errors appear in parentheses. Because results are rounded to the nearest wholenumber, some totals may appear inconsistent.
An “r” indicates data are available for 70-84% of the students. An “s” indicates data are avail-able for 50-69% of the students. An “x” indicates data are available for less than 50% of thestudents.
A dash (–) indicates data are not available. A tilde (~) indicates insufficient data to reportachievement.
ISC 4th GradePIRLS 2001
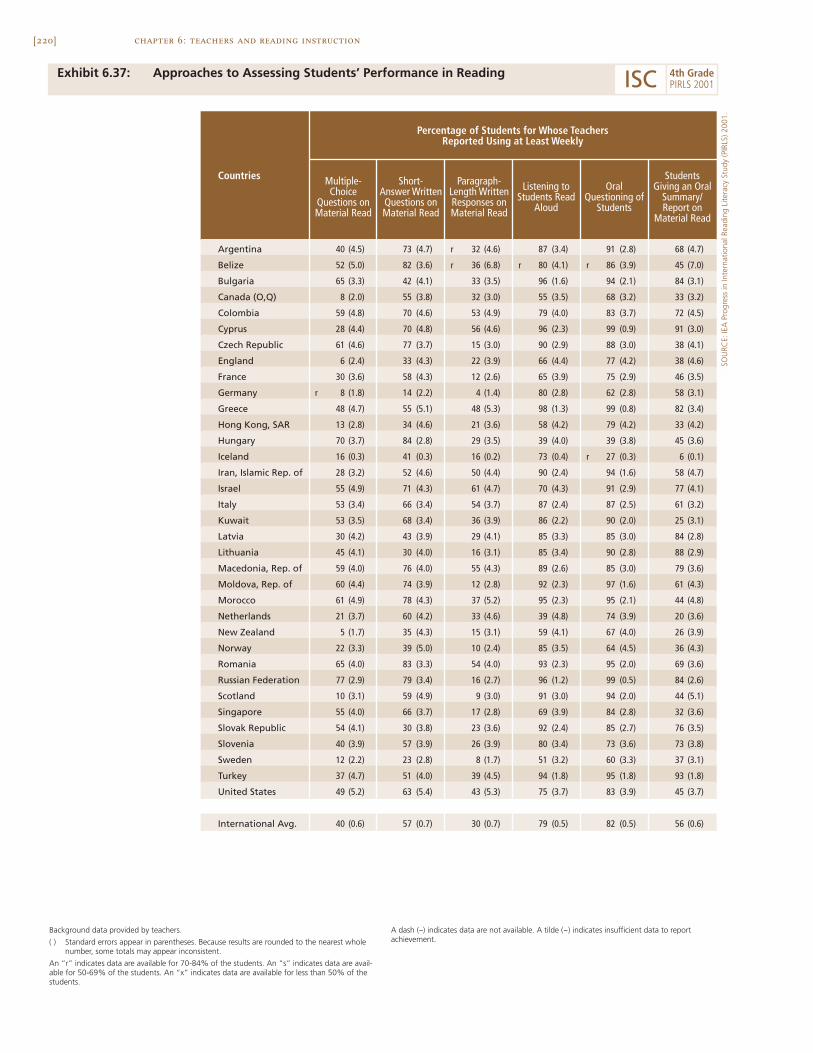
[220] chapter 6: teachers and reading instruction
Exhibit 6.37: Approaches to Assessing Students’ Performance in Reading
Argentina 40 (4.5) 73 (4.7) r 32 (4.6) 87 (3.4) 91 (2.8) 68 (4.7)
Belize 52 (5.0) 82 (3.6) r 36 (6.8) r 80 (4.1) r 86 (3.9) 45 (7.0)
Bulgaria 65 (3.3) 42 (4.1) 33 (3.5) 96 (1.6) 94 (2.1) 84 (3.1)
Canada (O,Q) 8 (2.0) 55 (3.8) 32 (3.0) 55 (3.5) 68 (3.2) 33 (3.2)
Colombia 59 (4.8) 70 (4.6) 53 (4.9) 79 (4.0) 83 (3.7) 72 (4.5)
Cyprus 28 (4.4) 70 (4.8) 56 (4.6) 96 (2.3) 99 (0.9) 91 (3.0)
Czech Republic 61 (4.6) 77 (3.7) 15 (3.0) 90 (2.9) 88 (3.0) 38 (4.1)
England 6 (2.4) 33 (4.3) 22 (3.9) 66 (4.4) 77 (4.2) 38 (4.6)
France 30 (3.6) 58 (4.3) 12 (2.6) 65 (3.9) 75 (2.9) 46 (3.5)
Germany r 8 (1.8) 14 (2.2) 4 (1.4) 80 (2.8) 62 (2.8) 58 (3.1)
Greece 48 (4.7) 55 (5.1) 48 (5.3) 98 (1.3) 99 (0.8) 82 (3.4)
Hong Kong, SAR 13 (2.8) 34 (4.6) 21 (3.6) 58 (4.2) 79 (4.2) 33 (4.2)
Hungary 70 (3.7) 84 (2.8) 29 (3.5) 39 (4.0) 39 (3.8) 45 (3.6)
Iceland 16 (0.3) 41 (0.3) 16 (0.2) 73 (0.4) r 27 (0.3) 6 (0.1)
Iran, Islamic Rep. of 28 (3.2) 52 (4.6) 50 (4.4) 90 (2.4) 94 (1.6) 58 (4.7)
Israel 55 (4.9) 71 (4.3) 61 (4.7) 70 (4.3) 91 (2.9) 77 (4.1)
Italy 53 (3.4) 66 (3.4) 54 (3.7) 87 (2.4) 87 (2.5) 61 (3.2)
Kuwait 53 (3.5) 68 (3.4) 36 (3.9) 86 (2.2) 90 (2.0) 25 (3.1)
Latvia 30 (4.2) 43 (3.9) 29 (4.1) 85 (3.3) 85 (3.0) 84 (2.8)
Lithuania 45 (4.1) 30 (4.0) 16 (3.1) 85 (3.4) 90 (2.8) 88 (2.9)
Macedonia, Rep. of 59 (4.0) 76 (4.0) 55 (4.3) 89 (2.6) 85 (3.0) 79 (3.6)
Moldova, Rep. of 60 (4.4) 74 (3.9) 12 (2.8) 92 (2.3) 97 (1.6) 61 (4.3)
Morocco 61 (4.9) 78 (4.3) 37 (5.2) 95 (2.3) 95 (2.1) 44 (4.8)
Netherlands 21 (3.7) 60 (4.2) 33 (4.6) 39 (4.8) 74 (3.9) 20 (3.6)
New Zealand 5 (1.7) 35 (4.3) 15 (3.1) 59 (4.1) 67 (4.0) 26 (3.9)
Norway 22 (3.3) 39 (5.0) 10 (2.4) 85 (3.5) 64 (4.5) 36 (4.3)
Romania 65 (4.0) 83 (3.3) 54 (4.0) 93 (2.3) 95 (2.0) 69 (3.6)
Russian Federation 77 (2.9) 79 (3.4) 16 (2.7) 96 (1.2) 99 (0.5) 84 (2.6)
Scotland 10 (3.1) 59 (4.9) 9 (3.0) 91 (3.0) 94 (2.0) 44 (5.1)
Singapore 55 (4.0) 66 (3.7) 17 (2.8) 69 (3.9) 84 (2.8) 32 (3.6)
Slovak Republic 54 (4.1) 30 (3.8) 23 (3.6) 92 (2.4) 85 (2.7) 76 (3.5)
Slovenia 40 (3.9) 57 (3.9) 26 (3.9) 80 (3.4) 73 (3.6) 73 (3.8)
Sweden 12 (2.2) 23 (2.8) 8 (1.7) 51 (3.2) 60 (3.3) 37 (3.1)
Turkey 37 (4.7) 51 (4.0) 39 (4.5) 94 (1.8) 95 (1.8) 93 (1.8)
United States 49 (5.2) 63 (5.4) 43 (5.3) 75 (3.7) 83 (3.9) 45 (3.7)
International Avg. 40 (0.6) 57 (0.7) 30 (0.7) 79 (0.5) 82 (0.5) 56 (0.6)
Percentage of Students for Whose TeachersReported Using at Least Weekly
Countries Multiple-Choice
Questions onMaterial Read
Short-Answer WrittenQuestions onMaterial Read
Paragraph-Length WrittenResponses onMaterial Read
Listening toStudents Read
Aloud
OralQuestioning of
Students
StudentsGiving an Oral
Summary/Report on
Material Read
Background data provided by teachers.
( ) Standard errors appear in parentheses. Because results are rounded to the nearest wholenumber, some totals may appear inconsistent.
An “r” indicates data are available for 70-84% of the students. An “s” indicates data are avail-able for 50-69% of the students. An “x” indicates data are available for less than 50% of thestudents.
A dash (–) indicates data are not available. A tilde (~) indicates insufficient data to reportachievement.
SOU
RCE:
IEA
Pro
gres
s in
Inte
rnat
iona
l Rea
ding
Lite
racy
Stu
dy (P
IRLS
) 200
1.
ISC 4th GradePIRLS 2001

[221]chapter 6: teachers and reading instruction
7

[223]
Chapter 7School Contexts
While the home environment provides enrichment
opportunities and support for literacy, the school
environment is the primary setting for formal
learning and educational activities. School
characteristics vary with regard to demographic
factors such as school location and composition
of the student body. These factors contribute to the
general school environment and influence school
policies and practices.
[224]
What Are the Schools’ Demographic Characteristics?
Percentages of students in schools characterized by principals as urban, sub-urban, or rural are shown in Exhibit 7.1. On average, internationally, nearly half(46%) the students attended urban schools, with at least 70 percent of stu-dents in Argentina, Colombia, Italy, Lithuania, and Singapore enrolled in suchschools. One-quarter of students internationally attended suburban schools,and 29 percent attended rural schools. Two-thirds or more of the students inKuwait and Sweden were enrolled in suburban schools, and about half ormore of the students in Belize, Germany, Moldova, The Netherlands, Norway,and Romania were in rural schools. In most countries, reading achievement ishighest for those students in urban schools, lower in suburban schools, andeven lower in rural schools. However, some countries exhibit different pat-terns in achievement. Average reading achievement in Argentina, Morocco,New Zealand, and Romania was higher for students in urban or rural schoolsthan for those in suburban schools, whereas achievement in Canada (O,Q),Israel, Norway, the Russian Federation, and the United States was highest forstudents in suburban schools versus those in urban or rural schools.
Exhibit 7.2 presents principals’ reports about the economic composi-tion of their schools’ student populations. Internationally, one-third of thestudents, on average, attended schools where less than 10 percent of the studentbody came from economically disadvantaged homes; more than half attendedschools where less than 25 percent of students were from disadvantaged homes.In only four countries – Argentina, Colombia, Morocco, and Turkey – weremore than half the students enrolled in schools where more than 50 percentof students came from disadvantaged homes.
On average, internationally, average achievement for students in schoolswith few students from economically disadvantaged homes was 40 scale-scorepoints greater than that for students attending schools with more than halftheir student populations from disadvantaged homes (518 vs. 478). The rangeof this achievement difference varies greatly within countries. For example,differences in average achievement scores between students in schools withthe fewest economically disadvantaged students and students in those schoolswith the majority range from less than 10 points in Kuwait, Moldova, Romania,
chapter 7: school contexts
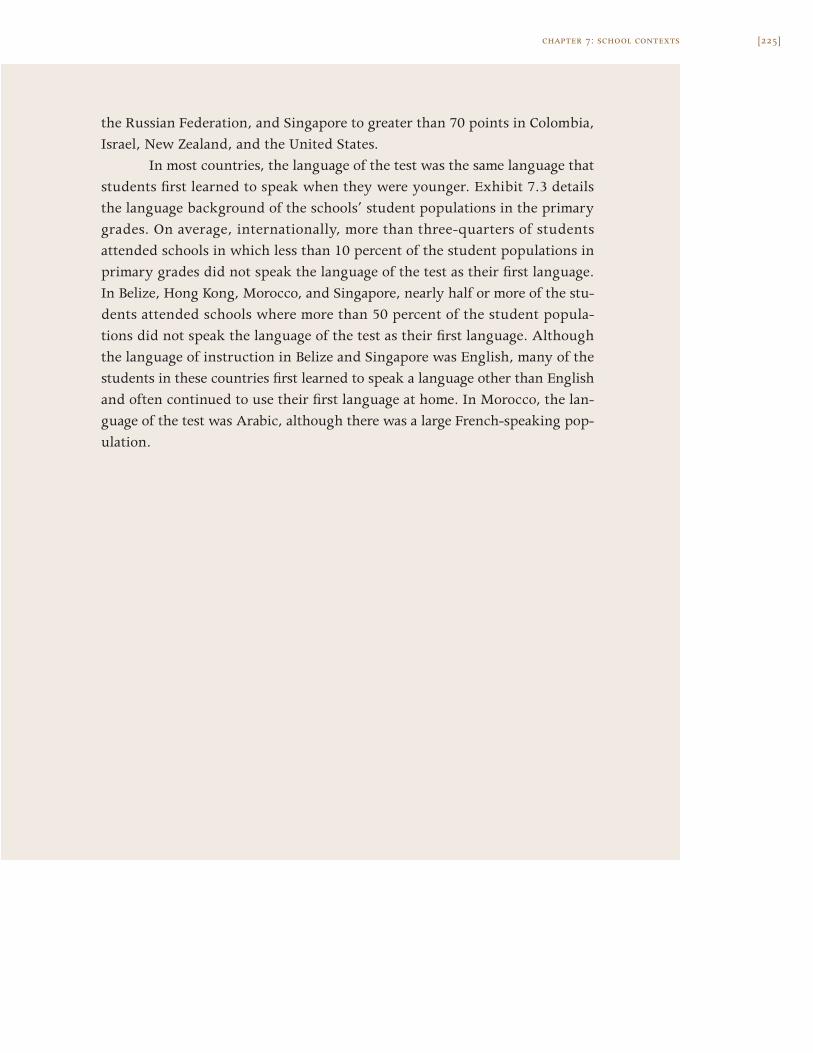
[225]chapter 7: school contexts
the Russian Federation, and Singapore to greater than 70 points in Colombia,Israel, New Zealand, and the United States.
In most countries, the language of the test was the same language thatstudents first learned to speak when they were younger. Exhibit 7.3 detailsthe language background of the schools’ student populations in the primarygrades. On average, internationally, more than three-quarters of studentsattended schools in which less than 10 percent of the student populations inprimary grades did not speak the language of the test as their first language.In Belize, Hong Kong, Morocco, and Singapore, nearly half or more of the stu-dents attended schools where more than 50 percent of the student popula-tions did not speak the language of the test as their first language. Althoughthe language of instruction in Belize and Singapore was English, many of thestudents in these countries first learned to speak a language other than Englishand often continued to use their first language at home. In Morocco, the lan-guage of the test was Arabic, although there was a large French-speaking pop-ulation.
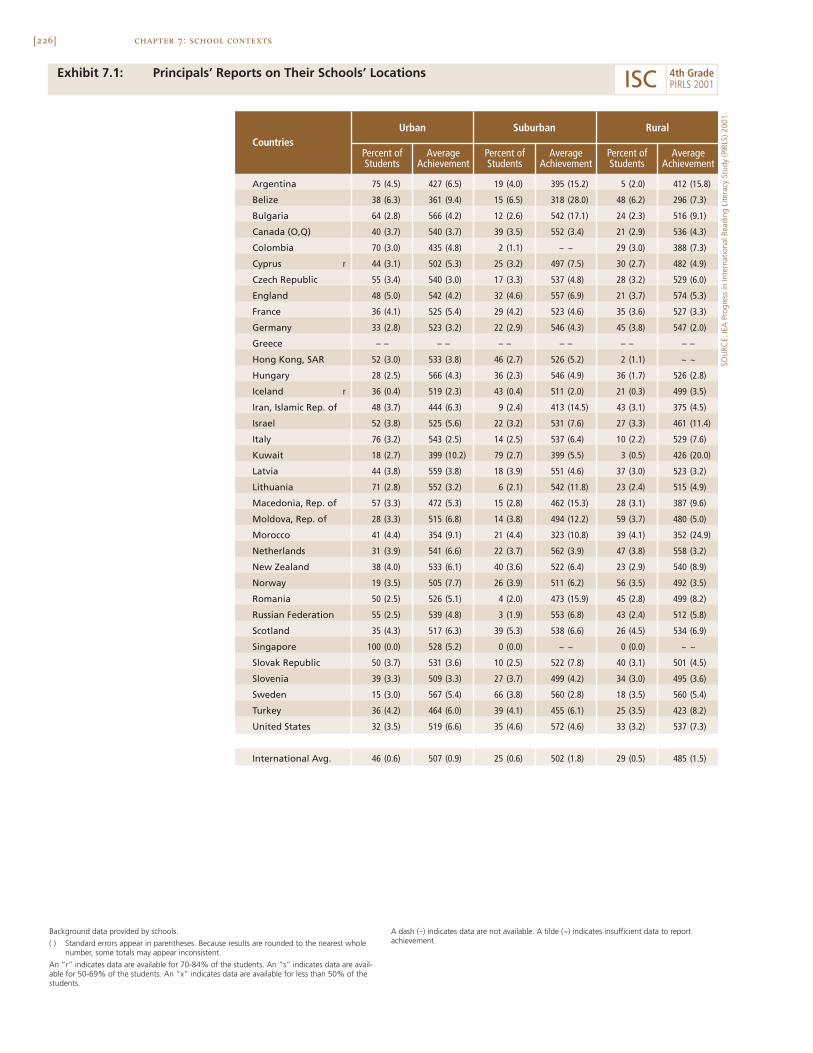
[226] chapter 7: school contexts
Exhibit 7.1: Principals’ Reports on Their Schools’ Locations
Argentina 75 (4.5) 427 (6.5) 19 (4.0) 395 (15.2) 5 (2.0) 412 (15.8)
Belize 38 (6.3) 361 (9.4) 15 (6.5) 318 (28.0) 48 (6.2) 296 (7.3)
Bulgaria 64 (2.8) 566 (4.2) 12 (2.6) 542 (17.1) 24 (2.3) 516 (9.1)
Canada (O,Q) 40 (3.7) 540 (3.7) 39 (3.5) 552 (3.4) 21 (2.9) 536 (4.3)
Colombia 70 (3.0) 435 (4.8) 2 (1.1) ~ ~ 29 (3.0) 388 (7.3)
Cyprus r 44 (3.1) 502 (5.3) 25 (3.2) 497 (7.5) 30 (2.7) 482 (4.9)
Czech Republic 55 (3.4) 540 (3.0) 17 (3.3) 537 (4.8) 28 (3.2) 529 (6.0)
England 48 (5.0) 542 (4.2) 32 (4.6) 557 (6.9) 21 (3.7) 574 (5.3)
France 36 (4.1) 525 (5.4) 29 (4.2) 523 (4.6) 35 (3.6) 527 (3.3)
Germany 33 (2.8) 523 (3.2) 22 (2.9) 546 (4.3) 45 (3.8) 547 (2.0)
Greece – – – – – – – – – – – –
Hong Kong, SAR 52 (3.0) 533 (3.8) 46 (2.7) 526 (5.2) 2 (1.1) ~ ~
Hungary 28 (2.5) 566 (4.3) 36 (2.3) 546 (4.9) 36 (1.7) 526 (2.8)
Iceland r 36 (0.4) 519 (2.3) 43 (0.4) 511 (2.0) 21 (0.3) 499 (3.5)
Iran, Islamic Rep. of 48 (3.7) 444 (6.3) 9 (2.4) 413 (14.5) 43 (3.1) 375 (4.5)
Israel 52 (3.8) 525 (5.6) 22 (3.2) 531 (7.6) 27 (3.3) 461 (11.4)
Italy 76 (3.2) 543 (2.5) 14 (2.5) 537 (6.4) 10 (2.2) 529 (7.6)
Kuwait 18 (2.7) 399 (10.2) 79 (2.7) 399 (5.5) 3 (0.5) 426 (20.0)
Latvia 44 (3.8) 559 (3.8) 18 (3.9) 551 (4.6) 37 (3.0) 523 (3.2)
Lithuania 71 (2.8) 552 (3.2) 6 (2.1) 542 (11.8) 23 (2.4) 515 (4.9)
Macedonia, Rep. of 57 (3.3) 472 (5.3) 15 (2.8) 462 (15.3) 28 (3.1) 387 (9.6)
Moldova, Rep. of 28 (3.3) 515 (6.8) 14 (3.8) 494 (12.2) 59 (3.7) 480 (5.0)
Morocco 41 (4.4) 354 (9.1) 21 (4.4) 323 (10.8) 39 (4.1) 352 (24.9)
Netherlands 31 (3.9) 541 (6.6) 22 (3.7) 562 (3.9) 47 (3.8) 558 (3.2)
New Zealand 38 (4.0) 533 (6.1) 40 (3.6) 522 (6.4) 23 (2.9) 540 (8.9)
Norway 19 (3.5) 505 (7.7) 26 (3.9) 511 (6.2) 56 (3.5) 492 (3.5)
Romania 50 (2.5) 526 (5.1) 4 (2.0) 473 (15.9) 45 (2.8) 499 (8.2)
Russian Federation 55 (2.5) 539 (4.8) 3 (1.9) 553 (6.8) 43 (2.4) 512 (5.8)
Scotland 35 (4.3) 517 (6.3) 39 (5.3) 538 (6.6) 26 (4.5) 534 (6.9)
Singapore 100 (0.0) 528 (5.2) 0 (0.0) ~ ~ 0 (0.0) ~ ~
Slovak Republic 50 (3.7) 531 (3.6) 10 (2.5) 522 (7.8) 40 (3.1) 501 (4.5)
Slovenia 39 (3.3) 509 (3.3) 27 (3.7) 499 (4.2) 34 (3.0) 495 (3.6)
Sweden 15 (3.0) 567 (5.4) 66 (3.8) 560 (2.8) 18 (3.5) 560 (5.4)
Turkey 36 (4.2) 464 (6.0) 39 (4.1) 455 (6.1) 25 (3.5) 423 (8.2)
United States 32 (3.5) 519 (6.6) 35 (4.6) 572 (4.6) 33 (3.2) 537 (7.3)
International Avg. 46 (0.6) 507 (0.9) 25 (0.6) 502 (1.8) 29 (0.5) 485 (1.5)
CountriesSuburbanUrban Rural
AverageAchievement
Percent ofStudents
AverageAchievement
Percent ofStudents
AverageAchievement
Percent ofStudents
Background data provided by schools.
( ) Standard errors appear in parentheses. Because results are rounded to the nearest wholenumber, some totals may appear inconsistent.
An “r” indicates data are available for 70-84% of the students. An “s” indicates data are avail-able for 50-69% of the students. An “x” indicates data are available for less than 50% of thestudents.
A dash (–) indicates data are not available. A tilde (~) indicates insufficient data to reportachievement.
SOU
RCE:
IEA
Pro
gres
s in
Inte
rnat
iona
l Rea
ding
Lite
racy
Stu
dy (P
IRLS
) 200
1.
ISC 4th GradePIRLS 2001

[227]chapter 7: school contexts
Exhibit 7.2: Principals’ Reports on Their Primary-Grade Students Coming fromEconomically Disadvantaged Homes
SOU
RCE:
IEA
Pro
gres
s in
Inte
rnat
iona
l Rea
ding
Lite
racy
Stu
dy (P
IRLS
) 200
1.
Argentina 8 (2.9) 418 (32.3) 8 (2.3) 476 (6.4) 18 (3.5) 437 (10.7) 66 (4.6) 403 (6.9)
Belize 8 (2.7) 355 (22.6) 24 (6.1) 339 (16.6) 30 (7.0) 333 (17.1) 39 (4.3) 301 (8.5)
Bulgaria 18 (2.4) 582 (6.2) 23 (2.9) 571 (6.1) 29 (3.5) 552 (6.6) 31 (3.5) 516 (8.0)
Canada (O,Q) 48 (3.9) 556 (3.1) 28 (3.4) 541 (3.6) 13 (1.9) 530 (4.6) 11 (2.6) 515 (7.1)
Colombia 10 (2.6) 480 (19.2) 5 (1.4) 440 (17.1) 14 (3.8) 449 (8.6) 71 (4.1) 407 (5.2)
Cyprus r 47 (5.2) 503 (4.5) 29 (5.4) 496 (6.1) 16 (4.0) 478 (6.1) 9 (2.8) 480 (8.9)
Czech Republic 30 (4.2) 548 (5.1) 25 (4.3) 534 (4.1) 28 (4.6) 531 (5.5) 16 (3.6) 532 (6.2)
England 34 (4.2) 578 (5.2) 34 (4.5) 557 (5.6) 18 (3.5) 532 (7.3) 13 (2.9) 511 (5.1)
France 54 (3.9) 537 (3.4) 23 (3.8) 532 (3.9) 13 (3.3) 505 (5.1) 10 (2.3) 476 (10.8)
Germany r 46 (4.0) 547 (2.1) 37 (4.0) 543 (3.3) 13 (2.9) 515 (8.1) 4 (1.8) 504 (11.5)
Greece 23 (3.7) 549 (6.6) 14 (3.4) 521 (8.6) 20 (3.8) 514 (8.2) 42 (4.7) 517 (4.2)
Hong Kong, SAR 27 (3.6) 536 (4.5) 20 (3.5) 528 (6.3) 28 (4.7) 533 (6.2) 25 (4.0) 518 (7.6)
Hungary 23 (3.5) 566 (5.4) 41 (3.9) 550 (3.8) 29 (3.4) 527 (4.4) 7 (1.6) 522 (9.0)
Iceland r 89 (0.2) 514 (1.5) 9 (0.2) 499 (5.5) 2 (0.0) ~ ~ 0 (0.0) ~ ~
Iran, Islamic Rep. of 25 (4.1) 457 (9.5) 10 (2.8) 439 (8.2) 22 (3.5) 411 (10.7) 43 (4.3) 385 (5.0)
Israel 22 (3.6) 561 (4.7) 29 (4.0) 508 (9.2) 32 (3.6) 486 (8.6) 17 (3.3) 472 (12.6)
Italy 56 (3.5) 547 (3.0) 30 (3.2) 536 (4.7) 12 (2.3) 523 (6.5) 3 (1.0) 529 (30.5)
Kuwait 67 (4.1) 400 (6.6) 22 (3.6) 399 (11.6) 5 (1.8) 386 (30.9) 7 (0.2) 403 (10.1)
Latvia 12 (2.4) 562 (8.0) 50 (3.6) 548 (3.1) 23 (3.5) 534 (5.4) 16 (2.7) 525 (5.8)
Lithuania 16 (3.1) 574 (3.9) 36 (4.2) 547 (4.7) 32 (3.8) 535 (4.7) 16 (2.1) 523 (5.8)
Macedonia, Rep. of 13 (2.7) 476 (12.6) 18 (3.3) 456 (18.3) 31 (4.2) 438 (10.0) 37 (4.5) 424 (9.4)
Moldova, Rep. of 17 (2.8) 500 (11.0) 26 (4.1) 490 (10.3) 26 (3.7) 480 (8.6) 31 (4.0) 494 (6.9)
Morocco 9 (2.9) 345 (10.8) 7 (2.0) 329 (18.7) 23 (4.3) 320 (11.3) 61 (4.6) 357 (15.8)
Netherlands r 59 (4.6) 560 (3.3) 25 (4.1) 554 (3.9) 8 (2.7) 547 (7.1) 8 (2.5) 517 (12.3)
New Zealand 46 (3.4) 552 (5.3) 24 (3.8) 540 (8.0) 12 (2.4) 507 (9.5) 18 (2.5) 478 (6.6)
Norway r 85 (3.9) 500 (3.8) 12 (3.5) 496 (9.0) 3 (1.7) 495 (24.7) 0 (0.0) ~ ~
Romania 6 (1.7) 501 (23.6) 17 (3.4) 529 (11.0) 35 (4.0) 518 (8.7) 42 (4.8) 502 (6.7)
Russian Federation 22 (2.9) 533 (8.9) 28 (3.7) 524 (7.0) 30 (3.8) 530 (7.7) 20 (3.4) 525 (6.2)
Scotland 38 (4.0) 557 (5.4) 25 (4.6) 524 (8.1) 16 (2.9) 509 (9.7) 21 (4.3) 494 (5.1)
Singapore 66 (3.7) 541 (6.3) 20 (3.0) 487 (11.6) 10 (2.1) 523 (16.1) 3 (1.1) 495 (19.7)
Slovak Republic 18 (3.2) 531 (5.4) 29 (3.8) 521 (5.1) 31 (4.1) 518 (5.9) 22 (3.7) 503 (7.5)
Slovenia 34 (4.3) 504 (3.6) 50 (4.5) 501 (3.2) 15 (3.2) 497 (6.0) 1 (0.8) ~ ~
Sweden 46 (4.4) 567 (2.5) 32 (4.2) 562 (4.3) 13 (2.9) 558 (6.1) 9 (2.7) 527 (7.9)
Turkey 5 (1.1) 508 (17.0) 14 (3.0) 495 (8.7) 21 (3.5) 448 (7.0) 60 (4.2) 434 (3.7)
United States 25 (3.8) 578 (6.4) 20 (4.7) 565 (4.9) 19 (4.1) 548 (6.3) 36 (3.9) 505 (4.3)
International Avg. 33 (0.6) 518 (1.8) 24 (0.6) 505 (1.5) 20 (0.6) 493 (1.8) 23 (0.6) 478 (2.4)
More than 50%Economically
Disadvantaged
11-25% EconomicallyDisadvantaged
Countries
26-50% EconomicallyDisadvantaged
0-10% EconomicallyDisadvantaged
AverageAchievement
Percent ofStudents
AverageAchievement
Percent ofStudents
AverageAchievement
Percent ofStudents
AverageAchievement
Percent ofStudents
Background data provided by schools.
( ) Standard errors appear in parentheses. Because results are rounded to the nearest wholenumber, some totals may appear inconsistent.
An “r” indicates data are available for 70-84% of the students. An “s” indicates data are avail-able for 50-69% of the students. An “x” indicates data are available for less than 50% of thestudents.
A dash (–) indicates data are not available. A tilde (~) indicates insufficient data to reportachievement.
ISC 4th GradePIRLS 2001
[228] chapter 7: school contexts
Exhibit 7.3: Principals’ Reports on Their Primary-Grade Students Not Speakingthe Language of the Test as Their First Language
Countries
Argentina r 97 (1.7) 428 (6.4) 2 (1.5) ~ ~ 1 (0.0) ~ ~ 0 (0.0) ~ ~
Belize 23 (5.5) 341 (16.1) 13 (6.0) 318 (11.5) 7 (3.2) 300 (17.0) 58 (8.2) 323 (11.1)
Bulgaria 61 (3.9) 569 (3.9) 9 (2.4) 543 (9.3) 7 (2.2) 529 (13.1) 23 (3.2) 509 (12.2)
Canada (O,Q) 80 (2.8) 548 (2.6) 9 (1.9) 529 (6.7) 6 (1.7) 525 (9.2) 4 (1.3) 514 (10.3)
Colombia r 93 (2.6) 425 (5.2) 0 (0.3) ~ ~ 1 (0.0) ~ ~ 6 (2.5) 444 (56.7)
Cyprus r 96 (1.0) 495 (3.3) 3 (0.9) 483 (19.4) 0 (0.0) ~ ~ 0 (0.4) ~ ~
Czech Republic 95 (1.9) 538 (2.5) 2 (1.4) ~ ~ 1 (0.6) ~ ~ 2 (1.3) ~ ~
England 88 (2.7) 558 (3.8) 3 (1.4) 546 (15.6) 4 (1.8) 549 (9.7) 6 (1.8) 499 (9.3)
France 89 (2.8) 529 (2.8) 9 (2.7) 493 (7.2) 0 (0.2) ~ ~ 2 (1.2) ~ ~
Germany 68 (3.6) 545 (2.4) 18 (3.2) 536 (5.0) 10 (2.6) 522 (6.9) 4 (1.6) 491 (7.6)
Greece 83 (3.2) 524 (4.2) 15 (2.7) 534 (7.7) 2 (1.7) ~ ~ 0 (0.0) ~ ~
Hong Kong, SAR 12 (2.9) 538 (6.3) 0 (0.0) ~ ~ 0 (0.0) ~ ~ 88 (2.9) 527 (3.3)
Hungary 94 (1.9) 544 (2.5) 1 (0.4) ~ ~ 0 (0.0) ~ ~ 5 (1.9) 559 (12.3)
Iceland r 98 (0.1) 512 (1.3) 0 (0.0) ~ ~ 0 (0.0) ~ ~ 2 (0.0) ~ ~
Iran, Islamic Rep. of 54 (5.0) 426 (7.4) 9 (3.3) 390 (12.6) 8 (2.3) 410 (10.5) 29 (4.4) 393 (9.5)
Israel 59 (4.1) 530 (4.8) 18 (3.2) 496 (12.7) 8 (2.5) 507 (15.4) 15 (2.4) 431 (10.6)
Italy 95 (1.7) 542 (2.4) 3 (1.3) 558 (9.3) 1 (0.8) ~ ~ 1 (0.8) ~ ~
Kuwait r 91 (2.7) 402 (5.8) 2 (1.1) ~ ~ 0 (0.0) ~ ~ 7 (2.4) 400 (27.2)
Latvia 87 (2.5) 544 (2.4) 8 (2.2) 547 (7.0) 4 (0.8) 530 (12.1) 1 (1.3) ~ ~
Lithuania 92 (2.5) 543 (2.8) 4 (1.9) 557 (10.8) 0 (0.0) ~ ~ 4 (1.6) 525 (12.4)
Macedonia, Rep. of r 54 (3.5) 467 (8.4) 11 (2.9) 455 (14.7) 8 (3.0) 396 (15.8) 27 (3.5) 394 (10.9)
Moldova, Rep. of r 82 (3.4) 486 (4.4) 7 (2.4) 516 (12.9) 3 (1.4) 453 (25.7) 8 (2.4) 522 (18.8)
Morocco r 39 (5.0) 334 (12.2) 7 (2.8) 439 (32.2) 9 (3.2) 363 (14.3) 44 (4.8) 319 (13.4)
Netherlands 84 (3.3) 560 (2.3) 6 (2.0) 537 (11.4) 4 (1.6) 529 (9.6) 7 (2.3) 521 (16.4)
New Zealand 78 (3.2) 537 (4.1) 14 (2.7) 517 (11.0) 5 (1.9) 496 (18.3) 2 (1.2) ~ ~
Norway 89 (2.9) 500 (3.0) 8 (2.8) 501 (11.4) 3 (1.6) 475 (11.1) 0 (0.0) ~ ~
Romania 83 (3.7) 513 (4.4) 10 (3.2) 524 (20.8) 2 (1.3) ~ ~ 5 (2.1) 530 (25.9)
Russian Federation 77 (4.2) 534 (4.0) 7 (1.7) 493 (22.2) 4 (1.4) 542 (20.8) 13 (2.4) 505 (14.0)
Scotland 96 (2.1) 528 (3.9) 3 (1.9) 522 (26.7) 1 (0.9) ~ ~ 0 (0.0) ~ ~
Singapore 21 (3.0) 534 (13.3) 13 (2.8) 551 (16.3) 19 (3.6) 548 (10.4) 47 (4.1) 511 (8.0)
Slovak Republic 82 (2.6) 521 (3.1) 5 (1.9) 497 (8.6) 4 (1.8) 480 (40.8) 9 (1.5) 523 (13.3)
Slovenia 84 (3.4) 502 (2.2) 8 (2.4) 495 (6.2) 6 (2.2) 510 (10.3) 2 (1.1) ~ ~
Sweden 76 (3.8) 567 (2.2) 11 (2.7) 555 (4.8) 4 (1.7) 532 (9.8) 8 (2.6) 527 (8.8)
Turkey 74 (3.5) 454 (4.3) 4 (1.7) 445 (21.9) 3 (1.1) 417 (6.7) 19 (3.1) 450 (10.1)
United States 79 (3.0) 549 (4.1) 12 (2.4) 540 (12.1) 5 (1.7) 514 (15.0) 5 (1.5) 484 (7.6)
International Avg. 76 (0.5) 505 (1.0) 7 (0.4) 504 (2.5) 4 (0.3) 482 (3.2) 13 (0.4) 474 (3.1)
11-25% First LanguageNot Language of Test
26-50% First LanguageNot Language of Test
More than 50%First Language
Not Language of Test
0-10% First LanguageNot Language of Test
AverageAchievement
Percent ofStudents
AverageAchievement
Percent ofStudents
AverageAchievement
Percent ofStudents
AverageAchievement
Percent ofStudents
Background data provided by schools.
( ) Standard errors appear in parentheses. Because results are rounded to the nearest wholenumber, some totals may appear inconsistent.
An “r” indicates data are available for 70-84% of the students. An “s” indicates data are avail-able for 50-69% of the students. An “x” indicates data are available for less than 50% of thestudents.
A dash (–) indicates data are not available. A tilde (~) indicates insufficient data to reportachievement.
SOU
RCE:
IEA
Pro
gres
s in
Inte
rnat
iona
l Rea
ding
Lite
racy
Stu
dy (P
IRLS
) 200
1.
ISC 4th GradePIRLS 2001
[229]chapter 7: school contexts
What Is the Role of the School Principal?
PIRLS asked school principals to describe the percentage of time they spenton various school-related activities on a typical day. The response categoriesincluded curriculum and pedagogy development, staff management and devel-opment, administrative duties, parent and community relations, teaching, andother responsibilities. Exhibit 7.4 summarizes the principals’ reports of theamount of time spent on these activities. On average, internationally, principals’responsibilities were divided rather evenly across the categories, with the leastamount of time spent in the miscellaneous “other” category (9%). Almost one-quarter of time reported internationally was spent on administrative duties.Principals in France and Germany reported spending more than 40 percent oftheir time teaching, the most of any of the PIRLS countries. In Bulgaria, prin-cipals spent more than one-third of their time developing curriculum and ped-agogy for their schools.
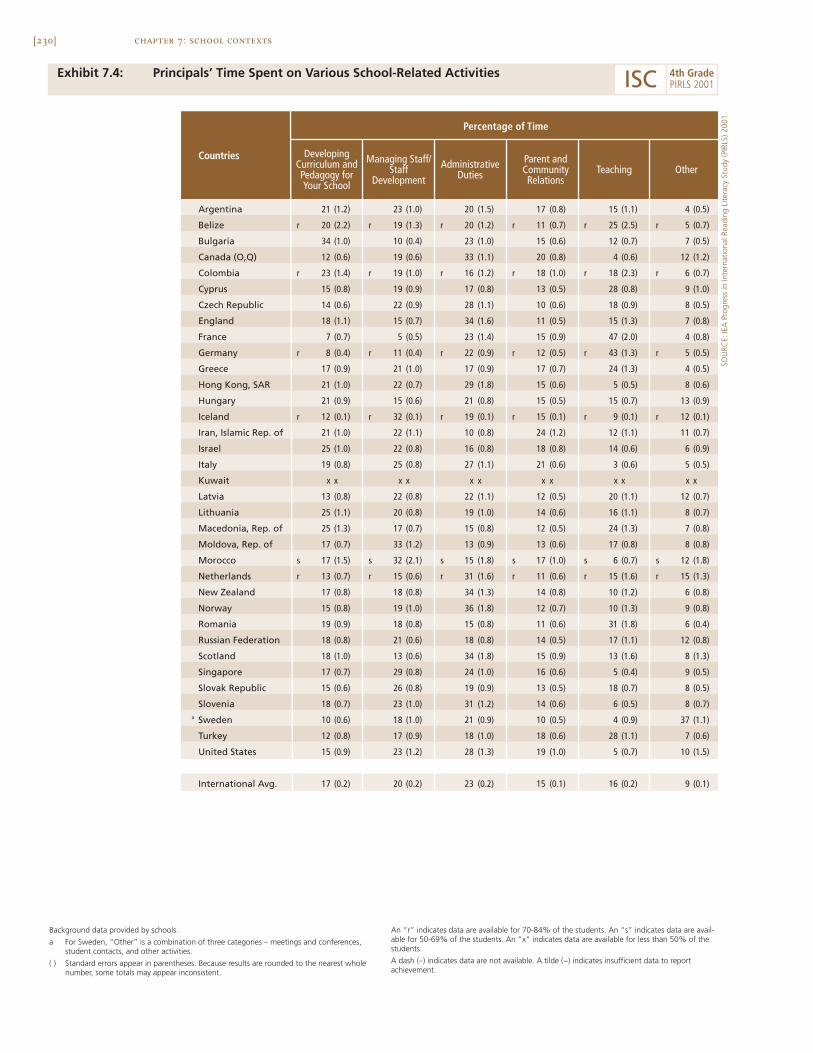
[230] chapter 7: school contexts
Exhibit 7.4: Principals’ Time Spent on Various School-Related Activities
Argentina 21 (1.2) 23 (1.0) 20 (1.5) 17 (0.8) 15 (1.1) 4 (0.5)
Belize r 20 (2.2) r 19 (1.3) r 20 (1.2) r 11 (0.7) r 25 (2.5) r 5 (0.7)
Bulgaria 34 (1.0) 10 (0.4) 23 (1.0) 15 (0.6) 12 (0.7) 7 (0.5)
Canada (O,Q) 12 (0.6) 19 (0.6) 33 (1.1) 20 (0.8) 4 (0.6) 12 (1.2)
Colombia r 23 (1.4) r 19 (1.0) r 16 (1.2) r 18 (1.0) r 18 (2.3) r 6 (0.7)
Cyprus 15 (0.8) 19 (0.9) 17 (0.8) 13 (0.5) 28 (0.8) 9 (1.0)
Czech Republic 14 (0.6) 22 (0.9) 28 (1.1) 10 (0.6) 18 (0.9) 8 (0.5)
England 18 (1.1) 15 (0.7) 34 (1.6) 11 (0.5) 15 (1.3) 7 (0.8)
France 7 (0.7) 5 (0.5) 23 (1.4) 15 (0.9) 47 (2.0) 4 (0.8)
Germany r 8 (0.4) r 11 (0.4) r 22 (0.9) r 12 (0.5) r 43 (1.3) r 5 (0.5)
Greece 17 (0.9) 21 (1.0) 17 (0.9) 17 (0.7) 24 (1.3) 4 (0.5)
Hong Kong, SAR 21 (1.0) 22 (0.7) 29 (1.8) 15 (0.6) 5 (0.5) 8 (0.6)
Hungary 21 (0.9) 15 (0.6) 21 (0.8) 15 (0.5) 15 (0.7) 13 (0.9)
Iceland r 12 (0.1) r 32 (0.1) r 19 (0.1) r 15 (0.1) r 9 (0.1) r 12 (0.1)
Iran, Islamic Rep. of 21 (1.0) 22 (1.1) 10 (0.8) 24 (1.2) 12 (1.1) 11 (0.7)
Israel 25 (1.0) 22 (0.8) 16 (0.8) 18 (0.8) 14 (0.6) 6 (0.9)
Italy 19 (0.8) 25 (0.8) 27 (1.1) 21 (0.6) 3 (0.6) 5 (0.5)
Kuwait x x x x x x x x x x x x
Latvia 13 (0.8) 22 (0.8) 22 (1.1) 12 (0.5) 20 (1.1) 12 (0.7)
Lithuania 25 (1.1) 20 (0.8) 19 (1.0) 14 (0.6) 16 (1.1) 8 (0.7)
Macedonia, Rep. of 25 (1.3) 17 (0.7) 15 (0.8) 12 (0.5) 24 (1.3) 7 (0.8)
Moldova, Rep. of 17 (0.7) 33 (1.2) 13 (0.9) 13 (0.6) 17 (0.8) 8 (0.8)
Morocco s 17 (1.5) s 32 (2.1) s 15 (1.8) s 17 (1.0) s 6 (0.7) s 12 (1.8)
Netherlands r 13 (0.7) r 15 (0.6) r 31 (1.6) r 11 (0.6) r 15 (1.6) r 15 (1.3)
New Zealand 17 (0.8) 18 (0.8) 34 (1.3) 14 (0.8) 10 (1.2) 6 (0.8)
Norway 15 (0.8) 19 (1.0) 36 (1.8) 12 (0.7) 10 (1.3) 9 (0.8)
Romania 19 (0.9) 18 (0.8) 15 (0.8) 11 (0.6) 31 (1.8) 6 (0.4)
Russian Federation 18 (0.8) 21 (0.6) 18 (0.8) 14 (0.5) 17 (1.1) 12 (0.8)
Scotland 18 (1.0) 13 (0.6) 34 (1.8) 15 (0.9) 13 (1.6) 8 (1.3)
Singapore 17 (0.7) 29 (0.8) 24 (1.0) 16 (0.6) 5 (0.4) 9 (0.5)
Slovak Republic 15 (0.6) 26 (0.8) 19 (0.9) 13 (0.5) 18 (0.7) 8 (0.5)
Slovenia 18 (0.7) 23 (1.0) 31 (1.2) 14 (0.6) 6 (0.5) 8 (0.7)a Sweden 10 (0.6) 18 (1.0) 21 (0.9) 10 (0.5) 4 (0.9) 37 (1.1)
Turkey 12 (0.8) 17 (0.9) 18 (1.0) 18 (0.6) 28 (1.1) 7 (0.6)
United States 15 (0.9) 23 (1.2) 28 (1.3) 19 (1.0) 5 (0.7) 10 (1.5)
International Avg. 17 (0.2) 20 (0.2) 23 (0.2) 15 (0.1) 16 (0.2) 9 (0.1)
Teaching
Percentage of Time
OtherCountries Developing
Curriculum andPedagogy forYour School
Managing Staff/Staff
Development
AdministrativeDuties
Parent andCommunityRelations
Background data provided by schools.
a For Sweden, “Other” is a combination of three categories – meetings and conferences,student contacts, and other activities.
( ) Standard errors appear in parentheses. Because results are rounded to the nearest wholenumber, some totals may appear inconsistent.
An “r” indicates data are available for 70-84% of the students. An “s” indicates data are avail-able for 50-69% of the students. An “x” indicates data are available for less than 50% of thestudents.
A dash (–) indicates data are not available. A tilde (~) indicates insufficient data to reportachievement.
SOU
RCE:
IEA
Pro
gres
s in
Inte
rnat
iona
l Rea
ding
Lite
racy
Stu
dy (P
IRLS
) 200
1.
ISC 4th GradePIRLS 2001
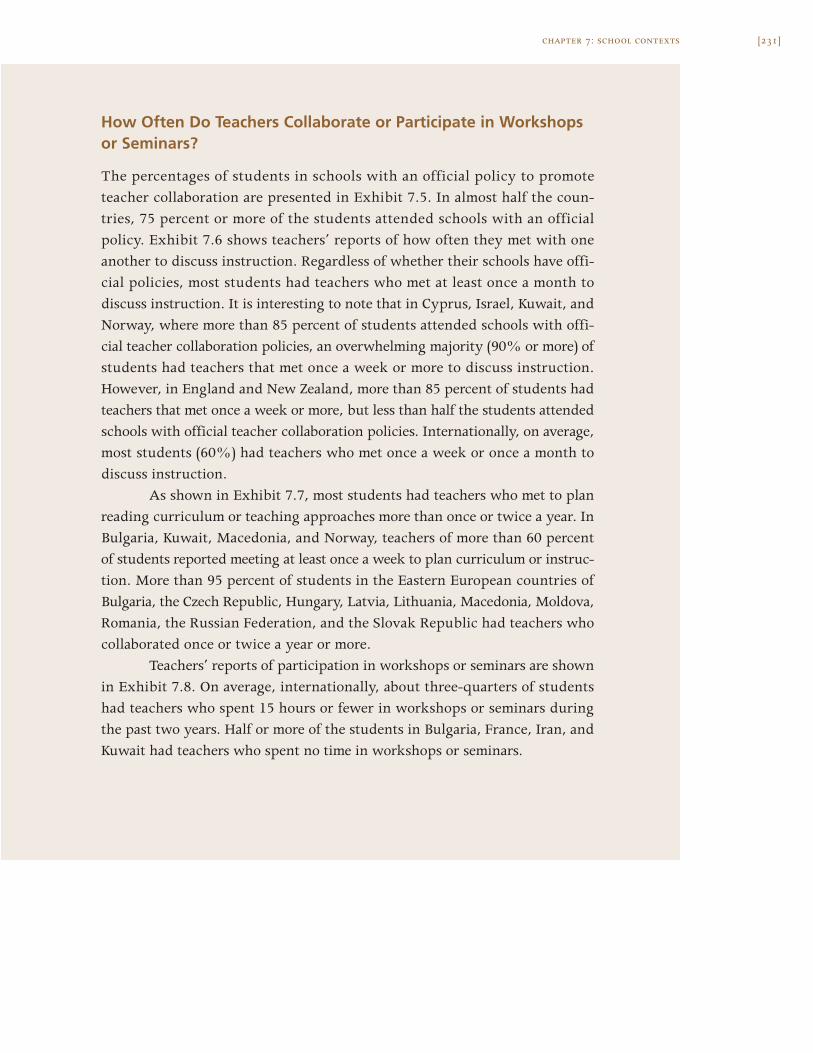
[231]chapter 7: school contexts
How Often Do Teachers Collaborate or Participate in Workshopsor Seminars?
The percentages of students in schools with an official policy to promoteteacher collaboration are presented in Exhibit 7.5. In almost half the coun-tries, 75 percent or more of the students attended schools with an officialpolicy. Exhibit 7.6 shows teachers’ reports of how often they met with oneanother to discuss instruction. Regardless of whether their schools have offi-cial policies, most students had teachers who met at least once a month todiscuss instruction. It is interesting to note that in Cyprus, Israel, Kuwait, andNorway, where more than 85 percent of students attended schools with offi-cial teacher collaboration policies, an overwhelming majority (90% or more) ofstudents had teachers that met once a week or more to discuss instruction.However, in England and New Zealand, more than 85 percent of students hadteachers that met once a week or more, but less than half the students attendedschools with official teacher collaboration policies. Internationally, on average,most students (60%) had teachers who met once a week or once a month todiscuss instruction.
As shown in Exhibit 7.7, most students had teachers who met to planreading curriculum or teaching approaches more than once or twice a year. InBulgaria, Kuwait, Macedonia, and Norway, teachers of more than 60 percentof students reported meeting at least once a week to plan curriculum or instruc-tion. More than 95 percent of students in the Eastern European countries ofBulgaria, the Czech Republic, Hungary, Latvia, Lithuania, Macedonia, Moldova,Romania, the Russian Federation, and the Slovak Republic had teachers whocollaborated once or twice a year or more.
Teachers’ reports of participation in workshops or seminars are shownin Exhibit 7.8. On average, internationally, about three-quarters of studentshad teachers who spent 15 hours or fewer in workshops or seminars duringthe past two years. Half or more of the students in Bulgaria, France, Iran, andKuwait had teachers who spent no time in workshops or seminars.
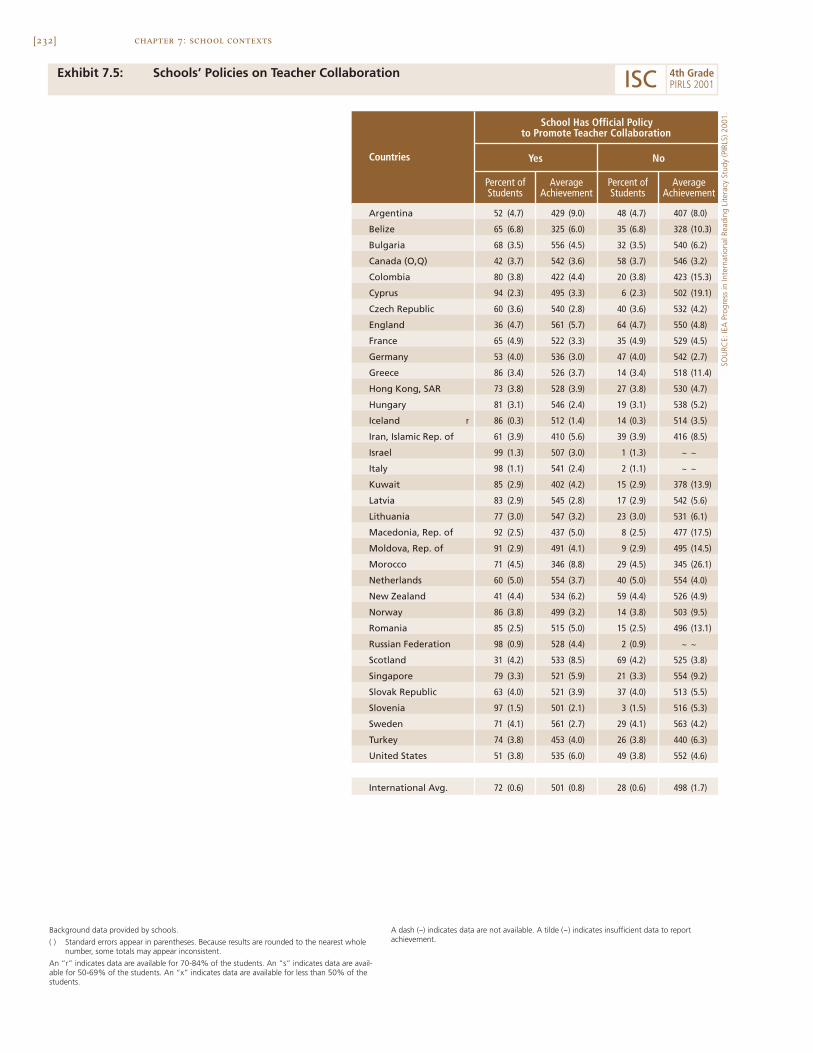
[232] chapter 7: school contexts
Exhibit 7.5: Schools’ Policies on Teacher Collaboration
Argentina 52 (4.7) 429 (9.0) 48 (4.7) 407 (8.0)
Belize 65 (6.8) 325 (6.0) 35 (6.8) 328 (10.3)
Bulgaria 68 (3.5) 556 (4.5) 32 (3.5) 540 (6.2)
Canada (O,Q) 42 (3.7) 542 (3.6) 58 (3.7) 546 (3.2)
Colombia 80 (3.8) 422 (4.4) 20 (3.8) 423 (15.3)
Cyprus 94 (2.3) 495 (3.3) 6 (2.3) 502 (19.1)
Czech Republic 60 (3.6) 540 (2.8) 40 (3.6) 532 (4.2)
England 36 (4.7) 561 (5.7) 64 (4.7) 550 (4.8)
France 65 (4.9) 522 (3.3) 35 (4.9) 529 (4.5)
Germany 53 (4.0) 536 (3.0) 47 (4.0) 542 (2.7)
Greece 86 (3.4) 526 (3.7) 14 (3.4) 518 (11.4)
Hong Kong, SAR 73 (3.8) 528 (3.9) 27 (3.8) 530 (4.7)
Hungary 81 (3.1) 546 (2.4) 19 (3.1) 538 (5.2)
Iceland r 86 (0.3) 512 (1.4) 14 (0.3) 514 (3.5)
Iran, Islamic Rep. of 61 (3.9) 410 (5.6) 39 (3.9) 416 (8.5)
Israel 99 (1.3) 507 (3.0) 1 (1.3) ~ ~
Italy 98 (1.1) 541 (2.4) 2 (1.1) ~ ~
Kuwait 85 (2.9) 402 (4.2) 15 (2.9) 378 (13.9)
Latvia 83 (2.9) 545 (2.8) 17 (2.9) 542 (5.6)
Lithuania 77 (3.0) 547 (3.2) 23 (3.0) 531 (6.1)
Macedonia, Rep. of 92 (2.5) 437 (5.0) 8 (2.5) 477 (17.5)
Moldova, Rep. of 91 (2.9) 491 (4.1) 9 (2.9) 495 (14.5)
Morocco 71 (4.5) 346 (8.8) 29 (4.5) 345 (26.1)
Netherlands 60 (5.0) 554 (3.7) 40 (5.0) 554 (4.0)
New Zealand 41 (4.4) 534 (6.2) 59 (4.4) 526 (4.9)
Norway 86 (3.8) 499 (3.2) 14 (3.8) 503 (9.5)
Romania 85 (2.5) 515 (5.0) 15 (2.5) 496 (13.1)
Russian Federation 98 (0.9) 528 (4.4) 2 (0.9) ~ ~
Scotland 31 (4.2) 533 (8.5) 69 (4.2) 525 (3.8)
Singapore 79 (3.3) 521 (5.9) 21 (3.3) 554 (9.2)
Slovak Republic 63 (4.0) 521 (3.9) 37 (4.0) 513 (5.5)
Slovenia 97 (1.5) 501 (2.1) 3 (1.5) 516 (5.3)
Sweden 71 (4.1) 561 (2.7) 29 (4.1) 563 (4.2)
Turkey 74 (3.8) 453 (4.0) 26 (3.8) 440 (6.3)
United States 51 (3.8) 535 (6.0) 49 (3.8) 552 (4.6)
International Avg. 72 (0.6) 501 (0.8) 28 (0.6) 498 (1.7)
Countries NoYes
School Has Official Policyto Promote Teacher Collaboration
AverageAchievement
Percent ofStudents
AverageAchievement
Percent ofStudents
Background data provided by schools.
( ) Standard errors appear in parentheses. Because results are rounded to the nearest wholenumber, some totals may appear inconsistent.
An “r” indicates data are available for 70-84% of the students. An “s” indicates data are avail-able for 50-69% of the students. An “x” indicates data are available for less than 50% of thestudents.
A dash (–) indicates data are not available. A tilde (~) indicates insufficient data to reportachievement.
SOU
RCE:
IEA
Pro
gres
s in
Inte
rnat
iona
l Rea
ding
Lite
racy
Stu
dy (P
IRLS
) 200
1.
ISC 4th GradePIRLS 2001

[233]chapter 7: school contexts
Exhibit 7.6: Teachers Meet to Discuss Instruction
SOU
RCE:
IEA
Pro
gres
s in
Inte
rnat
iona
l Rea
ding
Lite
racy
Stu
dy (P
IRLS
) 200
1.
Argentina 30 (3.6) 441 (9.4) 28 (4.6) 410 (11.9) 24 (4.4) 422 (14.5) 18 (3.8) 393 (12.4)
Belize 6 (4.3) 389 (25.1) 38 (6.3) 323 (11.0) 35 (6.8) 330 (15.3) 22 (4.1) 308 (11.4)
Bulgaria 16 (2.8) 546 (15.6) 13 (2.9) 551 (12.8) 45 (3.7) 554 (5.1) 26 (3.8) 548 (5.8)
Canada (O,Q) 9 (2.1) 545 (7.5) 19 (2.7) 542 (5.0) 50 (3.3) 546 (3.5) 22 (2.4) 542 (4.2)
Colombia 13 (2.5) 406 (15.9) 18 (3.6) 444 (7.9) 45 (4.9) 419 (6.3) 24 (4.8) 420 (13.7)
Cyprus 23 (4.7) 494 (5.2) 67 (4.9) 497 (4.3) 4 (1.8) 499 (29.5) 7 (2.0) 475 (10.6)
Czech Republic 39 (4.2) 535 (4.6) 17 (3.4) 534 (3.4) 30 (4.0) 542 (4.5) 14 (2.8) 537 (4.2)
England 31 (3.6) 551 (6.5) 52 (4.4) 555 (5.5) 10 (2.7) 560 (7.5) 6 (2.3) 541 (10.7)
France 46 (4.6) 527 (3.5) 9 (2.4) 533 (9.0) 38 (4.5) 520 (4.8) 7 (2.5) 526 (9.3)
Germany 10 (2.8) 546 (7.5) 19 (3.4) 547 (3.7) 27 (3.3) 533 (4.2) 44 (3.9) 538 (3.0)
Greece 13 (2.8) 511 (13.5) 26 (3.6) 529 (6.7) 38 (4.5) 520 (4.4) 23 (3.9) 531 (7.1)
Hong Kong, SAR 3 (1.5) 533 (13.1) 16 (3.0) 527 (7.7) 33 (4.1) 524 (6.2) 48 (4.1) 532 (3.5)
Hungary 4 (1.6) 539 (6.5) 4 (1.4) 556 (14.7) 48 (4.2) 546 (4.0) 45 (4.3) 541 (3.7)
Iceland r 29 (0.3) 514 (2.5) 51 (0.4) 509 (1.9) 14 (0.3) 519 (4.0) 7 (0.2) 506 (4.7)
Iran, Islamic Rep. of 21 (3.6) 413 (12.0) 19 (3.7) 421 (10.4) 53 (4.2) 413 (7.0) 7 (2.2) 404 (24.5)
Israel 34 (4.1) 473 (9.2) 62 (4.0) 527 (4.4) 2 (1.3) ~ ~ 1 (1.0) ~ ~
Italy 9 (2.2) 537 (10.6) 76 (3.2) 541 (2.9) 10 (2.0) 542 (6.4) 6 (2.0) 538 (9.7)
Kuwait 20 (4.3) 383 (14.5) 74 (4.8) 405 (4.7) 4 (1.3) 382 (19.0) 2 (1.8) ~ ~
Latvia 16 (3.3) 542 (6.8) 26 (3.7) 550 (5.5) 32 (4.4) 538 (4.7) 26 (4.0) 549 (5.2)
Lithuania 12 (2.9) 548 (7.3) 23 (3.2) 539 (5.4) 48 (4.1) 546 (3.9) 17 (3.4) 538 (8.0)
Macedonia, Rep. of 34 (4.0) 449 (10.5) 35 (4.0) 445 (8.6) 25 (3.8) 427 (12.9) 6 (1.9) 409 (18.4)
Moldova, Rep. of 5 (1.8) 484 (14.4) 31 (4.3) 491 (8.6) 52 (4.4) 495 (6.0) 12 (3.4) 476 (11.6)
Morocco 2 (1.2) ~ ~ 4 (1.9) 355 (19.7) 46 (5.6) 344 (12.3) 47 (5.5) 353 (15.7)
Netherlands r 33 (4.7) 559 (4.3) 45 (4.6) 554 (3.9) 17 (3.7) 543 (6.7) 4 (1.9) 561 (6.8)
New Zealand 49 (4.7) 523 (5.3) 46 (4.7) 536 (6.5) 3 (1.6) 553 (4.2) 2 (0.9) ~ ~
Norway 73 (3.9) 500 (3.5) 23 (4.1) 496 (6.7) 3 (1.8) 495 (14.8) 1 (0.9) ~ ~
Romania 40 (4.7) 522 (8.8) 22 (3.6) 522 (7.7) 32 (4.1) 494 (6.7) 7 (1.8) 509 (25.1)
Russian Federation 11 (2.4) 544 (11.9) 21 (2.6) 525 (8.4) 46 (3.2) 531 (6.5) 22 (2.9) 517 (6.1)
Scotland 4 (2.1) 524 (16.5) 20 (4.0) 526 (10.2) 34 (5.2) 535 (6.6) 41 (5.4) 523 (5.2)
Singapore 4 (1.4) 478 (19.4) 36 (3.7) 514 (9.4) 41 (4.0) 544 (7.6) 19 (3.2) 529 (13.1)
Slovak Republic 38 (4.1) 509 (4.1) 20 (3.5) 521 (7.9) 22 (3.4) 519 (5.2) 20 (3.3) 529 (7.5)
Slovenia 15 (2.5) 503 (4.5) 42 (3.5) 501 (3.9) 33 (3.0) 500 (3.8) 10 (2.7) 506 (4.9)
Sweden 58 (4.2) 560 (2.9) 35 (3.8) 562 (4.1) 4 (2.0) 557 (4.6) 3 (1.9) 578 (6.1)
Turkey 1 (0.9) ~ ~ 5 (1.5) 474 (15.2) 40 (4.6) 445 (5.1) 54 (4.4) 450 (5.3)
United States 40 (4.7) 542 (4.9) 28 (4.0) 543 (7.3) 24 (4.3) 550 (7.9) 7 (2.1) 537 (10.1)
International Avg. 23 (0.6) 505 (2.2) 31 (0.6) 503 (1.4) 29 (0.6) 500 (2.6) 18 (0.5) 498 (2.8)
Percentage of Students Whose Teachers Meet to Discuss Instruction
CountriesMore than
Once a WeekOnce aWeek
Once aMonth
Less thanOnce a Month
AverageAchievement
Percent ofStudents
AverageAchievement
Percent ofStudents
AverageAchievement
Percent ofStudents
AverageAchievement
Percent ofStudents
Background data provided by schools.
( ) Standard errors appear in parentheses. Because results are rounded to the nearest wholenumber, some totals may appear inconsistent.
An “r” indicates data are available for 70-84% of the students. An “s” indicates data are avail-able for 50-69% of the students. An “x” indicates data are available for less than 50% of thestudents.
A dash (–) indicates data are not available. A tilde (~) indicates insufficient data to reportachievement.
ISC 4th GradePIRLS 2001
[234] chapter 7: school contexts
Exhibit 7.7: Teachers Meet to Plan Reading Curriculum or Teaching Approaches
Argentina 28 (4.3) 392 (13.3) 37 (5.1) 437 (8.8) 23 (4.5) 433 (12.5) 12 (2.4) 397 (13.7)
Belize r 28 (3.8) 335 (8.8) 24 (3.3) 295 (12.5) 24 (3.7) 325 (11.1) 24 (4.2) 336 (17.1)
Bulgaria 63 (3.6) 548 (5.2) 19 (3.1) 550 (7.4) 16 (2.6) 562 (8.1) 3 (1.3) 540 (20.3)
Canada (O,Q) 18 (2.6) 549 (5.1) 35 (3.1) 546 (3.8) 31 (3.2) 545 (4.7) 15 (2.5) 537 (4.5)
Colombia 18 (3.1) 418 (12.6) 40 (4.6) 421 (7.7) 22 (4.0) 424 (8.0) 20 (4.2) 427 (15.3)
Cyprus 39 (4.5) 491 (4.3) 21 (3.8) 502 (5.8) 25 (4.4) 497 (6.9) 15 (3.4) 485 (6.1)
Czech Republic 49 (4.4) 537 (3.1) 36 (4.6) 535 (4.7) 11 (2.7) 539 (7.0) 4 (1.6) 536 (18.3)
England 26 (3.6) 536 (7.0) 32 (4.2) 564 (6.6) 33 (4.2) 563 (6.2) 9 (2.3) 540 (8.3)
France 12 (2.1) 529 (7.3) 33 (3.9) 520 (5.2) 33 (4.1) 530 (4.3) 22 (3.9) 524 (5.6)
Germany 26 (3.1) 538 (3.4) 32 (3.3) 542 (3.4) 31 (3.3) 543 (3.1) 11 (2.2) 528 (6.7)
Greece 25 (3.4) 539 (6.5) 41 (4.6) 518 (6.9) 18 (3.0) 523 (6.7) 16 (3.3) 527 (6.4)
Hong Kong, SAR 15 (3.4) 513 (9.0) 40 (4.3) 531 (5.5) 35 (4.6) 532 (5.1) 10 (2.3) 532 (5.9)
Hungary 51 (4.2) 539 (3.5) 29 (4.1) 552 (4.6) 17 (3.3) 542 (6.8) 2 (1.3) ~ ~
Iceland 21 (0.3) 512 (2.3) 28 (0.3) 512 (1.9) 40 (0.3) 515 (2.1) 11 (0.2) 515 (4.5)
Iran, Islamic Rep. of 18 (2.8) 421 (9.5) 61 (3.6) 415 (5.8) 12 (2.1) 402 (12.9) 8 (2.3) 413 (20.5)
Israel 53 (4.1) 513 (5.8) 29 (3.6) 483 (8.6) 15 (3.2) 543 (10.4) 3 (1.5) 477 (37.8)
Italy 46 (3.5) 535 (4.0) 32 (3.6) 548 (3.8) 10 (2.1) 543 (7.5) 12 (2.7) 543 (7.0)
Kuwait 64 (3.3) 403 (5.9) 19 (2.8) 393 (6.9) 8 (2.1) 408 (18.1) 9 (2.1) 385 (12.6)
Latvia 20 (3.4) 548 (6.6) 50 (4.4) 542 (3.6) 29 (3.9) 548 (4.7) 1 (0.9) ~ ~
Lithuania 29 (4.0) 539 (4.9) 47 (4.4) 547 (4.2) 24 (3.5) 540 (6.0) 0 (0.0) ~ ~
Macedonia, Rep. of 68 (4.2) 442 (5.9) 29 (4.0) 441 (11.0) 2 (0.9) ~ ~ 2 (1.1) ~ ~
Moldova, Rep. of 55 (4.8) 488 (6.2) 35 (4.6) 499 (7.1) 9 (2.4) 490 (9.3) 0 (0.5) ~ ~
Morocco 19 (3.8) 339 (18.7) 37 (4.6) 337 (16.3) 34 (5.0) 362 (10.9) 10 (3.1) 313 (20.2)
Netherlands 12 (2.9) 550 (9.3) 27 (4.2) 546 (4.3) 55 (4.5) 559 (2.9) 6 (2.1) 547 (9.7)
New Zealand 26 (3.7) 516 (7.2) 36 (4.3) 530 (6.8) 31 (3.6) 540 (6.9) 7 (2.4) 515 (17.3)
Norway 61 (4.1) 501 (4.4) 19 (3.9) 495 (4.5) 11 (2.5) 496 (9.5) 9 (2.9) 497 (5.1)
Romania 45 (4.3) 507 (7.1) 49 (4.3) 519 (7.2) 6 (2.0) 487 (17.8) 0 (0.4) ~ ~
Russian Federation 25 (3.1) 525 (9.0) 59 (4.1) 531 (3.7) 15 (3.3) 520 (8.9) 0 (0.0) ~ ~
Scotland 7 (2.5) 529 (15.5) 30 (4.2) 532 (8.8) 44 (5.1) 527 (5.2) 18 (3.8) 523 (8.1)
Singapore 14 (2.7) 512 (14.0) 38 (3.7) 517 (7.2) 37 (3.7) 546 (7.7) 11 (2.5) 525 (18.1)
Slovak Republic 45 (4.2) 518 (3.7) 42 (4.2) 520 (5.7) 11 (2.7) 515 (8.0) 3 (1.3) 492 (20.5)
Slovenia 48 (4.5) 500 (2.7) 26 (3.9) 497 (4.9) 18 (3.3) 511 (4.6) 8 (2.4) 505 (5.6)
Sweden 28 (2.8) 556 (4.5) 21 (2.7) 562 (3.8) 37 (3.2) 563 (3.2) 14 (1.9) 568 (4.2)
Turkey 37 (3.9) 456 (6.9) 40 (4.2) 448 (6.4) 18 (2.8) 443 (9.2) 4 (1.8) 431 (8.6)
United States 35 (4.7) 539 (7.3) 35 (4.6) 541 (7.1) 26 (3.4) 554 (6.4) 4 (1.6) 512 (20.9)
International Avg. 34 (0.6) 498 (1.4) 35 (0.7) 499 (1.2) 23 (0.6) 505 (2.1) 9 (0.4) 488 (3.4)
Percentage of Students Whose Teachers Reported Meeting toPlan Reading Curriculum or Teaching Approaches
At Least Once a Week Once a Month orEvery Other Month Once or Twice a Year NeverCountries
AverageAchievement
Percent ofStudents
AverageAchievement
Percent ofStudents
AverageAchievement
Percent ofStudents
AverageAchievement
Percent ofStudents
Background data provided by teachers.
( ) Standard errors appear in parentheses. Because results are rounded to the nearest wholenumber, some totals may appear inconsistent.
An “r” indicates data are available for 70-84% of the students. An “s” indicates data are avail-able for 50-69% of the students. An “x” indicates data are available for less than 50% ofthe students.
A dash (–) indicates data are not available. A tilde (~) indicates insufficient data to reportachievement.
SOU
RCE:
IEA
Pro
gres
s in
Inte
rnat
iona
l Rea
ding
Lite
racy
Stu
dy (P
IRLS
) 200
1.
ISC 4th GradePIRLS 2001
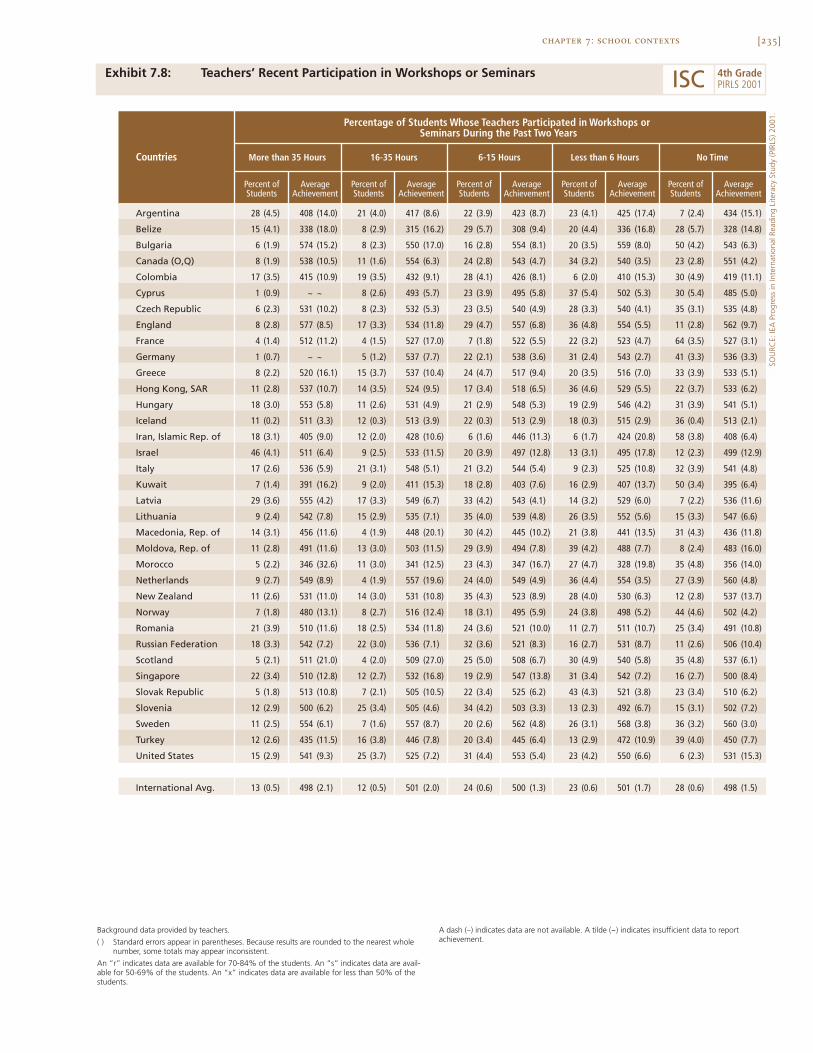
[235]chapter 7: school contexts
Exhibit 7.8: Teachers’ Recent Participation in Workshops or Seminars
SOU
RCE:
IEA
Pro
gres
s in
Inte
rnat
iona
l Rea
ding
Lite
racy
Stu
dy (P
IRLS
) 200
1.
Argentina 28 (4.5) 408 (14.0) 21 (4.0) 417 (8.6) 22 (3.9) 423 (8.7) 23 (4.1) 425 (17.4) 7 (2.4) 434 (15.1)
Belize 15 (4.1) 338 (18.0) 8 (2.9) 315 (16.2) 29 (5.7) 308 (9.4) 20 (4.4) 336 (16.8) 28 (5.7) 328 (14.8)
Bulgaria 6 (1.9) 574 (15.2) 8 (2.3) 550 (17.0) 16 (2.8) 554 (8.1) 20 (3.5) 559 (8.0) 50 (4.2) 543 (6.3)
Canada (O,Q) 8 (1.9) 538 (10.5) 11 (1.6) 554 (6.3) 24 (2.8) 543 (4.7) 34 (3.2) 540 (3.5) 23 (2.8) 551 (4.2)
Colombia 17 (3.5) 415 (10.9) 19 (3.5) 432 (9.1) 28 (4.1) 426 (8.1) 6 (2.0) 410 (15.3) 30 (4.9) 419 (11.1)
Cyprus 1 (0.9) ~ ~ 8 (2.6) 493 (5.7) 23 (3.9) 495 (5.8) 37 (5.4) 502 (5.3) 30 (5.4) 485 (5.0)
Czech Republic 6 (2.3) 531 (10.2) 8 (2.3) 532 (5.3) 23 (3.5) 540 (4.9) 28 (3.3) 540 (4.1) 35 (3.1) 535 (4.8)
England 8 (2.8) 577 (8.5) 17 (3.3) 534 (11.8) 29 (4.7) 557 (6.8) 36 (4.8) 554 (5.5) 11 (2.8) 562 (9.7)
France 4 (1.4) 512 (11.2) 4 (1.5) 527 (17.0) 7 (1.8) 522 (5.5) 22 (3.2) 523 (4.7) 64 (3.5) 527 (3.1)
Germany 1 (0.7) ~ ~ 5 (1.2) 537 (7.7) 22 (2.1) 538 (3.6) 31 (2.4) 543 (2.7) 41 (3.3) 536 (3.3)
Greece 8 (2.2) 520 (16.1) 15 (3.7) 537 (10.4) 24 (4.7) 517 (9.4) 20 (3.5) 516 (7.0) 33 (3.9) 533 (5.1)
Hong Kong, SAR 11 (2.8) 537 (10.7) 14 (3.5) 524 (9.5) 17 (3.4) 518 (6.5) 36 (4.6) 529 (5.5) 22 (3.7) 533 (6.2)
Hungary 18 (3.0) 553 (5.8) 11 (2.6) 531 (4.9) 21 (2.9) 548 (5.3) 19 (2.9) 546 (4.2) 31 (3.9) 541 (5.1)
Iceland 11 (0.2) 511 (3.3) 12 (0.3) 513 (3.9) 22 (0.3) 513 (2.9) 18 (0.3) 515 (2.9) 36 (0.4) 513 (2.1)
Iran, Islamic Rep. of 18 (3.1) 405 (9.0) 12 (2.0) 428 (10.6) 6 (1.6) 446 (11.3) 6 (1.7) 424 (20.8) 58 (3.8) 408 (6.4)
Israel 46 (4.1) 511 (6.4) 9 (2.5) 533 (11.5) 20 (3.9) 497 (12.8) 13 (3.1) 495 (17.8) 12 (2.3) 499 (12.9)
Italy 17 (2.6) 536 (5.9) 21 (3.1) 548 (5.1) 21 (3.2) 544 (5.4) 9 (2.3) 525 (10.8) 32 (3.9) 541 (4.8)
Kuwait 7 (1.4) 391 (16.2) 9 (2.0) 411 (15.3) 18 (2.8) 403 (7.6) 16 (2.9) 407 (13.7) 50 (3.4) 395 (6.4)
Latvia 29 (3.6) 555 (4.2) 17 (3.3) 549 (6.7) 33 (4.2) 543 (4.1) 14 (3.2) 529 (6.0) 7 (2.2) 536 (11.6)
Lithuania 9 (2.4) 542 (7.8) 15 (2.9) 535 (7.1) 35 (4.0) 539 (4.8) 26 (3.5) 552 (5.6) 15 (3.3) 547 (6.6)
Macedonia, Rep. of 14 (3.1) 456 (11.6) 4 (1.9) 448 (20.1) 30 (4.2) 445 (10.2) 21 (3.8) 441 (13.5) 31 (4.3) 436 (11.8)
Moldova, Rep. of 11 (2.8) 491 (11.6) 13 (3.0) 503 (11.5) 29 (3.9) 494 (7.8) 39 (4.2) 488 (7.7) 8 (2.4) 483 (16.0)
Morocco 5 (2.2) 346 (32.6) 11 (3.0) 341 (12.5) 23 (4.3) 347 (16.7) 27 (4.7) 328 (19.8) 35 (4.8) 356 (14.0)
Netherlands 9 (2.7) 549 (8.9) 4 (1.9) 557 (19.6) 24 (4.0) 549 (4.9) 36 (4.4) 554 (3.5) 27 (3.9) 560 (4.8)
New Zealand 11 (2.6) 531 (11.0) 14 (3.0) 531 (10.8) 35 (4.3) 523 (8.9) 28 (4.0) 530 (6.3) 12 (2.8) 537 (13.7)
Norway 7 (1.8) 480 (13.1) 8 (2.7) 516 (12.4) 18 (3.1) 495 (5.9) 24 (3.8) 498 (5.2) 44 (4.6) 502 (4.2)
Romania 21 (3.9) 510 (11.6) 18 (2.5) 534 (11.8) 24 (3.6) 521 (10.0) 11 (2.7) 511 (10.7) 25 (3.4) 491 (10.8)
Russian Federation 18 (3.3) 542 (7.2) 22 (3.0) 536 (7.1) 32 (3.6) 521 (8.3) 16 (2.7) 531 (8.7) 11 (2.6) 506 (10.4)
Scotland 5 (2.1) 511 (21.0) 4 (2.0) 509 (27.0) 25 (5.0) 508 (6.7) 30 (4.9) 540 (5.8) 35 (4.8) 537 (6.1)
Singapore 22 (3.4) 510 (12.8) 12 (2.7) 532 (16.8) 19 (2.9) 547 (13.8) 31 (3.4) 542 (7.2) 16 (2.7) 500 (8.4)
Slovak Republic 5 (1.8) 513 (10.8) 7 (2.1) 505 (10.5) 22 (3.4) 525 (6.2) 43 (4.3) 521 (3.8) 23 (3.4) 510 (6.2)
Slovenia 12 (2.9) 500 (6.2) 25 (3.4) 505 (4.6) 34 (4.2) 503 (3.3) 13 (2.3) 492 (6.7) 15 (3.1) 502 (7.2)
Sweden 11 (2.5) 554 (6.1) 7 (1.6) 557 (8.7) 20 (2.6) 562 (4.8) 26 (3.1) 568 (3.8) 36 (3.2) 560 (3.0)
Turkey 12 (2.6) 435 (11.5) 16 (3.8) 446 (7.8) 20 (3.4) 445 (6.4) 13 (2.9) 472 (10.9) 39 (4.0) 450 (7.7)
United States 15 (2.9) 541 (9.3) 25 (3.7) 525 (7.2) 31 (4.4) 553 (5.4) 23 (4.2) 550 (6.6) 6 (2.3) 531 (15.3)
International Avg. 13 (0.5) 498 (2.1) 12 (0.5) 501 (2.0) 24 (0.6) 500 (1.3) 23 (0.6) 501 (1.7) 28 (0.6) 498 (1.5)
Percent ofStudents
AverageAchievement
Countries
Percentage of Students Whose Teachers Participated in Workshops orSeminars During the Past Two Years
16-35 Hours 6-15 HoursMore than 35 Hours No TimeLess than 6 Hours
Percent ofStudents
AverageAchievement
Percent ofStudents
AverageAchievement
Percent ofStudents
AverageAchievement
Percent ofStudents
AverageAchievement
Background data provided by teachers.
( ) Standard errors appear in parentheses. Because results are rounded to the nearest wholenumber, some totals may appear inconsistent.
An “r” indicates data are available for 70-84% of the students. An “s” indicates data are avail-able for 50-69% of the students. An “x” indicates data are available for less than 50% of thestudents.
A dash (–) indicates data are not available. A tilde (~) indicates insufficient data to reportachievement.
ISC 4th GradePIRLS 2001
[236]
What Is the Level of Home-School Involvement?
Parental involvement provides a means for monitoring academic progress andreinforcing behaviors believed to contribute to students’ academic success.There are several ways in which schools keep parents apprised of their child’sprogress in school. Schools may send information about the school home tothe parents, parents may participate in school-related events, or teachers maysend home examples of classroom work.
To measure the extent to which communication was emphasizedbetween schools and parents in each of the participating countries, PIRLScreated an Index of Home-School Involvement. As described in Exhibit 7.9,the index was based on schools’ average response to six questions about theopportunities for parental involvement provided by the school and aboutparental attendance at school-sponsored meetings or other events. Studentswere placed in the high category if schools held teacher-parent conferences andother events at school to which parents were invited, and more than halfattended, four or more times a year; schools sent home letters, calendars andnewsletters with information about the school 7 or more times a year; andthey sent written reports, or report cards, of children’s performance four ormore times a year. The low level indicates that schools never held teacher-parent conferences, or if conferences were held less than one quarter of theparents attended; schools sent home letters, calendars or newsletters aboutthe school no more than 3 times a year; and they sent home written reports ofchildren’s performance once a year, if ever. The medium level indicates allother combinations of parental involvement opportunities and participation.
On average, internationally, 41 percent of students were in the highcategory, 28 were in the medium, and 31 in the low category. At least half thestudents in the United States, Canada (O,Q), The Netherlands, Kuwait, NewZealand, Israel, Singapore, France, Hong Kong, Iran, and Iceland were in schoolsat the high level. Only in Morocco, Bulgaria, Turkey, Macedonia, and Moldovawere two-thirds or more of students in schools at the low level of home-schoolinvolvement.
chapter 7: school contexts
[237]chapter 7: school contexts
Exhibits 7.10 through 7.12 present results of more informal home-school interaction. As shown in Exhibit 7.10, the teachers of 62 percent ofstudents, internationally, on average, sent home examples of the students’classroom work in language arts at least monthly. Interestingly, in most English-speaking countries, for the majority of students, teachers sent home examplesof classroom work only six times a year or less, with the exception of theUnited States, where the majority of students (65%) had teachers who sentexamples home at least weekly. Exhibit 7.11 shows how often schools asked theparents to review their child’s language progress by sending home examples ofclassroom work, sending home information about the child’s performance in thelanguage, and asking parents to monitor the completion of assignments. Inter-nationally, on average, nearly half (48%) the students had parents who wereasked to review their child’s language progress. Parents’ reports of how oftenthey discussed classroom reading work with their child are presented in Exhibit7.12. Three-quarters of students, internationally, on average, had parents whoreported talking to their child at least once or twice a week about their readingwork.
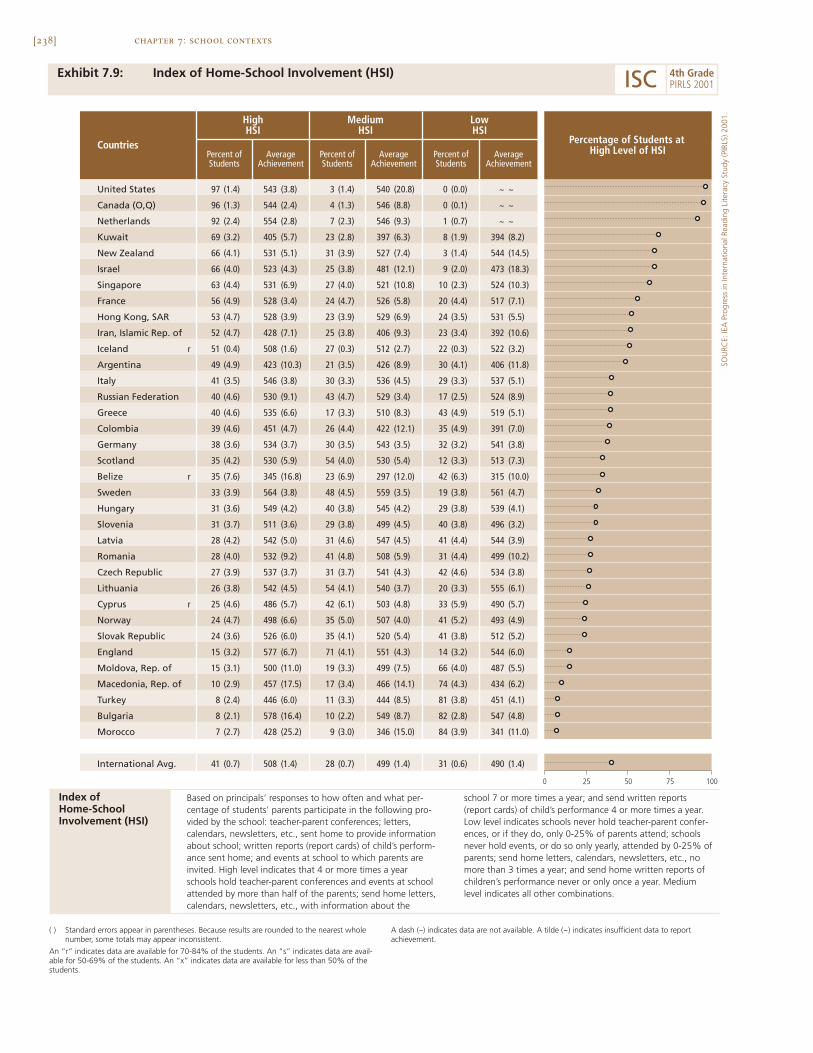
[238] chapter 7: school contexts
Exhibit 7.9: Index of Home-School Involvement (HSI)
United States 97 (1.4) 543 (3.8) 3 (1.4) 540 (20.8) 0 (0.0) ~ ~
Canada (O,Q) 96 (1.3) 544 (2.4) 4 (1.3) 546 (8.8) 0 (0.1) ~ ~
Netherlands 92 (2.4) 554 (2.8) 7 (2.3) 546 (9.3) 1 (0.7) ~ ~
Kuwait 69 (3.2) 405 (5.7) 23 (2.8) 397 (6.3) 8 (1.9) 394 (8.2)
New Zealand 66 (4.1) 531 (5.1) 31 (3.9) 527 (7.4) 3 (1.4) 544 (14.5)
Israel 66 (4.0) 523 (4.3) 25 (3.8) 481 (12.1) 9 (2.0) 473 (18.3)
Singapore 63 (4.4) 531 (6.9) 27 (4.0) 521 (10.8) 10 (2.3) 524 (10.3)
France 56 (4.9) 528 (3.4) 24 (4.7) 526 (5.8) 20 (4.4) 517 (7.1)
Hong Kong, SAR 53 (4.7) 528 (3.9) 23 (3.9) 529 (6.9) 24 (3.5) 531 (5.5)
Iran, Islamic Rep. of 52 (4.7) 428 (7.1) 25 (3.8) 406 (9.3) 23 (3.4) 392 (10.6)
Iceland r 51 (0.4) 508 (1.6) 27 (0.3) 512 (2.7) 22 (0.3) 522 (3.2)
Argentina 49 (4.9) 423 (10.3) 21 (3.5) 426 (8.9) 30 (4.1) 406 (11.8)
Italy 41 (3.5) 546 (3.8) 30 (3.3) 536 (4.5) 29 (3.3) 537 (5.1)
Russian Federation 40 (4.6) 530 (9.1) 43 (4.7) 529 (3.4) 17 (2.5) 524 (8.9)
Greece 40 (4.6) 535 (6.6) 17 (3.3) 510 (8.3) 43 (4.9) 519 (5.1)
Colombia 39 (4.6) 451 (4.7) 26 (4.4) 422 (12.1) 35 (4.9) 391 (7.0)
Germany 38 (3.6) 534 (3.7) 30 (3.5) 543 (3.5) 32 (3.2) 541 (3.8)
Scotland 35 (4.2) 530 (5.9) 54 (4.0) 530 (5.4) 12 (3.3) 513 (7.3)
Belize r 35 (7.6) 345 (16.8) 23 (6.9) 297 (12.0) 42 (6.3) 315 (10.0)
Sweden 33 (3.9) 564 (3.8) 48 (4.5) 559 (3.5) 19 (3.8) 561 (4.7)
Hungary 31 (3.6) 549 (4.2) 40 (3.8) 545 (4.2) 29 (3.8) 539 (4.1)
Slovenia 31 (3.7) 511 (3.6) 29 (3.8) 499 (4.5) 40 (3.8) 496 (3.2)
Latvia 28 (4.2) 542 (5.0) 31 (4.6) 547 (4.5) 41 (4.4) 544 (3.9)
Romania 28 (4.0) 532 (9.2) 41 (4.8) 508 (5.9) 31 (4.4) 499 (10.2)
Czech Republic 27 (3.9) 537 (3.7) 31 (3.7) 541 (4.3) 42 (4.6) 534 (3.8)
Lithuania 26 (3.8) 542 (4.5) 54 (4.1) 540 (3.7) 20 (3.3) 555 (6.1)
Cyprus r 25 (4.6) 486 (5.7) 42 (6.1) 503 (4.8) 33 (5.9) 490 (5.7)
Norway 24 (4.7) 498 (6.6) 35 (5.0) 507 (4.0) 41 (5.2) 493 (4.9)
Slovak Republic 24 (3.6) 526 (6.0) 35 (4.1) 520 (5.4) 41 (3.8) 512 (5.2)
England 15 (3.2) 577 (6.7) 71 (4.1) 551 (4.3) 14 (3.2) 544 (6.0)
Moldova, Rep. of 15 (3.1) 500 (11.0) 19 (3.3) 499 (7.5) 66 (4.0) 487 (5.5)
Macedonia, Rep. of 10 (2.9) 457 (17.5) 17 (3.4) 466 (14.1) 74 (4.3) 434 (6.2)
Turkey 8 (2.4) 446 (6.0) 11 (3.3) 444 (8.5) 81 (3.8) 451 (4.1)
Bulgaria 8 (2.1) 578 (16.4) 10 (2.2) 549 (8.7) 82 (2.8) 547 (4.8)
Morocco 7 (2.7) 428 (25.2) 9 (3.0) 346 (15.0) 84 (3.9) 341 (11.0)
International Avg. 41 (0.7) 508 (1.4) 28 (0.7) 499 (1.4) 31 (0.6) 490 (1.4)
Percentage of Students atHigh Level of HSICountries
HighHSI
MediumHSI
LowHSI
Percent ofStudents
AverageAchievement
Percent ofStudents
AverageAchievement
Percent ofStudents
AverageAchievement
0 10050 7525
( ) Standard errors appear in parentheses. Because results are rounded to the nearest wholenumber, some totals may appear inconsistent.
An “r” indicates data are available for 70-84% of the students. An “s” indicates data are avail-able for 50-69% of the students. An “x” indicates data are available for less than 50% of thestudents.
A dash (–) indicates data are not available. A tilde (~) indicates insufficient data to reportachievement.
SOU
RCE:
IEA
Pro
gres
s in
Inte
rnat
iona
l Rea
ding
Lite
racy
Stu
dy (P
IRLS
) 200
1.
ISC 4th GradePIRLS 2001
Index of Home-SchoolInvolvement (HSI)
Based on principals’ responses to how often and what per-centage of students’ parents participate in the following pro-vided by the school: teacher-parent conferences; letters,calendars, newsletters, etc., sent home to provide informationabout school; written reports (report cards) of child’s perform-ance sent home; and events at school to which parents areinvited. High level indicates that 4 or more times a yearschools hold teacher-parent conferences and events at schoolattended by more than half of the parents; send home letters,calendars, newsletters, etc., with information about the
school 7 or more times a year; and send written reports(report cards) of child’s performance 4 or more times a year.Low level indicates schools never hold teacher-parent confer-ences, or if they do, only 0-25% of parents attend; schoolsnever hold events, or do so only yearly, attended by 0-25% ofparents; send home letters, calendars, newsletters, etc., nomore than 3 times a year; and send home written reports ofchildren’s performance never or only once a year. Mediumlevel indicates all other combinations.

[239]chapter 7: school contexts
Exhibit 7.10: Teachers Send Home Examples of Students’ Classroom Work in Language
SOU
RCE:
IEA
Pro
gres
s in
Inte
rnat
iona
l Rea
ding
Lite
racy
Stu
dy (P
IRLS
) 200
1.
Argentina 32 (4.4) 425 (8.4) 31 (5.0) 406 (14.9) 37 (4.6) 425 (9.4)
Belize r 30 (4.3) 342 (11.3) 38 (5.0) 321 (10.3) 32 (5.4) 311 (11.4)
Bulgaria 55 (4.3) 552 (6.5) 38 (4.3) 553 (5.7) 8 (2.0) 527 (14.5)
Canada (O,Q) 24 (2.9) 549 (3.8) 44 (3.6) 546 (3.1) 33 (3.3) 540 (4.8)
Colombia 35 (5.0) 420 (9.0) 35 (4.8) 427 (6.8) 30 (4.6) 426 (9.5)
Cyprus 50 (5.1) 496 (4.5) 39 (4.6) 494 (4.9) 11 (2.8) 486 (6.9)
Czech Republic 55 (4.5) 540 (3.4) 29 (3.9) 535 (4.1) 17 (3.2) 529 (6.9)
England 7 (2.7) 583 (9.9) 6 (2.3) 546 (13.3) 86 (3.5) 552 (3.6)
France 30 (4.3) 530 (4.5) 41 (4.3) 525 (3.8) 29 (3.7) 519 (5.2)
Germany 12 (2.1) 535 (3.8) 34 (3.2) 540 (3.4) 53 (3.2) 539 (3.2)
Greece 56 (4.7) 521 (4.6) 29 (4.0) 533 (8.3) 16 (2.9) 526 (9.6)
Hong Kong, SAR 22 (3.8) 532 (7.5) 13 (3.1) 535 (6.2) 65 (4.7) 526 (3.8)
Hungary 14 (2.8) 557 (9.2) 59 (4.1) 544 (3.5) 28 (3.6) 538 (4.7)
Iceland 34 (0.4) 517 (1.9) 10 (0.2) 506 (3.9) 56 (0.4) 512 (1.6)
Iran, Islamic Rep. of 21 (3.0) 421 (11.3) 47 (4.1) 414 (5.9) 32 (4.1) 410 (8.5)
Israel 14 (3.2) 496 (15.1) 36 (4.2) 496 (7.2) 50 (4.6) 512 (7.3)
Italy 59 (3.5) 544 (3.5) 24 (3.0) 538 (4.2) 16 (2.8) 540 (7.3)
Kuwait 29 (3.3) 398 (8.7) 56 (3.5) 401 (5.0) 15 (2.5) 395 (12.2)
Latvia 44 (3.9) 548 (4.2) 28 (3.8) 544 (4.7) 29 (3.8) 539 (4.0)
Lithuania 15 (3.1) 547 (7.2) 38 (4.4) 540 (4.6) 47 (4.5) 545 (3.9)
Macedonia, Rep. of 28 (3.7) 455 (10.4) 47 (4.7) 443 (9.0) 24 (3.9) 432 (12.3)
Moldova, Rep. of 34 (4.4) 502 (7.1) 38 (4.4) 484 (7.1) 28 (4.5) 488 (9.2)
Morocco 5 (2.1) 341 (38.2) 45 (4.8) 340 (12.4) 50 (5.2) 349 (11.1)
Netherlands 9 (2.4) 549 (10.8) 9 (2.6) 543 (7.1) 82 (3.3) 555 (2.7)
New Zealand 3 (1.5) 586 (32.6) 6 (2.4) 514 (16.1) 91 (2.8) 528 (3.9)
Norway 17 (3.4) 497 (6.9) 19 (3.3) 508 (6.4) 64 (4.4) 496 (3.7)
Romania 65 (3.9) 519 (6.5) 27 (3.7) 505 (7.6) 8 (2.5) 483 (11.8)
Russian Federation 82 (2.8) 532 (4.0) 11 (2.2) 499 (15.1) 8 (1.6) 528 (9.4)
Scotland 6 (2.6) 540 (10.4) 4 (2.0) 528 (25.2) 89 (3.3) 527 (4.2)
Singapore 27 (3.5) 520 (10.0) 41 (3.8) 536 (8.2) 32 (3.5) 528 (9.8)
Slovak Republic 38 (4.0) 524 (5.1) 31 (4.0) 518 (4.3) 30 (3.4) 511 (5.1)
Slovenia 49 (4.0) 502 (2.7) 38 (4.0) 500 (3.6) 13 (2.6) 506 (7.3)
Sweden 13 (2.6) 561 (6.1) 17 (2.4) 568 (3.7) 70 (2.9) 560 (2.6)
Turkey 11 (2.8) 478 (14.9) 55 (4.3) 458 (4.7) 34 (4.0) 427 (5.8)
United States 65 (4.9) 545 (5.0) 27 (4.9) 546 (5.2) 8 (1.9) 501 (11.5)
International Avg. 31 (0.6) 506 (1.9) 31 (0.6) 498 (1.5) 38 (0.6) 495 (1.3)
Countries
MonthlyWeekly 6 Times a Year or Less
AverageAchievement
Percent ofStudents
AverageAchievement
Percent ofStudents
AverageAchievement
Percent ofStudents
Background data provided by teachers.
( ) Standard errors appear in parentheses. Because results are rounded to the nearest wholenumber, some totals may appear inconsistent.
An “r” indicates data are available for 70-84% of the students. An “s” indicates data are avail-able for 50-69% of the students. An “x” indicates data are available for less than 50% ofthe students.
A dash (–) indicates data are not available. A tilde (~) indicates insufficient data to reportachievement.
ISC 4th GradePIRLS 2001
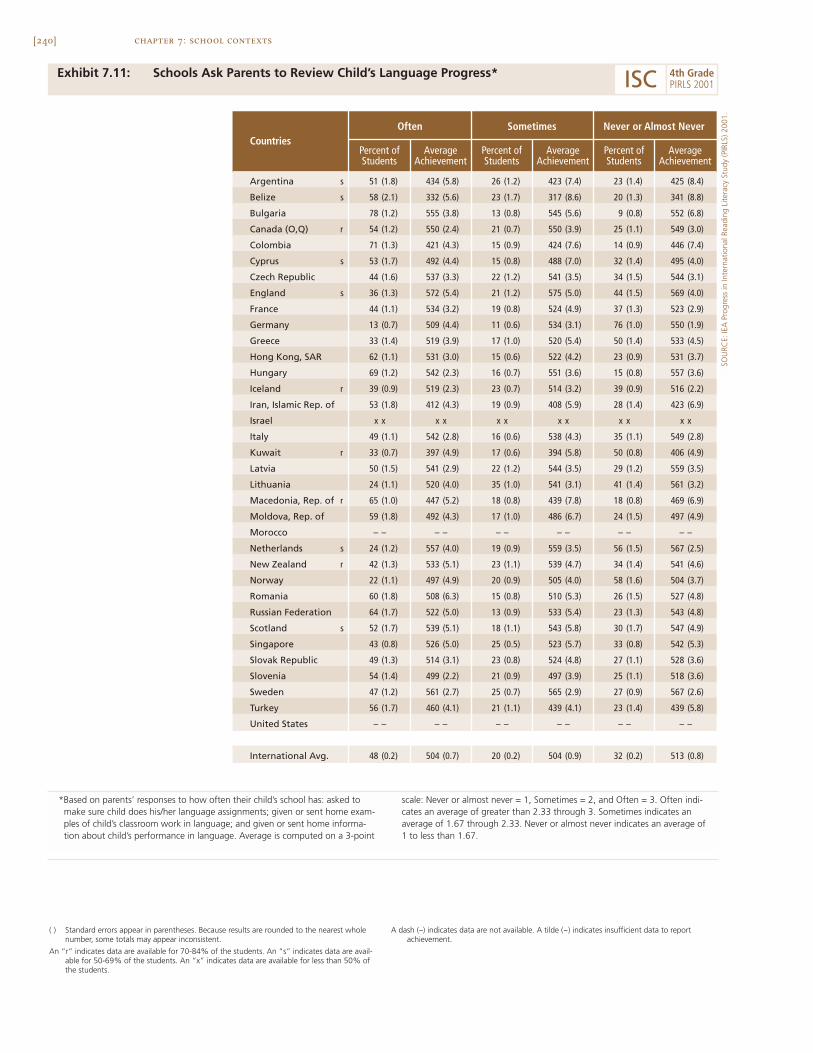
[240] chapter 7: school contexts
Exhibit 7.11: Schools Ask Parents to Review Child’s Language Progress*
Argentina s 51 (1.8) 434 (5.8) 26 (1.2) 423 (7.4) 23 (1.4) 425 (8.4)
Belize s 58 (2.1) 332 (5.6) 23 (1.7) 317 (8.6) 20 (1.3) 341 (8.8)
Bulgaria 78 (1.2) 555 (3.8) 13 (0.8) 545 (5.6) 9 (0.8) 552 (6.8)
Canada (O,Q) r 54 (1.2) 550 (2.4) 21 (0.7) 550 (3.9) 25 (1.1) 549 (3.0)
Colombia 71 (1.3) 421 (4.3) 15 (0.9) 424 (7.6) 14 (0.9) 446 (7.4)
Cyprus s 53 (1.7) 492 (4.4) 15 (0.8) 488 (7.0) 32 (1.4) 495 (4.0)
Czech Republic 44 (1.6) 537 (3.3) 22 (1.2) 541 (3.5) 34 (1.5) 544 (3.1)
England s 36 (1.3) 572 (5.4) 21 (1.2) 575 (5.0) 44 (1.5) 569 (4.0)
France 44 (1.1) 534 (3.2) 19 (0.8) 524 (4.9) 37 (1.3) 523 (2.9)
Germany 13 (0.7) 509 (4.4) 11 (0.6) 534 (3.1) 76 (1.0) 550 (1.9)
Greece 33 (1.4) 519 (3.9) 17 (1.0) 520 (5.4) 50 (1.4) 533 (4.5)
Hong Kong, SAR 62 (1.1) 531 (3.0) 15 (0.6) 522 (4.2) 23 (0.9) 531 (3.7)
Hungary 69 (1.2) 542 (2.3) 16 (0.7) 551 (3.6) 15 (0.8) 557 (3.6)
Iceland r 39 (0.9) 519 (2.3) 23 (0.7) 514 (3.2) 39 (0.9) 516 (2.2)
Iran, Islamic Rep. of 53 (1.8) 412 (4.3) 19 (0.9) 408 (5.9) 28 (1.4) 423 (6.9)
Israel x x x x x x x x x x x x
Italy 49 (1.1) 542 (2.8) 16 (0.6) 538 (4.3) 35 (1.1) 549 (2.8)
Kuwait r 33 (0.7) 397 (4.9) 17 (0.6) 394 (5.8) 50 (0.8) 406 (4.9)
Latvia 50 (1.5) 541 (2.9) 22 (1.2) 544 (3.5) 29 (1.2) 559 (3.5)
Lithuania 24 (1.1) 520 (4.0) 35 (1.0) 541 (3.1) 41 (1.4) 561 (3.2)
Macedonia, Rep. of r 65 (1.0) 447 (5.2) 18 (0.8) 439 (7.8) 18 (0.8) 469 (6.9)
Moldova, Rep. of 59 (1.8) 492 (4.3) 17 (1.0) 486 (6.7) 24 (1.5) 497 (4.9)
Morocco – – – – – – – – – – – –
Netherlands s 24 (1.2) 557 (4.0) 19 (0.9) 559 (3.5) 56 (1.5) 567 (2.5)
New Zealand r 42 (1.3) 533 (5.1) 23 (1.1) 539 (4.7) 34 (1.4) 541 (4.6)
Norway 22 (1.1) 497 (4.9) 20 (0.9) 505 (4.0) 58 (1.6) 504 (3.7)
Romania 60 (1.8) 508 (6.3) 15 (0.8) 510 (5.3) 26 (1.5) 527 (4.8)
Russian Federation 64 (1.7) 522 (5.0) 13 (0.9) 533 (5.4) 23 (1.3) 543 (4.8)
Scotland s 52 (1.7) 539 (5.1) 18 (1.1) 543 (5.8) 30 (1.7) 547 (4.9)
Singapore 43 (0.8) 526 (5.0) 25 (0.5) 523 (5.7) 33 (0.8) 542 (5.3)
Slovak Republic 49 (1.3) 514 (3.1) 23 (0.8) 524 (4.8) 27 (1.1) 528 (3.6)
Slovenia 54 (1.4) 499 (2.2) 21 (0.9) 497 (3.9) 25 (1.1) 518 (3.6)
Sweden 47 (1.2) 561 (2.7) 25 (0.7) 565 (2.9) 27 (0.9) 567 (2.6)
Turkey 56 (1.7) 460 (4.1) 21 (1.1) 439 (4.1) 23 (1.4) 439 (5.8)
United States – – – – – – – – – – – –
International Avg. 48 (0.2) 504 (0.7) 20 (0.2) 504 (0.9) 32 (0.2) 513 (0.8)
CountriesOften Sometimes Never or Almost Never
AverageAchievement
Percent ofStudents
AverageAchievement
Percent ofStudents
AverageAchievement
Percent ofStudents
( ) Standard errors appear in parentheses. Because results are rounded to the nearest wholenumber, some totals may appear inconsistent.
An “r” indicates data are available for 70-84% of the students. An “s” indicates data are avail-able for 50-69% of the students. An “x” indicates data are available for less than 50% ofthe students.
A dash (–) indicates data are not available. A tilde (~) indicates insufficient data to reportachievement.
SOU
RCE:
IEA
Pro
gres
s in
Inte
rnat
iona
l Rea
ding
Lite
racy
Stu
dy (P
IRLS
) 200
1.
ISC 4th GradePIRLS 2001
*Based on parents’ responses to how often their child’s school has: asked tomake sure child does his/her language assignments; given or sent home exam-ples of child’s classroom work in language; and given or sent home informa-tion about child’s performance in language. Average is computed on a 3-point
scale: Never or almost never = 1, Sometimes = 2, and Often = 3. Often indi-cates an average of greater than 2.33 through 3. Sometimes indicates anaverage of 1.67 through 2.33. Never or almost never indicates an average of1 to less than 1.67.
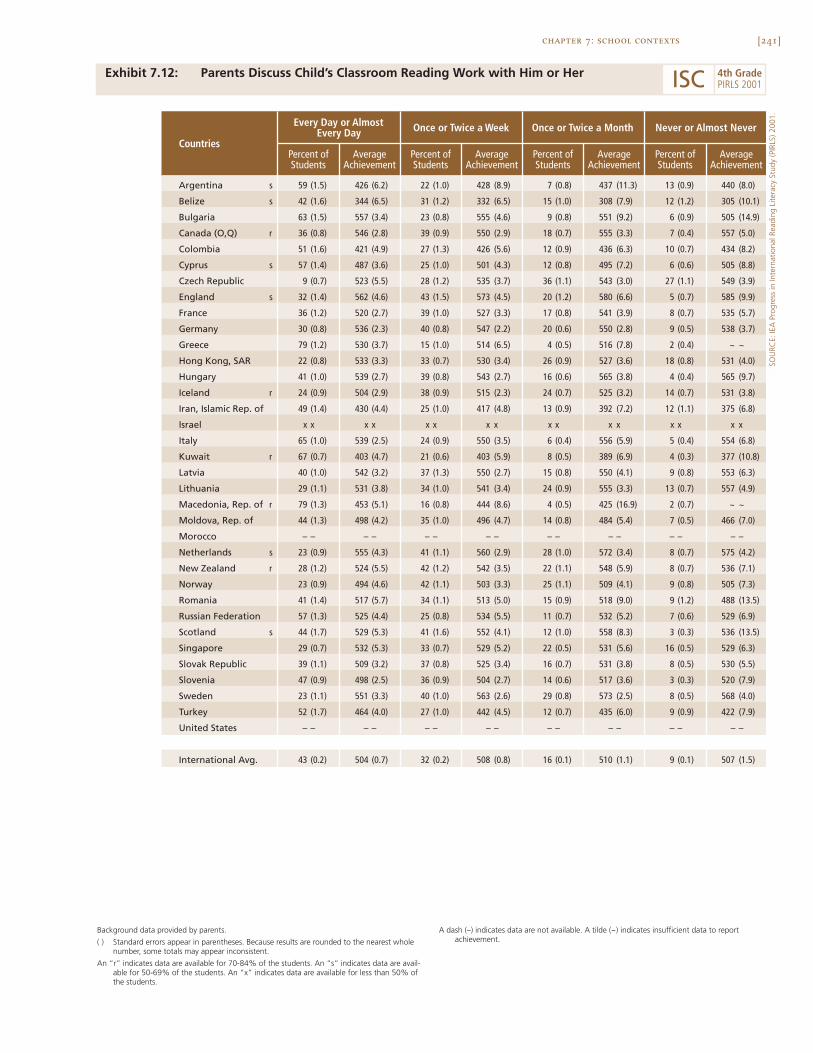
[241]chapter 7: school contexts
Exhibit 7.12: Parents Discuss Child’s Classroom Reading Work with Him or Her
SOU
RCE:
IEA
Pro
gres
s in
Inte
rnat
iona
l Rea
ding
Lite
racy
Stu
dy (P
IRLS
) 200
1.
Argentina s 59 (1.5) 426 (6.2) 22 (1.0) 428 (8.9) 7 (0.8) 437 (11.3) 13 (0.9) 440 (8.0)
Belize s 42 (1.6) 344 (6.5) 31 (1.2) 332 (6.5) 15 (1.0) 308 (7.9) 12 (1.2) 305 (10.1)
Bulgaria 63 (1.5) 557 (3.4) 23 (0.8) 555 (4.6) 9 (0.8) 551 (9.2) 6 (0.9) 505 (14.9)
Canada (O,Q) r 36 (0.8) 546 (2.8) 39 (0.9) 550 (2.9) 18 (0.7) 555 (3.3) 7 (0.4) 557 (5.0)
Colombia 51 (1.6) 421 (4.9) 27 (1.3) 426 (5.6) 12 (0.9) 436 (6.3) 10 (0.7) 434 (8.2)
Cyprus s 57 (1.4) 487 (3.6) 25 (1.0) 501 (4.3) 12 (0.8) 495 (7.2) 6 (0.6) 505 (8.8)
Czech Republic 9 (0.7) 523 (5.5) 28 (1.2) 535 (3.7) 36 (1.1) 543 (3.0) 27 (1.1) 549 (3.9)
England s 32 (1.4) 562 (4.6) 43 (1.5) 573 (4.5) 20 (1.2) 580 (6.6) 5 (0.7) 585 (9.9)
France 36 (1.2) 520 (2.7) 39 (1.0) 527 (3.3) 17 (0.8) 541 (3.9) 8 (0.7) 535 (5.7)
Germany 30 (0.8) 536 (2.3) 40 (0.8) 547 (2.2) 20 (0.6) 550 (2.8) 9 (0.5) 538 (3.7)
Greece 79 (1.2) 530 (3.7) 15 (1.0) 514 (6.5) 4 (0.5) 516 (7.8) 2 (0.4) ~ ~
Hong Kong, SAR 22 (0.8) 533 (3.3) 33 (0.7) 530 (3.4) 26 (0.9) 527 (3.6) 18 (0.8) 531 (4.0)
Hungary 41 (1.0) 539 (2.7) 39 (0.8) 543 (2.7) 16 (0.6) 565 (3.8) 4 (0.4) 565 (9.7)
Iceland r 24 (0.9) 504 (2.9) 38 (0.9) 515 (2.3) 24 (0.7) 525 (3.2) 14 (0.7) 531 (3.8)
Iran, Islamic Rep. of 49 (1.4) 430 (4.4) 25 (1.0) 417 (4.8) 13 (0.9) 392 (7.2) 12 (1.1) 375 (6.8)
Israel x x x x x x x x x x x x x x x x
Italy 65 (1.0) 539 (2.5) 24 (0.9) 550 (3.5) 6 (0.4) 556 (5.9) 5 (0.4) 554 (6.8)
Kuwait r 67 (0.7) 403 (4.7) 21 (0.6) 403 (5.9) 8 (0.5) 389 (6.9) 4 (0.3) 377 (10.8)
Latvia 40 (1.0) 542 (3.2) 37 (1.3) 550 (2.7) 15 (0.8) 550 (4.1) 9 (0.8) 553 (6.3)
Lithuania 29 (1.1) 531 (3.8) 34 (1.0) 541 (3.4) 24 (0.9) 555 (3.3) 13 (0.7) 557 (4.9)
Macedonia, Rep. of r 79 (1.3) 453 (5.1) 16 (0.8) 444 (8.6) 4 (0.5) 425 (16.9) 2 (0.7) ~ ~
Moldova, Rep. of 44 (1.3) 498 (4.2) 35 (1.0) 496 (4.7) 14 (0.8) 484 (5.4) 7 (0.5) 466 (7.0)
Morocco – – – – – – – – – – – – – – – –
Netherlands s 23 (0.9) 555 (4.3) 41 (1.1) 560 (2.9) 28 (1.0) 572 (3.4) 8 (0.7) 575 (4.2)
New Zealand r 28 (1.2) 524 (5.5) 42 (1.2) 542 (3.5) 22 (1.1) 548 (5.9) 8 (0.7) 536 (7.1)
Norway 23 (0.9) 494 (4.6) 42 (1.1) 503 (3.3) 25 (1.1) 509 (4.1) 9 (0.8) 505 (7.3)
Romania 41 (1.4) 517 (5.7) 34 (1.1) 513 (5.0) 15 (0.9) 518 (9.0) 9 (1.2) 488 (13.5)
Russian Federation 57 (1.3) 525 (4.4) 25 (0.8) 534 (5.5) 11 (0.7) 532 (5.2) 7 (0.6) 529 (6.9)
Scotland s 44 (1.7) 529 (5.3) 41 (1.6) 552 (4.1) 12 (1.0) 558 (8.3) 3 (0.3) 536 (13.5)
Singapore 29 (0.7) 532 (5.3) 33 (0.7) 529 (5.2) 22 (0.5) 531 (5.6) 16 (0.5) 529 (6.3)
Slovak Republic 39 (1.1) 509 (3.2) 37 (0.8) 525 (3.4) 16 (0.7) 531 (3.8) 8 (0.5) 530 (5.5)
Slovenia 47 (0.9) 498 (2.5) 36 (0.9) 504 (2.7) 14 (0.6) 517 (3.6) 3 (0.3) 520 (7.9)
Sweden 23 (1.1) 551 (3.3) 40 (1.0) 563 (2.6) 29 (0.8) 573 (2.5) 8 (0.5) 568 (4.0)
Turkey 52 (1.7) 464 (4.0) 27 (1.0) 442 (4.5) 12 (0.7) 435 (6.0) 9 (0.9) 422 (7.9)
United States – – – – – – – – – – – – – – – –
International Avg. 43 (0.2) 504 (0.7) 32 (0.2) 508 (0.8) 16 (0.1) 510 (1.1) 9 (0.1) 507 (1.5)
Countries
Once or Twice a Week Once or Twice a Month Never or Almost NeverEvery Day or AlmostEvery Day
AverageAchievement
Percent ofStudents
AverageAchievement
Percent ofStudents
AverageAchievement
Percent ofStudents
AverageAchievement
Percent ofStudents
Background data provided by parents.
( ) Standard errors appear in parentheses. Because results are rounded to the nearest wholenumber, some totals may appear inconsistent.
An “r” indicates data are available for 70-84% of the students. An “s” indicates data are avail-able for 50-69% of the students. An “x” indicates data are available for less than 50% ofthe students.
A dash (–) indicates data are not available. A tilde (~) indicates insufficient data to reportachievement.
ISC 4th GradePIRLS 2001
[242]
How Serious Is Absenteeism in Schools?
Principals’ reports on the seriousness of absenteeism in their schools are detailedin Exhibit 7.13. Absenteeism did not appear to be prevalent among fourthgraders. On average, internationally, almost four-fifths of students attendedschools where absenteeism was reported to be either a minor problem or nota problem. In only Kuwait and Morocco were one-third or more of the stu-dents in schools reporting absenteeism as a serious problem.
What Are the Perceptions of School Climate?
The school environment establishes the climate for learning. To measure theextent to which schools offer a positive school climate, PIRLS created an Indexof Principals’ Perceptions of School Climate, shown in Exhibit 7.14. On a scalefrom very high to very low, the index was based on principals’ characteriza-tions of the following: teachers’ job satisfaction, teachers’ expectations forstudent achievement, parental support for student achievement, students’regard for school property, and students’ desire to do well in school. Principalsof students at the high category had an average response of “high” or “veryhigh”. Students’ principals characterized school climate as “medium” at themedium level, and “low” or “very low” at the low level.
Internationally, on average, about one-third of the students (36%) werein the high category and the majority (62%) were in the medium category –only 2 percent internationally were at the low level. Students in schools thatreported having a high level of principals’ perceptions of school climate gen-erally had higher average reading achievement than those in schools wherethe perception of school climate was less positive. In Iceland, Norway, Cyprus,New Zealand, Scotland, and the United States, more than 60 percent of stu-dents attended schools perceived by the principals to have high morale, highacademic expectations, regard for school property, and a high level of parentalsupport.
chapter 7: school contexts

[243]chapter 7: school contexts
Exhibit 7.13: Seriousness of Absenteeism in Schools
SOU
RCE:
IEA
Pro
gres
s in
Inte
rnat
iona
l Rea
ding
Lite
racy
Stu
dy (P
IRLS
) 200
1.
Argentina 31 (4.5) 442 (9.1) 35 (4.5) 423 (11.9) 23 (4.1) 398 (9.8) 11 (2.9) 372 (16.9)
Belize 4 (1.3) 311 (18.8) 49 (7.8) 337 (11.9) 35 (7.0) 318 (15.9) 12 (3.6) 309 (14.9)
Bulgaria 21 (3.1) 547 (8.7) 35 (3.8) 558 (5.7) 32 (4.0) 552 (5.8) 12 (2.7) 527 (18.0)
Canada (O,Q) 45 (3.4) 551 (2.9) 46 (3.2) 544 (2.9) 8 (2.0) 504 (5.6) 1 (0.5) ~ ~
Colombia 10 (2.5) 459 (10.4) 42 (5.0) 430 (8.2) 30 (4.9) 427 (7.6) 18 (3.0) 382 (12.8)
Cyprus r 69 (4.7) 496 (3.8) 25 (4.9) 483 (6.4) 2 (0.9) ~ ~ 4 (2.1) 521 (8.2)
Czech Republic 29 (3.3) 538 (4.6) 62 (3.9) 538 (3.0) 8 (2.2) 527 (5.8) 0 (0.0) ~ ~
England – – – – – – – – – – – – – – – –
France 50 (5.3) 530 (4.0) 40 (5.3) 525 (4.6) 10 (2.6) 505 (5.8) 1 (0.9) ~ ~
Germany 45 (4.5) 546 (3.3) 45 (4.9) 538 (2.9) 9 (2.5) 517 (6.9) 1 (0.6) ~ ~
Greece r 48 (4.9) 532 (5.5) 43 (5.2) 526 (7.0) 2 (1.2) ~ ~ 6 (2.6) 520 (12.0)
Hong Kong, SAR 78 (4.1) 530 (3.2) 20 (4.0) 526 (8.0) 1 (1.0) ~ ~ 0 (0.0) ~ ~
Hungary 15 (2.7) 549 (5.6) 77 (3.4) 546 (2.8) 7 (2.2) 524 (12.3) 1 (0.9) ~ ~
Iceland r 39 (0.4) 516 (2.1) 52 (0.4) 509 (2.0) 9 (0.3) 511 (4.6) 0 (0.0) ~ ~
Iran, Islamic Rep. of 36 (3.9) 433 (9.6) 36 (4.2) 408 (7.3) 15 (3.8) 394 (13.3) 13 (3.3) 400 (13.0)
Israel 36 (4.1) 510 (6.3) 48 (4.6) 516 (6.7) 11 (2.6) 494 (15.3) 5 (1.4) 444 (36.1)
Italy 42 (3.6) 546 (3.4) 32 (3.7) 540 (4.7) 14 (2.9) 530 (6.2) 12 (2.2) 537 (8.2)
Kuwait 6 (1.7) 394 (5.1) 30 (4.3) 398 (7.2) 22 (3.5) 409 (5.6) 42 (4.7) 398 (9.4)
Latvia 19 (3.4) 545 (6.0) 64 (3.9) 545 (3.1) 15 (3.5) 541 (7.8) 2 (1.3) ~ ~
Lithuania 23 (3.5) 543 (6.9) 47 (4.1) 547 (3.5) 22 (3.7) 539 (5.0) 7 (2.3) 538 (11.0)
Macedonia, Rep. of 12 (2.8) 421 (11.8) 59 (4.0) 451 (6.3) 22 (3.8) 448 (14.2) 7 (2.2) 361 (15.1)
Moldova, Rep. of 10 (2.7) 512 (12.2) 39 (4.3) 493 (7.3) 43 (4.4) 486 (6.8) 8 (2.8) 498 (14.1)
Morocco 17 (2.9) 334 (13.4) 20 (3.6) 335 (18.7) 26 (4.7) 359 (27.9) 38 (4.7) 354 (15.3)
Netherlands 67 (4.6) 556 (2.6) 29 (4.2) 548 (6.2) 4 (1.8) 552 (12.5) 0 (0.0) ~ ~
New Zealand 40 (4.0) 557 (5.7) 51 (4.2) 518 (5.3) 8 (2.1) 477 (8.5) 1 (0.9) ~ ~
Norway 63 (4.9) 505 (3.4) 33 (4.8) 488 (4.9) 3 (1.7) 504 (19.8) 0 (0.0) ~ ~
Romania 31 (3.9) 520 (8.1) 41 (4.7) 515 (8.8) 23 (3.7) 504 (7.6) 5 (1.8) 478 (22.4)
Russian Federation 41 (3.8) 539 (4.5) 56 (3.8) 522 (6.9) 2 (0.9) ~ ~ 1 (0.6) ~ ~
Scotland 68 (4.7) 539 (4.3) 26 (5.0) 507 (6.9) 6 (2.6) 488 (7.9) 0 (0.0) ~ ~
Singapore 55 (3.7) 538 (7.8) 43 (3.9) 517 (7.9) 3 (1.3) 495 (37.3) 0 (0.0) ~ ~
Slovak Republic 28 (3.4) 528 (4.7) 43 (4.0) 519 (4.1) 22 (3.3) 512 (6.4) 8 (2.2) 494 (18.9)
Slovenia 19 (3.6) 499 (5.4) 76 (3.9) 502 (2.3) 4 (1.7) 496 (11.3) 0 (0.0) ~ ~
Sweden 61 (4.6) 563 (2.8) 30 (4.5) 560 (4.2) 7 (2.2) 550 (10.2) 1 (1.0) ~ ~
Turkey 20 (3.1) 482 (9.2) 38 (4.1) 454 (4.9) 23 (3.6) 429 (9.3) 19 (3.2) 430 (6.0)
United States 25 (3.3) 567 (5.7) 60 (4.7) 546 (5.0) 14 (3.0) 500 (7.5) 1 (0.7) ~ ~
International Avg. 35 (0.6) 505 (1.3) 43 (0.8) 497 (1.2) 14 (0.5) 483 (3.2) 7 (0.4) 445 (3.4)
Minor Problem Moderate Problem Serious ProblemNot a Problem
CountriesAverage
AchievementPercent ofStudents
AverageAchievement
Percent ofStudents
AverageAchievement
Percent ofStudents
AverageAchievement
Percent ofStudents
Background data provided by schools.
( ) Standard errors appear in parentheses. Because results are rounded to the nearest wholenumber, some totals may appear inconsistent.
An “r” indicates data are available for 70-84% of the students. An “s” indicates data are avail-able for 50-69% of the students. An “x” indicates data are available for less than 50% of thestudents.
A dash (–) indicates data are not available. A tilde (~) indicates insufficient data to reportachievement.
ISC 4th GradePIRLS 2001

[244] chapter 7: school contexts
Exhibit 7.14: Index of Principals’ Perceptions of School Climate (PPSC)
Iceland r 77 (0.3) 514 (1.4) 23 (0.3) 504 (2.7) 0 (0.0) ~ ~
Norway 72 (3.6) 505 (3.4) 28 (3.6) 486 (4.5) 0 (0.0) ~ ~
Cyprus 66 (4.0) 499 (3.7) 34 (4.0) 487 (6.7) 0 (0.0) ~ ~
New Zealand 63 (4.1) 541 (5.3) 36 (4.0) 511 (6.1) 0 (0.0) ~ ~
Scotland 63 (4.8) 537 (5.0) 37 (4.8) 509 (5.4) 0 (0.0) ~ ~
United States 62 (4.9) 557 (4.4) 37 (4.9) 523 (5.9) 1 (0.7) ~ ~
Singapore 59 (3.8) 536 (7.3) 41 (3.8) 517 (7.8) 0 (0.0) ~ ~
Greece 57 (4.8) 535 (4.3) 42 (4.8) 509 (4.5) 1 (0.7) ~ ~
Canada (O,Q) 57 (3.7) 552 (3.1) 42 (3.6) 534 (2.8) 1 (0.5) ~ ~
Sweden 56 (5.2) 566 (3.1) 44 (5.2) 554 (3.5) 0 (0.0) ~ ~
Argentina 51 (4.9) 439 (9.5) 49 (4.9) 396 (7.4) 0 (0.0) ~ ~
Hong Kong, SAR 47 (4.6) 532 (3.5) 53 (4.6) 526 (4.8) 0 (0.0) ~ ~
Iran, Islamic Rep. of 45 (4.6) 433 (7.6) 52 (4.8) 399 (4.4) 3 (1.4) 370 (15.5)
France 41 (4.8) 536 (4.1) 58 (4.9) 519 (3.5) 1 (1.2) ~ ~
Romania 33 (4.3) 533 (7.3) 67 (4.3) 502 (5.9) 0 (0.0) ~ ~
Kuwait 33 (4.3) 405 (7.8) 63 (4.8) 404 (4.9) 4 (2.3) 305 (4.4)
Macedonia, Rep. of 27 (3.7) 462 (10.9) 71 (3.8) 433 (6.0) 1 (0.9) ~ ~
Colombia 27 (4.5) 437 (9.0) 69 (4.8) 420 (6.0) 4 (1.9) 362 (34.2)
Moldova, Rep. of 27 (3.5) 505 (7.1) 73 (3.5) 486 (5.2) 0 (0.0) ~ ~
Slovenia 24 (3.7) 506 (3.9) 76 (3.7) 500 (2.6) 0 (0.0) ~ ~
Germany 24 (3.8) 555 (4.4) 76 (3.8) 534 (2.0) 0 (0.0) ~ ~
Netherlands 21 (4.3) 566 (4.3) 79 (4.3) 550 (3.1) 0 (0.0) ~ ~
Belize 21 (6.1) 347 (24.9) 74 (6.5) 320 (8.6) 5 (2.5) 325 (18.1)
Russian Federation 20 (2.9) 539 (9.0) 80 (2.9) 525 (4.6) 0 (0.0) ~ ~
Italy 19 (2.7) 544 (6.1) 80 (2.8) 540 (2.8) 1 (0.0) ~ ~
Hungary 19 (3.3) 560 (4.9) 80 (3.3) 542 (2.7) 1 (0.6) ~ ~
Turkey 18 (3.0) 477 (8.0) 68 (3.5) 447 (4.4) 13 (2.9) 425 (7.3)
Bulgaria 15 (2.9) 580 (7.7) 73 (3.6) 551 (4.7) 12 (2.7) 505 (18.2)
Morocco 13 (2.3) 382 (22.7) 78 (3.8) 346 (12.6) 9 (3.0) 329 (20.0)
Lithuania 12 (2.9) 553 (10.2) 88 (2.9) 542 (2.5) 0 (0.0) ~ ~
Slovak Republic 10 (2.7) 528 (7.4) 87 (3.0) 518 (3.1) 3 (1.3) 484 (11.9)
Latvia 8 (2.2) 569 (5.1) 90 (2.4) 542 (2.4) 1 (0.9) ~ ~
Czech Republic 6 (2.4) 536 (8.2) 89 (3.0) 538 (2.4) 5 (1.7) 532 (5.0)
England – – – – – – – – – – – –
Israel – – – – – – – – – – – –
International Avg. 36 (0.7) 511 (1.5) 62 (0.7) 491 (0.9) 2 (0.2) ~ ~
Countries
HighPPSC
MediumPPSC
LowPPSC
Percent ofStudents
AverageAchievement
Percent ofStudents
AverageAchievement
Percent ofStudents
AverageAchievement
0 10050 7525
Percentage of Studentsat High Level of PPSC
( ) Standard errors appear in parentheses. Because results are rounded to the nearest wholenumber, some totals may appear inconsistent.
An “r” indicates data are available for 70-84% of the students. An “s” indicates data are avail-able for 50-69% of the students. An “x” indicates data are available for less than 50% of thestudents.
A dash (–) indicates data are not available. A tilde (~) indicates insufficient data to reportachievement.
SOU
RCE:
IEA
Pro
gres
s in
Inte
rnat
iona
l Rea
ding
Lite
racy
Stu
dy (P
IRLS
) 200
1.
ISC 4th GradePIRLS 2001
Index of Principal’s Perceptions of School Climate
Based on principals’ characterization in their school: teachers’job satisfaction; teachers’ expectations for student achieve-ment; parental support for student achievement; students’regard for school property; and students’ desire to do well inschool. Average is computed on a 5-point scale: Very high = 1,
High = 2, Medium = 3, Low = 4, and Very low = 5. High levelindicates an average of 1 to less than 2.33. Medium level indi-cates an average of 2.33 through 3.67. Low level indicates anaverage of greater than 3.67 through 5.
[245]chapter 7: school contexts
How Safe Are Schools?
Safety is key for fostering a positive learning environment in schools. PIRLSasked both students and principals to characterize their perceptions of safetyin their schools. Students’ reports of feeling safe at school are presented inExhibit 7.15. When asked how much they agreed with the statement “I feelsafe when I’m in school”, an average of 89 percent of students internationallyagreed either a little or a lot. In Germany, Hong Kong, Iceland, Moldova, andThe Netherlands, 15 percent or more of students disagreed or disagreed a lotwith the statement.
Exhibit 7.16 presents results of students’ affirmative responses to inci-dents of stealing, bullying, and hitting or hurting at school during the monthprior to testing. On average, internationally, the same proportions of studentsreported incidents of stealing, bullying and hitting, with more students report-ing something happening to someone in their class rather than to them as indi-viduals. About 60 percent or more of students in Argentina, Belize, Israel, andNew Zealand reported that incidents of stealing, bullying, and hitting orhurting had occurred against their classmates within the past month. The rel-atively high percentage of students reporting incidents in their classes seemsto be in contradiction with students’ overall feeling of safety. Students mayhave different interpretations of the types of behaviors that warranted a “yes”response. Furthermore, classroom teachers or school principals may haveaddressed events in the classroom in a manner that made the students feelsafe.
PIRLS developed an Index of Principals’ Perceptions of School Safetybased on principals’ responses to the severity of seven behavioral problemswithin school. These problems include classroom disturbances, cheating, pro-fanity, vandalism, theft, intimidation or verbal abuse of other students, andphysical conflict among students. Details of the index are shown in Exhibit7.17. Students in the high category attended schools where principals ratedall behaviors as not a problem. A low level indicates that all behaviors werereported to be serious problems, and the medium level indicates all other com-binations of severity among the problems. Several countries had more thanhalf the students at the high level. On average, internationally, only 6 percent

[246]
of students were in schools where principals’ characterizations of school safetywere at the low level. Morocco and Kuwait were the only countries with morethan one-third of the students at the low level, where behavioral problemswere perceived as being serious problems.
chapter 7: school contexts
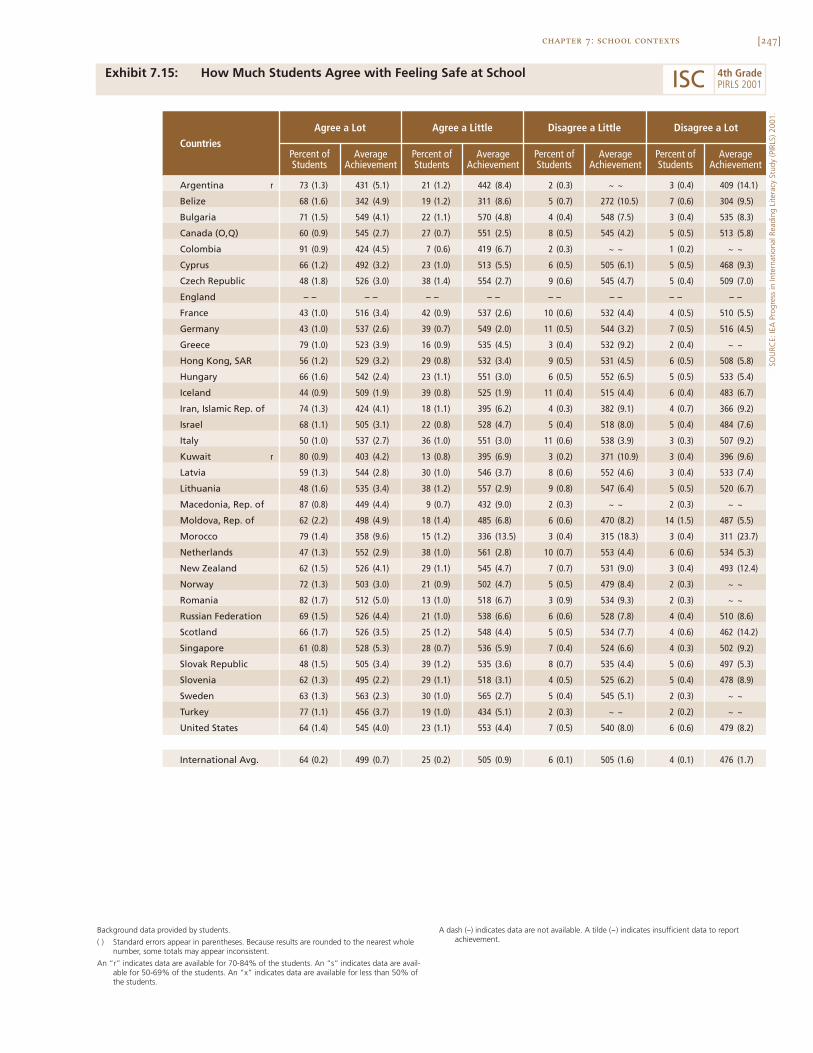
[247]chapter 7: school contexts
Exhibit 7.15: How Much Students Agree with Feeling Safe at School
SOU
RCE:
IEA
Pro
gres
s in
Inte
rnat
iona
l Rea
ding
Lite
racy
Stu
dy (P
IRLS
) 200
1.
Argentina r 73 (1.3) 431 (5.1) 21 (1.2) 442 (8.4) 2 (0.3) ~ ~ 3 (0.4) 409 (14.1)
Belize 68 (1.6) 342 (4.9) 19 (1.2) 311 (8.6) 5 (0.7) 272 (10.5) 7 (0.6) 304 (9.5)
Bulgaria 71 (1.5) 549 (4.1) 22 (1.1) 570 (4.8) 4 (0.4) 548 (7.5) 3 (0.4) 535 (8.3)
Canada (O,Q) 60 (0.9) 545 (2.7) 27 (0.7) 551 (2.5) 8 (0.5) 545 (4.2) 5 (0.5) 513 (5.8)
Colombia 91 (0.9) 424 (4.5) 7 (0.6) 419 (6.7) 2 (0.3) ~ ~ 1 (0.2) ~ ~
Cyprus 66 (1.2) 492 (3.2) 23 (1.0) 513 (5.5) 6 (0.5) 505 (6.1) 5 (0.5) 468 (9.3)
Czech Republic 48 (1.8) 526 (3.0) 38 (1.4) 554 (2.7) 9 (0.6) 545 (4.7) 5 (0.4) 509 (7.0)
England – – – – – – – – – – – – – – – –
France 43 (1.0) 516 (3.4) 42 (0.9) 537 (2.6) 10 (0.6) 532 (4.4) 4 (0.5) 510 (5.5)
Germany 43 (1.0) 537 (2.6) 39 (0.7) 549 (2.0) 11 (0.5) 544 (3.2) 7 (0.5) 516 (4.5)
Greece 79 (1.0) 523 (3.9) 16 (0.9) 535 (4.5) 3 (0.4) 532 (9.2) 2 (0.4) ~ ~
Hong Kong, SAR 56 (1.2) 529 (3.2) 29 (0.8) 532 (3.4) 9 (0.5) 531 (4.5) 6 (0.5) 508 (5.8)
Hungary 66 (1.6) 542 (2.4) 23 (1.1) 551 (3.0) 6 (0.5) 552 (6.5) 5 (0.5) 533 (5.4)
Iceland 44 (0.9) 509 (1.9) 39 (0.8) 525 (1.9) 11 (0.4) 515 (4.4) 6 (0.4) 483 (6.7)
Iran, Islamic Rep. of 74 (1.3) 424 (4.1) 18 (1.1) 395 (6.2) 4 (0.3) 382 (9.1) 4 (0.7) 366 (9.2)
Israel 68 (1.1) 505 (3.1) 22 (0.8) 528 (4.7) 5 (0.4) 518 (8.0) 5 (0.4) 484 (7.6)
Italy 50 (1.0) 537 (2.7) 36 (1.0) 551 (3.0) 11 (0.6) 538 (3.9) 3 (0.3) 507 (9.2)
Kuwait r 80 (0.9) 403 (4.2) 13 (0.8) 395 (6.9) 3 (0.2) 371 (10.9) 3 (0.4) 396 (9.6)
Latvia 59 (1.3) 544 (2.8) 30 (1.0) 546 (3.7) 8 (0.6) 552 (4.6) 3 (0.4) 533 (7.4)
Lithuania 48 (1.6) 535 (3.4) 38 (1.2) 557 (2.9) 9 (0.8) 547 (6.4) 5 (0.5) 520 (6.7)
Macedonia, Rep. of 87 (0.8) 449 (4.4) 9 (0.7) 432 (9.0) 2 (0.3) ~ ~ 2 (0.3) ~ ~
Moldova, Rep. of 62 (2.2) 498 (4.9) 18 (1.4) 485 (6.8) 6 (0.6) 470 (8.2) 14 (1.5) 487 (5.5)
Morocco 79 (1.4) 358 (9.6) 15 (1.2) 336 (13.5) 3 (0.4) 315 (18.3) 3 (0.4) 311 (23.7)
Netherlands 47 (1.3) 552 (2.9) 38 (1.0) 561 (2.8) 10 (0.7) 553 (4.4) 6 (0.6) 534 (5.3)
New Zealand 62 (1.5) 526 (4.1) 29 (1.1) 545 (4.7) 7 (0.7) 531 (9.0) 3 (0.4) 493 (12.4)
Norway 72 (1.3) 503 (3.0) 21 (0.9) 502 (4.7) 5 (0.5) 479 (8.4) 2 (0.3) ~ ~
Romania 82 (1.7) 512 (5.0) 13 (1.0) 518 (6.7) 3 (0.9) 534 (9.3) 2 (0.3) ~ ~
Russian Federation 69 (1.5) 526 (4.4) 21 (1.0) 538 (6.6) 6 (0.6) 528 (7.8) 4 (0.4) 510 (8.6)
Scotland 66 (1.7) 526 (3.5) 25 (1.2) 548 (4.4) 5 (0.5) 534 (7.7) 4 (0.6) 462 (14.2)
Singapore 61 (0.8) 528 (5.3) 28 (0.7) 536 (5.9) 7 (0.4) 524 (6.6) 4 (0.3) 502 (9.2)
Slovak Republic 48 (1.5) 505 (3.4) 39 (1.2) 535 (3.6) 8 (0.7) 535 (4.4) 5 (0.6) 497 (5.3)
Slovenia 62 (1.3) 495 (2.2) 29 (1.1) 518 (3.1) 4 (0.5) 525 (6.2) 5 (0.4) 478 (8.9)
Sweden 63 (1.3) 563 (2.3) 30 (1.0) 565 (2.7) 5 (0.4) 545 (5.1) 2 (0.3) ~ ~
Turkey 77 (1.1) 456 (3.7) 19 (1.0) 434 (5.1) 2 (0.3) ~ ~ 2 (0.2) ~ ~
United States 64 (1.4) 545 (4.0) 23 (1.1) 553 (4.4) 7 (0.5) 540 (8.0) 6 (0.6) 479 (8.2)
International Avg. 64 (0.2) 499 (0.7) 25 (0.2) 505 (0.9) 6 (0.1) 505 (1.6) 4 (0.1) 476 (1.7)
Agree a Little Disagree a Little Disagree a LotAgree a Lot
AverageAchievement
Percent ofStudents
CountriesAverage
AchievementPercent ofStudents
AverageAchievement
Percent ofStudents
AverageAchievement
Percent ofStudents
Background data provided by students.
( ) Standard errors appear in parentheses. Because results are rounded to the nearest wholenumber, some totals may appear inconsistent.
An “r” indicates data are available for 70-84% of the students. An “s” indicates data are avail-able for 50-69% of the students. An “x” indicates data are available for less than 50% ofthe students.
A dash (–) indicates data are not available. A tilde (~) indicates insufficient data to reportachievement.
ISC 4th GradePIRLS 2001
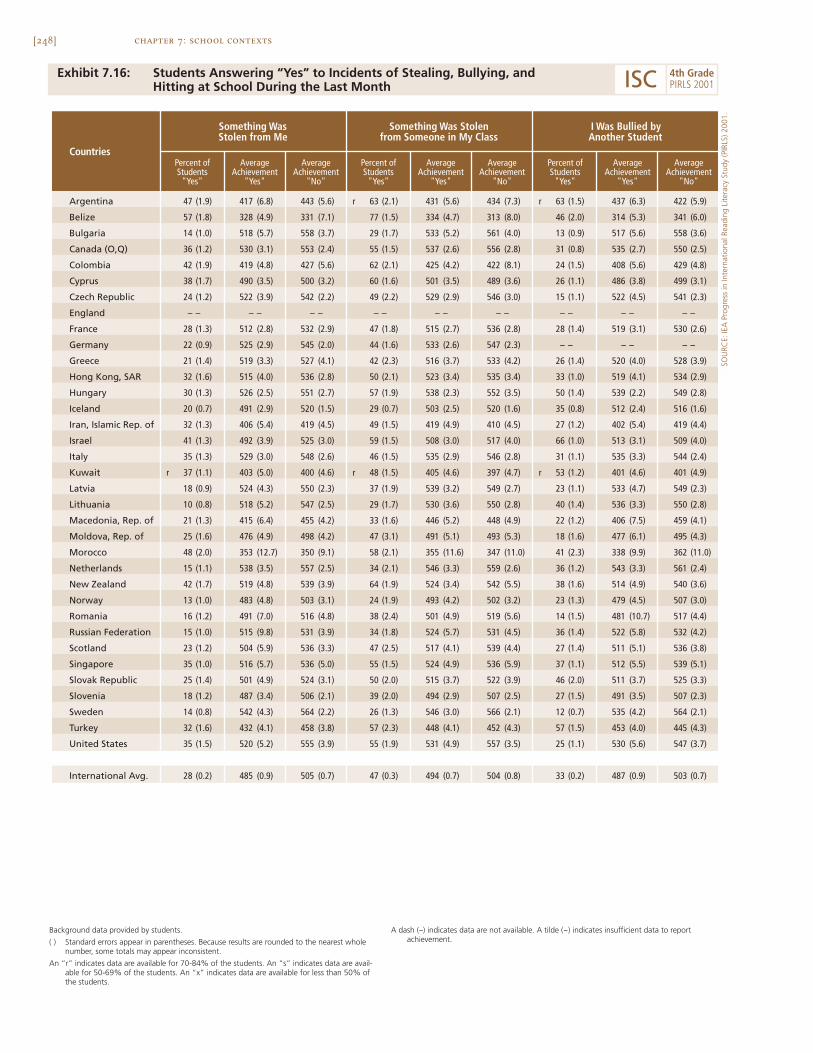
[248] chapter 7: school contexts
Exhibit 7.16: Students Answering “Yes” to Incidents of Stealing, Bullying, andHitting at School During the Last Month
Argentina 47 (1.9) 417 (6.8) 443 (5.6) r 63 (2.1) 431 (5.6) 434 (7.3) r 63 (1.5) 437 (6.3) 422 (5.9)
Belize 57 (1.8) 328 (4.9) 331 (7.1) 77 (1.5) 334 (4.7) 313 (8.0) 46 (2.0) 314 (5.3) 341 (6.0)
Bulgaria 14 (1.0) 518 (5.7) 558 (3.7) 29 (1.7) 533 (5.2) 561 (4.0) 13 (0.9) 517 (5.6) 558 (3.6)
Canada (O,Q) 36 (1.2) 530 (3.1) 553 (2.4) 55 (1.5) 537 (2.6) 556 (2.8) 31 (0.8) 535 (2.7) 550 (2.5)
Colombia 42 (1.9) 419 (4.8) 427 (5.6) 62 (2.1) 425 (4.2) 422 (8.1) 24 (1.5) 408 (5.6) 429 (4.8)
Cyprus 38 (1.7) 490 (3.5) 500 (3.2) 60 (1.6) 501 (3.5) 489 (3.6) 26 (1.1) 486 (3.8) 499 (3.1)
Czech Republic 24 (1.2) 522 (3.9) 542 (2.2) 49 (2.2) 529 (2.9) 546 (3.0) 15 (1.1) 522 (4.5) 541 (2.3)
England – – – – – – – – – – – – – – – – – –
France 28 (1.3) 512 (2.8) 532 (2.9) 47 (1.8) 515 (2.7) 536 (2.8) 28 (1.4) 519 (3.1) 530 (2.6)
Germany 22 (0.9) 525 (2.9) 545 (2.0) 44 (1.6) 533 (2.6) 547 (2.3) – – – – – –
Greece 21 (1.4) 519 (3.3) 527 (4.1) 42 (2.3) 516 (3.7) 533 (4.2) 26 (1.4) 520 (4.0) 528 (3.9)
Hong Kong, SAR 32 (1.6) 515 (4.0) 536 (2.8) 50 (2.1) 523 (3.4) 535 (3.4) 33 (1.0) 519 (4.1) 534 (2.9)
Hungary 30 (1.3) 526 (2.5) 551 (2.7) 57 (1.9) 538 (2.3) 552 (3.5) 50 (1.4) 539 (2.2) 549 (2.8)
Iceland 20 (0.7) 491 (2.9) 520 (1.5) 29 (0.7) 503 (2.5) 520 (1.6) 35 (0.8) 512 (2.4) 516 (1.6)
Iran, Islamic Rep. of 32 (1.3) 406 (5.4) 419 (4.5) 49 (1.5) 419 (4.9) 410 (4.5) 27 (1.2) 402 (5.4) 419 (4.4)
Israel 41 (1.3) 492 (3.9) 525 (3.0) 59 (1.5) 508 (3.0) 517 (4.0) 66 (1.0) 513 (3.1) 509 (4.0)
Italy 35 (1.3) 529 (3.0) 548 (2.6) 46 (1.5) 535 (2.9) 546 (2.8) 31 (1.1) 535 (3.3) 544 (2.4)
Kuwait r 37 (1.1) 403 (5.0) 400 (4.6) r 48 (1.5) 405 (4.6) 397 (4.7) r 53 (1.2) 401 (4.6) 401 (4.9)
Latvia 18 (0.9) 524 (4.3) 550 (2.3) 37 (1.9) 539 (3.2) 549 (2.7) 23 (1.1) 533 (4.7) 549 (2.3)
Lithuania 10 (0.8) 518 (5.2) 547 (2.5) 29 (1.7) 530 (3.6) 550 (2.8) 40 (1.4) 536 (3.3) 550 (2.8)
Macedonia, Rep. of 21 (1.3) 415 (6.4) 455 (4.2) 33 (1.6) 446 (5.2) 448 (4.9) 22 (1.2) 406 (7.5) 459 (4.1)
Moldova, Rep. of 25 (1.6) 476 (4.9) 498 (4.2) 47 (3.1) 491 (5.1) 493 (5.3) 18 (1.6) 477 (6.1) 495 (4.3)
Morocco 48 (2.0) 353 (12.7) 350 (9.1) 58 (2.1) 355 (11.6) 347 (11.0) 41 (2.3) 338 (9.9) 362 (11.0)
Netherlands 15 (1.1) 538 (3.5) 557 (2.5) 34 (2.1) 546 (3.3) 559 (2.6) 36 (1.2) 543 (3.3) 561 (2.4)
New Zealand 42 (1.7) 519 (4.8) 539 (3.9) 64 (1.9) 524 (3.4) 542 (5.5) 38 (1.6) 514 (4.9) 540 (3.6)
Norway 13 (1.0) 483 (4.8) 503 (3.1) 24 (1.9) 493 (4.2) 502 (3.2) 23 (1.3) 479 (4.5) 507 (3.0)
Romania 16 (1.2) 491 (7.0) 516 (4.8) 38 (2.4) 501 (4.9) 519 (5.6) 14 (1.5) 481 (10.7) 517 (4.4)
Russian Federation 15 (1.0) 515 (9.8) 531 (3.9) 34 (1.8) 524 (5.7) 531 (4.5) 36 (1.4) 522 (5.8) 532 (4.2)
Scotland 23 (1.2) 504 (5.9) 536 (3.3) 47 (2.5) 517 (4.1) 539 (4.4) 27 (1.4) 511 (5.1) 536 (3.8)
Singapore 35 (1.0) 516 (5.7) 536 (5.0) 55 (1.5) 524 (4.9) 536 (5.9) 37 (1.1) 512 (5.5) 539 (5.1)
Slovak Republic 25 (1.4) 501 (4.9) 524 (3.1) 50 (2.0) 515 (3.7) 522 (3.9) 46 (2.0) 511 (3.7) 525 (3.3)
Slovenia 18 (1.2) 487 (3.4) 506 (2.1) 39 (2.0) 494 (2.9) 507 (2.5) 27 (1.5) 491 (3.5) 507 (2.3)
Sweden 14 (0.8) 542 (4.3) 564 (2.2) 26 (1.3) 546 (3.0) 566 (2.1) 12 (0.7) 535 (4.2) 564 (2.1)
Turkey 32 (1.6) 432 (4.1) 458 (3.8) 57 (2.3) 448 (4.1) 452 (4.3) 57 (1.5) 453 (4.0) 445 (4.3)
United States 35 (1.5) 520 (5.2) 555 (3.9) 55 (1.9) 531 (4.9) 557 (3.5) 25 (1.1) 530 (5.6) 547 (3.7)
International Avg. 28 (0.2) 485 (0.9) 505 (0.7) 47 (0.3) 494 (0.7) 504 (0.8) 33 (0.2) 487 (0.9) 503 (0.7)
AverageAchievement
"No"
Something WasStolen from Me
Something Was Stolenfrom Someone in My Class
I Was Bullied byAnother Student
Percent ofStudents
"Yes"
AverageAchievement
"Yes"
CountriesAverage
Achievement"No"
Percent ofStudents
"Yes"
AverageAchievement
"Yes"
AverageAchievement
"No"
Percent ofStudents
"Yes"
AverageAchievement
"Yes"
Background data provided by students.
( ) Standard errors appear in parentheses. Because results are rounded to the nearest wholenumber, some totals may appear inconsistent.
An “r” indicates data are available for 70-84% of the students. An “s” indicates data are avail-able for 50-69% of the students. An “x” indicates data are available for less than 50% ofthe students.
A dash (–) indicates data are not available. A tilde (~) indicates insufficient data to reportachievement.
SOU
RCE:
IEA
Pro
gres
s in
Inte
rnat
iona
l Rea
ding
Lite
racy
Stu
dy (P
IRLS
) 200
1.
ISC 4th GradePIRLS 2001
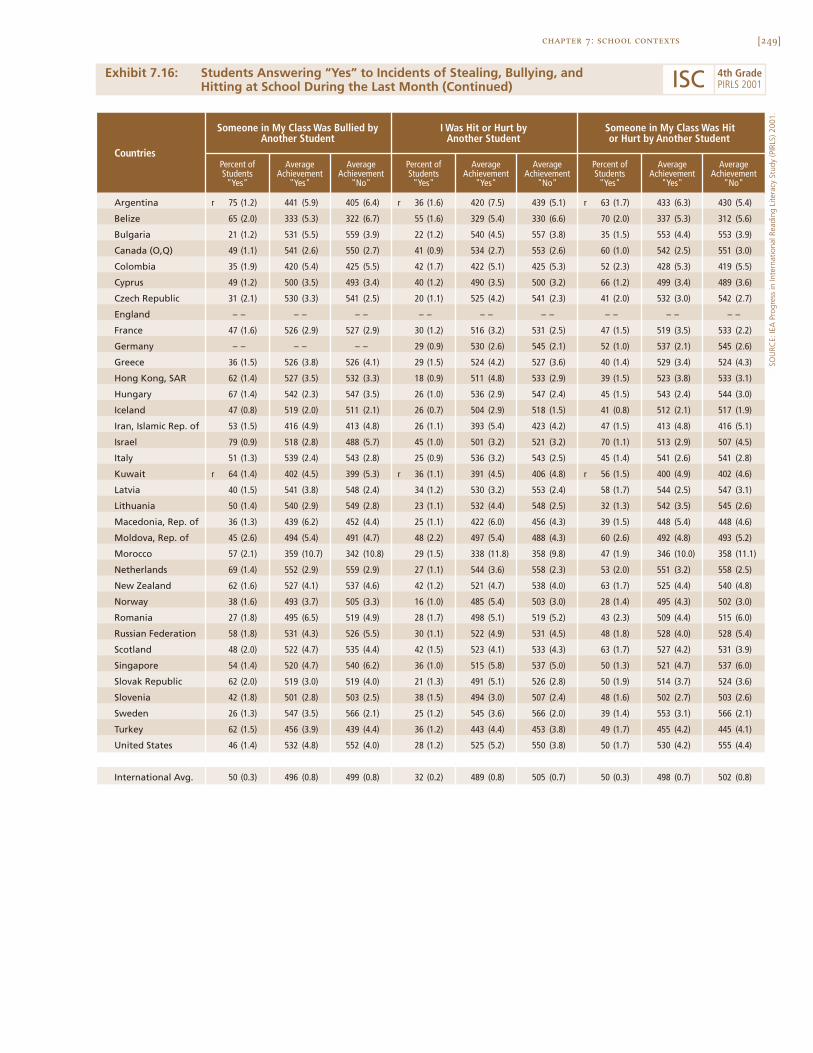
[249]chapter 7: school contexts
Exhibit 7.16: Students Answering “Yes” to Incidents of Stealing, Bullying, andHitting at School During the Last Month (Continued)
SOU
RCE:
IEA
Pro
gres
s in
Inte
rnat
iona
l Rea
ding
Lite
racy
Stu
dy (P
IRLS
) 200
1.
Argentina r 75 (1.2) 441 (5.9) 405 (6.4) r 36 (1.6) 420 (7.5) 439 (5.1) r 63 (1.7) 433 (6.3) 430 (5.4)
Belize 65 (2.0) 333 (5.3) 322 (6.7) 55 (1.6) 329 (5.4) 330 (6.6) 70 (2.0) 337 (5.3) 312 (5.6)
Bulgaria 21 (1.2) 531 (5.5) 559 (3.9) 22 (1.2) 540 (4.5) 557 (3.8) 35 (1.5) 553 (4.4) 553 (3.9)
Canada (O,Q) 49 (1.1) 541 (2.6) 550 (2.7) 41 (0.9) 534 (2.7) 553 (2.6) 60 (1.0) 542 (2.5) 551 (3.0)
Colombia 35 (1.9) 420 (5.4) 425 (5.5) 42 (1.7) 422 (5.1) 425 (5.3) 52 (2.3) 428 (5.3) 419 (5.5)
Cyprus 49 (1.2) 500 (3.5) 493 (3.4) 40 (1.2) 490 (3.5) 500 (3.2) 66 (1.2) 499 (3.4) 489 (3.6)
Czech Republic 31 (2.1) 530 (3.3) 541 (2.5) 20 (1.1) 525 (4.2) 541 (2.3) 41 (2.0) 532 (3.0) 542 (2.7)
England – – – – – – – – – – – – – – – – – –
France 47 (1.6) 526 (2.9) 527 (2.9) 30 (1.2) 516 (3.2) 531 (2.5) 47 (1.5) 519 (3.5) 533 (2.2)
Germany – – – – – – 29 (0.9) 530 (2.6) 545 (2.1) 52 (1.0) 537 (2.1) 545 (2.6)
Greece 36 (1.5) 526 (3.8) 526 (4.1) 29 (1.5) 524 (4.2) 527 (3.6) 40 (1.4) 529 (3.4) 524 (4.3)
Hong Kong, SAR 62 (1.4) 527 (3.5) 532 (3.3) 18 (0.9) 511 (4.8) 533 (2.9) 39 (1.5) 523 (3.8) 533 (3.1)
Hungary 67 (1.4) 542 (2.3) 547 (3.5) 26 (1.0) 536 (2.9) 547 (2.4) 45 (1.5) 543 (2.4) 544 (3.0)
Iceland 47 (0.8) 519 (2.0) 511 (2.1) 26 (0.7) 504 (2.9) 518 (1.5) 41 (0.8) 512 (2.1) 517 (1.9)
Iran, Islamic Rep. of 53 (1.5) 416 (4.9) 413 (4.8) 26 (1.1) 393 (5.4) 423 (4.2) 47 (1.5) 413 (4.8) 416 (5.1)
Israel 79 (0.9) 518 (2.8) 488 (5.7) 45 (1.0) 501 (3.2) 521 (3.2) 70 (1.1) 513 (2.9) 507 (4.5)
Italy 51 (1.3) 539 (2.4) 543 (2.8) 25 (0.9) 536 (3.2) 543 (2.5) 45 (1.4) 541 (2.6) 541 (2.8)
Kuwait r 64 (1.4) 402 (4.5) 399 (5.3) r 36 (1.1) 391 (4.5) 406 (4.8) r 56 (1.5) 400 (4.9) 402 (4.6)
Latvia 40 (1.5) 541 (3.8) 548 (2.4) 34 (1.2) 530 (3.2) 553 (2.4) 58 (1.7) 544 (2.5) 547 (3.1)
Lithuania 50 (1.4) 540 (2.9) 549 (2.8) 23 (1.1) 532 (4.4) 548 (2.5) 32 (1.3) 542 (3.5) 545 (2.6)
Macedonia, Rep. of 36 (1.3) 439 (6.2) 452 (4.4) 25 (1.1) 422 (6.0) 456 (4.3) 39 (1.5) 448 (5.4) 448 (4.6)
Moldova, Rep. of 45 (2.6) 494 (5.4) 491 (4.7) 48 (2.2) 497 (5.4) 488 (4.3) 60 (2.6) 492 (4.8) 493 (5.2)
Morocco 57 (2.1) 359 (10.7) 342 (10.8) 29 (1.5) 338 (11.8) 358 (9.8) 47 (1.9) 346 (10.0) 358 (11.1)
Netherlands 69 (1.4) 552 (2.9) 559 (2.9) 27 (1.1) 544 (3.6) 558 (2.3) 53 (2.0) 551 (3.2) 558 (2.5)
New Zealand 62 (1.6) 527 (4.1) 537 (4.6) 42 (1.2) 521 (4.7) 538 (4.0) 63 (1.7) 525 (4.4) 540 (4.8)
Norway 38 (1.6) 493 (3.7) 505 (3.3) 16 (1.0) 485 (5.4) 503 (3.0) 28 (1.4) 495 (4.3) 502 (3.0)
Romania 27 (1.8) 495 (6.5) 519 (4.9) 28 (1.7) 498 (5.1) 519 (5.2) 43 (2.3) 509 (4.4) 515 (6.0)
Russian Federation 58 (1.8) 531 (4.3) 526 (5.5) 30 (1.1) 522 (4.9) 531 (4.5) 48 (1.8) 528 (4.0) 528 (5.4)
Scotland 48 (2.0) 522 (4.7) 535 (4.4) 42 (1.5) 523 (4.1) 533 (4.3) 63 (1.7) 527 (4.2) 531 (3.9)
Singapore 54 (1.4) 520 (4.7) 540 (6.2) 36 (1.0) 515 (5.8) 537 (5.0) 50 (1.3) 521 (4.7) 537 (6.0)
Slovak Republic 62 (2.0) 519 (3.0) 519 (4.0) 21 (1.3) 491 (5.1) 526 (2.8) 50 (1.9) 514 (3.7) 524 (3.6)
Slovenia 42 (1.8) 501 (2.8) 503 (2.5) 38 (1.5) 494 (3.0) 507 (2.4) 48 (1.6) 502 (2.7) 503 (2.6)
Sweden 26 (1.3) 547 (3.5) 566 (2.1) 25 (1.2) 545 (3.6) 566 (2.0) 39 (1.4) 553 (3.1) 566 (2.1)
Turkey 62 (1.5) 456 (3.9) 439 (4.4) 36 (1.2) 443 (4.4) 453 (3.8) 49 (1.7) 455 (4.2) 445 (4.1)
United States 46 (1.4) 532 (4.8) 552 (4.0) 28 (1.2) 525 (5.2) 550 (3.8) 50 (1.7) 530 (4.2) 555 (4.4)
International Avg. 50 (0.3) 496 (0.8) 499 (0.8) 32 (0.2) 489 (0.8) 505 (0.7) 50 (0.3) 498 (0.7) 502 (0.8)
Someone in My Class Was Hitor Hurt by Another Student
I Was Hit or Hurt byAnother Student
Countries
Someone in My Class Was Bullied byAnother Student
AverageAchievement
"No"
Percent ofStudents
"Yes"
AverageAchievement
"Yes"
AverageAchievement
"No"
Percent ofStudents
"Yes"
AverageAchievement
"Yes"
AverageAchievement
"No"
Percent ofStudents
"Yes"
AverageAchievement
"Yes"
ISC 4th GradePIRLS 2001
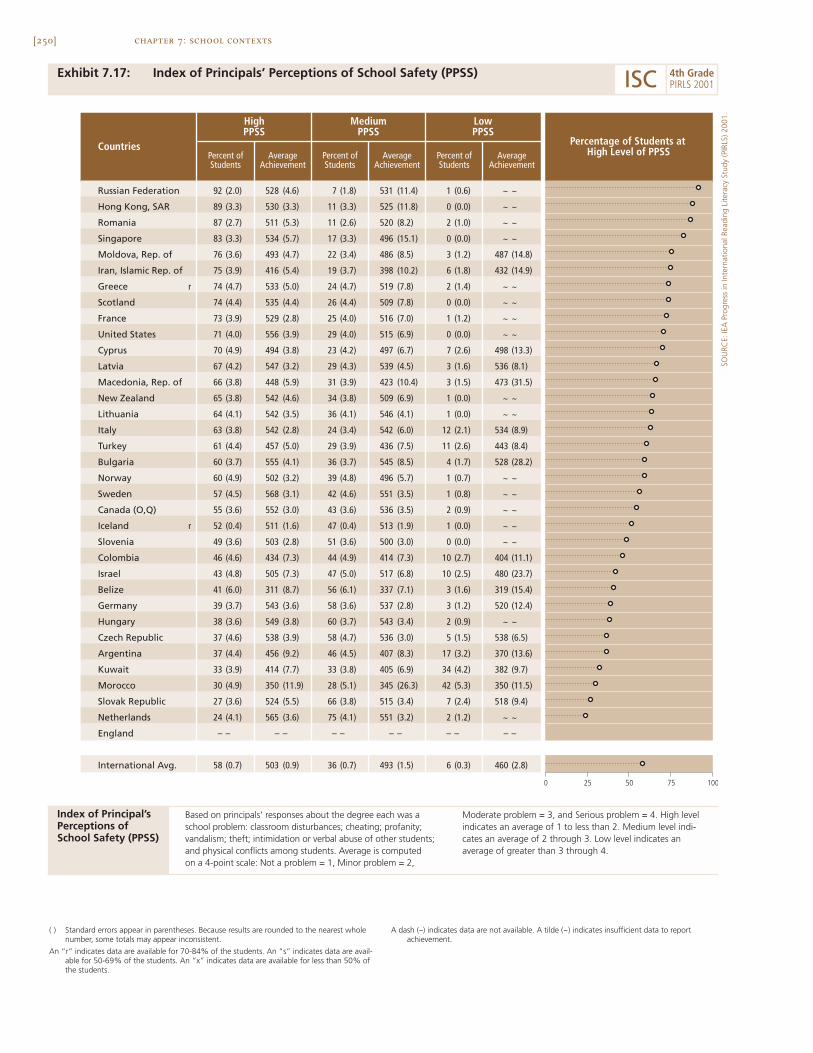
[250] chapter 7: school contexts
Exhibit 7.17: Index of Principals’ Perceptions of School Safety (PPSS)
0 10050 7525
Russian Federation 92 (2.0) 528 (4.6) 7 (1.8) 531 (11.4) 1 (0.6) ~ ~
Hong Kong, SAR 89 (3.3) 530 (3.3) 11 (3.3) 525 (11.8) 0 (0.0) ~ ~
Romania 87 (2.7) 511 (5.3) 11 (2.6) 520 (8.2) 2 (1.0) ~ ~
Singapore 83 (3.3) 534 (5.7) 17 (3.3) 496 (15.1) 0 (0.0) ~ ~
Moldova, Rep. of 76 (3.6) 493 (4.7) 22 (3.4) 486 (8.5) 3 (1.2) 487 (14.8)
Iran, Islamic Rep. of 75 (3.9) 416 (5.4) 19 (3.7) 398 (10.2) 6 (1.8) 432 (14.9)
Greece r 74 (4.7) 533 (5.0) 24 (4.7) 519 (7.8) 2 (1.4) ~ ~
Scotland 74 (4.4) 535 (4.4) 26 (4.4) 509 (7.8) 0 (0.0) ~ ~
France 73 (3.9) 529 (2.8) 25 (4.0) 516 (7.0) 1 (1.2) ~ ~
United States 71 (4.0) 556 (3.9) 29 (4.0) 515 (6.9) 0 (0.0) ~ ~
Cyprus 70 (4.9) 494 (3.8) 23 (4.2) 497 (6.7) 7 (2.6) 498 (13.3)
Latvia 67 (4.2) 547 (3.2) 29 (4.3) 539 (4.5) 3 (1.6) 536 (8.1)
Macedonia, Rep. of 66 (3.8) 448 (5.9) 31 (3.9) 423 (10.4) 3 (1.5) 473 (31.5)
New Zealand 65 (3.8) 542 (4.6) 34 (3.8) 509 (6.9) 1 (0.0) ~ ~
Lithuania 64 (4.1) 542 (3.5) 36 (4.1) 546 (4.1) 1 (0.0) ~ ~
Italy 63 (3.8) 542 (2.8) 24 (3.4) 542 (6.0) 12 (2.1) 534 (8.9)
Turkey 61 (4.4) 457 (5.0) 29 (3.9) 436 (7.5) 11 (2.6) 443 (8.4)
Bulgaria 60 (3.7) 555 (4.1) 36 (3.7) 545 (8.5) 4 (1.7) 528 (28.2)
Norway 60 (4.9) 502 (3.2) 39 (4.8) 496 (5.7) 1 (0.7) ~ ~
Sweden 57 (4.5) 568 (3.1) 42 (4.6) 551 (3.5) 1 (0.8) ~ ~
Canada (O,Q) 55 (3.6) 552 (3.0) 43 (3.6) 536 (3.5) 2 (0.9) ~ ~
Iceland r 52 (0.4) 511 (1.6) 47 (0.4) 513 (1.9) 1 (0.0) ~ ~
Slovenia 49 (3.6) 503 (2.8) 51 (3.6) 500 (3.0) 0 (0.0) ~ ~
Colombia 46 (4.6) 434 (7.3) 44 (4.9) 414 (7.3) 10 (2.7) 404 (11.1)
Israel 43 (4.8) 505 (7.3) 47 (5.0) 517 (6.8) 10 (2.5) 480 (23.7)
Belize 41 (6.0) 311 (8.7) 56 (6.1) 337 (7.1) 3 (1.6) 319 (15.4)
Germany 39 (3.7) 543 (3.6) 58 (3.6) 537 (2.8) 3 (1.2) 520 (12.4)
Hungary 38 (3.6) 549 (3.8) 60 (3.7) 543 (3.4) 2 (0.9) ~ ~
Czech Republic 37 (4.6) 538 (3.9) 58 (4.7) 536 (3.0) 5 (1.5) 538 (6.5)
Argentina 37 (4.4) 456 (9.2) 46 (4.5) 407 (8.3) 17 (3.2) 370 (13.6)
Kuwait 33 (3.9) 414 (7.7) 33 (3.8) 405 (6.9) 34 (4.2) 382 (9.7)
Morocco 30 (4.9) 350 (11.9) 28 (5.1) 345 (26.3) 42 (5.3) 350 (11.5)
Slovak Republic 27 (3.6) 524 (5.5) 66 (3.8) 515 (3.4) 7 (2.4) 518 (9.4)
Netherlands 24 (4.1) 565 (3.6) 75 (4.1) 551 (3.2) 2 (1.2) ~ ~
England – – – – – – – – – – – –
International Avg. 58 (0.7) 503 (0.9) 36 (0.7) 493 (1.5) 6 (0.3) 460 (2.8)
Countries
HighPPSS
MediumPPSS
LowPPSS
Percentage of Students atHigh Level of PPSSPercent of
StudentsAverage
AchievementPercent ofStudents
AverageAchievement
Percent ofStudents
AverageAchievement
( ) Standard errors appear in parentheses. Because results are rounded to the nearest wholenumber, some totals may appear inconsistent.
An “r” indicates data are available for 70-84% of the students. An “s” indicates data are avail-able for 50-69% of the students. An “x” indicates data are available for less than 50% ofthe students.
A dash (–) indicates data are not available. A tilde (~) indicates insufficient data to reportachievement.
SOU
RCE:
IEA
Pro
gres
s in
Inte
rnat
iona
l Rea
ding
Lite
racy
Stu
dy (P
IRLS
) 200
1.
ISC 4th GradePIRLS 2001
Index of Principal’s Perceptions of School Safety (PPSS)
Based on principals’ responses about the degree each was aschool problem: classroom disturbances; cheating; profanity;vandalism; theft; intimidation or verbal abuse of other students;and physical conflicts among students. Average is computed on a 4-point scale: Not a problem = 1, Minor problem = 2,
Moderate problem = 3, and Serious problem = 4. High levelindicates an average of 1 to less than 2. Medium level indi-cates an average of 2 through 3. Low level indicates anaverage of greater than 3 through 4.
[251]chapter 7: school contexts
What School Resources Are Available to Support Reading?
Availability of school resources contributes to the overall school climate aswell as to the academic rigor in the school. PIRLS created an Index of Avail-ability of School Resources, presented in Exhibit 7.18, which is based on theextent to which schools’ capacities to provide instruction were affected by ashortage or inadequacy of staff, basic classroom supplies, instructional mate-rials, or the schools’ buildings and grounds. A high index level indicates thecapacity to provide reading instruction is not affected at all, while the mediumlevel indicates some effect. Students in the low category attended schoolsaffected “a lot” by a shortage or inadequacy of resources.
On average, internationally, 43 percent of students attended schoolsreporting adequate availability of resources, and only 18 percent were in schoolsheavily affected by the lack of availability. Students in schools reporting noshortage or inadequacy of resources generally had higher reading achieve-ment than those affected “a lot” by shortages. However, schools in some coun-tries appear better able than others to compensate for a lack of resources. Morethan three-quarters of students in New Zealand, The Netherlands, Iceland,the United States, Scotland, and Sweden attended schools that were not affectedby a lack of resources.
While research has found that the availability of technology in class-rooms has been increasing over the years, students’ access to computers forinstruction and specifically to the Internet varies greatly across countries.Exhibit 7.19 provides the results of schools’ reports of the ratio of fourth-grade students to computers. Internationally, 33 percent of students attendedschools without any computers. The majority of these students were in Iran,Macedonia, and the Russian Federation, where more than 90 percent of stu-dents attended schools without any computers available. In Canada (O,Q) andIceland, more than three-quarters of students attended schools that had, onaverage, one computer for every five students or fewer. England, Hong Kong,Israel, The Netherlands, New Zealand, Norway, Singapore, Slovenia, and theUnited States had one computer for up to 10 students available to more thanthree-quarters of the student population.
[252]
Schools’ access to the Internet is presented in Exhibit 7.20, along withthe average number of computers available in the schools. Students in fewcountries had access to the Internet on all of their computers. Hong Kong andIceland were the only two countries with all computers accessible to the Inter-net for at least three-quarters of their students. On average, internationally,42 percent of students were in schools that reported having no access to theInternet on available computers. Almost all students in Iran, Kuwait, andMoldova were without access to the Internet in their schools.
chapter 7: school contexts
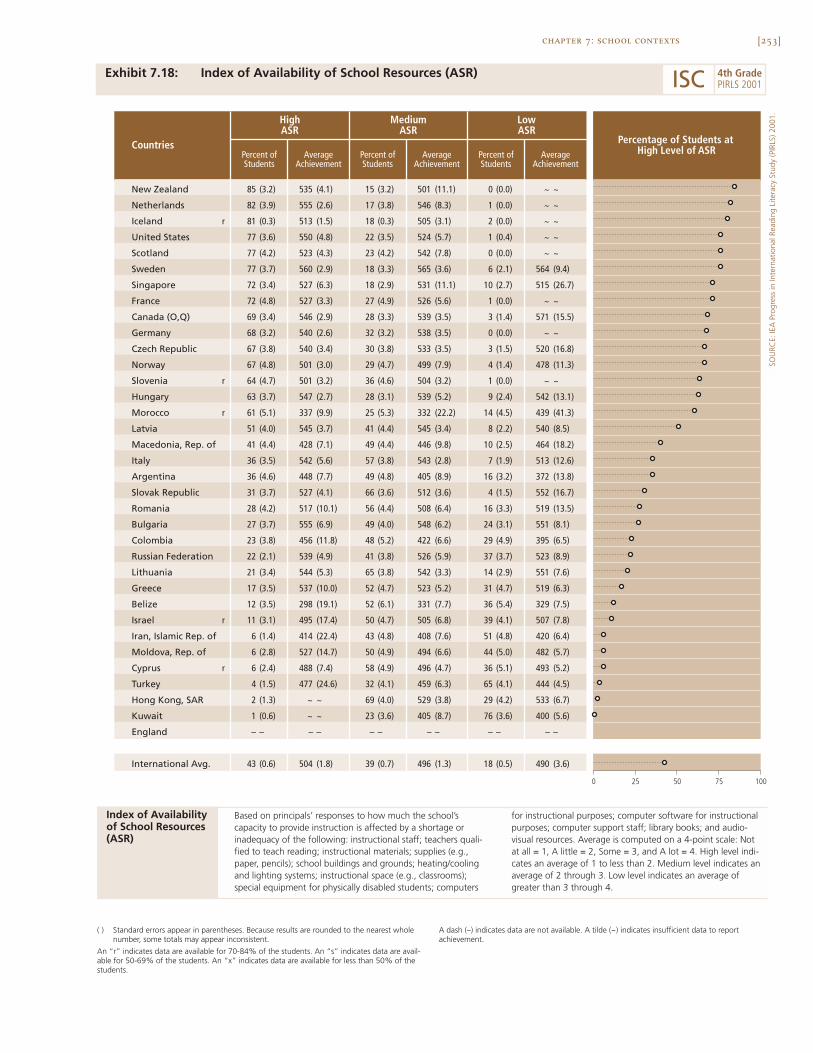
[253]chapter 7: school contexts
Exhibit 7.18: Index of Availability of School Resources (ASR)
SOU
RCE:
IEA
Pro
gres
s in
Inte
rnat
iona
l Rea
ding
Lite
racy
Stu
dy (P
IRLS
) 200
1.0 10050 7525
New Zealand 85 (3.2) 535 (4.1) 15 (3.2) 501 (11.1) 0 (0.0) ~ ~
Netherlands 82 (3.9) 555 (2.6) 17 (3.8) 546 (8.3) 1 (0.0) ~ ~
Iceland r 81 (0.3) 513 (1.5) 18 (0.3) 505 (3.1) 2 (0.0) ~ ~
United States 77 (3.6) 550 (4.8) 22 (3.5) 524 (5.7) 1 (0.4) ~ ~
Scotland 77 (4.2) 523 (4.3) 23 (4.2) 542 (7.8) 0 (0.0) ~ ~
Sweden 77 (3.7) 560 (2.9) 18 (3.3) 565 (3.6) 6 (2.1) 564 (9.4)
Singapore 72 (3.4) 527 (6.3) 18 (2.9) 531 (11.1) 10 (2.7) 515 (26.7)
France 72 (4.8) 527 (3.3) 27 (4.9) 526 (5.6) 1 (0.0) ~ ~
Canada (O,Q) 69 (3.4) 546 (2.9) 28 (3.3) 539 (3.5) 3 (1.4) 571 (15.5)
Germany 68 (3.2) 540 (2.6) 32 (3.2) 538 (3.5) 0 (0.0) ~ ~
Czech Republic 67 (3.8) 540 (3.4) 30 (3.8) 533 (3.5) 3 (1.5) 520 (16.8)
Norway 67 (4.8) 501 (3.0) 29 (4.7) 499 (7.9) 4 (1.4) 478 (11.3)
Slovenia r 64 (4.7) 501 (3.2) 36 (4.6) 504 (3.2) 1 (0.0) ~ ~
Hungary 63 (3.7) 547 (2.7) 28 (3.1) 539 (5.2) 9 (2.4) 542 (13.1)
Morocco r 61 (5.1) 337 (9.9) 25 (5.3) 332 (22.2) 14 (4.5) 439 (41.3)
Latvia 51 (4.0) 545 (3.7) 41 (4.4) 545 (3.4) 8 (2.2) 540 (8.5)
Macedonia, Rep. of 41 (4.4) 428 (7.1) 49 (4.4) 446 (9.8) 10 (2.5) 464 (18.2)
Italy 36 (3.5) 542 (5.6) 57 (3.8) 543 (2.8) 7 (1.9) 513 (12.6)
Argentina 36 (4.6) 448 (7.7) 49 (4.8) 405 (8.9) 16 (3.2) 372 (13.8)
Slovak Republic 31 (3.7) 527 (4.1) 66 (3.6) 512 (3.6) 4 (1.5) 552 (16.7)
Romania 28 (4.2) 517 (10.1) 56 (4.4) 508 (6.4) 16 (3.3) 519 (13.5)
Bulgaria 27 (3.7) 555 (6.9) 49 (4.0) 548 (6.2) 24 (3.1) 551 (8.1)
Colombia 23 (3.8) 456 (11.8) 48 (5.2) 422 (6.6) 29 (4.9) 395 (6.5)
Russian Federation 22 (2.1) 539 (4.9) 41 (3.8) 526 (5.9) 37 (3.7) 523 (8.9)
Lithuania 21 (3.4) 544 (5.3) 65 (3.8) 542 (3.3) 14 (2.9) 551 (7.6)
Greece 17 (3.5) 537 (10.0) 52 (4.7) 523 (5.2) 31 (4.7) 519 (6.3)
Belize 12 (3.5) 298 (19.1) 52 (6.1) 331 (7.7) 36 (5.4) 329 (7.5)
Israel r 11 (3.1) 495 (17.4) 50 (4.7) 505 (6.8) 39 (4.1) 507 (7.8)
Iran, Islamic Rep. of 6 (1.4) 414 (22.4) 43 (4.8) 408 (7.6) 51 (4.8) 420 (6.4)
Moldova, Rep. of 6 (2.8) 527 (14.7) 50 (4.9) 494 (6.6) 44 (5.0) 482 (5.7)
Cyprus r 6 (2.4) 488 (7.4) 58 (4.9) 496 (4.7) 36 (5.1) 493 (5.2)
Turkey 4 (1.5) 477 (24.6) 32 (4.1) 459 (6.3) 65 (4.1) 444 (4.5)
Hong Kong, SAR 2 (1.3) ~ ~ 69 (4.0) 529 (3.8) 29 (4.2) 533 (6.7)
Kuwait 1 (0.6) ~ ~ 23 (3.6) 405 (8.7) 76 (3.6) 400 (5.6)
England – – – – – – – – – – – –
International Avg. 43 (0.6) 504 (1.8) 39 (0.7) 496 (1.3) 18 (0.5) 490 (3.6)
Countries
HighASR
MediumASR
LowASR
Percent ofStudents
AverageAchievement
Percent ofStudents
AverageAchievement
Percent ofStudents
AverageAchievement
Percentage of Students atHigh Level of ASR
( ) Standard errors appear in parentheses. Because results are rounded to the nearest wholenumber, some totals may appear inconsistent.
An “r” indicates data are available for 70-84% of the students. An “s” indicates data are avail-able for 50-69% of the students. An “x” indicates data are available for less than 50% of thestudents.
A dash (–) indicates data are not available. A tilde (~) indicates insufficient data to reportachievement.
ISC 4th GradePIRLS 2001
Index of Availability of School Resources(ASR)
Based on principals’ responses to how much the school’scapacity to provide instruction is affected by a shortage orinadequacy of the following: instructional staff; teachers quali-fied to teach reading; instructional materials; supplies (e.g.,paper, pencils); school buildings and grounds; heating/coolingand lighting systems; instructional space (e.g., classrooms);special equipment for physically disabled students; computers
for instructional purposes; computer software for instructionalpurposes; computer support staff; library books; and audio-visual resources. Average is computed on a 4-point scale: Notat all = 1, A little = 2, Some = 3, and A lot = 4. High level indi-cates an average of 1 to less than 2. Medium level indicates anaverage of 2 through 3. Low level indicates an average ofgreater than 3 through 4.
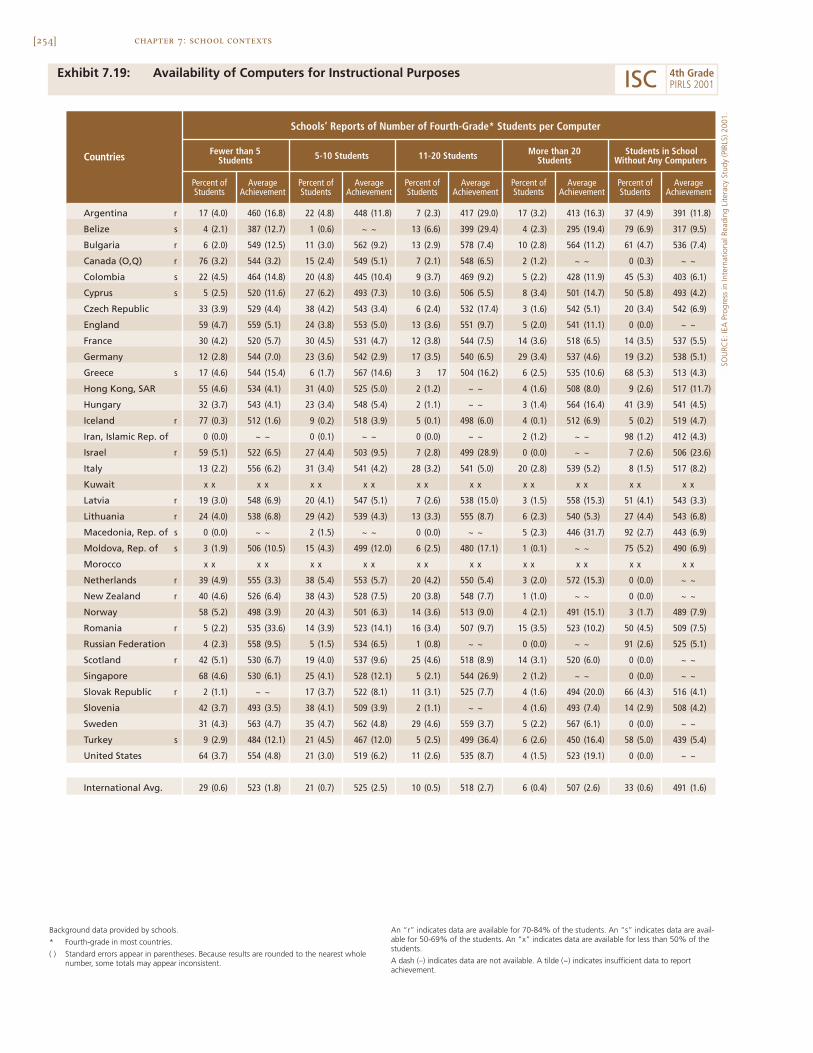
[254] chapter 7: school contexts
Exhibit 7.19: Availability of Computers for Instructional Purposes
Schools’ Reports of Number of Fourth-Grade* Students per Computer
Students in SchoolWithout Any ComputersCountries Fewer than 5
Students 5-10 Students More than 20Students11-20 Students
Percent ofStudents
AverageAchievement
Percent ofStudents
AverageAchievement
Percent ofStudents
AverageAchievement
Percent ofStudents
AverageAchievement
Percent ofStudents
AverageAchievement
Argentina r 17 (4.0) 460 (16.8) 22 (4.8) 448 (11.8) 7 (2.3) 417 (29.0) 17 (3.2) 413 (16.3) 37 (4.9) 391 (11.8)
Belize s 4 (2.1) 387 (12.7) 1 (0.6) ~ ~ 13 (6.6) 399 (29.4) 4 (2.3) 295 (19.4) 79 (6.9) 317 (9.5)
Bulgaria r 6 (2.0) 549 (12.5) 11 (3.0) 562 (9.2) 13 (2.9) 578 (7.4) 10 (2.8) 564 (11.2) 61 (4.7) 536 (7.4)
Canada (O,Q) r 76 (3.2) 544 (3.2) 15 (2.4) 549 (5.1) 7 (2.1) 548 (6.5) 2 (1.2) ~ ~ 0 (0.3) ~ ~
Colombia s 22 (4.5) 464 (14.8) 20 (4.8) 445 (10.4) 9 (3.7) 469 (9.2) 5 (2.2) 428 (11.9) 45 (5.3) 403 (6.1)
Cyprus s 5 (2.5) 520 (11.6) 27 (6.2) 493 (7.3) 10 (3.6) 506 (5.5) 8 (3.4) 501 (14.7) 50 (5.8) 493 (4.2)
Czech Republic 33 (3.9) 529 (4.4) 38 (4.2) 543 (3.4) 6 (2.4) 532 (17.4) 3 (1.6) 542 (5.1) 20 (3.4) 542 (6.9)
England 59 (4.7) 559 (5.1) 24 (3.8) 553 (5.0) 13 (3.6) 551 (9.7) 5 (2.0) 541 (11.1) 0 (0.0) ~ ~
France 30 (4.2) 520 (5.7) 30 (4.5) 531 (4.7) 12 (3.8) 544 (7.5) 14 (3.6) 518 (6.5) 14 (3.5) 537 (5.5)
Germany 12 (2.8) 544 (7.0) 23 (3.6) 542 (2.9) 17 (3.5) 540 (6.5) 29 (3.4) 537 (4.6) 19 (3.2) 538 (5.1)
Greece s 17 (4.6) 544 (15.4) 6 (1.7) 567 (14.6) 3 17 504 (16.2) 6 (2.5) 535 (10.6) 68 (5.3) 513 (4.3)
Hong Kong, SAR 55 (4.6) 534 (4.1) 31 (4.0) 525 (5.0) 2 (1.2) ~ ~ 4 (1.6) 508 (8.0) 9 (2.6) 517 (11.7)
Hungary 32 (3.7) 543 (4.1) 23 (3.4) 548 (5.4) 2 (1.1) ~ ~ 3 (1.4) 564 (16.4) 41 (3.9) 541 (4.5)
Iceland r 77 (0.3) 512 (1.6) 9 (0.2) 518 (3.9) 5 (0.1) 498 (6.0) 4 (0.1) 512 (6.9) 5 (0.2) 519 (4.7)
Iran, Islamic Rep. of 0 (0.0) ~ ~ 0 (0.1) ~ ~ 0 (0.0) ~ ~ 2 (1.2) ~ ~ 98 (1.2) 412 (4.3)
Israel r 59 (5.1) 522 (6.5) 27 (4.4) 503 (9.5) 7 (2.8) 499 (28.9) 0 (0.0) ~ ~ 7 (2.6) 506 (23.6)
Italy 13 (2.2) 556 (6.2) 31 (3.4) 541 (4.2) 28 (3.2) 541 (5.0) 20 (2.8) 539 (5.2) 8 (1.5) 517 (8.2)
Kuwait x x x x x x x x x x x x x x x x x x x x
Latvia r 19 (3.0) 548 (6.9) 20 (4.1) 547 (5.1) 7 (2.6) 538 (15.0) 3 (1.5) 558 (15.3) 51 (4.1) 543 (3.3)
Lithuania r 24 (4.0) 538 (6.8) 29 (4.2) 539 (4.3) 13 (3.3) 555 (8.7) 6 (2.3) 540 (5.3) 27 (4.4) 543 (6.8)
Macedonia, Rep. of s 0 (0.0) ~ ~ 2 (1.5) ~ ~ 0 (0.0) ~ ~ 5 (2.3) 446 (31.7) 92 (2.7) 443 (6.9)
Moldova, Rep. of s 3 (1.9) 506 (10.5) 15 (4.3) 499 (12.0) 6 (2.5) 480 (17.1) 1 (0.1) ~ ~ 75 (5.2) 490 (6.9)
Morocco x x x x x x x x x x x x x x x x x x x x
Netherlands r 39 (4.9) 555 (3.3) 38 (5.4) 553 (5.7) 20 (4.2) 550 (5.4) 3 (2.0) 572 (15.3) 0 (0.0) ~ ~
New Zealand r 40 (4.6) 526 (6.4) 38 (4.3) 528 (7.5) 20 (3.8) 548 (7.7) 1 (1.0) ~ ~ 0 (0.0) ~ ~
Norway 58 (5.2) 498 (3.9) 20 (4.3) 501 (6.3) 14 (3.6) 513 (9.0) 4 (2.1) 491 (15.1) 3 (1.7) 489 (7.9)
Romania r 5 (2.2) 535 (33.6) 14 (3.9) 523 (14.1) 16 (3.4) 507 (9.7) 15 (3.5) 523 (10.2) 50 (4.5) 509 (7.5)
Russian Federation 4 (2.3) 558 (9.5) 5 (1.5) 534 (6.5) 1 (0.8) ~ ~ 0 (0.0) ~ ~ 91 (2.6) 525 (5.1)
Scotland r 42 (5.1) 530 (6.7) 19 (4.0) 537 (9.6) 25 (4.6) 518 (8.9) 14 (3.1) 520 (6.0) 0 (0.0) ~ ~
Singapore 68 (4.6) 530 (6.1) 25 (4.1) 528 (12.1) 5 (2.1) 544 (26.9) 2 (1.2) ~ ~ 0 (0.0) ~ ~
Slovak Republic r 2 (1.1) ~ ~ 17 (3.7) 522 (8.1) 11 (3.1) 525 (7.7) 4 (1.6) 494 (20.0) 66 (4.3) 516 (4.1)
Slovenia 42 (3.7) 493 (3.5) 38 (4.1) 509 (3.9) 2 (1.1) ~ ~ 4 (1.6) 493 (7.4) 14 (2.9) 508 (4.2)
Sweden 31 (4.3) 563 (4.7) 35 (4.7) 562 (4.8) 29 (4.6) 559 (3.7) 5 (2.2) 567 (6.1) 0 (0.0) ~ ~
Turkey s 9 (2.9) 484 (12.1) 21 (4.5) 467 (12.0) 5 (2.5) 499 (36.4) 6 (2.6) 450 (16.4) 58 (5.0) 439 (5.4)
United States 64 (3.7) 554 (4.8) 21 (3.0) 519 (6.2) 11 (2.6) 535 (8.7) 4 (1.5) 523 (19.1) 0 (0.0) ~ ~
International Avg. 29 (0.6) 523 (1.8) 21 (0.7) 525 (2.5) 10 (0.5) 518 (2.7) 6 (0.4) 507 (2.6) 33 (0.6) 491 (1.6)
Background data provided by schools.
* Fourth-grade in most countries.
( ) Standard errors appear in parentheses. Because results are rounded to the nearest wholenumber, some totals may appear inconsistent.
An “r” indicates data are available for 70-84% of the students. An “s” indicates data are avail-able for 50-69% of the students. An “x” indicates data are available for less than 50% of thestudents.
A dash (–) indicates data are not available. A tilde (~) indicates insufficient data to reportachievement.
SOU
RCE:
IEA
Pro
gres
s in
Inte
rnat
iona
l Rea
ding
Lite
racy
Stu
dy (P
IRLS
) 200
1.
ISC 4th GradePIRLS 2001
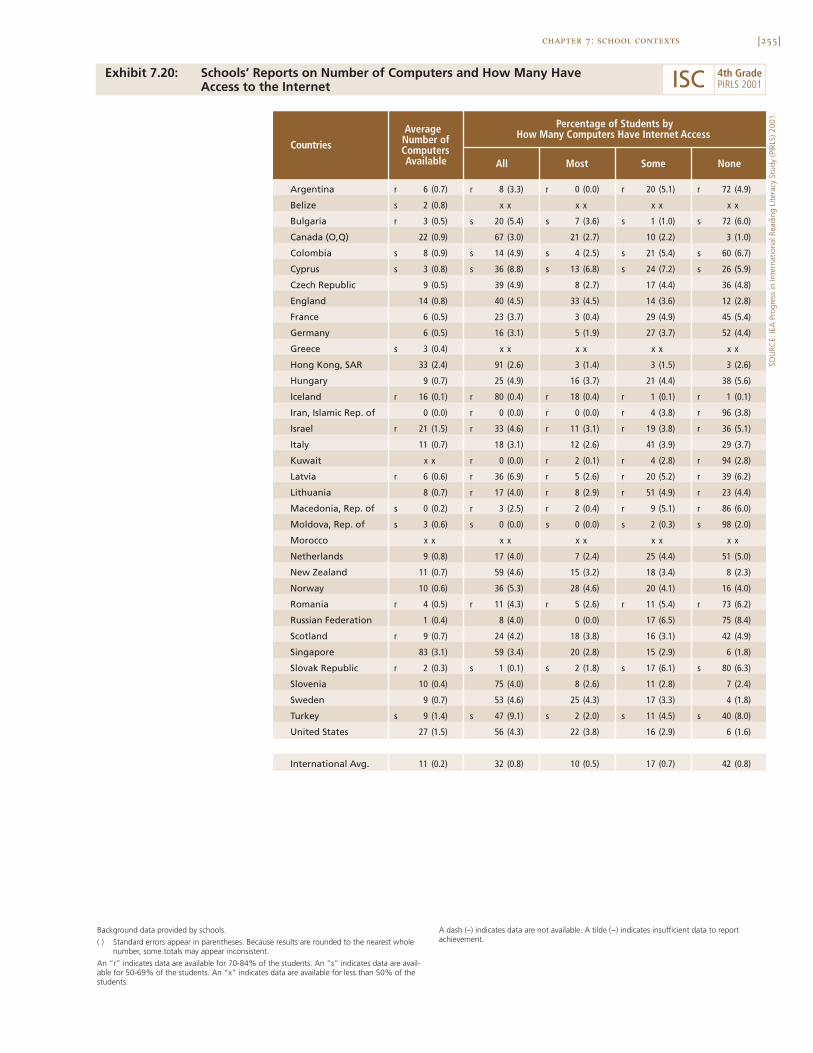
[255]chapter 7: school contexts
Exhibit 7.20: Schools’ Reports on Number of Computers and How Many HaveAccess to the Internet
SOU
RCE:
IEA
Pro
gres
s in
Inte
rnat
iona
l Rea
ding
Lite
racy
Stu
dy (P
IRLS
) 200
1.
Argentina r 6 (0.7) r 8 (3.3) r 0 (0.0) r 20 (5.1) r 72 (4.9)
Belize s 2 (0.8) x x x x x x x x
Bulgaria r 3 (0.5) s 20 (5.4) s 7 (3.6) s 1 (1.0) s 72 (6.0)
Canada (O,Q) 22 (0.9) 67 (3.0) 21 (2.7) 10 (2.2) 3 (1.0)
Colombia s 8 (0.9) s 14 (4.9) s 4 (2.5) s 21 (5.4) s 60 (6.7)
Cyprus s 3 (0.8) s 36 (8.8) s 13 (6.8) s 24 (7.2) s 26 (5.9)
Czech Republic 9 (0.5) 39 (4.9) 8 (2.7) 17 (4.4) 36 (4.8)
England 14 (0.8) 40 (4.5) 33 (4.5) 14 (3.6) 12 (2.8)
France 6 (0.5) 23 (3.7) 3 (0.4) 29 (4.9) 45 (5.4)
Germany 6 (0.5) 16 (3.1) 5 (1.9) 27 (3.7) 52 (4.4)
Greece s 3 (0.4) x x x x x x x x
Hong Kong, SAR 33 (2.4) 91 (2.6) 3 (1.4) 3 (1.5) 3 (2.6)
Hungary 9 (0.7) 25 (4.9) 16 (3.7) 21 (4.4) 38 (5.6)
Iceland r 16 (0.1) r 80 (0.4) r 18 (0.4) r 1 (0.1) r 1 (0.1)
Iran, Islamic Rep. of 0 (0.0) r 0 (0.0) r 0 (0.0) r 4 (3.8) r 96 (3.8)
Israel r 21 (1.5) r 33 (4.6) r 11 (3.1) r 19 (3.8) r 36 (5.1)
Italy 11 (0.7) 18 (3.1) 12 (2.6) 41 (3.9) 29 (3.7)
Kuwait x x r 0 (0.0) r 2 (0.1) r 4 (2.8) r 94 (2.8)
Latvia r 6 (0.6) r 36 (6.9) r 5 (2.6) r 20 (5.2) r 39 (6.2)
Lithuania 8 (0.7) r 17 (4.0) r 8 (2.9) r 51 (4.9) r 23 (4.4)
Macedonia, Rep. of s 0 (0.2) r 3 (2.5) r 2 (0.4) r 9 (5.1) r 86 (6.0)
Moldova, Rep. of s 3 (0.6) s 0 (0.0) s 0 (0.0) s 2 (0.3) s 98 (2.0)
Morocco x x x x x x x x x x
Netherlands 9 (0.8) 17 (4.0) 7 (2.4) 25 (4.4) 51 (5.0)
New Zealand 11 (0.7) 59 (4.6) 15 (3.2) 18 (3.4) 8 (2.3)
Norway 10 (0.6) 36 (5.3) 28 (4.6) 20 (4.1) 16 (4.0)
Romania r 4 (0.5) r 11 (4.3) r 5 (2.6) r 11 (5.4) r 73 (6.2)
Russian Federation 1 (0.4) 8 (4.0) 0 (0.0) 17 (6.5) 75 (8.4)
Scotland r 9 (0.7) 24 (4.2) 18 (3.8) 16 (3.1) 42 (4.9)
Singapore 83 (3.1) 59 (3.4) 20 (2.8) 15 (2.9) 6 (1.8)
Slovak Republic r 2 (0.3) s 1 (0.1) s 2 (1.8) s 17 (6.1) s 80 (6.3)
Slovenia 10 (0.4) 75 (4.0) 8 (2.6) 11 (2.8) 7 (2.4)
Sweden 9 (0.7) 53 (4.6) 25 (4.3) 17 (3.3) 4 (1.8)
Turkey s 9 (1.4) s 47 (9.1) s 2 (2.0) s 11 (4.5) s 40 (8.0)
United States 27 (1.5) 56 (4.3) 22 (3.8) 16 (2.9) 6 (1.6)
International Avg. 11 (0.2) 32 (0.8) 10 (0.5) 17 (0.7) 42 (0.8)
Countries
Average Number ofComputersAvailable
Percentage of Students byHow Many Computers Have Internet Access
All Most Some None
Background data provided by schools.
( ) Standard errors appear in parentheses. Because results are rounded to the nearest wholenumber, some totals may appear inconsistent.
An “r” indicates data are available for 70-84% of the students. An “s” indicates data are avail-able for 50-69% of the students. An “x” indicates data are available for less than 50% of thestudents.
A dash (–) indicates data are not available. A tilde (~) indicates insufficient data to reportachievement.
ISC 4th GradePIRLS 2001
8

[257]
Chapter 8Students’ ReadingAttitudes, Self-Concept,and Out-of-School Activities
Literacy activities at home and in school encourage
and reinforce students’ positive reading attitudes.
The reading curriculum in most countries
emphasizes students’ positive attitudes toward
reading as a major objective. Students who enjoy
reading usually read more frequently, thus
broadening their knowledge of text situations,
expanding their literary experiences, and improving
their comprehension skills.

[258]
What Are Students’ Attitudes Toward Reading?
To examine fourth-graders’ views on reading for enjoyment and appreciatingbooks, PIRLS created an Index of Students’ Attitudes Toward Reading. Theindex was based on students’ agreement with the following statements relatedto reading:
• I read only if I have to (reverse coded).
• I like talking about books with other people.
• I would be happy if someone gave me a book as a present.
• I think reading is boring (reverse coded).
• I enjoy reading.
Responses to each statement, ranging from disagree a lot to agree a loton a 4-point scale, were averaged across each student. Students in the highcategory agreed or agreed a lot with all of the statements about reading. Stu-
dents in the low category of students’ attitudes toward readingdisagreed or disagreed a lot with all of the statements. Themedium level of the index indicates all other combinations ofresponses. The results are shown in Exhibit 8.1.
Student attitudes toward reading were generally posi-tive. About half the students, on average, internationally, werecategorized in the high category of the index, and over 90percent of the students were in either the high or medium cat-egory. At least 60 percent of the students in Iran, Moldova,Macedonia, Greece, Romania, and Bulgaria were at the highlevel; the country with the largest percentage of students atthis level was Iran with 71 percent. Within all countries, stu-dents with the most positive attitudes had the highest readingachievement.
Exhibit 8.2 presents the percentage of boys and girls ateach of the levels in the index. More girls than boys had positive attitudes in allcountries. There were significantly greater percentages of girls in the high cat-
chapter 8: students’ reading attitudes, self-concept, and out-of-school activities
[259]chapter 8: students’ reading attitudes, self-concept, and out-of-school activities
egory, whereas there were greater percentages of boys than girls in the mediumand low categories. On average, internationally, 60 percent of the students inthe high category were girls and 42 percent boys. Countries with the greatestdifferences (at least 24%) between girls and boysat the high level included Cyprus, Latvia, Lithua-nia, The Netherlands, Singapore, and Slovenia.
What Are Students’ Perceptions of TheirReading Ability?
Students possess self-awareness of their abilitiesand limitations in their coursework at school. Pos-itive perceptions of their reading ability may influence their perseverance witha task, or may encourage their engagement in activities related to academicperformance.
To examine students’ conceptions of their reading ability, PIRLS askedstudents to respond to the following statements about how well they read:
• Reading is very easy for me.
• I do not read as well as other students in my class (reverse coded).
• Reading aloud is very hard for me (reverse coded).
Response options ranged from disagree a lot to agree a lot on a 4-pointscale. PIRLS combined students’ responses to these three statements to forman Index of Students’ Reading Self-Concept. Students in the high categoryagreed or agreed a lot with all three statements about their perceived com-petence in reading. Students in the low category disagreed or disagreed a lotwith all three statements. The medium level of the index indicates all othercombinations of responses. Results of this index are presented in Exhibit 8.3.
Less than half the students, internationally (40%), were at the highlevel of the index with percentages of students for individual countries rangingfrom 23 to 56 percent. In six countries – Italy, Sweden, Bulgaria, Slovenia,Cyprus, and Israel – more than half of the students were in the high category.On average, across countries, the majority of students were in the medium cat-
Student attitudes toward reading weregenerally positive.
[260]
egory (55%), while only 5 percent were in the low category. Students with apositive reading self-concept had higher achievement in each of the PIRLScountries.
The percentages of boys and girls at each level of the index are shownin Exhibit 8.4. On average, internationally, more girls were in the high cate-gory than boys (43% vs. 36%). Italy and Sweden were the only countrieswith more than 50 percent of both girls and boys in the high category. Inmost countries, more girls than boys had positive reading self-concepts. Therewere no significant gender differences at any level in Iceland and The Nether-lands. In addition, England, France, Scotland, and the United States did nothave significantly different percentages of girls and boys at the high or mediumlevels.
chapter 8: students’ reading attitudes, self-concept, and out-of-school activities

[261]chapter 8: students’ reading attitudes, self-concept, and out-of-school activities
Exhibit 8.1: Index of Students’ Attitudes Toward Reading (SATR)
SOU
RCE:
IEA
Pro
gres
s in
Inte
rnat
iona
l Rea
ding
Lite
racy
Stu
dy (P
IRLS
) 200
1.
Iran, Islamic Rep. of 71 (1.9) 432 (4.0) 27 (1.8) 375 (4.7) 3 (0.3) 344 (14.5)
Moldova, Rep. of 65 (1.9) 506 (4.3) 33 (1.9) 470 (4.7) 2 (0.3) ~ ~
Macedonia, Rep. of 62 (1.5) 480 (4.0) 37 (1.5) 395 (5.7) 1 (0.2) ~ ~
Greece 61 (1.7) 536 (3.8) 33 (1.4) 509 (4.9) 6 (0.6) 507 (9.3)
Romania 60 (1.7) 539 (4.5) 38 (1.7) 476 (6.2) 1 (0.2) ~ ~
Bulgaria 60 (1.6) 573 (3.3) 36 (1.4) 524 (4.8) 4 (0.5) 510 (10.8)
Turkey 59 (1.5) 478 (3.3) 40 (1.4) 410 (4.6) 1 (0.2) ~ ~
Slovenia 59 (1.4) 523 (2.4) 35 (1.3) 475 (3.4) 6 (0.6) 469 (6.9)
France 58 (1.1) 548 (2.4) 39 (1.2) 499 (3.3) 3 (0.3) 480 (5.9)
Cyprus 57 (1.3) 513 (3.5) 37 (1.0) 471 (3.6) 7 (0.7) 486 (7.0)
Italy 56 (1.3) 555 (2.5) 38 (1.2) 524 (3.2) 6 (0.5) 523 (5.0)
Russian Federation 54 (1.8) 544 (3.8) 42 (1.7) 510 (6.0) 4 (0.4) 519 (6.0)
Canada (O,Q) 54 (1.0) 566 (2.4) 38 (1.0) 523 (2.6) 8 (0.4) 511 (4.7)
Sweden 54 (1.1) 581 (2.1) 39 (0.9) 542 (2.6) 7 (0.6) 520 (4.6)
Singapore 54 (1.3) 561 (4.6) 42 (1.2) 490 (5.8) 5 (0.3) 506 (7.2)
New Zealand 51 (1.3) 560 (4.2) 41 (1.3) 499 (4.4) 8 (0.8) 507 (6.9)
Germany 50 (0.9) 563 (1.8) 40 (0.7) 520 (2.5) 10 (0.5) 510 (3.2)
Hungary 50 (1.2) 565 (2.7) 40 (1.0) 525 (2.4) 10 (0.8) 522 (4.2)
Hong Kong, SAR 49 (1.2) 545 (2.7) 46 (1.1) 513 (3.5) 5 (0.3) 510 (6.9)
Kuwait r 49 (1.2) 419 (4.6) 47 (1.2) 385 (5.2) 4 (0.4) 371 (14.5)
Iceland 49 (1.0) 538 (1.9) 45 (1.0) 495 (1.9) 6 (0.4) 471 (4.3)
Morocco 48 (2.2) 383 (12.7) 49 (2.2) 323 (10.2) 3 (1.0) 319 (19.7)
Scotland 47 (1.3) 554 (3.9) 42 (1.1) 510 (4.3) 11 (0.9) 498 (5.6)
Colombia 47 (1.6) 445 (5.1) 50 (1.5) 405 (5.0) 3 (0.3) 433 (8.3)
Lithuania 46 (1.5) 560 (2.5) 48 (1.4) 531 (3.1) 6 (0.6) 524 (5.8)
Israel 44 (1.4) 534 (3.1) 48 (1.2) 488 (3.9) 8 (0.6) 508 (6.0)
England 44 (1.4) 584 (3.9) 43 (1.2) 531 (3.8) 13 (0.9) 521 (5.2)
Norway 44 (1.2) 529 (3.4) 47 (1.0) 481 (3.4) 9 (0.6) 460 (6.7)
Slovak Republic 44 (1.5) 540 (3.0) 50 (1.3) 504 (3.4) 6 (0.6) 495 (5.7)
Netherlands 43 (1.3) 575 (2.4) 42 (1.0) 543 (2.8) 15 (0.8) 528 (3.6)
Argentina r 43 (1.3) 453 (6.4) 52 (1.1) 417 (5.7) 4 (0.5) 424 (11.6)
Latvia 43 (1.6) 566 (2.6) 49 (1.5) 530 (2.6) 8 (0.6) 528 (3.7)
United States 42 (1.1) 569 (3.7) 44 (0.9) 528 (4.4) 13 (0.9) 513 (5.1)
Czech Republic 40 (1.2) 561 (3.2) 52 (1.2) 525 (2.7) 7 (0.6) 500 (3.7)
Belize 33 (1.4) 372 (6.9) 62 (1.4) 310 (5.2) 5 (0.6) 311 (9.3)
International Avg. 51 (0.2) 524 (0.7) 43 (0.2) 479 (0.7) 6 (0.1) 478 (1.6)
Percentage of Students atHigh Level of SATRCountries
HighSATR
MediumSATR
LowSATR
Percent ofStudents
AverageAchievement
0 10050 7525
Percent ofStudents
AverageAchievement
Percent ofStudents
AverageAchievement
( ) Standard errors appear in parentheses. Because results are rounded to the nearest wholenumber, some totals may appear inconsistent.
An “r” indicates data are available for 70-84% of the students. An “s” indicates data are avail-able for 50-69% of the students. An “x” indicates data are available for less than 50% of thestudents.
A dash (–) indicates data are not available. A tilde (~) indicates insufficient data to reportachievement.
ISC 4th GradePIRLS 2001
Index of Students’ Attitudes Toward Reading (SATR)
Based on students’ agreement with the following: I readonly if I have to; I like talking about books with otherpeople; I would be happy if someone gave me a book as apresent; I think reading is boring; and I enjoy reading.Average is computed on a 4-point scale: Disagree a lot = 1,
Disagree a little = 2, Agree a little = 3, and Agree a lot = 4.Responses for negative statement were reverse-coded. Highlevel indicates an average greater than 3 through 4. Mediumlevel indicates an average of 2 through 3. Low level indicatesan average of 1 to less than 2.
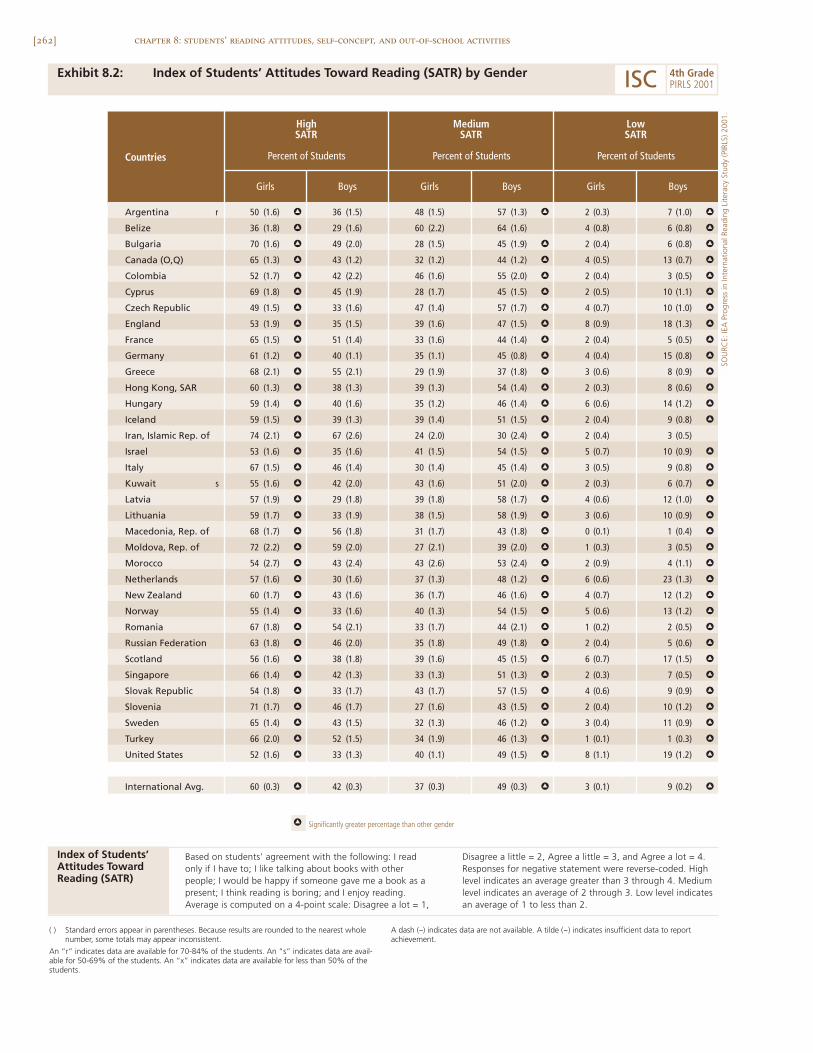
[262] chapter 8: students’ reading attitudes, self-concept, and out-of-school activities
Exhibit 8.2: Index of Students’ Attitudes Toward Reading (SATR) by Gender
Argentina r 50 (1.6) h 36 (1.5) 48 (1.5) 57 (1.3) h 2 (0.3) 7 (1.0) h
Belize 36 (1.8) h 29 (1.6) 60 (2.2) 64 (1.6) 4 (0.8) 6 (0.8) h
Bulgaria 70 (1.6) h 49 (2.0) 28 (1.5) 45 (1.9) h 2 (0.4) 6 (0.8) h
Canada (O,Q) 65 (1.3) h 43 (1.2) 32 (1.2) 44 (1.2) h 4 (0.5) 13 (0.7) h
Colombia 52 (1.7) h 42 (2.2) 46 (1.6) 55 (2.0) h 2 (0.4) 3 (0.5) h
Cyprus 69 (1.8) h 45 (1.9) 28 (1.7) 45 (1.5) h 2 (0.5) 10 (1.1) h
Czech Republic 49 (1.5) h 33 (1.6) 47 (1.4) 57 (1.7) h 4 (0.7) 10 (1.0) h
England 53 (1.9) h 35 (1.5) 39 (1.6) 47 (1.5) h 8 (0.9) 18 (1.3) h
France 65 (1.5) h 51 (1.4) 33 (1.6) 44 (1.4) h 2 (0.4) 5 (0.5) h
Germany 61 (1.2) h 40 (1.1) 35 (1.1) 45 (0.8) h 4 (0.4) 15 (0.8) h
Greece 68 (2.1) h 55 (2.1) 29 (1.9) 37 (1.8) h 3 (0.6) 8 (0.9) h
Hong Kong, SAR 60 (1.3) h 38 (1.3) 39 (1.3) 54 (1.4) h 2 (0.3) 8 (0.6) h
Hungary 59 (1.4) h 40 (1.6) 35 (1.2) 46 (1.4) h 6 (0.6) 14 (1.2) h
Iceland 59 (1.5) h 39 (1.3) 39 (1.4) 51 (1.5) h 2 (0.4) 9 (0.8) h
Iran, Islamic Rep. of 74 (2.1) h 67 (2.6) 24 (2.0) 30 (2.4) h 2 (0.4) 3 (0.5)
Israel 53 (1.6) h 35 (1.6) 41 (1.5) 54 (1.5) h 5 (0.7) 10 (0.9) h
Italy 67 (1.5) h 46 (1.4) 30 (1.4) 45 (1.4) h 3 (0.5) 9 (0.8) h
Kuwait s 55 (1.6) h 42 (2.0) 43 (1.6) 51 (2.0) h 2 (0.3) 6 (0.7) h
Latvia 57 (1.9) h 29 (1.8) 39 (1.8) 58 (1.7) h 4 (0.6) 12 (1.0) h
Lithuania 59 (1.7) h 33 (1.9) 38 (1.5) 58 (1.9) h 3 (0.6) 10 (0.9) h
Macedonia, Rep. of 68 (1.7) h 56 (1.8) 31 (1.7) 43 (1.8) h 0 (0.1) 1 (0.4) h
Moldova, Rep. of 72 (2.2) h 59 (2.0) 27 (2.1) 39 (2.0) h 1 (0.3) 3 (0.5) h
Morocco 54 (2.7) h 43 (2.4) 43 (2.6) 53 (2.4) h 2 (0.9) 4 (1.1) h
Netherlands 57 (1.6) h 30 (1.6) 37 (1.3) 48 (1.2) h 6 (0.6) 23 (1.3) h
New Zealand 60 (1.7) h 43 (1.6) 36 (1.7) 46 (1.6) h 4 (0.7) 12 (1.2) h
Norway 55 (1.4) h 33 (1.6) 40 (1.3) 54 (1.5) h 5 (0.6) 13 (1.2) h
Romania 67 (1.8) h 54 (2.1) 33 (1.7) 44 (2.1) h 1 (0.2) 2 (0.5) h
Russian Federation 63 (1.8) h 46 (2.0) 35 (1.8) 49 (1.8) h 2 (0.4) 5 (0.6) h
Scotland 56 (1.6) h 38 (1.8) 39 (1.6) 45 (1.5) h 6 (0.7) 17 (1.5) h
Singapore 66 (1.4) h 42 (1.3) 33 (1.3) 51 (1.3) h 2 (0.3) 7 (0.5) h
Slovak Republic 54 (1.8) h 33 (1.7) 43 (1.7) 57 (1.5) h 4 (0.6) 9 (0.9) h
Slovenia 71 (1.7) h 46 (1.7) 27 (1.6) 43 (1.5) h 2 (0.4) 10 (1.2) h
Sweden 65 (1.4) h 43 (1.5) 32 (1.3) 46 (1.2) h 3 (0.4) 11 (0.9) h
Turkey 66 (2.0) h 52 (1.5) 34 (1.9) 46 (1.3) h 1 (0.1) 1 (0.3) h
United States 52 (1.6) h 33 (1.3) 40 (1.1) 49 (1.5) h 8 (1.1) 19 (1.2) h
International Avg. 60 (0.3) h 42 (0.3) 37 (0.3) 49 (0.3) h 3 (0.1) 9 (0.2) h
h Significantly greater percentage than other gender
Countries
Girls Boys
HighSATR
Percent of Students
MediumSATR
Percent of Students
LowSATR
Percent of Students
Girls Boys Girls Boys
( ) Standard errors appear in parentheses. Because results are rounded to the nearest wholenumber, some totals may appear inconsistent.
An “r” indicates data are available for 70-84% of the students. An “s” indicates data are avail-able for 50-69% of the students. An “x” indicates data are available for less than 50% of thestudents.
A dash (–) indicates data are not available. A tilde (~) indicates insufficient data to reportachievement.
SOU
RCE:
IEA
Pro
gres
s in
Inte
rnat
iona
l Rea
ding
Lite
racy
Stu
dy (P
IRLS
) 200
1.
ISC 4th GradePIRLS 2001
Index of Students’ Attitudes Toward Reading (SATR)
Based on students’ agreement with the following: I readonly if I have to; I like talking about books with otherpeople; I would be happy if someone gave me a book as apresent; I think reading is boring; and I enjoy reading.Average is computed on a 4-point scale: Disagree a lot = 1,
Disagree a little = 2, Agree a little = 3, and Agree a lot = 4.Responses for negative statement were reverse-coded. Highlevel indicates an average greater than 3 through 4. Mediumlevel indicates an average of 2 through 3. Low level indicatesan average of 1 to less than 2.
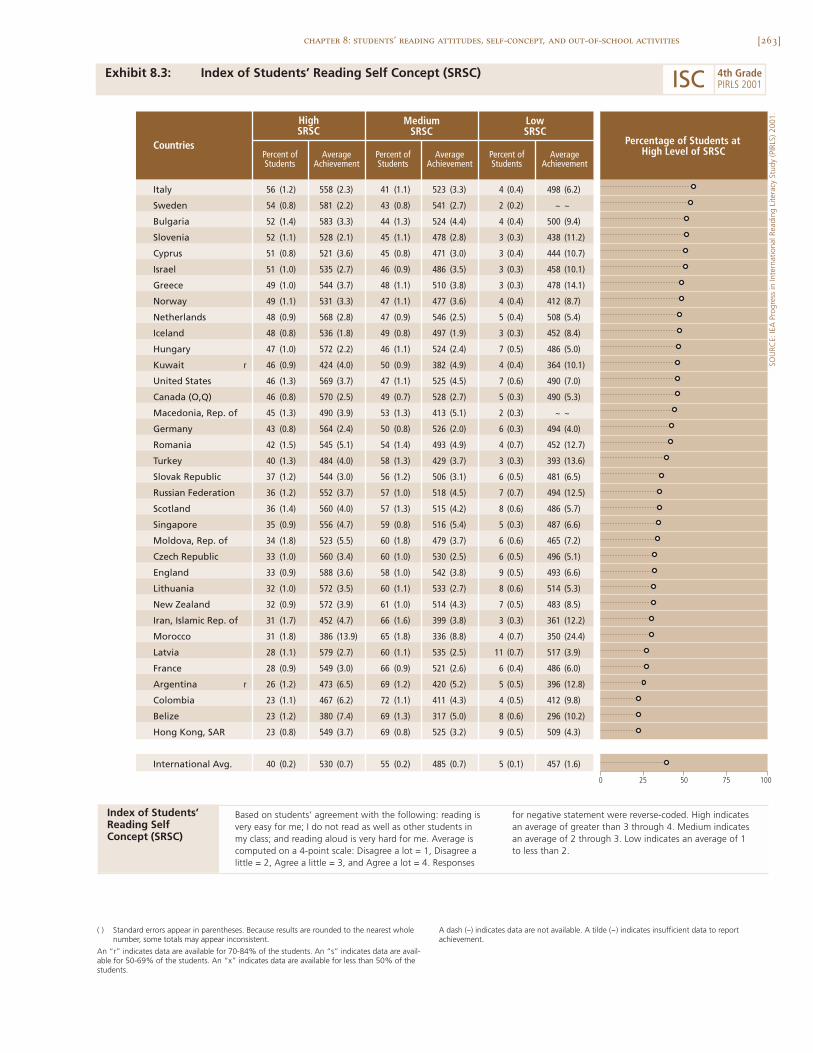
[263]chapter 8: students’ reading attitudes, self-concept, and out-of-school activities
Exhibit 8.3: Index of Students’ Reading Self Concept (SRSC)
SOU
RCE:
IEA
Pro
gres
s in
Inte
rnat
iona
l Rea
ding
Lite
racy
Stu
dy (P
IRLS
) 200
1.
Italy 56 (1.2) 558 (2.3) 41 (1.1) 523 (3.3) 4 (0.4) 498 (6.2)
Sweden 54 (0.8) 581 (2.2) 43 (0.8) 541 (2.7) 2 (0.2) ~ ~
Bulgaria 52 (1.4) 583 (3.3) 44 (1.3) 524 (4.4) 4 (0.4) 500 (9.4)
Slovenia 52 (1.1) 528 (2.1) 45 (1.1) 478 (2.8) 3 (0.3) 438 (11.2)
Cyprus 51 (0.8) 521 (3.6) 45 (0.8) 471 (3.0) 3 (0.4) 444 (10.7)
Israel 51 (1.0) 535 (2.7) 46 (0.9) 486 (3.5) 3 (0.3) 458 (10.1)
Greece 49 (1.0) 544 (3.7) 48 (1.1) 510 (3.8) 3 (0.3) 478 (14.1)
Norway 49 (1.1) 531 (3.3) 47 (1.1) 477 (3.6) 4 (0.4) 412 (8.7)
Netherlands 48 (0.9) 568 (2.8) 47 (0.9) 546 (2.5) 5 (0.4) 508 (5.4)
Iceland 48 (0.8) 536 (1.8) 49 (0.8) 497 (1.9) 3 (0.3) 452 (8.4)
Hungary 47 (1.0) 572 (2.2) 46 (1.1) 524 (2.4) 7 (0.5) 486 (5.0)
Kuwait r 46 (0.9) 424 (4.0) 50 (0.9) 382 (4.9) 4 (0.4) 364 (10.1)
United States 46 (1.3) 569 (3.7) 47 (1.1) 525 (4.5) 7 (0.6) 490 (7.0)
Canada (O,Q) 46 (0.8) 570 (2.5) 49 (0.7) 528 (2.7) 5 (0.3) 490 (5.3)
Macedonia, Rep. of 45 (1.3) 490 (3.9) 53 (1.3) 413 (5.1) 2 (0.3) ~ ~
Germany 43 (0.8) 564 (2.4) 50 (0.8) 526 (2.0) 6 (0.3) 494 (4.0)
Romania 42 (1.5) 545 (5.1) 54 (1.4) 493 (4.9) 4 (0.7) 452 (12.7)
Turkey 40 (1.3) 484 (4.0) 58 (1.3) 429 (3.7) 3 (0.3) 393 (13.6)
Slovak Republic 37 (1.2) 544 (3.0) 56 (1.2) 506 (3.1) 6 (0.5) 481 (6.5)
Russian Federation 36 (1.2) 552 (3.7) 57 (1.0) 518 (4.5) 7 (0.7) 494 (12.5)
Scotland 36 (1.4) 560 (4.0) 57 (1.3) 515 (4.2) 8 (0.6) 486 (5.7)
Singapore 35 (0.9) 556 (4.7) 59 (0.8) 516 (5.4) 5 (0.3) 487 (6.6)
Moldova, Rep. of 34 (1.8) 523 (5.5) 60 (1.8) 479 (3.7) 6 (0.6) 465 (7.2)
Czech Republic 33 (1.0) 560 (3.4) 60 (1.0) 530 (2.5) 6 (0.5) 496 (5.1)
England 33 (0.9) 588 (3.6) 58 (1.0) 542 (3.8) 9 (0.5) 493 (6.6)
Lithuania 32 (1.0) 572 (3.5) 60 (1.1) 533 (2.7) 8 (0.6) 514 (5.3)
New Zealand 32 (0.9) 572 (3.9) 61 (1.0) 514 (4.3) 7 (0.5) 483 (8.5)
Iran, Islamic Rep. of 31 (1.7) 452 (4.7) 66 (1.6) 399 (3.8) 3 (0.3) 361 (12.2)
Morocco 31 (1.8) 386 (13.9) 65 (1.8) 336 (8.8) 4 (0.7) 350 (24.4)
Latvia 28 (1.1) 579 (2.7) 60 (1.1) 535 (2.5) 11 (0.7) 517 (3.9)
France 28 (0.9) 549 (3.0) 66 (0.9) 521 (2.6) 6 (0.4) 486 (6.0)
Argentina r 26 (1.2) 473 (6.5) 69 (1.2) 420 (5.2) 5 (0.5) 396 (12.8)
Colombia 23 (1.1) 467 (6.2) 72 (1.1) 411 (4.3) 4 (0.5) 412 (9.8)
Belize 23 (1.2) 380 (7.4) 69 (1.3) 317 (5.0) 8 (0.6) 296 (10.2)
Hong Kong, SAR 23 (0.8) 549 (3.7) 69 (0.8) 525 (3.2) 9 (0.5) 509 (4.3)
International Avg. 40 (0.2) 530 (0.7) 55 (0.2) 485 (0.7) 5 (0.1) 457 (1.6)
Countries Percentage of Students atHigh Level of SRSC
HighSRSC
MediumSRSC
LowSRSC
Percent ofStudents
AverageAchievement
Percent ofStudents
AverageAchievement
Percent ofStudents
AverageAchievement
0 10050 7525
( ) Standard errors appear in parentheses. Because results are rounded to the nearest wholenumber, some totals may appear inconsistent.
An “r” indicates data are available for 70-84% of the students. An “s” indicates data are avail-able for 50-69% of the students. An “x” indicates data are available for less than 50% of thestudents.
A dash (–) indicates data are not available. A tilde (~) indicates insufficient data to reportachievement.
ISC 4th GradePIRLS 2001
Index of Students’ Reading Self Concept (SRSC)
Based on students’ agreement with the following: reading isvery easy for me; I do not read as well as other students inmy class; and reading aloud is very hard for me. Average iscomputed on a 4-point scale: Disagree a lot = 1, Disagree alittle = 2, Agree a little = 3, and Agree a lot = 4. Responses
for negative statement were reverse-coded. High indicates an average of greater than 3 through 4. Medium indicates an average of 2 through 3. Low indicates an average of 1 to less than 2.
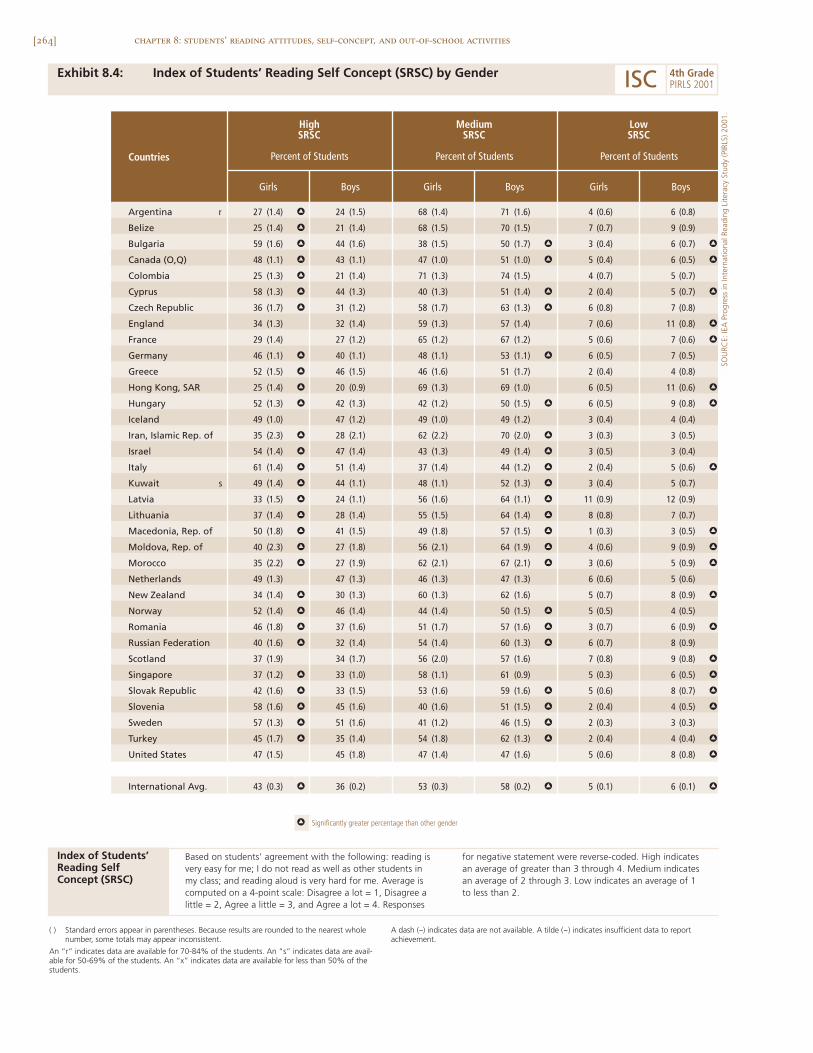
[264] chapter 8: students’ reading attitudes, self-concept, and out-of-school activities
Exhibit 8.4: Index of Students’ Reading Self Concept (SRSC) by Gender
Argentina r 27 (1.4) h 24 (1.5) 68 (1.4) 71 (1.6) 4 (0.6) 6 (0.8)
Belize 25 (1.4) h 21 (1.4) 68 (1.5) 70 (1.5) 7 (0.7) 9 (0.9)
Bulgaria 59 (1.6) h 44 (1.6) 38 (1.5) 50 (1.7) h 3 (0.4) 6 (0.7) h
Canada (O,Q) 48 (1.1) h 43 (1.1) 47 (1.0) 51 (1.0) h 5 (0.4) 6 (0.5) h
Colombia 25 (1.3) h 21 (1.4) 71 (1.3) 74 (1.5) 4 (0.7) 5 (0.7)
Cyprus 58 (1.3) h 44 (1.3) 40 (1.3) 51 (1.4) h 2 (0.4) 5 (0.7) h
Czech Republic 36 (1.7) h 31 (1.2) 58 (1.7) 63 (1.3) h 6 (0.8) 7 (0.8)
England 34 (1.3) 32 (1.4) 59 (1.3) 57 (1.4) 7 (0.6) 11 (0.8) h
France 29 (1.4) 27 (1.2) 65 (1.2) 67 (1.2) 5 (0.6) 7 (0.6) h
Germany 46 (1.1) h 40 (1.1) 48 (1.1) 53 (1.1) h 6 (0.5) 7 (0.5)
Greece 52 (1.5) h 46 (1.5) 46 (1.6) 51 (1.7) 2 (0.4) 4 (0.8)
Hong Kong, SAR 25 (1.4) h 20 (0.9) 69 (1.3) 69 (1.0) 6 (0.5) 11 (0.6) h
Hungary 52 (1.3) h 42 (1.3) 42 (1.2) 50 (1.5) h 6 (0.5) 9 (0.8) h
Iceland 49 (1.0) 47 (1.2) 49 (1.0) 49 (1.2) 3 (0.4) 4 (0.4)
Iran, Islamic Rep. of 35 (2.3) h 28 (2.1) 62 (2.2) 70 (2.0) h 3 (0.3) 3 (0.5)
Israel 54 (1.4) h 47 (1.4) 43 (1.3) 49 (1.4) h 3 (0.5) 3 (0.4)
Italy 61 (1.4) h 51 (1.4) 37 (1.4) 44 (1.2) h 2 (0.4) 5 (0.6) h
Kuwait s 49 (1.4) h 44 (1.1) 48 (1.1) 52 (1.3) h 3 (0.4) 5 (0.7)
Latvia 33 (1.5) h 24 (1.1) 56 (1.6) 64 (1.1) h 11 (0.9) 12 (0.9)
Lithuania 37 (1.4) h 28 (1.4) 55 (1.5) 64 (1.4) h 8 (0.8) 7 (0.7)
Macedonia, Rep. of 50 (1.8) h 41 (1.5) 49 (1.8) 57 (1.5) h 1 (0.3) 3 (0.5) h
Moldova, Rep. of 40 (2.3) h 27 (1.8) 56 (2.1) 64 (1.9) h 4 (0.6) 9 (0.9) h
Morocco 35 (2.2) h 27 (1.9) 62 (2.1) 67 (2.1) h 3 (0.6) 5 (0.9) h
Netherlands 49 (1.3) 47 (1.3) 46 (1.3) 47 (1.3) 6 (0.6) 5 (0.6)
New Zealand 34 (1.4) h 30 (1.3) 60 (1.3) 62 (1.6) 5 (0.7) 8 (0.9) h
Norway 52 (1.4) h 46 (1.4) 44 (1.4) 50 (1.5) h 5 (0.5) 4 (0.5)
Romania 46 (1.8) h 37 (1.6) 51 (1.7) 57 (1.6) h 3 (0.7) 6 (0.9) h
Russian Federation 40 (1.6) h 32 (1.4) 54 (1.4) 60 (1.3) h 6 (0.7) 8 (0.9)
Scotland 37 (1.9) 34 (1.7) 56 (2.0) 57 (1.6) 7 (0.8) 9 (0.8) h
Singapore 37 (1.2) h 33 (1.0) 58 (1.1) 61 (0.9) 5 (0.3) 6 (0.5) h
Slovak Republic 42 (1.6) h 33 (1.5) 53 (1.6) 59 (1.6) h 5 (0.6) 8 (0.7) h
Slovenia 58 (1.6) h 45 (1.6) 40 (1.6) 51 (1.5) h 2 (0.4) 4 (0.5) h
Sweden 57 (1.3) h 51 (1.6) 41 (1.2) 46 (1.5) h 2 (0.3) 3 (0.3)
Turkey 45 (1.7) h 35 (1.4) 54 (1.8) 62 (1.3) h 2 (0.4) 4 (0.4) h
United States 47 (1.5) 45 (1.8) 47 (1.4) 47 (1.6) 5 (0.6) 8 (0.8) h
International Avg. 43 (0.3) h 36 (0.2) 53 (0.3) 58 (0.2) h 5 (0.1) 6 (0.1) h
h Significantly greater percentage than other gender
Countries
Girls Boys
HighSRSC
Percent of Students
MediumSRSC
Percent of Students
LowSRSC
Percent of Students
Girls Boys Girls Boys
( ) Standard errors appear in parentheses. Because results are rounded to the nearest wholenumber, some totals may appear inconsistent.
An “r” indicates data are available for 70-84% of the students. An “s” indicates data are avail-able for 50-69% of the students. An “x” indicates data are available for less than 50% of thestudents.
A dash (–) indicates data are not available. A tilde (~) indicates insufficient data to reportachievement.
SOU
RCE:
IEA
Pro
gres
s in
Inte
rnat
iona
l Rea
ding
Lite
racy
Stu
dy (P
IRLS
) 200
1.
ISC 4th GradePIRLS 2001
Index of Students’ Reading Self Concept (SRSC)
Based on students’ agreement with the following: reading isvery easy for me; I do not read as well as other students inmy class; and reading aloud is very hard for me. Average iscomputed on a 4-point scale: Disagree a lot = 1, Disagree alittle = 2, Agree a little = 3, and Agree a lot = 4. Responses
for negative statement were reverse-coded. High indicates an average of greater than 3 through 4. Medium indicates an average of 2 through 3. Low indicates an average of 1 to less than 2.
[265]chapter 8: students’ reading attitudes, self-concept, and out-of-school activities
How Often Do Students Engage in Literacy Activities Outside of School?
Students engage in many literacy activities outside of school, whether theyare reading or talking about reading with members of their families. At home,students read texts in various formats for many purposes. They may readstories, novels, or comic books for recreation, or they may read books, maga-zines, newspapers, or other nonfiction materials for information. Engagementin reading activities outside of school can support students’ intrinsic motiva-tion to read and learn, and broaden the scope of students’ background knowl-edge.
To learn more about students’ reading habits, PIRLS asked studentshow often they read different types of text when they were not in school. Stu-dents’ reports of their general reading habits are presented in Exhibit 8.5.Internationally, on average, 40 percent of students reported reading for funevery day or almost every day, and 69 percent at least once a week. In Bul-garia, France, Iceland, Lithuania, Moldova, and the Russian Federation, morethan half the students reported reading for fun every day or almost every day.In nearly all countries, students who reported reading for fun outside of schooldaily or almost daily had higher average reading achievement than thosereading for fun less frequently.
Exhibits 8.6 through 8.9 provide information on the frequency withwhich students read different types of text. Students’ reports of how oftenthey read stories or novels outside of school are shown in Exhibit 8.6. Onaverage, internationally, nearly two-thirds of students (63%) reported readingstories or novels at least once a week. Countries with the highest percentagesof students reading stories or novels every day or almost every day includedthe Colombia, Russian Federation, and Singapore. In the Czech Republic,Germany, Italy, Latvia, Norway, and the Slovak Republic, more than half of thestudents reported reading stories or novels twice a month or less.
Exhibit 8.7 presents students’ reports of how often they read stories ornovels outside of school by gender. Of the students who reported reading storiesor novels every day or almost every day in each country, the percentage of girlswas equal to or higher than the percentage of boys. Only in Cyprus, Iran,
[266]
Morocco, and Romania was the percentage of girls not significantly differentfrom the percentage of boys. On average, internationally, more than two-thirdsof the girls (70%) and more than half of the boys (55%) read stories or novelsat least once a week. More than 50 percent of girls in Italy and the SlovakRepublic reported reading stories or novels twice a month or less. Half or moreof the boys in Germany, Italy, and the Slovak Republic never or almost neverread stories or novels outside of school.
Students’ reports on how often they read for information outside ofschool (books that explain things, magazines, newspapers, and directions orinstructions) are presented in Exhibit 8.8. Internationally, on average, 18percent of the students reported reading for information every day or almostevery day. However, most students reported doing this kind of reading onceor twice a week. Students in The Netherlands and Sweden reported doing rel-atively little reading for information. These countries had the smallest per-centages of students who reported reading for information at least once ortwice a week (27% and 37%, respectively) and the largest percentages report-ing never or almost never reading such texts once or twice a month or less(72% and 63%, respectively). Only in Argentina, Bulgaria, Colombia, Kuwait,Macedonia, and Turkey did more than one-quarter of students report readinginformational text daily.
Exhibit 8.9 shows students’ reports of reading for information outsideof school by gender. Internationally, 62 percent of girls and 59 percent of boysread for information at least once a week. More than three-quarters of bothgirls and boys in Colombia and Macedonia read for information at least oncea week. Gender differences in reading for information were less pronounced instudents’ reading for information than in students’ reading of stories or novels.Significantly greater percentages of boys in Cyprus, Greece, and Sweden readfor information outside of school every day or almost every day. Significantlygreater percentages of girls in Bulgaria, New Zealand, and Scotland read forinformation outside of school at least once a week.
chapter 8: students’ reading attitudes, self-concept, and out-of-school activities
[267]chapter 8: students’ reading attitudes, self-concept, and out-of-school activities
Students’ interactions with their families about what they are readingcan help foster an interest in learning and improve students’ abilities to con-struct meaning from text. PIRLS asked both students and their parents howoften they talked about what the student was reading. Exhibit 8.10 showsparents’ reports of how often they talked with their children about what thechildren were reading. Students’ reports of how often they talked with theirfamilies about their reading are summarized in Exhibit 8.11. On average, inter-nationally, about one-third of the students’ parents reported talking withtheir children daily about what they were reading. The same percentage ofstudents reported talking every day or almost every day with their familiesabout what they were reading. In Colombia, Cyprus, and Iran, the percent-ages of students who reported talking daily with their families about readingwere higher than the percentages of students whose parents reported talkingdaily. This difference may be a result of students talking about their readingwith other members of the family besides their parents.
How Often Do Students Watch Television or Videos?
Exhibit 8.12 presents students’ reports of how often they watched televisionor videos on a normal school day. On average, internationally, 43 percent ofstudents reported watching television or videos less than 1 hour a day and 45percent watching television or videos between 1 and 5 hours a day. The averagenumber of hours students spent watching television or videos across coun-tries was 2 hours per day. Half or more of the students in Belize, Germany,Greece, Iceland, Iran, Italy, Kuwait, Morocco, Norway, the Russian Federa-tion, and Turkey reported spending less than an hour a day watching televi-sion or videos. In comparison, more than one-third of students in Argentina,England, Israel, and the Slovak Republic said they watched three or morehours of television or videos on a normal school day.
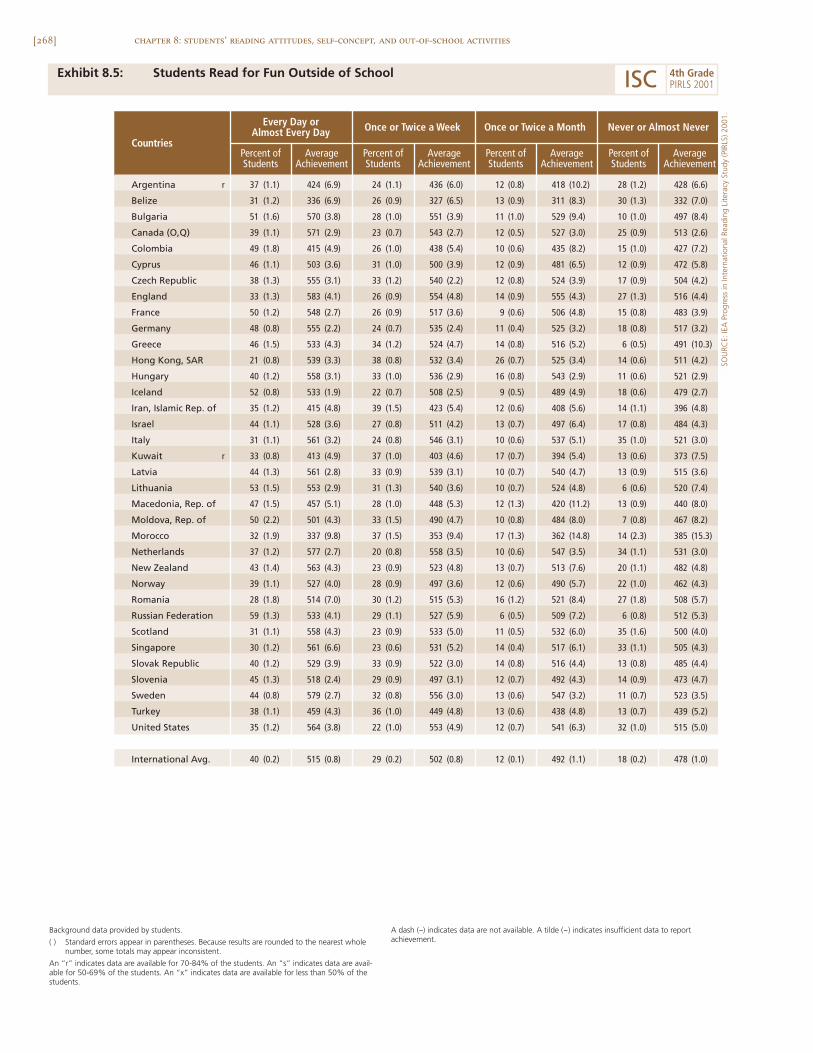
[268] chapter 8: students’ reading attitudes, self-concept, and out-of-school activities
Exhibit 8.5: Students Read for Fun Outside of School
Argentina r 37 (1.1) 424 (6.9) 24 (1.1) 436 (6.0) 12 (0.8) 418 (10.2) 28 (1.2) 428 (6.6)
Belize 31 (1.2) 336 (6.9) 26 (0.9) 327 (6.5) 13 (0.9) 311 (8.3) 30 (1.3) 332 (7.0)
Bulgaria 51 (1.6) 570 (3.8) 28 (1.0) 551 (3.9) 11 (1.0) 529 (9.4) 10 (1.0) 497 (8.4)
Canada (O,Q) 39 (1.1) 571 (2.9) 23 (0.7) 543 (2.7) 12 (0.5) 527 (3.0) 25 (0.9) 513 (2.6)
Colombia 49 (1.8) 415 (4.9) 26 (1.0) 438 (5.4) 10 (0.6) 435 (8.2) 15 (1.0) 427 (7.2)
Cyprus 46 (1.1) 503 (3.6) 31 (1.0) 500 (3.9) 12 (0.9) 481 (6.5) 12 (0.9) 472 (5.8)
Czech Republic 38 (1.3) 555 (3.1) 33 (1.2) 540 (2.2) 12 (0.8) 524 (3.9) 17 (0.9) 504 (4.2)
England 33 (1.3) 583 (4.1) 26 (0.9) 554 (4.8) 14 (0.9) 555 (4.3) 27 (1.3) 516 (4.4)
France 50 (1.2) 548 (2.7) 26 (0.9) 517 (3.6) 9 (0.6) 506 (4.8) 15 (0.8) 483 (3.9)
Germany 48 (0.8) 555 (2.2) 24 (0.7) 535 (2.4) 11 (0.4) 525 (3.2) 18 (0.8) 517 (3.2)
Greece 46 (1.5) 533 (4.3) 34 (1.2) 524 (4.7) 14 (0.8) 516 (5.2) 6 (0.5) 491 (10.3)
Hong Kong, SAR 21 (0.8) 539 (3.3) 38 (0.8) 532 (3.4) 26 (0.7) 525 (3.4) 14 (0.6) 511 (4.2)
Hungary 40 (1.2) 558 (3.1) 33 (1.0) 536 (2.9) 16 (0.8) 543 (2.9) 11 (0.6) 521 (2.9)
Iceland 52 (0.8) 533 (1.9) 22 (0.7) 508 (2.5) 9 (0.5) 489 (4.9) 18 (0.6) 479 (2.7)
Iran, Islamic Rep. of 35 (1.2) 415 (4.8) 39 (1.5) 423 (5.4) 12 (0.6) 408 (5.6) 14 (1.1) 396 (4.8)
Israel 44 (1.1) 528 (3.6) 27 (0.8) 511 (4.2) 13 (0.7) 497 (6.4) 17 (0.8) 484 (4.3)
Italy 31 (1.1) 561 (3.2) 24 (0.8) 546 (3.1) 10 (0.6) 537 (5.1) 35 (1.0) 521 (3.0)
Kuwait r 33 (0.8) 413 (4.9) 37 (1.0) 403 (4.6) 17 (0.7) 394 (5.4) 13 (0.6) 373 (7.5)
Latvia 44 (1.3) 561 (2.8) 33 (0.9) 539 (3.1) 10 (0.7) 540 (4.7) 13 (0.9) 515 (3.6)
Lithuania 53 (1.5) 553 (2.9) 31 (1.3) 540 (3.6) 10 (0.7) 524 (4.8) 6 (0.6) 520 (7.4)
Macedonia, Rep. of 47 (1.5) 457 (5.1) 28 (1.0) 448 (5.3) 12 (1.3) 420 (11.2) 13 (0.9) 440 (8.0)
Moldova, Rep. of 50 (2.2) 501 (4.3) 33 (1.5) 490 (4.7) 10 (0.8) 484 (8.0) 7 (0.8) 467 (8.2)
Morocco 32 (1.9) 337 (9.8) 37 (1.5) 353 (9.4) 17 (1.3) 362 (14.8) 14 (2.3) 385 (15.3)
Netherlands 37 (1.2) 577 (2.7) 20 (0.8) 558 (3.5) 10 (0.6) 547 (3.5) 34 (1.1) 531 (3.0)
New Zealand 43 (1.4) 563 (4.3) 23 (0.9) 523 (4.8) 13 (0.7) 513 (7.6) 20 (1.1) 482 (4.8)
Norway 39 (1.1) 527 (4.0) 28 (0.9) 497 (3.6) 12 (0.6) 490 (5.7) 22 (1.0) 462 (4.3)
Romania 28 (1.8) 514 (7.0) 30 (1.2) 515 (5.3) 16 (1.2) 521 (8.4) 27 (1.8) 508 (5.7)
Russian Federation 59 (1.3) 533 (4.1) 29 (1.1) 527 (5.9) 6 (0.5) 509 (7.2) 6 (0.8) 512 (5.3)
Scotland 31 (1.1) 558 (4.3) 23 (0.9) 533 (5.0) 11 (0.5) 532 (6.0) 35 (1.6) 500 (4.0)
Singapore 30 (1.2) 561 (6.6) 23 (0.6) 531 (5.2) 14 (0.4) 517 (6.1) 33 (1.1) 505 (4.3)
Slovak Republic 40 (1.2) 529 (3.9) 33 (0.9) 522 (3.0) 14 (0.8) 516 (4.4) 13 (0.8) 485 (4.4)
Slovenia 45 (1.3) 518 (2.4) 29 (0.9) 497 (3.1) 12 (0.7) 492 (4.3) 14 (0.9) 473 (4.7)
Sweden 44 (0.8) 579 (2.7) 32 (0.8) 556 (3.0) 13 (0.6) 547 (3.2) 11 (0.7) 523 (3.5)
Turkey 38 (1.1) 459 (4.3) 36 (1.0) 449 (4.8) 13 (0.6) 438 (4.8) 13 (0.7) 439 (5.2)
United States 35 (1.2) 564 (3.8) 22 (1.0) 553 (4.9) 12 (0.7) 541 (6.3) 32 (1.0) 515 (5.0)
International Avg. 40 (0.2) 515 (0.8) 29 (0.2) 502 (0.8) 12 (0.1) 492 (1.1) 18 (0.2) 478 (1.0)
Every Day orAlmost Every Day Once or Twice a Week Once or Twice a Month Never or Almost Never
Percent ofStudents
AverageAchievement
CountriesPercent ofStudents
AverageAchievement
Percent ofStudents
AverageAchievement
Percent ofStudents
AverageAchievement
Background data provided by students.
( ) Standard errors appear in parentheses. Because results are rounded to the nearest wholenumber, some totals may appear inconsistent.
An “r” indicates data are available for 70-84% of the students. An “s” indicates data are avail-able for 50-69% of the students. An “x” indicates data are available for less than 50% of thestudents.
A dash (–) indicates data are not available. A tilde (~) indicates insufficient data to reportachievement.
SOU
RCE:
IEA
Pro
gres
s in
Inte
rnat
iona
l Rea
ding
Lite
racy
Stu
dy (P
IRLS
) 200
1.
ISC 4th GradePIRLS 2001

[269]chapter 8: students’ reading attitudes, self-concept, and out-of-school activities
Exhibit 8.6: Students Read Stories or Novels Outside of School
SOU
RCE:
IEA
Pro
gres
s in
Inte
rnat
iona
l Rea
ding
Lite
racy
Stu
dy (P
IRLS
) 200
1.
Argentina 33 (1.1) 417 (7.4) 25 (1.1) 432 (7.8) 13 (0.8) 430 (10.0) 29 (1.3) 434 (6.3)
Belize 32 (1.4) 342 (6.1) 30 (0.9) 334 (7.1) 14 (0.7) 317 (6.9) 25 (1.6) 315 (7.3)
Bulgaria 28 (1.2) 571 (5.0) 29 (1.0) 555 (4.1) 21 (1.0) 558 (4.8) 22 (1.6) 519 (7.0)
Canada (O,Q) 46 (0.9) 559 (3.1) 28 (0.7) 543 (2.7) 15 (0.6) 528 (3.2) 10 (0.6) 505 (4.1)
Colombia 51 (1.8) 413 (4.8) 27 (1.1) 430 (6.1) 11 (0.8) 445 (7.3) 12 (0.9) 436 (7.4)
Cyprus 29 (1.0) 504 (4.7) 37 (1.2) 497 (3.3) 21 (0.9) 496 (4.6) 13 (0.7) 472 (5.6)
Czech Republic 21 (1.1) 550 (3.8) 23 (1.0) 542 (3.4) 19 (0.8) 545 (3.4) 37 (1.3) 524 (2.9)
England 38 (1.2) 574 (3.8) 32 (0.9) 553 (4.6) 17 (0.7) 547 (4.3) 13 (0.8) 501 (4.2)
France 30 (1.2) 545 (3.8) 28 (0.8) 524 (3.1) 20 (0.7) 522 (3.8) 22 (1.0) 505 (3.0)
Germany 27 (0.7) 556 (2.5) 20 (0.7) 543 (2.4) 15 (0.6) 538 (3.4) 38 (1.0) 527 (2.3)
Greece 29 (1.2) 537 (4.5) 38 (1.4) 521 (5.1) 21 (1.0) 523 (4.6) 12 (0.8) 513 (6.8)
Hong Kong, SAR 20 (1.0) 542 (3.5) 44 (0.9) 535 (3.1) 23 (0.8) 521 (3.7) 12 (0.6) 499 (5.1)
Hungary 33 (0.9) 551 (3.3) 33 (1.0) 541 (2.8) 23 (0.9) 543 (2.4) 12 (0.7) 532 (3.9)
Iceland 44 (0.7) 529 (2.2) 26 (0.6) 511 (2.4) 14 (0.6) 507 (3.3) 16 (0.5) 483 (3.2)
Iran, Islamic Rep. of 22 (0.9) 415 (6.1) 42 (0.9) 423 (4.8) 21 (0.9) 422 (4.8) 14 (1.3) 380 (6.7)
Israel 30 (1.1) 507 (5.1) 27 (1.0) 499 (4.1) 15 (0.7) 510 (4.9) 28 (1.3) 527 (3.7)
Italy 15 (0.8) 562 (4.5) 18 (0.7) 542 (3.9) 17 (0.6) 550 (4.1) 51 (1.1) 533 (2.5)
Kuwait r 28 (1.3) 414 (4.5) 36 (1.2) 406 (4.6) 21 (1.0) 397 (6.4) 16 (1.2) 371 (8.4)
Latvia 23 (0.9) 559 (4.2) 27 (0.9) 545 (3.5) 20 (0.8) 548 (3.4) 30 (1.0) 532 (2.8)
Lithuania 27 (1.2) 551 (3.6) 31 (1.0) 544 (3.3) 20 (0.9) 556 (4.3) 22 (1.1) 526 (4.0)
Macedonia, Rep. of 49 (1.4) 447 (5.5) 34 (1.2) 448 (6.1) 14 (1.1) 441 (7.7) 3 (0.4) 414 (10.8)
Moldova, Rep. of 23 (1.5) 501 (5.0) 44 (1.9) 494 (4.2) 22 (1.5) 492 (6.8) 11 (1.1) 475 (6.5)
Morocco 18 (1.1) 340 (9.0) 34 (1.6) 345 (8.0) 25 (1.2) 354 (8.4) 23 (2.4) 366 (25.6)
Netherlands 48 (1.1) 565 (2.8) 26 (0.9) 551 (2.5) 12 (0.6) 548 (3.6) 14 (0.8) 530 (3.9)
New Zealand 46 (1.5) 556 (4.7) 30 (1.1) 527 (4.3) 13 (0.8) 509 (5.8) 10 (0.8) 457 (7.8)
Norway 18 (0.9) 519 (5.5) 25 (0.9) 499 (3.7) 19 (0.9) 505 (4.3) 37 (1.4) 488 (3.9)
Romania 20 (1.2) 503 (5.4) 38 (1.5) 517 (5.2) 27 (1.2) 527 (6.0) 15 (1.2) 489 (7.8)
Russian Federation 56 (1.6) 533 (4.6) 30 (1.0) 525 (5.4) 9 (0.7) 523 (6.2) 6 (0.6) 506 (4.9)
Scotland 40 (1.3) 550 (4.6) 32 (1.0) 523 (3.8) 15 (0.7) 526 (4.7) 13 (0.9) 481 (7.0)
Singapore 53 (1.1) 553 (4.9) 27 (0.8) 517 (4.8) 11 (0.5) 492 (6.1) 9 (0.5) 464 (7.8)
Slovak Republic 15 (0.9) 531 (4.9) 21 (0.9) 525 (3.8) 22 (0.9) 524 (3.3) 42 (1.2) 509 (3.8)
Slovenia 26 (1.2) 515 (3.1) 27 (1.1) 501 (3.2) 19 (1.0) 497 (3.6) 27 (1.4) 496 (3.4)
Sweden 33 (0.8) 580 (2.6) 33 (0.7) 557 (2.7) 22 (0.6) 555 (3.0) 11 (0.6) 528 (3.6)
Turkey 35 (1.3) 459 (4.3) 41 (0.9) 454 (4.1) 17 (0.9) 441 (5.2) 7 (0.6) 403 (7.1)
United States 34 (1.5) 560 (4.0) 28 (1.1) 548 (4.3) 17 (0.8) 548 (5.5) 21 (1.0) 505 (6.0)
International Avg. 32 (0.2) 512 (0.8) 31 (0.2) 501 (0.7) 18 (0.1) 500 (0.9) 19 (0.2) 478 (1.2)
Countries
Every Day orAlmost Every Day Once or Twice a Week Once or Twice a Month Never or Almost Never
Percent ofStudents
AverageAchievement
Percent ofStudents
AverageAchievement
Percent ofStudents
AverageAchievement
Percent ofStudents
AverageAchievement
Background data provided by students.
( ) Standard errors appear in parentheses. Because results are rounded to the nearest wholenumber, some totals may appear inconsistent.
An “r” indicates data are available for 70-84% of the students. An “s” indicates data are avail-able for 50-69% of the students. An “x” indicates data are available for less than 50% of thestudents.
A dash (–) indicates data are not available. A tilde (~) indicates insufficient data to reportachievement.
ISC 4th GradePIRLS 2001
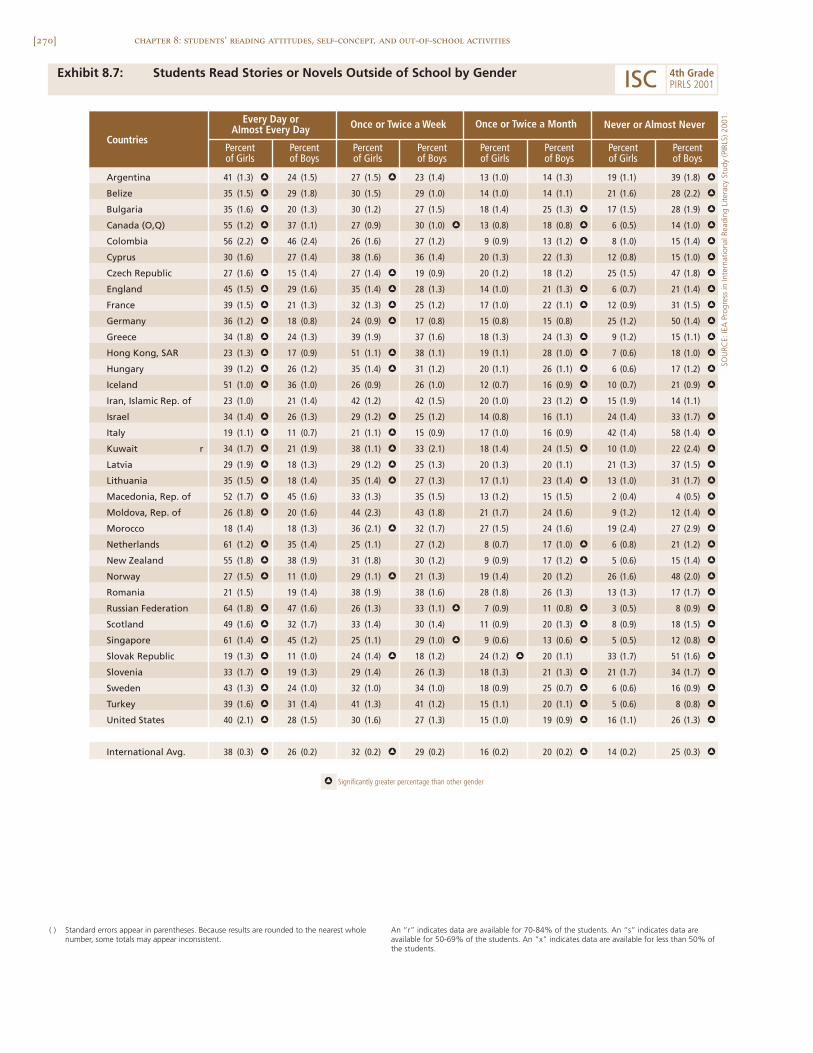
[270] chapter 8: students’ reading attitudes, self-concept, and out-of-school activities
Exhibit 8.7: Students Read Stories or Novels Outside of School by Gender
Argentina 41 (1.3) h 24 (1.5) 27 (1.5) h 23 (1.4) 13 (1.0) 14 (1.3) 19 (1.1) 39 (1.8) h
Belize 35 (1.5) h 29 (1.8) 30 (1.5) 29 (1.0) 14 (1.0) 14 (1.1) 21 (1.6) 28 (2.2) h
Bulgaria 35 (1.6) h 20 (1.3) 30 (1.2) 27 (1.5) 18 (1.4) 25 (1.3) h 17 (1.5) 28 (1.9) h
Canada (O,Q) 55 (1.2) h 37 (1.1) 27 (0.9) 30 (1.0) h 13 (0.8) 18 (0.8) h 6 (0.5) 14 (1.0) h
Colombia 56 (2.2) h 46 (2.4) 26 (1.6) 27 (1.2) 9 (0.9) 13 (1.2) h 8 (1.0) 15 (1.4) h
Cyprus 30 (1.6) 27 (1.4) 38 (1.6) 36 (1.4) 20 (1.3) 22 (1.3) 12 (0.8) 15 (1.0) h
Czech Republic 27 (1.6) h 15 (1.4) 27 (1.4) h 19 (0.9) 20 (1.2) 18 (1.2) 25 (1.5) 47 (1.8) h
England 45 (1.5) h 29 (1.6) 35 (1.4) h 28 (1.3) 14 (1.0) 21 (1.3) h 6 (0.7) 21 (1.4) h
France 39 (1.5) h 21 (1.3) 32 (1.3) h 25 (1.2) 17 (1.0) 22 (1.1) h 12 (0.9) 31 (1.5) h
Germany 36 (1.2) h 18 (0.8) 24 (0.9) h 17 (0.8) 15 (0.8) 15 (0.8) 25 (1.2) 50 (1.4) h
Greece 34 (1.8) h 24 (1.3) 39 (1.9) 37 (1.6) 18 (1.3) 24 (1.3) h 9 (1.2) 15 (1.1) h
Hong Kong, SAR 23 (1.3) h 17 (0.9) 51 (1.1) h 38 (1.1) 19 (1.1) 28 (1.0) h 7 (0.6) 18 (1.0) h
Hungary 39 (1.2) h 26 (1.2) 35 (1.4) h 31 (1.2) 20 (1.1) 26 (1.1) h 6 (0.6) 17 (1.2) h
Iceland 51 (1.0) h 36 (1.0) 26 (0.9) 26 (1.0) 12 (0.7) 16 (0.9) h 10 (0.7) 21 (0.9) h
Iran, Islamic Rep. of 23 (1.0) 21 (1.4) 42 (1.2) 42 (1.5) 20 (1.0) 23 (1.2) h 15 (1.9) 14 (1.1)
Israel 34 (1.4) h 26 (1.3) 29 (1.2) h 25 (1.2) 14 (0.8) 16 (1.1) 24 (1.4) 33 (1.7) h
Italy 19 (1.1) h 11 (0.7) 21 (1.1) h 15 (0.9) 17 (1.0) 16 (0.9) 42 (1.4) 58 (1.4) h
Kuwait r 34 (1.7) h 21 (1.9) 38 (1.1) h 33 (2.1) 18 (1.4) 24 (1.5) h 10 (1.0) 22 (2.4) h
Latvia 29 (1.9) h 18 (1.3) 29 (1.2) h 25 (1.3) 20 (1.3) 20 (1.1) 21 (1.3) 37 (1.5) h
Lithuania 35 (1.5) h 18 (1.4) 35 (1.4) h 27 (1.3) 17 (1.1) 23 (1.4) h 13 (1.0) 31 (1.7) h
Macedonia, Rep. of 52 (1.7) h 45 (1.6) 33 (1.3) 35 (1.5) 13 (1.2) 15 (1.5) 2 (0.4) 4 (0.5) h
Moldova, Rep. of 26 (1.8) h 20 (1.6) 44 (2.3) 43 (1.8) 21 (1.7) 24 (1.6) 9 (1.2) 12 (1.4) h
Morocco 18 (1.4) 18 (1.3) 36 (2.1) h 32 (1.7) 27 (1.5) 24 (1.6) 19 (2.4) 27 (2.9) h
Netherlands 61 (1.2) h 35 (1.4) 25 (1.1) 27 (1.2) 8 (0.7) 17 (1.0) h 6 (0.8) 21 (1.2) h
New Zealand 55 (1.8) h 38 (1.9) 31 (1.8) 30 (1.2) 9 (0.9) 17 (1.2) h 5 (0.6) 15 (1.4) h
Norway 27 (1.5) h 11 (1.0) 29 (1.1) h 21 (1.3) 19 (1.4) 20 (1.2) 26 (1.6) 48 (2.0) h
Romania 21 (1.5) 19 (1.4) 38 (1.9) 38 (1.6) 28 (1.8) 26 (1.3) 13 (1.3) 17 (1.7) h
Russian Federation 64 (1.8) h 47 (1.6) 26 (1.3) 33 (1.1) h 7 (0.9) 11 (0.8) h 3 (0.5) 8 (0.9) h
Scotland 49 (1.6) h 32 (1.7) 33 (1.4) 30 (1.4) 11 (0.9) 20 (1.3) h 8 (0.9) 18 (1.5) h
Singapore 61 (1.4) h 45 (1.2) 25 (1.1) 29 (1.0) h 9 (0.6) 13 (0.6) h 5 (0.5) 12 (0.8) h
Slovak Republic 19 (1.3) h 11 (1.0) 24 (1.4) h 18 (1.2) 24 (1.2) h 20 (1.1) 33 (1.7) 51 (1.6) h
Slovenia 33 (1.7) h 19 (1.3) 29 (1.4) 26 (1.3) 18 (1.3) 21 (1.3) h 21 (1.7) 34 (1.7) h
Sweden 43 (1.3) h 24 (1.0) 32 (1.0) 34 (1.0) 18 (0.9) 25 (0.7) h 6 (0.6) 16 (0.9) h
Turkey 39 (1.6) h 31 (1.4) 41 (1.3) 41 (1.2) 15 (1.1) 20 (1.1) h 5 (0.6) 8 (0.8) h
United States 40 (2.1) h 28 (1.5) 30 (1.6) 27 (1.3) 15 (1.0) 19 (0.9) h 16 (1.1) 26 (1.3) h
International Avg. 38 (0.3) h 26 (0.2) 32 (0.2) h 29 (0.2) 16 (0.2) 20 (0.2) h 14 (0.2) 25 (0.3) h
h Significantly greater percentage than other gender
Countries
Every Day orAlmost Every Day Once or Twice a Week Once or Twice a Month Never or Almost Never
Percentof Girls
Percentof Boys
Percentof Girls
Percentof Boys
Percentof Girls
Percentof Boys
Percentof Girls
Percentof Boys
( ) Standard errors appear in parentheses. Because results are rounded to the nearest wholenumber, some totals may appear inconsistent.
An “r” indicates data are available for 70-84% of the students. An “s” indicates data areavailable for 50-69% of the students. An “x” indicates data are available for less than 50% ofthe students.
SOU
RCE:
IEA
Pro
gres
s in
Inte
rnat
iona
l Rea
ding
Lite
racy
Stu
dy (P
IRLS
) 200
1.
ISC 4th GradePIRLS 2001
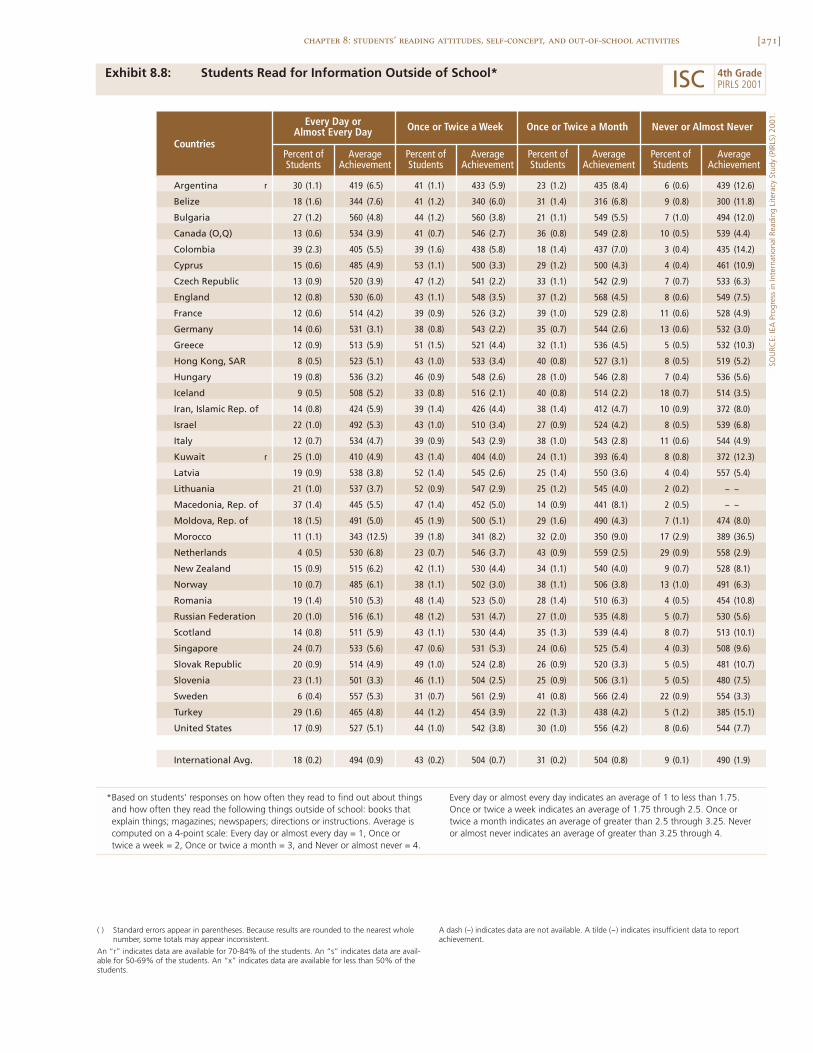
[271]chapter 8: students’ reading attitudes, self-concept, and out-of-school activities
Exhibit 8.8: Students Read for Information Outside of School*
SOU
RCE:
IEA
Pro
gres
s in
Inte
rnat
iona
l Rea
ding
Lite
racy
Stu
dy (P
IRLS
) 200
1.
Argentina r 30 (1.1) 419 (6.5) 41 (1.1) 433 (5.9) 23 (1.2) 435 (8.4) 6 (0.6) 439 (12.6)
Belize 18 (1.6) 344 (7.6) 41 (1.2) 340 (6.0) 31 (1.4) 316 (6.8) 9 (0.8) 300 (11.8)
Bulgaria 27 (1.2) 560 (4.8) 44 (1.2) 560 (3.8) 21 (1.1) 549 (5.5) 7 (1.0) 494 (12.0)
Canada (O,Q) 13 (0.6) 534 (3.9) 41 (0.7) 546 (2.7) 36 (0.8) 549 (2.8) 10 (0.5) 539 (4.4)
Colombia 39 (2.3) 405 (5.5) 39 (1.6) 438 (5.8) 18 (1.4) 437 (7.0) 3 (0.4) 435 (14.2)
Cyprus 15 (0.6) 485 (4.9) 53 (1.1) 500 (3.3) 29 (1.2) 500 (4.3) 4 (0.4) 461 (10.9)
Czech Republic 13 (0.9) 520 (3.9) 47 (1.2) 541 (2.2) 33 (1.1) 542 (2.9) 7 (0.7) 533 (6.3)
England 12 (0.8) 530 (6.0) 43 (1.1) 548 (3.5) 37 (1.2) 568 (4.5) 8 (0.6) 549 (7.5)
France 12 (0.6) 514 (4.2) 39 (0.9) 526 (3.2) 39 (1.0) 529 (2.8) 11 (0.6) 528 (4.9)
Germany 14 (0.6) 531 (3.1) 38 (0.8) 543 (2.2) 35 (0.7) 544 (2.6) 13 (0.6) 532 (3.0)
Greece 12 (0.9) 513 (5.9) 51 (1.5) 521 (4.4) 32 (1.1) 536 (4.5) 5 (0.5) 532 (10.3)
Hong Kong, SAR 8 (0.5) 523 (5.1) 43 (1.0) 533 (3.4) 40 (0.8) 527 (3.1) 8 (0.5) 519 (5.2)
Hungary 19 (0.8) 536 (3.2) 46 (0.9) 548 (2.6) 28 (1.0) 546 (2.8) 7 (0.4) 536 (5.6)
Iceland 9 (0.5) 508 (5.2) 33 (0.8) 516 (2.1) 40 (0.8) 514 (2.2) 18 (0.7) 514 (3.5)
Iran, Islamic Rep. of 14 (0.8) 424 (5.9) 39 (1.4) 426 (4.4) 38 (1.4) 412 (4.7) 10 (0.9) 372 (8.0)
Israel 22 (1.0) 492 (5.3) 43 (1.0) 510 (3.4) 27 (0.9) 524 (4.2) 8 (0.5) 539 (6.8)
Italy 12 (0.7) 534 (4.7) 39 (0.9) 543 (2.9) 38 (1.0) 543 (2.8) 11 (0.6) 544 (4.9)
Kuwait r 25 (1.0) 410 (4.9) 43 (1.4) 404 (4.0) 24 (1.1) 393 (6.4) 8 (0.8) 372 (12.3)
Latvia 19 (0.9) 538 (3.8) 52 (1.4) 545 (2.6) 25 (1.4) 550 (3.6) 4 (0.4) 557 (5.4)
Lithuania 21 (1.0) 537 (3.7) 52 (0.9) 547 (2.9) 25 (1.2) 545 (4.0) 2 (0.2) ~ ~
Macedonia, Rep. of 37 (1.4) 445 (5.5) 47 (1.4) 452 (5.0) 14 (0.9) 441 (8.1) 2 (0.5) ~ ~
Moldova, Rep. of 18 (1.5) 491 (5.0) 45 (1.9) 500 (5.1) 29 (1.6) 490 (4.3) 7 (1.1) 474 (8.0)
Morocco 11 (1.1) 343 (12.5) 39 (1.8) 341 (8.2) 32 (2.0) 350 (9.0) 17 (2.9) 389 (36.5)
Netherlands 4 (0.5) 530 (6.8) 23 (0.7) 546 (3.7) 43 (0.9) 559 (2.5) 29 (0.9) 558 (2.9)
New Zealand 15 (0.9) 515 (6.2) 42 (1.1) 530 (4.4) 34 (1.1) 540 (4.0) 9 (0.7) 528 (8.1)
Norway 10 (0.7) 485 (6.1) 38 (1.1) 502 (3.0) 38 (1.1) 506 (3.8) 13 (1.0) 491 (6.3)
Romania 19 (1.4) 510 (5.3) 48 (1.4) 523 (5.0) 28 (1.4) 510 (6.3) 4 (0.5) 454 (10.8)
Russian Federation 20 (1.0) 516 (6.1) 48 (1.2) 531 (4.7) 27 (1.0) 535 (4.8) 5 (0.7) 530 (5.6)
Scotland 14 (0.8) 511 (5.9) 43 (1.1) 530 (4.4) 35 (1.3) 539 (4.4) 8 (0.7) 513 (10.1)
Singapore 24 (0.7) 533 (5.6) 47 (0.6) 531 (5.3) 24 (0.6) 525 (5.4) 4 (0.3) 508 (9.6)
Slovak Republic 20 (0.9) 514 (4.9) 49 (1.0) 524 (2.8) 26 (0.9) 520 (3.3) 5 (0.5) 481 (10.7)
Slovenia 23 (1.1) 501 (3.3) 46 (1.1) 504 (2.5) 25 (0.9) 506 (3.1) 5 (0.5) 480 (7.5)
Sweden 6 (0.4) 557 (5.3) 31 (0.7) 561 (2.9) 41 (0.8) 566 (2.4) 22 (0.9) 554 (3.3)
Turkey 29 (1.6) 465 (4.8) 44 (1.2) 454 (3.9) 22 (1.3) 438 (4.2) 5 (1.2) 385 (15.1)
United States 17 (0.9) 527 (5.1) 44 (1.0) 542 (3.8) 30 (1.0) 556 (4.2) 8 (0.6) 544 (7.7)
International Avg. 18 (0.2) 494 (0.9) 43 (0.2) 504 (0.7) 31 (0.2) 504 (0.8) 9 (0.1) 490 (1.9)
Countries
Every Day orAlmost Every Day Once or Twice a Week Once or Twice a Month Never or Almost Never
Percent ofStudents
AverageAchievement
Percent ofStudents
AverageAchievement
Percent ofStudents
AverageAchievement
Percent ofStudents
AverageAchievement
( ) Standard errors appear in parentheses. Because results are rounded to the nearest wholenumber, some totals may appear inconsistent.
An “r” indicates data are available for 70-84% of the students. An “s” indicates data are avail-able for 50-69% of the students. An “x” indicates data are available for less than 50% of thestudents.
A dash (–) indicates data are not available. A tilde (~) indicates insufficient data to reportachievement.
ISC 4th GradePIRLS 2001
*Based on students’ responses on how often they read to find out about thingsand how often they read the following things outside of school: books thatexplain things; magazines; newspapers; directions or instructions. Average iscomputed on a 4-point scale: Every day or almost every day = 1, Once ortwice a week = 2, Once or twice a month = 3, and Never or almost never = 4.
Every day or almost every day indicates an average of 1 to less than 1.75.Once or twice a week indicates an average of 1.75 through 2.5. Once ortwice a month indicates an average of greater than 2.5 through 3.25. Neveror almost never indicates an average of greater than 3.25 through 4.
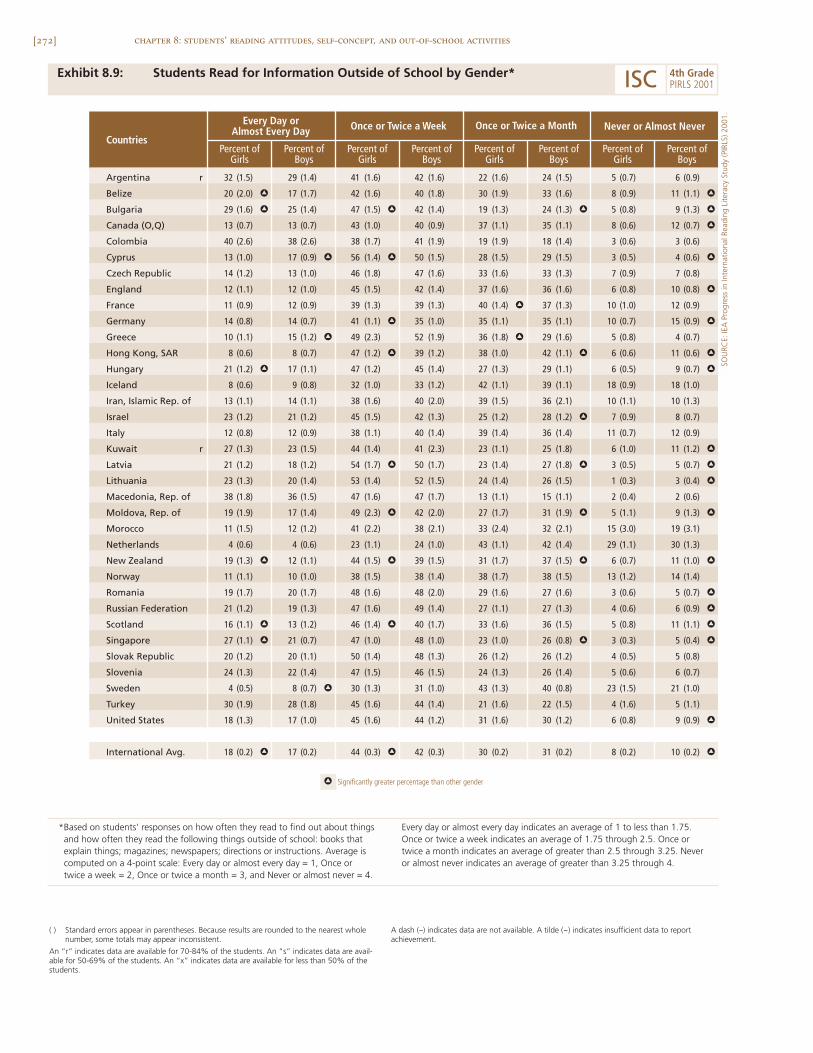
[272] chapter 8: students’ reading attitudes, self-concept, and out-of-school activities
Exhibit 8.9: Students Read for Information Outside of School by Gender*
Argentina r 32 (1.5) 29 (1.4) 41 (1.6) 42 (1.6) 22 (1.6) 24 (1.5) 5 (0.7) 6 (0.9)
Belize 20 (2.0) h 17 (1.7) 42 (1.6) 40 (1.8) 30 (1.9) 33 (1.6) 8 (0.9) 11 (1.1) h
Bulgaria 29 (1.6) h 25 (1.4) 47 (1.5) h 42 (1.4) 19 (1.3) 24 (1.3) h 5 (0.8) 9 (1.3) h
Canada (O,Q) 13 (0.7) 13 (0.7) 43 (1.0) 40 (0.9) 37 (1.1) 35 (1.1) 8 (0.6) 12 (0.7) h
Colombia 40 (2.6) 38 (2.6) 38 (1.7) 41 (1.9) 19 (1.9) 18 (1.4) 3 (0.6) 3 (0.6)
Cyprus 13 (1.0) 17 (0.9) h 56 (1.4) h 50 (1.5) 28 (1.5) 29 (1.5) 3 (0.5) 4 (0.6) h
Czech Republic 14 (1.2) 13 (1.0) 46 (1.8) 47 (1.6) 33 (1.6) 33 (1.3) 7 (0.9) 7 (0.8)
England 12 (1.1) 12 (1.0) 45 (1.5) 42 (1.4) 37 (1.6) 36 (1.6) 6 (0.8) 10 (0.8) h
France 11 (0.9) 12 (0.9) 39 (1.3) 39 (1.3) 40 (1.4) h 37 (1.3) 10 (1.0) 12 (0.9)
Germany 14 (0.8) 14 (0.7) 41 (1.1) h 35 (1.0) 35 (1.1) 35 (1.1) 10 (0.7) 15 (0.9) h
Greece 10 (1.1) 15 (1.2) h 49 (2.3) 52 (1.9) 36 (1.8) h 29 (1.6) 5 (0.8) 4 (0.7)
Hong Kong, SAR 8 (0.6) 8 (0.7) 47 (1.2) h 39 (1.2) 38 (1.0) 42 (1.1) h 6 (0.6) 11 (0.6) h
Hungary 21 (1.2) h 17 (1.1) 47 (1.2) 45 (1.4) 27 (1.3) 29 (1.1) 6 (0.5) 9 (0.7) h
Iceland 8 (0.6) 9 (0.8) 32 (1.0) 33 (1.2) 42 (1.1) 39 (1.1) 18 (0.9) 18 (1.0)
Iran, Islamic Rep. of 13 (1.1) 14 (1.1) 38 (1.6) 40 (2.0) 39 (1.5) 36 (2.1) 10 (1.1) 10 (1.3)
Israel 23 (1.2) 21 (1.2) 45 (1.5) 42 (1.3) 25 (1.2) 28 (1.2) h 7 (0.9) 8 (0.7)
Italy 12 (0.8) 12 (0.9) 38 (1.1) 40 (1.4) 39 (1.4) 36 (1.4) 11 (0.7) 12 (0.9)
Kuwait r 27 (1.3) 23 (1.5) 44 (1.4) 41 (2.3) 23 (1.1) 25 (1.8) 6 (1.0) 11 (1.2) h
Latvia 21 (1.2) 18 (1.2) 54 (1.7) h 50 (1.7) 23 (1.4) 27 (1.8) h 3 (0.5) 5 (0.7) h
Lithuania 23 (1.3) 20 (1.4) 53 (1.4) 52 (1.5) 24 (1.4) 26 (1.5) 1 (0.3) 3 (0.4) h
Macedonia, Rep. of 38 (1.8) 36 (1.5) 47 (1.6) 47 (1.7) 13 (1.1) 15 (1.1) 2 (0.4) 2 (0.6)
Moldova, Rep. of 19 (1.9) 17 (1.4) 49 (2.3) h 42 (2.0) 27 (1.7) 31 (1.9) h 5 (1.1) 9 (1.3) h
Morocco 11 (1.5) 12 (1.2) 41 (2.2) 38 (2.1) 33 (2.4) 32 (2.1) 15 (3.0) 19 (3.1)
Netherlands 4 (0.6) 4 (0.6) 23 (1.1) 24 (1.0) 43 (1.1) 42 (1.4) 29 (1.1) 30 (1.3)
New Zealand 19 (1.3) h 12 (1.1) 44 (1.5) h 39 (1.5) 31 (1.7) 37 (1.5) h 6 (0.7) 11 (1.0) h
Norway 11 (1.1) 10 (1.0) 38 (1.5) 38 (1.4) 38 (1.7) 38 (1.5) 13 (1.2) 14 (1.4)
Romania 19 (1.7) 20 (1.7) 48 (1.6) 48 (2.0) 29 (1.6) 27 (1.6) 3 (0.6) 5 (0.7) h
Russian Federation 21 (1.2) 19 (1.3) 47 (1.6) 49 (1.4) 27 (1.1) 27 (1.3) 4 (0.6) 6 (0.9) h
Scotland 16 (1.1) h 13 (1.2) 46 (1.4) h 40 (1.7) 33 (1.6) 36 (1.5) 5 (0.8) 11 (1.1) h
Singapore 27 (1.1) h 21 (0.7) 47 (1.0) 48 (1.0) 23 (1.0) 26 (0.8) h 3 (0.3) 5 (0.4) h
Slovak Republic 20 (1.2) 20 (1.1) 50 (1.4) 48 (1.3) 26 (1.2) 26 (1.2) 4 (0.5) 5 (0.8)
Slovenia 24 (1.3) 22 (1.4) 47 (1.5) 46 (1.5) 24 (1.3) 26 (1.4) 5 (0.6) 6 (0.7)
Sweden 4 (0.5) 8 (0.7) h 30 (1.3) 31 (1.0) 43 (1.3) 40 (0.8) 23 (1.5) 21 (1.0)
Turkey 30 (1.9) 28 (1.8) 45 (1.6) 44 (1.4) 21 (1.6) 22 (1.5) 4 (1.6) 5 (1.1)
United States 18 (1.3) 17 (1.0) 45 (1.6) 44 (1.2) 31 (1.6) 30 (1.2) 6 (0.8) 9 (0.9) h
International Avg. 18 (0.2) h 17 (0.2) 44 (0.3) h 42 (0.3) 30 (0.2) 31 (0.2) 8 (0.2) 10 (0.2) h
h Significantly greater percentage than other gender
Countries
Every Day orAlmost Every Day Once or Twice a Week Once or Twice a Month Never or Almost Never
Percent ofGirls
Percent ofBoys
Percent ofGirls
Percent ofBoys
Percent ofGirls
Percent ofBoys
Percent ofGirls
Percent ofBoys
( ) Standard errors appear in parentheses. Because results are rounded to the nearest wholenumber, some totals may appear inconsistent.
An “r” indicates data are available for 70-84% of the students. An “s” indicates data are avail-able for 50-69% of the students. An “x” indicates data are available for less than 50% of thestudents.
A dash (–) indicates data are not available. A tilde (~) indicates insufficient data to reportachievement.
SOU
RCE:
IEA
Pro
gres
s in
Inte
rnat
iona
l Rea
ding
Lite
racy
Stu
dy (P
IRLS
) 200
1.
ISC 4th GradePIRLS 2001
*Based on students’ responses on how often they read to find out about thingsand how often they read the following things outside of school: books thatexplain things; magazines; newspapers; directions or instructions. Average iscomputed on a 4-point scale: Every day or almost every day = 1, Once ortwice a week = 2, Once or twice a month = 3, and Never or almost never = 4.
Every day or almost every day indicates an average of 1 to less than 1.75.Once or twice a week indicates an average of 1.75 through 2.5. Once ortwice a month indicates an average of greater than 2.5 through 3.25. Neveror almost never indicates an average of greater than 3.25 through 4.
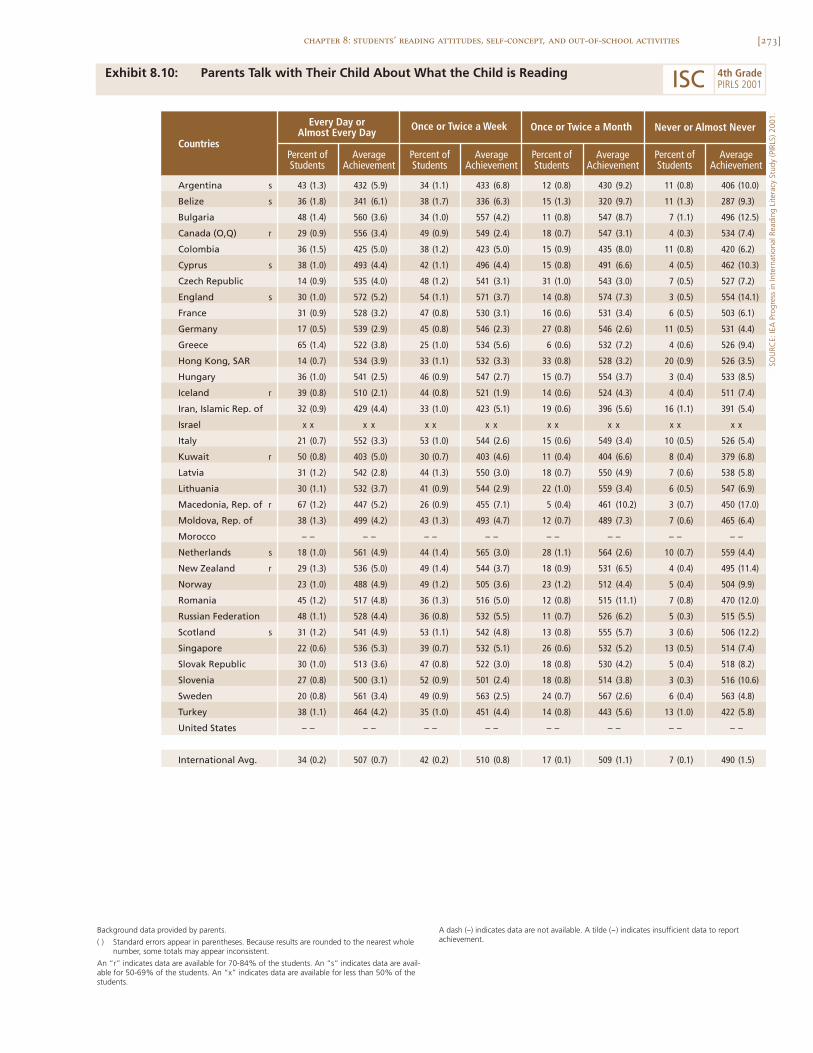
[273]chapter 8: students’ reading attitudes, self-concept, and out-of-school activities
Exhibit 8.10: Parents Talk with Their Child About What the Child is Reading
SOU
RCE:
IEA
Pro
gres
s in
Inte
rnat
iona
l Rea
ding
Lite
racy
Stu
dy (P
IRLS
) 200
1.
Argentina s 43 (1.3) 432 (5.9) 34 (1.1) 433 (6.8) 12 (0.8) 430 (9.2) 11 (0.8) 406 (10.0)
Belize s 36 (1.8) 341 (6.1) 38 (1.7) 336 (6.3) 15 (1.3) 320 (9.7) 11 (1.3) 287 (9.3)
Bulgaria 48 (1.4) 560 (3.6) 34 (1.0) 557 (4.2) 11 (0.8) 547 (8.7) 7 (1.1) 496 (12.5)
Canada (O,Q) r 29 (0.9) 556 (3.4) 49 (0.9) 549 (2.4) 18 (0.7) 547 (3.1) 4 (0.3) 534 (7.4)
Colombia 36 (1.5) 425 (5.0) 38 (1.2) 423 (5.0) 15 (0.9) 435 (8.0) 11 (0.8) 420 (6.2)
Cyprus s 38 (1.0) 493 (4.4) 42 (1.1) 496 (4.4) 15 (0.8) 491 (6.6) 4 (0.5) 462 (10.3)
Czech Republic 14 (0.9) 535 (4.0) 48 (1.2) 541 (3.1) 31 (1.0) 543 (3.0) 7 (0.5) 527 (7.2)
England s 30 (1.0) 572 (5.2) 54 (1.1) 571 (3.7) 14 (0.8) 574 (7.3) 3 (0.5) 554 (14.1)
France 31 (0.9) 528 (3.2) 47 (0.8) 530 (3.1) 16 (0.6) 531 (3.4) 6 (0.5) 503 (6.1)
Germany 17 (0.5) 539 (2.9) 45 (0.8) 546 (2.3) 27 (0.8) 546 (2.6) 11 (0.5) 531 (4.4)
Greece 65 (1.4) 522 (3.8) 25 (1.0) 534 (5.6) 6 (0.6) 532 (7.2) 4 (0.6) 526 (9.4)
Hong Kong, SAR 14 (0.7) 534 (3.9) 33 (1.1) 532 (3.3) 33 (0.8) 528 (3.2) 20 (0.9) 526 (3.5)
Hungary 36 (1.0) 541 (2.5) 46 (0.9) 547 (2.7) 15 (0.7) 554 (3.7) 3 (0.4) 533 (8.5)
Iceland r 39 (0.8) 510 (2.1) 44 (0.8) 521 (1.9) 14 (0.6) 524 (4.3) 4 (0.4) 511 (7.4)
Iran, Islamic Rep. of 32 (0.9) 429 (4.4) 33 (1.0) 423 (5.1) 19 (0.6) 396 (5.6) 16 (1.1) 391 (5.4)
Israel x x x x x x x x x x x x x x x x
Italy 21 (0.7) 552 (3.3) 53 (1.0) 544 (2.6) 15 (0.6) 549 (3.4) 10 (0.5) 526 (5.4)
Kuwait r 50 (0.8) 403 (5.0) 30 (0.7) 403 (4.6) 11 (0.4) 404 (6.6) 8 (0.4) 379 (6.8)
Latvia 31 (1.2) 542 (2.8) 44 (1.3) 550 (3.0) 18 (0.7) 550 (4.9) 7 (0.6) 538 (5.8)
Lithuania 30 (1.1) 532 (3.7) 41 (0.9) 544 (2.9) 22 (1.0) 559 (3.4) 6 (0.5) 547 (6.9)
Macedonia, Rep. of r 67 (1.2) 447 (5.2) 26 (0.9) 455 (7.1) 5 (0.4) 461 (10.2) 3 (0.7) 450 (17.0)
Moldova, Rep. of 38 (1.3) 499 (4.2) 43 (1.3) 493 (4.7) 12 (0.7) 489 (7.3) 7 (0.6) 465 (6.4)
Morocco – – – – – – – – – – – – – – – –
Netherlands s 18 (1.0) 561 (4.9) 44 (1.4) 565 (3.0) 28 (1.1) 564 (2.6) 10 (0.7) 559 (4.4)
New Zealand r 29 (1.3) 536 (5.0) 49 (1.4) 544 (3.7) 18 (0.9) 531 (6.5) 4 (0.4) 495 (11.4)
Norway 23 (1.0) 488 (4.9) 49 (1.2) 505 (3.6) 23 (1.2) 512 (4.4) 5 (0.4) 504 (9.9)
Romania 45 (1.2) 517 (4.8) 36 (1.3) 516 (5.0) 12 (0.8) 515 (11.1) 7 (0.8) 470 (12.0)
Russian Federation 48 (1.1) 528 (4.4) 36 (0.8) 532 (5.5) 11 (0.7) 526 (6.2) 5 (0.3) 515 (5.5)
Scotland s 31 (1.2) 541 (4.9) 53 (1.1) 542 (4.8) 13 (0.8) 555 (5.7) 3 (0.6) 506 (12.2)
Singapore 22 (0.6) 536 (5.3) 39 (0.7) 532 (5.1) 26 (0.6) 532 (5.2) 13 (0.5) 514 (7.4)
Slovak Republic 30 (1.0) 513 (3.6) 47 (0.8) 522 (3.0) 18 (0.8) 530 (4.2) 5 (0.4) 518 (8.2)
Slovenia 27 (0.8) 500 (3.1) 52 (0.9) 501 (2.4) 18 (0.8) 514 (3.8) 3 (0.3) 516 (10.6)
Sweden 20 (0.8) 561 (3.4) 49 (0.9) 563 (2.5) 24 (0.7) 567 (2.6) 6 (0.4) 563 (4.8)
Turkey 38 (1.1) 464 (4.2) 35 (1.0) 451 (4.4) 14 (0.8) 443 (5.6) 13 (1.0) 422 (5.8)
United States – – – – – – – – – – – – – – – –
International Avg. 34 (0.2) 507 (0.7) 42 (0.2) 510 (0.8) 17 (0.1) 509 (1.1) 7 (0.1) 490 (1.5)
Countries
Every Day orAlmost Every Day Once or Twice a Week Once or Twice a Month Never or Almost Never
Percent ofStudents
AverageAchievement
Percent ofStudents
AverageAchievement
Percent ofStudents
AverageAchievement
Percent ofStudents
AverageAchievement
Background data provided by parents.
( ) Standard errors appear in parentheses. Because results are rounded to the nearest wholenumber, some totals may appear inconsistent.
An “r” indicates data are available for 70-84% of the students. An “s” indicates data are avail-able for 50-69% of the students. An “x” indicates data are available for less than 50% of thestudents.
A dash (–) indicates data are not available. A tilde (~) indicates insufficient data to reportachievement.
ISC 4th GradePIRLS 2001
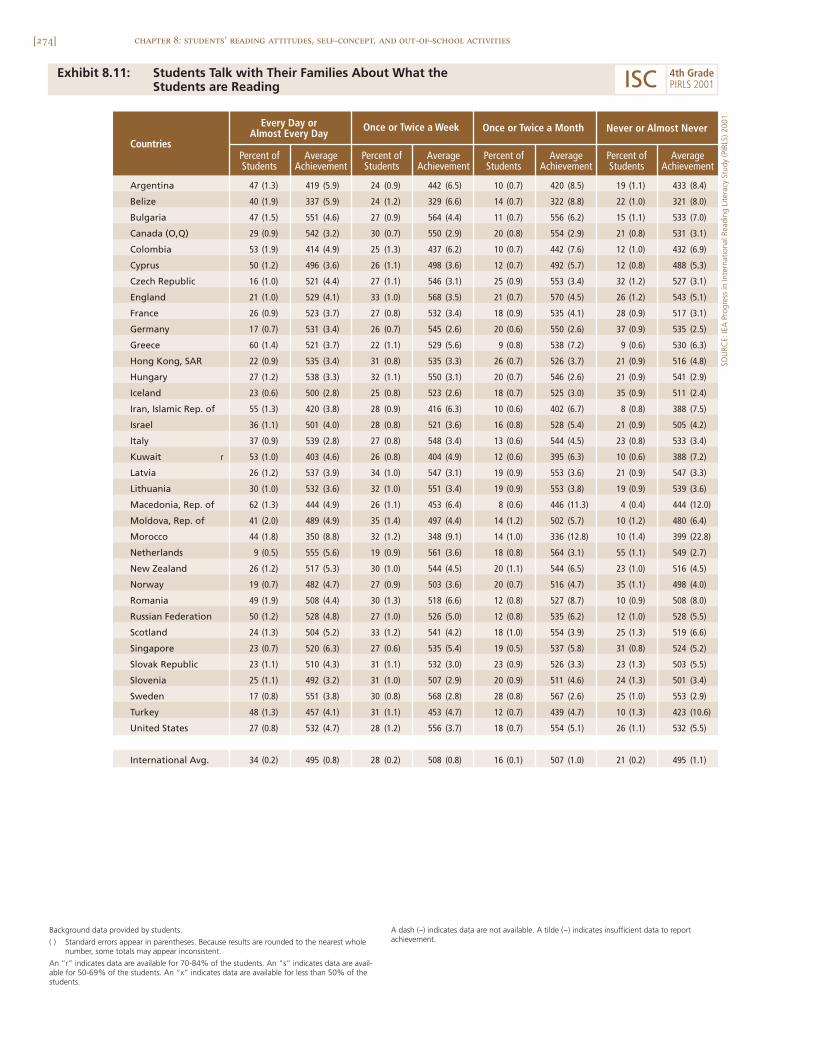
[274] chapter 8: students’ reading attitudes, self-concept, and out-of-school activities
Exhibit 8.11: Students Talk with Their Families About What the Students are Reading
Argentina 47 (1.3) 419 (5.9) 24 (0.9) 442 (6.5) 10 (0.7) 420 (8.5) 19 (1.1) 433 (8.4)
Belize 40 (1.9) 337 (5.9) 24 (1.2) 329 (6.6) 14 (0.7) 322 (8.8) 22 (1.0) 321 (8.0)
Bulgaria 47 (1.5) 551 (4.6) 27 (0.9) 564 (4.4) 11 (0.7) 556 (6.2) 15 (1.1) 533 (7.0)
Canada (O,Q) 29 (0.9) 542 (3.2) 30 (0.7) 550 (2.9) 20 (0.8) 554 (2.9) 21 (0.8) 531 (3.1)
Colombia 53 (1.9) 414 (4.9) 25 (1.3) 437 (6.2) 10 (0.7) 442 (7.6) 12 (1.0) 432 (6.9)
Cyprus 50 (1.2) 496 (3.6) 26 (1.1) 498 (3.6) 12 (0.7) 492 (5.7) 12 (0.8) 488 (5.3)
Czech Republic 16 (1.0) 521 (4.4) 27 (1.1) 546 (3.1) 25 (0.9) 553 (3.4) 32 (1.2) 527 (3.1)
England 21 (1.0) 529 (4.1) 33 (1.0) 568 (3.5) 21 (0.7) 570 (4.5) 26 (1.2) 543 (5.1)
France 26 (0.9) 523 (3.7) 27 (0.8) 532 (3.4) 18 (0.9) 535 (4.1) 28 (0.9) 517 (3.1)
Germany 17 (0.7) 531 (3.4) 26 (0.7) 545 (2.6) 20 (0.6) 550 (2.6) 37 (0.9) 535 (2.5)
Greece 60 (1.4) 521 (3.7) 22 (1.1) 529 (5.6) 9 (0.8) 538 (7.2) 9 (0.6) 530 (6.3)
Hong Kong, SAR 22 (0.9) 535 (3.4) 31 (0.8) 535 (3.3) 26 (0.7) 526 (3.7) 21 (0.9) 516 (4.8)
Hungary 27 (1.2) 538 (3.3) 32 (1.1) 550 (3.1) 20 (0.7) 546 (2.6) 21 (0.9) 541 (2.9)
Iceland 23 (0.6) 500 (2.8) 25 (0.8) 523 (2.6) 18 (0.7) 525 (3.0) 35 (0.9) 511 (2.4)
Iran, Islamic Rep. of 55 (1.3) 420 (3.8) 28 (0.9) 416 (6.3) 10 (0.6) 402 (6.7) 8 (0.8) 388 (7.5)
Israel 36 (1.1) 501 (4.0) 28 (0.8) 521 (3.6) 16 (0.8) 528 (5.4) 21 (0.9) 505 (4.2)
Italy 37 (0.9) 539 (2.8) 27 (0.8) 548 (3.4) 13 (0.6) 544 (4.5) 23 (0.8) 533 (3.4)
Kuwait r 53 (1.0) 403 (4.6) 26 (0.8) 404 (4.9) 12 (0.6) 395 (6.3) 10 (0.6) 388 (7.2)
Latvia 26 (1.2) 537 (3.9) 34 (1.0) 547 (3.1) 19 (0.9) 553 (3.6) 21 (0.9) 547 (3.3)
Lithuania 30 (1.0) 532 (3.6) 32 (1.0) 551 (3.4) 19 (0.9) 553 (3.8) 19 (0.9) 539 (3.6)
Macedonia, Rep. of 62 (1.3) 444 (4.9) 26 (1.1) 453 (6.4) 8 (0.6) 446 (11.3) 4 (0.4) 444 (12.0)
Moldova, Rep. of 41 (2.0) 489 (4.9) 35 (1.4) 497 (4.4) 14 (1.2) 502 (5.7) 10 (1.2) 480 (6.4)
Morocco 44 (1.8) 350 (8.8) 32 (1.2) 348 (9.1) 14 (1.0) 336 (12.8) 10 (1.4) 399 (22.8)
Netherlands 9 (0.5) 555 (5.6) 19 (0.9) 561 (3.6) 18 (0.8) 564 (3.1) 55 (1.1) 549 (2.7)
New Zealand 26 (1.2) 517 (5.3) 30 (1.0) 544 (4.5) 20 (1.1) 544 (6.5) 23 (1.0) 516 (4.5)
Norway 19 (0.7) 482 (4.7) 27 (0.9) 503 (3.6) 20 (0.7) 516 (4.7) 35 (1.1) 498 (4.0)
Romania 49 (1.9) 508 (4.4) 30 (1.3) 518 (6.6) 12 (0.8) 527 (8.7) 10 (0.9) 508 (8.0)
Russian Federation 50 (1.2) 528 (4.8) 27 (1.0) 526 (5.0) 12 (0.8) 535 (6.2) 12 (1.0) 528 (5.5)
Scotland 24 (1.3) 504 (5.2) 33 (1.2) 541 (4.2) 18 (1.0) 554 (3.9) 25 (1.3) 519 (6.6)
Singapore 23 (0.7) 520 (6.3) 27 (0.6) 535 (5.4) 19 (0.5) 537 (5.8) 31 (0.8) 524 (5.2)
Slovak Republic 23 (1.1) 510 (4.3) 31 (1.1) 532 (3.0) 23 (0.9) 526 (3.3) 23 (1.3) 503 (5.5)
Slovenia 25 (1.1) 492 (3.2) 31 (1.0) 507 (2.9) 20 (0.9) 511 (4.6) 24 (1.3) 501 (3.4)
Sweden 17 (0.8) 551 (3.8) 30 (0.8) 568 (2.8) 28 (0.8) 567 (2.6) 25 (1.0) 553 (2.9)
Turkey 48 (1.3) 457 (4.1) 31 (1.1) 453 (4.7) 12 (0.7) 439 (4.7) 10 (1.3) 423 (10.6)
United States 27 (0.8) 532 (4.7) 28 (1.2) 556 (3.7) 18 (0.7) 554 (5.1) 26 (1.1) 532 (5.5)
International Avg. 34 (0.2) 495 (0.8) 28 (0.2) 508 (0.8) 16 (0.1) 507 (1.0) 21 (0.2) 495 (1.1)
Countries
Every Day orAlmost Every Day Once or Twice a Week Once or Twice a Month Never or Almost Never
Percent ofStudents
AverageAchievement
Percent ofStudents
AverageAchievement
Percent ofStudents
AverageAchievement
Percent ofStudents
AverageAchievement
Background data provided by students.
( ) Standard errors appear in parentheses. Because results are rounded to the nearest wholenumber, some totals may appear inconsistent.
An “r” indicates data are available for 70-84% of the students. An “s” indicates data are avail-able for 50-69% of the students. An “x” indicates data are available for less than 50% of thestudents.
A dash (–) indicates data are not available. A tilde (~) indicates insufficient data to reportachievement.
SOU
RCE:
IEA
Pro
gres
s in
Inte
rnat
iona
l Rea
ding
Lite
racy
Stu
dy (P
IRLS
) 200
1.
ISC 4th GradePIRLS 2001
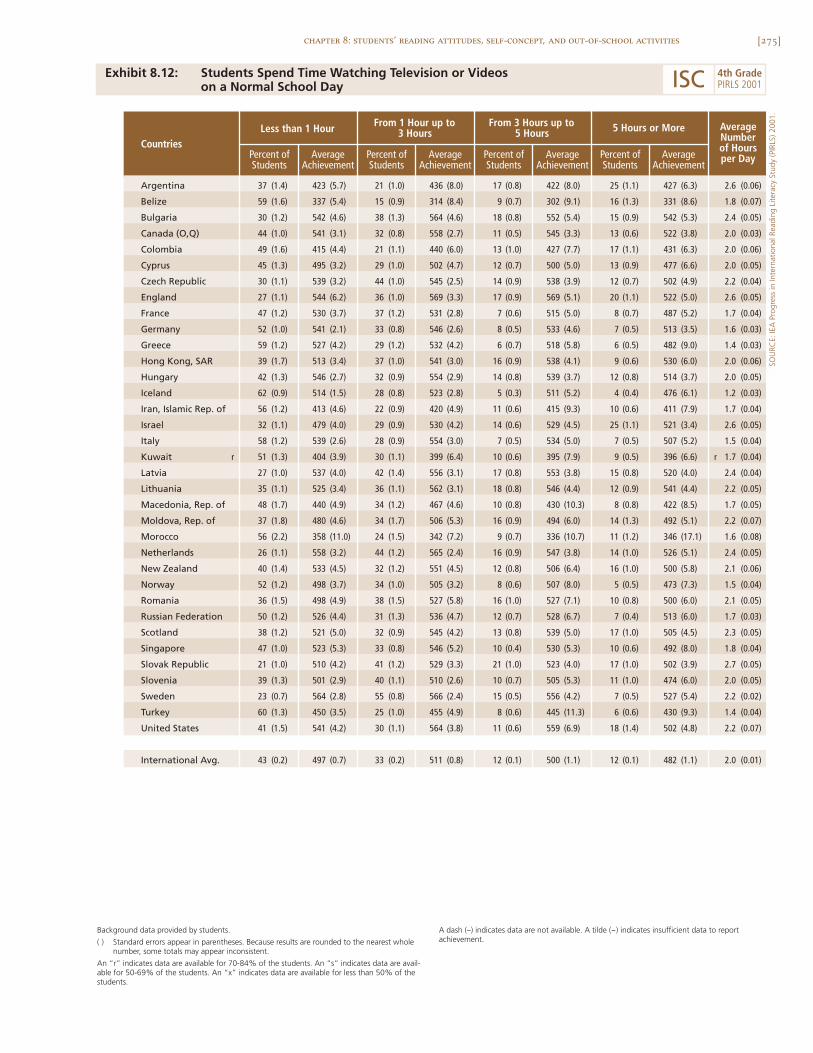
[275]chapter 8: students’ reading attitudes, self-concept, and out-of-school activities
Exhibit 8.12: Students Spend Time Watching Television or Videos on a Normal School Day
SOU
RCE:
IEA
Pro
gres
s in
Inte
rnat
iona
l Rea
ding
Lite
racy
Stu
dy (P
IRLS
) 200
1.
Argentina 37 (1.4) 423 (5.7) 21 (1.0) 436 (8.0) 17 (0.8) 422 (8.0) 25 (1.1) 427 (6.3) 2.6 (0.06)
Belize 59 (1.6) 337 (5.4) 15 (0.9) 314 (8.4) 9 (0.7) 302 (9.1) 16 (1.3) 331 (8.6) 1.8 (0.07)
Bulgaria 30 (1.2) 542 (4.6) 38 (1.3) 564 (4.6) 18 (0.8) 552 (5.4) 15 (0.9) 542 (5.3) 2.4 (0.05)
Canada (O,Q) 44 (1.0) 541 (3.1) 32 (0.8) 558 (2.7) 11 (0.5) 545 (3.3) 13 (0.6) 522 (3.8) 2.0 (0.03)
Colombia 49 (1.6) 415 (4.4) 21 (1.1) 440 (6.0) 13 (1.0) 427 (7.7) 17 (1.1) 431 (6.3) 2.0 (0.06)
Cyprus 45 (1.3) 495 (3.2) 29 (1.0) 502 (4.7) 12 (0.7) 500 (5.0) 13 (0.9) 477 (6.6) 2.0 (0.05)
Czech Republic 30 (1.1) 539 (3.2) 44 (1.0) 545 (2.5) 14 (0.9) 538 (3.9) 12 (0.7) 502 (4.9) 2.2 (0.04)
England 27 (1.1) 544 (6.2) 36 (1.0) 569 (3.3) 17 (0.9) 569 (5.1) 20 (1.1) 522 (5.0) 2.6 (0.05)
France 47 (1.2) 530 (3.7) 37 (1.2) 531 (2.8) 7 (0.6) 515 (5.0) 8 (0.7) 487 (5.2) 1.7 (0.04)
Germany 52 (1.0) 541 (2.1) 33 (0.8) 546 (2.6) 8 (0.5) 533 (4.6) 7 (0.5) 513 (3.5) 1.6 (0.03)
Greece 59 (1.2) 527 (4.2) 29 (1.2) 532 (4.2) 6 (0.7) 518 (5.8) 6 (0.5) 482 (9.0) 1.4 (0.03)
Hong Kong, SAR 39 (1.7) 513 (3.4) 37 (1.0) 541 (3.0) 16 (0.9) 538 (4.1) 9 (0.6) 530 (6.0) 2.0 (0.06)
Hungary 42 (1.3) 546 (2.7) 32 (0.9) 554 (2.9) 14 (0.8) 539 (3.7) 12 (0.8) 514 (3.7) 2.0 (0.05)
Iceland 62 (0.9) 514 (1.5) 28 (0.8) 523 (2.8) 5 (0.3) 511 (5.2) 4 (0.4) 476 (6.1) 1.2 (0.03)
Iran, Islamic Rep. of 56 (1.2) 413 (4.6) 22 (0.9) 420 (4.9) 11 (0.6) 415 (9.3) 10 (0.6) 411 (7.9) 1.7 (0.04)
Israel 32 (1.1) 479 (4.0) 29 (0.9) 530 (4.2) 14 (0.6) 529 (4.5) 25 (1.1) 521 (3.4) 2.6 (0.05)
Italy 58 (1.2) 539 (2.6) 28 (0.9) 554 (3.0) 7 (0.5) 534 (5.0) 7 (0.5) 507 (5.2) 1.5 (0.04)
Kuwait r 51 (1.3) 404 (3.9) 30 (1.1) 399 (6.4) 10 (0.6) 395 (7.9) 9 (0.5) 396 (6.6) r 1.7 (0.04)
Latvia 27 (1.0) 537 (4.0) 42 (1.4) 556 (3.1) 17 (0.8) 553 (3.8) 15 (0.8) 520 (4.0) 2.4 (0.04)
Lithuania 35 (1.1) 525 (3.4) 36 (1.1) 562 (3.1) 18 (0.8) 546 (4.4) 12 (0.9) 541 (4.4) 2.2 (0.05)
Macedonia, Rep. of 48 (1.7) 440 (4.9) 34 (1.2) 467 (4.6) 10 (0.8) 430 (10.3) 8 (0.8) 422 (8.5) 1.7 (0.05)
Moldova, Rep. of 37 (1.8) 480 (4.6) 34 (1.7) 506 (5.3) 16 (0.9) 494 (6.0) 14 (1.3) 492 (5.1) 2.2 (0.07)
Morocco 56 (2.2) 358 (11.0) 24 (1.5) 342 (7.2) 9 (0.7) 336 (10.7) 11 (1.2) 346 (17.1) 1.6 (0.08)
Netherlands 26 (1.1) 558 (3.2) 44 (1.2) 565 (2.4) 16 (0.9) 547 (3.8) 14 (1.0) 526 (5.1) 2.4 (0.05)
New Zealand 40 (1.4) 533 (4.5) 32 (1.2) 551 (4.5) 12 (0.8) 506 (6.4) 16 (1.0) 500 (5.8) 2.1 (0.06)
Norway 52 (1.2) 498 (3.7) 34 (1.0) 505 (3.2) 8 (0.6) 507 (8.0) 5 (0.5) 473 (7.3) 1.5 (0.04)
Romania 36 (1.5) 498 (4.9) 38 (1.5) 527 (5.8) 16 (1.0) 527 (7.1) 10 (0.8) 500 (6.0) 2.1 (0.05)
Russian Federation 50 (1.2) 526 (4.4) 31 (1.3) 536 (4.7) 12 (0.7) 528 (6.7) 7 (0.4) 513 (6.0) 1.7 (0.03)
Scotland 38 (1.2) 521 (5.0) 32 (0.9) 545 (4.2) 13 (0.8) 539 (5.0) 17 (1.0) 505 (4.5) 2.3 (0.05)
Singapore 47 (1.0) 523 (5.3) 33 (0.8) 546 (5.2) 10 (0.4) 530 (5.3) 10 (0.6) 492 (8.0) 1.8 (0.04)
Slovak Republic 21 (1.0) 510 (4.2) 41 (1.2) 529 (3.3) 21 (1.0) 523 (4.0) 17 (1.0) 502 (3.9) 2.7 (0.05)
Slovenia 39 (1.3) 501 (2.9) 40 (1.1) 510 (2.6) 10 (0.7) 505 (5.3) 11 (1.0) 474 (6.0) 2.0 (0.05)
Sweden 23 (0.7) 564 (2.8) 55 (0.8) 566 (2.4) 15 (0.5) 556 (4.2) 7 (0.5) 527 (5.4) 2.2 (0.02)
Turkey 60 (1.3) 450 (3.5) 25 (1.0) 455 (4.9) 8 (0.6) 445 (11.3) 6 (0.6) 430 (9.3) 1.4 (0.04)
United States 41 (1.5) 541 (4.2) 30 (1.1) 564 (3.8) 11 (0.6) 559 (6.9) 18 (1.4) 502 (4.8) 2.2 (0.07)
International Avg. 43 (0.2) 497 (0.7) 33 (0.2) 511 (0.8) 12 (0.1) 500 (1.1) 12 (0.1) 482 (1.1) 2.0 (0.01)
AverageNumberof Hoursper Day
Countries
From 1 Hour up to3 HoursLess than 1 Hour 5 Hours or MoreFrom 3 Hours up to
5 Hours
Percent ofStudents
AverageAchievement
Percent ofStudents
AverageAchievement
Percent ofStudents
AverageAchievement
Percent ofStudents
AverageAchievement
Background data provided by students.
( ) Standard errors appear in parentheses. Because results are rounded to the nearest wholenumber, some totals may appear inconsistent.
An “r” indicates data are available for 70-84% of the students. An “s” indicates data are avail-able for 50-69% of the students. An “x” indicates data are available for less than 50% of thestudents.
A dash (–) indicates data are not available. A tilde (~) indicates insufficient data to reportachievement.
ISC 4th GradePIRLS 2001

A
1 Thorndike, R.L. (1973). Reading comprehension in fifteen countries: An empirical study. International studies in evaluation: Vol. 3. Stockholm:Almqvist & Wiksell.
2 Elley, W.B. (Ed.). (1994). The IEA study of reading literacy: Achievement and instruction in thirty-two school systems. Oxford, England: ElsevierScience Ltd. [277]
Appendix AOverview of PIRLS Procedures
History
With the Progress in International Reading Literacy Study (PIRLS), the Inter-national Association for the Evaluation of Educational Achievement (IEA)continues its mission to conduct comparative studies of student achievementin school subjects to inform educational policies and practices in countriesaround the world. Since its inception in 1959, the IEA has conducted studieson a wide range of topics and subjects including mathematics, science, lan-guage, civics, and reading. By providing a cross-national perspective on edu-cational systems and on organizational and instructional practices, IEA studieshave contributed greatly to current understanding of the educational process.PIRLS 2001 is a large international study of the reading literacy of young chil-dren around the world. It is designed to measure children’s reading literacyachievement, to provide a baseline for future studies of trends in achieve-ment, and to gather information about children’s home and school experiencesin learning to read.
In 1970, IEA conducted its first reading study, a study of reading com-prehension in 15 countries.1 This was followed in 1991 by the IEA Reading Literacy Study,2 which studied student reading literacy achievement in 32 coun-tries. PIRLS is the successor to these studies, and was influenced particularly
[278]
by the Reading Literacy Study, which served as a starting point for its devel-opment. PIRLS 2001 is intended to be the first in a continuing five-year cycleof trend studies in reading literacy, and has been designed from the outset tomonitor progress in reading achievement into the future. The IEA scheduledthe PIRLS data collection for 2001 to coincide with the 10th anniversary of its1991 Reading Literacy Study. In order to provide countries that participated inthe 1991 Reading Literacy Study an opportunity to measure changes from 1991to 2001, PIRLS 2001 also included an option to re-administer the 1991 readingliteracy test in 2001, at the same time as the main PIRLS assessment. The resultsof this study, known as the Trends in IEA’s Reading Literacy Study, are pre-sented in a separate report.3
Participants in PIRLS
Thirty-five countries took part in the 2001 PIRLS assessment. Of these coun-tries, nine participated in the Trends in IEA’s Reading Literacy Study to measurechanges between 1991 and 2001 in student performance as measured by the1991 reading literacy test (see Exhibit A.1).
Developing the PIRLS Tests
The assessment framework and specifications4 for PIRLS was developed in col-laboration with the PIRLS Reading Development Group (RDG) and with theassistance of the National Research Coordinators (NRCs) from the 35 countriesparticipating in the study. The framework underwent several iterations inresponse to reviews and comments from the PIRLS countries and the readingresearch community, and embodies the ideas and interests of many individu-als and organizations around the world. The IEA 1991 Reading Literacy Studyserved as the foundation for PIRLS, providing a basis for the PIRLS definitionof reading literacy, and for establishing its framework and developing itsassessment instruments. Although the 1991 study provided the groundworkfor PIRLS, the PIRLS framework and instruments are new; reflecting the IEA’scommitment to be forward-thinking, incorporating in PIRLS the latestapproaches to measuring reading literacy.
appendix a: overview of pirls procedures
3 Martin, M.O., Mullis, I.V.S., Gonzalez, E.J., & Kennedy, A.M. (2003). Trends in children’s reading literacy achievement 1991-2001: IEA’s repeatin nine countries of the 1991 Reading Literacy Study. Chestnut Hill, MA: Boston College.
4 See Campbell, J.R., Kelly, D.L., Mullis, I.V.S., Martin, M.O., & Sainsbury, M. (2001). Framework and specifications for PIRLS assessment 2001(2nd ed.). Chestnut Hill, MA: Boston College.
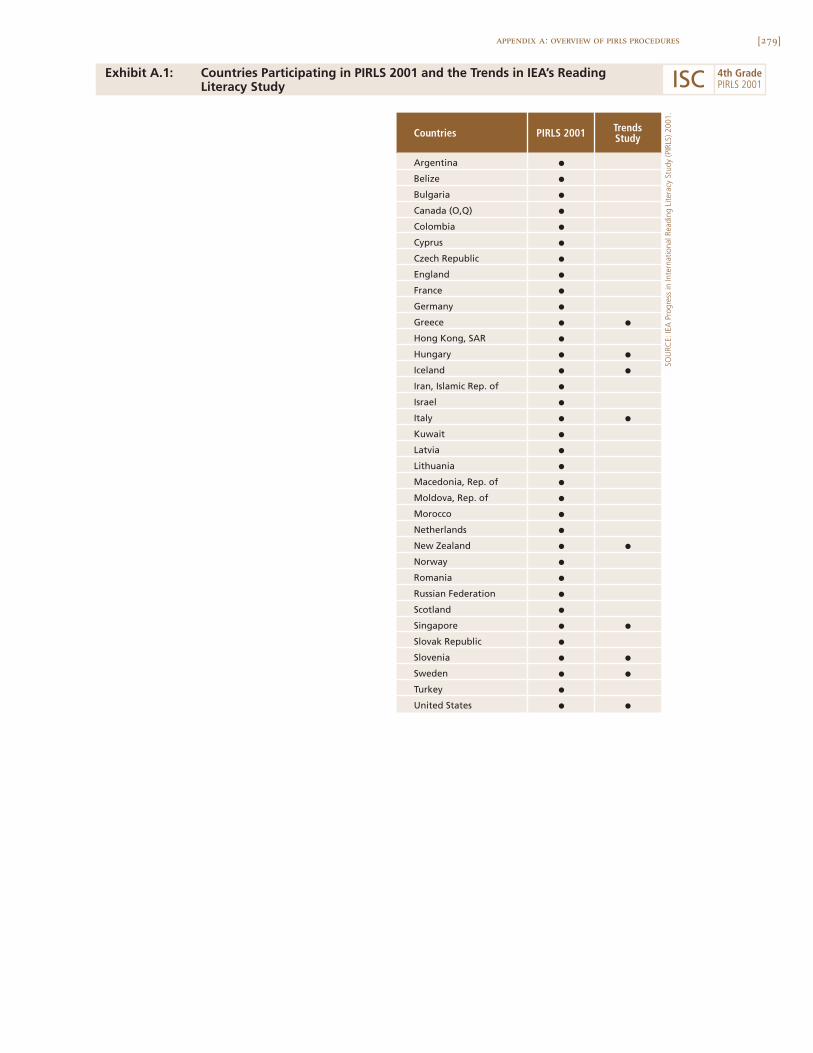
[279]appendix a: overview of pirls procedures
Exhibit A.1: Countries Participating in PIRLS 2001 and the Trends in IEA’s ReadingLiteracy Study
SOU
RCE:
IEA
Pro
gres
s in
Inte
rnat
iona
l Rea
ding
Lite
racy
Stu
dy (P
IRLS
) 200
1.
Countries PIRLS 2001 TrendsStudy
Argentina D
Belize D
Bulgaria D
Canada (O,Q) D
Colombia D
Cyprus D
Czech Republic D
England D
France D
Germany D
Greece D D
Hong Kong, SAR D
Hungary D D
Iceland D D
Iran, Islamic Rep. of D
Israel D
Italy D D
Kuwait D
Latvia D
Lithuania D
Macedonia, Rep. of D
Moldova, Rep. of D
Morocco D
Netherlands D
New Zealand D D
Norway D
Romania D
Russian Federation D
Scotland D
Singapore D D
Slovak Republic D
Slovenia D D
Sweden D D
Turkey D
United States D D
ISC 4th GradePIRLS 2001
[280] appendix a: overview of pirls procedures
The PIRLS assessment framework focuses on three aspects of readingliteracy:
• Processes of comprehension
• Purposes for reading
• Reading behaviors and attitudes.
The first two aspects, the processes of comprehension and purposes forreading, form the basis of the written test of reading comprehension. The lastaspect, the behaviors and attitudes, is addressed by the student questionnaire.
Readers construct meaning in different ways. They focus on andretrieve specific ideas, make inferences, interpret and integrate information andideas, and examine or evaluate textual features. These four processes of com-prehension were used in the PIRLS assessment to develop the comprehen-sion questions for the passages presented to students. Across the assessment,a combination of questions, each dealing with one of the processes, enabledstudents to demonstrate a range of abilities and skills in constructing meaningfrom written texts.
Reading literacy is directly related to the reasons why people read.These reasons include reading for personal interest or pleasure, reading toparticipate in society, and reading to learn. For young readers, emphasis isplaced on reading for interest or pleasure and reading to learn. The PIRLSassessment focused on the two purposes that account for most of the readingdone by young students both in and out of school:
• Reading for literary experience
• Reading to acquire and use information.
Because both types of reading are important at this age, the PIRLS assess-ment contained an equal proportion of materials assessing each purpose.Although the assessment distinguished between purposes for reading, theprocesses and strategies readers used for both purposes are perhaps more similarthan different. The processes of comprehension and purposes for reading werethe foundation for the PIRLS written assessment of reading comprehension.
[281]appendix a: overview of pirls procedures
Exhibit A.2 portrays the interaction of the two: each process is assessed withineach purpose for reading.
The selection of the assessment passages and the development of theitems and scoring guides were the result of an intensive process of collabora-tion, piloting, and review – spanning more than two years.5 In selecting the pas-sages for PIRLS, every effort was made to minimize cultural bias. Potentialstimulus passages were collected from as many countries as possible, and thefinal selection was based, in part, on the national and cultural representation ofthe entire set of assessment passages. Everything possible was done to ensurethat the PIRLS assessment represented the curricula of the participating coun-tries, and that the items did not exhibit bias towards or against particular coun-tries. Draft passages and items were subjected to full-scale field testing beforethe instruments for the main data collection were finalized.6 The final versionof the assessment was endorsed by the NRCs of the participating countries.
Exhibit A.3 shows the distribution of items by reading purpose andprocess category. There were 98 items in the assessment, approximately halfof which were multiple-choice and half constructed-response. The constructed-response items required students to generate and write their own answers.Some items required short answers while others demanded a more elaborateresponse. In scoring the test, correct answers to most questions (includingall those in multiple-choice format) were worth one point. However, responsesto questions seeking more elaborate responses were evaluated for partialcredit, with a fully-correct answer being awarded two or three points. Thus,the total number of score points available for analyses somewhat exceeds thenumber of items in the assessment. The student answer booklet provided anindication to the student of how many score points would be awarded foreach answer, and how much writing was expected. Almost two-thirds of thescore points came from constructed-response items.
5 For a full discussion of the PIRLS 2001 test development effort, see Sainsbury, M. and Campbell, J.R. (2003). Developing the PIRLS readingassessment and scoring guides. In M.O. Martin, I.V.S. Mullis, & A.M. Kennedy (Eds.), PIRLS 2001 technical report. Chestnut Hill, MA: BostonCollege.
6 Approximately 48,000 students from almost 1,100 schools in 30 countries participated in the field test.
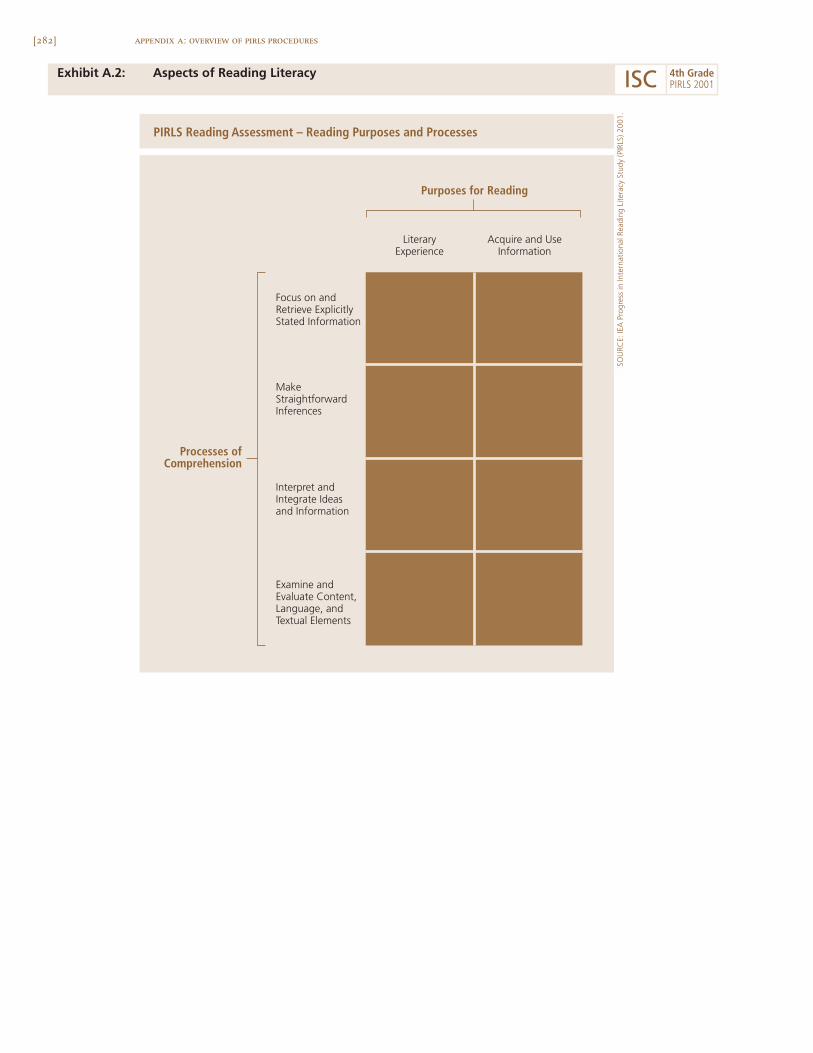
[282] appendix a: overview of pirls procedures
Exhibit A.2: Aspects of Reading Literacy
Purposes for Reading
Focus on and Retrieve ExplicitlyStated Information
MakeStraightforwardInferences
Interpret andIntegrate Ideasand Information
Examine andEvaluate Content,Language, andTextual Elements
Acquire and UseInformation
LiteraryExperience
PIRLS Reading Assessment – Reading Purposes and Processes
Processes ofComprehension
SOU
RCE:
IEA
Pro
gres
s in
Inte
rnat
iona
l Rea
ding
Lite
racy
Stu
dy (P
IRLS
) 200
1.
ISC 4th GradePIRLS 2001
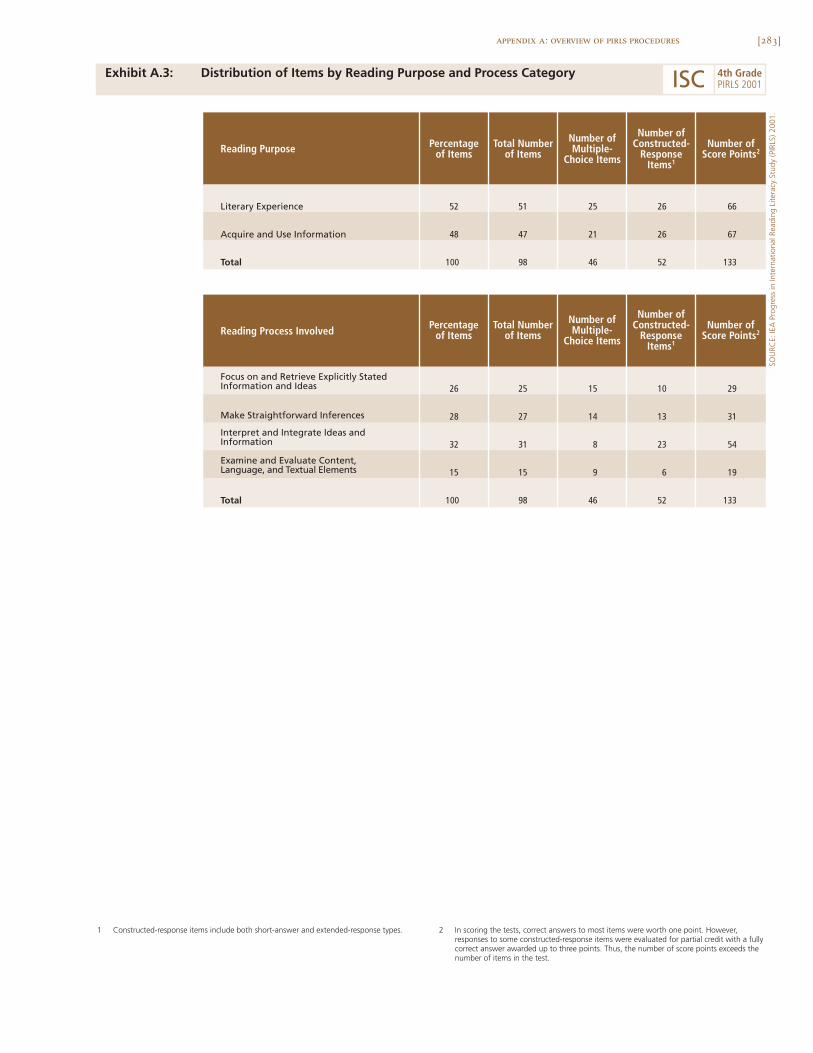
[283]appendix a: overview of pirls procedures
Exhibit A.3: Distribution of Items by Reading Purpose and Process Category
SOU
RCE:
IEA
Pro
gres
s in
Inte
rnat
iona
l Rea
ding
Lite
racy
Stu
dy (P
IRLS
) 200
1.
Reading Purpose Percentageof Items
Total Numberof Items
Number ofMultiple-
Choice Items
Number ofConstructed-
ResponseItems1
Number ofScore Points2
Literary Experience 52 51 25 26 66
Acquire and Use Information 48 47 21 26 67
Total 100 98 46 52 133
Reading Process Involved
Focus on and Retrieve Explicitly StatedInformation and Ideas 26 25 15 10 29
Make Straightforward Inferences 28 27 14 13 31
Interpret and Integrate Ideas andInformation 32 31 8 23 54
Examine and Evaluate Content,Language, and Textual Elements 15 15 9 6 19
Total 100 98 46 52 133
Percentageof Items
Total Numberof Items
Number ofMultiple-
Choice Items
Number ofConstructed-
ResponseItems1
Number ofScore Points2
1 Constructed-response items include both short-answer and extended-response types. 2 In scoring the tests, correct answers to most items were worth one point. However,responses to some constructed-response items were evaluated for partial credit with a fullycorrect answer awarded up to three points. Thus, the number of score points exceeds thenumber of items in the test.
ISC 4th GradePIRLS 2001
[284] appendix a: overview of pirls procedures
PIRLS Test Design
Given the broad coverage goals of the PIRLS framework and its emphasis on theuse of authentic texts, the specifications for the pool of reading passages andaccompanying items included extensive testing time. The PIRLS RDG foundthat a valid assessment of two purposes for reading – reading for literary expe-rience and reading to acquire and use information – required at least eightpassages and items, four for each purpose. Students were given 40 minutes tocomplete a passage. With eight passages, a total assessment time would takeup 320 minutes. While such an amount of assessment materials would providegood coverage of the reading material children meet in their everyday lives,it was an unreasonable expectation to administer the entire set of reading pas-sages and test items to any one child. So as not to overburden the young chil-dren participating in PIRLS, the testing time was limited to 80 minutes (twopassages) per student, with an additional 15-30 minutes allotted for a studentquestionnaire.
With eight reading passages in total, but just two to be given to anyone student, passages and their accompanying items were assigned to studenttest booklets according to a matrix sampling plan. The eight passages weredistributed across 10 booklets, two per booklet, so that passages were pairedtogether in a booklet in as many different ways as possible. Each studentbooklet consisted of two 40-minute blocks of passages and items, which wereaccompanied by the Student Questionnaire. So as to present at least some pas-sages in a more natural, authentic setting, two blocks (one literary and oneinformational) were presented in colorized, magazine-type format, with thequestions appearing in a separate booklet. This booklet, Booklet 10, is referredto as the PIRLS “Reader.”
Background Questionnaires
The PIRLS questionnaires are grounded in a conceptual model relating readingoutcomes – students’ reading literacy achievement and attitudes – to home,school, communal, and national contexts.7 PIRLS 2001 administered a broadarray of questionnaires to collect data on these educational contexts.
7 See Kelly, D.L. (2003). Developing the PIRLS background questionnaires. In M.O. Martin, I.V.S. Mullis, & A.M. Kennedy (Eds.), PIRLS 2001technical report. Chestnut Hill, MA: Boston College.
[285]appendix a: overview of pirls procedures
The students who were tested answered questions pertaining to their homeand school experiences in learning to read – including instructional expe-riences, self-perception and attitudes towards reading, out-of-school readinghabits, computer use, home literacy resources, and basic demographic infor-mation. Parents or caregivers of the sampled students responded to ques-tions about the students’ early reading experiences, child-parent literacyinteractions, parents’ reading habits and attitudes, home-school connections,and demographic and socioeconomic indicators. The teachers of the sampledstudents responded to questions about characteristics of the class tested,instructional activities for teaching reading, classroom resources, assessmentpractices, and about their education, training, and opportunities for pro-fessional development. The principals of schools responded to questionsabout enrollment and school characteristics, school organization for readinginstruction, school staffing and resources, home-school connections, and theschool environment.
Translation Verification
The PIRLS instruments were prepared in English and translated into 31 lan-guages. Five countries administered the assessment in two languages, andseven countries administered one or more questionnaires in more than onelanguage. The languages in which the test was administered most often wereEnglish (seven countries) and Arabic (three countries). In addition, it wassometimes necessary to modify the international versions for cultural reasons,even in the seven countries that tested in English. This process representedan enormous effort for the national centers, with many checks along the way.Before the translated instruments were used in schools, they were put throughan exhaustive process of review and verification.8 The translation effortincluded: (1) developing explicit guidelines for translation and cultural adap-tation; (2) translation of the instruments by the national centers in accordancewith the guidelines – using two or more independent translations; (3) verifi-cation of translation quality by professional translators from an independenttranslation company; (4) corrections by national centers in accordance withthe suggestions made; (5) verification by the PIRLS International Study Center
8 More details about the translation verification procedures can be found in Kelly, D.L., and Malak, B. (2003). Translating the PIRLS readingassessment and questionnaires. In M.O. Martin, I.V.S. Mullis, and A.M. Kennedy (Eds.), PIRLS 2001 technical report. Chestnut Hill, MA: BostonCollege.
[286] appendix a: overview of pirls procedures
that the corrections were made; and (6) a series of statistical checks after thetesting to detect items that did not perform comparably across countries.
For the participating countries, the bulk of the translation effort tookplace prior to the field test. After the field test, countries needed only to makeany changes to the items or passages that resulted from analysis of the fieldtest data. The PIRLS data-collection instruments were verified twice – the fieldtest versions before the field test and the final versions before the main datacollection. Countries, therefore, had the benefit of two careful reviews of theirtranslations. They also had the benefit of diagnostic item statistics from thefield test data analysis, which helped to identify mistranslations that could becorrected before the main data collection.
Sample Implementation and Participation Rates
PIRLS 2001 had as its target population students enrolled in the upper of thetwo adjacent grades that contained the largest proportion of 9-year-old stu-dents at the time of testing.9 Beyond the age criterion embedded in the abovedefinition, the target grade should represent that point in the curriculum wherestudents have essentially finished learning the basic reading skills and willfocus more on “reading to learn” in the subsequent grades. Thus, the PIRLS2001 target grade was expected to be fourth grade in most countries (somecountries have students significantly older than nine years of age). ExhibitA.4 shows any differences in coverage between the international and nationaldesired populations.
Selecting valid and efficient samples is critical to the quality and successof an international comparative study such as PIRLS. The accuracy of thesurvey results depends upon the quality of the sampling information avail-able when planning the sample, and on the care with which the samplingactivities are conducted. For PIRLS, NRCs worked on all phases of samplingin conjunction with staff from Statistics Canada. NRCs were trained in howto select the school and student samples, and in how to use the sampling soft-ware provided by the IEA Data Processing Center. In consultation with thePIRLS 2001 sampling referee (Keith Rust, Westat, Inc.), staff from StatisticsCanada reviewed the national sampling plans, sampling data, sampling frames,
9 See Foy, P. and Joncas, M. (2003). PIRLS sampling design. In M.O. Martin, I.V.S. Mullis, & A.M. Kennedy (Eds.), PIRLS 2001 technical report.Chestnut Hill, MA: Boston College.
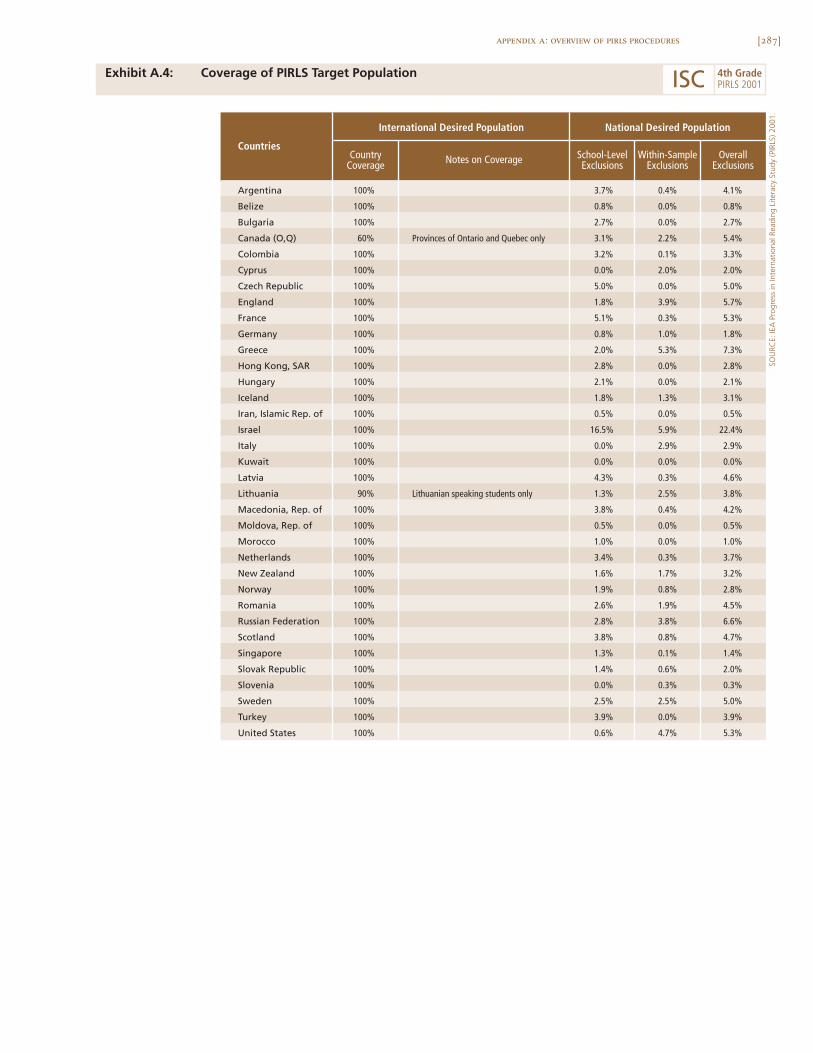
[287]appendix a: overview of pirls procedures
Exhibit A.4: Coverage of PIRLS Target Population
SOU
RCE:
IEA
Pro
gres
s in
Inte
rnat
iona
l Rea
ding
Lite
racy
Stu
dy (P
IRLS
) 200
1.
CountryCoverage Notes on Coverage School-Level
ExclusionsWithin-Sample
ExclusionsOverall
Exclusions
Argentina 100% 3.7% 0.4% 4.1%
Belize 100% 0.8% 0.0% 0.8%
Bulgaria 100% 2.7% 0.0% 2.7%
Canada (O,Q) 60% Provinces of Ontario and Quebec only 3.1% 2.2% 5.4%
Colombia 100% 3.2% 0.1% 3.3%
Cyprus 100% 0.0% 2.0% 2.0%
Czech Republic 100% 5.0% 0.0% 5.0%
England 100% 1.8% 3.9% 5.7%
France 100% 5.1% 0.3% 5.3%
Germany 100% 0.8% 1.0% 1.8%
Greece 100% 2.0% 5.3% 7.3%
Hong Kong, SAR 100% 2.8% 0.0% 2.8%
Hungary 100% 2.1% 0.0% 2.1%
Iceland 100% 1.8% 1.3% 3.1%
Iran, Islamic Rep. of 100% 0.5% 0.0% 0.5%
Israel 100% 16.5% 5.9% 22.4%
Italy 100% 0.0% 2.9% 2.9%
Kuwait 100% 0.0% 0.0% 0.0%
Latvia 100% 4.3% 0.3% 4.6%
Lithuania 90% Lithuanian speaking students only 1.3% 2.5% 3.8%
Macedonia, Rep. of 100% 3.8% 0.4% 4.2%
Moldova, Rep. of 100% 0.5% 0.0% 0.5%
Morocco 100% 1.0% 0.0% 1.0%
Netherlands 100% 3.4% 0.3% 3.7%
New Zealand 100% 1.6% 1.7% 3.2%
Norway 100% 1.9% 0.8% 2.8%
Romania 100% 2.6% 1.9% 4.5%
Russian Federation 100% 2.8% 3.8% 6.6%
Scotland 100% 3.8% 0.8% 4.7%
Singapore 100% 1.3% 0.1% 1.4%
Slovak Republic 100% 1.4% 0.6% 2.0%
Slovenia 100% 0.0% 0.3% 0.3%
Sweden 100% 2.5% 2.5% 5.0%
Turkey 100% 3.9% 0.0% 3.9%
United States 100% 0.6% 4.7% 5.3%
International Desired Population National Desired Population
Countries
ISC 4th GradePIRLS 2001
[288] appendix a: overview of pirls procedures
and sample selections. The sampling documentation was used by the Inter-national Study Center (in consultation with Statistics Canada and the sam-pling referee) to evaluate the quality of the samples.
The basic design of the sample used in PIRLS 2001 was a two-stagestratified cluster design. The first stage consisted of a sampling of schools, andthe second stage of a sampling of intact classrooms from the target grade inthe sampled schools. Most countries sampled 150 schools and one intact class-room from each school.10 Countries that selected large school samples includedsome countries with very large populations (such as the United States and theRussian Federation) as well as countries such as Canada, Germany, and Hungarywhich required accurate survey estimates for regions or provinces. Schoolswere selected with probability proportional to size, and classrooms with equalprobabilities. Upon recommendation from Statistics Canada, some countrieschose to sample more than one classroom per selected school.
Exhibits A.5 and A.6 present achieved sample sizes for schools andstudents, respectively. Exhibit A.7 shows the participation rates for schools,students, and overall – both with, and without, the use of replacement schools.For analysis and reporting, students’ questionnaire data, along with ques-tionnaire data from their parents, teachers, and school principals, were linkedto students’ achievement data. Exhibit A.8 shows the percentage of studentswith available student, parent, teacher, and principal questionnaire data.
Data Collection
Each participating country was responsible for carrying out all aspects of thedata collection, using standardized procedures developed for the study. Train-ing manuals were created for school coordinators and test administrators thatexplained procedures for receipt and distribution of materials, as well as for theactivities related to the testing sessions. These manuals covered proceduresfor test security, standardized scripts to regulate directions and timing, rulesfor answering students’ questions, and steps to ensure that identification on thetest booklets and questionnaires corresponded to the information on the formsused to track students.
10 For further detail, see Joncas, M. (2003). PIRLS sampling weights and participation rates. In M.O. Martin, I.V.S. Mullis, & A.M. Kennedy (Eds.),PIRLS 2001 technical report. Chestnut Hill, MA: Boston College.
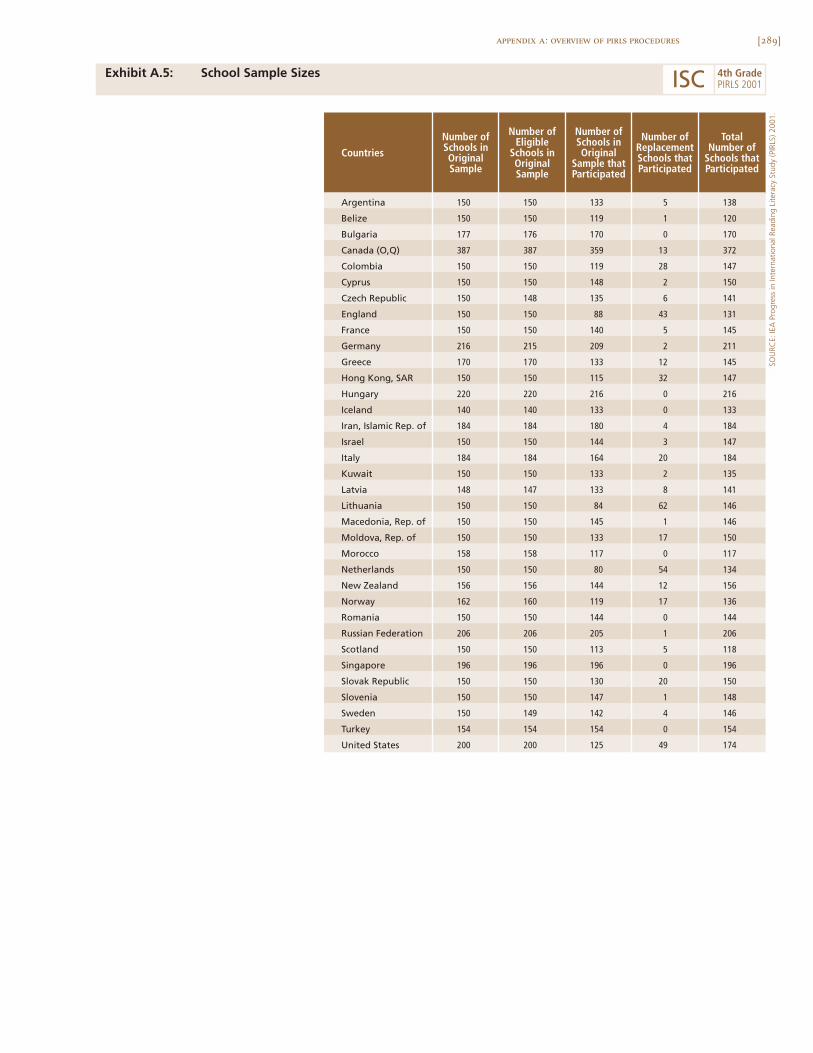
[289]appendix a: overview of pirls procedures
Exhibit A.5: School Sample Sizes
SOU
RCE:
IEA
Pro
gres
s in
Inte
rnat
iona
l Rea
ding
Lite
racy
Stu
dy (P
IRLS
) 200
1.
Countries
Number ofSchools inOriginalSample
Number ofEligible
Schools inOriginalSample
Number ofSchools inOriginal
Sample thatParticipated
Number ofReplacementSchools thatParticipated
TotalNumber of
Schools thatParticipated
Argentina 150 150 133 5 138
Belize 150 150 119 1 120
Bulgaria 177 176 170 0 170
Canada (O,Q) 387 387 359 13 372
Colombia 150 150 119 28 147
Cyprus 150 150 148 2 150
Czech Republic 150 148 135 6 141
England 150 150 88 43 131
France 150 150 140 5 145
Germany 216 215 209 2 211
Greece 170 170 133 12 145
Hong Kong, SAR 150 150 115 32 147
Hungary 220 220 216 0 216
Iceland 140 140 133 0 133
Iran, Islamic Rep. of 184 184 180 4 184
Israel 150 150 144 3 147
Italy 184 184 164 20 184
Kuwait 150 150 133 2 135
Latvia 148 147 133 8 141
Lithuania 150 150 84 62 146
Macedonia, Rep. of 150 150 145 1 146
Moldova, Rep. of 150 150 133 17 150
Morocco 158 158 117 0 117
Netherlands 150 150 80 54 134
New Zealand 156 156 144 12 156
Norway 162 160 119 17 136
Romania 150 150 144 0 144
Russian Federation 206 206 205 1 206
Scotland 150 150 113 5 118
Singapore 196 196 196 0 196
Slovak Republic 150 150 130 20 150
Slovenia 150 150 147 1 148
Sweden 150 149 142 4 146
Turkey 154 154 154 0 154
United States 200 200 125 49 174
ISC 4th GradePIRLS 2001
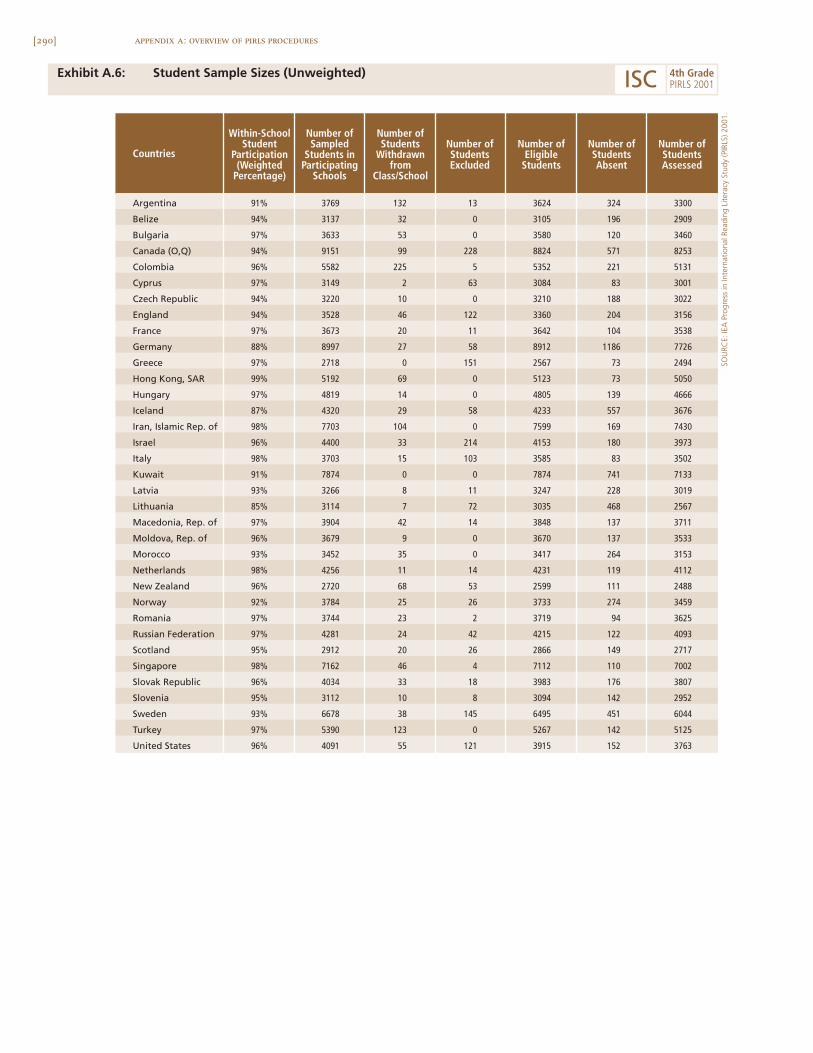
[290] appendix a: overview of pirls procedures
Exhibit A.6: Student Sample Sizes (Unweighted)
Countries
Within-SchoolStudent
Participation(Weighted
Percentage)
Number ofSampled
Students inParticipating
Schools
Number ofStudents
Withdrawnfrom
Class/School
Number ofStudentsExcluded
Number ofEligible
Students
Number ofStudentsAbsent
Number ofStudentsAssessed
Argentina 91% 3769 3624 3300
Belize 94% 3137 3105 2909
Bulgaria 97% 3633 3580 3460
Canada (O,Q) 94% 9151 8824 8253
Colombia 96% 5582 5352 5131
Cyprus 97% 3149 3084 3001
Czech Republic 94% 3220 3210 3022
England 94% 3528 3360 3156
France 97% 3673 3642 3538
Germany 88% 8997 8912 7726
Greece 97% 2718 2567 2494
Hong Kong, SAR 99% 5192 5123 5050
Hungary 97% 4819 4805 4666
Iceland 87% 4320 4233 3676
Iran, Islamic Rep. of 98% 7703 7599 7430
Israel 96% 4400 4153 3973
Italy 98% 3703 3585 3502
Kuwait 91% 7874 7874 7133
Latvia 93% 3266 3247 3019
Lithuania 85% 3114 3035 2567
Macedonia, Rep. of 97% 3904 3848 3711
Moldova, Rep. of 96% 3679 3670 3533
Morocco 93% 3452 3417 3153
Netherlands 98% 4256 4231 4112
New Zealand 96% 2720 2599 2488
Norway 92% 3784 3733 3459
Romania 97% 3744 3719 3625
Russian Federation 97% 4281 4215 4093
Scotland 95% 2912 2866 2717
Singapore 98% 7162 7112 7002
Slovak Republic 96% 4034 3983 3807
Slovenia 95% 3112 3094 2952
Sweden 93% 6678 6495 6044
Turkey 97% 5390 5267 5125
United States 96% 4091 3915 3763
132
32
53
99
225
2
10
46
20
27
0
69
14
29
104
33
15
0
8
7
42
9
35
11
68
25
23
24
20
46
33
10
38
123
55
13
0
0
228
5
63
0
122
11
58
151
0
0
58
0
214
103
0
11
72
14
0
0
14
53
26
2
42
26
4
18
8
145
0
121
324
196
120
571
221
83
188
204
104
1186
73
73
139
557
169
180
83
741
228
468
137
137
264
119
111
274
94
122
149
110
176
142
451
142
152
SOU
RCE:
IEA
Pro
gres
s in
Inte
rnat
iona
l Rea
ding
Lite
racy
Stu
dy (P
IRLS
) 200
1.
ISC 4th GradePIRLS 2001
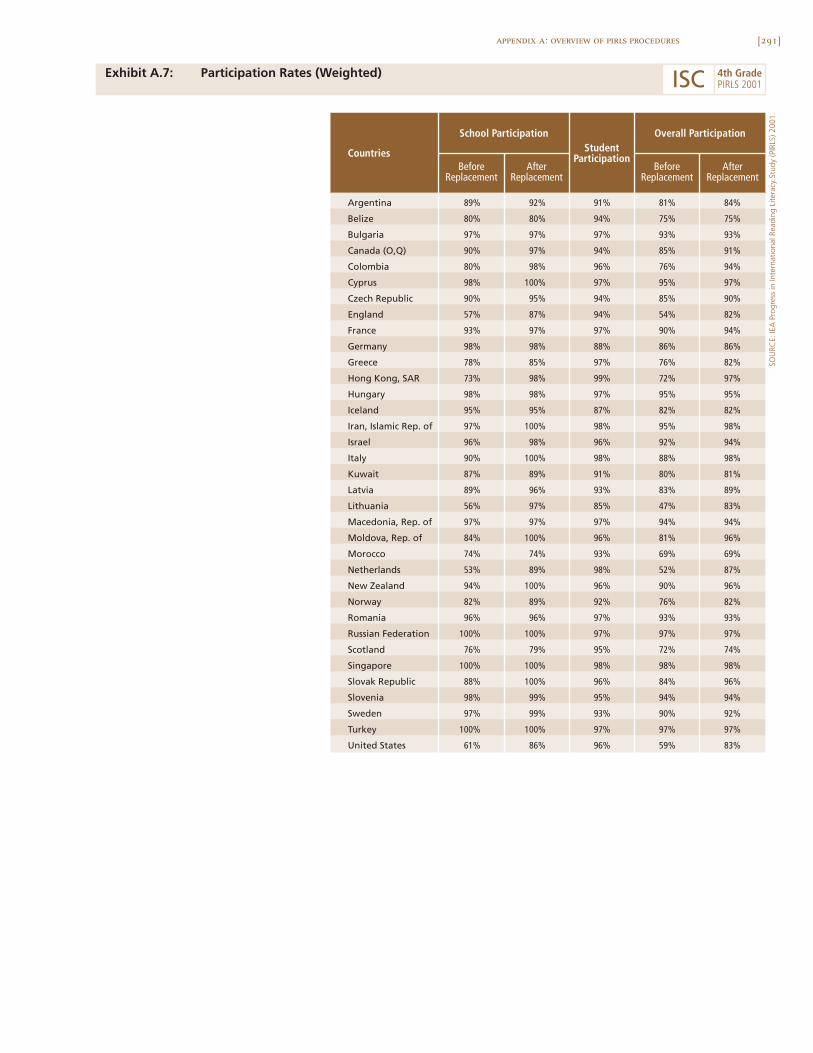
[291]appendix a: overview of pirls procedures
Exhibit A.7: Participation Rates (Weighted)
SOU
RCE:
IEA
Pro
gres
s in
Inte
rnat
iona
l Rea
ding
Lite
racy
Stu
dy (P
IRLS
) 200
1.
BeforeReplacement
AfterReplacement
BeforeReplacement
AfterReplacement
Argentina 89% 92% 91% 81% 84%
Belize 80% 80% 94% 75% 75%
Bulgaria 97% 97% 97% 93% 93%
Canada (O,Q) 90% 97% 94% 85% 91%
Colombia 80% 98% 96% 76% 94%
Cyprus 98% 100% 97% 95% 97%
Czech Republic 90% 95% 94% 85% 90%
England 57% 87% 94% 54% 82%
France 93% 97% 97% 90% 94%
Germany 98% 98% 88% 86% 86%
Greece 78% 85% 97% 76% 82%
Hong Kong, SAR 73% 98% 99% 72% 97%
Hungary 98% 98% 97% 95% 95%
Iceland 95% 95% 87% 82% 82%
Iran, Islamic Rep. of 97% 100% 98% 95% 98%
Israel 96% 98% 96% 92% 94%
Italy 90% 100% 98% 88% 98%
Kuwait 87% 89% 91% 80% 81%
Latvia 89% 96% 93% 83% 89%
Lithuania 56% 97% 85% 47% 83%
Macedonia, Rep. of 97% 97% 97% 94% 94%
Moldova, Rep. of 84% 100% 96% 81% 96%
Morocco 74% 74% 93% 69% 69%
Netherlands 53% 89% 98% 52% 87%
New Zealand 94% 100% 96% 90% 96%
Norway 82% 89% 92% 76% 82%
Romania 96% 96% 97% 93% 93%
Russian Federation 100% 100% 97% 97% 97%
Scotland 76% 79% 95% 72% 74%
Singapore 100% 100% 98% 98% 98%
Slovak Republic 88% 100% 96% 84% 96%
Slovenia 98% 99% 95% 94% 94%
Sweden 97% 99% 93% 90% 92%
Turkey 100% 100% 97% 97% 97%
United States 61% 86% 96% 59% 83%
Countries
School Participation Overall ParticipationStudent
Participation
ISC 4th GradePIRLS 2001
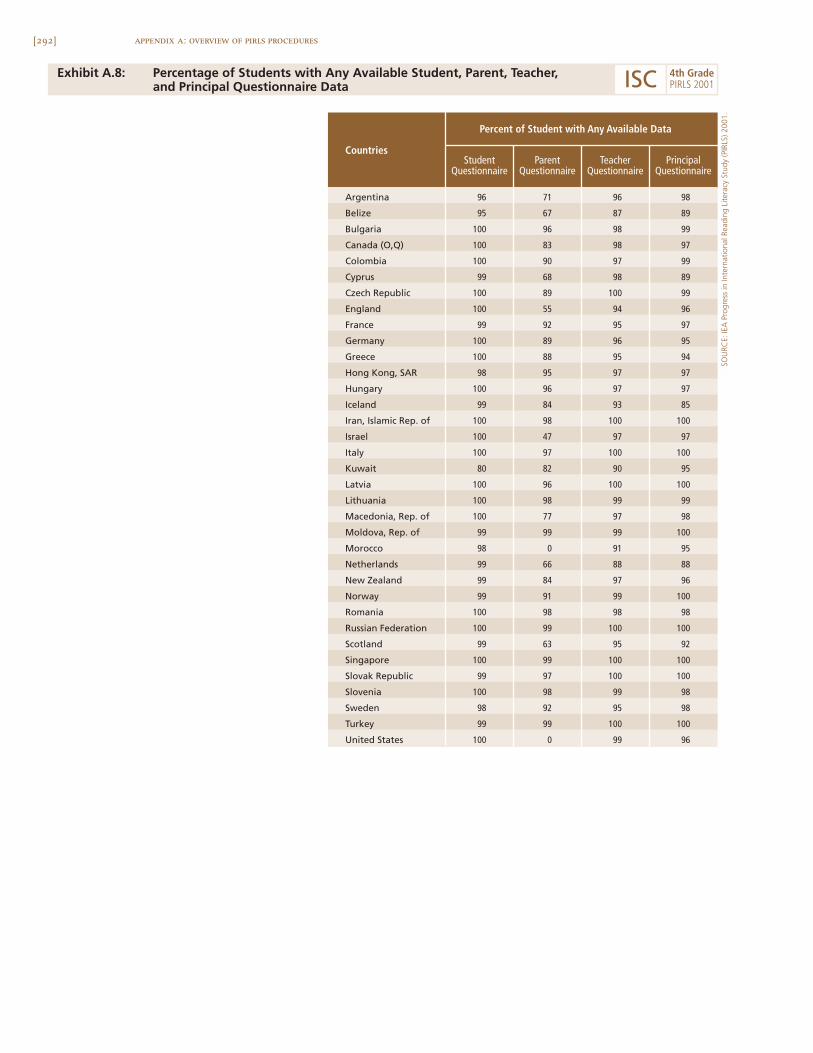
[292] appendix a: overview of pirls procedures
Exhibit A.8: Percentage of Students with Any Available Student, Parent, Teacher,and Principal Questionnaire Data
StudentQuestionnaire
ParentQuestionnaire
TeacherQuestionnaire
PrincipalQuestionnaire
Argentina
Belize
Bulgaria
Canada (O,Q)
Colombia
Cyprus
Czech Republic
England
France
Germany
Greece
Hong Kong, SAR
Hungary
Iceland
Iran, Islamic Rep. of
Israel
Italy
Kuwait
Latvia
Lithuania
Macedonia, Rep. of
Moldova, Rep. of
Morocco
Netherlands
New Zealand
Norway
Romania
Russian Federation
Scotland
Singapore
Slovak Republic
Slovenia
Sweden
Turkey
United States
Percent of Student with Any Available Data
Countries
96
95
100
100
100
99
100
100
99
100
100
98
100
99
100
100
100
80
100
100
100
99
98
99
99
99
100
100
99
100
99
100
98
99
100
71
67
96
83
90
68
89
55
92
89
88
95
96
84
98
47
97
82
96
98
77
99
0
66
84
91
98
99
63
99
97
98
92
99
0
96
87
98
98
97
98
100
94
95
96
95
97
97
93
100
97
100
90
100
99
97
99
91
88
97
99
98
100
95
100
100
99
95
100
99
98
89
99
97
99
89
99
96
97
95
94
97
97
85
100
97
100
95
100
99
98
100
95
88
96
100
98
100
92
100
100
98
98
100
96
SOU
RCE:
IEA
Pro
gres
s in
Inte
rnat
iona
l Rea
ding
Lite
racy
Stu
dy (P
IRLS
) 200
1.
ISC 4th GradePIRLS 2001
[293]appendix a: overview of pirls procedures
Each country was responsible for conducting quality control proce-dures and describing this effort in the Survey Activities report documentingprocedures used in the study. In addition, the International Study Center con-sidered it essential to independently monitor compliance with standardizedprocedures. NRCs were asked to nominate a person, unconnected with theirnational center, to serve as quality control monitors (QCMs) for their coun-tries. The International Study Center developed manuals for the quality controlmonitors and, in a two-day training session, briefed them about PIRLS, theresponsibilities of the national centers in conducting the study, and their ownroles and responsibilities. Monitors from 33 countries attended the trainingsession conducted by the International Study Center staff. In countries wherethe data collection schedule made it impossible for one quality control monitorto visit all the sampled schools, monitors who attended the training sessionwere asked to recruit other monitors as necessary, in order to allow for effi-ciency in the coverage of the territory and testing timetable. In all, 71 qualitycontrol monitors participated.11 They interviewed NRCs about data collectionplans and procedures, and visited a sample of 15 schools in each country,where they observed testing sessions and interviewed school coordinators.12
All together, quality control monitors visited observed testing sessions andinterviewed school coordinators in 475 schools from 33 countries.
The results of the interviews indicate that, in general, NRCs had pre-pared well for data collection and – despite the heavy demands of the sched-ule and shortages of resources – were able to conduct the data collectionefficiently and professionally. Similarly, the PIRLS test appeared to have beenadministered in compliance with international procedures – including theactivities before the testing session, along with school-level activities relatedto receiving, distributing, and returning material from national centers.
Scoring the Constructed-Response Items
Because almost two-thirds of the score points came from constructed-responseitems, PIRLS needed to develop procedures for reliably evaluating studentresponses within and across countries. To ensure reliable scoring proceduresbased on the PIRLS rubrics, the International Study Center prepared detailed
11 Operational constraints did not permit QCM visits to be conducted in Argentina or Iceland.
12 Steps taken to ensure high-quality data collection in PIRLS are described in detail in Gonzalez, E.J., & Kennedy, A.M. (2003). Quality control inthe PIRLS data collection. In M.O. Martin, I.V.S. Mullis, & A.M. Kennedy (Eds.), PIRLS 2001 technical report. Chestnut Hill, MA: BostonCollege.
[294] appendix a: overview of pirls procedures
guides containing the rubrics and explanations of how to implement them,together with example student responses for the various rubric categories.These guides, along with training packets containing extensive examples ofstudent responses for practice in applying the rubrics, were used as a basisfor intensive training in scoring the constructed-response items. The trainingsessions were designed to help representatives of national centers, who wouldthen be responsible for training personnel in their own countries to apply thescoring rubrics reliably.
To gather and document empirical information about the within-countryagreement among scorers, PIRLS arranged to have systematic sub-samples ofat least 200 students’ responses to each item scored independently by tworeaders. Exhibit A.9 shows the average range of the within-country exactpercent of agreement between scorers on the free-response items. Scoring reli-ability within countries was high – the percentage of exact agreement, onaverage, across countries, was 93 percent.
To monitor the consistency with which the scoring rubrics were appliedacross countries, PIRLS collected from the countries that administered PIRLSin English a sample of 200 student responses to 25 constructed-response ques-tions from four of the assessment passages. This set of 5,000 student responseswas then sent to each country having scorers proficient in English, and wereall scored independently by two of these scorers. Each of these responses wasscored by 55 scorers from the countries that participated.13 Making all possi-ble comparisons among scorers gave 1,485 comparisons for each studentresponse to each item, and 297,000 total comparisons when aggregated acrossall 200 student responses to that item. Agreement across countries was definedin terms of the percentage of these comparisons that were in exact agreement.Exhibit A.10 shows this percentage of exact agreement for each of the 25 items.As shown in this exhibit, the percentage of agreement averaged across the 25items was 85 percent.
Test Reliability
Exhibit A.11 displays the reading test reliability coefficient for each country.This coefficient is the median KR-20 reliability across the nine test booklets
13 Scorers proficient in English were available in 28 of the 35 PIRLS countries. Only one English-proficient scorer was available in Macedonia. Inthe Russian Federation, resources permitted only half of the English-language responses to be scored.
[295]appendix a: overview of pirls procedures
and the PIRLS Reader. Median reliabilities ranged from 0.83 in The Nether-lands to 0.91 in England, Israel, Macedonia, New Zealand, Romania, andSingapore. The international median (0.88) is the median of the reliabilitycoefficients for all countries.
Data Processing
To ensure the availability of comparable, high-quality data for analysis, PIRLStook rigorous quality control steps to create the international database.14 PIRLSprepared manuals and software for countries to use in creating and checkingtheir data files, so that the information would be in a standardized interna-tional format before being forwarded to the IEA Data Processing Center inHamburg for creation of the international database. Upon arrival at the DataProcessing Center, the data underwent an exhaustive cleaning process. Thisinvolved several iterative steps and procedures designed to identify, docu-ment, and correct deviations from the international instruments, file struc-tures, and coding schemes. The process also emphasized consistency ofinformation within national data sets and appropriate linking among thestudent, parent, teacher, and school data files.
Throughout the process, the data were checked and double-checkedby the IEA Data Processing Center, the International Study Center, and thenational centers. The national centers were contacted regularly, and given mul-tiple opportunities to review the data for their countries. In conjunction withthe IEA Data Processing Center, the International Study Center reviewed itemstatistics for each cognitive item in each country to identify poorly perform-ing items.15 In general, the items exhibited very good psychometric proper-ties in all countries. On only two occasions was an item deleted for a country;once because of a translation error in the student booklet, and once because ofa misinterpretation of a scoring rubric.
IRT Scaling and Data Analysis
The general approach to reporting the PIRLS achievement data was basedprimarily on item response theory (IRT) scaling methods.16 Student readingachievement was summarized using a family of 2- and 3-parameter IRT models
14 These steps are detailed in Itzlinger, U., & Schwippert, K. (2003). Creating and checking the PIRLS database. In M.O. Martin, I.V.S. Mullis, &A.M. Kennedy (Eds.), PIRLS 2001 technical report. Chestnut Hill, MA: Boston College.
15 See Mullis, I.V.S., Martin, M.O., & Kennedy, A.M. (2003). Reviewing the PIRLS item statistics. In M.O. Martin, I.V.S. Mullis, & A.M. Kennedy(Eds.), PIRLS 2001 technical report. Chestnut Hill, MA: Boston College.
16 For a detailed description of the PIRLS scaling, see Gonzalez, E.J. (2003). Scaling the PIRLS reading assessment data. In M.O. Martin, I.V.S.Mullis, & A.M. Kennedy (Eds.), PIRLS 2001 technical report. Chestnut Hill, MA: Boston College.
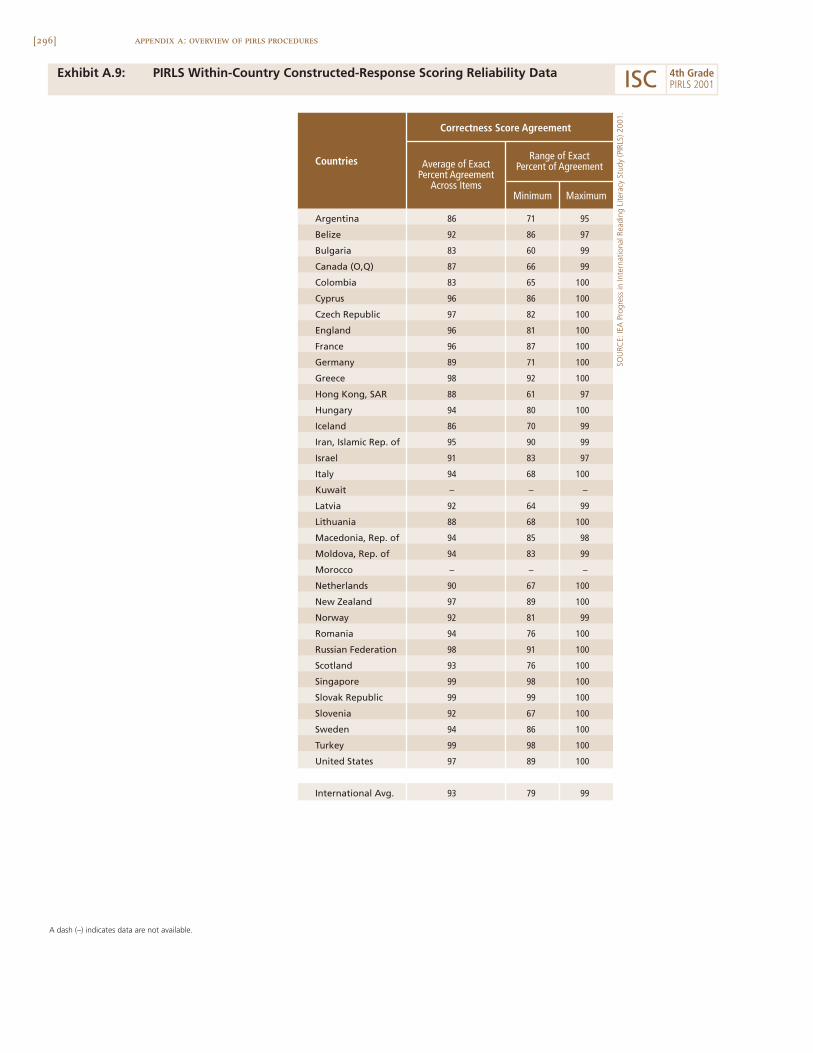
[296] appendix a: overview of pirls procedures
Exhibit A.9: PIRLS Within-Country Constructed-Response Scoring Reliability Data
Minimum Maximum
Argentina
Belize
Bulgaria
Canada (O,Q)
Colombia
Cyprus
Czech Republic
England
France
Germany
Greece
Hong Kong, SAR
Hungary
Iceland
Iran, Islamic Rep. of
Israel
Italy
Kuwait – – –
Latvia
Lithuania
Macedonia, Rep. of
Moldova, Rep. of 83
Morocco – – –
Netherlands
New Zealand
Norway
Romania
Russian Federation
Scotland
Singapore
Slovak Republic
Slovenia
Sweden
Turkey
United States
International Avg.
Average of ExactPercent Agreement
Across Items
Correctness Score Agreement
Range of ExactPercent of AgreementCountries
64
68
85
67
89
81
76
91
76
98
99
67
86
98
89
79
71
86
60
66
65
86
82
81
87
71
92
61
80
70
90
83
68
95
97
99
99
100
100
100
100
100
100
100
97
100
99
99
97
100
99
100
98
99
100
100
99
100
100
100
100
100
100
100
100
100
99
86
92
83
87
83
96
97
96
96
89
98
88
94
86
95
91
94
92
88
94
94
90
97
92
94
98
93
99
99
92
94
99
97
93
A dash (–) indicates data are not available.
SOU
RCE:
IEA
Pro
gres
s in
Inte
rnat
iona
l Rea
ding
Lite
racy
Stu
dy (P
IRLS
) 200
1.
ISC 4th GradePIRLS 2001
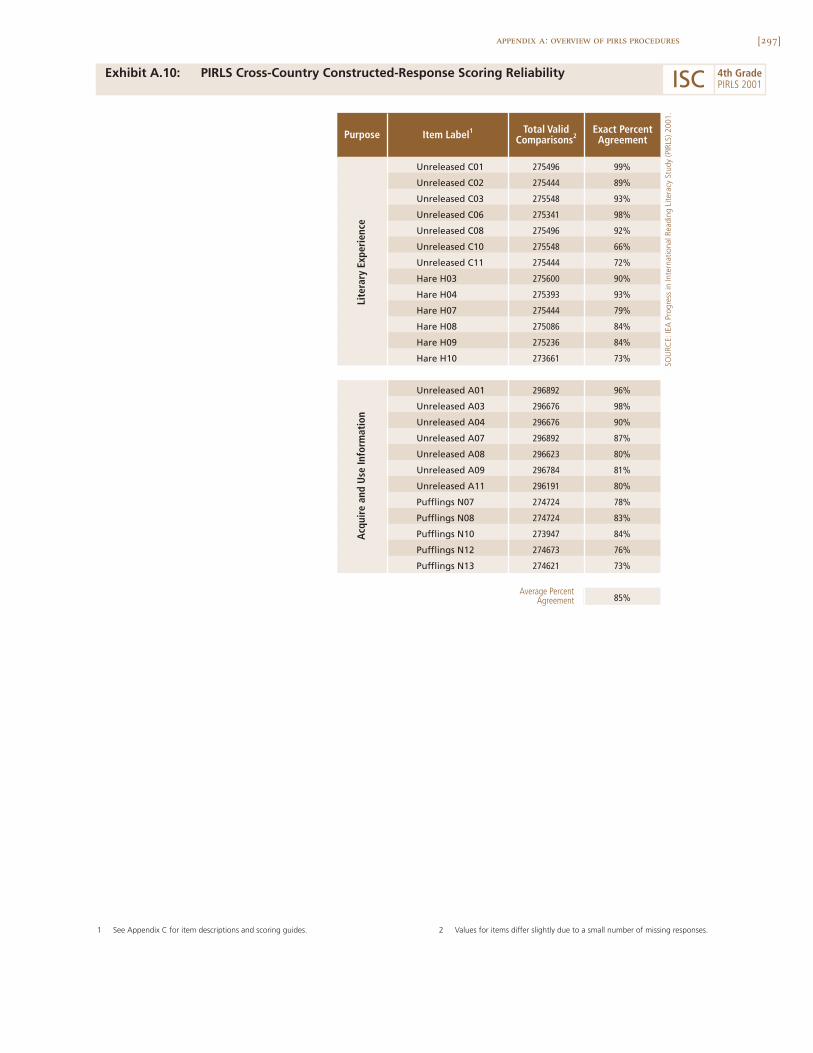
[297]appendix a: overview of pirls procedures
Exhibit A.10: PIRLS Cross-Country Constructed-Response Scoring Reliability
SOU
RCE:
IEA
Pro
gres
s in
Inte
rnat
iona
l Rea
ding
Lite
racy
Stu
dy (P
IRLS
) 200
1.
Total ValidComparisons2
Exact PercentAgreement
Unreleased C01 275496 99%
Unreleased C02 275444 89%
Unreleased C03 275548 93%
Unreleased C06 275341 98%
Unreleased C08 275496 92%
Unreleased C10 275548 66%
Unreleased C11 275444 72%
Hare H03 275600 90%
Hare H04 275393 93%
Hare H07 275444 79%
Hare H08 275086 84%
Hare H09 275236 84%
Hare H10 273661 73%
Unreleased A01 296892 96%
Unreleased A03 296676 98%
Unreleased A04 296676 90%
Unreleased A07 296892 87%
Unreleased A08 296623 80%
Unreleased A09 296784 81%
Unreleased A11 296191 80%
Pufflings N07 274724 78%
Pufflings N08 274724 83%
Pufflings N10 273947 84%
Pufflings N12 274673 76%
Pufflings N13 274621 73%
85%
Item Label1
Average PercentAgreement
Purpose
Lite
rary
Exp
erie
nce
Acq
uire
and
Use
Info
rmat
ion
1 See Appendix C for item descriptions and scoring guides. 2 Values for items differ slightly due to a small number of missing responses.
ISC 4th GradePIRLS 2001
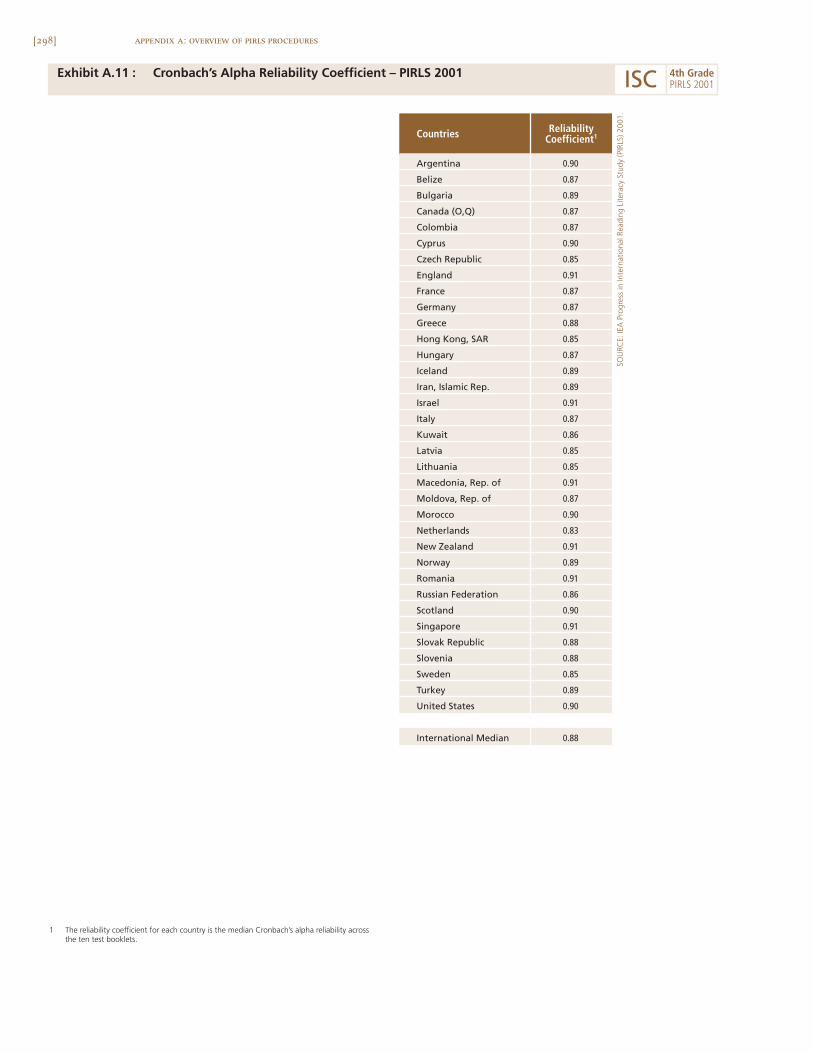
[298] appendix a: overview of pirls procedures
Exhibit A.11 : Cronbach’s Alpha Reliability Coefficient – PIRLS 2001
Countries ReliabilityCoefficient1
Argentina 0.90
Belize 0.87
Bulgaria 0.89
Canada (O,Q) 0.87
Colombia 0.87
Cyprus 0.90
Czech Republic 0.85
England 0.91
France 0.87
Germany 0.87
Greece 0.88
Hong Kong, SAR 0.85
Hungary 0.87
Iceland 0.89
Iran, Islamic Rep. 0.89
Israel 0.91
Italy 0.87
Kuwait 0.86
Latvia 0.85
Lithuania 0.85
Macedonia, Rep. of 0.91
Moldova, Rep. of 0.87
Morocco 0.90
Netherlands 0.83
New Zealand 0.91
Norway 0.89
Romania 0.91
Russian Federation 0.86
Scotland 0.90
Singapore 0.91
Slovak Republic 0.88
Slovenia 0.88
Sweden 0.85
Turkey 0.89
United States 0.90
International Median 0.88
1 The reliability coefficient for each country is the median Cronbach’s alpha reliability acrossthe ten test booklets.
SOU
RCE:
IEA
Pro
gres
s in
Inte
rnat
iona
l Rea
ding
Lite
racy
Stu
dy (P
IRLS
) 200
1.
ISC 4th GradePIRLS 2001
[299]appendix a: overview of pirls procedures
for dichotomously-scored items (right or wrong), and generalized partialcredit models for items with two or three available score points. The IRTscaling method produces a score by averaging the responses of each studentto the items that he or she took which takes into account the difficulty anddiscriminating power of each item. The methodology used in PIRLS includedrefinements enabling reliable scores to be produced even though individualstudents responded to just two of the eight assessment passages. Achieve-ment scales were produced for each of the two reading purposes (readingfor literary experience and reading for information), as well as for readingoverall. Exhibit A.12 presents the Pearson correlation coefficient indicatingthe linear relationship between the two reading purposes in each of thePIRLS countries.
The IRT methodology was preferred for developing comparable esti-mates of performance for all students, since students responded to differentpassages and items depending upon which of the test booklets they received(Booklets 1 through 9, or the PIRLS Reader). The IRT analysis provides acommon scale on which performance can be compared across countries. Inaddition to providing a basis for estimating mean achievement, scale scorespermit estimates of how students within countries vary and provide infor-mation on percentiles of performance. Treating all participating countriesequally, the PIRLS scale average across countries was set to 500, and the stan-dard deviation was set at 100. Since the countries varied in size, each countrywas weighted to contribute equally to the mean and standard deviation of thescale. The average and standard deviation of the scale scores are arbitrary anddo not affect scale interpretation.
To allow more accurate estimation of summary statistics for studentsubpopulations, the PIRLS scaling made use of plausible-value technology,whereby five separate estimates of each student’s score were generated on eachscale – based on the student’s responses to the items in the student’s booklet,and on the student’s background characteristics. The five score estimates areknown as “plausible values,” and the variability between them encapsulates theuncertainty inherent in the score estimation process.
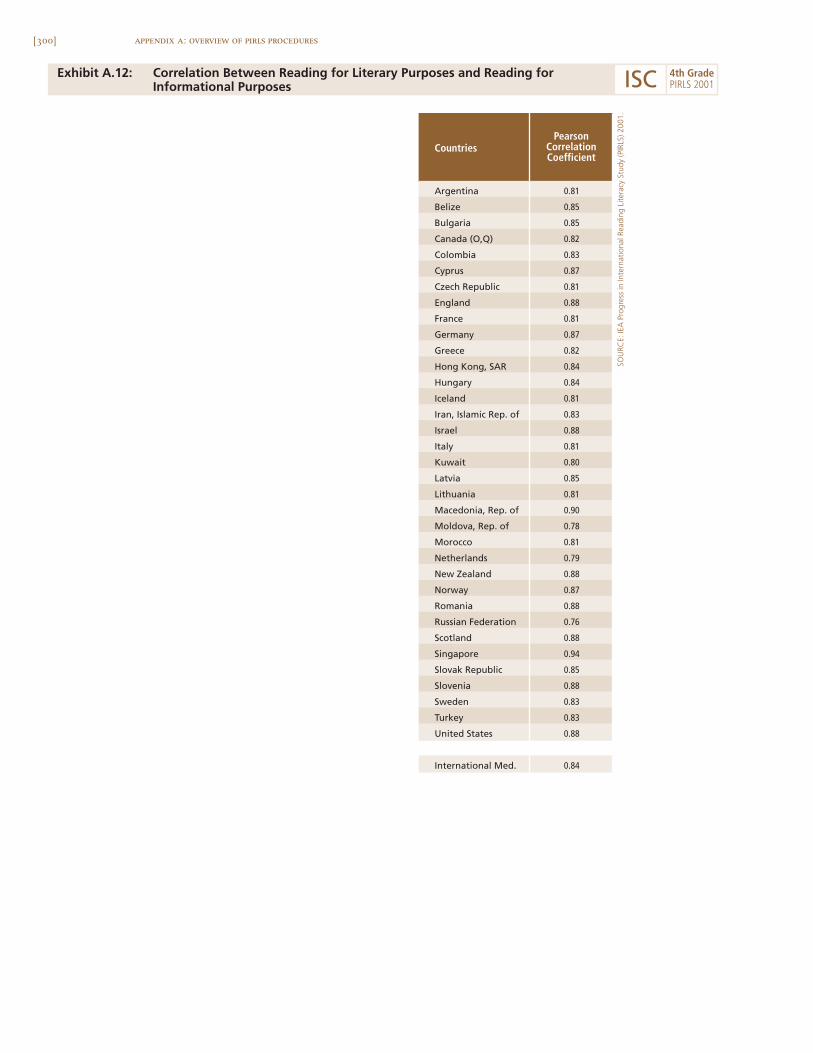
[300] appendix a: overview of pirls procedures
Exhibit A.12: Correlation Between Reading for Literary Purposes and Reading forInformational Purposes
Argentina 0.81
Belize 0.85
Bulgaria 0.85
Canada (O,Q) 0.82
Colombia 0.83
Cyprus 0.87
Czech Republic 0.81
England 0.88
France 0.81
Germany 0.87
Greece 0.82
Hong Kong, SAR 0.84
Hungary 0.84
Iceland 0.81
Iran, Islamic Rep. of 0.83
Israel 0.88
Italy 0.81
Kuwait 0.80
Latvia 0.85
Lithuania 0.81
Macedonia, Rep. of 0.90
Moldova, Rep. of 0.78
Morocco 0.81
Netherlands 0.79
New Zealand 0.88
Norway 0.87
Romania 0.88
Russian Federation 0.76
Scotland 0.88
Singapore 0.94
Slovak Republic 0.85
Slovenia 0.88
Sweden 0.83
Turkey 0.83
United States 0.88
International Med. 0.84
PearsonCorrelationCoefficient
Countries
SOU
RCE:
IEA
Pro
gres
s in
Inte
rnat
iona
l Rea
ding
Lite
racy
Stu
dy (P
IRLS
) 200
1.
ISC 4th GradePIRLS 2001
[301]appendix a: overview of pirls procedures
Estimating Sampling Error
Because the statistics presented in this report are estimates of national per-formance based on samples of students – rather than on the values that couldbe calculated if every student in every country had answered every question –it is important to have measures for the degree of uncertainty of the estimates.The jackknife procedure was used to estimate the standard error associated witheach statistic presented in this report.17 The jackknife standard errors alsoinclude an error component due to variation between the five plausible valuesgenerated for each student. The use of confidence intervals (based on the stan-dard errors) provides a way to make inferences about the population meansand proportions in a manner that reflects the uncertainty associated with thesample estimates. An estimated sample statistic plus or minus two standarderrors represents a 95 percent confidence interval for the corresponding pop-ulation result.
Setting International Benchmarks of Student Achievement
To facilitate reporting of student reading achievement at a variety of per-formance levels, PIRLS identified four international benchmarks of studentachievement. These benchmarks are the points on the PIRLS reading scale thatseparate the 10 percent of students located on top of the distribution, the top25 percent of students, the top 50 percent, and the bottom 25 percent. Thepercentage of students in each country meeting or exceeding the internationalbenchmarks is reported. The benchmarks correspond to the 90th, 75th, 50th,and 25th percentiles of the international distribution of achievement. Whencomputing these percentiles, sampling weights were applied so that eachcountry contributed as many students to the distribution as there were stu-dents in the target population in the country. That is, each country’s contri-bution to setting the international benchmarks was proportional to theestimated population enrolled at the fourth grade.
In order to interpret the PIRLS scale scores and analyze achievementat the international benchmarks, PIRLS conducted a scale anchoring analysisto describe achievement of students at those four points on the scale.
17 Procedures for computing jackknifed standard errors are presented in Gonzalez, E.J., & Kennedy, A.M. (2003). Statistical analysis and report-ing of the PIRLS data. In M.O. Martin, I.V.S. Mullis, & A.M. Kennedy (Eds.), PIRLS 2001 technical report. Chestnut Hill, MA: Boston College.
[302] appendix a: overview of pirls procedures
Scale anchoring is a way of describing students’ performance at different pointson a scale, in terms of the kind of reading they can do and the level of com-prehension they exhibit. It involves a statistical component, in which itemsthat discriminate between successive points on the scale are identified, and ajudgmental component in which subject matter experts examine the items andgeneralize to students’ knowledge and understandings.18 In PIRLS, the ReadingDevelopment Group (RDG) worked with the Reading Coordinator and PIRLSstaff to describe student reading at the international benchmarks.
18 The scale-anchoring procedure is described fully in Gonzalez, E.J., & Kennedy, A.M. (2003). Statistical analysis and reporting of the PIRLS data.In M.O. Martin, I.V.S. Mullis, & A.M. Kennedy (Eds.), PIRLS 2001 technical report. Chestnut Hill, MA: Boston College. An application of theprocedure to the 1995 TIMSS data may be found in Kelly, D.L., Mullis, I.V.S., & Martin, M.O. (2000). Profiles of student achievement in math-ematics at the TIMSS international benchmarks: U.S. performance and standards in an international context. Chestnut Hill, MA: BostonCollege.
[303]appendix a: overview of pirls procedures

B

[305]
Appendix BPercentiles and StandardDeviations of ReadingAchievement
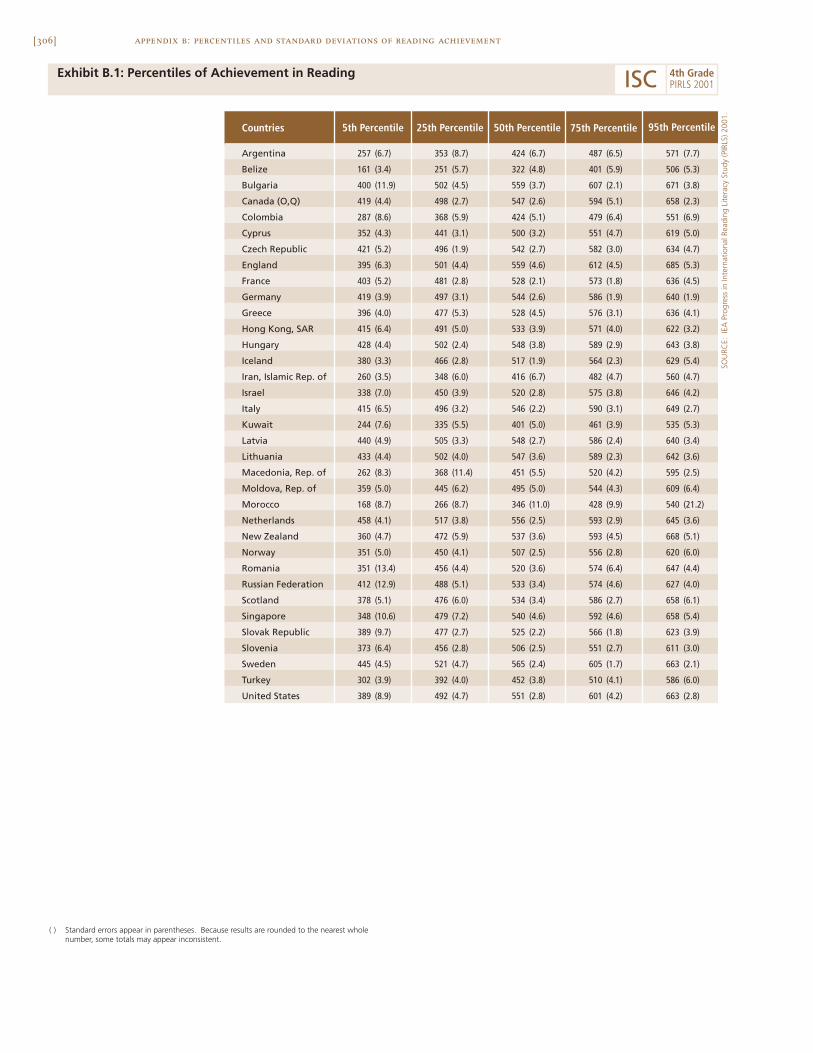
[306] appendix b: percentiles and standard deviations of reading achievement
Exhibit B.1: Percentiles of Achievement in Reading
Countries
Argentina 257 (6.7) 353 (8.7) 424 (6.7) 487 (6.5) 571 (7.7)
Belize 161 (3.4) 251 (5.7) 322 (4.8) 401 (5.9) 506 (5.3)
Bulgaria 400 (11.9) 502 (4.5) 559 (3.7) 607 (2.1) 671 (3.8)
Canada (O,Q) 419 (4.4) 498 (2.7) 547 (2.6) 594 (5.1) 658 (2.3)
Colombia 287 (8.6) 368 (5.9) 424 (5.1) 479 (6.4) 551 (6.9)
Cyprus 352 (4.3) 441 (3.1) 500 (3.2) 551 (4.7) 619 (5.0)
Czech Republic 421 (5.2) 496 (1.9) 542 (2.7) 582 (3.0) 634 (4.7)
England 395 (6.3) 501 (4.4) 559 (4.6) 612 (4.5) 685 (5.3)
France 403 (5.2) 481 (2.8) 528 (2.1) 573 (1.8) 636 (4.5)
Germany 419 (3.9) 497 (3.1) 544 (2.6) 586 (1.9) 640 (1.9)
Greece 396 (4.0) 477 (5.3) 528 (4.5) 576 (3.1) 636 (4.1)
Hong Kong, SAR 415 (6.4) 491 (5.0) 533 (3.9) 571 (4.0) 622 (3.2)
Hungary 428 (4.4) 502 (2.4) 548 (3.8) 589 (2.9) 643 (3.8)
Iceland 380 (3.3) 466 (2.8) 517 (1.9) 564 (2.3) 629 (5.4)
Iran, Islamic Rep. of 260 (3.5) 348 (6.0) 416 (6.7) 482 (4.7) 560 (4.7)
Israel 338 (7.0) 450 (3.9) 520 (2.8) 575 (3.8) 646 (4.2)
Italy 415 (6.5) 496 (3.2) 546 (2.2) 590 (3.1) 649 (2.7)
Kuwait 244 (7.6) 335 (5.5) 401 (5.0) 461 (3.9) 535 (5.3)
Latvia 440 (4.9) 505 (3.3) 548 (2.7) 586 (2.4) 640 (3.4)
Lithuania 433 (4.4) 502 (4.0) 547 (3.6) 589 (2.3) 642 (3.6)
Macedonia, Rep. of 262 (8.3) 368 (11.4) 451 (5.5) 520 (4.2) 595 (2.5)
Moldova, Rep. of 359 (5.0) 445 (6.2) 495 (5.0) 544 (4.3) 609 (6.4)
Morocco 168 (8.7) 266 (8.7) 346 (11.0) 428 (9.9) 540 (21.2)
Netherlands 458 (4.1) 517 (3.8) 556 (2.5) 593 (2.9) 645 (3.6)
New Zealand 360 (4.7) 472 (5.9) 537 (3.6) 593 (4.5) 668 (5.1)
Norway 351 (5.0) 450 (4.1) 507 (2.5) 556 (2.8) 620 (6.0)
Romania 351 (13.4) 456 (4.4) 520 (3.6) 574 (6.4) 647 (4.4)
Russian Federation 412 (12.9) 488 (5.1) 533 (3.4) 574 (4.6) 627 (4.0)
Scotland 378 (5.1) 476 (6.0) 534 (3.4) 586 (2.7) 658 (6.1)
Singapore 348 (10.6) 479 (7.2) 540 (4.6) 592 (4.6) 658 (5.4)
Slovak Republic 389 (9.7) 477 (2.7) 525 (2.2) 566 (1.8) 623 (3.9)
Slovenia 373 (6.4) 456 (2.8) 506 (2.5) 551 (2.7) 611 (3.0)
Sweden 445 (4.5) 521 (4.7) 565 (2.4) 605 (1.7) 663 (2.1)
Turkey 302 (3.9) 392 (4.0) 452 (3.8) 510 (4.1) 586 (6.0)
United States 389 (8.9) 492 (4.7) 551 (2.8) 601 (4.2) 663 (2.8)
95th Percentile5th Percentile 25th Percentile 50th Percentile 75th Percentile
( ) Standard errors appear in parentheses. Because results are rounded to the nearest wholenumber, some totals may appear inconsistent.
SOU
RCE:
IEA
Pro
gres
s in
Inte
rnat
iona
l Rea
ding
Lite
racy
Stu
dy (P
IRLS
) 200
1.
ISC 4th GradePIRLS 2001
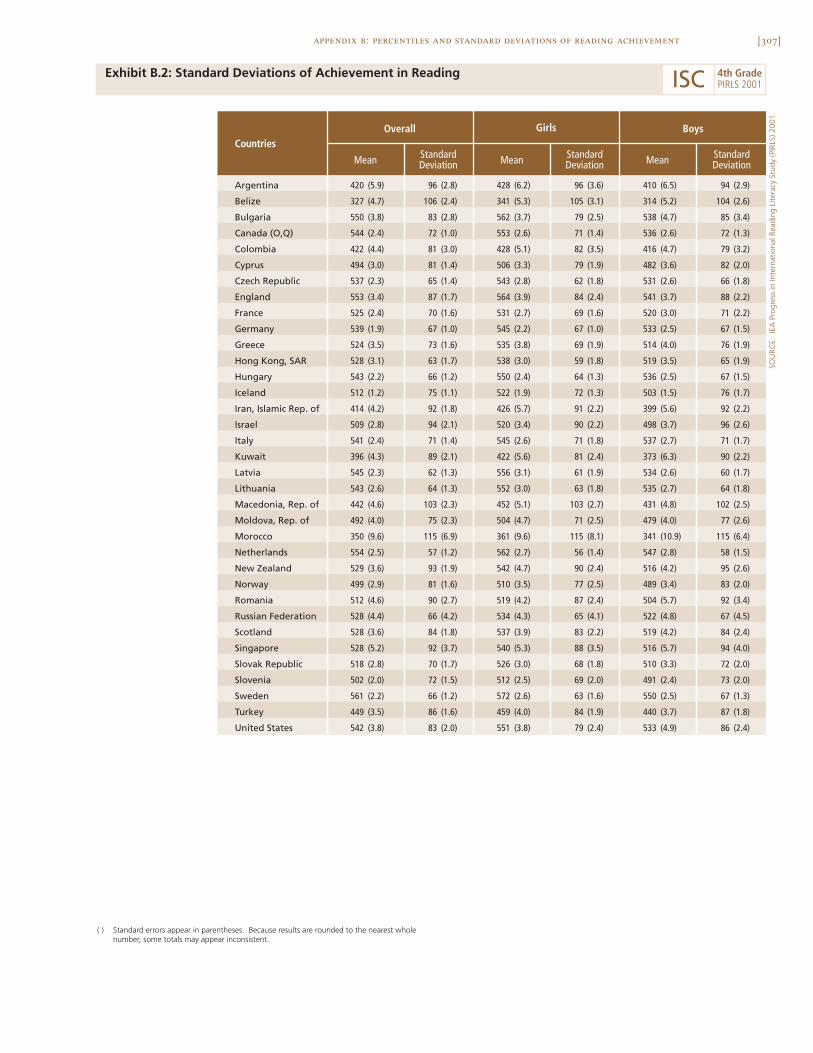
[307]appendix b: percentiles and standard deviations of reading achievement
Exhibit B.2: Standard Deviations of Achievement in Reading
SOU
RCE:
IEA
Pro
gres
s in
Inte
rnat
iona
l Rea
ding
Lite
racy
Stu
dy (P
IRLS
) 200
1.
Argentina 420 (5.9) 96 (2.8) 428 (6.2) 96 (3.6) 410 (6.5) 94 (2.9)
Belize 327 (4.7) 106 (2.4) 341 (5.3) 105 (3.1) 314 (5.2) 104 (2.6)
Bulgaria 550 (3.8) 83 (2.8) 562 (3.7) 79 (2.5) 538 (4.7) 85 (3.4)
Canada (O,Q) 544 (2.4) 72 (1.0) 553 (2.6) 71 (1.4) 536 (2.6) 72 (1.3)
Colombia 422 (4.4) 81 (3.0) 428 (5.1) 82 (3.5) 416 (4.7) 79 (3.2)
Cyprus 494 (3.0) 81 (1.4) 506 (3.3) 79 (1.9) 482 (3.6) 82 (2.0)
Czech Republic 537 (2.3) 65 (1.4) 543 (2.8) 62 (1.8) 531 (2.6) 66 (1.8)
England 553 (3.4) 87 (1.7) 564 (3.9) 84 (2.4) 541 (3.7) 88 (2.2)
France 525 (2.4) 70 (1.6) 531 (2.7) 69 (1.6) 520 (3.0) 71 (2.2)
Germany 539 (1.9) 67 (1.0) 545 (2.2) 67 (1.0) 533 (2.5) 67 (1.5)
Greece 524 (3.5) 73 (1.6) 535 (3.8) 69 (1.9) 514 (4.0) 76 (1.9)
Hong Kong, SAR 528 (3.1) 63 (1.7) 538 (3.0) 59 (1.8) 519 (3.5) 65 (1.9)
Hungary 543 (2.2) 66 (1.2) 550 (2.4) 64 (1.3) 536 (2.5) 67 (1.5)
Iceland 512 (1.2) 75 (1.1) 522 (1.9) 72 (1.3) 503 (1.5) 76 (1.7)
Iran, Islamic Rep. of 414 (4.2) 92 (1.8) 426 (5.7) 91 (2.2) 399 (5.6) 92 (2.2)
Israel 509 (2.8) 94 (2.1) 520 (3.4) 90 (2.2) 498 (3.7) 96 (2.6)
Italy 541 (2.4) 71 (1.4) 545 (2.6) 71 (1.8) 537 (2.7) 71 (1.7)
Kuwait 396 (4.3) 89 (2.1) 422 (5.6) 81 (2.4) 373 (6.3) 90 (2.2)
Latvia 545 (2.3) 62 (1.3) 556 (3.1) 61 (1.9) 534 (2.6) 60 (1.7)
Lithuania 543 (2.6) 64 (1.3) 552 (3.0) 63 (1.8) 535 (2.7) 64 (1.8)
Macedonia, Rep. of 442 (4.6) 103 (2.3) 452 (5.1) 103 (2.7) 431 (4.8) 102 (2.5)
Moldova, Rep. of 492 (4.0) 75 (2.3) 504 (4.7) 71 (2.5) 479 (4.0) 77 (2.6)
Morocco 350 (9.6) 115 (6.9) 361 (9.6) 115 (8.1) 341 (10.9) 115 (6.4)
Netherlands 554 (2.5) 57 (1.2) 562 (2.7) 56 (1.4) 547 (2.8) 58 (1.5)
New Zealand 529 (3.6) 93 (1.9) 542 (4.7) 90 (2.4) 516 (4.2) 95 (2.6)
Norway 499 (2.9) 81 (1.6) 510 (3.5) 77 (2.5) 489 (3.4) 83 (2.0)
Romania 512 (4.6) 90 (2.7) 519 (4.2) 87 (2.4) 504 (5.7) 92 (3.4)
Russian Federation 528 (4.4) 66 (4.2) 534 (4.3) 65 (4.1) 522 (4.8) 67 (4.5)
Scotland 528 (3.6) 84 (1.8) 537 (3.9) 83 (2.2) 519 (4.2) 84 (2.4)
Singapore 528 (5.2) 92 (3.7) 540 (5.3) 88 (3.5) 516 (5.7) 94 (4.0)
Slovak Republic 518 (2.8) 70 (1.7) 526 (3.0) 68 (1.8) 510 (3.3) 72 (2.0)
Slovenia 502 (2.0) 72 (1.5) 512 (2.5) 69 (2.0) 491 (2.4) 73 (2.0)
Sweden 561 (2.2) 66 (1.2) 572 (2.6) 63 (1.6) 550 (2.5) 67 (1.3)
Turkey 449 (3.5) 86 (1.6) 459 (4.0) 84 (1.9) 440 (3.7) 87 (1.8)
United States 542 (3.8) 83 (2.0) 551 (3.8) 79 (2.4) 533 (4.9) 86 (2.4)
Girls Boys
Mean
CountriesOverall
StandardDeviation Mean Standard
Deviation Mean StandardDeviation
( ) Standard errors appear in parentheses. Because results are rounded to the nearest wholenumber, some totals may appear inconsistent.
ISC 4th GradePIRLS 2001

[308] appendix b: percentiles and standard deviations of reading achievement
Exhibit B.3: Percentiles of Achievement in Literary Reading
Countries
Argentina 255 (5.9) 352 (8.5) 422 (7.7) 488 (6.9) 576 (8.6)
Belize 168 (7.3) 255 (6.2) 324 (5.1) 401 (5.8) 508 (12.9)
Bulgaria 394 (8.3) 497 (5.1) 557 (5.0) 609 (4.2) 678 (5.2)
Canada (O,Q) 415 (4.0) 496 (2.9) 547 (3.1) 595 (2.8) 664 (4.2)
Colombia 296 (6.6) 371 (5.7) 426 (5.1) 480 (5.9) 553 (6.0)
Cyprus 359 (5.8) 446 (2.2) 503 (2.6) 555 (3.4) 622 (4.2)
Czech Republic 423 (8.9) 496 (2.2) 539 (2.9) 579 (3.2) 632 (3.8)
England 391 (9.9) 502 (5.3) 565 (3.7) 623 (3.5) 705 (5.1)
France 396 (7.8) 473 (5.4) 521 (2.2) 566 (2.7) 631 (3.2)
Germany 418 (3.4) 494 (3.4) 541 (2.2) 583 (2.1) 637 (2.0)
Greece 397 (5.8) 481 (5.2) 531 (4.5) 579 (4.3) 643 (7.4)
Hong Kong, SAR 401 (7.0) 477 (4.3) 521 (3.5) 563 (2.4) 618 (4.2)
Hungary 436 (3.6) 508 (3.3) 552 (3.7) 594 (2.9) 649 (3.4)
Iceland 399 (2.4) 477 (2.4) 524 (2.1) 568 (1.3) 627 (4.7)
Iran, Islamic Rep. of 268 (6.1) 358 (6.9) 423 (5.5) 488 (6.1) 564 (5.4)
Israel 336 (8.1) 452 (5.4) 521 (3.3) 577 (3.2) 648 (7.3)
Italy 407 (8.1) 495 (3.3) 547 (2.1) 597 (4.3) 660 (3.0)
Kuwait 250 (6.2) 335 (4.4) 397 (4.4) 455 (4.2) 528 (5.9)
Latvia 436 (7.3) 499 (3.0) 539 (2.6) 578 (3.7) 631 (4.0)
Lithuania 428 (7.8) 502 (5.5) 550 (3.0) 592 (2.3) 650 (3.9)
Macedonia, Rep. of 271 (7.8) 372 (6.8) 449 (5.8) 515 (3.0) 588 (2.9)
Moldova, Rep. of 357 (5.9) 433 (3.3) 482 (3.5) 529 (5.1) 593 (5.8)
Morocco 181 (6.1) 271 (8.4) 345 (7.4) 419 (10.1) 524 (16.6)
Netherlands 453 (6.7) 516 (2.9) 553 (2.4) 592 (2.5) 645 (3.0)
New Zealand 357 (12.6) 471 (6.4) 540 (5.0) 598 (4.4) 676 (4.4)
Norway 350 (6.9) 455 (4.8) 513 (3.4) 565 (2.7) 631 (3.5)
Romania 355 (6.8) 456 (6.6) 517 (6.0) 574 (5.5) 649 (10.0)
Russian Federation 408 (8.3) 481 (4.4) 528 (3.2) 570 (2.7) 626 (3.5)
Scotland 373 (12.5) 474 (4.2) 533 (3.1) 589 (3.8) 668 (5.9)
Singapore 340 (14.7) 474 (6.8) 540 (5.1) 596 (5.2) 668 (4.9)
Slovak Republic 387 (7.7) 472 (2.9) 518 (3.5) 559 (2.4) 613 (4.3)
Slovenia 379 (3.2) 457 (4.1) 504 (2.1) 546 (1.5) 603 (5.0)
Sweden 445 (9.3) 520 (2.6) 564 (2.7) 603 (1.9) 659 (4.0)
Turkey 300 (5.8) 391 (5.1) 452 (4.4) 509 (3.8) 583 (4.0)
United States 391 (6.8) 496 (5.1) 557 (6.0) 613 (3.0) 681 (3.5)
95th Percentile5th Percentile 25th Percentile 50th Percentile 75th Percentile
( ) Standard errors appear in parentheses. Because results are rounded to the nearest wholenumber, some totals may appear inconsistent.
SOU
RCE:
IEA
Pro
gres
s in
Inte
rnat
iona
l Rea
ding
Lite
racy
Stu
dy (P
IRLS
) 200
1.
ISC 4th GradePIRLS 2001

[309]appendix b: percentiles and standard deviations of reading achievement
Exhibit B.4: Standard Deviations of Achievement in Literary Reading
SOU
RCE:
IEA
Pro
gres
s in
Inte
rnat
iona
l Rea
ding
Lite
racy
Stu
dy (P
IRLS
) 200
1.
Argentina 419 (5.8) 97 (2.9) 429 (6.2) 97 (3.2) 408 (6.2) 97 (3.1)
Belize 330 (4.9) 103 (3.0) 340 (5.3) 103 (3.8) 320 (5.6) 101 (2.8)
Bulgaria 550 (3.9) 86 (2.8) 563 (4.2) 83 (2.6) 535 (5.1) 88 (3.5)
Canada (O,Q) 545 (2.6) 75 (1.2) 554 (3.0) 74 (1.5) 535 (2.7) 74 (1.5)
Colombia 425 (4.2) 79 (2.8) 431 (4.9) 81 (3.2) 419 (4.8) 76 (3.0)
Cyprus 498 (2.5) 80 (1.1) 512 (2.9) 78 (2.1) 485 (3.3) 79 (1.7)
Czech Republic 535 (2.3) 63 (1.2) 543 (2.7) 61 (1.6) 528 (2.7) 65 (1.7)
England 559 (3.9) 94 (1.8) 574 (4.9) 91 (2.3) 544 (4.0) 94 (2.1)
France 518 (2.6) 71 (1.7) 524 (2.9) 69 (2.2) 513 (3.2) 73 (2.2)
Germany 537 (1.9) 66 (1.1) 544 (2.1) 66 (1.2) 529 (2.4) 66 (1.5)
Greece 528 (3.3) 74 (1.2) 539 (3.8) 70 (1.8) 516 (3.7) 76 (1.9)
Hong Kong, SAR 518 (3.1) 66 (1.8) 528 (3.4) 63 (1.9) 507 (3.4) 67 (2.1)
Hungary 548 (2.0) 65 (1.1) 558 (2.1) 62 (1.1) 538 (2.6) 66 (1.6)
Iceland 520 (1.3) 69 (0.9) 531 (1.9) 65 (1.4) 509 (1.7) 71 (1.3)
Iran, Islamic Rep. of 421 (4.5) 91 (2.0) 433 (5.7) 89 (2.0) 406 (6.4) 90 (2.6)
Israel 510 (2.6) 95 (2.0) 521 (3.3) 92 (2.0) 498 (3.2) 96 (2.7)
Italy 543 (2.7) 76 (1.3) 549 (2.7) 76 (1.7) 538 (3.3) 75 (1.6)
Kuwait 394 (3.8) 85 (1.8) 416 (5.2) 79 (1.9) 373 (5.4) 85 (2.1)
Latvia 537 (2.2) 59 (1.4) 548 (2.8) 58 (1.8) 527 (2.2) 58 (1.6)
Lithuania 546 (3.1) 68 (1.6) 554 (3.4) 66 (1.8) 536 (3.7) 69 (2.2)
Macedonia, Rep. of 441 (4.5) 97 (2.2) 453 (4.6) 96 (2.8) 430 (4.9) 97 (2.6)
Moldova, Rep. of 480 (3.7) 72 (2.0) 492 (4.3) 68 (2.4) 468 (3.6) 73 (2.3)
Morocco 347 (8.4) 106 (5.2) 358 (8.5) 105 (5.6) 340 (9.1) 105 (5.5)
Netherlands 552 (2.5) 58 (1.4) 561 (2.8) 57 (1.4) 544 (3.2) 58 (1.6)
New Zealand 531 (3.9) 96 (2.3) 546 (4.7) 92 (3.1) 517 (4.6) 98 (2.7)
Norway 506 (2.7) 84 (1.4) 519 (3.4) 80 (2.0) 494 (3.1) 86 (1.9)
Romania 512 (4.7) 88 (2.3) 518 (4.2) 86 (2.2) 505 (6.1) 91 (3.1)
Russian Federation 523 (3.9) 68 (3.4) 531 (3.9) 66 (3.2) 517 (4.3) 68 (3.8)
Scotland 529 (3.5) 88 (2.1) 538 (4.0) 88 (2.5) 519 (4.1) 87 (2.5)
Singapore 528 (5.6) 98 (4.1) 541 (5.7) 93 (4.1) 516 (6.0) 100 (4.4)
Slovak Republic 512 (2.6) 68 (1.7) 519 (2.9) 67 (2.1) 505 (2.9) 69 (2.0)
Slovenia 499 (1.8) 68 (1.3) 509 (2.4) 66 (2.0) 490 (2.4) 69 (1.7)
Sweden 559 (2.4) 64 (1.4) 572 (2.9) 61 (1.8) 547 (2.6) 65 (1.6)
Turkey 448 (3.4) 86 (1.8) 460 (3.8) 84 (2.3) 437 (3.6) 88 (1.8)
United States 550 (3.8) 88 (1.8) 558 (4.2) 85 (2.2) 542 (4.6) 91 (1.9)
Girls Boys
Mean
CountriesOverall
StandardDeviation Mean Standard
Deviation Mean StandardDeviation
( ) Standard errors appear in parentheses. Because results are rounded to the nearest wholenumber, some totals may appear inconsistent.
ISC 4th GradePIRLS 2001
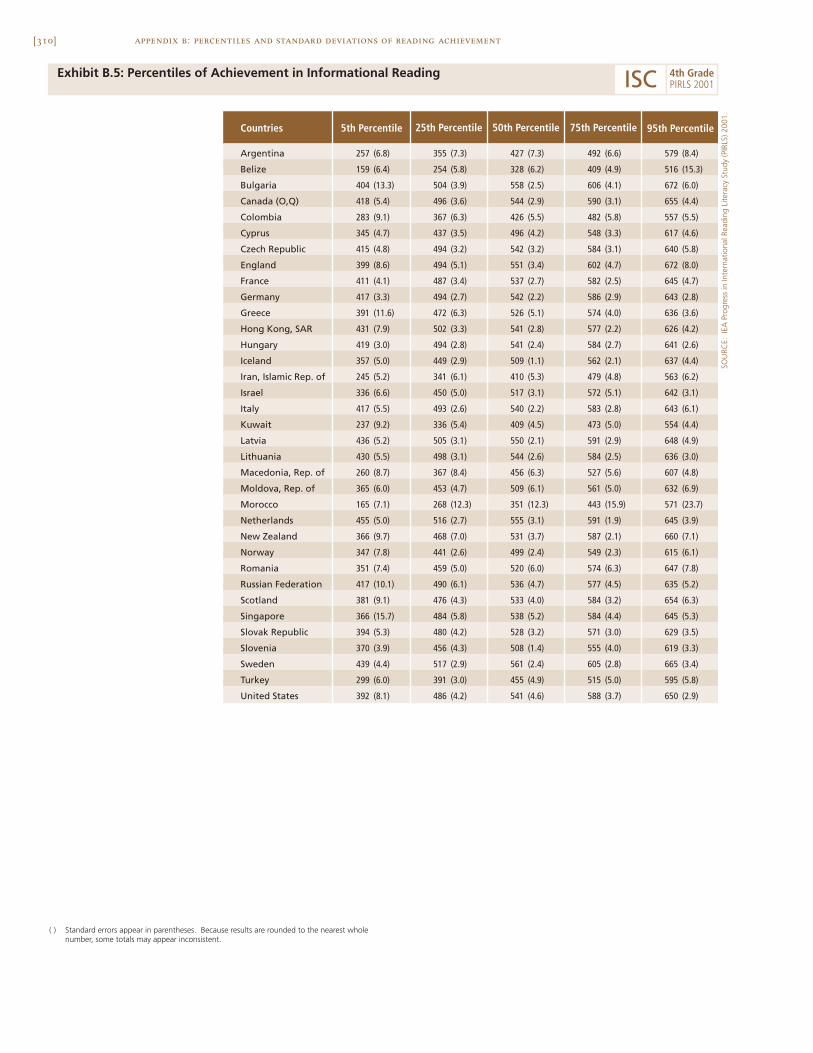
[310] appendix b: percentiles and standard deviations of reading achievement
Exhibit B.5: Percentiles of Achievement in Informational Reading
Countries
Argentina 257 (6.8) 355 (7.3) 427 (7.3) 492 (6.6) 579 (8.4)
Belize 159 (6.4) 254 (5.8) 328 (6.2) 409 (4.9) 516 (15.3)
Bulgaria 404 (13.3) 504 (3.9) 558 (2.5) 606 (4.1) 672 (6.0)
Canada (O,Q) 418 (5.4) 496 (3.6) 544 (2.9) 590 (3.1) 655 (4.4)
Colombia 283 (9.1) 367 (6.3) 426 (5.5) 482 (5.8) 557 (5.5)
Cyprus 345 (4.7) 437 (3.5) 496 (4.2) 548 (3.3) 617 (4.6)
Czech Republic 415 (4.8) 494 (3.2) 542 (3.2) 584 (3.1) 640 (5.8)
England 399 (8.6) 494 (5.1) 551 (3.4) 602 (4.7) 672 (8.0)
France 411 (4.1) 487 (3.4) 537 (2.7) 582 (2.5) 645 (4.7)
Germany 417 (3.3) 494 (2.7) 542 (2.2) 586 (2.9) 643 (2.8)
Greece 391 (11.6) 472 (6.3) 526 (5.1) 574 (4.0) 636 (3.6)
Hong Kong, SAR 431 (7.9) 502 (3.3) 541 (2.8) 577 (2.2) 626 (4.2)
Hungary 419 (3.0) 494 (2.8) 541 (2.4) 584 (2.7) 641 (2.6)
Iceland 357 (5.0) 449 (2.9) 509 (1.1) 562 (2.1) 637 (4.4)
Iran, Islamic Rep. of 245 (5.2) 341 (6.1) 410 (5.3) 479 (4.8) 563 (6.2)
Israel 336 (6.6) 450 (5.0) 517 (3.1) 572 (5.1) 642 (3.1)
Italy 417 (5.5) 493 (2.6) 540 (2.2) 583 (2.8) 643 (6.1)
Kuwait 237 (9.2) 336 (5.4) 409 (4.5) 473 (5.0) 554 (4.4)
Latvia 436 (5.2) 505 (3.1) 550 (2.1) 591 (2.9) 648 (4.9)
Lithuania 430 (5.5) 498 (3.1) 544 (2.6) 584 (2.5) 636 (3.0)
Macedonia, Rep. of 260 (8.7) 367 (8.4) 456 (6.3) 527 (5.6) 607 (4.8)
Moldova, Rep. of 365 (6.0) 453 (4.7) 509 (6.1) 561 (5.0) 632 (6.9)
Morocco 165 (7.1) 268 (12.3) 351 (12.3) 443 (15.9) 571 (23.7)
Netherlands 455 (5.0) 516 (2.7) 555 (3.1) 591 (1.9) 645 (3.9)
New Zealand 366 (9.7) 468 (7.0) 531 (3.7) 587 (2.1) 660 (7.1)
Norway 347 (7.8) 441 (2.6) 499 (2.4) 549 (2.3) 615 (6.1)
Romania 351 (7.4) 459 (5.0) 520 (6.0) 574 (6.3) 647 (7.8)
Russian Federation 417 (10.1) 490 (6.1) 536 (4.7) 577 (4.5) 635 (5.2)
Scotland 381 (9.1) 476 (4.3) 533 (4.0) 584 (3.2) 654 (6.3)
Singapore 366 (15.7) 484 (5.8) 538 (5.2) 584 (4.4) 645 (5.3)
Slovak Republic 394 (5.3) 480 (4.2) 528 (3.2) 571 (3.0) 629 (3.5)
Slovenia 370 (3.9) 456 (4.3) 508 (1.4) 555 (4.0) 619 (3.3)
Sweden 439 (4.4) 517 (2.9) 561 (2.4) 605 (2.8) 665 (3.4)
Turkey 299 (6.0) 391 (3.0) 455 (4.9) 515 (5.0) 595 (5.8)
United States 392 (8.1) 486 (4.2) 541 (4.6) 588 (3.7) 650 (2.9)
5th Percentile 25th Percentile 50th Percentile 75th Percentile 95th Percentile
( ) Standard errors appear in parentheses. Because results are rounded to the nearest wholenumber, some totals may appear inconsistent.
SOU
RCE:
IEA
Pro
gres
s in
Inte
rnat
iona
l Rea
ding
Lite
racy
Stu
dy (P
IRLS
) 200
1.
ISC 4th GradePIRLS 2001
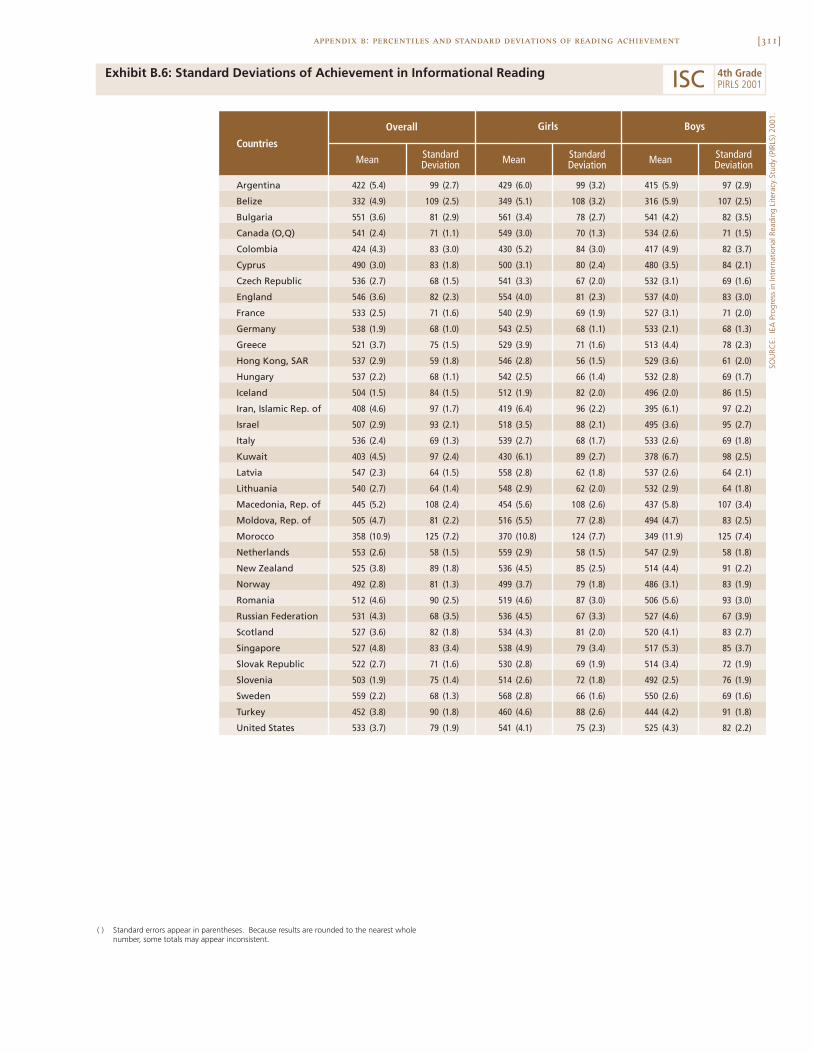
[311]appendix b: percentiles and standard deviations of reading achievement
Exhibit B.6: Standard Deviations of Achievement in Informational Reading
SOU
RCE:
IEA
Pro
gres
s in
Inte
rnat
iona
l Rea
ding
Lite
racy
Stu
dy (P
IRLS
) 200
1.
Argentina 422 (5.4) 99 (2.7) 429 (6.0) 99 (3.2) 415 (5.9) 97 (2.9)
Belize 332 (4.9) 109 (2.5) 349 (5.1) 108 (3.2) 316 (5.9) 107 (2.5)
Bulgaria 551 (3.6) 81 (2.9) 561 (3.4) 78 (2.7) 541 (4.2) 82 (3.5)
Canada (O,Q) 541 (2.4) 71 (1.1) 549 (3.0) 70 (1.3) 534 (2.6) 71 (1.5)
Colombia 424 (4.3) 83 (3.0) 430 (5.2) 84 (3.0) 417 (4.9) 82 (3.7)
Cyprus 490 (3.0) 83 (1.8) 500 (3.1) 80 (2.4) 480 (3.5) 84 (2.1)
Czech Republic 536 (2.7) 68 (1.5) 541 (3.3) 67 (2.0) 532 (3.1) 69 (1.6)
England 546 (3.6) 82 (2.3) 554 (4.0) 81 (2.3) 537 (4.0) 83 (3.0)
France 533 (2.5) 71 (1.6) 540 (2.9) 69 (1.9) 527 (3.1) 71 (2.0)
Germany 538 (1.9) 68 (1.0) 543 (2.5) 68 (1.1) 533 (2.1) 68 (1.3)
Greece 521 (3.7) 75 (1.5) 529 (3.9) 71 (1.6) 513 (4.4) 78 (2.3)
Hong Kong, SAR 537 (2.9) 59 (1.8) 546 (2.8) 56 (1.5) 529 (3.6) 61 (2.0)
Hungary 537 (2.2) 68 (1.1) 542 (2.5) 66 (1.4) 532 (2.8) 69 (1.7)
Iceland 504 (1.5) 84 (1.5) 512 (1.9) 82 (2.0) 496 (2.0) 86 (1.5)
Iran, Islamic Rep. of 408 (4.6) 97 (1.7) 419 (6.4) 96 (2.2) 395 (6.1) 97 (2.2)
Israel 507 (2.9) 93 (2.1) 518 (3.5) 88 (2.1) 495 (3.6) 95 (2.7)
Italy 536 (2.4) 69 (1.3) 539 (2.7) 68 (1.7) 533 (2.6) 69 (1.8)
Kuwait 403 (4.5) 97 (2.4) 430 (6.1) 89 (2.7) 378 (6.7) 98 (2.5)
Latvia 547 (2.3) 64 (1.5) 558 (2.8) 62 (1.8) 537 (2.6) 64 (2.1)
Lithuania 540 (2.7) 64 (1.4) 548 (2.9) 62 (2.0) 532 (2.9) 64 (1.8)
Macedonia, Rep. of 445 (5.2) 108 (2.4) 454 (5.6) 108 (2.6) 437 (5.8) 107 (3.4)
Moldova, Rep. of 505 (4.7) 81 (2.2) 516 (5.5) 77 (2.8) 494 (4.7) 83 (2.5)
Morocco 358 (10.9) 125 (7.2) 370 (10.8) 124 (7.7) 349 (11.9) 125 (7.4)
Netherlands 553 (2.6) 58 (1.5) 559 (2.9) 58 (1.5) 547 (2.9) 58 (1.8)
New Zealand 525 (3.8) 89 (1.8) 536 (4.5) 85 (2.5) 514 (4.4) 91 (2.2)
Norway 492 (2.8) 81 (1.3) 499 (3.7) 79 (1.8) 486 (3.1) 83 (1.9)
Romania 512 (4.6) 90 (2.5) 519 (4.6) 87 (3.0) 506 (5.6) 93 (3.0)
Russian Federation 531 (4.3) 68 (3.5) 536 (4.5) 67 (3.3) 527 (4.6) 67 (3.9)
Scotland 527 (3.6) 82 (1.8) 534 (4.3) 81 (2.0) 520 (4.1) 83 (2.7)
Singapore 527 (4.8) 83 (3.4) 538 (4.9) 79 (3.4) 517 (5.3) 85 (3.7)
Slovak Republic 522 (2.7) 71 (1.6) 530 (2.8) 69 (1.9) 514 (3.4) 72 (1.9)
Slovenia 503 (1.9) 75 (1.4) 514 (2.6) 72 (1.8) 492 (2.5) 76 (1.9)
Sweden 559 (2.2) 68 (1.3) 568 (2.8) 66 (1.6) 550 (2.6) 69 (1.6)
Turkey 452 (3.8) 90 (1.8) 460 (4.6) 88 (2.6) 444 (4.2) 91 (1.8)
United States 533 (3.7) 79 (1.9) 541 (4.1) 75 (2.3) 525 (4.3) 82 (2.2)
Girls Boys
Mean
Countries
Overall
StandardDeviation Mean Standard
Deviation Mean StandardDeviation
( ) Standard errors appear in parentheses. Because results are rounded to the nearest wholenumber, some totals may appear inconsistent.
ISC 4th GradePIRLS 2001

C

[313]
Appendix CSample Passages, Questions,and Scoring Guides
Reading for Literary Experience
The Upside-Down Mice
Hare Heralds an Earthquake
Reading to Acquire and Use Information
Nights of the Pufflings
River Trail
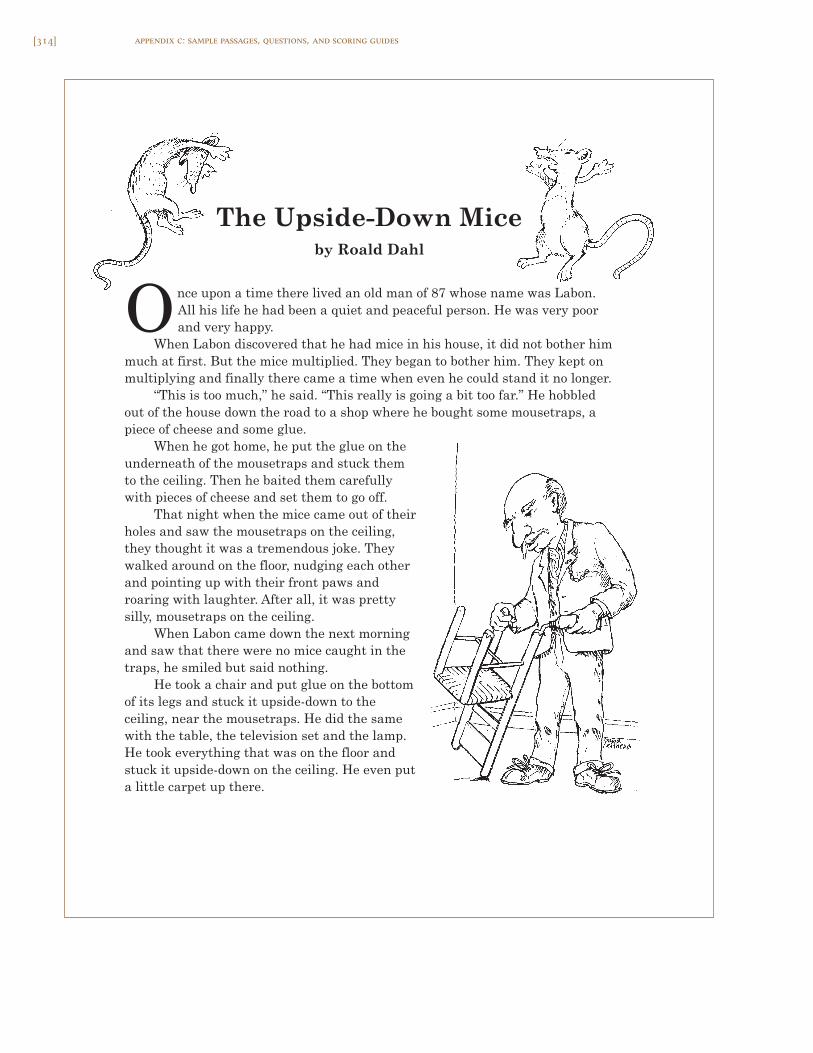
[314]
Upside Down Mice 3
The Upside-Down Miceby Roald Dahl
Once upon a time there lived an old man of 87 whose name was Labon.
All his life he had been a quiet and peaceful person. He was very poor
and very happy.
When Labon discovered that he had mice in his house, it did not bother him
much at first. But the mice multiplied. They began to bother him. They kept on
multiplying and finally there came a time when even he could stand it no longer.
“This is too much,” he said. “This really is going a bit too far.” He hobbled
out of the house down the road to a shop where he bought some mousetraps, a
piece of cheese and some glue.
When he got home, he put the glue on the
underneath of the mousetraps and stuck them
to the ceiling. Then he baited them carefully
with pieces of cheese and set them to go off.
That night when the mice came out of their
holes and saw the mousetraps on the ceiling,
they thought it was a tremendous joke. They
walked around on the floor, nudging each other
and pointing up with their front paws and
roaring with laughter. After all, it was pretty
silly, mousetraps on the ceiling.
When Labon came down the next morning
and saw that there were no mice caught in the
traps, he smiled but said nothing.
He took a chair and put glue on the bottom
of its legs and stuck it upside-down to the
ceiling, near the mousetraps. He did the same
with the table, the television set and the lamp.
He took everything that was on the floor and
stuck it upside-down on the ceiling. He even put
a little carpet up there.
appendix c: sample passages, questions, and scoring guides
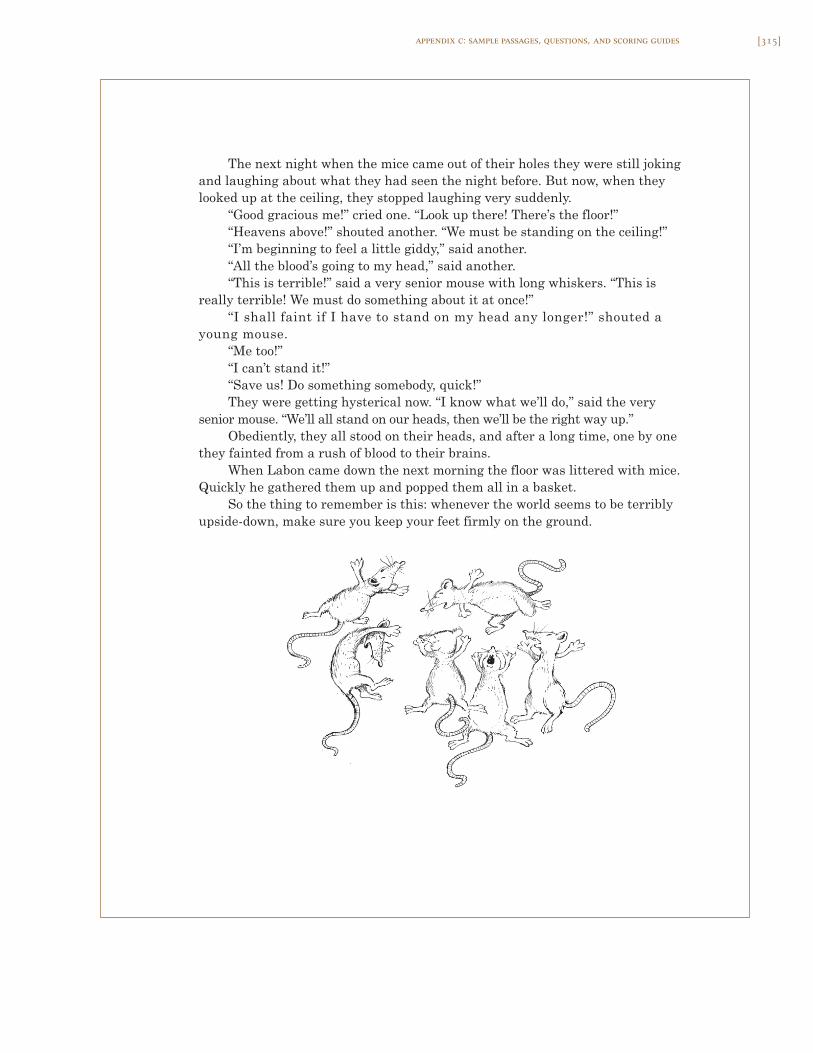
[315]appendix c: sample passages, questions, and scoring guides
Upside Down Mice4
The next night when the mice came out of their holes they were still joking
and laughing about what they had seen the night before. But now, when they
looked up at the ceiling, they stopped laughing very suddenly.
“Good gracious me!” cried one. “Look up there! There’s the floor!”
“Heavens above!” shouted another. “We must be standing on the ceiling!”
“I’m beginning to feel a little giddy,” said another.
“All the blood’s going to my head,” said another.
“This is terrible!” said a very senior mouse with long whiskers. “This is
really terrible! We must do something about it at once!”
“I shall faint if I have to stand on my head any longer!” shouted a
young mouse.
“Me too!”
“I can’t stand it!”
“Save us! Do something somebody, quick!”
They were getting hysterical now. “I know what we’ll do,” said the very
senior mouse. “We’ll all stand on our heads, then we’ll be the right way up.”
Obediently, they all stood on their heads, and after a long time, one by one
they fainted from a rush of blood to their brains.
When Labon came down the next morning the floor was littered with mice.
Quickly he gathered them up and popped them all in a basket.
So the thing to remember is this: whenever the world seems to be terribly
upside-down, make sure you keep your feet firmly on the ground.

[316]
Upside Down Mice 5
Questions The Upside-Down Mice
2. Where did Labon put the mousetraps?
in a basket
near the mouse holes
under the chairs
on the ceiling
1. Why did Labon want to get rid of the mice?
He had always hated mice.
There were too many of them.
They laughed too loudly.
They ate all his cheese.
3. Why were the mice nudging each other and pointing up with their
paws when they came out of their holes on the first night?
They could see a chair on the ceiling.
They thought Labon had done something silly.
They wanted the cheese in the mousetraps.
They were afraid of what they saw.
appendix c: sample passages, questions, and scoring guides
*
*
*
* correct answer
Copyright
prote
cted by IE
A.
This ite
m m
ay not be use
d
for c
omm
ercial p
urpose
s
without e
xpress
permiss
ion from
IEA.

[317]appendix c: sample passages, questions, and scoring guides
Upside Down Mice6
4. Why did Labon smile when he saw there were no mice in the
traps?
5. What did Labon do after he stuck the chair to the ceiling?
smiled and said nothing
bought some mousetraps
stuck everything to the ceiling
gave the mice some cheese
6. On the second night, where did the mice think they were standing
and what did they decide to do about it?
Where the mice thought they were standing:
*
* correct answer
Copyright
prote
cted by IE
A.
This ite
m m
ay not be use
d
for c
omm
ercial p
urpose
s
without e
xpress
permiss
ion from
IEA.

[318]
Upside Down Mice 7
7. Find and copy one of the sentences that show the panic the mice
felt on the second night.
8. How does the story show you what the mice thought was
happening?
by telling you what Labon thought of the mice
by describing where the mice lived
by telling you what the mice said to one another
by describing what the mice were like
9. Why was the floor covered with mice when Labon came
down on the last morning?
The mice had stood on their heads for too long.
Labon had given the mice too much cheese.
The mice had fallen from the ceiling.
Labon had put glue on the floor.
appendix c: sample passages, questions, and scoring guides
*
*
* correct answer
Copyright
prote
cted by IE
A.
This ite
m m
ay not be use
d
for c
omm
ercial p
urpose
s
without e
xpress
permiss
ion from
IEA.

[319]appendix c: sample passages, questions, and scoring guides
Upside Down Mice8
11. Do you think the mice were easy to fool? Give one reason why or
why not.
10. Where did Labon put the mice when he picked them up from the
floor?
12. You learn what Labon is like from the things he does. Describe
what he is like and give two examples of what he does that show
this.
Copyright
prote
cted by IE
A.
This ite
m m
ay not be use
d
for c
omm
ercial p
urpose
s
without e
xpress
permiss
ion from
IEA.

[320]
Upside Down Mice 9
13. Which words best describe this story?
serious and sad
scary and exciting
funny and clever
thrilling and mysterious
14. Think about what Labon and the mice did in the story. Explain
what makes the story unbelievable.
StopEnd of this part of the booklet.
Please stop working.
appendix c: sample passages, questions, and scoring guides
*
* correct answer
Copyright
prote
cted by IE
A.
This ite
m m
ay not be use
d
for c
omm
ercial p
urpose
s
without e
xpress
permiss
ion from
IEA.
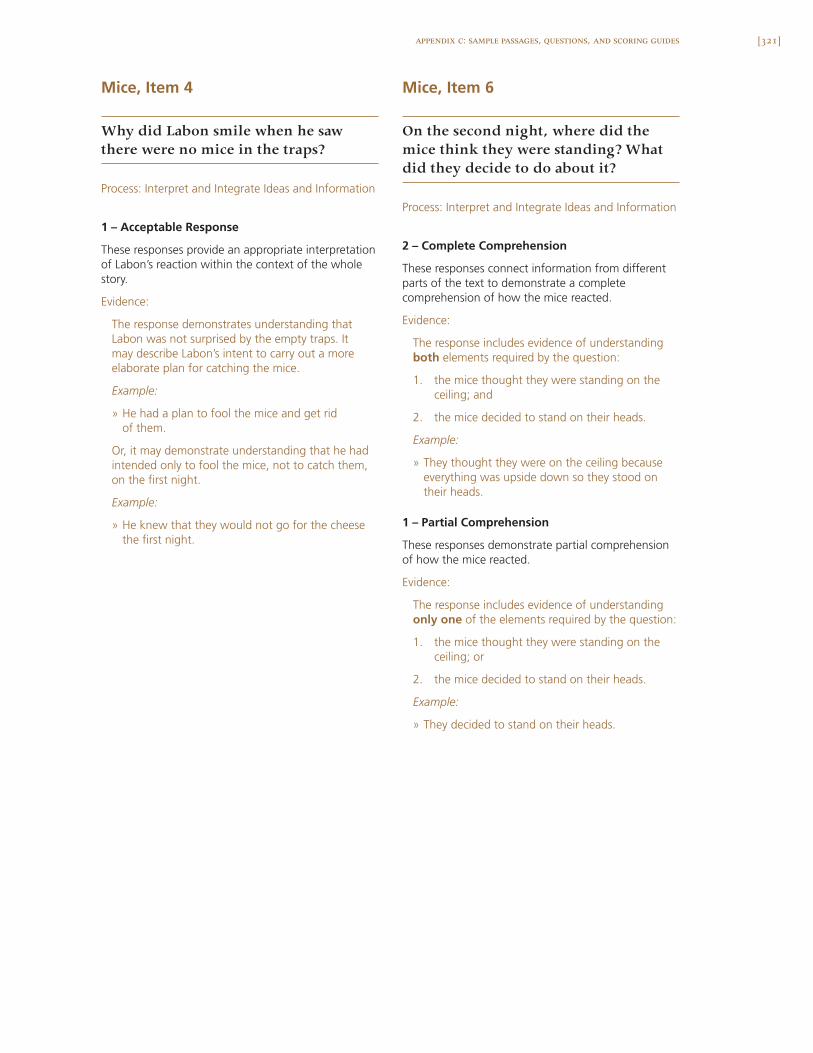
[321]appendix c: sample passages, questions, and scoring guides
Mice, Item 4
Why did Labon smile when he sawthere were no mice in the traps?
Process: Interpret and Integrate Ideas and Information
1 – Acceptable Response
These responses provide an appropriate interpretationof Labon’s reaction within the context of the wholestory.
Evidence:
The response demonstrates understanding thatLabon was not surprised by the empty traps. Itmay describe Labon’s intent to carry out a moreelaborate plan for catching the mice.
Example:
» He had a plan to fool the mice and get ridof them.
Or, it may demonstrate understanding that he hadintended only to fool the mice, not to catch them,on the first night.
Example:
» He knew that they would not go for the cheesethe first night.
Mice, Item 6
On the second night, where did themice think they were standing? Whatdid they decide to do about it?
Process: Interpret and Integrate Ideas and Information
2 – Complete Comprehension
These responses connect information from differentparts of the text to demonstrate a completecomprehension of how the mice reacted.
Evidence:
The response includes evidence of understandingboth elements required by the question:
1. the mice thought they were standing on theceiling; and
2. the mice decided to stand on their heads.
Example:
» They thought they were on the ceiling becauseeverything was upside down so they stood ontheir heads.
1 – Partial Comprehension
These responses demonstrate partial comprehensionof how the mice reacted.
Evidence:
The response includes evidence of understandingonly one of the elements required by the question:
1. the mice thought they were standing on theceiling; or
2. the mice decided to stand on their heads.
Example:
» They decided to stand on their heads.
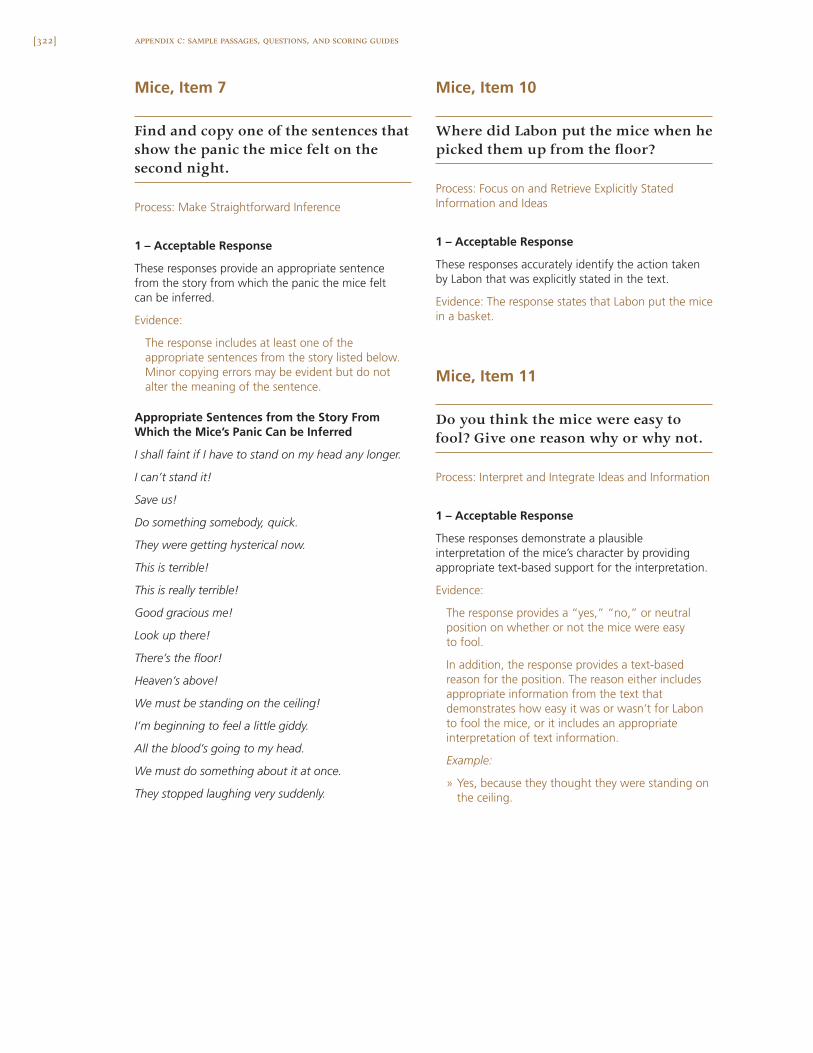
[322]
Mice, Item 7
Find and copy one of the sentences thatshow the panic the mice felt on thesecond night.
Process: Make Straightforward Inference
1 – Acceptable Response
These responses provide an appropriate sentencefrom the story from which the panic the mice feltcan be inferred.
Evidence:
The response includes at least one of theappropriate sentences from the story listed below.Minor copying errors may be evident but do notalter the meaning of the sentence.
Appropriate Sentences from the Story FromWhich the Mice’s Panic Can be Inferred
I shall faint if I have to stand on my head any longer.
I can’t stand it!
Save us!
Do something somebody, quick.
They were getting hysterical now.
This is terrible!
This is really terrible!
Good gracious me!
Look up there!
There’s the floor!
Heaven’s above!
We must be standing on the ceiling!
I’m beginning to feel a little giddy.
All the blood’s going to my head.
We must do something about it at once.
They stopped laughing very suddenly.
Mice, Item 10
Where did Labon put the mice when hepicked them up from the floor?
Process: Focus on and Retrieve Explicitly StatedInformation and Ideas
1 – Acceptable Response
These responses accurately identify the action takenby Labon that was explicitly stated in the text.
Evidence: The response states that Labon put the micein a basket.
Mice, Item 11
Do you think the mice were easy tofool? Give one reason why or why not.
Process: Interpret and Integrate Ideas and Information
1 – Acceptable Response
These responses demonstrate a plausibleinterpretation of the mice’s character by providingappropriate text-based support for the interpretation.
Evidence:
The response provides a “yes,” “no,” or neutralposition on whether or not the mice were easyto fool.
In addition, the response provides a text-basedreason for the position. The reason either includesappropriate information from the text thatdemonstrates how easy it was or wasn’t for Labonto fool the mice, or it includes an appropriateinterpretation of text information.
Example:
» Yes, because they thought they were standing onthe ceiling.
appendix c: sample passages, questions, and scoring guides
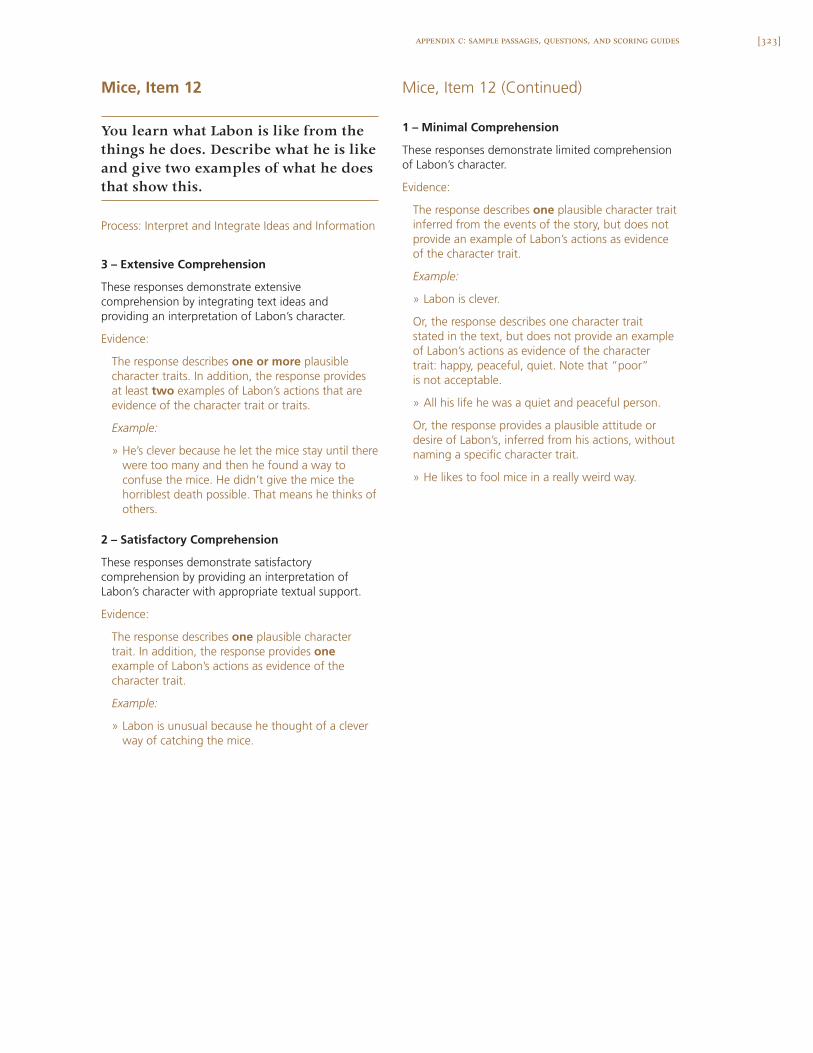
[323]appendix c: sample passages, questions, and scoring guides
Mice, Item 12
You learn what Labon is like from thethings he does. Describe what he is likeand give two examples of what he doesthat show this.
Process: Interpret and Integrate Ideas and Information
3 – Extensive Comprehension
These responses demonstrate extensivecomprehension by integrating text ideas andproviding an interpretation of Labon’s character.
Evidence:
The response describes one or more plausiblecharacter traits. In addition, the response providesat least two examples of Labon’s actions that areevidence of the character trait or traits.
Example:
» He’s clever because he let the mice stay until therewere too many and then he found a way toconfuse the mice. He didn’t give the mice thehorriblest death possible. That means he thinks ofothers.
2 – Satisfactory Comprehension
These responses demonstrate satisfactorycomprehension by providing an interpretation ofLabon’s character with appropriate textual support.
Evidence:
The response describes one plausible charactertrait. In addition, the response provides oneexample of Labon’s actions as evidence of thecharacter trait.
Example:
» Labon is unusual because he thought of a cleverway of catching the mice.
Mice, Item 12 (Continued)
1 – Minimal Comprehension
These responses demonstrate limited comprehensionof Labon’s character.
Evidence:
The response describes one plausible character traitinferred from the events of the story, but does notprovide an example of Labon’s actions as evidenceof the character trait.
Example:
» Labon is clever.
Or, the response describes one character traitstated in the text, but does not provide an exampleof Labon’s actions as evidence of the charactertrait: happy, peaceful, quiet. Note that “poor”is not acceptable.
» All his life he was a quiet and peaceful person.
Or, the response provides a plausible attitude ordesire of Labon’s, inferred from his actions, withoutnaming a specific character trait.
» He likes to fool mice in a really weird way.
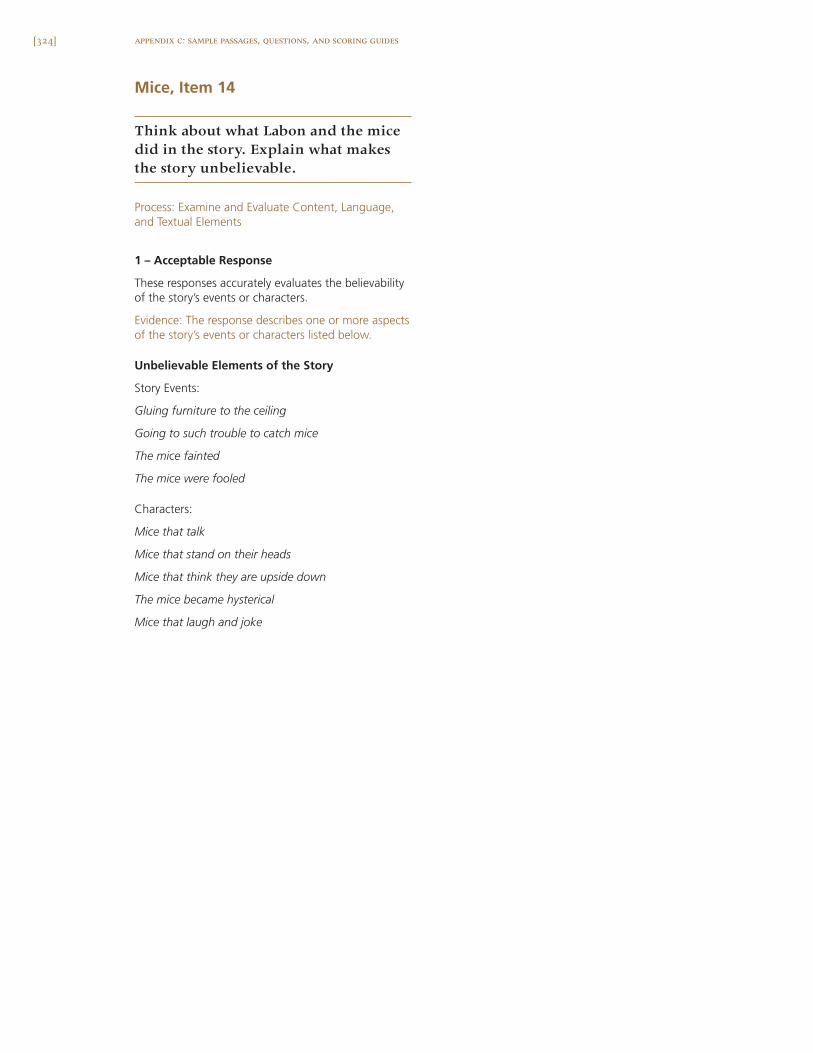
[324]
Mice, Item 14
Think about what Labon and the micedid in the story. Explain what makesthe story unbelievable.
Process: Examine and Evaluate Content, Language,and Textual Elements
1 – Acceptable Response
These responses accurately evaluates the believabilityof the story’s events or characters.
Evidence: The response describes one or more aspectsof the story’s events or characters listed below.
Unbelievable Elements of the Story
Story Events:
Gluing furniture to the ceiling
Going to such trouble to catch mice
The mice fainted
The mice were fooled
Characters:
Mice that talk
Mice that stand on their heads
Mice that think they are upside down
The mice became hysterical
Mice that laugh and joke
appendix c: sample passages, questions, and scoring guides

[325]appendix c: sample passages, questions, and scoring guides
Text for “Hare Heralds the Earthquake”can be found in the PIRLS Reader Booklet,located in the back of this publication.

[326]
4 The Natural World
Questions Hare Heralds the Earthquake
1. What was the hare’s greatest worry?
a lion
a crash
an earthquake
a falling fruit
2. What made the whole earth shake?
an earthquake
an enormous fruit
the fleeing hares
a falling tree
3. Things happened quickly after the hare shouted “Earthquake!”
Find and copy two words in the story that show this.
1.
2.
appendix c: sample passages, questions, and scoring guides
*
*
* correct answer
Copyright
prote
cted by IE
A.
This ite
m m
ay not be use
d
for c
omm
ercial p
urpose
s
without e
xpress
permiss
ion from
IEA.

[327]appendix c: sample passages, questions, and scoring guides
5The Natural World
6. How did the hare feel after the lion dropped the fruit onto the
ground?
angry
disappointed
foolish
worried
4. Where did the lion want the hare to take him?
5. Why did the lion drop the fruit onto the ground?
to make the hare run away
to help the hare get the fruit
to show the hare what had happened
to make the hare laugh
*
*
* correct answer
Copyright
prote
cted by IE
A.
This ite
m m
ay not be use
d
for c
omm
ercial p
urpose
s
without e
xpress
permiss
ion from
IEA.

[328]
6 The Natural World
8. Do you think the lion liked the hare? What happens in the story
that shows this?
7. Write two ways in which the lion tried to make the hare feel better
at the end of the story.
1.
2.
appendix c: sample passages, questions, and scoring guides
Copyright
prote
cted by IE
A.
This ite
m m
ay not be use
d
for c
omm
ercial p
urpose
s
without e
xpress
permiss
ion from
IEA.

[329]appendix c: sample passages, questions, and scoring guides
7The Natural World
9. How did the hare’s feelings change during the story?
At the beginning of the story the hare felt
because
At the end of the story the hare felt
because
Copyright
prote
cted by IE
A.
This ite
m m
ay not be use
d
for c
omm
ercial p
urpose
s
without e
xpress
permiss
ion from
IEA.

[330]
8The Natural World
11. What is the main message of this story?
Run away from trouble.
Check the facts before panicking.
Even lions that seem kind cannot be trusted.
Hares are fast animals.
10. You learn what the lion and the hare are like from the things they
do in the story. Describe how the lion and the hare are different
from each other and what each does that shows this.
StopEnd of this part of the booklet.
Please stop working.
appendix c: sample passages, questions, and scoring guides
*
* correct answer
Copyright
prote
cted by IE
A.
This ite
m m
ay not be use
d
for c
omm
ercial p
urpose
s
without e
xpress
permiss
ion from
IEA.
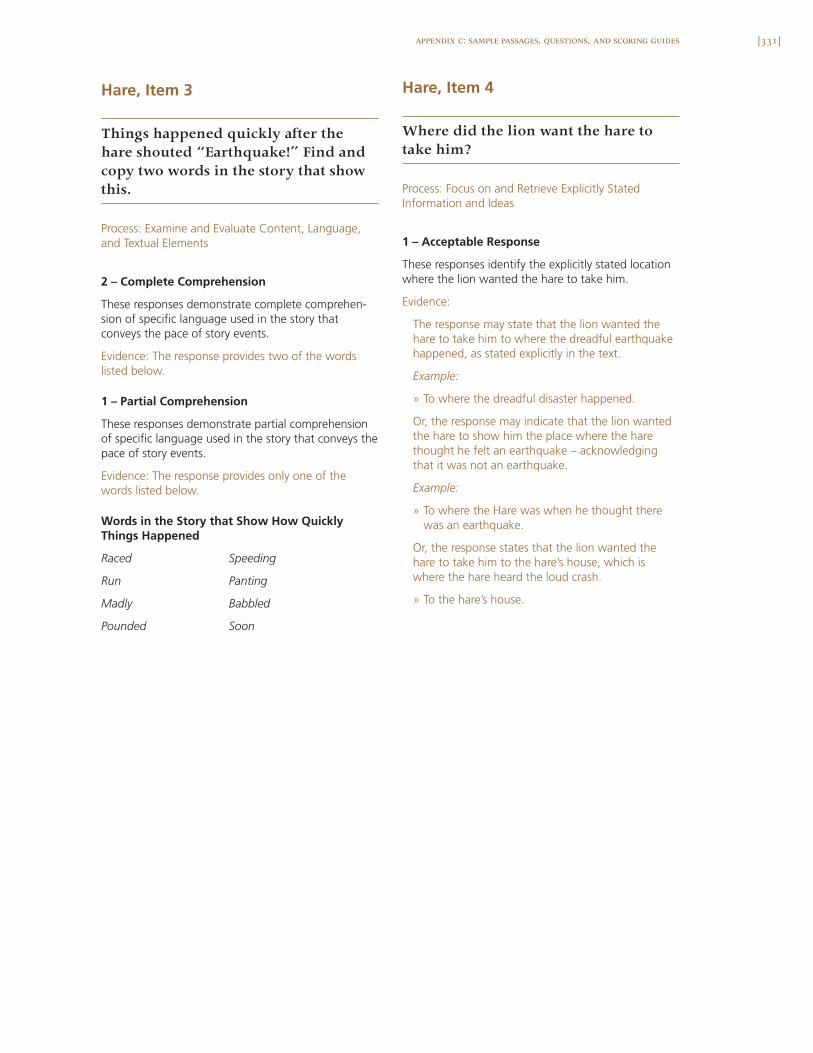
[331]appendix c: sample passages, questions, and scoring guides
Hare, Item 3
Things happened quickly after thehare shouted “Earthquake!” Find andcopy two words in the story that showthis.
Process: Examine and Evaluate Content, Language,and Textual Elements
2 – Complete Comprehension
These responses demonstrate complete comprehen-sion of specific language used in the story thatconveys the pace of story events.
Evidence: The response provides two of the wordslisted below.
1 – Partial Comprehension
These responses demonstrate partial comprehensionof specific language used in the story that conveys thepace of story events.
Evidence: The response provides only one of thewords listed below.
Words in the Story that Show How QuicklyThings Happened
Raced Speeding
Run Panting
Madly Babbled
Pounded Soon
Hare, Item 4
Where did the lion want the hare totake him?
Process: Focus on and Retrieve Explicitly StatedInformation and Ideas
1 – Acceptable Response
These responses identify the explicitly stated locationwhere the lion wanted the hare to take him.
Evidence:
The response may state that the lion wanted thehare to take him to where the dreadful earthquakehappened, as stated explicitly in the text.
Example:
» To where the dreadful disaster happened.
Or, the response may indicate that the lion wantedthe hare to show him the place where the harethought he felt an earthquake – acknowledgingthat it was not an earthquake.
Example:
» To where the Hare was when he thought therewas an earthquake.
Or, the response states that the lion wanted thehare to take him to the hare’s house, which iswhere the hare heard the loud crash.
» To the hare’s house.
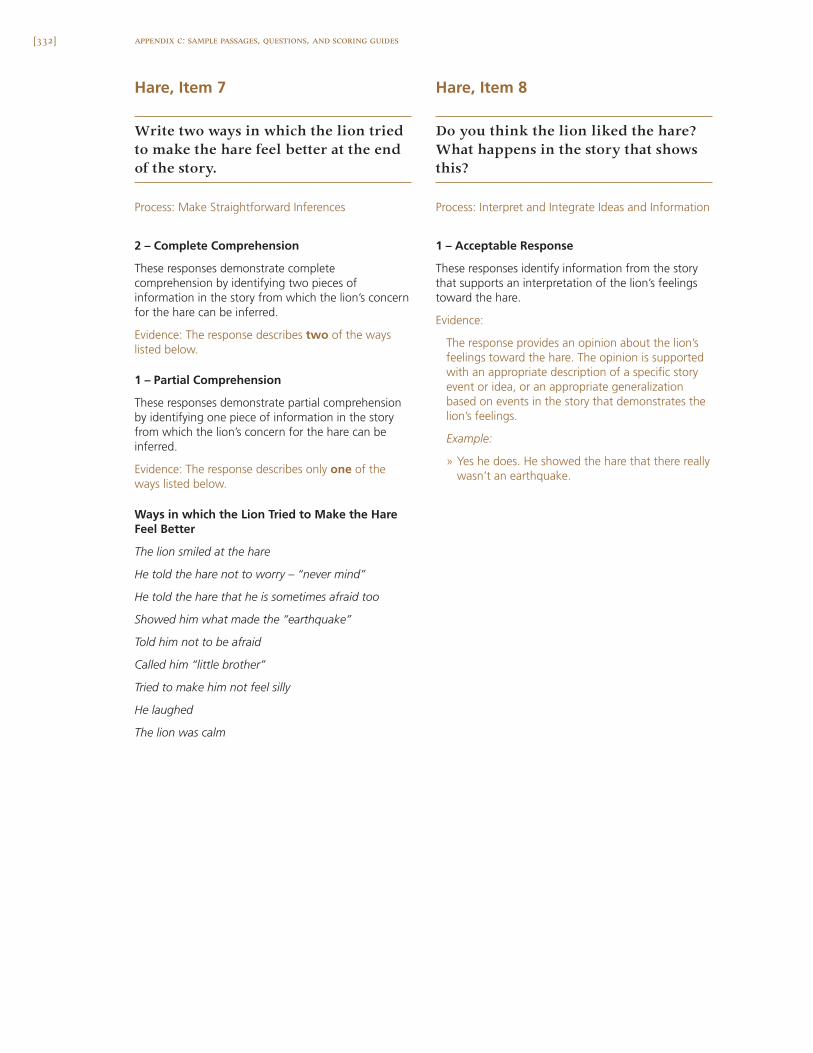
[332] appendix c: sample passages, questions, and scoring guides
Hare, Item 7
Write two ways in which the lion triedto make the hare feel better at the endof the story.
Process: Make Straightforward Inferences
2 – Complete Comprehension
These responses demonstrate completecomprehension by identifying two pieces ofinformation in the story from which the lion’s concernfor the hare can be inferred.
Evidence: The response describes two of the wayslisted below.
1 – Partial Comprehension
These responses demonstrate partial comprehensionby identifying one piece of information in the storyfrom which the lion’s concern for the hare can beinferred.
Evidence: The response describes only one of theways listed below.
Ways in which the Lion Tried to Make the HareFeel Better
The lion smiled at the hare
He told the hare not to worry – “never mind”
He told the hare that he is sometimes afraid too
Showed him what made the “earthquake”
Told him not to be afraid
Called him “little brother”
Tried to make him not feel silly
He laughed
The lion was calm
Hare, Item 8
Do you think the lion liked the hare?What happens in the story that showsthis?
Process: Interpret and Integrate Ideas and Information
1 – Acceptable Response
These responses identify information from the storythat supports an interpretation of the lion’s feelingstoward the hare.
Evidence:
The response provides an opinion about the lion’sfeelings toward the hare. The opinion is supportedwith an appropriate description of a specific storyevent or idea, or an appropriate generalizationbased on events in the story that demonstrates thelion’s feelings.
Example:
» Yes he does. He showed the hare that there reallywasn’t an earthquake.
[333]appendix c: sample passages, questions, and scoring guides
Hare, Item 9
How did the hare’s feelings changeduring the story?At the beginning of the story the harefelt __________ because __________.At the end of the story the hare felt__________ because __________.
Process: Interpret and Integrate Ideas and Information
2 – Complete Comprehension
These responses demonstrate complete comprehensionby integrating information from across the story tointerpret how the hare’s feelings changed during thestory.
Evidence:
The response provides an appropriate feeling andexplanation for both the beginning and ending ofthe story, as described below.
1 – Partial Comprehension
These responses demonstrate partial comprehensionby interpreting the hare’s feelings in one part of thestory.
Evidence:
The response provides an appropriate feeling andexplanation for either the beginning or ending ofthe story as described below. An appropriate feelingmay be provided for the other part of the story, butwithout an appropriate explanation.
Appropriate Feelings and Example Explanations
Beginning of the story: The response may describe thehare’s feelings as fearful, worried, or anxious.
Example explanation:
» because he thought there was going to bean earthquake
Ending of the Story: The response may describe thehare’s feelings as relieved or silly.
Example explanation:
» because he found out there really wasn’tan earthquake
Hare, Item 10
You learn what the lion and the hareare like from the things they do in thestory. Describe how the lion and thehare are different from each other andwhat each does that shows this.
Process: Interpret and Integrate Ideas and Information
3 – Extensive Comprehension
These responses demonstrate extensivecomprehension by integrating ideas from across thetext to fully support an interpretation of thedifference between the two characters.
Evidence:
The response conveys understanding of thedifference between the lion and the hare bydescribing a contrasting character trait andproviding a specific action of each character tosupport that trait.
Example:
» The hare doesn’t stop to think. He just ran off assoon as he heard the crash without going to seewhat it was. The lion is thoughtful. He made thehare go back and see what made the noise.
OR, the response provides a generalization for thebasis of the difference supported by specific actions.
» They do different things when there is danger.The hare ran away when he heard the noise. Thelion wanted to see what made the noise.
(continues overleaf)
[334] appendix c: sample passages, questions, and scoring guides
Hare, Item 10 (Continued)
2 – Satisfactory Comprehension
These responses demonstrate satisfactorycomprehension of the characters.
Evidence:
The response provides a description of thedifference between the lion and the hare, butprovides a story event to support the description ofneither or only one of the characters.
Examples:
» The lion is brave and the hare is nervous. The lionwent back to look at the “earthquake.”
OR, the response provides a specific and contrastingaction taken by each character, but does notprovide a description or generalization of eithercharacter.
» The hare is different from the lion because thehare warns that an earthquake is coming and lionconvinces him that it isn’t an earthquake.
1 – Minimal Comprehension
These responses demonstrate limited comprehensionof the characters.
Evidence:
The response describes the actions or providesa generalization of a trait of only one of thecharacters.
Example:
» The hare ran away because he thought there wasan earthquake.
[335]appendix c: sample passages, questions, and scoring guides
Text for “Nights of the Pufflings” can befound in the PIRLS Reader Booklet, locatedin the back of this publication.

[336] appendix c: sample passages, questions, and scoring guides
9The Natural World
Questions Nights of the Pufflings
1. Why are puffins clumsy at takeoffs and landings?
They live in a land of ice.
They hardly ever come to shore.
They spend time on high cliffs.
They have chunky bodies and short wings.
2. Where do the puffins spend the winter?
inside the cliffs
on the beach
at sea
on the ice
3. Why do the puffins come to the island?
to be rescued
to look for food
to lay eggs
to learn to fly
*
*
*
* correct answer
Copyright
prote
cted by IE
A.
This ite
m m
ay not be use
d
for c
omm
ercial p
urpose
s
without e
xpress
permiss
ion from
IEA.

[337]appendix c: sample passages, questions, and scoring guides
10 The Natural World
4. How does Halla know the pufflings are about to fly?
Parents bring fish to the pufflings.
Flowers are in full bloom.
Chicks are hidden away.
Summer has just begun.
5. What happens during the nights of the pufflings?
Puffin pairs tap-tap-tap their beaks together.
Pufflings take their first flight.
Puffin eggs hatch into chicks.
Pufflings come ashore from the sea.
6. What could the people in the village do to stop the pufflings from
landing there by mistake?
turn off the lights
get the boxes ready
keep the cats and dogs inside
shine their torches in the sky
*
*
*
* correct answer
Copyright
prote
cted by IE
A.
This ite
m m
ay not be use
d
for c
omm
ercial p
urpose
s
without e
xpress
permiss
ion from
IEA.

[338] appendix c: sample passages, questions, and scoring guides
11The Natural World
9. According to the article, which of these is a danger faced
by the pufflings?
drowning while landing in the sea
getting lost in the burrows
not having enough fish from their parents
being run over by cars and trucks
7. Explain how Halla uses her torch to rescue the pufflings.
8. Explain how Halla uses the cardboard boxes to rescue the
pufflings.
Questions 7 and 8 ask you to explain how Halla rescues
the pufflings.
*
* correct answer
Copyright
prote
cted by IE
A.
This ite
m m
ay not be use
d
for c
omm
ercial p
urpose
s
without e
xpress
permiss
ion from
IEA.

[339]appendix c: sample passages, questions, and scoring guides
12 The Natural World
10. Why does it need to be daylight when the children release the
pufflings? Use information from the article to explain.
11. What do the pufflings do after Halla and her friends release them?
walk on the beach
fly from the cliff
hide in the village
swim in the sea
12. Write two different feelings Halla might have after she has set the
pufflings free. Explain why she might have each feeling.
1.
2.
*
* correct answer
Copyright
prote
cted by IE
A.
This ite
m m
ay not be use
d
for c
omm
ercial p
urpose
s
without e
xpress
permiss
ion from
IEA.

[340] appendix c: sample passages, questions, and scoring guides
13The Natural World
13. Would you like to go and rescue pufflings with Halla and her
friends? Use what you have read to help you explain.
StopEnd of this part of the booklet.
Please stop working.
Copyright
prote
cted by IE
A.
This ite
m m
ay not be use
d
for c
omm
ercial p
urpose
s
without e
xpress
permiss
ion from
IEA.
[341]appendix c: sample passages, questions, and scoring guides
Pufflings, Item 7
Explain how Halla uses her torch torescue the pufflings.
Process: Interpret and Integrate Ideas and Information
2 – Complete Comprehension
These responses demonstrate completecomprehension by integrating specific informationfrom the article to explain fully how Halla uses thetorch.
Evidence:
The response provides an appropriate explanationfor how Halla uses the torch. The explanationincludes an explicit reference to rescuing thepufflings as described in the text. In order to beconsidered a complete explanation, it must indicatethat the torch facilitates finding the pufflings atnight or locating pufflings that are hiding.
Example:
» It helps Halla find the pufflings in the dark.
1 – Partial Comprehension
These responses demonstrate partial comprehensionby identifying general information from the article toexplain how Halla uses the torch.
Evidence:
The response provides an appropriate, but general,explanation for how Halla uses the torch. Theexplanation is not inconsistent with the text andmay mention that Halla is looking for or finding thepufflings. However, it does not include an explicitreference to finding the pufflings at night orlocating pufflings that are hiding.
Example:
» It helps her wander the village.
Pufflings, Item 8
Explain how Halla uses the cardboardboxes to rescue the pufflings.
Process: Interpret and Integrate Ideas and Information
2 – Complete Comprehension
These responses demonstrate completecomprehension by integrating specific informationfrom the article to explain fully how Halla uses thecardboard boxes.
Evidence:
The response provides an appropriate explanationfor how Halla uses the cardboard boxes. Theexplanation includes an explicit reference torescuing the pufflings as described in the text. Inorder to be considered a complete explanation, itmust indicate that the cardboard boxes facilitatekeeping the pufflings safe or transporting thepufflings.
Example:
» She puts the pufflings in the boxes to keepthem safe.
1 – Partial Comprehension
These responses demonstrate partial comprehensionby identifying general information from the article toexplain how Halla uses the cardboard boxes.
Evidence:
The response provides an appropriate, but general,explanation for how Halla uses the cardboardboxes. The explanation is not inconsistent with thetext. However, it does not include an explicitreference to keeping the pufflings safe ortransporting them.
Example:
» She puts the pufflings in them.
[342] appendix c: sample passages, questions, and scoring guides
Pufflings, Item 10
Why does it need to be daylight whenthe children release the pufflings? Useinformation from the article toexplain.
Process: Make Straightforward Inferences
1 – Acceptable Response
These responses provide an appropriate inference forwhy the pufflings must be released in the daylight.
Evidence:
The response demonstrates understanding that thepufflings can become confused at night, or thatthey can see their target more clearly in daylight.
Example:
» If the pufflings were released in the dark, thelights of the village would attract them back there.
Or, the response may focus on the needs of thechildren in releasing the pufflings by citing specificinformation from the article that shows whydaylight is necessary.
Example:
» It would be hard for the children to see what theywere doing at the beach at night.
Pufflings, Item 12
Write two different feelings Hallamight have after she has set thepufflings free. Explain why she mighthave each feeling.
Process: Interpret and Integrate Ideas and Information
2 – Complete Comprehension
These responses demonstrate completecomprehension by integrating ideas from acrossthe text to identify and explain Halla’s feelings.
Evidence:
The response identifies two different feelingsand provides an appropriate explanation for eachfeeling. The two feelings identified may be bothpositive or both negative, or the two may representconflicting feelings. The explanation for eachfeeling draws on different information from the textand is a plausible justification for the feeling.
Examples:
» She feels sad to say goodbye to the pufflings. Butshe is happy that they made it to the water.
1 – Partial Comprehension
These responses demonstrate partial comprehensionof Halla’s feelings.
Evidence:
The response identifies two different feelings.The two feelings identified may be both positiveor both negative, or the two may representconflicting feelings. However, one of the feelingsis not supported with appropriate informationfrom the text.
Example:
» She is sad, but also happy that they are rescued.
Or, the response identifies only one feeling, andprovides an explanation for that feeling that isbased on appropriate information in the text.
Example:
» She is happy that she was able to help them getto the sea.
[343]appendix c: sample passages, questions, and scoring guides
Pufflings, Item 13
Would you like to go and rescuepufflings with Halla and her friends?Use what you have read to help youexplain.
Process: Examine and Evaluate Content, Language,and Textual Elements
2 – Complete Comprehension
These responses demonstrate completecomprehension of the article by supporting a personalevaluation of its content.
Evidence:
The response provides a personal evaluation,supported with one specific piece of informationfrom the text.
Example:
» Yes, it would be fun to take them to the beach.
1 – Partial Comprehension
These responses demonstrate completecomprehension of the article by supporting a personalevaluation of its content.
Evidence:
The response provides a personal evaluation that issupported by a generalization of the article’scontent. The generalization may be based mostlyon personal experience, but is related to the article.
Example:
» I would like to help her. I think it is important tosave baby birds.
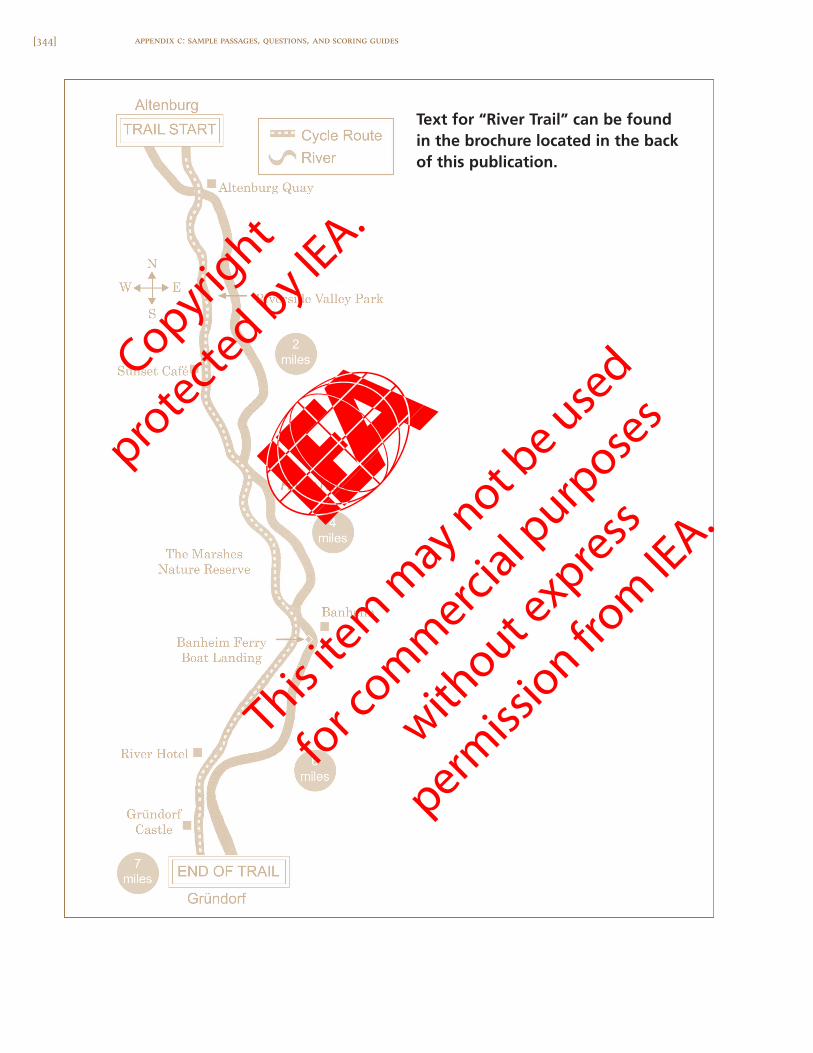
[344] appendix c: sample passages, questions, and scoring guides
Text for “River Trail” can be foundin the brochure located in the backof this publication.
Copyright
prote
cted by IE
A.
This ite
m m
ay not be use
d
for c
omm
ercial p
urpose
s
without e
xpress
permiss
ion from
IEA.

[345]appendix c: sample passages, questions, and scoring guides
River Trail 1
Questions River Trail
1. What is the main purpose of the section called
The River Nord Trail?
to describe what Gründorf Castle looks like
to explain about bikes
to display the bike hire prices
to give directions
Questions 1 and 2 ask you about different parts of the leaflet. Each
part asked about is shown next to the question.
Take out the leaflet called Follow the River Nord Trail.
The questions in this section are about this leaflet.
Raise your hand if you do not have the leaflet.
2. What is the main purpose of this section of
the leaflet?
to show you where the trail goes
to give you information about bikes
you can hire
to describe what happens on the trail
to teach you about riding bikes
*
*
* correct answer
Copyright
prote
cted by IE
A.
This ite
m m
ay not be use
d
for c
omm
ercial p
urpose
s
without e
xpress
permiss
ion from
IEA.

[346] appendix c: sample passages, questions, and scoring guides
River Trail2
5. How much would it cost a 10-year-old child to hire a bike for a full
day?
3. Where does the River Trail start?
Banheim
Gründorf
Altenburg
Riverside Valley Park
4. Number these places in the order you would see them on the River
Trail from the beginning to the end. Number 1 has been done for
you.
Gründorf Castle
Banheim
Riverside Valley Park
River Hotel
1
*
* correct answer
Copyright
prote
cted by IE
A.
This ite
m m
ay not be use
d
for c
omm
ercial p
urpose
s
without e
xpress
permiss
ion from
IEA.

[347]appendix c: sample passages, questions, and scoring guides
River Trail 3
6. Zippy Bike Hire rents out equipment for children.
Write two things that are for children.
1.
2.
7. What information about Zippy bikes tells you that the bikes for
hire are in good condition?Copyright
prote
cted by IE
A.
This ite
m m
ay not be use
d
for c
omm
ercial p
urpose
s
without e
xpress
permiss
ion from
IEA.

[348] appendix c: sample passages, questions, and scoring guides
River Trail4
Questions 8 and 9 are about a family with two adults and two
children, one 10 years old and one 3 years old. They are planning
to spend a day cycling along the River Trail.
8. Which bikes would the family need? Use what you have read in the
leaflet to answer.
9. Which place on the River Trail could the family visit? Explain why
they might like to go there.
Copyright
prote
cted by IE
A.
This ite
m m
ay not be use
d
for c
omm
ercial p
urpose
s
without e
xpress
permiss
ion from
IEA.

[349]appendix c: sample passages, questions, and scoring guides
River Trail 5
Alex
10. Read the comments of Jane, Alex, John, and Khalil. Draw a line
from each person’s name to the place on the map that shows where
they are standing on the River Trail. One has been done for you.
“There’s a lovely littleport town on the other
side of the river.”
Jane
John
Khalil
“Just stopped to buya snack at theSunset Café.”
“I can seehundreds ofbirds here.”
“The deer have justbeen scared off by our
clanking bike!”
Copyright
prote
cted by IE
A.
This ite
m m
ay not be use
d
for c
omm
ercial p
urpose
s
without e
xpress
permiss
ion from
IEA.

[350] appendix c: sample passages, questions, and scoring guides
River Trail6
11. Draw lines to show your answers to the questions below.
One has been done for you.
Where can you find
information about
bike hire
charges?
Which sentence
invites you to try
the River Trail?
Where can you find
a short sentence
persuading you to
try cycling?
Where can you
find out about the
range of adult
bikes for hire?
What does it cost to hire a bike?(Prices in £)
Zippy
B i k e H i r e
Cycling is fun for everyone& healthy too!
Come and explore 7 miles of flat easy
traffic-free cycle routes in beautiful
countryside following the River Nord...
Whatever bike you fancy, ZIPPY has the
right one for you. Great choice...mountain
bikes, tandems, children’s bikes, trailers for
kids and child seats. Trekking bikes for
ladies and gents, soft comfortable seats and
21 easy gears.
All ZIPPY bikes are replaced every year
and regularly serviced. Cycle helmets,
pumps, rucksacks and locks are free to all.
Trailer
Bicycle HireHalf
Day
Full
Day
Per
Week
Adults / Trailer 8 12 50
Children (under 16) 6 9 30
Child Seat 2 3 12
For children under 7 we have bikes that
attach to an adult bike—great for keeping
children where they should be and helping
them out on long rides. For children
under 5 we have comfortable child seats
and trailers which attach to the adult’s bike.
For the more able young cyclist we have
little bikes with or without stabilisers.
TRY before you BUY
Copyright
prote
cted by IE
A.
This ite
m m
ay not be use
d
for c
omm
ercial p
urpose
s
without e
xpress
permiss
ion from
IEA.
[351]appendix c: sample passages, questions, and scoring guides
River, Item 4
Number these places in the order youwould see them on the River Trail fromthe beginning to the end. Number 1has been done for you. __ Grundorf Castle__ Banheim 1 Riverside Valley Park__ River Hotel
Process: Make Straightforward Inferences
1 – Acceptable Response
These responses infer the appropriate order of sitesalong the river trail.
Evidence:
The response accurately numbers the sentences asshown below. In order to receive full credit, eachsentence must have the appropriate number.
Appropriate Ordering of Sentences
4 Grundorf Castle
2 Banheim
1 Riverside Valley Park
3 River Hotel
River, Item 5
How much would it cost a 10-year-oldchild to hire a bike for a full day?
Process: Make Straightforward Inferences
1 – Acceptable Response
These responses infer the appropriate cost of hiring abike from information presented in tabular form.
Evidence:
The response accurately states the amountindicated at the intersection of the second row(Children under 16) and second column (Full Day)of the “What does it cost to hire a bike” table(back of leaflet). It may or may not include theunit of currency with the amount.
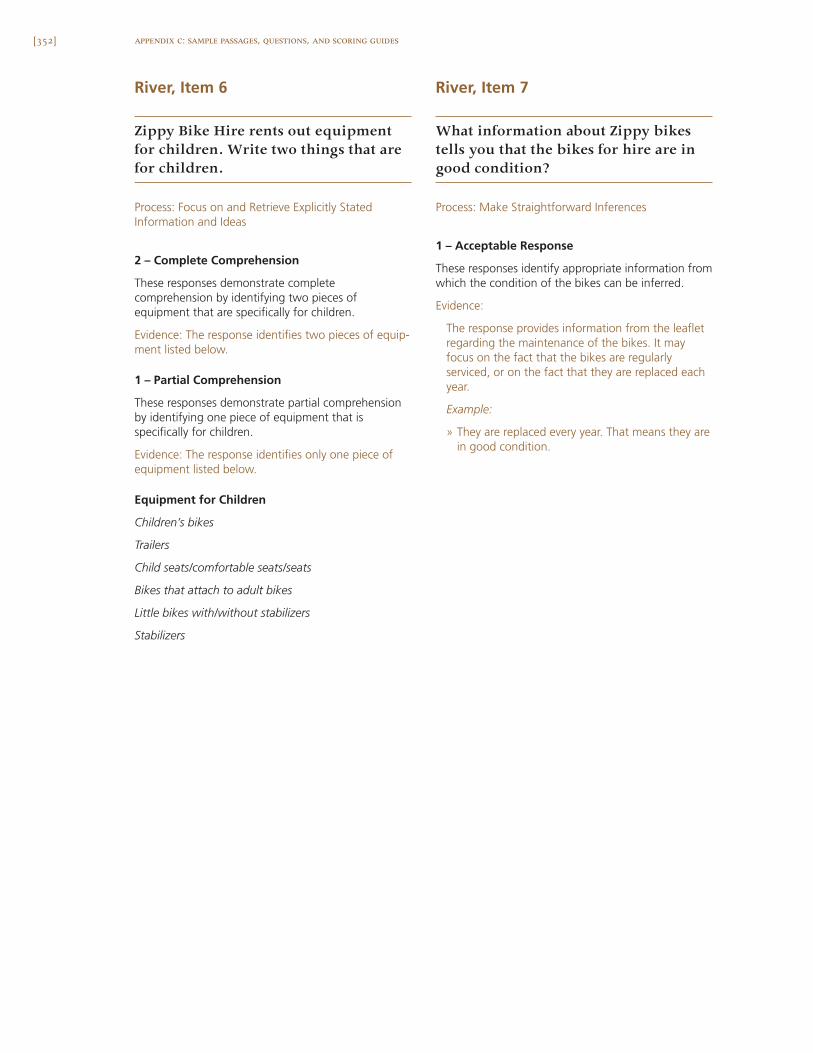
[352] appendix c: sample passages, questions, and scoring guides
River, Item 6
Zippy Bike Hire rents out equipmentfor children. Write two things that arefor children.
Process: Focus on and Retrieve Explicitly StatedInformation and Ideas
2 – Complete Comprehension
These responses demonstrate completecomprehension by identifying two pieces ofequipment that are specifically for children.
Evidence: The response identifies two pieces of equip-ment listed below.
1 – Partial Comprehension
These responses demonstrate partial comprehensionby identifying one piece of equipment that isspecifically for children.
Evidence: The response identifies only one piece ofequipment listed below.
Equipment for Children
Children’s bikes
Trailers
Child seats/comfortable seats/seats
Bikes that attach to adult bikes
Little bikes with/without stabilizers
Stabilizers
River, Item 7
What information about Zippy bikestells you that the bikes for hire are ingood condition?
Process: Make Straightforward Inferences
1 – Acceptable Response
These responses identify appropriate information fromwhich the condition of the bikes can be inferred.
Evidence:
The response provides information from the leafletregarding the maintenance of the bikes. It mayfocus on the fact that the bikes are regularlyserviced, or on the fact that they are replaced eachyear.
Example:
» They are replaced every year. That means they arein good condition.
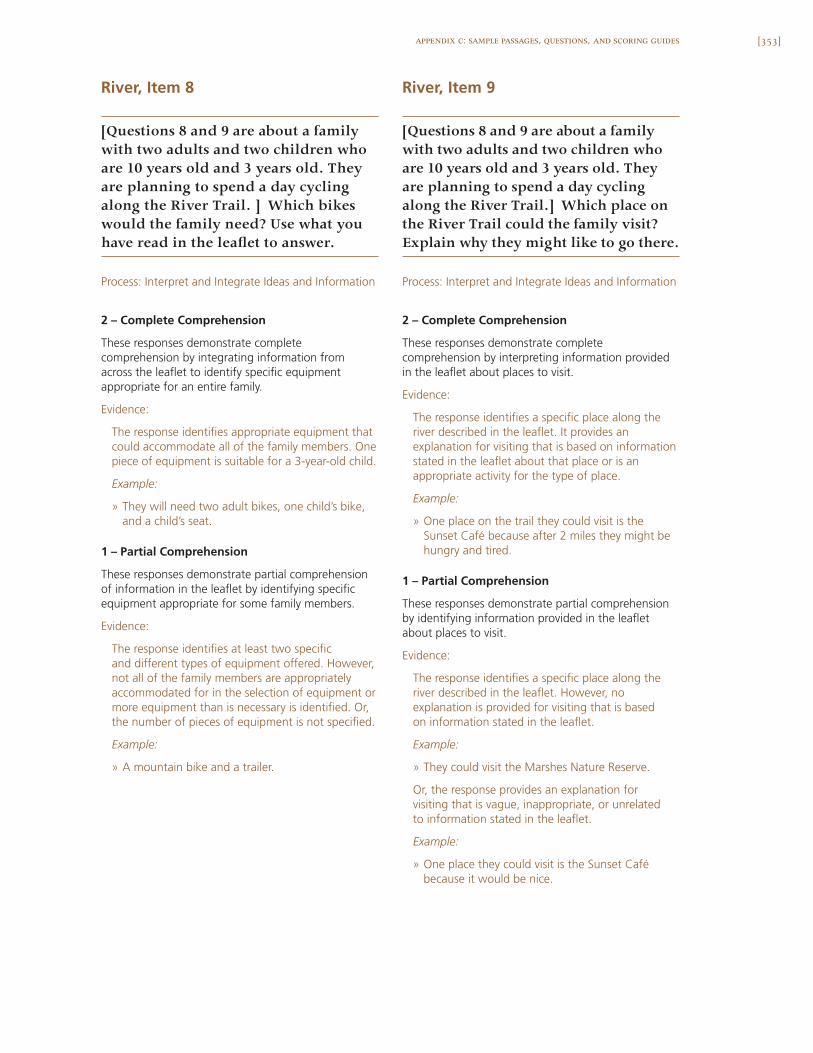
[353]appendix c: sample passages, questions, and scoring guides
River, Item 8
[Questions 8 and 9 are about a familywith two adults and two children whoare 10 years old and 3 years old. Theyare planning to spend a day cyclingalong the River Trail. ] Which bikeswould the family need? Use what youhave read in the leaflet to answer.
Process: Interpret and Integrate Ideas and Information
2 – Complete Comprehension
These responses demonstrate completecomprehension by integrating information fromacross the leaflet to identify specific equipmentappropriate for an entire family.
Evidence:
The response identifies appropriate equipment thatcould accommodate all of the family members. Onepiece of equipment is suitable for a 3-year-old child.
Example:
» They will need two adult bikes, one child’s bike,and a child’s seat.
1 – Partial Comprehension
These responses demonstrate partial comprehensionof information in the leaflet by identifying specificequipment appropriate for some family members.
Evidence:
The response identifies at least two specificand different types of equipment offered. However,not all of the family members are appropriatelyaccommodated for in the selection of equipment ormore equipment than is necessary is identified. Or,the number of pieces of equipment is not specified.
Example:
» A mountain bike and a trailer.
River, Item 9
[Questions 8 and 9 are about a familywith two adults and two children whoare 10 years old and 3 years old. Theyare planning to spend a day cyclingalong the River Trail.] Which place onthe River Trail could the family visit?Explain why they might like to go there.
Process: Interpret and Integrate Ideas and Information
2 – Complete Comprehension
These responses demonstrate completecomprehension by interpreting information providedin the leaflet about places to visit.
Evidence:
The response identifies a specific place along theriver described in the leaflet. It provides anexplanation for visiting that is based on informationstated in the leaflet about that place or is anappropriate activity for the type of place.
Example:
» One place on the trail they could visit is theSunset Café because after 2 miles they might behungry and tired.
1 – Partial Comprehension
These responses demonstrate partial comprehensionby identifying information provided in the leafletabout places to visit.
Evidence:
The response identifies a specific place along theriver described in the leaflet. However, noexplanation is provided for visiting that is basedon information stated in the leaflet.
Example:
» They could visit the Marshes Nature Reserve.
Or, the response provides an explanation forvisiting that is vague, inappropriate, or unrelatedto information stated in the leaflet.
Example:
» One place they could visit is the Sunset Cafébecause it would be nice.
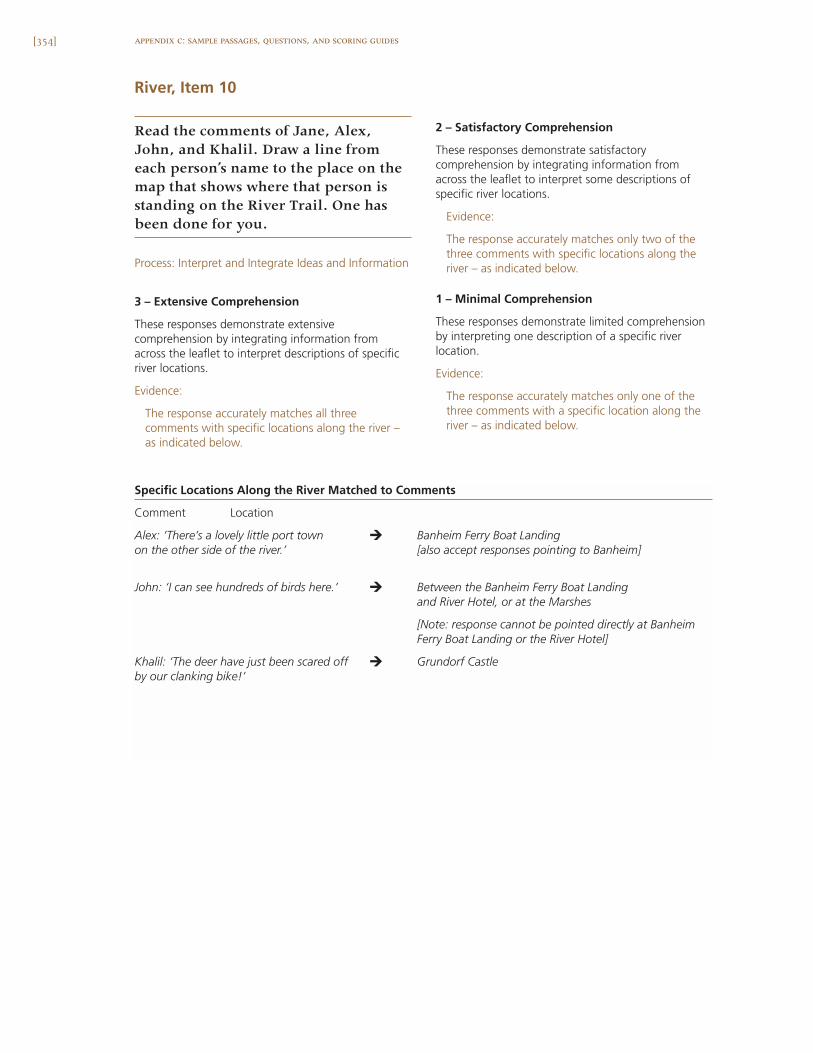
[354] appendix c: sample passages, questions, and scoring guides
River, Item 10
Read the comments of Jane, Alex,John, and Khalil. Draw a line fromeach person’s name to the place on themap that shows where that person isstanding on the River Trail. One hasbeen done for you.
Process: Interpret and Integrate Ideas and Information
3 – Extensive Comprehension
These responses demonstrate extensivecomprehension by integrating information fromacross the leaflet to interpret descriptions of specificriver locations.
Evidence:
The response accurately matches all threecomments with specific locations along the river –as indicated below.
2 – Satisfactory Comprehension
These responses demonstrate satisfactorycomprehension by integrating information fromacross the leaflet to interpret some descriptions ofspecific river locations.
Evidence:
The response accurately matches only two of thethree comments with specific locations along theriver – as indicated below.
1 – Minimal Comprehension
These responses demonstrate limited comprehensionby interpreting one description of a specific riverlocation.
Evidence:
The response accurately matches only one of thethree comments with a specific location along theriver – as indicated below.
Specific Locations Along the River Matched to Comments
Comment Location
Alex: ‘There’s a lovely little port town E Banheim Ferry Boat Landing on the other side of the river.’ [also accept responses pointing to Banheim]
John: ‘I can see hundreds of birds here.’ E Between the Banheim Ferry Boat Landingand River Hotel, or at the Marshes
[Note: response cannot be pointed directly at BanheimFerry Boat Landing or the River Hotel]
Khalil: ‘The deer have just been scared off E Grundorf Castle by our clanking bike!’
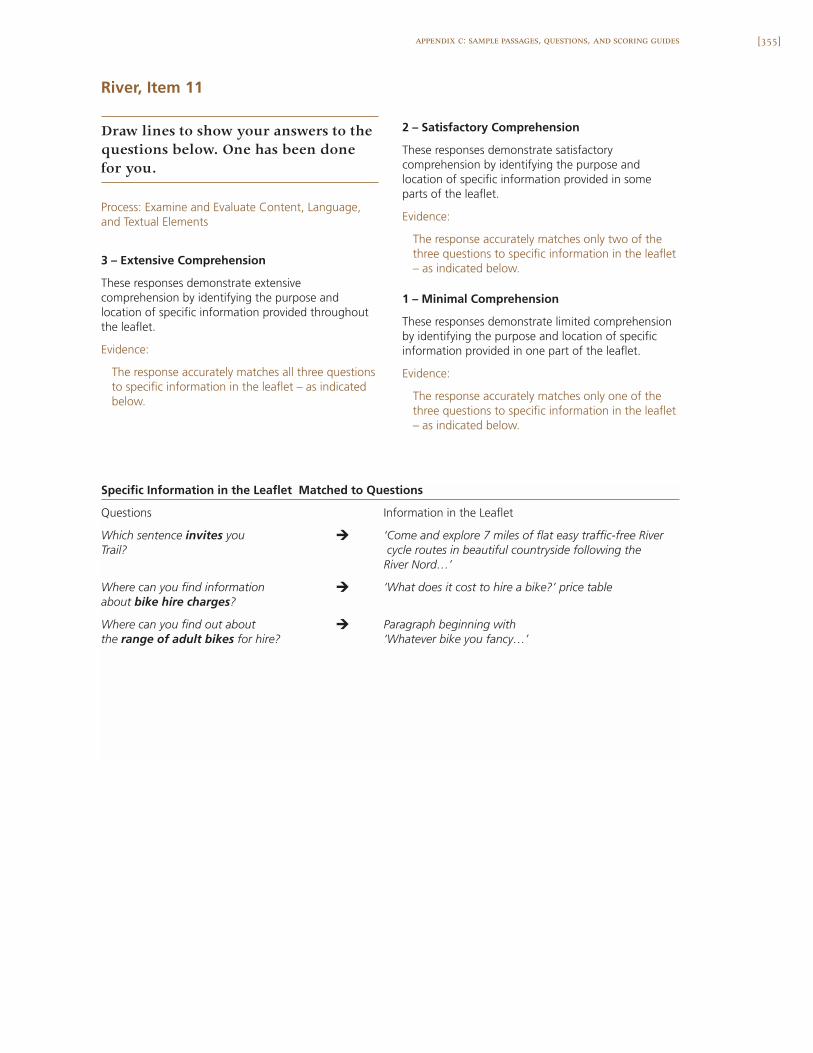
[355]appendix c: sample passages, questions, and scoring guides
River, Item 11
Draw lines to show your answers to thequestions below. One has been donefor you.
Process: Examine and Evaluate Content, Language,and Textual Elements
3 – Extensive Comprehension
These responses demonstrate extensivecomprehension by identifying the purpose andlocation of specific information provided throughoutthe leaflet.
Evidence:
The response accurately matches all three questionsto specific information in the leaflet – as indicatedbelow.
2 – Satisfactory Comprehension
These responses demonstrate satisfactorycomprehension by identifying the purpose andlocation of specific information provided in someparts of the leaflet.
Evidence:
The response accurately matches only two of thethree questions to specific information in the leaflet– as indicated below.
1 – Minimal Comprehension
These responses demonstrate limited comprehensionby identifying the purpose and location of specificinformation provided in one part of the leaflet.
Evidence:
The response accurately matches only one of thethree questions to specific information in the leaflet– as indicated below.
Specific Information in the Leaflet Matched to Questions
Questions Information in the Leaflet
Which sentence invites you E ‘Come and explore 7 miles of flat easy traffic-free RiverTrail? cycle routes in beautiful countryside following the
River Nord…’
Where can you find information E ‘What does it cost to hire a bike?’ price tableabout bike hire charges?
Where can you find out about E Paragraph beginning with the range of adult bikes for hire? ‘Whatever bike you fancy…’

D
* Not all items were used. Some anchored above the Top 10% Benchmark.
[357]
Appendix DReading Items Used for Describing Each Benchmark*
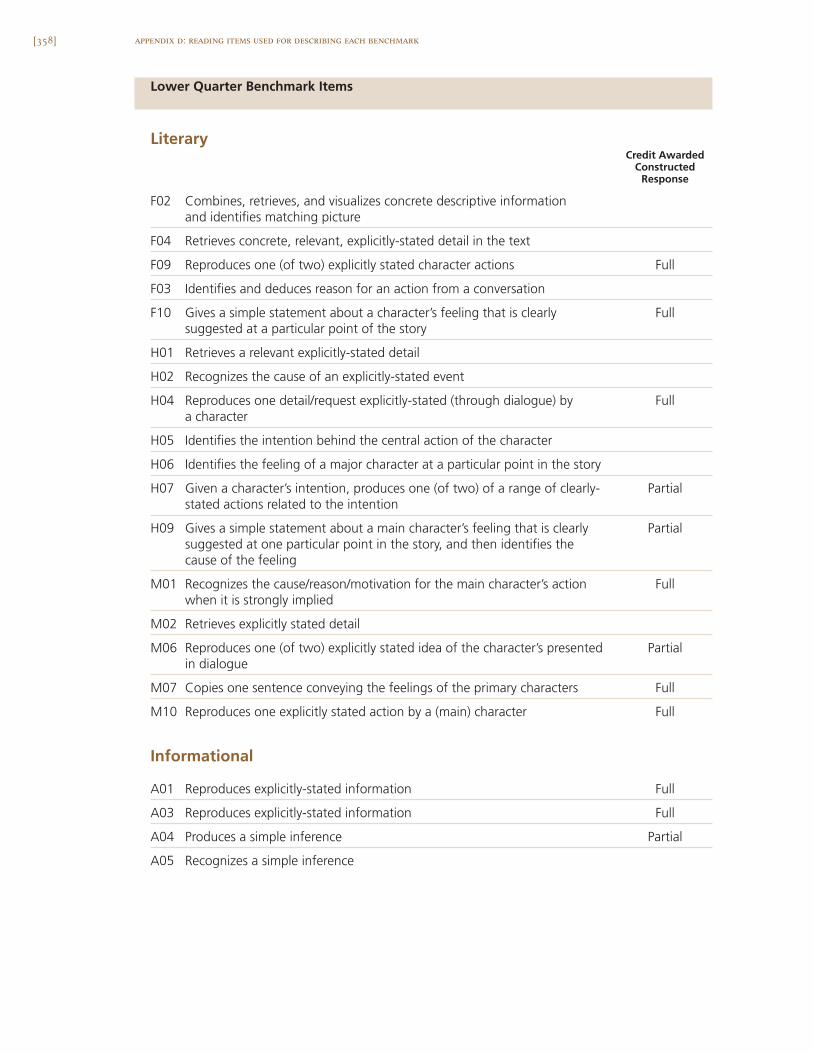
[358]
Lower Quarter Benchmark Items
LiteraryCredit Awarded
Constructed Response
F02 Combines, retrieves, and visualizes concrete descriptive information and identifies matching picture
F04 Retrieves concrete, relevant, explicitly-stated detail in the text
F09 Reproduces one (of two) explicitly stated character actions Full
F03 Identifies and deduces reason for an action from a conversation
F10 Gives a simple statement about a character’s feeling that is clearly Fullsuggested at a particular point of the story
H01 Retrieves a relevant explicitly-stated detail
H02 Recognizes the cause of an explicitly-stated event
H04 Reproduces one detail/request explicitly-stated (through dialogue) by Fulla character
H05 Identifies the intention behind the central action of the character
H06 Identifies the feeling of a major character at a particular point in the story
H07 Given a character’s intention, produces one (of two) of a range of clearly- Partialstated actions related to the intention
H09 Gives a simple statement about a main character’s feeling that is clearly Partialsuggested at one particular point in the story, and then identifies the cause of the feeling
M01 Recognizes the cause/reason/motivation for the main character’s action Fullwhen it is strongly implied
M02 Retrieves explicitly stated detail
M06 Reproduces one (of two) explicitly stated idea of the character’s presented Partialin dialogue
M07 Copies one sentence conveying the feelings of the primary characters Full
M10 Reproduces one explicitly stated action by a (main) character Full
Informational
A01 Reproduces explicitly-stated information Full
A03 Reproduces explicitly-stated information Full
A04 Produces a simple inference Partial
A05 Recognizes a simple inference
appendix d: reading items used for describing each benchmark
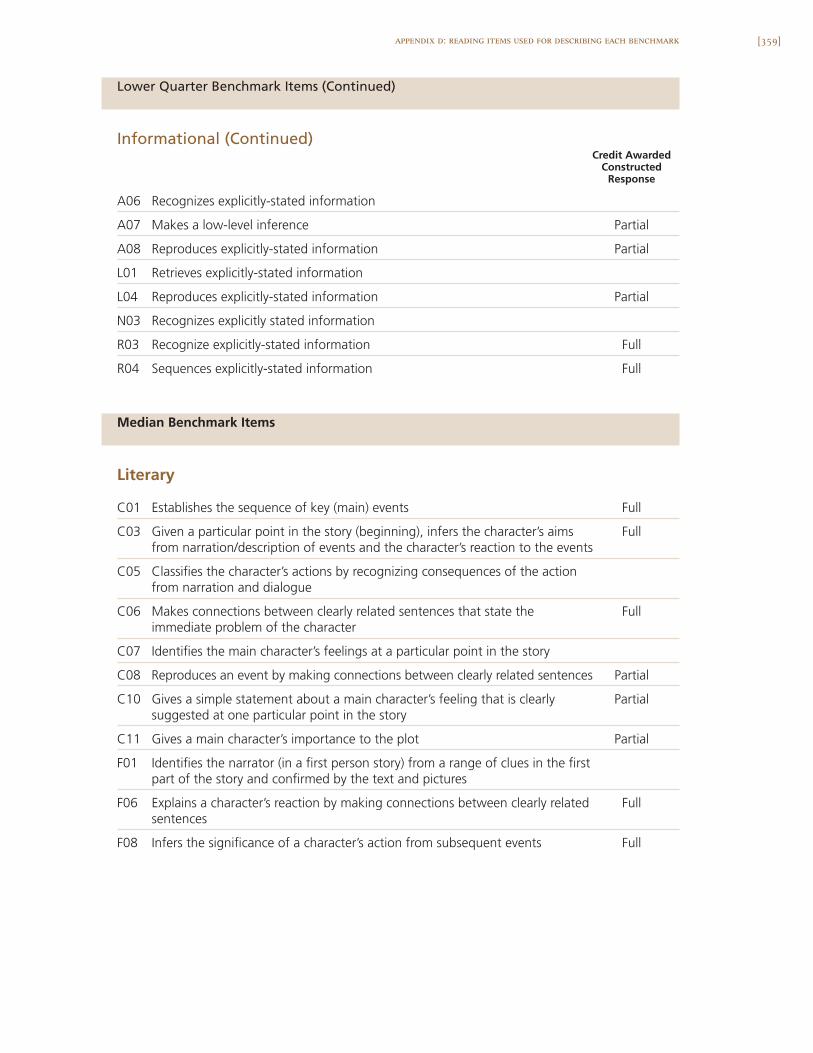
[359]appendix d: reading items used for describing each benchmark
Lower Quarter Benchmark Items (Continued)
Informational (Continued)Credit Awarded
Constructed Response
A06 Recognizes explicitly-stated information
A07 Makes a low-level inference Partial
A08 Reproduces explicitly-stated information Partial
L01 Retrieves explicitly-stated information
L04 Reproduces explicitly-stated information Partial
N03 Recognizes explicitly stated information
R03 Recognize explicitly-stated information Full
R04 Sequences explicitly-stated information Full
Median Benchmark Items
Literary
C01 Establishes the sequence of key (main) events Full
C03 Given a particular point in the story (beginning), infers the character’s aims Fullfrom narration/description of events and the character’s reaction to the events
C05 Classifies the character’s actions by recognizing consequences of the action from narration and dialogue
C06 Makes connections between clearly related sentences that state the Fullimmediate problem of the character
C07 Identifies the main character’s feelings at a particular point in the story
C08 Reproduces an event by making connections between clearly related sentences Partial
C10 Gives a simple statement about a main character’s feeling that is clearly Partialsuggested at one particular point in the story
C11 Gives a main character’s importance to the plot Partial
F01 Identifies the narrator (in a first person story) from a range of clues in the first part of the story and confirmed by the text and pictures
F06 Explains a character’s reaction by making connections between clearly related Fullsentences
F08 Infers the significance of a character’s action from subsequent events Full
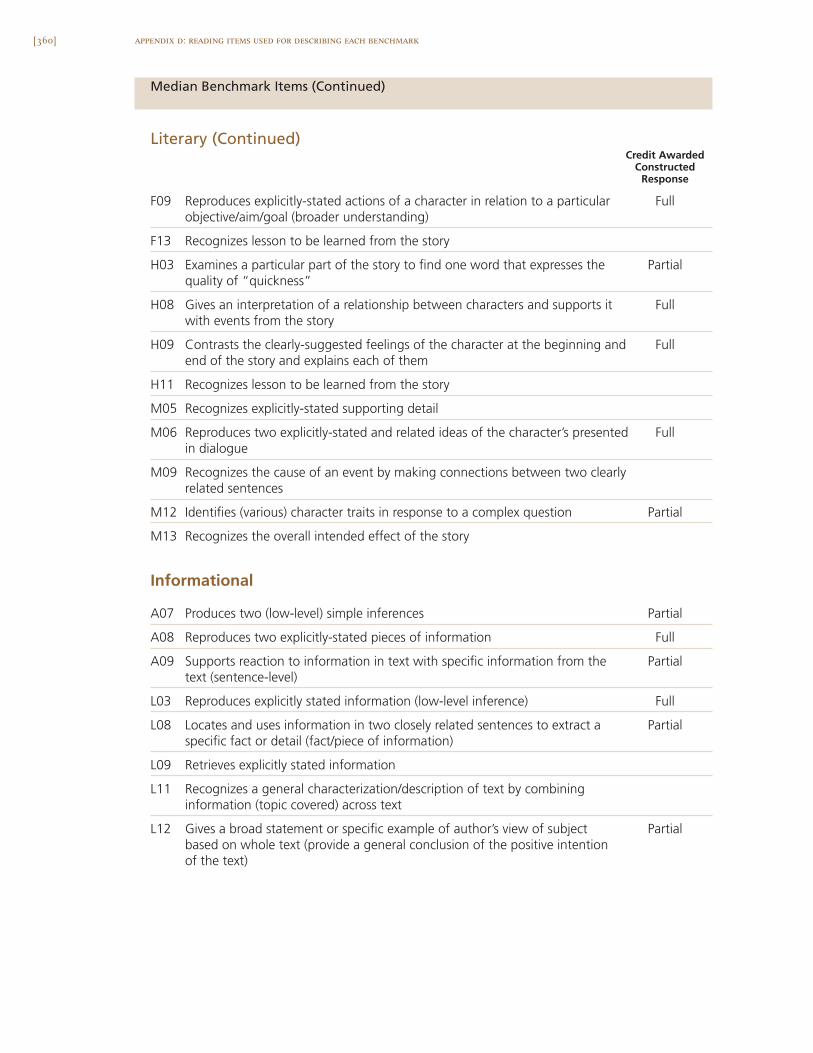
[360]
Median Benchmark Items (Continued)
Literary (Continued)Credit Awarded
Constructed Response
F09 Reproduces explicitly-stated actions of a character in relation to a particular Fullobjective/aim/goal (broader understanding)
F13 Recognizes lesson to be learned from the story
H03 Examines a particular part of the story to find one word that expresses the Partialquality of “quickness”
H08 Gives an interpretation of a relationship between characters and supports it Fullwith events from the story
H09 Contrasts the clearly-suggested feelings of the character at the beginning and Fullend of the story and explains each of them
H11 Recognizes lesson to be learned from the story
M05 Recognizes explicitly-stated supporting detail
M06 Reproduces two explicitly-stated and related ideas of the character’s presented Fullin dialogue
M09 Recognizes the cause of an event by making connections between two clearly related sentences
M12 Identifies (various) character traits in response to a complex question Partial
M13 Recognizes the overall intended effect of the story
Informational
A07 Produces two (low-level) simple inferences Partial
A08 Reproduces two explicitly-stated pieces of information Full
A09 Supports reaction to information in text with specific information from the Partialtext (sentence-level)
L03 Reproduces explicitly stated information (low-level inference) Full
L08 Locates and uses information in two closely related sentences to extract a Partialspecific fact or detail (fact/piece of information)
L09 Retrieves explicitly stated information
L11 Recognizes a general characterization/description of text by combining information (topic covered) across text
L12 Gives a broad statement or specific example of author’s view of subject Partialbased on whole text (provide a general conclusion of the positive intention of the text)
appendix d: reading items used for describing each benchmark
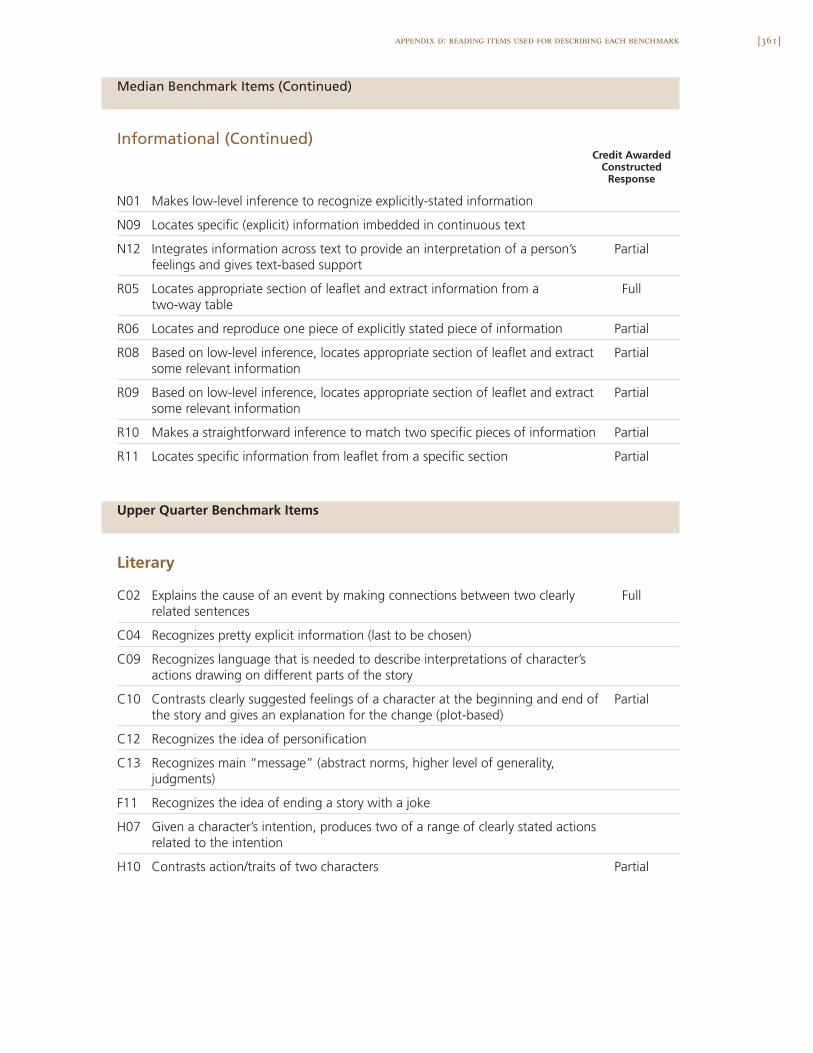
[361]appendix d: reading items used for describing each benchmark
Median Benchmark Items (Continued)
Informational (Continued)Credit Awarded
Constructed Response
N01 Makes low-level inference to recognize explicitly-stated information
N09 Locates specific (explicit) information imbedded in continuous text
N12 Integrates information across text to provide an interpretation of a person’s Partial feelings and gives text-based support
R05 Locates appropriate section of leaflet and extract information from a Fulltwo-way table
R06 Locates and reproduce one piece of explicitly stated piece of information Partial
R08 Based on low-level inference, locates appropriate section of leaflet and extract Partialsome relevant information
R09 Based on low-level inference, locates appropriate section of leaflet and extract Partialsome relevant information
R10 Makes a straightforward inference to match two specific pieces of information Partial
R11 Locates specific information from leaflet from a specific section Partial
Upper Quarter Benchmark Items
Literary
C02 Explains the cause of an event by making connections between two clearly Fullrelated sentences
C04 Recognizes pretty explicit information (last to be chosen)
C09 Recognizes language that is needed to describe interpretations of character’s actions drawing on different parts of the story
C10 Contrasts clearly suggested feelings of a character at the beginning and end of Partialthe story and gives an explanation for the change (plot-based)
C12 Recognizes the idea of personification
C13 Recognizes main “message” (abstract norms, higher level of generality, judgments)
F11 Recognizes the idea of ending a story with a joke
H07 Given a character’s intention, produces two of a range of clearly stated actions related to the intention
H10 Contrasts action/traits of two characters Partial

[362]
Upper Quarter Benchmark Items (Continued)
Literary (Continued)Credit Awarded
Constructed Response
M03 Recognizes the cause of the event by making connections between two clearly related sentences
M11 Makes interpretation and support with text-based reason Full
Informational
A02 Retrieves and matches two explicitly stated pieces of information
A07 Makes three low-level inferences (across two sentences) Full
A10 Locates embedded information and recognize its section heading
A11 Provides a distinguishing feature of a text type to support a preference Full
L05 Recognize the meaning of a simple metaphor (understanding of figurative language)
L06 Uses information in the text to make an inference about the importance of Fullthe information for today (inference, judgment, supporting statement)
L07 Integrates ideas and information (dates) across text and personal knowledge to recognize a reason for an event
L10 Demonstrates an understanding of the information conveyed in an abstract Partialtitle by giving an example from the text (make an appropriate interpretation of an abstract concept and support with an example from the text)
N02 Retrieves explicitly stated information that seems counter-intuitive
N04 Makes an inference based on connections across several sentences
N05 Retrieves explicitly stated information
N11 Makes an inference based on connections across several sentences
N13 Gives a general reaction to text and gives an example Full
R01 Recognizes correct description of purpose of text
R02 Recognizes correct description of purpose of text
R06 Locates appropriate section of leaflet and reproduces two explicitly-stated Fullpieces of information
R07 Makes straightforward inference based on embedded information Full
R09 Makes an interpretation to justify a choice based on information in the text Full
appendix d: reading items used for describing each benchmark
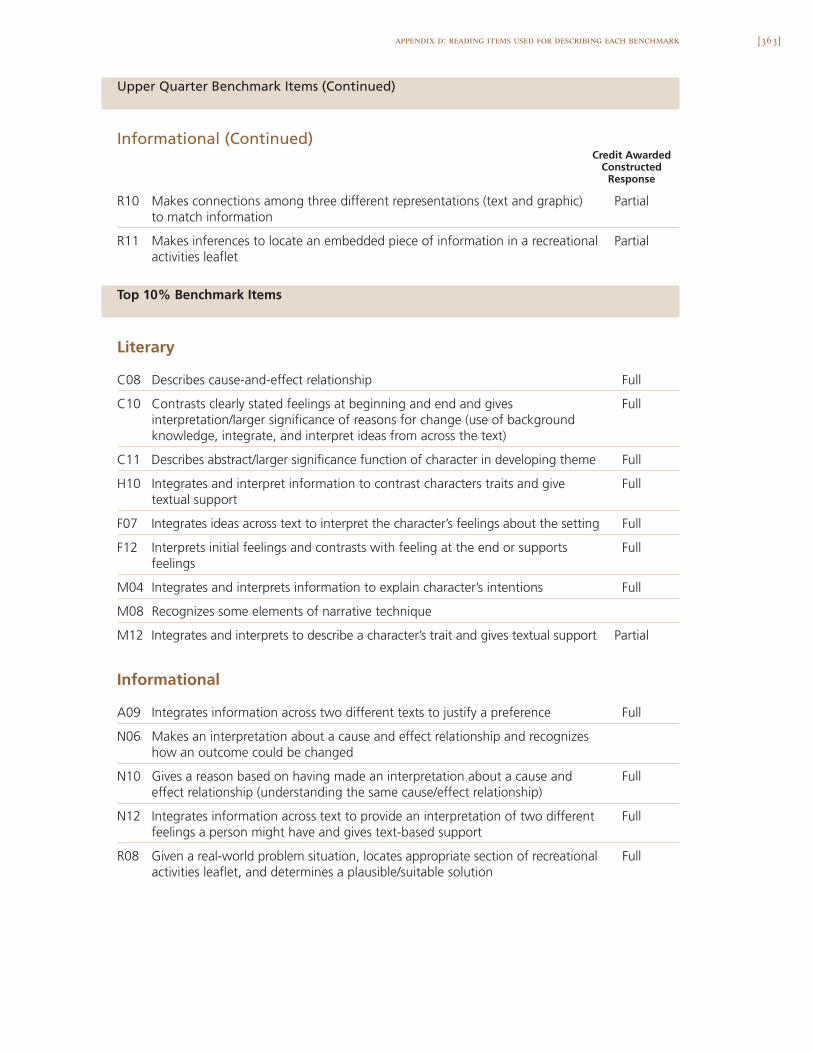
[363]appendix d: reading items used for describing each benchmark
Upper Quarter Benchmark Items (Continued)
Informational (Continued)Credit Awarded
Constructed Response
R10 Makes connections among three different representations (text and graphic) Partialto match information
R11 Makes inferences to locate an embedded piece of information in a recreational Partialactivities leaflet
Top 10% Benchmark Items
Literary
C08 Describes cause-and-effect relationship Full
C10 Contrasts clearly stated feelings at beginning and end and gives Fullinterpretation/larger significance of reasons for change (use of background knowledge, integrate, and interpret ideas from across the text)
C11 Describes abstract/larger significance function of character in developing theme Full
H10 Integrates and interpret information to contrast characters traits and give Full textual support
F07 Integrates ideas across text to interpret the character’s feelings about the setting Full
F12 Interprets initial feelings and contrasts with feeling at the end or supports Fullfeelings
M04 Integrates and interprets information to explain character’s intentions Full
M08 Recognizes some elements of narrative technique
M12 Integrates and interprets to describe a character’s trait and gives textual support Partial
Informational
A09 Integrates information across two different texts to justify a preference Full
N06 Makes an interpretation about a cause and effect relationship and recognizes how an outcome could be changed
N10 Gives a reason based on having made an interpretation about a cause and Fulleffect relationship (understanding the same cause/effect relationship)
N12 Integrates information across text to provide an interpretation of two different Fullfeelings a person might have and gives text-based support
R08 Given a real-world problem situation, locates appropriate section of recreational Fullactivities leaflet, and determines a plausible/suitable solution

E
[365]
Appendix ESweden - Grade 3 ReadingAchievement
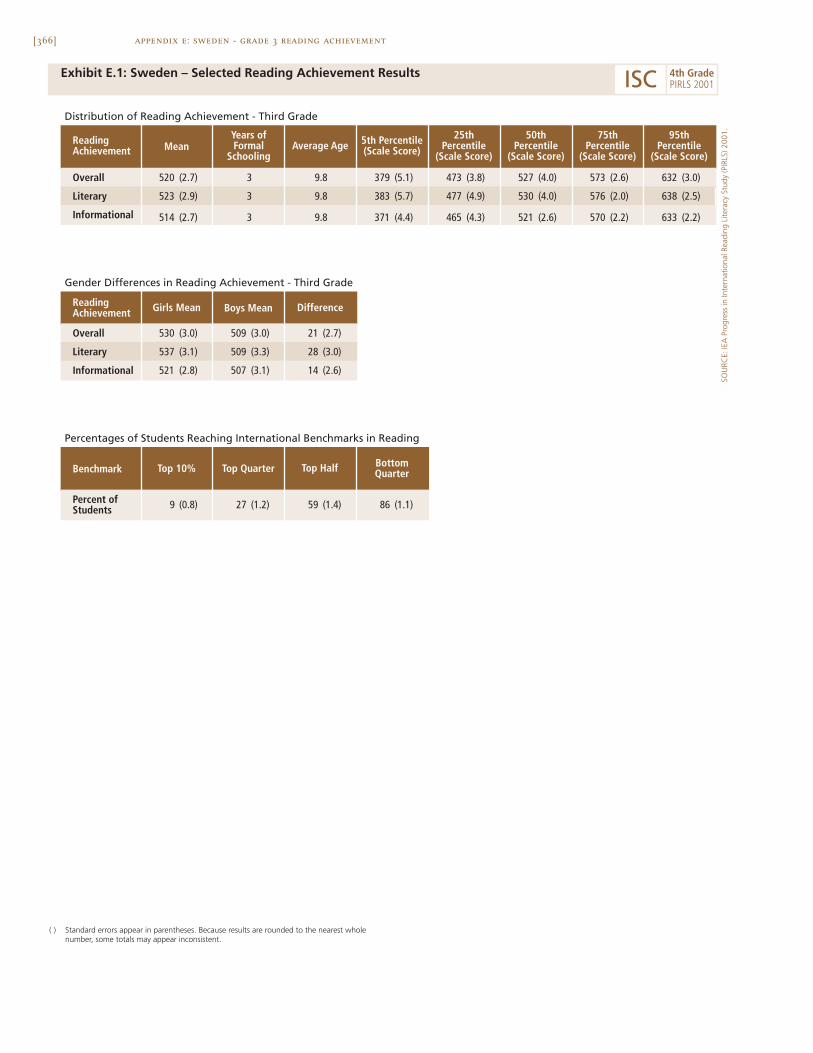
[366] appendix e: sweden - grade 3 reading achievement
Exhibit E.1: Sweden – Selected Reading Achievement Results
Distribution of Reading Achievement - Third Grade
520 (2.7) 379 (5.1) 473 (3.8) 527 (4.0) 573 (2.6) 632 (3.0)
523 (2.9) 383 (5.7) 477 (4.9) 530 (4.0) 576 (2.0) 638 (2.5)
514 (2.7) 371 (4.4) 465 (4.3) 521 (2.6) 570 (2.2) 633 (2.2)
3 9.8
3 9.8
3 9.8
25thPercentile
(Scale Score)Mean
Years ofFormal
SchoolingAverage Age 5th Percentile
(Scale Score)ReadingAchievement
Overall
Literary
Informational
50thPercentile
(Scale Score)
75thPercentile
(Scale Score)
95thPercentile
(Scale Score)
Gender Differences in Reading Achievement - Third Grade
530 (3.0) 509 (3.0) 21 (2.7)
537 (3.1) 509 (3.3) 28 (3.0)
521 (2.8) 507 (3.1) 14 (2.6)
Literary
Overall
Girls Mean
Informational
Boys Mean DifferenceReadingAchievement
9 (0.8) 27 (1.2) 59 (1.4) 86 (1.1)
Percentages of Students Reaching International Benchmarks in Reading
Top HalfBenchmark Top 10% Top Quarter BottomQuarter
Percent ofStudents
( ) Standard errors appear in parentheses. Because results are rounded to the nearest wholenumber, some totals may appear inconsistent.
SOU
RCE:
IEA
Pro
gres
s in
Inte
rnat
iona
l Rea
ding
Lite
racy
Stu
dy (P
IRLS
) 200
1.
ISC 4th GradePIRLS 2001
[367]appendix e: sweden - grade 3 reading achievement

F
[369]
Appendix FAcknowledgements
The design and development of PIRLS 2001 was achieved through the col-laborative efforts of individuals around the world. Staff from the nationalresearch centers in each participating country, members of advisory commit-tees, the International Association for the Evaluation for Educational Achieve-ment (IEA), funding agencies, and the International Study Center (ISC) atBoston College worked together to develop and implement the PIRLS 2001assessment. This appendix acknowledges the individuals and organizationsfor their contributions. Given that the development and implementation ofPIRLS 2001 has spanned approximately four years and has involved so manypeople and organizations, this list may not include all who contributed. Anyomission is inadvertent. PIRLS 2001 also acknowledges the students, teach-ers, and school principals who contributed their time and effort to the study.This report would not be possible without them.
Funding Agencies
Funding for the development of PIRLS 2001 was provided by the NationalCenter for Education Statistics of the U.S. Department of Education (NCES),The World Bank, and the participating countries. Valena Plisko, EugeneOwen, Dawn Nelson and Lawrence Ogle of NCES and Vincent Greaney of the
[370]
World Bank were instrumental in making PIRLS 2001 possible and for ensur-ing the quality of the study. Each participating country was responsible forfunding national project costs and implementing PIRLS in accordance with theinternational procedures.
Management and Operations
PIRLS 2001 was conducted under the auspices of the IEA. The study is directedby Ina V.S. Mullis and Michael O. Martin, and managed centrally by the staffof the International Study Center at Boston College, Lynch School of Education.The PIRLS International Study Center worked closely with organizations thatwere responsible for particular aspects of the study, the PIRLS advisory com-mittees, and representatives of the participating countries.
In the IEA Secretariat, Hans Wagemaker was responsible for oversee-ing fundraising and country participation. Barbara Malak, also of the IEASecretariat, was responsible for managing the ambitious translation verifica-tion effort and for recruiting international quality control monitors. Statis-tics Canada worked with countries to ensure that the international samplingprocedures were followed, adapted the international design to national con-ditions, documented the national samples, and computed sampling weights.The National Foundation for Educational Research in England and Wales hadmajor responsibility for developing the reading test, including collectingreading passages, developing items and scoring guides, and conducting scoringtraining. The IEA Data Processing Center was responsible for processing andverifying the data from the 35 countries, and for constructing the interna-tional database.
appendix f: acknowledgements
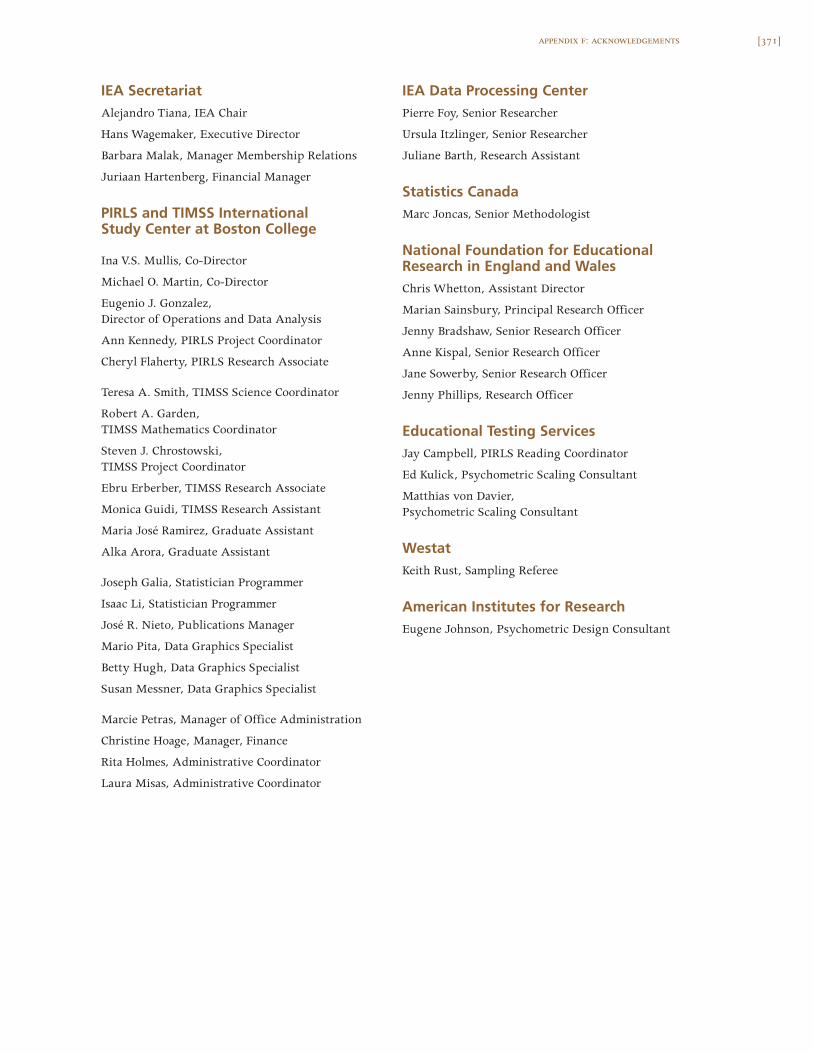
[371]appendix f: acknowledgements
IEA SecretariatAlejandro Tiana, IEA Chair
Hans Wagemaker, Executive Director
Barbara Malak, Manager Membership Relations
Juriaan Hartenberg, Financial Manager
PIRLS and TIMSS InternationalStudy Center at Boston College
Ina V.S. Mullis, Co-Director
Michael O. Martin, Co-Director
Eugenio J. Gonzalez,Director of Operations and Data Analysis
Ann Kennedy, PIRLS Project Coordinator
Cheryl Flaherty, PIRLS Research Associate
Teresa A. Smith, TIMSS Science Coordinator
Robert A. Garden, TIMSS Mathematics Coordinator
Steven J. Chrostowski,TIMSS Project Coordinator
Ebru Erberber, TIMSS Research Associate
Monica Guidi, TIMSS Research Assistant
Maria José Ramirez, Graduate Assistant
Alka Arora, Graduate Assistant
Joseph Galia, Statistician Programmer
Isaac Li, Statistician Programmer
José R. Nieto, Publications Manager
Mario Pita, Data Graphics Specialist
Betty Hugh, Data Graphics Specialist
Susan Messner, Data Graphics Specialist
Marcie Petras, Manager of Office Administration
Christine Hoage, Manager, Finance
Rita Holmes, Administrative Coordinator
Laura Misas, Administrative Coordinator
IEA Data Processing CenterPierre Foy, Senior Researcher
Ursula Itzlinger, Senior Researcher
Juliane Barth, Research Assistant
Statistics CanadaMarc Joncas, Senior Methodologist
National Foundation for EducationalResearch in England and WalesChris Whetton, Assistant Director
Marian Sainsbury, Principal Research Officer
Jenny Bradshaw, Senior Research Officer
Anne Kispal, Senior Research Officer
Jane Sowerby, Senior Research Officer
Jenny Phillips, Research Officer
Educational Testing ServicesJay Campbell, PIRLS Reading Coordinator
Ed Kulick, Psychometric Scaling Consultant
Matthias von Davier,Psychometric Scaling Consultant
WestatKeith Rust, Sampling Referee
American Institutes for ResearchEugene Johnson, Psychometric Design Consultant
[372]
PIRLS Advisory Committees
The PIRLS Reading Development Group (RDG) con-tributed their invaluable expertise to developingand reviewing the framework and reading test. TheRDG also worked with the PIRLS Reading Coordi-nator, NFER, and ISC staff members to develop thedescriptions of achievement at international bench-marks. The PIRLS Questionnaire DevelopmentGroup (QDG) helped develop the PIRLS question-naires, including writing items and reviewing draftsof all questionnaires.
PIRLS Reading Development GroupMarilyn Binkley National Center for Education Statistics United States
Karl Blueml Vienna School Board Austria
Sue Horner Qualifications and Curriculum Authority England
Pirjo Linnakylä University of Jyväskylä Finland
Martine Rémond Institut National de la Recherche Pédagogique France
William Tunmer Massey University New Zealand
Tan See Keen Ministry of Education Singapore
PIRLS Questionnaire Development Group Annette Lafontaine Université de Liège Belgium
Michael Marshall University of British Columbia Canada
Ivana Prochazkova Institute for Information on Education Czech Republic
Monica Rosén Göteborg University Sweden
Graham Ruddock National Foundation for Educational Researchin England and Wales England
Maurice Walker Ministry of Education New Zealand
appendix f: acknowledgements
[373]appendix f: acknowledgements
National Research Coordinators The PIRLS 2001 National Research Coordinators(NRCs) were responsible for the crucial task of imple-menting the study in their countries. They partici-pated in every aspect of the work to ensure that thestudy was of high quality. All the PIRLS 2001 NRCsand their staff members are to be commended fortheir professionalism and their dedication in con-ducting all aspects of the project.
Argentina
Lilia Toranzos Ministerio de Educación
Belize
Rosalind Bradley Denise RobateauBelize Teachers’ Training College
Bulgaria
Georgi BishkovFelyanka KaftandjievaUniversity of Sofia
Canada
Francine JaquesRobert Deschênes Education Quality & Accountability Office (EQAO)
Louis-Philippe Gaudreault Jean-Louis Lebel Ministère de l’Éducation
Michael Marshall University of British Columbia
Colombia
Martha Rocha Claudia Saenz Servicio Nacional de Pruebas
Cyprus
Mary KoutseliniConstantinos PapanastasiouUniversity of Cyprus
Czech Republic
Iveta KramplovaIvana Prochazkova Institute for Information on Education
England
Liz Twist National Foundation for EducationalResearch (NFER)
France
Marc Colmant Ministère de l’Éducation Nationale
Germany
Wilfried BosKnut SchwippertEva-Maria Lankes University of Hamburg
Greece
Georgia Kontogiannopoulou-PolydoridesCostas Basbas University of Athens
Hong Kong, SAR
Tse Shek-Kam The University of Hong Kong
Hungary
Péter Vari Emese Felvégi National Institute of Public Education Centre for Evaluation Studies
Iceland
Einar Gudmundsson University of Iceland
Islamic Republic of Iran
Abdol’azim Karimi Ministry of Education
Israel
Elite Olshtain Hebrew University
Ruth Zuzovsky Tel Aviv University
[374]
Italy
Gabriella Pavan de GregorioNational Institute for the Evaluationof the Educational System (CEDE)
Kuwait
Mansour Hussein Ministry of Education
Latvia
Ieva Johansone University of Latvia
Lithuania
Aiste Mackeviciute Ministry of Education and Science
Republic of Macedonia
Bojana Naceva Pedagogical Institute of Macedonia
Moldova
Ilie Nasu Ministry of Education & Science
Morocco
Abdellah Belachkar Ministère de L’Education Nationale
The Netherlands
Mieke Van Diepen University of Nijmegen
New Zealand
Megan ChamberlainMaurice Walker Ministry of Education
Norway
Finn Egil Tønnessen Ragnar Gees Solheim Stavanger College
Romania
Gabriela Noveanu Institute for Educational Sciences
Russian Federation
Galina Kovalyova Institute of General Secondary Education
Scotland
Liz Levy Brian Semple Scottish Office Education and Industry Department
Singapore
Siow-Chin Ng Ministry of Education
Slovak Republic
Zuzana Lukacková SPU-National Institute for Education
Slovenia
Marjeta Doupona-Horvat Center for IEA Studies Educational Research Institute
Sweden
Monica Rosén Göteborg University
Turkey
Yurdanur Atlioglu Educational Research and DevelopmentDirectorate (ERDD)
United States of America
Laurence Ogle Dawn Nelson National Center for Education Statistics (NCES)
appendix f: acknowledgements
[375]appendix f: acknowledgements
typographySet in Apollo, Frutiger, and Meridien,designed by Adrian Frutiger.
photographsGetty Images and Corbis
cover & book designJosé R. Nieto
production coordinatorSusan L. Messner
layoutSusan L. Messner,Betty Hugh, and Mario A. Pita
Copyright © 2022 FDOKUMEN