Languages as factors of reading achievement in PIRLS assessments
347
UNIVERSITE DE B OURGOGNE Faculté de Lettres et Sciences Humaines École doctorale LISIT Institut de Recherche sur l’Éducation IREDU - CNRS THÈSE Texte présenté en vue de l’obtention du titre de Docteur de l’Université de Bourgogne Discipline : Sciences de l’Education par Gabriela GÓMEZ VERA Dijon, 27 Janvier 2011 Languages as factors of reading achievement in PIRLS assessments Directeur de thèse Bruno S UCHAUT MEMBRES DU JURY : Mesdames et Messieurs Pascal BRESSOUX Professeur à l’Université Pierre-Mendès-France – Grenoble II Marc DEMEUSE Professeur à l’Université de Mons-Hainaut Michel FAYOL Professeur à l’Université Blaise Pascal – Clermont-Ferrand II Martine REMOND Maître de conférences IUFM de Créteil Bruno S UCHAUT Professeur à l’Université de Bourgogne tel-00563710, version 1 - 7 Feb 2011
Transcript of Languages as factors of reading achievement in PIRLS assessments
UNIVERSITE DE BOURGOGNE
Faculté de Lettres et Sciences Humaines
École doctorale LISIT
Institut de Recherche sur l’Éducation
IREDU - CNRS
THÈSE
Texte présenté en vue de l’obtention du titre de
Docteur de l’Université de Bourgogne
Discipline : Sciences de l’Education
par
Gabriela GÓMEZ VERA
Dijon, 27 Janvier 2011
Languages as factors of readingachievement in PIRLS assessments
Directeur de thèse
Bruno SUCHAUT
MEMBRES DU JURY : Mesdames et Messieurs
Pascal BRESSOUX Professeur à l’Université Pierre-Mendès-France – Grenoble II
Marc DEMEUSE Professeur à l’Université de Mons-Hainaut
Michel FAYOL Professeur à l’Université Blaise Pascal – Clermont-Ferrand II
Martine REMOND Maître de conférences IUFM de Créteil
Bruno SUCHAUT Professeur à l’Université de Bourgogne
tel-0
0563
710,
ver
sion
1 -
7 Fe
b 20
11

tel-0
0563
710,
ver
sion
1 -
7 Fe
b 20
11
À mes grands parents Blanca Alicia et Jorge
tel-0
0563
710,
ver
sion
1 -
7 Fe
b 20
11
Remerciements
Je tiens à exprimer ma plus profonde reconnaissance à M. Bruno Suchaut pour
son soutien, pour son encadrement lors de la rédaction de cette thèse et pour la
confiance dont il a fait preuve à mon égard.
Je tiens à exprimer aussi mes remerciements aux membres du jury, qui ont accepté
d’évaluer mon travail de thèse.
J’aimerais par ailleurs exprimer mes profondes gratitudes aux membres de l’IREDU,
les chercheurs, les enseignants, les docteurs, les futurs docteurs aussi comme les
membres du personnel administratif.
Je suis particulièrement reconnaissant à Madame Denise Sauvadet, service des
relations internationales du CROUS, parce que grâce à sa diligence ce séjour à
Dijon a été très réussi.
Cette thèse a été réalisée avec le soutien financier de la commission nationale
chilienne pour la science et la technologie (CONICYT) et l’Ambassade de France
au Chili.
Gracias Juan Carlos por secundarme en todo, nada de esto habría sido lo mismo si
no lo hubiese compartido contigo. A mi hermana y mis sobrinos: Mauren, Eduardo
y Cristina, cuyo cariño nunca he dejado de sentir a pesar de la distancia.
Gracias a mis amigos por su apoyo a toda prueba, en Viña del Mar, Santiago, Dijon
y Barcelona, especialmente a aquellos que han compartido esta aventura conmigo,
Marcela y Manu, Frank, así como también Paola, Michel, Agustina y Agustin.
2
tel-0
0563
710,
ver
sion
1 -
7 Fe
b 20
11
Résumé
Cette thèse est une contribution aux études sur l’acquisition de la lecture et de
la langue. La question clé que nous nous avons posé est : « l’acquisition de lalecture, peut-elle être plus ou moins effective en fonction de la langue dans laquelleelle s’effectue ? ». Cet problème peut être simple en apparence, mais il comporte
une série d’autres problématiques.
Premièrement, il a été nécessaire de définir ce que nous appelons lecture, ainsi,
trois de ses propriétés ont été mobilisées. D’abord, l’accent a été mis sur le caractère
multidimensionnel de l’acte de lire, qui peut varier en fonction de paramètres tells
que la finalité de la lecture ou les processus cognitifs requis pour comprendre
un texte. Ensuite, on a souligné le rôle actif du lecteur autant que constructeur
de sens, c’est-à-dire, participant à la création de la significativité d’un texte ; ceci
implique de prendre en compte les circonstances qui déterminent l’acte de lire, no-
tamment le contexte individuel et social du lecteur. Finalement, en ce qui concerne
l’acquisition de la lecture, l’accent a été mis sur l’évolution de l’oral à l’écrit, en
supposant une augmentation progressive de la complexité de la lecture, dans la
mesure où elle est un processus cognitif.
Le deuxième problème théorique concerne la détermination de ce qui permet de
distinguer une langue d’une autre. Afin de répondre à cette question, des para-
mètres ont été établis pour classer les langues en vue de mettre en évidence les
dissimilitudes qui peuvent exister entre celles-ci. Premièrement, nous avons pris
comme référence le concept de familles linguistiques, qui permet de faire ressortir
les connexions entre les langues en fonction de leurs liens historiques et culturels ;
en général, les langues qui proviennent de la même racine, ne partagent pas seule-
ment une étymologie ou des structures syntaxiques, mais aussi un passé commun
et une vision du monde. Deuxièmement, il y a certaines propriétés du passage de
l’oral à l’écrit qui peuvent faire une différence dans la qualité de la lecture, à savoir,
la régularité avec laquelle l’orthographe représente les phonèmes de la langue,
laquelle peut faire de la lecture une tâche plus ou moins transparente ; c’est la
notion de profondeur orthographique. Dans les catégories les plus extrêmes, nous
trouvons, d’une part, l’Anglais comme une langue hautement irrégulière et d’une
difficile acquisition, et d’autre part, des langues comme l’italien ou l’espagnol dont
la régularité se rapproche de l’idéal d’une orthographe phonétique.
À partir de ces références théoriques on a pu aborder plus solidement notre su-
3
tel-0
0563
710,
ver
sion
1 -
7 Fe
b 20
11
jet, mais pour la mise en œuvre ce travail, il a été aussi nécessaire de disposer
d’informations qui permettent de décrire les compétences en lecture, la langue
et les facteurs liés aux sujets lecteurs. C’est pourquoi nous avons fait appel aux
données produites à partir de PIRLS. Coordonné par l’IEA, il s’agit d’une étude des
compétences en littéracie chez des enfants âgés de 9 à 10 de plus de 30 pays à tra-
vers le monde. Dans le cadre de notre problématique, cette étude nous a offert la
possibilité d’établir des liens entre la lecture et les langues des pays participants, en
incluant des renseignements sur les circonstances environnementales et scolaires
des élèves. PIRLS suppose comme hypothèse que la maîtrise de la lecture est liée
à trois facteurs : l’objectif ou type de texte, les compétences de compréhension
requises par le processus de lecture, et les caractéristiques sociales, économiques
et culturelles. De plus, PIRLS a permis d’effectuer un suivi des résultats dans le
temps puisqu’il y a, jusqu’à maintenant deux vagues de l’étude, 2001 et 2006.
Des procédures
À partir de cette approche théorique et afin de répondre à la question posée dans
la problématique, une série de procédures ont été mises en œuvre. La première
à été celle de classer les langues présentes dans PIRLS, à partir des deux critères
mentionnés, premièrement les groupes de langues liées par familles linguistiques,
et ensuite les langues reliées par un même niveau de profondeur orthographique.
Parallèlement, les facteurs environnementaux et scolaires ont été étudiés. Après
avoir recueilli suffisamment d’informations sur les catégories linguistiques et les
facteurs contextuels, nous avons cherché à les rapprocher aux dimensions qui com-
posent l’acte de lecture selon PIRLS (lecture informative, littéraire, processus de
compréhension simples et complexes). Finalement, la dernière procédure a été la
création d’un modèle d’interprétation statistique capable de rendre compte du rôle
de la langue et d’autres facteurs associés au rendement en lecture.
En ce qui concerne l‘étude préliminaire des liens entre les catégories linguistiques,
les facteurs contextuels, et les dimensions de la lecture, cette démarche avait une
double finalité. Premièrement, on a cherché à enrichir l’étude des variables lin-
guistiques en établissant le contexte dans lequel elles prennent place. C’est-à-dire,
recueillir les informations nécessaires afin de développer un modèle explicatif dans
lequel les langues ne sont pas les seules déterminantes du rendement en lecture,
mais aussi d’autres facteurs liés aux individus et au contexte scolaire. Deuxième-
4
tel-0
0563
710,
ver
sion
1 -
7 Fe
b 20
11
ment, nous avons cherché à mettre en évidence les différences possibles entre les
dimensions de la lecture, de façon à intégrer dans le modèle explicatif les facteurs
qui ont déterminé différemment une dimension ou l’autre. Cette procédure est
fondée sur l’hypothèse que si les dimensions ont été déterminées par des diffé-
rents facteurs, elles peuvent avoir un pouvoir explicatif différent. Ainsi, une même
variable expliquera que 5% de la variance d’une dimension, (e.g. score littéraire),
en revanche elle expliquera 10% des la variance d’une autre dimension (e.g. score
informatif).
Afin d’identifier ces déterminants potentiels, nous avons estimé les corrélations
entre les résultats des tests PIRLS et un nombre important des questions en pro-
venance des enquêtes. Les variables dérivées à partir des réponses des élèves, des
enseignants et des responsables des écoles, ont été corrélées avec les différences
entre les dimensions de la lecture ; ce qui a permis la création d’indices en repré-
sentant les facteurs inférés à partir de ces variables. Les modèles multi–niveaux
incluent cinq facteurs en représentant des caractéristiques des individus, dérivée
des réponses des élèves, et six facteurs scolaires, dérivés de réponses des ensei-
gnants et des directeurs.
La littérature spécialisée est d’accord pour remarquer que ces modèles multi–
niveaux présentent un avantage important quand il s’agit d’une analyse de sys-
tèmes éducatifs en tenant compte de sa structure hiérarchisée. Dans notre étude,
on propose un modèle à deux niveaux : étudiant–école, car d’après la comparaison
avec d’autres possibilités, celle-ci s’est revelée la plus adaptée pour expliquer les
données.
Résultats
Les résultats de la modélisation, nient l’hypothèse selon laquelle la langue déter-
mine l’acquisition de la lecture. On ne peut pas affirmer que le fait de parler une
langue ou une autre fait varier le résultat obtenu dans ce test, car aucune des ca-
tégories utilisées (les familles linguistiques, la profondeur orthographique) n’a été
en mesure d’expliquer la variance du rendement en lecture, ni entre les individus
ni entre les écoles. En outre, les résultats sont similaires pour les différentes di-
mensions de la lecture, aucune différence n’a été trouvée parmi les facteurs qui
déterminent les dimensions prises en compte.
5
tel-0
0563
710,
ver
sion
1 -
7 Fe
b 20
11
Cette carence de détermination peut être interprétée à la fois négativement et
positivement. D’une part, si la langue avait été un facteur déterminant de l’acqui-
sition de la lecture, le modèle aurait pu apporter un nouvel élément aux facteurs
déjà connus, par conséquent, la langue aurait été une nouvelle source explicative
par rapport au rendement en lecture. Un autre aspect, « négatif », est la transfor-
mation du rôle de la langue, vu de son importance dans les premiers moments de
l’acquisition de l’écrit ; pendant des tâches de décodage, la complexité orthogra-
phique s’est avéré être une source clé d’explication des différences d’acquisition de
lecture entre une langue et l’autre.
Cependant, on comprend rapidement que ce manque de détermination de la langue
en lecture est plutôt un avantage, car elle provient, en fait, de l’aspect le plus
positif de ce résultat : il n’est pas plus facile ou difficile de répondre aux items
de PIRLS dans une langue déterminée. Notre recherche montre que, au niveau
macro, il y a des scores différents entre les groupes linguistiques ; en particulier,
l’Anglais a une moyenne plus élevée que les autres familles linguistiques et que les
langues aux orthographes plus simples ; pourtant, selon le modèle, cet avantage
ne détermine ni les résultats des élèves, ni celui des écoles. Au niveau des pays,
cet avantage pourrait être tiré d’autres aspects (culturels, économiques, sociaux),
mais ce n’est pas une conséquence de conditions linguistiques particulières. En
outre, s’il dépendait des conditions linguistiques, les résultats des élèves anglo-
phones devraient être au-dessous de la moyenne, puisque la littérature spécialisée
suppose une désavantage très probable pour la langue anglaise, compte tenu de
son orthographe complexe ; cela n’a pas été confirmé par nos résultats.
Un résultat distinct est obtenu grâce à l’analyse des facteurs liés aux caractéris-
tiques individuelles et des facteurs liés au milieu scolaire. Ils sont en mesure d’ex-
pliquer au moins une partie de la différence des scores entre les individus et entre
les écoles. Dans la modélisation, quand les variables individuelles sont incorporées
comme sources uniques de la détermination, elles expliquent environ 20% de la
variance entre les scores des élèves et plus de 40% de la variance entre les écoles.
Cette importante proportion indique qu’il y a une correspondance entre les carac-
téristiques des élèves et les écoles qu’ils fréquentent. Cela peut fonctionner dans
les deux sens, puisque, d’une part, il est possible que les caractéristiques soient le
résultat de la formation reçue à l’école, et d’autre part, il est aussi possible que les
caractéristiques soient la cause du choix d’une école ou d’une autre. Par ailleurs,
les facteurs scolaires sont proportionnellement moins explicatifs du rendement en
6
tel-0
0563
710,
ver
sion
1 -
7 Fe
b 20
11
lecture, seuls, ils n’expliquent que 10% de la variance des scores entre les écoles.
Le facteur « acquérir tôt dans la scolarité des compétences en lecture » est la variable
scolaire la plus déterminante. En plus, les principales sources de détermination
entre les facteurs individuels sont les variables « quantité de livres disponibles dansle foyer », « ressources matérielles pour la scolarité », et « des attitudes favorablesenvers la lecture ». Ces résultats sont constants entre les deux échantillons, celui de
2001 et celui de 2006.
Une forte influence de l’école a été aussi identifiée (ICC = .42). Cette influence
dépend en grande partie du système éducatif des pays, qui peut être détermi-
nant comme en Macédoine (ICC = .51) ou peu influant comme en Slovénie
(ICC = .11), pays remarquable pour l’homogénéité de ses écoles. En d’autres
termes, l’école fréquentée détermine en grande partie le rendement en lecture,
avec toutefois des fortes variations d’un pays à l’autre.
Les résultats produits dans cette recherche sont, bien sûr, contingents au contexte
de l’enquête PIRLS, ils ont toutefois le mérite de mobiliser une perspective longi-
tudinale qui fait apparaître une cohérence de ces résultats à travers le temps.
7
tel-0
0563
710,
ver
sion
1 -
7 Fe
b 20
11
Contents
Résumé . . . . . . . . . . . . . . . . . . . . . . . . . . . . . . . . . . . . 3
1 Defining Reading 16
1.1 Premises about reading . . . . . . . . . . . . . . . . . . . . . . . . 20
1.2 Premises about reading learning . . . . . . . . . . . . . . . . . . . . 22
1.3 Global purposes . . . . . . . . . . . . . . . . . . . . . . . . . . . . . 25
I Theoretical Framework 27
2 Describing Languages 28
2.1 Ethnographic description . . . . . . . . . . . . . . . . . . . . . . . . 30
2.1.1 Culture and History in Languages Evolution . . . . . . . . . 30
2.1.2 Linguistic Families in PIRLS assesments . . . . . . . . . . . 32
2.2 Phonological description . . . . . . . . . . . . . . . . . . . . . . . . 43
2.2.1 General notions about psycholinguistic and phonology . . . 43
2.2.2 Orthography and alphabetic systems . . . . . . . . . . . . . 49
3 PIRLS Assessment and Reading Research 64
3.1 Description of the study . . . . . . . . . . . . . . . . . . . . . . . . 67
3.1.1 History of the Study . . . . . . . . . . . . . . . . . . . . . . 67
3.1.2 Reading definition in PIRLS . . . . . . . . . . . . . . . . . . 69
3.2 What is PIRLS measuring? . . . . . . . . . . . . . . . . . . . . . . . 73
3.2.1 Aspects of Student’s Reading Literacy . . . . . . . . . . . . . 73
3.2.2 Assessment description . . . . . . . . . . . . . . . . . . . . . 81
8
tel-0
0563
710,
ver
sion
1 -
7 Fe
b 20
11
Contents
3.3 Criticism on PIRLS . . . . . . . . . . . . . . . . . . . . . . . . . . . 89
3.3.1 Criticized features . . . . . . . . . . . . . . . . . . . . . . . 89
3.3.2 Language and Cultural validity . . . . . . . . . . . . . . . . 90
3.4 How to compare reading acquisition among languages? . . . . . . 94
3.4.1 Research Problem . . . . . . . . . . . . . . . . . . . . . . . 94
3.4.2 Hypothesis . . . . . . . . . . . . . . . . . . . . . . . . . . . 95
3.4.3 Research objectives . . . . . . . . . . . . . . . . . . . . . . . 100
3.4.4 Methodological procedure . . . . . . . . . . . . . . . . . . . 100
II Development of experiments 108
4 Criteria to establish linguistic categories 109
4.1 Language in PIRLS . . . . . . . . . . . . . . . . . . . . . . . . . . . 110
4.1.1 Especial linguistic cases . . . . . . . . . . . . . . . . . . . . 113
4.1.2 Multilingualism cases . . . . . . . . . . . . . . . . . . . . . 115
4.2 Linguistic Family as factor . . . . . . . . . . . . . . . . . . . . . . . 119
4.2.1 Descriptive variable . . . . . . . . . . . . . . . . . . . . . . 119
4.2.2 Modeling variable . . . . . . . . . . . . . . . . . . . . . . . 122
4.3 Orthographic depth as factor . . . . . . . . . . . . . . . . . . . . . 126
4.3.1 Orthographic properties of PIRLS languages . . . . . . . . . 127
4.3.2 Classifying orthographic depth . . . . . . . . . . . . . . . . 147
5 Individual and school factors related to reading aspects 152
5.1 PIRLS 2001 . . . . . . . . . . . . . . . . . . . . . . . . . . . . . . . 157
5.1.1 Reading objectives 2001 . . . . . . . . . . . . . . . . . . . . 157
5.1.2 Processes of Comprehension 2001 . . . . . . . . . . . . . . 174
5.2 PIRLS 2006 . . . . . . . . . . . . . . . . . . . . . . . . . . . . . . . 187
5.2.1 Reading objectives 2006 . . . . . . . . . . . . . . . . . . . . 187
5.2.2 Processes of Comprehension 2006 . . . . . . . . . . . . . . 198
5.3 Description of the findings . . . . . . . . . . . . . . . . . . . . . . . 211
9
tel-0
0563
710,
ver
sion
1 -
7 Fe
b 20
11
Contents
5.3.1 Factors related to the purposes of reading . . . . . . . . . . 212
5.3.2 Factors related to the comprehension processes . . . . . . . 215
5.3.3 Factors related to both aspects of reading . . . . . . . . . . 216
6 Factor that influence reading in PIRLS 217
6.1 General Description . . . . . . . . . . . . . . . . . . . . . . . . . . 219
6.1.1 Variables and Factors to be incorporated in the analysis . . . 219
6.1.2 Comparative sample . . . . . . . . . . . . . . . . . . . . . . 225
6.2 Hierarchical Models . . . . . . . . . . . . . . . . . . . . . . . . . . 231
6.2.1 Structure of the model: the null model . . . . . . . . . . . . 231
6.2.2 Modelling linguistic Variables . . . . . . . . . . . . . . . . . 237
6.2.3 Contextual determinants . . . . . . . . . . . . . . . . . . . . 244
6.2.4 Final Models . . . . . . . . . . . . . . . . . . . . . . . . . . 253
Conclusion 267
Answers to the hypotheses . . . . . . . . . . . . . . . . . . . . . . . . . . 268
Findings about factors of PIRLS reading achievement . . . . . . . . . . . 273
References 277
Appendix 289
A PIRLS variables derived from Questionnaires 289
A.1 2001 questionnaires . . . . . . . . . . . . . . . . . . . . . . . . . . 290
A.1.1 Pearson Correlation Coefficients with TEX 2001 . . . . . . . 290
A.1.2 Pearson Correlation Coefficients with COM 2001 . . . . . . 298
A.2 2006 questionnaires . . . . . . . . . . . . . . . . . . . . . . . . . . 307
A.2.1 Pearson Correlation Coefficients with TEX 2006 . . . . . . . 307
A.2.2 Pearson Correlation Coefficients with COM 2006 . . . . . . 311
B Hierarchical models for partial scores 321
B.1 2001 models . . . . . . . . . . . . . . . . . . . . . . . . . . . . . . 322
10
tel-0
0563
710,
ver
sion
1 -
7 Fe
b 20
11
Contents
B.1.1 PIRLS 2001 literary score . . . . . . . . . . . . . . . . . . . 322
B.1.2 PIRLS 2001 informative score . . . . . . . . . . . . . . . . . 323
B.1.3 PIRLS 2001 low order processes score . . . . . . . . . . . . 324
B.1.4 PIRLS 2001 high order processes score . . . . . . . . . . . . 325
B.2 2006 models . . . . . . . . . . . . . . . . . . . . . . . . . . . . . . 326
B.2.1 PIRLS 2006 literary score . . . . . . . . . . . . . . . . . . . 326
B.2.2 PIRLS 2006 informative score . . . . . . . . . . . . . . . . . 327
B.2.3 PIRLS 2006 low order processes score Models . . . . . . . . 328
B.2.4 PIRLS 2006 high order processes score Models . . . . . . . 329
C SAS and R programs 330
C.1 Programs for preliminary analysis . . . . . . . . . . . . . . . . . . . 331
C.1.1 2006 Linguistic families at country level . . . . . . . . . . . 331
C.1.2 2001 Literary score at countries . . . . . . . . . . . . . . . . 332
C.1.3 Example: analysis of a question from teacher 2001 question-naire . . . . . . . . . . . . . . . . . . . . . . . . . . . . . . . 332
C.1.4 Macro to create variables . . . . . . . . . . . . . . . . . . . 333
C.2 Models . . . . . . . . . . . . . . . . . . . . . . . . . . . . . . . . . . 335
C.2.1 Null Models . . . . . . . . . . . . . . . . . . . . . . . . . . . 335
C.2.2 Linguistic Models . . . . . . . . . . . . . . . . . . . . . . . . 335
C.2.3 School variance by country . . . . . . . . . . . . . . . . . . 336
C.3 R. graphics . . . . . . . . . . . . . . . . . . . . . . . . . . . . . . . 338
C.3.1 Boxplot in figure 6.1 . . . . . . . . . . . . . . . . . . . . . . 338
C.3.2 Plots in figure 6.2 . . . . . . . . . . . . . . . . . . . . . . . . 338
C.4 LATEX . . . . . . . . . . . . . . . . . . . . . . . . . . . . . . . . . . . 341
Abstract . . . . . . . . . . . . . . . . . . . . . . . . . . . . . . . . . . . . 345
11
tel-0
0563
710,
ver
sion
1 -
7 Fe
b 20
11
List of Tables
2.1 The evolution of Romance Languages . . . . . . . . . . . . . . . . . 39
3.1 PIRLS 2001 distribution of items by reading purpose, process cate-gory and format . . . . . . . . . . . . . . . . . . . . . . . . . . . . . 82
3.2 PIRLS 2006 distribution of items by reading purpose, process cate-gory and format . . . . . . . . . . . . . . . . . . . . . . . . . . . . . 85
3.3 Comparison of items distribution 2001 – 2006 . . . . . . . . . . . . 86
3.4 Variable TEX 2006, Pearson Correlation Coefficients . . . . . . . . . 104
3.5 Differences between reading aspects by country . . . . . . . . . . . 105
4.1 Languages in PIRLS Assesments . . . . . . . . . . . . . . . . . . . . 110
4.2 2006 Differences by component in Canadian provinces . . . . . . . 114
4.3 Literary and Informative scores and their difference in Spain . . . . 117
4.4 Linguistic Families in 2001 sample . . . . . . . . . . . . . . . . . . 119
4.5 Linguistic Families in 2006 sample . . . . . . . . . . . . . . . . . . 120
4.6 Linguistic families in comparative sample . . . . . . . . . . . . . . 122
4.7 Distribution of families in the comparative sample . . . . . . . . . . 123
4.8 Degree of opacity of PIRLS languages . . . . . . . . . . . . . . . . . 149
5.1 French and English countries and TEX 2001 . . . . . . . . . . . . . 153
5.2 PIRLS 2001 scores . . . . . . . . . . . . . . . . . . . . . . . . . . . 155
5.3 PIRLS 2006 scores . . . . . . . . . . . . . . . . . . . . . . . . . . . 156
5.4 Correlation Coefficients: Variable TEX - Student Indexes . . . . . . 160
5.5 Correlation Coefficients: Variable TEX - Teacher Indexes . . . . . . 163
5.6 Correlation Coefficients: Variable TEX - School Index . . . . . . . . 167
12
tel-0
0563
710,
ver
sion
1 -
7 Fe
b 20
11
List of Tables
5.7 Linear regression results: TEX 2001 - Indexes and Language . . . . 171
5.8 Correlation Coefficients: Variable COM - Student Indexes . . . . . . 175
5.9 TEX and COM compared correlations . . . . . . . . . . . . . . . . . 176
5.10 Correlation Coefficients: Variable COM - Teacher Indexes . . . . . . 179
5.11 Correlation Coefficients: Variable COM - School Indexes . . . . . . 181
5.12 Linear regression results: COM 2001 - Indexes and Language . . . 184
5.13 Correlation Coefficients: Variable TEX - Student Indexes . . . . . . 188
5.14 Correlation Coefficients: Variable TEX - Teacher Indexes . . . . . . 192
5.15 Linear regression results: TEX 2006 - Indexes and Language . . . . 196
5.16 Correlation Coefficients: Variable COM - Student Indexes . . . . . . 199
5.17 Correlation Coefficients: Variable COM - Teacher Indexes . . . . . . 202
5.18 Correlation Coefficients: Variable COM - School Indexes . . . . . . 206
5.19 Linear regression results: COM 2006 - Indexes and Language . . . 208
6.1 Number of observations in PIRLS dataset . . . . . . . . . . . . . . . 218
6.2 Comparable individual factors . . . . . . . . . . . . . . . . . . . . . 219
6.3 Comparable school factors . . . . . . . . . . . . . . . . . . . . . . . 221
6.4 Correlation Matrix: scores PIRLS 2001 . . . . . . . . . . . . . . . . 223
6.5 Correlation Matrix: scores PIRLS 2006 . . . . . . . . . . . . . . . . 223
6.6 Linguistic Families, Scores and differences in 2001 and 2006 . . . . 225
6.7 Orthographic depth, scores and differences in 2001 and 2006 . . . 226
6.8 Scores and differences in bilingual countries . . . . . . . . . . . . . 229
6.9 Scores and differences in New Zealand 2006 . . . . . . . . . . . . . 230
6.10 PIRLS 2001 total score Null Model . . . . . . . . . . . . . . . . . . 232
6.11 Deviance between two and tree levels models . . . . . . . . . . . . 236
6.12 PIRLS 2001 total score Models . . . . . . . . . . . . . . . . . . . . 238
6.13 PIRLS 2006 total score Models . . . . . . . . . . . . . . . . . . . . 239
6.14 Attitudes from children and parents variables . . . . . . . . . . . . 247
6.15 2001 and 2006 final models . . . . . . . . . . . . . . . . . . . . . . 255
6.16 Models applied to French sample . . . . . . . . . . . . . . . . . . . 261
13
tel-0
0563
710,
ver
sion
1 -
7 Fe
b 20
11
List of Tables
6.17 Models applied to United States sample . . . . . . . . . . . . . . . 263
6.18 Models applied to Russian sample . . . . . . . . . . . . . . . . . . . 265
A.1 TEX 2001 and the Student Questionnaire . . . . . . . . . . . . . . . 290
A.2 TEX 2001 and the Teacher Questionnaire . . . . . . . . . . . . . . . 292
A.3 TEX 2001 and the School Questionnaire . . . . . . . . . . . . . . . 295
A.4 COM 2001 and the Student Questionnaire . . . . . . . . . . . . . . 298
A.5 COM 2001 and the Teacher Questionnaire . . . . . . . . . . . . . . 300
A.6 COM 2001 and the School Questionnaire . . . . . . . . . . . . . . . 304
A.7 TEX 2006 and the Student Questionnaire . . . . . . . . . . . . . . . 307
A.8 TEX 2006 and the Teacher Questionnaire . . . . . . . . . . . . . . . 309
A.9 TEX 2006 and the School Questionnaire . . . . . . . . . . . . . . . 310
A.10 Com 2006 and the Student Questionnaire . . . . . . . . . . . . . . 311
A.11 COM 2006 and the Teacher Questionnaire . . . . . . . . . . . . . . 314
A.12 COM 2006 and the School Questionnaire . . . . . . . . . . . . . . . 319
14
tel-0
0563
710,
ver
sion
1 -
7 Fe
b 20
11
List of Figures
2.1 Afro-Asiatic: Semitic Branch . . . . . . . . . . . . . . . . . . . . . . 32
2.2 Indo-European: Albanian and Baltic Branches . . . . . . . . . . . . 35
2.3 Indo-European: Germanic Branch . . . . . . . . . . . . . . . . . . . 36
2.4 Indo-European: Italic Branch . . . . . . . . . . . . . . . . . . . . . 38
2.5 Indo-European: Slavic Branch . . . . . . . . . . . . . . . . . . . . . 40
2.6 Examples of scripts along history . . . . . . . . . . . . . . . . . . . 46
2.7 Seymour’s classification of languages, deepness and complexity . . 61
3.1 Contexts of reading literacy . . . . . . . . . . . . . . . . . . . . . . 74
4.1 Plot of languages scores . . . . . . . . . . . . . . . . . . . . . . . . 125
4.2 Plot of languages scores . . . . . . . . . . . . . . . . . . . . . . . . 150
6.1 School Variance and ICC within countries 2006 . . . . . . . . . . . 234
6.2 Variation of the effect of some factors across schools . . . . . . . . 258
15
tel-0
0563
710,
ver
sion
1 -
7 Fe
b 20
11
Chapter 1
Defining Reading
Until the mid-twentieth century, reading was often considered as the path to ac-
cess to the meaning locked in the depth of a written work. All reflections and
intellectual efforts turned around this idea. For example, a key work in literary
theory is the study of Russian folk tales, achieved by Propp published in 1928.
Through the analysis of a corpus of 100 tales, he identified a series of recurrent
functions and characters. He concluded that any folk tale or fairy tale could be
resolved into 31 functions and 8 character types. Later, this theory was applied
to other fictional works like theater plays, films, and novels. In such a formalist
point of view, the role played by reading in evidently secondary. Reading is only
an instrument to accomplish the task of identifying the structure, functions, and
characters. Another side of this same approach is the notion of “literariness” deve-
loped by Propp’s colleges: Shklovsky, Eichenbaum, and others members of Russian
formalist theoretical movement. Here too, the literary work is considered like a
special object, different from other similar objects like non fictional writing. The
formalists aimed to define this essence, which is not determined at all by reading
conditions or strategies.
This point of view was, at the same time, a continuation and a break point from a
long tradition of reading theory focuses in texts and authors; readers were totally
absent of these theoretical reflections. If, during the nineteenth century, the focus
of attention was put on historical, biographical, and cultural context, Russian for-
malism reduced the importance of all aspects related to authors to focus on textsthemselves. The agreeing point of these traditions is the passive role accorded to
readers.
16
tel-0
0563
710,
ver
sion
1 -
7 Fe
b 20
11
Chapter 1. Defining Reading
This was the predominant approach during the mayor part of the twentieth cen-
tury, particularly developed by structural theory (Lévi-Strauss (1958), Barthes
(1953), starting from Saussure’s proposals), which applied this formalism, not
only to literary texts, but also to all linguistic communications.
However, through history, this was not the only way of understanding linguistic
communication. In previous periods, the effects that could be caused in the recep-
tor of a text was the center of concern for Rhetoric. Even if roman rhetoricians like
Cicero, were interested mainly in oral communication, they applied their theories
in their writing texts. The hypothesis in rhetoric was that effective communication
can lead the audience to be convinced of the qualities of the proposal. In this case
the interaction between the producer and the receptor of a communicative work
was the center of interest.
Returning to the theme of the evolution of reading, during the twentieth century,
a major change was caused by the reintroduction of this very same element: the
reader. But this time, it was not from the point of view of the text producers, like
rhetoricians, but from the point of view of the readers themselves. It was during
the highest point of the structuralism influence, that a dissident voice, Jacques
Derrida (1967), broke out with one of the main premises of this current: there
was not a meaning outside the structure of a text, the structure itself is all there
is. From this nihilist point of view, the meaning is only a function of the structure,
with no values by itself.
However, this was not the end of text studies; on the contrary, very soon after a
new theory put the silent element of structuralism, the reader, in the very center
of the discussion. Reader-response criticism was first developed at the German
university of Constance, where two mayor scholars: Wolfgang Iser (1997) and
Hans Robert Jauss (1978) proposed a theory of reception that addressed this issue.
This school of thought, criticized the notion of text proposed by structuralism,
saying that the significance of a text depends not only on the text itself, but also
on the reader.
According to Wolfgang Iser, the reader is, himself, one of the authors of the text
insofar as he participates in the creation of its significance. For the theorist, a text
is not an object, but an effect that is waiting to be explained. During reading, not
all the information is explicit; much of the necessary elements used to construct
the meaning of the text are implied. For Iser, the act of reading is to complete the
17
tel-0
0563
710,
ver
sion
1 -
7 Fe
b 20
11

sense in responding to the challenges of the text, this reaction will be the way to
access the deeper meanings. As a result, to successfully construct meaning, the
reader must count on the help of his/her reading skills, in other words, this theory
encompasses the impact of factors that influence reading, including previous ex-
perience with similar texts, cognitive and metacognitive processes, and the effects
of context (social, cultural, educational).
Despite of the fact that this exposition mainly focuses on literature and linguistic,
it has been only a way to enter into the complex field of Reading theory, which
is a key concept to understand reading learning and actual studies about its de-
velopment. In addition, it is important to mention that this is a field of collective
work, several research areas participated in the development of this knowledge on
reading. Linguistics, anthropology, semiotics, literary theory, sociolinguistics, and
cognitive science have all made contributions to the conception of reading which
is now used.
To introduce the research work that will be undertaken in the next pages, it is
necessary to start with an idea of what reading is today. However, because of the
exploratory nature of this research, a complete definition cannot be expected. It
is preferable to discuss some current premises that will allow the presentation of
the theme and problematic of this work.
In this context, the idea of the reader as a constructor of meaning is the key con-
cept. A review of the definitions of reading that are widespread in contemporary
literature, can confirm this idea. For example, three definitions from very different
books and articles prove this connection:
First, from an encyclopedia of language:
Reading comprehension refers to understanding the meaning of writ-
ten words; sentences, and text. Readers try to understand the written
message of the writer at different levels (lexical, syntactic, semantic,
and pragmatic). Reading comprehension is an active process; that is
affected by complex interactions between the content of the text it-
self, the reader’s prior knowledge and goals, and various cognitive and
metacognitive activities and processes. (Aarnoutse, Leeuwe, & Verho-
even, 2005, p. 255)
Second, in the introductory pages of a research about reading learning, Ziegler
18
tel-0
0563
710,
ver
sion
1 -
7 Fe
b 20
11
Chapter 1. Defining Reading
& Goswami (2005) define reading as: “Reading is the process of understanding
speech written down. The goal is to gain access to meaning. To acquire reading,
children must learn the code used by their culture for representing speech as a
series of visual symbols” (p.3). Finally, the central role of readers can be appreci-
ate in the definition made by Bachman (1990) in his deep study about language
evaluation: “Most current frameworks of language use are based on the concept
of language as communication, and recognize the importance of the context, both
discourse and sociolinguistic, in which language is used” (p. 9).
These definitions underline the role of readers in accessing meaning. Readers and
reading have become a central element of actual paradigm about written commu-
nication. These three definitions also allow to observe two other premises about
reading that are fundamental in today’s research: the definition of reading as a
cognitive process and the importance of context. Understanding as context all the
environmental and individuals elements that determine readers and, consequently,
their reading. To introduce the theme to be studied here, it is necessary to intro-
duce first these two notions and also introduce two specific premises derived from
the relation of reading and learning.
19
tel-0
0563
710,
ver
sion
1 -
7 Fe
b 20
11
1.1. Premises about reading
1.1 Premises about reading
“Today, it is generally agreed that reading is a complex process encompassing de-
coding abilities and comprehension abilities”(Hagtvet, Helland, & Lyster, 2006).
As this definition underlines, reading is a process, but not a simple one. It is de-
termined by its cognitive character and, at the same time, by the social interaction
that its implies (see Oakhill & Beard, 1995). Moreover, it has been described as
a pluridimentional process: “Skillful reading is not a unitary skill. It is a whole
complex system of skills and knowledge” (Adams, 1990, p.3). That is, reading is
not only one process, but several cognitive tasks responding to several dimensions
that make up a text (see Van Dijk & Kintsch, 1983). This notion is related to the
Reader response theory, because its underlines the importance of implicit informa-
tion in the texts to which the reader must gain access. This perspective (close to
Cognitive science) underlines the role played by reading skills that readers can
learn and build up.
From the point of view of the text, there are several dimensions that constitute
a text. The deeper ones have been defined as information lying beyond the sur-face, depending on processes of abstraction of an increasing complexity. Van Dijk
(1980) described this as Semantic macrostructures: overall meaning or topic to
which a text refers; it can be explicitly stated in a text, or can be abstracted from
it. The macrostructure is the deeper level of a text, and it is different from the
microstructure or superficial level. Microstructure is constituted of local elements
like words, sentences, and paragraphs.
In relation to education, the fundamental effect of this multidimensional config-
uration is that the reader must be capable of gaining access to all the different
dimensions by applying multiple cognitive procedures. But the reader is not alone
in this work, as the following second premise states.
The second premise about reading is the fundamental role played by context, as
the quoted by Ziegler & Goswami (2005) remarked, the reading process is deter-
mined by culture, and also, by social, economical and historical circumstances in
which the reader is immersed. As the Bachman (1990) definition underlined,
context determines reading as a social process of language. The consequences of
this supposition are numerous, particularly in relation to reading learning. For
example, Baker, Afflerbach, & Reinking (1996) developed a series of hypotheses
in relation to the diversity of social environments: “There are ... both qualita-
20
tel-0
0563
710,
ver
sion
1 -
7 Fe
b 20
11

Chapter 1. Defining Reading
tive and quantitative differences in the ways that children from different cultural
groups experience literacy. The influence of these differential experiences during
the preschool years may extend into the school years” (p. 3). What is necessary
to underline is the importance of the role played by the readers and their contexts
of lecture in today’s theoretical research about communication through written
language.
In summary, present definitions of reading cannot avoid considering those two as-
pects, the multidimensional character of reading as a process, and the role played
by the context. Both are main determinants of the quality of reading, that is, they
can determine how well comprehension is achieved, which is why they cannot be
avoided when considering reading learning.
These two aspects put reading in a perspective totally opposite from older theo-
ries, but there are other aspects that should be included. They are not related to
questions about what reading is, as the previous premises, but they are related to
the question about what learning to read is.
21
tel-0
0563
710,
ver
sion
1 -
7 Fe
b 20
11
1.2. Premises about reading learning
1.2 Premises about reading learning
First of all, it is necessary to introduce a developmental element to reading, consid-
ering that it is not the same to read during the first years of learning than it is as an
advanced learner. Reading learning evolves over time, and so do comprehension
abilities.
To describe this phenomenon, one of the current terms used is stages. For example,
Chall (1996) has proposed several Stages of Reading Development, she inspired her
proposals by Piaget’s theory of cognitive development. Chall defines five stages
and a prereading period. In this step zero, children imitate the act of reading but
without having the basic concept of the process, which will be learned during the
first stage: Initial reading or decoding stage. Then, a confirmation stage follows, in
which fluency is the main goal, once the aspect of decoding is surpassed. Later,
children will be able to use reading to acquire information, this is the stage of
reading for learning the new, which matches whit Grades 4-8, Ages 8-14, according
to formal education. Finally, stages four and five: improve the reading to aspects
as multiple viewpoints and construction and reconstruction of the meaning, and
correspond to adult life and independent reading.
The importance of quoting this theory is related to the role that it can play in
learning. For example, Goswami & Bryant (1990) underline the importance of
changes in developmental reading:
It is not just a matter ... of saying that children of seven can now read
a lot of words which were too difficult for them a year ago. We need
to know if the seven year old has acquired some underlying skill which
makes it possible for him or her to read the new words. ‘Underlying’ is
the important word here. Theories about developmental changes have
to explain the underlying nature of these changes.(141)
This idea of change and variability was already introduced together with the idea
of the reader as creator of meaning. Now, besides the differences from reader to
reader, there is also an inner change across learning process. Since the object of
this research will be related to the first stages of reading development, this is an
idea that will be present during the entire exposition.
22
tel-0
0563
710,
ver
sion
1 -
7 Fe
b 20
11
Chapter 1. Defining Reading
Secondly, there is another assumption generally accepted by present research, it
is related to the association between oral and written comprehension. Oral com-
munication is natural in societies, the essential knowledge to develop linguistic
communication seems to be part of our genetic heritage (see Chomsky, 2001). On
the contrary, to use graphical marks to represent language, to read and write, are
skills that must be acquired by training. However, there is a relation between both
ways of using language: a good understanding of the sounds of a language, called
phonological awareness. This is related to a faster and more efficient learning of
writing language.
A mayor reference pertaining to this subject is the paper of Bradley & Bryant
(1983) Categorizing sounds and learning to read: a causal connection. Its main
point is that the experience reported, proves that phonological awareness plays
a role as a predictor of success in learning to read. That was a large scale study
involving training processes with children and longitudinal analysis of the results.
They concluded that “The awareness of rhyme and alliteration which children
acquire before they go to school, possibly as a result of their experiences at home,
has a powerful influence on their eventual success in learning to read and to spell”
(p. 420). Moreover, the researchers stated that “there were high correlations
between the initial sound categorization scores and the children’s reading and
spelling over 3 year later” (page 419). This has become a recurrent reference
when estimating the importance of phonological awareness not only in beginning
reading, but also, in later stages of development.
The importance of phonological awareness is related to the alphabetic principle.
This principle plays a central role in most modern languages that use conventional
representations of sounds to construct words and then graphical messages:
Word identification or word recognition constitutes the foundation of
the reading process. Word recognition implies, among other things,
that children understand the principle of the alphabet or, in others
words, see that the sounds of a spoken word correspond to the letters
of a written word. Every letter of the alphabet represents, in princi-
ple, a speech sound with a meaningful distinction. Word recognition
implies at the level of early literacy that children can transpose the
letters of a word into sounds (the grapheme-phoneme) association),
connect the sounds to a spoken word; and assign a meaning to this
word. (Aarnoutse, Leeuwe, & Verhoeven, 2005, pp. 254–255)
23
tel-0
0563
710,
ver
sion
1 -
7 Fe
b 20
11
1.2. Premises about reading learning
As this quotation underlines, there is a direct connection between sounds, alpha-
bets, graphemes, words, and reading comprehension. These are all concepts that
will be referenced during this dissertation.
Besides the recurrent presence of both premises in current definition of reading
learning, it is also possible to apply the hypothesis of developmental stages to the
ability of making use of sounds in reading. As (Adams, 1990) proposes, this aware-
ness can evolve through time too. The researcher identified five levels: awareness
of the sounds of words, ability to focus attention on the component of the sounds,
familiarity with the syllable concept, ability to analyze word’s phonemes, ability
to manipulate phonemes.
This last proposition only gives an example of the vast possibilities of interpreta-
tion and application of these premises. These two propositions about learning,
together with the two, more general, proposals about reading are the main con-
cept of current research. But, far from giving clues about what reading is, they are
only the entrance to the density of this subject.
24
tel-0
0563
710,
ver
sion
1 -
7 Fe
b 20
11
Chapter 1. Defining Reading
1.3 Global purposes
These ideas will be present in this research as guiding concepts and as part of
the goals and proposals. The theme of this dissertation is reading, that is why
it started with this short exposition. However, the subject will be a very specific
aspect of the universe of reading. In section 3.4.4.c the research questions and
objectives will be presented, but before that, the element that will be part of the
study will be deeply described.
There are two element that, along with reading, form the fundamental pillars
that support this research. In first place, a precise component of reading was
identified as an interesting subject: language, the linguistic code, even if it is quite
obvious that reading depends on language acquisition, the many facets that are
present in this connection are not as obvious. Only to introduce the problematic,
the complexity of the relation between reading and phonology can be mentioned.
The relation between reading and language will be the subject of chapter 2, where
this and other issues will be referenced.
However, the aim of this research is not only theoretical, to be able to propose
hypotheses and answer them, a third pillar is necessary, that is, an empirical refer-
ence that allows experimenting, proving or refusing the research questions. This
basis is PIRLS, the Progress in International Reading Literacy Study, a study con-
ducted by the International Association for the Evaluation of Educational Achieve-
ment, intended to measure children’s reading achievement. Chapter 3, will de-
scribe this study and explain why and how it will be used as a source of data in
relation to the research problems. Then, part II will be devoted to development
and application of experimental tests to investigate the hypotheses, making use of
statistical procedures.
In summary, this research is about a specific aspect of reading learning, under-
standing it as a communication process: the linguistic code. It will be stud-
ied in relation to reading comprehension measured by the PIRLS assessment in
terms of reading achievement. Many factors can vary during reading, be more or
less present or even totally absent, but this process will always be accomplishing
through the use of language. The guiding statement of this research is that lan-
guage is the main source of reading. By searching to understand how language
and reading interact, this study aims to touch on the core of this subject.
25
tel-0
0563
710,
ver
sion
1 -
7 Fe
b 20
11

1.3. Global purposes
But, the goal is not to give any mayor answers, it is simply to study a particular
aspect of this relation. This work searches, in first place, to describe the relation of
languages and reading. Secondly, from this theoretical framework, to deduce some
research questions, and finally, from this starting point, to implement experiments
to test the relation of language and reading achievement; without forgetting the
context that enclose all reading experience.
26
tel-0
0563
710,
ver
sion
1 -
7 Fe
b 20
11
Part I
Theoretical Framework
27
tel-0
0563
710,
ver
sion
1 -
7 Fe
b 20
11
Chapter 2
Describing Languages
The first aim of this exposition is to explain why language is considered as an
interesting component of the process of reading. To accomplish this task, the
relation between reading and language will be deeply studied. A main concern
is to link the characteristic of language with the notions about reading that were
already presented.
The main supposition that will guide the following pages is that it is not useless to
question the role of language in reading, and particularly in a reading assessment
like PIRLS. The reason is that, as reading, language can be described from more
than one point of view. Consequently, because depending on a chosen point of
view, different theoretical approaches and evaluation procedures can determine
the way in which reading is tested.
Following the discussion in the previous chapter, two approaches of the relation
between language and reading will be discussed. First, a cultural approach, that
implies to take into account the context and the reception process in this relation.
In second place, a linguistic approach will be discussed. This is a more abstract
approach, that is, isolated from context, but that establish a procedure to char-
acterize the relation between reading and language starting from the structural
properties of languages.
With the characterization of these approaches, different concepts will imply differ-
ent perspectives in a research procedure. If language is defined not as an isolated
phenomenon but in interrelation with other factors, the significance given to them
will also change. This is the reason why the next step after the definition and de-
28
tel-0
0563
710,
ver
sion
1 -
7 Fe
b 20
11

Chapter 2. Describing Languages
scription of the relation between languages and reading will be the development
of classifications able to be included as variables in a modelling procedure. How-
ever, to accomplish this task a deeper analysis of the rest of the aspects concerned
by this problematic should be clarified first. That will be the subject of the other
chapters of this theoretical framework.
29
tel-0
0563
710,
ver
sion
1 -
7 Fe
b 20
11
2.1. Ethnographic description
2.1 Ethnographic description
2.1.1 Culture and History in Languages Evolution
The defined goal of this subsection is to describe languages and their relations
from a sociological and cultural point of view, that is, underlying the relevance
of context. Starting from that definition, a first proposal to classify languages will
follow. The first question that must be answered to get there is: how are languages
related from the point of view of society and culture? The key to the answer are
historiography and philology: to look at the evolution of languages, how they are
born, expand and, sometimes, disappear, along with the societies and cultures that
created them.
Historical linguistic is a well developed science; nowadays there is copious infor-
mation about languages of the world, particularly concerning their properties and
their evolution. Moreover, the origins of some of these languages have been hy-
pothesized, getting to recreate disappeared languages as Indo-European. In this
context:
A high proportion of lexico-phonetic correspondences is the criterion
used by traditional comparative philology to define the language family
– members of which, it is assumed, have developed from one and the
same language spoken by a single language community at some time
in the past. (Posner, 1996, p. 71)
However, for our research, a first problem that will be encountered in this def-
inition is about priorities: if we are pursuing a cultural approach, are linguistic
characteristics the best criteria to establish relations among languages? We will
see that there are languages very close to each other, in lexicon, phonetic or other
linguistic aspects, but whose speakers are incapable of understanding each other;
on the other hand, there are languages having no common ancestors but sharing
a geographical space or a common cultural history, as in colonial territories. So, if
we commit us to define the relation of languages from the point of view of philol-
ogy, we will put in the same category languages that do not share culture. Or, if we
use a cultural only criteria, we will link up languages with no common philological
roots.
30
tel-0
0563
710,
ver
sion
1 -
7 Fe
b 20
11
Chapter 2. Describing Languages
Since this section of our research is guided by a more cultural than technical point
of view, a simple classification cannot be done by following criteria already deve-
loped. To reach this goal, we will describe languages in the following paragraphs,
putting a particular emphasis on their relations and cultural resemblances. Obvi-
ously it is not possible attempting to describe even a minimal part of the 6,909
living languages of the world (Lewis, 2009a). Since the empirical chapters of this
research will be focused on languages present in one or both versions of PIRLS
assessments, this seems to be the best option to work with a manageable and de-
scribable sample. Even if it is only in chapter 4.1 that these languages will be
defined.
The notion of linguistic family (already quoted) is the axis that will allow us to
organize this description. Consequently, in this section, families more than isolated
languages will be illustrated. A family is a group of languages that are related
because they descent from a common ancestor, an original language. Through
time, depending in economical, social, religious and (or) political factors, they can
evolve into different languages and spread through different geographical areas.
Considering both versions of PIRLS, a total of ten families take part of the sample,
with a large presence of languages coming from the Indo-European family. In
many other cases there is only one or two languages coming from a specific family,
however, this is not an inadequacy of the sample, it corresponds to the actual
situation of many regions of the world, where there has been only a small group
of societies that have imposed their languages to weaker groups. On the other
hand, these few survivors of certain families can also be the withstanders of an
external influence as in the case of Basque in Iberia or Georgian in the region
of the Slavic influence. Consequently, this lack of balance among families is not a
failure but a property of real state of languages, specifically in regions of European
or North-American influence.
In the next paragraphs we will mention the families that will constitute our sam-
ple and describe their most remarkable characteristics. It must be mentioned that
what follows is based on SIL research along with ISO-639 standards and online
encyclopedias as Britannica and Wikipedia to assure the most up-to-date informa-
tion.
31
tel-0
0563
710,
ver
sion
1 -
7 Fe
b 20
11
2.1. Ethnographic description
2.1.2 Linguistic Families in PIRLS assesments
2.1.2.a Afro-Asiatic Family
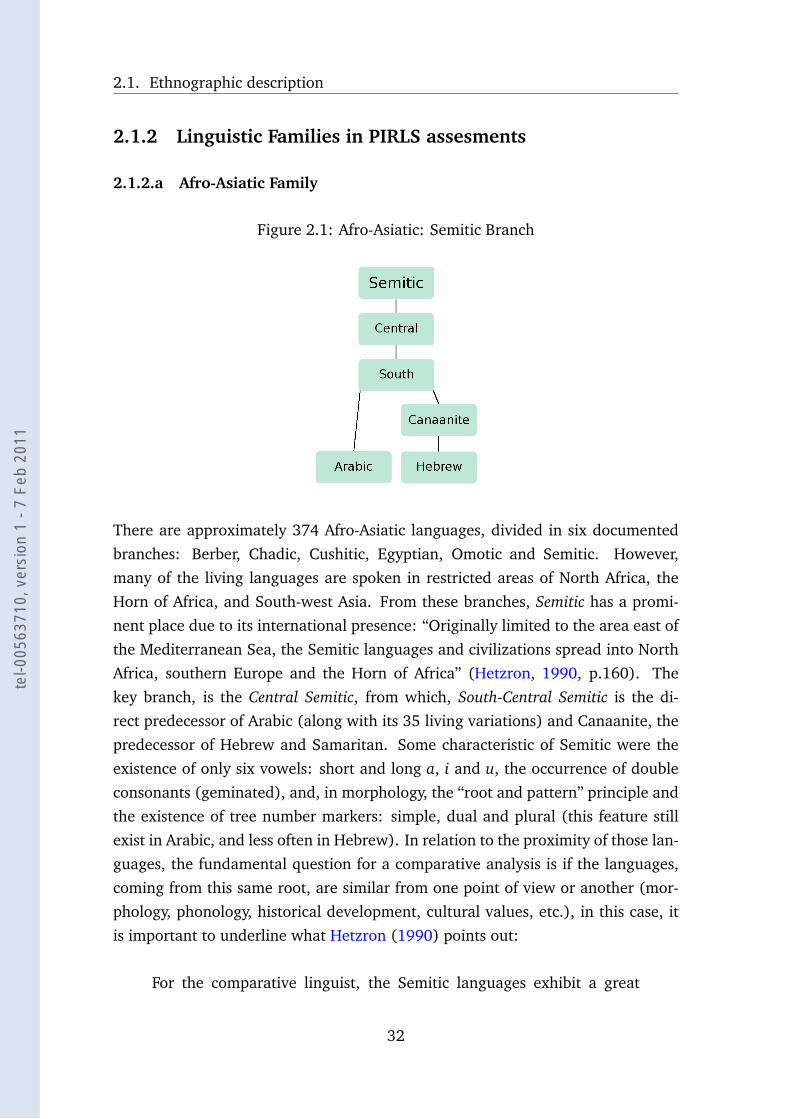
Figure 2.1: Afro-Asiatic: Semitic Branch
There are approximately 374 Afro-Asiatic languages, divided in six documented
branches: Berber, Chadic, Cushitic, Egyptian, Omotic and Semitic. However,
many of the living languages are spoken in restricted areas of North Africa, the
Horn of Africa, and South-west Asia. From these branches, Semitic has a promi-
nent place due to its international presence: “Originally limited to the area east of
the Mediterranean Sea, the Semitic languages and civilizations spread into North
Africa, southern Europe and the Horn of Africa” (Hetzron, 1990, p.160). The
key branch, is the Central Semitic, from which, South-Central Semitic is the di-
rect predecessor of Arabic (along with its 35 living variations) and Canaanite, the
predecessor of Hebrew and Samaritan. Some characteristic of Semitic were the
existence of only six vowels: short and long a, i and u, the occurrence of double
consonants (geminated), and, in morphology, the “root and pattern” principle and
the existence of tree number markers: simple, dual and plural (this feature still
exist in Arabic, and less often in Hebrew). In relation to the proximity of those lan-
guages, the fundamental question for a comparative analysis is if the languages,
coming from this same root, are similar from one point of view or another (mor-
phology, phonology, historical development, cultural values, etc.), in this case, it
is important to underline what Hetzron (1990) points out:
For the comparative linguist, the Semitic languages exhibit a great
32
tel-0
0563
710,
ver
sion
1 -
7 Fe
b 20
11
Chapter 2. Describing Languages
deal of similarity. The family is much more uniform than, say, Indo-
European. Yet, from a practical point of view, these languages are very
different, there being no mutual comprehensibility even between the
close relatives. (p.160)
For instance, from a purely linguistic point of view it can be said that there are
structural correspondences among the languages, but from the point of view of
culture, and from the point of view of the speakers of these languages, there is not
such familiarity.
2.1.2.b Altaic Family
The Altaic family is spread from north Asia to Eastern Europe, and it is particu-
larly present in a wide line along central Asia. Three major languages historically
considered as Altaic are Turkic, Mongolic, and Tungusic. Recently Korean and
Japanese have also been considered in this family. However, the definition of this
family has been full of controversies, and its actual structure has been established
only in recent research (Blažek, 2006).
In fact, the existence of the hypothetical proto-altaic was questioned by scholars
arguing that there is more a resemblance due to interactions than due to a com-
mon ancestor. Some of the shared features of Altaic languages are also commonly
present in all kinds of languages. Currently, the accepted features considered as
Altaic are: an agglutinating morphology (frequent use of affixes), the SOV wordorder (subject-object-verb) and the use of postpositions (instead of prepositions).
Another important distinction of Altaic is their difference with the rest of the lan-
guages present in the region: “The Altaic languages differ from the neighbouring
languages of East Asia in two important respects. They typically lack honorific
language, and there is no significant difference between the speech of men and
women. Furthermore, gender distinctions are absent” (Britannica, 2010).
In our sample, Turkish is the only language representing this family, that is why,
from the point of view of culture and historical resemblance it is isolated. How-
ever, it is a very interesting case because of its phonological properties, which will
be discussed in chapter 4.
33
tel-0
0563
710,
ver
sion
1 -
7 Fe
b 20
11
2.1. Ethnographic description
2.1.2.c Austronesian
These are the native languages of Southeast Asia and the Pacific Islands. Because
of this geographical distribution, many of the 1257 Austronesian languages are
spoken in isolated islands and / or little communities. Due to this wide spread
and the great number of living languages coming from Austronesian, it is difficult
to notice familiarity. However, there are common characteristics; a tendency to
simplicity in phonemic and morphology, the common use of reduplication to create
new words and CV syllables structure.
Two languages of this family are present in the sample: Indonesian and Maori.
They are not quite related since they come from two different sub-groups of
Malayo-Polynesian, the principal branch of Austronesian. Maori belongs to the
Oceanic group, and it is a native language of New Zealand. The Maori alphabet,
counts only with 20 letters, and use Latin scripts to be represented, since there is
no evidence of an independent graphical system, prior to the arrival of settlers. In-
donesian has a very different status, since it is a standardized dialect, established
since Indonesian independence. Its origin is Malay, a group spread across Malaysia
and Indonesia, derived from Nuclear Malayo-Polynesian branch of Austronesian.
This language is phonetically consistent in its writing system, which means that it
is close to direct correspondence between graphemes and phonemes.
2.1.2.d Indo–european Family
This is the most important historical family, because it encloses some of the world’s
major languages, with three billion native speakers (Lewis, 2009a); today the
greatest part of the world use a language originated from its numerous subdivi-
sions. However, this does not mean that the speakers can understand each other,
or that all these languages are similar from the point of view of linguistic structure.
It is a:
Family of languages which by about 1000 BC were spoken over a large
part of Europe and parts of southwestern and southern Asia. Indo-
European is essentially a geographical term: it refers to the eastern-
most (India) and westernmost (Europe) expansion of the family at the
time it was proven to be a linguistic group”. (Baldik, 1990, p.21)
34
tel-0
0563
710,
ver
sion
1 -
7 Fe
b 20
11
Chapter 2. Describing Languages
As Baldik says, Indo—European is more a regional term than a linguistic link, even
if the linguistic conditions to identify a family are present(shared vocabulary and
evolutional features).
Because of this great diversity and the importance of this family in the world today,
its subdivisions are almost as important as if they were independent families. The
first line of branches of Indo-European counts 11 sub-families, two are extinct:
Anatolian and Tocharian, and seven of the living are present in our sample. Celtic
is not present in the sample even when Gaelic is currently used in Scotland as a
language of teaching, the PIRLS’ tests and questionnaires were conducted solely
in English. Armenian, like Albanian, is a very restricted family made only for one
living language. It is a language very open to foreign influences and clearly related
to other languages: “It shows considerable influence from Greek, Arabic, Syriac
and especially Persian” (Baldik, 1990, p.30). Regretfully, Armenian is not present
in our sample.
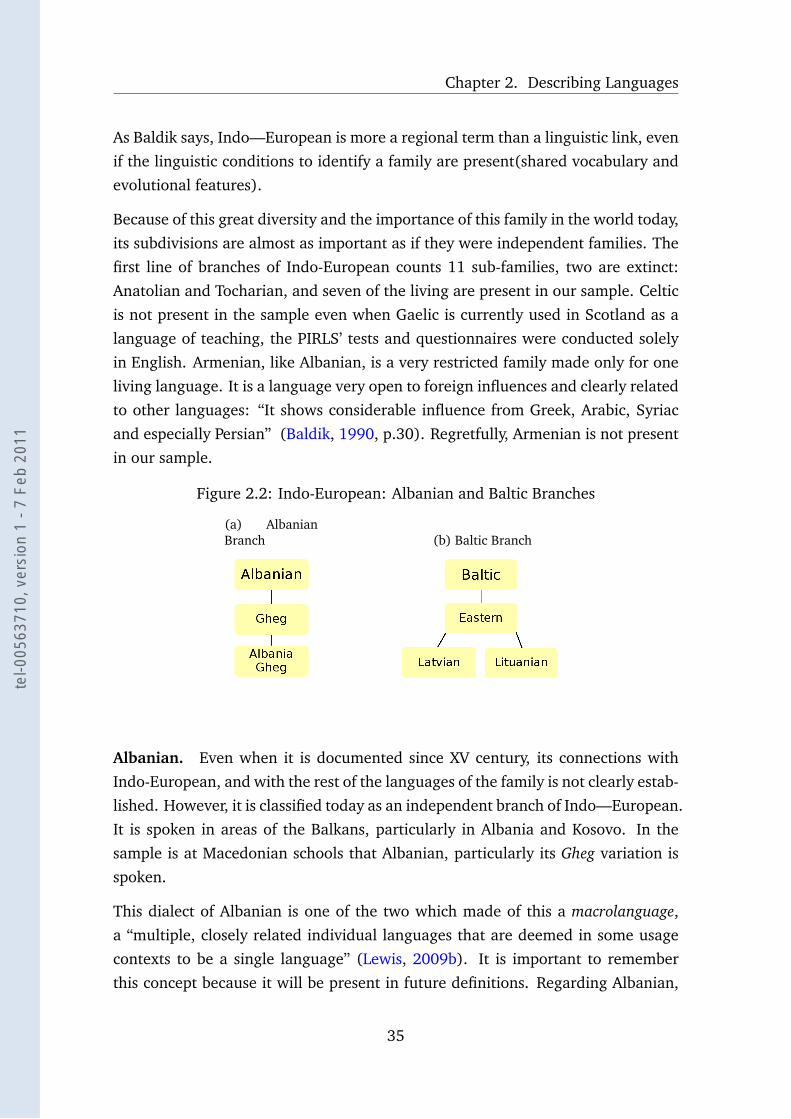
Figure 2.2: Indo-European: Albanian and Baltic Branches
(a) AlbanianBranch (b) Baltic Branch
Albanian. Even when it is documented since XV century, its connections with
Indo-European, and with the rest of the languages of the family is not clearly estab-
lished. However, it is classified today as an independent branch of Indo—European.
It is spoken in areas of the Balkans, particularly in Albania and Kosovo. In the
sample is at Macedonian schools that Albanian, particularly its Gheg variation is
spoken.
This dialect of Albanian is one of the two which made of this a macrolanguage,
a “multiple, closely related individual languages that are deemed in some usage
contexts to be a single language” (Lewis, 2009b). It is important to remember
this concept because it will be present in future definitions. Regarding Albanian,
35
tel-0
0563
710,
ver
sion
1 -
7 Fe
b 20
11
2.1. Ethnographic description
more details about its characteristic as individual language will be presented in
section 4.3.
Baltic. It is often considered as a unique group along with Slavic. What sets it
apart is the high degree of conservatisms of its languages, since it has preserved
several archaic features; this makes of it an interesting source for the study of Indo-
European. In contrast, in relation to its use in today’s world, only two languages
derived from Baltic are alive and in use: Latvian and Lithuanian, they count with
5 million speakers, mainly in the area around east and southeast of the Baltic Sea.
Despite their common features and their common conservatism Lithuanian and
Latvian languages are not mutually comprehensible and their vocabularies differ.
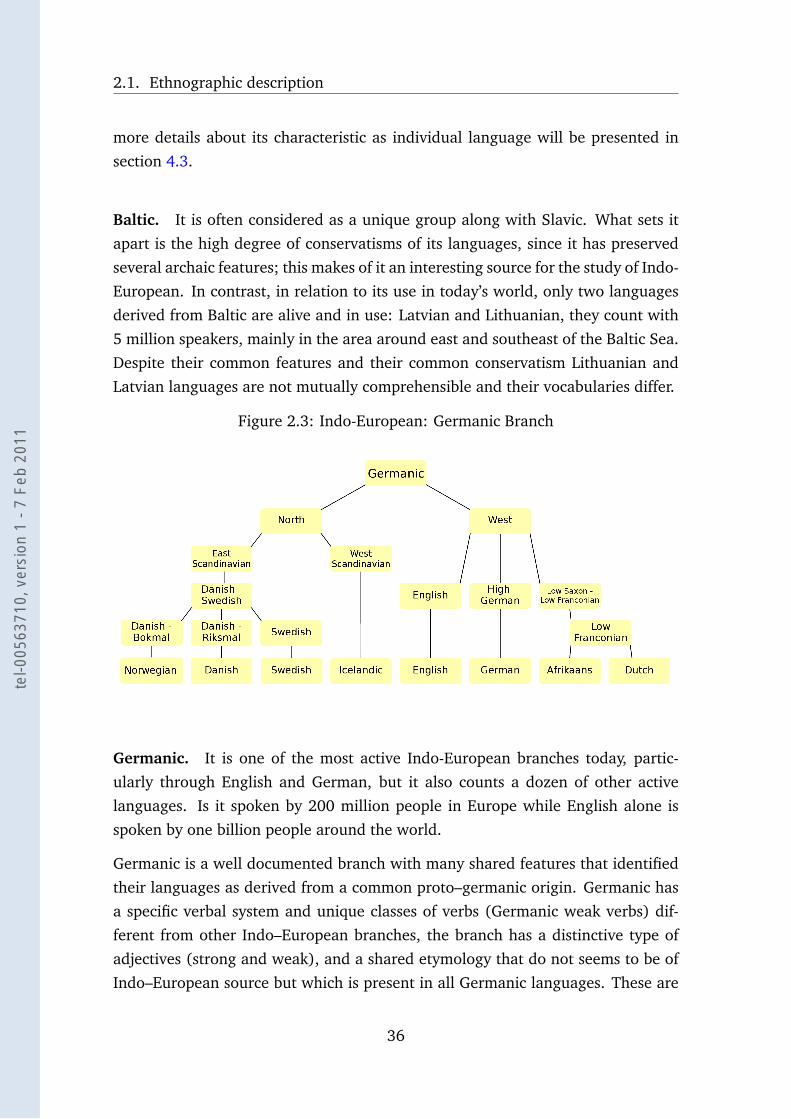
Figure 2.3: Indo-European: Germanic Branch
Germanic. It is one of the most active Indo-European branches today, partic-
ularly through English and German, but it also counts a dozen of other active
languages. Is it spoken by 200 million people in Europe while English alone is
spoken by one billion people around the world.
Germanic is a well documented branch with many shared features that identified
their languages as derived from a common proto–germanic origin. Germanic has
a specific verbal system and unique classes of verbs (Germanic weak verbs) dif-
ferent from other Indo–European branches, the branch has a distinctive type of
adjectives (strong and weak), and a shared etymology that do not seems to be of
Indo–European source but which is present in all Germanic languages. These are
36
tel-0
0563
710,
ver
sion
1 -
7 Fe
b 20
11
Chapter 2. Describing Languages
just some examples of common distinguishing features. But despite of this clear
familiarity, there is less mutual comprehension among the related languages than
in other Indo—European branches as Italic or Slavic.
Hellenic. Also known as the Greek family, it gathers a group of languages spo-
ken in Greece, Cyprus, and the Black Sea. The major language of them being
Greek, originated From the Attic sub–branch of Hellenic, the variant spoken in
Attica region. It is important to distinguish Ancient Greek from Modern Greek, the
former is one of the several dialects historically used in the area, and its modern
derivation is also one of many variations used currently. Regarding the features
of Modern Greek, the language present in PIRLS sample, we will present a more
detailed description in section 4.3. But it must be underlined the direct approach
of it sound-graphic representation, that made of this one of most transparent lan-
guages of the world.
Indo-Iranian. It is the largest sub-branch of Indo-European; today it is spoken
by more than one billion people in the world. Geographically, it is located in
west, south and central Asia. Two major branches of this family are Indo-Aryan
(South Asia), from which derived languages as Sanskrit (one of the Indo-European
languages having the most ancient written texts), Romani and Nepali; and Iranian
(West and Central Asia), from which derived languages as Armenian, Persian and
Farsi. The latter is the only language of this line in the sample.
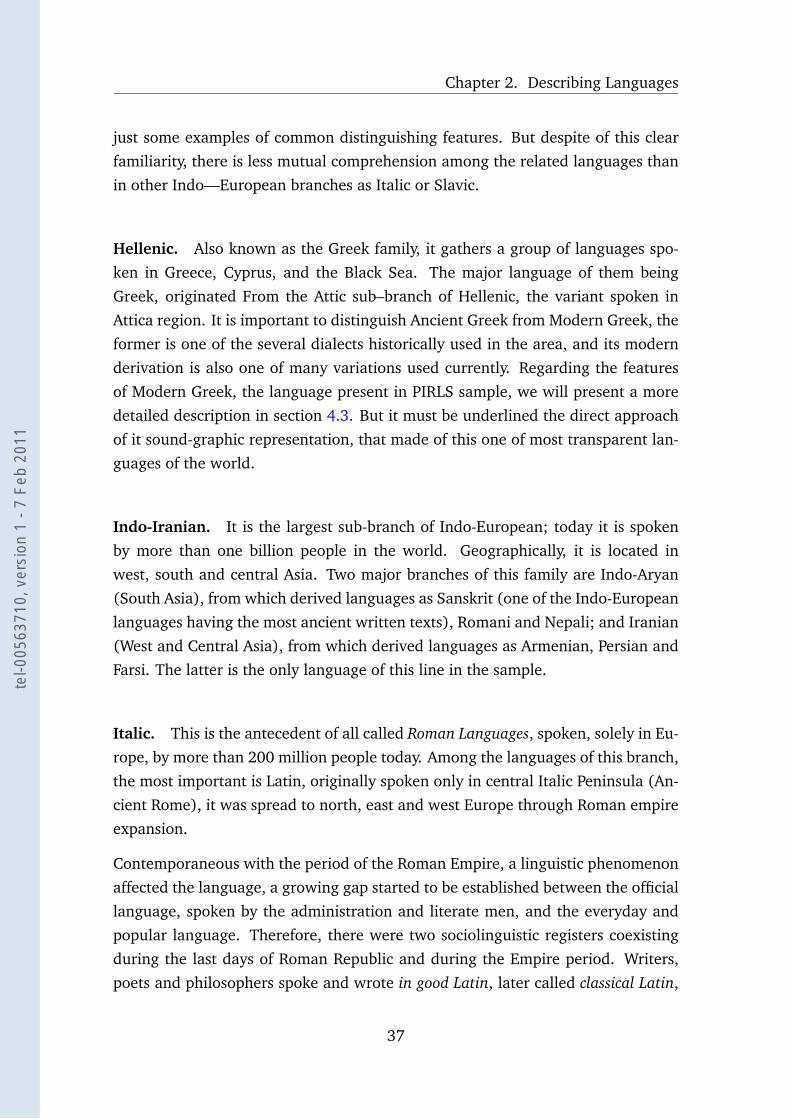
Italic. This is the antecedent of all called Roman Languages, spoken, solely in Eu-
rope, by more than 200 million people today. Among the languages of this branch,
the most important is Latin, originally spoken only in central Italic Peninsula (An-
cient Rome), it was spread to north, east and west Europe through Roman empire
expansion.
Contemporaneous with the period of the Roman Empire, a linguistic phenomenon
affected the language, a growing gap started to be established between the official
language, spoken by the administration and literate men, and the everyday and
popular language. Therefore, there were two sociolinguistic registers coexisting
during the last days of Roman Republic and during the Empire period. Writers,
poets and philosophers spoke and wrote in good Latin, later called classical Latin,
37
tel-0
0563
710,
ver
sion
1 -
7 Fe
b 20
11
2.1. Ethnographic description
Figure 2.4: Indo-European: Italic Branch
while the common people, the vulgus, spoke (rarely wrote) vulgar Latin. This ver-
sion, not regulated by central powers, was in direct contact with the vernacular
languages and specific characteristics of the local populations of the conquered
domains. Later, along with the decline of the empire and the diminution of cen-
tralism, the dialects spoken in each region were diversified, resulting in different
languages, so-called Romance languages, whose first trace are dated about the V
and VI centuries.
38
tel-0
0563
710,
ver
sion
1 -
7 Fe
b 20
11
Chapter 2. Describing Languages
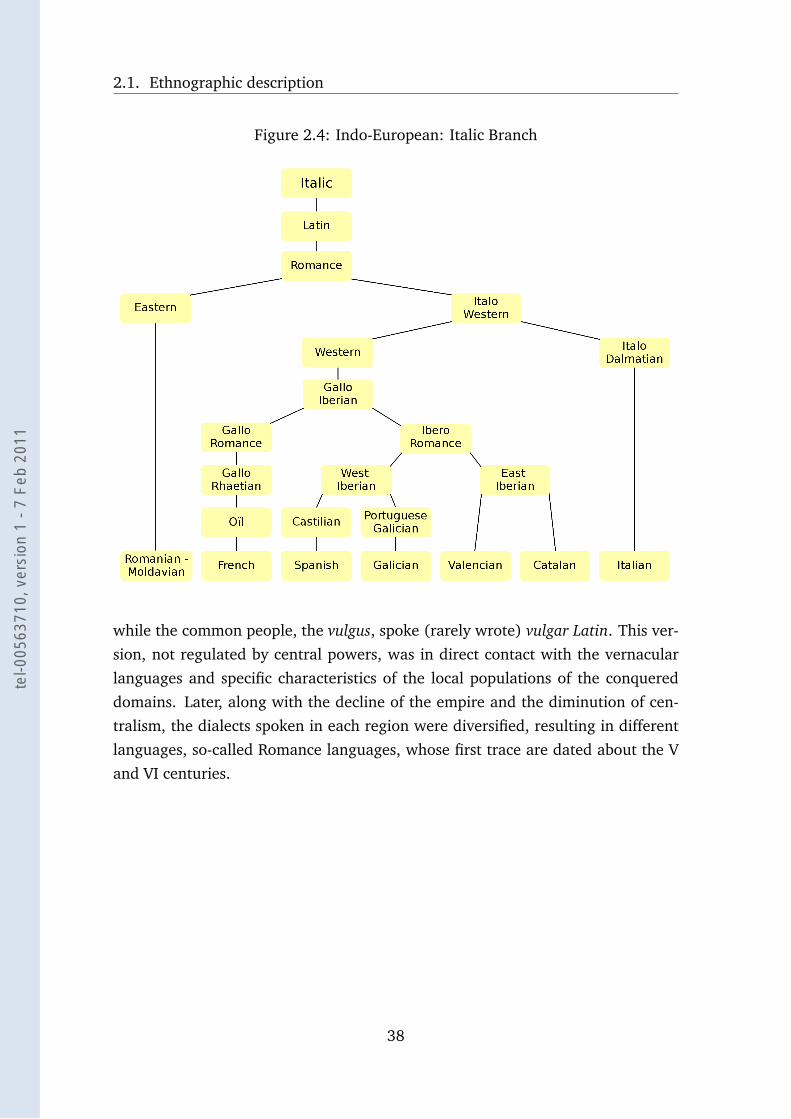
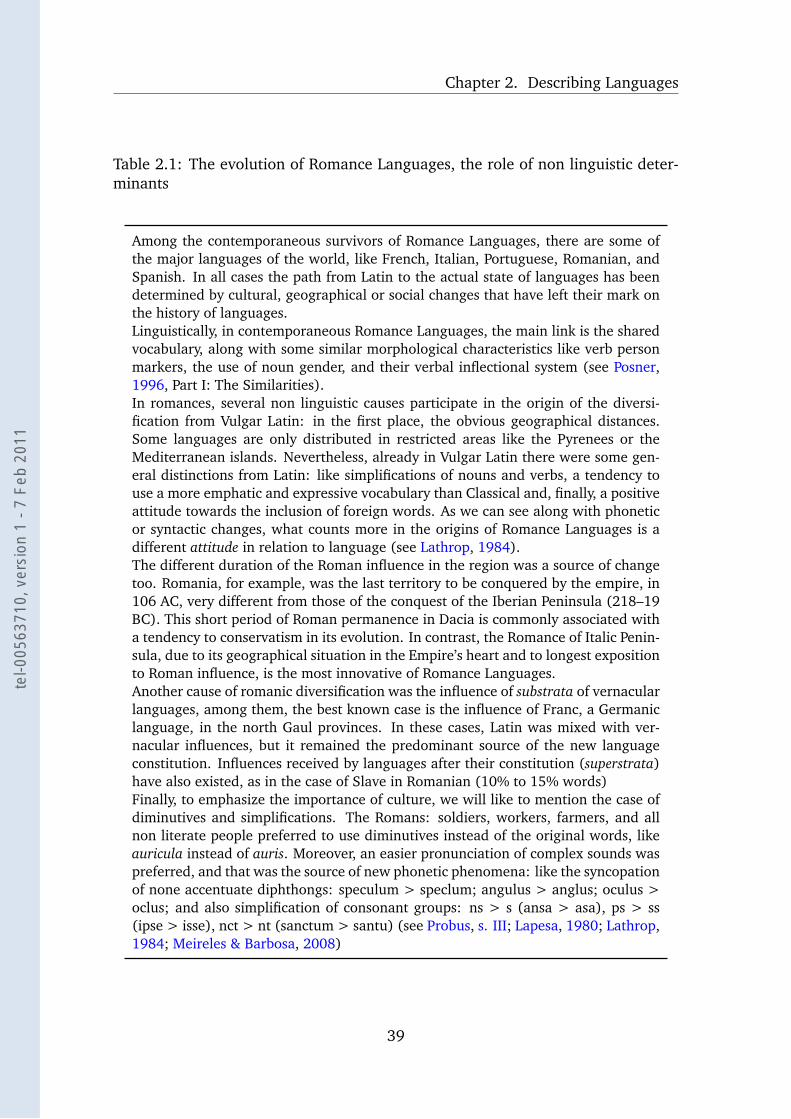
Table 2.1: The evolution of Romance Languages, the role of non linguistic deter-minants
Among the contemporaneous survivors of Romance Languages, there are some ofthe major languages of the world, like French, Italian, Portuguese, Romanian, andSpanish. In all cases the path from Latin to the actual state of languages has beendetermined by cultural, geographical or social changes that have left their mark onthe history of languages.Linguistically, in contemporaneous Romance Languages, the main link is the sharedvocabulary, along with some similar morphological characteristics like verb personmarkers, the use of noun gender, and their verbal inflectional system (see Posner,1996, Part I: The Similarities).In romances, several non linguistic causes participate in the origin of the diversi-fication from Vulgar Latin: in the first place, the obvious geographical distances.Some languages are only distributed in restricted areas like the Pyrenees or theMediterranean islands. Nevertheless, already in Vulgar Latin there were some gen-eral distinctions from Latin: like simplifications of nouns and verbs, a tendency touse a more emphatic and expressive vocabulary than Classical and, finally, a positiveattitude towards the inclusion of foreign words. As we can see along with phoneticor syntactic changes, what counts more in the origins of Romance Languages is adifferent attitude in relation to language (see Lathrop, 1984).The different duration of the Roman influence in the region was a source of changetoo. Romania, for example, was the last territory to be conquered by the empire, in106 AC, very different from those of the conquest of the Iberian Peninsula (218–19BC). This short period of Roman permanence in Dacia is commonly associated witha tendency to conservatism in its evolution. In contrast, the Romance of Italic Penin-sula, due to its geographical situation in the Empire’s heart and to longest expositionto Roman influence, is the most innovative of Romance Languages.Another cause of romanic diversification was the influence of substrata of vernacularlanguages, among them, the best known case is the influence of Franc, a Germaniclanguage, in the north Gaul provinces. In these cases, Latin was mixed with ver-nacular influences, but it remained the predominant source of the new languageconstitution. Influences received by languages after their constitution (superstrata)have also existed, as in the case of Slave in Romanian (10% to 15% words)Finally, to emphasize the importance of culture, we will like to mention the case ofdiminutives and simplifications. The Romans: soldiers, workers, farmers, and allnon literate people preferred to use diminutives instead of the original words, likeauricula instead of auris. Moreover, an easier pronunciation of complex sounds waspreferred, and that was the source of new phonetic phenomena: like the syncopationof none accentuate diphthongs: speculum > speclum; angulus > anglus; oculus >oclus; and also simplification of consonant groups: ns > s (ansa > asa), ps > ss(ipse > isse), nct > nt (sanctum > santu) (see Probus, s. III; Lapesa, 1980; Lathrop,1984; Meireles & Barbosa, 2008)
39
tel-0
0563
710,
ver
sion
1 -
7 Fe
b 20
11
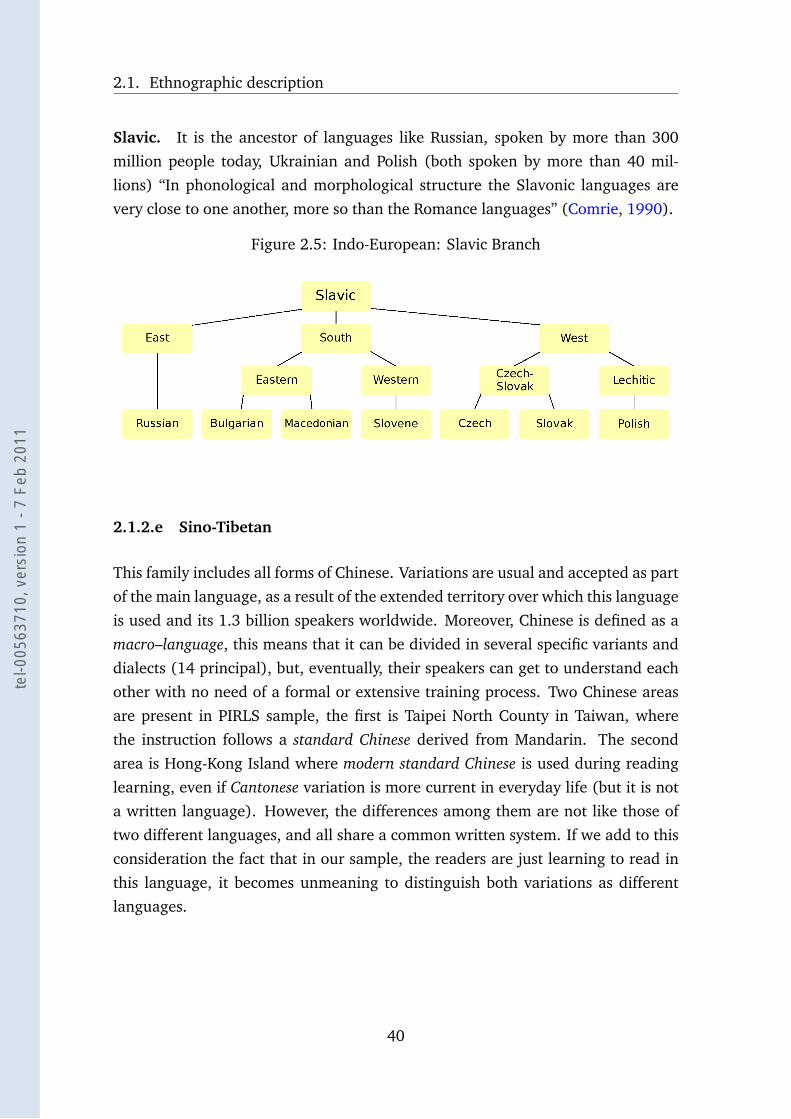
2.1. Ethnographic description
Slavic. It is the ancestor of languages like Russian, spoken by more than 300
million people today, Ukrainian and Polish (both spoken by more than 40 mil-
lions) “In phonological and morphological structure the Slavonic languages are
very close to one another, more so than the Romance languages” (Comrie, 1990).
Figure 2.5: Indo-European: Slavic Branch
2.1.2.e Sino-Tibetan
This family includes all forms of Chinese. Variations are usual and accepted as part
of the main language, as a result of the extended territory over which this language
is used and its 1.3 billion speakers worldwide. Moreover, Chinese is defined as a
macro–language, this means that it can be divided in several specific variants and
dialects (14 principal), but, eventually, their speakers can get to understand each
other with no need of a formal or extensive training process. Two Chinese areas
are present in PIRLS sample, the first is Taipei North County in Taiwan, where
the instruction follows a standard Chinese derived from Mandarin. The second
area is Hong-Kong Island where modern standard Chinese is used during reading
learning, even if Cantonese variation is more current in everyday life (but it is not
a written language). However, the differences among them are not like those of
two different languages, and all share a common written system. If we add to this
consideration the fact that in our sample, the readers are just learning to read in
this language, it becomes unmeaning to distinguish both variations as different
languages.
40
tel-0
0563
710,
ver
sion
1 -
7 Fe
b 20
11
Chapter 2. Describing Languages
2.1.2.f Uralic
Uralic proto-language in believed to be located somewhere around the Uralic
mountains. At present times its derived languages are spoken in a wide region
around this area. It has at least seven sub–branches (like Samoyed or Finnic)from
which Hungarian, the only Uralic language present in the sample, is a direct de-
scendent of the protolanguage. Considering the number of speakers, Hungarian is
the most widespread Uralic language, followed only by Finnish and Estonian.
Some common characteristics of Uralic languages are: suffixes agglutination, mark-
ing of grammatical cases with agglutinative suffixes; the absent of a verb to express
the concept of “to have”, which is replaced with syntactic structures; palataliza-
tion of consonants expressing variation of meanings; and first syllable stressing
preference. More features characterizing Hungarian, will be described in section
4.3, particularly in relation to its phonological representation.
2.1.2.g Other Isolated Languages
There are other languages in the sample, having a very reduce presence, the first is
Basque which does not belong to any family (see 4.1.2.b). The second is Georgian
belonging to the not very vast Kartvelian family. An important number of indige-
nous languages of South Africa is also present in the sample, even if they play a
minor role there will be described in section 4.1.2.a.
Is must be mention that all those classifications are theoretical agreements, con-
sequently there can be different versions of them. For example, some linguists
consider Armenia as related to Greek, others distinguish four branches of Indo-
Iranian instead of two. Our choice is to stay with the simpler explanation, since
the goal of this exposition is to describe clearly the linguistic context of a partic-
ular group of languages and not to propose any new hypothesis about languages
evolution. It is also the reason why we use references from encyclopaedias, which
will not be the case in the rest of our research where more specialized literature is
needed.
Now, the importance of culture in language evolution has been proved, and we
have made a description detailed enough to be able to distinguish the linguistic
families present in the sample, and to infer their hypothetical relevance in de-
termining reading achievement. But, to actually create a variable representing
41
tel-0
0563
710,
ver
sion
1 -
7 Fe
b 20
11
2.1. Ethnographic description
linguistic families, other issues must be described first, like a detailed character-
ization of the sample that we are talking about, along with a description of the
experiment in which this variable will be taken into account. Consequently, more
concepts will be introduced before reaching the point of modelling and variables
creation. It is important to mention that the previous paragraphs will have a direct
prolongation in chapter 4, that will be dedicated to the development of linguistic
variables.
42
tel-0
0563
710,
ver
sion
1 -
7 Fe
b 20
11
Chapter 2. Describing Languages
2.2 Phonological description
2.2.1 General notions about psycholinguistic and phonology
The researches about reading made in comparing different languages have con-
tributed in a very important way to the improvement of the theoretical models
and the better comprehension of the reading process. To underline a notion of
language as a system with a cognitive purpose, correspond to a point of view that
can be called psychological or psycholinguistic. One of the premises of the psycho-
logical studies about reading is the possibility of explaining the cognitive process
of reading through general models that can be validated in any time and in any
context. Moreover, these models seek to be useful in explaining developmental
reading as well as in explaining acquired reading or reading disorders. Evidently,
this universalist ideal has not be reached. However, actual researches imply this
principle as a starting point.
As it was mentioned in section 1.2, a key component of this reasoning is the role
played by phonology in decoding writing. Now, from this perspective, the ques-
tion be to answered in the following paragraphs is what consequences bring theinclusion of language as determinant factor? It was already stated that phonology
is a key factor in developmental reading. Now, this concept will be connected
with languages, through the study of the notion of orthography and orthographic
depth. In this regard, since this point of view is common to both language and
reading, these paragraphs are an extension of the introductory description in 1.2.
This point of view of language, and this universalistic perspective, can be un-
derstood as a renewed and up to day proposal connected with the synchronic
paradigm enunciated by Saussure, who first defined language as a formal system
of differential linguistic signs. Both theories, the foundational Cours de Linguis-tique Générale (1916), and the actual psycholinguistic, surpass the particularities
of the living languages to center their attention in a universal model of language.
It is evident how far are these proposals from those that underline the relevance of
history and culture in the development of languages. What counts in Saussure’s is
the abstraction and formalization, this is why the analogy that is most used in the
Cours de Linguistique Générale is that of a system. This idea is what Saussure seems
to be expressing when he said “Au fond, tout est psychologique dans la langue, y
compris ses manifestations matérielles et mécaniques, comme les changements de
43
tel-0
0563
710,
ver
sion
1 -
7 Fe
b 20
11
2.2. Phonological description
sons” (Saussure, 1995, p.21). Clearly, the genevese professor, is not alluding to
psychology or psycholinguistic as the science that we are familiar with nowadays,
but to the abstract and intangible nature of the object. In addition, he is not deny-
ing the existence of language in the reality, but its historical manifestation, the
diachronic facts, are not considered as a part of language itself but as a derivative
product: “La langue est un système qui ne connaît que son ordre propre” (Saus-
sure, 1995, p.43).
2.2.1.a Empirical research and Phonology
Now, these introductory remarks have led to what will be the core of this section:
the finding of empirical research in language and its association whit reading. It
was already affirmed that the key factor through which this connection is estab-
lished is phonology. This is the reason for underlining the importance of exper-
imentation. From the point of view of phonology, most of the reasoning about
reading has been done starting from an experimental disadvantage, that is, start-
ing from a particular phonology: English language. Hence, experiences show that,
when several languages are included in a reading experiment, the results put in
evidence that English is not the most suitable language to be taken as a model.
This is particularly important when considering developmental reading, since, as
Seymour, Aro, & Erskine (2003) point out “the decoding process ... develops more
slowly and less effectively in English than in other European languages” (p. 144).
More precisely, again quoting the findings from Seymour (2005), English beginner
readers are slower and around 20% less effective than children learning to read in
other languages, (see 2.2.2.b). The causes and consequences of those differences
will be examined later in this study, what is needed at this point of the exposi-
tion is to state that English is not an exemplary phonology. Moreover, it can be
added that there is no such thing like an exemplary phonology. Moving forward
from English, what comparative research shows is that languages are dissimilar;
the concrete materialization of this diversity is what is going to be detailed in the
following pages.
Now, from the linguistic point of view, what is the role of phonology in the system?
And, which is its connection with reading? First of all, a basic notion must be
introduced, the difference between oral and written language. Until now, the
relation between phonology and reading was described in general terms without
44
tel-0
0563
710,
ver
sion
1 -
7 Fe
b 20
11
Chapter 2. Describing Languages
indicating this particularity. Phonology is a dimension of speech, just like syntax
and vocabulary, what phonology does is to describe the way sounds function in a
particular encoding system (a language). However, reading is related to another
aspect of language, the writing system. To be able to read written information, a
person must be able to decode specific symbols employed in this particular form
of communication: the graphemes system, furthermore, the system of rules that
regulate this decoding process, which is the orthography of the language. Between
orthography and phonology there are different degrees of resemblance.
2.2.1.b Written systems and the role of phonemes
An essential difference between oral and written communication is that to speak
is a part of the biological nature of human being, is one of the innate conditions of
humankind. Our organism is equipped whit several physiological structures (air
cavities, larynx, tongue, thoracic diaphragm, alveoli, etc.) capable of transform-
ing aerodynamic energy into acoustic energy, to produce sounds that represent a
language. Another sign of the universality of speech is that every society possesses
a language, it is a propertie of human organization. It could be created from
zero, if the community is isolated, or it can be derived, adapted or mixed with the
languages of other communities, as described in section 2.1.2.g.
Ferrand (2007) states: “tout permet de penser que nous sommes programmés en
tant qu’êtres humains pour devenir des « hommes de parole », mais c’est la cul-
ture qui pourra éventuellement faire de nous des « hommes de l’écrit »” (p. 10).
Graphemes and written communication are part of cultural heritage, they are hu-
man inventions of particular societies, expressly created with the purpose of rep-
resenting speech in a way that can be preserved in the course of time (mnemonic
function) and moved through space. In other words, written communication has
the goal of to expand the communicative range already created in oral speech (see
Coulmas, 1989, pp.11–14). The same Coulmas (1989) is more radical in his ap-
preciation of the role of writing systems:
Writing is a cultural achievement rather than a universal property and
as such is much less important than speech for our self-understanding.
Anything that is an invention might as well not be there, and writing,
unlike speech, falls into this category. (p. 3)
45
tel-0
0563
710,
ver
sion
1 -
7 Fe
b 20
11

2.2. Phonological description
But, even if the importance of writing is not comparable to that of speech, when
it comes to inquiry about reading, the characteristic of the writing system and its
relation to speech become fundamental.
Besides its artificiality, what distinguishes writing systems from other codes like
information signs, graphics, maps, and algebra, is that none of them requires an-
other pre-existing knowledge to be understood, only to acquire their own rules.
On the contrary, to understand and make use of a writing system, prior compre-
hension of the oral language is necessary 1.
Figure 2.6: Examples of scripts along history
(a) Cuneiform script, 3000 BC (b) Archaic chinese, 2000 BC
(c) Zapateco script, 500 BC (d) Arab, 500 AC
Another particularity is the amounts of signs that can be used, due to its depen-
dency in human anatomy, the variety of phonemes (the smaller sounds that com-
pose words) are limited. During XX century, linguistics as Roman Jakobson and
Noam Chomsky, have contrasted languages to discover that there are around 12
or 30 distinctive features needed to characterize phonemes (Britannica, 2009), in
other words, all phonemes of all languages can be characterized following these
features, which are binary attributes (if a phoneme is glottal or not, syllabic, sono-
rant, etc). In contrast, the written signals, are eventually unlimited and each
society could have their own script system, as we can appreciate in figure 2.6.
Through history, the variety of signals invented by different societies is extremely
rich.
1eventually it is possible to learn only to read a written code when learning a secondary lan-guage but is not the usual way to learn the mother tongue.
46
tel-0
0563
710,
ver
sion
1 -
7 Fe
b 20
11
Chapter 2. Describing Languages
Now, knowing that among the characteristics of writing systems there is artificial-
ity, circumstantiality (it is not essential to communication), dependency on the
pre-existent oral system, and the great arbitrariness in its graphical representa-
tion. From this last characteristic, it is possible to make out a typology of writing
systems that will lead to recognize the origin and particularities of their relation to
speech. The question about how speech is graphically represented has been histor-
ically answered through three main solutions, depending on which unity is taken
as reference. Those different writing systems can be ordered in a line going from
the more abstract representation of ideas to the more technical representation of
the sounds of the languages.
Pictographs and Ideographs. In first place, there are writing systems that use
images and concepts as units of representation: Pictographs are graphic signs with
an illustrative resemblance to a physical object. More subjective, Ideographs are
symbols that represent abstract ideas. There is not register of a writing system
totally pictographic; civilizations have implemented combination of both forms of
signals, already in incipient development of writing. However this kind of script
do not trespass very specific functions in society as ritual, narrative or artistic
functions2.
However, this script do not fulfills one of the characteristic earlier mentioned about
writing systems, since its express meaning through images, these scripts do not de-
pends in previous knowledge of the language. In fact, contemporary pictographic
signs as traffic signals, computational emoticons or statistical diagrams, all can be
defined as pictorial scripts. The more ancient writing that is dependent in already
existent language is the logographic system.
Logographes. In many cases, a logographic system is an evolution of a previous
ideographic script (like ancient Chinese or Classic Maya). The fundamental dif-
ference with ideography is that a logography does not represent the meaning, a
concept, but the significant, words or morphemes (the smallest meaningful unit
of language). Moreover, this relation is arbitrary; the visual shape of the sign do
not has a direct relation with its meaning. In consequence, to surpass this arbi-
2To do not extend this paragraph further, It is interesting to mention, as example, the veryinteresting case of writing in Mesoamerican cultures that was considered as a pictorial art just liketheir scribers were artists (see Justeson, 1986).
47
tel-0
0563
710,
ver
sion
1 -
7 Fe
b 20
11
2.2. Phonological description
trariness, like Frost (2005) points out, a mapping becomes necessary, this, like
any other combinatory or representational rule, is organized by the orthographic
system, the more a language is arbitrary and dependent on conventions, the more
orthography becomes fundamental. However, in a system purely logographic, the
work of the orthography becomes very difficult, since the lexicon of a well deve-
loped language can easily reach hundreds of words. Consequently, if each one of
those words is represented by a particular sign, this makes very difficult for the
speakers to learn and use each graph.
Phonemic Systems. The final solution to the representational problem is en-
tirely dependent in language itself; which is, to graphically represent the soundsof the language, instead of concepts or words. In other words, an alphabet is used
to represent the phonology of the language. This is considered by researchers of
writing to be the essential form of artificial communication:
The decisive step in the development of writing is phonetization: that
is, the transition from pictorial icon to phonemic symbol. The ultimate
consequence of phonetization is the alphabet, which is often praised as
the finest and most highly developed writing system. (Coulmas, 1989,
p.33)
But, even the earliest graphic system like Egyptian hieroglyphs and Chinese lo-
gographs already has graphemes that represent phonemes. This implies that most
of the writing systems depend, to some degree, in representations of sounds, even
those that are not directly phonemic. As Frost (2005) states: “any human writing
system cannot do without phonographic signs” (p. 273).
In consequence, this dependency implies also a major degree of complexity, as the
subtlety of the system increases, the exigency of correctness and accuracy of the
structure of rules increases too, this is what Klima (1972) remarks:
The history of writing shows a clear development to less and less arbi-
trariness: from the character to the syllabary to the alphabet. (...) The
end of this development would logically be a system where character-
istics of the form of the letters would be related in a systematic way
to distinctive phonetic features of the individual sound segments. (p.
62–63)
48
tel-0
0563
710,
ver
sion
1 -
7 Fe
b 20
11
Chapter 2. Describing Languages
In other words, following the historical evolution from ideographic to phonology,
it is possible to envisage how an ideal alphabetic system 3 could be: it will lean
hardly in the systems of rules that regulate the interactions:
Bien qu’universel, le principe phonographique se présente sous des
formes qui varient avec les langues, les orthographes et les sociétés. La
différence la plus importante concerne le degré de régularité. Comme
la phonographie désigne pour l’essentiel un jeu de correspondances
entre des unités phoniques et des unités graphiques, la régularité sera
d’autant plus grande que le nombre respectif de ces unités sera proche.
(Fayol & Jaffré, 2008, p. 86)
What the authors are trying to underline is the fundamental importance of orthog-raphy in an alphabetic system. This last is in charge of this “jeu de correspon-
dances” that must be capable of represent the speech unequivocally minimizing
arbitrariness and at the same time, preserving all its richness. How languages re-
solve this problem? And, what are the consequences to reading learning? This is
what will be discussed in the following section.
2.2.2 Orthography and alphabetic systems
As Fayol & Jaffré (2008) state: “L’écriture propose, l’orthographe dispose”(p. 86).
If we observe the period in which the learner cross from speech to reading compre-
hension, what is seems to be the key in developmental reading is how the writing
system represents the oral system. This is where the orthography of the language
becomes central. Orthography is specific to each human language, since it is an
assemblage of conventions that indicates the correct way of using writing systems.
Consequently a major subject is how to represent the phonological characteristic
of each particular language; the answers are divers, almost divers as languages
themselves. But there are some general notions to be referenced.
Considering that “the relation between spelling and phonology varies widely be-
tween orthographies” (Frost, 2005, p. 278). A fundamental concept, issue of
3The most commonly alphabetic system is the Latin alphabet, but is certainly not the onlyavailable, there are also the Gothic, Irish, Runic, Oghamic, Armenian, or Georgian alphabets, moreor less related to Latin (see Kersaudy, 2001, chap. III)
49
tel-0
0563
710,
ver
sion
1 -
7 Fe
b 20
11
2.2. Phonological description
comparative research has been developed: the notion of orthographic depth. As
we mentioned before, in a perfect alphabetic system, the orthography will be to-
tally phonemic. In other words, it will be an orthography where each phoneme
will correspond with only one grapheme and vice versa. Nevertheless, any hu-
man language fit this ideal, all of them have irregularities, having graphemes that
can represent several sounds, or phonemes that can be represented by different
graphemes, and also complex ways of combine graphic signs, syllables having
many possible structures, words spelled in similar forms but pronounce differently,
several orthographies, etc.
The concept of orthographic depth offers a framework model to categorize lan-
guages in accord to this adequacy. In consequence, it is possible to identify what
is called a shallow orthography which is closer of being phonemic (Spanish, Greek
and Finnish among others), and also deep orthographies which, by one reason or
another, are farther of being an ideal orthography.
Two main subjects are derived from this notion. First of all, the criteria to establish
if the orthography is more or less transparent in relation to the phonology of the
language. Secondly, in relation to our particular research, we can ask about the
consequences of orthographic depth in learning to read. To answer the first ques-
tion, some fundamental notions will be described in the next paragraphs, through
their discussion in bibliographical references. A representative sample of the dis-
cussion and founds will me mentioned, however, since the problem is copious,
all details cannot be mentioned, particular attention will be put on more up to
date research. About the second problem, through this bibliographic discussion,
the actual state of the question can be understood, since several experiment take
reading as the subject of the study, because it is during reading development that
the orthographic differences between languages become more visible. Moreover,
since this is, in fact, a nuclear question about reading and languages, this second
question will become later an objective of the experimental tests to be carried out.
50
tel-0
0563
710,
ver
sion
1 -
7 Fe
b 20
11
Chapter 2. Describing Languages
2.2.2.a Early discussion about phonological differences among languages
Various hypotheses have been proposed to explain orthographic depth, a major
line in the Anglophone world, comes from the publication of the Chomsky and
Halle’s theory of sound structure: The Sound Pattern of English (Chomsky & Halle,
1968). In describing the general properties of English sound structure, the book
accomplish the improvement of the inventory of segmental features of English
phonemes (that was mentioned in section 2.2.1.b), during the reasoning, one of
the arguments is that this orthography is complex because it reflexes the deep
structure of English words. To surpass it, the generative method can be employed
to corroborate that is possible to go from pure phonology of a word to orthography
in a series of transformational steps.
Even if the theoretical issues represent a major advance in phonology, critics have
proved that the relationships between phonology and orthography in English are
far away from this ideal. One of the first critical studies that develop this concept
is the one from Edward S. Klima (1972). In his paper, the linguist analyzed the
relation between English phonology and orthography in comparing it with other
languages like Russian or German. He did not disagree with the idea that or-
thography reflex phonology, but recognized that there are different ways in which
such orthographies can solve the distance between linguistic units and their ortho-
graphic representation (not a unique way as Chomsky and Halle have implied).
As a result, he concluded that: “some real orthographies do often ... reflect more
nearly the underlying lexical representation of a word than its sound form when
the two diverge” (p. 72). Subsequently, terms like deep-structure, opacity and
transparency where used to describe this distance, which seems particularly long
in the case of English.
Even if it is not a comparative experiment, in this argumentation, the problems
that will be the subject of such experiments are already announced. This problem
is the diversity of orthographies, that is expressed making use of the extended
metaphor of transparency. But, beyond rhetoric, it is necessary to answer this
question: What were the criteria used by Klima to determine the depth of a lan-
guage?
The criteria followed to determine the relation between orthography and phonol-
ogy was that of the properties of an optimal orthography “in which no phonetic
variation is indicated orthographically where it is predictable by general phono-
51
tel-0
0563
710,
ver
sion
1 -
7 Fe
b 20
11
2.2. Phonological description
logical rule” (p. 61), there are four factors of such orthography: minimal arbi-
trariness (in the relationship between orthography and linguistic units), minimal
redundancy (economic performance), maximal expressiveness (minimizing am-
biguities) and a standardized spelling (to each unit, there should be only one
spelling and no more). This way, the researcher accomplish to develop a theoreti-
cal model to establish orthographic depth, that comes from an abstract reasoning,
even if it was corroborated by developing some examples it cannot be said that
there was an actual experimental development.
As we mentioned before, this kind of analysis respond to the criteria to establish
orthographic depth. The importance of mention this characterization is that it
allows a continuous classification of languages in accord with these properties.
Starting from the orthography which is closer to the optimal until the farthest.
Since the possibility of developing a classification is a goal of this research, that
comparability will be emphasized.
Another interesting paper to reference in one wrote ten years later by Katz &
Feldman (1981): Linguistic Coding in Word Recognition. Comparing this paper
with these of Klima, is evident the improvements that the concept of orthographic
depth have made. Moreover, this was a practical research through empirical ex-
perimentation in comparing languages. Here, the introduction contained a key
concept: the visual code as part of orthography.
Katz & Feldman were guided by two main questions that were very close to those
that are here been inquired about: “What kinds of information are provided to
readers by their orthography; how much of this potential information is actually
used; and how does this selection vary with reading experience?” (p. 85). Conse-
quently, in experimenting with reading tasks like naming and lexicon recognition,
the researches confirmed the distance between a shallow orthography: the Serbo–
Croatian 4, and a deep orthography: English.
As part of the theoretical framework, the concept of orthographic depth was com-
plemented with another factor that can influence depth: morphophonology or
word–level information. An orthography, like English contains information which
is not coded in a phonological way but morphophonological, consequently, the
decoding process will depend, not only in the access from orthography to sounds
but also in the degree to which the orthography relay in this word–level informa-4We use this denomination as authors did even if nowadays is being replaced by separate de-
nominations for each ex–Yugoslavian regions and more "politically correct” alternatives.
52
tel-0
0563
710,
ver
sion
1 -
7 Fe
b 20
11
Chapter 2. Describing Languages
tion. In other words, instead of profundity levels, as Klima suggested, Katz and
Feldman proposed a dichotomy: a direct or indirect way of reflecting phonology.
English would not being directly reflecting phonology but morphophonology. The
conclusion was that “the kind of code that is used for lexical access depends on
the kind of alphabetic orthography facing the reader. Specifically, it depends on
how directly the orthography reflects the phonetic surface” (p. 85).
Regretfully, the difference between the code itself and the processing method were
not clear enough, since it is said that there is word level information in English or-
thography, and, at the same time a decoding process that is morphophonological.
Later studies of the same author and others will clarify this difference recognizing
that English is a phonological orthography too (see Frost, 2005, p. 272–275) and
that is the processing that can be focused in a different way in phonemes or bigger
units (see Katz & Frost, 1992).
Another important notion introduced to the discussion by these authors is that of
the change of the decoding process between younger and order readers. The first
will use more phonological information while the last will tend to use “nonphono-
logical (e.g. word-specific) mechanisms” (p. 86). In other words, through time,
the style of decoding will pass will become less phonetic and more morphological.
About those two proposals, even if they took distance from the definition of or-
thography made by Chomsky and Halle, their point of view was still reliant in
generative theory. First of all because both of them were formalistic, that is, under-
standing language processing as a transformational procedure, having an internal
logic: “the character of a code is described by the range of a transform” said Katz
and Feldman (p. 85). However, the limits of these studies were not established
by this point of view but, moreover, by the more general framework of traditional
linguistic. Greater development in studying orthography and reading will arrive
along with the incursion of psychology and cognitive scientist in this field.
The evolution of this line of thinking can be established in referencing another
paper by Leonard Katz, this time in collaboration with R. Frost. In their paper
of (1992), the researchers proposed an explicative hypothesis of the relation be-
tween reading and orthography, the Orthographic depth hypothesis (ODH): “we
can meaningfully address the question of whether or not the relative amount of
assembled phonological coding decreases with increasing orthographic depth: the
orthographic depth hypothesis” (Katz & Frost, 1992, p. 74). A more recent def-
53
tel-0
0563
710,
ver
sion
1 -
7 Fe
b 20
11
2.2. Phonological description
inition of the same ODH describe it as: “The hypothesis that the correspondence
between spelling and phonology in different orthographies affects the processes of
visual words recognition” (Snowling & Hulme, 2005b, p. 543). The central point
of this proposal is the role played by visual as a decoding alternative to phonology,
which was already announced in the referenced paper of 1982. Now, the improve-
ment is the major importance gave to this aspect as a decoding strategy, instead
than being focused in morphophonology as a linguistic property of particular or-
thographies. In other words, visual recognition is not in the code itself but a way
of accessing to it.
Concerning ways of access, there are several models that search to explain the
strategies used by readers to processing written language. Among them, and di-
rectly related to the notion of orthographic deep, there is the dual route model,that is also described as competing for being the principal processing strategy:
Assume that the processing system is capable of using either code: a
dual-code model. Suppose that a phonological representation is the
default code for any given word but processing of a word via its phono-
logical code can be replaced by processing via its visual–orthographic
representation when the word has been experienced by the reader a
sufficient number of times: a words frequency criterion. ... The cri-
terion word frequency that is required in order to replace processing
by assembled phonology with processing by visual–orthographic rep-
resentations should be a function of the cost involved–in part, the cost
for assembling the phonological representation and using it to access
the lexicon. A higher replacement criterion will obtain in a shallow
orthography where assembled phonology is easy to generate than in a
deeper orthography. (Katz & Frost, 1992, p. 81)
At this point, it is possible to specify the two major achievement of the discussion
about orthography and phonology referenced until now. In first place there are
two major criteria to answer the question about defining orthographic complexity:
in one hand there is a structural criterion that Klima defined (arbitrariness, econ-
omy, expressiveness and standardized encoding), that we can describe as a way
of judging the functionality of orthography. In the other hand, in the definition
made by Katz and his colleges, there is a more purely linguistic way of establish
54
tel-0
0563
710,
ver
sion
1 -
7 Fe
b 20
11
Chapter 2. Describing Languages
the transparency: how phonological a language is, depends in how visual can be
the encoding.
This last state is connected whit the second major achievement of these researches:
through ODH dual route theory, which was conceived as a decoding hypothesis
free of any particular orthography is now defined as depending in the phonetic
properties of orthography in each specific language. In other words, the chosen
route in dual route theory is not a question of simple strategic decision but an
inherent property of the orthography of the language.
The importance of this discussion to understand the relation between reading and
language is manifest. From both points of view, purely linguistic or focused in the
cognitive processing of information, both are aware of the importance of ortho-
graphic properties in reading. The major achievement comes from Katz in whose
work, through empirical experimentation, the advantage in reading processing for
the shallow orthographies has been confirmed. However, we must point out that
the reading described here respond to a very simple processing, in fact is more
suitable to call it decoding. But even keeping this distinction, we can say that is
confirmed (and so did later researches) that shallow orthographies are decoded
faster and easily than deep orthographies, as Snowling & Hulme (2005b) remark:
“because they support faster assembly of phonological codes from letter strings”
(p. 269).
This discussion shows that the problem of visual versus phonology is a main topic.
However at present, the orthographic depth appears as a key to go beyond this
dichotomy, because deepness is an invariant characteristic of the orthography, de-
finable and describable. This is why our concern will still be the orthography and
the criteria to determine it. At the same time, this means that to define the role
of whole–words will be not a major concern to this research, however, in the next
section, we will see that upper–phonemic units still being an important key to
understand orthographic complexity, particularly in opaque orthographies.
Consequently, it is necessary to still working on the previous question about the
criteria to establish the degree of complexity of languages, because not all deep-
ness is equal in causes and consequences. To do so, it will be discuss in the next
paragraph some other researches about orthographic dept, that are more contem-
porary and that focus their work more accurately in comparative methodology.
55
tel-0
0563
710,
ver
sion
1 -
7 Fe
b 20
11
2.2. Phonological description
2.2.2.b Contemporary discussion
Being the subject already identified as a valid problem, the research about differ-
ences in reading among orthographies has being increasing in quantity and qual-
ity in the last twenty years. There are more sophisticated experiments designs,
a growing number of orthographies included in comparisons, along with more
detailed information about the characteristic of languages. These improvements
have helped to take into account more complexes aspects of the subject. Going
slowly away from the old English monopoly in research, it can be said, as Snowl-
ing & Hulme (2005b) said, that “we have moved closer to a universal theory of
reading than we ever supposed would be the case” (p. 271). At less in this aspect
of language, by unexpected ways, Saussure’s aim seems to still being searched.
Thus, bibliographical researches allow to affirm that Orthographic depth hypothesisis the actual explanation to the difference in reading achievement among orthogra-
phies. However it is necessary to deepen the understanding about it by referenc-
ing some experiences that have tested its explicability in comparing languages and
also have proposed other solutions.
Cambridge professor Usha Goswami, has conducted several experiments, in com-
paring languages searching to define the role of linguistic units of different size
in reading. In Goswami, Gombert, & Barrera (1998), a comparison among En-
glish, French and Spanish children (7–9) was made. The difference in reading
tasks achievement was confirmed, showing advantages in reading in Spanish and
disadvantages in English.
Moreover, in reading words and non–words English children showed facilities
when the stimulus, monosyllables and bisyllables, shared rhymed onset or rime
(beginning and ends of words) with a familiar word, French readers also used
this resource of phonology resemblance but with reduced effect, in Spanish, the
positive effects of rhyme were of considerably less importance. The conclusion is
that: “Nontransparent languages may be more predictable in terms of spelling-
sound correspondence at levels other than the phoneme” and that in English and
to some extent in French “onsets and rimes function as units of print” (p. 21). That
is why, through rimes analogy children of the deeper orthographies found a extra
support in reading, on the other hand “The more transparent the orthographic
system, the more analogy use will reflect the grapheme–phoneme code, and the
easier and faster this code will be mastered by the novice” (p. 47). In other words,
56
tel-0
0563
710,
ver
sion
1 -
7 Fe
b 20
11
Chapter 2. Describing Languages
readers of transparent orthographies found all the information that their need at
the phoneme level, not being necessary to relay in more complex strategies.
A particularity of this study that must be remarked is that here the represents of
Spanish language are from schools in Venezuela. This is a country with educa-
tional results considerably lower of those of France or England, homelands of the
other children. Even considering these general differences, Venezuelan children
get better reading results in correctness and speed as well. Without wanting to
move forward to the next chapters of this works, an obvious question is what hap-
pened in later reading progress of those students to achieve scores that are so far
away of other countries in international comparative tests.
Analyzing the conclusions, it is easy to connect the efforts of Goswami and his
colleges with those of Katz, both searching to define units larger than the phonetic
level to improve the understanding of reading in English. This tendency in more
evident in a book published in 1990 in collaboration with Peter Bryant (whose
contribution about phonological awareness was mentioned before in section 1.2).
Both researchers share a concern about phonological units other than phonemes
which they think could be the key in learning to read “There may well be differ-
ent forms of this kind of awareness [phonological], because there are different
ways in which words and syllables can be divided up into smaller units of sound”
(Goswami & Bryant, 1990, p. 2).
Consequently with their previous researches, the proposal is that onset and rimes
are intra-syllabic units of major importance in early reading. In fact they as-
sume that these intra-syllabic units are the real subject of awareness since rhymes
(sounds resemblance of onset and rimes) are naturally closer to the children expe-
rience before and during reading learning. Regretfully, a comparative viewpoint
is absent of this reasoning, since by the information until here referenced, it is ev-
ident that this analysis reflexes the particularities of English as language of learn-
ing, and it can hardly be applied to understand learning in a transparent orthog-
raphy where rhymes and phonemes have a different status, as the same Goswami
proved in 1988. Other similar experiments can be referenced like Goswami,
Ziegler, Dalton, & Schneider (2003), Goswami, Ziegler, & Richardson (2005) and
Ziegler, Perry, Jacobs, & Braun (2001). All those researches, and many others,
lead to a brand new proposal, looking at the problem from a broader perspective:
More recently it has been recognized that the question of whether small
57
tel-0
0563
710,
ver
sion
1 -
7 Fe
b 20
11
2.2. Phonological description
units or large units are used first in reading acquisition may be mis-
placed. There appears to be evidence for the use of both types of units
in children, depending on the nature of the reading task, the type of
words being read, the teaching method being used, and the orthogra-
phy under investigation. (Goswami et al., 2003, p. 236)
Goswami and Zeigler are the authors of this new proposal which they call psy-cholinguistic grain size theory (PGST) (Ziegler & Goswami, 2005, 2006): “the dra-
matic differences in reading accuracy and reading speed found across orthogra-
phies reflect fundamental differences in the nature of the phonological recoding
and reading strategies that are developing in response to the orthography” (Ziegler
& Goswami, 2006, p. 431).
In words of Frost (2006) this theory can be described as an improved and modern
alternative to the Orthographic depth hypothesis. The divergence is that ODH
recognize two routes in reading: the non—lexical path, which is preferred by those
shallow orthographies where phonemes are sufficient to decode, and the lexical
pathway in the case of less transparent orthographies. Now, what Ziegler and
Goswami do is to emphasize and redefine this lexical route. The key concept is that
beyond simple phonemes’ awareness, the principal factor in reading development
is the grain size of linguistic units mostly used by the specific language. The way
in which sounds are mapped to letter is defined as a determinant factor of how a
child learns to read, or as Nergård-Nilssen (2006) explains: “because languages
vary in phonological structure and the consistency with which the phonology is
represented in the orthography, there will be developmental differences in the
grain size of lexical representations and reading strategies across languages” (pp.
270–271). Going from ODH to PGST, a general notion of lexical representation
becomes a very detailed description of several component of this lexical universe.
Remembering the previous questions that guide us in this work, it is pertinent to
ask: does this improvement allow a better understanding of the reading differ-
ence across orthographies? In other words, can PGST be employed to establish a
classification of languages?
To demonstrate empirically that there are differences in identifying units of differ-
ent sizes, Zeigler and Goswami quote a series of studies about reading in several
languages (English, German, Japanese, Spanish, Italian, etc.) that prove that the
granularity differs in relation to the complexity of the language, they do not make
58
tel-0
0563
710,
ver
sion
1 -
7 Fe
b 20
11
Chapter 2. Describing Languages
use of the term transparency but prefer to differentiate between consistent and
inconsistent languages. However, from these very examples a doubt arises, it is
consistency a better criteria to discriminate orthographic complexity?
It seems that grain size hypothesis is focuses in phonological and reading develop-
ment but not in orthographic depth, being the disadvantage of deep orthographies
a recognized fact and a starting point : “The data from all of these studies support
the notion that grapheme–phoneme recoding skills are taking longer to develop in
less transparent orthographies” (Ziegler & Goswami, 2005, p.11). Consequently,
this hypothesis tries to explain the mechanisms of decoding an inconsistent or-
thography but did not explain its depth itself.
PGST explains why the process of reading in an inconsistent orthography is slower
and more demanding: “beginning readers have to learn additional correspon-
dences for large orthographic units, such as syllables, rimes or whole words. There
are many more orthographic units to learn when the grain size is large” (Ziegler
& Goswami, 2005, p. 19). The connection of this perspective and double route
theory is remarkable, but just like them, and, as the same Ziegler and Goswami as-
sert, those processing architectures “may in fact only develop for English ... giving
the large number of studies of reading conducted in English” (p. 20). Regretfully,
the majority of the paper is dedicated to considerations about English too . This
is why the concept of consistency seems to be very functional in explaining com-
plexity in this particular language but could not be as useful in explaining others
orthographic circumstances.
It can be concluded that, as Durgunoglu (2006) remarks, PGST is successful in
stating the need of a better comparative perspective in understanding reading
across languages but it is not as successful in separating this perspective from the
particularities of English as complex language. As Zeigler and Goswami remark,
more systematic cross–language research and diversified experiments are needed
to improve this proposal which is only a “first sketch” (p. 23).
A few descriptions of languages made by Ram Frost in 2005 can help to get a
better understanding of the distinction between this two ways of categorize or-
thographies (consistence or transparency). According to Frost, the opacity of En-
glish would be determined not only by consistency, but also by a second factor:
regularity: the recurrence of exceptions in the grapheme–phoneme conversion
rules, more exceptions means more irregularity. On the other hand, consistency
59
tel-0
0563
710,
ver
sion
1 -
7 Fe
b 20
11
2.2. Phonological description
is the “unique pronunciation of an orthographic body” (p.278), consequently, in-
consistency is the difference in pronunciation of words that are spelled similarly.
Assembling this two factors, in English there are many words that “can be regular
but inconsistent, or irregular but consistent” (idem). Consequently, it is clear that
those are two different sources of variation in English.
In addition, a very different situation is the case of Hebrew orthography, which is
“different in character from that of English orthography” (p. 279), here the com-
plexity is given by absence of graphemes representing vowels, which are omitted,
on the contrary, a pointed writing, like those of the learning material for children,
is transparent, this means that, as Frost indicates, “opaque spelling-to-sound con-
nections arise simply from missing phonemic information” (idem).
A third case is that of French, here, while a grapheme (letter or letter clusters) is
always pronounced in the same way, there are phonemes that can be represented
graphically through several forms, e.g.: “The phoneme /E/, [can be represented]
by ’in’ (fin [thin]), ain (main [hand]), or ein (rein [kidney])” (Jaffré & Fayol,
2006), the consequence is that “the mapping of phonology to spelling is opaque
in French” (Frost, 2005), but not the mapping of spelling to phonology. Finally it
can also be defined as another source of orthographic depth, the case of languages
having several orthographies, like Korean (Hangul and Hanza) or Japanese (Kanjiand Kana), in which the same spoken forms can be represented by two totally
independent graphical systems. This comparison confirms that there are different
sources and directions of complexity, that is why is not possible to depend only in
the notion of consistency to discriminate orthographic distance from phonology.
Other effort in the same cross–linguistic line is that of Seymour, Aro, & Erskine
(2003). The advantage of this study is a wider range of languages with different
characteristics, due to cooperation with an international network of researchers
from 16 European countries. The focus of research is a particular moment in
early reading denominate Foundation literacy (see Seymour, 2005, pp. 306–307):
“through assessments of letter knowledge, familiar word reading, and simple non-
word reading” Seymour et al., p. 143.
The objective is to examine the language effects in developmental reading in Eu-
ropean languages. Besides English (in Scotland), other 12 languages were in-
cluded in the experiments: Finnish, Greek, Italian, Spanish, German, Norwegian,
Icelandic, Portuguese, Dutch, Swedish, French, and Danish. To classify orthogra-
60
tel-0
0563
710,
ver
sion
1 -
7 Fe
b 20
11
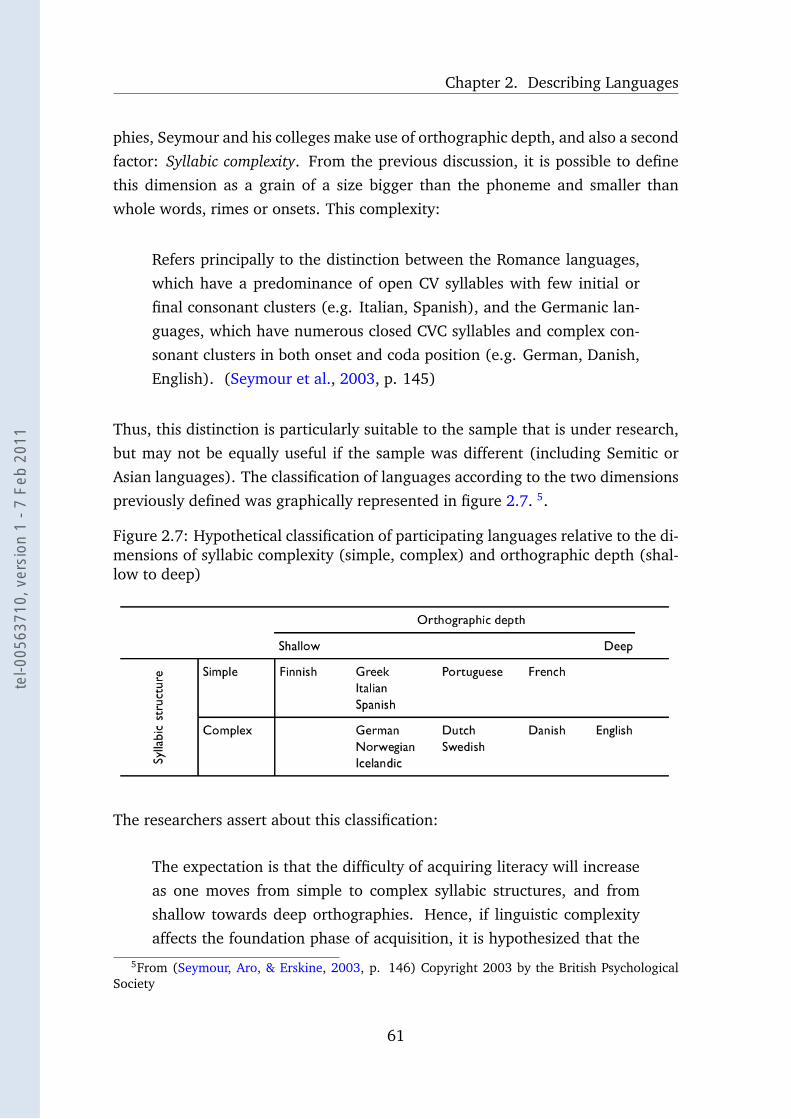
Chapter 2. Describing Languages
phies, Seymour and his colleges make use of orthographic depth, and also a second
factor: Syllabic complexity. From the previous discussion, it is possible to define
this dimension as a grain of a size bigger than the phoneme and smaller than
whole words, rimes or onsets. This complexity:
Refers principally to the distinction between the Romance languages,
which have a predominance of open CV syllables with few initial or
final consonant clusters (e.g. Italian, Spanish), and the Germanic lan-
guages, which have numerous closed CVC syllables and complex con-
sonant clusters in both onset and coda position (e.g. German, Danish,
English). (Seymour et al., 2003, p. 145)
Thus, this distinction is particularly suitable to the sample that is under research,
but may not be equally useful if the sample was different (including Semitic or
Asian languages). The classification of languages according to the two dimensions
previously defined was graphically represented in figure 2.7. 5.
Figure 2.7: Hypothetical classification of participating languages relative to the di-mensions of syllabic complexity (simple, complex) and orthographic depth (shal-low to deep)
The researchers assert about this classification:
The expectation is that the difficulty of acquiring literacy will increase
as one moves from simple to complex syllabic structures, and from
shallow towards deep orthographies. Hence, if linguistic complexity
affects the foundation phase of acquisition, it is hypothesized that the5From (Seymour, Aro, & Erskine, 2003, p. 146) Copyright 2003 by the British Psychological
Society
61
tel-0
0563
710,
ver
sion
1 -
7 Fe
b 20
11
2.2. Phonological description
initial steps in reading will be traversed more rapidly in languages with
simple syllabic structure than in languages with complex syllabic struc-
ture, and that acquisition will be slower in deeper orthographies than
in shallow orthographies. (p. 146)
In all tasks, the general results confirms the advantage of transparent orthogra-
phies in speed and accuracy in reading: “From the beginnings of learning, the
alphabetic decoding process develops more slowly and less efficiently in some lan-
guages than in others” (Seymour, 2005, p. 310). The result of familiar words
reading is particularly eloquent:
In most European orthographies children read familiar words very ac-
curately (>95% correct) and fluently (1.6 sec/item) before the end
of the first school year. These levels are substantially lower in Por-
tuguese, French, and Danish (approx 75% correct), and far lower in
English (34% in grade 1, rising to 76% in grade 2). Syllable structure
appeared not to have a damaging effect. Further, there was no sig-
nificant relationship with age (Scottish data excluded). It seems that
orthographic depth directly retards the rate at which a sight vocabulary
is learned. (p. 310)
Besides of being an interesting result in terms of the quantity of languages de-
scribed by the experiments, it also offers a final clue about the best way of classify
languages in accord with their orthographies. This study confirms that deepness
is the key factor, at the same time, it proves that syllabic complexity is not deter-
minant in reading accuracy, since language of different complexity degree have
similar results (e.g. Italian, Spanish, German and Norwegian).
These findings do not make explicit mention to the problem of decoding units’
size, however, the distinction between simple and complex syllable structure is,
in fact, an upper-phonemic unit: Its irrelevance in reading accuracy can be inter-
preted as a prove against the proposal that these units plays a role on it. The
word accuracy is highlighted because it is about a particular reading task that this
result was found, in other words, this do not deny that non–phonological units
are a component of reading development, particularly in languages with complex
structures, being this fact largely proved, as mentioned in this literature review.
62
tel-0
0563
710,
ver
sion
1 -
7 Fe
b 20
11
Chapter 2. Describing Languages
Whereas, in concerning reading achievement, which is the interest of this research
to measure, its explicative power seems to not be equally evident.
To conclude, it is clear that orthographic depth is a determinant factor in reading
accuracy that allow to discriminate among orthographies and, consequentially,
among languages. To be able to measure its role played in reading achievement,
the next step will be to define concretely which languages have transparent or
depth orthographies in our PIRLS sample, and, secondly, to develop an efficient
way to turn this factor into a measurable variable. But, before that, two elements
of the framework must be described to complete the theoretical review done until
now. First, it is necessary to describe the survey that will be the source of data
to the search experiments. Secondly, only after gathering all these theoretical ele-
ments it will be possible to clarify what is exactly our research proposal, hypothesis
and objectives. These will be the subject of the next chapter.
63
tel-0
0563
710,
ver
sion
1 -
7 Fe
b 20
11
Chapter 3
PIRLS Assessment and ReadingResearch
Reading acquisition has become a high priority subject, at schools, communities
and internationally. As the subject of this research is the connection between lan-
guage and reading, it is suitable to obtain data that comes from only one reading
test translated into several languages. Two possibilities to obtain data were consid-
ered: it might be a national test from a country where several languages co-exist
or an international test administered in several countries.
The advantage of choosing the first option is the possibility of equal educational
policies, methodology, and evaluation. These languages of teaching are all mem-
bers of the same educational system; moreover, the system shares the same cul-
tural and social conditions. However, this is not always the case, in a nation, the
coexistence of several languages can also mean local educational policies, as in
countries such as Spain and Canada (see subsections 4.1.2.b and 4.1.1.c). Two
principal inconveniences are exemplified by such countries.
Firstly, languages may come from the same root. In this case, they would not be as
diverse as is suitable for this research. Secondly, to find linguistic diversity, that is,
at least three or four languages well represented in a sample and not coming from
the same root, one should search among countries with a colonial history, as this
diversity is often a result of colonization processes. In this case, other problems
arise such as the presence of connections between a particular language and so-
cial group or class, unequal distribution of languages among population, and the
availability of data for the research (less available in developing countries).
64
tel-0
0563
710,
ver
sion
1 -
7 Fe
b 20
11
Chapter 3. PIRLS Assessment and Reading Research
African countries provide an interesting example to illuminate a situation in which
there exists a very extensive linguistic diversity. Not only is there a coexistence of
a colonial language along with several local languages, but there are also different
extents of representation of the languages in the national educational systems.
(e.a. see section 4.1.2.a). In addition, there are other circumstances that make
it difficult to work with such countries, like the problem of availability of data,
the connection between some languages and particular social groups, and the
fact that in its actual state of development there are other influencing factors,
mostly economic and social, that are particularly explicative of those countries’
results (see Pulleyblank, 1990).
Contrarily, in regards to the second alternative: a reading test translated into sev-
eral languages, the major issue of dealing with different educational contexts that
will increase the importance of controlling these variables, an achievable objective.
On the international level there are several organizations working in reading re-
search. Such as the OCDE program for International Student Assessment: PISA,
the research of the Latin American Laboratory for the Assessment of Education
Quality – LLECE and the UNESCO Institute for Lifelong Learning (previous Insti-
tute for Education).
This last organization was particularly important in the early beginnings of the
internationalization of educational research. Formerly a German foundation, (by
its institution in 1952) it became the research center of UNESCO with the mis-
sion of generating East-West cooperation in education. It was in this context, in
1958, when a group of scholars, educational psychologists, sociologists and psy-
chometricians, intended to develop more systematic and quantitative international
comparisons of educational systems. This was a response to the growing needs
of internationalization of educational research and to the proliferation of studies
founded in general notions and based on data-free assertions, “sweeping general-
izations were being made about the relative merits of various national systems of
education” (Husén & Postlethwaite, 1996, p. 130). These were the origins of the
International Association for the Evaluation of Educational Achievement (IEA), a
non-profit, private association founded in Amsterdam (1959), its works is to carry
out international comparative studies.
Since its first international study, conducted in 1959–62 and known as Pilot Twelve-
Country Study (Foshay, Thorndike, Hotyat, Pidgeon, & Walker, 1962), the IEA has
65
tel-0
0563
710,
ver
sion
1 -
7 Fe
b 20
11
been developing and improving educational research, and undertaking more ex-
tensive investigations of learning achievement. The principal goal of this research
is to identify the factors having a positive effect in learning and achievement at
school. One of this works is the Progress in International Reading Literacy Study(PIRLS), defined as, “a regular cycle of studies of children’s reading literacy and
the factors associated with its acquisition in countries around the world” (Mullis,
Kennedy, Martin, & Sainsbury, 2006, page 2). The target population for the study
was:
The upper of the two adjacent grades with the most 9-year-olds. In
most countries, this is the fourth grade. This population was chosen
for PIRLS because it is an important transition point in children’s de-
velopment as readers. Typically, at this point, students have learned
how to read and are now reading to learn. (Campbell, Kelly, Mullis,
Martin, & Sainsbury, 2001, p. 6)
66
tel-0
0563
710,
ver
sion
1 -
7 Fe
b 20
11
Chapter 3. PIRLS Assessment and Reading Research
3.1 Description of the study
PIRLS is the study in which, the data to test the hypothesis of this research will
be taken. A detailed description and characterization will be provided previous to
the data analysis. Before, since it is fundamental to the precision of this work, the
reasons why it was chosen will be immediately clear.
First, IEA asserts that “systems of education represented units that were respon-
sible for the education of young people within their boundaries” (Postlethwaite,
1995, p. 3). Consequently, their assessments provide numerous data from sev-
eral different countries and several different languages. To assure comparability
and the quality of the translations, important measures were taken. For example,
multiple revision and contrasting of pre-test results (see section 3.3). Secondly,
a point of interest in this particular assessment is the fact that PIRLS is a cycle.
In other words, it offers the possibility of having data available, not only for one
particular evaluation processes, but rather for several. In this particular case, two
evaluations have been carried out and a third one is scheduled for 2011. This will
allow comparisons and allow the statement of the persistence or modifications of
observed behaviors in a phase of time. Thirdly, the age of the evaluated students
in PIRLS, is satisfactory (around ten years), because the object of this study is the
development of reading skills after the first stages of learning, period in which
the development of cognitive strategies and processes become central. Finally, the
definition about reading, as it will be described later, is in accord with the actual
conceptions about reading, and it has, consequently, the necessary elements to
do a study, not only of general achievement scores, but also of specific reading
dimensions and languages.
3.1.1 History of the Study
PIRLS is the current product of the IEA’s interest in language assessment. It is also
the present result of numerous previous works through which the association has
being developing their expertise and systems of evaluation in this area. The first
international study of IEA, in 1959, already included a reading comprehension
section. The first objective of this study was, “to discover the possibilities and the
difficulties attending a large-scale international study” (Husén & Postlethwaite,
1996, p. 130). The second study was part of a more ambitious evaluation in sev-
67
tel-0
0563
710,
ver
sion
1 -
7 Fe
b 20
11
3.1. Description of the study
eral aspects of education: The Six Subjects Survey (1968–1972)(Walker, 1976), in
which, along with mathematic and science tests, a reading comprehension assess-
ment was developed, along with tests on French and English as foreign languages.
A more accurate explanation of the underlying assumptions of testing was deve-
loped for this new assessment. The factors considered as possible determinants
of accomplishment in reading included: home environment, language in home,
exposure to mass media, availability of reading materials, educational practices,
background and the interests and attitudes of the students. From these predictors,
two main instances were recognized: home and school factors. This point of view
has persisted over time in following studies of the IEA.
During the eighties, the areas of research of the IEA, consolidated in the previous
decade, start to enlarge. In the period from 1984 to 1985, a study focusing on
writing composition was done. Writing composition is a different subject of as-
sessment than reading comprehension. It is unlike reading comprehension in that
the production can be assessed directly (Davies et al., 1999). It is important to
note that one of the factors studied along with the curriculum and teaching prac-
tices was cultural background. In the reading studies, culture was not classified
as a main factor. It was only studied through individual aspects such as home
habits and / or language use. The importance of culture in this kind of interna-
tional research has been the object of constant controversy, a declared purpose of
international research is to compare, to be able to do that, international research
make generalizations that undervalue cultural differences. The next section (3.3),
discusses this problem in relation to PIRLS, and also, in relation to the problem of
language as cultural identity.
In the decade of nineties, the 1990–1994 IEA reading literacy study, reached a
higher level in reading research. Researchers improved and updated the definition
of reading and the methods and objective of their study. Reading and the teaching
of reading were defined as cognitive-linguistic acts (Lundberg & Linnakyla, 1993).
At the same time, Reading was classified as a particular kind of literacy. This def-
inition implies the acknowledgement of other ways to process information other
than through linguistic codes. Furthermore, it implied the inclusion of both, liter-
acy and reading in the wider theoretical framework of cognition, in other words,
both are defined as mental processing of information. This cognitive definition
will prove to be the most improved aspect in future assessments.
For the purposes of the study, reading literacy was defined as: “the ability to un-
68
tel-0
0563
710,
ver
sion
1 -
7 Fe
b 20
11
Chapter 3. PIRLS Assessment and Reading Research
derstand and use those written language forms required by society and / or valued
by the individual” (Elley, 1992, p. 3). Because of the constraints of mass testing,
the stress was placed on understanding more than on use. Another important dis-
tinction was the discrimination of three domains or types of materials: narrative
prose, expository prose and documents. This particular classification of reading
tasks depends on the previous stated definition. Moreover, the performance of the
countries was often reported separately in the analysis.
For the IEA, what was most fundamental for the assessment, even more than mea-
suring reading in general terms, was the study of factors that determined those
results. Particular attention was paid to identifying the different reading policies
and instructional practices, and their relation to students’ achievement and vol-
untary reading. Other objectives of the study were to produce valid international
tests and questionnaires and to provide a baseline to monitoring changes over
time. It showed that in the beginning of this study to create a cycle of assessment
was already present in the IEA program. This theoretical development of concepts,
objective,s and methods, suggest a main change in comparison to the first works
of the IEA. It also established the support for the following studies, those of which
the data for this research were taken.
3.1.2 Reading definition in PIRLS
The PIRLS study was created using the previous researches as references, of par-
ticular use was, the 1990–1994 study viewed as a direct source which: “served
as a foundation for PIRLS. It provided a basis for the PIRLS definition of reading
literacy and for establishing the framework and developing the assessment instru-
ments” (Campbell et al., 2001, p. 2). However, there were many improvements in
the design of the test that aim to reflect the latest approaches to what reading is
and how to measure it. Concerning the definition, PIRLS 2001 was improved by
adding the idea that reading is a constructive and interactive process. Therefore,
reading is now defined as:
The ability to understand and use those written language forms re-
quired by society and/or valued by the individual. Young readers can
construct meaning from a variety of texts. They read to learn, to partic-
ipate in communities of readers, and for enjoyment. (Campbell et al.,
69
tel-0
0563
710,
ver
sion
1 -
7 Fe
b 20
11
3.1. Description of the study
2001, p. 3)
In this definition, the second sentence, which is new, reflects the constructive char-
acter of reading, that is, the fact that the reader is not passive but active in the
process of making sense of the text. This points towards the concept of reader that
was developed by reader-response theory (see section 1): “La lecture est interac-
tion dynamique entre le texte et le lecteur. Car les signes linguistiques du texte et
ses combinaisons ne peuvent assumer leur fonction que s’ils déclenchent des actes
qui mènent à la transposition du texte dans la conscience de son lecteur” (Iser,
1997, p. 189). The third sentence, also new, goes ahead of Iser’s theory, as it
remarks that the act of reading is realized, not only in the conscience of the reader,but also in a social dimension. Now, reading is not understood as a closed process
but as a practice which is only completed obtaining the reader objectives. These
objectives have a social dimension, in which reading is used as a tool for attaining
individual and societal goals (see Austin, 1970; Street, 1993; Tryphon & Vonèche,
1996).
For the development of PIRLS 2006 assessment new reflections about this defini-
tion were made. The result was not a theoretical enlargement, but a clarification
of one of the aspects already considered:
For PIRLS, reading literacy is defined as the ability to understand and
use those written language forms required by society and/or valued by
the individual. Young readers can construct meaning from a variety of
texts. They read to learn, to participate in communities of readers in
school and everyday life, and for enjoyment. (Mullis et al., 2006, p. 3)
The only addition to the previous definition is the specification of the communi-
ties in which the students participate. This is not simply a refinement, but rather
a way to link this definition to the approaches followed in the construction of the
study and their later evaluation. On the other hand, this part of the definition has
the subtle mission of harmonizing with the more cultural approaches of reading
theory. The principal problem confronted here, is the fact that these approaches
understands culture not only as a factor determining reading ability but also as
a result of an evaluation process; the evaluation itself is determined by cultural
context. This was not, until now, added to PIRLS methodology because of the
70
tel-0
0563
710,
ver
sion
1 -
7 Fe
b 20
11
Chapter 3. PIRLS Assessment and Reading Research
characteristic of this international assessment and its goal of maintaining compa-
rability across countries.
On the other hand, a more abstract side of the definition of reading is the concept
of ability. Ability is the central notion of all three explanations that have been
discussed (the two PIRLS definition and that of the 1991 study). The notion of
ability can be defined as the “Current capacity to perform an act” (Davies et al.,
1999, p. 1). It is in this way that reading is probably understood by the IEA. It is
not, in the more general meaning in which ability is used, as a loose synonym of
aptitude (Pellegrino & Varnhagan, 1985, p. 1): a potential ability or the learning
capacities of an individual. A closer idea to the concept of intelligence.
The difference between them exists in the incorporation of the term current. The
term current states the involvement of time into ability. From this point of view,
and because PIRLS is a cycle, the study has incorporated this relation between
time and ability. This interest became the goal of monitoring changes over time.
In other words, following this interpretation, the reading ability of a sample of
students is representative of their capacities, only by the time of the test being
taken. Several evaluations, in different periods, must be done to get a general
perception of their reading ability.
Along with the question of measurement of ability in time, the other fundamen-
tal difference stated by this notion, is related to the fact of being evaluating an
educational system. PIRLS has no intention of being a test of intelligence of apti-
tudes, in fact, “it is designed to measure children’s reading literacy achievement”
(Mullis, Martin, Gonzalez, & Kennedy, 2003, p. 277). This is to say, it refers to
the mastery of what has been learned; “An achievement test therefore is an in-
strument designed to measure what a person has learned within or up to a given
time. It is based on a clear and public indication of the instruction that has been
given” (Davies et al., 1999, p. 2). Remembering the previously enunciated objec-
tives of the IEA: quantitative international comparisons of educational systems, and
knowing that the IEA has studied carefully the curriculum of each participating
country. The conclusion reached was that reading ability is conceived as mainly
determined by the fact of being part of an educational system. In other words, this
ability is an effect of formal education.
In spite of this explanation, the process of measurement reading is still a complex
procedure. Ability cannot be directly observed because it is a mental capacity, a
71
tel-0
0563
710,
ver
sion
1 -
7 Fe
b 20
11
3.1. Description of the study
construct, and not a physical fact:
Abilities, or capacities, or aptitudes, or intellectual skills, or whatever
you choose to call them, are measured in terms of response products
to standardized stimulus situations. The stimulus is presented to an
organism which by some process comes up with a response. (McNemar,
1964, p. 881)
In trying to measure reading ability, the question of which factors and components
of reading will be taken into account become fundamental. In the two PIRLS
definitions, several components of the assessment itself are elicited, like the factors
to study in explaining reading ability, the aspects of reading considered, and the
notion of reading as a set of processes of comprehension, which can be classified
in several areas. Moreover, a number of questionnaires were developed, in search
of information about the condition of reading learning. Each one will be described
in the next section.
72
tel-0
0563
710,
ver
sion
1 -
7 Fe
b 20
11
Chapter 3. PIRLS Assessment and Reading Research
3.2 What is PIRLS measuring?
The principal objective of PIRLS is to measure children’s reading ability. Since
this cannot be directly observed, indirect ways of evaluation were defined. PIRLS
determined the way in which the tests were elaborated, the conception of methods
to collect information, and the factors that can determine reading.
Three aspects are highlighted, specifically, because they would play a key role in
reading literacy. These aspects are the support of the assessment’s structure: a) the
reading processes of comprehension, similar to the idea of how to understandand use and construct meaning in PIRLS’ reading definition; b) the purposes for
reading, related to the idea of variety of texts and reading to learn, to participate incommunities, and for enjoyment; c) finally, PIRLS believes that reading behaviors
and attitudes are also determinant aspects of reading achievement, connected
with the phrase: forms required by society and/or valued by the individual, and also
with the construction of meaning. The description of these three aspects will start
by mentioning the characteristics of generalities in the next paragraph.
3.2.1 Aspects of Student’s Reading Literacy
3.2.1.a Home and individual factors
PIRLS identifies two major types of external factors with equal influence in read-
ing achievement: home and school. In both, there are behaviors and attitudes to
be studied that can help to understand reading achievement. In concrete terms,
PIRLS includes this aspect in the assessment, through a series of questionnaires
addressed to teachers, schools responsible, parents, and the children themselves
(all the participants of the learning process). These questionnaires are a funda-
mental source to analyze the influence in reading achievement of aspects such as
reading habits, social and economic circumstances, methodological choices, and
school character, among many other aspects.
As figure 3.1 shows, PIRLS framework suggests that there are two main sources
of influence: home and school. There are also several micro and macro levels
of influence, for instance, national polices or ethnological characteristics. A main
premise is to suppose is that school factors have the same importance as home
factors. Both home and school count 50% of this aspect of reading. In other
73
tel-0
0563
710,
ver
sion
1 -
7 Fe
b 20
11
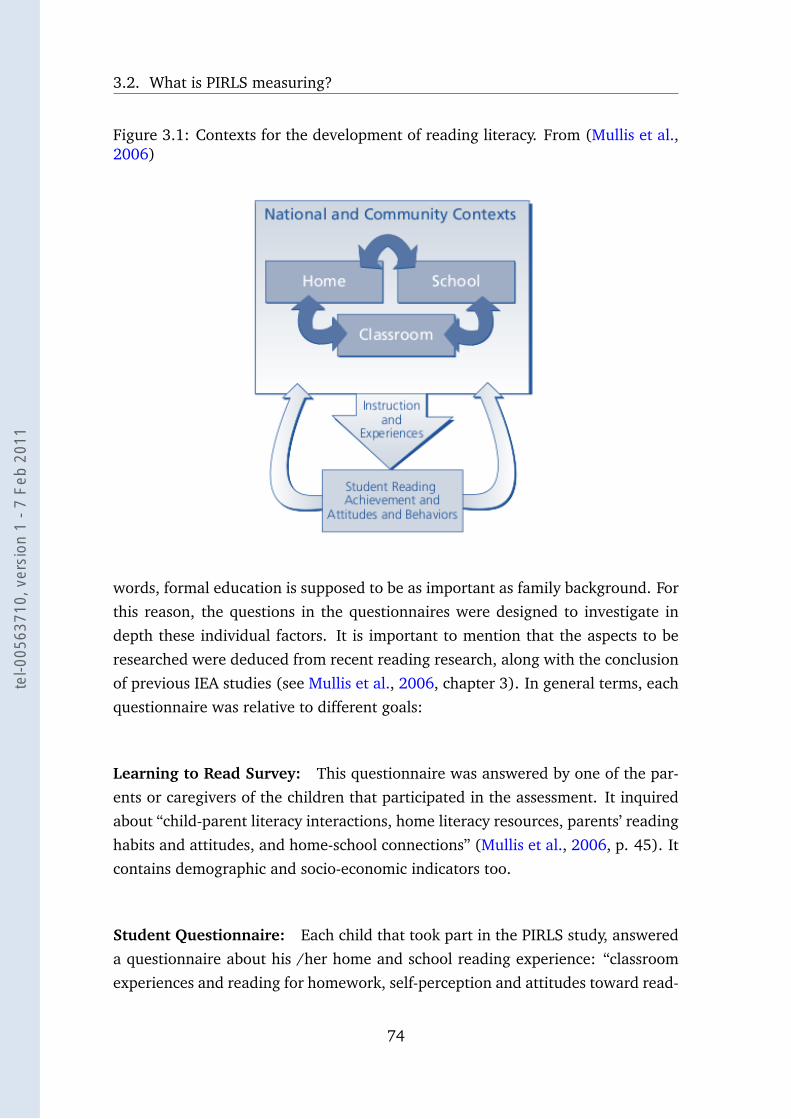
3.2. What is PIRLS measuring?
Figure 3.1: Contexts for the development of reading literacy. From (Mullis et al.,2006)
words, formal education is supposed to be as important as family background. For
this reason, the questions in the questionnaires were designed to investigate in
depth these individual factors. It is important to mention that the aspects to be
researched were deduced from recent reading research, along with the conclusion
of previous IEA studies (see Mullis et al., 2006, chapter 3). In general terms, each
questionnaire was relative to different goals:
Learning to Read Survey: This questionnaire was answered by one of the par-
ents or caregivers of the children that participated in the assessment. It inquired
about “child-parent literacy interactions, home literacy resources, parents’ reading
habits and attitudes, and home-school connections” (Mullis et al., 2006, p. 45). It
contains demographic and socio-economic indicators too.
Student Questionnaire: Each child that took part in the PIRLS study, answered
a questionnaire about his /her home and school reading experience: “classroom
experiences and reading for homework, self-perception and attitudes toward read-
74
tel-0
0563
710,
ver
sion
1 -
7 Fe
b 20
11
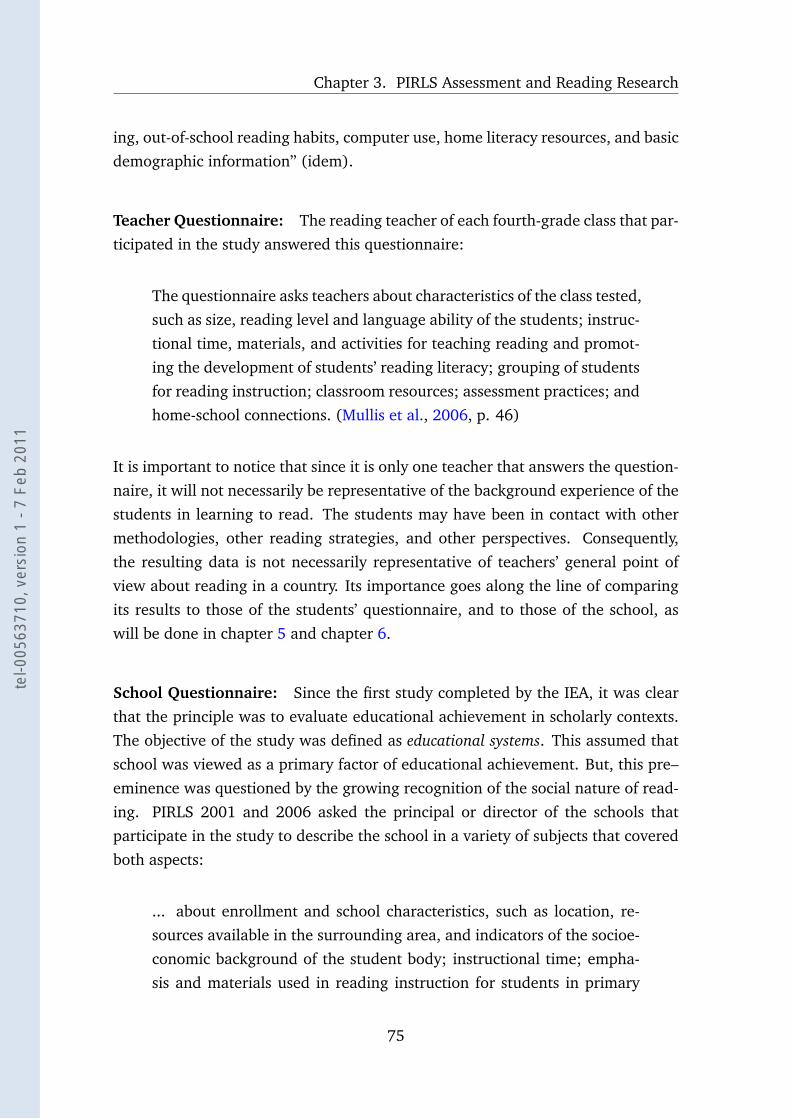
Chapter 3. PIRLS Assessment and Reading Research
ing, out-of-school reading habits, computer use, home literacy resources, and basic
demographic information” (idem).
Teacher Questionnaire: The reading teacher of each fourth-grade class that par-
ticipated in the study answered this questionnaire:
The questionnaire asks teachers about characteristics of the class tested,
such as size, reading level and language ability of the students; instruc-
tional time, materials, and activities for teaching reading and promot-
ing the development of students’ reading literacy; grouping of students
for reading instruction; classroom resources; assessment practices; and
home-school connections. (Mullis et al., 2006, p. 46)
It is important to notice that since it is only one teacher that answers the question-
naire, it will not necessarily be representative of the background experience of the
students in learning to read. The students may have been in contact with other
methodologies, other reading strategies, and other perspectives. Consequently,
the resulting data is not necessarily representative of teachers’ general point of
view about reading in a country. Its importance goes along the line of comparing
its results to those of the students’ questionnaire, and to those of the school, as
will be done in chapter 5 and chapter 6.
School Questionnaire: Since the first study completed by the IEA, it was clear
that the principle was to evaluate educational achievement in scholarly contexts.
The objective of the study was defined as educational systems. This assumed that
school was viewed as a primary factor of educational achievement. But, this pre–
eminence was questioned by the growing recognition of the social nature of read-
ing. PIRLS 2001 and 2006 asked the principal or director of the schools that
participate in the study to describe the school in a variety of subjects that covered
both aspects:
... about enrollment and school characteristics, such as location, re-
sources available in the surrounding area, and indicators of the socioe-
conomic background of the student body; instructional time; empha-
sis and materials used in reading instruction for students in primary
75
tel-0
0563
710,
ver
sion
1 -
7 Fe
b 20
11
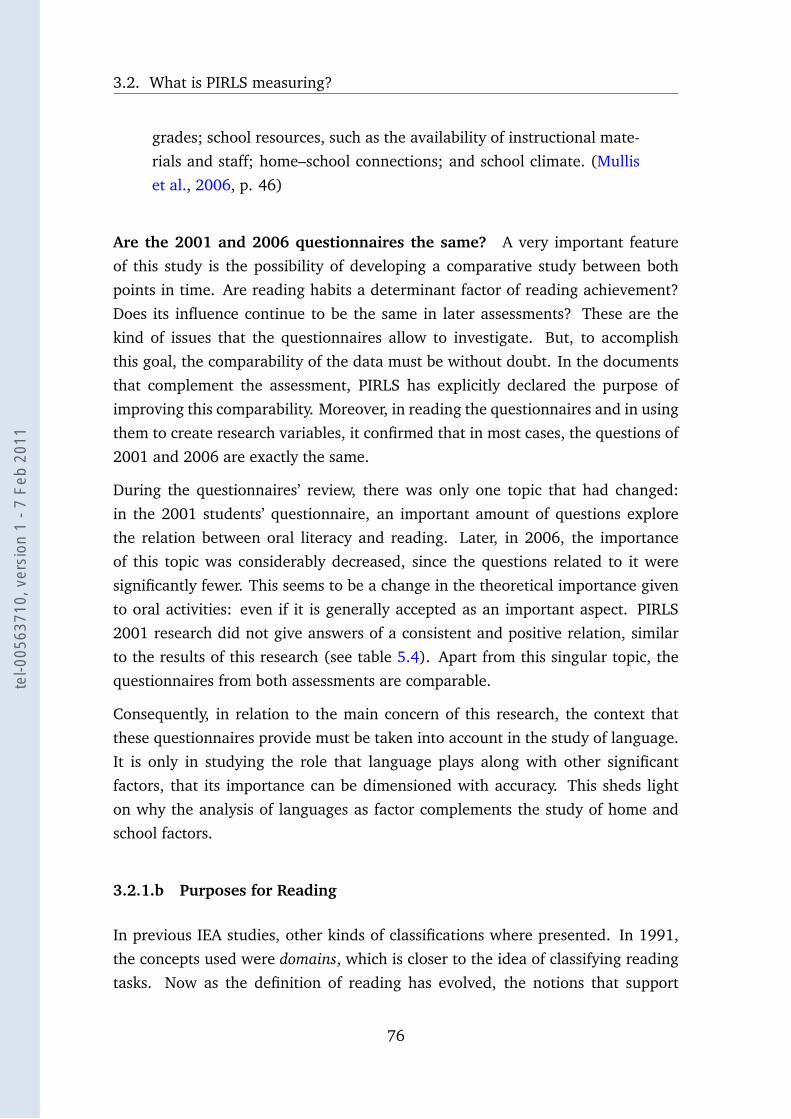
3.2. What is PIRLS measuring?
grades; school resources, such as the availability of instructional mate-
rials and staff; home–school connections; and school climate. (Mullis
et al., 2006, p. 46)
Are the 2001 and 2006 questionnaires the same? A very important feature
of this study is the possibility of developing a comparative study between both
points in time. Are reading habits a determinant factor of reading achievement?
Does its influence continue to be the same in later assessments? These are the
kind of issues that the questionnaires allow to investigate. But, to accomplish
this goal, the comparability of the data must be without doubt. In the documents
that complement the assessment, PIRLS has explicitly declared the purpose of
improving this comparability. Moreover, in reading the questionnaires and in using
them to create research variables, it confirmed that in most cases, the questions of
2001 and 2006 are exactly the same.
During the questionnaires’ review, there was only one topic that had changed:
in the 2001 students’ questionnaire, an important amount of questions explore
the relation between oral literacy and reading. Later, in 2006, the importance
of this topic was considerably decreased, since the questions related to it were
significantly fewer. This seems to be a change in the theoretical importance given
to oral activities: even if it is generally accepted as an important aspect. PIRLS
2001 research did not give answers of a consistent and positive relation, similar
to the results of this research (see table 5.4). Apart from this singular topic, the
questionnaires from both assessments are comparable.
Consequently, in relation to the main concern of this research, the context that
these questionnaires provide must be taken into account in the study of language.
It is only in studying the role that language plays along with other significant
factors, that its importance can be dimensioned with accuracy. This sheds light
on why the analysis of languages as factor complements the study of home and
school factors.
3.2.1.b Purposes for Reading
In previous IEA studies, other kinds of classifications where presented. In 1991,
the concepts used were domains, which is closer to the idea of classifying reading
tasks. Now as the definition of reading has evolved, the notions that support
76
tel-0
0563
710,
ver
sion
1 -
7 Fe
b 20
11
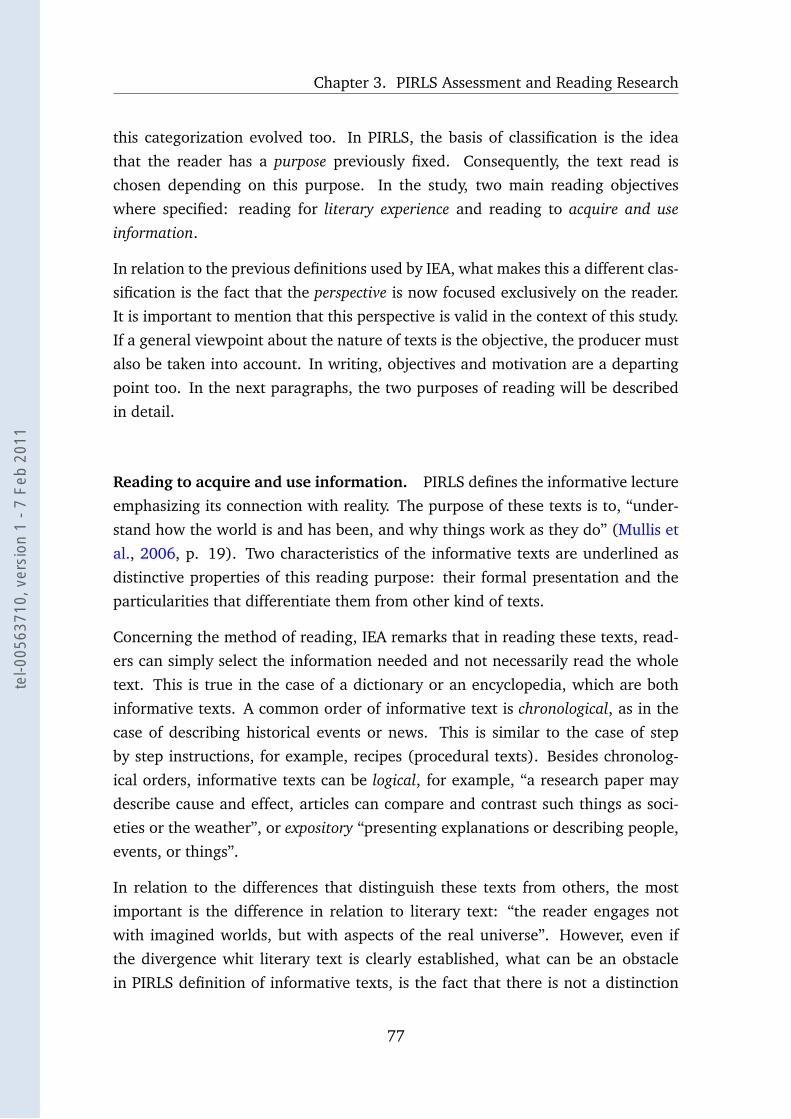
Chapter 3. PIRLS Assessment and Reading Research
this categorization evolved too. In PIRLS, the basis of classification is the idea
that the reader has a purpose previously fixed. Consequently, the text read is
chosen depending on this purpose. In the study, two main reading objectives
where specified: reading for literary experience and reading to acquire and useinformation.
In relation to the previous definitions used by IEA, what makes this a different clas-
sification is the fact that the perspective is now focused exclusively on the reader.
It is important to mention that this perspective is valid in the context of this study.
If a general viewpoint about the nature of texts is the objective, the producer must
also be taken into account. In writing, objectives and motivation are a departing
point too. In the next paragraphs, the two purposes of reading will be described
in detail.
Reading to acquire and use information. PIRLS defines the informative lecture
emphasizing its connection with reality. The purpose of these texts is to, “under-
stand how the world is and has been, and why things work as they do” (Mullis et
al., 2006, p. 19). Two characteristics of the informative texts are underlined as
distinctive properties of this reading purpose: their formal presentation and the
particularities that differentiate them from other kind of texts.
Concerning the method of reading, IEA remarks that in reading these texts, read-
ers can simply select the information needed and not necessarily read the whole
text. This is true in the case of a dictionary or an encyclopedia, which are both
informative texts. A common order of informative text is chronological, as in the
case of describing historical events or news. This is similar to the case of step
by step instructions, for example, recipes (procedural texts). Besides chronolog-
ical orders, informative texts can be logical, for example, “a research paper may
describe cause and effect, articles can compare and contrast such things as soci-
eties or the weather”, or expository “presenting explanations or describing people,
events, or things”.
In relation to the differences that distinguish these texts from others, the most
important is the difference in relation to literary text: “the reader engages not
with imagined worlds, but with aspects of the real universe”. However, even if
the divergence whit literary text is clearly established, what can be an obstacle
in PIRLS definition of informative texts, is the fact that there is not a distinction
77
tel-0
0563
710,
ver
sion
1 -
7 Fe
b 20
11
3.2. What is PIRLS measuring?
between the processing of information and its evaluation. The theoretical models
tend to make this differentiation (see Jakobson, 1960), and identify a third text
type: the argumentative or rhetoric text. On the contrary, PIRLS includes this task
as part of the informational lecture:
Persuasive texts aim directly at influencing the reader’s view as in
the presentation of a problem and recommended solution. In discus-
sion and persuasion, the reader must follow the development of ideas
and bring to the text a critical mind in forming his or her own opin-
ion.(Mullis et al., 2006, p. 20)
The aims of an informative text are explanation, analysis, and syntheses of facts,
while the argumentative text is based on subjective judgment of the same infor-
mation. In any case, the level of simplicity of the texts included in the assess-
ment, and the questions associated with them, decrease the importance of this
distinction, this would have been essential in evaluating reading comprehension
in higher levels.
Reading for literary experience. Research studies underline the importance of
the literary experience as one of the first contacts between children and the writ-
ing world. PIRLS also joins this point of view stating, “The early reading of most
young children centers on literary and narrative text types” (Mullis et al., 2006,
p. 18). In understanding literary texts, the reader “engages with the text to be-
come involved in imagined events, setting, actions, consequences, characters, at-
mosphere, feelings, and ideas, and to enjoy language itself. ... For young readers,
literature offers the opportunity to explore situations and feelings they have not
yet encountered” (Mullis et al., 2006, p. 19).
The definition of text types, purposes, and genders have been a subject of scholarly
discussion for a long time. Since Aristotle’s Poetics, a central issue in this area has
been the definition of the literary text. Poetics studies, that were mentioned in the
introduction (1) , searched to answer the question of what is the essential property
of a literary text that, is unique in relation to other kinds of texts, and shared by
all forms of literature. Jakobson answers to this question is the notion of Poetic as
a function of language, in which verbal communication, “focus on the message for
its own sake” (Jakobson, 1960, 356). In addition to these kinds of classifications,
78
tel-0
0563
710,
ver
sion
1 -
7 Fe
b 20
11
Chapter 3. PIRLS Assessment and Reading Research
which are highly abstract, there is a tendency in actual research to include the act
of lecture and the readers as part of the essence of texts, along with socio-cultural
circumstances.
These brief paragraphs underline the complexity of establishing a definition of
literary reading. This complexity can be also further explored in the definition of
informative texts. It is inferred from its unclear frontier with argumentative texts.
In both cases, the level of simplicity of the texts presented by PIRLS, created for
beginner readers, provides an interesting opportunity to study the limits of these
definitions. Moreover, as will be described later, the results of the assessment are
presented separately for each purpose of the reader. This will allow further study
of each feature, and to study factors that can play a different role in each type of
text.
3.2.1.c Processes of Comprehension
These so-called processes give a systematic response to the question: what doesthe reader do to reach comprehension? In comparison with the previous assess-
ments developed by the IEA this distinction is innovative. In the 1991 precedent
study, the processes were named only in terms of specific tasks of each reading
domain. Furthermore, they were not considered in the subsequent analysis of
the data. PIRLS 2001 framework stated the idea that there are several ways to
construct meaning from a text. The study defined four processes that should be
taken into account in the creation of the reading test and in the resulting data–
sets. Each question of the test is referred to one process. Moreover, the processes
were proportionally distributed following a previously established sketch (see sec-
tion 3.2.2.a), increasing the importance given to this idea. PIRLS 2006 not only
recognized these processes, but also took them into account in the data analysis.
Four reading comprehension processes were identified:
Focus on and retrieve explicitly stated information. In reading, the informa-
tion is visually present. The reader finds it in the surface of the text and under-
stands what is stated explicitly, an almost automatic process. However, the level
of automatism will depend on the general reading ability achieved by the reader.
Some examples of tasks related to this process are: “identifying information that
is relevant to the specific goal of reading, looking for specific ideas, searching
79
tel-0
0563
710,
ver
sion
1 -
7 Fe
b 20
11
3.2. What is PIRLS measuring?
for definitions of words or phrases, identifying the setting of a story (e.g., time,
place), finding the topic sentence or main idea (when explicitly stated)” (Mullis et
al., 2006, p. 13).
Make straightforward inferences. To construct meaning by inferring, the reader
must connect two or more ideas contained in the text. These ideas are explicitly
text-based, but the connection is not. Meaning from sentences can be the subject
of an inference but also global and whole text ideas. Normally, a skilled reader
is capable of developing this task automatically. Some examples of this process
are: “inferring that one event caused another event, concluding what is the main
point made by a series of arguments, determining the referent of a pronoun, iden-
tifying generalizations made in the text, describing the relationship between two
characters” (Mullis et al., 2006, p. 14).
Interpret and integrate ideas and information. Processing information in this
level, supports a global comprehension of the text meaning. The reader may need
the support of explicit or local information, but it must be interpreted and con-
nected to other parts of the text or other levels of meaning to reach comprehen-
sion. The process depends, not only on the reader’s experience, but also in their
background knowledge, and understanding of the world. The process can differ
from one reader to another and different interpretations may result in superior
comprehension. Some tasks are: “discerning the overall message or theme of a
text, considering an alternative to actions of characters, comparing and contrast-
ing text information, inferring a story’s mood or tone, interpreting a real-world
application of text information” (Mullis et al., 2006, p. 15).
Examine and evaluate content, language, and textual elements. What char-
acterizes this type of process is the idea of criticizing. In fact, it is not exactly
a comprehension process, but rather, a result of a satisfactory comprehension in
connection with the experience of the reader. Comparing texts with other texts
already known or with a personal experience are two fundamental ways of devel-
oping this process. Some examples of tasks are: “evaluating the likelihood that
the events described could really happen, describing how the author devised a
surprise ending, judging the completeness or clarity of information in the text,
80
tel-0
0563
710,
ver
sion
1 -
7 Fe
b 20
11
Chapter 3. PIRLS Assessment and Reading Research
determining an author’s perspective on the central topic” (Mullis et al., 2006, p.
17).
These four processes are considered by PIRLS as fundamentals of reading compre-
hension at the age of the examinees, considering the years that they have spend
learning to read. In the next section the details about how these skills and text
types are distributed in the assessment will be described. But before continuing, it
must be highlighted again the fact that both aspects of students reading literacy,
along with the external factors, are all the result of theoretical choices made by
IEA’s researchers. This should be considered when setting the limits of the inter-
pretation of these results.
3.2.2 Assessment description
A final point to consider, which is fundamental to the goals of this research, is to
review the translation of this theoretical conceptualization into the evaluation. In
other words, it is necessary to describe how these notions are represented in the
materials by means of which the evaluation is done, and the criteria employed for
this evaluation. In general terms, both PIRLS assessments are constructed with the
same theoretical framework. The texts employed as stimuli are conceived to be
equally understandable to all the examinees, with high standards of comparability
among international translation (see Mullis et al., 2006, chapter 4) and (Mullis,
Martin, Kennedy, & Foy, 2007, chapter 5).
Regarding the questions created to evaluate reading comprehension, its constitu-
tion and distribution responds to the previously described approach. Every item
in the assessment is conceived to evaluate a specific pair of purpose–procedure in
relation to a predetermined lecture stimulus. Besides the main purpose of keeping
the comparability of both tests, there are some differences that must be mentioned,
even if they do not prevent general comparisons. Both tests will be now described
separately to remark later they differences and resemblances.
3.2.2.a PIRLS 2001 assessment
Table 3.1 represents a detailed description of how the theoretical conceptions are
related to the items in the 2001 test. There are two horizontal blocks presenting
81
tel-0
0563
710,
ver
sion
1 -
7 Fe
b 20
11
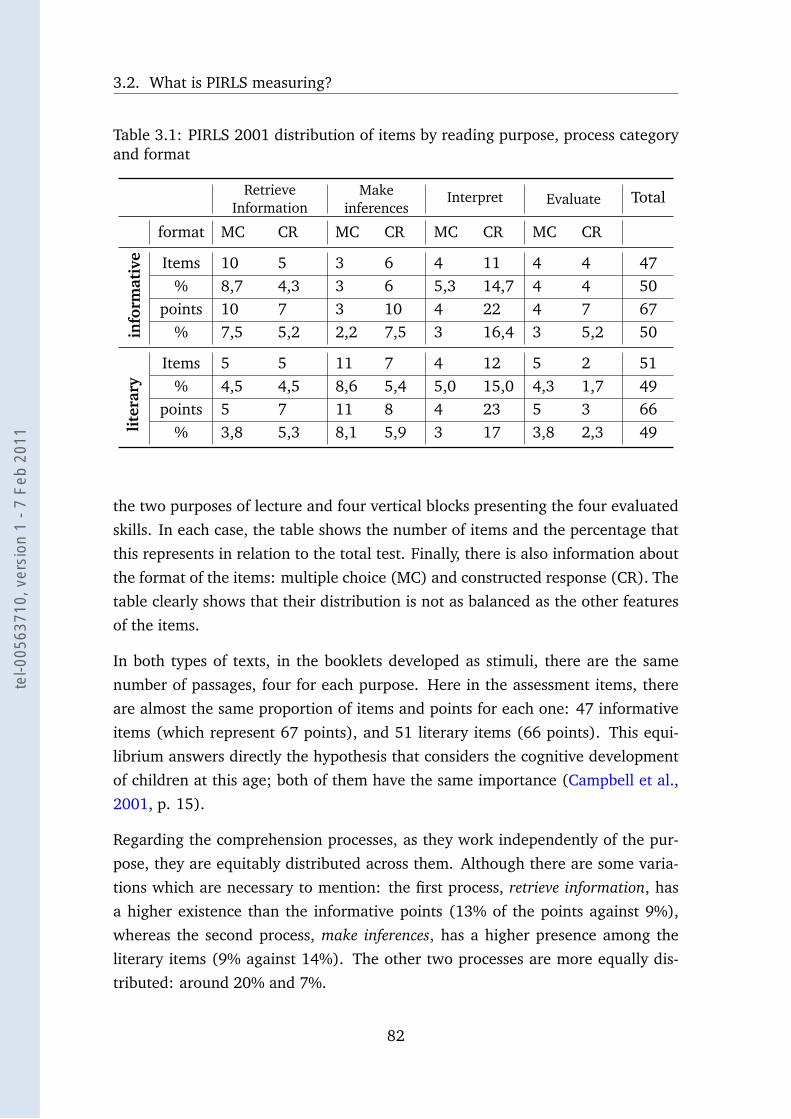
3.2. What is PIRLS measuring?
Table 3.1: PIRLS 2001 distribution of items by reading purpose, process categoryand format
RetrieveInformation
Makeinferences
Interpret Evaluate Total
format MC CR MC CR MC CR MC CR
info
rmat
ive Items 10 5 3 6 4 11 4 4 47
% 8,7 4,3 3 6 5,3 14,7 4 4 50points 10 7 3 10 4 22 4 7 67
% 7,5 5,2 2,2 7,5 3 16,4 3 5,2 50
Items 5 5 11 7 4 12 5 2 51
lite
rary % 4,5 4,5 8,6 5,4 5,0 15,0 4,3 1,7 49
points 5 7 11 8 4 23 5 3 66% 3,8 5,3 8,1 5,9 3 17 3,8 2,3 49
the two purposes of lecture and four vertical blocks presenting the four evaluated
skills. In each case, the table shows the number of items and the percentage that
this represents in relation to the total test. Finally, there is also information about
the format of the items: multiple choice (MC) and constructed response (CR). The
table clearly shows that their distribution is not as balanced as the other features
of the items.
In both types of texts, in the booklets developed as stimuli, there are the same
number of passages, four for each purpose. Here in the assessment items, there
are almost the same proportion of items and points for each one: 47 informative
items (which represent 67 points), and 51 literary items (66 points). This equi-
librium answers directly the hypothesis that considers the cognitive development
of children at this age; both of them have the same importance (Campbell et al.,
2001, p. 15).
Regarding the comprehension processes, as they work independently of the pur-
pose, they are equitably distributed across them. Although there are some varia-
tions which are necessary to mention: the first process, retrieve information, has
a higher existence than the informative points (13% of the points against 9%),
whereas the second process, make inferences, has a higher presence among the
literary items (9% against 14%). The other two processes are more equally dis-
tributed: around 20% and 7%.
82
tel-0
0563
710,
ver
sion
1 -
7 Fe
b 20
11
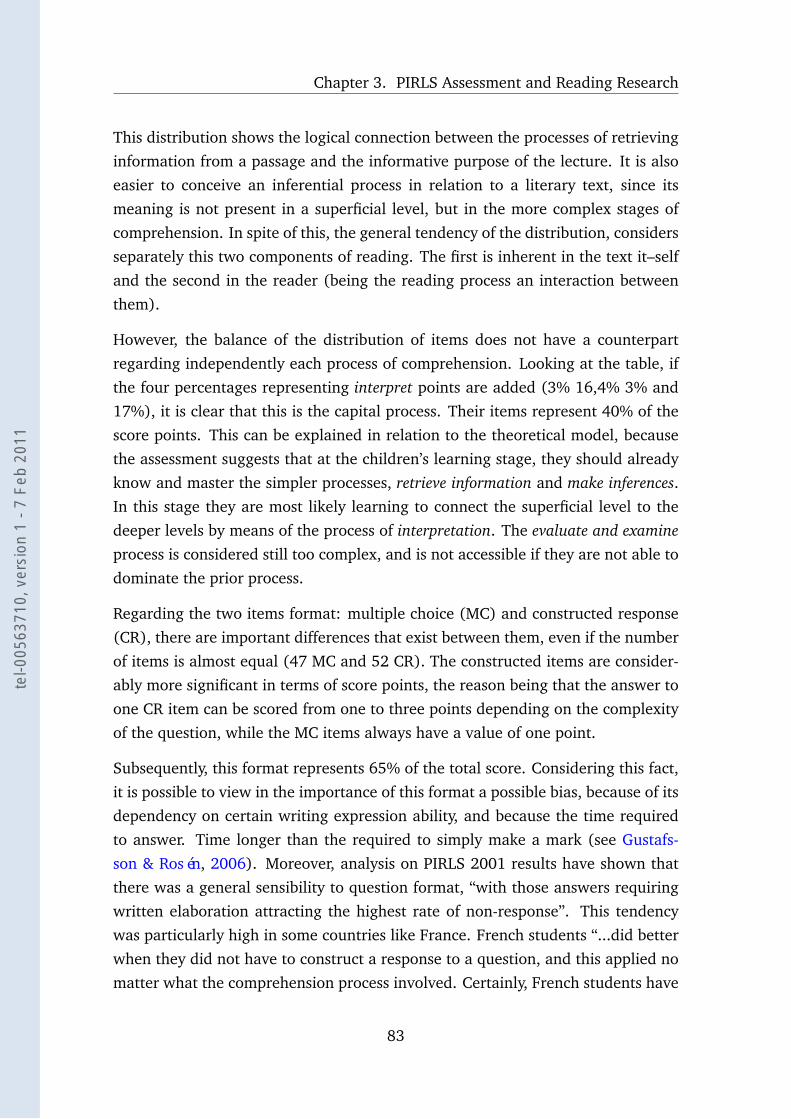
Chapter 3. PIRLS Assessment and Reading Research
This distribution shows the logical connection between the processes of retrieving
information from a passage and the informative purpose of the lecture. It is also
easier to conceive an inferential process in relation to a literary text, since its
meaning is not present in a superficial level, but in the more complex stages of
comprehension. In spite of this, the general tendency of the distribution, considers
separately this two components of reading. The first is inherent in the text it–self
and the second in the reader (being the reading process an interaction between
them).
However, the balance of the distribution of items does not have a counterpart
regarding independently each process of comprehension. Looking at the table, if
the four percentages representing interpret points are added (3% 16,4% 3% and
17%), it is clear that this is the capital process. Their items represent 40% of the
score points. This can be explained in relation to the theoretical model, because
the assessment suggests that at the children’s learning stage, they should already
know and master the simpler processes, retrieve information and make inferences.In this stage they are most likely learning to connect the superficial level to the
deeper levels by means of the process of interpretation. The evaluate and examineprocess is considered still too complex, and is not accessible if they are not able to
dominate the prior process.
Regarding the two items format: multiple choice (MC) and constructed response
(CR), there are important differences that exist between them, even if the number
of items is almost equal (47 MC and 52 CR). The constructed items are consider-
ably more significant in terms of score points, the reason being that the answer to
one CR item can be scored from one to three points depending on the complexity
of the question, while the MC items always have a value of one point.
Subsequently, this format represents 65% of the total score. Considering this fact,
it is possible to view in the importance of this format a possible bias, because of its
dependency on certain writing expression ability, and because the time required
to answer. Time longer than the required to simply make a mark (see Gustafs-
son & Rosén, 2006). Moreover, analysis on PIRLS 2001 results have shown that
there was a general sensibility to question format, “with those answers requiring
written elaboration attracting the highest rate of non-response”. This tendency
was particularly high in some countries like France. French students “...did better
when they did not have to construct a response to a question, and this applied no
matter what the comprehension process involved. Certainly, French students have
83
tel-0
0563
710,
ver
sion
1 -
7 Fe
b 20
11
3.2. What is PIRLS measuring?
a strong tendency to refrain from answering open-ended questions” (Schwippert
(2007, p. 82); see also Rémond (2006)). Consequently, this evidence demon-
strated that item format is not without consequence in the test achievement. In
addition, this can affect some countries or communities more than others.
3.2.2.b PIRLS 2006 assessment
As was mentioned before, PIRLS 2006 is explicitly built on PIRLS 2001 (see Mullis
et al., 2007, p. 16), their purposes and goals being the same. Both studies are part
of one only project, and, in general terms, it is possible to establish correlations
and juxtaposition between them. But, in the fine points of this general resem-
blance, there are some important variations which must be taken into account.
These differentiations can be reordered into two principal lines: internal and ex-
ternals. First, there is some dissimilarity concerning the structure of the test itself,
related to the incorporation of the comprehension process among the objectives
of analysis. Secondly, there are variations related to the changes in the sample,
regarding the participant countries and the languages used by them.
In the paragraphs to come, an explanation of why the internal changes do not
forces the introduction of alteration into this research will be provided. Dissimi-
larly, the external changes do compel the careful study of the new sample and to
adapt this work. That is why these changes will be described in a different sec-
tion (see chapter 4) centering the focus of interest on the linguistic changes of the
sample (new languages, percentage of representation, validity of the data, etc.).
Adjustments on comprehension processes. In describing PIRLS 2001 items, it
was mentioned that the questions used for testing constituted the tangible formu-
lation of the theoretical conceptualization about reading developed for this assess-
ment. Because those notions have not changed, the questions are structurally sim-
ilar to the previous ones. There is one variation inside this theoretical framework:
the importance given to the difference between the comprehension processes at
the moment of interpreting results. The purpose of the 2001 report was only “to
report results for the two major types of reading students do in school” (Mullis &
Martin, 2004, p. 6). Later, PIRLS developers had the intention of improving the
assessment by providing information on comprehension processes in addition to
reading purposes as an important goal of PIRLS 2006, as defined in the mentioned
84
tel-0
0563
710,
ver
sion
1 -
7 Fe
b 20
11
Chapter 3. PIRLS Assessment and Reading Research
rapport by Mullis & Martin.
To be able to report the results on comprehension processes, the number of pas-
sages was increased from 8 to 10, five for the literary purpose and five for the
informational purpose. This expansion, suggests a larger amount of questions
(125) and score points (165) 1, still a high comparability was searched. In fact,
there are four passages, two literary and two informational retained from PIRLS
2001, they represent 49 items and 66 score points.
Table 3.2: PIRLS 2006 distribution of items by reading purpose, process categoryand format
RetrieveInformation
Makeinferences
Interpret Evaluate Total
format MC CR MC CR MC CR MC CR
info
rmat
ive items 11 7 12 6 1 15 5 4 61
% 8.8 5.6 9.6 4.8 0.8 12.0 4.0 3.2 48.8points 11 9 12 9 1 27 5 7 81
% 6.7 5.5 7.3 5.5 0.6 16.4 3.0 4.2 49.1
items 8 5 17 8 5 13 4 4 64
lite
rary % 6.4 4.0 13.6 6.4 4.0 10.4 3.2 3.2 51.2
points 8 8 17 9 5 27 4 6 84% 4.8 4.8 10.3 5.5 3.0 16.4 2.4 3.6 50.9
Items distribution. This table shows the item distribution in the same way as
in 2001, likewise, every item evaluate a pair of purpose–process in relation to a
predetermined lecture stimulus using a particular format of item. As it was done
for 2001, here are two blocks presenting the two purposes of reading. They respect
the same proportion of items and points. The only difference is the total amount,
there are more items and points than in 2001: 14 informative items (14 score
points) and 13 literary items (18 points). This increment keeps the proportions,
and the literary part of the items is barely one point higher than the informative
part.
In regards of the comprehension processes, there was some dissimilarities detected1Our values can differ from the PIRLS publications because we considered omitted, not admin-
ister or different coded question taking these data from the results of the assessment.
85
tel-0
0563
710,
ver
sion
1 -
7 Fe
b 20
11
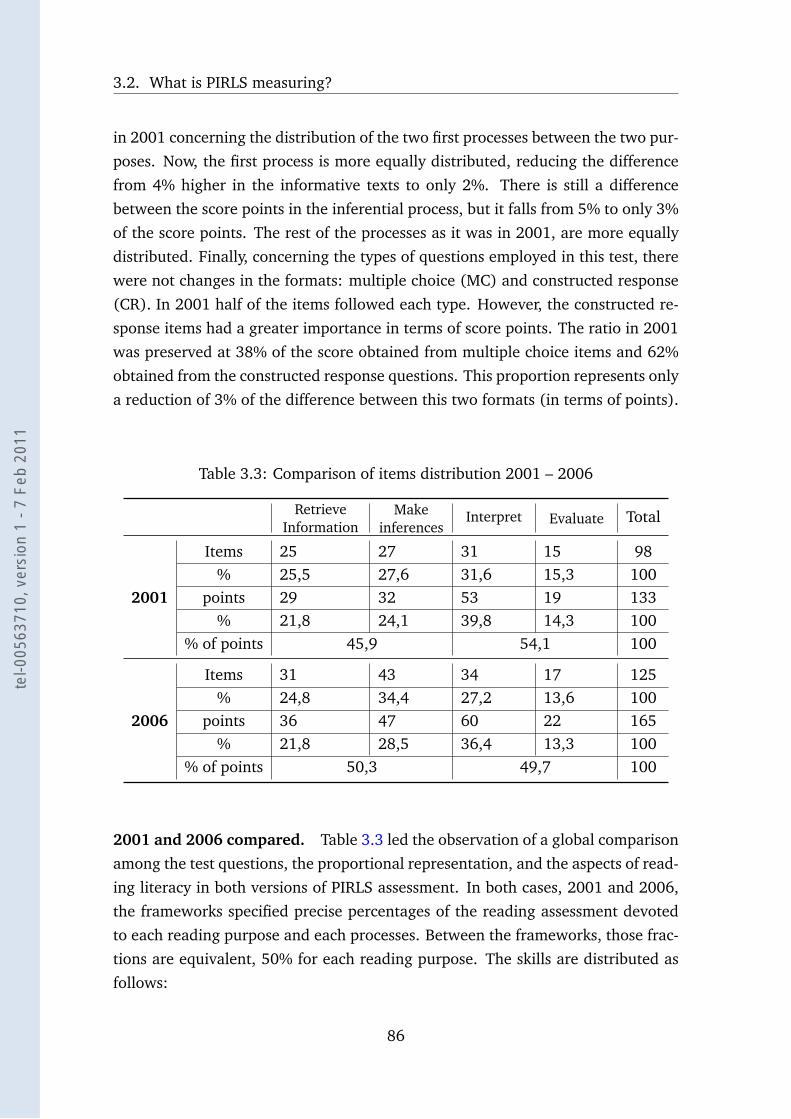
3.2. What is PIRLS measuring?
in 2001 concerning the distribution of the two first processes between the two pur-
poses. Now, the first process is more equally distributed, reducing the difference
from 4% higher in the informative texts to only 2%. There is still a difference
between the score points in the inferential process, but it falls from 5% to only 3%
of the score points. The rest of the processes as it was in 2001, are more equally
distributed. Finally, concerning the types of questions employed in this test, there
were not changes in the formats: multiple choice (MC) and constructed response
(CR). In 2001 half of the items followed each type. However, the constructed re-
sponse items had a greater importance in terms of score points. The ratio in 2001
was preserved at 38% of the score obtained from multiple choice items and 62%
obtained from the constructed response questions. This proportion represents only
a reduction of 3% of the difference between this two formats (in terms of points).
Table 3.3: Comparison of items distribution 2001 – 2006
RetrieveInformation
Makeinferences
Interpret Evaluate Total
Items 25 27 31 15 98% 25,5 27,6 31,6 15,3 100
2001 points 29 32 53 19 133% 21,8 24,1 39,8 14,3 100
% of points 45,9 54,1 100
Items 31 43 34 17 125% 24,8 34,4 27,2 13,6 100
2006 points 36 47 60 22 165% 21,8 28,5 36,4 13,3 100
% of points 50,3 49,7 100
2001 and 2006 compared. Table 3.3 led the observation of a global comparison
among the test questions, the proportional representation, and the aspects of read-
ing literacy in both versions of PIRLS assessment. In both cases, 2001 and 2006,
the frameworks specified precise percentages of the reading assessment devoted
to each reading purpose and each processes. Between the frameworks, those frac-
tions are equivalent, 50% for each reading purpose. The skills are distributed as
follows:
86
tel-0
0563
710,
ver
sion
1 -
7 Fe
b 20
11

Chapter 3. PIRLS Assessment and Reading Research
• Focus on and Retrieve Explicitly Stated Information: 20%
• Make Straightforward Inferences: 30%
• Interpret and Integrate Ideas and Information: 30%
• Examine and Evaluate Content, Language, and Textual Elements: 20%
However, table 3.3 shows that in terms of number of items and in terms of score
points, these proportions are not always maintained. The first process is almost
identical in both, items and points, the items represent around 25%, that is 5%
more than planned, while the points are close to 20%. This difference can be ex-
plained by the high number of 1 point MC items used to measure this ability; their
amount decrees as the complexity of the process increases. The second process
is, in both cases, closer to the goal of 30% in number of items, but they differ in
percentage of score points. In 2001, they reached only 24%, 6% under what was
expected. In 2006, they almost reached the goal, (this shows how the 2006 test is
an improved version of 2001 assessment).
The interpret process has a higher variation in relation to the goal of 30%. The
items do represent it, but the score points are 10% and 6% over the objective. This
over–representation has a detrimental effect on the process evaluate which only
reach 14% of the total score point, very far from the 20% theoretically expected.
This particular distribution will not be without consequences in the assessment.
Whether the students master this skill or not, will determine their results more
than any of the other comprehension processes. However, the assessment does not
consider the four processes separately. To be able to produce valid scores for each
one, many more questions will be needed, and that will increase the extension
and complexity of the test itself. This will not be suitable for the students age and
level of reading learning (see Mullis et al., 2007, chapter 2). Consequently, the
scores derived from the assessment only take into account two reading process
scales: “Equal proportions among the first two and last two processes support the
reporting of separate scales for two processes of comprehension: retrieval and
straightforward inferencing and interpreting, integrating, and evaluating” (Mullis
et al., 2007, p. 21).
Comparing the two low level comprehension processes and the two high processes,
an important change exist, that is related to the new objective of PIRLS 2006: to
87
tel-0
0563
710,
ver
sion
1 -
7 Fe
b 20
11
3.2. What is PIRLS measuring?
incorporate the analysis of the processes. The second process altered its propor-
tion 4.4%, allowing the combination of the two lower processes to reach 50%
of representations in the test in terms of points. On the other side, the sum of
both high processes: interpret and evaluate has decreased: 1% (interpret) and
3% (evaluate). This reduces the presence of these processes in the test to nearly
50%. It could have been a perfect match of half and half score points to each scale,
except for one question that was not considered because the item discrimination
was too low for many countries (Foy & Kennedy, 2008, Supplement 2, p.113).
To conclude, it is necessary to confirm that the theoretical framework, the dis-
tribution of the items, and the means to evaluate them, do not stray way from
this study. On the contrary, they provide more clues to develop this research than
PIRLS 2001. In relation to the question of whether the mastery of the skills affect
the achievement, that will be one of the complementary questions of this research,
now focused in low and high level scales.
88
tel-0
0563
710,
ver
sion
1 -
7 Fe
b 20
11
Chapter 3. PIRLS Assessment and Reading Research
3.3 Criticism on PIRLS
As it can be assumed, to develop a study involving so many countries, educational
systems, and languages, is not a process exempt from detractors and polemics. Es-
pecially when media coverage is extensive and a country’s results are very good or
very bad. For example, in England, when the 2001 results were published: “Typ-
ical headlines were, ‘English rank third in world reading chart’ (TES) or ‘English
primary pupils are among the best readers in the world’, and ‘the most successful
English-speaking country’(DFES)” (Clark, 2004, p.27). Obviously these are state-
ments that are out of context and disproportionate. They do not represent the aim
of the survey, which does not search to ‘rank’ countries, as Rocher (2008) says “La
mise en perspective des données issues des évaluations internationales nécessite
un exercice de comparaison plus fin qu’un simple ordonnancement des pays” (p.
63). In contrast, this kind of mediatic repercussions illustrate the impact of these
researches on public opinion, making of the surveys an especially delicate issue.
3.3.1 Criticized features
The criticism related to this study are referred to several aspects of the assess-
ment. Whetton, Ruddock, & Twist (2007) classified the criticisms derived from
the English polemics:
The criticisms can be grouped into four types: those that relate to the
underlying conceptualisation of the studies as research enterprises;
those that concentrate on cultural and linguistic factors; those that
question the statistical and psychometric basis; and finally those which
examine the sampling methodology. (p. 4)
All these criticisms can be summarized in two main aspects: methodology and
culture. Regarding methodology, several researchers have deeply investigated the
validity of the instruments used to measure reading in PIRLS study. For example,
Hilton (2006) criticizes many aspects of the test, questioning its overall validity
in reference to the general quality of the English educational system. Among her
targets, the items’ dimensions (the subject of the previous paragraphs) are men-
tioned, along with the representational sizes of the sample, the geographic disper-
sion, and the linguistic and cultural bias. Vrignaud (2006) Describes how difficult
89
tel-0
0563
710,
ver
sion
1 -
7 Fe
b 20
11
3.3. Criticism on PIRLS
is to empirically prove the existence of different dimensions in PISA assessment,
considering that there are strongly correlated (see tables 6.4 and 6.5) . Other
researchers inquired about the use of two different types of items. As mentioned
previously, they suggest different cognitive procedures and different amount of
time. The constructed response items considerably more complex and slower to be
answered (see Gustafsson & Rosén, 2006). Another criticized point is the use of
IRT statistical methodology. Its validity in such large scale surveys cannot be the
same as in simpler psychometric tests (see Goldstein, 2004).
Evaluation, criticism, or even description of the psychometric features of this test
(or any other international comparison) could not be done without doing a com-
plete investigation of the subject. Psychometric cannot be treated superficially and
it is out of the aims of this work. Consequently a further explanation of criticism
on this particular subject will not be developed. This decision agrees with Whet-
ton et al. (2007) assertion: “Ultimately, each interested person must make their
own view on the reliability and validity of these international surveys and of the
methodological criticisms made of them. But this cannot be a single view of them
all” (p. 7).
But there is another issue that is directly related to our main subject, and that
should be discussed before proceeding: culture. Reading achievement is not out-
side the influence of culture, on the contrary it is in the center of the discussion.
Reading is a fundamental ability in the present world, as this world depends on so-
cieties and on reading. For this reason it will be determined by the idiosyncrasy of
the cultures of each society. As Barré-de Miniac (2003) highlights: “Savoir lire et
savoir écrire sont des compétences qui ne peuvent se définir dans l’absolu, comme
des compétences cognitives indépendantes des conditions sociales et culturelles
de leur développement et de leur mise en œuvre” (p. 117).
3.3.2 Language and Cultural validity
The criticism related to culture can involve a wide range of issues, from transla-
tions, languages, populations, to the ideology behind international comparisons.
Being all aspect of culture itself, the first two subjects are at the center of the prob-
lem and are directly related to the subject of this research. For this reason a more
systematic description will be given in the next paragraphs.
90
tel-0
0563
710,
ver
sion
1 -
7 Fe
b 20
11
Chapter 3. PIRLS Assessment and Reading Research
About languages and translations. As was already described, there are more
than 40 languages present in PIRLS test, and many tasks have been done to assure
comparability. The original passages that make up the test were contributed by
several of the participating systems. The translation and verification process is
described in (Martin, Mullis, & Kennedy, 2007, chapter 5), the major steps in this
process were the following:
In first place, the assessments, questionnaires, and manuals, were developed in
English (this fact, as will be discussed later, is an important source of criticism).
Secondly, with the help of guidelines created by the IEA, each participant country
translated the materials and adapted them to fit their cultural context. Among the
recommendations of the guide, was the preservation of the original register and
information (not omissions, not additions), the use of correct grammar, spelling
and punctuation, and the translation of idiomatic expression preserving meaning
and not word by word. IEA encouraged participants to hire a highly competent
translator with experience in educational fields along with literary texts to do the
translation. It is important to mention that each educational system that partici-
pated in the study did its own translation. There was not a general translation for
all the countries sharing a language.
Later, a reviewer was also asked to read the translation to verify their readability in
relation to the target population. A third step to assure the quality and equivalence
of these translations was an “international translation verification process” (Martin
et al., 2007, p. 49). Two independent translation companies were hired to assure
the quality of the international translation (one from England and the other from
Belgium). Their principal task was to ensure that the translation did not affect
meaning, difficulty, order or options, and that no omissions were made.
As can be seen, translation was a subject of great effort to assure quality, however
it is questionable that all the source texts were in English because it can bias
the results of a test, particularly in this case where the goal of the assessment is
as related to language as to read. An analysis made by Diepen, Verhoevenand,
Aarnoutse, & Bosman (2007) studied this subject in comparing English and Dutch
translations of PIRLS. The compared texts presented differences in the quantity
and length of words, and there were modifications introduced to improve Dutch
version. Although the changes did not show an impact in the results:
The use of more and longer words did not produce a higher level of
91
tel-0
0563
710,
ver
sion
1 -
7 Fe
b 20
11
3.3. Criticism on PIRLS
complexity with respect to content, sentence structure, text structure,
or test items as judged by a panel of bilingual experts. ... The omission
of passages and the modification or omission of test items were found
to have no consequences for the psychometric properties of the Dutch
version of the test were examined. (p. 1)
In relation to this problem, even if it was unrelated to IEA work, the shadows of
the translation issues in IALS are present. IALS (1995) was an international study
about Adult Literacy. It was published by the OCDE and developed by StatisticsCanada along with the participant countries. In that occasion, the results were
contested, France, after having participated in the development of the study and
completing the tests in a sample of adults aged 16 to 65, raised objections to the
results and finally asked for a total withdrawal of any reference to its education
system in IALS report (see Bottani & Vrignaud, 2005, Chapter 1.7.2). As Bottani
& Vrignaud describe, French researchers proved that there were three problematic
domains in the development of this study: “le problème de la traduction des items
de test, mais aussi de la formulation des questions dans les questionnaires et le
problème des biais de nature culturelle” (p. 41). In particular, the evaluation
questionnaire consisted of half of the questions related to professions and texts
that came from the United States or Canada, which explains the cultural bias, and
the linguistic and translation issues (see Bonnet, 2006, p. 96).
In conclusion, the issues surrounding this study, proved that an international sur-
vey can fail, particularly, in a subject as susceptible as culture and translation. Even
if the IEA was not involved, Bottani & Vrignaud are right when they affirm that
“On peut donc distinguer une période antérieure à l’enquête IALS et une période
postérieure à cette enquête, un « avant 1994 » et un « après 1994 »” (p. 39). The
demands for an extra effort in avoiding cultural and translation biases is higher
than ever. In the case of PIRLS it is not possible to reject, a priori, the presence of
a certain degree of linguistic influence when a specific language is the source of
the entire assessment. Finally, these authors are also right when they state:
La traduction de l’épreuve dans les différentes langues des pays partic-
ipants a donné lieu à de nombreuses vérifications. Ce point mériterait
néanmoins davantage de recherches et d’explicitations. D’abord, sur
un plan théorique, on aimerait savoir dans quelle mesure la variabilité
92
tel-0
0563
710,
ver
sion
1 -
7 Fe
b 20
11
Chapter 3. PIRLS Assessment and Reading Research
linguistique peut influer sur la performance à des épreuves utilisant le
langage comme la littéracie. (p. 126)
On the other hand, researches about PISA, like that from Duru-Bellat, Mons, &
Suchaut (2004) underlines that “les pays dont les élèves sont les plus performant
appartiennent à des aires culturellement très différentes”, the same remark can be
made about PIRLS, where, in 2006, the three best countries are Russian Feder-
ation, Hong Kong and the province of Alberta in Canada. This force to consider
linguistic bias as a possibility, and consequently, as a subject of research, what can-
not be done is to suppose that language and culture are a problem in international
comparisons without systematically measuring it.
93
tel-0
0563
710,
ver
sion
1 -
7 Fe
b 20
11
3.4. How to compare reading acquisition among languages?
3.4 How to compare reading acquisition among lan-
guages?
The purpose of this section is to state which are the specific assumptions and the
hypothesis that will guide the development of the experimental pathway; all the
previous chapters are the source of this proposal. The first subsection, searches
to clarify the conclusions from the previous theoretical discussion. Then, the hy-
pothesis will be presented. Next, the specific objectives of this research will be
presented in a way that seeks to be clear and concise, so that these can be deve-
loped in the work of analysis and easily identified by the reader. Finally, and to
conclude with this exposition, the methodological steps to be accomplished will
be described.
3.4.1 Research Problem
Starting from the general question about the relation between language and read-
ing, some distinguishing characteristic of this connection have been identified.
First of all, it was established that reading is a complex process, in which decoding
is only the first step to comprehension. Its complexity is determined by its double
dimensionality: it is a cognitive act and, at the same time, a social process (Oakhill
& Beard, 1995). Moreover, this complexity changes in time too. Consequently, it
will not be the same to read a novel as to read a newspaper. It will not be the same
to read a newspaper as a 7 year old as it is as a 25 year old nor will it be the same
to read just to pass time and for amusement, as it is to study for an exam. How-
ever, all these different situations are reading examples, all of them come from a
common root, use cognitive processes, and take place in social situations.
Now, the obvious question is how to develop an empirical research about such a
variable subject. In this case, the solution has been to find support in a specific
constituent that is always present in this process, no matter what the goal or sub-
ject of the reading is: language is the exclusive code to accomplish this tasks (see
Jakobson, 1960). Nevertheless, the advantage of studying the relation between
language and reading is also relative, since language is a complex system too and
the two dimensions that play a role in reading, cognitive and social, also play a
role in language. All this, makes a comprehensive empirical research become a
94
tel-0
0563
710,
ver
sion
1 -
7 Fe
b 20
11
Chapter 3. PIRLS Assessment and Reading Research
very difficult task to accomplish. However, in the same way that a definition of
reading was out of the aims of this research, a general definition of languages
is not either the objective. The aim is the less ambitious goal of to merely de-
scribe human tongues and its relation to reading, without forgetting, obviously,
the more large–scale problematic. In summary, from the theoretical framework,
three premises can be stated: first, languages are cultural-social entities, second,
the act of reading is complex and multidimentional, and differences can take place
from one stage of reading to another.
3.4.2 Hypothesis
At this point, there are more questions than answers about the subject; the most
general being how to compare reading acquisition among languages?, and the two
most specific are: how languages of learning are related to the multiple aspects thatcompose the act of reading, and does the influence of languages change in time?.
These questions will now be translated into a more specific research hypothesis
with the support of the previous discussion. The first question is, obviously, the
one that cannot be answered in a definitive way, it simply stands in to support
IEA’s reading study to be able to develop experiments. PIRLS, as a source of in-
formation, allows us to measure reading achievement in different languages, in a
particular point of development of this ability, considering different cognitive pro-
cesses and types of texts. Connecting this with the previous framework, we can
establish a principal and three auxiliary hypotheses.
THE LANGUAGE IN WHICH THE PIRLS TEST IS PERFORMED, AND/OR THE MOTHER
TONGUE OF THE EXAMINEES, CAN INFLUENCE THE TEST RESULTS
If languages determine reading ability in different ways, a trace of this diversity
should be found in test results. The revision of literature, has showed that lan-
guages are diverse, even if all of them have the same social and cognitive function
in their societies; there are many aspects that differentiate them. Two major lines
have been documented: the social characteristics (historical roots, resemblance in
evolution, geographical proximity), and the orthographic properties (in particular,
the way of mapping phonology into writing). Starting with such classifications
as framework, it is possible to create variables representing these notions using
95
tel-0
0563
710,
ver
sion
1 -
7 Fe
b 20
11
3.4. How to compare reading acquisition among languages?
PIRLS database to confirm or refute the presence of variation in reading scores in
relation with languages.
As it can be easily supposed, that is not an innovative hypothesis at all; many
researchers have constant similar tendencies among countries while examining
international survey results. For example in analyzing PIRLS 2001 Givvin, Hiebert,
Jacobs, Hollingsworth, & Gallimore (2005) found that:
Teachers within countries plan and implement lessons that share at
least some important similarities. The extent and nature of a given
pattern depends on the country examined and the lens used. These
national patterns may arise from a shared cultural “script” that teachers
have internalized as they participate in the educational system of their
country. Or the patterns may be generated from other sources (e.g.,
similarities in the curriculum mandated within a country). (342)
In this research the question is, can we get to a similar conclusion about the influ-ence of language?. Closer to this problem is the observation made by the IEA report
of their 1992 reading survey, when one of the findings of the assessment was the
better performance in the narrative domain of the students in Cyprus and Greece:
“while students in Hong Kong, Switzerland, Germany and Denmark performed
better in Documents” (Elley, 1992, page XII), in this finding there is an interesting
linguistic relation between two countries that share a language and also a trans-
parent orthography. This can be considered as a precedent of the linguistic topic
that will be studied in the present research.
Even closer to the aim of this research, is the finding of Schwippert (2007), who
made the following observation about PIRLS 2001:
In France, the test items on which the students scored most highly
were (1) an advertising leaflet that presented the services of a rent-a-
bike shop and included a map of a cycle trail (informational text), and
(2) an animal fable (a narrative literary text). France’s across-country
ranking for the first item was third and for the second was 10th. How-
ever, for another narrative text, France’s ranking was much lower, at
the 26th position. In Québec, the only other French-speaking commu-
nity in PIRLS, students’ performance on these three texts followed the
96
tel-0
0563
710,
ver
sion
1 -
7 Fe
b 20
11
Chapter 3. PIRLS Assessment and Reading Research
same hierarchy. In seems that language and culture maintain some in-
fluence on students’ comprehension of what they are reading despite
all the methodological efforts to reduce it. (p. 82)
As these two final quotes suggest, the tendencies related to languages, will not
necessarily be present in the total results. In other words, we can suppose that
these linguistic differences will also be manifested in the specific aspects that con-
form the reading process. That is the reason why it is important to define the
following auxiliary hypothesis.
LANGUAGES, CAN HAVE A DIFFERENT INCIDENCE CONCERNING THE ASPECTS AND
COMPONENTS OF THE READING PROCESS
Achievement in reading can change, if considering specific reading aspects; this
is the premise that is the starting point of this hypothesis. The relative indepen-
dence of these aspects is itself a premise derived from the notion of reading as a
multidimentional process. This connection has been stated by researchers, as for
example, Rémond (2006) who said: “Cet effet du «format des textes» peut prob-
ablement se rattacher à des différences culturelles et à des options pédagogiques
privilégiant davantage certains écrits que d’autres” (p. 74). The dimensions that
PIRLS differentiate are very specifics: two types of texts and four comprehension
processes, PIRLS data–sets will allow us to obtain specific scores in reading literary
texts and informative texts, along with two scales of comprehension, the high and
low order processes.
Therefore, only these specific dimensions will be included in the analysis. As was
previously mentioned, they are very limited because they depend on the theoreti-
cal choices made by PIRLS. Nevertheless, it is still very interesting to include them
into a modelling process, and to prove or refuse with empirical data the reality of
possible differences between reading with a literary purpose and reading with an
informative purpose, and between processing low level information and process-
ing high level information, along with the possible connection of those dimensions
with linguistic factors.
97
tel-0
0563
710,
ver
sion
1 -
7 Fe
b 20
11
3.4. How to compare reading acquisition among languages?
LANGUAGES, AS A FACTOR THAT INFLUENCES READING DEVELOPMENT CAN PLAY A
DIFFERENT ROLE THROUGH TIME
The implicit question in this auxiliary hypothesis is whether the influence of lan-
guages can change, increase or decrease over time, particulary in relation to lan-
guages phonology. In section 2.2.2.b, it was shown that the language of teaching
determines speed and accuracy of reading learning. Consequently, it is a relevant
factor in learning to read. Some researchers have hypothesized the consequences
of this fact in later stages of reading, for example Ziegler & Goswami (2005, p.3)
talk about developmental “footprints” in the adult lexicon: “The lexical organization
and processing strategies that are characteristic of skilled reading in different or-
thographies are affected by different developmental constraints in different writ-
ing systems”. Following this idea, in a reading test like PIRLS, one should find
differences among languages, but one cannot suppose what will be the nature
of these differences. They could simply be differences concerning the score, or, as
was already mentioned, differences regarding the purposes of each text used in the
test, or the cognitive processes implied. It can be assumed that children that used
to have a global point of view of text since the very start of the learning process,
(as in languages like English) will be better at high level processes of comprehen-
sion than at low level, which depends more directly on word comprehension (as
in languages like Spanish).
However, it can also be assumed that the previous differences will not continue
in time, since the task in which they were confirmed was simple decoding with
children not surpassing 8 years old. Now, in more skilled reading, the role of
comprehension implies another perspective to be taken into account. For exam-
ple, Van Orden & Kloos (2005, p. 67), in talking about English, has said: “so
far no one has discovered a generally robust phonology effect in skilled reading”;
Moreover, following the design of double route theory, “broad classes of codes” in
competition to be the more effective way of process information, Katz & Feldman
(1981, p.86) he proposes that the style of decoding of skilled readers will become
less dependent on phonological information and more morphological: “younger
readers tend to rely more on phonological information and less on nonphonologi-
cal (e.g. word-specific) mechanisms than do older readers”.
Consequently, the models will aim to test the following possibility: If linguistic
distance between phonology and orthography affects the initial phases of reading
98
tel-0
0563
710,
ver
sion
1 -
7 Fe
b 20
11
Chapter 3. PIRLS Assessment and Reading Research
acquisition, there can also be consequences or at least traces of those initial dif-
ferences in the following phases of reading learning. A final observation is that,
this hypothesis refers principally to orthographic transparency as decisive factor to
discriminate among languages, as the bibliographical references allow inferring.
No evidence has been found to attest to an incidence of linguistic family, the socio-
cultural factor, in earlier steps of reading development. This, however, does not
prevent the continuation of this research and the study of a possible connection
between families and reading.
HOME AND SCHOOL CHARACTERISTICS THAT DETERMINE READING ACHIEVEMENT
CAN HELP TO IMPROVE AN EXPLICATIVE MODEL INCLUDING LANGUAGES AS FAC-
TORS
This last hypothesis is very self–explanatory, and search to take into account con-
text into reading and language study. If contextual factors are not integrated in
this research and modelling, language, as factor, will be isolated. Language is one
factor among many others, that may play a role in reading achievement. In any
case this research proposes that this factor is more or less important than others.
The role of language can only be estimated if the potential findings are put in a
context.
Through this triangulation of factors, the expectation is to be able to compare the
incidence of language and other determinants of reading, to develop an explica-
tive model that explains the examinees’ achievement as accurately as possible.
However, while the general hypothesis that there is a school and home factor can
be accepted with no doubt, it is still worthless if specifics determinants are not
named. The use of PIRLS assessment makes it easier to define home and school
factors, since their questionnaires study several actual theories about possible de-
terminants, like early literacy, availability of reading material at home, motivation,
etc.
A central aim of this hypothesis will be the search of variables that can provide
evidence that contrasts the aspects of reading, in other words, it can be acknowl-
edge that a factor can affect a component of reading or another in a different
way, just as was also hypothesized for languages. An early experience in reading,
before school, can be more significant in explaining a literary score than an infor-
mative score or the achievement on high level comprehension instead of low. The
99
tel-0
0563
710,
ver
sion
1 -
7 Fe
b 20
11
3.4. How to compare reading acquisition among languages?
experiments of this research will attempt to prove or refuse these hypotheses.
3.4.3 Research objectives
The general objective, what this research hope to achieve is: To describe the inter-action between language and reading in PIRLS database, its relation to componentsof reading, and the connections with other factors that could explain variations inreading achievement. To accomplish this task the following specific objectives will
be developed:
1. To classify the languages present in PIRLS, in terms of their ethnological
relations (linguistic families).
2. To gather information about the orthography of each language participant in
PIRLS.
3. To use this information to classify languages in accord with their ortho-
graphic resemblance.
4. To transform these classifications into measurable variables.
5. To determine the connection of the two resultant variables with reading
achievement in PIRLS.
6. To describe other significant factors that explain differences in reading
achievement.
7. To verify if all these factors (linguistic, home and school) differ in their ex-
plicative power, while taking into account diverse dimensions of reading.
8. To create a statistical model, using the previous findings, able to explain
variations in reading achievement in PIRLS.
3.4.4 Methodological procedure
The steps to be followed to accomplish the purpose of this research are implicit
in the hypothesis and in the research objectives; they can be also found in the
index of the part II of this work. Each time that a new procedure is introduced all
100
tel-0
0563
710,
ver
sion
1 -
7 Fe
b 20
11
Chapter 3. PIRLS Assessment and Reading Research
necessary details will be presented, aiming to be as clear as it is possible to avoid
shadowy areas in this research. Now, in order to introduce the work done with
PIRLS database, a general presentation of these steps will be done. Not all details
will be mentioned, as this will be developed in the next chapters, but, at least all of
them will be named, and most importantly, all of them will be justified. Thus, the
aim of the coming paragraphs is to explain why decisions were taken in relation
to the data treatment and the statistical procedures.
3.4.4.a Properties of PIRLS database
As was mentioned before (3.3.2), the fact of taking PIRLS data as source has
several advantages from the methodological point of view. The most important
advantage is the resemblance of 2001 and 2006 data sets. Almost all descrip-
tive variables are repeated in both studies, demographic characteristic of the stu-
dents like age, sex and language, answers in the tests, scores, characteristics of
the schools, and all the necessary links to connect the different collections of data:
the questionnaires and the results of the assessment. Thus, it is totally possible
to identify one specific student and the score that he/she obtained on the test, to
know which kind of questions he/she is best at, the conditions of his/her life at
home, if he/she is younger or older than his/her classmates, to know how many
years his/her teacher has being teaching reading, the kind of activities that they
do in class, to know if these activities are repeated in other classes at the school,
and to know if the school is rural or urban, if it is in and advantaged area or in a
poor suburb, it there is violence among the students or if their do a lot of group
activities. These, among many other characteristics can be observed in both data
sets. This similarity has allowed us to reproduce the same procedures from one
year to another with minor modifications and great comparability potential.
Therefore, to proceed to study a specific question, the amount of books at home,
for example, the variable at the student questionnaire is searched, where the an-
swer given by each student is present. Then, it is possible to manipulate the vari-
able to obtain a score in relation to each possible answer, and to know the score
of each student that has 100 books at home, and the score of each student that
has only 10 books at home. A third parameter can be included in order to know
the score of only the girls, or only the students of a certain country or that speak
a certain languages. Finally it is possibly to combine those parameters to obtain,
101
tel-0
0563
710,
ver
sion
1 -
7 Fe
b 20
11
3.4. How to compare reading acquisition among languages?
for example, the average score of French girls that have 25 books or less at home.
A variable, which will be particularly important to this research, is the one called
ITLANG, present in both databases. It indicates the language in which the test has
been answered by the student. There can be several languages in one country.
From ITLANG, the linguistic factors will be developed into variables following our
theoretical frameworks. Another important set of variables, also present in all
datasets, indicate what language the student speaks at home, the amount of time
that each student uses the school languages, and other linguistic particularities.
These variables will be fundamental in the creation of language variables and
will allow us to explore the incidence of having different languages at home and
school.
A final property of the databases is that the information of all the data sets can be
combined to obtain variables representing different levels: all the answers from the
tests and the questionnaires can be used as attributes of the student (one student =
one datum for each variable) or they can be aggregated forming a new data type,
creating a score or an average of the answers at the teacher, school or country
level. However, more than a simple calculation of an average, the important thing
is that PIRLS has a number of operation procedures to assure the quality and
comparability of the information. Since the starting point to create the database
is a representative sample of schools and students in each educational system (see
Martin et al., 2007, chapter 9).
In relation to this property of PIRLS data sets, of being combinable, a key com-
ponent is the sampling weight defined as “the product of the three intermediate
weights: the first stage (school) weight, the second stage (classroom) weight, and
the third stage (student) weight. The overall student sampling weight was the
product of these three weights including non-participation adjustments.” (Martin
et al., 2007, p. 113). In other words, taking into account the population target, the
selected and non selected (due to adjustments or to special conditions that leave
them out of the sample) schools, classrooms, and students, a value was linked
to each observation in the data that represents its possibilities of being selected.
Later, these weights will be taken into account when performing analyses in the
form of weight variables (TOTWGT for a total or TCHWGT for teachers).
PIRLS offers to researchers a set of programs and macros prepared for statistical
systems such as, SAS and SPSS, that allow the calculation of percentages, means,
102
tel-0
0563
710,
ver
sion
1 -
7 Fe
b 20
11
Chapter 3. PIRLS Assessment and Reading Research
regression coefficients, and their standard errors. Taking into account the weights
and the PIRLS methodology to obtain the survey results, jackknife repeated repli-
cation (JRR) is used (see Foy & Kennedy, 2008, chapter 5). Using these programs
and macros to obtain results, the comparability of the data and the representa-
tional properties of the sample were preserved. It must mentioned that the soft-
ware that used here to develop analysis was SAS2, for which a series of macros
to improve the collection of information from the data sets was developed (see
appendix C).
3.4.4.b Descriptive research
Now, is important to mention the type of variables that were derived from the
data sets using the procedures described in the later paragraphs. In accord with
the research objectives, it was necessary to be able to develop interactions among
the studied factors: languages, home and school, and the PIRLS’s test results.
Consequently the first task was to create variables that represented those factors
from the data available.
In relation to the language factors, two approaches have been presented in chap-
ter 2, and to study them two variables will be created. The first one, combines the
information presented in section 2.1.2.g and the languages present in each PIRLS
assessment. Since all language presented in the test have a known linguistic family
that can represent its historical and cultural relations, it is simple to develop a new
variable FAMILY representing the family to which each language belongs. A more
difficult task will be the creation of a variable indicating the orthographic depth of
each language present in the study. For that reason the use of this variable will be
more restrained as will be detailed in section 4.3.
In relation to the home and school factors, the mentioned SAS programs will be
used to obtain scores, taking advantage of the fact that it is possible to obtain
specific scores for each type of text and each order of comprehension process.
This will allow several comparisons, for example in comparing the scores, it will
be possible to observe if students that have 100 or more books at home are better
literary or informative readers, or if they can read both kind of texts equally. Using
this procedure, as shown in table 3.4, it will be possible to identify significant
factors that are related to specific aspects of the reading process from the PIRLS
2SAS Institute (2002), Statistical analysis system.
103
tel-0
0563
710,
ver
sion
1 -
7 Fe
b 20
11
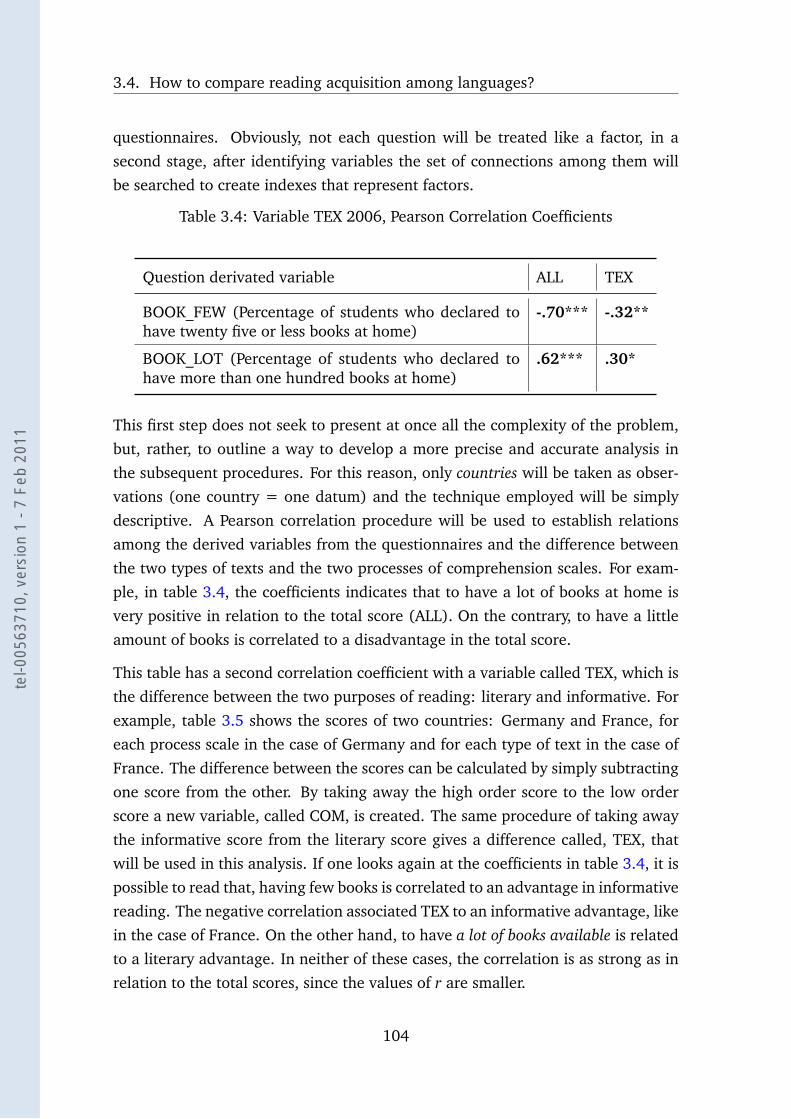
3.4. How to compare reading acquisition among languages?
questionnaires. Obviously, not each question will be treated like a factor, in a
second stage, after identifying variables the set of connections among them will
be searched to create indexes that represent factors.
Table 3.4: Variable TEX 2006, Pearson Correlation Coefficients
Question derivated variable ALL TEX
BOOK_FEW (Percentage of students who declared tohave twenty five or less books at home)
-.70*** -.32**
BOOK_LOT (Percentage of students who declared tohave more than one hundred books at home)
.62*** .30*
This first step does not seek to present at once all the complexity of the problem,
but, rather, to outline a way to develop a more precise and accurate analysis in
the subsequent procedures. For this reason, only countries will be taken as obser-
vations (one country = one datum) and the technique employed will be simply
descriptive. A Pearson correlation procedure will be used to establish relations
among the derived variables from the questionnaires and the difference between
the two types of texts and the two processes of comprehension scales. For exam-
ple, in table 3.4, the coefficients indicates that to have a lot of books at home is
very positive in relation to the total score (ALL). On the contrary, to have a little
amount of books is correlated to a disadvantage in the total score.
This table has a second correlation coefficient with a variable called TEX, which is
the difference between the two purposes of reading: literary and informative. For
example, table 3.5 shows the scores of two countries: Germany and France, for
each process scale in the case of Germany and for each type of text in the case of
France. The difference between the scores can be calculated by simply subtracting
one score from the other. By taking away the high order score to the low order
score a new variable, called COM, is created. The same procedure of taking away
the informative score from the literary score gives a difference called, TEX, that
will be used in this analysis. If one looks again at the coefficients in table 3.4, it is
possible to read that, having few books is correlated to an advantage in informative
reading. The negative correlation associated TEX to an informative advantage, like
in the case of France. On the other hand, to have a lot of books available is related
to a literary advantage. In neither of these cases, the correlation is as strong as in
relation to the total scores, since the values of r are smaller.
104
tel-0
0563
710,
ver
sion
1 -
7 Fe
b 20
11
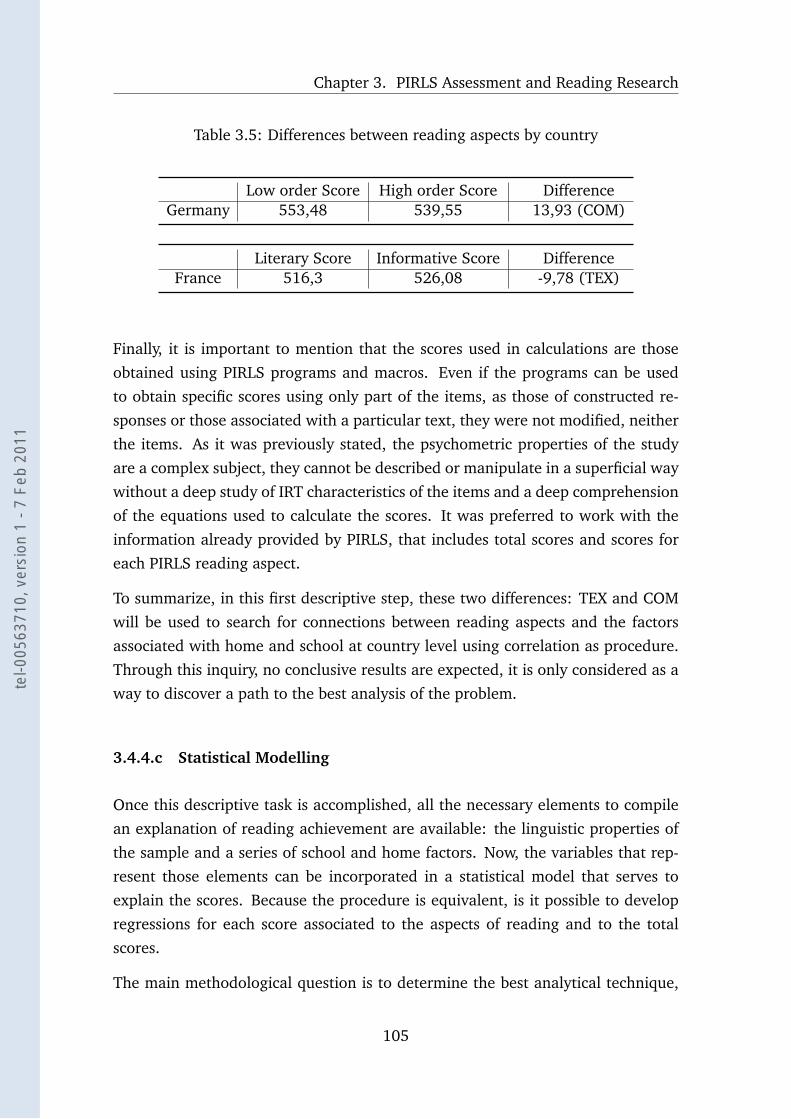
Chapter 3. PIRLS Assessment and Reading Research
Table 3.5: Differences between reading aspects by country
Low order Score High order Score DifferenceGermany 553,48 539,55 13,93 (COM)
Literary Score Informative Score DifferenceFrance 516,3 526,08 -9,78 (TEX)
Finally, it is important to mention that the scores used in calculations are those
obtained using PIRLS programs and macros. Even if the programs can be used
to obtain specific scores using only part of the items, as those of constructed re-
sponses or those associated with a particular text, they were not modified, neither
the items. As it was previously stated, the psychometric properties of the study
are a complex subject, they cannot be described or manipulate in a superficial way
without a deep study of IRT characteristics of the items and a deep comprehension
of the equations used to calculate the scores. It was preferred to work with the
information already provided by PIRLS, that includes total scores and scores for
each PIRLS reading aspect.
To summarize, in this first descriptive step, these two differences: TEX and COM
will be used to search for connections between reading aspects and the factors
associated with home and school at country level using correlation as procedure.
Through this inquiry, no conclusive results are expected, it is only considered as a
way to discover a path to the best analysis of the problem.
3.4.4.c Statistical Modelling
Once this descriptive task is accomplished, all the necessary elements to compile
an explanation of reading achievement are available: the linguistic properties of
the sample and a series of school and home factors. Now, the variables that rep-
resent those elements can be incorporated in a statistical model that serves to
explain the scores. Because the procedure is equivalent, is it possible to develop
regressions for each score associated to the aspects of reading and to the total
scores.
The main methodological question is to determine the best analytical technique,
105
tel-0
0563
710,
ver
sion
1 -
7 Fe
b 20
11
3.4. How to compare reading acquisition among languages?
taking into account that the objects explained are, basically, educational systems.
The principal property of these types of organizations is to count several nested
levels. In PIRLS, students, classrooms, teachers, schools, school locations, coun-
tries, or even geographic regions can be considered as different floors of a struc-
ture. The regression technique taking into account this organization is the hier-archical or multilevel model (Rumberger & Palardy, 2004; Bressoux, 2008). The
principle is that if several schools of a region or a country are studied, it will be
not the same to consider all students as equals, as to consider that their answers
can be influenced by their classroom, teacher or school. As Rumberger & Palardy
(2004) said:
Student learning is influenced by experiences and activities of individ-
ual students, such as the amount and nature of the homework that they
do. But student learning is also influenced by the amount and nature
of the instruction that they receive within their teachers’ classrooms,
as well as by the qualities of the schools they attend, such as school
climate and the nature of the courses that are provided. (p. 237)
A multilevel statistical model considers each level as nested in the upper level.
The model allow to calculate, for example, if a factor determined outcomes in
a different way from one school to another, or if the estimated performance of
an individual is determined by the school in which he / she is enrolled or the
classroom or the teachers. In these models the factors can vary in their explicative
power at more than one level.
In the case of this research, the interest of implementing such a model in the analy-
sis is, in first place, an answer to the need of support to improve the interpretation
of the results, by taking into account the hierarchical structure of PIRLS database.
The large variety of educational systems that has participated in this survey makes
it mandatory that at least some of the levels of educational organization are in-
corporated in the modelling. Secondly, because through this regression technique,
parameters representing the influence of the factors will be estimated, it is essen-
tial to the goal of this research that these values and significance are as exact as
possible. At least part of the factors that will be incorporated in the models have
not been tested before, that is, the linguistic factors, they must be clearly contextu-
alized to be able to develop interpretations of their role as determinants of reading
achievement.
106
tel-0
0563
710,
ver
sion
1 -
7 Fe
b 20
11
Chapter 3. PIRLS Assessment and Reading Research
Finally, it must be mention that another goal of the model integrated in this anal-
ysis is to be able to compare the results from the 2001 and 2006 surveys. To be
able to compare, the multilevel models will only include countries and languages
that participated in both assessments. The consequence of this is an important
reduction of data, but, the number of observations at students’ level is still very
important. Moreover, this is the only condition that assures the comparability.
107
tel-0
0563
710,
ver
sion
1 -
7 Fe
b 20
11
Part II
Development of experiments
108
tel-0
0563
710,
ver
sion
1 -
7 Fe
b 20
11
Chapter 4
Criteria to establish linguisticcategories
The goal of this chapter is to clarify some particularities of PIRLS sample of lan-
guages and to describe the process of creating both linguistic variables. One re-
ferred to cultural and historical links among languages, and the other referred to
their phonological and orthographic structure.
Particular attention will be paid to the description of the relation between phonol-
ogy and orthography in the countries that are present in both versions of PIRLS
assessment, and that consequently, will be part of the comparative sample. In
other words, not all languages present in PIRLS assessments will be described
from this point of view, but rather, only those that will be in the main analysis. As
it will be explained later, the creation of an orthographical variable implies a new
perspective of the linguistic problematic on PIRLS assessment.
Accomplishing this task, some interesting linguistic situations, exceptions, and
special cases will be referenced. Particularly, from the perspective of the devel-
oping of new comparative studies of languages. Then, the historical–cultural ap-
proach to language will be the base for the constitution of linguistic family as
criteria to classify languages. The variable will be illustrated in both assessments
separately and in the comparative sample. Finally, this chapter will close with the
question of orthographical deepness and the orthographical properties of PIRLS
languages.
109
tel-0
0563
710,
ver
sion
1 -
7 Fe
b 20
11
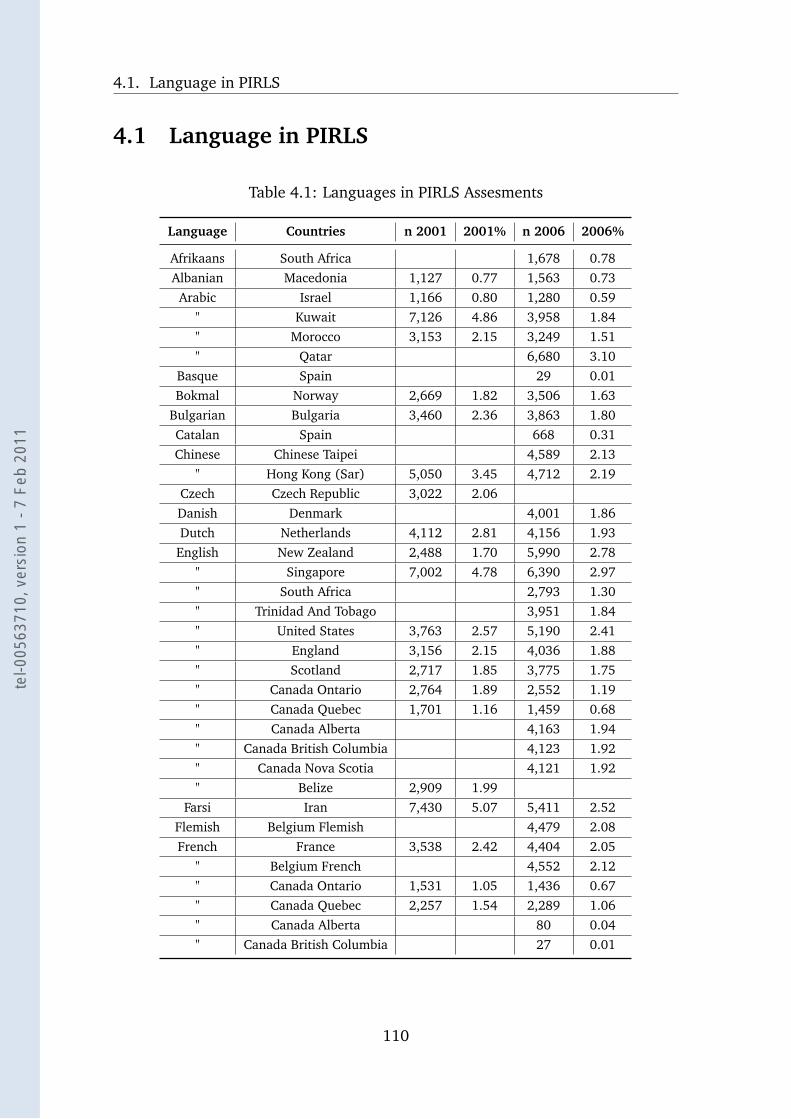
4.1. Language in PIRLS
4.1 Language in PIRLS
Table 4.1: Languages in PIRLS Assesments
Language Countries n 2001 2001% n 2006 2006%
Afrikaans South Africa 1,678 0.78Albanian Macedonia 1,127 0.77 1,563 0.73Arabic Israel 1,166 0.80 1,280 0.59
" Kuwait 7,126 4.86 3,958 1.84" Morocco 3,153 2.15 3,249 1.51" Qatar 6,680 3.10
Basque Spain 29 0.01Bokmal Norway 2,669 1.82 3,506 1.63
Bulgarian Bulgaria 3,460 2.36 3,863 1.80Catalan Spain 668 0.31Chinese Chinese Taipei 4,589 2.13
" Hong Kong (Sar) 5,050 3.45 4,712 2.19Czech Czech Republic 3,022 2.06Danish Denmark 4,001 1.86Dutch Netherlands 4,112 2.81 4,156 1.93
English New Zealand 2,488 1.70 5,990 2.78" Singapore 7,002 4.78 6,390 2.97" South Africa 2,793 1.30" Trinidad And Tobago 3,951 1.84" United States 3,763 2.57 5,190 2.41" England 3,156 2.15 4,036 1.88" Scotland 2,717 1.85 3,775 1.75" Canada Ontario 2,764 1.89 2,552 1.19" Canada Quebec 1,701 1.16 1,459 0.68" Canada Alberta 4,163 1.94" Canada British Columbia 4,123 1.92" Canada Nova Scotia 4,121 1.92" Belize 2,909 1.99
Farsi Iran 7,430 5.07 5,411 2.52Flemish Belgium Flemish 4,479 2.08French France 3,538 2.42 4,404 2.05
" Belgium French 4,552 2.12" Canada Ontario 1,531 1.05 1,436 0.67" Canada Quebec 2,257 1.54 2,289 1.06" Canada Alberta 80 0.04" Canada British Columbia 27 0.01
110
tel-0
0563
710,
ver
sion
1 -
7 Fe
b 20
11
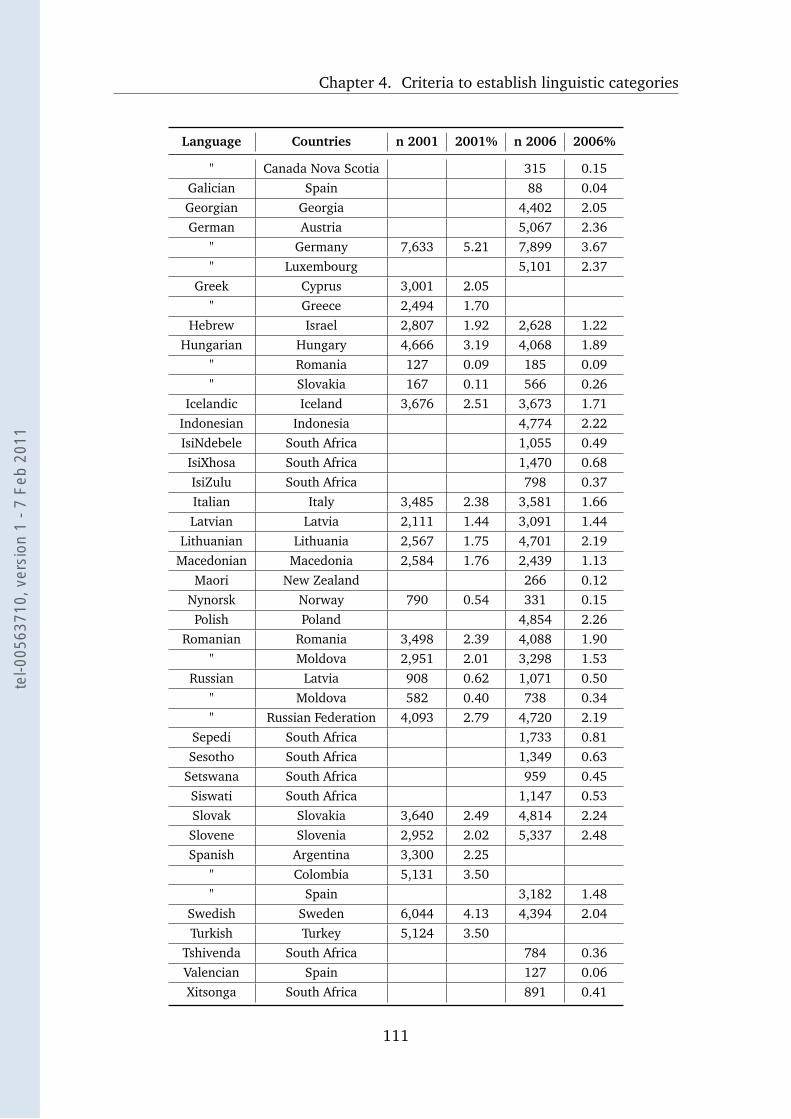
Chapter 4. Criteria to establish linguistic categories
Language Countries n 2001 2001% n 2006 2006%
" Canada Nova Scotia 315 0.15Galician Spain 88 0.04Georgian Georgia 4,402 2.05German Austria 5,067 2.36
" Germany 7,633 5.21 7,899 3.67" Luxembourg 5,101 2.37
Greek Cyprus 3,001 2.05" Greece 2,494 1.70
Hebrew Israel 2,807 1.92 2,628 1.22Hungarian Hungary 4,666 3.19 4,068 1.89
" Romania 127 0.09 185 0.09" Slovakia 167 0.11 566 0.26
Icelandic Iceland 3,676 2.51 3,673 1.71Indonesian Indonesia 4,774 2.22IsiNdebele South Africa 1,055 0.49IsiXhosa South Africa 1,470 0.68IsiZulu South Africa 798 0.37Italian Italy 3,485 2.38 3,581 1.66Latvian Latvia 2,111 1.44 3,091 1.44
Lithuanian Lithuania 2,567 1.75 4,701 2.19Macedonian Macedonia 2,584 1.76 2,439 1.13
Maori New Zealand 266 0.12Nynorsk Norway 790 0.54 331 0.15Polish Poland 4,854 2.26
Romanian Romania 3,498 2.39 4,088 1.90" Moldova 2,951 2.01 3,298 1.53
Russian Latvia 908 0.62 1,071 0.50" Moldova 582 0.40 738 0.34" Russian Federation 4,093 2.79 4,720 2.19
Sepedi South Africa 1,733 0.81Sesotho South Africa 1,349 0.63
Setswana South Africa 959 0.45Siswati South Africa 1,147 0.53Slovak Slovakia 3,640 2.49 4,814 2.24Slovene Slovenia 2,952 2.02 5,337 2.48Spanish Argentina 3,300 2.25
" Colombia 5,131 3.50" Spain 3,182 1.48
Swedish Sweden 6,044 4.13 4,394 2.04Turkish Turkey 5,124 3.50
Tshivenda South Africa 784 0.36Valencian Spain 127 0.06Xitsonga South Africa 891 0.41
111
tel-0
0563
710,
ver
sion
1 -
7 Fe
b 20
11
4.1. Language in PIRLS
Table 4.1 clarifies the languages present in the sample in which the test was trans-
lated and the countries were these languages are spoken. As can be observe, as
there are languages present in several countries, there are also countries with more
than one language. When there was more than one language in the educational
system of a country, multiples translation were done (see 3.3.2).
Directly related to the previous subject is the increase of languages from 2001 to
2006. There is a more complex distribution of languages in the sample because
there are more countries and more languages (28 languages before, 46 languages
in the new test). The two principal contributors for this change are South Africa,
having eleven different official languages, and Spain, having five. A brief interlude
to explain in detail the characteristics of these two countries will be made at the
end of this section.
The amount of countries where English is the language of the test is remarkable,
even if only six of these countries have participated in both versions of the as-
sessment. However, this number is increased by taking into account Canadian
provinces as independent countries; this is a special case that will be discussed in
the coming paragraphs.
French is the next language in terms of its presence in different countries, how-
ever, in Canada, excluding Ontario and Quebec, the proportion of French speakers
is low. In this research, Ontario is the most important province, along with Quebec,
as both are present in the two versions of the assessment, as is France. This will be
an interesting point for this analysis, because French has remarkable characteris-
tics in regards to linguistic families (as a romance language) and also concerning
its phonetic, as a language of intermediate deepness (see 4.3.1.h).
In an opposite situation, there are languages with a very limited percentage of
participation, that were part of only one version of PIRLS and with few speakers.
Among these languages are Basque, Galician, Valencian, Maori, and some South
African languages. In all cases, these languages are minority or regional in coun-
tries where another language occupies the role of national language (Spanish,
English, and Afrikaans).
From these characteristics it is already evident that it will not be possible to in-
clude, in this analysis, all the languages present in the assessments. For this rea-
son, it is necessary to describe various special cases and to explain the decisions
that will be made on including, excluding, or how to include some languages and
112
tel-0
0563
710,
ver
sion
1 -
7 Fe
b 20
11
Chapter 4. Criteria to establish linguistic categories
countries with special conditions.
Over the next few paragraphs, these changes will be described. It is necessary to
underline that here, only the characteristics that can affect the constitution of the
sample will be considered, specifically in linguistic terms. In other words, not all
the changes in the sample will be pointed out, but only those directly related to
this research and that can influence the applicability of the analytical procedures.
4.1.1 Especial linguistic cases
4.1.1.a English
Apart from the main Anglophone countries, there are two others that will not be
considered in equal conditions with the rest. Belize will not be considered as part
of the English family, nor Singapore because of their special linguistic conditions.
In Belize, although English is the official language, there are at least four other
languages currently spoken in the country (Kriol, Spanish, Garifuna, Maya, Plaut-
dietsch) English is often a second language. Moreover, the PIRLS 2001 report
indicates that only 28% of the examinees claimed to speak English every day (see
Mullis et al., 2003, p. 101), far from the 88% of English students or the 85% in
the United States. Similarly, in Singapore Singlish (Standard Singapore English) is
the official language, but the population is particularly varied in their origins and
there are three other official languages: Malay, Chinese (Mandarin), and Tamil.
the PIRLS 2001 report indicates that 43% of the examinees said they spoke English
daily, while a 50% spoke it only sometimes.
4.1.1.b Qatar, Kuwait, Morocco and South Africa
A common problem in this kind of research, is that some countries have missing
data or abnormal results in relation to the rest of the sample. Countries with such
problems can cause a bias in the interpretation of data due to aberrant values.
With this in mind, the most extreme cases can be found in countries having devi-
ations too high in comparison to the average of the mean scores, and also having
an unusual score distribution. Such was the case of the four last countries in
the PIRLS 2006 achievement ranking: Qatar, Kuwait, Morocco, and South Africa
(whose characteristic will be detailed later).
113
tel-0
0563
710,
ver
sion
1 -
7 Fe
b 20
11
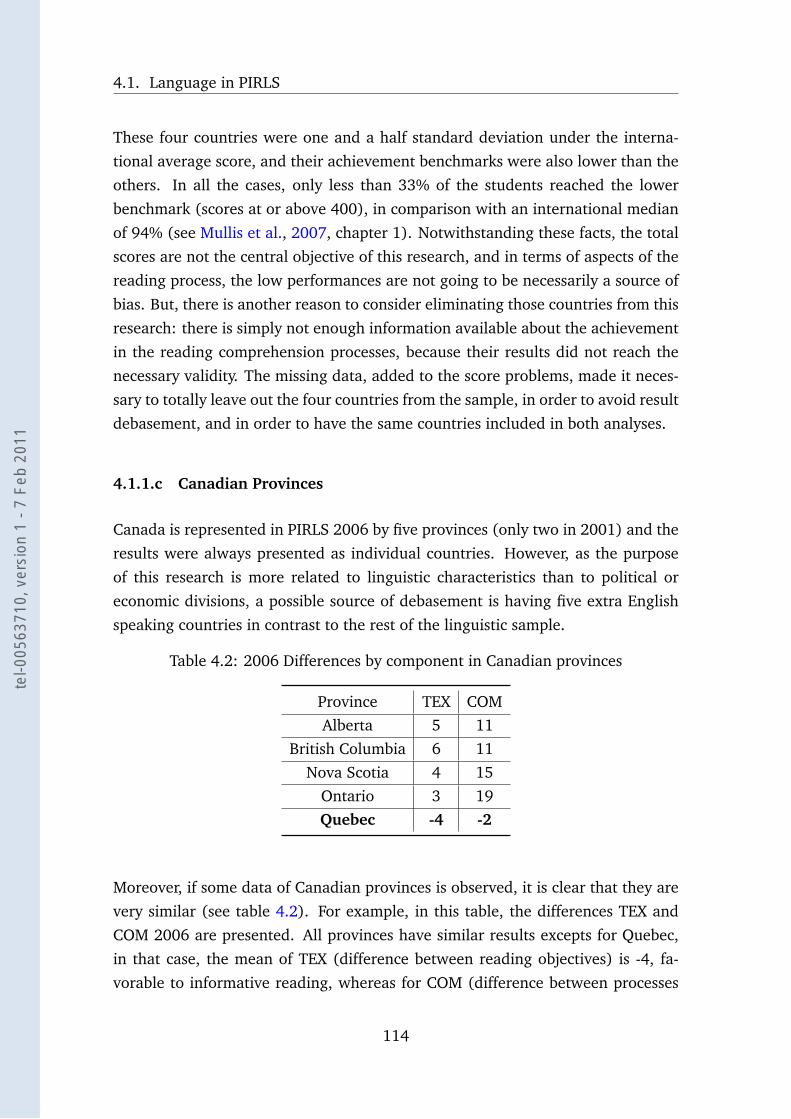
4.1. Language in PIRLS
These four countries were one and a half standard deviation under the interna-
tional average score, and their achievement benchmarks were also lower than the
others. In all the cases, only less than 33% of the students reached the lower
benchmark (scores at or above 400), in comparison with an international median
of 94% (see Mullis et al., 2007, chapter 1). Notwithstanding these facts, the total
scores are not the central objective of this research, and in terms of aspects of the
reading process, the low performances are not going to be necessarily a source of
bias. But, there is another reason to consider eliminating those countries from this
research: there is simply not enough information available about the achievement
in the reading comprehension processes, because their results did not reach the
necessary validity. The missing data, added to the score problems, made it neces-
sary to totally leave out the four countries from the sample, in order to avoid result
debasement, and in order to have the same countries included in both analyses.
4.1.1.c Canadian Provinces
Canada is represented in PIRLS 2006 by five provinces (only two in 2001) and the
results were always presented as individual countries. However, as the purpose
of this research is more related to linguistic characteristics than to political or
economic divisions, a possible source of debasement is having five extra English
speaking countries in contrast to the rest of the linguistic sample.
Table 4.2: 2006 Differences by component in Canadian provinces
Province TEX COMAlberta 5 11
British Columbia 6 11Nova Scotia 4 15
Ontario 3 19Quebec -4 -2
Moreover, if some data of Canadian provinces is observed, it is clear that they are
very similar (see table 4.2). For example, in this table, the differences TEX and
COM 2006 are presented. All provinces have similar results excepts for Quebec,
in that case, the mean of TEX (difference between reading objectives) is -4, fa-
vorable to informative reading, whereas for COM (difference between processes
114
tel-0
0563
710,
ver
sion
1 -
7 Fe
b 20
11
Chapter 4. Criteria to establish linguistic categories
of comprehension) the mean is -2, far away from the average of 14 of the other
provinces. Hence, the Canadian region of Quebec has very dissimilar results from
the rest of the country, not only in the total score, (533, against an average of 554)
but also in the components of reading process.
Following these facts, in order to include the Canadian provinces in the sample,
only a linguistic division was established: only Ontario and Quebec, the two Cana-
dian regions that are present in both assessments will be included. These English
and French provinces will be considered as two bilingual and independent coun-
tries.
4.1.2 Multilingualism cases
The cases of multilingualism are South Africa and Spain, which have only partic-
ipated in 2006 assessment. The term multilingualism makes reference to those
countries with more than two official languages. There are many cases like these
in the sample, but only these two have made several translations of the test, giv-
ing students the possibility of answering in their closest language. Due to this
particular condition, and the interest of this research in languages, it is important
to offer some lines to describe those multilingual cultures before continuing with
this analysis, even if it is already clear that South Africa will not be part of this
analysis, and that the modeling will include only those languages that take part in
both versions of the survey.
4.1.2.a South Africa
The language in the case of South Africa is a very complex scenario since there
are eleven official languages: Zulu, Xhosa, Afrikaans, Northern Sotho, Tswana,
English, Sotho, Tsonga, Swati, Venda, Ndebele. The government of the country
is engaged in the promotion and development of all these languages, particularly
of the indigenous languages, that have been historically diminishing. PIRLS 2006
offers to the students translations of the test in all these languages. There are sev-
eral cultural and linguistic differences between them, but at least five big families
can be identified:
• Afrikaans, which as was described in section 2.1.2.d, is an Indo–European
115
tel-0
0563
710,
ver
sion
1 -
7 Fe
b 20
11
4.1. Language in PIRLS
language from the Germanic–Low Franconian branch and a direct deriva-
tion from Dutch; it is recognized as a language in itself and not only a Dutch
dialect since s. XIX. Afrikaans is spoken by 13.3% of the South African pop-
ulation as a mother tongue (Statistics South Africa, 2001). It is the pri-
mary language used by the Afrikaners (mostly the white population) and the
Coloureds (mixed race, but not enough to be considered as black).
• English, (Indo–European, Germanic–West branch) even if it is only the sixth–
most common language in the country, and the mother tongue of only 8.2%
of the population, it is the dominant language for commerce, administration,
and the medias.
• The languages derived from the Sotho-Tswana branch of Narrow Bantu (com-
mon ancestor of all the indigenous language of South Africa), they are:
Sotho, Northern Sotho and Tswana. Altogether, they are the home language
of 25.5% of the population, principally in the northern third of the country.
• The languages derived from the Nguni branch: Zulu, Xhosa, Swati and Nde-
bele, they are predominant in the south-eastern third of the country. Zulu
is the first language of the country spoken by 23.8% of the inhabitants. To-
gether with the other three Nguni derived, they represent 45.7% of lan-
guages spoken at South African’s homes.
• Finally, There are two other derived languages of Bantu, but not related
to the previous branches: the Venda and Tsonga, which are spoken as first
language by 6.7% of the population.
In spite of the fact that it is already known that South Africa will not be considered
in this sample, it was necessary to describe its linguistic complexity and to remark
on the fact that this country is by it–self a source of study in regards to the relation
between language and reading learning. It is very probable that at the current
point of development of the South African nation, there are other factors that
influence reading acquisition more than this one, but this linguistic diversity is
certainly a key aspect of their educational system. Moreover, it makes this a unique
source for the study of the relation between languages and education.
116
tel-0
0563
710,
ver
sion
1 -
7 Fe
b 20
11
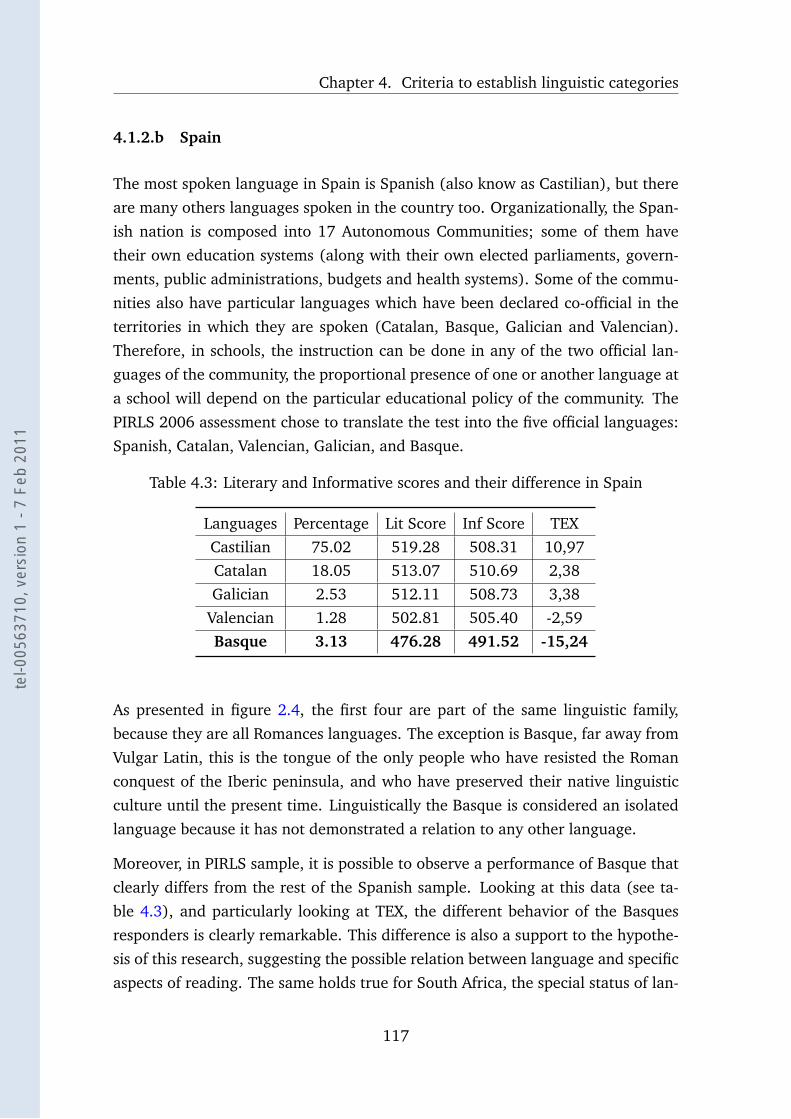
Chapter 4. Criteria to establish linguistic categories
4.1.2.b Spain
The most spoken language in Spain is Spanish (also know as Castilian), but there
are many others languages spoken in the country too. Organizationally, the Span-
ish nation is composed into 17 Autonomous Communities; some of them have
their own education systems (along with their own elected parliaments, govern-
ments, public administrations, budgets and health systems). Some of the commu-
nities also have particular languages which have been declared co-official in the
territories in which they are spoken (Catalan, Basque, Galician and Valencian).
Therefore, in schools, the instruction can be done in any of the two official lan-
guages of the community, the proportional presence of one or another language at
a school will depend on the particular educational policy of the community. The
PIRLS 2006 assessment chose to translate the test into the five official languages:
Spanish, Catalan, Valencian, Galician, and Basque.
Table 4.3: Literary and Informative scores and their difference in Spain
Languages Percentage Lit Score Inf Score TEXCastilian 75.02 519.28 508.31 10,97Catalan 18.05 513.07 510.69 2,38Galician 2.53 512.11 508.73 3,38
Valencian 1.28 502.81 505.40 -2,59Basque 3.13 476.28 491.52 -15,24
As presented in figure 2.4, the first four are part of the same linguistic family,
because they are all Romances languages. The exception is Basque, far away from
Vulgar Latin, this is the tongue of the only people who have resisted the Roman
conquest of the Iberic peninsula, and who have preserved their native linguistic
culture until the present time. Linguistically the Basque is considered an isolated
language because it has not demonstrated a relation to any other language.
Moreover, in PIRLS sample, it is possible to observe a performance of Basque that
clearly differs from the rest of the Spanish sample. Looking at this data (see ta-
ble 4.3), and particularly looking at TEX, the different behavior of the Basques
responders is clearly remarkable. This difference is also a support to the hypothe-
sis of this research, suggesting the possible relation between language and specific
aspects of reading. The same holds true for South Africa, the special status of lan-
117
tel-0
0563
710,
ver
sion
1 -
7 Fe
b 20
11
4.1. Language in PIRLS
guages in Spain needs to be the object of a deeper analysis by itself, particularly
with more representative samples of the languages that make up the educational
system (there are only 29 Basques in the sample).
To summarize, from all the countries and languages wit special cases, the only that
will be present in the analysis are Ontario and Quebec. English will be obviously
present but without Belize and Singapore. The mentioned African countries will
not be considered. Finally, Spain will only be considered as part of the Latin family
during the preliminary analysis of 2001 sample.
118
tel-0
0563
710,
ver
sion
1 -
7 Fe
b 20
11

Chapter 4. Criteria to establish linguistic categories
4.2 Linguistic Family as factor
Since the family of each language present in the test is known, a variable indicating
the families is easy to create using the information that was exposed in section
2.1.2.g. This versatility will allow for the inclusion of this variable, not only in the
models, but also in the preliminary descriptive tasks. To create these variables,
two stages of selection were done, a first step for the inclusion of this variable in
the descriptive analysis, and a second step to include it in the models.
4.2.1 Descriptive variable
Table 4.4: Linguistic Families in 2001 sample
Others Latin Slavic Germanic Anglo
belize Argentina Bulgaria Germany New ZealandCyprus Colombia Czech Rep. Iceland United StatesGreece France Russian Fed. Netherlands EnglandHong Kong Italy Slovakia Norway ScotlandHungary Romania Slovenia Sweden OntarioIran Moldova MacedoniaIsrael QuebecKuwaitLatviaLithuaniaMoroccoSingaporeTurkey
For the first selection, all the countries were distributed into linguistic families
to create a country–level variable. It is important to notice that, at this point,
the countries are to be the observations and not the languages, even if in most
of the cases one country has only one language, there are also several cases of
bilingualism or even more than 3 or 4 languages in the same country. The criteria
have been to use the preeminent family in the country. If table 4.1 is compared
with tables 4.4 and 4.5, it can be see that bilingual countries such as Moldavia,
119
tel-0
0563
710,
ver
sion
1 -
7 Fe
b 20
11
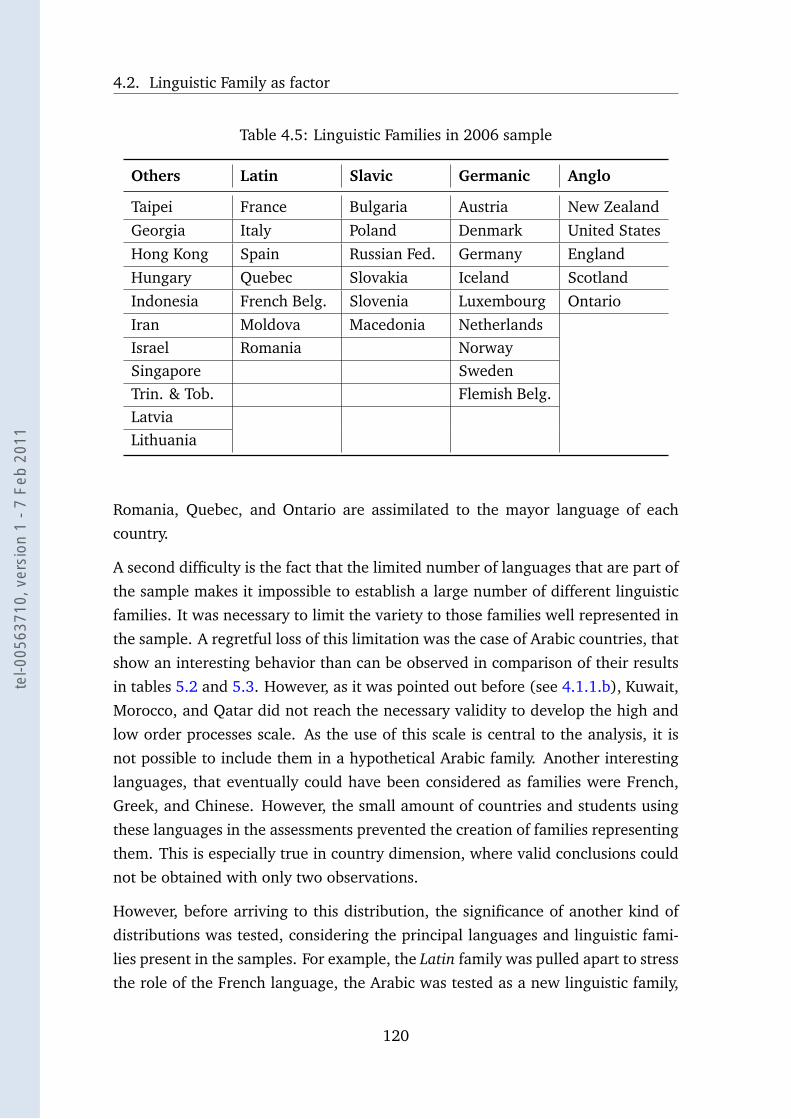
4.2. Linguistic Family as factor
Table 4.5: Linguistic Families in 2006 sample
Others Latin Slavic Germanic Anglo
Taipei France Bulgaria Austria New ZealandGeorgia Italy Poland Denmark United StatesHong Kong Spain Russian Fed. Germany EnglandHungary Quebec Slovakia Iceland ScotlandIndonesia French Belg. Slovenia Luxembourg OntarioIran Moldova Macedonia NetherlandsIsrael Romania NorwaySingapore SwedenTrin. & Tob. Flemish Belg.LatviaLithuania
Romania, Quebec, and Ontario are assimilated to the mayor language of each
country.
A second difficulty is the fact that the limited number of languages that are part of
the sample makes it impossible to establish a large number of different linguistic
families. It was necessary to limit the variety to those families well represented in
the sample. A regretful loss of this limitation was the case of Arabic countries, that
show an interesting behavior than can be observed in comparison of their results
in tables 5.2 and 5.3. However, as it was pointed out before (see 4.1.1.b), Kuwait,
Morocco, and Qatar did not reach the necessary validity to develop the high and
low order processes scale. As the use of this scale is central to the analysis, it is
not possible to include them in a hypothetical Arabic family. Another interesting
languages, that eventually could have been considered as families were French,
Greek, and Chinese. However, the small amount of countries and students using
these languages in the assessments prevented the creation of families representing
them. This is especially true in country dimension, where valid conclusions could
not be obtained with only two observations.
However, before arriving to this distribution, the significance of another kind of
distributions was tested, considering the principal languages and linguistic fami-
lies present in the samples. For example, the Latin family was pulled apart to stress
the role of the French language, the Arabic was tested as a new linguistic family,
120
tel-0
0563
710,
ver
sion
1 -
7 Fe
b 20
11
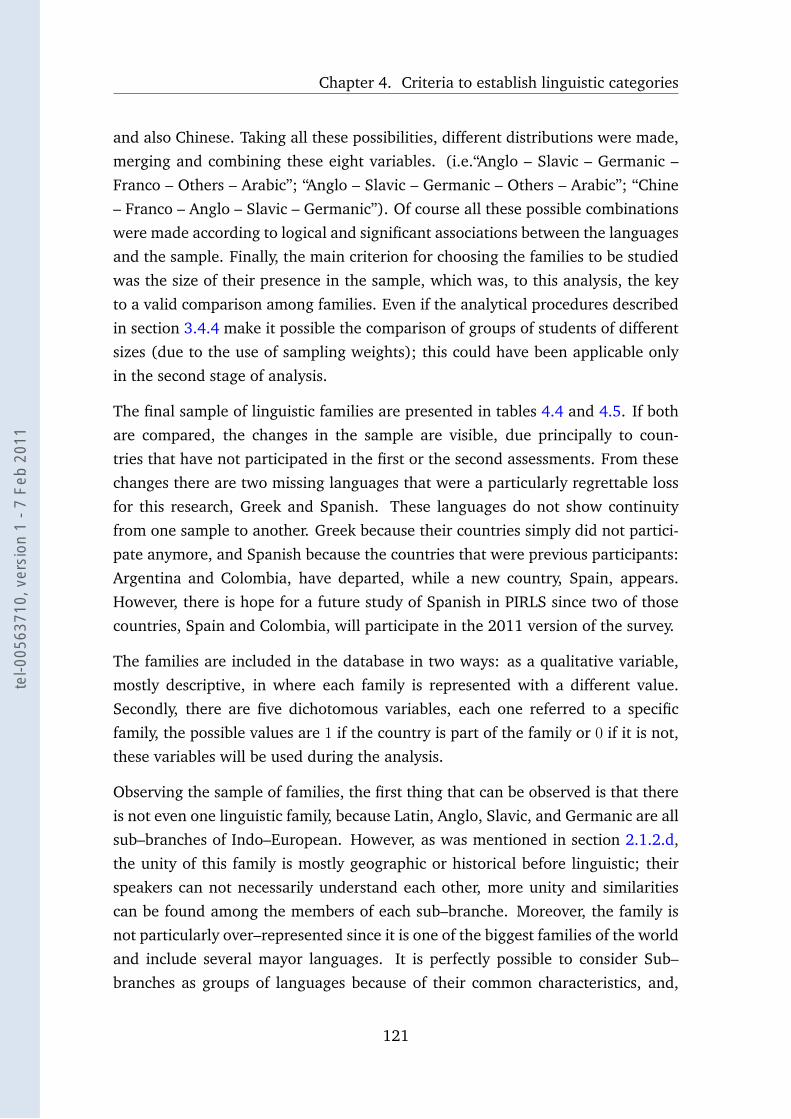
Chapter 4. Criteria to establish linguistic categories
and also Chinese. Taking all these possibilities, different distributions were made,
merging and combining these eight variables. (i.e.“Anglo – Slavic – Germanic –
Franco – Others – Arabic”; “Anglo – Slavic – Germanic – Others – Arabic”; “Chine
– Franco – Anglo – Slavic – Germanic”). Of course all these possible combinations
were made according to logical and significant associations between the languages
and the sample. Finally, the main criterion for choosing the families to be studied
was the size of their presence in the sample, which was, to this analysis, the key
to a valid comparison among families. Even if the analytical procedures described
in section 3.4.4 make it possible the comparison of groups of students of different
sizes (due to the use of sampling weights); this could have been applicable only
in the second stage of analysis.
The final sample of linguistic families are presented in tables 4.4 and 4.5. If both
are compared, the changes in the sample are visible, due principally to coun-
tries that have not participated in the first or the second assessments. From these
changes there are two missing languages that were a particularly regrettable loss
for this research, Greek and Spanish. These languages do not show continuity
from one sample to another. Greek because their countries simply did not partici-
pate anymore, and Spanish because the countries that were previous participants:
Argentina and Colombia, have departed, while a new country, Spain, appears.
However, there is hope for a future study of Spanish in PIRLS since two of those
countries, Spain and Colombia, will participate in the 2011 version of the survey.
The families are included in the database in two ways: as a qualitative variable,
mostly descriptive, in where each family is represented with a different value.
Secondly, there are five dichotomous variables, each one referred to a specific
family, the possible values are 1 if the country is part of the family or 0 if it is not,
these variables will be used during the analysis.
Observing the sample of families, the first thing that can be observed is that there
is not even one linguistic family, because Latin, Anglo, Slavic, and Germanic are all
sub–branches of Indo–European. However, as was mentioned in section 2.1.2.d,
the unity of this family is mostly geographic or historical before linguistic; their
speakers can not necessarily understand each other, more unity and similarities
can be found among the members of each sub–branche. Moreover, the family is
not particularly over–represented since it is one of the biggest families of the world
and include several mayor languages. It is perfectly possible to consider Sub–
branches as groups of languages because of their common characteristics, and,
121
tel-0
0563
710,
ver
sion
1 -
7 Fe
b 20
11
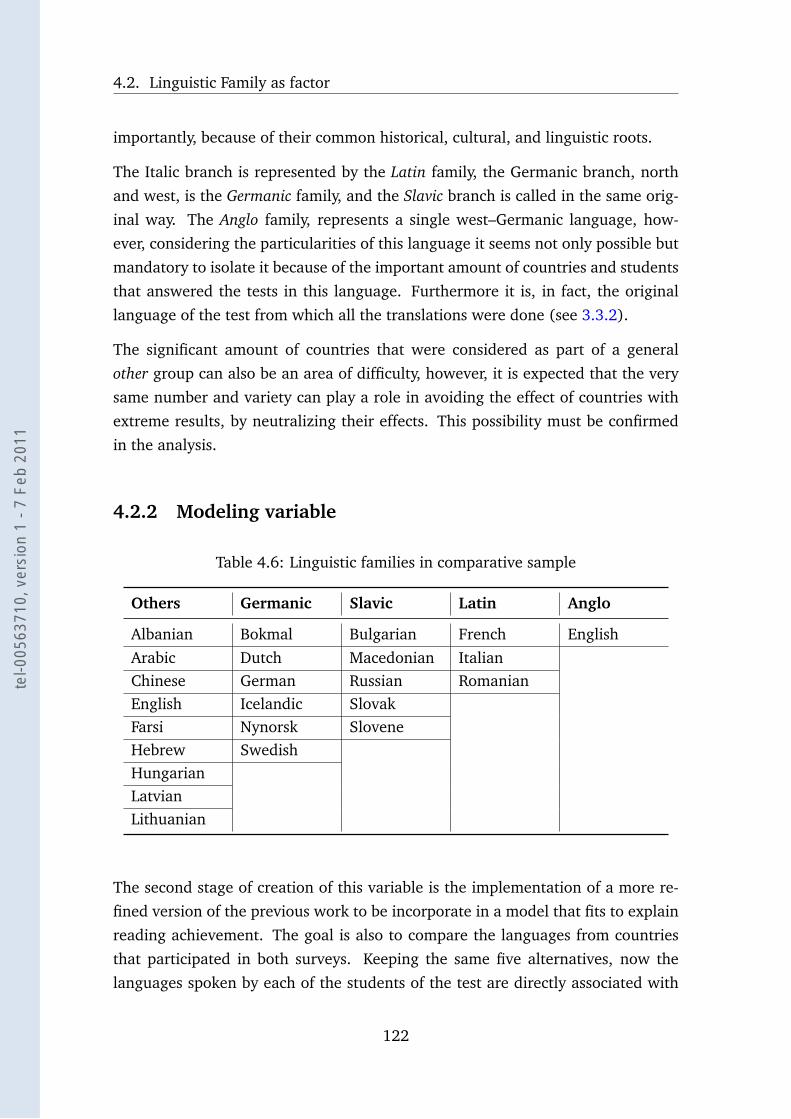
4.2. Linguistic Family as factor
importantly, because of their common historical, cultural, and linguistic roots.
The Italic branch is represented by the Latin family, the Germanic branch, north
and west, is the Germanic family, and the Slavic branch is called in the same orig-
inal way. The Anglo family, represents a single west–Germanic language, how-
ever, considering the particularities of this language it seems not only possible but
mandatory to isolate it because of the important amount of countries and students
that answered the tests in this language. Furthermore it is, in fact, the original
language of the test from which all the translations were done (see 3.3.2).
The significant amount of countries that were considered as part of a general
other group can also be an area of difficulty, however, it is expected that the very
same number and variety can play a role in avoiding the effect of countries with
extreme results, by neutralizing their effects. This possibility must be confirmed
in the analysis.
4.2.2 Modeling variable
Table 4.6: Linguistic families in comparative sample
Others Germanic Slavic Latin Anglo
Albanian Bokmal Bulgarian French EnglishArabic Dutch Macedonian ItalianChinese German Russian RomanianEnglish Icelandic SlovakFarsi Nynorsk SloveneHebrew SwedishHungarianLatvianLithuanian
The second stage of creation of this variable is the implementation of a more re-
fined version of the previous work to be incorporate in a model that fits to explain
reading achievement. The goal is also to compare the languages from countries
that participated in both surveys. Keeping the same five alternatives, now the
languages spoken by each of the students of the test are directly associated with
122
tel-0
0563
710,
ver
sion
1 -
7 Fe
b 20
11
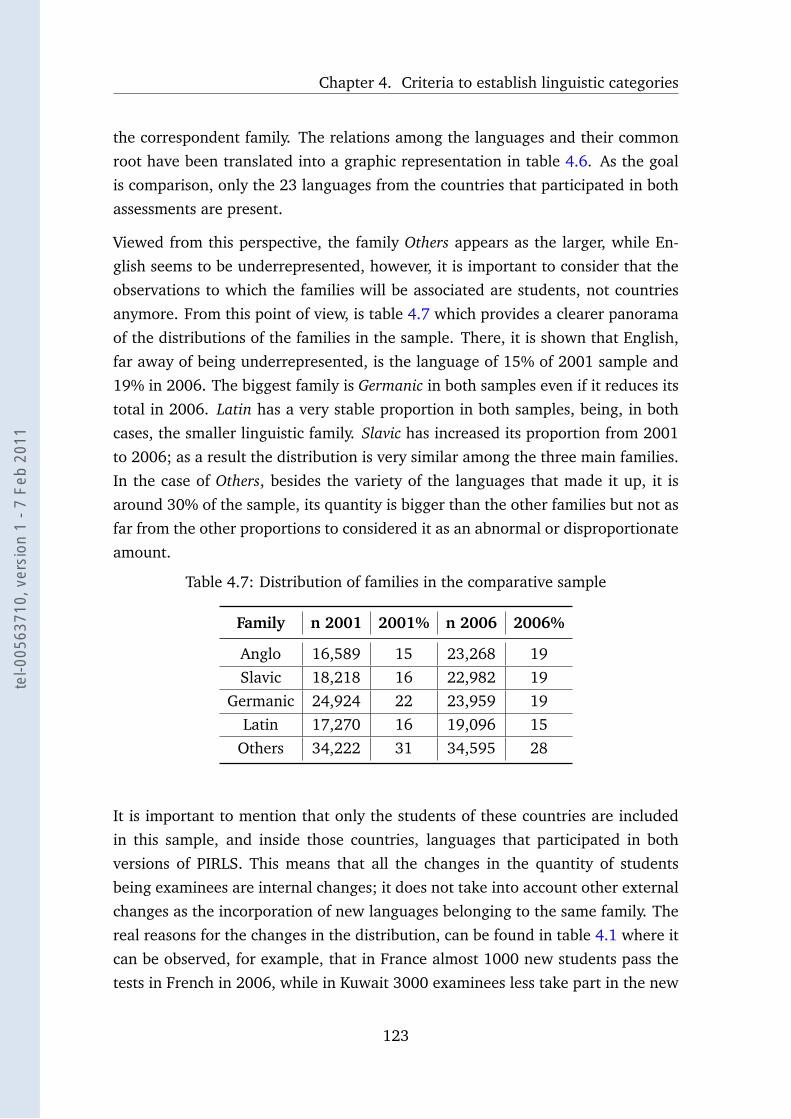
Chapter 4. Criteria to establish linguistic categories
the correspondent family. The relations among the languages and their common
root have been translated into a graphic representation in table 4.6. As the goal
is comparison, only the 23 languages from the countries that participated in both
assessments are present.
Viewed from this perspective, the family Others appears as the larger, while En-
glish seems to be underrepresented, however, it is important to consider that the
observations to which the families will be associated are students, not countries
anymore. From this point of view, is table 4.7 which provides a clearer panorama
of the distributions of the families in the sample. There, it is shown that English,
far away of being underrepresented, is the language of 15% of 2001 sample and
19% in 2006. The biggest family is Germanic in both samples even if it reduces its
total in 2006. Latin has a very stable proportion in both samples, being, in both
cases, the smaller linguistic family. Slavic has increased its proportion from 2001
to 2006; as a result the distribution is very similar among the three main families.
In the case of Others, besides the variety of the languages that made it up, it is
around 30% of the sample, its quantity is bigger than the other families but not as
far from the other proportions to considered it as an abnormal or disproportionate
amount.
Table 4.7: Distribution of families in the comparative sample
Family n 2001 2001% n 2006 2006%
Anglo 16,589 15 23,268 19Slavic 18,218 16 22,982 19
Germanic 24,924 22 23,959 19Latin 17,270 16 19,096 15
Others 34,222 31 34,595 28
It is important to mention that only the students of these countries are included
in this sample, and inside those countries, languages that participated in both
versions of PIRLS. This means that all the changes in the quantity of students
being examinees are internal changes; it does not take into account other external
changes as the incorporation of new languages belonging to the same family. The
real reasons for the changes in the distribution, can be found in table 4.1 where it
can be observed, for example, that in France almost 1000 new students pass the
tests in French in 2006, while in Kuwait 3000 examinees less take part in the new
123
tel-0
0563
710,
ver
sion
1 -
7 Fe
b 20
11
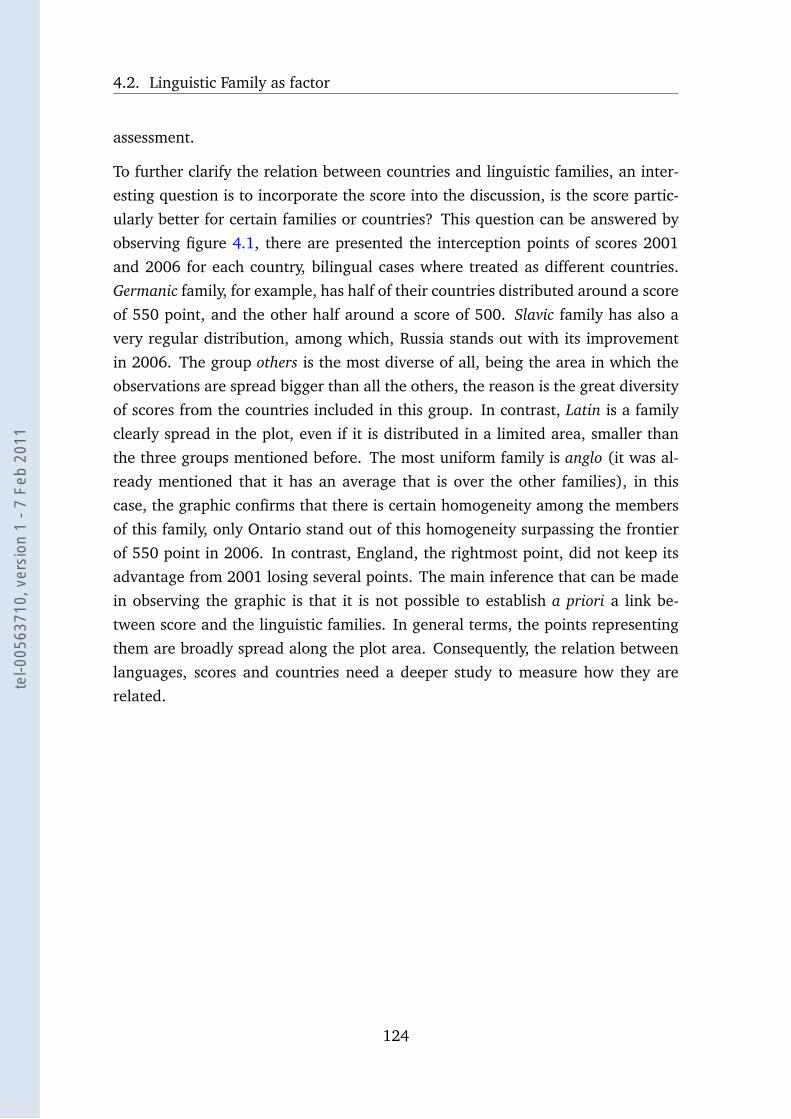
4.2. Linguistic Family as factor
assessment.
To further clarify the relation between countries and linguistic families, an inter-
esting question is to incorporate the score into the discussion, is the score partic-
ularly better for certain families or countries? This question can be answered by
observing figure 4.1, there are presented the interception points of scores 2001
and 2006 for each country, bilingual cases where treated as different countries.
Germanic family, for example, has half of their countries distributed around a score
of 550 point, and the other half around a score of 500. Slavic family has also a
very regular distribution, among which, Russia stands out with its improvement
in 2006. The group others is the most diverse of all, being the area in which the
observations are spread bigger than all the others, the reason is the great diversity
of scores from the countries included in this group. In contrast, Latin is a family
clearly spread in the plot, even if it is distributed in a limited area, smaller than
the three groups mentioned before. The most uniform family is anglo (it was al-
ready mentioned that it has an average that is over the other families), in this
case, the graphic confirms that there is certain homogeneity among the members
of this family, only Ontario stand out of this homogeneity surpassing the frontier
of 550 point in 2006. In contrast, England, the rightmost point, did not keep its
advantage from 2001 losing several points. The main inference that can be made
in observing the graphic is that it is not possible to establish a priori a link be-
tween score and the linguistic families. In general terms, the points representing
them are broadly spread along the plot area. Consequently, the relation between
languages, scores and countries need a deeper study to measure how they are
related.
124
tel-0
0563
710,
ver
sion
1 -
7 Fe
b 20
11
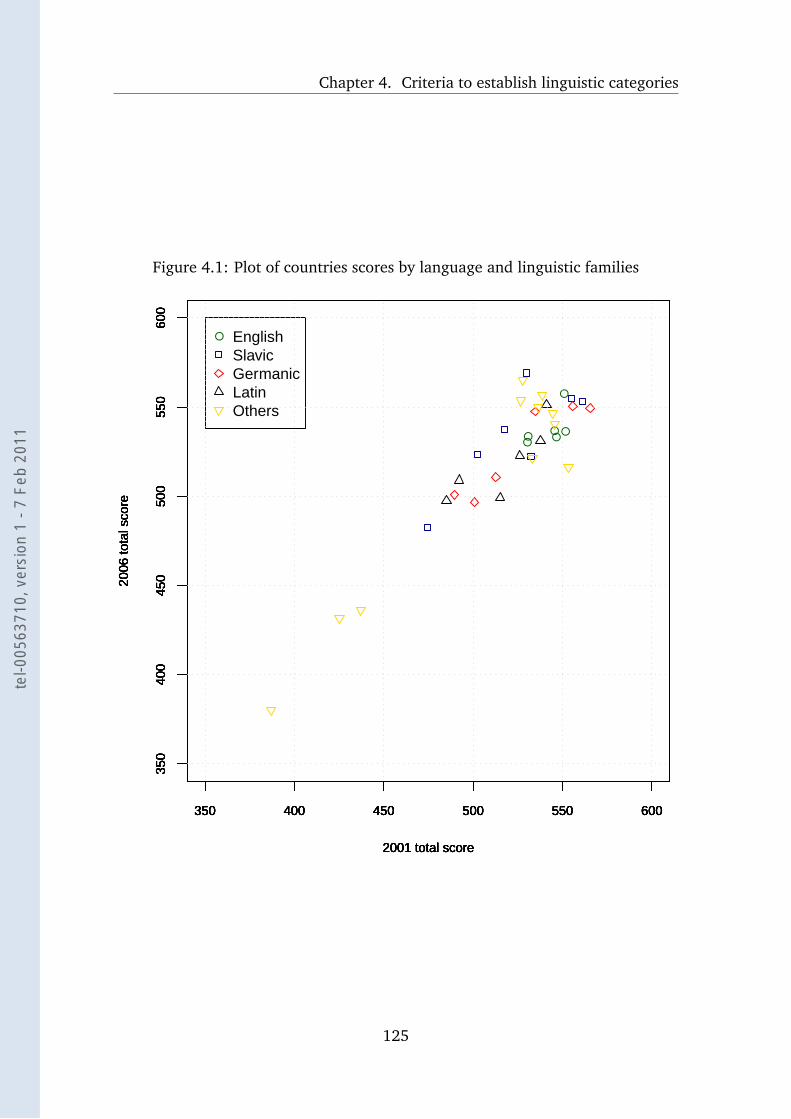
Chapter 4. Criteria to establish linguistic categories
Figure 4.1: Plot of countries scores by language and linguistic families
●● ●
●
●
●
350 400 450 500 550 600
350
400
450
500
550
600
2001 total score
2006
tota
l sco
re
350 400 450 500 550 600
350
400
450
500
550
600
2001 total score
2006
tota
l sco
re
350 400 450 500 550 600
350
400
450
500
550
600
2001 total score
2006
tota
l sco
re
350 400 450 500 550 600
350
400
450
500
550
600
2001 total score
2006
tota
l sco
re
350 400 450 500 550 600
350
400
450
500
550
600
2001 total score
2006
tota
l sco
re
● EnglishSlavicGermanicLatinOthers
125
tel-0
0563
710,
ver
sion
1 -
7 Fe
b 20
11
4.3. Orthographic depth as factor
4.3 Orthographic depth as factor
In previous discussions, orthographic deepness has been defined as a linguistic fac-
tor, as a part of the “linguistique synchronique”, as Saussure said, this definition
contrasts with the definition of language as a cultural product, as part of a “lin-
guistique diachronique”. Orthography is an internal feature, different from other
characteristics of languages directly related to history and culture. Nevertheless,
orthography is not purely linguistic, because it varies from one language to an-
other. The great variety of these rules among languages is the result of cultural
evolution:
Toutes les écritures européennes utilisent le principe alphabétique mais
chacune le fait à sa façon. Aucune d’entre elles, et a fortitiori aucune
orthographe, n’est le fruit d’un calcul linguistique délibéré. Toutes sont
les filles naturelles de bricolages et de tâtonnements qui aboutissent
malgré tout à un équilibre quasi fonctionnel.
Produits d’un déterminisme culturel, les écritures alphabétiques sont
en même temps le fruit d’un hasard. Et si nos orthographes contem-
poraines ont opté pour l’alphabet latin, ce n’est pas en vertu d’une
quelconque logique. Une analyse, même succincte, de ce fameux con-
texte sociohistorique montre assez que la diffusion de l’alphabet en
Occident passe par l’influence conjuguée des pouvoirs politiques et re-
ligieux. (Jaffré & Fayol, 1997, p. 42)
Therefore, the different degrees of regularity in grapheme-phoneme correspon-
dences, which is the origin of the notion of orthographic deepness, are cultural
factors too.
In the next paragraphs, the question to be answered will be how deep are thelanguages in PIRLS sample?. This information will allow the development of a
variable that classifies the languages in the sample, according to their degree of
opacity. During this description of languages, the influence of culture will be put
in evidence, and it will be shown that there are languages whose opacity is due
to a long cultural tradition and others that, being very ancient languages, choosetransparency. There are other very shallow languages that are also very recent
in their constitution, thus, they have had a political will in developing a regular
orthography.
126
tel-0
0563
710,
ver
sion
1 -
7 Fe
b 20
11
Chapter 4. Criteria to establish linguistic categories
Regarding the classification structure, an important question is the categories to be
employed: how many degrees of opacity can be identified? Frost (1987; 2005) de-
scribes orthographic depth as a continuum from transparent to opaque languages,
“in this view languages may be aligned one next to the other where one language
would be considered deeper than another but shallower than a third one” (Frost,
2005, p. 278). Seymour (2003; 2005) also recognizes that orthographic depth can
be a continuous variable, but specifies that in terms of it cognitive effect in read-
ing acquisition it may be mostly dichotomous: “there is a range of low degrees of
complexity, collectively classifiable as shallow orthographies, and then a threshold
level of complexity that marks the boundary for a group of deep orthographies”
(Seymour, 2005, p. 311).
Consequently it seems that the key to classifying languages is being able to de-
termine their opacity. Then, it will be possible to think about a more general
model if more information about orthographies is gathered. As Caravolas (2005,
p. 338) thinks, the ideal will be a comparable database with statistical estimates
for all those languages from which an exact calculation of their deepness can be
made. Even if it is less formal, we expect to be able to develop a referential frame-
work, getting information from general descriptions, specific studies of languages
properties, and international comparisons. This is not the ideal starting point for
classified languages, but it is not completely ineffective since the high degree of
formalization that the research about orthographic properties has reached in the
last two decades.
Concretely, since this language sample is limited to those present in PIRLS studies,
here is a description of each of the languages, paying particular attention to their
phonological and orthographic characteristics, to determine which languages are
transparent and which ones are deep.
4.3.1 Orthographic properties of PIRLS languages
4.3.1.a Albanian
Albanian is a very independent language in relation to alphabets. This charac-
teristic explains the shallow phonetic representation of its orthography. Albanian,
as a language, precedes the adoption of the Latin alphabet. Before this system,
Albanian was written in Greek characters and in autochthonous scripts, like ‘El-
127
tel-0
0563
710,
ver
sion
1 -
7 Fe
b 20
11
4.3. Orthographic depth as factor
basan script’ (created and used in Elbasan during s. VIII) and Beitha Kukjo script,
created in s. XIX (see Coulmas, 1999, p. 7). This independence has made possible
that Albanian speakers accept reforms as part of a normal linguistic development.
The most recent reforms were made in the 1970s with the publication of sev-
eral normative books, like "Fjalori drejtshkrimor i gjuhës shqipe" that promotes a
phonological and spelling normalization.
Consequently, Albanian is one of the shallowest orthographies in the sample: “Al-
banian orthography has a one–to–one correspondence between graphemes and
phonemes as well as between phonemes and graphemes, that is, it is one of the
few ‘ideal’ alphabetic orthographies with high feedforward and feedback consis-
tency” (Landerl, 2006, p. 525).
However, there are not many analyses of the effectiveness of this transparency in
reading learning, only one study: Learning to read words in Albanian: A skill easilyacquired (quoted in Landerl, 2006). This paper shows that, in reading isolated
words of increasing difficulty, Albanian children performed better that their coun-
terparts in English and Welsh. Besides this study no other direct comparison has
been referenced.
4.3.1.b Arabic
Arabic is characterized by its derivational and inflectional morphology. The key in
Arabic orthography is the distinction between vowels and consonants, there are
not only different kinds of sounds, but also, holders of different types of morpho-
logical and semantic information.
Semitic languages are based in a root–relative structure. The root is the core of
a word and is usually formed by consonants, vowels are only used to generate
relatives:
Semitic words that are related by derivation or inflection have a com-
mon core (usually three consonants). Although the vowels in each of
the different relatives may be quite different and although there may
be additional consonants in a prefix or suffix, there remains an invari-
ant series of three consonants, the root. (Katz & Frost, 1992, p. 69)
In Arabic orthography, this different status is translated into different graphical
128
tel-0
0563
710,
ver
sion
1 -
7 Fe
b 20
11
Chapter 4. Criteria to establish linguistic categories
values. Consonants are the key of writing, because the root represents the basic
sense of the word while vocals are often omitted, indeed they are only represented
in poetry, or instructional reading texts. In regular Arabic writing, vocals sounds
must be deduced. In learning to read, during the first period of instruction, chil-
dren study from vowelised text and then gradually abandon the use of vowels: “In
sum, beginning readers are introduced to vowelised Arabic, but skilled readers are
introduced to unvowelised Arabic” (Abu-Rabia, 2002, p. 300).
If vowels are explicit in a text, Arabic is mostly shallow. However, even if the texts
in PIRLS assessments are all vowelised, 1 there is a second attribute of Arabic that
increases its opacity to beginner readers.
Arabic is not the language of one nation, it is spoken in a vast region of North-
Africa and the Middle–East. Several countries share the same language. The
situation resembles that of Latin in the Roman Empire: there is Standard Arabic,
that is equal in all countries and allows the communication among the entire com-
munity, as well as regional variations from country to country or even in the same
nation, and those dialects are not necessarily understandable to each other (see
Kaye, 1990). What makes a fundamental difference in relation to the status of
Latin is that this dissimilarity of Arabic does not include a social component, as
Abu-rabia, Share, & Mansour (2003) describe:
The educated Arabs use literary Arabic for reading, writing, and speak-
ing on all official occasions. However, both educated and uneducated
native Arabic speakers use the spoken language on a daily basis for ev-
eryday communication: family dialogues, shopping, cultural talks, and
entertainment. Literary Arabic differs in vocabulary, phonology, gram-
mar, morphology, and syntax from the accepted spoken language, in
which there is a diversity of dialects. (p. 424)
Consequently, the difference between literary and spoken Arabic is formal, not so-
cial or regional. In relation to education, since at home spoken Arabic is usually
used, it is at school that children have their first contact with literary Arabic. If
they have not had any experience with this language before, this can become a
difficult process. Some researchers state that this learning is more similar to the
1we cannot be certain because it was not possible to have access to the translations into Arabic,moreover since each country developed an independent translation.
129
tel-0
0563
710,
ver
sion
1 -
7 Fe
b 20
11
4.3. Orthographic depth as factor
process of learning a second language instead of the mother tongue, this linguis-
tic phenomenon is called diglossia (see Abu-Rabia, 2002; Abu-rabia et al., 2003;
Zuzovsky, 2010).
Diglossia is a cross–national problem in learning Arabic, and this could be the ex-
planation for the delay in learning to read, which can be deduced from reading
achievement of these countries in international comparisons like PIRLS. From this
language, after cleaning the sample (see 4.1.1.b), the only speakers that remain
are a thousand Israel–Arabic children, in describing their results (one s.d. under
Hebrew), Zuzovsky (2010) affirms: “These findings supported the explanation
according to which Arabic diglossia is the main cause of the low reading attain-
ment of Arabic-speaking students in Israel and may have implications for the low
achievement in other Arabic-speaking countries as well” (Zuzovsky, 2010, p. 7).
Because of this phenomenon Arabic cannot be considered as a transparent or-
thography. Even if this is not exactly a phonetic or orthographic property of the
language, it is determinant in learning Arabic, for any learner, a second language
will always be more opaque that the mother tongue (see Koda, 2007).
4.3.1.c Bulgarian
Bulgarian is mostly transparent in its orthography; the alphabet has 30 Cyrillic
letters that represent 42 phonemes. Thus there is some degree of non one–to–one
correspondence, that affects consonant sounds specifically, the 6 vowels sound of
Bulgarian having all one–to–one representation in the alphabet. However, Janyan
& Andonova (2006) Bulgarian report for the Handbook of orthography and literacysupposes some degree of complexity when they state:
...the Bulgarian language lacks definite rules for stress, which means
that the accent of every word must be learned individually and that
most words (being multisyllabic) require adequate access to the lex-
eme representation before they can be read out correctly despite the
generally close grapheme-phoneme fit. (276)
There is not comparative research of reading acquisition that includes Bulgarian in
their sample. However, all the linguistic studies of Bulgarian that at least mention
its degree of opacity, describe this orthography as shallow or mostly transparent
(see Jetchev & Bertinetto, 2002).
130
tel-0
0563
710,
ver
sion
1 -
7 Fe
b 20
11
Chapter 4. Criteria to establish linguistic categories
4.3.1.d Chinese
Traditionally, the reflections about this writing system have been defined by the
belief that Chinese is ideographic or logographic: that the units directly represent
ideas or real objects. However, even in the earliest period of its development (1200
bc. during Shang dynasty) the system did use this principle, actual characters of
written Chinese have other properties:
Approximately 80 to 90% of characters are semantic-phonetic com-
pounds consisting of an element called the semantic radical, which
gives information about the meaning, and an element called the phone-mic, which gives information about the pronunciation of the word.
Hence, it is possible to extract from most Chinese characters cues to
word meaning and pronunciation. (Caravolas, 2005, p. 339)
There are about 56,000 characters, of which, only around 3,000 are in common
use, the knowledge of this portion of the characters will allow readers to under-
stand most of the texts. From the characters that follow the phonemic–radical
structure, there are 200 different radicals and 1000 different phonemics.
Accordingly, the Chinese writing system differs importantly from the other studied
languages, that are strictly phonetic and that do not carry semantic information
in their graphical manifestation. Moreover, even if the phonemic component of
Chinese characters approaches the orthography to sounds, it is far from being a
transparent relation. Caravolas (2005) states that only 30% of these phonetic el-
ements are unambiguous, while “The remaining components are semitransparent
or opaque offering only partial clues or no clue to pronunciation or meaning”(p.
339).
It is difficult to make a decision about the opacity of such a particular language;
however, some researches have stated that phonology is a determinant factor in
learning to read Chinese:
There is now a substantial body of evidence showing that children are
sensitive to both the radical and the phonetic components of Chinese
characters, and, interestingly, the regularity of the phonetic component
(the consistency with which it is associated with the same pronuncia-
tion) affects the rate at which a character can be learned. A related
131
tel-0
0563
710,
ver
sion
1 -
7 Fe
b 20
11
4.3. Orthographic depth as factor
finding is that readers of Chinese have better syllable and morpheme
awareness than readers of English. Variations in phonological skills do
predict learning to read in Chinese but less powerfully than in English,
however the independence of phonological skills from other language
skills as predictors of learning to read in Chinese has yet to be estab-
lished unambiguously. (Snowling & Hulme, 2005a, p. 270)
If phonetic determines reading learning, the relation between Chinese orthogra-
phy and phonology also plays a part in reading. Phonetic methods are used to
introduce children to reading, Pinyin in mainland China and Zhu-Yin-Fu-Hao in
Taiwan. Considering the elements that characterize this relation, it is possible to
define it as a language of an intermediate complexity, not as deep as English but
certainly not as transparent as Italian.
However, besides the complexity of the language itself, there is a second source of
difficulty in this language. As was mentioned in section 2.1.2.e, Chinese is defined
as a macro–language because it has numerous variations which are accepted as
part of the main language. Looking now at PIRLS, there are two of the Chinese
variations that are present in the sample: Taiwan Mandarin Chinese, mostly con-
servative, and Hong Kong Cantonese variation. Even if Hong Kong children are
taught to read in Mandarin, the differences between it and Cantonese can add
extra difficulty in the learning process:
A Mandarin speaker would find it quite difficult to read a newspaper
from Hong Kong written in Cantonese, and a monolingual Cantonese
speaker would struggle to read text written in Mandarin. This is be-
cause the syntax of the two languages is different, and because the
meaning of some characters differs in Cantonese and Mandarin. (Han-
ley, 2005, p. 319)
To summarize, Chinese is certainly not a transparent language, but, in accord with
our research the use of phonetic in teaching reading is an element that approach
this language to regularity. Moreover, there is not evidence indicating that this
language is as complex as English in terms of it relation to phonetic. This language
will be defined as deep but not in the same level as English.
132
tel-0
0563
710,
ver
sion
1 -
7 Fe
b 20
11
Chapter 4. Criteria to establish linguistic categories
4.3.1.e Dutch
Dutch has been defined as a language of an intermediate consistency (see De Jong,
2006). Seymour et al. (2003) describe Dutch as a language with a complex syllabic
structure and an intermediate degree of orthographic depth. Seymour and his
colleges observed that in the test of accuracy, speed and fluency, Dutch children
ranked among the deeper languages along with Danish, French, and English.
The cause can be found in a similar orthographic structure to French, where syl-
labic complexity goes only in one direction:
Written Dutch is morphophonemic, this feature has different conse-
quences for reading and spelling. That is, grapheme–to–phoneme re-
lations appear to be more consistent than phoneme–to–grapheme re-
lations, which renders written Dutch relatively transparent for read-
ing but somewhat opaque for spelling rules, affects reading for begin-
ning readers and spelling for both beginning and advanced spellers.
(Bosman, Graaff, & Gijsel, 2006, p. 135)
An example of this complexity, is described by the same Bosman: “... in native-
Dutch words, only 9 sound-letter couplings are unique; the remaining 26 native
phonemes have at least two, often three, and sometimes four different written
possibilities” (p. 145). Consequently this language must be considered as opaque,
even if instruction in Netherlands has a phonological perspective.
4.3.1.f English
From the point of view of orthographic depth, English is a very particular case. In
the general argumentation of section 2.2.2 it is already understood that English is
a deep orthography, at least, deeper than those compared with (German, Serbo–
Croatian, French). Now, how long is the distance between English phonology and
orthography?
From the point of view of reading, it seems that the distance is the longest if com-
pared with languages described until now. No child is slower than the English
when comparing reading tasks that search to explore this distance (words, pseu-
dowords, non words reading). Goswami et al. (2005), for example, believe that
133
tel-0
0563
710,
ver
sion
1 -
7 Fe
b 20
11
4.3. Orthographic depth as factor
“English children decoding less than 50% of simple familiar words successfully
during the first year at school” (p. 347). In their comparative study of English and
other European orthographies, Seymour et al. (2003), point out that many studies
“suggest that the decoding process ... develops more slowly and less effectively
in English than in other European languages” (p. 144), the conclusions of their
own research indicate that their English sample (Scottish) has a very low reading
accuracy (34%), one year older children only reach the lower accuracy of other
languages (80%). In terms of age, it takes many years for English children to
reach the first year accuracy of other languages, like Aro & Wimmer (2003) have
demonstrated:
At the end of Grade 1, reading accuracy levels were already around
85% for the German, Dutch, French, Spanish, and Finnish children
and above 90% for the Swedish children, leaving little room for fur-
ther improvement in all these orthographies. A markedly different de-
velopmental trend is apparent for the English children, who, having
achieved only 50% accuracy by the end of Grade 1, did not attain the
high accuracy shown by their Grade 1 counterparts in other orthogra-
phies until Grade 4. (627)
These findings have led researchers like Seymour and his colleges to such em-
phatic conclusions like: “the slow rate of foundation literacy acquisition by the
Scottish sample can be seen as an inevitable consequence of the complexity of
the orthography and phonology of English” (Seymour et al., 2003, pp. 168–169).
Others have simply classified English as a “chaotic” orthography (Caravolas, 2005,
p. 336).
Accordingly, English can be defined as a very special situation of orthographic
complexity, deeper than any other referenced language. Regarding the possible
causes, researchers argue that this deep structure is the result of a double condi-
tion in English orthography: it “contains many words that are either irregular or
inconsistent” (Frost, 2005, p. 278).
First of all, English has an inconsistent system of grapheme–phonemes, other deep
languages show complexity when going from phonemes to graphemes or from
graphemes to phonemes, English has both directions of opacity: grapheme –>
phoneme and vice/verse. Ziegler & Goswami (2005) underline that one letter or
134
tel-0
0563
710,
ver
sion
1 -
7 Fe
b 20
11
Chapter 4. Criteria to establish linguistic categories
letter cluster can have multiple pronunciations, while a phoneme can have mul-
tiple spellings, which tjey call the “bidirectional inconsistency of English”(p. 11).
Goswami et al. (1998) gives an example of this inconsistency: “the consistent
spelling of morphemic invariances (e.g., heal–health) lead to different pronunci-
ations for the same spelling and identical pronunciations for different spellings
(e.g., peel–deal).” (pp. 19–20).
Secondly, besides the inconsistency, English has a complex syllabic structure (Goswami
et al., 2003; Ziegler & Goswami, 2005, see), because of the high frequency of
consonant clusters (groups of consonant with specific morphological or semantic
properties) that leads to a large amount of syllables: English is said to have at least
8000 syllables. Moreover this language has a particularly important repertory of
vowels: 15 vocalic phonemes represented by fewer graphemes.
Currently, English represent a key in studying orthographic depth, as many other
researches about languages are done in comparing their behavior with those of
English readers. This is why it is particularly interesting to include English in this
research; because of its complexity it cannot be compared with any other language
and it will constitute a specific value of degree of opacity.
4.3.1.g Farsi
Farsi (Persian) is the Iranian variation of Persian, macrolanguage of Afganistan,
Iran, Tajikistan, Uzbekistan and Russia. Even if it is an Indo–European language,
Farsi is written using Perso-Arabic script, a variation of Arabic made of 28 Ara-
bic letter plus 4 additional Farsi letters that correspond to 23 consonants and 6
vowels. As in Semitic scripts, Farsi is written omitting vowels, equally a vow-
elised text is very transparent. A description of Persian is similar to that of Ara-
bic: “There is a direct, one-to-one relationship between letters of the alphabet
and phonemes in Persian. Moreover, Persian script, insofar as grapheme-phoneme
correspondences are concerned, in its fully vowelised format is a highly regular
orthography” (Baluch, 2006, 367).
A deeper analysis made by (Rasekh & Eshghi, 2007) explains how phonetic and
orthographic correspondences work in this language:
– Farsi orthography is naturally phonetic. All letters, except some
cases, are phonemes...
135
tel-0
0563
710,
ver
sion
1 -
7 Fe
b 20
11
4.3. Orthographic depth as factor
– In Farsi all the letters in a word has one phoneme. There is not any
letter with two or more phonemes.
– In Farsi almost all the letters in a word are pronounced. Unpro-
nounced letters are so sparse.
– Each phoneme is corresponded to one letter in a word. In the other
word, the combination of 2 or more letters does not present a new
phoneme in Farsi language. (155)
Despite this transparency, there is another similarity with Arabic; Baluch (2006)
reported that there is a “strong dissociation of standard written Persian and collo-
quial Persian (Teherani accent)” (p. 374), even if this does not reach the level of
diglossia as in Arabic. Because of this last factor it is not possible to classify Farsi
as a transparent orthography and it must be treated only as a language with an
intermediate opacity.
4.3.1.h French
Ziegler & Goswami (2005) describe French as a language with a complex syllable
structure, similar to English, with many consonant clusters and a large repertory
of vowels. However, French is not as opaque as English, because the complex-
ity of the language goes only in one direction: “although written French is less
complex than English in grapheme-phoneme mappings (i.e., reading), it is as in-
consistent as English in phoneme-grapheme mappings (i.e., spelling)” (Caravolas,
2005, 338).
Conversely, the opacity of phoneme-grapheme mappings is very high and cause
difficulties for learners, because it is the source of an important degree of ho-
mophony in spoken French, like Frost (2005) describes: “There are ... several
possible spellings for a given phoneme (e.g., o, au, eau may represent the vowel
/o/). Thus, the mapping of phonology to spelling is opaque in French” (p. 280).
There are 30 phonemes in spoken French that can be represented by 130 phono-
grams, letters or letter clusters (see Fayol & Jaffré, 2008).
The reason for this complexity is described by Alegria, Morais, Carrillo, & Mousty
(2003) as the intention of representing graphically several language levels, in
other words, French orthography searches to represent not only phonology but
also morphology and syntax at the same time:
136
tel-0
0563
710,
ver
sion
1 -
7 Fe
b 20
11
Chapter 4. Criteria to establish linguistic categories
Le Français, par exemple, représente systématiquement la morpholo-
gie, y compris dans les aspects qui ne sont pas représentés dans la
phonologie. La conséquence en est que certains graphèmes ne représen-
tent aucun phonème. Par exemple, la phrase ils¯
marchen¯
t¯
comporte
des marques orthographiques du pluriel qui n’apparaissent pas dans la
prononciation. (51)
Jaffré & Fayol (2006) indicate that only 85% of French graphemes are phono-
grams, there is also 4% that have a lexical function and 13% that are only histori-
cal traces in writing the language. This historical factor is very important since it
is the source of homophony, due to a process of morphological erosion, old sounds
and morphological information have disappeared from pronunciation but still re-
main in writing French (see Posner, 1996, 245). This erosion originated from the
Celtic substrate that separated French from the rest of the Roman languages: “the
Germanic period resulted in the erosion of the final letters of words that convey
essential grammatical information” (Jaffré & Fayol, 2006, p. 81).
Along with the erosion of the original Latin components and homophony, conser-vationism must be added to the sources of French complexity (see Coulmas, 2003,
pp. 96–97). This language and its orthography were one of the first European
languages to be standardized, since then, few reforms have been undertaken, and
the gap between the French of everyday life and its graphical representation has
been increasing:
This system thus acquired a stability that has been hard to shake ever
since, despite the considerable linguistic changes that have occurred.
As a result of the large–scale educational projects introduced in the
19th century, the conventional orthography was taught in the schools
without any attempt being made to render it more accessible to the
new users of the written language. French children all over the country
simply had to learn to master a system of orthography designed by
and for an elite section of the population, and to achieve this aim and
overcome the problems involved, they were simply given an extremely
thorough grounding in the grammatical rules of French. (Jaffré &
Fayol, 2006, p. 88).
The effects of French opacity in reading learning are visible in decoding tasks,
Seymour (2005) states that French children’s performance is poorer than Finnish,
137
tel-0
0563
710,
ver
sion
1 -
7 Fe
b 20
11
4.3. Orthographic depth as factor
Greek or Italian children in decoding simple nonwords, even if it is not as low
as the performance of English children. In Goswami et al. (2005, p. 347) read-
ing learning in French is described as “more slowly” than in other European lan-
guages, closer to English and Danish, the two most difficult languages to learn.
Another important characteristic is the methodology employed during instruction,
in France as Aro & Wimmer (2003) describe: “it appears that a sight-word vocabu-
lary was used to support an analytical phonics approach, for example, by pointing
out that rhyming words share the same letter spelling body” (624). Thus, in this
educational system the teaching of reading is not purely phonic, while great de-
bates have been raised in later years about the best didactical method for teaching
reading, today the strategies used in this country cannot be compared with the
systematic phonics approach used in teaching Spanish or Slovak.
In summary, several factors make of French a complex language from the point of
view of orthography and phonetic relationships. In PIRLS sample, there is a signif-
icant amount of children that completed the test and answered the questionnaires
in French, which is why it is important to consider this language in this analysis.
4.3.1.i German
German is at the same time, defined as a language with a complex phonologi-
cal structure (with many complex syllables, like English), and a language with a
consistent orthography (like Italian or Greek). It is often defined as a shallow or-
thography (Snowling & Hulme, 2005a; Goswami et al., 1998, see). At the same
time, German is often related to English because of their similar orthography and
phonology; except that there are different degrees of consistency: “For example,
the words ball, park, and hand exist in both languages in identical form; however,
the grapheme a receives the same pronunciation in all three words in German but
a different pronunciation in each word in English” (Goswami et al., 2003, p. 238).
Now, concerning reading development, experiments like those of Goswami et al.
(2003), Goswami et al. (2005), and Seymour et al. (2003), all proved that accu-
racy and speed of German children in decoding reading is much closer to trans-
parent orthographies, but not reaching such favorable results as Greek, Spanish or
Finish.
There are two main reasons for defining German orthography as shallow. First,
the accuracy in decoding already referenced. Secondly, as Aro & Wimmer (2003)
138
tel-0
0563
710,
ver
sion
1 -
7 Fe
b 20
11
Chapter 4. Criteria to establish linguistic categories
point out, in learning to read, German children were subject to systematic phonics
teaching. Both are fundamental factors in describing the relation between reading
and orthography. In terms o this research, this special condition of Germans,
led to the conclusion that it represents an intermediate condition, not as deep as
English, not as transparent as Italian. However, the reading achievements and
teaching methodology influence the link of German to transparent orthographies
in spite of syllabic complexity.
4.3.1.j Hebrew
Hebrew characteristics are similar to those of Arabic languages, but without the
diversification derived from the large amount of countries that share that lan-
guage. Hebrew, while spoken in numerous places, due to migration processes,
is only primarily and officially the language of Israel. The distinguished prop-
erty of South-Central Semitic orthography is present in Hebrew: only consonant
sounds are graphically represented, vocalic sounds must be inferred from reading:
“Standard written Hebrew is an orthography in which all diacritics (or points) are
omitted. These diacritics represent nearly all of the vowels and are also used to
disambiguate some of the consonants” (Katz & Frost, 1992, p. 69).
Therefore, Hebrew is quite an opaque language in every day reading, but not as
difficult during beginning learning. As Frost (2005) argues, it is important to
distinguish this kind of opacity from others like English, the source of the lack of
transparency is purely superficial, directly related to the way in which sounds are
represented.
In Hebrew opaque spelling–to–sound connections arise simply from
missing phonemic information, mainly vowel information. Note that
when the diacritical marks are presented in the text, Hebrew orthogra-
phy is entirely shallow, as the phonemic structure of the printed word
can be easily assembled using simple grapheme–phoneme conversion
rules. (p. 279)
Consistency or the syllabic structure, are not questioned because a fully voweled
text reaches a high degree of transparency.
Consequently, to determine the degree of transparency of the Hebrew sample it
was necessary to know how the texts were presented: with or without diacritics.
139
tel-0
0563
710,
ver
sion
1 -
7 Fe
b 20
11
4.3. Orthographic depth as factor
This research led to the understanding that at the age of ten, the students are
still working with pointed texts, while they started reading texts without diacritics
progressively: “children begin learning to read with pointed text, but are gradually
exposed to unpointed text in a systematic manner around grade 3. By grade 4, a
child is expected to be competent in both scripts” (Share & Levin, 1999, p. 105).
Given that PIRLS examinees have not totally crossed the frontier of expert reading
and they are still beginning readers. The translation to Hebrew maybe has been
not totally unpointed. It can be inferred that orthography in the PIRLS Hebrew
sample was mostly shallow. This is a specific condition of this sample, due to the
age of the children; consequently, the conclusions that can be made will be only
valid to this kind of reading: beginning reading with pointed Hebrew.
4.3.1.k Hungarian
The Hungarian alphabet is an extension of the Latin alphabet. Hungarian or-
thography follows a phonetic principle, even if there is also a conservative com-
ponent. “Transparent orthography is one of the main characteristics of the Hun-
garian writing system, therefore, no differences are present in the regularity of
letter sequences ... no particular rules are required for translating orthography
into phonology” (Csépe et al., 2003). A more expressive description says:
Le hongrois est exempt des nombreuses complications présentes dans
les langues indo–européens : les substantifs, les pronoms, les articles,
etc. n’ont pas de genre (ni masculin, ni féminin, ni neutre) ; la con-
jugaison est simple, et surtout la prononciation est régulière, sans la
moindre exception. L’accent tonique, également régulier, porte tou-
jours sur la première syllabe du mot ; la morphologie et la syntaxe
donnent l’impression d’une superbe mécanique de précision, parfaite-
ment réglée. (Kersaudy, 2001, p. 81)
Consequently all our reference indicates that Hungarian must be considered as a
transparent language.
140
tel-0
0563
710,
ver
sion
1 -
7 Fe
b 20
11
Chapter 4. Criteria to establish linguistic categories
4.3.1.l Icelandic
Icelandic orthography is often classified as being mostly shallow, but with some
degree of opacity, particularly in the path from sound to graphemes. Thus read-
ing is easier than spelling: “The current Icelandic orthography is pretty regular
in the mapping from print to sound, making it relatively easy for most children
to learn to decode. The mapping from sound to print is much more difficult to
master” (Pind, 2006, p. 13). Pind states that the reason for this separation be-
tween phonemes and graphemes is an important tendency of conservatism: “The
current Icelandic spelling is a compromise between opposing viewpoints arguing
either for an Orthography that is close to the pronunciation or one that remains
faithful to the long tradition of writing in the country” (p. 12). Seymour et al.
(2003) describe Icelandic as orthography of a complex syllabic structure and a
quite regular relation to phonology, features that this language shares with Ger-
man and Norwegian. From this information it can be concluded that Icelandic can
be considered as mostly shallow, even if it is not as regular as Albanian, Italian, or
vowelised Hebrew.
4.3.1.m Italian
All literature concerning orthographical deepness agrees with qualifying Italian
as “a regular, transparent and phonologically predictable language” (D’Angiulli,
Siegel, & Serra, 2001, 484), the high accuracy and fluency in reading at early
stage of instruction is also a common characteristic (see Job et al., 2006; Ziegler
& Goswami, 2005; Seymour, 2005; Seymour et al., 2003; Goswami et al., 2005).
Consequently there is not much information to add, that is not already noticeable
from our exposition about orthography and phonology, except for noting that the
one–to–one phoneme–grapheme correspondence in Italian should be reflected in
some way in reading achievement, if is accepted the hypothesis that this advantage
in early stages of reading learning leaves a footprint in later stages. As a result,
Italian together with the other highly transparent orthographies in the sample is
going to be one of the focuses of this analysis.
141
tel-0
0563
710,
ver
sion
1 -
7 Fe
b 20
11
4.3. Orthographic depth as factor
4.3.1.n Latvian
Standard Latvian was developed during XX century, under the influence of Finnish,
Polish and German. Kersaudy (2001) states that it is easier than Lithuanian be-
cause of the regularity of its structure. Latvian is defined as a language, “plus
moderne” (p. 94), than Lithuanian because of the acceptance of changes in the
search for adequacy between rules and use.
Its basis is the Latin alphabet and it is phonetic because it follows the pronunci-
ation; there are only three exceptions in grapheme to phoneme translation. The
main property of Latvian is the use of diacritical marks that improve the regularity
of the language.
Latvian is one of the language of which not much information is available and
no direct reading comparisons have been made. However, the descriptions of its
alphabetic system and its relation to phonology indicate that this is a transparent
orthography.
4.3.1.o Lithuanian
Lithuanian is closely related to Latvian, but they are not mutually intelligible. The
only reference found (Kersaudy, 2001) indicate that Lithuanian is more difficult
than Latvian, because is most conservative. This language was originally several
dialects that have been reunified today.
4.3.1.p Macedonian
Originally, it was part of a collection of related dialects, all local variations of Bul-
garian; nowadays, Macedonian has become a language due to its independent
development along with the autonomy of the region where it is spoken; Macedo-
nian and Bulgarian are mutually intelligible.
Macedonian orthography is consistent and mostly phonemic close to the princi-
ple of one–to–one grapheme–phoneme correspondence, although, there are some
inconsistencies and exceptions.
Similar to Albanian, Macedonian has no historical attachment with a script. Before
standardization, it had been written in a variety of different versions of Cyrillic.
142
tel-0
0563
710,
ver
sion
1 -
7 Fe
b 20
11
Chapter 4. Criteria to establish linguistic categories
Moreover, since the Macedonian disconnection from Bulgarian is recent, all the
regulation and standardization rules are also recent. The Macedonian alphabet
started its standardization in 1944 by a committee formed in the Socialist Republic
after Nazi defeat. The orthography was developed following a phonemic principle
and the alphabet was influenced by Serbian Cyrillic, which is well known by its
high degree of transparency.
4.3.1.q Norwegian
PIRLS bibliography describes Norway as having two different languages, but the
research shows that they are not separated languages, but two mutually intelli-
gible official forms of written Norwegian. In other words, Bokmål and Nynorsk
are two different orthographies, defined as variations of the same Norwegian lan-
guage (see Kersaudy, 2001, pp. 102–103). Hagtvet, Helland, & Lyster (2006),
gives a clear description of Norwegian variations:
Today we have two standard, oficial orthographies: urban Norwegian
(Bokmål), which originally developed from Danish and was based on
the southern and eastern dialects centred around Oslo, and rural Nor-
wegian (Nynorsk), which is based on dialects of the western parts of
the country. Norwegian has furthermore many different dialects, which
are appreciated and used officially. (16)
Hagtvet et al. (2006) underlines another important characteristic of the linguistic
situation in Norway: there is a dynamic approach of this society to their languages:
“The orthographies are regularly being reformed, not only in accordance with di-
alectal changes, but also in accordance with the ongoing debate of the two official
orthographies” (p. 16). In other languages like Icelandic or French, conserva-
tionism is a source of distance between written language and speech; it can be
expected that this language can be adapted more easily to the evolution of orality.
It does not seem necessary to treat Bokmål and Nynorsk as different languages,
because of this dynamic structure, and because the two variations are closely re-
lated since they take part of a larger collection of dialects. Moreover there is no
evidence of differentiations in the relation between phonology and orthography.
Besides, the quantity of Nynorsk speakers that take part in the PIRLS assessment is
143
tel-0
0563
710,
ver
sion
1 -
7 Fe
b 20
11
4.3. Orthographic depth as factor
very small: in the 2001 sample there were only 790 Nynorsk speakers, a quantity
that was reduced dramatically to only 331 in 2006.
Norwegian is defined by Hagtvet et al. (2006) as a semi-transparent orthography,
easier than French or Danish, but less transparent than Spanish or Italian. A
similar conclusion was shown in figure 2.7. Seymour et al. (2003) considered
Norwegian as a unique language and described it as a shallow orthography with
a complex syllable structure, like German or Icelandic. What makes this a shallow
orthography, are the consistent mappings between letters and sounds: “Because
of the fairly systematic sound-letter correspondence of Norwegian orthography,
learning the sound-letter relationships associated with early reading is easy even
for children at risk of developing reading problems” (Hagtvet et al., 2006, p. 15).
In summary, the Norwegian orthographic situation is similar to that of German:
its orthographies do not represent a major obstacle for beginner readers, even if
there are some subtle details about semantic representation(see Nergård-Nilssen,
2006).
A final characteristic of Norwegian is that reading instruction is generally phonics
oriented. This is the definitive factor that leads us to classify Norwegian as a
shallow orthography, although it is less transparent than other languages present
in the sample.
4.3.1.r Romanian and Moldavian
Moldavian Romanian is often called Moldavian, in fact, Moldavian is the same as
Romanian, so it is considered such by the Ethnologue Lewis (2009a). The distinc-
tion originated in the ancient use of Cyrillic characters in the writing of the lan-
guage, instead of Latin characters. This was the only distinction from Romanian,
but these characters are no longer in use nowadays: “Depuis 1991, les Moldaves
roumanophones ont remplacé l’écriture cyrillique par l’écriture latine, de sorte que
leur langue ne se distingue plus du roumain” (Kersaudy, 2001, p. 87).
Romanian is a regular language, as its spelling system was standardized only in
s. XIX, it spelling system is largely phonemic with straightforward grapheme-
phoneme correspondences (Coulmas, 2003, p. 442). Romanian alphabet count
27 letters, 20 consonants, and 7 vocals; a small amount if compared with more
irregular languages.
144
tel-0
0563
710,
ver
sion
1 -
7 Fe
b 20
11
Chapter 4. Criteria to establish linguistic categories
4.3.1.s Russian
Researchers agree in defining Russian spelling as anything but transparent, Grig-
orenko (2006) wrote that the Russian language is “heaven for experts and hell for
novice writers and readers” (p. 319).
On one hand, Russian orthography consist in a mix of morphological and phonetic
principles, there is also an important amount of etymological and historic forms
present in spelling or written representations. On the other hand, all these ele-
ments follow logical connections in their participation of the system, as Kerek et
al. (2009, p. 8–9) sum up:
Although Russian graphics can often represent one–to–one phoneme–
grapheme correspondences, they also contain numerous irregularities.
Their rules are highly positional and far from straightforward. At the
same time, they are a sufficiently logical system with a high degree of
regularity and predictability. (p. 8–9)
Among the 33 letters that constitute The Russian alphabet, there are letters that
represent one sound (27), two sounds (4) and two mute letters. In addition letter
clusters (combinations of letter) can also represent specific phonemes. From them,
10 are vowels and 21 are consonants. This important amount of vowels approach
Russian of deep languages as French or English and move it away from transparent
orthographies as Spanish were there is only five vocalic sounds.
The characteristic that define Russian orthographic depth is that sounds, and, con-
sequently, meaning depend of contexts, position, and stress, that is, in morpholog-
ical features:
Phoneme–grapheme correspondences are not always straightforward
in Russian because many letters in the Russian alphabet are not bound
to representing only one phoneme each. ... The essence of this is that
phonemic values cannot be assigned to the consonants and vowels in
a syllable without evaluating either or both the left or right context of
a given grapheme. One of the most common examples is the represen-
tation of palatalized consonant phonemes: 15 consonant letters out of
the 21 each correspond to two phonemes, where one letter signifies
both hard and soft consonant phonemes. (Kerek et al., 2009, p. 6–7)
145
tel-0
0563
710,
ver
sion
1 -
7 Fe
b 20
11
4.3. Orthographic depth as factor
For beginning readers and writers, Russian writing may be difficult to learn, be-
cause of the distance from phonology to orthography. Its mastering depends in
a third element, morphology, which plays a role of communicating mediatory be-
tween oral and writing.
Consequently, beginning reading starts not only with the mastery of one aspect like
phonology, but with the mastery of several aspects at the same time, as Grigorenko
(2006) points out:
The primary grade course of Russian includes extensive introduction
to phonology, orthography, morphology, and lexicology. Specifically,
children are familiarized with the main principles of Russian orthogra-
phy (phonological, traditional, and morphological). Reading, writing,
and spelling are taught simultaneously within one subject matter titled
“Russian Language”. (p. 314)
In addition, there is not one teaching program but several approaches to teach
reading, as Kerek et al. (2009) describe:
Several types of reading and writing programs with supplementary ma-
terials, based on different principles and approaches to reading acqui-
sition, are available for use in Russian schools. Most programs are
phonics-based, but they differ in their presentation of irregularities of
Russian orthography. (p. 10)
To this research aims, these characteristics indicate that Russian must be classified
among deep languages. Regretfully, there were not reference available compar-
ing Russian and English or Dutch, because the relation between its phonology
and orthography may be as complex as that of these languages in accord to the
description.
4.3.1.t Slovak
Slovak orthography is related to Czech in its origins and later during the existence
of Czechoslovakia. Because its system of rules is dynamic, Slovak has undergone
multiple changes throughout history that allow the adaptation of written Slovak
146
tel-0
0563
710,
ver
sion
1 -
7 Fe
b 20
11
Chapter 4. Criteria to establish linguistic categories
to changes in spoken Slovak. There is a high degree of regularity in the Slovak
alphabet; it is an adapted version of Latin alphabet that employs 38 letters to
represent 46 sounds. Moreover, this language follows a phonetic principle, and
morphology or etymology play a secondary role in graphical representation of
words.
Regarding reading learning, Slovakian educational system used a phonemic method;
Schwippert (2007), describes this approach:
Reading instruction in Grade 1 (ages six to seven) is devoted to en-
suring children acquire basal reading skill. The procedure follows a
prescribed letter-by-letter sequence and lasts about eight to 10 months
on average. ... The aim of the next two or three years of schooling
is to improve and reinforce children’ ‘reading technique’ (skill). (pp.
195-196)
This information leads us to classify Slovak as a mostly shallow orthography, along
with Italian and Albanian.
4.3.1.u Slovene
Regretfully there are not many descriptions of this language in scientific literature.
The nearest reference is Serbo–Croate, which is well known for been considered
one of the shallowest languages. Coming also from several regional dialects, to-
day’s Slovenian language is well uniformed and standardized.
4.3.1.v Swedish
This is a language with consistent grapheme-phoneme correspondences, Seymour
et al. (2003) describe Swedish as a shallow orthography with a complex sylla-
ble structure, similar to Dutch, but less transparent than German and more than
French. Elbro (2006) compares its orthography with Danish to conclude that
Swedish is much shallower. If this language is compared to other European lan-
guages, the results indicate that this is an orthography easy to acquire: “At the
end of Grade 1, reading accuracy levels were already around 85% for the German,
Dutch, French, Spanish, and Finnish children and above 90% for the Swedish
147
tel-0
0563
710,
ver
sion
1 -
7 Fe
b 20
11
4.3. Orthographic depth as factor
children” (Aro & Wimmer, 2003, 627). In summary, even if like other Nordic or-
thographies, Swedish has a complex structure, the regularity of this same structure
made this a shallow orthography.
4.3.2 Classifying orthographic depth
According to the information gathered, it is possible to judge how regular the lan-
guages in the sample are. Three factors will be key to the classification: first,
the main characteristic of the languages, how they are generally defined or de-
scribed in related literature; second, if available, their descriptions in comparison
with other languages, if the language is defined as more or less transparent than
others.
Finally, since this variable will be connected with reading, it is important to con-
sider the methodology preferred to teach each language. However it is not easy to
find direct descriptions, considering the purpose of the classification of this analy-
sis. What is necessary is to know if the teaching of reading follows or not a phone-
mic perspective, it other words, if a phoneme–by–phoneme sequence is followed.
The importance of this characteristic is that a systematic work with phonemes can
increase the tendency of regularity and transparency of a language. On the con-
trary, most of the languages that employ other teaching methods do it because
the structure of the same language cannot be taught using only phonemes; conse-
quently this can also be a prove of the complexity of the language. Regretfully, this
information is not available for each language in the sample, it is only included in
half of the cases.
To summarize, all this information has been synthesized in table 4.8. Here, the
main characteristic, comparison and reading methodology of each language of
the sample is presented, along with the classification. There are two main cate-
gories: shallow and deep languages. Shallow languages have in common regular
graphemes–phonemes relations, while deep orthographies have a variety of fac-
tors that originate their complexity. It can be said that what they have in common
is to not be regular. A third category was created specially for English, due to the
particularity of its orthography and the role that this language plays in the as-
sessment. Because all literature underlines the complex relation between English
and reading learning, it seems more appropriate to follow the general tendency to
isolate English from other languages.
148
tel-0
0563
710,
ver
sion
1 -
7 Fe
b 20
11
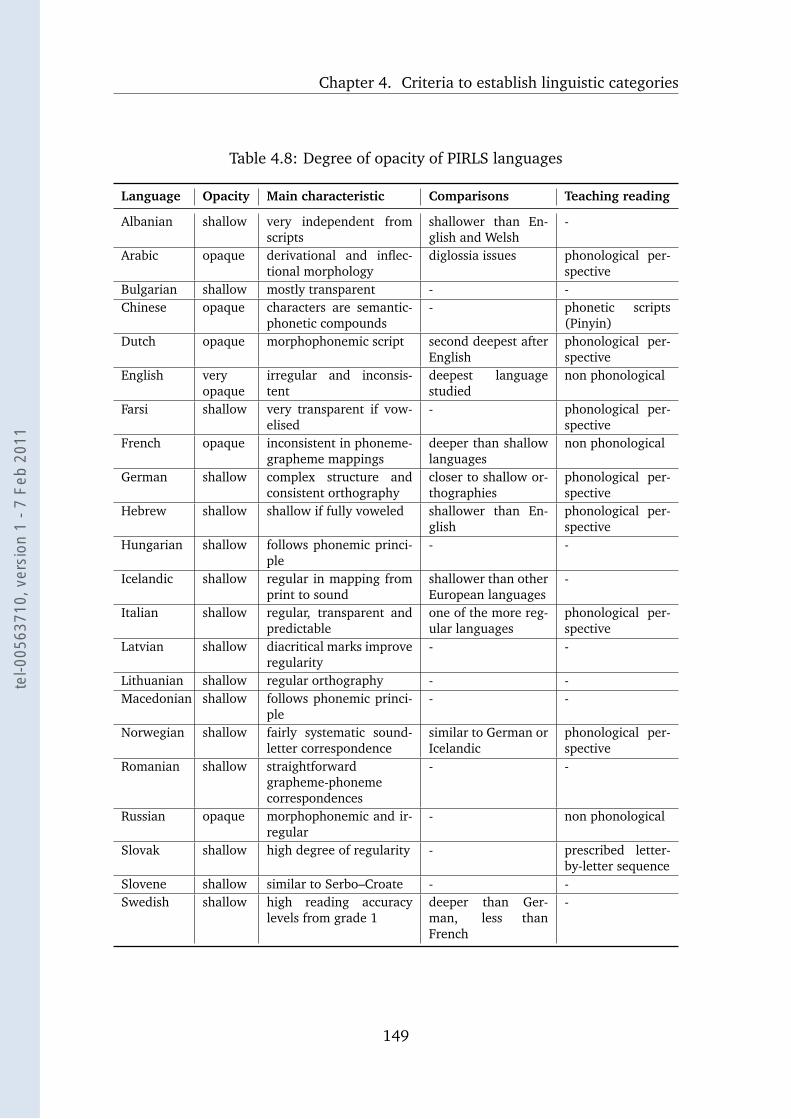
Chapter 4. Criteria to establish linguistic categories
Table 4.8: Degree of opacity of PIRLS languages
Language Opacity Main characteristic Comparisons Teaching reading
Albanian shallow very independent fromscripts
shallower than En-glish and Welsh
-
Arabic opaque derivational and inflec-tional morphology
diglossia issues phonological per-spective
Bulgarian shallow mostly transparent - -Chinese opaque characters are semantic-
phonetic compounds- phonetic scripts
(Pinyin)Dutch opaque morphophonemic script second deepest after
Englishphonological per-spective
English veryopaque
irregular and inconsis-tent
deepest languagestudied
non phonological
Farsi shallow very transparent if vow-elised
- phonological per-spective
French opaque inconsistent in phoneme-grapheme mappings
deeper than shallowlanguages
non phonological
German shallow complex structure andconsistent orthography
closer to shallow or-thographies
phonological per-spective
Hebrew shallow shallow if fully voweled shallower than En-glish
phonological per-spective
Hungarian shallow follows phonemic princi-ple
- -
Icelandic shallow regular in mapping fromprint to sound
shallower than otherEuropean languages
-
Italian shallow regular, transparent andpredictable
one of the more reg-ular languages
phonological per-spective
Latvian shallow diacritical marks improveregularity
- -
Lithuanian shallow regular orthography - -Macedonian shallow follows phonemic princi-
ple- -
Norwegian shallow fairly systematic sound-letter correspondence
similar to German orIcelandic
phonological per-spective
Romanian shallow straightforwardgrapheme-phonemecorrespondences
- -
Russian opaque morphophonemic and ir-regular
- non phonological
Slovak shallow high degree of regularity - prescribed letter-by-letter sequence
Slovene shallow similar to Serbo–Croate - -Swedish shallow high reading accuracy
levels from grade 1deeper than Ger-man, less thanFrench
-
149
tel-0
0563
710,
ver
sion
1 -
7 Fe
b 20
11
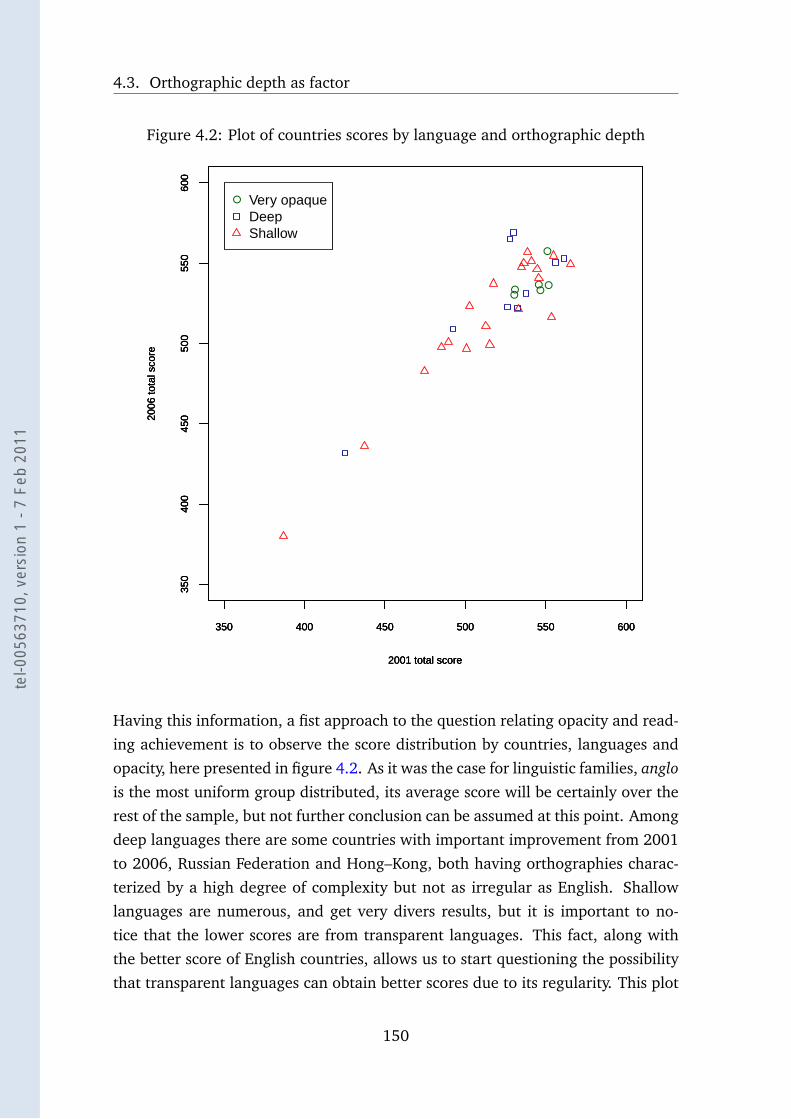
4.3. Orthographic depth as factor
Figure 4.2: Plot of countries scores by language and orthographic depth
●● ●
●
●
●
350 400 450 500 550 600
350
400
450
500
550
600
2001 total score
2006
tota
l sco
re
350 400 450 500 550 600
350
400
450
500
550
600
2001 total score
2006
tota
l sco
re
350 400 450 500 550 600
350
400
450
500
550
600
2001 total score
2006
tota
l sco
re
● Very opaqueDeepShallow
Having this information, a fist approach to the question relating opacity and read-
ing achievement is to observe the score distribution by countries, languages and
opacity, here presented in figure 4.2. As it was the case for linguistic families, anglois the most uniform group distributed, its average score will be certainly over the
rest of the sample, but not further conclusion can be assumed at this point. Among
deep languages there are some countries with important improvement from 2001
to 2006, Russian Federation and Hong–Kong, both having orthographies charac-
terized by a high degree of complexity but not as irregular as English. Shallow
languages are numerous, and get very divers results, but it is important to no-
tice that the lower scores are from transparent languages. This fact, along with
the better score of English countries, allows us to start questioning the possibility
that transparent languages can obtain better scores due to its regularity. This plot
150
tel-0
0563
710,
ver
sion
1 -
7 Fe
b 20
11
Chapter 4. Criteria to establish linguistic categories
indicates that transparent orthographies are not better in reading achievement
than the rest of the sample. Consequently, the possibility of a trace of the earlier
advantage of these languages in reading acquisition could be questioned by the
experience that will be carried out in this research.
151
tel-0
0563
710,
ver
sion
1 -
7 Fe
b 20
11
Chapter 5
Individual and school factors relatedto reading aspects
Following the research objectives from the section 3.4.3, the first four have been
accomplished: the identification of linguistics factor and the implementation of
variables representing them. The objective number five implies the inclusion of
these variables in a model that attempts to explain reading achievement which is
the task defined in the last objective (number eight). Before reaching that point,
it is necessary to do an analogous study of contextual factors, that correspond to
objectives six and seven. This chapters search to advance in objectives six and
seven by describing home and school determinants that play an important role
influencing the conditions in which reading learning is carried out. Only after
having a clear understanding of those determinants, an explanation of reading
achievement can be researched.
The starting points of this study are the factors which had already been identified,
specifically those considered by PIRLS as significant contextual elements. To re-
search the role they played in reading results, they were tested by means of the
questionnaires described in section 3.2.1.a. The aim of this chapter will be to in-
vestigate how those factors interact with reading achievement. However, since one
of our aims is to take advantage of the structure of PIRLS that allow the separate
observation of several aspects of reading, there will be a special emphasis placed
on this.
As described in sections 3.2.1.b and 3.2.1.c, the aspects considered were the pur-
poses of reading: literary and informative, and four comprehension levels summed
152
tel-0
0563
710,
ver
sion
1 -
7 Fe
b 20
11
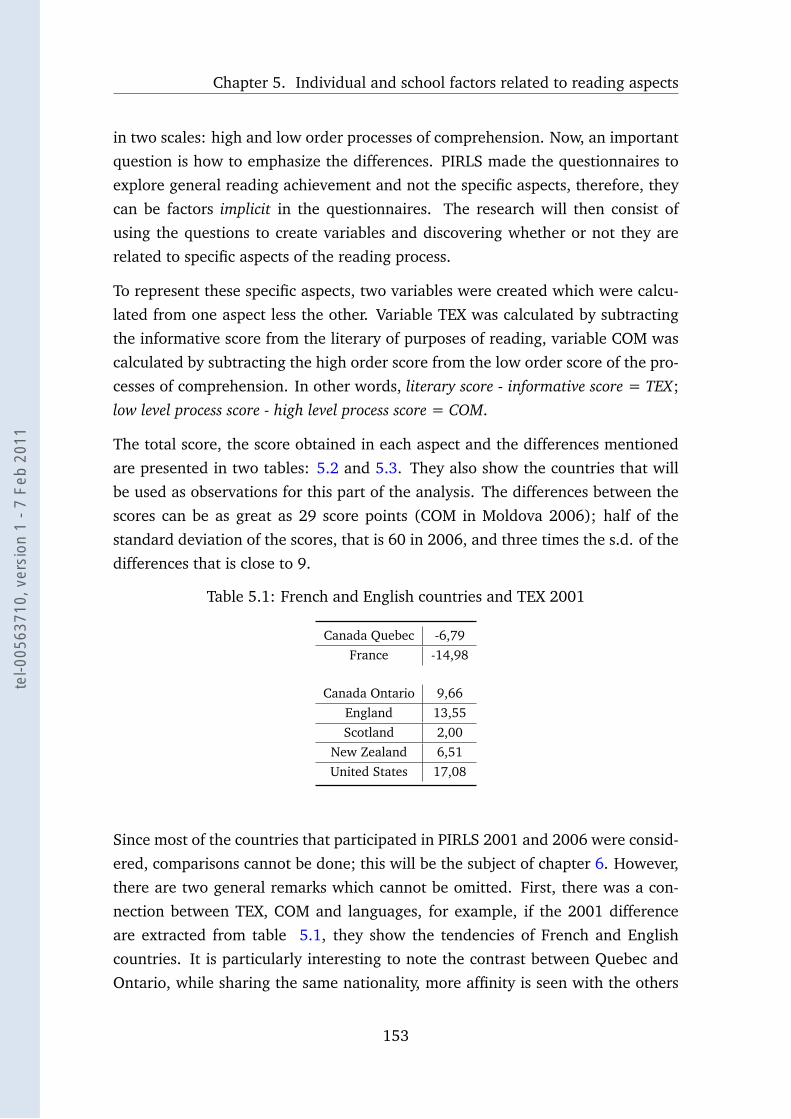
Chapter 5. Individual and school factors related to reading aspects
in two scales: high and low order processes of comprehension. Now, an important
question is how to emphasize the differences. PIRLS made the questionnaires to
explore general reading achievement and not the specific aspects, therefore, they
can be factors implicit in the questionnaires. The research will then consist of
using the questions to create variables and discovering whether or not they are
related to specific aspects of the reading process.
To represent these specific aspects, two variables were created which were calcu-
lated from one aspect less the other. Variable TEX was calculated by subtracting
the informative score from the literary of purposes of reading, variable COM was
calculated by subtracting the high order score from the low order score of the pro-
cesses of comprehension. In other words, literary score - informative score = TEX;
low level process score - high level process score = COM.
The total score, the score obtained in each aspect and the differences mentioned
are presented in two tables: 5.2 and 5.3. They also show the countries that will
be used as observations for this part of the analysis. The differences between the
scores can be as great as 29 score points (COM in Moldova 2006); half of the
standard deviation of the scores, that is 60 in 2006, and three times the s.d. of the
differences that is close to 9.
Table 5.1: French and English countries and TEX 2001
Canada Quebec -6,79France -14,98
Canada Ontario 9,66England 13,55Scotland 2,00
New Zealand 6,51United States 17,08
Since most of the countries that participated in PIRLS 2001 and 2006 were consid-
ered, comparisons cannot be done; this will be the subject of chapter 6. However,
there are two general remarks which cannot be omitted. First, there was a con-
nection between TEX, COM and languages, for example, if the 2001 difference
are extracted from table 5.1, they show the tendencies of French and English
countries. It is particularly interesting to note the contrast between Quebec and
Ontario, while sharing the same nationality, more affinity is seen with the others
153
tel-0
0563
710,
ver
sion
1 -
7 Fe
b 20
11
countries of the same language (case described in detail in section 4.1.1.c). Apart
from those two languages, Slavic and Arabic countries have also shown common
tendencies. One of the hypothesis, presented in the section 3.4.4.c, is related to
this: specific linguistic families could explain specific aspects of reading. For ex-
ample, the Anglo family may explain high order scores, since it seems to be related
to them (this was our second hypothesis: Languages, can have a different incidenceconcerning the aspects and components of the reading process, see 3.4.2). In addi-
tion, this link between aspects of reading and languages has been stated by several
researchers (see Sainsbury et al. (2004); Mullis & Martin (2004); Comparative Ed-
ucation Research Unit (2005); Rémond (2006)). This possibility will be confirmed
or denied when it is implemented a model, including families as determinants of
these specific scores.
The second feature of the differences TEX and COM is that, in several cases, they
were constant in time. Even if comparisons are not the theme of this chapter, it
is interesting to notice how the scores of some countries evolved. For example,
Honk Kong had a significant improvement of its general score but, in looking at
the difference between the scores, beside general progress, the country continued
to get better results in informative reading and high order processing. In contrast,
in 2006, England lost the literary advantage that it had in 2001, and Singapore
lost the informative advantage of 2001. These changes help to explain why their
results were not as good as in the first test. Other cases of consistency were France,
Iran, Norway, Hungary and the United States, all of which held the same tendency
in both assessments.
In summary, this chapter will study the connection of contextual factors with the
difference obtained from both aspects of reading considered in PIRLS assessment
structure. The method to be followed is to search for correlations between these
differences, TEX and COM, and the variables derived from the Students, Teachers
and School questionnaires. By measuring the estimate of Pearson product-moment
correlation squared, it is expected that factors will be discovered, which will have
the property of being associated specifically with one reading aspect (literary read-
ing, informative reading, low order processing of comprehension or high order
processing). Approximately 200 questions were analyzed one by one to determine
the coefficient of determination with the differences.
154
tel-0
0563
710,
ver
sion
1 -
7 Fe
b 20
11
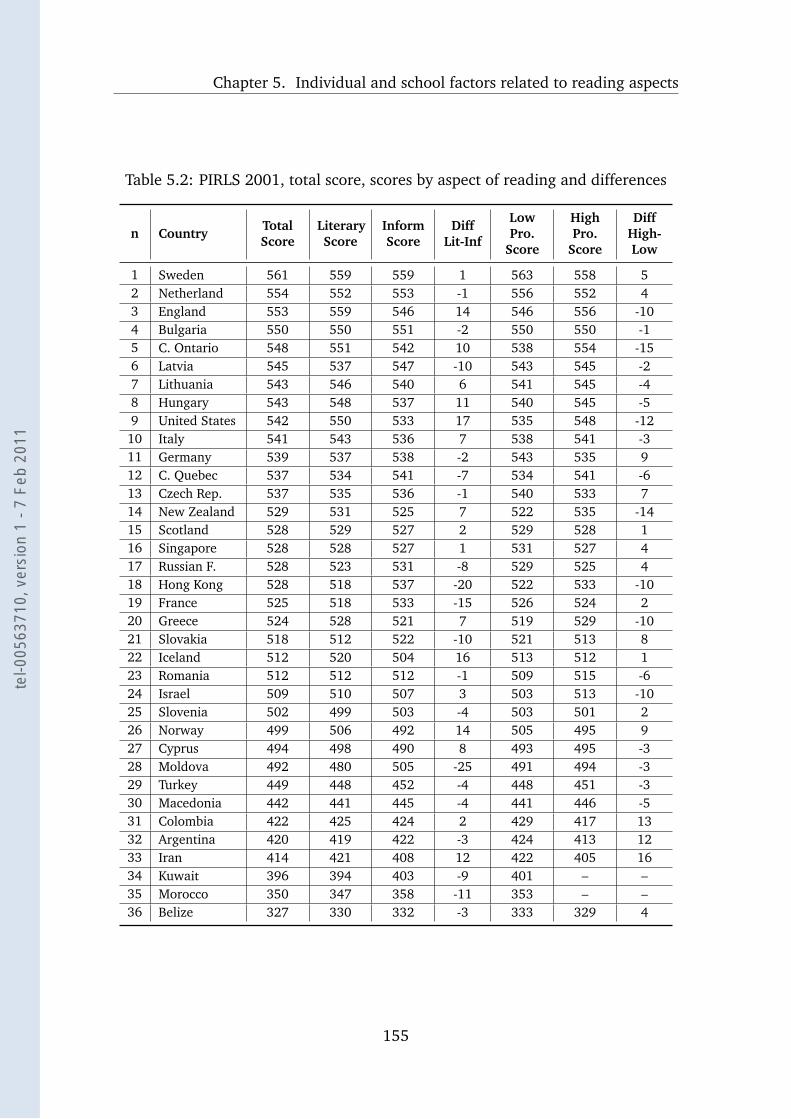
Chapter 5. Individual and school factors related to reading aspects
Table 5.2: PIRLS 2001, total score, scores by aspect of reading and differences
n CountryTotalScore
LiteraryScore
InformScore
DiffLit-Inf
LowPro.
Score
HighPro.
Score
DiffHigh-Low
1 Sweden 561 559 559 1 563 558 52 Netherland 554 552 553 -1 556 552 43 England 553 559 546 14 546 556 -104 Bulgaria 550 550 551 -2 550 550 -15 C. Ontario 548 551 542 10 538 554 -156 Latvia 545 537 547 -10 543 545 -27 Lithuania 543 546 540 6 541 545 -48 Hungary 543 548 537 11 540 545 -59 United States 542 550 533 17 535 548 -12
10 Italy 541 543 536 7 538 541 -311 Germany 539 537 538 -2 543 535 912 C. Quebec 537 534 541 -7 534 541 -613 Czech Rep. 537 535 536 -1 540 533 714 New Zealand 529 531 525 7 522 535 -1415 Scotland 528 529 527 2 529 528 116 Singapore 528 528 527 1 531 527 417 Russian F. 528 523 531 -8 529 525 418 Hong Kong 528 518 537 -20 522 533 -1019 France 525 518 533 -15 526 524 220 Greece 524 528 521 7 519 529 -1021 Slovakia 518 512 522 -10 521 513 822 Iceland 512 520 504 16 513 512 123 Romania 512 512 512 -1 509 515 -624 Israel 509 510 507 3 503 513 -1025 Slovenia 502 499 503 -4 503 501 226 Norway 499 506 492 14 505 495 927 Cyprus 494 498 490 8 493 495 -328 Moldova 492 480 505 -25 491 494 -329 Turkey 449 448 452 -4 448 451 -330 Macedonia 442 441 445 -4 441 446 -531 Colombia 422 425 424 2 429 417 1332 Argentina 420 419 422 -3 424 413 1233 Iran 414 421 408 12 422 405 1634 Kuwait 396 394 403 -9 401 – –35 Morocco 350 347 358 -11 353 – –36 Belize 327 330 332 -3 333 329 4
155
tel-0
0563
710,
ver
sion
1 -
7 Fe
b 20
11
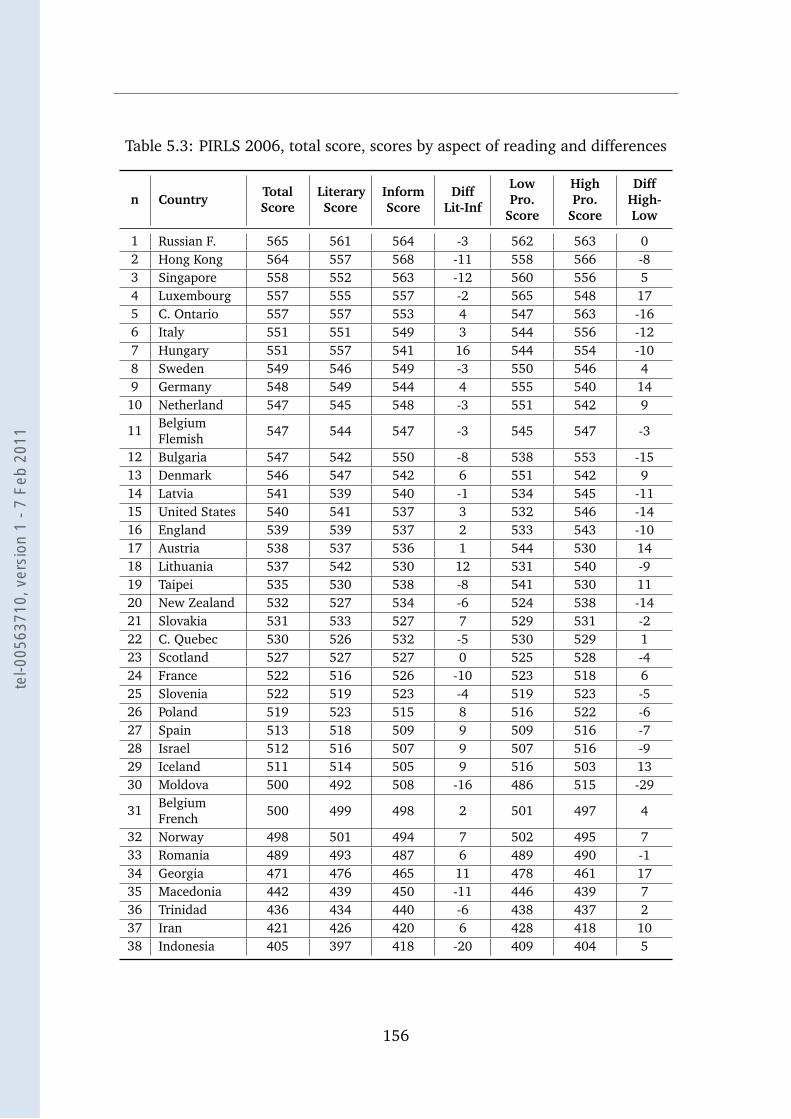
Table 5.3: PIRLS 2006, total score, scores by aspect of reading and differences
n CountryTotalScore
LiteraryScore
InformScore
DiffLit-Inf
LowPro.
Score
HighPro.
Score
DiffHigh-Low
1 Russian F. 565 561 564 -3 562 563 02 Hong Kong 564 557 568 -11 558 566 -83 Singapore 558 552 563 -12 560 556 54 Luxembourg 557 555 557 -2 565 548 175 C. Ontario 557 557 553 4 547 563 -166 Italy 551 551 549 3 544 556 -127 Hungary 551 557 541 16 544 554 -108 Sweden 549 546 549 -3 550 546 49 Germany 548 549 544 4 555 540 14
10 Netherland 547 545 548 -3 551 542 9
11 BelgiumFlemish
547 544 547 -3 545 547 -3
12 Bulgaria 547 542 550 -8 538 553 -1513 Denmark 546 547 542 6 551 542 914 Latvia 541 539 540 -1 534 545 -1115 United States 540 541 537 3 532 546 -1416 England 539 539 537 2 533 543 -1017 Austria 538 537 536 1 544 530 1418 Lithuania 537 542 530 12 531 540 -919 Taipei 535 530 538 -8 541 530 1120 New Zealand 532 527 534 -6 524 538 -1421 Slovakia 531 533 527 7 529 531 -222 C. Quebec 530 526 532 -5 530 529 123 Scotland 527 527 527 0 525 528 -424 France 522 516 526 -10 523 518 625 Slovenia 522 519 523 -4 519 523 -526 Poland 519 523 515 8 516 522 -627 Spain 513 518 509 9 509 516 -728 Israel 512 516 507 9 507 516 -929 Iceland 511 514 505 9 516 503 1330 Moldova 500 492 508 -16 486 515 -29
31 BelgiumFrench
500 499 498 2 501 497 4
32 Norway 498 501 494 7 502 495 733 Romania 489 493 487 6 489 490 -134 Georgia 471 476 465 11 478 461 1735 Macedonia 442 439 450 -11 446 439 736 Trinidad 436 434 440 -6 438 437 237 Iran 421 426 420 6 428 418 1038 Indonesia 405 397 418 -20 409 404 5
156
tel-0
0563
710,
ver
sion
1 -
7 Fe
b 20
11
Chapter 5. Individual and school factors related to reading aspects
5.1 PIRLS 2001
5.1.1 Reading objectives 2001
5.1.1.a Student Questionnaire
The answers to PIRLS’ questionnaires were analyzed in order to discover underling
high and low tendencies. The following themes studied in those questionnaires
were considered: attitudes and preferences in reading, learning methodologies,
evaluation, teaching models, and language characteristics. In particular, the stu-
dents’ questionnaire sought to describe reading attitudes, concepts about reading,
activities fostering literacy, habits at home, learning methodology, materials at
school, classroom environment and structure, economic resources at school and
at home, and some social and linguistic characteristics.
Because of the objectives of our research, the number of subjects taken into ac-
count was reduced, leaving out some economic aspects, like the use of comput-
ers in learning (that depends in resources) and other demographic characteristics
(sex, age, and origins). The result was a list of 63 questions from which two to six
variables were derived. For each one correlations were searched: with the total
score of the test, the difference between literary and informative score (TEX), and
the difference between high and low order of comprehension processes (COM).
After this, 33 variables derived from 23 questions were founded to be significantly
correlated to TEX (see Table A.1); the greater part (21) was positively related to
the literary advantage.
From these correlations, a description of two types of readers was deduced: the
one that answers better having a literary purpose, and the one that answers better
if the aim is informative.
On one hand, the literary readers showed particular habits at home and at school.
At home, they did not talk with friends about reading, speak the same language
at school and at home, have more than 100 books available. Regarding their
reading habits, they read stories or novels but never read news papers. At school,
they did not read aloud; neither to the whole class nor to small groups, and they
frequently read books chosen by they self; about his own abilities as reader, they
did not thought to be less competent than others.
157
tel-0
0563
710,
ver
sion
1 -
7 Fe
b 20
11
5.1. PIRLS 2001
On the other hand, the informative readers spoke a different language than the
one used at school, and had learned a second language before starting school. At
home, there were not many books available (less than 10), but the students often
listened to someone at home reading. At school, they often followed along while
others students read aloud, and after having read they answered questions aloud
and talked with other students abut what they had read.
Particular attention was paid to three variables because they were significantly
correlated to TEX and were not derived from direct questions but from indexes,which were constructed by PIRLS to summarize the information obtained combin-
ing a number of questions. The three indexes were: SATR student attitudes towardsreading, SRSC student reading self concept and HER home educational resources.
In fact, the first of them showed the higher correlation of this questionnaire with
TEX (SATR_low r=.48**). The index SATR gathered information about students’
agreement with the following statements: I read only if I have to, I like talking aboutbooks with other people, I would be happy if someone gave me a book as a present, Ithink reading is boring, and I enjoy reading. The index indicated a high, medium or
low attitude towards reading; a low value, that is, a negative attitude, was related
to an advantage in reading literary texts. This result was interesting because, when
analyzing each variable, they did not show significant correlations, excepts when
considered together. We have concluded that as this index has stated, there was a
correlation between the purposes of reading and the attitude of the reader.
The index student reading self concept (SRSC), showed a similar connection to
TEX; the individual questions that composed this index were not correlated, ex-
cept for one. In spite of this, a high value of this index was, in fact, correlated
to TEX (SRSC_high r=.37**). It summarized the agreement with the following
ideas: reading is very easy for me, I do not read as well as other students in my class(r=.30*), and reading aloud is very hard for me.
It was interesting that a positive SRSC_high, i.e. high reading self concept, and
a negative SATR_low, negative attitudes about reading, were both pointing in the
same direction, literary advantage. It was surprising, as a positive correlation be-
tween these two factors could be expected, that is, a high positive attitude towards
reading could be correlated to a high self-concept about reading capacities, but it
was the opposed. In fact, those two aspects were not necessarily in accord be-
cause they were not describing the same conduct. On one hand, the first index
158
tel-0
0563
710,
ver
sion
1 -
7 Fe
b 20
11
Chapter 5. Individual and school factors related to reading aspects
was composed of students’ opinions about reading, what reading meant for them
as an activity. On the other hand, the second variable indicated how children
felt when they were actually reading, what was happening within them at that
moment, independent of the answer to the former question. Therefore, it was cer-
tainly possible to think about a student who did not like to read, as a preferential
activity, but at the same time, not feeling feebler than others performing this task.
Moreover, this attitude can most likely be associated with a general self-confidence
in their capacities.
It was previously stated that economic factors were not included, an exception
was the last index, home educational resources (HER). Although it is not exactly
“economical” because it evaluated material resources, it include only those directly
related to educational aspects: availability of reading resources (number of booksin the home, daily newspaper); educational resources (computer, study table for ownuse, books of their own) and the parents’ education. The index included a number
of variables from parents questionnaire, which was not studied.
This index entailed that the children from families with few resources could ob-
tain better results in reading informative texts than literary ones. This assertion
was confirmed by the fact that all the variables derived from the original index
were significantly correlated to TEX (GPS_high, low, noGPS and GPS). This could
be explained by a predeterminism in which the literary world is too complex for
children having no access to culture or reading resources. However, it is preferable
to refer to another interpretation, that of the sociologist Bernard Lahire. Speaking
of the workers reading habits, he corroborates a tendency among them to prefer
“concrete” lectures, but for him, these practices are not just a consequence of the
work conditions or the social class but also: “c’est la volonté objective d’ancrage
des textes dans une autre réalité que la seule réalité textuelle : dans une configura-
tion pratique, dans un espace connu, vécu” (Lahire, 1993, p. 105). If we translate
this interpretation in the analysis, it can be said that the reading resources at
home were not only a cause but also a consequence of the reading home habits.
Furthermore, those habits reflected a particular way of life: “Ce goût pour les ou-
vrages qui expliquent les fonctionnements réels (physiques, naturels...) est très
lié à l’affinité pour des textes qui s’annulent comme tels pour énoncer le réel. Là
encore, il y a un intérêt profond pour des ‘choses vrais”’ (Lahire, 1993, p. 114). It
will be important to return to this hypothesis when the analysis of the PIRLS 2006
questionnaires are done.
159
tel-0
0563
710,
ver
sion
1 -
7 Fe
b 20
11
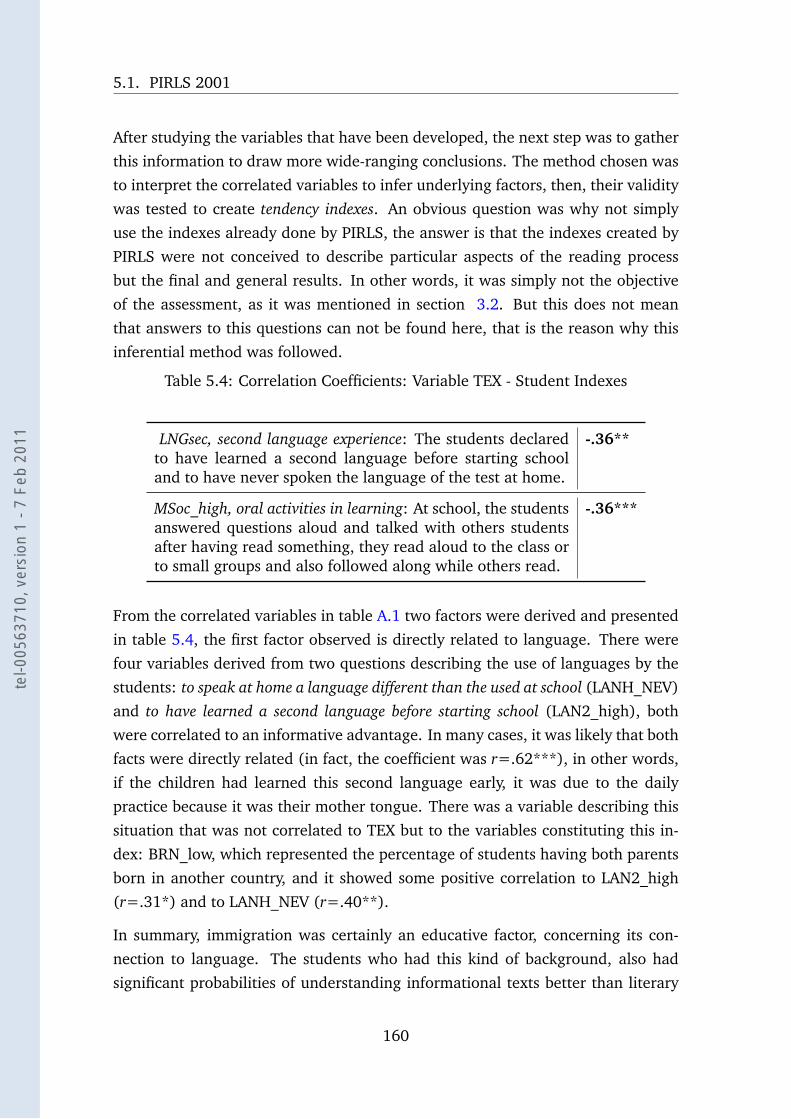
5.1. PIRLS 2001
After studying the variables that have been developed, the next step was to gather
this information to draw more wide-ranging conclusions. The method chosen was
to interpret the correlated variables to infer underlying factors, then, their validity
was tested to create tendency indexes. An obvious question was why not simply
use the indexes already done by PIRLS, the answer is that the indexes created by
PIRLS were not conceived to describe particular aspects of the reading process
but the final and general results. In other words, it was simply not the objective
of the assessment, as it was mentioned in section 3.2. But this does not mean
that answers to this questions can not be found here, that is the reason why this
inferential method was followed.
Table 5.4: Correlation Coefficients: Variable TEX - Student Indexes
LNGsec, second language experience: The students declaredto have learned a second language before starting schooland to have never spoken the language of the test at home.
-.36**
MSoc_high, oral activities in learning: At school, the studentsanswered questions aloud and talked with others studentsafter having read something, they read aloud to the class orto small groups and also followed along while others read.
-.36***
From the correlated variables in table A.1 two factors were derived and presented
in table 5.4, the first factor observed is directly related to language. There were
four variables derived from two questions describing the use of languages by the
students: to speak at home a language different than the used at school (LANH_NEV)
and to have learned a second language before starting school (LAN2_high), both
were correlated to an informative advantage. In many cases, it was likely that both
facts were directly related (in fact, the coefficient was r=.62***), in other words,
if the children had learned this second language early, it was due to the daily
practice because it was their mother tongue. There was a variable describing this
situation that was not correlated to TEX but to the variables constituting this in-
dex: BRN_low, which represented the percentage of students having both parents
born in another country, and it showed some positive correlation to LAN2_high
(r=.31*) and to LANH_NEV (r=.40**).
In summary, immigration was certainly an educative factor, concerning its con-
nection to language. The students who had this kind of background, also had
significant probabilities of understanding informational texts better than literary
160
tel-0
0563
710,
ver
sion
1 -
7 Fe
b 20
11
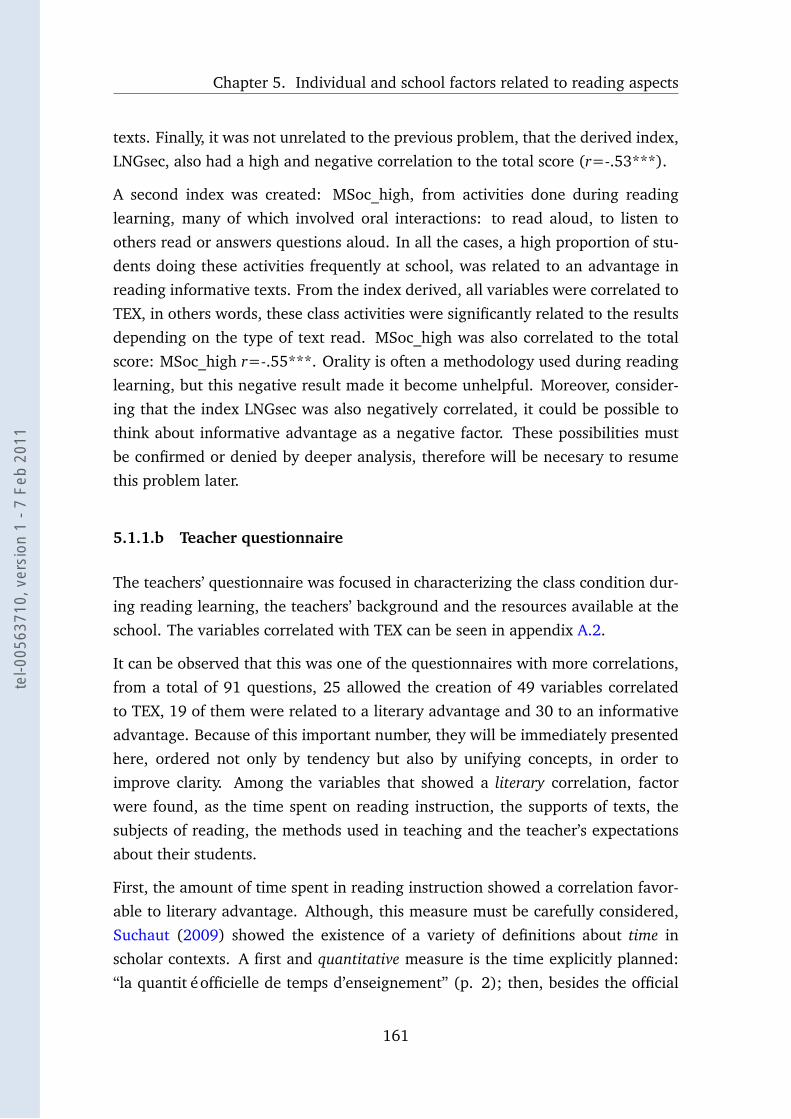
Chapter 5. Individual and school factors related to reading aspects
texts. Finally, it was not unrelated to the previous problem, that the derived index,
LNGsec, also had a high and negative correlation to the total score (r=-.53***).
A second index was created: MSoc_high, from activities done during reading
learning, many of which involved oral interactions: to read aloud, to listen to
others read or answers questions aloud. In all the cases, a high proportion of stu-
dents doing these activities frequently at school, was related to an advantage in
reading informative texts. From the index derived, all variables were correlated to
TEX, in others words, these class activities were significantly related to the results
depending on the type of text read. MSoc_high was also correlated to the total
score: MSoc_high r=-.55***. Orality is often a methodology used during reading
learning, but this negative result made it become unhelpful. Moreover, consider-
ing that the index LNGsec was also negatively correlated, it could be possible to
think about informative advantage as a negative factor. These possibilities must
be confirmed or denied by deeper analysis, therefore will be necesary to resume
this problem later.
5.1.1.b Teacher questionnaire
The teachers’ questionnaire was focused in characterizing the class condition dur-
ing reading learning, the teachers’ background and the resources available at the
school. The variables correlated with TEX can be seen in appendix A.2.
It can be observed that this was one of the questionnaires with more correlations,
from a total of 91 questions, 25 allowed the creation of 49 variables correlated
to TEX, 19 of them were related to a literary advantage and 30 to an informative
advantage. Because of this important number, they will be immediately presented
here, ordered not only by tendency but also by unifying concepts, in order to
improve clarity. Among the variables that showed a literary correlation, factor
were found, as the time spent on reading instruction, the supports of texts, the
subjects of reading, the methods used in teaching and the teacher’s expectations
about their students.
First, the amount of time spent in reading instruction showed a correlation favor-
able to literary advantage. Although, this measure must be carefully considered,
Suchaut (2009) showed the existence of a variety of definitions about time in
scholar contexts. A first and quantitative measure is the time explicitly planned:
“la quantité officielle de temps d’enseignement” (p. 2); then, besides the official
161
tel-0
0563
710,
ver
sion
1 -
7 Fe
b 20
11
5.1. PIRLS 2001
planning it is necessary to take into account the real educative time a qualitativemeasure which can differ from official: “la quantité d’instruction reçue par l’élève,
celle-ci pouvant différer de la précédente” (p. 2).
PIRLS have taken into account partially this distinction. In this questionnaire,
teachers had indicated the time explicitly designated in the scholar program to
work on reading, in hours and minutes. Then, teachers had indicated the time
spent on reading instruction regardless of whether or not it was formally sched-
uled. This was refered to as a partial description because it was not possible to
infer the real learning time from teacher’s judgments, an impartial description of
time could not be done. Consequently, these variables were actually the teachers’
evaluation of teaching time.
There were seven questions that described time distribution in reading activi-
ties, only two were significantly correlated on three variables (ATBGRINH, RINH,
FRIN). A particular characteristic of time variables was that none of them was re-
lated to the total score, in other words, more or less time for reading instruction
did not affect the general results.
The index (TIME_high, high proportion of time dedicated to reading) derived from
these variables was correlated to TEX: r=.43***, and had no connection to the
total score either. Nevertheless, it was not included in the analysis as its validity
seemed suspect since there was not enough mention about a tendency, particularly
in this case were many other variables were not correlated. This is the opposite
case of the index LNGsec, where the problem is the small quantity of variables
describing linguistic characteristics, but all had a coherent connection. However,
it will be important to think again about the role of this factor when developing a
deeper analysis.
The second group of variables referred to materials or support that teachers used
frequently during reading instruction: to work frequently with computer software,
on-line material, to use lectures from other subjects or a variety of children’s books.
They were also related to literary advantage. The key seems to be the concept of
variety, because this variables did not say anything about the purposes of reading,
difficulty levels or comprehension processes; they simply described different sup-
ports and explicitly refers to the plurality of them. The presence of computers as
learning media; even if not well represented enough to be an independent index,
can be see as a signal of this variety of resources to learn reading. Consequently,
162
tel-0
0563
710,
ver
sion
1 -
7 Fe
b 20
11
Chapter 5. Individual and school factors related to reading aspects
an index under the concept of variety was created, as seen in table 5.5, it was sig-
nificantly correlated to literary advantage and the total score: r=.31*. This means
that, if an amelioration of the literary score is researched, the use of a variety of
text will be suitable because this also helps with the total score.
Table 5.5: Correlation Coefficients: Variable TEX - Teacher Indexes
VATY_high, variety in materials: Teachers propose texts ofdifferent kind to the students during reading instruction:computer software, on-line reading materials, a variety ofchildren’s books and reading from other subjects.
.42**
CAAS_high, Concern about assessment: Teacher controllearning though classroom test, national and or regional ex-aminations and oral questioning.
-.40**
VOC_high, instruction in vocabulary: Teacher frequentlyteach vocabulary systematically and help the students withthe new vocabulary in texts.
-.40**
There are two others support that have shown a contrary tendency: one directly
related to informative reading as the use of children newspapers (RES3), and the
other describing the lack of a material, instead of its frequency: the fact of do not
using textbooks during reading instruction (noRES1), that was related to a literary
advantage.
An isolated variable, with a literary advantage was directly related to the objective
of reading: to frequently reading long fictional books (TXT3). This connection
can be see as obvious, although many other variables describing the purpose of
lecture were tested, there were no other significant result. Moreover, in describing
the results related to informative reading, some contradictions will be mentioned
which are difficult to interpret.
In connection to the activities during reading instruction, there were two related to
a literary advantage: the teacher use to read aloud to the class and gives time to readbooks of the students own choosing. It was difficult to create an index from them,
as they represented very different activities, moreover the first one was focused on
the teacher and the second on the students. For this reason it has been preferable
not to draw out generalizations.
Finally, in relation to the literary texts, a last isolated variable was the teachers’
163
tel-0
0563
710,
ver
sion
1 -
7 Fe
b 20
11
5.1. PIRLS 2001
answers to the question: About how many students in this class do you expect willgrow up to be good readers?, all derived variables were significant. GOOD_high
which indicated the percentage of teachers who believed that more than a half
of their students will be good readers was the variable more correlated to TEX
(r=.61***), the second largest correlation was its opposite: GOOD_low which
indicated the percentage of teachers who believed that less than a half of their
students will be good readers (r=-.53***). Consequently teachers’ beliefs were an
important factor in connection to the difference between types of texts. However
these variable were not correlated to the total score; if this connection is true, this
means that the TEX difference is influenced by a highly subjective aspect of the
instructional process. This possibility will have to be further researched later.
Now, variables and factors related to informative reading will be described. Some
factors already mentioned were also correlated to this type of reading, such as
reading subjects and methods of teaching. Moreover, there were new factors such
as the assessment systems and the emphasis on vocabulary.
First, an isolated variable described organization: to frequently develop reading in-struction as a whole class activity, this was favorable to an informative advantage.
Regretfully there were not other significant information about other ways of or-
ganizing the class, such as mixed ability group, same ability groups or individual
attention to students.
Previously, some contradictions about variables representing purposes of read-
ing were mentioned. Here, a variable related to informative advantage was the
low frequency of lectures such as descriptions, explanations, charts, diagrams and
graphs. Thus, the absence of non–fictional lectures cannot be related to the im-
provement of informational reading, but was probably related, more generally, to
a low reading ability. This is why it was preferable not to draw any conclusion
about these variables, moreover, the high frequency of poetry reading, appeared
as related to an informative advantage. Those contradictory results were probably
related with the level of observations in this analysis, (countries) too general to
observe details, and must be reconsidered when developing a deeper analysis.
Three variables related to reading evaluation were correlated to TEX, two of them
described the scope emphasized by the teacher: national exams and classroom
tests. Both have been considered as having little in common because of this dif-
ference in the scale. However, what was considered as the similarity was that they
164
tel-0
0563
710,
ver
sion
1 -
7 Fe
b 20
11
Chapter 5. Individual and school factors related to reading aspects
expressed a general concern about assessment, like the third variable, the high
frequency of oral questioning. From this trio, an index was created under the con-
cept of a high concern. In table 5.5, CAAS_high represent the high frequency of
those variables, and it was related to an advantage in reading informative texts.
The index also had a negative correlation with the total score, even if it is not very
significant r=-.31*.
The third variable about evaluation is oral questioning, it was also related to one
of the indexes created from the students questionnaire, Msoc, as the components
of this index, oral questioning was an act of socialization of knowledge. There was
a second variable, not mentioned yet, which was also interpreted in this sense:
the frequency of students reading aloud during instruction. This last was the same
question discovered in the students questionnaire, now, asked to the teachers, it
was also related to an informative advantage. Therefore, going beyond the limits
of each questionnaire, these two variables were added to the index, which has
increased the correlation with TEX (r=-.39**) and also with the total score (r=-
.49***).
Finally, a third index was created starting from two variables related to vocabulary,
they were referred to: frequency of systematic study of new vocabulary and empha-sis in studying the new vocabulary that students encounter while reading. This time
an index with only two variables was created, as those were the only two asking
about vocabulary in this questionnaire. Table 5.5, shows that this is also an in-
dex describing an informative advantage; there was not correlation with the total
score.
In connection with literary advantage, there were three activities developed during
reading instruction: the students read aloud daily and the teacher helped them
with new vocabulary systematically, particularly from the text they were reading.
It is interesting that the high frequency of teacher reading to the class was related
to literary reading and this one to informative reading, this can be interpreted as
two opposite methods during instruction. One more focused on teacher and the
other on students, regretfully there were not more significant variables to study
this possibility.
165
tel-0
0563
710,
ver
sion
1 -
7 Fe
b 20
11
5.1. PIRLS 2001
5.1.1.c School questionnaire
In this last questionnaire, from the original 59 questions that were analyzed, a to-
tal of 50 variables were correlated to TEX, derived from 27 questions; 27 of which
had a literary correlation and 23 had an informative correlation. The correlated
variables can be observed in appendix A.3. Although this was the shorter ques-
tionnaire, it had as many correlations as the others. One of the reasons was the
presence of many questions whose derived variables were all or almost all signifi-
cant. There were also a set of variables having more derived variables (six instead
of four), they described the moment in which the instruction of some aspect of
reading has begun, these variables are very important in the study of the reading
components.
Starting to interpret, it can be observed that schools having few children speaking
other language and having economically affluent homes, were schools having bet-
ter literary scores. At those schools there was a concern about national standards,
they had their own statement for instruction, programs adapted by levels and pro-
grams to help teachers in this task, who were themselves highly satisfied with their
job and had high expectations of the students’ achievement. The students also had
a high level of desire to do well, and they took care of school property and they
were highly supported by their parents. On the other hand, their wishes were not
considered in curriculum or methodology. The principal’s perception of the school
climate was good 1. Finally and more directly linked to what is learned during
reading instruction, the literary advantage was related to an early study of the
letters of the alphabet, the relationship sound-letter, making generalizations and
inferences, and describing style and the structure of text.
Now, in analyzing literary variables, it was possible to construct indexes from this
information, but was first necessary to observe the variables that remained iso-
lated. In first place, there were two variables indicating the economic level of the
student’s homes. This can be interpreted following the same line that we already
did, in connection to the students index of home resources, in which case a low
availability of materials to improve reading was related to an advantage in read-
ing informative texts. Here, a high proportion of homes which were economically
affluent and a low proportion of homes which were economically disadvantaged
were related to a literary advantage. Again, a correlational interpretation can
1As a side note, it must be remembered that is the principal who answer this questionnaire.
166
tel-0
0563
710,
ver
sion
1 -
7 Fe
b 20
11
Chapter 5. Individual and school factors related to reading aspects
be made, if literary reading was easier for these children it was because their
daily life context was affluent economically; inversely, if they daily life contexts
were more affluent, this was a consequence of having developed this kind of read-
ing. In others words, the literary reading was, at the same time, cause and ef-
fect of the home resources related to the literacy habits. This kind of reading
was more present in the family and parents’ work may be related to reading, be-
cause, as Lahire pointed out in connection with professional situation: “[elle] joue
comme une sorte de filtre permettant de laisser ‘passer’ certaines compétences
et réduisant considérablement la probabilité d’apparition de telles autres compé-
tences” (Lahire, 1993, p. 57–58). Moreover, we can add that the children educated
in these kind of schools had already developed a literary reading advantage; they
will have a greater chance of building affluent homes in the future.
The variable noPSS2, which indicated a high proportion of schools with more than
half of the students coming from affluent homes, was correlated to two other sig-
nificant variables: the students regard for school property (r with noPSS2 of .35**),
and the good school environment (r=.42***). The connection among these three
variables did not seem strong enough to create an index, as the first was purely
economic, the second referred to students’ behavior and the third was it–self an
index based on other variables. However the connection can be a consequence of
this economical advantage, as this can improve the general environment.
Table 5.6: Correlation Coefficients: Variable TEX - School Index
SUBm_high, Wishes: High teacher job satisfaction and expec-tation about students, high parental support and studentsdesire to do well.
.51***
CDAS_high, curriculum development at the school: At theschool there are : programs for teachers to improve read-ing instruction, ones own written statement of reading cur-riculum, different programs implemented for different lev-els, and an influence on curriculum of national standards.
.39**
EREL_l, Early learning of reading skills: Schools where beforefourth grade is done the instruction of aspects of the read-ing process: letter identification, letters-sound connections,generalization and description of the style of the texts.
.38**
The first school index considered totally subjective aspects as wishes, expectation
167
tel-0
0563
710,
ver
sion
1 -
7 Fe
b 20
11
5.1. PIRLS 2001
and desires. In table 5.6 this factor shows the higher correlation to TEX, favor-
able to literary advantage. Moreover, a low result in this index, which means low
expectation and wishes, was related to an informative advantage (r=-0.44***).
SUBm_high can be connected with the expectations of teachers (GOOD) about
their students, which was the variable having greater correlation to TEX in the
teachers’ questionnaire. In fact, it was also highly correlated to this index: GOOD_high
and SUBm_high r=.59***. Just like the teachers’ variable, this index has had no
connection with the total score. Finally it must be mentioned that this index only
takes 34 countries into account, because Israel and England did not answer those
questions.
Another group of variables, apparently connected to each other, was that of the
questions regarding the curriculum and programs organization, also favorable to
literary advantage. They were translated into an index of involvement of the
school members in tasks of curricula and programs development. The students
had read better literary text when their school had created their own statement
of reading curriculum, implemented programs differentiated by levels, when there
were programs for teachers to improve their quality and if there was also a concern
about national and regional standards. As it can be observed, the correlation was
not as high as the previous index but it is still significant, moreover the correlation
with the total score was also absent.
The last index included four variables representing different literacy skills, and the
moment in which they were learned at the school. The skills were very different
in level of complexity, as to know letters and to describe style. Yet, it must be
remembered that, depending on methodology, a simple task like knowing letters
and connecting them with sounds can be the first priority in a phonemic approach.
Although here, the early development of reading skills lead to literary advantage,
they had in common the fact of having been learned before the year of testing.
Moreover, the questions about these aspects of reading were organized by order
of complexity, therefore, it is not irrelevant that the two first and the last two
variables of the list were the ones correlated to TEX. The cause can be that they
represent opposite limits of this complexity or that the answers were more explicit
than the others. In any case, the explicability of this factor will be reconsidered
later. Finally, it must be mentioned that there was a positive correlation with the
total score: r=.37**.
On the other side of the tendencies, the score was higher in reading informa-
168
tel-0
0563
710,
ver
sion
1 -
7 Fe
b 20
11
Chapter 5. Individual and school factors related to reading aspects
tive texts, if at the school, more than 50% of the children were not speaking the
language of the test as first language, if the school organized classes based on
students’ abilities and the same program was implemented for all students at the
same level; if there was only a few students receiving remedial reading instruction
in the language of the test. In connection to the materials used in teaching read-
ing, the texts books were basic for instruction, such as newspapers and children’
magazines. On the contrary, reading series and material from other areas were
not used. Regarding the reading competencies, the only one related to an infor-
mative advantage was to learn to make predictions about texts in the same year
of the test. Finally, it was connected with an informative advantage the factor par-ents’ wishes having a lot of influence in curriculum and a low index of home-schoolinvolvement.
These results did not show enough regularity to create indexes. However, there
were some aspects already mentioned in describing the previous questionnaires,
which occurrence here is interesting.
First of all, in the student questionnaire, there was a series of linguistic variables:
the percentage of students speaking a second language before the beginning of
school and three variables describing the frequency of speaking the language of
the test at home. Here, there was a variable indicating a high percentage of chil-
dren that did not speak the language of the test as their fist language. These
four variables were all correlated: the early learning of a second language was
correlated to having another language as first language (r=.49***), this last was
correlated to never speak the language of the test at home (r=.83***), if the
children had declared speaking this language only sometimes the correlation was
textitr=.86***. In analyzing the student’s questionnaire, index LNGsec was cre-
ated, combining these two variables. Now this new variable can be included in the
index to improve it.
Another variable that described the factor of second language, was the question
asking for the percentage of students receiving remedial reading instruction in thelanguage of the test. However, it did not indicate if this was or not the first language
of the students. Later, in 2006 questionnaires, this question was discarded.
The use of newspapers was also a significant variable in the teacher’s question-
naire, as the absence of this kind of reading in the student’s questionnaire, conse-
quently it can be concluded that the use of this reading material made a difference
169
tel-0
0563
710,
ver
sion
1 -
7 Fe
b 20
11
5.1. PIRLS 2001
in connection to informative reading. Although likely, as the teacher and school
variables showed, the high frequency of this media was related negatively to the
general score. Different explanations can be supposed for this last result, for ex-
ample, maybe there was no other media available apart from newspapers and
magazines, or this was a more common reading among struggling readers, or this
media simply did not have impact on general reading learning. In any case, a
deeper study is necessary.
5.1.1.d Linear regression model
The study of correlations and the inference indexes is only a first step to describing
interactions among the reading processes and the factors that can explain its as-
pects. Nevertheless, even if this is a very general and wide–ranging point of view,
this part of the analysis would not be complete if we did not try to explain the way
in which those factors were related to our dependent variables.
Following the hypothesis presented in section 3.4.4.c, an ideal model should con-
sider at least one linguistic family as predictor, along will factors representing
aspects of the student, the teacher and the school. Since, at the moment, 36 coun-
tries are the observations, only a simple linear regression can be tested. Obviously,
the range of any interpretation will be very limited, but it will allow us to establish
some orientations to more accurate descriptions.
To elaborate a model, the first step was to study the connections among TEX and
the linguistic families that were previously determined. There, only the Slavic
and the Anglo families were significantly correlated to TEX (around 40%), the
correlation of the Slavic family was favorable to informative advantage while the
correlation of the Anglo family was favorable to literary advantage. Two regres-
sions were created using those families as the only predictors, the models were
significant and the Slavic family fit to explain a slightly bigger proportion of the
variance (R2 .19 compared to the R2 .17 of Anglo) and it had, also, a bigger F
value (F test = 7.99 compared to 6.74). Thus, statistically the Slavic family was a
better candidate to be part of a model.
Secondly, the possibility of including one of the indexes derived from the students’
questionnaire was considered. MSoc_high, The factor that represented the oralactivities developed during learning, was not significant, in joining it to both mod-
els, its estimated parameter was not different from zero, and a reduction of the
170
tel-0
0563
710,
ver
sion
1 -
7 Fe
b 20
11
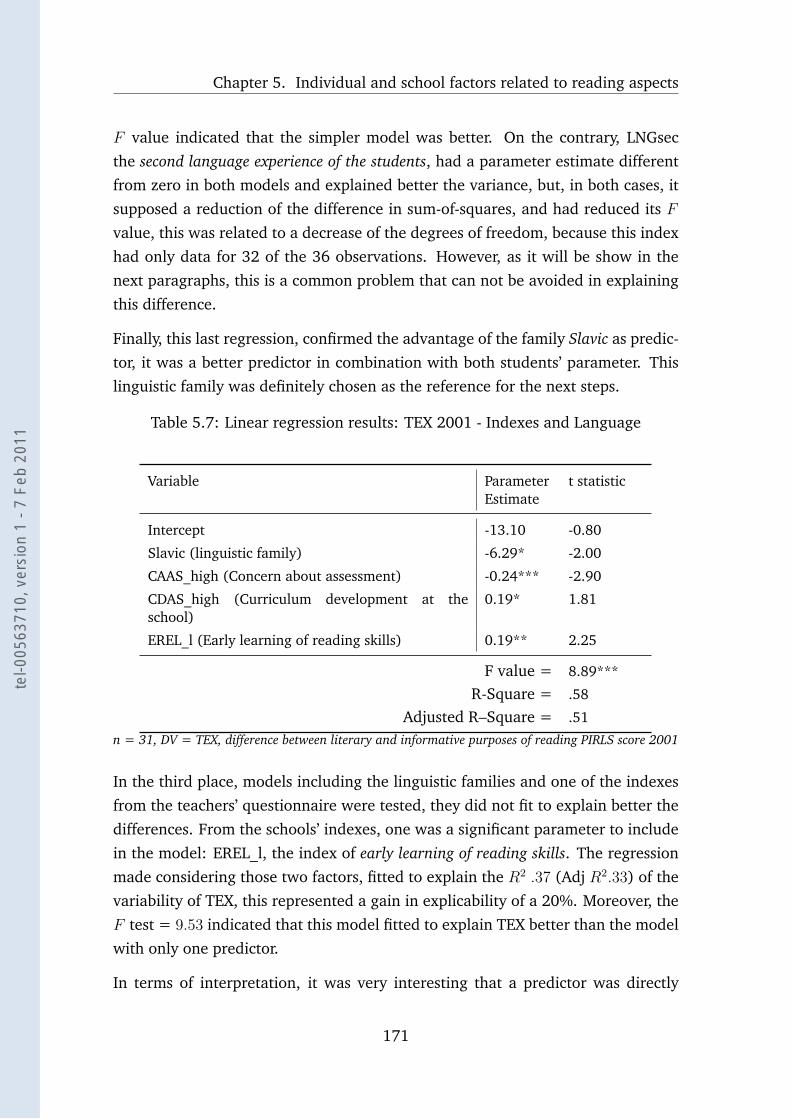
Chapter 5. Individual and school factors related to reading aspects
F value indicated that the simpler model was better. On the contrary, LNGsec
the second language experience of the students, had a parameter estimate different
from zero in both models and explained better the variance, but, in both cases, it
supposed a reduction of the difference in sum-of-squares, and had reduced its F
value, this was related to a decrease of the degrees of freedom, because this index
had only data for 32 of the 36 observations. However, as it will be show in the
next paragraphs, this is a common problem that can not be avoided in explaining
this difference.
Finally, this last regression, confirmed the advantage of the family Slavic as predic-
tor, it was a better predictor in combination with both students’ parameter. This
linguistic family was definitely chosen as the reference for the next steps.
Table 5.7: Linear regression results: TEX 2001 - Indexes and Language
Variable ParameterEstimate
t statistic
Intercept -13.10 -0.80
Slavic (linguistic family) -6.29* -2.00
CAAS_high (Concern about assessment) -0.24*** -2.90
CDAS_high (Curriculum development at theschool)
0.19* 1.81
EREL_l (Early learning of reading skills) 0.19** 2.25
F value = 8.89***
R-Square = .58
Adjusted R–Square = .51
n = 31, DV = TEX, difference between literary and informative purposes of reading PIRLS score 2001
In the third place, models including the linguistic families and one of the indexes
from the teachers’ questionnaire were tested, they did not fit to explain better the
differences. From the schools’ indexes, one was a significant parameter to include
in the model: EREL_l, the index of early learning of reading skills. The regression
made considering those two factors, fitted to explain the R2 .37 (Adj R2.33) of the
variability of TEX, this represented a gain in explicability of a 20%. Moreover, the
F test = 9.53 indicated that this model fitted to explain TEX better than the model
with only one predictor.
In terms of interpretation, it was very interesting that a predictor was directly
171
tel-0
0563
710,
ver
sion
1 -
7 Fe
b 20
11
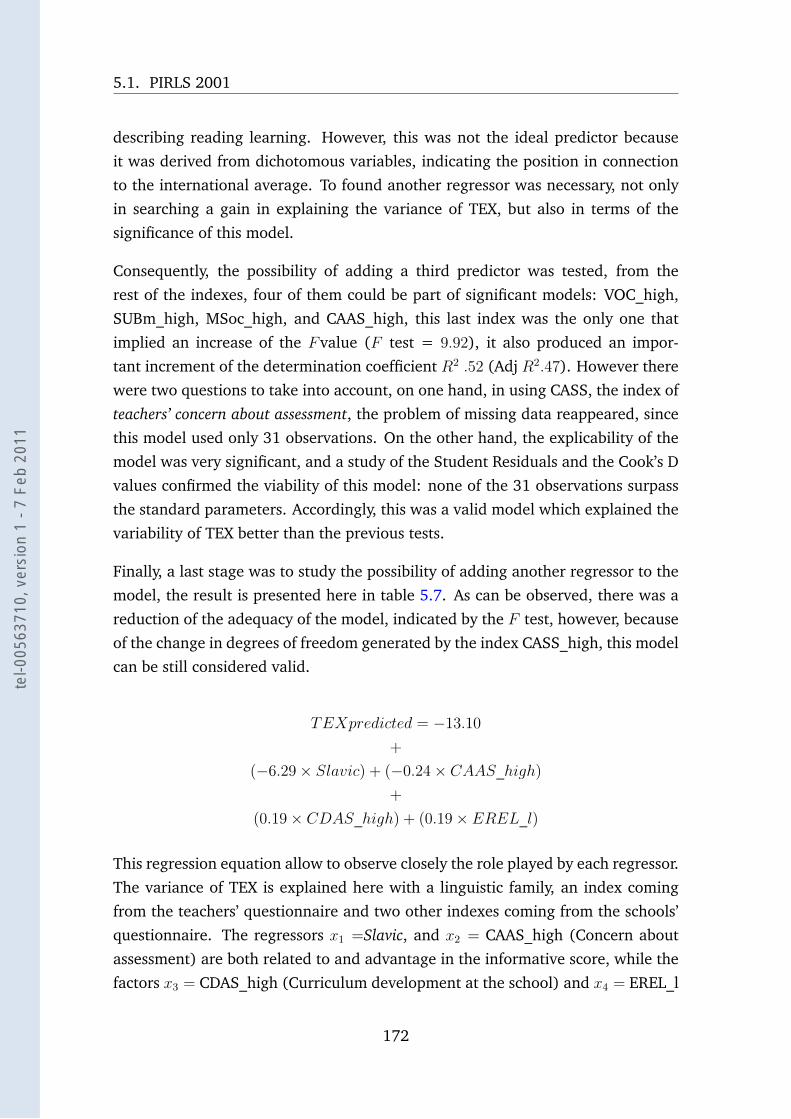
5.1. PIRLS 2001
describing reading learning. However, this was not the ideal predictor because
it was derived from dichotomous variables, indicating the position in connection
to the international average. To found another regressor was necessary, not only
in searching a gain in explaining the variance of TEX, but also in terms of the
significance of this model.
Consequently, the possibility of adding a third predictor was tested, from the
rest of the indexes, four of them could be part of significant models: VOC_high,
SUBm_high, MSoc_high, and CAAS_high, this last index was the only one that
implied an increase of the Fvalue (F test = 9.92), it also produced an impor-
tant increment of the determination coefficient R2 .52 (Adj R2.47). However there
were two questions to take into account, on one hand, in using CASS, the index of
teachers’ concern about assessment, the problem of missing data reappeared, since
this model used only 31 observations. On the other hand, the explicability of the
model was very significant, and a study of the Student Residuals and the Cook’s D
values confirmed the viability of this model: none of the 31 observations surpass
the standard parameters. Accordingly, this was a valid model which explained the
variability of TEX better than the previous tests.
Finally, a last stage was to study the possibility of adding another regressor to the
model, the result is presented here in table 5.7. As can be observed, there was a
reduction of the adequacy of the model, indicated by the F test, however, because
of the change in degrees of freedom generated by the index CASS_high, this model
can be still considered valid.
TEXpredicted = −13.10
+
(−6.29 × Slavic) + (−0.24 × CAAS_high)
+
(0.19 × CDAS_high) + (0.19 × EREL_l)
This regression equation allow to observe closely the role played by each regressor.
The variance of TEX is explained here with a linguistic family, an index coming
from the teachers’ questionnaire and two other indexes coming from the schools’
questionnaire. The regressors x1 =Slavic, and x2 = CAAS_high (Concern about
assessment) are both related to and advantage in the informative score, while the
factors x3 = CDAS_high (Curriculum development at the school) and x4 = EREL_l
172
tel-0
0563
710,
ver
sion
1 -
7 Fe
b 20
11
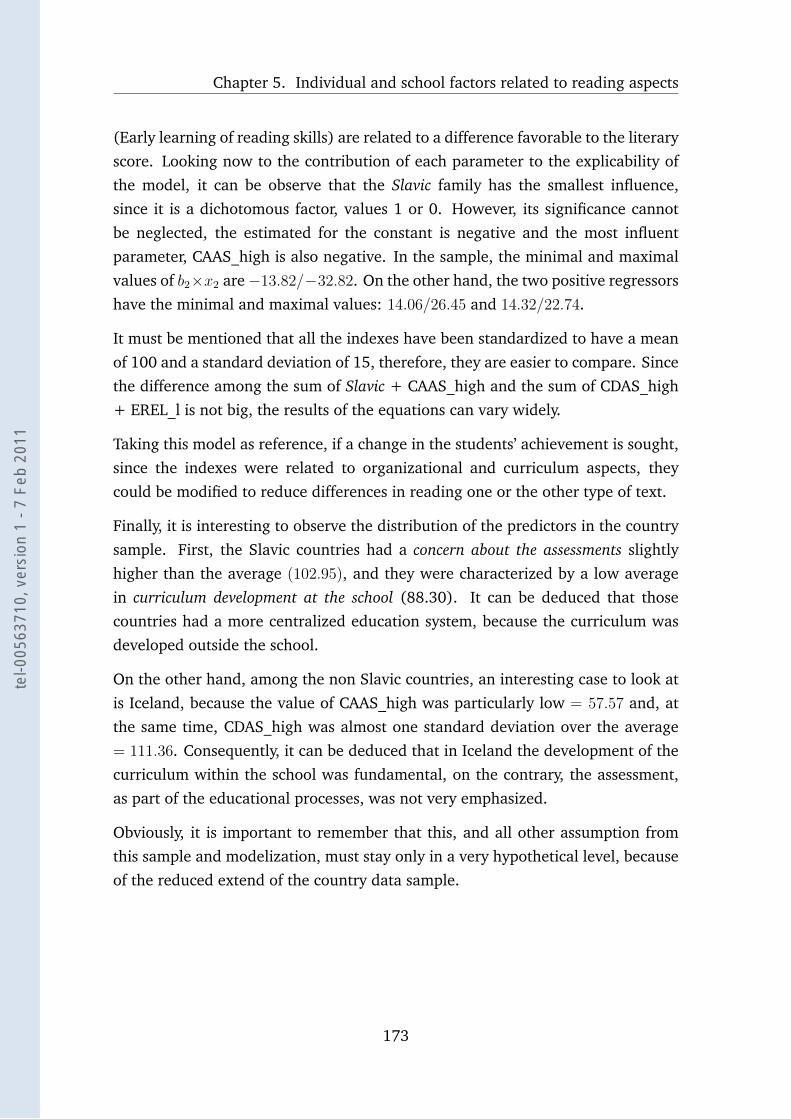
Chapter 5. Individual and school factors related to reading aspects
(Early learning of reading skills) are related to a difference favorable to the literary
score. Looking now to the contribution of each parameter to the explicability of
the model, it can be observe that the Slavic family has the smallest influence,
since it is a dichotomous factor, values 1 or 0. However, its significance cannot
be neglected, the estimated for the constant is negative and the most influent
parameter, CAAS_high is also negative. In the sample, the minimal and maximal
values of b2×x2 are −13.82/−32.82. On the other hand, the two positive regressors
have the minimal and maximal values: 14.06/26.45 and 14.32/22.74.
It must be mentioned that all the indexes have been standardized to have a mean
of 100 and a standard deviation of 15, therefore, they are easier to compare. Since
the difference among the sum of Slavic + CAAS_high and the sum of CDAS_high
+ EREL_l is not big, the results of the equations can vary widely.
Taking this model as reference, if a change in the students’ achievement is sought,
since the indexes were related to organizational and curriculum aspects, they
could be modified to reduce differences in reading one or the other type of text.
Finally, it is interesting to observe the distribution of the predictors in the country
sample. First, the Slavic countries had a concern about the assessments slightly
higher than the average (102.95), and they were characterized by a low average
in curriculum development at the school (88.30). It can be deduced that those
countries had a more centralized education system, because the curriculum was
developed outside the school.
On the other hand, among the non Slavic countries, an interesting case to look at
is Iceland, because the value of CAAS_high was particularly low = 57.57 and, at
the same time, CDAS_high was almost one standard deviation over the average
= 111.36. Consequently, it can be deduced that in Iceland the development of the
curriculum within the school was fundamental, on the contrary, the assessment,
as part of the educational processes, was not very emphasized.
Obviously, it is important to remember that this, and all other assumption from
this sample and modelization, must stay only in a very hypothetical level, because
of the reduced extend of the country data sample.
173
tel-0
0563
710,
ver
sion
1 -
7 Fe
b 20
11
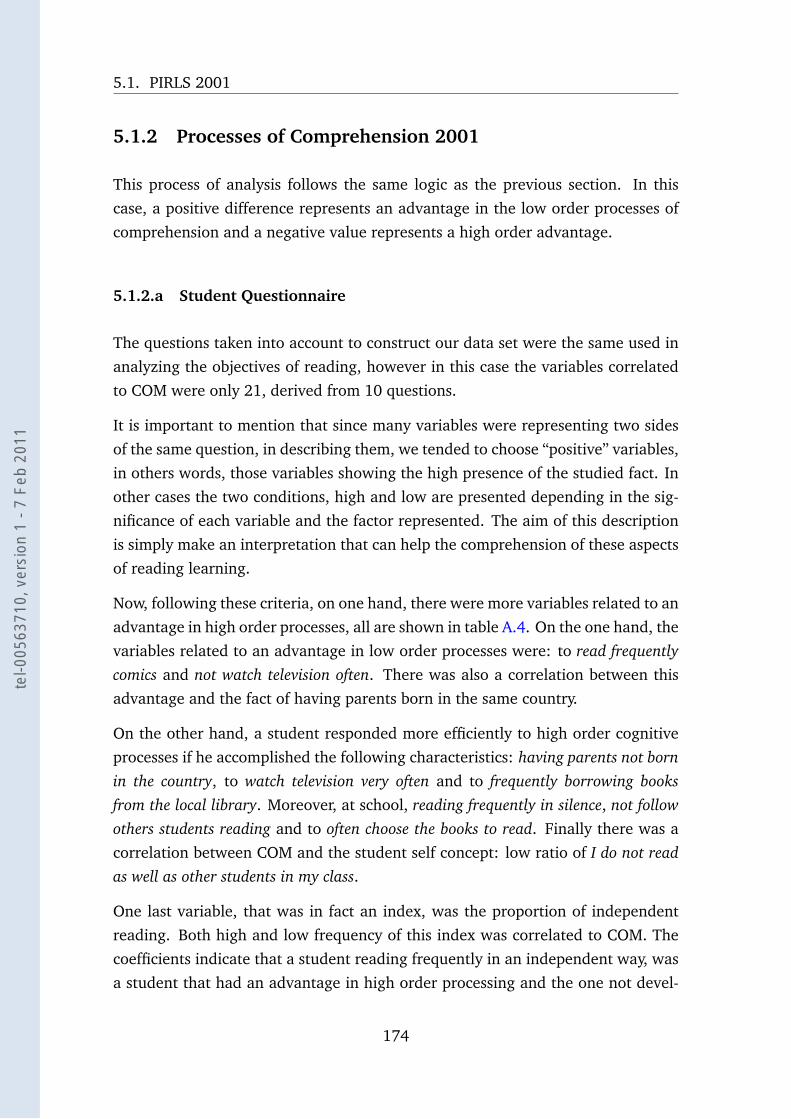
5.1. PIRLS 2001
5.1.2 Processes of Comprehension 2001
This process of analysis follows the same logic as the previous section. In this
case, a positive difference represents an advantage in the low order processes of
comprehension and a negative value represents a high order advantage.
5.1.2.a Student Questionnaire
The questions taken into account to construct our data set were the same used in
analyzing the objectives of reading, however in this case the variables correlated
to COM were only 21, derived from 10 questions.
It is important to mention that since many variables were representing two sides
of the same question, in describing them, we tended to choose “positive” variables,
in others words, those variables showing the high presence of the studied fact. In
other cases the two conditions, high and low are presented depending in the sig-
nificance of each variable and the factor represented. The aim of this description
is simply make an interpretation that can help the comprehension of these aspects
of reading learning.
Now, following these criteria, on one hand, there were more variables related to an
advantage in high order processes, all are shown in table A.4. On the one hand, the
variables related to an advantage in low order processes were: to read frequentlycomics and not watch television often. There was also a correlation between this
advantage and the fact of having parents born in the same country.
On the other hand, a student responded more efficiently to high order cognitive
processes if he accomplished the following characteristics: having parents not bornin the country, to watch television very often and to frequently borrowing booksfrom the local library. Moreover, at school, reading frequently in silence, not followothers students reading and to often choose the books to read. Finally there was a
correlation between COM and the student self concept: low ratio of I do not readas well as other students in my class.
One last variable, that was in fact an index, was the proportion of independent
reading. Both high and low frequency of this index was correlated to COM. The
coefficients indicate that a student reading frequently in an independent way, was
a student that had an advantage in high order processing and the one not devel-
174
tel-0
0563
710,
ver
sion
1 -
7 Fe
b 20
11
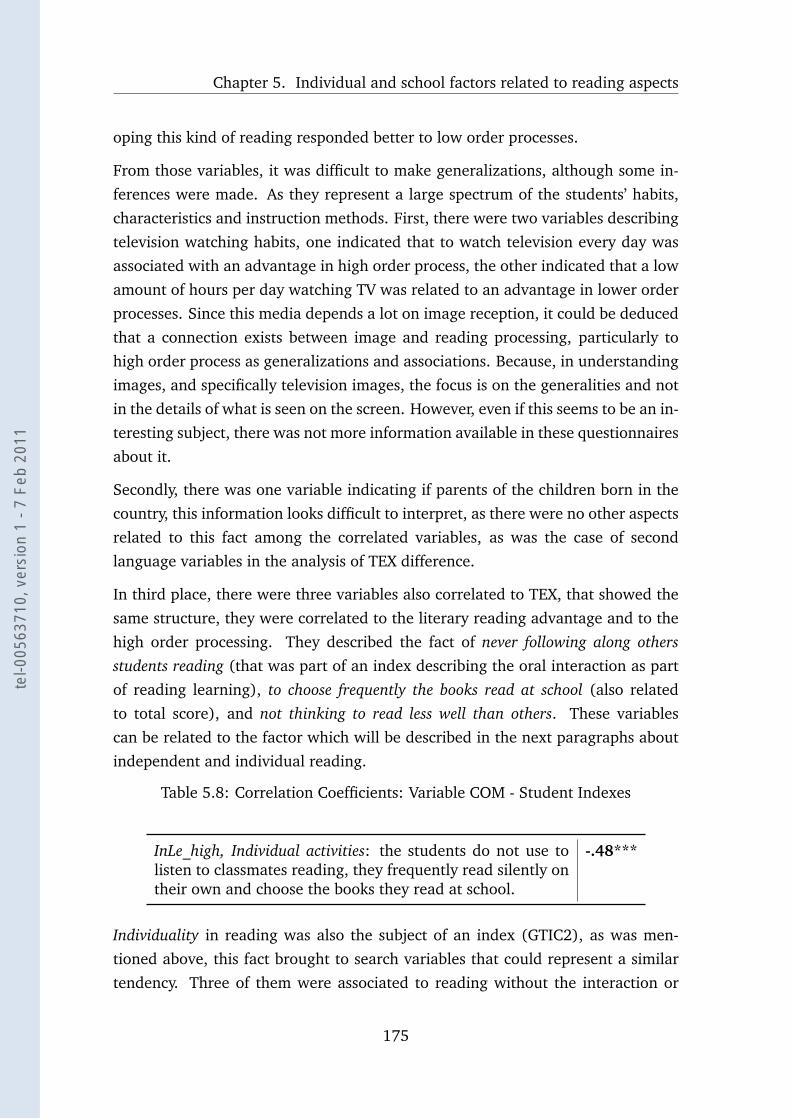
Chapter 5. Individual and school factors related to reading aspects
oping this kind of reading responded better to low order processes.
From those variables, it was difficult to make generalizations, although some in-
ferences were made. As they represent a large spectrum of the students’ habits,
characteristics and instruction methods. First, there were two variables describing
television watching habits, one indicated that to watch television every day was
associated with an advantage in high order process, the other indicated that a low
amount of hours per day watching TV was related to an advantage in lower order
processes. Since this media depends a lot on image reception, it could be deduced
that a connection exists between image and reading processing, particularly to
high order process as generalizations and associations. Because, in understanding
images, and specifically television images, the focus is on the generalities and not
in the details of what is seen on the screen. However, even if this seems to be an in-
teresting subject, there was not more information available in these questionnaires
about it.
Secondly, there was one variable indicating if parents of the children born in the
country, this information looks difficult to interpret, as there were no other aspects
related to this fact among the correlated variables, as was the case of second
language variables in the analysis of TEX difference.
In third place, there were three variables also correlated to TEX, that showed the
same structure, they were correlated to the literary reading advantage and to the
high order processing. They described the fact of never following along othersstudents reading (that was part of an index describing the oral interaction as part
of reading learning), to choose frequently the books read at school (also related
to total score), and not thinking to read less well than others. These variables
can be related to the factor which will be described in the next paragraphs about
independent and individual reading.
Table 5.8: Correlation Coefficients: Variable COM - Student Indexes
InLe_high, Individual activities: the students do not use tolisten to classmates reading, they frequently read silently ontheir own and choose the books they read at school.
-.48***
Individuality in reading was also the subject of an index (GTIC2), as was men-
tioned above, this fact brought to search variables that could represent a similar
tendency. Three of them were associated to reading without the interaction or
175
tel-0
0563
710,
ver
sion
1 -
7 Fe
b 20
11
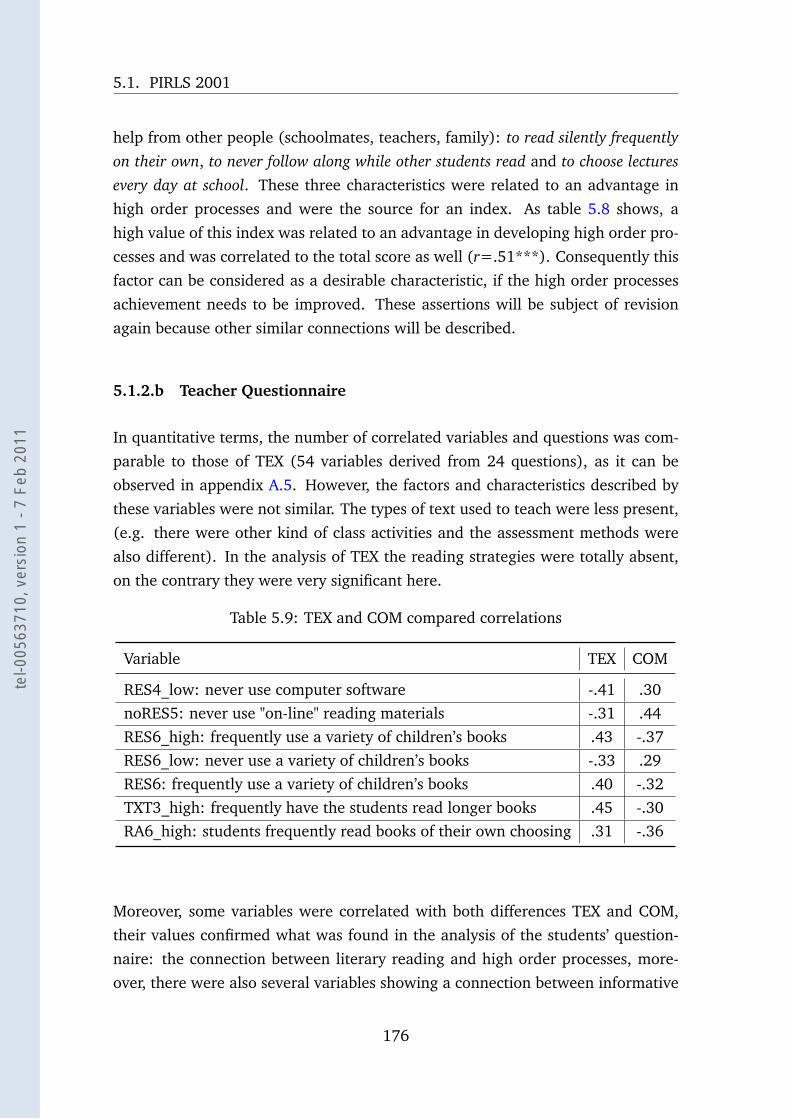
5.1. PIRLS 2001
help from other people (schoolmates, teachers, family): to read silently frequentlyon their own, to never follow along while other students read and to choose lecturesevery day at school. These three characteristics were related to an advantage in
high order processes and were the source for an index. As table 5.8 shows, a
high value of this index was related to an advantage in developing high order pro-
cesses and was correlated to the total score as well (r=.51***). Consequently this
factor can be considered as a desirable characteristic, if the high order processes
achievement needs to be improved. These assertions will be subject of revision
again because other similar connections will be described.
5.1.2.b Teacher Questionnaire
In quantitative terms, the number of correlated variables and questions was com-
parable to those of TEX (54 variables derived from 24 questions), as it can be
observed in appendix A.5. However, the factors and characteristics described by
these variables were not similar. The types of text used to teach were less present,
(e.g. there were other kind of class activities and the assessment methods were
also different). In the analysis of TEX the reading strategies were totally absent,
on the contrary they were very significant here.
Table 5.9: TEX and COM compared correlations
Variable TEX COM
RES4_low: never use computer software -.41 .30noRES5: never use "on-line" reading materials -.31 .44RES6_high: frequently use a variety of children’s books .43 -.37RES6_low: never use a variety of children’s books -.33 .29RES6: frequently use a variety of children’s books .40 -.32TXT3_high: frequently have the students read longer books .45 -.30RA6_high: students frequently read books of their own choosing .31 -.36
Moreover, some variables were correlated with both differences TEX and COM,
their values confirmed what was found in the analysis of the students’ question-
naire: the connection between literary reading and high order processes, more-
over, there were also several variables showing a connection between informative
176
tel-0
0563
710,
ver
sion
1 -
7 Fe
b 20
11
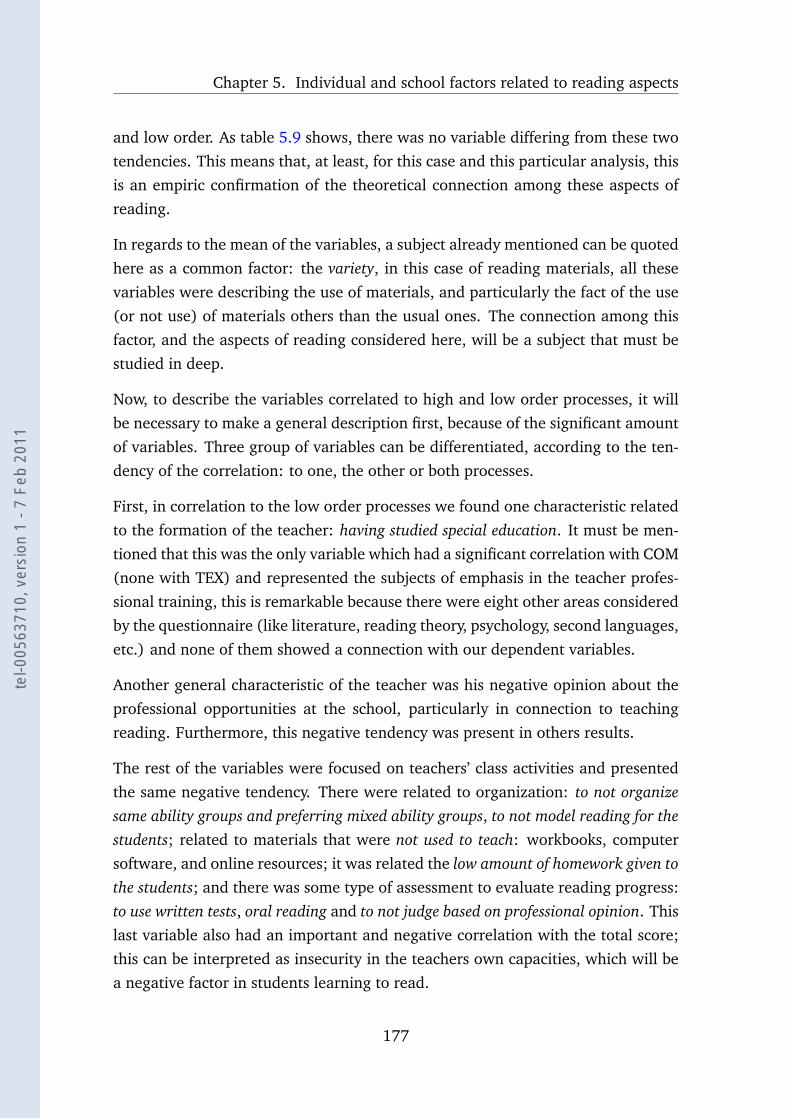
Chapter 5. Individual and school factors related to reading aspects
and low order. As table 5.9 shows, there was no variable differing from these two
tendencies. This means that, at least, for this case and this particular analysis, this
is an empiric confirmation of the theoretical connection among these aspects of
reading.
In regards to the mean of the variables, a subject already mentioned can be quoted
here as a common factor: the variety, in this case of reading materials, all these
variables were describing the use of materials, and particularly the fact of the use
(or not use) of materials others than the usual ones. The connection among this
factor, and the aspects of reading considered here, will be a subject that must be
studied in deep.
Now, to describe the variables correlated to high and low order processes, it will
be necessary to make a general description first, because of the significant amount
of variables. Three group of variables can be differentiated, according to the ten-
dency of the correlation: to one, the other or both processes.
First, in correlation to the low order processes we found one characteristic related
to the formation of the teacher: having studied special education. It must be men-
tioned that this was the only variable which had a significant correlation with COM
(none with TEX) and represented the subjects of emphasis in the teacher profes-
sional training, this is remarkable because there were eight other areas considered
by the questionnaire (like literature, reading theory, psychology, second languages,
etc.) and none of them showed a connection with our dependent variables.
Another general characteristic of the teacher was his negative opinion about the
professional opportunities at the school, particularly in connection to teaching
reading. Furthermore, this negative tendency was present in others results.
The rest of the variables were focused on teachers’ class activities and presented
the same negative tendency. There were related to organization: to not organizesame ability groups and preferring mixed ability groups, to not model reading for thestudents; related to materials that were not used to teach: workbooks, computer
software, and online resources; it was related the low amount of homework given tothe students; and there was some type of assessment to evaluate reading progress:
to use written tests, oral reading and to not judge based on professional opinion. This
last variable also had an important and negative correlation with the total score;
this can be interpreted as insecurity in the teachers own capacities, which will be
a negative factor in students learning to read.
177
tel-0
0563
710,
ver
sion
1 -
7 Fe
b 20
11
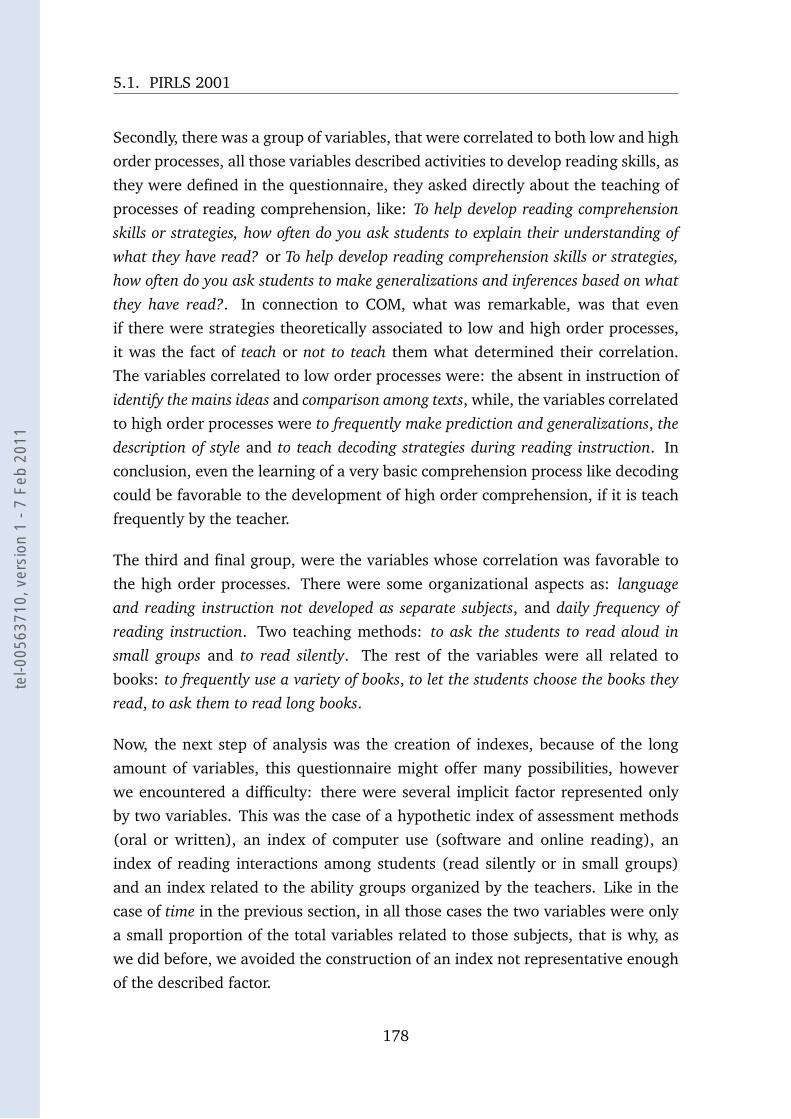
5.1. PIRLS 2001
Secondly, there was a group of variables, that were correlated to both low and high
order processes, all those variables described activities to develop reading skills, as
they were defined in the questionnaire, they asked directly about the teaching of
processes of reading comprehension, like: To help develop reading comprehensionskills or strategies, how often do you ask students to explain their understanding ofwhat they have read? or To help develop reading comprehension skills or strategies,how often do you ask students to make generalizations and inferences based on whatthey have read?. In connection to COM, what was remarkable, was that even
if there were strategies theoretically associated to low and high order processes,
it was the fact of teach or not to teach them what determined their correlation.
The variables correlated to low order processes were: the absent in instruction of
identify the mains ideas and comparison among texts, while, the variables correlated
to high order processes were to frequently make prediction and generalizations, thedescription of style and to teach decoding strategies during reading instruction. In
conclusion, even the learning of a very basic comprehension process like decoding
could be favorable to the development of high order comprehension, if it is teach
frequently by the teacher.
The third and final group, were the variables whose correlation was favorable to
the high order processes. There were some organizational aspects as: languageand reading instruction not developed as separate subjects, and daily frequency ofreading instruction. Two teaching methods: to ask the students to read aloud insmall groups and to read silently. The rest of the variables were all related to
books: to frequently use a variety of books, to let the students choose the books theyread, to ask them to read long books.
Now, the next step of analysis was the creation of indexes, because of the long
amount of variables, this questionnaire might offer many possibilities, however
we encountered a difficulty: there were several implicit factor represented only
by two variables. This was the case of a hypothetic index of assessment methods
(oral or written), an index of computer use (software and online reading), an
index of reading interactions among students (read silently or in small groups)
and an index related to the ability groups organized by the teachers. Like in the
case of time in the previous section, in all those cases the two variables were only
a small proportion of the total variables related to those subjects, that is why, as
we did before, we avoided the construction of an index not representative enough
of the described factor.
178
tel-0
0563
710,
ver
sion
1 -
7 Fe
b 20
11
Chapter 5. Individual and school factors related to reading aspects
Table 5.10: Correlation Coefficients: Variable COM - Teacher Indexes
DEV_low, Emphasis in Strategies: The teacher never asks oralmost never asks for the main ideas of texts, to compare textwith experience, for making predictions, generalizations orinferences, and he never asks the students to describe styleor structure of texts, (N=33).
.50***
VATY2_high, Variety in materials: Teachers propose texts ofdifferent kind to the students during reading instruction:textbooks, computer software, on-line reading materials,and a variety of children’s books.
-.43**
In contrast, the variables allowed the creation of two indexes with sufficient data
support. First of all, one index considering the processes of comprehension em-
phasized or not by the teachers. Summarizing the frequency of all the processes,
the assertions previously done were confirmed: to develop strategies every day,
even if those were low order strategies, were always correlated to an advantage in
high order processing. The most important correlation is presented in table 5.10,
however DEV_high has also a significant correlation to COM (r=-.33*). However,
none of them have a correlation with the total score.
The second index had two qualities, first of all, it described a factor correlated to
COM: the variety in the material used during reading instruction, its high and low
frequency were correlated. Secondly, in section 5.1.1.d, Teacher Questionnaire,
there was an index related to this factor: VATY, that index and this new one:
VATY2 were both created from variables indicating the use of: computer software,
online reading and variety in books; the use of textbooks was literary related, here
it showed the same tendencies as the other variables and it was put into the index
to add more variety. As we did in analyzing TEX, we did not count in this index
the variable about reading longer books because there was an explicit indication
about the content: fiction.
The results of correlating VATY2 with the dependent variables were significant in
several areas, first of all, as table 5.10 shows, there was a correlation favorable
to high order processes in the high frequency of VATY2_high (teachers declaringto use those materials frequently during reading instruction). However, this was
not the higher correlation, VATY2_low (to not use the materials) showed a more
significant result: r=.51***. It was better to refers the high correlation because
179
tel-0
0563
710,
ver
sion
1 -
7 Fe
b 20
11
5.1. PIRLS 2001
is equivalent to the one used before (VATY_high); moreover, this confirms a ten-
dency previously commented: the daily use of a variety of material had a positive
correlation with the literary tendencies. The same variety showed a correlation
with the high order processes. Moreover, the low frequency, related to low order
processing, was related with informative reading. A final aspect to remark, is that
both high and low frequency of this index were correlated with the total score,
from this point of view, VATY2_high, the frequent use of a variety of materials will
be a recommendable activity as it improves the high order comprehension pro-
cesses and, at the same time, is correlated with an improvement of the total score
r=.50***. The low frequency of variety was in the opposite situation: r=-.41**.
5.1.2.c School Questionnaire
This was the shorter questionnaire considered in this analysis, however, the amount
of questions from which correlated variables were derived is not very different
from the teacher questionnaire (the bigger one). As appendix A.6 shows, from
the original 59 questions, 41 variables were correlated to COM from 23 questions.
From these 41 variables, 21 had a positive correlation and 20 had a negative cor-
relation.
To describe the correlations obtained from this questionnaire, some isolated vari-
ables will be mentioned, then, a group of variables having a common factor will
be reported. Finally, it will be described a mayor group referred to the moment
when the reading processes and tasks were learned.
In first place, three variables were mostly isolated from the rest of the sample,
whose correlation to COM was favorable to low order processing. They were the
low amount of immigrant students (less than 10%), the preference of the school for
forming classes based on students ability and the high importance given in curricu-
lum to the students wishes. The variables had in common that they were related
to students’ characteristics, however they did not imply a common factor. Another
variable related to low order advantage, was the absence of reading series in in-struction, it could be linked with the absence of textbooks during instruction, but
this was favorable to high order advantage, those two variables were the only ones
describing instructional material preferred at school.
Secondly, there were also variables mostly isolated, but having a difference fa-
vorable to the high order processes of comprehension. Two variables were the
180
tel-0
0563
710,
ver
sion
1 -
7 Fe
b 20
11
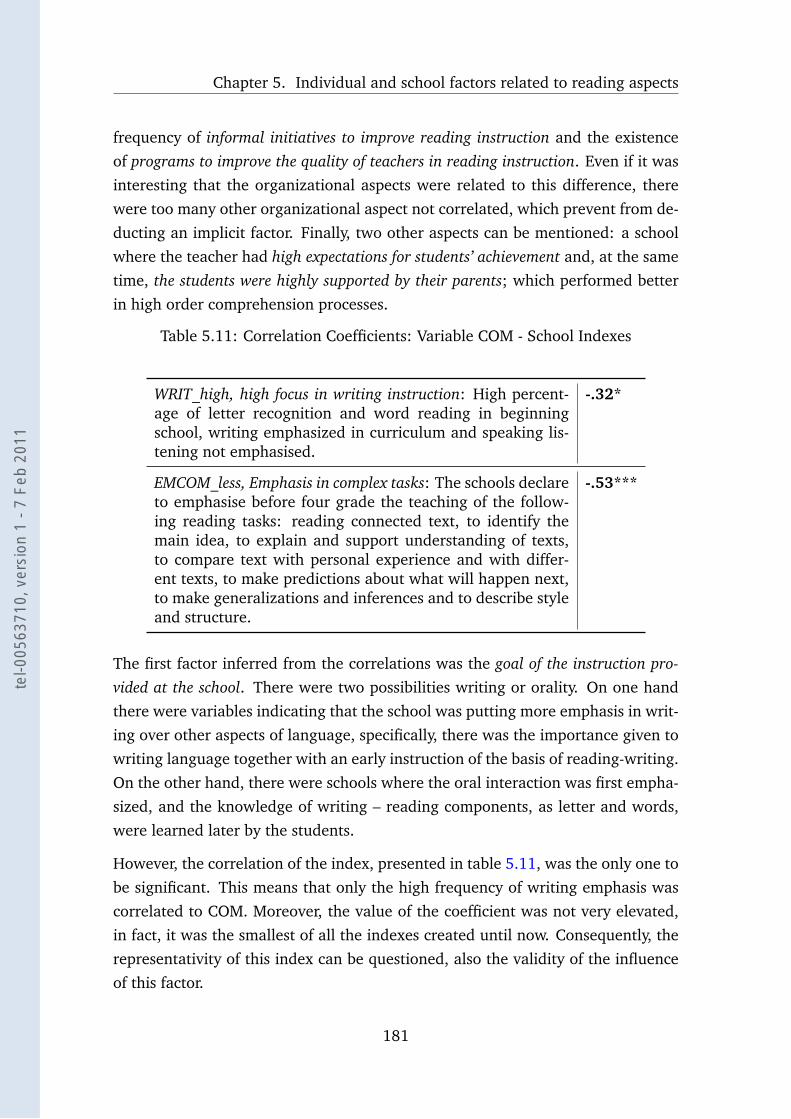
Chapter 5. Individual and school factors related to reading aspects
frequency of informal initiatives to improve reading instruction and the existence
of programs to improve the quality of teachers in reading instruction. Even if it was
interesting that the organizational aspects were related to this difference, there
were too many other organizational aspect not correlated, which prevent from de-
ducting an implicit factor. Finally, two other aspects can be mentioned: a school
where the teacher had high expectations for students’ achievement and, at the same
time, the students were highly supported by their parents; which performed better
in high order comprehension processes.
Table 5.11: Correlation Coefficients: Variable COM - School Indexes
WRIT_high, high focus in writing instruction: High percent-age of letter recognition and word reading in beginningschool, writing emphasized in curriculum and speaking lis-tening not emphasised.
-.32*
EMCOM_less, Emphasis in complex tasks: The schools declareto emphasise before four grade the teaching of the follow-ing reading tasks: reading connected text, to identify themain idea, to explain and support understanding of texts,to compare text with personal experience and with differ-ent texts, to make predictions about what will happen next,to make generalizations and inferences and to describe styleand structure.
-.53***
The first factor inferred from the correlations was the goal of the instruction pro-vided at the school. There were two possibilities writing or orality. On one hand
there were variables indicating that the school was putting more emphasis in writ-
ing over other aspects of language, specifically, there was the importance given to
writing language together with an early instruction of the basis of reading-writing.
On the other hand, there were schools where the oral interaction was first empha-
sized, and the knowledge of writing – reading components, as letter and words,
were learned later by the students.
However, the correlation of the index, presented in table 5.11, was the only one to
be significant. This means that only the high frequency of writing emphasis was
correlated to COM. Moreover, the value of the coefficient was not very elevated,
in fact, it was the smallest of all the indexes created until now. Consequently, the
representativity of this index can be questioned, also the validity of the influence
of this factor.
181
tel-0
0563
710,
ver
sion
1 -
7 Fe
b 20
11
5.1. PIRLS 2001
In contrast, the most important group of variables from this questionnaire, were
related to questions about the principal moment in which a certain process or
aspect of reading was emphasized during instruction. An example of this question
is: At which <grades> prior to <fourth grade> does knowing letters of the alphabetfirst receive a major emphasis in instruction in your school?. There were five possible
answers: three grades Earlier than the present year (first year), two grades earlier,one grade earlier, during fourth grade or not in these grades.
To analyze these questions three derived variables were constructed, depending
on time: before fourth grade (first three alternatives), during fourth grade or after
fourth grade (last alternative). From those variables, this analysis emphasized the
results referred to before and during fourth grade, as the last alternative not in thesegrades, is not explicitly referred to an instruction “after” fourth grade. Moreover,
in the database, many schools did not selected this alternative at all, so there was
many countries with null values.
Nevertheless, the correlations showed that the only instruction that matters in
relation to COM was the early instruction of the more complex processes. More-
over, it was significant that the first variable showing a significant correlation was
referred to reading connected text; this significance increased in parallel with the
augment of the complexity of the tasks.
More precisely, to formalize these tendencies, an index regrouping all these vari-
ables was created, and it is showed in table 5.11. The proportion of this tasks being
emphasized before fourth grade was negatively correlated to COM, which means,
that it was favorable to high order processing. In addition, if those task were em-
phasized only in fourth grade, there were also correlated to COM: r=.54***. It is
important to mention that both variables were correlated to the total score as well,
and those correlations were the most elevated found in this analysis: r=.65*** for
early emphasis and r=-.59*** for instruction during fourth grade. This allows us
to deduce that the early teaching of the considered tasks of comprehension will
improve the general reading achievement and specifically the high order skills.
On the contrary, do not consider these tasks in the instruction will be negative to
the general reading achievement, and in particular, it will establish a difference
favorable to low order processes.
182
tel-0
0563
710,
ver
sion
1 -
7 Fe
b 20
11
Chapter 5. Individual and school factors related to reading aspects
5.1.2.d Linear regression model
These last paragraphs of PIRLS 2001 analysis will reproduce the strategy used with
the difference TEX, to create a model using the derived indexes and the linguistic
families as regressors.
First, there were two families being correlated to COM: Anglo (r=-.51***) and
Germanic (r=.33*). Consequently, this case is very different from the previous
regression, where two families where correlated in a similar way to TEX. In this
case, the higher correlation of the first family, made of it the best candidate to
explain the variation of COM. Moreover, two regressions were made, having each
one of these families as the single predictor; the determination coefficient and the
result of the F test, were considerably better in the regression made with Anglo:
R2 .26 (Adj R2.23), F test = 10.96, than in the regression made with Germanic: R2
.11 (Adj R2.08), F test = 4.03.
But, if this last statistic is compared with the result of the model explaining TEX
difference, since the extension of the data is the same, it becomes uncertain that
the adequacy of the model could be improved in adding more regressors besides
Anglo. To resolve this problem, since our interest is to study the explicability
of the individual and scholar factors, the solution will be plainly to reverse the
explicative process: to search first a stable model beginning with the indexes and
later, to include one or more linguistic families.
Now, a search was developed among the predictors, combining two indexes. Among
them, two not represented in the tables: low variety in materials and low empha-sis in complex tasks. Low variety in materials had the second higher correlation
with COM, the first was the correlation between COM and low emphasis in com-plex tasks. There were exactly those two variables that fitted to explain better the
variation of COM. This model presented a determination coefficient of R2 .41 (Adj
R2.37) and a F statistic of = 10.57, all the parameter estimates were significantly
different of 0(p > .05). In comparing with the model with Anglo, The F test in-
dicated that this model was satisfactory and, in addition, it explained better the
variance of COM.
Besides the statistical explicability of the model, those two predictors were inter-
esting from the point of view of interpretations. There was an index coming from
the teachers’ questionnaire and another coming from the schools’ questionnaire.
Moreover, VATY represented a factor also correlated to the TEX difference, which
183
tel-0
0563
710,
ver
sion
1 -
7 Fe
b 20
11

5.1. PIRLS 2001
Table 5.12: Linear regression results: COM 2001 - Indexes and Language
Variable ParameterEstimate
t statistic
Intercept -9.67 -0.69
Germ (linguistic family) 8.45*** 2.85
VATY2_low (Variety in materials) 0.27*** 3.59
EMCOM_less (Emphasis in complex tasks) -0.18** -2.01
F value = 11.36***
R-Square = .53
Adjusted R–Square = .49
n = 34, DV = COM, difference between low and high order of comprehension processes PIRLS score2001
allowed us to observe the connections between informative reading and low or-
der processes that was already described. In addition, the importance of the early
instruction of the processes of comprehension was represented by the variable
EMCOM_less.
Any other indexes can be added successfully to this model as regressor, but linguis-
tic families were incorporated. To complete the model, two families were plausible
predictors: Other, and Germanic. Besides the improvement of the model, the in-
clusion of families different from Anglo reduced the possibility of thinking that the
explicative power related to the English speaking countries was not a linguistic
factor but rather economic or socio-cultural. The fact that other linguistic families
were significant predictors proves the validity of this criterion.
Now, as it is shown in the table 5.12, the final model included the two indexes
already mentioned, along with the Germanic family as linguistic factor, it was the
model that was able to best explain the variance of COM. Looking in the first
place at the F statistic, it is remarkable that its value was higher than all the other
possible models; better than Anglo alone, better that the model with two indexes,
and particularly better than the model where of only Germanic. This last model
can be taken as a reference to compare the gain in explicability; the determination
coefficient indicated a gain of a 40%.
In addition, the meaning of the indexes and the model it–self can be interpreted
184
tel-0
0563
710,
ver
sion
1 -
7 Fe
b 20
11
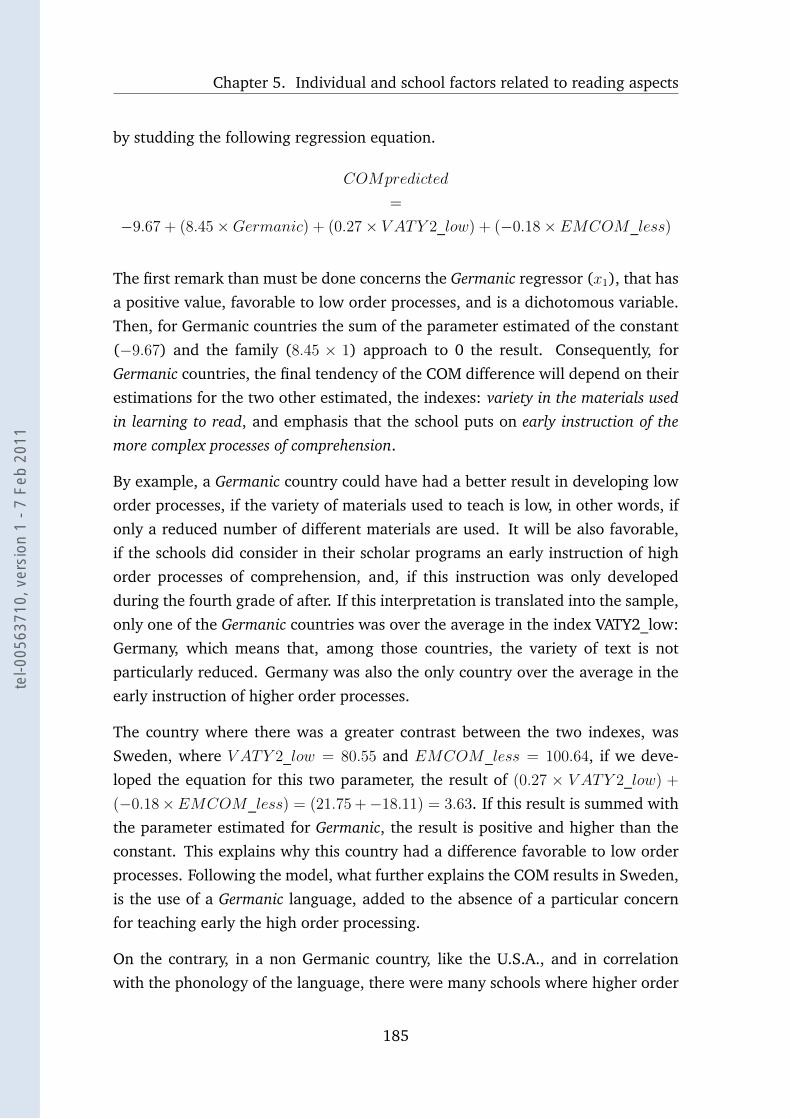
Chapter 5. Individual and school factors related to reading aspects
by studding the following regression equation.
COMpredicted
=
−9.67 + (8.45 ×Germanic) + (0.27 × V ATY 2_low) + (−0.18 × EMCOM_less)
The first remark than must be done concerns the Germanic regressor (x1), that has
a positive value, favorable to low order processes, and is a dichotomous variable.
Then, for Germanic countries the sum of the parameter estimated of the constant
(−9.67) and the family (8.45 × 1) approach to 0 the result. Consequently, for
Germanic countries, the final tendency of the COM difference will depend on their
estimations for the two other estimated, the indexes: variety in the materials usedin learning to read, and emphasis that the school puts on early instruction of themore complex processes of comprehension.
By example, a Germanic country could have had a better result in developing low
order processes, if the variety of materials used to teach is low, in other words, if
only a reduced number of different materials are used. It will be also favorable,
if the schools did consider in their scholar programs an early instruction of high
order processes of comprehension, and, if this instruction was only developed
during the fourth grade of after. If this interpretation is translated into the sample,
only one of the Germanic countries was over the average in the index VATY2_low:
Germany, which means that, among those countries, the variety of text is not
particularly reduced. Germany was also the only country over the average in the
early instruction of higher order processes.
The country where there was a greater contrast between the two indexes, was
Sweden, where V ATY 2_low = 80.55 and EMCOM_less = 100.64, if we deve-
loped the equation for this two parameter, the result of (0.27 × V ATY 2_low) +
(−0.18×EMCOM_less) = (21.75 +−18.11) = 3.63. If this result is summed with
the parameter estimated for Germanic, the result is positive and higher than the
constant. This explains why this country had a difference favorable to low order
processes. Following the model, what further explains the COM results in Sweden,
is the use of a Germanic language, added to the absence of a particular concern
for teaching early the high order processing.
On the contrary, in a non Germanic country, like the U.S.A., and in correlation
with the phonology of the language, there were many schools where higher order
185
tel-0
0563
710,
ver
sion
1 -
7 Fe
b 20
11
5.1. PIRLS 2001
processing was studied since the beginning (EMCOM_less = 118.88), one stan-
dard deviation over the average; on the other hand there was not a significant
amount of teachers declaring to not use a variety of material, the value of this
variable was, in fact, one of the lowers in the sample (V ATY 2_low = 68.84), two
standard deviation under the average. These characteristics explains why this was
one of the countries where the difference COM was more favorable to high order
comprehension processes.
186
tel-0
0563
710,
ver
sion
1 -
7 Fe
b 20
11
Chapter 5. Individual and school factors related to reading aspects
5.2 PIRLS 2006
5.2.1 Reading objectives 2006
There were two great changes from 2001 to 2006: the enlargement (and vari-
ation) in the sample of countries and the adjustments in the distribution of the
items. Consequently, it can not be expected to find the same phenomena that
were previously recognized. However, the principal aim of this new section is to
discover new factors. It can be factors been explicative of both assessments, but
they can be working in a different way. In other words, this second section of
analysis is not yet a comparative procedure; it is an independent examination.
The comparison will only be accomplished when all the preliminary precedents
are compiled, and to obtain it, this study of 2006 data becomes fundamental.
The structure of this subsection follows the same order that the analysis of TEX dif-
ference in 2001. First of all, variables and factors derived from each questionnaire
will be described : students, teachers and schools, later a linear modelization will
be tested, trying to incorporate linguistics factors as well. The dependent variable
TEX represents exactly the same as for 2001; it is: the tendency to have a better
score in one category of texts than the other.
As section 5.1.2.d showed, in 2001 this trend was explained by a model using
the languages spoken in the country along with other factors such as the student
reading habits and performance, the task difficulty, and their knowledge of other
languages and vocabulary.
5.2.1.a Student Questionnaire
The student sub-set was made up of 42 questions, related to students’ home habits,
reading concepts and attitudes, language practice, types of books read and school
activities about reading. From this selection, 28 derived variables were signifi-
cantly correlated, the larger part (17) were literary related, as it can be observed
in appendix A.7. It is very interesting to compare these quantities with those of
2001 sub-set, there was a more important number of questions that were taken
into account, however, the number of variables correlated to TEX was similar (33)
and also the amount of variables showing a literary advantage (21).
187
tel-0
0563
710,
ver
sion
1 -
7 Fe
b 20
11
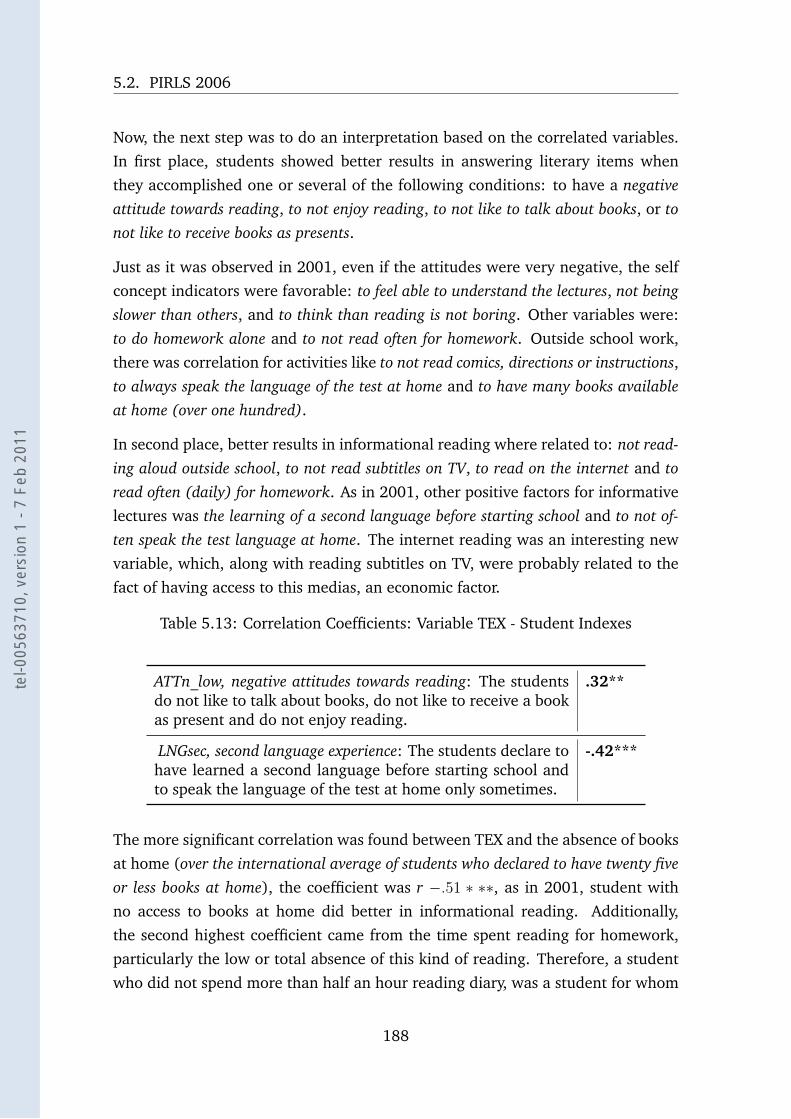
5.2. PIRLS 2006
Now, the next step was to do an interpretation based on the correlated variables.
In first place, students showed better results in answering literary items when
they accomplished one or several of the following conditions: to have a negativeattitude towards reading, to not enjoy reading, to not like to talk about books, or tonot like to receive books as presents.
Just as it was observed in 2001, even if the attitudes were very negative, the self
concept indicators were favorable: to feel able to understand the lectures, not beingslower than others, and to think than reading is not boring. Other variables were:
to do homework alone and to not read often for homework. Outside school work,
there was correlation for activities like to not read comics, directions or instructions,to always speak the language of the test at home and to have many books availableat home (over one hundred).
In second place, better results in informational reading where related to: not read-ing aloud outside school, to not read subtitles on TV, to read on the internet and toread often (daily) for homework. As in 2001, other positive factors for informative
lectures was the learning of a second language before starting school and to not of-ten speak the test language at home. The internet reading was an interesting new
variable, which, along with reading subtitles on TV, were probably related to the
fact of having access to this medias, an economic factor.
Table 5.13: Correlation Coefficients: Variable TEX - Student Indexes
ATTn_low, negative attitudes towards reading: The studentsdo not like to talk about books, do not like to receive a bookas present and do not enjoy reading.
.32**
LNGsec, second language experience: The students declare tohave learned a second language before starting school andto speak the language of the test at home only sometimes.
-.42***
The more significant correlation was found between TEX and the absence of books
at home (over the international average of students who declared to have twenty fiveor less books at home), the coefficient was r −.51 ∗ ∗∗, as in 2001, student with
no access to books at home did better in informational reading. Additionally,
the second highest coefficient came from the time spent reading for homework,
particularly the low or total absence of this kind of reading. Therefore, a student
who did not spend more than half an hour reading diary, was a student for whom
188
tel-0
0563
710,
ver
sion
1 -
7 Fe
b 20
11
Chapter 5. Individual and school factors related to reading aspects
it is easier to read a literary text than an informative one. This correlation has a rvalue of .45***.
Starting from this information, another step in the analysis was done, that is, to
create tendency indexes representative of factors. The most significant results are
presented in table 5.13.
The first factor, children’s attitudes, have involved variables related to aspects also
identified in the 2001 data. Concretely, it corresponded to a PIRLS derived index
included in the data: SATR, students index of attitudes toward reading. However,
the SATR 2006 was not correlated to TEX, even if it was highly correlated to our
index (r =-.59***).
Among the correlated variables, we were also able to identify some variables re-
lated to the other PIRLS index mentioned during the 2001 analysis: reading self-concept. However, it was not possible to put them together to create an index,
the coefficients indicated some contradictions: apparently a student that did not
think that reading is easy could, at the same time, have declared to understand
everything when reading and have declared to read slower than others. That is
why we omitted this possible interrelation.
The second index represented a linguistic tendency, already mentioned in 2001
results as well. The variable described the role of the language used at school
in children’s everyday lives. Specifically, less experience at home with the official
language was related to an informative advantage, on the contrary, to use exclu-
sively the same language at school and at home resulted in a literary advantage.
Following the same procedure as in 2001, an index was created considering the
variables indicating an early learning of a second language, and a low proportion
of school language at home; the two variables were highly correlated (r=.77***).
On the other hand, in spite of its interesting meaning, this index was not able to
be used as a factor in a model because of missing data. In this case, the amount of
missing data was over the acceptable number: there were too many countries (6)
where those questions were not part of the questionnaire.
Following this information from the students’ variables, it is possible to affirm that
the reading activities and purposes, the evaluation methods, and all the other
aspects of the learning practice have had no influence in the performance of stu-
dents in comparing these two objectives of reading. What did have an influence
was the home activities, linguistic practices, and the students’ personal opinion
189
tel-0
0563
710,
ver
sion
1 -
7 Fe
b 20
11
5.2. PIRLS 2006
about reading.
Finally, if we come back to compare these correlations with those of 2001, a last
aspect to be taken into account were the variables that were present in both anal-
yses, correlated in both cases. They were few, only 8 variables (derived from 4
questions), the subject to which they were referred were:
• Self-concept about reading in comparison to the other students in the class.
• Amount of books available at the student’s house.
• Students speaks another language at home.
• Students learned a second language before starting school
However, even if there were not many, the persistence of those subjects could be
considered as an interesting clue. The first subject, for example, was related to the
factor students attitudes and allows the creation of a variable to test its explicability
in the comparative analysis. The same thing can be said about the factors related
to language use.
On the contrary, the factor that were absent from this second analysis must be
mentioned as well. Comparing the two groups of significant variables, there were
three factors which were present at the first analysis and not in the second: school
work, oral interaction and security. Concerning the first factor, even if they were
few, in 2001 two explicative variables were related to the school activities de-
scribed by the students, while, in 2006, the schools aspects were completely ab-
sent. In relation to the second factor, in 2001 a particular activity related to read-
ing was identified: the possible effect of read aloud and to express aloud, now,
there were no references to this factor; the reason was probably that there were
changes in the questionnaire concerning this aspect and several questions were
omitted. Finally, concerning the third factor, no question regarding bulling and
feelings of safety were correlated to TEX, moreover, only the answers to this last
question were related to the total score.
190
tel-0
0563
710,
ver
sion
1 -
7 Fe
b 20
11

Chapter 5. Individual and school factors related to reading aspects
5.2.1.b Teacher questionnaire
In term of quantity, even if the data considered was as large as the obtained from
the student questionnaire, only a dozen of variables were significantly correlate
to TEX (see appendix A.8). Half of them explained a tendency towards the infor-
mative objectives, the other half showed a tendency to the literary purpose. This
was a great change if it is compared to 2001 questionnaire, where a total of 49
variables were correlated to TEX. In consequence, we can already deduce that the
factors of 2001 will not necessarily be found here, but in a partial way.
Firstly, Concerning the two tendencies, on one hand, the teachers whose results
showed a positive tendency to the literary lecture, were those who always use aworkbook during reading instruction, read short stories with the students as part ofthe reading instruction, frequently help the students to understand new vocabulary,
ask the student to answer oral questions about what they read and ask the studentsto explain their understanding of what they have read.
On the other hand, the informational reading was better when teachers declared
to organize reading activities by creating mixed–ability groups, to allow the studentswork independently on a goal they choose themselves, to not use children books duringreading instruction, and to use instructions or manuals as part of teaching readingmaterial.
Among these variables, the higher coefficient of the correlation was related to
the creation of mixed-ability groups. This means that the students from a country
where teachers tend to organize the instruction in this way, had more probabilities
of getting an informative advantage, in this case, the correlation was r = -.39**.
In the second stage of our analysis, two factors were considered for the creation of
tendency indexes, for the fist (IND) 2, related to informational advantage, we kept
the variables which described a learning process not focused on the interaction
of the students with the teachers but within them or in an individual way. Then,
for the second index (DEP) a selection of variables showing a direct interaction
between the teacher and the students was done where the instruction depended
greatly on this interaction. This index contrasted with independent work or peer
interaction. Besides the correlations presented in table 5.14, the variable DEP_low
2In general, we avoid to present two level categorical variables in our index, since they areartificially dichotomized from averages. In this case, we make an exception because is the onlyvariable whit a significant correlation coefficient.
191
tel-0
0563
710,
ver
sion
1 -
7 Fe
b 20
11
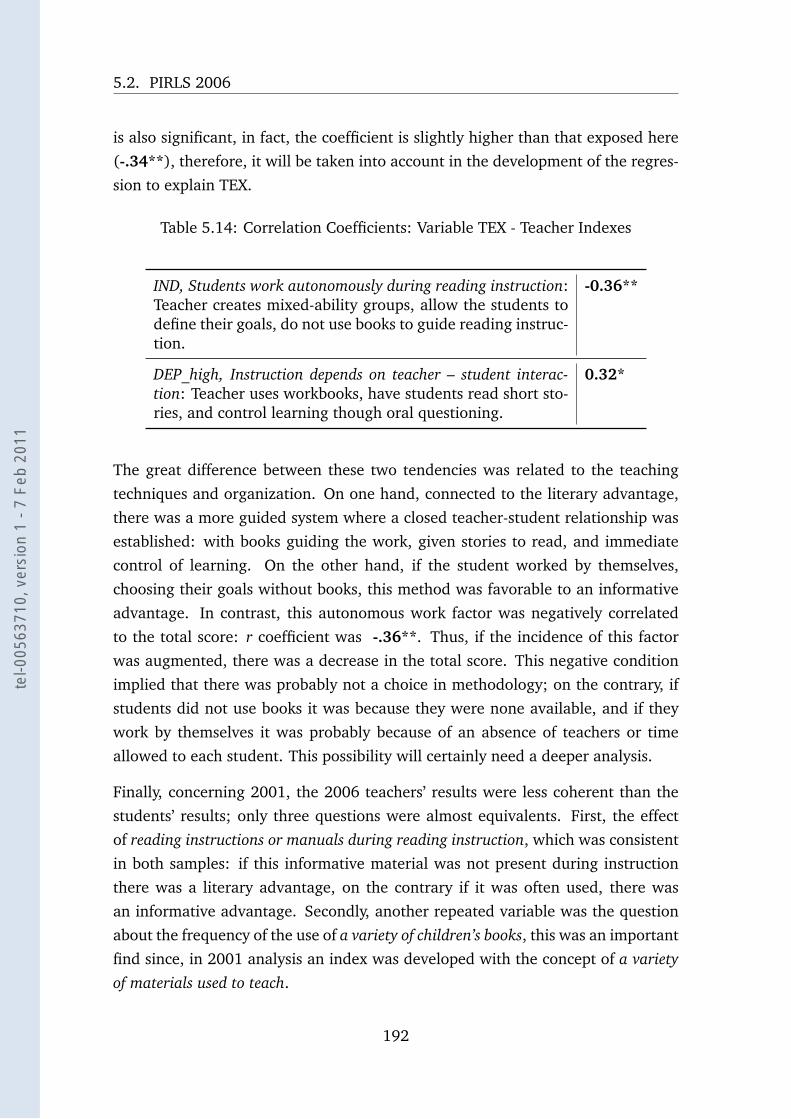
5.2. PIRLS 2006
is also significant, in fact, the coefficient is slightly higher than that exposed here
(-.34**), therefore, it will be taken into account in the development of the regres-
sion to explain TEX.
Table 5.14: Correlation Coefficients: Variable TEX - Teacher Indexes
IND, Students work autonomously during reading instruction:Teacher creates mixed-ability groups, allow the students todefine their goals, do not use books to guide reading instruc-tion.
-0.36**
DEP_high, Instruction depends on teacher – student interac-tion: Teacher uses workbooks, have students read short sto-ries, and control learning though oral questioning.
0.32*
The great difference between these two tendencies was related to the teaching
techniques and organization. On one hand, connected to the literary advantage,
there was a more guided system where a closed teacher-student relationship was
established: with books guiding the work, given stories to read, and immediate
control of learning. On the other hand, if the student worked by themselves,
choosing their goals without books, this method was favorable to an informative
advantage. In contrast, this autonomous work factor was negatively correlated
to the total score: r coefficient was -.36**. Thus, if the incidence of this factor
was augmented, there was a decrease in the total score. This negative condition
implied that there was probably not a choice in methodology; on the contrary, if
students did not use books it was because they were none available, and if they
work by themselves it was probably because of an absence of teachers or time
allowed to each student. This possibility will certainly need a deeper analysis.
Finally, concerning 2001, the 2006 teachers’ results were less coherent than the
students’ results; only three questions were almost equivalents. First, the effect
of reading instructions or manuals during reading instruction, which was consistent
in both samples: if this informative material was not present during instruction
there was a literary advantage, on the contrary if it was often used, there was
an informative advantage. Secondly, another repeated variable was the question
about the frequency of the use of a variety of children’s books, this was an important
find since, in 2001 analysis an index was developed with the concept of a varietyof materials used to teach.
192
tel-0
0563
710,
ver
sion
1 -
7 Fe
b 20
11
Chapter 5. Individual and school factors related to reading aspects
If compared to 2006, the reading materials correlated to TEX were not the same
but there were materials, this means that at least the factor itself could be rec-
ognized. Finally, the last variable present in both data sets was the frequency of
help given by a teacher to the students to understand new vocabulary in texts,
in this case the result were contradictories, whereas in 2001 a high frequency of
this activity was associated to an informative advantage, now in 2006 data, it was
associated to a literary advantage, there were no changes that can explain this
contradiction. That was the reason why this variable was not considered for the
construction of the index DEP.
5.2.1.c School questionnaire
From this questionnaire, only fifteen derivative variables were significantly cor-
related to TEX, yet the number of questions taken into account were similar to
the previous ones (47 questions). Besides that, the explicability of these variables
revealed more correlations between TEX and informational factors (10), between
TEX and literary factors there were only five correlations. A deduction can be
made from these numbers, even if in this plain analysis with countries as units,
no finer interpretations can be made, but when developing a more comprehensive
work, this fact must be taken into account: the literary tendency could be ex-
plained with more student-related factors, in contrast, the informational tendency
of TEX could be more related to school factors.
Now, to describe the tendencies of the correlation, a better result in literary read-
ing was related to these two conditions. First, the use of languages at school, that
was mentioned previously: To have few students receiving instruction in their homelanguage (when different from the school language) and secondly, if the school
had high resources (following principal’s perception of them), that was a literary
aspect as well.
On the contrary, a higher informative score was correlated to the high enrollmentof fourth grade students in the school (the bigger the school, more informational
the tendency). Moreover, it was correlated to informative reading a low safety sen-sation at the school (following principal’s perception of it). In accord with previous
results about the effect of a second language in the school, another informative
factor was a high percentage of students whose first language is not the languageof the test (over 50%). It was correlated to informative reading as well, the ab-
193
tel-0
0563
710,
ver
sion
1 -
7 Fe
b 20
11
5.2. PIRLS 2006
sence of material from different curricular areas in reading instruction, in fact this
was the higher coefficient of correlation: (r=-.39**). This is interesting because it
confirmed a previous result from the teacher questionnaire, there, an informative
factor was also the choice of not using children’s books during reading instruction.
As in 2001, from the schools’ questionnaire, the more important correlated vari-
ables were related to the period in which a series of aspects of reading were first
introduced. The TEX difference, positive to literary lecture, was increased if one
or several reading aspects were already learned at the school before 4◦ grade:
• To identify the main idea of texts
• To explain or support understanding of texts.
• To compare text with personal experience.
• To make predictions about what will happen next in text.
This series of variables were related to the complexity of the instruction given dur-
ing these first years of learning. Regretfully, in this questionnaire, many of those
variables had a lot of missing data, which made the creation of an index very dif-
ficult. However, this was tested, and there were not significant correlations with
TEX, there was only a correlation between the index AFT4_less (from the answers
the school have thought those strategies before 4◦ grade) and the total score (r =
.72***), another possible index: AFT4_equal (from the answers the school teachesthose strategies during 4◦ grade) was also correlated but negatively (r = -.73***).
Those discovers indicated that the early learning of reading comprehension tech-
niques was particularly positive to the total score, and so to the reading learning it
self, while only teaching these techniques during four grade influenced negatively
the reading competences of the students.
In reference to the 2001 results, as in the teachers’ questionnaires, there was a
great reduction of the quantity of correlated variables. But, in this case there
was a reason for this change, because this questionnaire had being considerably
modified, the subject of the questions were changed and also the way of asking
some questions. In contrast, there was a repeated factor, which was one of central
importance: the same variables related to the instruction gave during first years of
learning. Even if the only question about making predictions was present in both
correlation tables, in general terms, all the variables related to this factor showed
194
tel-0
0563
710,
ver
sion
1 -
7 Fe
b 20
11
Chapter 5. Individual and school factors related to reading aspects
the same tendency favorable to a literary advantage. It can be deduced that this
could be an important explicative factor in more general terms.
5.2.1.d Linear regression model
By means of the explicative variables already created, it was possible to produce a
linear regression model explaining TEX. However, in contrast to the 2001 analysis
where some of the linguistic families were significantly correlated to TEX, now
they are not an option to begin with the construction of the model. As we did in
constructing the explicative model of the variable COM in 2001, we searched a
reference among the indexes. As was mentioned before the index LNGsec had too
many missing data to be used as reference, that is why we preferred to test the
other index ATTn_low, low presence of negative attitudes. Moreover, this was one of
the most interesting factors founded during the analysis, because it was present in
both analysis and it had a corresponding PIRLS index. A model where ATTn_low
was the only explicative variable fitted to explain 8% of the variance of TEX (Adj
R2 = .08), the F statistic indicate that this model was a valid predictor (4.15).
Then, to be able to study the variation of TEX in considering different aspects of
the reading instruction, it was important for this model that the next regressor,
came from the teachers sample. It was possible to successfully add DEP_high,
instruction depends on teacher – student interaction to the model; its addition, gave
a gain in explicability of almost a 15%, being R20.26 (Adj R20.22). Moreover,
this was a better model in explaining the variation of TEX, because the F test has
increased its coefficient to 6.11***.
Still, even if this result seems to gives us important clues to understand how this
tendencies work, it was also suitable to try to demonstrate the possible incidence
of linguistic factors. As it was done before, now, the procedure was simply to test
those linguistic families as an extra factor in our different trials models. Models in-
cluding Anglo, Latin, Germanic, Slavic and Others as linguistic families were tested.
Finally, only one linguistic variable could be added to the model, without losing
stability and with an increase of its explicative power.
Table 5.15 shows the estimated coefficients for a linear regression model that fit
to explain the difference between the two reading objectives. Here, as well as the
variables mentioned above, the linguistic family Slavic was added to the equation.
195
tel-0
0563
710,
ver
sion
1 -
7 Fe
b 20
11
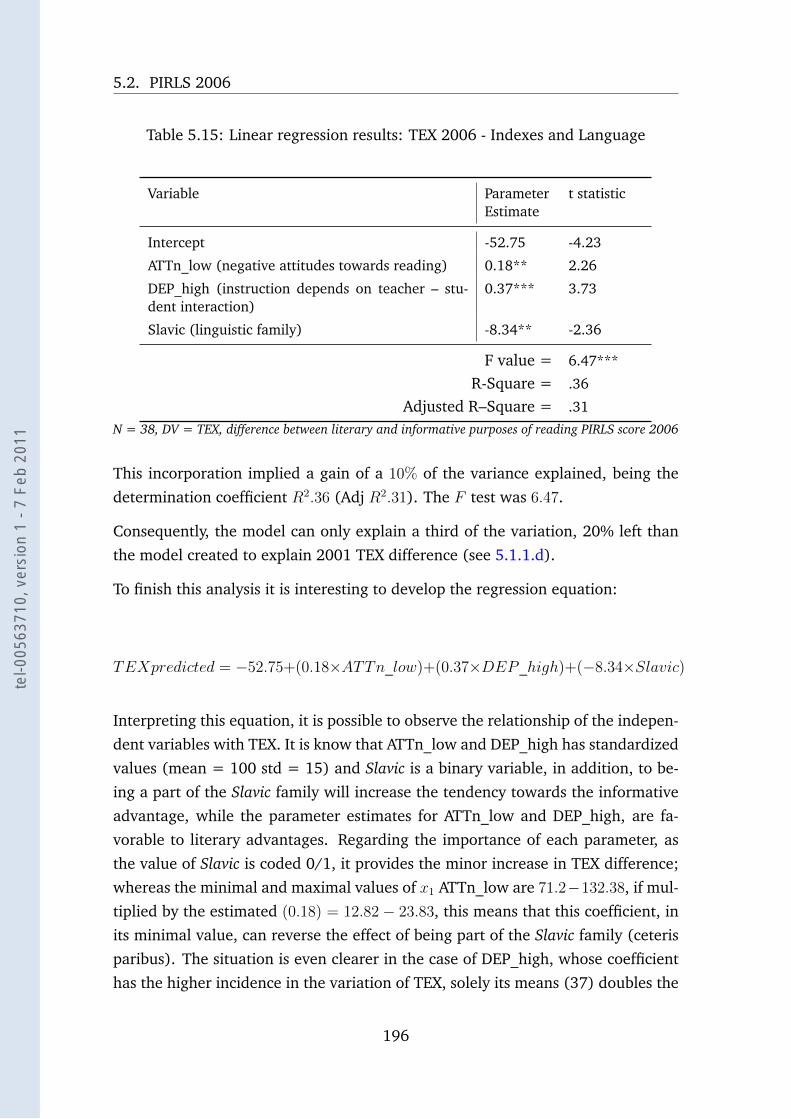
5.2. PIRLS 2006
Table 5.15: Linear regression results: TEX 2006 - Indexes and Language
Variable ParameterEstimate
t statistic
Intercept -52.75 -4.23
ATTn_low (negative attitudes towards reading) 0.18** 2.26
DEP_high (instruction depends on teacher – stu-dent interaction)
0.37*** 3.73
Slavic (linguistic family) -8.34** -2.36
F value = 6.47***
R-Square = .36
Adjusted R–Square = .31
N = 38, DV = TEX, difference between literary and informative purposes of reading PIRLS score 2006
This incorporation implied a gain of a 10% of the variance explained, being the
determination coefficient R2.36 (Adj R2.31). The F test was 6.47.
Consequently, the model can only explain a third of the variation, 20% left than
the model created to explain 2001 TEX difference (see 5.1.1.d).
To finish this analysis it is interesting to develop the regression equation:
TEXpredicted = −52.75+(0.18×ATTn_low)+(0.37×DEP_high)+(−8.34×Slavic)
Interpreting this equation, it is possible to observe the relationship of the indepen-
dent variables with TEX. It is know that ATTn_low and DEP_high has standardized
values (mean = 100 std = 15) and Slavic is a binary variable, in addition, to be-
ing a part of the Slavic family will increase the tendency towards the informative
advantage, while the parameter estimates for ATTn_low and DEP_high, are fa-
vorable to literary advantages. Regarding the importance of each parameter, as
the value of Slavic is coded 0/1, it provides the minor increase in TEX difference;
whereas the minimal and maximal values of x1 ATTn_low are 71.2−132.38, if mul-
tiplied by the estimated (0.18) = 12.82 − 23.83, this means that this coefficient, in
its minimal value, can reverse the effect of being part of the Slavic family (ceteris
paribus). The situation is even clearer in the case of DEP_high, whose coefficient
has the higher incidence in the variation of TEX, solely its means (37) doubles the
196
tel-0
0563
710,
ver
sion
1 -
7 Fe
b 20
11
Chapter 5. Individual and school factors related to reading aspects
values of ATTn_low and it is four times greater than Slavic. Since DEP_high is
a positive coefficient, it can reverse the effect of the highly negative value of the
constant.
Examining how this equation could work in the country sample, it is possible to
explain some tendencies of TEX by the incidence of those factors. For example, the
case of a Slavic country, like Poland, where there were many teachers declaring
to work in direct interaction with the students (DEP_high = 130.3), this was two
standard deviations over the average, at the same time, the Polish students had
average negative attitudes towards reading (101.93). Those results can explain
why this particular country had a TEX difference favorable to literary reading,
which was the contrary of the general tendency of the Slavic countries. In con-
trast, an opposite example is the case Hong Kong where the proportion of students
having negative attitudes and dependent work were one s. d. under the average
(88.11, 85.33), this could explain the informative tendency of the TEX difference
(−11.31), a similar behavior, with even lower regressors was noticed in Taipei
data, another country where Chinese is the language.
Finally, a valid question is if Slavic is a real linguistic factor, and not an economic
or geographic one. A first assertion favorable to this hypothesis is that there were
other countries in the region such as Georgia and Romania, whose results were
higher in reading literary texts, unlike the Slavonic block, those countries partic-
ipated in this block in geographic terms but not in linguistic proximity. Secondly,
we must mention the PIRLS 2001 results, already commented here, where the
Slavic family was also the referential predictor of the model. Moreover, it was the
only factor that was able to be part of both models.
197
tel-0
0563
710,
ver
sion
1 -
7 Fe
b 20
11

5.2. PIRLS 2006
5.2.2 Processes of Comprehension 2006
This is the last analysis of individual variables obtained from the assesments, as it
was announced before. Then, the next step will be a comparison of the two PIRLS
surveys. To finish with this previous stage, it is fundamental to describe how
this other component of the lecture process has functioned. The methodological
procedure will be the same already applied in the previous sections.
5.2.2.a Student Questionnaire
The student sub-set was made up of the same 42 questions used for the analysis
of TEX. From there, 37 derived variables were correlated to COM, even if this
quantity was very significant to this research, many of these variables came from
the same source, specifically from the high and low value of the factors described
by the questions. As a result, if only each question was counted, instead of the
variables, the amount was only 21; the difference in connection to the previous
analysis was that a higher quantity of variables “by question” was correlated (see
appendix A.10). This tendency has been constant in the rest of the questionnaires.
So is a particular property of COM 2006.
First, reading those results, there are positive and negatives factors related to low
order processes. The negative variables were the following home activities: notreading or listening aloud reading, never talk with the family about reading, neverread to find out things wanted to learn, never read magazines, explicative books ordirections and instructions. Other negatives factor that also contribute to a better
score in low order process were: the students think they are not reading as well asother, and some class activities: never read aloud to small groups, to have teacherthat do not read aloud and do not talk with other students about what they read.
In contrast, there were only two positive home activities: reading comic books andsubtitles on television.
Secondly, concerning high order processing, the advantage was related to school
activities like: reading silently on their own, and following others lecture, there were
some variables describing evaluation procedures: to answer questions aloud, in aworkbook or to write something about the reading. Regarding individual factors,
self concept about reading was again correlated: thinking to not understand al-most everything, and, contradictory, believing to read as fast as other students. In
198
tel-0
0563
710,
ver
sion
1 -
7 Fe
b 20
11

Chapter 5. Individual and school factors related to reading aspects
this case, this contradiction could be related to the difference between depth and
speed, this last is an objective of the fist steps of learning but should be overcome
later to focus in comprehension. In contrast, this same insecurity in own com-
prehension capacities, could be a consequence of being aware of the existence of
those deeper levels.
In connection to the correlations, the higher coefficient from this questionnaire
was found in the correlation between COM and the percentage of students whose
teacher never read aloud to the class (r=.50***). Additionally, other highly sig-
nificant correlation was related to the absence of informative readings: to read
directions or instructions (r=.48***)
Table 5.16: Correlation Coefficients: Variable COM - Student Indexes
SOC_low, Sociability of reading learning: the students do notread or listen to someone reading, do not talk with theirfamily about reading or read aloud at school to the class orto small groups.
.40**
IFCH_low, Reading with informative purposes: the studentsdo not read explicative books, magazines and directions, orto learn things at home.
.48***
RIND_high, Individual reading learning: the students fre-quently read silently at school, they answer to questions ina workbook or write something about their readings.
-.45***
Those home and school conditions coming from the answers of the student ques-
tionnaire, led to think that the difference between high and low order processes
was related to two principal concepts in this questionnaire: the social sharing ofknowledge and the individual reading learning.
The first factor was founded in the incidence of learning helped by other people
listening or reading (family, teacher and other students), to interact often with
others during reading was related to an improvement of low order score, whereas
a more individual and silent work (read and being evaluated alone), improved the
higher ones. This was translated into indexes (see table 5.16) and this tendency
was indeed confirmed.
In second place, concerning the individual reading learning, it was related to some
activities that were done individually at school. It is necessary to remember that
199
tel-0
0563
710,
ver
sion
1 -
7 Fe
b 20
11
5.2. PIRLS 2006
the incidence of individuality was already mentioned in analyzing TEX (see Table
5.14), thus it could have been interesting to find some correlation between this
new variable RIND and the ancient variable IND. However, this correlation did not
exist, and either RIND was related to TEX or IND was related to COM. However,
this was not surprising, because the ancient variable was constructed from infor-
mation coming from the teacher questionnaire, and was describing their particular
point of view of the school work; moreover, the variables were not combined in
the same way, since the objectives of analysis were different.
Finally, a third index was created, it characterized informative reading and was
related to an advantage in lower order processes. This tendency was already rec-
ognized in the 2001 analysis, accordingly, it is possible to affirm that there was
a deeper connection between this purpose of reading and low order COM. The
reason could be related to the fact that a text whose purpose is to inform, is a
text that expresses its meaning in the superficial levels, in an explicit and direct
way. This does not imply that an informative text can not reach other levels of
complexity, but it makes a greater use of explicit information, which a literary text
can omit.
From those three indexes, the first and the third were correlated to the total score.
In fact, the positive correlation between SOC_low and the score was very impor-
tant, r = .61 ∗ ∗∗, whereas there was a negative correlation between RIND_high
and the score, r = −.45 ∗ ∗∗. These correlations proved that it would be a mistake
to associate directly the development of the high order processes and the improve-
ment of the total scores, as the interactions between the processes and the score
are more complex and pluridimentional.
In regards to the connection of those results and the results obtained during the
2001 data analysis, it must be mentioned that, only taking into account the orig-
inal questions, the quantity of variables correlated was now twice as big (10 in
PIRLS 2001, 21 in 2006). However, this increment was not linked with an incre-
ment in coherence between both questionnaires; only 3 questions were correlated
in both data sets. These three variables were:
• Read silently in school.
• Believing on not reading as well as other students.
• To read comics books at home.
200
tel-0
0563
710,
ver
sion
1 -
7 Fe
b 20
11
Chapter 5. Individual and school factors related to reading aspects
As it can be observed, those variables were not very related either among them
or with the factors identified. However, there was a factor that was correlated to
both COM differences. In 2001, the Individual Activities (InLe_high) was the only
factor that could be inferred from the data, then, in 2006 there were two factors
that were also related to individuality and socialization. Even if the indexes were
not constructed from the same variables, in both cases the tendencies indicated
that a high individuality was related to better results in high order processing,
in contrast, a high socialization indicates the contrary. Individuality was also the
subject of an index presented in both data sets, it was correlated to COM in the
same way as reported, the principal difference was that, in 2001, this index was
highly correlated with the total score while now there was not a correlation.
Coming back to the 2006 description, two final variables were related to the use of
language, even if the correlations values were not particularly high, it is important
to our research to mention that this was the only linguistic factor correlated to
COM: the fact of to speak or not speak the language of the test before starting school,it was related to a higher processes advantage.
To conclude, a general remark about the percentage of correlation, that was 44%
average, which was higher than the one from the indexes explaining the TEX dif-
ference (39%). It will be seen in the next indexes, that in general the correlations
are higher for this difference than for TEX.
5.2.2.b Teacher Questionnaire
The questions coming from the teacher questionnaire were largely the most signif-
icant data set in terms of correlations. From the forty questions taken into account,
92 derived variables were related to COM, coming from 32 questions. As it was
saw in the students results, there were many variables that represent several as-
pects of an answer to a unique question, in this case the ratio of correlations were
even bigger: 2.9 correlated variables per each question.
The teacher questionnaire had multiple topics on which the teachers were interro-
gated, yet the correlated variables were related to only a few subjects, as appendix
A.11 shows, the frequency of reading and language teaching, the supports used toteach reading, the teaching and evaluation methods. They will now be described
directly in connection to the indexes created since these four subjects embrace the
92 variables.
201
tel-0
0563
710,
ver
sion
1 -
7 Fe
b 20
11
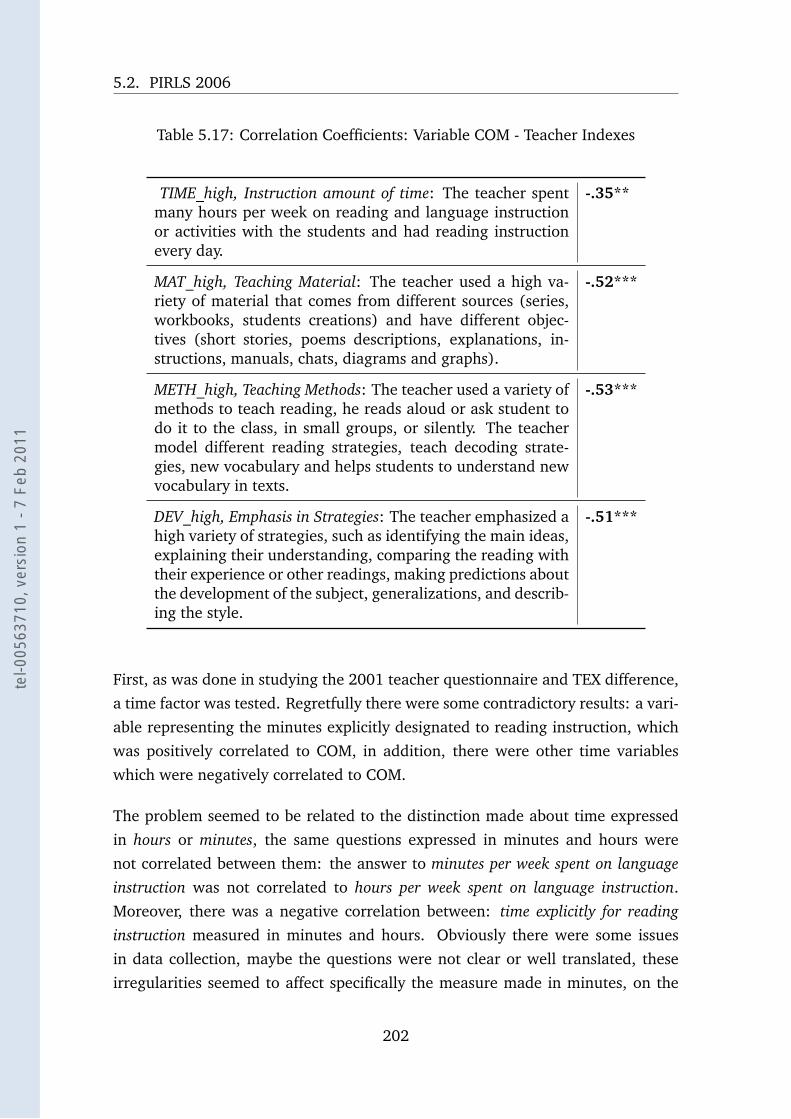
5.2. PIRLS 2006
Table 5.17: Correlation Coefficients: Variable COM - Teacher Indexes
TIME_high, Instruction amount of time: The teacher spentmany hours per week on reading and language instructionor activities with the students and had reading instructionevery day.
-.35**
MAT_high, Teaching Material: The teacher used a high va-riety of material that comes from different sources (series,workbooks, students creations) and have different objec-tives (short stories, poems descriptions, explanations, in-structions, manuals, chats, diagrams and graphs).
-.52***
METH_high, Teaching Methods: The teacher used a variety ofmethods to teach reading, he reads aloud or ask student todo it to the class, in small groups, or silently. The teachermodel different reading strategies, teach decoding strate-gies, new vocabulary and helps students to understand newvocabulary in texts.
-.53***
DEV_high, Emphasis in Strategies: The teacher emphasized ahigh variety of strategies, such as identifying the main ideas,explaining their understanding, comparing the reading withtheir experience or other readings, making predictions aboutthe development of the subject, generalizations, and describ-ing the style.
-.51***
First, as was done in studying the 2001 teacher questionnaire and TEX difference,
a time factor was tested. Regretfully there were some contradictory results: a vari-
able representing the minutes explicitly designated to reading instruction, which
was positively correlated to COM, in addition, there were other time variables
which were negatively correlated to COM.
The problem seemed to be related to the distinction made about time expressed
in hours or minutes, the same questions expressed in minutes and hours were
not correlated between them: the answer to minutes per week spent on languageinstruction was not correlated to hours per week spent on language instruction.
Moreover, there was a negative correlation between: time explicitly for readinginstruction measured in minutes and hours. Obviously there were some issues
in data collection, maybe the questions were not clear or well translated, these
irregularities seemed to affect specifically the measure made in minutes, on the
202
tel-0
0563
710,
ver
sion
1 -
7 Fe
b 20
11
Chapter 5. Individual and school factors related to reading aspects
contrary, the hours variables were all correlated positively among them, which
was not the case of the minutes.
Consequently, an index was developed but only considering hours: hours per weekspent in language instruction, reading instruction, the explicit hours dedicated in thecurriculum to reading instruction and the frequency (expressed in times per week)of reading instruction. Two remarks must be made about these variables, first, it
must be remembered the distinction between qualitative and quantitative time (see
5.1.1.b), the official amount of teaching time can play a different role in learning
than the real, effective amount of teaching time. In this case, since variables
representing both aspects were correlated, it was valid to create an index merging
them.
In second place, the distinction between reading and language teaching must be
mentioned, because, in fourth grade, if there was still an explicit time dedicated
to learn reading, it could be different from the time dedicated before. At present
grade, the basic reading and writing teaching was done, in most cases, it was
common that children continue to learn reading throw language and literature
instruction, but not explicitly reading lessons.
In both cases, the amount of time used to teach language or reading, was pos-
itively correlated to the advantage in high order processes; even if the value of
this correlation was the smallest among the created indexes. The countries with
the higher values for this variable, those who dedicate more time to language and
reading teaching were France, Trinidad and Tobago, the Russian Federation and
the United States.
The second factor identified were the supports, the materials used to teach read-
ing. In some cases, there are supports that can be directly related to specific pur-
poses of reading, (for example, a poem is a structure conceived with and literary
objective, as a description or a graph is the support to inform about someone
or something). However, this connection is not always that obvious, the notion of
supports is more clearly related to the material presentation of a text, consequently
is a more general classification.
This generalization about supports was necessary since there were texts with di-
verse objectives showing an equal tendency in connection to the COM difference.
Therefore, the common point was the variety of supports. This variety was asso-
ciated with an increment in difference favorable to the complex processes, even if
203
tel-0
0563
710,
ver
sion
1 -
7 Fe
b 20
11
5.2. PIRLS 2006
the supports to teach were as diverse as a poem and a graph. Was the increment
in variety what promoted higher order processes.
In third place, there were two indexes that were created following the same rea-
soning; on one hand, METH_high was refered to the different interaction among
the teacher and the students during reading instructions. The students worked
alone, with others students, or interacting with the teacher, while the teacher read
and taught strategies or helped with vocabulary. This index was the most corre-
lated of all with the advantage in high order processes. In table 5.17 the positive
variable is represented, but it is important to mention that not using these meth-
ods (noMETH) was even more correlated to COM (.62***). On the other hand,
the strategies index, DEV_high, also included in 2001 analysis, was related to the
emphasis of teachers in developing the mentioned reading strategies. Again, as
was said in 2001, even if the index included tasks associated with low order pro-
cesses like to identify the main idea of texts, all those variables were correlated to
an advantage in high order processing when the task was frequently done.
These last three indexes were also highly and positively correlated among them,
having a r coefficient of over .60 (the index of time was also correlated but slightly
lower), the most correlated indexes were DEV_high and METH_high, strategies
and methodology, having a r = .84 ∗ ∗∗. Consequently, if the teacher used to work
with a long selection of materials and asked the student to use strategies during
reading, this variety is favorable to the development of high order processes. How-
ever, even if the correlation coefficients with COM were very significant and the
indexes were also correlated among them, none of those indexes were correlated
to the total score.
Finally, a particularity of the correlations derived from teachers’ questionnaire was
the great quantity of variables that were correlated in both assessments 2001 and
2006. Firstly, there were some variables unrelated among them:
• Frequency of reading instruction.
• To use workbooks or worksheets.
• To ask the students to read aloud in small groups.
• To ask the students to read silently on their own.
• To model different reading strategies.
204
tel-0
0563
710,
ver
sion
1 -
7 Fe
b 20
11
Chapter 5. Individual and school factors related to reading aspects
• To teach strategies for decoding sounds and words.
Then, there were several variables derived from questions about the reading strate-
gies and competences emphasized:
• To identify the main idea.
• To compare the lecture with their experiences.
• To make predictions about what will happen next in texts.
• To make generalizations and inferences.
• To describe style or structure of the text.
In all the cases the correlations were similar in both data sets. Among the unre-
lated variables, there were two pairs of variables describing similar phenomena:
interactions during reading learning and instruction of strategies. Both pairs were
part of the factor identified as teaching methodology, the first pair was also related
to oral interaction factor or with organizational aspects. In addition, the second
pair was related to the factor unifying the second group of variables: the role
given to the reading strategies during instruction. The repetition of this last factor
is another reason to consider it a fundamental aspect of our results and to infer
that it can also play an important role in a more complex analysis.
5.2.2.c School Questionnaire
From the school subset, 31 variables derived from 14 questions, were significantly
correlated to COM. Regarding the tendencies of the correlation, some school activ-
ities related to low order processes were: to employ news–papers and/or magazinesand computer programs in their reading instructional program. Those two variables
had been used in previous indexes in relation to the variety of materials. It is in-
teresting that they have reappeared in the school correlations. However, it is not
possible to create a new variety because there were only two variables.
In contrast, the opposite of these two isolated variables was a group of 16 variables
related to the period in which the learning of a certain aspect of reading was first
emphasized. They are presented in appendix A.12 under the codeME∗∗, being ∗∗
205
tel-0
0563
710,
ver
sion
1 -
7 Fe
b 20
11
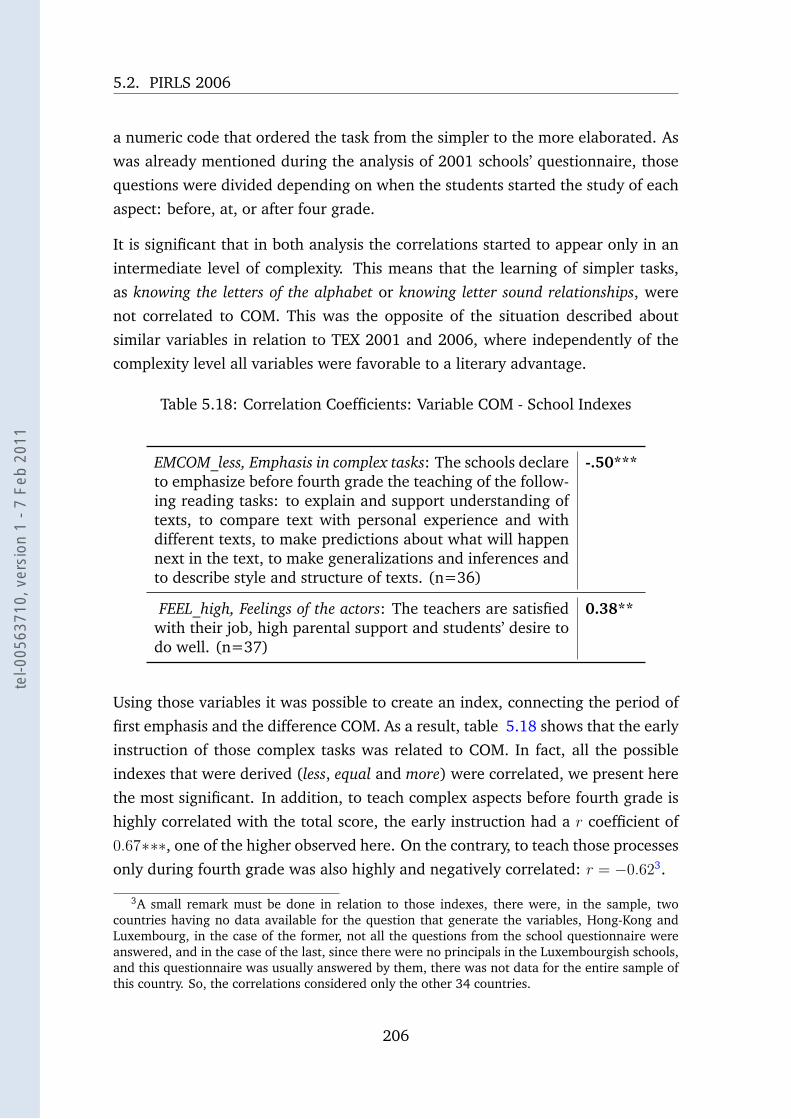
5.2. PIRLS 2006
a numeric code that ordered the task from the simpler to the more elaborated. As
was already mentioned during the analysis of 2001 schools’ questionnaire, those
questions were divided depending on when the students started the study of each
aspect: before, at, or after four grade.
It is significant that in both analysis the correlations started to appear only in an
intermediate level of complexity. This means that the learning of simpler tasks,
as knowing the letters of the alphabet or knowing letter sound relationships, were
not correlated to COM. This was the opposite of the situation described about
similar variables in relation to TEX 2001 and 2006, where independently of the
complexity level all variables were favorable to a literary advantage.
Table 5.18: Correlation Coefficients: Variable COM - School Indexes
EMCOM_less, Emphasis in complex tasks: The schools declareto emphasize before fourth grade the teaching of the follow-ing reading tasks: to explain and support understanding oftexts, to compare text with personal experience and withdifferent texts, to make predictions about what will happennext in the text, to make generalizations and inferences andto describe style and structure of texts. (n=36)
-.50***
FEEL_high, Feelings of the actors: The teachers are satisfiedwith their job, high parental support and students’ desire todo well. (n=37)
0.38**
Using those variables it was possible to create an index, connecting the period of
first emphasis and the difference COM. As a result, table 5.18 shows that the early
instruction of those complex tasks was related to COM. In fact, all the possible
indexes that were derived (less, equal and more) were correlated, we present here
the most significant. In addition, to teach complex aspects before fourth grade is
highly correlated with the total score, the early instruction had a r coefficient of
0.67∗∗∗, one of the higher observed here. On the contrary, to teach those processes
only during fourth grade was also highly and negatively correlated: r = −0.623.
3A small remark must be done in relation to those indexes, there were, in the sample, twocountries having no data available for the question that generate the variables, Hong-Kong andLuxembourg, in the case of the former, not all the questions from the school questionnaire wereanswered, and in the case of the last, since there were no principals in the Luxembourgish schools,and this questionnaire was usually answered by them, there was not data for the entire sample ofthis country. So, the correlations considered only the other 34 countries.
206
tel-0
0563
710,
ver
sion
1 -
7 Fe
b 20
11
Chapter 5. Individual and school factors related to reading aspects
Finally, there was another group of variables related to a subject already men-
tioned in analyzing 2001 data set: the incidence of expectations and wishes, the
most subjective aspects. Previously, a connection between literary advantage and
personal notions was identified, as desired to do well and satisfaction of the teacher.What was also particular was the total absence of correlation among those vari-
ables and the total score. Here, there was a similar situation, five variables were
derived from three questions describing subjective aspects and they were not
linked with the total score. If those variables are used to create an index, the
result was correlated to COM, even if the coefficient is one of the lowest found.
Nevertheless, the incidence of a subjectivity factor was recurrent and will be stud-
ied more in depth.
5.2.2.d Linear regression model
The last step of the analysis was to construct a model to explain the variation of
the difference between the two orders of processes. First, an index from the stu-
dent sample was selected, since the correlations were already known, the most
suitable candidate was the most correlated to COM: IFCH_low, which represents
a low proportion of students declaring to read with informative purposes at home.
A linear regression where the variation of COM was explained only by this in-
dex, produced a determination coefficient of R2 .23 (Adj R2.21). Being this value
significant in accord with the F test (10.76***).
The next step was to add to the model a teacher regressor, after several tests,
MAT_high, the index of teaching material, was the best option. A regression con-
sidering these two factors was made, the model fitted to explain the R2 .35 (Adj
R2.32) of the variability of COM, the F test (9.58***) was still being valid. Conse-
quently, this factor added a 10% to the explicability of the model. The combination
of these two factors in the explanation of COM, seemed coherent in terms of in-
terpretation, since they shared common characteristics as the use of informative
material. What was also important was that one represented a home habit, and
the other a scholar factor.
Following the analysis, as in the previous models, the languages were also con-
sidered here. Several regressions including combinations of indexes and one lin-
guistic family were tested, even if there were other significant combinations, with
Germanic and Slavic families, the best alternative was the one presented here (see
207
tel-0
0563
710,
ver
sion
1 -
7 Fe
b 20
11
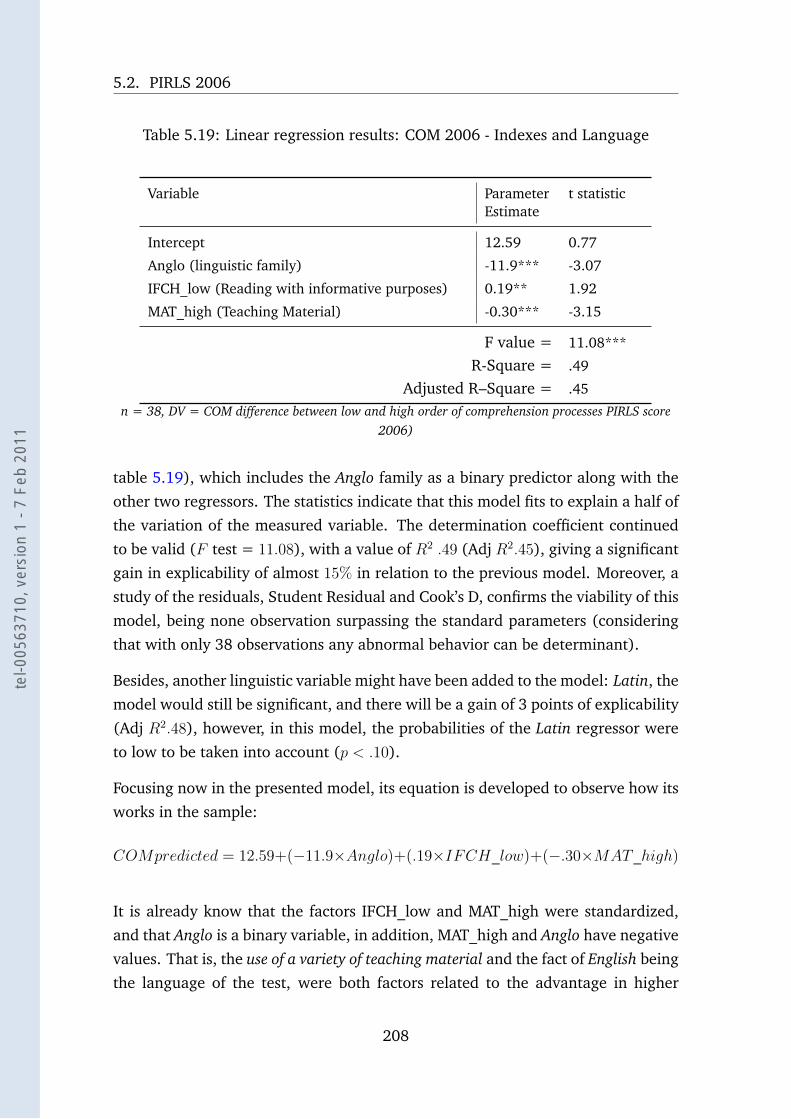
5.2. PIRLS 2006
Table 5.19: Linear regression results: COM 2006 - Indexes and Language
Variable ParameterEstimate
t statistic
Intercept 12.59 0.77
Anglo (linguistic family) -11.9*** -3.07
IFCH_low (Reading with informative purposes) 0.19** 1.92
MAT_high (Teaching Material) -0.30*** -3.15
F value = 11.08***
R-Square = .49
Adjusted R–Square = .45
n = 38, DV = COM difference between low and high order of comprehension processes PIRLS score2006)
table 5.19), which includes the Anglo family as a binary predictor along with the
other two regressors. The statistics indicate that this model fits to explain a half of
the variation of the measured variable. The determination coefficient continued
to be valid (F test = 11.08), with a value of R2 .49 (Adj R2.45), giving a significant
gain in explicability of almost 15% in relation to the previous model. Moreover, a
study of the residuals, Student Residual and Cook’s D, confirms the viability of this
model, being none observation surpassing the standard parameters (considering
that with only 38 observations any abnormal behavior can be determinant).
Besides, another linguistic variable might have been added to the model: Latin, the
model would still be significant, and there will be a gain of 3 points of explicability
(Adj R2.48), however, in this model, the probabilities of the Latin regressor were
to low to be taken into account (p < .10).
Focusing now in the presented model, its equation is developed to observe how its
works in the sample:
COMpredicted = 12.59+(−11.9×Anglo)+(.19×IFCH_low)+(−.30×MAT_high)
It is already know that the factors IFCH_low and MAT_high were standardized,
and that Anglo is a binary variable, in addition, MAT_high and Anglo have negative
values. That is, the use of a variety of teaching material and the fact of English being
the language of the test, were both factors related to the advantage in higher
208
tel-0
0563
710,
ver
sion
1 -
7 Fe
b 20
11
Chapter 5. Individual and school factors related to reading aspects
processes. On the contrary, the parameter estimated of IFCH_low is positive, that
is, a low amount of home lecture with informative purposes was related to the
advantage in lower-order comprehension processes.
In relation to the contribution of each parameter to the explicability of the model,
the smallest was Anglo, which can have a value of 0 or −11.9, however, this is not
insignificant, because, it can almost revert the effect of the intercept’s estimated
parameter, approaching it to 0. On the other hand, in the sample, the minimal
and maximal values of IFCH_low were 70.40/139.42, being .19 × IFCH_low =
13.34/26.49, this means that this estimation, in its minor amount, can annul the
effect of being Anglo, or even duplicate its value. In a non Anglo country where
students aren’t used to reading with informative purpose, the tendency will be the
lower-order processes advantage.
This tendency can be completely reversed with the last parameter: MAT_high,
since it was standardized as IFCH_low, the parameter estimated indicates that its
incidence was one third greater, and could be more determinant than the linguistic
factor, the minimal and maximal values of −.30 ×MAT_high were 23.78/41.54,
this was from 3 to almost 4 time bigger than −11.9 × Anglo. This is a very im-
portant fact, because the methodology of teachers can be more easily controlled
or modified than habits, thus it can improve the achievement in the high-order
processes.
To conclude, it can be observed how these factors were distributed in the country
sample. Looking at the members of the Anglo family, it is remarkable that none of
those countries were over the average in relation to IFCH_low, which means that
they did not have an elevated amount of students not reading with an informative
purpose (this is all the information that this variable gives, which does not reveal
anything about what they were actually reading). Those countries showed higher
values in the index of teaching material, even though there were not among the
maximal values of the sample.
Among the countries under the average in the index of Low Informative Readingat home, there were only three countries that were also under the average in
the index of Teaching Material: Indonesia, Macedonia and England; on the other
border of the list, the countries which are above the average in IFCH_low index,
are generally not over the average in the Teaching Material index. This shows
clearly the opposite relation that is present between them.
209
tel-0
0563
710,
ver
sion
1 -
7 Fe
b 20
11
5.2. PIRLS 2006
Finally, looking at the case of a non English-speaking country, the Netherlands
was a good example of the last statement. It had the maximal value of IFCH_low
(139.42), thus the bigger proportion of students not reading with informative pur-
poses and, in contrast, it had one of the 6 lower values in the index MAT_high
(86.36). That is, the less flexible teaching methodology. Moreover, in developing
the equation: b1(0), 0.19× IFCH_low = 26.49 and −0.30×MAT_high = −25.91;
adding the constant to this values, the predicted value of COM is 13.17. This
shows how, even being the −0.30 × MAT_high almost equally elevated than
0.19 × IFCH_low, the incidence of the constant and a value 0 of the linguistic
factor finally incline the tendency to the low order advantage.
At this point of the research, it is not possible to go further in explaining the lin-
guistic incidence and the contextual factors in relation to the aspects of reading
learning in PIRLS. The explicated variances were a highly significant proportion,
but they are only talking about countries, that is, in very general terms in com-
parison to the complexity of PIRLS results. Consequently a deeper analysis will be
done in the next chapter. But before it is necessary to organize and resume the
factor identified.
210
tel-0
0563
710,
ver
sion
1 -
7 Fe
b 20
11
Chapter 5. Individual and school factors related to reading aspects
5.3 Description of the findings
To finish this chapter, a review of all the findings must be done. The purpose is not
only to synthesize the work already done, but principally to connect it with what
will be done in the next chapter. Consequently, general assertions will be done
first; secondly, findings discovered during the analysis of both aspects of reading
will be presented. But more than just mentioning them, it necessary to think about
their pertinence as predictors: it will still be possible to considerer them as factors
determining reading achievement if a more complex scenario is established? Some
hypothesis about the answer will be elaborated.
First, following the amount of correlated variables, and taking into account the
different quantities of questions used from each questionnaire it seems that the
TEX difference is more related with students’ aspects than COM. Moreover, the
coefficients of correlations were, both, 2001 and 2006, more positive than nega-
tive, that is, literary related. However, in the regression step, the student’s factors
were not more present than the other components; on the contrary, they were not
able to be part of the model created to explain TEX 2001 variation. Consequently,
even if there are some indications that let to infer a particular connection between
students’ aspects and the difference TEX, it is far from being confirmed, but it will
be noticed if it is present again in later analyses.
In contrast, the informational tendency of TEX is more related to school factors,
and particularly negative schools factors. At it was discussed, the informational
advantage appeared more among disadvantage students: immigrants, homes with
low incomes and schools where the conditions of learning were difficult.
It will be necessary to study if this is really an informative advantage or a liter-
ary disadvantage instead. In that case, literary advantage will become a property
of good learning conditions, because the contrary tendency to all these negative
factors. However, at least at country level, there is not a clear tendency related to
literary reading among countries with the best scores. On the contrary, if the best
five scores of each study are examined (see tables 5.2 and 5.3), it can be observed
that only two countries had a literary advantage in 2001 and none in 2006, more-
over there were two countries with a clear informative advantage among those
first five scores (Hong Kong and Singapore).
Regarding the process of comprehension, if the low and high order scales are
211
tel-0
0563
710,
ver
sion
1 -
7 Fe
b 20
11
5.3. Description of the findings
regarded separately, it is possible to see that the correlations found in the first case
were focused in individuals, and how they socialized their reading habits. On the
contrary, the high order processes were related to school factors, there was almost
a total absence of home factors in this area, this lack, implies that this difference
may be more determined by school or teacher factors.
Finally, there were variables that were correlated with both differences TEX and
COM. On one hand, a connection was found between literary and high order pro-
cesses advantages. On the other hand, there were also several variables showing
a connection between informative and low order advantages.
Consequently, the relation among the difference, the contextual factors and the
total score must be closely studied. There are two possible explanations to these
findings, this relation may be complex and only describable in a most sophisticated
setting, as the one that will be developed, or, the advantage or disadvantage may
simply play no part in final results, which is also a possible result of modelling
those variables.
5.3.1 Factors related to the purposes of reading
From the factors identified during this analysis, what follows is a list of these
possible determinants, which will be taken into account in the next chapter, during
the modelling process. As the objective of this research pointed out (see 3.4.3),
the final goal will be a general model including all factors, this is why in the
next section, the variables that will be implemented will be part of another kind
of analysis. Consequently, the original correlations described in this chapter will
be only a general reference. However they were organized here according to the
correlations that were their source because this allows a clear image of their origin
and could be a reference for later analysis.
5.3.1.a Factors related to the literary purpose
Attitudes toward reading: from the significance of the index SATR in 2001 and
some separate variables in 2006, it is possible to infer that the degree of positivism
or negativism of the students’ attitudes can play a role in literary score. Specifi-
cally, a favorable tendency to literary reading was observed when those attitudes
were positives.
212
tel-0
0563
710,
ver
sion
1 -
7 Fe
b 20
11
Chapter 5. Individual and school factors related to reading aspects
Reading self concept: a similar situation was the case of the index SRSC of PIRLS
2001 and some of the variables forming it that were correlated to TEX in 2006.
But, in contrast, a student declaring to think that it is difficult to read was a reader
showing a literary advantage as well.
Economic resources at home: this factor was represented by two variables, the
first, an index created from some answers to the students’ questionnaire, the sec-
ond the principal’s perception of the school resources. In both cases high resources
were linked to an advantage for literary reading. However, the relevance of this
factor is not yet confirmed since both variables were mostly correlated to 2001
data.
Instruction depends on teacher–student interaction: Several variables indi-
cated that a more continuous presence of the teacher during reading instruction
was linked to a literary advantage. However, it will be particularly important
to test this possibility with more accurate instruments, and better defined vari-
ables, particularly if it is connected to the results of the variable describing the
autonomous work.
Time: some significant correlations indicated a connection between the quan-
tity of time devoted to reading instruction and a literary advantage. But, as was
pointed out previously (see 5.1.1.b), this results were very partial and contradic-
tory with other variables describing the same factor. We expect that a deeper
analysis will allow a better appreciation of the role played by this factor.
Availability of books at home: This is a single variable in the PIRLS data, and it
will be also used here independently of other variables. The reason is its potential
significance as predictor because of the correlation shown in both 2001 and 2006
previous analysis. The variable indicating the absence of books at home had the
higher coefficient of correlation with TEX in 2006 students’ questionnaire. In both
cases those variables were also correlated to the total score in more than a 70%.
Consequently, this factor can be a significant predictor of both scores, informative
and literary. It must be mention that this factor was also studied in both PIRLS
reports (see Mullis et al., 2003, pp 104–111) and (see Mullis et al., 2007, pp 114–
118) as part of a Educational Resources index. The only difference between them
is that while in 2001 the report point the five possible answers to the questions
about the amount of books at home, PIRLS 2006 reduce them to the tree principal
ones (More than 100 Books 51–100 Books 26–50 Books). In creating the variables
213
tel-0
0563
710,
ver
sion
1 -
7 Fe
b 20
11
5.3. Description of the findings
for this research, a more simple presentation was also preferred.
5.3.1.b Factors related to the informative purpose
Mother tongue and the use of the school language: After the finding done
during the previous analysis, everything seems to indicate that the proportion
of using other languages in daily life plays a different role in reading literary or
informative texts. Several variables related to this subject were present in both
analyses showing similar tendencies. Those variables were part of the students’
and the schools’ questionnaire; consequently a factor combining that information
can be conceived. It will be interesting to study if this is really an informative
advantage or rather a literary disadvantage.
Oral activities in reading learning: only present in 2001 correlations, this is
an aspect that can be an interesting subject of analysis. Following the results,
a great amount of oral interaction during the learning process was linked to an
informative advantage. This can raise further questions about other aspects as its
connection with the total score and the exactitude of what we are describing as
oral. Those topics must be resolved in order to create a more significant variable
that can represent this factor.
214
tel-0
0563
710,
ver
sion
1 -
7 Fe
b 20
11
Chapter 5. Individual and school factors related to reading aspects
5.3.2 Factors related to the comprehension processes
5.3.2.a Factors related to the low order processes
Reading with informative purposes: As was mentioned in the introduction of
this section, a connection between purposes of reading and processes of compre-
hension was noticed. In developing a variable that represent one of those aspects,
this connection could be studied, among them, the best candidate was informative
reading because more variables were found correlated in studying COM differ-
ences, consequently it is possible to affirm that there is a deeper relation between
this factor and the studied difference.
5.3.2.b Factors related to the high order processes
Independent reading and social sharing: These two factors were presented to-
gether because the concepts that they represent are connected, the social sharing ofknowledge and the individual reading learning. The first is founded in the incidence
of students learning with other people listening or reading to them around (fam-
ily, teacher and other students), this seems to improve the lower–processes scores,
whereas a more individual and silent work (read and being evaluated alone), im-
prove the higher ones. The individuality is also a subject of an index present in
both data sets, in both cases it was correlated to COM, the only difference is that,
in 2001, this index was also correlated with the total score. Sociability, on the
other hand, besides its relation to COM, also showed a correlation with informa-
tive reading.
Emphasis in Strategies: in both assessments, the subject of several variables was
directly related to the processes of comprehension, some of them were theoreti-
cally associated to low processing, others to high processing, but it was the fact
of teaching them or not, that showed a correlation. In other words, to frequently
study strategies, even if those are low order strategies, was always correlated to an
advantage in high order processing. Then, its relation with the reading achieve-
ment must be taken into account in an explicative model.
Variety of instruction methods: similarly to the variety of reading supports, the
variety of methods of teaching was also identified as a factor. By this concept a
connection among several variables is established, variables that described how
215
tel-0
0563
710,
ver
sion
1 -
7 Fe
b 20
11
5.3. Description of the findings
the teacher organizes the class and what he/she does during reading instruction.
More variety was related to high order processing advantage. This tendency was
more clearly present in the 2006 analysis but there were some isolated variables
describing organization in 2001.
5.3.3 Factors related to both aspects of reading
Early learning of reading skills: In relation to TEX, the literary advantage was
increased if some aspects were learned at the school before fourth grade. They
were very different in complexity levels, indicating that it was the early learning
that was particularly positive. In relation to COM, not all the tasks were related,
just those representing a complex process. This factor was also related to the total
score, if these techniques were taught only during the fourth grade, there was a
negative influence in the reading results of the students.
Expectations and wishes: in correlation to TEX, this factor was only present in
2001 data, but there were isolated variables that pointed to this same idea in 2006.
In relation to COM, the factor was connected to high order processing. Taking
into account the importance of the variables representing this factor (teacher and
parents expectations, the students’ desire to do well) it will be included in our later
analysis. In addition, what is particularly interesting about those variables is that
they were not correlated at all with the total score. This indicates that the variables
describing this factor could help to test the subjectivity of those differences.
Variety in reading materials: This factor describes a variable created from several
different kinds of texts, independently of their purpose. The variable represented
a high or low diversity in the stimuli proposed to the students during reading
instruction. In the 2001 analysis the presence of this factor was related to a literary
advantage and also to a high order processing advantage. In 2006, the variable
could not be put into practice and correlated to TEX, but a certain variety among
the materials was recognized. In relation to COM 2006, it was found that a more
variety of supports was related to an advantage in high order processing. In both
studies this factor was also positively correlated to the total score.
216
tel-0
0563
710,
ver
sion
1 -
7 Fe
b 20
11
Chapter 6
Factor that influence reading inPIRLS
In this chapter the reading achievement will be explained by the contextual vari-
ables identified in the previous chapters. The same model will be used to explain
the total score and the partial results of each aspect of reading considered by
PIRLS. This will allow for the comparison of those results and the influence of
each variable in explaining those different results.
To keep continuity with the previous chapter, the following section will present
the variables derived from the analysis of PIRLS questionnaires in accord to the
factors that were previously identified. Then, the second section will describe the
sample which considered only those countries present in both data sets.
Table 6.1 shows the number of observations that will take part in this analysis.
The quantity is a fraction of the total PIRLS sample because it only counts the
28 countries that take part in both assessments (see table 4.1). The subject here
will not be countries but students, then, as was mentioned in the methodology
section (see 3.4.4), a modelization will be developed, which takes into account the
hierarchical structure of educational systems. From table 6.1 it can be inferred that
this structure will not show important differences between classes and teachers,
since they are almost equivalent (one teacher-one class); moreover, teachers may
not influence achievement in a different way from schools because of their similar
distribution. Nevertheless, all the levels: students, classes, teachers, schools, and
even countries, will be considered in the development of the explicative model,
because that will help to explain not only the scores but also the influence of the
217
tel-0
0563
710,
ver
sion
1 -
7 Fe
b 20
11
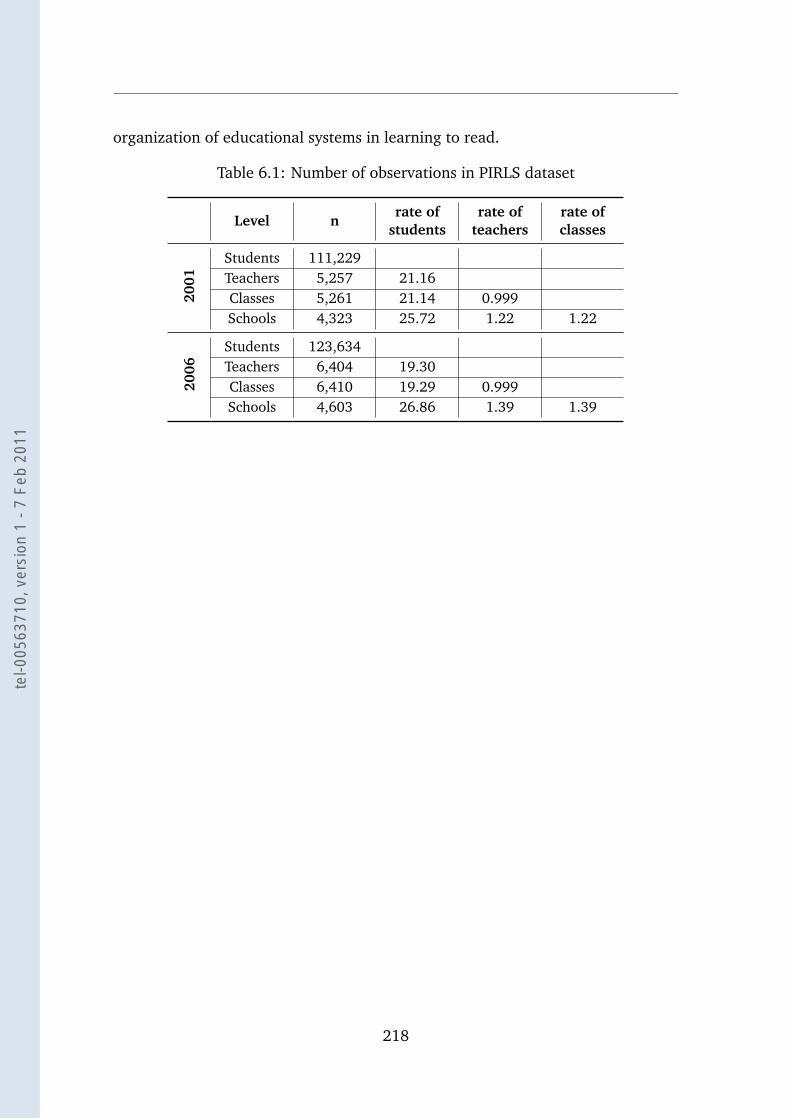
organization of educational systems in learning to read.
Table 6.1: Number of observations in PIRLS dataset
Level nrate of
studentsrate of
teachersrate ofclasses
2001
Students 111,229Teachers 5,257 21.16Classes 5,261 21.14 0.999Schools 4,323 25.72 1.22 1.22
2006
Students 123,634Teachers 6,404 19.30Classes 6,410 19.29 0.999Schools 4,603 26.86 1.39 1.39
218
tel-0
0563
710,
ver
sion
1 -
7 Fe
b 20
11
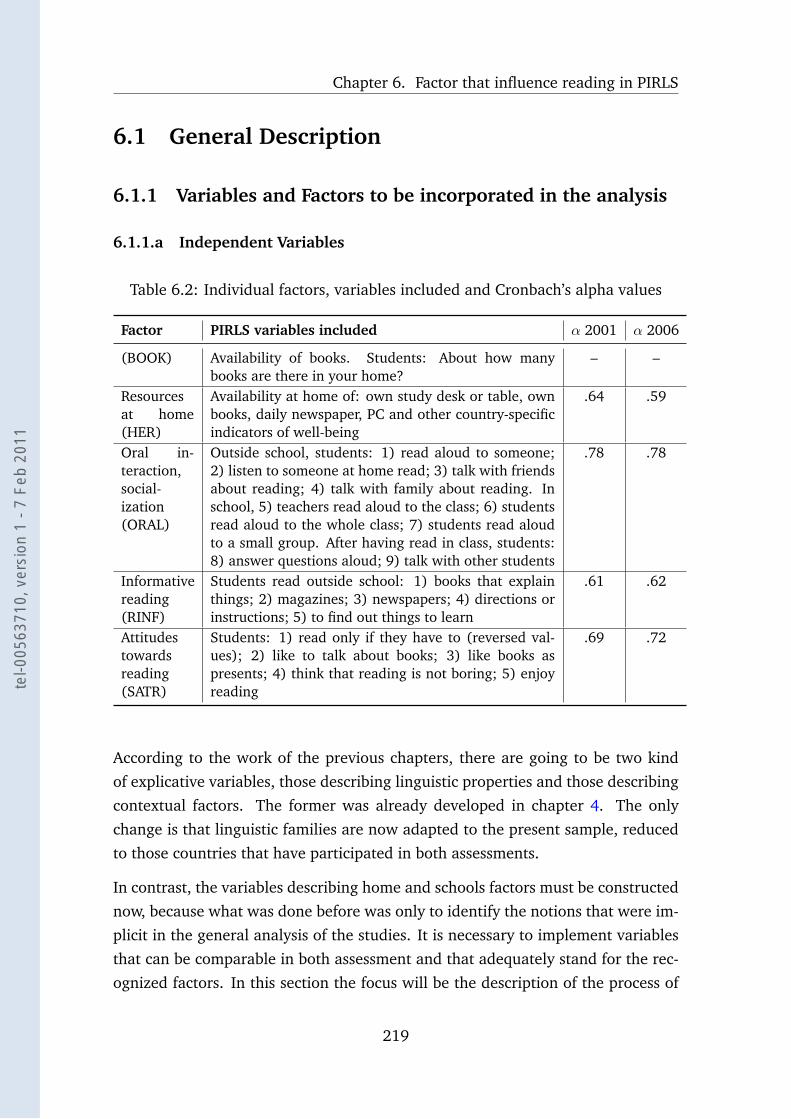
Chapter 6. Factor that influence reading in PIRLS
6.1 General Description
6.1.1 Variables and Factors to be incorporated in the analysis
6.1.1.a Independent Variables
Table 6.2: Individual factors, variables included and Cronbach’s alpha values
Factor PIRLS variables included α 2001 α 2006
(BOOK) Availability of books. Students: About how manybooks are there in your home?
– –
Resourcesat home(HER)
Availability at home of: own study desk or table, ownbooks, daily newspaper, PC and other country-specificindicators of well-being
.64 .59
Oral in-teraction,social-ization(ORAL)
Outside school, students: 1) read aloud to someone;2) listen to someone at home read; 3) talk with friendsabout reading; 4) talk with family about reading. Inschool, 5) teachers read aloud to the class; 6) studentsread aloud to the whole class; 7) students read aloudto a small group. After having read in class, students:8) answer questions aloud; 9) talk with other students
.78 .78
Informativereading(RINF)
Students read outside school: 1) books that explainthings; 2) magazines; 3) newspapers; 4) directions orinstructions; 5) to find out things to learn
.61 .62
Attitudestowardsreading(SATR)
Students: 1) read only if they have to (reversed val-ues); 2) like to talk about books; 3) like books aspresents; 4) think that reading is not boring; 5) enjoyreading
.69 .72
According to the work of the previous chapters, there are going to be two kind
of explicative variables, those describing linguistic properties and those describing
contextual factors. The former was already developed in chapter 4. The only
change is that linguistic families are now adapted to the present sample, reduced
to those countries that have participated in both assessments.
In contrast, the variables describing home and schools factors must be constructed
now, because what was done before was only to identify the notions that were im-
plicit in the general analysis of the studies. It is necessary to implement variables
that can be comparable in both assessment and that adequately stand for the rec-
ognized factors. In this section the focus will be the description of the process of
219
tel-0
0563
710,
ver
sion
1 -
7 Fe
b 20
11

6.1. General Description
elaborating the variables, stressing those last two aspects: their internal coherence
and their comparability.
Each of the variables will represent one of the factors identified in the previous
chapter, the variables will become standardized indexes (mean=0 std=1) that
sum up the values of PIRLS answers to the questions related to the subject of the
index. Consequently, a positive value will represent a high presence of the factor
and a negative value its absence. Regarding the internal coherence, it is necessary
to ensure that the PIRLS questions chosen to represent a factor are effectively in-
tercorrelated among them. Cronbach’s alpha statistic has been used as a measure
of internal consistency. This calculation is better known for been used to measure
the reliability of tests items, it is valid in this case because the problem is the same:
the goal is to evaluate if a set of variables is related to a latent construct, which is
supposed to be the identified factor.
Tables 6.2 and 6.3 show the value obtained for each index. The high correspon-
dence between the α coefficients of each year is remarkable, in many cases was
exactly the same. Since some students, teachers, schools or even entire coun-
tries did not answer certain questions, particular attention was paid to avoid the
inclusion of missing data in calculating this statistic, which is not robust against
it. Regarding the comparability, from the questions that were taken into account
in this analysis, most of them were present in both assessments with almost no
variation; but there were some exceptions. To assure comparability, only those
variables that were equivalent were tested to be part of the indexes. In the presen-
tation, there are two factors that represent PIRLS variables, BOOK and VATY, they
directly describe the factor of interest. In contrast, there were not other variables
to be liked with them, this is why they do not have a α value.
The variables were separated into two tables in accord to the database from where
the data was taken. On one hand, individual factors were inferred from questions
directly answered by the students; on the other hand, among school factors, only
one variable combined successfully the variables from student and school ques-
tionnaires: LGN, one variable was derived from the schools’ questionnaires: CHA,
and the six other variables were derived from teachers’ questionnaires. It is im-
portant to mention that, since the model will be a hierarchical structure, it will be
possible to try to study separately the explicability of each of these levels (student–
teacher–school).
220
tel-0
0563
710,
ver
sion
1 -
7 Fe
b 20
11
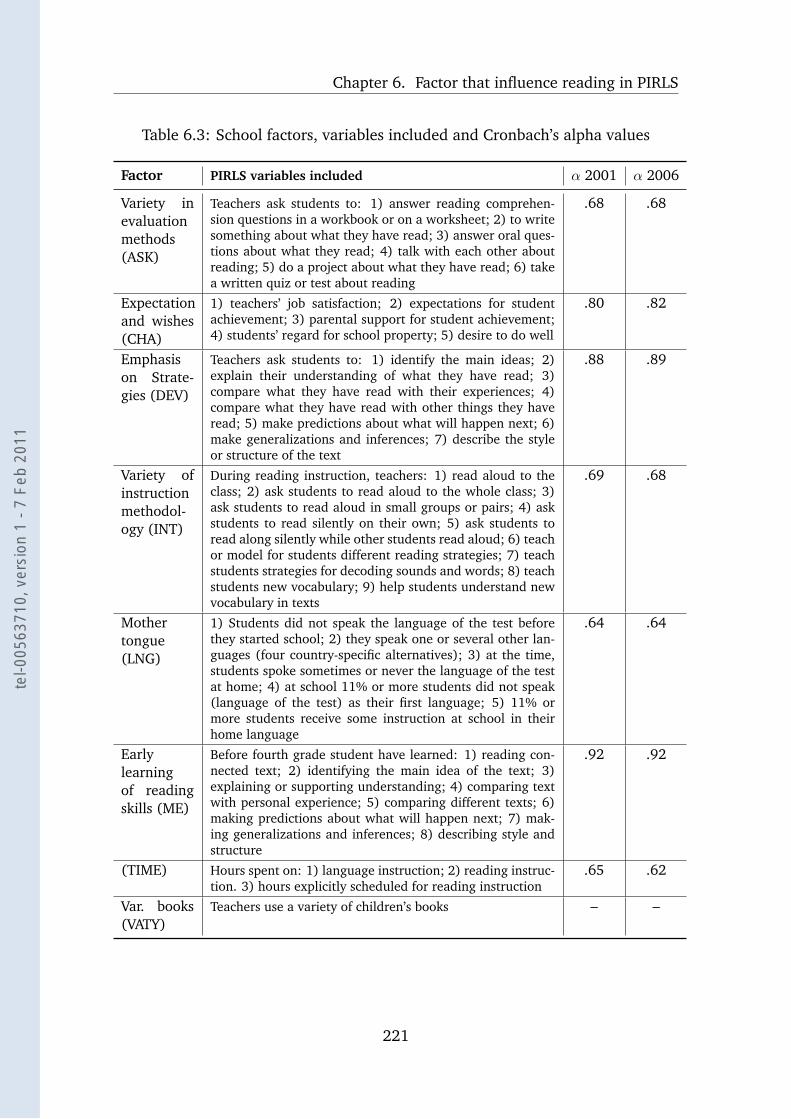
Chapter 6. Factor that influence reading in PIRLS
Table 6.3: School factors, variables included and Cronbach’s alpha values
Factor PIRLS variables included α 2001 α 2006
Variety inevaluationmethods(ASK)
Teachers ask students to: 1) answer reading comprehen-sion questions in a workbook or on a worksheet; 2) to writesomething about what they have read; 3) answer oral ques-tions about what they read; 4) talk with each other aboutreading; 5) do a project about what they have read; 6) takea written quiz or test about reading
.68 .68
Expectationand wishes(CHA)
1) teachers’ job satisfaction; 2) expectations for studentachievement; 3) parental support for student achievement;4) students’ regard for school property; 5) desire to do well
.80 .82
Emphasison Strate-gies (DEV)
Teachers ask students to: 1) identify the main ideas; 2)explain their understanding of what they have read; 3)compare what they have read with their experiences; 4)compare what they have read with other things they haveread; 5) make predictions about what will happen next; 6)make generalizations and inferences; 7) describe the styleor structure of the text
.88 .89
Variety ofinstructionmethodol-ogy (INT)
During reading instruction, teachers: 1) read aloud to theclass; 2) ask students to read aloud to the whole class; 3)ask students to read aloud in small groups or pairs; 4) askstudents to read silently on their own; 5) ask students toread along silently while other students read aloud; 6) teachor model for students different reading strategies; 7) teachstudents strategies for decoding sounds and words; 8) teachstudents new vocabulary; 9) help students understand newvocabulary in texts
.69 .68
Mothertongue(LNG)
1) Students did not speak the language of the test beforethey started school; 2) they speak one or several other lan-guages (four country-specific alternatives); 3) at the time,students spoke sometimes or never the language of the testat home; 4) at school 11% or more students did not speak(language of the test) as their first language; 5) 11% ormore students receive some instruction at school in theirhome language
.64 .64
Earlylearningof readingskills (ME)
Before fourth grade student have learned: 1) reading con-nected text; 2) identifying the main idea of the text; 3)explaining or supporting understanding; 4) comparing textwith personal experience; 5) comparing different texts; 6)making predictions about what will happen next; 7) mak-ing generalizations and inferences; 8) describing style andstructure
.92 .92
(TIME) Hours spent on: 1) language instruction; 2) reading instruc-tion. 3) hours explicitly scheduled for reading instruction
.65 .62
Var. books(VATY)
Teachers use a variety of children’s books – –
221
tel-0
0563
710,
ver
sion
1 -
7 Fe
b 20
11
6.1. General Description
Finally, as it was mentioned, not all the factors were able to be represented, the
reasons were related to issues of internal coherence or comparability: in some
cases, the variables that were believed to be related showed a weak or non-existent
relation with the others. In this case the specific variable was put apart, keeping
only those variables having an internal coherence over 60% in accord to the calcu-
lation of the Cronbach’s alpha. In other cases, the questions have changed in the
questionnaires, from the first assessment to the second, becoming impossible the
creation of analogous indexes. The factors that were unsuccessfully tested were:
• Instruction depends on teacher-student interaction
• Reading self concept
• Emphasis in writing instruction
• Individuality
• Curriculum development
6.1.1.b Dependent Variables
In the previous analysis, the difference between reading aspects were used as de-
pendent variables to help identifying those factors that were influencing reading
in specific ways in accordance to each reading type and process of comprehen-
sion. Now, that a series of factors have been developed from this work, it is time
to focus on the final objective: to study reading achievement. However, since,
apart from the total score, the scores representing each aspect are available, it will
be an improvement to this analysis to be able to compare how the factors react
in explaining each of those scores. Consequently, there will be several models
containing individual, school, and linguistic factors as explicative elements, and
having the total score, along with each partial score, as dependent variables. In
addition, since this stage also has a comparative goal, by repeating the same model
in the 2001 and 2006 dataset, a comparison of the behavior of the determinants
will be achieved.
In summary, the model will be replicated five times for each PIRLS dataset, includ-
ing the partial and total scores as dependent variables. The results between both
versions of the study will be compared.
222
tel-0
0563
710,
ver
sion
1 -
7 Fe
b 20
11
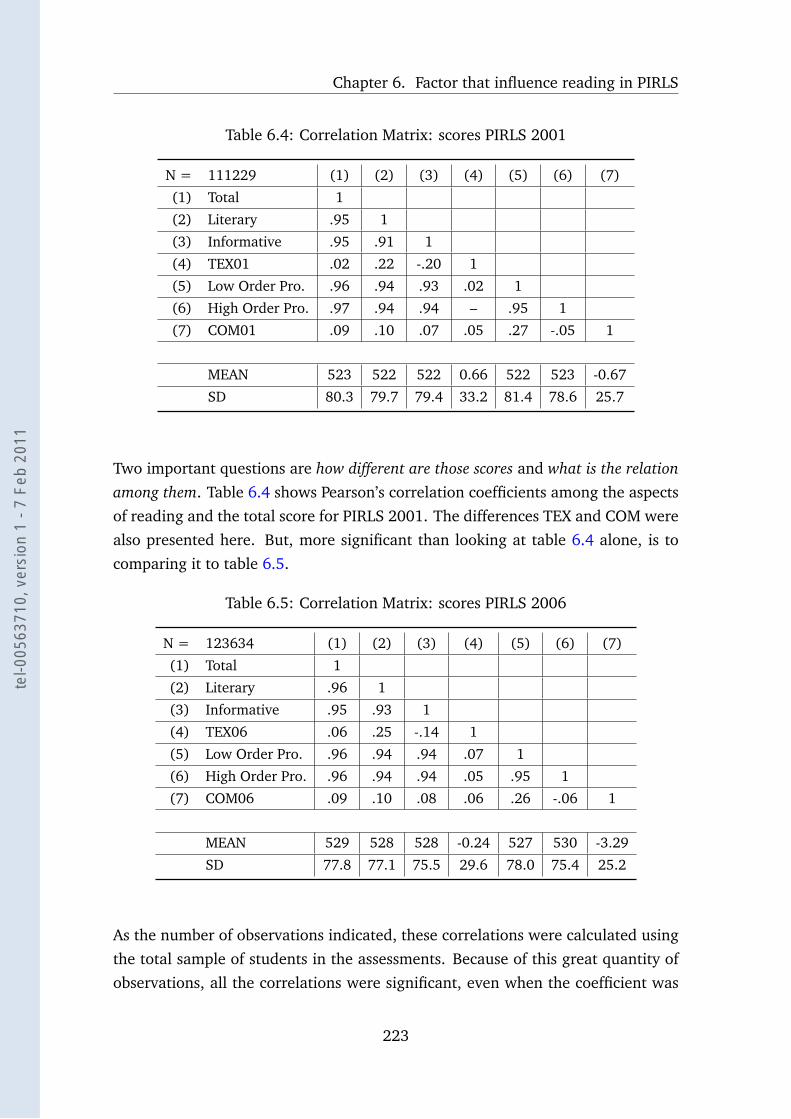
Chapter 6. Factor that influence reading in PIRLS
Table 6.4: Correlation Matrix: scores PIRLS 2001
N = 111229 (1) (2) (3) (4) (5) (6) (7)
(1) Total 1
(2) Literary .95 1
(3) Informative .95 .91 1
(4) TEX01 .02 .22 -.20 1
(5) Low Order Pro. .96 .94 .93 .02 1
(6) High Order Pro. .97 .94 .94 – .95 1
(7) COM01 .09 .10 .07 .05 .27 -.05 1
MEAN 523 522 522 0.66 522 523 -0.67
SD 80.3 79.7 79.4 33.2 81.4 78.6 25.7
Two important questions are how different are those scores and what is the relationamong them. Table 6.4 shows Pearson’s correlation coefficients among the aspects
of reading and the total score for PIRLS 2001. The differences TEX and COM were
also presented here. But, more significant than looking at table 6.4 alone, is to
comparing it to table 6.5.
Table 6.5: Correlation Matrix: scores PIRLS 2006
N = 123634 (1) (2) (3) (4) (5) (6) (7)
(1) Total 1
(2) Literary .96 1
(3) Informative .95 .93 1
(4) TEX06 .06 .25 -.14 1
(5) Low Order Pro. .96 .94 .94 .07 1
(6) High Order Pro. .96 .94 .94 .05 .95 1
(7) COM06 .09 .10 .08 .06 .26 -.06 1
MEAN 529 528 528 -0.24 527 530 -3.29
SD 77.8 77.1 75.5 29.6 78.0 75.4 25.2
As the number of observations indicated, these correlations were calculated using
the total sample of students in the assessments. Because of this great quantity of
observations, all the correlations were significant, even when the coefficient was
223
tel-0
0563
710,
ver
sion
1 -
7 Fe
b 20
11
6.1. General Description
as low as .05. The only uncorrelated values were high order process scores with
TEX 2001.
Regarding the means of both samples, it can be observed that in 2006 the scores
were all better by only a few points, a lot less than one standard deviation. More-
over, the means of all 2001 scores and 2006 scores are almost equal among them.
This could be considered as a consequence of standardization of the scores. Con-
cerning standard deviations, in 2006, they were similar or lower than in 2001 in
all cases. The variable COM shows a particularly similar SD between the samples.
In 2001, the greater correlation with the total score was the high order processes.
This is not surprising if one remembers that they represent an important part of
the questions. In 2006, when the proportion of variables of high and low orders
was equilibrated, the difference disappeared.
Keeping in mind the tendencies reported during the questionnaires analysis, it
could have been expected to see some correlations between the low order score
and the informative score, or the high order and literary score. This was not the
case in any of the samples, and they share all similar correlations. Low order
processes were equally correlated to informative and to literary reading in both
datasets, the same occurred to the high order score. Even if there were only 2
points of difference, the processes were more correlated to the total score than to
the aspects of reading.
As it can be expected, the higher correlation of TEX was with the literary score,
and then with the informative score. In addition, the higher correlation of COM
was with low order score, its correlation to the high order score was considerably
lower. However, these correlations are feeble, indicating that the differences are
mostly an independent fact.
To summarize, great stability can be observed between the two samples. The re-
semblance between the coefficients indicate that each score is reacting in a similar
way to the influence of the others scores and that the relations among them are
comparable. It is certainly the important amount of observations that help to im-
prove comparability. The question about the real need of creating these four scales
arise, as was mentioned in section 3.3.1, when it was mentioned how difficult is
to empirically prove the existence of different dimensions in PISA assessments.
224
tel-0
0563
710,
ver
sion
1 -
7 Fe
b 20
11
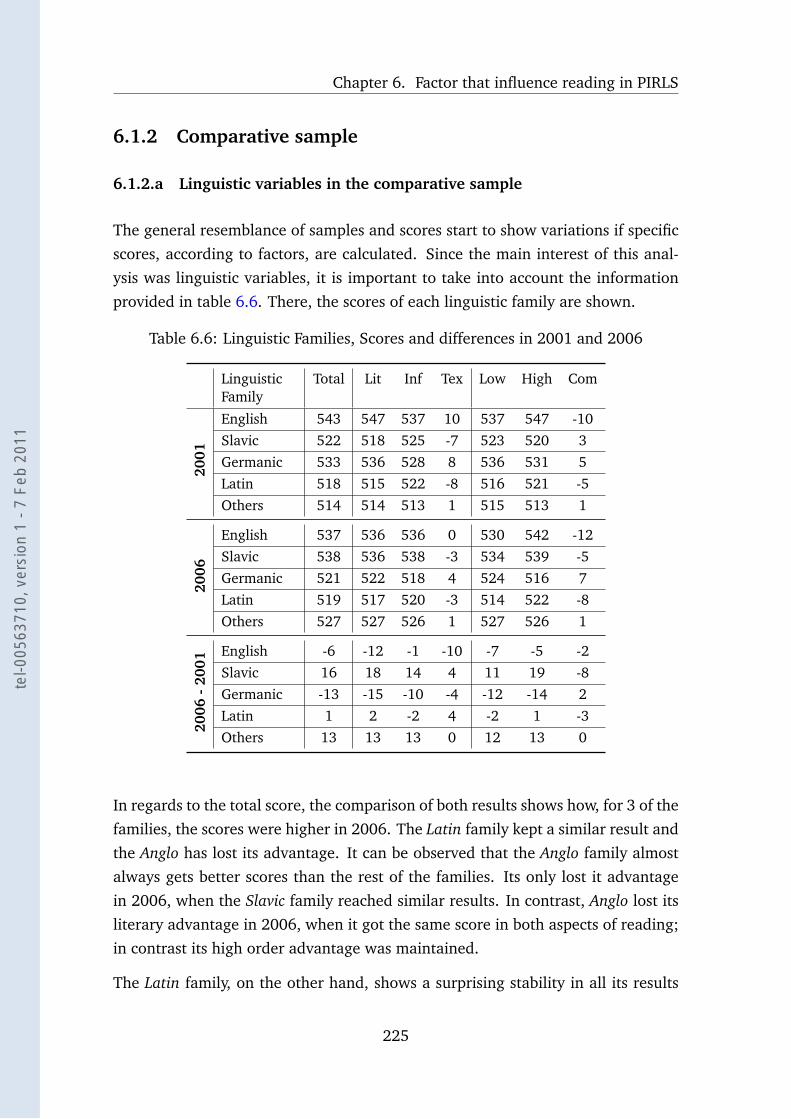
Chapter 6. Factor that influence reading in PIRLS
6.1.2 Comparative sample
6.1.2.a Linguistic variables in the comparative sample
The general resemblance of samples and scores start to show variations if specific
scores, according to factors, are calculated. Since the main interest of this anal-
ysis was linguistic variables, it is important to take into account the information
provided in table 6.6. There, the scores of each linguistic family are shown.
Table 6.6: Linguistic Families, Scores and differences in 2001 and 2006
LinguisticFamily
Total Lit Inf Tex Low High Com
2001
English 543 547 537 10 537 547 -10Slavic 522 518 525 -7 523 520 3Germanic 533 536 528 8 536 531 5Latin 518 515 522 -8 516 521 -5Others 514 514 513 1 515 513 1
2006
English 537 536 536 0 530 542 -12Slavic 538 536 538 -3 534 539 -5Germanic 521 522 518 4 524 516 7Latin 519 517 520 -3 514 522 -8Others 527 527 526 1 527 526 1
2006
-20
01
English -6 -12 -1 -10 -7 -5 -2Slavic 16 18 14 4 11 19 -8Germanic -13 -15 -10 -4 -12 -14 2Latin 1 2 -2 4 -2 1 -3Others 13 13 13 0 12 13 0
In regards to the total score, the comparison of both results shows how, for 3 of the
families, the scores were higher in 2006. The Latin family kept a similar result and
the Anglo has lost its advantage. It can be observed that the Anglo family almost
always gets better scores than the rest of the families. Its only lost it advantage
in 2006, when the Slavic family reached similar results. In contrast, Anglo lost its
literary advantage in 2006, when it got the same score in both aspects of reading;
in contrast its high order advantage was maintained.
The Latin family, on the other hand, shows a surprising stability in all its results
225
tel-0
0563
710,
ver
sion
1 -
7 Fe
b 20
11
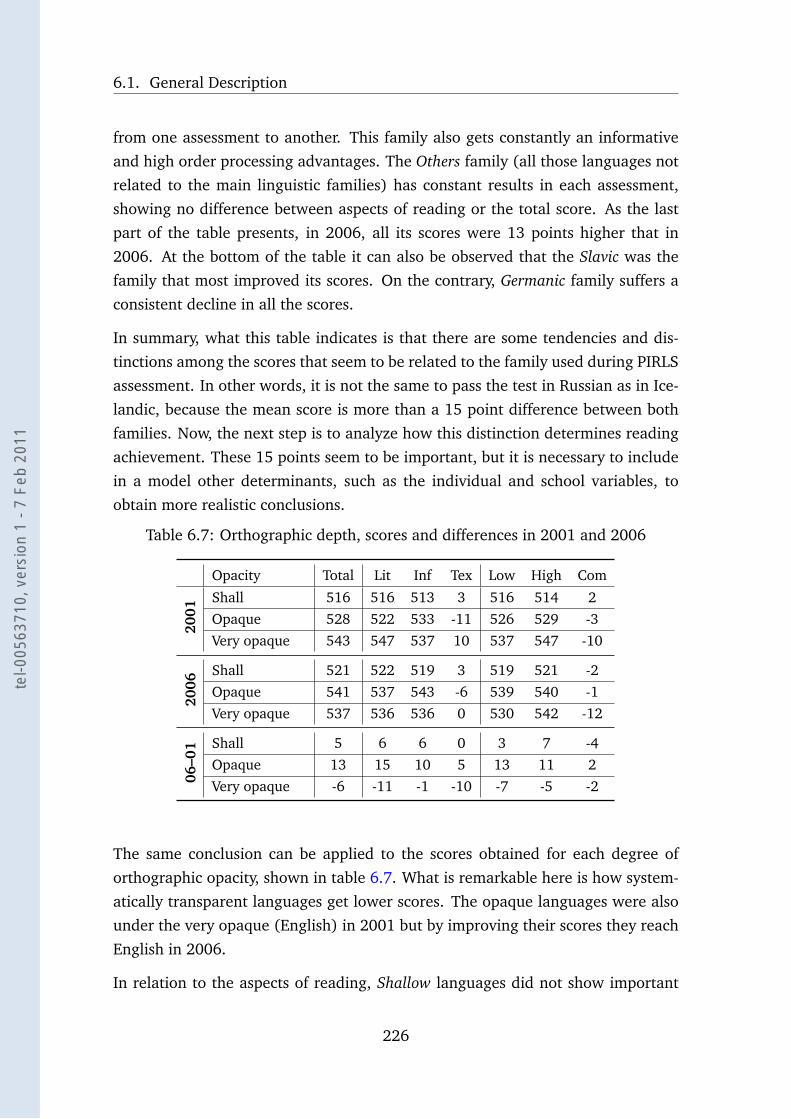
6.1. General Description
from one assessment to another. This family also gets constantly an informative
and high order processing advantages. The Others family (all those languages not
related to the main linguistic families) has constant results in each assessment,
showing no difference between aspects of reading or the total score. As the last
part of the table presents, in 2006, all its scores were 13 points higher that in
2006. At the bottom of the table it can also be observed that the Slavic was the
family that most improved its scores. On the contrary, Germanic family suffers a
consistent decline in all the scores.
In summary, what this table indicates is that there are some tendencies and dis-
tinctions among the scores that seem to be related to the family used during PIRLS
assessment. In other words, it is not the same to pass the test in Russian as in Ice-
landic, because the mean score is more than a 15 point difference between both
families. Now, the next step is to analyze how this distinction determines reading
achievement. These 15 points seem to be important, but it is necessary to include
in a model other determinants, such as the individual and school variables, to
obtain more realistic conclusions.
Table 6.7: Orthographic depth, scores and differences in 2001 and 2006
Opacity Total Lit Inf Tex Low High Com
2001
Shall 516 516 513 3 516 514 2Opaque 528 522 533 -11 526 529 -3Very opaque 543 547 537 10 537 547 -10
2006
Shall 521 522 519 3 519 521 -2Opaque 541 537 543 -6 539 540 -1Very opaque 537 536 536 0 530 542 -12
06–0
1 Shall 5 6 6 0 3 7 -4Opaque 13 15 10 5 13 11 2Very opaque -6 -11 -1 -10 -7 -5 -2
The same conclusion can be applied to the scores obtained for each degree of
orthographic opacity, shown in table 6.7. What is remarkable here is how system-
atically transparent languages get lower scores. The opaque languages were also
under the very opaque (English) in 2001 but by improving their scores they reach
English in 2006.
In relation to the aspects of reading, Shallow languages did not show important
226
tel-0
0563
710,
ver
sion
1 -
7 Fe
b 20
11
Chapter 6. Factor that influence reading in PIRLS
differences between their scores, Opaque languages had better informative read-
ers, while obtaining similar scores in the processes of comprehension. The Veryopaque languages obtained a better high order score (as Anglo family before),
while they scores between purposes changed from 2001 to 2006. As the last part
of the table shows, the improvement of the scores from 2001 to 2006 were equal
for Shallow and Opaque languages, having no difference between aspects of read-
ing or the total score. English, however, did not improve consistently in its scores,
only improving some points in informative reading. If this last result is related to
the results of the other participants, it is probable that this stability is mostly an
effect of the improvement of the rest. In other words, they were not the English
speakers that kept their score, but the others that have improved. This deduction
is based on the fact that there were non–English countries (Russia, Hong-Kong)
that improved their results the most, reaching the top of the classification (see
tables 5.2 and 5.3).
In summary, among aspects of reading, the scores obtained by degree of opacity
did not show significant variations. In contrast, there was a difference between
depths that was constant among the scores. As for the case of linguistic families,
it was not the same to pass the tests in English as it was to pass it in Italian, the
speakers of this complex language obtained better results. This found is opposite
to what the literature about orthographic comparisons have carried to suppose, it
was established that, in beginning acquisition, English readers were slower and
have more troubles in learning to read than readers from more regular languages.
Consequently, if this situation had been remained in time, there should be the
readers from transparent languages those having better results. It can be inferred
that conditions of learning at beginning reading are not the same at this stage
where comprehension is the main purpose of accessing a text.
6.1.2.b Bilingual countries
A final linguistic aspect that must be described, is the case of countries which
have two languages of teaching, and where the test was translated to these two
languages. As was described in chapter 5, and exemplified in table 5.1, the scores
differ between students from the same country but working in different languages.
This gives rise to the question of how recurrent these linguistic differences are in
bilingual countries. Now, this information is showed in table 6.8 and the results of
227
tel-0
0563
710,
ver
sion
1 -
7 Fe
b 20
11
6.1. General Description
the 2006 sample was added. This allows the observation of the evolution in time
of these countries.
The first interesting detail is the resemblance of the results in Norway, where there
was not a significant difference between the scores of Bokmål and Nynorsk, this
affirms the choice of to define them as variations of the same language (see section
4.3.1.q). The Norwegian scores were equivalent, being the bigger variation of only
6 points.
Latvia, Moldova, and Macedonia have also had very similar results in comparing
2001 and 2006 objectives of lectures: a TEX difference was favorable to infor-
mative reading in both assessments. Slovak republic also showed no difference
between Slovak and Hungarian and both languages reduced their informative
tendencies of 2001 to positive values in 2006. Comparing the processes of com-
prehension, the four countries have had differences between languages in 2001
(Latvia the smaller and Macedonia the bigger), however, all of them erased these
differences in 2006 sample. If the scores of each of these countries are observed
and compared more closely, it can be found that there were divers reasons for the
changes, but that they had all had a relation to language: in Latvia, the change
affected the low order processes (improvement in Latvian score and fall in Rus-
sian score), the high order score was almost the same. In Moldova, there was
an important fall of a quarter of an SD in the low order score of the second lan-
guage, and an equivalent increment of the high order score in the first language.
In Macedonia, all the Macedonian scores had fall, while the Russian speakers had
lost some points in the lower order score and gained a third part of a SD in the
high order score.
The Slovakian students also presented changes directly linked to language. They
have improved scores in 10 points in low and 20 in high order processes, while
Hungarian speakers have lost 40 and 35 points each, more than half SD. In this
particular case, a possible explanation is the variation of the dimensions of the
sample, in 2001, the Hungarian speakers represented a very small sample of 170
students, while in 2006, the quantity increased to 566, due to a general enlarge-
ment of the sample of this country. In addition, from a more general point of view,
a valid factor is the connection of all these countries with the Slavic world, even
if in Latvia and Moldova, Latvian and Romanian do not share the same linguistic
origins, Russian does, which allow to conclude that at least one of the languages
spoken in these countries is part of the Slavic family.
228
tel-0
0563
710,
ver
sion
1 -
7 Fe
b 20
11
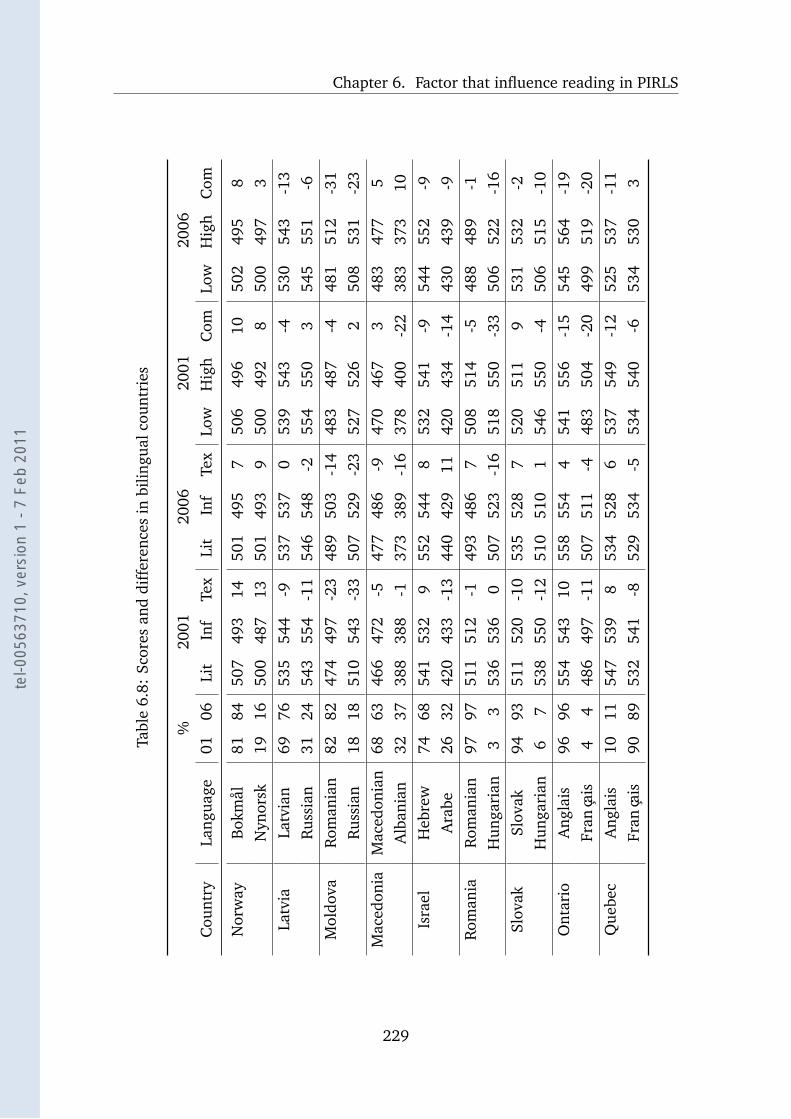
Chapter 6. Factor that influence reading in PIRLS
Tabl
e6.
8:Sc
ores
and
diff
eren
ces
inbi
lingu
alco
untr
ies
%20
0120
0620
0120
06C
ount
ryLa
ngua
ge01
06Li
tIn
fTe
xLi
tIn
fTe
xLo
wH
igh
Com
Low
Hig
hC
om
Nor
way
Bok
mål
8184
507
493
1450
149
57
506
496
1050
249
58
Nyn
orsk
1916
500
487
1350
149
39
500
492
850
049
73
Latv
iaLa
tvia
n69
7653
554
4-9
537
537
053
954
3-4
530
543
-13
Rus
sian
3124
543
554
-11
546
548
-255
455
03
545
551
-6M
oldo
vaR
oman
ian
8282
474
497
-23
489
503
-14
483
487
-448
151
2-3
1R
ussi
an18
1851
054
3-3
350
752
9-2
352
752
62
508
531
-23
Mac
edon
iaM
aced
onia
n68
6346
647
2-5
477
486
-947
046
73
483
477
5A
lban
ian
3237
388
388
-137
338
9-1
637
840
0-2
238
337
310
Isra
elH
ebre
w74
6854
153
29
552
544
853
254
1-9
544
552
-9A
rabe
2632
420
433
-13
440
429
1142
043
4-1
443
043
9-9
Rom
ania
Rom
ania
n97
9751
151
2-1
493
486
750
851
4-5
488
489
-1H
unga
rian
33
536
536
050
752
3-1
651
855
0-3
350
652
2-1
6Sl
ovak
Slov
ak94
9351
152
0-1
053
552
87
520
511
953
153
2-2
Hun
gari
an6
753
855
0-1
251
051
01
546
550
-450
651
5-1
0O
ntar
ioA
ngla
is96
9655
454
310
558
554
454
155
6-1
554
556
4-1
9Fr
ança
is4
448
649
7-1
150
751
1-4
483
504
-20
499
519
-20
Que
bec
Ang
lais
1011
547
539
853
452
86
537
549
-12
525
537
-11
Fran
çais
9089
532
541
-852
953
4-5
534
540
-653
453
03
229
tel-0
0563
710,
ver
sion
1 -
7 Fe
b 20
11
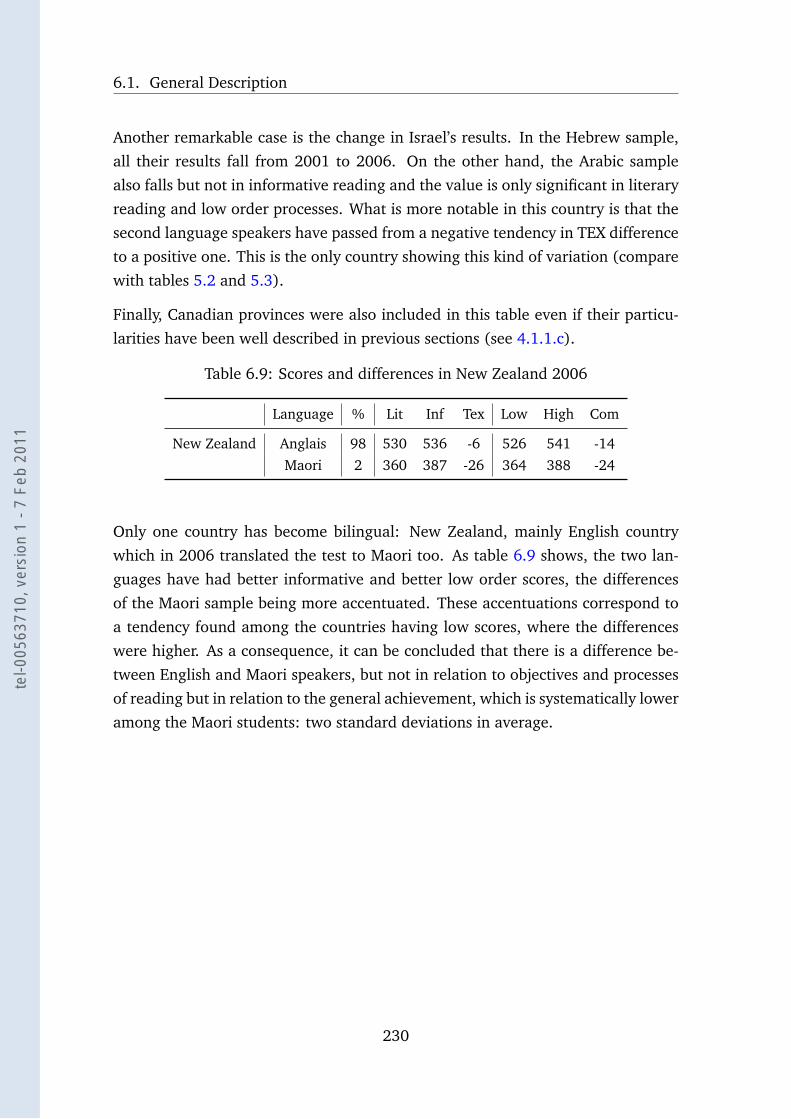
6.1. General Description
Another remarkable case is the change in Israel’s results. In the Hebrew sample,
all their results fall from 2001 to 2006. On the other hand, the Arabic sample
also falls but not in informative reading and the value is only significant in literary
reading and low order processes. What is more notable in this country is that the
second language speakers have passed from a negative tendency in TEX difference
to a positive one. This is the only country showing this kind of variation (compare
with tables 5.2 and 5.3).
Finally, Canadian provinces were also included in this table even if their particu-
larities have been well described in previous sections (see 4.1.1.c).
Table 6.9: Scores and differences in New Zealand 2006
Language % Lit Inf Tex Low High Com
New Zealand Anglais 98 530 536 -6 526 541 -14Maori 2 360 387 -26 364 388 -24
Only one country has become bilingual: New Zealand, mainly English country
which in 2006 translated the test to Maori too. As table 6.9 shows, the two lan-
guages have had better informative and better low order scores, the differences
of the Maori sample being more accentuated. These accentuations correspond to
a tendency found among the countries having low scores, where the differences
were higher. As a consequence, it can be concluded that there is a difference be-
tween English and Maori speakers, but not in relation to objectives and processes
of reading but in relation to the general achievement, which is systematically lower
among the Maori students: two standard deviations in average.
230
tel-0
0563
710,
ver
sion
1 -
7 Fe
b 20
11
Chapter 6. Factor that influence reading in PIRLS
6.2 Hierarchical Models
In the previous chapters, from the original databases, a comparable sample was
taken, languages were studied to infer linguistic parameters, and the context was
deeply analyzed to infer possible determiners of reading. Moreover, observations
that were not comparable (such as Morocco or those not indicating the language)
were left out and the case of bilingualism was studied to eliminate a possible
incidence of this phenomenon. To summarize, at this point of the research, it is
possible to affirm that the main aspect concerning language and context of PIRLS
study have been taken into account. As a result a series of variables have been
created that, according to the hypothesis, may explain reading achievement. In the
following pages the focus will be the development of a statistic model capable of
include these factors and determine how they are related to reading achievement.
The chosen modelling technique was the implementation of a multilevel model to
put emphasis on the hierarchical structure of the educational system.
6.2.1 Structure of the model: the null model
The first step will be the defining of the structure that will be the base of the
model. Since education has been defined as a nested phenomenon, it is necessary
to define what are the levels that play a role in determining PIRLS results. The
method is to set up an unconditional or null model, that is, a model that has no
predictor variables.
6.2.1.a Two level model
Concretely, what the null model does, is to estimate the distribution of the variance
of scores among the levels believed to be part of the structure, If a two levels
structure is the starting point, its equation can be represented as follows(Adapted
from Rumberger & Palardy, 2004, p. 241) :
Level 1 model: READscoreij = β0j + rij where rij N(0, σ2r)
Level 2 model: β0j = γ00 + µ0j where µ0j N(0, σ2µ0)
Combined model: READscoreij = γ00 + µ0j + rij
231
tel-0
0563
710,
ver
sion
1 -
7 Fe
b 20
11
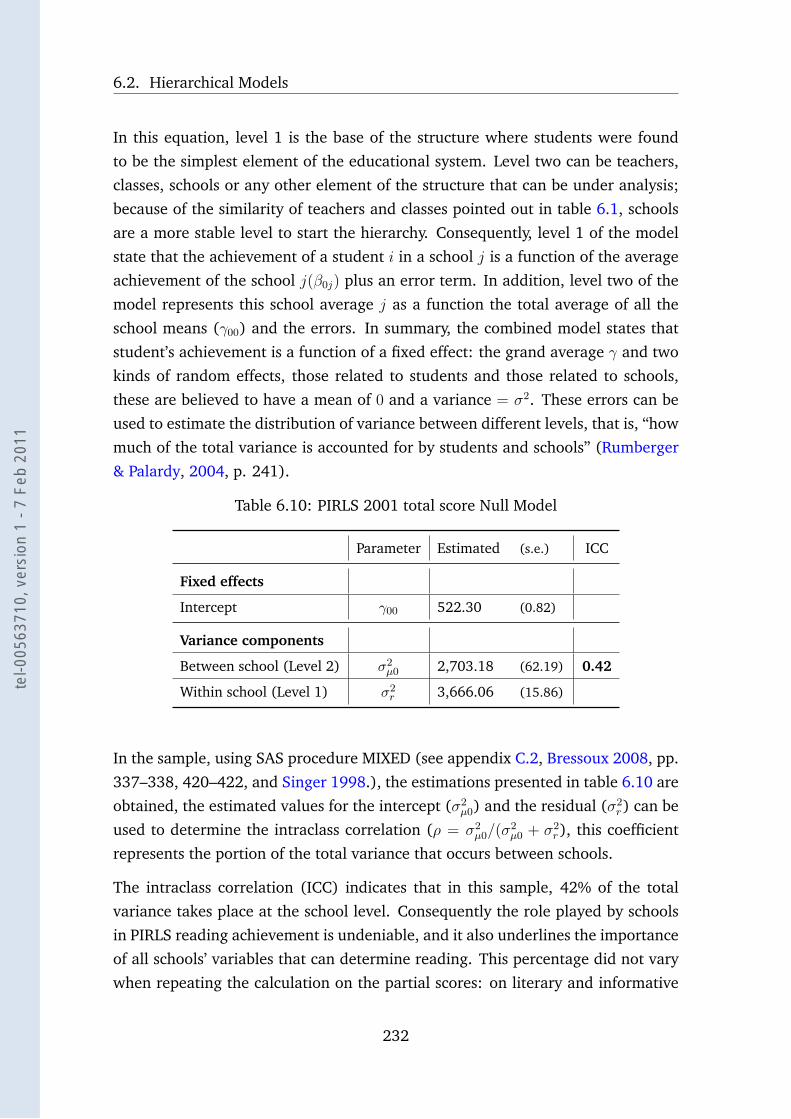
6.2. Hierarchical Models
In this equation, level 1 is the base of the structure where students were found
to be the simplest element of the educational system. Level two can be teachers,
classes, schools or any other element of the structure that can be under analysis;
because of the similarity of teachers and classes pointed out in table 6.1, schools
are a more stable level to start the hierarchy. Consequently, level 1 of the model
state that the achievement of a student i in a school j is a function of the average
achievement of the school j(β0j) plus an error term. In addition, level two of the
model represents this school average j as a function the total average of all the
school means (γ00) and the errors. In summary, the combined model states that
student’s achievement is a function of a fixed effect: the grand average γ and two
kinds of random effects, those related to students and those related to schools,
these are believed to have a mean of 0 and a variance = σ2. These errors can be
used to estimate the distribution of variance between different levels, that is, “how
much of the total variance is accounted for by students and schools” (Rumberger
& Palardy, 2004, p. 241).
Table 6.10: PIRLS 2001 total score Null Model
Parameter Estimated (s.e.) ICC
Fixed effects
Intercept γ00 522.30 (0.82)
Variance components
Between school (Level 2) σ2µ0 2,703.18 (62.19) 0.42
Within school (Level 1) σ2r 3,666.06 (15.86)
In the sample, using SAS procedure MIXED (see appendix C.2, Bressoux 2008, pp.
337–338, 420–422, and Singer 1998.), the estimations presented in table 6.10 are
obtained, the estimated values for the intercept (σ2µ0) and the residual (σ2
r) can be
used to determine the intraclass correlation (ρ = σ2µ0/(σ
2µ0 + σ2
r), this coefficient
represents the portion of the total variance that occurs between schools.
The intraclass correlation (ICC) indicates that in this sample, 42% of the total
variance takes place at the school level. Consequently the role played by schools
in PIRLS reading achievement is undeniable, and it also underlines the importance
of all schools’ variables that can determine reading. This percentage did not vary
when repeating the calculation on the partial scores: on literary and informative
232
tel-0
0563
710,
ver
sion
1 -
7 Fe
b 20
11
Chapter 6. Factor that influence reading in PIRLS
scores, 42% of the variance occurs between schools, 40% of the variance of the
low order and a 44% of the high order processing scores occurs between schools.
In addition, in the total score of the 2006 sample, 42% of the total variance takes
place at the school level as well. This is an important result since it proves that the
role of the school was stable through time.
This proportion is very important, but it is also unusual in relation to studies of
school effectiveness, as Rumberger & Palardy (2004) points out, the percentage
of the variance that occurs at the school level in different studies is close to 25%,
depending on the sample. However, since PIRLS includes several educational sys-
tems, the bigger proportion of variation is certainly related to the cross–country
variation. It is easy to imagine how different the schools could be among the many
educational systems that participated at this survey. To visualize this variety, the
2006 average score of each school was calculated, its distribution at the coun-
try level is represented in figure 6.1. There it is possible to observe how much
the school average can vary, the higher school’s score is 656 in Bulgaria, while
the lower is 179 points (an Iranian school with only 5 students taking the test),
between them, there is almost 9 standard variations.
Besides this graphical representation, two experiments have been done to study
the relation between school and country variance. In first place, the addition to
the model of a country level was tested, keeping students as the first level of the
model. If countries are the second level, only 14% of the total variance in 2001
and 17% in 2006 occurs at this level. In other words, the total variance is less
explained by this level than by a school level, being the difference in the variance
explained more than 20%. Moreover, as will be explained later, the values of
∆ indicate that this model is farther from a perfect fit than the two level school
model. In summary, countries explain a lower proportion of achievement than
schools; it could be assumed that most of country variation is already explained
by school variation.
The second test was to observe the within country school variance, the 2006 values
are presented in figure 6.1, next to each country name. It can be observed that
the proportion of variance explained is very different when the model is used to
explain scores variance in each country separately. The school in which a student
is enrolled can be as important as in the Republic of Moldova, or it can be as
insignificant as in Iceland where the schools are very similar. The importance
of schools in student achievement is also graphically represented by the distance
233
tel-0
0563
710,
ver
sion
1 -
7 Fe
b 20
11
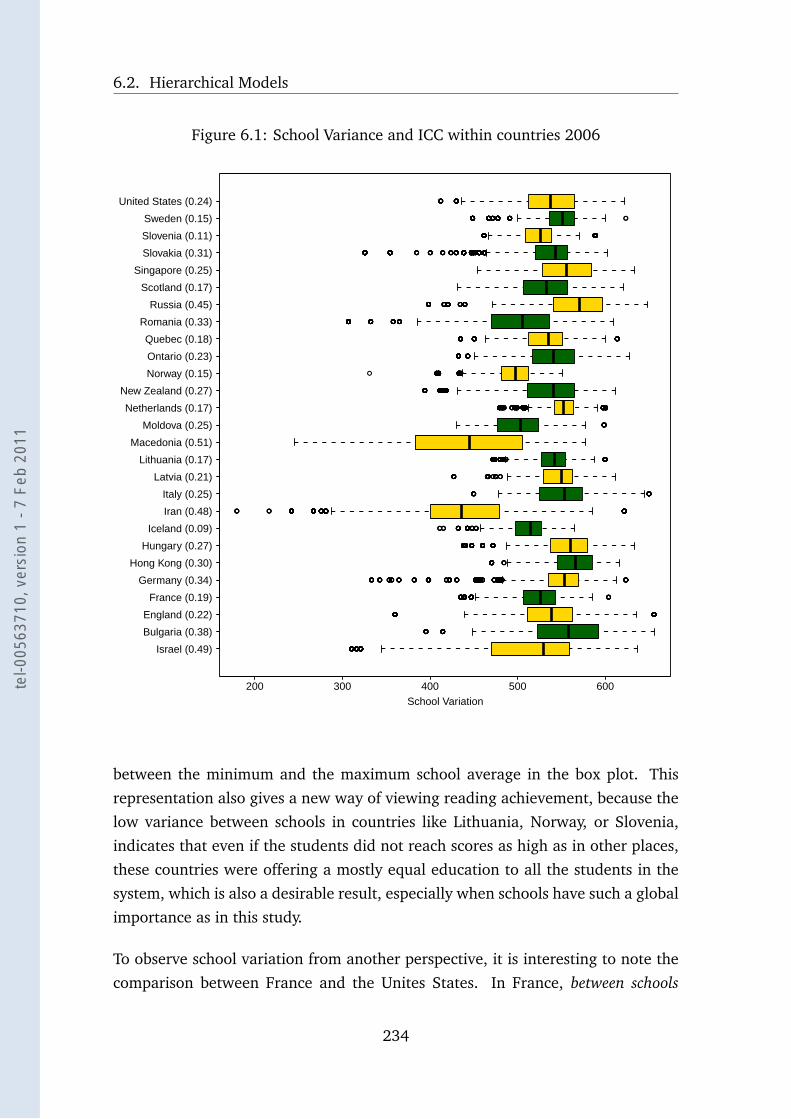
6.2. Hierarchical Models
Figure 6.1: School Variance and ICC within countries 2006
●●●●●●●●●●●●●●●●●●●●●●●●●● ●●●●●●●●●●●●●●●●●●●●●●●●●●●●●●●●●●●●●●●●●●●●●●●●●●●●●●●●●●●●●●
●●●●●●●●●●● ●●●●●●●●●●●●●●●●
●●●●●●●●●●●●●●●●●●●●● ●●●●●●●●●●●●●●●●●●●●
●●●●●●●●●●●●●●●●●●●●●●●●●●●●●●●●●●●●●●●●●●●●●●●●●●●●●●●●● ●●●●●●●●●●●●●●●●●●●●●●●●●●●●●●●●●●●●●●●●●●●● ●●●●●●
●●●●●●●● ●●●●●●●● ●●●●●●●●●●●●●● ●●●●●●●● ●●●●●●●● ●●●●●●●●●●●●●●●●● ●●●●●●●●●●●●●●●●● ●●●●●●●● ●●●●●●●●●●●●●●●●●●●●●●●●●●●●●●●●●●●●●●●●●●●●●●●●●●●●●●●●●●●●●●●●●●●●●●●●●●●●●●●●●●●●●●●●●●●●●●●●●●●●●●●●●●●●●●●●●●●●●●●●●●●●●●●●●●●●●● ●●●●●●●●●●●●●●●●●●●●●●●●●●●●●●●●●●●●●●●●●●●●●●●●●●●●●●●●●●●●●●●●●●●●●●●●●●●●●●●●●●●●●●●●●●●●●●●●●●●●●●●●●●●●●●●●●●●●●●●●●●●●●●●●●●●●●●●●●●●●●●●●●●●● ●●●●●●●●●●●●●●
●●●●●●●●●●●●●●●●●●●●●●●●●●● ●●●●
●●●●●●●●●●●●●●●●●●●●●●●●●●●●●●●●●●●●●●●●●●●●●●●●●●●●●●●●● ●●●●●●●●●●●●●●●●● ●●●●●●●●●●●●●●●●●●● ●●●●●●●●●●●●●●●
●●●●●● ●●●●●●●●●● ●●●●●●●●●●●●●●●●●●●●● ●●●●●●●●●●●●●
●●●● ●●● ●●●●●●●●●●●●●●●●●●●●●●●●●●●● ●●●●●●●●●●●●●●●●●●●●● ●●●●●●●●●●●●●●●●●● ●●●●●●●●●●●●●●●●●●●●●●●●●●●●●●●●●●● ●●●●●●●●●●●●●●●●●●●●●●●●●
●●●●●●●●● ●●●●●●●●●●●●●
●●●●●●●●●● ●●●●●●●●●●●●● ●●●●●●●●●●●●●● ●●●
●●●●●●●●●●●●●●●●●●●●●●●●●●●●●●●●●●●●●●●●● ●●●●●●●●●●●●●●●●●●●●●●●●●●●●●●●●●●●●●●●●●●●●●●●●●●●● ●●●●●●●●●●●●●●●●●●●●●●●●●●●●●●●●●●●●●●●●●●●
●●●●●●●●●●●●●●●●●
●●●●●●●●●●●●●●●●●●●●●●●●●●●●●●●●●●●●●●●●●●●●●●●●●●●●●●●●●●●● ●●●●●●●●●●●●●●●●●●●●●●●●●●●●●●●●●●●●●●●●●●●● ●●●●●●●●●●●●●●●●●●●●●●●●●●●●●●●●●●●●●●●●●●●●●●●●●●●●●●●●●●●●●●●●●●●●●●●●●●●●●●●●● ●●●●●●●●●●●●●●●●●●●●●●●●●●●●●●●●●●●●●●●●●●●●●●●●●●●●●●●●●●●●●●●●●●●●●●
●●●●●●●●●●●●●●●●●●● ●●●●●●●●●●●●●●●●●●●●●●●●●●●●●●●●●●●●●●●●●●●●●●●●●●●●●●●●●●●●●●●●●●●●●●●●●●●●●●●●●●●●●●●●●●●●●●●●●●●●●●●●●●●●●●●●●●●
● ●●●●●●●●●●●●●●●●●●●●●●●●●●●●●●●●●●●●●●●●●●●●●●●●●●●●● ●●●●●●●●●●●●●●●●●●●●●●●●●●●●●●●●●●●●●●●●●●
●●●●●●●●●●●●●●●●●● ●●●●●●●●●●●●
●●●●●●●●●●●●●●●●●● ●●●●●●●●●●●●●●●●●●●● ●●●●●●●●●●●●●●●●●
●●●●●●●●●●●●●●●●●●●●●●●●●●●●●●●● ●●●●●●●●●●●●●●● ●●●●●●●●●● ●●●●●●●●●●●
●●●●●●●●●●●●●●●● ●●●●●●●●●●●●●●●●●●●●●●●●●●●●●● ●●●●● ●●●●●●●●●●
●●●●●●●●●●●●●●●●●●●●●●●●●●●●●●●●●●● ●●●●●●●●●●●●●●●●●●●●●●●●●●●●●●●● ●●●●● ●●●●●● ●●●●●● ●●●●●● ●●●●●●●●●●● ●●●●●●●●●●●●●●●●●●●●●●●●●●●●●●●●●●●●●●●● ●●●●●●●●●●●●●●●●●●●●●●●●●●●●●●●●●●●●●●●●●●●●●●●●●●●●●●●●●●●●●●●●●●●●●●●●●●●●●●●●●●●●●●●●●●●●●●●●●●● ●●●●●●●●●●●●●●●●●●●●●●●●●●●●●●●●●●●●●●●
●●●●●●●●●●●●●●●●●●●●●●●●●●●●●●●●●●●●●●●●●●●●●●●●●●● ●●●●●●●●●●●●●●●●●●●●●●●●●●●●●●●●●●●●●●●●●●●●●●●●●●●●●●●●
●●●●●●●●●●●●●●●●●●●●●●●●●●●●● ●●●●●●●●●●●●●●●●●●●●●●●●●●●●●● ●●●●●●●●●●●●●●●●●●●●●●●●●●●●●●●●● ●●●●●●●●●● ●●
●●●●●●●● ●●●●●●●●●●●●●●
Israel (0.49)
Bulgaria (0.38)
England (0.22)
France (0.19)
Germany (0.34)
Hong Kong (0.30)
Hungary (0.27)
Iceland (0.09)
Iran (0.48)
Italy (0.25)
Latvia (0.21)
Lithuania (0.17)
Macedonia (0.51)
Moldova (0.25)
Netherlands (0.17)
New Zealand (0.27)
Norway (0.15)
Ontario (0.23)
Quebec (0.18)
Romania (0.33)
Russia (0.45)
Scotland (0.17)
Singapore (0.25)
Slovakia (0.31)
Slovenia (0.11)
Sweden (0.15)
United States (0.24)
200 300 400 500 600School Variation
between the minimum and the maximum school average in the box plot. This
representation also gives a new way of viewing reading achievement, because the
low variance between schools in countries like Lithuania, Norway, or Slovenia,
indicates that even if the students did not reach scores as high as in other places,
these countries were offering a mostly equal education to all the students in the
system, which is also a desirable result, especially when schools have such a global
importance as in this study.
To observe school variation from another perspective, it is interesting to note the
comparison between France and the Unites States. In France, between schools
234
tel-0
0563
710,
ver
sion
1 -
7 Fe
b 20
11
Chapter 6. Factor that influence reading in PIRLS
variance was only 19%, this similarity between schools is probably related to the
importance of the French public system where most of the decisions are taken
at a central level. In contrast, in the U.S.A. where local authorities play a major
role in educational policy, between schools variance reached 24% 1. If this value is
taken as a reference, the sum of this intra-country school variance plus the inter-
country variance (24% + 17%) explains the total school variance when considered
in cross-country context, this confirms the earlier statement that country variance
is already explained by schools.
Finally, coming back to the original model, the single change in ICC values could
be the 5% of distance between the schools variance in explaining low order and
high order processing, that is constant in the 2006 sample too. Consequently, the
low order process of comprehension is 5% more related to schools than low order
processing. It should be mentioned too, that the estimated reading score (γ00)
is equal to the mean of the 2001 sample, which was 522. In 2006 the mean of
the total score was 527, while the estimated of the model was 527 too. This high
correspondence could be explained by the important amount of observations that
took part in the calculations; moreover, all estimations were significant.
To summarize, in relation to reading achievement in this sample, schools make a
difference that is constant in time and highly determinant.
6.2.1.b Testing for extra levels
Now, a structure has been established that is able to estimate the role played by the
school in how a student learns to read. The next step is to study if this structure
can include other hierarchical levels. However, even before proceeding, it can be
expected that it will be difficult to explain a bigger part of the variance, due to
the great part already considered by school variation. To estimate the pertinence
of including extra levels in the model, it was used an analogous procedure to that
of F test, that is, the procedure consisted in testing the global significance of the
model and the contribution of each new level.
To test this significance, the measurement of a double negative deviant of the Log-Likelihood (-2 Log L) was calculated. This value takes away from the Log-Likelihoodof the estimated model the Log-Likelihood of a supposed model (saturated), that is a
1Quantity that approaches the studies quoted by Rumberger & Palardy (2004), which whereprobably located in U.S.A. or England.
235
tel-0
0563
710,
ver
sion
1 -
7 Fe
b 20
11
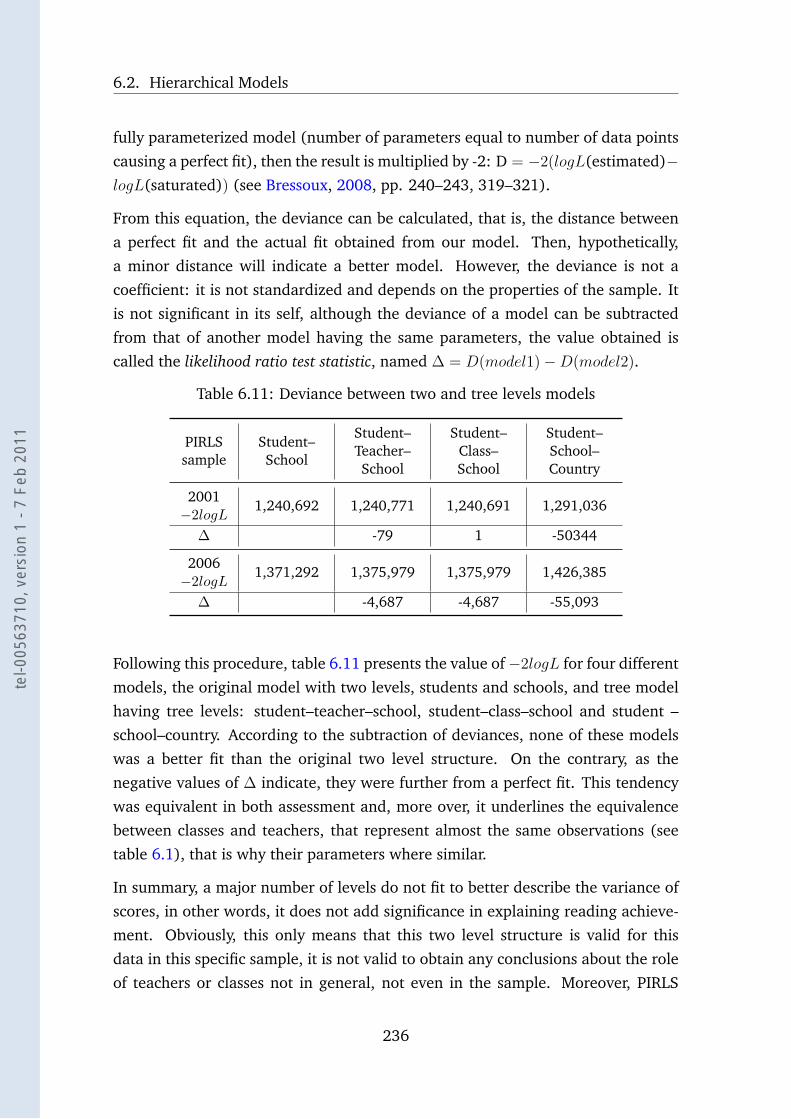
6.2. Hierarchical Models
fully parameterized model (number of parameters equal to number of data points
causing a perfect fit), then the result is multiplied by -2: D = −2(logL(estimated)−logL(saturated)) (see Bressoux, 2008, pp. 240–243, 319–321).
From this equation, the deviance can be calculated, that is, the distance between
a perfect fit and the actual fit obtained from our model. Then, hypothetically,
a minor distance will indicate a better model. However, the deviance is not a
coefficient: it is not standardized and depends on the properties of the sample. It
is not significant in its self, although the deviance of a model can be subtracted
from that of another model having the same parameters, the value obtained is
called the likelihood ratio test statistic, named ∆ = D(model1) −D(model2).
Table 6.11: Deviance between two and tree levels models
PIRLSsample
Student–School
Student–Teacher–School
Student–Class–School
Student–School–Country
2001−2logL
1,240,692 1,240,771 1,240,691 1,291,036
∆ -79 1 -50344
2006−2logL
1,371,292 1,375,979 1,375,979 1,426,385
∆ -4,687 -4,687 -55,093
Following this procedure, table 6.11 presents the value of −2logL for four different
models, the original model with two levels, students and schools, and tree model
having tree levels: student–teacher–school, student–class–school and student –
school–country. According to the subtraction of deviances, none of these models
was a better fit than the original two level structure. On the contrary, as the
negative values of ∆ indicate, they were further from a perfect fit. This tendency
was equivalent in both assessment and, more over, it underlines the equivalence
between classes and teachers, that represent almost the same observations (see
table 6.1), that is why their parameters where similar.
In summary, a major number of levels do not fit to better describe the variance of
scores, in other words, it does not add significance in explaining reading achieve-
ment. Obviously, this only means that this two level structure is valid for this
data in this specific sample, it is not valid to obtain any conclusions about the role
of teachers or classes not in general, not even in the sample. Moreover, PIRLS
236
tel-0
0563
710,
ver
sion
1 -
7 Fe
b 20
11
Chapter 6. Factor that influence reading in PIRLS
designers explicitly avoid working with a teacher level, because the sample was
optimized to represent students within a country and not its teachers. However,
some interesting analyses have been done using teacher level data (for example
Cheung, Tse, Lam, & Loh, 2009).
6.2.2 Modelling linguistic Variables
Knowing that the students and the schools are the levels that best describe the
structure of PIRLS sample in relation to reading achievement, there are now other
factors (fixed effects) that can be added to the structure, in first place, linguistic
variables.
To be able to read the estimated values, one of the families and one of the ortho-
graphical levels were chosen to be the reference, by not including it in the model,
it is possible to know how much or fewer score can be obtained by a student be-
cause of being part of another family or another degree of opacity. In other words,
the model will compare the results of those being part of the family and those not
being part of the family and will express the difference in the estimated parameter
for each variable. The references will be the Anglo family for linguistic families and
the Very deep orthography, which is, in fact, the same English part of the sample,
this will allow for the direct measuring of the incidence of this particular language
in reading achievement. In addition, the estimations obtained will be comparable.
6.2.2.a Linguistic Families
In relation to linguistic families, as was showed in table 6.6, Anglo represents
the higher average in 2001 and shares this result with the Slavic family in 2006.
Consequently, it can be expected that the parameter estimated will be all negative
values, since they will represent the distance between the score of one of the other
families and the higher score of Anglo. In addition, because of the proximity of
Slavic 2006 scores, they may not be different from zero in some cases.
Model 1 in tables 6.12 and 6.13, represent the result of the multilevel regressions
that included linguistic families as explicative factors. In appendix B there are
also the tables with results for the partial scores (literary, informative, low and
high order). The first important result is that there is no significant difference
237
tel-0
0563
710,
ver
sion
1 -
7 Fe
b 20
11
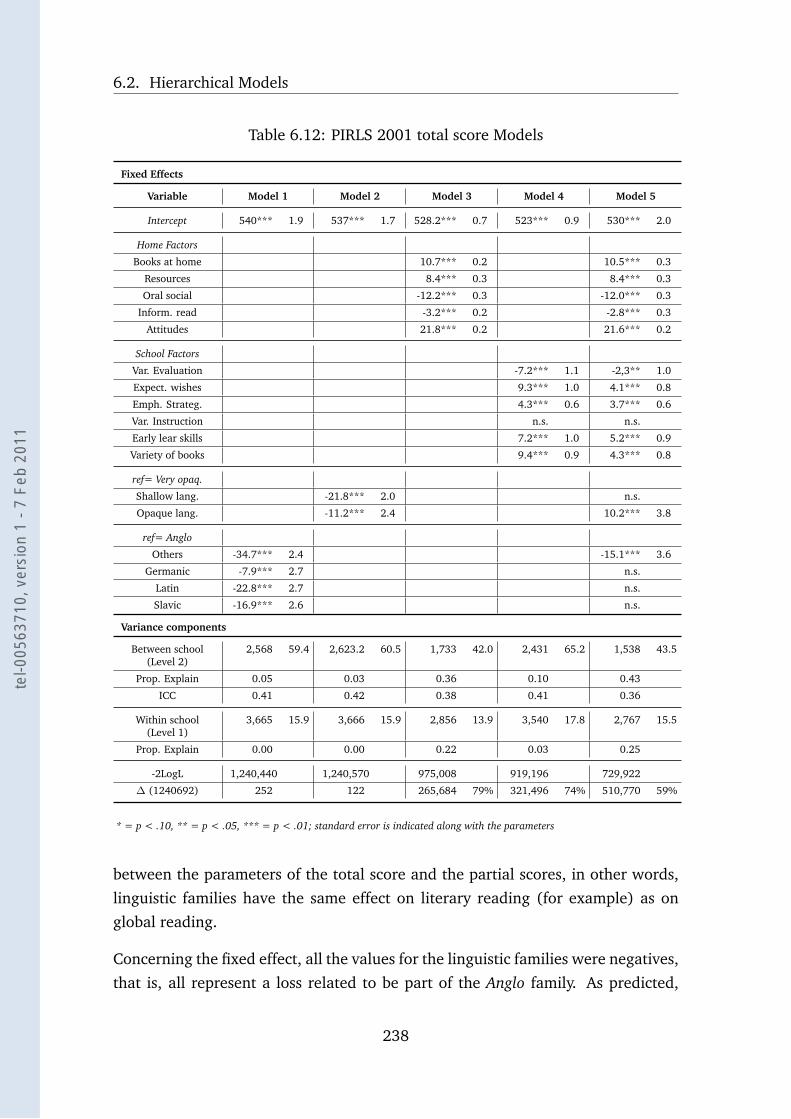
6.2. Hierarchical Models
Table 6.12: PIRLS 2001 total score Models
Fixed Effects
Variable Model 1 Model 2 Model 3 Model 4 Model 5
Intercept 540*** 1.9 537*** 1.7 528.2*** 0.7 523*** 0.9 530*** 2.0
Home Factors
Books at home 10.7*** 0.2 10.5*** 0.3
Resources 8.4*** 0.3 8.4*** 0.3
Oral social -12.2*** 0.3 -12.0*** 0.3
Inform. read -3.2*** 0.2 -2.8*** 0.3
Attitudes 21.8*** 0.2 21.6*** 0.2
School Factors
Var. Evaluation -7.2*** 1.1 -2,3** 1.0
Expect. wishes 9.3*** 1.0 4.1*** 0.8
Emph. Strateg. 4.3*** 0.6 3.7*** 0.6
Var. Instruction n.s. n.s.
Early lear skills 7.2*** 1.0 5.2*** 0.9
Variety of books 9.4*** 0.9 4.3*** 0.8
ref= Very opaq.
Shallow lang. -21.8*** 2.0 n.s.
Opaque lang. -11.2*** 2.4 10.2*** 3.8
ref= Anglo
Others -34.7*** 2.4 -15.1*** 3.6
Germanic -7.9*** 2.7 n.s.
Latin -22.8*** 2.7 n.s.
Slavic -16.9*** 2.6 n.s.
Variance components
Between school(Level 2)
2,568 59.4 2,623.2 60.5 1,733 42.0 2,431 65.2 1,538 43.5
Prop. Explain 0.05 0.03 0.36 0.10 0.43
ICC 0.41 0.42 0.38 0.41 0.36
Within school(Level 1)
3,665 15.9 3,666 15.9 2,856 13.9 3,540 17.8 2,767 15.5
Prop. Explain 0.00 0.00 0.22 0.03 0.25
-2LogL 1,240,440 1,240,570 975,008 919,196 729,922
∆ (1240692) 252 122 265,684 79% 321,496 74% 510,770 59%
* = p < .10, ** = p < .05, *** = p < .01; standard error is indicated along with the parameters
between the parameters of the total score and the partial scores, in other words,
linguistic families have the same effect on literary reading (for example) as on
global reading.
Concerning the fixed effect, all the values for the linguistic families were negatives,
that is, all represent a loss related to be part of the Anglo family. As predicted,
238
tel-0
0563
710,
ver
sion
1 -
7 Fe
b 20
11
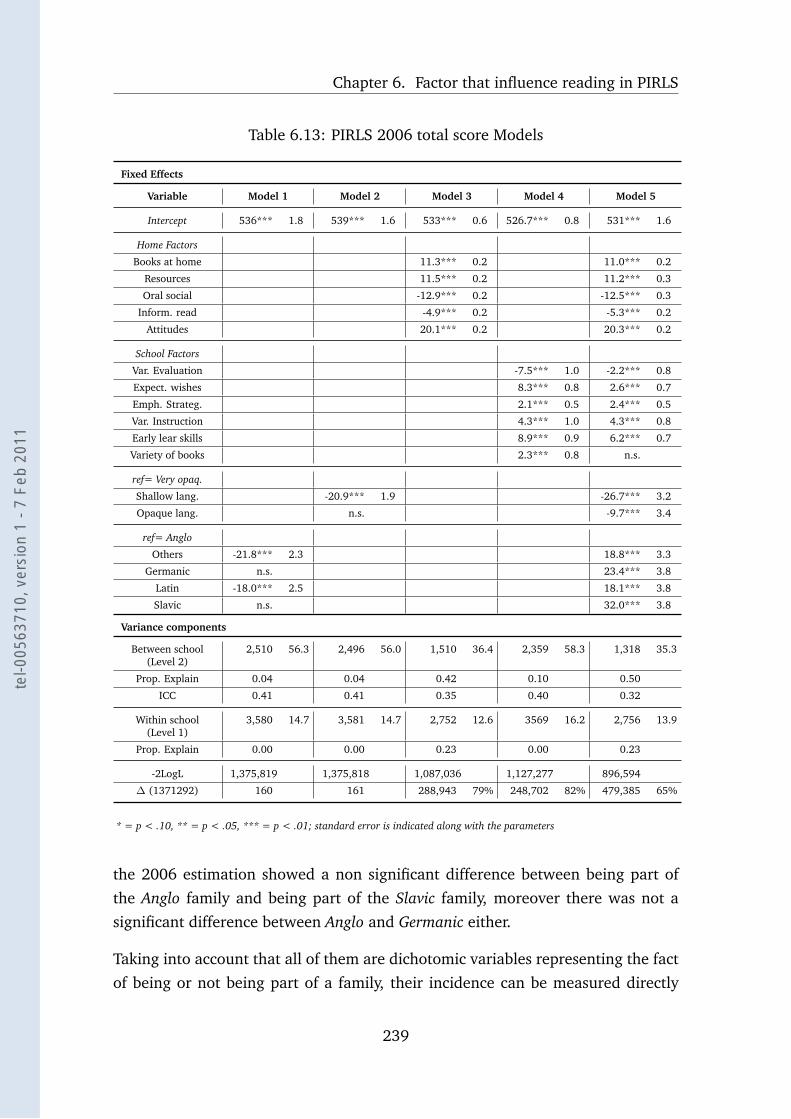
Chapter 6. Factor that influence reading in PIRLS
Table 6.13: PIRLS 2006 total score Models
Fixed Effects
Variable Model 1 Model 2 Model 3 Model 4 Model 5
Intercept 536*** 1.8 539*** 1.6 533*** 0.6 526.7*** 0.8 531*** 1.6
Home Factors
Books at home 11.3*** 0.2 11.0*** 0.2
Resources 11.5*** 0.2 11.2*** 0.3
Oral social -12.9*** 0.2 -12.5*** 0.3
Inform. read -4.9*** 0.2 -5.3*** 0.2
Attitudes 20.1*** 0.2 20.3*** 0.2
School Factors
Var. Evaluation -7.5*** 1.0 -2.2*** 0.8
Expect. wishes 8.3*** 0.8 2.6*** 0.7
Emph. Strateg. 2.1*** 0.5 2.4*** 0.5
Var. Instruction 4.3*** 1.0 4.3*** 0.8
Early lear skills 8.9*** 0.9 6.2*** 0.7
Variety of books 2.3*** 0.8 n.s.
ref= Very opaq.
Shallow lang. -20.9*** 1.9 -26.7*** 3.2
Opaque lang. n.s. -9.7*** 3.4
ref= Anglo
Others -21.8*** 2.3 18.8*** 3.3
Germanic n.s. 23.4*** 3.8
Latin -18.0*** 2.5 18.1*** 3.8
Slavic n.s. 32.0*** 3.8
Variance components
Between school(Level 2)
2,510 56.3 2,496 56.0 1,510 36.4 2,359 58.3 1,318 35.3
Prop. Explain 0.04 0.04 0.42 0.10 0.50
ICC 0.41 0.41 0.35 0.40 0.32
Within school(Level 1)
3,580 14.7 3,581 14.7 2,752 12.6 3569 16.2 2,756 13.9
Prop. Explain 0.00 0.00 0.23 0.00 0.23
-2LogL 1,375,819 1,375,818 1,087,036 1,127,277 896,594
∆ (1371292) 160 161 288,943 79% 248,702 82% 479,385 65%
* = p < .10, ** = p < .05, *** = p < .01; standard error is indicated along with the parameters
the 2006 estimation showed a non significant difference between being part of
the Anglo family and being part of the Slavic family, moreover there was not a
significant difference between Anglo and Germanic either.
Taking into account that all of them are dichotomic variables representing the fact
of being or not being part of a family, their incidence can be measured directly
239
tel-0
0563
710,
ver
sion
1 -
7 Fe
b 20
11

6.2. Hierarchical Models
by the parameter estimated. For example, in 2001, those having a value of 1 in
Others variable, will obtain as much as −34.75(±2.4) points less in the score in
comparison to those being part of the Anglo family. Moreover, all the families
showed a disadvantage in relation to the reference, the higher was Others and
Latin. These two families, in fact, kept that disadvantage in 2006, whereas Slavicand Germanic managed to equalize the reference; in general the disadvantage
was smaller in 2006. The bigger disadvantage in relation to Anglo, was for the
Others family in relation to the 2001 literary score, being part of this family means
−38.34(±2.4) less than Anglo.
Another aspect to look at, are the partial scores, because some differences can be
observed. Comparing the 2001 purposes of reading (see tables B.1.1 and B.1.2),
one can notices that the disadvantage is particularly accentuated in literary read-
ing, particularly for Latin and Slavic families, the first can lost 22.54 points more
in literary reading (−30.7 ± 2.6) − (−13.36 ± 2.6), the second can lost 20.99. In
2006 (tables B.2.1 and B.2.2), this literary advantage did not last, which lead one
to assume, according to the model, that the advantage for English speakers in the
2001 results was particularly linked with a literary advantage, even if they also
obtained better informative scores.
In relation to comprehension processes, there were also various results if com-
pared to Anglo. In 2001, while in low order processing, Germanic was not at a
disadvantage (equal to 0), it lost more than 15 points in high order processing.
The Slavic family had a small disadvantage in low order processing and a much
larger one in high order processing. In general, the 2001 results showed more
elevated disadvantages in high order processing. In 2006, the situation remains
similar; in general the bigger advantages were in high order processing. In addi-
tion, it was in 2006 low order processing when the Germanic family obtained the
only parameter with a positive value (see B.2.3), in other words, this was the only
case in which being part of a family different from Anglo was not a disadvantage,
but an advantage. However, for the rest of the families, particularly for Others and
Latin, the disadvantage was still very important.
In summary, the first important conclusion is that the values confirm that there
are variations related to the linguistic family to which a student belongs. In ad-
dition, another way to read this result is that Anglo students have a preexisting
advantage in relation to the rest of the sample by the fact that they speak this par-
ticular language; this advantage is more patent in literary reading and high order
240
tel-0
0563
710,
ver
sion
1 -
7 Fe
b 20
11
Chapter 6. Factor that influence reading in PIRLS
processing.
This fact is also supported by the coefficient for the constant, which is higher than
what was calculated in the null model, while in 2001 it was 522, now it is almost 20
points higher. The 2006 results indicate 10 points more for the linguistic model,
with the Anglo family as the reference. Considering that this coefficient is the
predicted reading achievement, those results indicates that when all predictors
are 0, that is when all the other linguistic families are 0, the students reading
achievement is predicted to be higher, since the dichotomic distribution indicates
that the families will get a 0 only when Anglo will be true. This high score is
the reading achievement of Anglo students taking into account the hierarchical
structure of educational system. These results are similar to the real average of
Anglo students as was shown in table 6.6.
This situation changes when taking into account variance components. These re-
sults put language influence in another perspective, because there is no relation
between linguistic family and school or individual variance of scores. If compared
with the null model, the level 2 variance (between schools) did not decrease sig-
nificantly, it only varied from 2703 to 2568 in 2001, and from 2610 to 2510 in 2006.
If these coefficients are used to calculate the proportion of variance explained at
school level ((2703 − 2568)/2703 in 2001) the results shown that only 5% of the
variance was explained, in other words, the parameters indicate that linguistic
families did not explain the school-to-school variation in mean reading achieve-
ment. The same situation was found at within-school level where the residual,
σ2r , almost did not change from the null model to this one (see 6.10), giving a
proportion of variance explained equal to 0.
Moreover, the distance between the model and the ideal fit did not significantly
decrease the value ∆. It only showed a diminution of 252, in 2001, and 160 in
2006. Considering that the value of −2logL is, in both cases over a million (value
related to the important quantity of observations); this is certainly too small. In
addition, intraclass correlation, that could have been decreased, did not vary; it
only lost 1 point in both 2001 and 2006. Finally, if partial scores are compared,
there were almost no changes among different purposes of reading or processes of
comprehension, the variance components reacted in the same way in every case.
241
tel-0
0563
710,
ver
sion
1 -
7 Fe
b 20
11
6.2. Hierarchical Models
6.2.2.b Orthographical depth
The parameters estimated for orthographic depth are very similar to those for
linguistic families. The variance components are equivalent, the proportion of
variance explained is almost non–existent too, and the intraclass correlation is
also 42%. Similarly, the explicability of the model is very low in accordance with
the ∆ parameter. Moreover, this is regular among the different scores.
In contrast, the values expressed by the parameter estimated for the fixed effect,
indicate an important disadvantage from being or not being part of the most
opaque language, which is the reference. This disadvantage is particularly high
in the case of shallow languages that lost more than 20 point both in the 2001
and 2006 models; opaque languages, instead, only lost 11 points in 2001, and 0
in 2006. The 2006 disadvantage of shallow languages vary some points across
the partial scores, being the most high the parameter estimated for the informa-
tive score = −36.1 ∗ ∗∗ (see B.2.2), in contrast, the estimation for literary score
= −17.4 ∗ ∗∗ is the lower (see B.2.1). Processes of reading also indicated variation
even if in a smaller proportion. This can indicate a possible connection between
shallow orthography and aspects of reading, which was not verified before, but
that could be explained in relation to the reference, the English orthography.
As opaque languages also concentrated its disadvantage in literary reading, this
confirms the advantage of English speakers in literary reading, since there was also
a score loss associated with reading among linguistic families. It can be assumed
that this is mostly a literary advantage of English speakers in this assessment more
than a disadvantage of the rest of the sample. A similar situation was found in
2006, even if the disadvantage for opaque languages was reduced significantly,
on the contrary, shallow languages kept showing a significant disadvantage. In
relation to comprehension processes, for both shallow and opaque orthographies,
the parameter estimated for high order comprehension was bigger than that of
low order, in other words, the scores are closer to those of English in this aspect.
Between orthographies, deep languages were closer from English scores, in pro-
cessing, purposes of reading and the general score.
In summary, there seems to be a language–to–language variation, since the values
estimated changes from family to family and between the different degrees of
opacity. Moreover, the estimations were constant from one assessment to the other,
indicating regularity through time. However, the proportion of variance explained
242
tel-0
0563
710,
ver
sion
1 -
7 Fe
b 20
11
Chapter 6. Factor that influence reading in PIRLS
by these models, which is close to zero, indicated that this is not an explicative
factor of score variance not at school, or individual levels, and not in any of the
aspects of reading taken into account. In addition, in developing a complete model
with all the linguistic factors, home and school variables (see models 5), there will
be important changes in the linguistic estimation that will show no consistence
with the models discussed here. This variability, indicates that language could be
influenced by other factors instead of acting at the same level, so it can not be
considered as an equivalent predictor. A preliminary conclusion of this analysis is
that languages do not determine reading achievement, but they may play another
role, since the parameter estimated did show variations from family to family and
between degrees of depth.
To study this option, some models were developed. In first place, a possible ex-
planation is that language is not an effect but a component of the variance itself.
However, the 2006 sample was used to test a null model including language as the
secondary level of the structure. English was the language of reference, creating
a structure in which speaking this language divided the sample into two groups.
The result was that there was no intraclass correlation (ICC= 0), that is, English
can not be considered as a level of the structure. This is particularly clear consid-
ering that it was tested as the only secondary level, leaving schools, teachers and
all others part of the structure out of this model.
In section 4, it was discussed the assumption that language could be determined
by countries, that is, by the educational systems. In that case, the categories
that were presented here might be under certain influence of this macro–level
of the educational structure. To observe this possible interaction, graphics 4.1
and 4.2 represented the scores by country and languages, distinguishing linguistic
families and orthographic depth. There, the only groups more homogeneous than
the average were those of English countries, but not further conclusions were
inferred at that point. Now, through modelling, it is possible to reconsider the
interaction between countries and the linguistic categories. However, it is already
now that a three level structure: students–schools–countries, does not explain
better the school that the simpler two level structure. The question is if this model
is capable of a better explicability in relation to linguistic categories. Consequently
two models were developed including as fixed effect linguistic families, in the first,
and orthographical depth in the second case. The fact of keeping always English
as the referential group became more significant when the similarity of scores at
243
tel-0
0563
710,
ver
sion
1 -
7 Fe
b 20
11
6.2. Hierarchical Models
country level is considered.
As predicted by the three level null model, these two structures are not explain-
ing reading achievement. The explicability for the variance inter-students and
inter-schools is always 0.00. Furthermore, the explicability at country level ob-
tains negative values (for example, −.17 for 2001 families), indicating that this
model is even less explicative that the null model. For both samples, and in both
models, the intraclass correlation is the same than in the null model, that is, our
categories are not a source of likeness not at school not at country level.
Consequently, it is necessary to think again about the role played by language as
reading determinant. In general terms there was some degree of interaction, the
students from English countries have a better score than the rest of the sample, but
this not explain the variance of scores from the point of view of this hierarchical
structure. It is probable that the resemblance among countries having a same
language is not representing a linguistic category, at least not as they were defined
in this research.
6.2.3 Contextual determinants
6.2.3.a Home factors
A very different situation was found when adding the home factors previously
identified to the model (see table 6.2). There were interesting proportions of
variance explained and the parameters estimated were consistent across aspects
of reading. Fixes effects and variance component will now be described separately.
Fixed effects. In first place, regarding fixed effects in model 3, the importance
of these five factors was confirmed. All the variables were represented by signif-
icant parameters estimated. Moreover, these estimations were stable through the
different aspects of reading, that is, besides some small differences between the
estimations, the values were similar.
As predicted, the availability of books at home is a positive factor according to the
standardization previously done (m=0, sd=1). The parameter indicates that a
SD over the means will add at least 11 score points in 2001 and 2006 samples.
In other words, to posses an amount of books over the international average is
244
tel-0
0563
710,
ver
sion
1 -
7 Fe
b 20
11
Chapter 6. Factor that influence reading in PIRLS
related to an improvement in reading achievement that is constant in time. If the
possible values of this variable are developed, it can show an estimation of the
gain or loss of points related to this factor. In the 2001 data, the lowest value
for this variable was = −1.64, if multiplied by the sum of the estimate and its
standard error, a student having the lowest amount of books at home can lose
((10.68+0.2)×−1.64), this is −17.84 score points. In contrast, the model indicates
that, a student having the maximum = 1.52, can add 16.54 points to the score. In
summary, this model confirms that to have books at home is positive in relation to
reading achievement, while their absence can play a negative role in reading.
A similar situation was found in relation to the resources that the student can counton at home. In 2001 the estimation for this factor was a little smaller than the
estimation for books, situation that changed in 2006 where both were equal. In
other words, the role played by home resources in 2001 was a little less important
than the availability of books at home, however this difference was small and both
were factors determining reading achievement. Moreover, both are equally impor-
tant in explaining the 2006 results. This last change can also be interpreted as an
augmentation of the importance of material resources in learning to read, how-
ever, since the augmentation is only around 2 or 3 points this conclusion cannot
be assumed.
What was called, oral socialization, is the most negative factor that was considered
in the model. As showed in table 6.2, this index gathered activities like, reading toothers or listening others reading, and talking with others about reading. The stan-
dardized estimation indicates that, the smaller the proportion of these activities,
the better the score can be. As in the previous cases, the estimation for this factor
was very stable across aspects of reading, and also from one sample to another,
the 2001 and 2006 estimations were analogous. PIRLS included questions about
these social activities, hypothesizing that they can improve reading learning, how-
ever, this model clearly points in the opposite direction, the more independent
the work, the better the reading achievement. Evidently, this result cannot be
generalized out of the sample, but it can be supposed that a main proportion of
oral interaction can be, reversely, a consequence of difficulties in learning to read.
A student who needs more support learning can obtain, at the same time, high
proportion of orality and lower reading scores.
Informative reading is also a negative factor, but in a minor degree. In 2006, the
parameter was one point more negative than the estimated for 2001. Since a
245
tel-0
0563
710,
ver
sion
1 -
7 Fe
b 20
11
6.2. Hierarchical Models
positive value of this variable, indicated a high proportion of informative reading
(explanatory books, magazines, newspapers etc.), it was expected that the esti-
mation could vary between literary scores and informative scores, however, the
difference between them was not significant, barely one point in both samples. In
addition, it was also expected that a particular relation between informative read-
ing and low order processing would exist, but, again the difference between low
and high order processing is too small to be taken into account. It can be assumed
that a significant amount of informative reading is equally negative, even if the
parameter estimated is one of the smallest in this model.
Students’ attitudes toward reading. The last home factor included in the model, is
certainly the most important factor in accordance with its parameter estimated.
To have a positive attitude toward the act of reading and toward books is related
to an improvement of reading achievement. In developing the equation of this
parameter using 2001 data, it can be observed that, on one hand, if the maximum
value is multiplied by the parameter (1.39 × 21.79), the gain in score points for a
positive attitude can be as much as 30.29 ± 0.2. On the other hand, the minimum
value of this variable is particularly low = −3.05. Consequently, to have the most
negative attitude toward reading, is related to a loss of −66.46 ± 0.2. This is more
than a standard deviation. It can be assumed that, for PIRLS sample, the role
played by motivation is particularly important in learning to read.
Because of the important parameter estimated for the variable representing at-titudes toward reading, a derived question, is how much of the variance can be
explained by this particular factor. To explore it, regressions with only this vari-
able as a fixed effect were developed. The first remark is that neither the intercept
nor the parameter estimated varied. The last was 20.89 in 2001 and 19.12 in 2006.
In 2001, the model fit to explain 4% of the school–to–school variance, and 13%
of the variation at student level. For 2006 data, it explained 5% of the school–
to–school variance, and 11% of the variation at student level. This proportion
clearly shows that this factor depends on the individuals more than the schools;
consequently, its subjective constitution is confirmed.
This information leads to a new problem: the most influential parameter in this
model can not be controlled or modified since is not part of the educational sys-
tem itself. A possible way of controlling this variable could be controlling variables
related to parents, that may determine positively their children’ attitudes. To ex-
amine if there is a relation between parents and the variable SATR, the PIRLS
246
tel-0
0563
710,
ver
sion
1 -
7 Fe
b 20
11
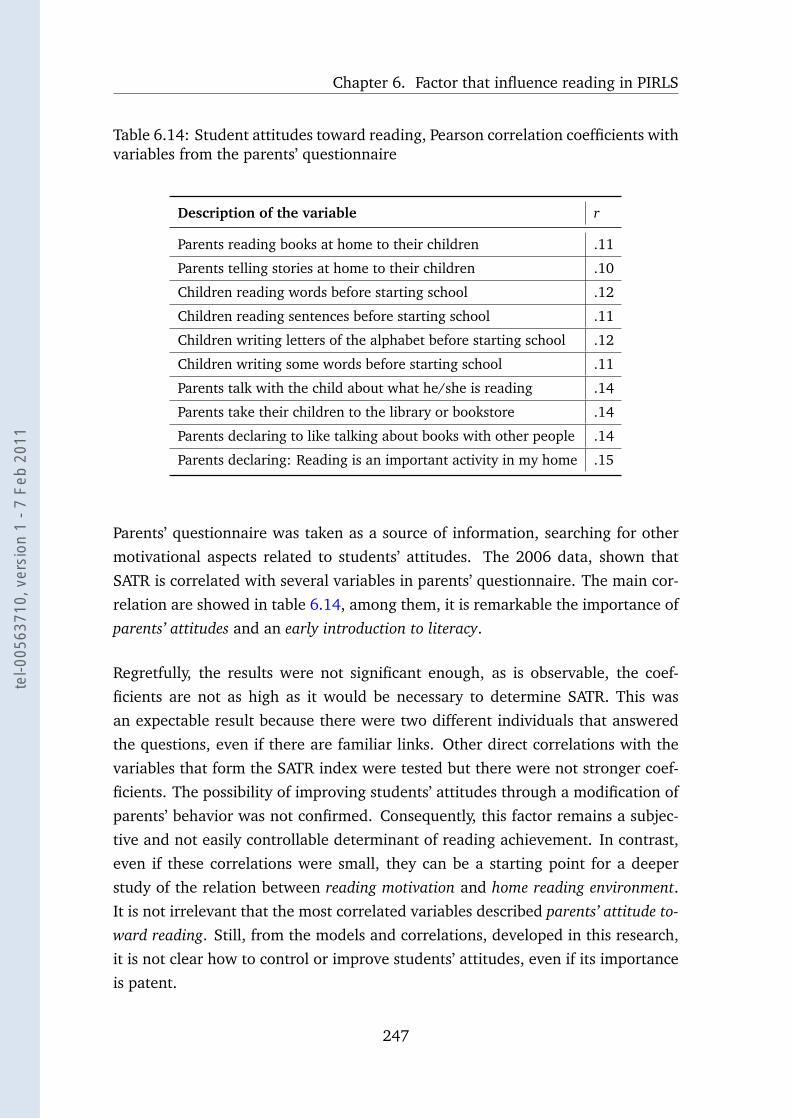
Chapter 6. Factor that influence reading in PIRLS
Table 6.14: Student attitudes toward reading, Pearson correlation coefficients withvariables from the parents’ questionnaire
Description of the variable r
Parents reading books at home to their children .11
Parents telling stories at home to their children .10
Children reading words before starting school .12
Children reading sentences before starting school .11
Children writing letters of the alphabet before starting school .12
Children writing some words before starting school .11
Parents talk with the child about what he/she is reading .14
Parents take their children to the library or bookstore .14
Parents declaring to like talking about books with other people .14
Parents declaring: Reading is an important activity in my home .15
Parents’ questionnaire was taken as a source of information, searching for other
motivational aspects related to students’ attitudes. The 2006 data, shown that
SATR is correlated with several variables in parents’ questionnaire. The main cor-
relation are showed in table 6.14, among them, it is remarkable the importance of
parents’ attitudes and an early introduction to literacy.
Regretfully, the results were not significant enough, as is observable, the coef-
ficients are not as high as it would be necessary to determine SATR. This was
an expectable result because there were two different individuals that answered
the questions, even if there are familiar links. Other direct correlations with the
variables that form the SATR index were tested but there were not stronger coef-
ficients. The possibility of improving students’ attitudes through a modification of
parents’ behavior was not confirmed. Consequently, this factor remains a subjec-
tive and not easily controllable determinant of reading achievement. In contrast,
even if these correlations were small, they can be a starting point for a deeper
study of the relation between reading motivation and home reading environment.It is not irrelevant that the most correlated variables described parents’ attitude to-ward reading. Still, from the models and correlations, developed in this research,
it is not clear how to control or improve students’ attitudes, even if its importance
is patent.
247
tel-0
0563
710,
ver
sion
1 -
7 Fe
b 20
11

6.2. Hierarchical Models
Variance components. Coming back to the study of model 3, it is remarkable
the stability of the coefficients across the different aspects of reading and between
both samples, besides some small differences that will be mentioned in the next
paragraph, the models are characterized by a great degree of resemblance. They
all fit to explain around 36% to 42% of the explainable variation in school means
reading achievement and 22% of the students score variation. Moreover, the de-
gree of dependences among students from schools of the same score means is still
very elevated: it only decreases 3% in 2001, and 6% in 2006, in other words,
the scores continue to be highly dependent on the school in which a student is
enrolled.
Concerning variations among aspects of reading, there was no change between lit-
erary and informative purposes, they obtained equivalent parameters in all cases,
the proportion of variance explained and the intraclass correlation did not vary
either (see tables B.1.1, B.1.2, B.2.1, and B.2.2). In contrast, high and low pro-
cesses of comprehension did show a little difference, in 2001 (see tables B.1.3,
and B.1.4), the model fit to explain 5% more of the variance between schools
during low order processing. In addition, this proportion continues to be part of
the 2006 models (see tables B.2.3, and B.2.4), where low order score obtain the
bigger proportion of school–to–school variance explained by this model: 45%, this
is, half of the explicable variance. It must be remembered that there were some
changes in the distribution of these processes across the items, which is probably
the reason for this small change. The most important result is the general amount
of explicability related to school–to–school variance, that is observable in total
scores.
In general, it can be conclude that there was not significant difference in explica-
bility from model to model. Besides the mentioned distinctions, what stands out
most is the resemblance of all models. Concerning total scores, the proportion
of variance between schools explained by these individual factors augmented six
points from 2001 to 2006. This small augmentation can be taken as relevant since
is one of the few changes in the general resemblance tendency. It can be concluded
that the relevance of home conditions at school level has increased.
In contrast, the explicability of home factors within schools with the same average
stays constant (22%). From this percentage, close to a half is related to the atti-tudes towards reading, because the model were this was the only regressor fit to
explain around 12% of variance (see 6.2.3.a). Concerning schools variance, the
248
tel-0
0563
710,
ver
sion
1 -
7 Fe
b 20
11
Chapter 6. Factor that influence reading in PIRLS
proportion explained is certainly exceptional, since the lower proportion was 34%,
explaining 2001 informative score (table B.1.2)and the major is the 45% already
mentioned (table B.2.3). Consequently, a valid question is how home factors get to
best explain school variance over the variance related to individuals. A possible an-
swer is that the similarity of school achievement is, in fact, related to the similarity
of the individuals that constitute it. In other words, similar individual character-
istics are the basis for school choice, which implies a connection between schools
and reading achievement. Another possibility, is that it is the international dimen-
sion of the sample that emphasizes home factors explicability, there are reasons to
assume this conclusion since it has already been described how much intraclass
correlation among schools can change from one country to another (see 6.1). If
an analysis of separate countries is undertaken, the proportions of explicability
can vary, this is a possibility that will be discussed later (see 6.2.4.c).
6.2.3.b School factors
Model 4, includes school factors as a fixed effect to explain reading achievement
variance. It can be observed that not all the variables mentioned in table 6.3 are
present. The reason was a significant amount of missing values in two of the
variables. In 2001, if variable time is added to the model, 57, 152 observations
are not included because of missing values; if mother tongue is included 28, 540
observations are eliminated; in 2006 the losses were similar. These amounts are
too high to not affect the global significance of the model, in addition, to include
the rest of the school variables also implies loss of observations. In 2001, from
the original 111, 205 observations read, only 82, 665 were included in the model
without time and LNG, however, in this case, the missing values are distributed
along with the rest of the variables not affecting one of them in particular, as was
the case of the two excluded.
Consequently these two variables must be excluded to preserve the general validity
of this model, but, it is a valid question, to ask, how much of the variance could
have been account by them. In first place, time is not a significant loss, because
in the models including both language and time, the latter is not significant. In
2001, if language is omitted and time kept, it only represents a gain of 1.91(±0.64)
points in average. In contrast, the index of second language use is significant and
represents a loss of −15.38(±0.5) for an average rang, thus there is an important
249
tel-0
0563
710,
ver
sion
1 -
7 Fe
b 20
11
6.2. Hierarchical Models
and negative relation between reading achievement and the use of a language
different from that of the school. However, this is only valid for 50% of the sample.
Searching to discover where exactly the missing values for LNG are, there are
some specific countries where there are no observations: in 2001: Hong Kong,
Hungary, Iceland Lithuania, Russia, Ontario and Quebec, in 2006 the same coun-
tries less Hong Kong, plus Slovenia and New Zealand. These countries did not
answer some of the questions related to language. This information was used to
test a regression leaving them out, using the 2001 data, it was found that the esti-
mated parameter for language was −21.73(p < .1). If a model not including LNGand another including it are compared, the proportion of variance explained at
school level change significantly from 14% to 28% compared to the null model. In
2006, the same procedure showed a gain of 9%: from 11% to 20%. Consequently,
even if this factor can not be included in a general model explaining this data,
the importance of second language is confirmed. For example, a student whose
mother tongue is different from that used at school and who speaks the educa-
tional language only when he/she is at the school can risk losing 20 score points
for each standard deviation over the mean language use. In other words, reading
achievement can be better if the first language learned is then used daily at home
and at school.
Fixed effects. Now, model 4 excludes these variables and shows the role played
by the rest of the school factors in explaining reading achievement. As was the case
for the Home Factors, School factors are characterized by a great similarity across
the models, including different aspects of reading. There were very small changes
in the parameter estimated from 2001 to 2006, and all the variance components
were constant across process and purposes of reading.
The first factor included was the variety in evaluation methods that got a negative
relation with reading achievement, that is, the more the activities are declared
by teachers, the more the negative results. The parameters estimated for this
variable were similar between both samples and aspects of reading. Even if the
value is smaller that those of the Home Factors, the negative role played by this
variety is patent. If 2006 data is used to develop the equation, the maximum
value of variable ASK is 2.88, which means a loss of score points equivalent to
((−7.51 − 1) × 2.88 = −24.51). In contrast, if teachers chose only one or two
of these methods to evaluate reading, the minimum value of the variable is −3.8,
250
tel-0
0563
710,
ver
sion
1 -
7 Fe
b 20
11
Chapter 6. Factor that influence reading in PIRLS
developing the equation: ((−7.51−1)×−3.8 = 32, 34). What these values indicate
is that the variety in evaluation does not improve reading achievement; on the
contrary, to apply specific methodologies could help to improve reading. However,
the procedure did not help in discovering which exactly those methods are.
The second factor, expectations and wishes, is, like students’ attitudes, a very sub-
jective element. It would have been interesting to find some relation between
both variables, however the coefficient of a correlation for 2006 data is equal to
.01. The parameter estimated for this variable was constant across the sample of
both assessments; consequently, this is one of the aspects that must be taken into
account to improve reading achievement.
The low estimated parameter for the third variable: emphasis on strategies, was
one of the unexpected results, because of the importance of the variable represent-
ing these strategies in the previous analysis. In addition, the parameter did not
vary between partial scores, which would have been expected since it is particu-
larly related to processes of comprehension. In summary, the emphasis on strategiesduring reading instruction does implies an improvement of reading achievement,
but in terms of score points, it represent a small measure.
In contrast with the negative incidence of the variety of evaluation methods, al-
ready described, the variety of instruction methods is related positively to reading
achievement. However, this result is only valid for 2006 data. In 2001, all the
parameters estimated where not significantly different from 0, in other words, this
factor did not improve or diminish 2001 scores. In addition, the estimation for the
2006 models were not very elevated, indicating that the role played by this factor
was not as central as other factors.
More important estimations were those related to early learning of reading skills.This factor is related to a general improvement of the scores, and not to any aspect
of reading in particular. This is also a variation in relation to what could have been
expected, because in the preliminary analysis this variable was directly related to
high order processing. If the possible score points associated with the estimations
are studied, the 2006 data allows one to observe that the minimum and maximum
values for this variable are −2.17/0.89. This is interesting because the negative
values can reach 2 standard deviations while the positive values got only 1 SD. In
other words, the distribution of this variable indicates that the 50% low is more
variable that the 50% high. In this case, an interesting value is that of the mode of
251
tel-0
0563
710,
ver
sion
1 -
7 Fe
b 20
11
6.2. Hierarchical Models
the values, which is equal to the maximum value: 0.89. This means that an impor-
tant proportion of the sample gets this maximum value, while some observations
got particularly low values. In other words, the tendency in the sample it to de-
velop all these skills before fourth grade, in contrast, those schools where these
skills are not part of the instruction before fourth grade, will obtain an important
penalization in reading achievement close to 7 points by each negative standard
deviation.
Concerning the last factor, the use of a variety of books is one of the two variables
that were directly created from variables present in PIRLS questionnaires, that
is, this is not an index summarizing several questions. The other one was the
variable describing the availability of books, there, the parameters estimated were
stable and comparable. In contrast, this variable shows an important change from
2001 to 2006 sample, while 2001 estimations are around a coefficient of 9, in
2006 they are close to a value of 2 and less significant. Because of this change, the
comparability of the variables from sample to sample was verified. However it is
the exact same question that was answered by the teacher in both questionnaires:
When you have reading instruction and/or do reading activities with the students,how often do you use a variety of children’s books?. Moreover, the alternatives to
answer were also exactly the same. Concerning the replies given by the teachers,
the 2001 version of the variable had a means of 2.23, and a SD of 0.83, being almost
equal to 2006 version, that obtained a means of 2.22 and a SD of 0.82. Since the
comparability of the variables between both samples was confirmed, the change
in the estimated values can be interpreted as a variation of the role played by this
factor. In that case, it is possible to affirm that to use a variety of books during
instruction played a more important part in explaining 2001 results. However, it
is preferable to affirm that a deeper study of this aspect is needed to ensure more
definitive conclusions.
Variance components Regarding variance components, because of the hierar-
chical structure that is being applied, these factors, that are related to the superior
level, are not capable of explaining variation from individual–to–individual. This
is why the proportion of variance explained between students is only 3% in 2001
and 0 in 2006. In contrast, these insignificant percentages confirm that the model
is clearly describing properties of the schools and not merging elements coming
from different levels of the structure.
252
tel-0
0563
710,
ver
sion
1 -
7 Fe
b 20
11
Chapter 6. Factor that influence reading in PIRLS
On the contrary, a negative aspect of these findings it that the model fit to ex-
plain only 10% of the variance between schools, in other words, most of reading
achievement has yet to be explained. However, since it is already known that the
significant amount of variance explained at this level is by home Factors, it will
be necessary to revise the model combining both kinds of factors before drawing
definitive conclusions.
As it has been the general tendency among models, the estimations are similar for
all the scores, total and partials and there is a remarkable resemblance between
the models representing both samples. In other words, the models are valid for all
the aspects of reading and constant across time.
A final characteristic to be mentioned about variance components is the general
explicability of the model. The ∆ value shows that there was a significant reduc-
tion of the distance from the ideal model. The last two models, representing Home
and School obtained a smaller 2LogL. In the tables, together with the value of ∆
for each model an estimation of the percentage of reduction has been added, this
allows for the affirmation that model 3 is 79% closer to an ideal fit than the null
model, if this one represent the maximum distance. However, it is necessary to
be carefully in interpreting this reduction because the amount of observations has
diminished too, and so the degrees of freedom must be taken into account.
6.2.4 Final Models
Model 5 represents the final goal of this research, a model including contextual
factors and linguistic elements that are able to explain, at least, a part of the
variance in reading achievement. However, because of the findings of the previous
models, other better possibilities must be considered. The reason is the lack of
improvement in explicability relating to language factors. As it was described,
none of the models including linguistic families or orthographic depth was better
than the null model in explaining reading achievement. In addition, the variable
components of this last model indicate that the proportion of variance explained
in both levels is the sum of the proportions explained by models 3 and 4. For
example, between schools, the total variance explained was 43% of the variance,
a value that is close to the sum of the 36% explained by home factors and the
10% explained by school factors. Similarly, the proportion of variance explained
between students from schools with the same average is 25%, which is the sum of
253
tel-0
0563
710,
ver
sion
1 -
7 Fe
b 20
11

6.2. Hierarchical Models
22% from home and 3% from schools factors.
Another negative aspect of the inclusion of linguistic factor is the contradictory
results of their estimated parameters. While only one of them was a positive value
before, now, the few significant estimations seem to represent an improvement
in scores related to not being part of the English language. This contradicts the
previous results and the general results where English achievement averages were
above the others. In addition, a big part of the variables obtained non significant
estimations, particularly in the 2001 models, which differ from the 2006 estima-
tions, where the highest values are too elevated considering the low explicability
of these factors. In summary, the parameter estimated for linguistic variables were
contradictory; many of them were not significant, they were not consistent from
2001 to 2006, and did not represent an improvement of the explicability of the
model.
6.2.4.a Final Model compared to models 3, 4 and 5
Consequently, since there is no loss in taking off the model of linguistic variables,
the final models in table 6.15 propose to explain reading achievement only consid-
ering home and school factors. Since it is already established that the tendencies
are equivalent across all the models for partial scores, from now on the analysis
will be focused on total scores.
Concerning model 6, if it is compared with model 5, the contrast allows for the
study of the possible changes related to the absence of linguistic factors, because,
besides their lack of explicability, it is valid to ask if their presence alters the
parameter estimated for the rest of the variables and the variance components.
Model 6 shows that with the exclusion of linguistic variables, there were only small
changes in the estimations for the rest of the variables. What is more remarkable
is that these changes were all congregated on school factors, while home param-
eters did not vary significantly. Now it is possible to add to the supposition that
the resemblance among countries was due to something different than languages
(see 6.2.2.b), the idea that this could be more related to school characteristics.
This last result is also confirmed by the proportion of variance explained, decreas-
ing two points in school–to–school explicability, while variance within schools did
not change. In other words, even if the inference is based in a very small amount of
254
tel-0
0563
710,
ver
sion
1 -
7 Fe
b 20
11
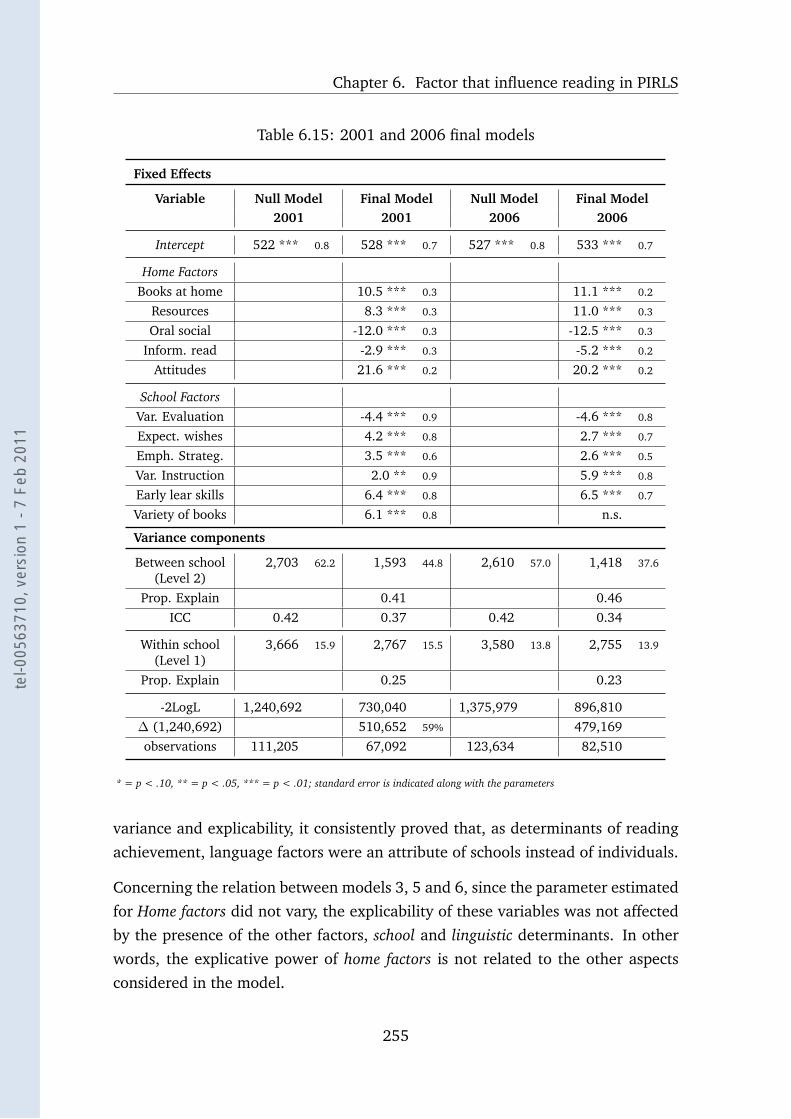
Chapter 6. Factor that influence reading in PIRLS
Table 6.15: 2001 and 2006 final models
Fixed Effects
Variable Null Model Final Model Null Model Final Model2001 2001 2006 2006
Intercept 522 *** 0.8 528 *** 0.7 527 *** 0.8 533 *** 0.7
Home FactorsBooks at home 10.5 *** 0.3 11.1 *** 0.2
Resources 8.3 *** 0.3 11.0 *** 0.3
Oral social -12.0 *** 0.3 -12.5 *** 0.3
Inform. read -2.9 *** 0.3 -5.2 *** 0.2
Attitudes 21.6 *** 0.2 20.2 *** 0.2
School FactorsVar. Evaluation -4.4 *** 0.9 -4.6 *** 0.8
Expect. wishes 4.2 *** 0.8 2.7 *** 0.7
Emph. Strateg. 3.5 *** 0.6 2.6 *** 0.5
Var. Instruction 2.0 ** 0.9 5.9 *** 0.8
Early lear skills 6.4 *** 0.8 6.5 *** 0.7
Variety of books 6.1 *** 0.8 n.s.
Variance components
Between school(Level 2)
2,703 62.2 1,593 44.8 2,610 57.0 1,418 37.6
Prop. Explain 0.41 0.46ICC 0.42 0.37 0.42 0.34
Within school(Level 1)
3,666 15.9 2,767 15.5 3,580 13.8 2,755 13.9
Prop. Explain 0.25 0.23
-2LogL 1,240,692 730,040 1,375,979 896,810∆ (1,240,692) 510,652 59% 479,169observations 111,205 67,092 123,634 82,510
* = p < .10, ** = p < .05, *** = p < .01; standard error is indicated along with the parameters
variance and explicability, it consistently proved that, as determinants of reading
achievement, language factors were an attribute of schools instead of individuals.
Concerning the relation between models 3, 5 and 6, since the parameter estimated
for Home factors did not vary, the explicability of these variables was not affected
by the presence of the other factors, school and linguistic determinants. In other
words, the explicative power of home factors is not related to the other aspects
considered in the model.
255
tel-0
0563
710,
ver
sion
1 -
7 Fe
b 20
11
6.2. Hierarchical Models
A different situation is that of school determinants, which did vary. In all the cases,
the values change only some points more or less. However, none of them changed
from positive to negative or add more than 5 points, as was the case of linguistic
factors between models 1, 2 and 5. Among models 4, 5 and 6, there were some
variations that are necessary to illustrate.
Describing the model with schools factors, it was mentioned that the factor Ex-pectation and wishes could have been related to students attitudes toward reading,
since both represent subjective aspects. Even if this relation was not proved, the
diminution of the coefficient estimated for this variable in model 6, indicate that
there is a relation between expectation and wishes and home factors. In addition,
since its coefficient did not vary from model 5 to 6, a possible relation with lin-
guistic variables can be rejected.
In contrast, the factor variety in evaluation did vary in relation to linguistic factors.
It reduced its estimation by more than half in model 5, then, recovered some points
in model 6, but not as much as in model 4. These variations imply that there was
an interaction between variety in evaluation, linguistic and home determinants.
However, the values do not represent a significant change, since they are not much
bigger than standard errors. Similarly, variety of books, lost some points in model
5, and recovered some others in model 6, but not enough to be significant.
Another different case was that of emphasis in strategies, whose variable did not
vary from model 4 to 5, or from model 5 to 6. This fact proves that there is
not an interaction of this variable with home factors, or with linguistic variables.The variation of the estimations for variety in instruction methodology and earlylearning of reading skills indicates that they are related with home and not with
linguistic factors, because it recovered a few points from model 5 to 6, not from
model 4 to 5.
In relation to variance components, ICC has decreased 5% in 2001, some more
points in 2006, but in both cases, the degree of dependence among observations
within schools is still very important.
Concerning variance between schools, this model fit to explain 41% of the expli-
cable variance in 2001, 5% more than in 2006. These are the most positive re-
sults that these procedures were capable of obtaining; that shows how important
schools are in student achievement, in other words, in PIRLS reading tests, 40%
of the variation in student achievement is due to the schools in which students are
256
tel-0
0563
710,
ver
sion
1 -
7 Fe
b 20
11

Chapter 6. Factor that influence reading in PIRLS
enrolled.
In contrast, the explicability of the model concerning variation between students
is less important, but not without significance; 25% of the variance that occurs
among students in their respective school means was explained by the model. In
summary, PIRLS results are considerably more related to schools than to individu-
als, however, the determinants that explain this variation came from background
characteristics of the students, that is, not controlled by school policies.
6.2.4.b Studding means–and slopes
Final properties of hierarchical models that can improve its explicative power are
the inclusions of random coefficients, which allow the fixed effect to vary on each
school. The hypothesis behind this technique is to suppose that an average regres-
sion equation is not necessarily the best option to explain reading achievement,
because it can be very different depending on the average of the school. In other
words, two students with a similar background can obtain higher or lower reading
achievement depending on the high or low average of their schools, since school
average can affect students’ outcomes. In the equation, the variables can vary not
only at the interception point but also it can obtain random slope equations. This
kind of model is called means–and slopes–as-outcomes model (see Rumberger &
Palardy, 2004, 245–246).
Now, the goal is to discover which factors can vary across schools significantly.
Figure 6.2, represents different regression equations for the most determinant
variables. To underline possible differences, score averages for each school were
calculated using 2006 sample, then linear regressions were calculated for the 95%
Quantile (high), the 5% Quantile (low), and the 90% between them (medium),
using different variables as determinants.
As the figure shows, the different slopes are not as great as it could been expected.
In general there are small differences from high average to medium, being almost
non–existent in the case of students attitudes and early learning. In other words,
if the average of the school is high or medium, the effect of these factors will not
vary.
The main changes are focused on the low schools average. Orality seems to gather
most of the variation from low average slope, that is, a high presence of this factor
257
tel-0
0563
710,
ver
sion
1 -
7 Fe
b 20
11
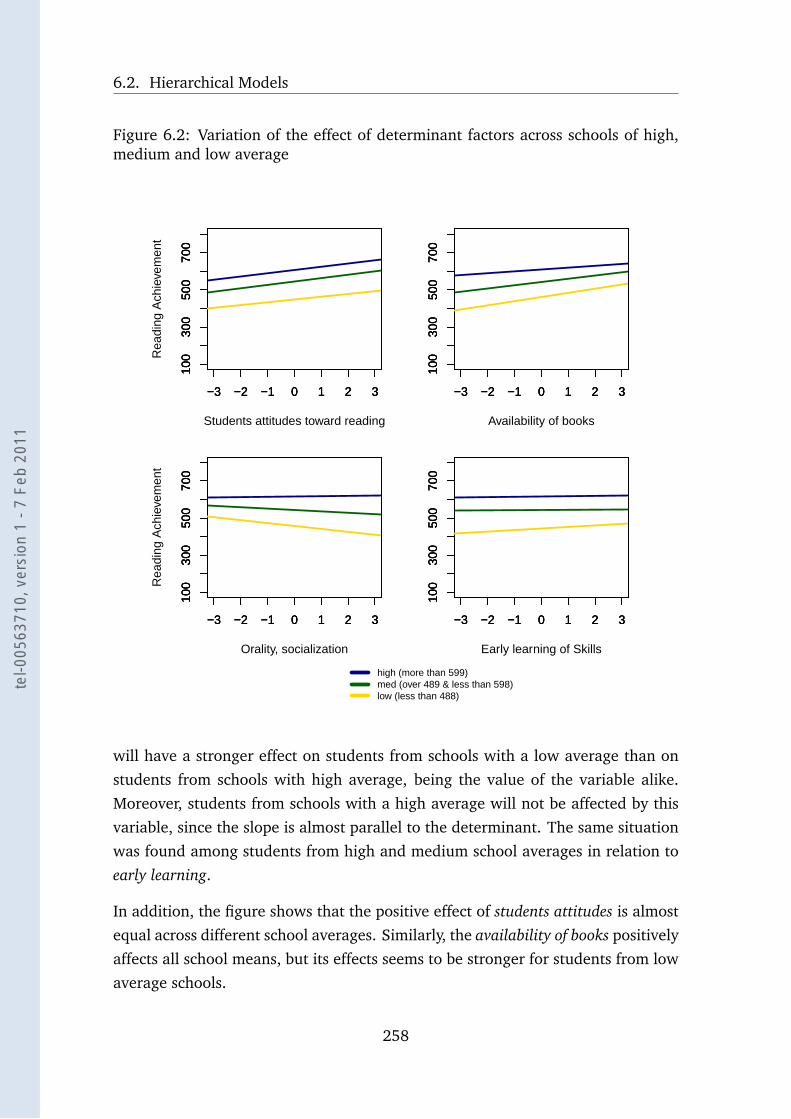
6.2. Hierarchical Models
Figure 6.2: Variation of the effect of determinant factors across schools of high,medium and low average
−3 −2 −1 0 1 2 3
100
300
500
700
Students attitudes toward reading
Rea
ding
Ach
ieve
men
t
−3 −2 −1 0 1 2 3
100
300
500
700
−3 −2 −1 0 1 2 3
100
300
500
700
−3 −2 −1 0 1 2 3
100
300
500
700
Availability of books
−3 −2 −1 0 1 2 3
100
300
500
700
−3 −2 −1 0 1 2 3
100
300
500
700
−3 −2 −1 0 1 2 3
100
300
500
700
Orality, socialization
Rea
ding
Ach
ieve
men
t
−3 −2 −1 0 1 2 3
100
300
500
700
−3 −2 −1 0 1 2 3
100
300
500
700
−3 −2 −1 0 1 2 3
100
300
500
700
Early learning of Skills
−3 −2 −1 0 1 2 3
100
300
500
700
−3 −2 −1 0 1 2 3
100
300
500
700
high (more than 599)med (over 489 & less than 598)low (less than 488)
will have a stronger effect on students from schools with a low average than on
students from schools with high average, being the value of the variable alike.
Moreover, students from schools with a high average will not be affected by this
variable, since the slope is almost parallel to the determinant. The same situation
was found among students from high and medium school averages in relation to
early learning.
In addition, the figure shows that the positive effect of students attitudes is almost
equal across different school averages. Similarly, the availability of books positively
affects all school means, but its effects seems to be stronger for students from low
average schools.
258
tel-0
0563
710,
ver
sion
1 -
7 Fe
b 20
11
Chapter 6. Factor that influence reading in PIRLS
Finally, models including these possible random effects were tested; however,
there was not a significant improvement of explicative power, not for fixed effect or
the variance component. The reason is probably the lack of real difference among
slopes, since the few changes that were presented in figure 6.2 represented the
5% more extreme percents of the school average, if the graphic had represented
a wider range, such as the 25% percent, the variation among slopes would have
been even weaker. In general, it can be said that the variables affected similarly
the sample, and this is why it was preferred to keep the simplest structure as final
model.
6.2.4.c Countries, applying models to France, USA and Russian samples
The last question left to be reviewed, deals with the relation of intraclass corre-
lation and the country effect, as was mentioned in section 6.2.1.a and shown in
figure 6.1. The intra–school correlation is very different from country to country,
which leads one to ask what could be the explicability of the models if it is applied
in specific countries.
The final model showed that, even controlling home and school determinants,
variation between schools remains very high. This lead one to remember what
was hypothesized before, that this variance was due, particularly to country–to–
country variation. If this is true, and the variables can really explain school–to–
school variation, in applying the model to a specific country should show a most
significant reduction of this variance.
Three countries were selected to study the explicability of the models in specific
educational systems, France, United States of America, and Russia. The first two
are countries with similar results in both assessments, with a long educational
tradition but with opposing structures. France is characterized by a highly central-
ized system; while the states that constituted USA, play a mayor role in organizing
their local systems. In addition, Russia seemed to be an interesting case to observe
closely because of its improvement from 2001 to 2006 and because the very high
proportion of intraclass correlation that was detected in figure 6.1,leading to sup-
pose that Russian schools are very diverse in their effectiveness, even if on aver-
age they were above the best results of PIRLS 2006. Tables 6.16, 6.17 and 6.18,
present models for both 2001 and 2006 data from these countries in comparing a
null model to that including Home and Schools factors.
259
tel-0
0563
710,
ver
sion
1 -
7 Fe
b 20
11
6.2. Hierarchical Models
In general terms, what is remarkable about these models is the low explicability
of school factors. They explicability in the model for the entire sample was already
low, and then they lost most of that significance, when developing these country
models. In contrast, some of the Home factors increase their parameter estimated,
but these values are diverse, thus it is necessary to describe them separately. A
last general remark is the bigger explicability of the models, that is, the propor-
tion of variance explained is higher to that of the general model, but again it is
better to describe that power in each country separately, because of the different
proportions that were obtained.
France In first place, the null models in table 6.16, confirms that France has a
low intra–school correlation if compared to the rest of the sample, this proportion
was equivalent in both samples. Because of this low amount, the decrease of this
correlation related to Home and School factors was also small. As a result, the
final French model indicated that the degree of dependence among observations
within schools with similar parameters for home and schools is only 12%. In other
words, if home and school factors are controlled the school in which a student is
enrolled only account for a minimal part of his/her achievement. French schools
are more similar between them than the international PIRLS average.
Concerning home factors, the estimated parameters for availability of books and
orality are similar to those of the international sample, in contrast, the parameter
estimated for home resources is lower, which means that it is less important in
France than in the international average. On the contrary, the parameter estimated
for informative reading was some points more negative than the average. This last
result can be related to the position of France in the international rank, because
the score of informative reading is higher than literary score (as shown in tables 5.2
and 5.3). Since it is a negative factor, this informative advantage can be related to
a decrease in the general results of France.
Finally, the most important factor, is attitudes toward reading, more important in
this country than in the international sample and than in the others studied coun-
tries. Consequently, from the factors included in this study, the most important
determinant of the results obtained by France is the motivation for reading that
the students have.
In relation to school factors, only expectations and wishes is a significant deter-
260
tel-0
0563
710,
ver
sion
1 -
7 Fe
b 20
11
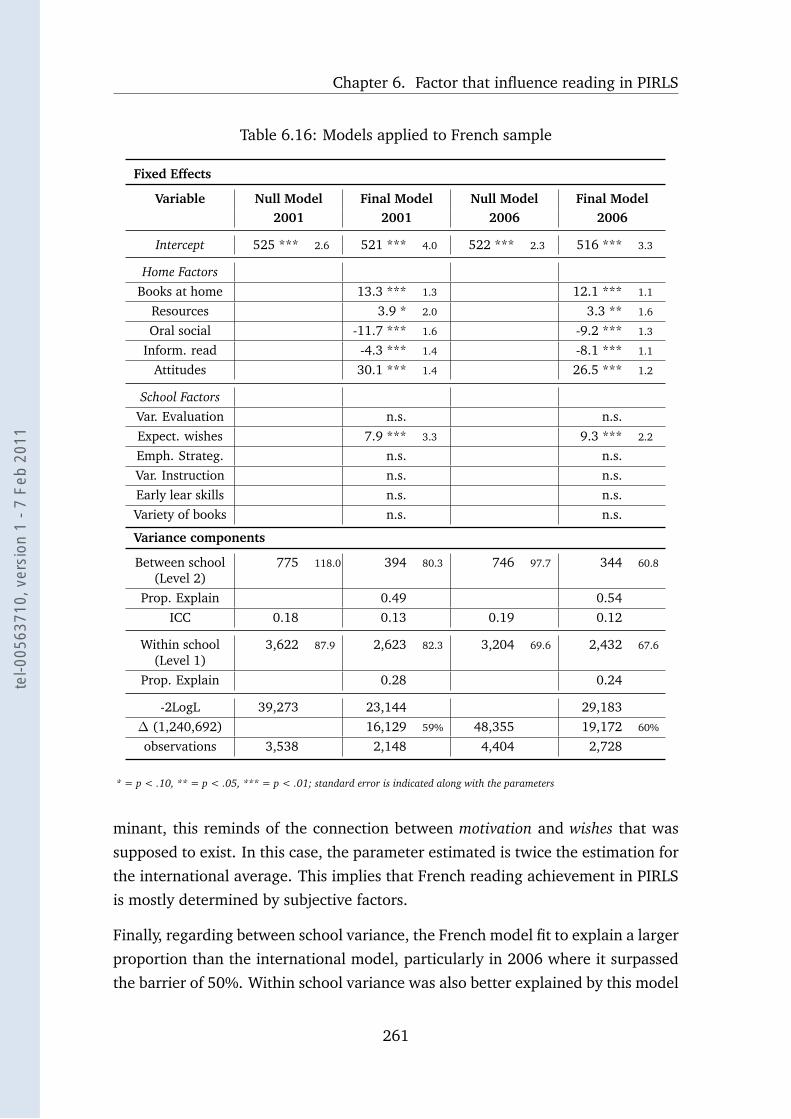
Chapter 6. Factor that influence reading in PIRLS
Table 6.16: Models applied to French sample
Fixed Effects
Variable Null Model Final Model Null Model Final Model2001 2001 2006 2006
Intercept 525 *** 2.6 521 *** 4.0 522 *** 2.3 516 *** 3.3
Home FactorsBooks at home 13.3 *** 1.3 12.1 *** 1.1
Resources 3.9 * 2.0 3.3 ** 1.6
Oral social -11.7 *** 1.6 -9.2 *** 1.3
Inform. read -4.3 *** 1.4 -8.1 *** 1.1
Attitudes 30.1 *** 1.4 26.5 *** 1.2
School FactorsVar. Evaluation n.s. n.s.Expect. wishes 7.9 *** 3.3 9.3 *** 2.2
Emph. Strateg. n.s. n.s.Var. Instruction n.s. n.s.Early lear skills n.s. n.s.Variety of books n.s. n.s.
Variance components
Between school(Level 2)
775 118.0 394 80.3 746 97.7 344 60.8
Prop. Explain 0.49 0.54ICC 0.18 0.13 0.19 0.12
Within school(Level 1)
3,622 87.9 2,623 82.3 3,204 69.6 2,432 67.6
Prop. Explain 0.28 0.24
-2LogL 39,273 23,144 29,183∆ (1,240,692) 16,129 59% 48,355 19,172 60%
observations 3,538 2,148 4,404 2,728
* = p < .10, ** = p < .05, *** = p < .01; standard error is indicated along with the parameters
minant, this reminds of the connection between motivation and wishes that was
supposed to exist. In this case, the parameter estimated is twice the estimation for
the international average. This implies that French reading achievement in PIRLS
is mostly determined by subjective factors.
Finally, regarding between school variance, the French model fit to explain a larger
proportion than the international model, particularly in 2006 where it surpassed
the barrier of 50%. Within school variance was also better explained by this model
261
tel-0
0563
710,
ver
sion
1 -
7 Fe
b 20
11
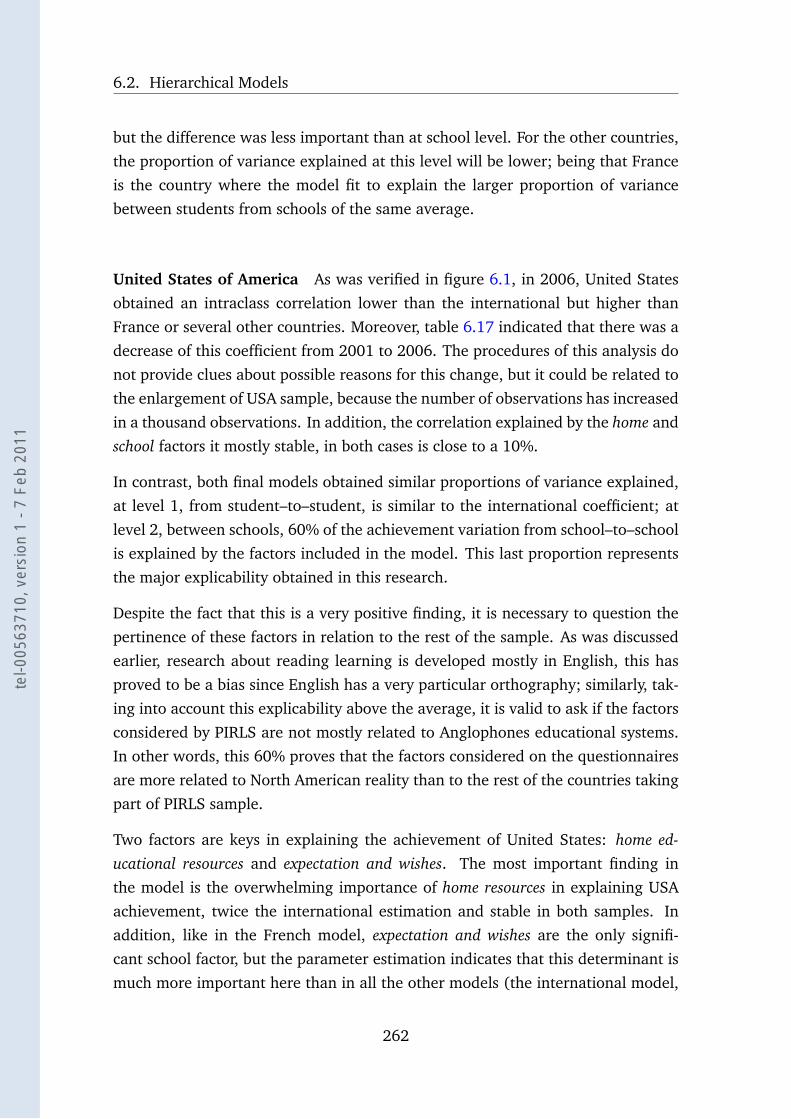
6.2. Hierarchical Models
but the difference was less important than at school level. For the other countries,
the proportion of variance explained at this level will be lower; being that France
is the country where the model fit to explain the larger proportion of variance
between students from schools of the same average.
United States of America As was verified in figure 6.1, in 2006, United States
obtained an intraclass correlation lower than the international but higher than
France or several other countries. Moreover, table 6.17 indicated that there was a
decrease of this coefficient from 2001 to 2006. The procedures of this analysis do
not provide clues about possible reasons for this change, but it could be related to
the enlargement of USA sample, because the number of observations has increased
in a thousand observations. In addition, the correlation explained by the home and
school factors it mostly stable, in both cases is close to a 10%.
In contrast, both final models obtained similar proportions of variance explained,
at level 1, from student–to–student, is similar to the international coefficient; at
level 2, between schools, 60% of the achievement variation from school–to–school
is explained by the factors included in the model. This last proportion represents
the major explicability obtained in this research.
Despite the fact that this is a very positive finding, it is necessary to question the
pertinence of these factors in relation to the rest of the sample. As was discussed
earlier, research about reading learning is developed mostly in English, this has
proved to be a bias since English has a very particular orthography; similarly, tak-
ing into account this explicability above the average, it is valid to ask if the factors
considered by PIRLS are not mostly related to Anglophones educational systems.
In other words, this 60% proves that the factors considered on the questionnaires
are more related to North American reality than to the rest of the countries taking
part of PIRLS sample.
Two factors are keys in explaining the achievement of United States: home ed-ucational resources and expectation and wishes. The most important finding in
the model is the overwhelming importance of home resources in explaining USA
achievement, twice the international estimation and stable in both samples. In
addition, like in the French model, expectation and wishes are the only signifi-
cant school factor, but the parameter estimation indicates that this determinant is
much more important here than in all the other models (the international model,
262
tel-0
0563
710,
ver
sion
1 -
7 Fe
b 20
11
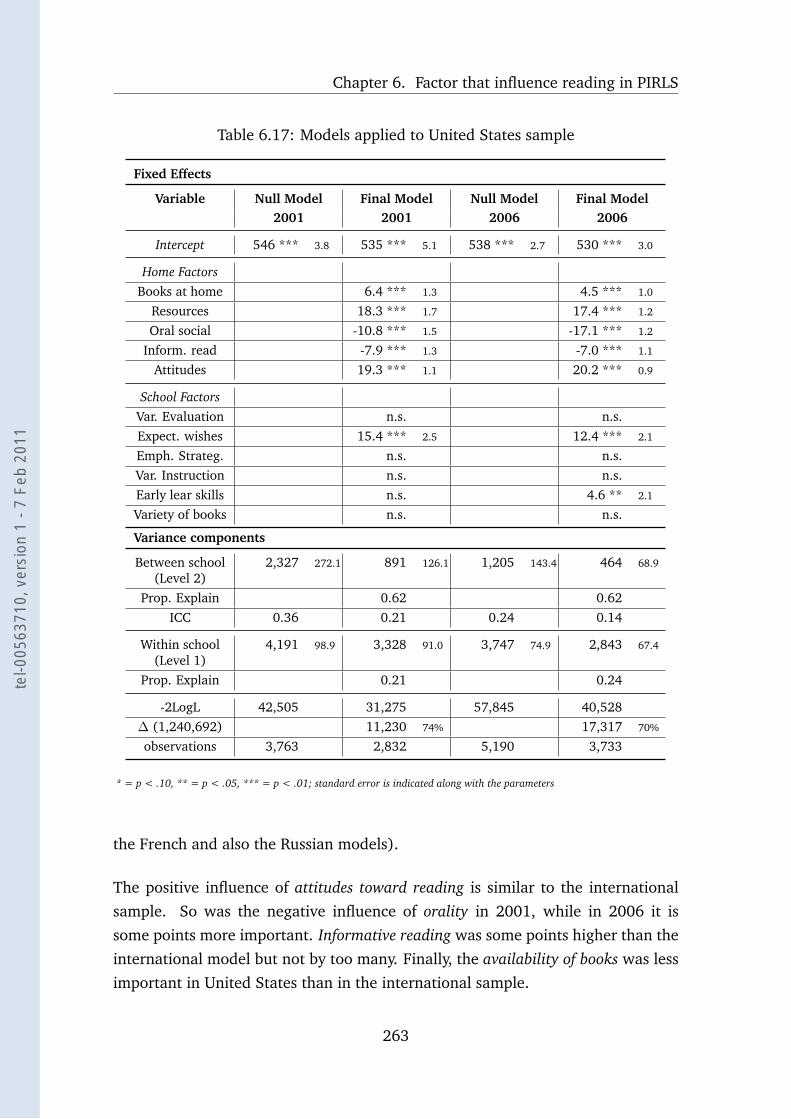
Chapter 6. Factor that influence reading in PIRLS
Table 6.17: Models applied to United States sample
Fixed Effects
Variable Null Model Final Model Null Model Final Model2001 2001 2006 2006
Intercept 546 *** 3.8 535 *** 5.1 538 *** 2.7 530 *** 3.0
Home FactorsBooks at home 6.4 *** 1.3 4.5 *** 1.0
Resources 18.3 *** 1.7 17.4 *** 1.2
Oral social -10.8 *** 1.5 -17.1 *** 1.2
Inform. read -7.9 *** 1.3 -7.0 *** 1.1
Attitudes 19.3 *** 1.1 20.2 *** 0.9
School FactorsVar. Evaluation n.s. n.s.Expect. wishes 15.4 *** 2.5 12.4 *** 2.1
Emph. Strateg. n.s. n.s.Var. Instruction n.s. n.s.Early lear skills n.s. 4.6 ** 2.1
Variety of books n.s. n.s.
Variance components
Between school(Level 2)
2,327 272.1 891 126.1 1,205 143.4 464 68.9
Prop. Explain 0.62 0.62ICC 0.36 0.21 0.24 0.14
Within school(Level 1)
4,191 98.9 3,328 91.0 3,747 74.9 2,843 67.4
Prop. Explain 0.21 0.24
-2LogL 42,505 31,275 57,845 40,528∆ (1,240,692) 11,230 74% 17,317 70%
observations 3,763 2,832 5,190 3,733
* = p < .10, ** = p < .05, *** = p < .01; standard error is indicated along with the parameters
the French and also the Russian models).
The positive influence of attitudes toward reading is similar to the international
sample. So was the negative influence of orality in 2001, while in 2006 it is
some points more important. Informative reading was some points higher than the
international model but not by too many. Finally, the availability of books was less
important in United States than in the international sample.
263
tel-0
0563
710,
ver
sion
1 -
7 Fe
b 20
11
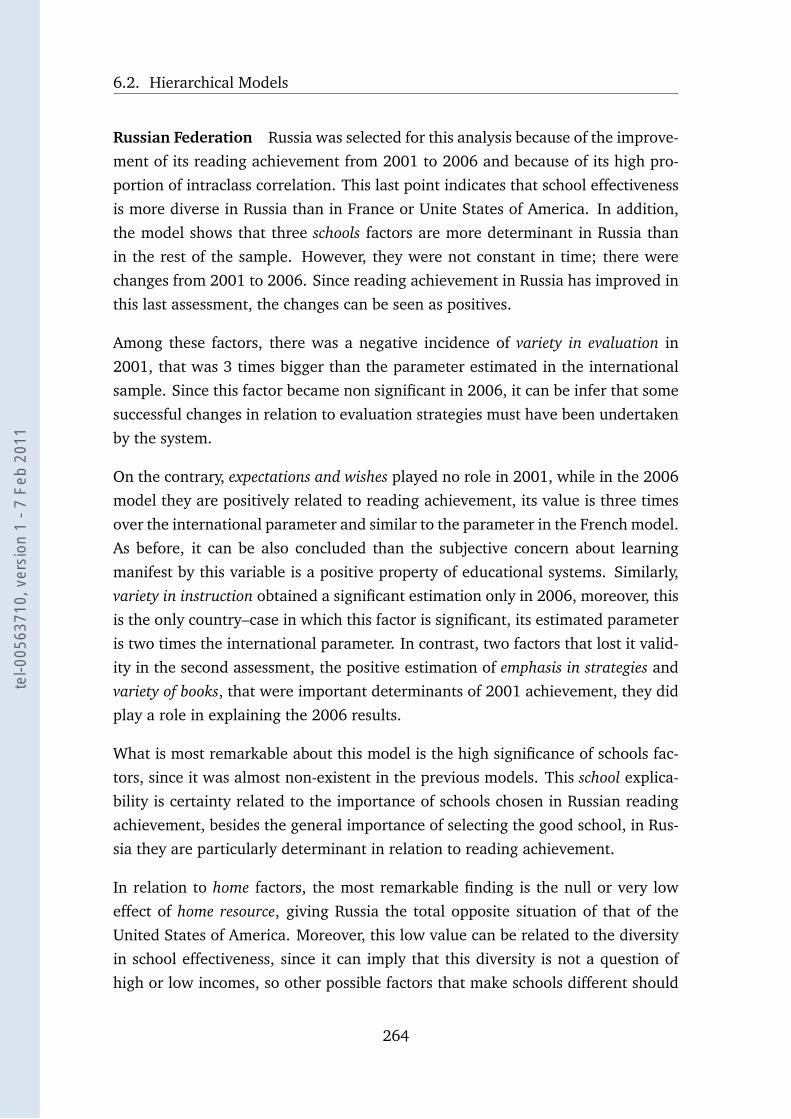
6.2. Hierarchical Models
Russian Federation Russia was selected for this analysis because of the improve-
ment of its reading achievement from 2001 to 2006 and because of its high pro-
portion of intraclass correlation. This last point indicates that school effectiveness
is more diverse in Russia than in France or Unite States of America. In addition,
the model shows that three schools factors are more determinant in Russia than
in the rest of the sample. However, they were not constant in time; there were
changes from 2001 to 2006. Since reading achievement in Russia has improved in
this last assessment, the changes can be seen as positives.
Among these factors, there was a negative incidence of variety in evaluation in
2001, that was 3 times bigger than the parameter estimated in the international
sample. Since this factor became non significant in 2006, it can be infer that some
successful changes in relation to evaluation strategies must have been undertaken
by the system.
On the contrary, expectations and wishes played no role in 2001, while in the 2006
model they are positively related to reading achievement, its value is three times
over the international parameter and similar to the parameter in the French model.
As before, it can be also concluded than the subjective concern about learning
manifest by this variable is a positive property of educational systems. Similarly,
variety in instruction obtained a significant estimation only in 2006, moreover, this
is the only country–case in which this factor is significant, its estimated parameter
is two times the international parameter. In contrast, two factors that lost it valid-
ity in the second assessment, the positive estimation of emphasis in strategies and
variety of books, that were important determinants of 2001 achievement, they did
play a role in explaining the 2006 results.
What is most remarkable about this model is the high significance of schools fac-
tors, since it was almost non-existent in the previous models. This school explica-
bility is certainty related to the importance of schools chosen in Russian reading
achievement, besides the general importance of selecting the good school, in Rus-
sia they are particularly determinant in relation to reading achievement.
In relation to home factors, the most remarkable finding is the null or very low
effect of home resource, giving Russia the total opposite situation of that of the
United States of America. Moreover, this low value can be related to the diversity
in school effectiveness, since it can imply that this diversity is not a question of
high or low incomes, so other possible factors that make schools different should
264
tel-0
0563
710,
ver
sion
1 -
7 Fe
b 20
11
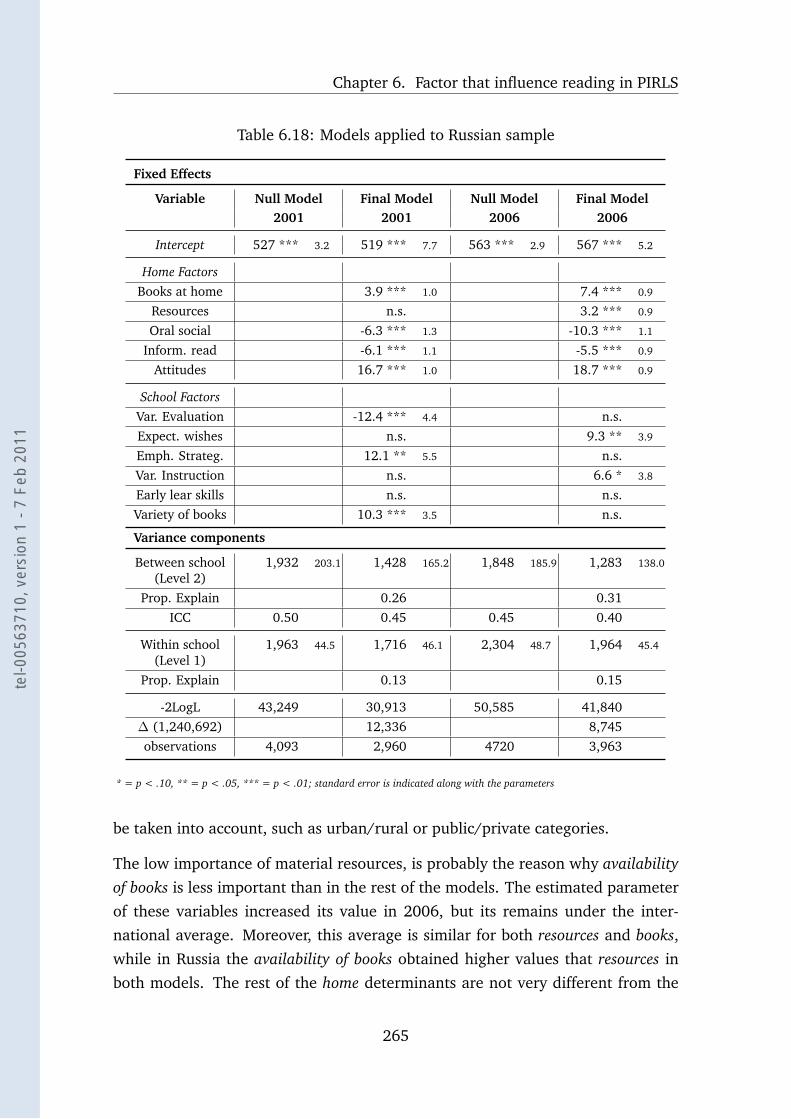
Chapter 6. Factor that influence reading in PIRLS
Table 6.18: Models applied to Russian sample
Fixed Effects
Variable Null Model Final Model Null Model Final Model2001 2001 2006 2006
Intercept 527 *** 3.2 519 *** 7.7 563 *** 2.9 567 *** 5.2
Home FactorsBooks at home 3.9 *** 1.0 7.4 *** 0.9
Resources n.s. 3.2 *** 0.9
Oral social -6.3 *** 1.3 -10.3 *** 1.1
Inform. read -6.1 *** 1.1 -5.5 *** 0.9
Attitudes 16.7 *** 1.0 18.7 *** 0.9
School FactorsVar. Evaluation -12.4 *** 4.4 n.s.Expect. wishes n.s. 9.3 ** 3.9
Emph. Strateg. 12.1 ** 5.5 n.s.Var. Instruction n.s. 6.6 * 3.8
Early lear skills n.s. n.s.Variety of books 10.3 *** 3.5 n.s.
Variance components
Between school(Level 2)
1,932 203.1 1,428 165.2 1,848 185.9 1,283 138.0
Prop. Explain 0.26 0.31ICC 0.50 0.45 0.45 0.40
Within school(Level 1)
1,963 44.5 1,716 46.1 2,304 48.7 1,964 45.4
Prop. Explain 0.13 0.15
-2LogL 43,249 30,913 50,585 41,840∆ (1,240,692) 12,336 8,745observations 4,093 2,960 4720 3,963
* = p < .10, ** = p < .05, *** = p < .01; standard error is indicated along with the parameters
be taken into account, such as urban/rural or public/private categories.
The low importance of material resources, is probably the reason why availabilityof books is less important than in the rest of the models. The estimated parameter
of these variables increased its value in 2006, but its remains under the inter-
national average. Moreover, this average is similar for both resources and books,while in Russia the availability of books obtained higher values that resources in
both models. The rest of the home determinants are not very different from the
265
tel-0
0563
710,
ver
sion
1 -
7 Fe
b 20
11
6.2. Hierarchical Models
international average, particularly in 2006.
Concerning variance components, the model fits to explain close to 30% of vari-
ance between schools, which is lower than the international model, and lower
than both, French and USA models. In addition, the variance explained within
schools is the lowest proportion, 10% under the international explicability and
also lower than French and USA models. In summary, the factors explaining Rus-
sian achievement are not as well described by the modelization of this research,
as it was the international sample.
The question raised in relation to the explicability of USA model can be replicated
here. This model is less explicative and more irregular, consequently, there may be
other factors not considered either in PIRLS, nor in this research, that fit to better
explain Russian results. If this is true, in selecting the factors to be considered as
possible reading determinants, PIRLS should pay more attention in local research
about reading learning, not only in the characteristics of the educational system,
since determining factors seems to vary from one country to another.
266
tel-0
0563
710,
ver
sion
1 -
7 Fe
b 20
11
Conclusions
Throughout this work, there have been many questions asked about language and
reading, not all of them have been answered, in some cases, the answers have not
been found, in other cases the answers did not matched with what was expected.
However, the act of asking these questions is the essential for the development of
knowledge on this subject. No question or answer, may be a priori discarded.
This work was started talking about literariness, the fundamental question deve-
loped by Russian formalist about the essence of texts. Now, as many others studies
have done before, it have been proved the role played by external factors in read-
ing, and consequently in texts. This is the way in which the idea of text as an effectis explained. Reading is not only an instrument but a key element of texts, which,
like a musical score, only finds its sense in performing.
Obviously, this information is not new, on the contrary is has been the subject of
consistent research for the last 40 years. The conclusions concerning this partic-
ular research refers to more specific facts. The intention of this dissertation has
never been to go beyond its own boundaries, which are the three pillars mentioned
in the introduction: language, reading and PIRLS assessment (see 1.3). Conse-
quently, all conclusions that could be made about language and reading are only
valid in describing PIRLS, and vice versa, all conclusions about PIRLS are only
valid in relation to language and reading, not to other cognitive process.
In order to summarize the information that has been gathered and the findings of
this investigation, two main lines can be identified: the results concerning the role
of languages, and the findings about determinants of reading achievement.
267
tel-0
0563
710,
ver
sion
1 -
7 Fe
b 20
11
6.2. Hierarchical Models
Answers to the hypotheses
THE LANGUAGES OF LEARNING DO NOT INFLUENCE READING AT THIS
STAGE OF ITS DEVELOPMENT
There are differences among the languages; the most evident case is the many
particularities of English. On one hand, the literature review proved that most of
the studies about reading and languages take English not only as the language of
writing but also as the focus for the experiments. On the other hand, the vast irreg-
ularity of this language was also described, putting emphasis in the consequences
for reading learning. English children learn to read slower and confronting more
difficulties than children using other learning languages. In consequence, the re-
search must be aware of this fact before drawing conclusions about reading in
general, from studies about English in particular. Taking this idea into account,
our experiments have separated English from the rest of the languages in a special
category. The results revealed that even if they had a better score, the hierarchical
models showed no advantage or disadvantage related to the use of English.
Two linguistic categories were developed in this research. The first was based
on common cultural history of languages, starting from the philological notion of
linguistic family. The families present in PIRLS assessment were identified, de-
scribed, and defined as properties of each student and country that take part in
the study. The second category was based on their phonological and orthograph-
ical properties; it was developed taking into account the degree of regularity of
orthographies in the task of translating the language phonology into writing. This
offers a framework model to categorize languages in accord to this adequacy, as it
was mentioned in section 2.2.2.
The first category has shown more significance than the second. Linguistic fami-
lies have had the possibility of being part of the preliminary analysis, because the
classification terms were already known. There, at country level, links between
certain families and aspects of reading were identified; for example, the case of
English with high processing or Slavic with literary reading. The results presented
here were also in accord with several previous researches that also underlined
these tendencies. However, there was not possible to identify traces of these rela-
tions in the modelling, not among students or schools. The models that explained
specific aspects of reading were not significantly different from those explaining
268
tel-0
0563
710,
ver
sion
1 -
7 Fe
b 20
11
Chapter 6. Factor that influence reading in PIRLS
the total score. This is the reason why, it is preferable to separate the general ten-
dencies expressed by countries behaviours and the reality of student in relation to
these linguistic categories.
Concerning the concept of orthographic depth, there was copious bibliography
proving that at earlier stages of reading, the orthography of a language plays a
determinant role in the reading achievement of children. Moreover, a possible
footprint of this initial influence was supposed to be present in later reading. But,
it was not the case in this research, the values representing the orthographic com-
plexity were clearly different, but they did not determine reading achievement.
Concerning orthographic depth, the most opposing result is related to English
speakers.
Our literary review underlined the numerous disadvantage of English orthography
in comparison with other less opaque languages; experiments proved that learning
to read was a slower and more difficult process among English speakers, because
of the many irregularities of the language. Consequently, if the orthography would
determine PIRLS results, a disadvantaged average could be expected. On the con-
trary, English average was better than that of transparent orthographies, being
only surpassed by the rest of deep languages in 2006 sample (see 6.7). This re-
sult can be explained in relation to the problematic that originally introduced the
notion of orthographic depth. In section 2.2.2.a, it was mentioned that dual routetheory, affirmed that the style of decoding can vary in time, experts readers can de-
pend less in phonetic and more in word–level mechanisms, moreover this change
can be not a question of simple strategic decision but an inherent property of the
orthography of the language. Therefore, speakers of transparent orthographies,
which depend only in phonologic decoding, can be in a disadvantage when devel-
oping more complex task as accessing to meaning, English speakers that from the
beginning of reading acquisition had deal with complex structures can be better
prepared to access to meaning, their advantage in high order processes of com-
prehension, can be related to this fact too.
In summary, it was mentioned in section 2.2.1.a that language are dissimilar, the
result obtained in both preliminary and hierarchical analysis confirms that as-
sumption. Using two categories, linguistic family and orthographic depth, the
result were in both cases unlike parameters estimated for each component of the
categories. That is, the estimations for Germanic family were different from those
of Latin family, and the estimations for transparent languages were different from
269
tel-0
0563
710,
ver
sion
1 -
7 Fe
b 20
11
6.2. Hierarchical Models
those of the opaque. The result confirmed that these two are valid categories to
classify languages, because there are represented in the sample by different scores,
and have estimated parameter that are clearly different.
Concerning the role that these categories play in explaining reading achievement,
the categories were not able to explain score variations, either between or within
schools. This result has negative and positive consequences. The negative aspect
is that a possible source of explicability has been lost. To be able to prove that
language was a source of variance would have allowed this research to augment
the explicability of the models, introducing a new factor to the debate about read-
ing learning. But, on the other hand, languages are already part of that debate.
Much of the debate concerning international comparisons is devoted to translation
issues and cultural diversity not been taken into account, as was discussed in sec-
tion 3.3. This investigation conclude that the linguistic and cultural differences do
exist, but also conclude that they do not determine PIRLS reading achievement.
The positive aspect is that PIRLS, being an international comparison, where the
translations were made starting from English to other languages, is not affected
by this in the hierarchical models here presented. Conclusions concerning reading
in this interlinguistic–intercultural context can be extracted without apprehension
of linguistic bias. With reference to the hierarchical model presented here, home
and school factor are determinants of reading achievement, while language is not.
In section 2.2.2, several approaches to orthography and its relation with phonol-
ogy were presented. The decision of using orthographic depth as criteria to classify
languages was a theoretical choice, explained in the mentioned section. Even if
the classification into linguistic families is a category already classical in linguistic,
it was also a theoretical choice to incorporate it in this research. Consequently it
is important to emphasize the dependency of all conclusions in that choice. Nev-
ertheless, using other criteria based of language could not be more helpful. It is
very likely, that the same distance between country and individual would show
up again, as two very different categories were used here without success. The
use of two criteria in searching determinacy is an argument to believe that other
classifications could not better explain reading achievement.
270
tel-0
0563
710,
ver
sion
1 -
7 Fe
b 20
11
Chapter 6. Factor that influence reading in PIRLS
LANGUAGES, HAVE A DIFFERENT INCIDENCE CONCERNING THE AS-
PECTS AND COMPONENTS OF THE READING PROCESS, BUT ONLY FROM
A WIDE-RANGING POINT OF VIEW
Concerning multidimentionality of reading, the research methods used here, did
not allow the observation of significant differences between aspects of reading
among students, because all the hierarchical models were equivalent. On the
contrary, the representation made of countries did shown significant differences.
It was possible not only to connect certain aspects to certain countries, but also to
discover factors that determine those aspects. Linear models were developed that
fit to explain difference between aspects of reading including home and school
factors and also linguistic determinants. At country level, there are factors that
play a different role depending on dimensions of reading. Consequently, there
are differences between informative and literary reading, and also between low
and high order processing but only if a very general point of view is taken, for
example, using countries as unity of measurement. Comparing both assessments,
most of the countries had differences favorable to one aspect; in addition, these
differences were constant in time.
Vrignaud (2006) emphasized the high correlation between the three dimensions
of reading literacy considered by PISA (> .89), thus he questions the validity of
considering them as different things: “On peut donc légitimement s’interroger sur
le bien fondé de distinguer trois échelles puisqu’un modèle comprenant une seule
échelle rend parfaitement compte des données” (p. 37). Equally, tables 6.4 and
6.5 showed that the correlation between aspects of reading was not lower than
> .94, from this point of view those dimensions are measuring the same thing.
Consequently, it is important to underline that these dimensions are a product
of the theoretical framework chosen by PIRLS, many are the possibilities of un-
derstanding multidimentionality. Consequently it is possible to think about other
choices, like putting more emphasis on other purposes of reading, like changing
the focus from purposes of reading to purposes of writing, deriving categories from
a perspective based of socialization of texts instead of comprehension, or like its
reception. In a more experimental path, categories can be conceived to increase
their differences and to test this property of texts in order to discover determinant
factors with more accuracy. An experiment can be conceived, in which reading
achievement is evaluated in order to discover the aspects that constitute it. Aspect
271
tel-0
0563
710,
ver
sion
1 -
7 Fe
b 20
11
6.2. Hierarchical Models
to be incorporated in the analysis could be chosen for been particularly different,
such as superficial understanding of information and evaluation of the proposals.
LANGUAGES, AS A FACTOR THAT INFLUENCES READING DEVELOP-
MENT LOST THEY RELEVANCE THROUGH TIME
How different moments of reading learning were characterized by different task
and purposes (see 1.2) was described. As reading determinant, orthographic
depth lacks of significance, which can be understood as evidence to confirm the in-
ner change during learning process. The fact that a factor that was a key determi-
nant of reading learning in earlier stages is now without significance in explaining
achievement, can be related to the evolution of reading development over time. It
was not confirmed the presences of a developmental footprint in the results, the
supposed trace that the earlier difference can made was not present in the models.
These results confirm the difference between decoding and comprehension, which
was hypothesized.
This is the only possible answer to the distance between the experiment reported
by Goswami et al. (1998) (see 2.2.2.b) and their possible later results. There,
Venezuelan children were capable of accomplish the same reading task better that
their English and French peers, but this advantage do not persist in time. Even if
Venezuela have not take part on PIRLS or other international studies, other similar
countries of the region have done it, and the results are not comparable to those of
English readers. Despite of the fact of being one of the easier languages to learn,
Spanish is certainly not associated with advantages in reading comprehension and
achievement.
In addition, there was no difference in the results concerning aspects of read-
ing, the models indicates that the role played by orthographic depth is equivalent
across all the presented dimensions of the reading process. Nevertheless, since the
results presented here depend on PIRLS theoretical structure, other experiments
are needed. In particular, it will be necessary to develop experiment analogous of
those applied in beginner readers, using non-words or pseudo-words but taking
older children as subject of the experiments. Moreover, comparable test can be
made, or a longitudinal study with the same subjects.
272
tel-0
0563
710,
ver
sion
1 -
7 Fe
b 20
11
Chapter 6. Factor that influence reading in PIRLS
Findings about home and school factors concerning
PIRLS reading achievement
In the last part of the hypotheses exposition, it was supposed that there could be
contextual factors that determine reading together with language. In contrast, the
models proved that there are home and school factors that are determinants of
reading without the intervention of languages. That is, to drop language out of
the model was not beneficial or detrimental to explicability. In other word, there
is a set of environmental variables explaining reading achievement by themselves
with no relation to languages. That is the reason why more attention must be pay
to the conclusions concerning these findings.
Looking at these factors, the conclusion is not such as positive as implied before.
The general models 6.12 and 6.13 indicated a major importance of home factors
instead of scholar factors. Supposed determinants, such as curriculum, teaching
strategies, school environment, or teachers’ formation, had low or even no ca-
pacity of explaining reading achievement. This result is negative if we take into
account that school variables can be controlled by means of curriculum or educa-
tional policy. In contrast, home factors imply changes in the environment of each
child in order to obtain a behavioral variation, which is more difficult to control.
A positive result of the models is that the variables obtained, in each case, regular
results. That is, their explicative power was constant from the 2001 assessment to
the 2006, and among the different reading aspects. Positive and negative factors
can be identified; the more remarkable of them will be mentioned in the next
paragraphs.
During the preliminary analysis, and in the hierarchical models, it was constant
the presence of economic factors, even if, at the beginning it was out of the scope
of this research to take into account this element, it forced itself in the analysis
and the results of this study. Several variables were mentioned during preliminary
analysis, such as the proportion of affluent homes, and the availability of learn-
ing materials at school and at home. The index HER (our variation from homeeconomic resources) was one of the most significant determinant of PIRLS reading
achievement. However, the models developed with data from specific countries
showed that the role played by this factor can vary importantly depending on the
educational system taken into account. A study using PIRLS and other datasets,
273
tel-0
0563
710,
ver
sion
1 -
7 Fe
b 20
11
6.2. Hierarchical Models
and focused on economic determinants should be necessary to clarify this point.
An interesting comparison can be the results of Rocher (2008) study about PISA
2003, where a variable called origine socio-économique (ESCS) was noticed to ex-
plain 19.6% of French score variance, and also a 19.0% of United States score
variance (p. 68). In our 2006 PIRLS sample, if a linear regression is used to
establish the explicability of home economic resources without adding other deter-
minants, the proportion of variance explained for the French sample is still very
low (Adj R2.03), on the contrary, in United States, this variables explains four time
more of the variance Adj R2.12; internationally, its significance is Adj R2.08. Even
if it is not the same variable and not the same sample, this difference can be the
starting point to infer that the importance of economic factor can be constant in
United State while it increases across time in France. This increased explicabil-
ity prevent us from underestimate the role played by economic determinants in
the achievement of French students (for a comprehensive analysis of economi-
cal determinants in french PISA sample see Duru-Bellat, Mons, & Suchaut (2004,
2003)). Obviously, ours are only very general ideas about the potentiality of inter-
national comparisons taking as starting point determinants of the supra–national
sample, to later describe how they vary across countries.
Availability of books over the international average is related to an improvement
in reading achievement that is constant over time. The particular interest of this
individual variable is its lack of subjectivity. In opposition to attitudes and wishes,
this is a variable that can be controlled by means of national policies more easily.
Figure 6.2 graphics clearly the importance of this variable, all students improved
their result in accord to the amount of books available at home. Those having an
average achievement and a lot of books reached the score of those being above
the average but having only few books. In addition, the improvement was partic-
ularly remarkable for those being under the average. Books availability, together
with attitudes are the two more important determinants of reading achievement
identified by this research.
Oral socialization is a negative element, but it is necessary to be aware of the rel-
ative value of this factor. It represents a significant collection of variables related
to social activities, particularly oral interaction. Figure 6.2 showed an important
property of this factor, its explicative power is inversely proportional to the score.
In other words, orality affects more the weaker readers, while the score of those
above the average did not vary according to orality presence. To infer valid con-
274
tel-0
0563
710,
ver
sion
1 -
7 Fe
b 20
11
Chapter 6. Factor that influence reading in PIRLS
clusions concerning this factor, more specific experiments and improved variables
are needed. In contrast, this is a first step to reconsider the relation of this kind of
activities and reading learning.
Early learning of reading skills was one of the factors that repeatedly appear in
preliminary analysis. Then, it is the more significant school factor, even if its
explicability is only the fifth higher parameter, under four other individual factors.
It is interesting that an element, as important in cognitive terms as early learning,
was not a main determinant of the achievement. This result support the fact that
there are the more individual and behavioral factors that plays a main role in
explain PIRLS results, instead of scholar aspects.
A final factor that must be underlined here is the major role played by Attitudestoward reading. It was a significant factor during the preliminary analysis and it
increases its significance in relation to total reading achievement. This is the key
element that confirms that PIRLS reading achievement is more related to subjec-
tive aspects than to objective aspects. The regularity of its influence is presented
in figure 6.2.
Finally, there are variables that need a deeper and more specific study, because
there were signals that showed that they had a relation with reading achievement,
but it was not possible to make a deeper analysis by means of this research. There
variables are scholar time, individuality, use of vocabulary, writing, and second
language use.
This last is, in the context of this research, a particularly interesting subject be-
cause is the only linguistic factor that seems to play a role in reading. During the
preliminary analyses a negative connection between score and second language
use was identified. Later, the hierarchical model also showed that relation even
if the data did not allow the inclusion of this variable in final models. It is im-
portant to remember that the models considered language as an attribute of the
schools instead of individuals. In section 6.2.3.b it was mentioned that a model
including that variable is a much better fit to explain schools variation (from 14%
to 28%) which is a major improvement. Moreover, the estimated parameter was
−21.73(p < 0.01), which could put this variable among the higher of the model.
In consequence, this is a determinant that certainly needs a deeper study, these
results would need to clearly separate second language use from other determi-
nant with which it could be interacting, such as resources, aspects of reading, or
275
tel-0
0563
710,
ver
sion
1 -
7 Fe
b 20
11
6.2. Hierarchical Models
writing, for example. In addition, it must be complemented with a best study of
the role played by second language in each of the countries studied.
This last point leads us to the last main conclusion of this research. Within country
variation is a key element that must be taken into account to a better understand-
ing of PIRLS results. Figure 6.1 showed how different could be the educational
reality from one country to another, particularly in relation to the role played by
schools. The simple score ranking are the element on PIRLS report that have more
impact on public opinion, however, these general reports of achievement do not
underline local realities. To put emphasis on identifying determinant factors in
each country, instead of score ranking, is a key strategy to a better use of this
international comparison.
The French, USA and Russian models give more details about these differences.
These models proved that the same variable, being an important determinant of
general reading achievement, can play a very different role on each country. Edu-
cational resources was, for example, a main determinant of USA score, indicating
that it is very different the reading achievement of those having no resources in
comparison to those having high availability of resources. In contrast, the influ-
ence of this factor in France and Russia was very low, where the most important
determinant was attitudes toward reading. In the United States the parameter
representing this last factor was similar to that representing resources.
However, it is out of the scope of this research to define how well PIRLS reading
achievement represent the general reading ability of the students that take part
into the test. The presences of environmental and scholar determinants that ex-
plain part of the variation can be taken as a prove of the positive value of this
achievement. In other words, the fact of being determined by environmental fac-
tors means that the score can be enhanced by improving these conditions, which
will certainly have an impact in reading ability. In summary, these three country
models give a first image of what could be a comparative study of reading de-
terminants. It is possible to develop equivalent models for each of the countries
of the sample and compare the role that each determinant plays from this per-
spective. The results will be certainly an interesting proposal to improve reading
achievement in these educational systems. That kind of research could also estab-
lish another way of looking at the results of this international assessment, other
than the broad perspective that characterizes its reports.
276
tel-0
0563
710,
ver
sion
1 -
7 Fe
b 20
11
Bibliography
Aarnoutse, C., Leeuwe, J. van, & Verhoeven, L. (2005). Early literacy from a
longitudinal perspective. Educational Research and Evaluation, 11(3), 253–275.
Abu-Rabia, S. (2002). Reading in a root–based–morphology language: the case
of arabic. Journal of Research in Reading, 25(3), 299–309.
Abu-rabia, S., Share, D., & Mansour, M. S. (2003). Word recognition and ba-
sic cognitive processes among reading-disabled and normal readers in arabic.
Reading and Writing, 16(5), 423–442.
Adams, M. J. (1990). Beginning to read: Thinking and learning about print. Cam-
bridge, MA: The MIT Press.
Alegria, J., Morais, J., Carrillo, S., & Mousty, P. (2003). Les premiers pas dans
l’acquisition de l’orthographe en fonction du caractère profond ou superficiel
du système alphabétique : comparaison entre le français et l’espagnol. In
M. N. Romdhane, J.-E. Gombert, & M. Belajouza (Eds.), L’apprentissage de lalecture, perspectives comparatives (pp. 51–67). Rennes, Tunis: Presses Universi-
taires de Rennes, Centre de publications universitaires de Tunis.
Aro, M., & Wimmer, H. (2003). Learning to read: English in comparison to six
more regular orthographies. Applied Psycholinguistics, 24(4), 621–635.
Austin, J. (1970). Quand dire c’est faire. Paris: Seuil.
Bachman, L. (1990). Fundamental Considerations in Language Testing. Oxford:
Oxford University Press.
Baker, L., Afflerbach, P., & Reinking, D. (1996). Developing engaged readers inschool and home communities. Mahwah, N.J.: Lawrence Erlbaum.
277
tel-0
0563
710,
ver
sion
1 -
7 Fe
b 20
11
Bibliography
Baldik, P. (1990). Indo-european languages. In B. Comrie (Ed.), The major lan-guages of eastern europe. London: Routledge.
Baluch, B. (2006). Persian orthography and its relation to literacy. In R. Joshi &
P. Aaron (Eds.), Handbook of orthography and literacy (pp. 365–376). Mahwah,
N.J.: Lawrence Erlbaum.
Barré-de Miniac, C. (2003). Savoir lire et écrire dans une société don-
née. Revue française de linguistique appliquée, 8(1), 107–120. Avail-
able from www.cairn.info/revue-francaise-de-linguistique-appliquee
-2003-1-page-107.htm
Barthes, R. (1953). Le degré zéro de l’écriture. Paris: Seuil.
Blažek, V. (2006, January). Current Progress in Altaic Etymology. Linguis-tica Online, 1-9. Available from http://www.phil.muni.cz/linguistica/art/
blazek/bla-004.pdf
Bonnet, G. (2006). Tener presentes las singularidades lingüísticas y culturales
en las evaluaciones internacionales de las competencias de los alumnos: ¿una
nueva dimensión para PISA? Revista de educación, extraordinario, 91–109.
Bosman, A., Graaff, S. de, & Gijsel, M. (2006). Double dutch: The dutch spelling
system and learning to spell in dutch. In R. Joshi & P. Aaron (Eds.), Handbookof orthography and literacy (pp. 135–150). Mahwah, N.J.: Lawrence Erlbaum.
Bottani, N., & Vrignaud, P. (2005). La France et les évaluations internationales.Haut conseil de l’évaluation de l’école. Available from http://lesrapports
.ladocumentationfrancaise.fr/BRP/054000359/0000.pdf
Bradley, L., & Bryant, P. (1983). Categorizing sounds and learning to read: A
causal connection. Nature, 301(3), 419–421.
Bressoux, P. (2008). Modélisation statistique appliquée aux sciences sociales. Brux-
elles: De Boeck.
Britannica, E. (2009). phonetics. Retrieved August 24, 2009, from Encyclopædia
Britannica Online. Available from http://www.britannica.com/EBchecked/
topic/457255/phonetics
278
tel-0
0563
710,
ver
sion
1 -
7 Fe
b 20
11
Bibliography
Britannica, E. (2010). Altaic languages. Retrieved February 02, 2010, from En-
cyclopædia Britannica Online. Available from http://www.britannica.com/
EBchecked/topic/17472/Altaic-languages
Campbell, J., Kelly, D., Mullis, I., Martin, M., & Sainsbury, M. (2001). Frameworkand specifications for pirls assessment 2001. Chestnut Hill, MA: TIMSS & PIRLS
International Study Center, Boston College.
Caravolas, M. (2005). The nature and causes of dyslexia in different languages.
In M. J. Snowling & C. Hulme (Eds.), The science of reading: A handbook (pp.
336–355). Oxford: Blackwell.
Chall, J. S. (1996). Stages of reading development. Fort Worth, TX.: Harcourt Brace
College Publishers.
Cheung, W., Tse, S., Lam, J., & Loh, E. (2009). Progress in International Reading
Literacy Study 2006 (PIRLS): pedagogical correlates of fourth-grade students in
Hong Kong. Journal of Research in Reading, 32(3), 293–308.
Chomsky, N. (2001). Le langage et la pensée. Paris: Payot.
Chomsky, N., & Halle, M. (1968). The Sound Pattern of English. New York: Harper
& Row.
Clark, M. (2004). How much can we learn from international studies of reading
such as PIRLS? A cautionary tale. Education Journal, 75, 25–27.
Comparative Education Research Unit. (2005, September). Processes of
reading comprehension. Ministry of Education of New Zealand. Avail-
able from http://www.educationcounts.govt.nz/__data/assets/pdf_file/
0018/7452/pirls-process-of-reading.pdf
Comrie, B. (1990). Slavonic languages. In B. Comrie (Ed.), The major languagesof eastern europe. London: Routledge.
Coulmas, F. (1989). The writing systems of the world. London: Blackwell.
Coulmas, F. (1999). The Blackwell encyclopedia of writing systems. Oxford: Wiley-
Blackwell.
Coulmas, F. (2003). Writing systems. New York: Cambridge University Press.
279
tel-0
0563
710,
ver
sion
1 -
7 Fe
b 20
11
Bibliography
Csépe, V., Szücs, D., & Honbolygó, F. (2003). Number-word reading as challenging
task in dyslexia? An ERP study. International Journal of Psychophysiology, 51(1),
69–83.
D’Angiulli, A., Siegel, L., & Serra, E. (2001). The development of reading in
english and italian in bilingual children. Applied Psycholinguistics, 22(4), 479–
507.
Davies, A., Brown, A., Elder, C., Hill, K., Lumley, T., & McNamara, T. (1999). Abil-
ity. In Dictionary of Language Testing (p. 1). Cambridge: Cambridge University
Press.
De Jong, P. F. (2006). Units and routes of reading in dutch. Developmental Science,
9(5), 441–442.
Derrida, J. (1967). De la grammatologie. Paris: Editions de Minuit.
Diepen, M. van, Verhoevenand, L., Aarnoutse, C., & Bosman, A. M. (2007). Val-
idation of the international reading literacy test evidence from dutch. WrittenLanguage & Literacy, 10(1), 1–23.
Durgunoglu, A. (2006). Learning to read in Turkish. Developmental Science, 9(5),
437–439.
Duru-Bellat, M., Mons, N., & Suchaut, B. (2003). Contextes nationaux, or-
ganisation des systèmes éducatifs et inégalités entre élèves : l’éclairage de
l’enquête PISA. Politiques d’éducation et de formation(9), 95-108. Available from
http://halshs.archives-ouvertes.fr/halshs-00004878/en/
Duru-Bellat, M., Mons, N., & Suchaut, B. (2004). Organisation scolaire et inégal-
ités sociales de performances. Les enseignements de l’enquête PISA. Education& formations, 70(1), 123-131. Available from http://media.education.gouv
.fr/file/14/2/5142.pdf
Elbro, C. (2006). Literacy acquisition in danish: A deep orthography in cross-
linguistic light. In R. Joshi & P. Aaron (Eds.), Handbook of orthography andliteracy (pp. 31–45). Mahwah, N.J.: Lawrence Erlbaum.
Elley, W. B. (1992). How in the world do students read? The International Associ-
ation for the Evaluation of Educational Achievement Hamburg. Available from
http://eric.ed.gov/PDFS/ED360613.pdf
280
tel-0
0563
710,
ver
sion
1 -
7 Fe
b 20
11
Bibliography
Fayol, M., & Jaffré, J. (2008). Orthographier. Paris: Presses universitaires de
France.
Ferrand, L. (2007). Psychologie cognitive de la lecture. Bruxelles: De Boeck.
Foshay, A., Thorndike, R., Hotyat, F., Pidgeon, D., & Walker, D. (1962). Educationalachievements of thirteen-year-olds in twelve countries. Hamburg: Unesco Institute
for Education.
Foy, P., & Kennedy, A. M. (Eds.). (2008). Pirls 2006 user guide for the internationaldatabase. Chestnut Hill, MA: TIMSS & PIRLS International Study Center, Boston
College. Available from http://timss.bc.edu/pirls2006/user_guide.html
Frost, R. (2005). Orthographic systems and skilled word recognition processes
in reading. In M. J. Snowling & C. Hulme (Eds.), The science of reading: Ahandbook (pp. 272–295). London: Blackwell.
Frost, R. (2006). Becoming literate in Hebrew: the grain size hypothesis and
Semitic orthographic systems. Developmental science, 9(5), 439–440.
Frost, R., Katz, L., & Bentin, S. (1987). Strategies for visual word recognition
and orthographical depth: A multilingual comparison. Journal of ExperimentalPsychology: Human Perception and Performance, 13(1), 104–115.
Givvin, K., Hiebert, J., Jacobs, J., Hollingsworth, H., & Gallimore, R. (2005). Are
there national patterns of teaching? Evidence from the TIMSS 1999 video study.
Comparative Education Review, 49(3), 311–343.
Goldstein, H. (2004). International comparative assessment: how far have we
really come? Assessment in Education, 11(2), 227–234.
Goswami, U., & Bryant, P. (1990). Phonological Skills and Learning to Read. Mah-
wah, N.J.: Lawrence Erlbaum.
Goswami, U., Gombert, J., & Barrera, L. de. (1998). Children’s orthographic
representations and linguistic transparency: Nonsense word reading in English,
French, and Spanish. Applied Psycholinguistics, 19(1), 19–52.
Goswami, U., Ziegler, J., Dalton, L., & Schneider, W. (2003). Nonword reading
across orthographies: How flexible is the choice of reading units? AppliedPsycholinguistics, 24(2), 235–247.
281
tel-0
0563
710,
ver
sion
1 -
7 Fe
b 20
11
Bibliography
Goswami, U., Ziegler, J., & Richardson, U. (2005). The effects of spelling consis-
tency on phonological awareness: A comparison of english and german. Journalof Experimental Child Psychology, 92(4), 345–365.
Grigorenko, E. (2006). If John were Ivan, would he fail in reading? In R. Joshi &
P. Aaron (Eds.), Handbook of orthography and literacy (pp. 303–320). Mahwah,
N.J.: Lawrence Erlbaum.
Gustafsson, J., & Rosén, M. (2006). The dimensional structure of reading assess-
ment tasks in the IEA reading literacy study 1991 and the progress in interna-
tional reading literacy study 2001. Educational Research and Evaluation, 12(5),
445–468.
Hagtvet, B., Helland, T., & Lyster, S. (2006). Literacy acquisition in norwegian.
In R. Joshi & P. Aaron (Eds.), Handbook of orthography and literacy (p. 15-30).
Mahwah, N.J.: Lawrence Erlbaum.
Hanley, J. R. (2005). Learning to Read in Chinese. In M. J. Snowling & C. Hulme
(Eds.), The science of reading: A handbook (pp. 316–336). London: Blackwell.
Hetzron, R. (1990). Afroasiatic languages. In B. Comrie (Ed.), The major languagesof South Asia, the Middle East and Africa (pp. 116–120). London: Routledge.
Hilton, M. (2006). Measuring standards in primary English: issues of validity
and accountability with respect to PIRLS and National Curriculum test scores.
British Educational Research Journal, 32(6), 817–837.
Husén, T., & Postlethwaite, T. (1996). A brief history of the International As-
sociation for the Evaluation of Educational Achievement (IEA). Assessment inEducation: Principles, Policy & Practice, 3(2), 129–141.
Iser, W. (1997). L’acte de lecture: théorie de l’effet esthétique. Bruxelles: Editions
Mardaga.
Jaffré, J., & Fayol, M. (1997). Orthographes: des systèmes aux usages. France:
Flammarion.
Jaffré, J., & Fayol, M. (2006). Orthography and literacy in French. In R. Joshi &
P. Aaron (Eds.), Handbook of orthography and literacy (pp. 81–104). Mahwah,
N.J.: Lawrence Erlbaum.
282
tel-0
0563
710,
ver
sion
1 -
7 Fe
b 20
11
Bibliography
Jakobson, R. (1960). Style in language. In T. Sebeok (Ed.), (pp. 350–377).
Cambridge, Mass.: MIT Press.
Janyan, A., & Andonova, E. (2006). Word Reading in Bulgarian Children and
Adults. In Handbook of orthography and literacy (pp. 275–290). Mahwah, N.J.:
Lawrence Erlbaum.
Jauss, H. R. (1978). Pour une esthétique de la réception. Paris: Gallimard.
Jetchev, G., & Bertinetto, P. (2002). Lexical access in Bulgarian perfective vs.
imperfective verbs. In Morphology 2000: selected papers from the 9th morphol-ogy meeting, vienna, 24-28 february 2000 (pp. 161–174). Amsterdam: John
Benjamins.
Job, R., Peressotti, F., & Mulatti, C. (2006). The acquisition of literacy in Italian. In
R. Joshi & P. Aaron (Eds.), Handbook of orthography and literacy (pp. 105–120).
Mahwah, N.J.: Lawrence Erlbaum.
Justeson, J. S. (1986). The origin of writing systems: Preclassic Mesoamerica.
World Archaeology, 17(3), 437–458.
Katz, L., & Feldman, L. B. (1981). Linguistic coding in word recognition. In
A. M. Lesgold & C. A. Perfetti (Eds.), Interactive processes in reading. Hillsdale,
N.J.: Erlbaum.
Katz, L., & Frost, R. (1992). The reading process is different for different or-
thographies: The orthographic depth hypothesis. In R. Frost & L. Katz (Eds.),
Orthography, phonology, morphology, and meaning (pp. 67–84). Amsterdam:
Elsevier Science.
Kaye, A. (1990). Arabic. In B. Comrie (Ed.), The major languages of East andSouth-east Asia (pp. 170–191). London: Routledge.
Kerek, E., Niemi, P., Parsons, C., Lyddy, F., Zhang, L., Wu, A., et al. (2009). Russian
orthography and learning to read. Reading in a Foreign Language, 21(1), 1–21.
Kersaudy, G. (2001). Langues sans frontières: à la découverte des langues del’Europe. Paris: Autrement.
Klima, E. (1972). How alphabets might reflect language. In J. F. Kavanagh &
I. G. Mattingly (Eds.), Language by ear and by eye: the relationships betweenspeech and reading (pp. 57–80). Cambridge, Mass.: MIT Press.
283
tel-0
0563
710,
ver
sion
1 -
7 Fe
b 20
11
Bibliography
Koda, K. (2007). Reading and language learning: Crosslinguistic constraints on
second language reading development. Language Learning, 57(Suppl. 1), 1–44.
Lahire, B. (1993). La raison des plus faibles. Lille: Presses universitaires de Lille.
Landerl, K. (2006). Reading acquisition in different orthographies: Evidence from
direct comparisons. In R. Joshi & P. Aaron (Eds.), Handbook of orthography andliteracy (pp. 513–530). Mahwah, N.J.: Lawrence Erlbaum.
Lapesa, R. (1980). Historia de la lengua española. Madrid: Gredos.
Lathrop, T. (1984). Curso de gramática histórica española. Barcelona: Ariel.
Lewis, M. P. (Ed.). (2009a). Ethnologue: Languages of the world. Dallas, Tex.: SIL
International. Available from http://www.ethnologue.com/
Lewis, M. P. (Ed.). (2009b). Microlanguage. Dallas, Tex.: SIL International.
Available from http://www.ethnologue.org/ethno_docs/introduction.asp#
Macro
Lundberg, I., & Linnakyla, P. (1993). Teaching Reading around the World. IEAStudy of Reading Literacy. The International Association for the Evaluation of
Educational Achievement. Available from http://eric.ed.gov/PDFS/ED360615
Lévi-Strauss, C. (1958). Anthropologie structurale. Paris: Plon.
Martin, M. O., Mullis, I. V., & Kennedy, A. M. (2007). PIRLS 2006 technical report.Chestnut Hill, MA: TIMSS & PIRLS International Study Center, Boston College.
Available from http://timss.bc.edu/pirls2006/tech_rpt.html
McNemar, Q. (1964). Our intelligence? Why. American Psychologist, 19, 871–882.
Meireles, A., & Barbosa, P. (2008). Lexical reorganization in brazilian portuguese:
An articulatory study. Speech Communication, 50(11-12), 916 –924.
Mullis, I., Kennedy, A. M., Martin, M. O., & Sainsbury, M. (2006). PIRLS 2006assessment framework and specifications. Chestnut Hill, MA: TIMSS & PIRLS
International Study Center, Boston College. Available from http://timss.bc
.edu/pirls2006/framework.html
284
tel-0
0563
710,
ver
sion
1 -
7 Fe
b 20
11
Bibliography
Mullis, I., & Martin, M. (2004). International achievement in the processes ofreading comprehension: results from PIRLS 2001 in 35 countries. Chestnut Hill,
MA: TIMSS & PIRLS International Study Center, Boston College. Available from
http://pirls.bc.edu/pirls2001i/PIRLS2001_Pubs_PR.html
Mullis, I., Martin, M., Gonzalez, E., & Kennedy, A. (2003). PIRLS 2001 Inter-national Report: IEA’s study of reading literacy achievement in primary schools.Chestnut Hill, MA: TIMSS & PIRLS International Study Center, Boston College.
Available from http://timss.bc.edu/pirls2001i/PIRLS2001_Pubs_IR.html
Mullis, I., Martin, M. O., Kennedy, A. M., & Foy, P. (2007). PIRLS 2006 internationalreport: IEA’s progress in international reading literacy study in primary schoolin 40 countries. TIMSS & PIRLS International Study Center, Boston College.
Available from http://timss.bc.edu/pirls2006/intl_rpt.html
Nergård-Nilssen, T. (2006). Word-decoding deficits in Norwegian: the impact of
psycholinguistic marker effects. Reading and Writing, 19(3), 265–290.
Oakhill, J., & Beard, R. (1995). Especial issue: the cognitive psychology. Journalof Research in Reading, 18(2), 69–73.
Pellegrino, J., & Varnhagan, C. (1985). Abilities and aptitudes. In T. Husén &
T. Postlethwaite (Eds.), The International Encyclopedia of Education: Researchand Studies. Oxford: Pergamon.
Pind, J. (2006). Evolution of an Alphabetic Writing System: The Case of Icelandic.
In R. Joshi & P. Aaron (Eds.), Handbook of orthography and literacy (pp. 3–14).
Mahwah, N.J.: Lawrence Erlbaum.
Posner, R. (1996). The romance languages. Cambridge: Cambridge University
Press.
Postlethwaite, T. (1995). International empirical research in comparative educa-
tion: An example of the studies of the international association for the evalua-
tion of educational achievement (IEA). Tertium Comparationis, 1(1), 1–19.
Probus. (s. III). Appendix probi. Available from http://ling.upenn.edu/
~kurisuto/germanic/appendix_probi.html
Propp, V. (1971). Morfologia del cuento. Madrid: Fundamentos.
285
tel-0
0563
710,
ver
sion
1 -
7 Fe
b 20
11
Bibliography
Pulleyblank, D. (1990). Niger - kordofanian languages. In B. Comrie (Ed.), Themajor languages of south asia, the middle east and africa. London: Routledge.
Rasekh, E., & Eshghi, M. (2007). An efficient hybrid solution for pronouncing
Farsi text. International Journal of Speech Technology, 10(2), 153–161.
Rémond, M. (2006). Éclairages des évaluations internationales PIRLSet PISA sur
les élèves français. Revue française de pédagogie, 157, 71–84.
Rocher, T. (2008). Que nous apprennent les évaluations internationales sur le
fonctionnement des systèmes éducatifs ? une illustration avec la question du
redoublement. Éducation & formations, 78, 63–68.
Rumberger, R., & Palardy, G. (2004). Multilevel models for school effectiveness
research. In D. Kaplan (Ed.), The sage handbook of quantitative methodology forthe social sciences (pp. 235–258). Thousand Oaks, CA: Sage.
Sainsbury, M., Schagen, I., & Hammond, P. (2004, June). What did pirls tell
us about reading skills? paper presented at the conference of the InternationalAssociation for Educational Assessment. Available from http://www.nfer.ac.uk/
nfer/publications/44407/44407.pdf
Saussure, F. d. (1995). Cours de linguistique générale [1916] (A. S. Bailly &
A. Riedlinger, Eds.). Paris: Payot & Rivages.
Schwippert, K. (2007). Progress in Reading Literacy: The Impact of PIRLS 2001 in13 Countries. Germany: Waxmann Verlag.
Seymour, P. (2005). Early reading development in European orthographies. In
M. J. Snowling & C. Hulme (Eds.), The science of reading: A handbook (pp. 296–
315). London: Blackwell.
Seymour, P., Aro, M., & Erskine, J. (2003). Foundation literacy acquisition in
European orthographies. British Journal of Psychology, 94(2), 143–174.
Share, D. L., & Levin, I. (1999). Learning to read and write in hebrew. In M. Harris
& G. Hatano (Eds.), Learning to read and write: A cross-linguistic perspective (pp.
97–133). London; New York: Cambridge University Press.
Singer, J. (1998). Using SAS PROC MIXED to fit multilevel models, hierarchical
models, and individual growth models. Journal of Educational and BehavioralStatistics, 23(4), 323.
286
tel-0
0563
710,
ver
sion
1 -
7 Fe
b 20
11
Bibliography
Snowling, M. J., & Hulme, C. (2005a). Editorial part IV. In M. J. Snowling &
C. Hulme (Eds.), The science of reading: A handbook (pp. 269–271). London:
Blackwell.
Snowling, M. J., & Hulme, C. (Eds.). (2005b). The science of reading: A handbook.
London: Blackwell.
Statistics South Africa. (2001). Census. Available from http://www.statssa.gov
.za/census01/html/default.asp
Street, B. (Ed.). (1993). Cross-cultural approaches to literacy. Cambridge: Cam-
bridge University Press.
Suchaut, B. (2009, May). L’organisation et l’utilisation du temps scolaire à l’école
primaire: enjeux et effets sur les élèves. Conférence à l’initiative de la ville deCran-Gevrier (Haute-Savoie), 1–16. Available from http://halshs.archives
-ouvertes.fr/halshs-00395539/
Tryphon, A., & Vonèche, J. (1996). Piaget-Vygotsky: The Social Genesis of Thought.UK: Psychology Press.
Van Dijk, T. A. (1980). Macrostructures. an interdisciplinary study of global struc-tures in discourse, interaction, and cognition. Hillsdale, N.J.: Erlbaum.
Van Dijk, T. A., & Kintsch, W. (1983). Strategies of discourse comprehension. New
York: Academic Press.
Van Orden, G., & Kloos, H. (2005). The question of phonology and reading.
In M. J. Snowling & C. Hulme (Eds.), The science of reading: A handbook (pp.
61–78). London: Blackwell.
Vrignaud, P. (2006). La mesure de la littéracie dans PISA: la méthodologie est
la réponse, mais quelle était la question? Revue française de pédagogie, 157,
27–41.
Walker, D. (1976). The IEA six subject survey: An empirical study of education intwenty-one countries. New York: John Wiley and Sons.
Whetton, C., Ruddock, G., & Twist, L. (2007). Standards in English primary ed-ucation: the international evidence. University of Cambridge. Available from
http://arrts.gtcni.org.uk/gtcni/handle/2428/29274
287
tel-0
0563
710,
ver
sion
1 -
7 Fe
b 20
11
Bibliography
Ziegler, J., & Goswami, U. (2005). Reading acquisition, developmental dyslexia,
and skilled reading across languages: A psycholinguistic grain size theory. Psy-chological Bulletin, 131(1), 3–29.
Ziegler, J., & Goswami, U. (2006). Becoming literate in different languages:
similar problems, different solutions. Developmental Science, 9(5), 429–453.
Ziegler, J., Perry, C., Jacobs, A., & Braun, M. (2001). Identical words are read
differently in different languages. Psychological Science, 12(5), 379–384.
Zuzovsky, R. (2010). Instructional variables involved in problems associated with
diglossia in arabic speaking schools in Israel: PIRLS 2006 findings. Journal forEducational Research Online / Journal für Bildungsforschung Online, 2(1), 5–31.
Available from http://www.j-e-r-o.com/index.php/jero/article/view/85
288
tel-0
0563
710,
ver
sion
1 -
7 Fe
b 20
11
Appendix A
PIRLS variables derived fromQuestionnaires
289
tel-0
0563
710,
ver
sion
1 -
7 Fe
b 20
11
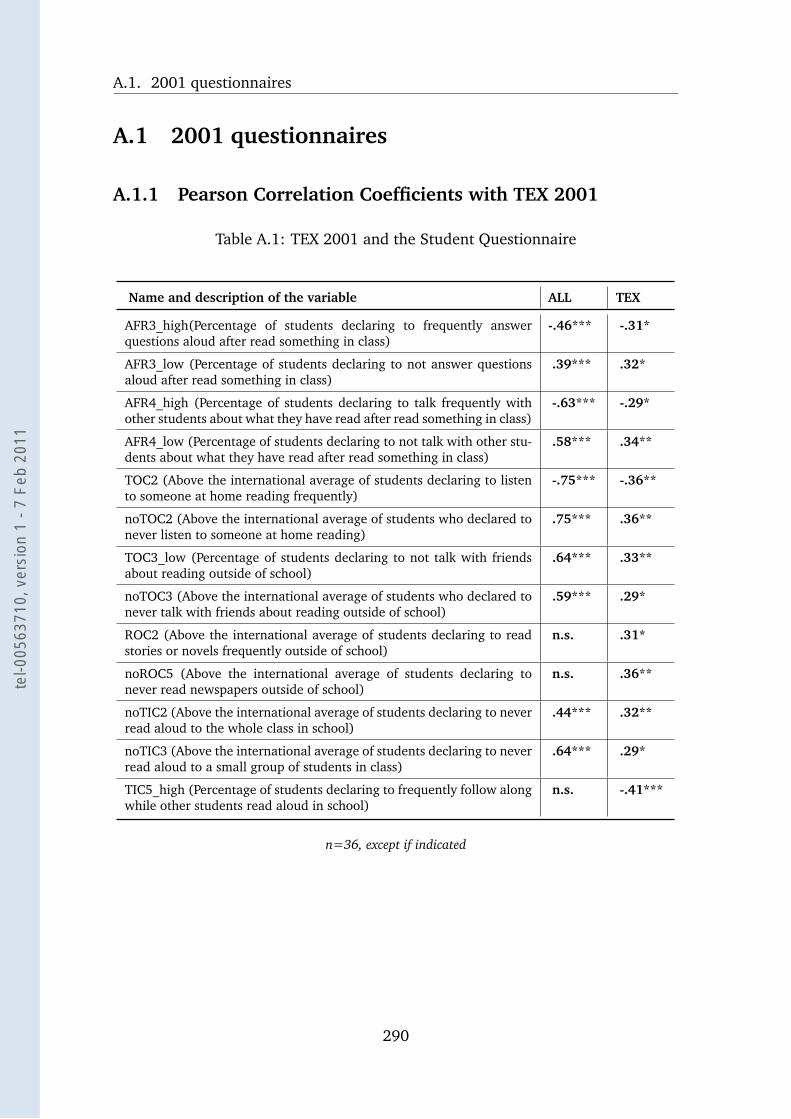
A.1. 2001 questionnaires
A.1 2001 questionnaires
A.1.1 Pearson Correlation Coefficients with TEX 2001
Table A.1: TEX 2001 and the Student Questionnaire
Name and description of the variable ALL TEX
AFR3_high(Percentage of students declaring to frequently answerquestions aloud after read something in class)
-.46*** -.31*
AFR3_low (Percentage of students declaring to not answer questionsaloud after read something in class)
.39*** .32*
AFR4_high (Percentage of students declaring to talk frequently withother students about what they have read after read something in class)
-.63*** -.29*
AFR4_low (Percentage of students declaring to not talk with other stu-dents about what they have read after read something in class)
.58*** .34**
TOC2 (Above the international average of students declaring to listento someone at home reading frequently)
-.75*** -.36**
noTOC2 (Above the international average of students who declared tonever listen to someone at home reading)
.75*** .36**
TOC3_low (Percentage of students declaring to not talk with friendsabout reading outside of school)
.64*** .33**
noTOC3 (Above the international average of students who declared tonever talk with friends about reading outside of school)
.59*** .29*
ROC2 (Above the international average of students declaring to readstories or novels frequently outside of school)
n.s. .31*
noROC5 (Above the international average of students declaring tonever read newspapers outside of school)
n.s. .36**
noTIC2 (Above the international average of students declaring to neverread aloud to the whole class in school)
.44*** .32**
noTIC3 (Above the international average of students declaring to neverread aloud to a small group of students in class)
.64*** .29*
TIC5_high (Percentage of students declaring to frequently follow alongwhile other students read aloud in school)
n.s. -.41***
n=36, except if indicated
290
tel-0
0563
710,
ver
sion
1 -
7 Fe
b 20
11
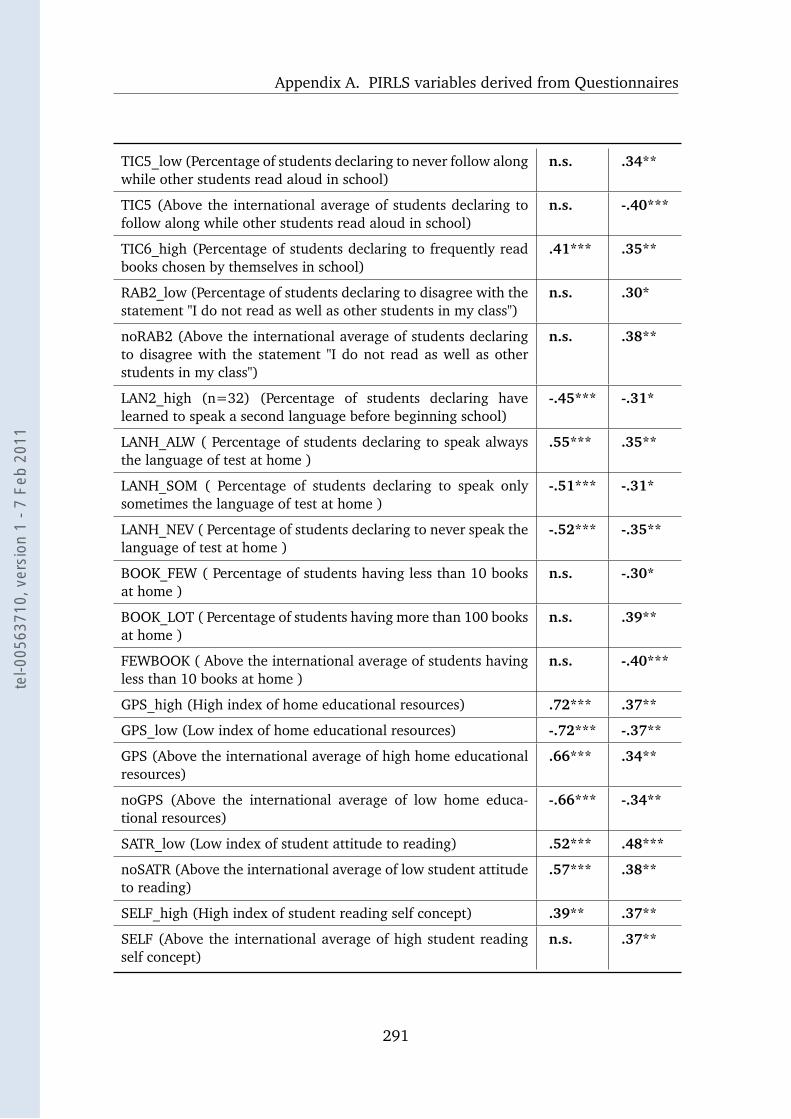
Appendix A. PIRLS variables derived from Questionnaires
TIC5_low (Percentage of students declaring to never follow alongwhile other students read aloud in school)
n.s. .34**
TIC5 (Above the international average of students declaring tofollow along while other students read aloud in school)
n.s. -.40***
TIC6_high (Percentage of students declaring to frequently readbooks chosen by themselves in school)
.41*** .35**
RAB2_low (Percentage of students declaring to disagree with thestatement "I do not read as well as other students in my class")
n.s. .30*
noRAB2 (Above the international average of students declaringto disagree with the statement "I do not read as well as otherstudents in my class")
n.s. .38**
LAN2_high (n=32) (Percentage of students declaring havelearned to speak a second language before beginning school)
-.45*** -.31*
LANH_ALW ( Percentage of students declaring to speak alwaysthe language of test at home )
.55*** .35**
LANH_SOM ( Percentage of students declaring to speak onlysometimes the language of test at home )
-.51*** -.31*
LANH_NEV ( Percentage of students declaring to never speak thelanguage of test at home )
-.52*** -.35**
BOOK_FEW ( Percentage of students having less than 10 booksat home )
n.s. -.30*
BOOK_LOT ( Percentage of students having more than 100 booksat home )
n.s. .39**
FEWBOOK ( Above the international average of students havingless than 10 books at home )
n.s. -.40***
GPS_high (High index of home educational resources) .72*** .37**
GPS_low (Low index of home educational resources) -.72*** -.37**
GPS (Above the international average of high home educationalresources)
.66*** .34**
noGPS (Above the international average of low home educa-tional resources)
-.66*** -.34**
SATR_low (Low index of student attitude to reading) .52*** .48***
noSATR (Above the international average of low student attitudeto reading)
.57*** .38**
SELF_high (High index of student reading self concept) .39** .37**
SELF (Above the international average of high student readingself concept)
n.s. .37**
291
tel-0
0563
710,
ver
sion
1 -
7 Fe
b 20
11
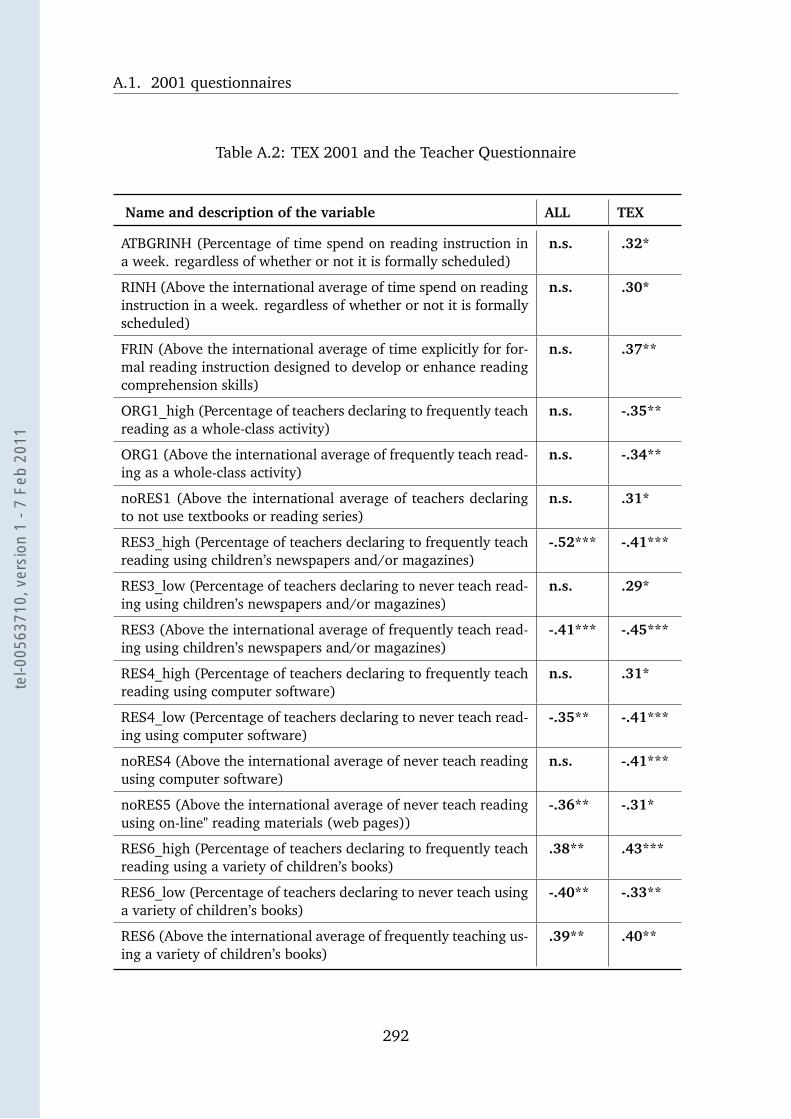
A.1. 2001 questionnaires
Table A.2: TEX 2001 and the Teacher Questionnaire
Name and description of the variable ALL TEX
ATBGRINH (Percentage of time spend on reading instruction ina week. regardless of whether or not it is formally scheduled)
n.s. .32*
RINH (Above the international average of time spend on readinginstruction in a week. regardless of whether or not it is formallyscheduled)
n.s. .30*
FRIN (Above the international average of time explicitly for for-mal reading instruction designed to develop or enhance readingcomprehension skills)
n.s. .37**
ORG1_high (Percentage of teachers declaring to frequently teachreading as a whole-class activity)
n.s. -.35**
ORG1 (Above the international average of frequently teach read-ing as a whole-class activity)
n.s. -.34**
noRES1 (Above the international average of teachers declaringto not use textbooks or reading series)
n.s. .31*
RES3_high (Percentage of teachers declaring to frequently teachreading using children’s newspapers and/or magazines)
-.52*** -.41***
RES3_low (Percentage of teachers declaring to never teach read-ing using children’s newspapers and/or magazines)
n.s. .29*
RES3 (Above the international average of frequently teach read-ing using children’s newspapers and/or magazines)
-.41*** -.45***
RES4_high (Percentage of teachers declaring to frequently teachreading using computer software)
n.s. .31*
RES4_low (Percentage of teachers declaring to never teach read-ing using computer software)
-.35** -.41***
noRES4 (Above the international average of never teach readingusing computer software)
n.s. -.41***
noRES5 (Above the international average of never teach readingusing on-line" reading materials (web pages))
-.36** -.31*
RES6_high (Percentage of teachers declaring to frequently teachreading using a variety of children’s books)
.38** .43***
RES6_low (Percentage of teachers declaring to never teach usinga variety of children’s books)
-.40** -.33**
RES6 (Above the international average of frequently teaching us-ing a variety of children’s books)
.39** .40**
292
tel-0
0563
710,
ver
sion
1 -
7 Fe
b 20
11
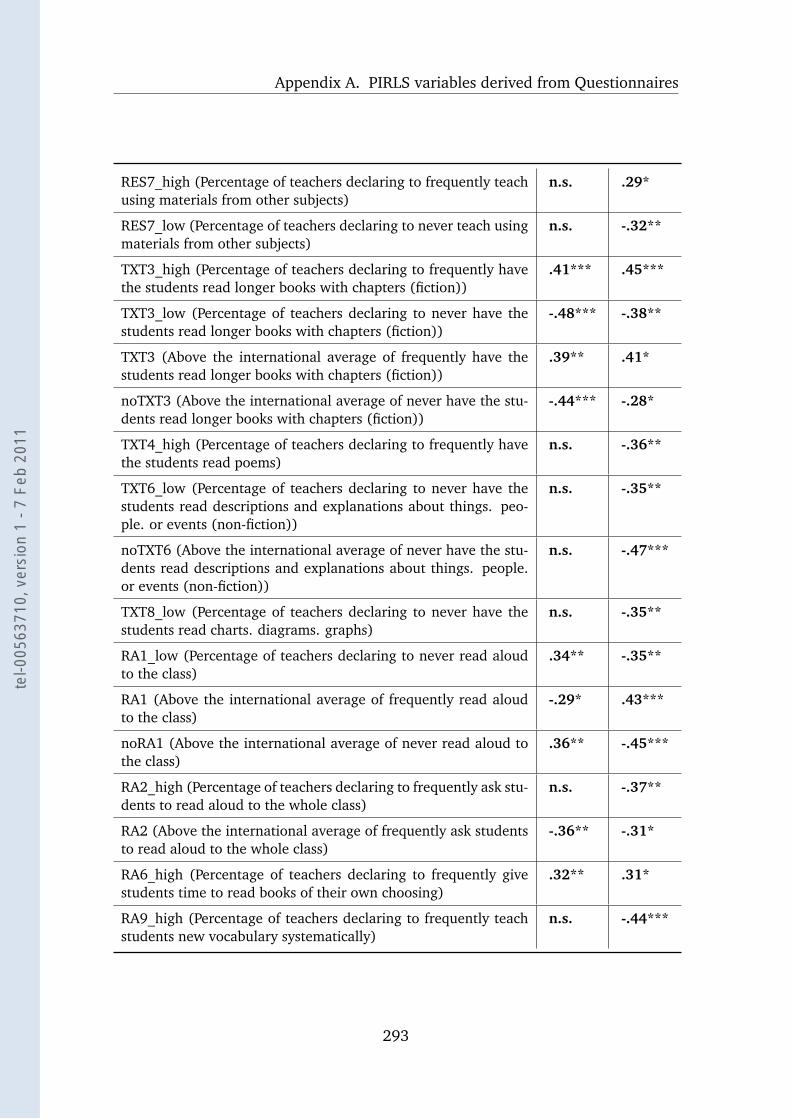
Appendix A. PIRLS variables derived from Questionnaires
RES7_high (Percentage of teachers declaring to frequently teachusing materials from other subjects)
n.s. .29*
RES7_low (Percentage of teachers declaring to never teach usingmaterials from other subjects)
n.s. -.32**
TXT3_high (Percentage of teachers declaring to frequently havethe students read longer books with chapters (fiction))
.41*** .45***
TXT3_low (Percentage of teachers declaring to never have thestudents read longer books with chapters (fiction))
-.48*** -.38**
TXT3 (Above the international average of frequently have thestudents read longer books with chapters (fiction))
.39** .41*
noTXT3 (Above the international average of never have the stu-dents read longer books with chapters (fiction))
-.44*** -.28*
TXT4_high (Percentage of teachers declaring to frequently havethe students read poems)
n.s. -.36**
TXT6_low (Percentage of teachers declaring to never have thestudents read descriptions and explanations about things. peo-ple. or events (non-fiction))
n.s. -.35**
noTXT6 (Above the international average of never have the stu-dents read descriptions and explanations about things. people.or events (non-fiction))
n.s. -.47***
TXT8_low (Percentage of teachers declaring to never have thestudents read charts. diagrams. graphs)
n.s. -.35**
RA1_low (Percentage of teachers declaring to never read aloudto the class)
.34** -.35**
RA1 (Above the international average of frequently read aloudto the class)
-.29* .43***
noRA1 (Above the international average of never read aloud tothe class)
.36** -.45***
RA2_high (Percentage of teachers declaring to frequently ask stu-dents to read aloud to the whole class)
n.s. -.37**
RA2 (Above the international average of frequently ask studentsto read aloud to the whole class)
-.36** -.31*
RA6_high (Percentage of teachers declaring to frequently givestudents time to read books of their own choosing)
.32** .31*
RA9_high (Percentage of teachers declaring to frequently teachstudents new vocabulary systematically)
n.s. -.44***
293
tel-0
0563
710,
ver
sion
1 -
7 Fe
b 20
11
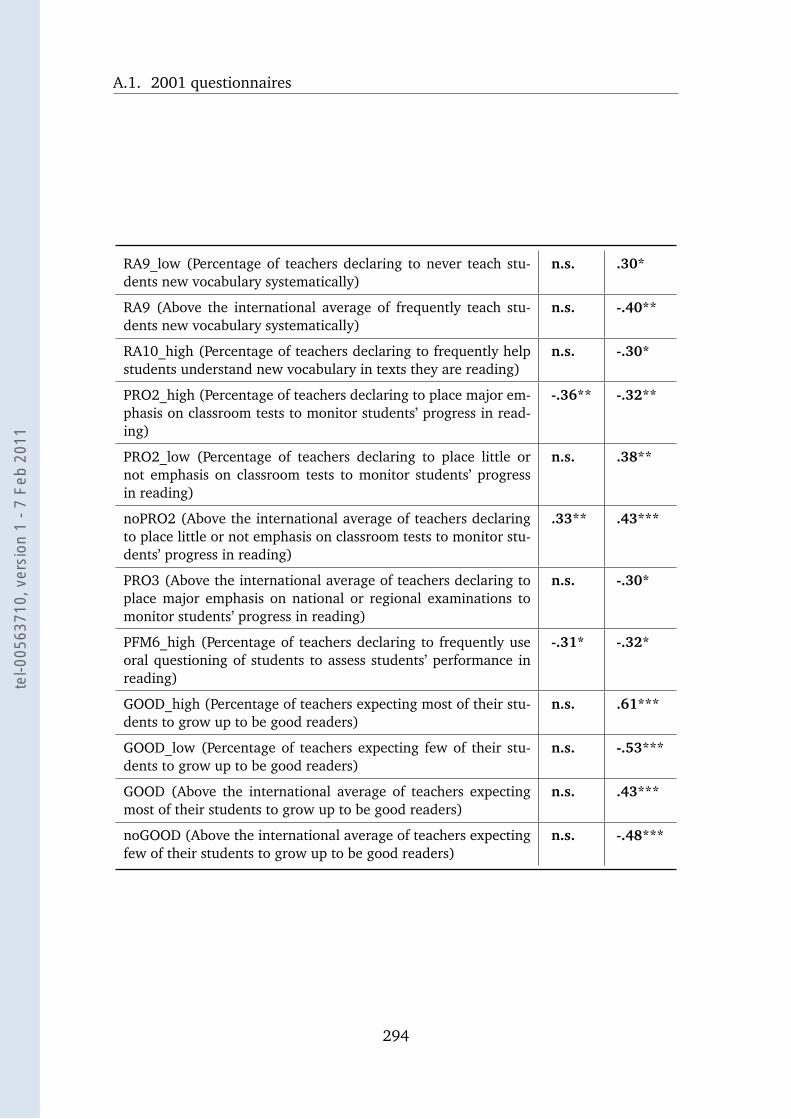
A.1. 2001 questionnaires
RA9_low (Percentage of teachers declaring to never teach stu-dents new vocabulary systematically)
n.s. .30*
RA9 (Above the international average of frequently teach stu-dents new vocabulary systematically)
n.s. -.40**
RA10_high (Percentage of teachers declaring to frequently helpstudents understand new vocabulary in texts they are reading)
n.s. -.30*
PRO2_high (Percentage of teachers declaring to place major em-phasis on classroom tests to monitor students’ progress in read-ing)
-.36** -.32**
PRO2_low (Percentage of teachers declaring to place little ornot emphasis on classroom tests to monitor students’ progressin reading)
n.s. .38**
noPRO2 (Above the international average of teachers declaringto place little or not emphasis on classroom tests to monitor stu-dents’ progress in reading)
.33** .43***
PRO3 (Above the international average of teachers declaring toplace major emphasis on national or regional examinations tomonitor students’ progress in reading)
n.s. -.30*
PFM6_high (Percentage of teachers declaring to frequently useoral questioning of students to assess students’ performance inreading)
-.31* -.32*
GOOD_high (Percentage of teachers expecting most of their stu-dents to grow up to be good readers)
n.s. .61***
GOOD_low (Percentage of teachers expecting few of their stu-dents to grow up to be good readers)
n.s. -.53***
GOOD (Above the international average of teachers expectingmost of their students to grow up to be good readers)
n.s. .43***
noGOOD (Above the international average of teachers expectingfew of their students to grow up to be good readers)
n.s. -.48***
294
tel-0
0563
710,
ver
sion
1 -
7 Fe
b 20
11
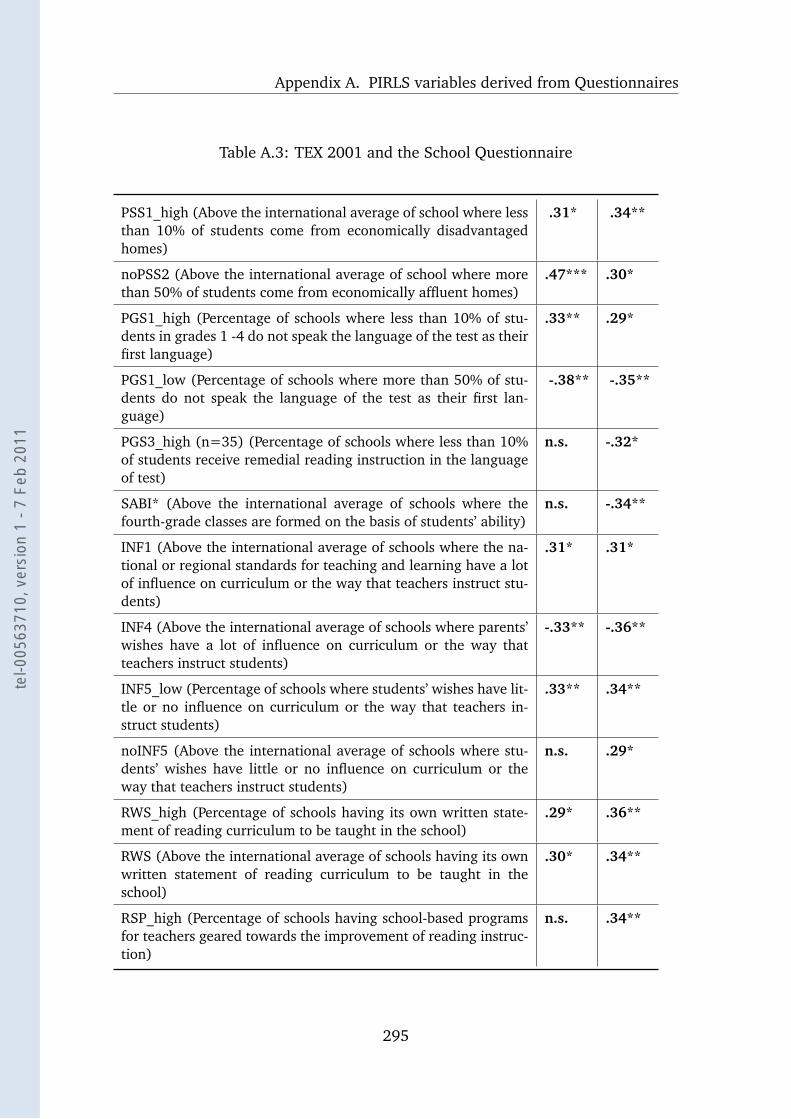
Appendix A. PIRLS variables derived from Questionnaires
Table A.3: TEX 2001 and the School Questionnaire
PSS1_high (Above the international average of school where lessthan 10% of students come from economically disadvantagedhomes)
.31* .34**
noPSS2 (Above the international average of school where morethan 50% of students come from economically affluent homes)
.47*** .30*
PGS1_high (Percentage of schools where less than 10% of stu-dents in grades 1 -4 do not speak the language of the test as theirfirst language)
.33** .29*
PGS1_low (Percentage of schools where more than 50% of stu-dents do not speak the language of the test as their first lan-guage)
-.38** -.35**
PGS3_high (n=35) (Percentage of schools where less than 10%of students receive remedial reading instruction in the languageof test)
n.s. -.32*
SABI* (Above the international average of schools where thefourth-grade classes are formed on the basis of students’ ability)
n.s. -.34**
INF1 (Above the international average of schools where the na-tional or regional standards for teaching and learning have a lotof influence on curriculum or the way that teachers instruct stu-dents)
.31* .31*
INF4 (Above the international average of schools where parents’wishes have a lot of influence on curriculum or the way thatteachers instruct students)
-.33** -.36**
INF5_low (Percentage of schools where students’ wishes have lit-tle or no influence on curriculum or the way that teachers in-struct students)
.33** .34**
noINF5 (Above the international average of schools where stu-dents’ wishes have little or no influence on curriculum or theway that teachers instruct students)
n.s. .29*
RWS_high (Percentage of schools having its own written state-ment of reading curriculum to be taught in the school)
.29* .36**
RWS (Above the international average of schools having its ownwritten statement of reading curriculum to be taught in theschool)
.30* .34**
RSP_high (Percentage of schools having school-based programsfor teachers geared towards the improvement of reading instruc-tion)
n.s. .34**
295
tel-0
0563
710,
ver
sion
1 -
7 Fe
b 20
11
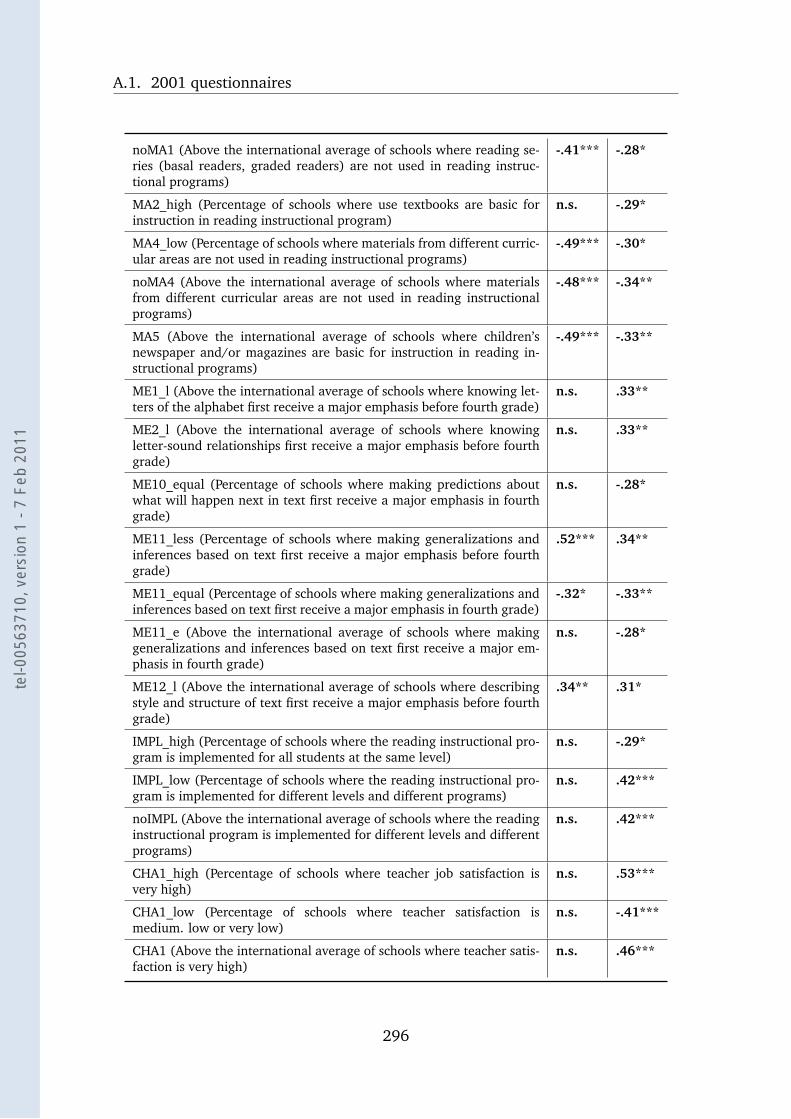
A.1. 2001 questionnaires
noMA1 (Above the international average of schools where reading se-ries (basal readers, graded readers) are not used in reading instruc-tional programs)
-.41*** -.28*
MA2_high (Percentage of schools where use textbooks are basic forinstruction in reading instructional program)
n.s. -.29*
MA4_low (Percentage of schools where materials from different curric-ular areas are not used in reading instructional programs)
-.49*** -.30*
noMA4 (Above the international average of schools where materialsfrom different curricular areas are not used in reading instructionalprograms)
-.48*** -.34**
MA5 (Above the international average of schools where children’snewspaper and/or magazines are basic for instruction in reading in-structional programs)
-.49*** -.33**
ME1_l (Above the international average of schools where knowing let-ters of the alphabet first receive a major emphasis before fourth grade)
n.s. .33**
ME2_l (Above the international average of schools where knowingletter-sound relationships first receive a major emphasis before fourthgrade)
n.s. .33**
ME10_equal (Percentage of schools where making predictions aboutwhat will happen next in text first receive a major emphasis in fourthgrade)
n.s. -.28*
ME11_less (Percentage of schools where making generalizations andinferences based on text first receive a major emphasis before fourthgrade)
.52*** .34**
ME11_equal (Percentage of schools where making generalizations andinferences based on text first receive a major emphasis in fourth grade)
-.32* -.33**
ME11_e (Above the international average of schools where makinggeneralizations and inferences based on text first receive a major em-phasis in fourth grade)
n.s. -.28*
ME12_l (Above the international average of schools where describingstyle and structure of text first receive a major emphasis before fourthgrade)
.34** .31*
IMPL_high (Percentage of schools where the reading instructional pro-gram is implemented for all students at the same level)
n.s. -.29*
IMPL_low (Percentage of schools where the reading instructional pro-gram is implemented for different levels and different programs)
n.s. .42***
noIMPL (Above the international average of schools where the readinginstructional program is implemented for different levels and differentprograms)
n.s. .42***
CHA1_high (Percentage of schools where teacher job satisfaction isvery high)
n.s. .53***
CHA1_low (Percentage of schools where teacher satisfaction ismedium. low or very low)
n.s. -.41***
CHA1 (Above the international average of schools where teacher satis-faction is very high)
n.s. .46***
296
tel-0
0563
710,
ver
sion
1 -
7 Fe
b 20
11
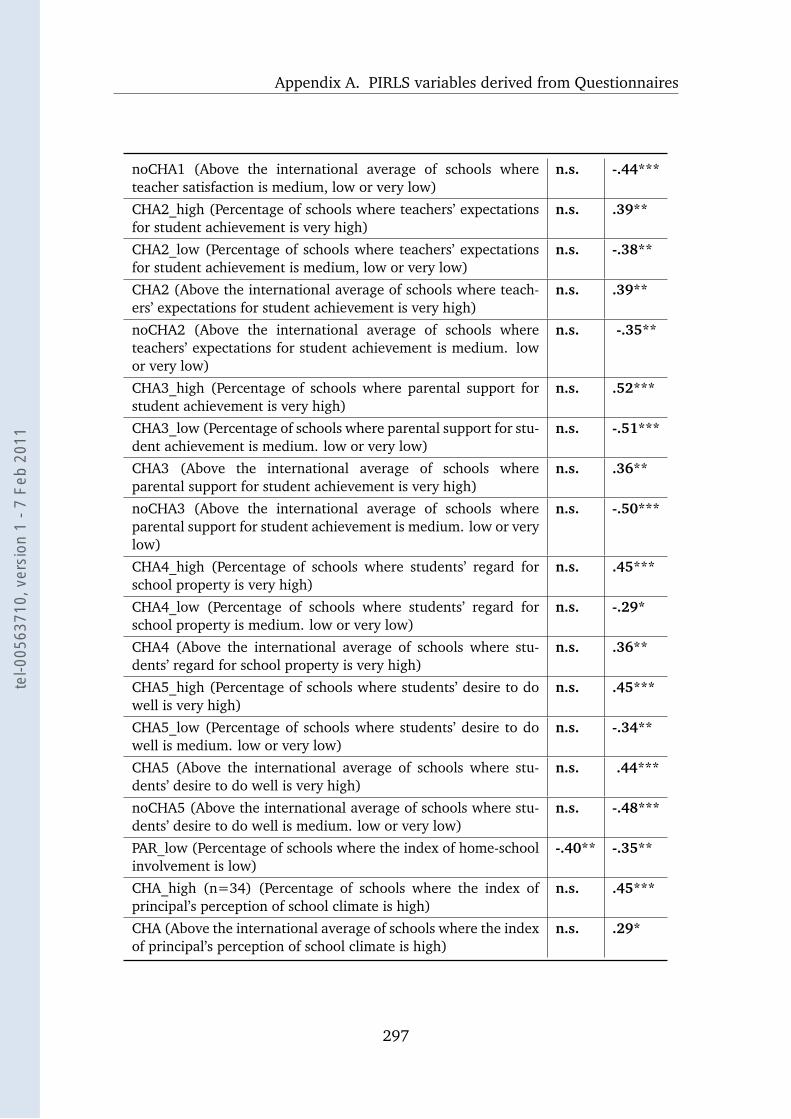
Appendix A. PIRLS variables derived from Questionnaires
noCHA1 (Above the international average of schools whereteacher satisfaction is medium, low or very low)
n.s. -.44***
CHA2_high (Percentage of schools where teachers’ expectationsfor student achievement is very high)
n.s. .39**
CHA2_low (Percentage of schools where teachers’ expectationsfor student achievement is medium, low or very low)
n.s. -.38**
CHA2 (Above the international average of schools where teach-ers’ expectations for student achievement is very high)
n.s. .39**
noCHA2 (Above the international average of schools whereteachers’ expectations for student achievement is medium. lowor very low)
n.s. -.35**
CHA3_high (Percentage of schools where parental support forstudent achievement is very high)
n.s. .52***
CHA3_low (Percentage of schools where parental support for stu-dent achievement is medium. low or very low)
n.s. -.51***
CHA3 (Above the international average of schools whereparental support for student achievement is very high)
n.s. .36**
noCHA3 (Above the international average of schools whereparental support for student achievement is medium. low or verylow)
n.s. -.50***
CHA4_high (Percentage of schools where students’ regard forschool property is very high)
n.s. .45***
CHA4_low (Percentage of schools where students’ regard forschool property is medium. low or very low)
n.s. -.29*
CHA4 (Above the international average of schools where stu-dents’ regard for school property is very high)
n.s. .36**
CHA5_high (Percentage of schools where students’ desire to dowell is very high)
n.s. .45***
CHA5_low (Percentage of schools where students’ desire to dowell is medium. low or very low)
n.s. -.34**
CHA5 (Above the international average of schools where stu-dents’ desire to do well is very high)
n.s. .44***
noCHA5 (Above the international average of schools where stu-dents’ desire to do well is medium. low or very low)
n.s. -.48***
PAR_low (Percentage of schools where the index of home-schoolinvolvement is low)
-.40** -.35**
CHA_high (n=34) (Percentage of schools where the index ofprincipal’s perception of school climate is high)
n.s. .45***
CHA (Above the international average of schools where the indexof principal’s perception of school climate is high)
n.s. .29*
297
tel-0
0563
710,
ver
sion
1 -
7 Fe
b 20
11
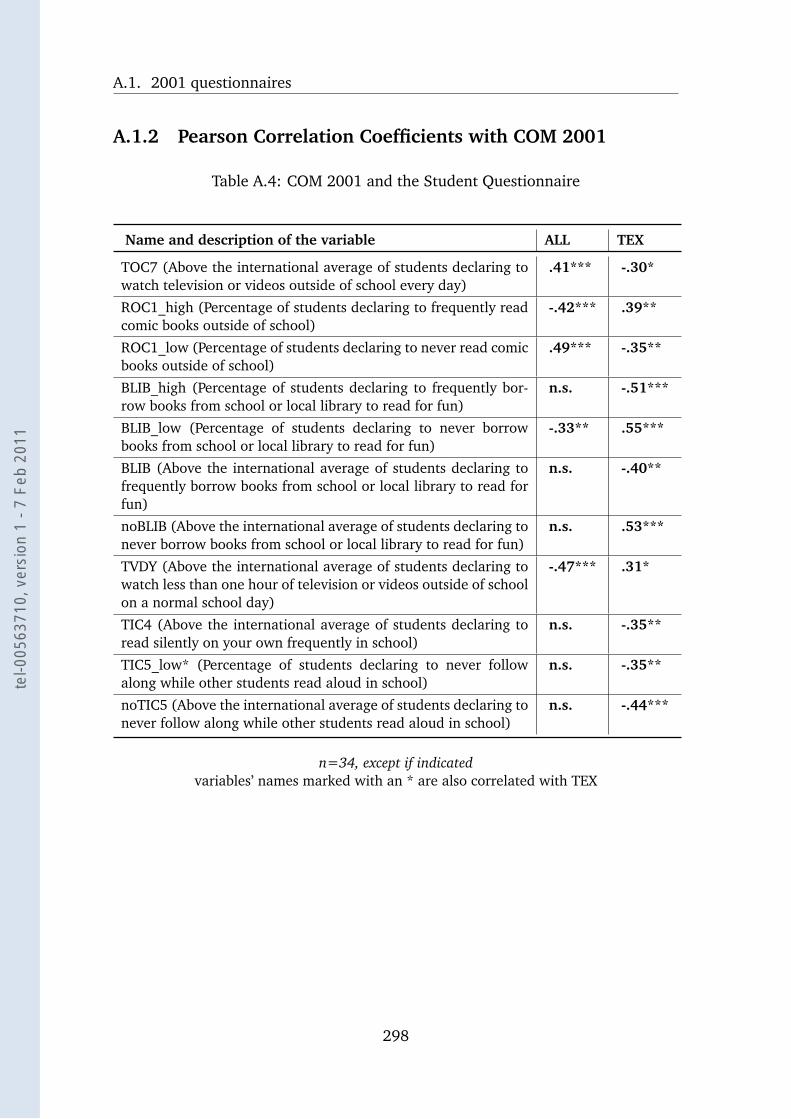
A.1. 2001 questionnaires
A.1.2 Pearson Correlation Coefficients with COM 2001
Table A.4: COM 2001 and the Student Questionnaire
Name and description of the variable ALL TEX
TOC7 (Above the international average of students declaring towatch television or videos outside of school every day)
.41*** -.30*
ROC1_high (Percentage of students declaring to frequently readcomic books outside of school)
-.42*** .39**
ROC1_low (Percentage of students declaring to never read comicbooks outside of school)
.49*** -.35**
BLIB_high (Percentage of students declaring to frequently bor-row books from school or local library to read for fun)
n.s. -.51***
BLIB_low (Percentage of students declaring to never borrowbooks from school or local library to read for fun)
-.33** .55***
BLIB (Above the international average of students declaring tofrequently borrow books from school or local library to read forfun)
n.s. -.40**
noBLIB (Above the international average of students declaring tonever borrow books from school or local library to read for fun)
n.s. .53***
TVDY (Above the international average of students declaring towatch less than one hour of television or videos outside of schoolon a normal school day)
-.47*** .31*
TIC4 (Above the international average of students declaring toread silently on your own frequently in school)
n.s. -.35**
TIC5_low* (Percentage of students declaring to never followalong while other students read aloud in school)
n.s. -.35**
noTIC5 (Above the international average of students declaring tonever follow along while other students read aloud in school)
n.s. -.44***
n=34, except if indicatedvariables’ names marked with an * are also correlated with TEX
298
tel-0
0563
710,
ver
sion
1 -
7 Fe
b 20
11
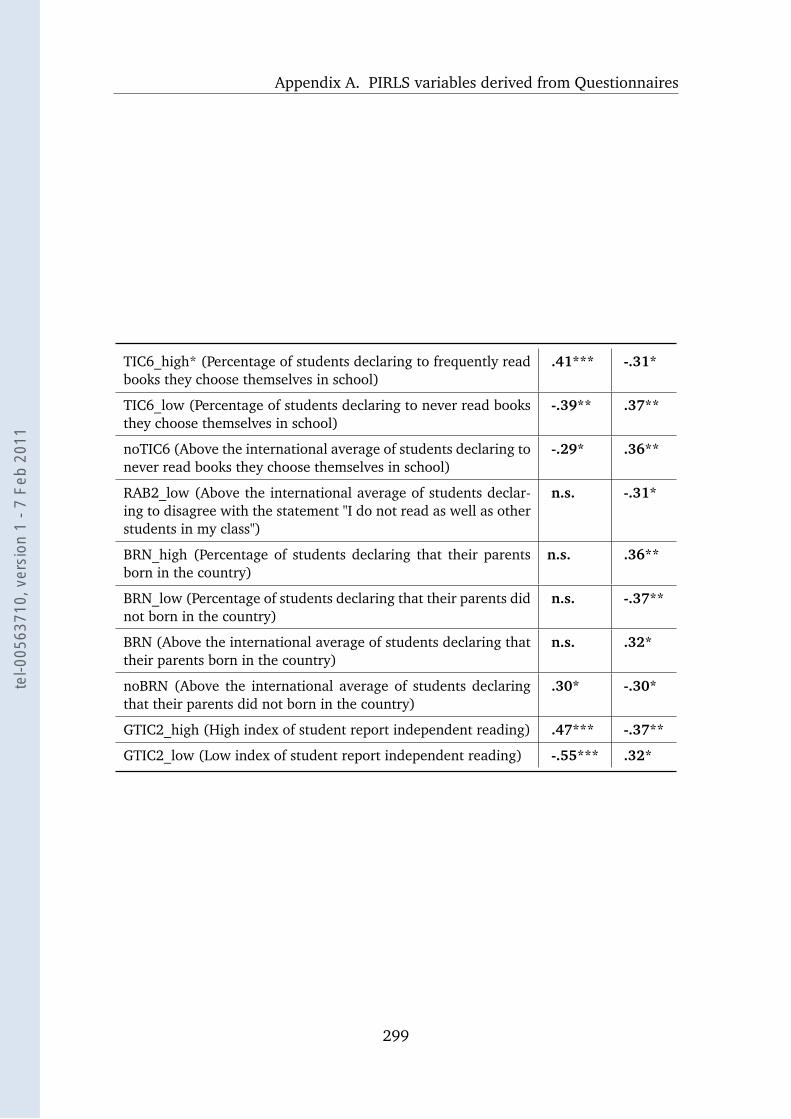
Appendix A. PIRLS variables derived from Questionnaires
TIC6_high* (Percentage of students declaring to frequently readbooks they choose themselves in school)
.41*** -.31*
TIC6_low (Percentage of students declaring to never read booksthey choose themselves in school)
-.39** .37**
noTIC6 (Above the international average of students declaring tonever read books they choose themselves in school)
-.29* .36**
RAB2_low (Above the international average of students declar-ing to disagree with the statement "I do not read as well as otherstudents in my class")
n.s. -.31*
BRN_high (Percentage of students declaring that their parentsborn in the country)
n.s. .36**
BRN_low (Percentage of students declaring that their parents didnot born in the country)
n.s. -.37**
BRN (Above the international average of students declaring thattheir parents born in the country)
n.s. .32*
noBRN (Above the international average of students declaringthat their parents did not born in the country)
.30* -.30*
GTIC2_high (High index of student report independent reading) .47*** -.37**
GTIC2_low (Low index of student report independent reading) -.55*** .32*
299
tel-0
0563
710,
ver
sion
1 -
7 Fe
b 20
11
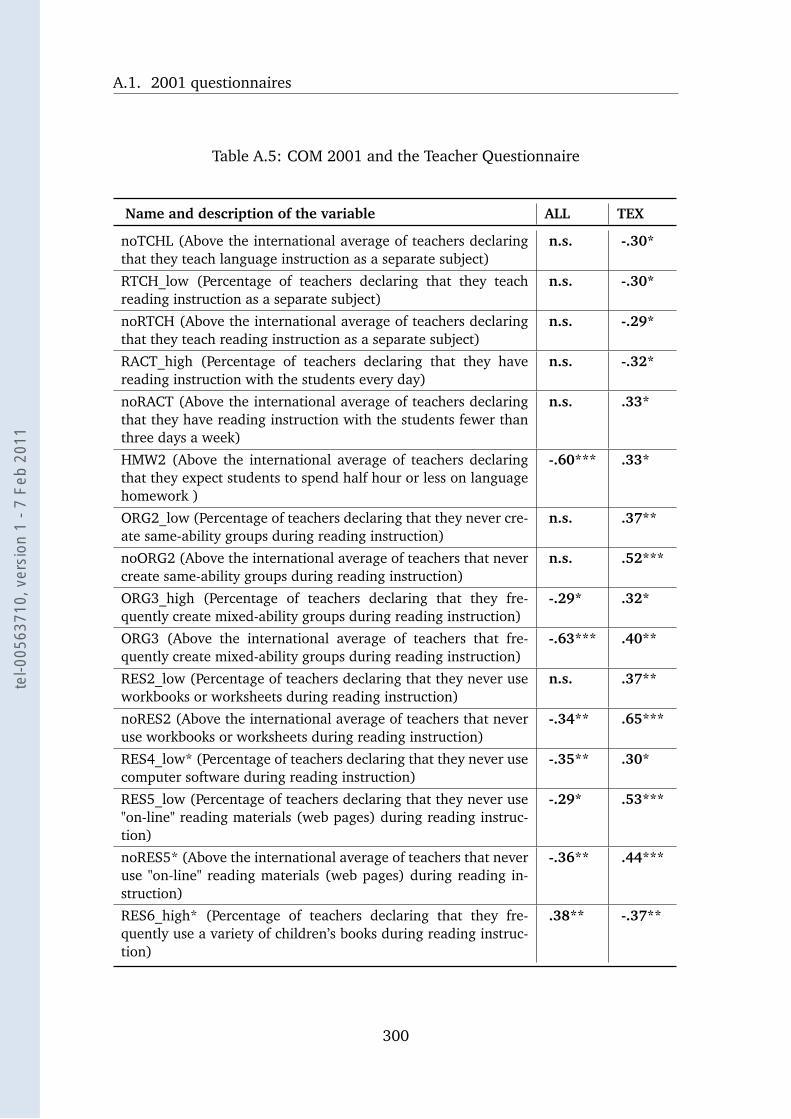
A.1. 2001 questionnaires
Table A.5: COM 2001 and the Teacher Questionnaire
Name and description of the variable ALL TEX
noTCHL (Above the international average of teachers declaringthat they teach language instruction as a separate subject)
n.s. -.30*
RTCH_low (Percentage of teachers declaring that they teachreading instruction as a separate subject)
n.s. -.30*
noRTCH (Above the international average of teachers declaringthat they teach reading instruction as a separate subject)
n.s. -.29*
RACT_high (Percentage of teachers declaring that they havereading instruction with the students every day)
n.s. -.32*
noRACT (Above the international average of teachers declaringthat they have reading instruction with the students fewer thanthree days a week)
n.s. .33*
HMW2 (Above the international average of teachers declaringthat they expect students to spend half hour or less on languagehomework )
-.60*** .33*
ORG2_low (Percentage of teachers declaring that they never cre-ate same-ability groups during reading instruction)
n.s. .37**
noORG2 (Above the international average of teachers that nevercreate same-ability groups during reading instruction)
n.s. .52***
ORG3_high (Percentage of teachers declaring that they fre-quently create mixed-ability groups during reading instruction)
-.29* .32*
ORG3 (Above the international average of teachers that fre-quently create mixed-ability groups during reading instruction)
-.63*** .40**
RES2_low (Percentage of teachers declaring that they never useworkbooks or worksheets during reading instruction)
n.s. .37**
noRES2 (Above the international average of teachers that neveruse workbooks or worksheets during reading instruction)
-.34** .65***
RES4_low* (Percentage of teachers declaring that they never usecomputer software during reading instruction)
-.35** .30*
RES5_low (Percentage of teachers declaring that they never use"on-line" reading materials (web pages) during reading instruc-tion)
-.29* .53***
noRES5* (Above the international average of teachers that neveruse "on-line" reading materials (web pages) during reading in-struction)
-.36** .44***
RES6_high* (Percentage of teachers declaring that they fre-quently use a variety of children’s books during reading instruc-tion)
.38** -.37**
300
tel-0
0563
710,
ver
sion
1 -
7 Fe
b 20
11
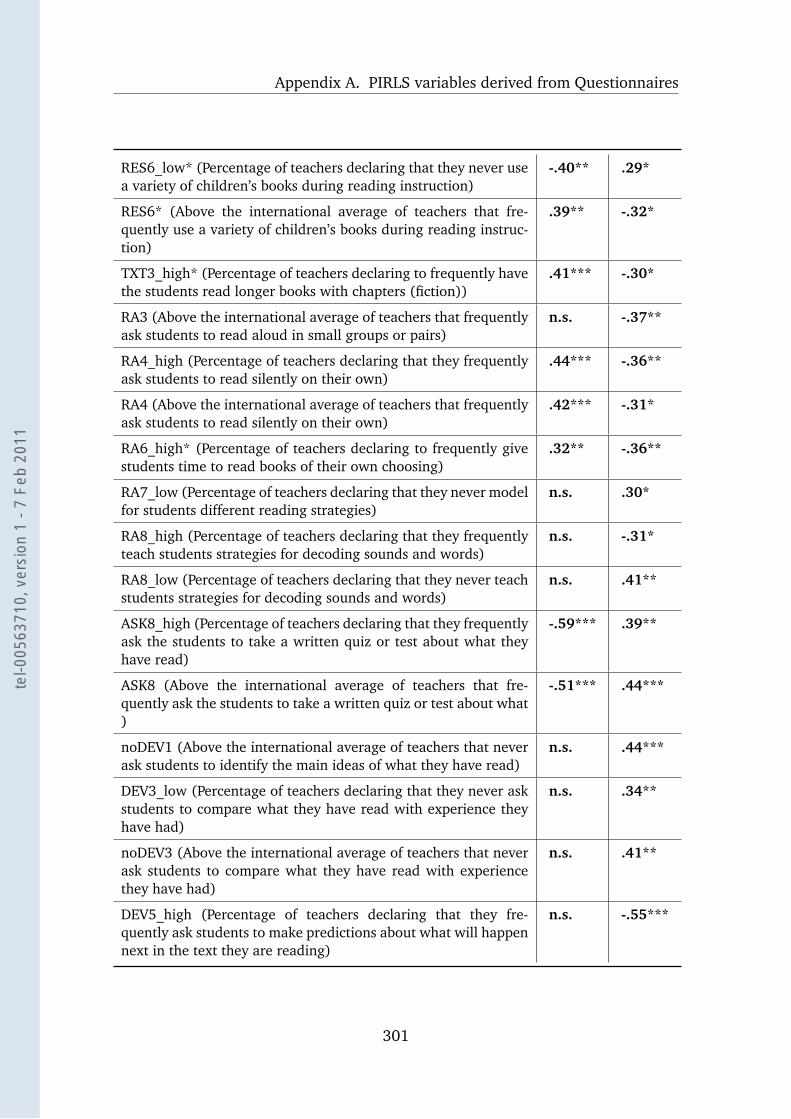
Appendix A. PIRLS variables derived from Questionnaires
RES6_low* (Percentage of teachers declaring that they never usea variety of children’s books during reading instruction)
-.40** .29*
RES6* (Above the international average of teachers that fre-quently use a variety of children’s books during reading instruc-tion)
.39** -.32*
TXT3_high* (Percentage of teachers declaring to frequently havethe students read longer books with chapters (fiction))
.41*** -.30*
RA3 (Above the international average of teachers that frequentlyask students to read aloud in small groups or pairs)
n.s. -.37**
RA4_high (Percentage of teachers declaring that they frequentlyask students to read silently on their own)
.44*** -.36**
RA4 (Above the international average of teachers that frequentlyask students to read silently on their own)
.42*** -.31*
RA6_high* (Percentage of teachers declaring to frequently givestudents time to read books of their own choosing)
.32** -.36**
RA7_low (Percentage of teachers declaring that they never modelfor students different reading strategies)
n.s. .30*
RA8_high (Percentage of teachers declaring that they frequentlyteach students strategies for decoding sounds and words)
n.s. -.31*
RA8_low (Percentage of teachers declaring that they never teachstudents strategies for decoding sounds and words)
n.s. .41**
ASK8_high (Percentage of teachers declaring that they frequentlyask the students to take a written quiz or test about what theyhave read)
-.59*** .39**
ASK8 (Above the international average of teachers that fre-quently ask the students to take a written quiz or test about what)
-.51*** .44***
noDEV1 (Above the international average of teachers that neverask students to identify the main ideas of what they have read)
n.s. .44***
DEV3_low (Percentage of teachers declaring that they never askstudents to compare what they have read with experience theyhave had)
n.s. .34**
noDEV3 (Above the international average of teachers that neverask students to compare what they have read with experiencethey have had)
n.s. .41**
DEV5_high (Percentage of teachers declaring that they fre-quently ask students to make predictions about what will happennext in the text they are reading)
n.s. -.55***
301
tel-0
0563
710,
ver
sion
1 -
7 Fe
b 20
11

A.1. 2001 questionnaires
DEV5_low (Percentage of teachers declaring that they never askstudents to make predictions about what will happen next in thetext they are reading)
n.s. .51***
DEV5 (Above the international average of teachers that fre-quently ask students to make predictions about what will happennext in the text they are reading)
n.s. -.35**
noDEV5 (Above the international average of teachers that neverask students to make predictions about what will happen next inthe text they are reading)
n.s. .45***
DEV6_high (Percentage of teachers declaring that they fre-quently ask students to make generalizations and draw infer-ences based on what they have read)
n.s. -.31*
DEV6_low (Percentage of teachers declaring that they never askstudents to make generalizations and draw inferences based onwhat they have read)
n.s. .43***
DEV6 (Above the international average of teachers that fre-quently ask students to make generalizations and draw infer-ences based on what they have read)
n.s. -.40**
noDEV6 (Above the international average of teachers that neverask students to make generalizations and draw inferences basedon what they have read)
n.s. .50***
DEV7_high (Percentage of teachers declaring that they fre-quently ask students to describe the style or structure of the textthey have read)
n.s. -.39**
DEV7_low (Percentage of teachers declaring that they never askstudents to describe the style or structure of the text they haveread)
n.s. .46***
DEV7 (Above the international average of teachers that fre-quently ask students to describe the style or structure of the textthey have read)
n.s. -.29*
noDEV7 (Above the international average of teachers that neverask students to describe the style or structure of the text theyhave read)
n.s. .35**
PRO5_low (Percentage of teachers declaring that they place littleor no emphasis in their professional opinion to monitor students’progress in reading)
-.63*** .34**
302
tel-0
0563
710,
ver
sion
1 -
7 Fe
b 20
11
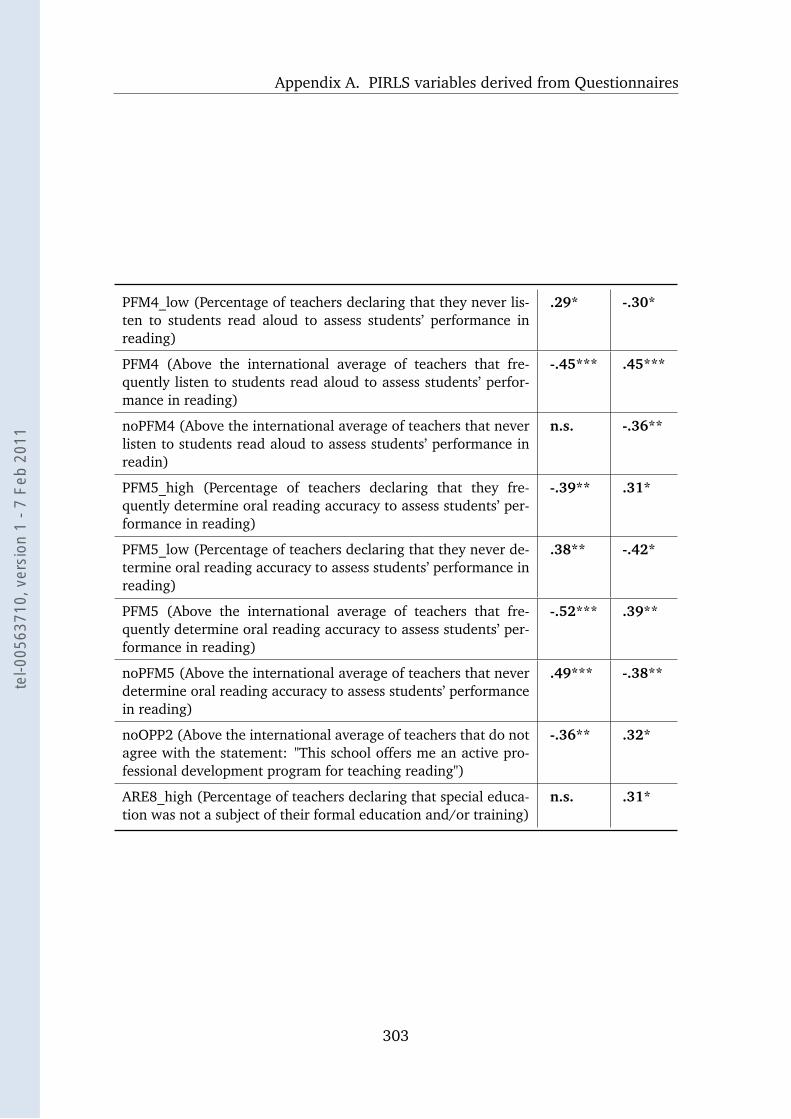
Appendix A. PIRLS variables derived from Questionnaires
PFM4_low (Percentage of teachers declaring that they never lis-ten to students read aloud to assess students’ performance inreading)
.29* -.30*
PFM4 (Above the international average of teachers that fre-quently listen to students read aloud to assess students’ perfor-mance in reading)
-.45*** .45***
noPFM4 (Above the international average of teachers that neverlisten to students read aloud to assess students’ performance inreadin)
n.s. -.36**
PFM5_high (Percentage of teachers declaring that they fre-quently determine oral reading accuracy to assess students’ per-formance in reading)
-.39** .31*
PFM5_low (Percentage of teachers declaring that they never de-termine oral reading accuracy to assess students’ performance inreading)
.38** -.42*
PFM5 (Above the international average of teachers that fre-quently determine oral reading accuracy to assess students’ per-formance in reading)
-.52*** .39**
noPFM5 (Above the international average of teachers that neverdetermine oral reading accuracy to assess students’ performancein reading)
.49*** -.38**
noOPP2 (Above the international average of teachers that do notagree with the statement: "This school offers me an active pro-fessional development program for teaching reading")
-.36** .32*
ARE8_high (Percentage of teachers declaring that special educa-tion was not a subject of their formal education and/or training)
n.s. .31*
303
tel-0
0563
710,
ver
sion
1 -
7 Fe
b 20
11
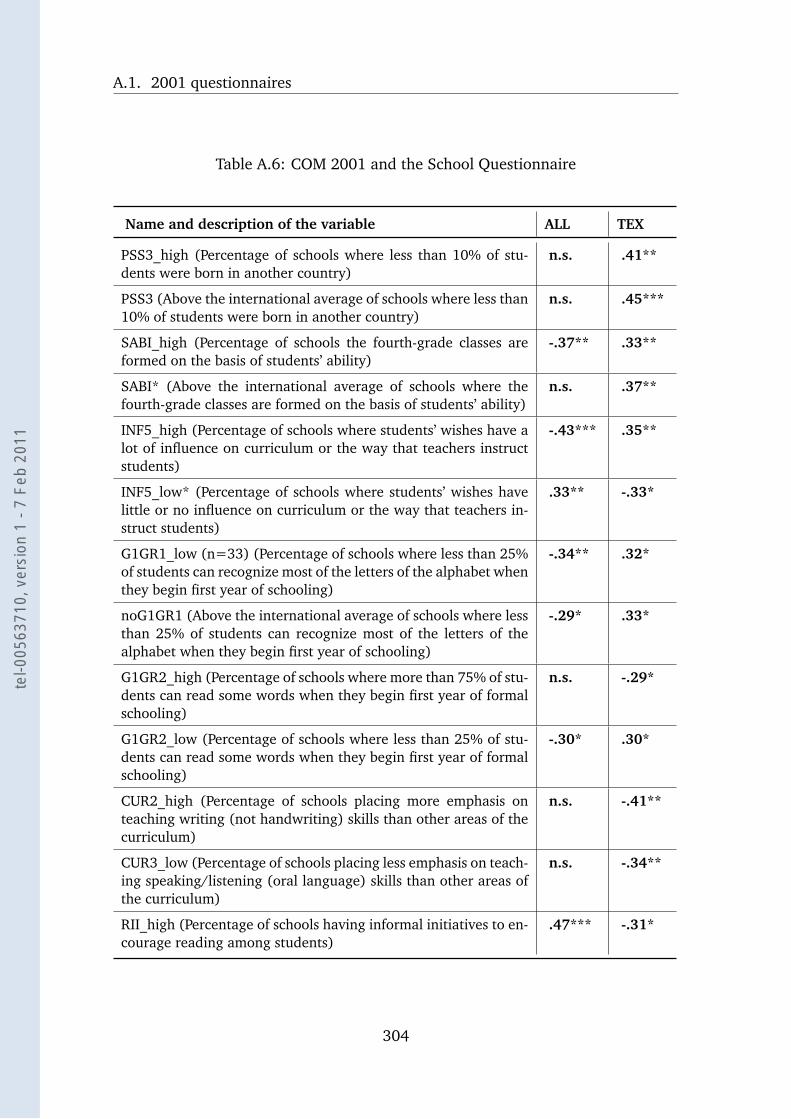
A.1. 2001 questionnaires
Table A.6: COM 2001 and the School Questionnaire
Name and description of the variable ALL TEX
PSS3_high (Percentage of schools where less than 10% of stu-dents were born in another country)
n.s. .41**
PSS3 (Above the international average of schools where less than10% of students were born in another country)
n.s. .45***
SABI_high (Percentage of schools the fourth-grade classes areformed on the basis of students’ ability)
-.37** .33**
SABI* (Above the international average of schools where thefourth-grade classes are formed on the basis of students’ ability)
n.s. .37**
INF5_high (Percentage of schools where students’ wishes have alot of influence on curriculum or the way that teachers instructstudents)
-.43*** .35**
INF5_low* (Percentage of schools where students’ wishes havelittle or no influence on curriculum or the way that teachers in-struct students)
.33** -.33*
G1GR1_low (n=33) (Percentage of schools where less than 25%of students can recognize most of the letters of the alphabet whenthey begin first year of schooling)
-.34** .32*
noG1GR1 (Above the international average of schools where lessthan 25% of students can recognize most of the letters of thealphabet when they begin first year of schooling)
-.29* .33*
G1GR2_high (Percentage of schools where more than 75% of stu-dents can read some words when they begin first year of formalschooling)
n.s. -.29*
G1GR2_low (Percentage of schools where less than 25% of stu-dents can read some words when they begin first year of formalschooling)
-.30* .30*
CUR2_high (Percentage of schools placing more emphasis onteaching writing (not handwriting) skills than other areas of thecurriculum)
n.s. -.41**
CUR3_low (Percentage of schools placing less emphasis on teach-ing speaking/listening (oral language) skills than other areas ofthe curriculum)
n.s. -.34**
RII_high (Percentage of schools having informal initiatives to en-courage reading among students)
.47*** -.31*
304
tel-0
0563
710,
ver
sion
1 -
7 Fe
b 20
11
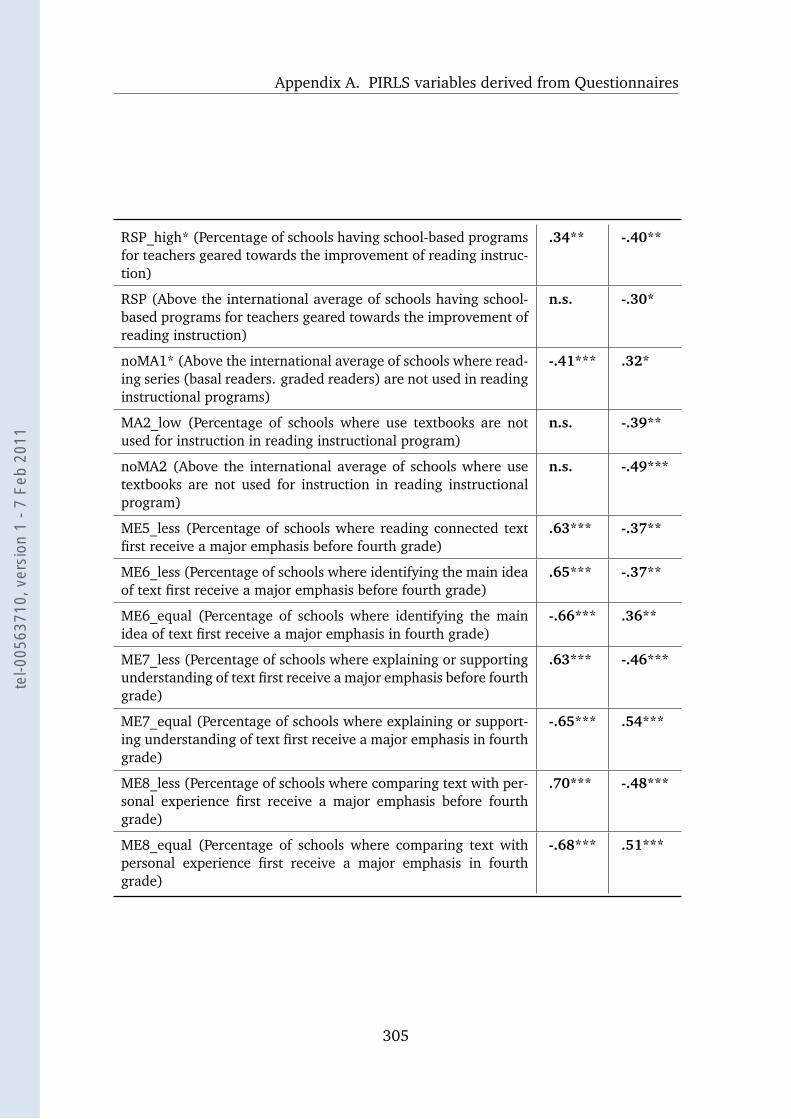
Appendix A. PIRLS variables derived from Questionnaires
RSP_high* (Percentage of schools having school-based programsfor teachers geared towards the improvement of reading instruc-tion)
.34** -.40**
RSP (Above the international average of schools having school-based programs for teachers geared towards the improvement ofreading instruction)
n.s. -.30*
noMA1* (Above the international average of schools where read-ing series (basal readers. graded readers) are not used in readinginstructional programs)
-.41*** .32*
MA2_low (Percentage of schools where use textbooks are notused for instruction in reading instructional program)
n.s. -.39**
noMA2 (Above the international average of schools where usetextbooks are not used for instruction in reading instructionalprogram)
n.s. -.49***
ME5_less (Percentage of schools where reading connected textfirst receive a major emphasis before fourth grade)
.63*** -.37**
ME6_less (Percentage of schools where identifying the main ideaof text first receive a major emphasis before fourth grade)
.65*** -.37**
ME6_equal (Percentage of schools where identifying the mainidea of text first receive a major emphasis in fourth grade)
-.66*** .36**
ME7_less (Percentage of schools where explaining or supportingunderstanding of text first receive a major emphasis before fourthgrade)
.63*** -.46***
ME7_equal (Percentage of schools where explaining or support-ing understanding of text first receive a major emphasis in fourthgrade)
-.65*** .54***
ME8_less (Percentage of schools where comparing text with per-sonal experience first receive a major emphasis before fourthgrade)
.70*** -.48***
ME8_equal (Percentage of schools where comparing text withpersonal experience first receive a major emphasis in fourthgrade)
-.68*** .51***
305
tel-0
0563
710,
ver
sion
1 -
7 Fe
b 20
11
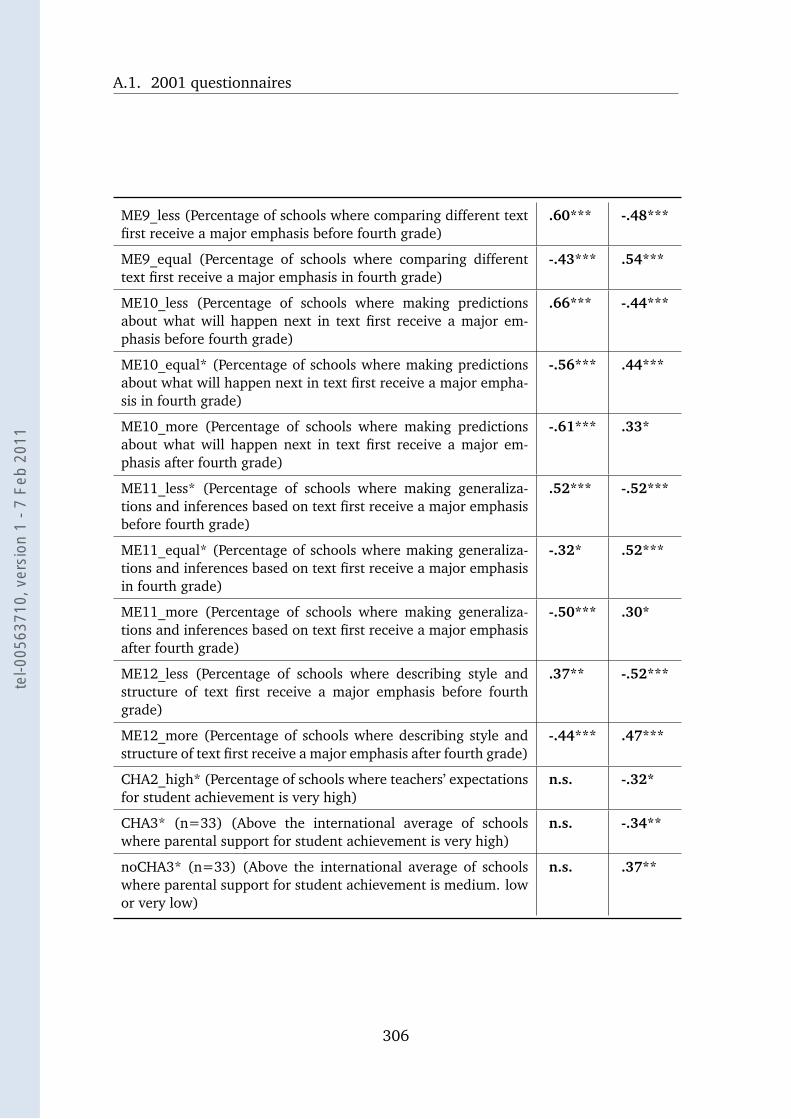
A.1. 2001 questionnaires
ME9_less (Percentage of schools where comparing different textfirst receive a major emphasis before fourth grade)
.60*** -.48***
ME9_equal (Percentage of schools where comparing differenttext first receive a major emphasis in fourth grade)
-.43*** .54***
ME10_less (Percentage of schools where making predictionsabout what will happen next in text first receive a major em-phasis before fourth grade)
.66*** -.44***
ME10_equal* (Percentage of schools where making predictionsabout what will happen next in text first receive a major empha-sis in fourth grade)
-.56*** .44***
ME10_more (Percentage of schools where making predictionsabout what will happen next in text first receive a major em-phasis after fourth grade)
-.61*** .33*
ME11_less* (Percentage of schools where making generaliza-tions and inferences based on text first receive a major emphasisbefore fourth grade)
.52*** -.52***
ME11_equal* (Percentage of schools where making generaliza-tions and inferences based on text first receive a major emphasisin fourth grade)
-.32* .52***
ME11_more (Percentage of schools where making generaliza-tions and inferences based on text first receive a major emphasisafter fourth grade)
-.50*** .30*
ME12_less (Percentage of schools where describing style andstructure of text first receive a major emphasis before fourthgrade)
.37** -.52***
ME12_more (Percentage of schools where describing style andstructure of text first receive a major emphasis after fourth grade)
-.44*** .47***
CHA2_high* (Percentage of schools where teachers’ expectationsfor student achievement is very high)
n.s. -.32*
CHA3* (n=33) (Above the international average of schoolswhere parental support for student achievement is very high)
n.s. -.34**
noCHA3* (n=33) (Above the international average of schoolswhere parental support for student achievement is medium. lowor very low)
n.s. .37**
306
tel-0
0563
710,
ver
sion
1 -
7 Fe
b 20
11
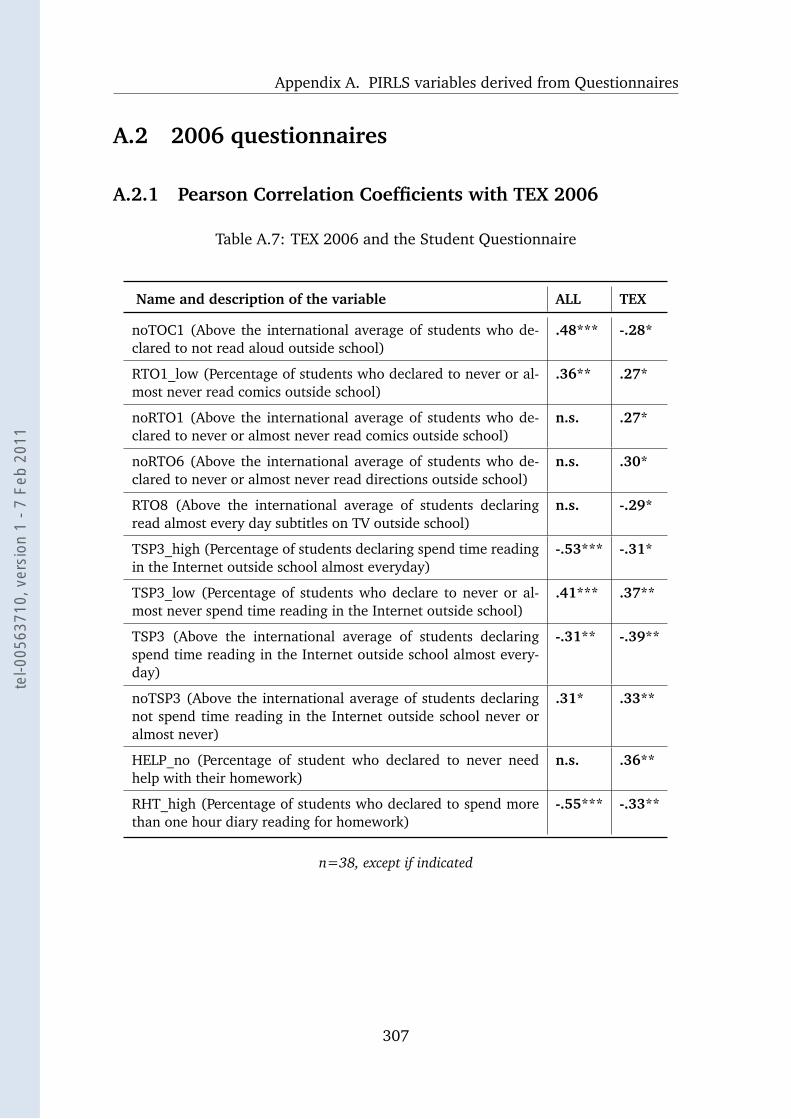
Appendix A. PIRLS variables derived from Questionnaires
A.2 2006 questionnaires
A.2.1 Pearson Correlation Coefficients with TEX 2006
Table A.7: TEX 2006 and the Student Questionnaire
Name and description of the variable ALL TEX
noTOC1 (Above the international average of students who de-clared to not read aloud outside school)
.48*** -.28*
RTO1_low (Percentage of students who declared to never or al-most never read comics outside school)
.36** .27*
noRTO1 (Above the international average of students who de-clared to never or almost never read comics outside school)
n.s. .27*
noRTO6 (Above the international average of students who de-clared to never or almost never read directions outside school)
n.s. .30*
RTO8 (Above the international average of students declaringread almost every day subtitles on TV outside school)
n.s. -.29*
TSP3_high (Percentage of students declaring spend time readingin the Internet outside school almost everyday)
-.53*** -.31*
TSP3_low (Percentage of students who declare to never or al-most never spend time reading in the Internet outside school)
.41*** .37**
TSP3 (Above the international average of students declaringspend time reading in the Internet outside school almost every-day)
-.31** -.39**
noTSP3 (Above the international average of students declaringnot spend time reading in the Internet outside school never oralmost never)
.31* .33**
HELP_no (Percentage of student who declared to never needhelp with their homework)
n.s. .36**
RHT_high (Percentage of students who declared to spend morethan one hour diary reading for homework)
-.55*** -.33**
n=38, except if indicated
307
tel-0
0563
710,
ver
sion
1 -
7 Fe
b 20
11
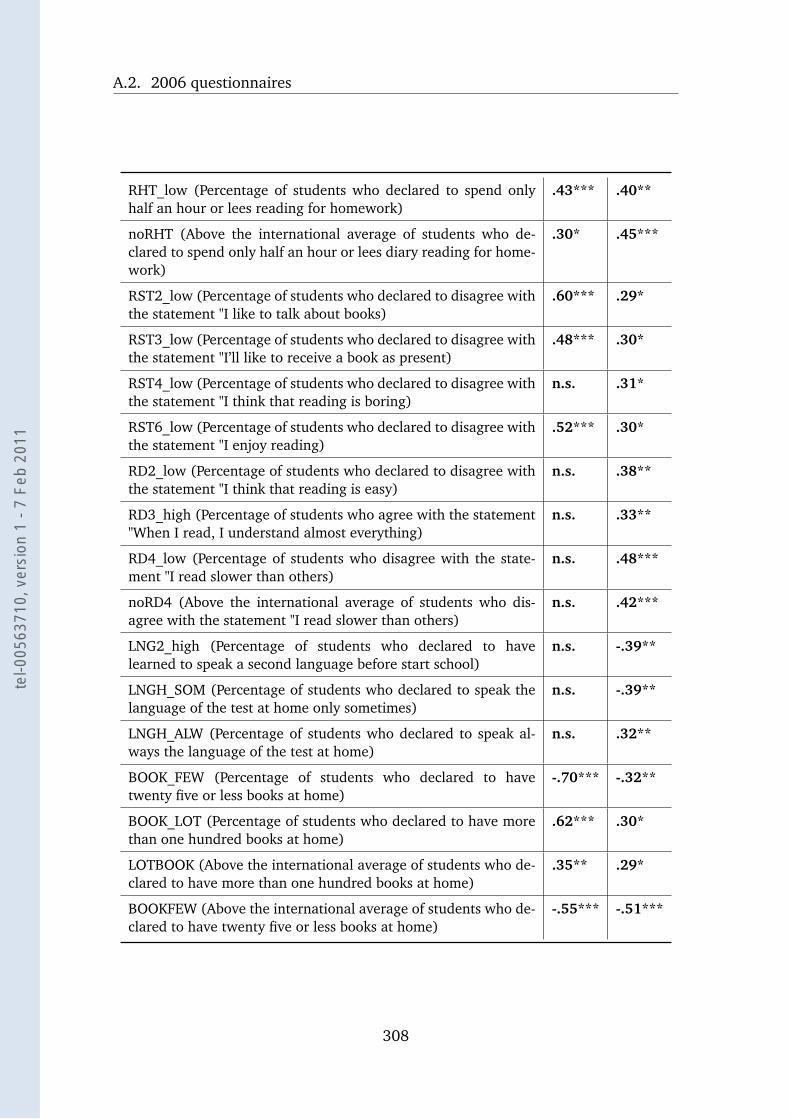
A.2. 2006 questionnaires
RHT_low (Percentage of students who declared to spend onlyhalf an hour or lees reading for homework)
.43*** .40**
noRHT (Above the international average of students who de-clared to spend only half an hour or lees diary reading for home-work)
.30* .45***
RST2_low (Percentage of students who declared to disagree withthe statement "I like to talk about books)
.60*** .29*
RST3_low (Percentage of students who declared to disagree withthe statement "I’ll like to receive a book as present)
.48*** .30*
RST4_low (Percentage of students who declared to disagree withthe statement "I think that reading is boring)
n.s. .31*
RST6_low (Percentage of students who declared to disagree withthe statement "I enjoy reading)
.52*** .30*
RD2_low (Percentage of students who declared to disagree withthe statement "I think that reading is easy)
n.s. .38**
RD3_high (Percentage of students who agree with the statement"When I read, I understand almost everything)
n.s. .33**
RD4_low (Percentage of students who disagree with the state-ment "I read slower than others)
n.s. .48***
noRD4 (Above the international average of students who dis-agree with the statement "I read slower than others)
n.s. .42***
LNG2_high (Percentage of students who declared to havelearned to speak a second language before start school)
n.s. -.39**
LNGH_SOM (Percentage of students who declared to speak thelanguage of the test at home only sometimes)
n.s. -.39**
LNGH_ALW (Percentage of students who declared to speak al-ways the language of the test at home)
n.s. .32**
BOOK_FEW (Percentage of students who declared to havetwenty five or less books at home)
-.70*** -.32**
BOOK_LOT (Percentage of students who declared to have morethan one hundred books at home)
.62*** .30*
LOTBOOK (Above the international average of students who de-clared to have more than one hundred books at home)
.35** .29*
BOOKFEW (Above the international average of students who de-clared to have twenty five or less books at home)
-.55*** -.51***
308
tel-0
0563
710,
ver
sion
1 -
7 Fe
b 20
11
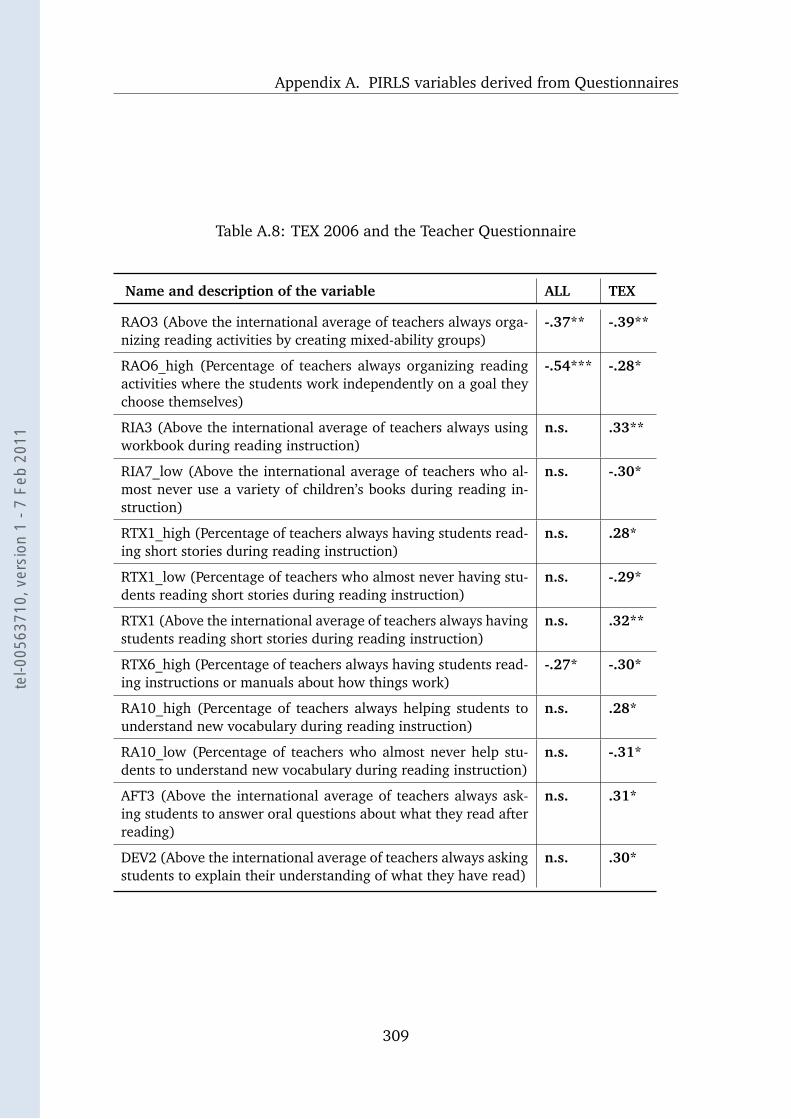
Appendix A. PIRLS variables derived from Questionnaires
Table A.8: TEX 2006 and the Teacher Questionnaire
Name and description of the variable ALL TEX
RAO3 (Above the international average of teachers always orga-nizing reading activities by creating mixed-ability groups)
-.37** -.39**
RAO6_high (Percentage of teachers always organizing readingactivities where the students work independently on a goal theychoose themselves)
-.54*** -.28*
RIA3 (Above the international average of teachers always usingworkbook during reading instruction)
n.s. .33**
RIA7_low (Above the international average of teachers who al-most never use a variety of children’s books during reading in-struction)
n.s. -.30*
RTX1_high (Percentage of teachers always having students read-ing short stories during reading instruction)
n.s. .28*
RTX1_low (Percentage of teachers who almost never having stu-dents reading short stories during reading instruction)
n.s. -.29*
RTX1 (Above the international average of teachers always havingstudents reading short stories during reading instruction)
n.s. .32**
RTX6_high (Percentage of teachers always having students read-ing instructions or manuals about how things work)
-.27* -.30*
RA10_high (Percentage of teachers always helping students tounderstand new vocabulary during reading instruction)
n.s. .28*
RA10_low (Percentage of teachers who almost never help stu-dents to understand new vocabulary during reading instruction)
n.s. -.31*
AFT3 (Above the international average of teachers always ask-ing students to answer oral questions about what they read afterreading)
n.s. .31*
DEV2 (Above the international average of teachers always askingstudents to explain their understanding of what they have read)
n.s. .30*
309
tel-0
0563
710,
ver
sion
1 -
7 Fe
b 20
11
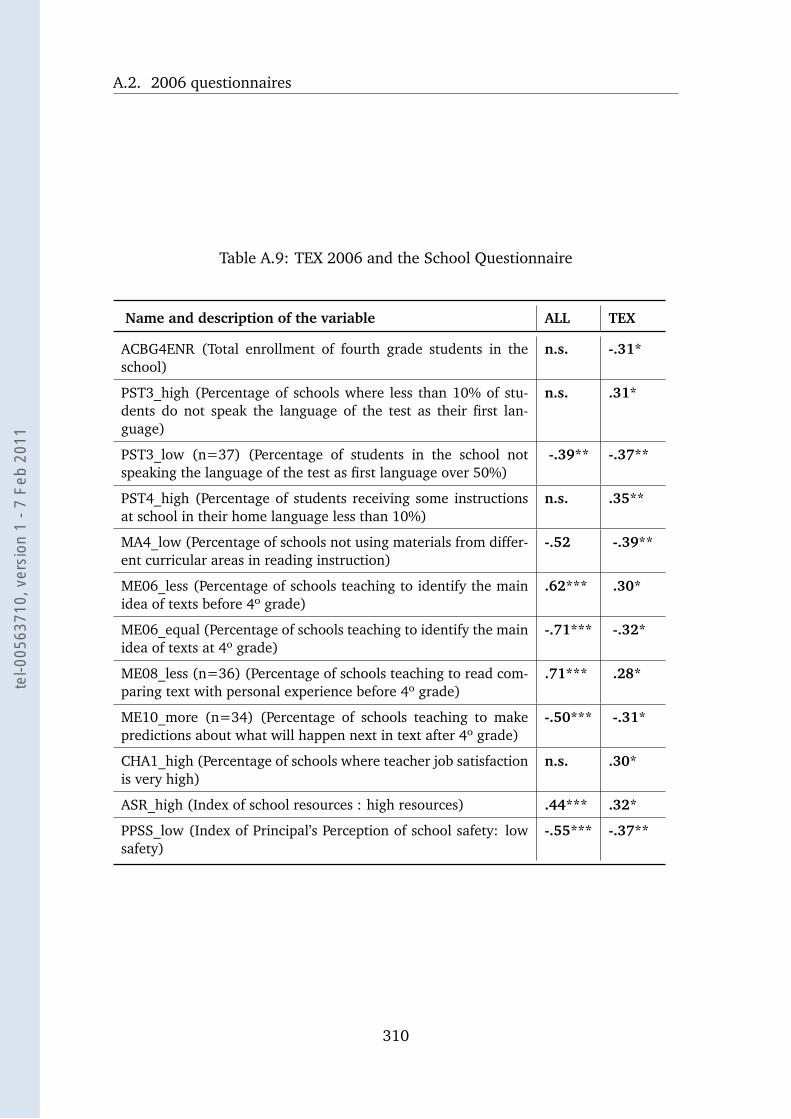
A.2. 2006 questionnaires
Table A.9: TEX 2006 and the School Questionnaire
Name and description of the variable ALL TEX
ACBG4ENR (Total enrollment of fourth grade students in theschool)
n.s. -.31*
PST3_high (Percentage of schools where less than 10% of stu-dents do not speak the language of the test as their first lan-guage)
n.s. .31*
PST3_low (n=37) (Percentage of students in the school notspeaking the language of the test as first language over 50%)
-.39** -.37**
PST4_high (Percentage of students receiving some instructionsat school in their home language less than 10%)
n.s. .35**
MA4_low (Percentage of schools not using materials from differ-ent curricular areas in reading instruction)
-.52 -.39**
ME06_less (Percentage of schools teaching to identify the mainidea of texts before 4º grade)
.62*** .30*
ME06_equal (Percentage of schools teaching to identify the mainidea of texts at 4º grade)
-.71*** -.32*
ME08_less (n=36) (Percentage of schools teaching to read com-paring text with personal experience before 4º grade)
.71*** .28*
ME10_more (n=34) (Percentage of schools teaching to makepredictions about what will happen next in text after 4º grade)
-.50*** -.31*
CHA1_high (Percentage of schools where teacher job satisfactionis very high)
n.s. .30*
ASR_high (Index of school resources : high resources) .44*** .32*
PPSS_low (Index of Principal’s Perception of school safety: lowsafety)
-.55*** -.37**
310
tel-0
0563
710,
ver
sion
1 -
7 Fe
b 20
11

Appendix A. PIRLS variables derived from Questionnaires
A.2.2 Pearson Correlation Coefficients with COM 2006
Table A.10: Com 2006 and the Student Questionnaire
Name and description of the variable ALL TEX
TOC1_low (Percentage of students who declared to never readaloud to someone at home)
.45*** .29*
TOC2_low (Percentage of students who declared to never listento someone at home reading them)
.68*** .34**
TOC4_low (Percentage of students who declared to never talkwith family about reading)
.53*** .35**
noTOC4 (Above the international average of students who de-clared to never talk with family about reading)
.28* .44***
TOC6_low (Percentage of students who declared to never readto find out things they want to learn at home)
.40** .28*
RTO1_high (Percentage of students who declared to read comicbooks at home)
-.33** .38**
RTO1_low (Percentage of students who declared to never readcomic books at home)
.36** -.28*
RTO1 (Above the international average of students who declaredto read comic books at home)
-.32** .29*
RTO3_low (Percentage of students who declared to never readbooks that explain things at home)
n.s. .41**
noRTO3 (Above the international average of students who de-clared to never read books that explain things at home)
n.s. .34**
RTO4_low (Percentage of students who declared to never readmagazines at home)
n.s. .33**
RTO6_low (Percentage of students who declared to never readdirections or instructions outside of school)
n.s. .48***
n=38, except if indicated
311
tel-0
0563
710,
ver
sion
1 -
7 Fe
b 20
11
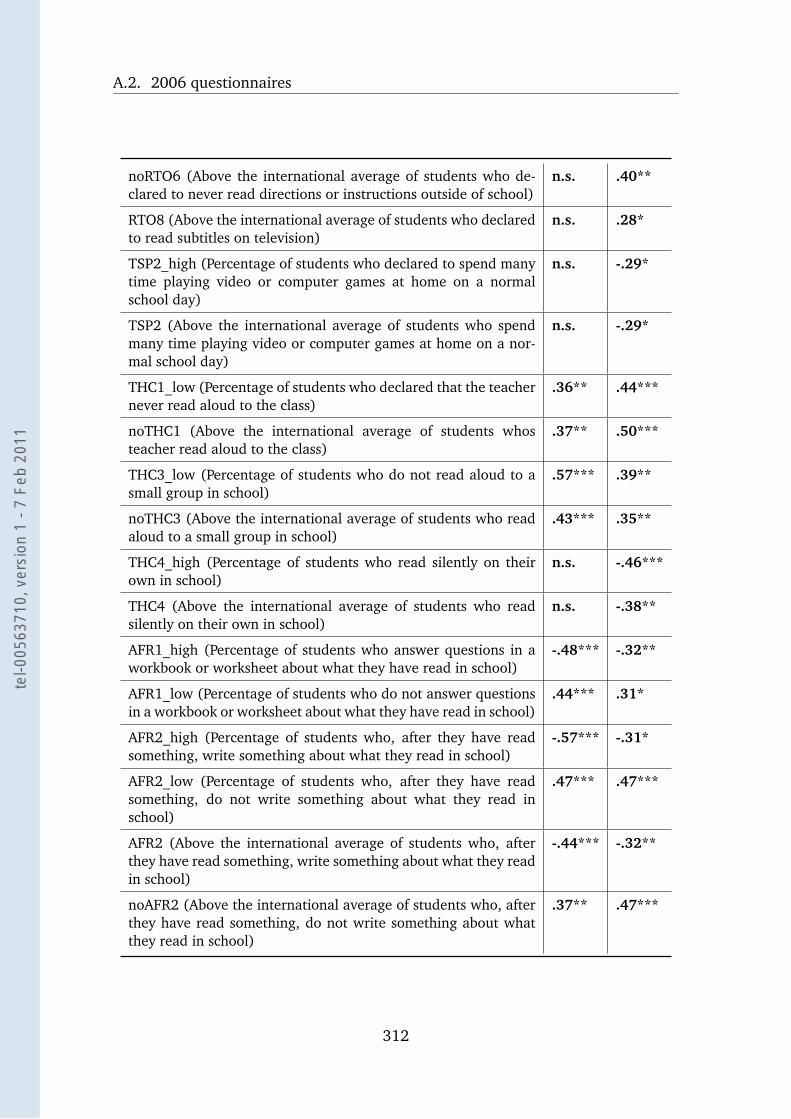
A.2. 2006 questionnaires
noRTO6 (Above the international average of students who de-clared to never read directions or instructions outside of school)
n.s. .40**
RTO8 (Above the international average of students who declaredto read subtitles on television)
n.s. .28*
TSP2_high (Percentage of students who declared to spend manytime playing video or computer games at home on a normalschool day)
n.s. -.29*
TSP2 (Above the international average of students who spendmany time playing video or computer games at home on a nor-mal school day)
n.s. -.29*
THC1_low (Percentage of students who declared that the teachernever read aloud to the class)
.36** .44***
noTHC1 (Above the international average of students whosteacher read aloud to the class)
.37** .50***
THC3_low (Percentage of students who do not read aloud to asmall group in school)
.57*** .39**
noTHC3 (Above the international average of students who readaloud to a small group in school)
.43*** .35**
THC4_high (Percentage of students who read silently on theirown in school)
n.s. -.46***
THC4 (Above the international average of students who readsilently on their own in school)
n.s. -.38**
AFR1_high (Percentage of students who answer questions in aworkbook or worksheet about what they have read in school)
-.48*** -.32**
AFR1_low (Percentage of students who do not answer questionsin a workbook or worksheet about what they have read in school)
.44*** .31*
AFR2_high (Percentage of students who, after they have readsomething, write something about what they read in school)
-.57*** -.31*
AFR2_low (Percentage of students who, after they have readsomething, do not write something about what they read inschool)
.47*** .47***
AFR2 (Above the international average of students who, afterthey have read something, write something about what they readin school)
-.44*** -.32**
noAFR2 (Above the international average of students who, afterthey have read something, do not write something about whatthey read in school)
.37** .47***
312
tel-0
0563
710,
ver
sion
1 -
7 Fe
b 20
11
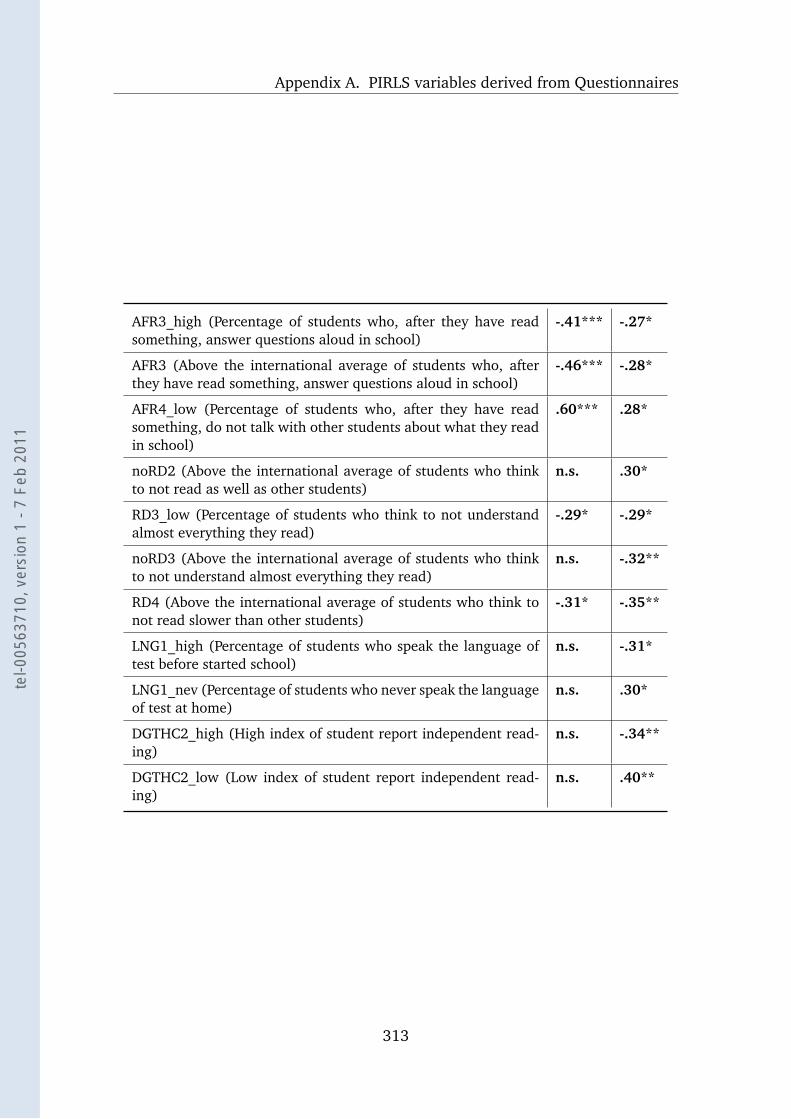
Appendix A. PIRLS variables derived from Questionnaires
AFR3_high (Percentage of students who, after they have readsomething, answer questions aloud in school)
-.41*** -.27*
AFR3 (Above the international average of students who, afterthey have read something, answer questions aloud in school)
-.46*** -.28*
AFR4_low (Percentage of students who, after they have readsomething, do not talk with other students about what they readin school)
.60*** .28*
noRD2 (Above the international average of students who thinkto not read as well as other students)
n.s. .30*
RD3_low (Percentage of students who think to not understandalmost everything they read)
-.29* -.29*
noRD3 (Above the international average of students who thinkto not understand almost everything they read)
n.s. -.32**
RD4 (Above the international average of students who think tonot read slower than other students)
-.31* -.35**
LNG1_high (Percentage of students who speak the language oftest before started school)
n.s. -.31*
LNG1_nev (Percentage of students who never speak the languageof test at home)
n.s. .30*
DGTHC2_high (High index of student report independent read-ing)
n.s. -.34**
DGTHC2_low (Low index of student report independent read-ing)
n.s. .40**
313
tel-0
0563
710,
ver
sion
1 -
7 Fe
b 20
11
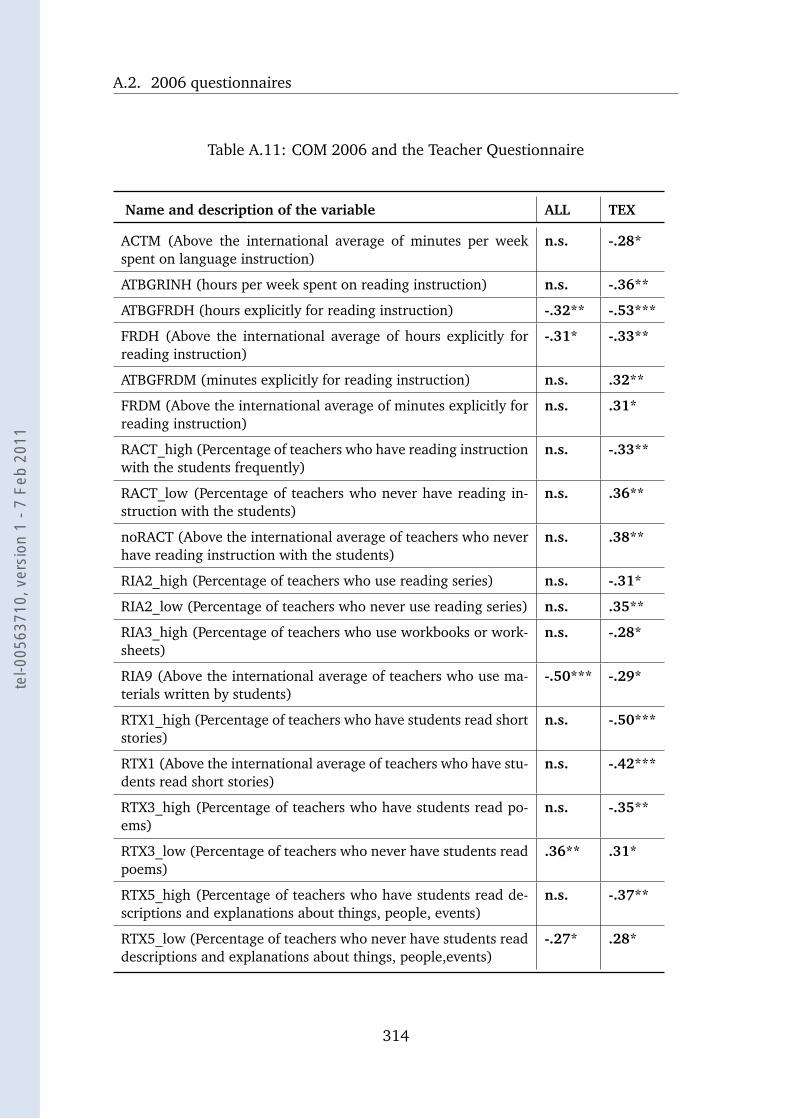
A.2. 2006 questionnaires
Table A.11: COM 2006 and the Teacher Questionnaire
Name and description of the variable ALL TEX
ACTM (Above the international average of minutes per weekspent on language instruction)
n.s. -.28*
ATBGRINH (hours per week spent on reading instruction) n.s. -.36**
ATBGFRDH (hours explicitly for reading instruction) -.32** -.53***
FRDH (Above the international average of hours explicitly forreading instruction)
-.31* -.33**
ATBGFRDM (minutes explicitly for reading instruction) n.s. .32**
FRDM (Above the international average of minutes explicitly forreading instruction)
n.s. .31*
RACT_high (Percentage of teachers who have reading instructionwith the students frequently)
n.s. -.33**
RACT_low (Percentage of teachers who never have reading in-struction with the students)
n.s. .36**
noRACT (Above the international average of teachers who neverhave reading instruction with the students)
n.s. .38**
RIA2_high (Percentage of teachers who use reading series) n.s. -.31*
RIA2_low (Percentage of teachers who never use reading series) n.s. .35**
RIA3_high (Percentage of teachers who use workbooks or work-sheets)
n.s. -.28*
RIA9 (Above the international average of teachers who use ma-terials written by students)
-.50*** -.29*
RTX1_high (Percentage of teachers who have students read shortstories)
n.s. -.50***
RTX1 (Above the international average of teachers who have stu-dents read short stories)
n.s. -.42***
RTX3_high (Percentage of teachers who have students read po-ems)
n.s. -.35**
RTX3_low (Percentage of teachers who never have students readpoems)
.36** .31*
RTX5_high (Percentage of teachers who have students read de-scriptions and explanations about things, people, events)
n.s. -.37**
RTX5_low (Percentage of teachers who never have students readdescriptions and explanations about things, people,events)
-.27* .28*
314
tel-0
0563
710,
ver
sion
1 -
7 Fe
b 20
11
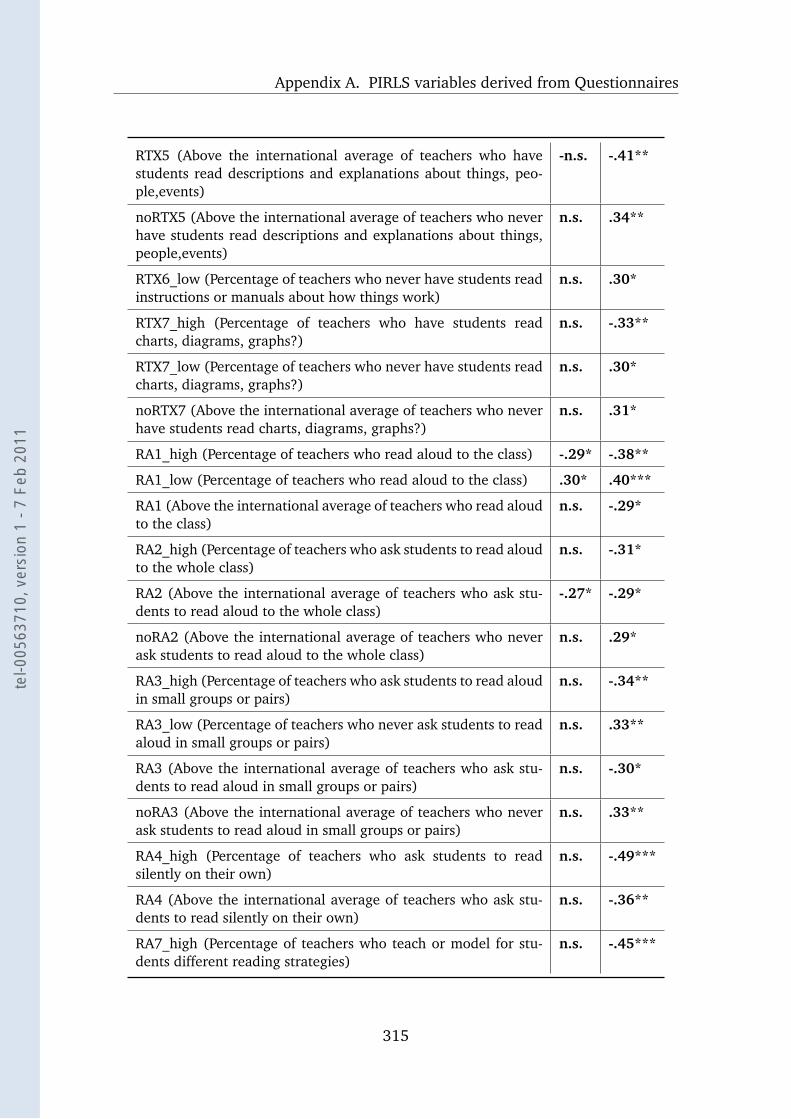
Appendix A. PIRLS variables derived from Questionnaires
RTX5 (Above the international average of teachers who havestudents read descriptions and explanations about things, peo-ple,events)
-n.s. -.41**
noRTX5 (Above the international average of teachers who neverhave students read descriptions and explanations about things,people,events)
n.s. .34**
RTX6_low (Percentage of teachers who never have students readinstructions or manuals about how things work)
n.s. .30*
RTX7_high (Percentage of teachers who have students readcharts, diagrams, graphs?)
n.s. -.33**
RTX7_low (Percentage of teachers who never have students readcharts, diagrams, graphs?)
n.s. .30*
noRTX7 (Above the international average of teachers who neverhave students read charts, diagrams, graphs?)
n.s. .31*
RA1_high (Percentage of teachers who read aloud to the class) -.29* -.38**
RA1_low (Percentage of teachers who read aloud to the class) .30* .40***
RA1 (Above the international average of teachers who read aloudto the class)
n.s. -.29*
RA2_high (Percentage of teachers who ask students to read aloudto the whole class)
n.s. -.31*
RA2 (Above the international average of teachers who ask stu-dents to read aloud to the whole class)
-.27* -.29*
noRA2 (Above the international average of teachers who neverask students to read aloud to the whole class)
n.s. .29*
RA3_high (Percentage of teachers who ask students to read aloudin small groups or pairs)
n.s. -.34**
RA3_low (Percentage of teachers who never ask students to readaloud in small groups or pairs)
n.s. .33**
RA3 (Above the international average of teachers who ask stu-dents to read aloud in small groups or pairs)
n.s. -.30*
noRA3 (Above the international average of teachers who neverask students to read aloud in small groups or pairs)
n.s. .33**
RA4_high (Percentage of teachers who ask students to readsilently on their own)
n.s. -.49***
RA4 (Above the international average of teachers who ask stu-dents to read silently on their own)
n.s. -.36**
RA7_high (Percentage of teachers who teach or model for stu-dents different reading strategies)
n.s. -.45***
315
tel-0
0563
710,
ver
sion
1 -
7 Fe
b 20
11
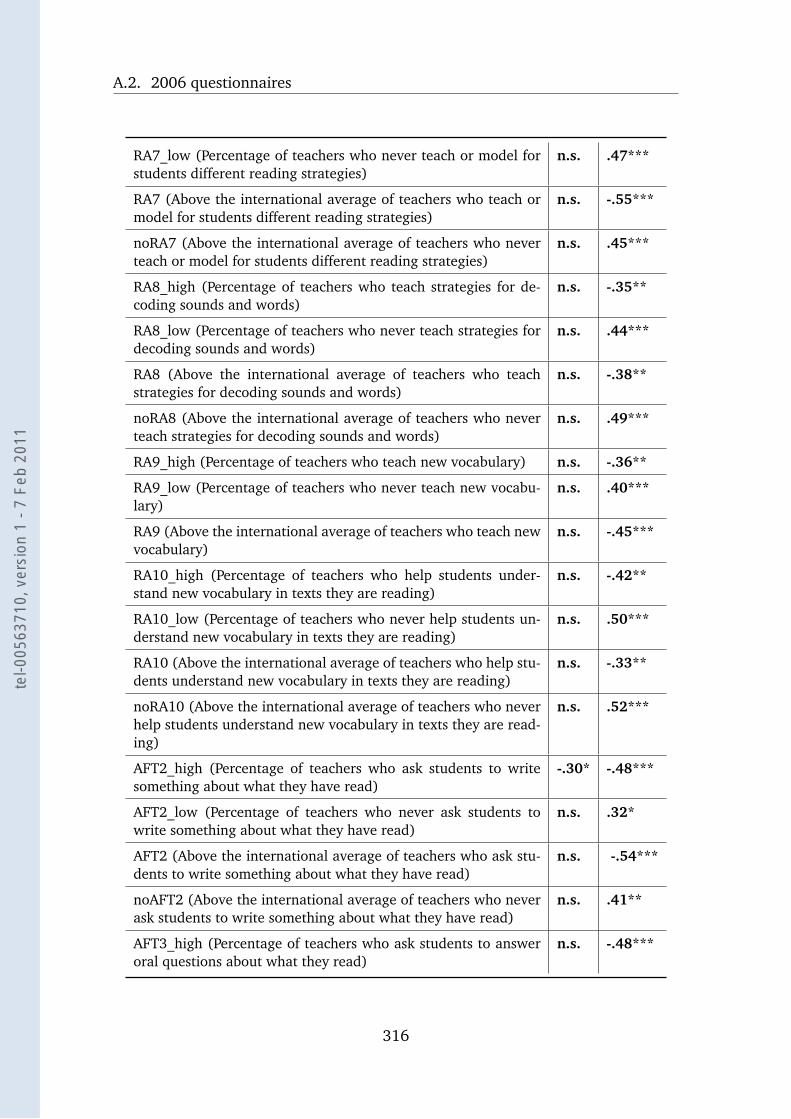
A.2. 2006 questionnaires
RA7_low (Percentage of teachers who never teach or model forstudents different reading strategies)
n.s. .47***
RA7 (Above the international average of teachers who teach ormodel for students different reading strategies)
n.s. -.55***
noRA7 (Above the international average of teachers who neverteach or model for students different reading strategies)
n.s. .45***
RA8_high (Percentage of teachers who teach strategies for de-coding sounds and words)
n.s. -.35**
RA8_low (Percentage of teachers who never teach strategies fordecoding sounds and words)
n.s. .44***
RA8 (Above the international average of teachers who teachstrategies for decoding sounds and words)
n.s. -.38**
noRA8 (Above the international average of teachers who neverteach strategies for decoding sounds and words)
n.s. .49***
RA9_high (Percentage of teachers who teach new vocabulary) n.s. -.36**
RA9_low (Percentage of teachers who never teach new vocabu-lary)
n.s. .40***
RA9 (Above the international average of teachers who teach newvocabulary)
n.s. -.45***
RA10_high (Percentage of teachers who help students under-stand new vocabulary in texts they are reading)
n.s. -.42**
RA10_low (Percentage of teachers who never help students un-derstand new vocabulary in texts they are reading)
n.s. .50***
RA10 (Above the international average of teachers who help stu-dents understand new vocabulary in texts they are reading)
n.s. -.33**
noRA10 (Above the international average of teachers who neverhelp students understand new vocabulary in texts they are read-ing)
n.s. .52***
AFT2_high (Percentage of teachers who ask students to writesomething about what they have read)
-.30* -.48***
AFT2_low (Percentage of teachers who never ask students towrite something about what they have read)
n.s. .32*
AFT2 (Above the international average of teachers who ask stu-dents to write something about what they have read)
n.s. -.54***
noAFT2 (Above the international average of teachers who neverask students to write something about what they have read)
n.s. .41**
AFT3_high (Percentage of teachers who ask students to answeroral questions about what they read)
n.s. -.48***
316
tel-0
0563
710,
ver
sion
1 -
7 Fe
b 20
11
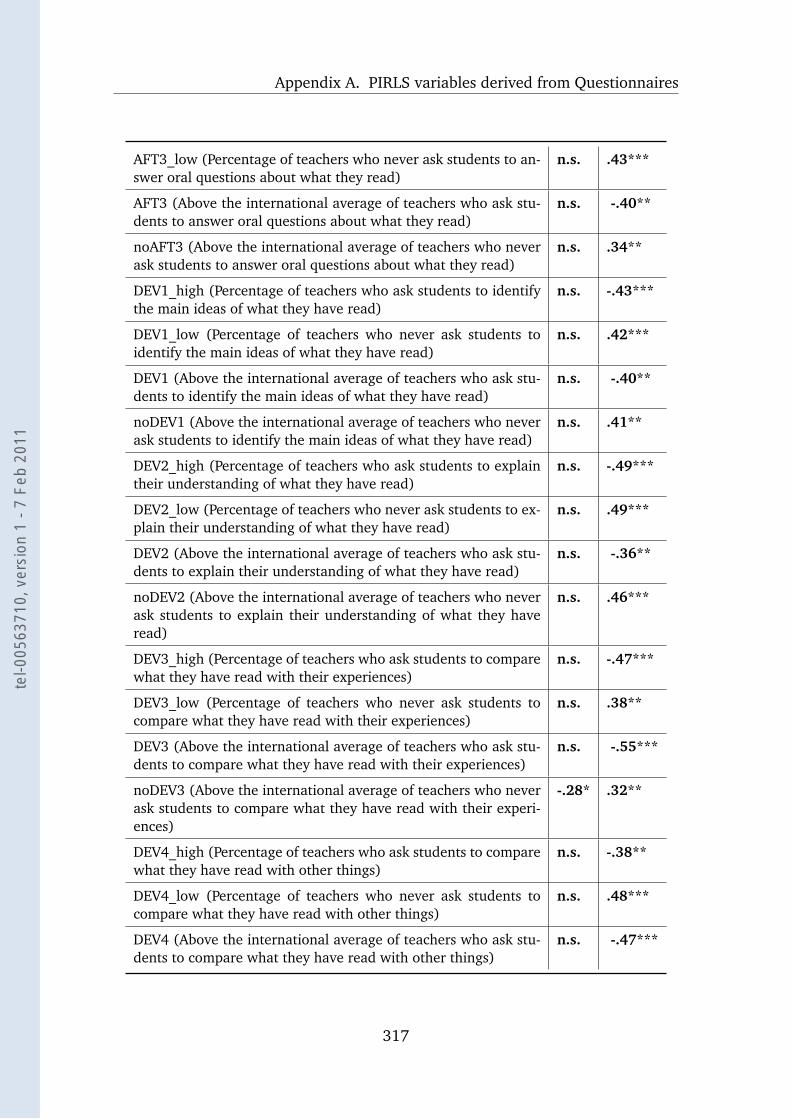
Appendix A. PIRLS variables derived from Questionnaires
AFT3_low (Percentage of teachers who never ask students to an-swer oral questions about what they read)
n.s. .43***
AFT3 (Above the international average of teachers who ask stu-dents to answer oral questions about what they read)
n.s. -.40**
noAFT3 (Above the international average of teachers who neverask students to answer oral questions about what they read)
n.s. .34**
DEV1_high (Percentage of teachers who ask students to identifythe main ideas of what they have read)
n.s. -.43***
DEV1_low (Percentage of teachers who never ask students toidentify the main ideas of what they have read)
n.s. .42***
DEV1 (Above the international average of teachers who ask stu-dents to identify the main ideas of what they have read)
n.s. -.40**
noDEV1 (Above the international average of teachers who neverask students to identify the main ideas of what they have read)
n.s. .41**
DEV2_high (Percentage of teachers who ask students to explaintheir understanding of what they have read)
n.s. -.49***
DEV2_low (Percentage of teachers who never ask students to ex-plain their understanding of what they have read)
n.s. .49***
DEV2 (Above the international average of teachers who ask stu-dents to explain their understanding of what they have read)
n.s. -.36**
noDEV2 (Above the international average of teachers who neverask students to explain their understanding of what they haveread)
n.s. .46***
DEV3_high (Percentage of teachers who ask students to comparewhat they have read with their experiences)
n.s. -.47***
DEV3_low (Percentage of teachers who never ask students tocompare what they have read with their experiences)
n.s. .38**
DEV3 (Above the international average of teachers who ask stu-dents to compare what they have read with their experiences)
n.s. -.55***
noDEV3 (Above the international average of teachers who neverask students to compare what they have read with their experi-ences)
-.28* .32**
DEV4_high (Percentage of teachers who ask students to comparewhat they have read with other things)
n.s. -.38**
DEV4_low (Percentage of teachers who never ask students tocompare what they have read with other things)
n.s. .48***
DEV4 (Above the international average of teachers who ask stu-dents to compare what they have read with other things)
n.s. -.47***
317
tel-0
0563
710,
ver
sion
1 -
7 Fe
b 20
11
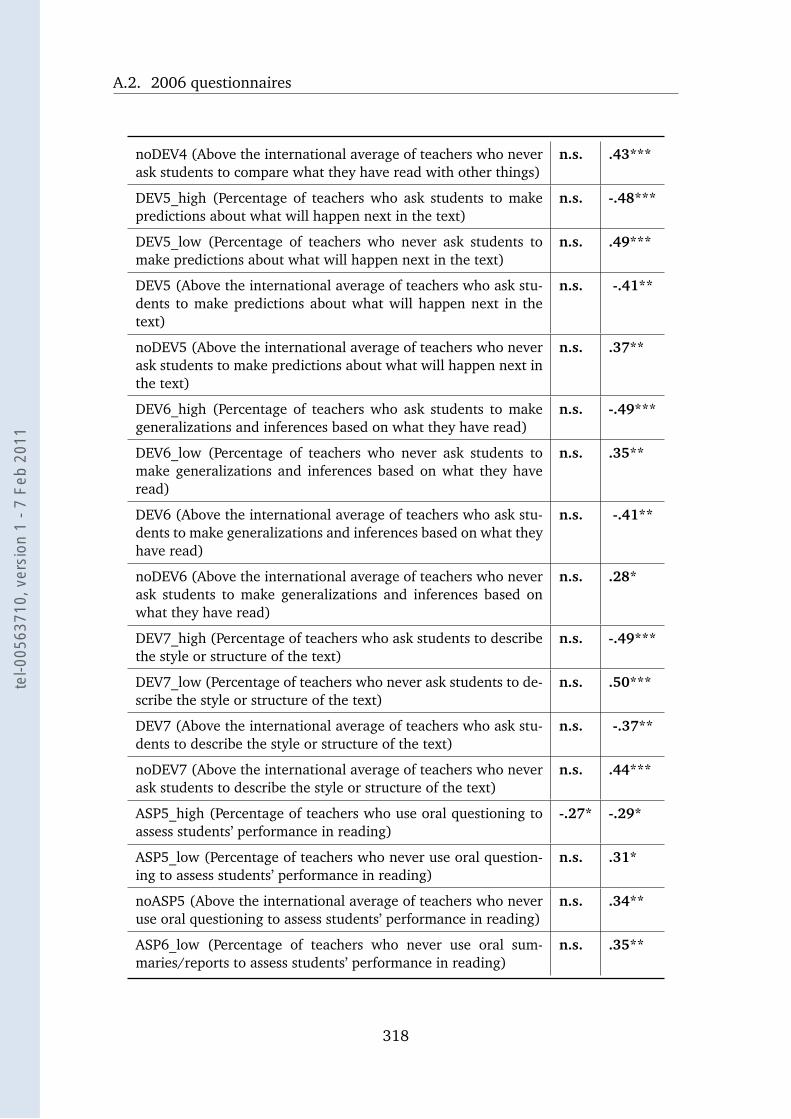
A.2. 2006 questionnaires
noDEV4 (Above the international average of teachers who neverask students to compare what they have read with other things)
n.s. .43***
DEV5_high (Percentage of teachers who ask students to makepredictions about what will happen next in the text)
n.s. -.48***
DEV5_low (Percentage of teachers who never ask students tomake predictions about what will happen next in the text)
n.s. .49***
DEV5 (Above the international average of teachers who ask stu-dents to make predictions about what will happen next in thetext)
n.s. -.41**
noDEV5 (Above the international average of teachers who neverask students to make predictions about what will happen next inthe text)
n.s. .37**
DEV6_high (Percentage of teachers who ask students to makegeneralizations and inferences based on what they have read)
n.s. -.49***
DEV6_low (Percentage of teachers who never ask students tomake generalizations and inferences based on what they haveread)
n.s. .35**
DEV6 (Above the international average of teachers who ask stu-dents to make generalizations and inferences based on what theyhave read)
n.s. -.41**
noDEV6 (Above the international average of teachers who neverask students to make generalizations and inferences based onwhat they have read)
n.s. .28*
DEV7_high (Percentage of teachers who ask students to describethe style or structure of the text)
n.s. -.49***
DEV7_low (Percentage of teachers who never ask students to de-scribe the style or structure of the text)
n.s. .50***
DEV7 (Above the international average of teachers who ask stu-dents to describe the style or structure of the text)
n.s. -.37**
noDEV7 (Above the international average of teachers who neverask students to describe the style or structure of the text)
n.s. .44***
ASP5_high (Percentage of teachers who use oral questioning toassess students’ performance in reading)
-.27* -.29*
ASP5_low (Percentage of teachers who never use oral question-ing to assess students’ performance in reading)
n.s. .31*
noASP5 (Above the international average of teachers who neveruse oral questioning to assess students’ performance in reading)
n.s. .34**
ASP6_low (Percentage of teachers who never use oral sum-maries/reports to assess students’ performance in reading)
n.s. .35**
318
tel-0
0563
710,
ver
sion
1 -
7 Fe
b 20
11
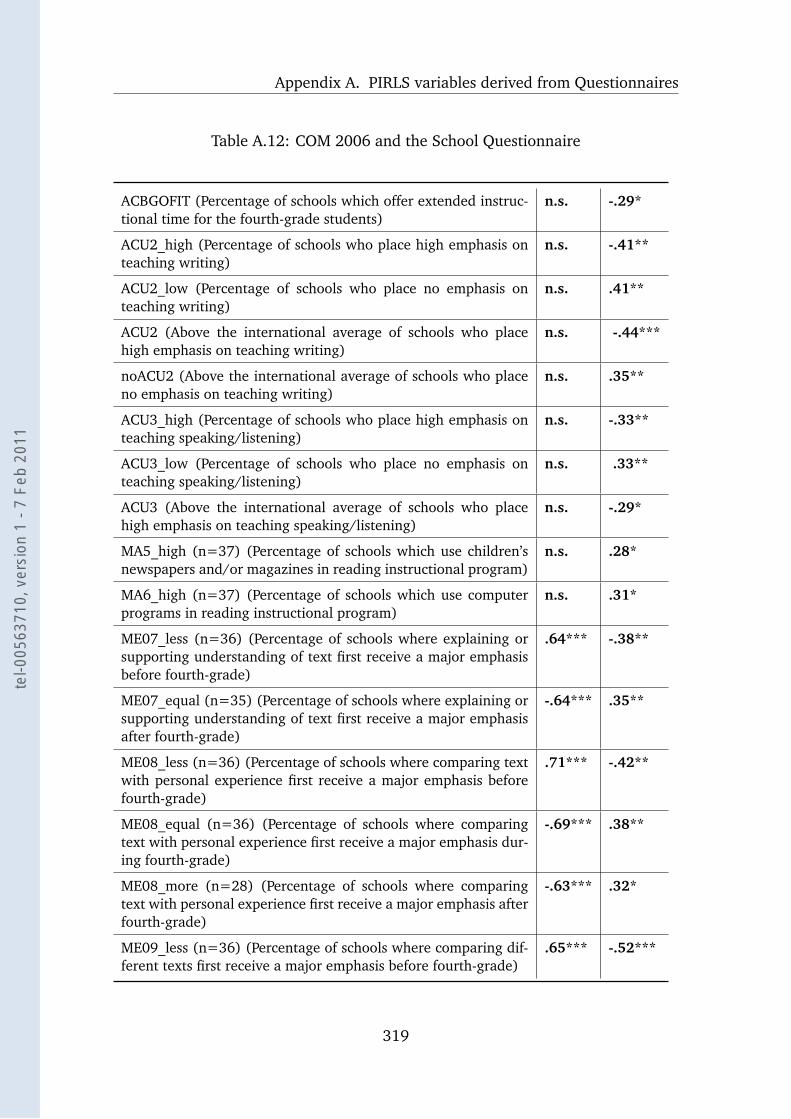
Appendix A. PIRLS variables derived from Questionnaires
Table A.12: COM 2006 and the School Questionnaire
ACBGOFIT (Percentage of schools which offer extended instruc-tional time for the fourth-grade students)
n.s. -.29*
ACU2_high (Percentage of schools who place high emphasis onteaching writing)
n.s. -.41**
ACU2_low (Percentage of schools who place no emphasis onteaching writing)
n.s. .41**
ACU2 (Above the international average of schools who placehigh emphasis on teaching writing)
n.s. -.44***
noACU2 (Above the international average of schools who placeno emphasis on teaching writing)
n.s. .35**
ACU3_high (Percentage of schools who place high emphasis onteaching speaking/listening)
n.s. -.33**
ACU3_low (Percentage of schools who place no emphasis onteaching speaking/listening)
n.s. .33**
ACU3 (Above the international average of schools who placehigh emphasis on teaching speaking/listening)
n.s. -.29*
MA5_high (n=37) (Percentage of schools which use children’snewspapers and/or magazines in reading instructional program)
n.s. .28*
MA6_high (n=37) (Percentage of schools which use computerprograms in reading instructional program)
n.s. .31*
ME07_less (n=36) (Percentage of schools where explaining orsupporting understanding of text first receive a major emphasisbefore fourth-grade)
.64*** -.38**
ME07_equal (n=35) (Percentage of schools where explaining orsupporting understanding of text first receive a major emphasisafter fourth-grade)
-.64*** .35**
ME08_less (n=36) (Percentage of schools where comparing textwith personal experience first receive a major emphasis beforefourth-grade)
.71*** -.42**
ME08_equal (n=36) (Percentage of schools where comparingtext with personal experience first receive a major emphasis dur-ing fourth-grade)
-.69*** .38**
ME08_more (n=28) (Percentage of schools where comparingtext with personal experience first receive a major emphasis afterfourth-grade)
-.63*** .32*
ME09_less (n=36) (Percentage of schools where comparing dif-ferent texts first receive a major emphasis before fourth-grade)
.65*** -.52***
319
tel-0
0563
710,
ver
sion
1 -
7 Fe
b 20
11
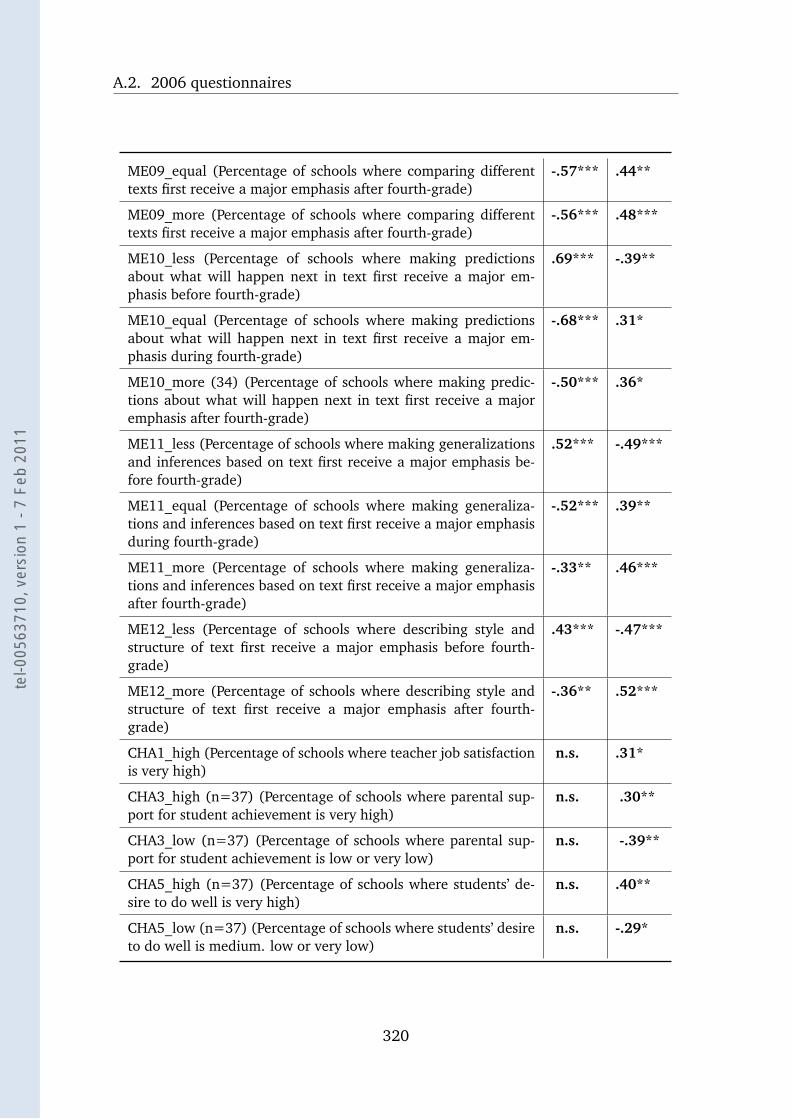
A.2. 2006 questionnaires
ME09_equal (Percentage of schools where comparing differenttexts first receive a major emphasis after fourth-grade)
-.57*** .44**
ME09_more (Percentage of schools where comparing differenttexts first receive a major emphasis after fourth-grade)
-.56*** .48***
ME10_less (Percentage of schools where making predictionsabout what will happen next in text first receive a major em-phasis before fourth-grade)
.69*** -.39**
ME10_equal (Percentage of schools where making predictionsabout what will happen next in text first receive a major em-phasis during fourth-grade)
-.68*** .31*
ME10_more (34) (Percentage of schools where making predic-tions about what will happen next in text first receive a majoremphasis after fourth-grade)
-.50*** .36*
ME11_less (Percentage of schools where making generalizationsand inferences based on text first receive a major emphasis be-fore fourth-grade)
.52*** -.49***
ME11_equal (Percentage of schools where making generaliza-tions and inferences based on text first receive a major emphasisduring fourth-grade)
-.52*** .39**
ME11_more (Percentage of schools where making generaliza-tions and inferences based on text first receive a major emphasisafter fourth-grade)
-.33** .46***
ME12_less (Percentage of schools where describing style andstructure of text first receive a major emphasis before fourth-grade)
.43*** -.47***
ME12_more (Percentage of schools where describing style andstructure of text first receive a major emphasis after fourth-grade)
-.36** .52***
CHA1_high (Percentage of schools where teacher job satisfactionis very high)
n.s. .31*
CHA3_high (n=37) (Percentage of schools where parental sup-port for student achievement is very high)
n.s. .30**
CHA3_low (n=37) (Percentage of schools where parental sup-port for student achievement is low or very low)
n.s. -.39**
CHA5_high (n=37) (Percentage of schools where students’ de-sire to do well is very high)
n.s. .40**
CHA5_low (n=37) (Percentage of schools where students’ desireto do well is medium. low or very low)
n.s. -.29*
320
tel-0
0563
710,
ver
sion
1 -
7 Fe
b 20
11
Appendix B
Hierarchical models for partialscores
321
tel-0
0563
710,
ver
sion
1 -
7 Fe
b 20
11

B.1. 2001 models
B.1 2001 models
B.1.1 PIRLS 2001 literary score
Fixed Effects
Variable Model 1 Model 2 Model 3 Model 4 Model 5
Intercept 545*** 1.9 540*** 1.7 528*** 0.7 522*** 0.9 534 2.0
Home Factors
Books at home 10.7*** 0.2 10.5*** 0.3
Resources 8.1*** 0.3 8.2*** 0.3
Oral social -12.0*** 0.3 -11.8*** 0.3
Inform. read -3.8*** 0.2 -3.4*** 0.3
Attitudes 21.8*** 0.2 21.7*** 0.2
School Factors
Var. Evaluation -6.4*** 1.1 -2.2** 1.0
Expect. wishes 9.9*** 0.9 4.4*** 0.8
Emph. Strateg. 3.7*** 0.6 3.2*** 0.6
Var. Instruction n.s. n.s.
Early lear skills 7.7*** 1.0 5.7*** 0.8
Variety of books 9.9*** 0.9 4.5*** 0.8
ref= Very opaq.
Shallow lang. -24.8*** 2.0 n.s.
Opaque lang. -20.6*** 2.4 n.s.
ref= Anglo
Others -38.3*** 2.4 -17.8*** 3.6
Germanic -11.1*** 2.6 n.s.
Latin -30.7*** 2.6 -8.9*** 4.2
Slavic -25.1*** 2.5 n.s.
Variance components
Between school(Level 2)
2,500 57.8 2,580 59.4 1,718 41.7 2,364 63.5 1,503 42.6
Prop. Explain 0.07 0.04 0.36 0.12 0.44
ICC 0.41 0.42 0.37 0.40 0.35
Within school(Level 1)
3,631 15.7 3,632 15.7 2,875 14.0 3,520 17.7 2,790 15.6
Prop. Explain 0.00 0.00 0.21 0.03 0.23
-2LogL 1,239,335 1,239,492 975,515 918,654 730,386
∆ (1371292) 311 154 264,131 79% 320,992 74% 509,260 59%
* = p < .10, ** = p < .05, *** = p < .01; standard error is indicated along with the parameters
322
tel-0
0563
710,
ver
sion
1 -
7 Fe
b 20
11
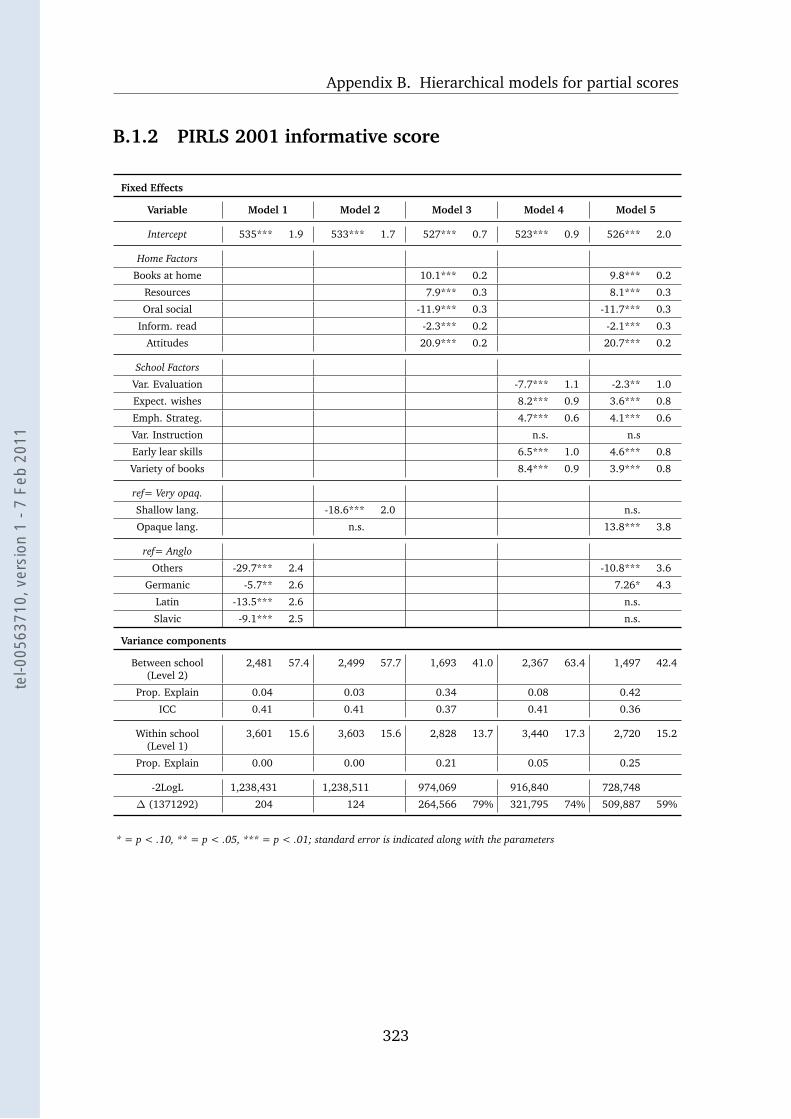
Appendix B. Hierarchical models for partial scores
B.1.2 PIRLS 2001 informative score
Fixed Effects
Variable Model 1 Model 2 Model 3 Model 4 Model 5
Intercept 535*** 1.9 533*** 1.7 527*** 0.7 523*** 0.9 526*** 2.0
Home Factors
Books at home 10.1*** 0.2 9.8*** 0.2
Resources 7.9*** 0.3 8.1*** 0.3
Oral social -11.9*** 0.3 -11.7*** 0.3
Inform. read -2.3*** 0.2 -2.1*** 0.3
Attitudes 20.9*** 0.2 20.7*** 0.2
School Factors
Var. Evaluation -7.7*** 1.1 -2.3** 1.0
Expect. wishes 8.2*** 0.9 3.6*** 0.8
Emph. Strateg. 4.7*** 0.6 4.1*** 0.6
Var. Instruction n.s. n.s
Early lear skills 6.5*** 1.0 4.6*** 0.8
Variety of books 8.4*** 0.9 3.9*** 0.8
ref= Very opaq.
Shallow lang. -18.6*** 2.0 n.s.
Opaque lang. n.s. 13.8*** 3.8
ref= Anglo
Others -29.7*** 2.4 -10.8*** 3.6
Germanic -5.7** 2.6 7.26* 4.3
Latin -13.5*** 2.6 n.s.
Slavic -9.1*** 2.5 n.s.
Variance components
Between school(Level 2)
2,481 57.4 2,499 57.7 1,693 41.0 2,367 63.4 1,497 42.4
Prop. Explain 0.04 0.03 0.34 0.08 0.42
ICC 0.41 0.41 0.37 0.41 0.36
Within school(Level 1)
3,601 15.6 3,603 15.6 2,828 13.7 3,440 17.3 2,720 15.2
Prop. Explain 0.00 0.00 0.21 0.05 0.25
-2LogL 1,238,431 1,238,511 974,069 916,840 728,748
∆ (1371292) 204 124 264,566 79% 321,795 74% 509,887 59%
* = p < .10, ** = p < .05, *** = p < .01; standard error is indicated along with the parameters
323
tel-0
0563
710,
ver
sion
1 -
7 Fe
b 20
11
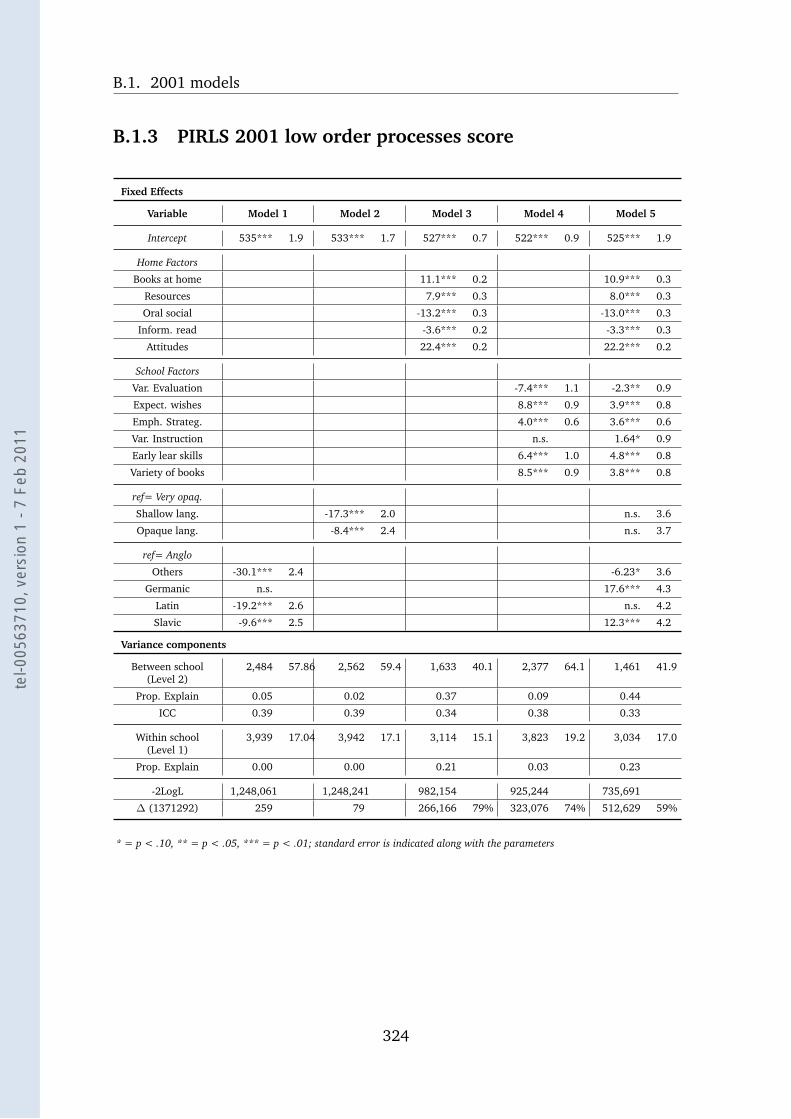
B.1. 2001 models
B.1.3 PIRLS 2001 low order processes score
Fixed Effects
Variable Model 1 Model 2 Model 3 Model 4 Model 5
Intercept 535*** 1.9 533*** 1.7 527*** 0.7 522*** 0.9 525*** 1.9
Home Factors
Books at home 11.1*** 0.2 10.9*** 0.3
Resources 7.9*** 0.3 8.0*** 0.3
Oral social -13.2*** 0.3 -13.0*** 0.3
Inform. read -3.6*** 0.2 -3.3*** 0.3
Attitudes 22.4*** 0.2 22.2*** 0.2
School Factors
Var. Evaluation -7.4*** 1.1 -2.3** 0.9
Expect. wishes 8.8*** 0.9 3.9*** 0.8
Emph. Strateg. 4.0*** 0.6 3.6*** 0.6
Var. Instruction n.s. 1.64* 0.9
Early lear skills 6.4*** 1.0 4.8*** 0.8
Variety of books 8.5*** 0.9 3.8*** 0.8
ref= Very opaq.
Shallow lang. -17.3*** 2.0 n.s. 3.6
Opaque lang. -8.4*** 2.4 n.s. 3.7
ref= Anglo
Others -30.1*** 2.4 -6.23* 3.6
Germanic n.s. 17.6*** 4.3
Latin -19.2*** 2.6 n.s. 4.2
Slavic -9.6*** 2.5 12.3*** 4.2
Variance components
Between school(Level 2)
2,484 57.86 2,562 59.4 1,633 40.1 2,377 64.1 1,461 41.9
Prop. Explain 0.05 0.02 0.37 0.09 0.44
ICC 0.39 0.39 0.34 0.38 0.33
Within school(Level 1)
3,939 17.04 3,942 17.1 3,114 15.1 3,823 19.2 3,034 17.0
Prop. Explain 0.00 0.00 0.21 0.03 0.23
-2LogL 1,248,061 1,248,241 982,154 925,244 735,691
∆ (1371292) 259 79 266,166 79% 323,076 74% 512,629 59%
* = p < .10, ** = p < .05, *** = p < .01; standard error is indicated along with the parameters
324
tel-0
0563
710,
ver
sion
1 -
7 Fe
b 20
11
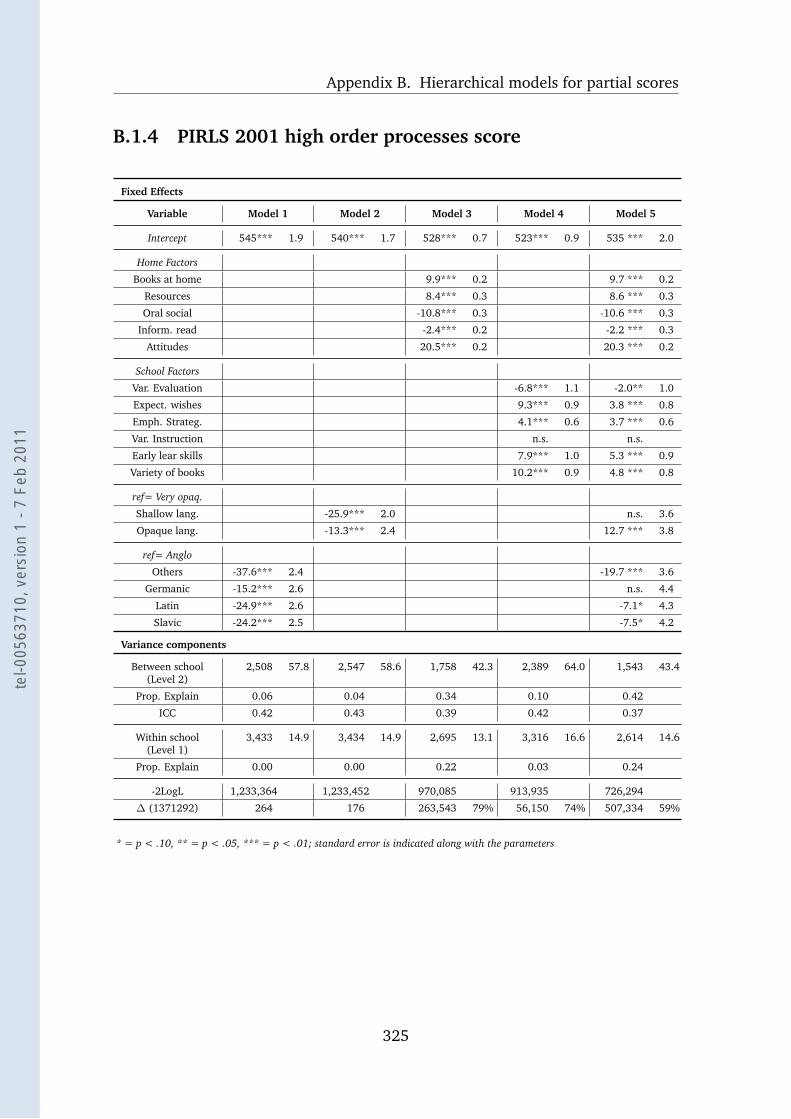
Appendix B. Hierarchical models for partial scores
B.1.4 PIRLS 2001 high order processes score
Fixed Effects
Variable Model 1 Model 2 Model 3 Model 4 Model 5
Intercept 545*** 1.9 540*** 1.7 528*** 0.7 523*** 0.9 535 *** 2.0
Home Factors
Books at home 9.9*** 0.2 9.7 *** 0.2
Resources 8.4*** 0.3 8.6 *** 0.3
Oral social -10.8*** 0.3 -10.6 *** 0.3
Inform. read -2.4*** 0.2 -2.2 *** 0.3
Attitudes 20.5*** 0.2 20.3 *** 0.2
School Factors
Var. Evaluation -6.8*** 1.1 -2.0** 1.0
Expect. wishes 9.3*** 0.9 3.8 *** 0.8
Emph. Strateg. 4.1*** 0.6 3.7 *** 0.6
Var. Instruction n.s. n.s.
Early lear skills 7.9*** 1.0 5.3 *** 0.9
Variety of books 10.2*** 0.9 4.8 *** 0.8
ref= Very opaq.
Shallow lang. -25.9*** 2.0 n.s. 3.6
Opaque lang. -13.3*** 2.4 12.7 *** 3.8
ref= Anglo
Others -37.6*** 2.4 -19.7 *** 3.6
Germanic -15.2*** 2.6 n.s. 4.4
Latin -24.9*** 2.6 -7.1* 4.3
Slavic -24.2*** 2.5 -7.5* 4.2
Variance components
Between school(Level 2)
2,508 57.8 2,547 58.6 1,758 42.3 2,389 64.0 1,543 43.4
Prop. Explain 0.06 0.04 0.34 0.10 0.42
ICC 0.42 0.43 0.39 0.42 0.37
Within school(Level 1)
3,433 14.9 3,434 14.9 2,695 13.1 3,316 16.6 2,614 14.6
Prop. Explain 0.00 0.00 0.22 0.03 0.24
-2LogL 1,233,364 1,233,452 970,085 913,935 726,294
∆ (1371292) 264 176 263,543 79% 56,150 74% 507,334 59%
* = p < .10, ** = p < .05, *** = p < .01; standard error is indicated along with the parameters
325
tel-0
0563
710,
ver
sion
1 -
7 Fe
b 20
11
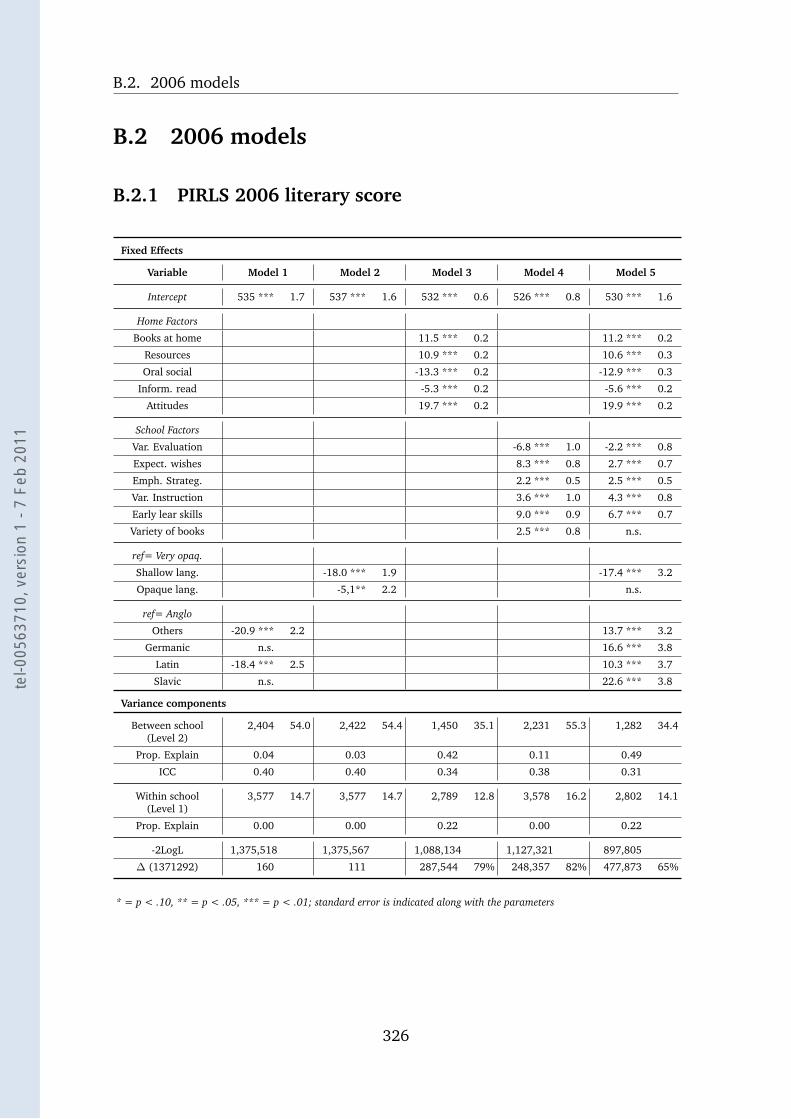
B.2. 2006 models
B.2 2006 models
B.2.1 PIRLS 2006 literary score
Fixed Effects
Variable Model 1 Model 2 Model 3 Model 4 Model 5
Intercept 535 *** 1.7 537 *** 1.6 532 *** 0.6 526 *** 0.8 530 *** 1.6
Home Factors
Books at home 11.5 *** 0.2 11.2 *** 0.2
Resources 10.9 *** 0.2 10.6 *** 0.3
Oral social -13.3 *** 0.2 -12.9 *** 0.3
Inform. read -5.3 *** 0.2 -5.6 *** 0.2
Attitudes 19.7 *** 0.2 19.9 *** 0.2
School Factors
Var. Evaluation -6.8 *** 1.0 -2.2 *** 0.8
Expect. wishes 8.3 *** 0.8 2.7 *** 0.7
Emph. Strateg. 2.2 *** 0.5 2.5 *** 0.5
Var. Instruction 3.6 *** 1.0 4.3 *** 0.8
Early lear skills 9.0 *** 0.9 6.7 *** 0.7
Variety of books 2.5 *** 0.8 n.s.
ref= Very opaq.
Shallow lang. -18.0 *** 1.9 -17.4 *** 3.2
Opaque lang. -5,1** 2.2 n.s.
ref= Anglo
Others -20.9 *** 2.2 13.7 *** 3.2
Germanic n.s. 16.6 *** 3.8
Latin -18.4 *** 2.5 10.3 *** 3.7
Slavic n.s. 22.6 *** 3.8
Variance components
Between school(Level 2)
2,404 54.0 2,422 54.4 1,450 35.1 2,231 55.3 1,282 34.4
Prop. Explain 0.04 0.03 0.42 0.11 0.49
ICC 0.40 0.40 0.34 0.38 0.31
Within school(Level 1)
3,577 14.7 3,577 14.7 2,789 12.8 3,578 16.2 2,802 14.1
Prop. Explain 0.00 0.00 0.22 0.00 0.22
-2LogL 1,375,518 1,375,567 1,088,134 1,127,321 897,805
∆ (1371292) 160 111 287,544 79% 248,357 82% 477,873 65%
* = p < .10, ** = p < .05, *** = p < .01; standard error is indicated along with the parameters
326
tel-0
0563
710,
ver
sion
1 -
7 Fe
b 20
11
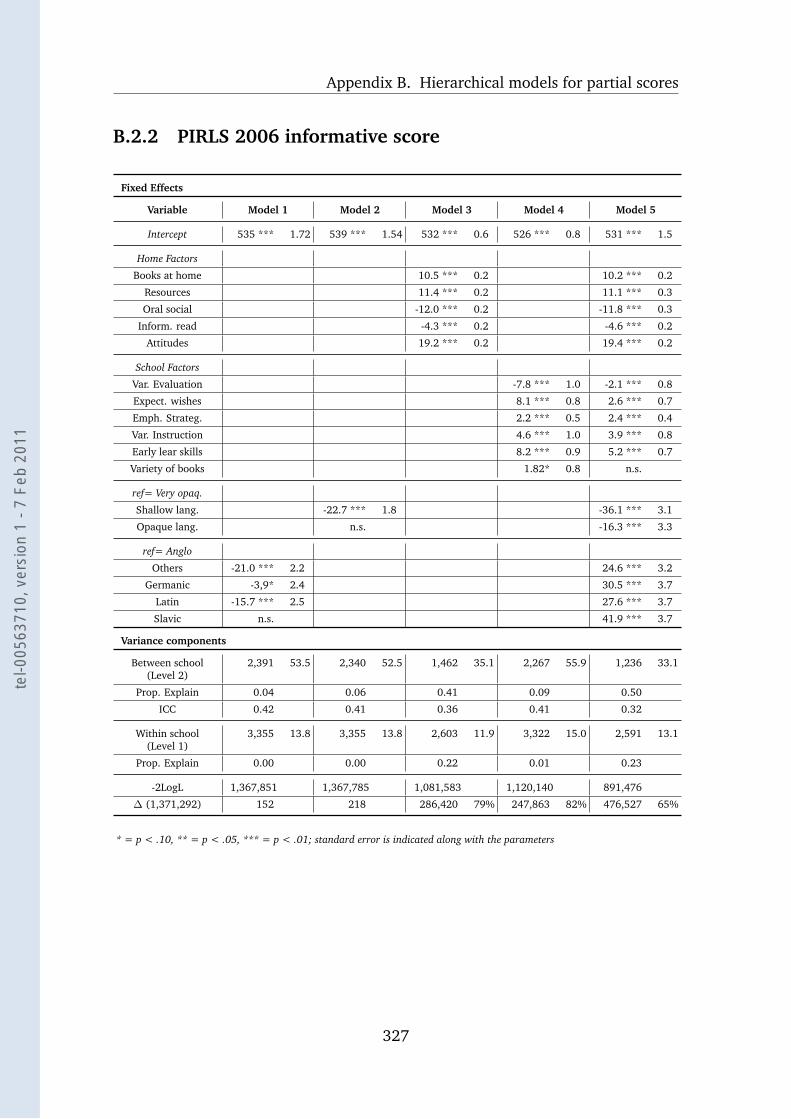
Appendix B. Hierarchical models for partial scores
B.2.2 PIRLS 2006 informative score
Fixed Effects
Variable Model 1 Model 2 Model 3 Model 4 Model 5
Intercept 535 *** 1.72 539 *** 1.54 532 *** 0.6 526 *** 0.8 531 *** 1.5
Home Factors
Books at home 10.5 *** 0.2 10.2 *** 0.2
Resources 11.4 *** 0.2 11.1 *** 0.3
Oral social -12.0 *** 0.2 -11.8 *** 0.3
Inform. read -4.3 *** 0.2 -4.6 *** 0.2
Attitudes 19.2 *** 0.2 19.4 *** 0.2
School Factors
Var. Evaluation -7.8 *** 1.0 -2.1 *** 0.8
Expect. wishes 8.1 *** 0.8 2.6 *** 0.7
Emph. Strateg. 2.2 *** 0.5 2.4 *** 0.4
Var. Instruction 4.6 *** 1.0 3.9 *** 0.8
Early lear skills 8.2 *** 0.9 5.2 *** 0.7
Variety of books 1.82* 0.8 n.s.
ref= Very opaq.
Shallow lang. -22.7 *** 1.8 -36.1 *** 3.1
Opaque lang. n.s. -16.3 *** 3.3
ref= Anglo
Others -21.0 *** 2.2 24.6 *** 3.2
Germanic -3,9* 2.4 30.5 *** 3.7
Latin -15.7 *** 2.5 27.6 *** 3.7
Slavic n.s. 41.9 *** 3.7
Variance components
Between school(Level 2)
2,391 53.5 2,340 52.5 1,462 35.1 2,267 55.9 1,236 33.1
Prop. Explain 0.04 0.06 0.41 0.09 0.50
ICC 0.42 0.41 0.36 0.41 0.32
Within school(Level 1)
3,355 13.8 3,355 13.8 2,603 11.9 3,322 15.0 2,591 13.1
Prop. Explain 0.00 0.00 0.22 0.01 0.23
-2LogL 1,367,851 1,367,785 1,081,583 1,120,140 891,476
∆ (1,371,292) 152 218 286,420 79% 247,863 82% 476,527 65%
* = p < .10, ** = p < .05, *** = p < .01; standard error is indicated along with the parameters
327
tel-0
0563
710,
ver
sion
1 -
7 Fe
b 20
11
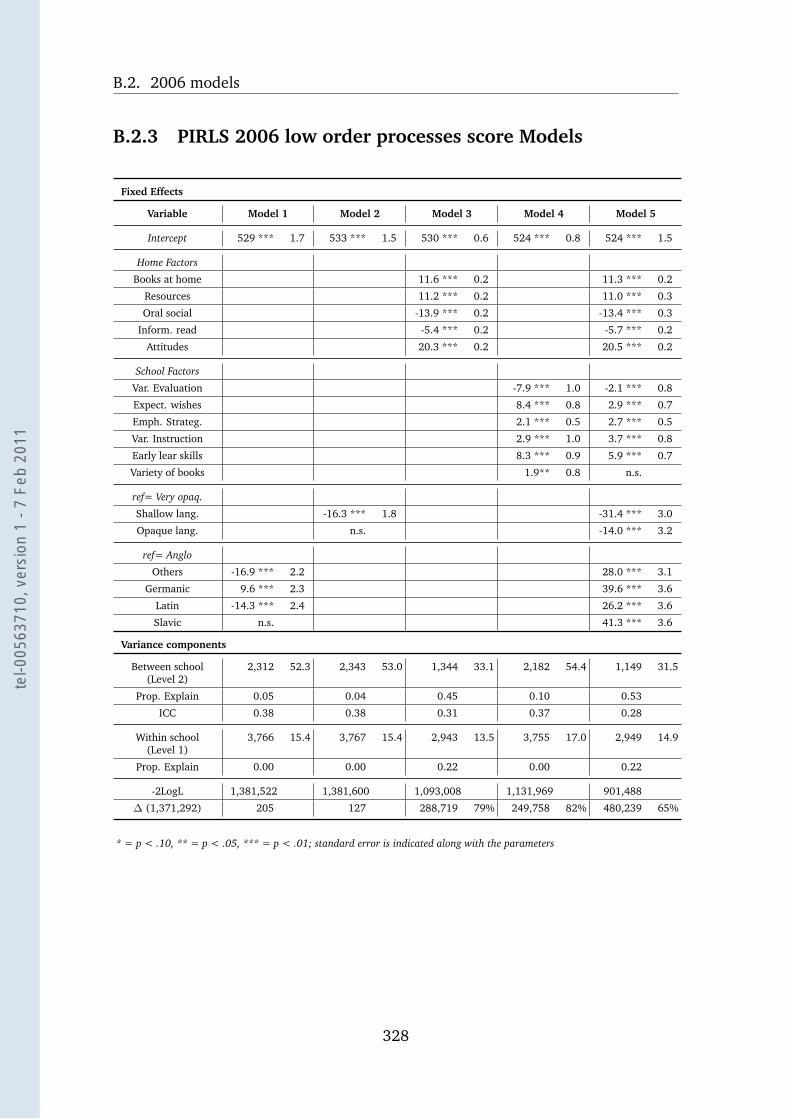
B.2. 2006 models
B.2.3 PIRLS 2006 low order processes score Models
Fixed Effects
Variable Model 1 Model 2 Model 3 Model 4 Model 5
Intercept 529 *** 1.7 533 *** 1.5 530 *** 0.6 524 *** 0.8 524 *** 1.5
Home Factors
Books at home 11.6 *** 0.2 11.3 *** 0.2
Resources 11.2 *** 0.2 11.0 *** 0.3
Oral social -13.9 *** 0.2 -13.4 *** 0.3
Inform. read -5.4 *** 0.2 -5.7 *** 0.2
Attitudes 20.3 *** 0.2 20.5 *** 0.2
School Factors
Var. Evaluation -7.9 *** 1.0 -2.1 *** 0.8
Expect. wishes 8.4 *** 0.8 2.9 *** 0.7
Emph. Strateg. 2.1 *** 0.5 2.7 *** 0.5
Var. Instruction 2.9 *** 1.0 3.7 *** 0.8
Early lear skills 8.3 *** 0.9 5.9 *** 0.7
Variety of books 1.9** 0.8 n.s.
ref= Very opaq.
Shallow lang. -16.3 *** 1.8 -31.4 *** 3.0
Opaque lang. n.s. -14.0 *** 3.2
ref= Anglo
Others -16.9 *** 2.2 28.0 *** 3.1
Germanic 9.6 *** 2.3 39.6 *** 3.6
Latin -14.3 *** 2.4 26.2 *** 3.6
Slavic n.s. 41.3 *** 3.6
Variance components
Between school(Level 2)
2,312 52.3 2,343 53.0 1,344 33.1 2,182 54.4 1,149 31.5
Prop. Explain 0.05 0.04 0.45 0.10 0.53
ICC 0.38 0.38 0.31 0.37 0.28
Within school(Level 1)
3,766 15.4 3,767 15.4 2,943 13.5 3,755 17.0 2,949 14.9
Prop. Explain 0.00 0.00 0.22 0.00 0.22
-2LogL 1,381,522 1,381,600 1,093,008 1,131,969 901,488
∆ (1,371,292) 205 127 288,719 79% 249,758 82% 480,239 65%
* = p < .10, ** = p < .05, *** = p < .01; standard error is indicated along with the parameters
328
tel-0
0563
710,
ver
sion
1 -
7 Fe
b 20
11
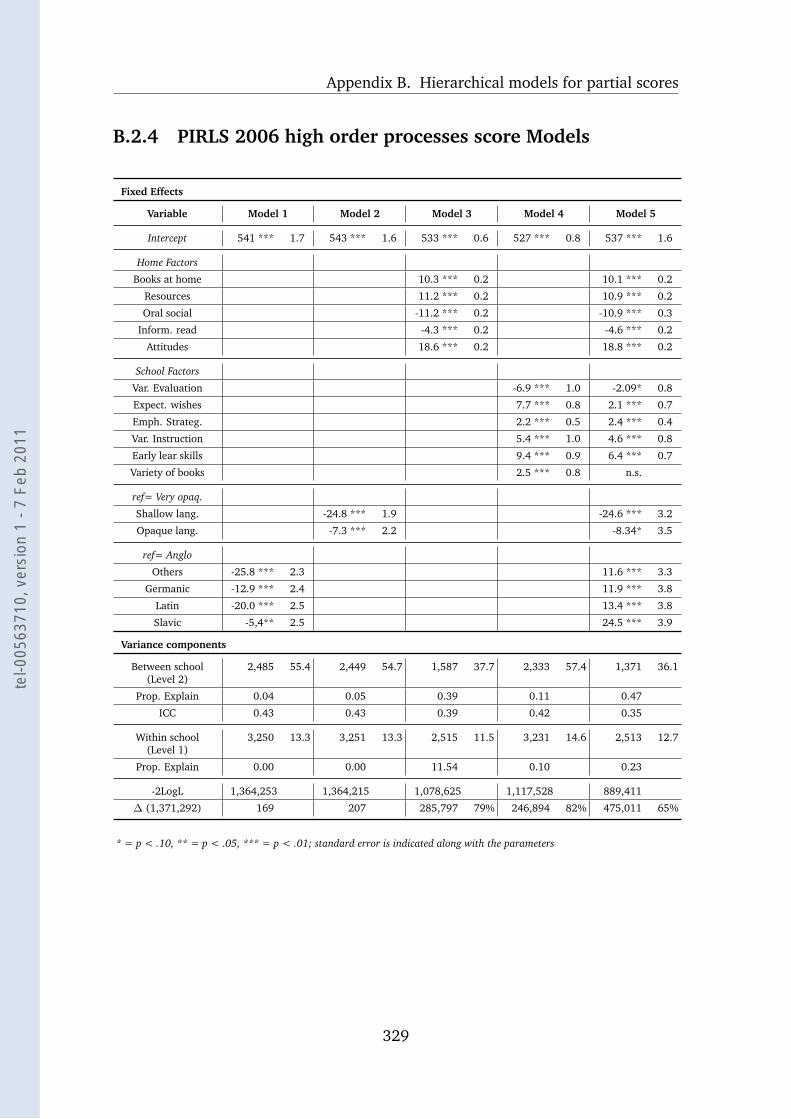
Appendix B. Hierarchical models for partial scores
B.2.4 PIRLS 2006 high order processes score Models
Fixed Effects
Variable Model 1 Model 2 Model 3 Model 4 Model 5
Intercept 541 *** 1.7 543 *** 1.6 533 *** 0.6 527 *** 0.8 537 *** 1.6
Home Factors
Books at home 10.3 *** 0.2 10.1 *** 0.2
Resources 11.2 *** 0.2 10.9 *** 0.2
Oral social -11.2 *** 0.2 -10.9 *** 0.3
Inform. read -4.3 *** 0.2 -4.6 *** 0.2
Attitudes 18.6 *** 0.2 18.8 *** 0.2
School Factors
Var. Evaluation -6.9 *** 1.0 -2.09* 0.8
Expect. wishes 7.7 *** 0.8 2.1 *** 0.7
Emph. Strateg. 2.2 *** 0.5 2.4 *** 0.4
Var. Instruction 5.4 *** 1.0 4.6 *** 0.8
Early lear skills 9.4 *** 0.9 6.4 *** 0.7
Variety of books 2.5 *** 0.8 n.s.
ref= Very opaq.
Shallow lang. -24.8 *** 1.9 -24.6 *** 3.2
Opaque lang. -7.3 *** 2.2 -8.34* 3.5
ref= Anglo
Others -25.8 *** 2.3 11.6 *** 3.3
Germanic -12.9 *** 2.4 11.9 *** 3.8
Latin -20.0 *** 2.5 13.4 *** 3.8
Slavic -5,4** 2.5 24.5 *** 3.9
Variance components
Between school(Level 2)
2,485 55.4 2,449 54.7 1,587 37.7 2,333 57.4 1,371 36.1
Prop. Explain 0.04 0.05 0.39 0.11 0.47
ICC 0.43 0.43 0.39 0.42 0.35
Within school(Level 1)
3,250 13.3 3,251 13.3 2,515 11.5 3,231 14.6 2,513 12.7
Prop. Explain 0.00 0.00 11.54 0.10 0.23
-2LogL 1,364,253 1,364,215 1,078,625 1,117,528 889,411
∆ (1,371,292) 169 207 285,797 79% 246,894 82% 475,011 65%
* = p < .10, ** = p < .05, *** = p < .01; standard error is indicated along with the parameters
329
tel-0
0563
710,
ver
sion
1 -
7 Fe
b 20
11
Appendix C
SAS and R programs
330
tel-0
0563
710,
ver
sion
1 -
7 Fe
b 20
11
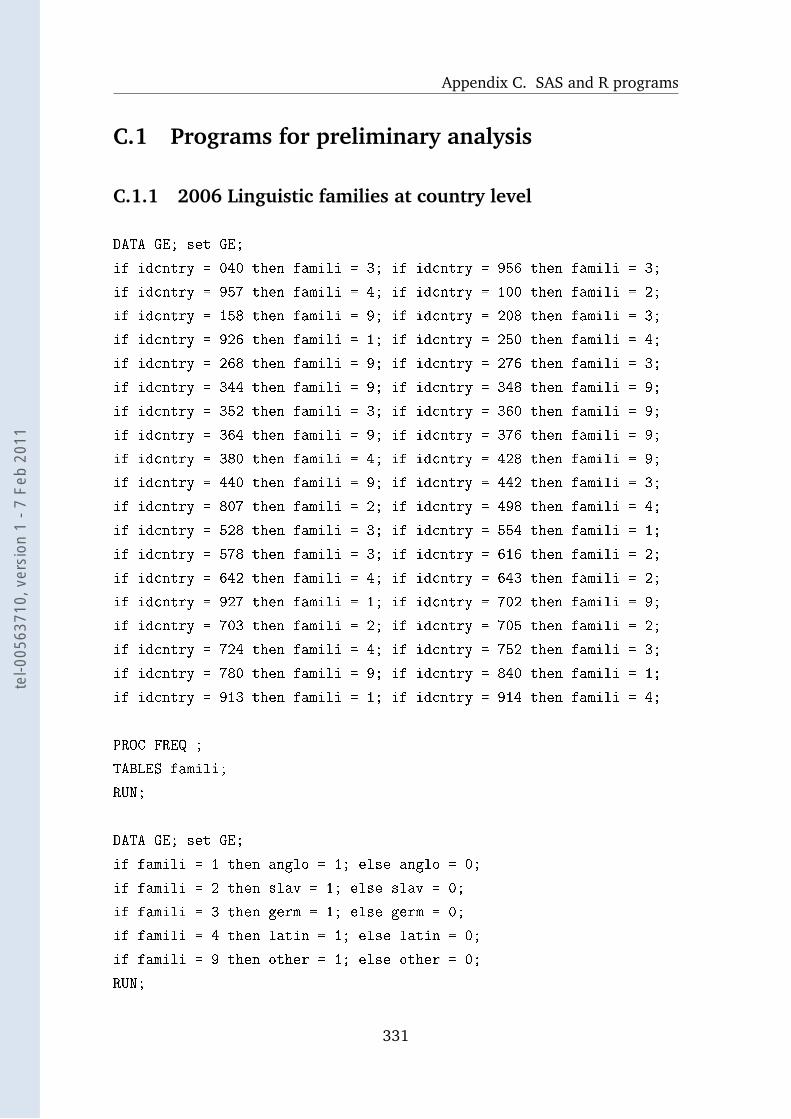
Appendix C. SAS and R programs
C.1 Programs for preliminary analysis
C.1.1 2006 Linguistic families at country level
DATA GE; set GE;
if idcntry = 040 then famili = 3; if idcntry = 956 then famili = 3;
if idcntry = 957 then famili = 4; if idcntry = 100 then famili = 2;
if idcntry = 158 then famili = 9; if idcntry = 208 then famili = 3;
if idcntry = 926 then famili = 1; if idcntry = 250 then famili = 4;
if idcntry = 268 then famili = 9; if idcntry = 276 then famili = 3;
if idcntry = 344 then famili = 9; if idcntry = 348 then famili = 9;
if idcntry = 352 then famili = 3; if idcntry = 360 then famili = 9;
if idcntry = 364 then famili = 9; if idcntry = 376 then famili = 9;
if idcntry = 380 then famili = 4; if idcntry = 428 then famili = 9;
if idcntry = 440 then famili = 9; if idcntry = 442 then famili = 3;
if idcntry = 807 then famili = 2; if idcntry = 498 then famili = 4;
if idcntry = 528 then famili = 3; if idcntry = 554 then famili = 1;
if idcntry = 578 then famili = 3; if idcntry = 616 then famili = 2;
if idcntry = 642 then famili = 4; if idcntry = 643 then famili = 2;
if idcntry = 927 then famili = 1; if idcntry = 702 then famili = 9;
if idcntry = 703 then famili = 2; if idcntry = 705 then famili = 2;
if idcntry = 724 then famili = 4; if idcntry = 752 then famili = 3;
if idcntry = 780 then famili = 9; if idcntry = 840 then famili = 1;
if idcntry = 913 then famili = 1; if idcntry = 914 then famili = 4;
PROC FREQ ;
TABLES famili;
RUN;
DATA GE; set GE;
if famili = 1 then anglo = 1; else anglo = 0;
if famili = 2 then slav = 1; else slav = 0;
if famili = 3 then germ = 1; else germ = 0;
if famili = 4 then latin = 1; else latin = 0;
if famili = 9 then other = 1; else other = 0;
RUN;
331
tel-0
0563
710,
ver
sion
1 -
7 Fe
b 20
11
C.1. Programs for preliminary analysis
C.1.2 2001 Literary score at countries
DATA student; set ar1.asaallr1;
%jackpv (totwgt , jkzone, jkrep, 75, idcntry, asrLIT0, 5, student);
PROC PRINT DATA=final noobs;
VAR idcntry N totwgt mnpv mnpv_se mnx mnx_se pct pct_se;
RUN;
DATA y; set final;
KEEP idcntry mnpv;
RENAME mnpv = LIT01;
RUN;
C.1.3 Example: analysis of a question from teacher 2001 ques-
tionnaire
* ACBGSTST = Length Students stay with the same teacher;
* jackpv.sas = PIRLS macro to calculate scores by a chosen parameter, here vari-
able ACBGSTST;
* CONT2_high_low_vars.sas = macro to create STST_high, STST_low, STST, noS-
TST, see next subsection ;
LIBNAME c "C:\PIRLS 2001\";
%include "C:\PIRLS 2001\jackpv.sas";
%include "C:\PIRLS 2001\CONT2_high_low_vars.sas";
RUN;
DATA school; set c.school;
WHERE nmiss(ACBGSTST) = 0;
332
tel-0
0563
710,
ver
sion
1 -
7 Fe
b 20
11
Appendix C. SAS and R programs
SELECT (ACBGSTST) ;
WHEN (2,3) ACBGSTST = 1 ; *ONE SCHOOL YEAR OR LESS:2 - TWO YEARS:3;
WHEN (4,5) ACBGSTST = 4 ; *THREE YEARS:4 - FOUR OR MORE YEARS:5;
OTHERWISE ACBGSTST = . ;
END ;
%jackpv (totwgt, jkzone, jkrep, 75, idcntry ACBGSTST, asrrea0, 5, school);
RUN;
DATA z; set final;
%cont2 (ACBGSTST, STST_high, STST_low, STST, noSTST);
RUN;
DATA sasuser.iea2001; set a;
RUN;
C.1.4 Macro to create variables
Macro to create sub-variables representing scores high (&a), low (&b), above (&c)
and under (&d) the average
%MACRO cont2 (a, b, c, d, e) ;
IF &a = 1 then &b=pct;
ELSE &b=0;
PROC MEANS DATA=z noprint;
VAR &b; output out=d sum=&b;
BY idcntry;
DATA z; set z;
IF &a = 4 then &c=pct;
ELSE &c=0;
PROC MEANS DATA=z noprint;
VAR &c; output out=f sum=&c;
BY idcntry;
RUN;
333
tel-0
0563
710,
ver
sion
1 -
7 Fe
b 20
11
C.1. Programs for preliminary analysis
DATA x; merge f d;
BY idcntry;
KEEP idcntry &b &c;
RUN;
DATA a; merge x p.iea2001;
BY idcntry;
RUN;
PROC MEANS DATA= a mean noprint;
VAR &b &c; output out = b mean= m1 m2;
DATA c; merge a b;
RETAIN mean1 mean2;
IF _n_ = 1 then do; mean1 = m1; mean2 = m2; end;
DROP _freq_ _type_ m1 m2;
334
tel-0
0563
710,
ver
sion
1 -
7 Fe
b 20
11
Appendix C. SAS and R programs
C.2 Models
C.2.1 Null Models
DATA a; set p.std2006;
RUN;
DATA a; set a;
KEEP score2006 school teacher class country;
RUN;
PROC MIXED DATA=a method=ml covtest noclprint;
CLASS school;
MODEL score2006 = /solution ddfm=bw;
RANDOM intercept/subject=school;
RUN;
method=ml: full maximum likelihood estimation
covtest: display tests for the variance components
noclprint: avoid printing of Class Level Information
ddfm=bw: Degrees of Freedom Method Between-Within;
3 Levels null model;
PROC MIXED DATA=a method=ml covtest noclprint;
CLASS school country;
MODEL score2006 = /solution ddfm=bw;
RANDOM intercept/subject=school;
RANDOM intercept/subject=school (country);
RUN;
C.2.2 Linguistic Models
PROC MIXED DATA=b method=ml covtest noclprint;
335
tel-0
0563
710,
ver
sion
1 -
7 Fe
b 20
11
C.2. Models
CLASS school;
MODEL score2006 = ANGLO GERM LATIN SLAVIC /solution ddfm=bw;
RANDOM intercept/subject=school;
ods output SolutionF=z;
ods output CovParms=y;
RUN;
*exporting option to develop tables;
ods output close; ods listing;
PROC EXPORT DATA= Z
OUTFILE= "C:\MIXEDodd.XLS"
DBMS=EXCEL REPLACE;
SHEET="Sol.score2006";
PROC EXPORT DATA= Y
OUTFILE= "C:\MIXEDodd.XLS"
DBMS=EXCEL REPLACE;
SHEET="Cov.score2006";
RUN;
C.2.3 School variance by country
PROC MIXED DATA=b method=ml covtest noclprint;
WHERE idcntry= 100;
CLASS schoolcount;
MODEL all06 = /solution ddfm=bw;
RANDOM intercept/subject=schoolcount;
ods output CovParms=y;
RUN;
DATA x; set y;
336
tel-0
0563
710,
ver
sion
1 -
7 Fe
b 20
11
Appendix C. SAS and R programs
keep Estimate;
RUN;
PROC TRANSPOSE data = x out=w;
var Estimate ;
run;
DATA w; set w;
schoolvar = COL1 /(COL2+COL1);
country= 100;
RUN;
337
tel-0
0563
710,
ver
sion
1 -
7 Fe
b 20
11
C.3. R. graphics
C.3 R. graphics
C.3.1 Boxplot in figure 6.1
x <- read.xport ("C:/sasfiles/P01")
summary (x)
oldpar <- par(cex=0.75, mex=0.60, mar=c(6.1, 14.1, 2.1, 1.1))
boxplot (SCM ~ NAMEVAR, data=x, horizontal=TRUE,
xlab="School Variation", col=(c("gold","darkgreen")), las=1)
C.3.2 Plots in figure 6.2
x <- sasxport.get("C:/sasfiles/OUT.xpt")
summary (x)
med <- subset(x, scm >= 489 & scm
< 598, select=c(all06, zbook, zsatr, zoral, zme))
low <- subset
(x, scm<=488, select=c(all06, zbook, zsatr, zoral, zme))
high <- subset
(x, scm>=599, select=c(all06, zbook, zsatr, zoral, zme))
par(mfrow=c(2,2))
plot(all06~zsatr, data=high, xlab="Students attitudes toward reading",
ylab="Reading Achievement", xlim=c(-3, 3), ylim=c(100, 800), pch='')
abline(lm(all06~zsatr, data=high), col=(c("darkblue")), lwd=2)
par(new=TRUE)
plot(all06~zsatr, data=med, xlab=" ", ylab=" ", xlim=c(-3, 3),
ylim=c(100, 800), pch='')
abline(lm(all06~zsatr, data=med), col=(c("darkgreen ")), lwd=2)
par(new=TRUE)
plot(all06~zsatr, data=low, xlab=" ", ylab=" ", xlim=c(-3, 3),
ylim=c(100, 800), pch='')
338
tel-0
0563
710,
ver
sion
1 -
7 Fe
b 20
11
Appendix C. SAS and R programs
abline(lm(all06~zsatr, data=low), col=(c("gold ")), lwd=2)
plot(all06~zbook, data=high, xlab="Availability of books",
ylab="Reading Achievement", xlim=c(-3, 3), ylim=c(100, 800), pch='')
abline(lm(all06~zbook, data=high), col=(c("darkblue")), lwd=2)
par(new=TRUE)
plot(all06~zbook, data=med, xlab="", ylab=" ", xlim=c(-3, 3),
ylim=c(100, 800), pch='')
abline(lm(all06~zbook, data=med), col=(c("darkgreen ")), lwd=2)
par(new=TRUE)
plot(all06~zbook, data=low, xlab=" ", ylab=" ", xlim=c(-3, 3),
ylim=c(100, 800), pch='')
abline(lm(all06~zbook, data=low), col=(c("gold ")), lwd=2)
plot(all06~zoral, data=high, xlab="Orality, socialization",
ylab="Reading Achievement", xlim=c(-3, 3), ylim=c(100, 800), pch='')
abline(lm(all06~zoral, data=high), col=(c("darkblue")), lwd=2)
par(new=TRUE)
plot(all06~zoral, data=med, xlab="", ylab=" ", xlim=c(-3, 3),
ylim=c(100, 800), pch='')
abline(lm(all06~zoral, data=med), col=(c("darkgreen ")), lwd=2)
par(new=TRUE)
plot(all06~zoral, data=low, xlab=" ", ylab=" ", xlim=c(-3, 3),
ylim=c(100, 800), pch='')
abline(lm(all06~zoral, data=low), col=(c("gold ")), lwd=2)
plot(all06~zme, data=high, xlab="Early learning of Skills",
ylab="Reading Achievement", xlim=c(-3, 3), ylim=c(100, 800), pch='')
abline(lm(all06~zme, data=high), col=(c("darkblue")), lwd=2)
par(new=TRUE)
plot(all06~zme, data=med, xlab="", ylab=" ", xlim=c(-3, 3),
339
tel-0
0563
710,
ver
sion
1 -
7 Fe
b 20
11

C.3. R. graphics
ylim=c(100, 800), pch='')
abline(lm(all06~ zme, data=med), col=(c("darkgreen ")), lwd=2)
par(new=TRUE)
plot(all06~zme, data=low, xlab=" ", ylab=" ", xlim=c(-3, 3),
ylim=c(100, 800), pch='')
abline(lm(all06~ zme, data=low), col=(c("gold ")), lwd=2)
340
tel-0
0563
710,
ver
sion
1 -
7 Fe
b 20
11
Appendix C. SAS and R programs
C.4 LATEX code of text formatting
\documentclass[a4paper,12pt,twoside]{report}
\usepackage[english, francais]{babel}
\usepackage[cp1252]{inputenc} %For using accented letters
\usepackage[T1]{fontenc} %Font encoding
\usepackage{textcomp} %Allows the use of extra characters
\usepackage{charter}%Font type
\usepackage{tipa}%International Phonetic
\usepackage
[left=3cm,
top=2cm,
right=3cm,
bottom=2.5cm,
includehead,
includefoot]{geometry}%text margens
\usepackage{amsfonts,subfig,amsmath} %mathematic's utils
\usepackage{appendix} %chapters using letter in numbering
\usepackage{multicol,array,rotating,multirow,booktabs} % improve tables
\usepackage{graphicx} %improve graphics
\usepackage{setspace} %double and one-and-a-half spacing
\usepackage{apacite} %use APA style in references
\usepackage{natbib} %author-year citations
\usepackage{verbatim} % for multi-line comments
\usepackage{hyperref} %links
\hypersetup{
pdfstartview=FitH, % page fit to window horizontaly when opened
colorlinks=true, % false: boxed links; true: colored links
linkcolor=blue, % color of internal links
citecolor=blue, % color of links to bibliography
filecolor=black, % color of file links
urlcolor=blue, % color of external links
bookmarksnumbered,
341
tel-0
0563
710,
ver
sion
1 -
7 Fe
b 20
11
C.4. LATEX
bookmarksopen=true,
bookmarksopenlevel=1
}
\setlength{\parindent}{0pt} %no indentation
\setlength{\parskip}{1.5ex plus 0.2ex minus 0.2ex} % paragraphs separation
\setlength{\footskip }{40pt} %setting page and margin sizes.
\setlength\headheight{15pt}
\usepackage{fancyhdr} %Customized headers and footers
\pagestyle{fancy}
\fancyhf{}
\fancyhead[RO]{\nouppercase\leftmark}
\fancyhead[LE]{\nouppercase\rightmark}
\fancyfoot[CO, CE]{\thepage}
\fancyfoot[LE,LO]{\today}
\onehalfspacing
\let\stdsection\section
\renewcommand\section{\newpage\stdsection}
\makeatother
\setcounter{secnumdepth}{3}
\renewcommand{\thesubsubsection}{\thesubsection.\alph{subsubsection}}
\begin{document}
\input{Title}
\input{acknowledgement}
\input{abstract}
\input{resume}
\begin{spacing}{1}
\tableofcontents
342
tel-0
0563
710,
ver
sion
1 -
7 Fe
b 20
11
\listoftables
\listoffigures
\end{spacing}
%\newpage
\input{chapter1/chapter1}%introduction
\part{Theoretical Framework}
\input{chapter2/chapter2}
\input{chapter3/chapter3}
\part{Development of experiments}
\label{part2}
\input{Chapter4/Chapter4}
\input{Chapter5/Chapter5}
\input{Chapter6/Chapter6}
\input{Conclusions}
\cleardoublepage
\phantomsection
\addcontentsline{toc}{chapter}{References}
\bibliographystyle{apacite} %Choose style for bibliography
\bibliography{biblio}
\appendix
\cleardoublepage
\phantomsection
\addcontentsline{toc}{part}{Appendix}
\input{appendix1/appendix1} %pirls
\input{appendix2/appendix2} % models
\input{appendix3/appendix3} %SAS
\end{document}
tel-0
0563
710,
ver
sion
1 -
7 Fe
b 20
11

tel-0
0563
710,
ver
sion
1 -
7 Fe
b 20
11
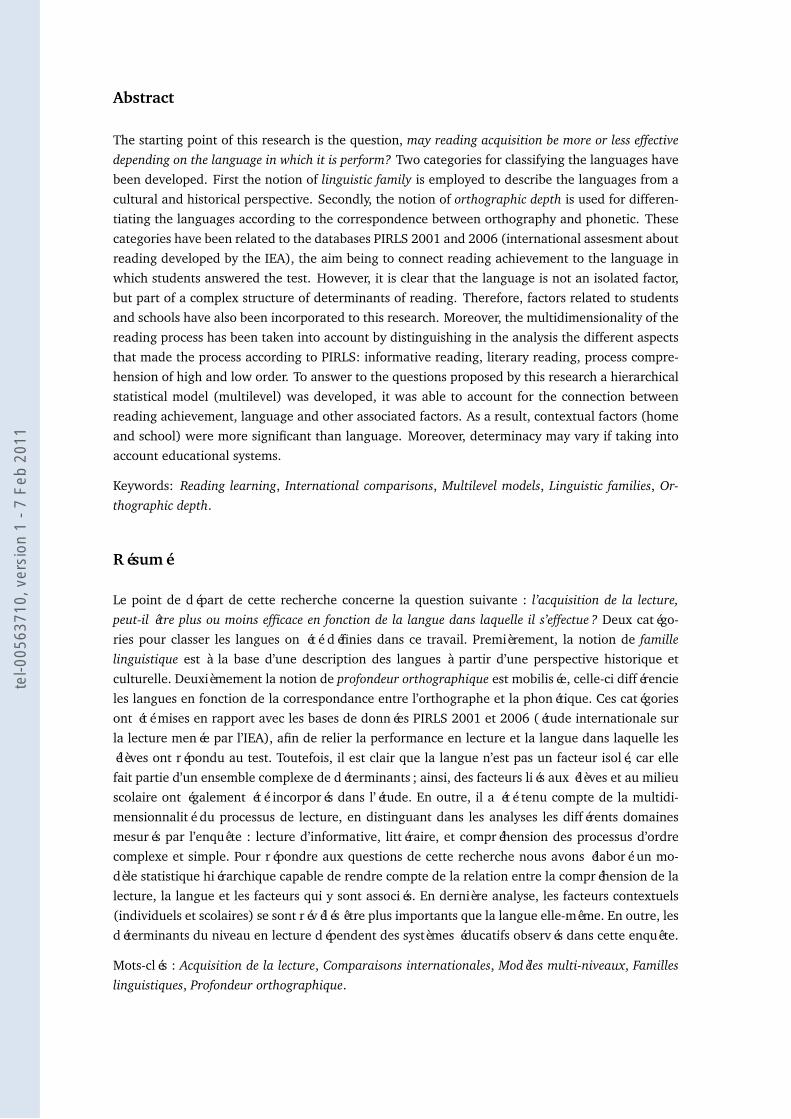
Abstract
The starting point of this research is the question, may reading acquisition be more or less effectivedepending on the language in which it is perform? Two categories for classifying the languages havebeen developed. First the notion of linguistic family is employed to describe the languages from acultural and historical perspective. Secondly, the notion of orthographic depth is used for differen-tiating the languages according to the correspondence between orthography and phonetic. Thesecategories have been related to the databases PIRLS 2001 and 2006 (international assesment aboutreading developed by the IEA), the aim being to connect reading achievement to the language inwhich students answered the test. However, it is clear that the language is not an isolated factor,but part of a complex structure of determinants of reading. Therefore, factors related to studentsand schools have also been incorporated to this research. Moreover, the multidimensionality of thereading process has been taken into account by distinguishing in the analysis the different aspectsthat made the process according to PIRLS: informative reading, literary reading, process compre-hension of high and low order. To answer to the questions proposed by this research a hierarchicalstatistical model (multilevel) was developed, it was able to account for the connection betweenreading achievement, language and other associated factors. As a result, contextual factors (homeand school) were more significant than language. Moreover, determinacy may vary if taking intoaccount educational systems.
Keywords: Reading learning, International comparisons, Multilevel models, Linguistic families, Or-thographic depth.
Résumé
Le point de départ de cette recherche concerne la question suivante : l’acquisition de la lecture,peut-il être plus ou moins efficace en fonction de la langue dans laquelle il s’effectue ? Deux catégo-ries pour classer les langues on été définies dans ce travail. Premièrement, la notion de famillelinguistique est à la base d’une description des langues à partir d’une perspective historique etculturelle. Deuxièmement la notion de profondeur orthographique est mobilisée, celle-ci différencieles langues en fonction de la correspondance entre l’orthographe et la phonétique. Ces catégoriesont été mises en rapport avec les bases de données PIRLS 2001 et 2006 (étude internationale surla lecture menée par l’IEA), afin de relier la performance en lecture et la langue dans laquelle lesélèves ont répondu au test. Toutefois, il est clair que la langue n’est pas un facteur isolé, car ellefait partie d’un ensemble complexe de déterminants ; ainsi, des facteurs liés aux élèves et au milieuscolaire ont également été incorporés dans l’étude. En outre, il a été tenu compte de la multidi-mensionnalité du processus de lecture, en distinguant dans les analyses les différents domainesmesurés par l’enquête : lecture d’informative, littéraire, et compréhension des processus d’ordrecomplexe et simple. Pour répondre aux questions de cette recherche nous avons élaboré un mo-dèle statistique hiérarchique capable de rendre compte de la relation entre la compréhension de lalecture, la langue et les facteurs qui y sont associés. En dernière analyse, les facteurs contextuels(individuels et scolaires) se sont révélés être plus importants que la langue elle-même. En outre, lesdéterminants du niveau en lecture dépendent des systèmes éducatifs observés dans cette enquête.
Mots-clés : Acquisition de la lecture, Comparaisons internationales, Modèles multi-niveaux, Familleslinguistiques, Profondeur orthographique.
tel-0
0563
710,
ver
sion
1 -
7 Fe
b 20
11