Human- faunal relationships a look from paleoecology to taphonomy
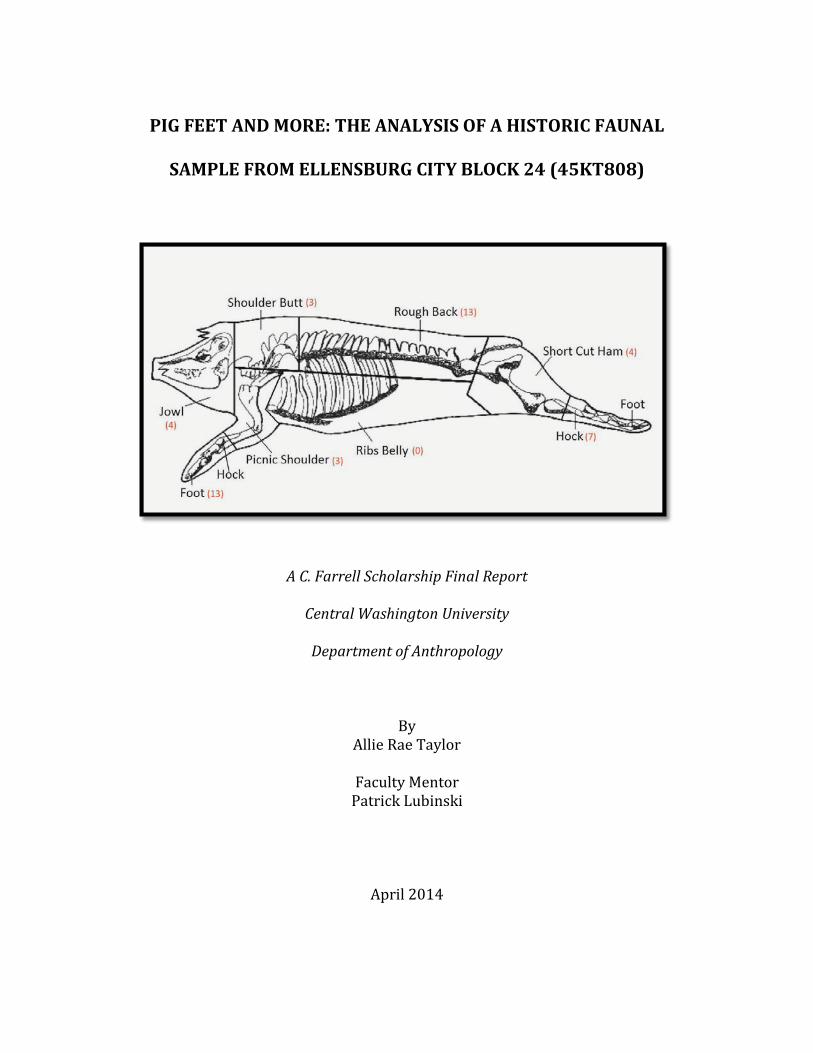
PIG FEET AND MORE: THE ANALYSIS OF A HISTORIC FAUNAL
SAMPLE FROM ELLENSBURG CITY BLOCK 24 (45KT808)
A C. Farrell Scholarship Final Report
Central Washington University
Department of Anthropology
By Allie Rae Taylor
Faculty Mentor
Patrick Lubinski
April 2014

PIG FEET AND MORE: ANALYSIS OF A HISTORIC FAUNAL SAMPLE
FROM ELLENSBURG CITY BLOCK 24 (45KT808)
____________________________________
A C. Farrell Scholarship Final Report
Central Washington University
____________________________________
By
Allie Rae Taylor
____________________________________
Faculty Mentor
Patrick Lubinski
Department of Anthropology
April 2014
ABSTRACT
The Ellensburg City Block 24 (45KT808) is a historic archaeology site occupied
by Euroamericans and Overseas Chinese starting in the late 1800s. The site is located in
downtown Ellensburg, Washington. A 1989 community archaeology project excavated a
portion of Block 24. Artifacts from the site include cultural materials mostly from the late
1800s to early 1900s. A previous project was conducted on this site by Stephanie
Simmons in 2007; her project included the analysis of small samples of faunal remains,
glass bottles, ceramics, and some other artifacts. My project focused on the faunal
remains from this site. A total of 457 specimens were analyzed from half (18) of the 5 x 5
foot excavation units. Identified taxa are dominated by domesticated species, including
pig, cattle, deer/sheep/pronghorn/goat, chicken, dog, and cat, but there is also one wild
species, pheasant. Most of the cattle, pig, and chicken specimens present are believed to
have been used for food consumption. The cat specimens were most likely found there
due to pet burials. A majority of the modified bones were saw-cut, except for the chicken,
dog, and cat elements. Pig bones were primarily lower limb elements, foot elements and
vertebral remnants, which demonstrate a variety of pork cuts exhibiting a range of meat
prices. Cattle specimens were mostly vertebral in nature, which are the more expensive of
the meat cuts. Unlike other sites from the 19th century West Coast, most of the
identifiable bones were pig and chicken instead of cattle.
ii
ACKNOWLEDGMENTS
Other people have carried out research on the Ellensburg City Block 24 historic
site over the years, and I thank each and every one for their individual contribution that
culminated in this report, especially Stephanie Simmons. I also thank those who will
undertake research on the site in the future.
Dr. Patrick Lubinski, my faculty mentor and advisor, deserves special recognition
for his support, patience, assistance, and guidance throughout this project. I also would
like to thank other faculty members that have helped me throughout this project, Dr.
Steve Hackenberger and Dr. Patrick McCutcheon.
My family, Cindy and Lawrence Taylor, Cassie and Andrew Urvina, and Dorothy
Hopkins provided me much-needed love and support through the duration of my project.
I thank my good friends, Taylor Harriman and Farrah Sultan for their constant source of
motivation and encouragement. Finally, special thanks to my roommates Elizabeth
Seelye and Eric Wakeland for assisting me in the cataloging of the fauna from the site
and supporting me throughout the remainder of the project.
iii
TABLE OF CONTENTS
Section Page
INTRODUCTION ...............................................................................................................1
SITE 45KT808 .....................................................................................................................2
METHODS ..........................................................................................................................6
FAUNAL ANALYSIS RESULTS ......................................................................................9
DISCUSSION ....................................................................................................................17
Felis catus ..............................................................................................................18 Sus scrofa ...............................................................................................................20 Bos taurus ..............................................................................................................23 Gallus gallus ..........................................................................................................25 Phasianus colchis...................................................................................................27 Canis sp. .................................................................................................................27 Chinese in Ellensburg ............................................................................................27 CONCLUSION ..................................................................................................................32
REFERENCES CITED ......................................................................................................34
iv
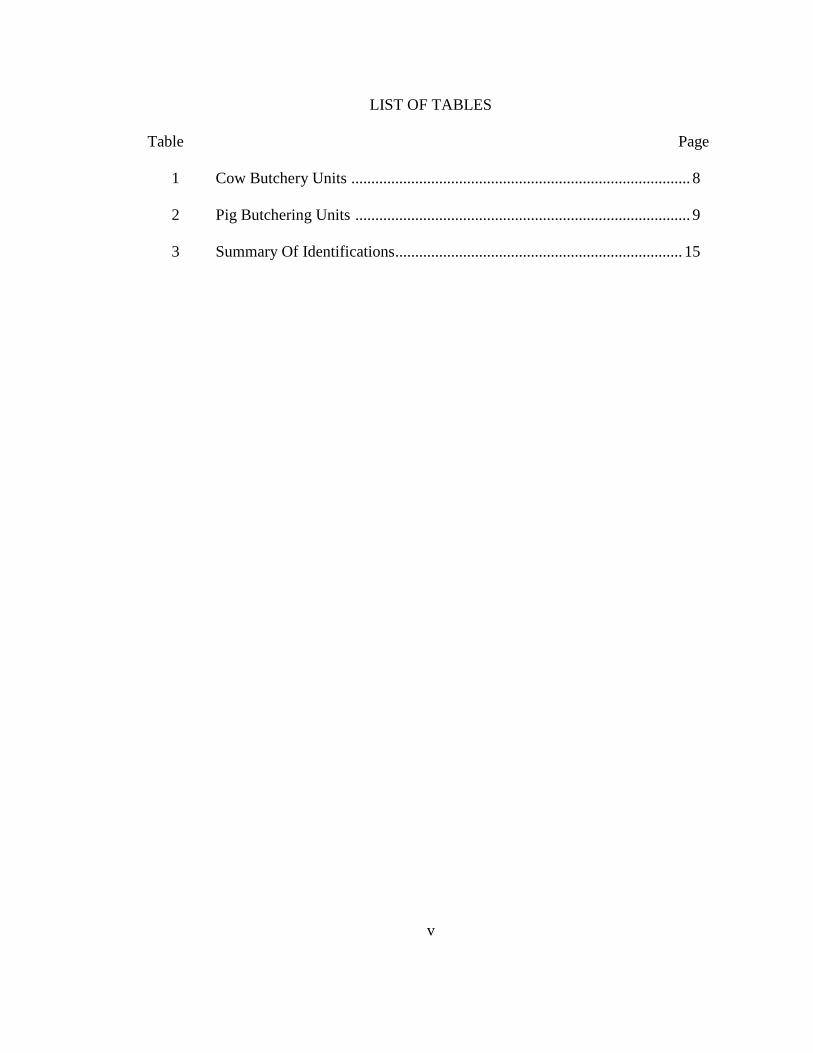
LIST OF TABLES
Table Page
1 Cow Butchery Units ..................................................................................... 8
2 Pig Butchering Units .................................................................................... 9
3 Summary Of Identifications ........................................................................ 15
v

LIST OF FIGURES
Figure Page
1 Site Map Of 45KT808 ................................................................................. 4
2 Overlay Of 1989 Excavation Grid On 1897 Sanborn Fire Insurance Map .. 5
3 Example Of Green Breakage And Saw Cut Modifications ....................... 11
4 Example Of Two Butchery Cut Marks And A Green Break ...................... 11
5 Example Of Carnivore Modification ......................................................... 12
6 Example Of Burning Stage 8 ...................................................................... 13
7 Two Cat Mandibles Of The Same Individual ............................................. 19
8 Pig Butchering Units Found In The Sample .............................................. 21
9 Foot Elements From A Pig. ....................................................................... 22
10 A Comparative Pork Chop Lumbar Vertebra (Left) With 5 Historic Pork
Chops From 45KT808 ............................................................................... 22
11 Cattle Butchering Units Found In The Sample .......................................... 24
12 Comparative T-Bone Steak (Left) With Historic T-Bone Steak (Right) From
45KT808 .................................................................................................... 24
13 Comparative T-Bone Steak (Left) With 4 Historic T-Bone Steak (Right) From
45KT808 .................................................................................................... 25
14 Beef Meat Cuts With Relative Price Rank ................................................. 25
15 A Historic Male Chicken Tibiotarsus Spur ................................................. 26
16 1889 Sanborn Fire Insurance Map for Block 24 ......................................... 29
17 1897 Sanborn Fire Insurance Map for Block 24 ......................................... 30
vi

LIST OF FIGURES (continued)
18 1909 Sanborn Fire Insurance Map for Block 24 ......................................... 31
vii
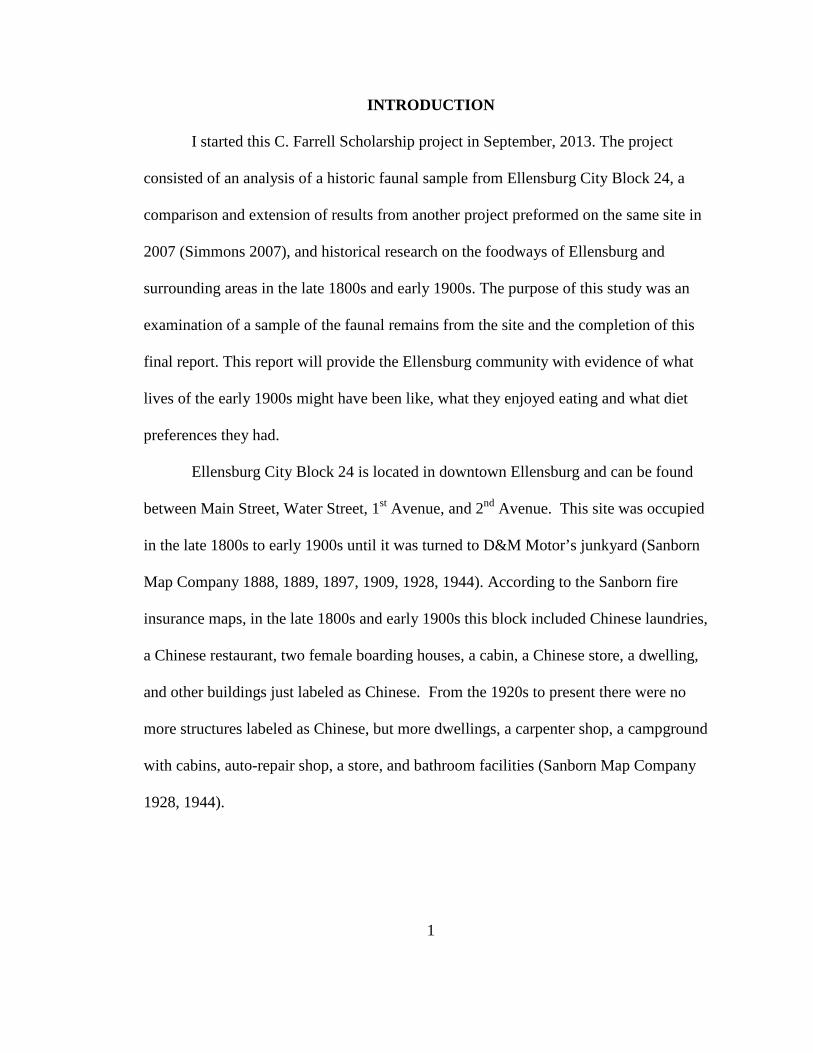
INTRODUCTION
I started this C. Farrell Scholarship project in September, 2013. The project
consisted of an analysis of a historic faunal sample from Ellensburg City Block 24, a
comparison and extension of results from another project preformed on the same site in
2007 (Simmons 2007), and historical research on the foodways of Ellensburg and
surrounding areas in the late 1800s and early 1900s. The purpose of this study was an
examination of a sample of the faunal remains from the site and the completion of this
final report. This report will provide the Ellensburg community with evidence of what
lives of the early 1900s might have been like, what they enjoyed eating and what diet
preferences they had.
Ellensburg City Block 24 is located in downtown Ellensburg and can be found
between Main Street, Water Street, 1st Avenue, and 2nd Avenue. This site was occupied
in the late 1800s to early 1900s until it was turned to D&M Motor’s junkyard (Sanborn
Map Company 1888, 1889, 1897, 1909, 1928, 1944). According to the Sanborn fire
insurance maps, in the late 1800s and early 1900s this block included Chinese laundries,
a Chinese restaurant, two female boarding houses, a cabin, a Chinese store, a dwelling,
and other buildings just labeled as Chinese. From the 1920s to present there were no
more structures labeled as Chinese, but more dwellings, a carpenter shop, a campground
with cabins, auto-repair shop, a store, and bathroom facilities (Sanborn Map Company
1928, 1944).
1
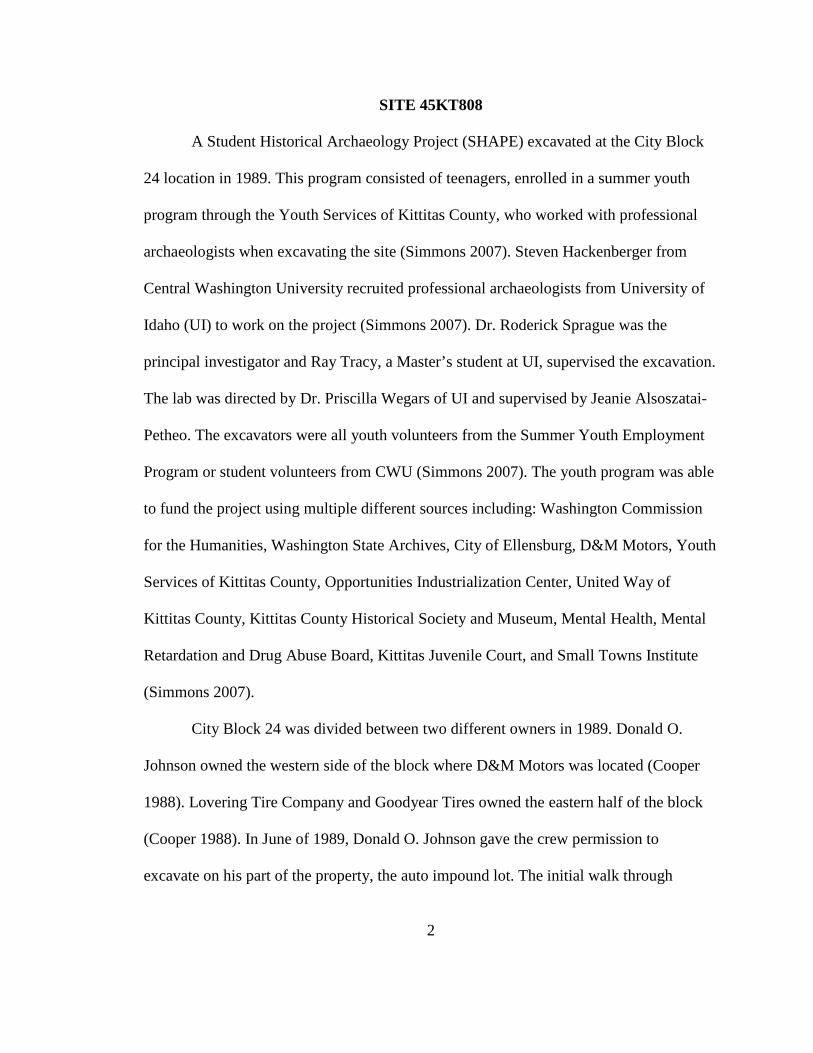
SITE 45KT808
A Student Historical Archaeology Project (SHAPE) excavated at the City Block
24 location in 1989. This program consisted of teenagers, enrolled in a summer youth
program through the Youth Services of Kittitas County, who worked with professional
archaeologists when excavating the site (Simmons 2007). Steven Hackenberger from
Central Washington University recruited professional archaeologists from University of
Idaho (UI) to work on the project (Simmons 2007). Dr. Roderick Sprague was the
principal investigator and Ray Tracy, a Master’s student at UI, supervised the excavation.
The lab was directed by Dr. Priscilla Wegars of UI and supervised by Jeanie Alsoszatai-
Petheo. The excavators were all youth volunteers from the Summer Youth Employment
Program or student volunteers from CWU (Simmons 2007). The youth program was able
to fund the project using multiple different sources including: Washington Commission
for the Humanities, Washington State Archives, City of Ellensburg, D&M Motors, Youth
Services of Kittitas County, Opportunities Industrialization Center, United Way of
Kittitas County, Kittitas County Historical Society and Museum, Mental Health, Mental
Retardation and Drug Abuse Board, Kittitas Juvenile Court, and Small Towns Institute
(Simmons 2007).
City Block 24 was divided between two different owners in 1989. Donald O.
Johnson owned the western side of the block where D&M Motors was located (Cooper
1988). Lovering Tire Company and Goodyear Tires owned the eastern half of the block
(Cooper 1988). In June of 1989, Donald O. Johnson gave the crew permission to
excavate on his part of the property, the auto impound lot. The initial walk through
2
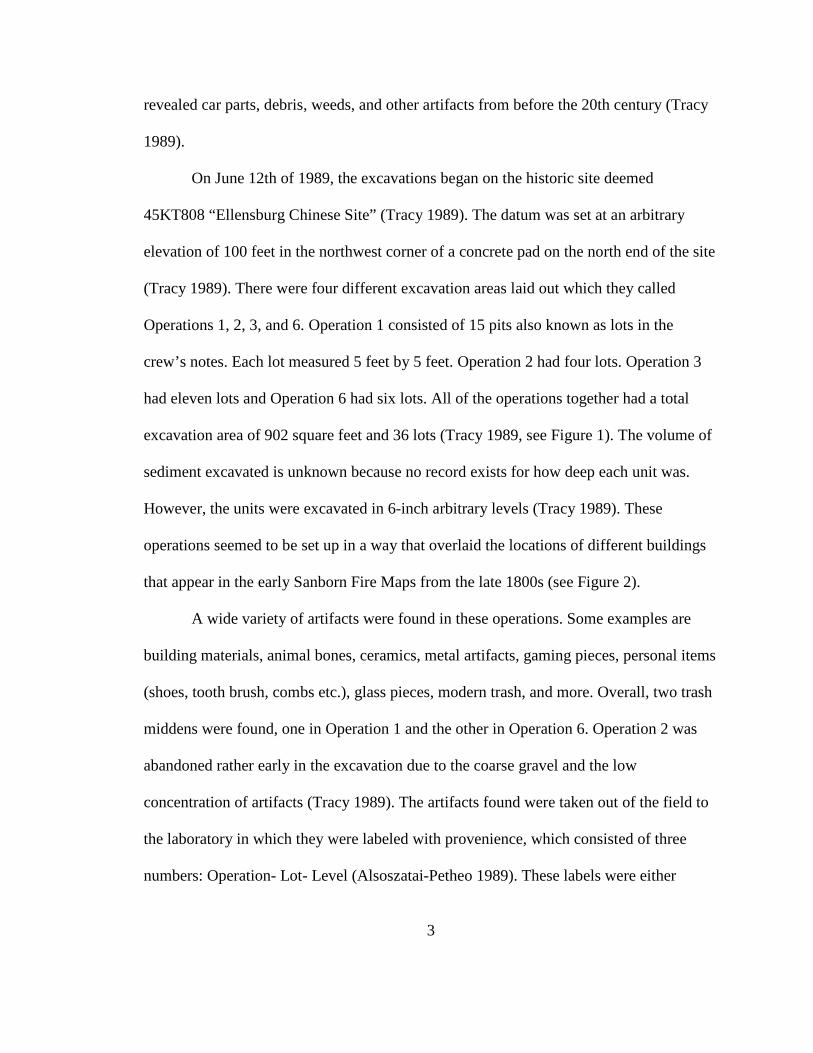
revealed car parts, debris, weeds, and other artifacts from before the 20th century (Tracy
1989).
On June 12th of 1989, the excavations began on the historic site deemed
45KT808 “Ellensburg Chinese Site” (Tracy 1989). The datum was set at an arbitrary
elevation of 100 feet in the northwest corner of a concrete pad on the north end of the site
(Tracy 1989). There were four different excavation areas laid out which they called
Operations 1, 2, 3, and 6. Operation 1 consisted of 15 pits also known as lots in the
crew’s notes. Each lot measured 5 feet by 5 feet. Operation 2 had four lots. Operation 3
had eleven lots and Operation 6 had six lots. All of the operations together had a total
excavation area of 902 square feet and 36 lots (Tracy 1989, see Figure 1). The volume of
sediment excavated is unknown because no record exists for how deep each unit was.
However, the units were excavated in 6-inch arbitrary levels (Tracy 1989). These
operations seemed to be set up in a way that overlaid the locations of different buildings
that appear in the early Sanborn Fire Maps from the late 1800s (see Figure 2).
A wide variety of artifacts were found in these operations. Some examples are
building materials, animal bones, ceramics, metal artifacts, gaming pieces, personal items
(shoes, tooth brush, combs etc.), glass pieces, modern trash, and more. Overall, two trash
middens were found, one in Operation 1 and the other in Operation 6. Operation 2 was
abandoned rather early in the excavation due to the coarse gravel and the low
concentration of artifacts (Tracy 1989). The artifacts found were taken out of the field to
the laboratory in which they were labeled with provenience, which consisted of three
numbers: Operation- Lot- Level (Alsoszatai-Petheo 1989). These labels were either
3
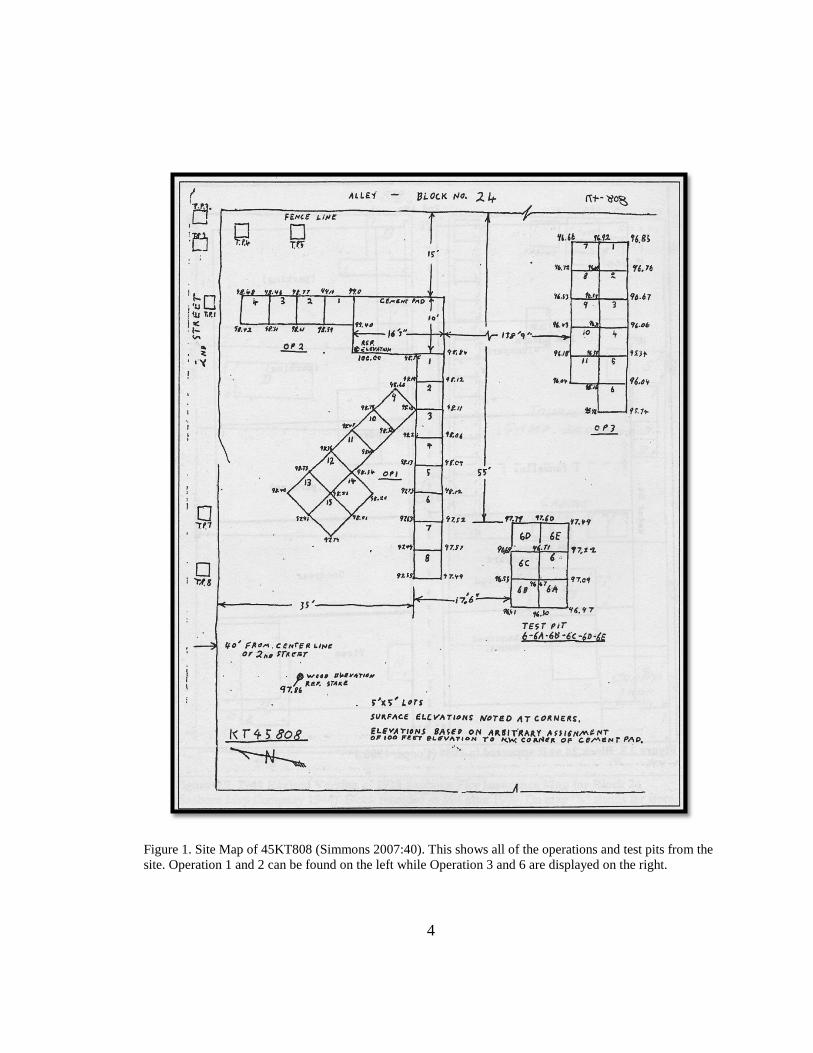
Figure 1. Site Map of 45KT808 (Simmons 2007:40). This shows all of the operations and test pits from the site. Operation 1 and 2 can be found on the left while Operation 3 and 6 are displayed on the right.
4
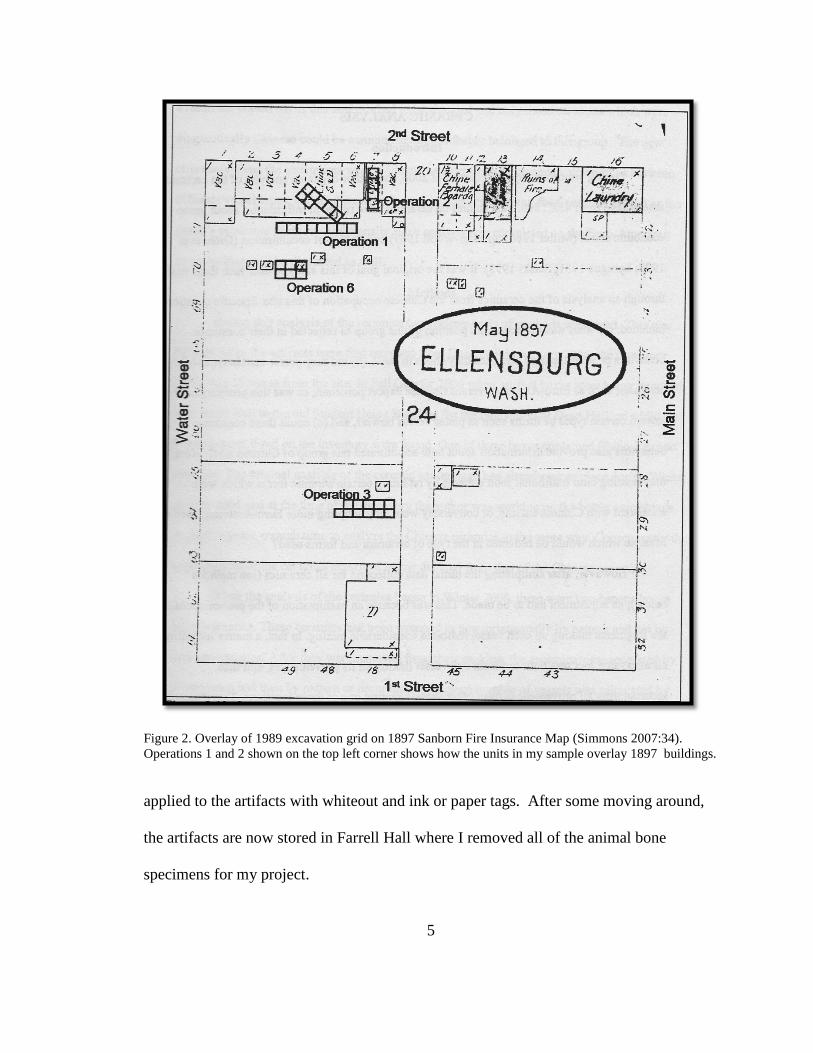
Figure 2. Overlay of 1989 excavation grid on 1897 Sanborn Fire Insurance Map (Simmons 2007:34). Operations 1 and 2 shown on the top left corner shows how the units in my sample overlay 1897 buildings. applied to the artifacts with whiteout and ink or paper tags. After some moving around,
the artifacts are now stored in Farrell Hall where I removed all of the animal bone
specimens for my project.
5
METHODS
My work on the Ellensburg City Block 24 archaeological site material consisted
of cataloging and the analysis of a sample of the animal bones. I began with inventorying
and photographing of all of the collection’s bone specimens. This included the separation
of larger faunal specimens from smaller ones and shell to decrease the possibility of
breakage. Shell specimens were not to be included in the analysis. Each bag of faunal
remains (bone or shell) was placed into a new Ziploc-style plastic bag with an acid-free
paper label. Bags were assigned catalog numbers starting with 1 and ending with 284.
The catalog numbers and counts of bone or shell from each bag were put into a Microsoft
Access database.
In order to select the sample I was to analyze, a Microsoft Access query of the
faunal specimens was performed to show the bone counts from each operation. A sample
of half of the excavation units (18), all of the lots from Operation 1 and 2, was chosen to
perform analysis upon. The sample was chosen because the size of the sample
assemblage (what I could reasonably do in my time frame), proximity of these units to ca.
1900 buildings based on the (Sanborn Fire Maps 1888, 1889, 1897, 1909; Tracy 1989),
and the fact that no other analysis had been previously performed on Operations 1 and 2
of this site. This sample included a total of 457 faunal specimens.
I examined all of these bone specimens and recorded several variables on paper
sheets, which were later entered into the Access database. I attempted to identify all
fragments to species, but often this was not possible and other, larger taxonomic groups
were commonly used instead. These identifications were made by the comparison of each
6
specimen to the skeletal specimens and published references (e.g., Schmid 1972, Olsen
1979) in the Zooarchaeology Laboratory at Central Washington University. All species
distributed in Washington in the past 500 years were considered for comparison. Non-
identified mammal specimens were classified using the five-class size system defined by
Thomas (1969) with the addition of a sixth size class for cattle-size animals. The side,
element, portion, and landmarks or the anatomical part of the bone if present and/or
identifiable were recorded as well.
Multiple features or modifications one the bone specimens, caused by processes
the bone goes through between animal death and archaeological recovery, were identified
mostly by comparison to modern osteological specimens available for use at the
zooarchaeology laboratory. These features include: burning, weathering stage, root
etching, breakage type, age indicators, saw cuts, butchering, other types of modifications,
and maximum length of the bone. A 15X hand lens was used to assist in finding small
modifications to the bone like tooth pits from carnivore gnawing. These modifications
were used in order to infer the nature of the bones deposition, such as being remnants of
food consumption, intentional burial, or non-cultural activity (e.g. bleaching,
carnivore/rodent gnawing, element completeness, and presence of matching pairs)
Dr. Lubinski verified the final identifications before being entered into the
Microsoft Access Database. This information was then queried to identify patterns in the
data, which could then provide the information to use in inferences made about the site.
Tables were then made in order to show these patterns including the number of identified
specimens (NISP), which counts each bone/ bone fragment as one unit (Payne 1975). The
7
NISP was categorized according to taxon and/or size class. An estimate of the minimum
number of individual (MNI) animals was performed to account for the total number of
bone specimens in my sample. The MNI (White 1953) was calculated by taking the
smaller of the count of left vs. right side element landmarks. Additional analysis
consisted of modification frequency tabulations such as saw cuts, or butchery marks, in
order to provide a more detailed explanation of the site’s types of specimens. For
domesticated mammal species, elements were correlated with historically-documented
butchery units following Lyman (1979) and Schultz and Gust (1983). The units I used
are provided in Tables 1 and 2 below.
Table 1. Cow Butchery units Cow Butchering Unit Cow Skeletal Elements
Hindshank Tibia, Distal Femur, Patella
Round/ Buttock Femur Shaft
Rump Proximal Femur, Ischium, Pubis, Acetabulum
Loin Illium, Lumbar Vertebrae, Sacrum
Flank No Bones
Navel End/ Plate Ventral Rib
Brisket Rib Cartilage, Sternum, Ventral Rib
Ribs Dorsal Ribs 6-12 Thoracic Vertebrae 6-12
Front Shank Radius-Ulna, Distal Humerus
Neck Cervical Vertebrae, Proximal Humerus, Distal Scapula
Chuck Dorsal Rib 1-5, Thoracic Vertebrae 1-5, Humerus Shaft, Scapula Blade Note: Units are those provided by Eakins (1924) as cited by Lyman (1979).
Apart from the faunal analysis itself some literature research was also conducted
on topics including the following: butchery units, skeletal units within the meat cuts,
8
meat cut prices, livestock population, meat prices in the Kittitas Valley, Overseas
Chinese inhabitants in the Kittitas Valley, Chinese diets, and more.
Table 2. Pig Butchering Units Pig Butchering Units Pig Skeletal Elements
Jowl Mandible (Cranium?)
Shoulder Butt Cervical Vertebrae, Scapula Blade
Picnic Shoulder Distal Scapula, Humerus, Radius-Ulna
Rough Back Thoracic and Lumbar Vertebrae, Dorsal Rib, Illium, Sacrum
Rib Belly Mid and Ventral Rib
Short Cut Ham Acetabulum, Pubis, Ischium, Femur, Proximal Tibia, and Shaft
Feet Carpals, Tarsals, Metapodials, Phalanges
Hock Distal Radius-Ulna, Fibula Shaft and Distal End, Distal Tibia. Note: Units are those provided by Eakins (1924) as cited by Lyman (1979), with the addition of hock.
FAUNAL ANALYSIS RESULTS
The entire faunal assemblage that I examined from the Ellensburg City Block 24
totaled 457 specimens from Operation 1 and Operation 2. This sample was about 36% of
the total faunal sample from the site (457/1260 NISP) and from half of the excavation
lots (18/36). The specific proveniences in my sample are the following, listed as
Operation # -Lot #: 1-1, 1-2, 1-3, 1-10, 1-13, 1-14, 1-15, 2-1, 2-3, 2-4, and 2-Surface.
The breakage observed in the sample included complete specimens, specimens
separated only along fusion plates (like unfused epiphyses), green bone breakage, recent
breakage (as from excavation damage), saw cut, and indeterminate breakage. Of the 457
bones, 95 bones (21%) of the bones were complete, and 140 (31%) were separated at the
fusion line. Nine of the bones exhibited green breakage, which are spiral fractures while
the bone is still fresh meaning at or near the time of death (Lyman 1994). This type of
9
breakage can be caused by humans getting at marrow and grease for food consumption,
however, it can be caused from other sources such as carnivores. Seventeen bones (3.7%)
were recently broken, most likely due to excavation damage caused from human
modification to the bone during the removal of the specimen from its original context in
the archaeological record. Thirteen bones (2.8%) had no signs of breakage but instead
had saw cuts on either end. Finally, 183 specimens (40%) were broken in such a way that
could not be identified to a certain class of breakage. Thirteen specimens were not broken
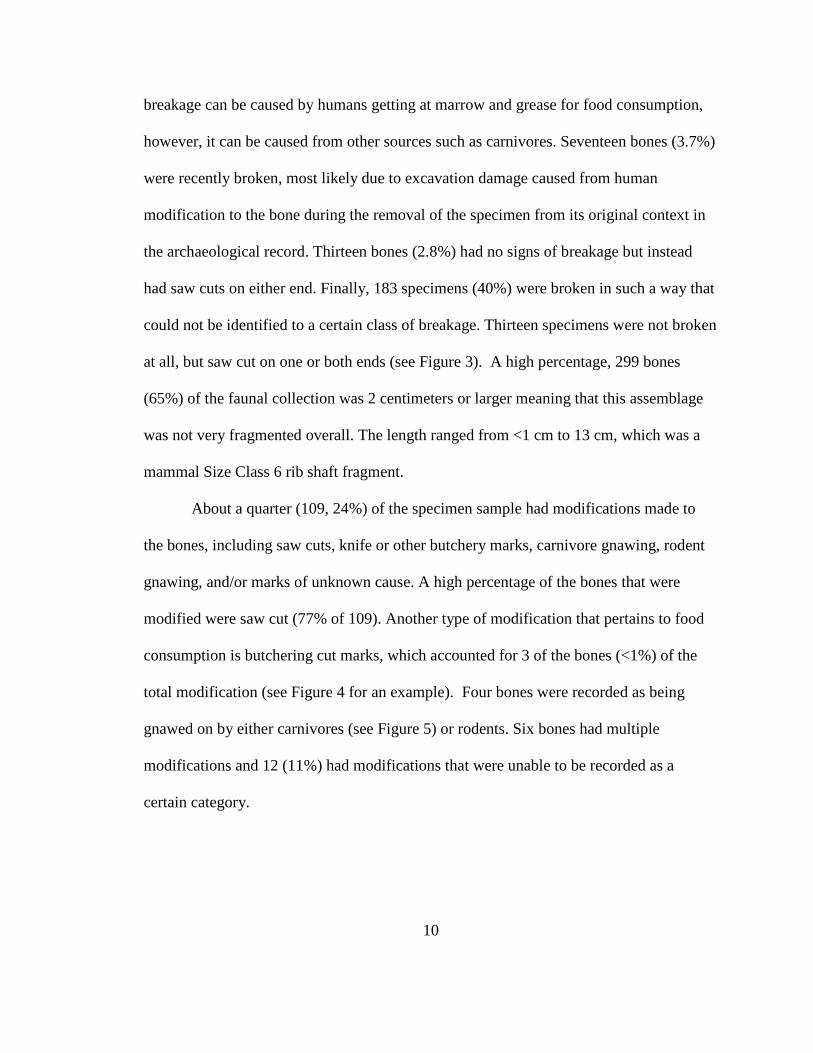
at all, but saw cut on one or both ends (see Figure 3). A high percentage, 299 bones
(65%) of the faunal collection was 2 centimeters or larger meaning that this assemblage
was not very fragmented overall. The length ranged from <1 cm to 13 cm, which was a
mammal Size Class 6 rib shaft fragment.
About a quarter (109, 24%) of the specimen sample had modifications made to
the bones, including saw cuts, knife or other butchery marks, carnivore gnawing, rodent
gnawing, and/or marks of unknown cause. A high percentage of the bones that were
modified were saw cut (77% of 109). Another type of modification that pertains to food
consumption is butchering cut marks, which accounted for 3 of the bones (<1%) of the
total modification (see Figure 4 for an example). Four bones were recorded as being
gnawed on by either carnivores (see Figure 5) or rodents. Six bones had multiple
modifications and 12 (11%) had modifications that were unable to be recorded as a
certain category.
10
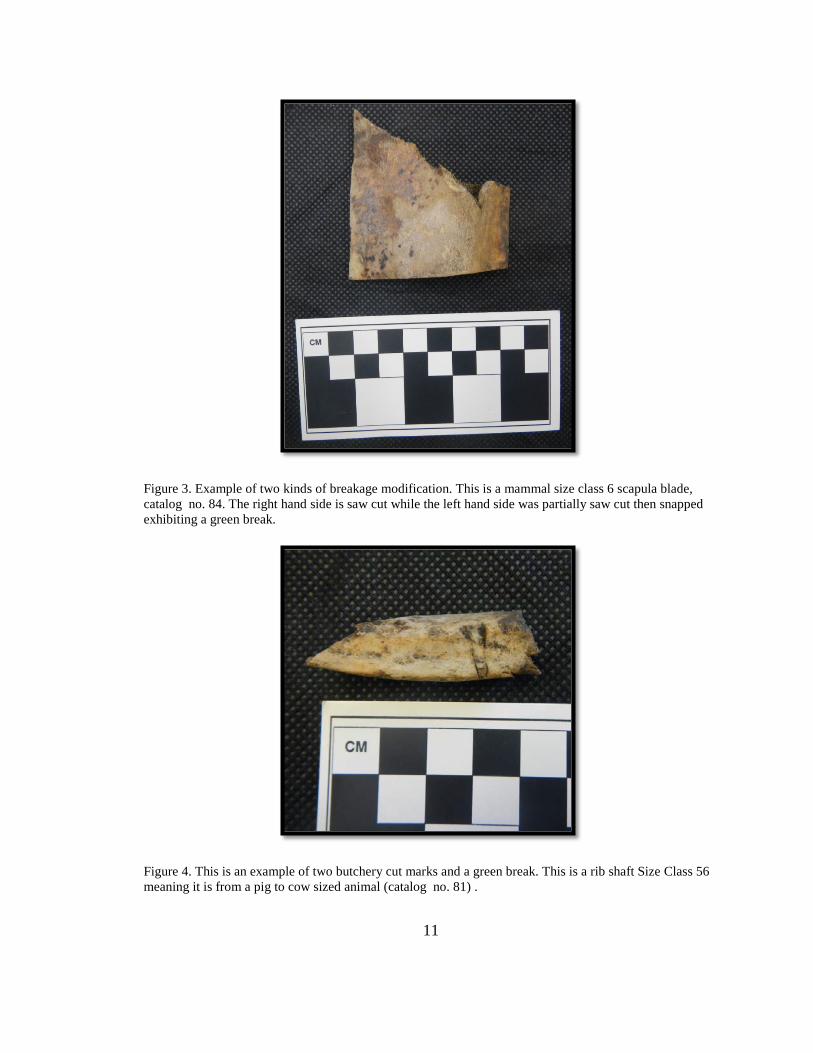
Figure 3. Example of two kinds of breakage modification. This is a mammal size class 6 scapula blade, catalog no. 84. The right hand side is saw cut while the left hand side was partially saw cut then snapped exhibiting a green break.
Figure 4. This is an example of two butchery cut marks and a green break. This is a rib shaft Size Class 56 meaning it is from a pig to cow sized animal (catalog no. 81) .
11
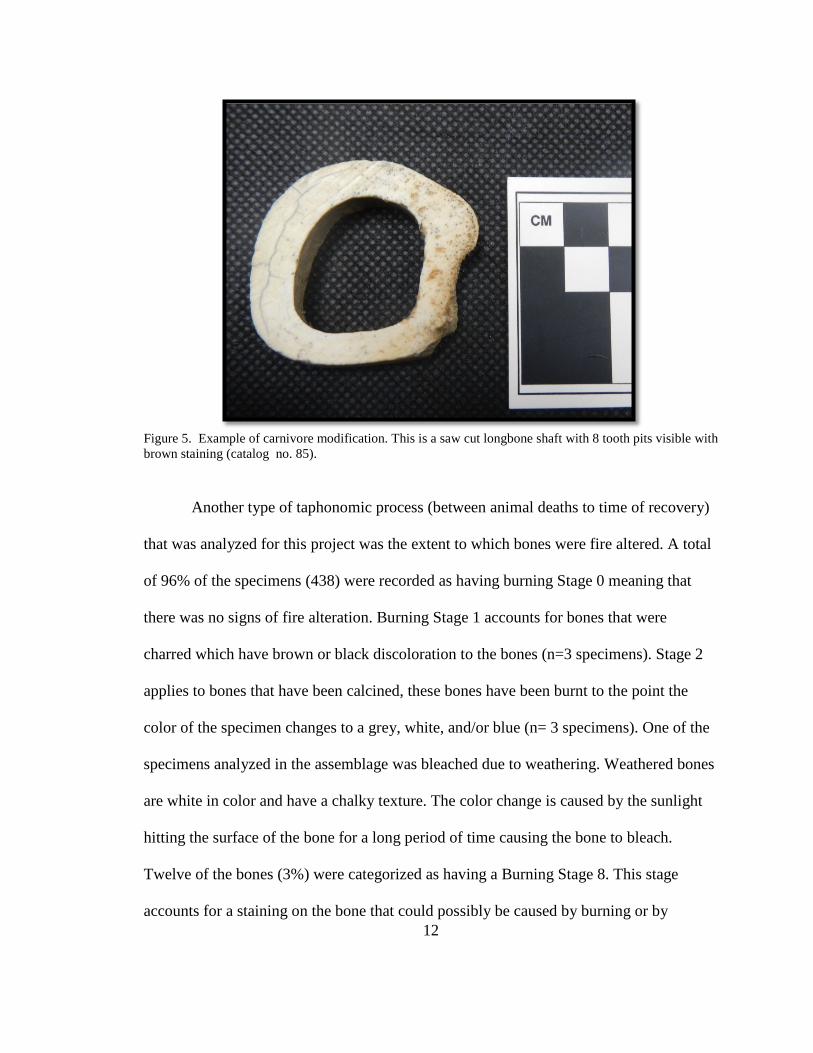
Figure 5. Example of carnivore modification. This is a saw cut longbone shaft with 8 tooth pits visible with brown staining (catalog no. 85).
Another type of taphonomic process (between animal deaths to time of recovery)
that was analyzed for this project was the extent to which bones were fire altered. A total
of 96% of the specimens (438) were recorded as having burning Stage 0 meaning that
there was no signs of fire alteration. Burning Stage 1 accounts for bones that were
charred which have brown or black discoloration to the bones (n=3 specimens). Stage 2
applies to bones that have been calcined, these bones have been burnt to the point the
color of the specimen changes to a grey, white, and/or blue (n= 3 specimens). One of the
specimens analyzed in the assemblage was bleached due to weathering. Weathered bones
are white in color and have a chalky texture. The color change is caused by the sunlight
hitting the surface of the bone for a long period of time causing the bone to bleach.
Twelve of the bones (3%) were categorized as having a Burning Stage 8. This stage
accounts for a staining on the bone that could possibly be caused by burning or by 12
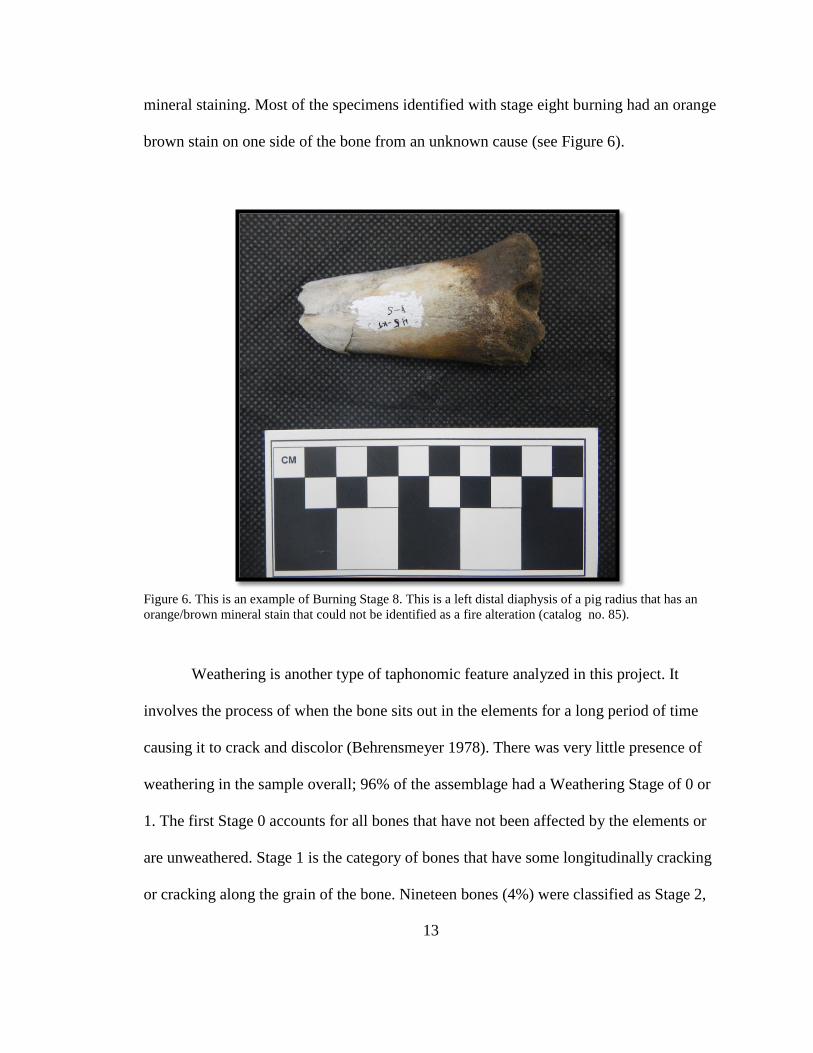
mineral staining. Most of the specimens identified with stage eight burning had an orange
brown stain on one side of the bone from an unknown cause (see Figure 6).
Figure 6. This is an example of Burning Stage 8. This is a left distal diaphysis of a pig radius that has an orange/brown mineral stain that could not be identified as a fire alteration (catalog no. 85).
Weathering is another type of taphonomic feature analyzed in this project. It
involves the process of when the bone sits out in the elements for a long period of time
causing it to crack and discolor (Behrensmeyer 1978). There was very little presence of
weathering in the sample overall; 96% of the assemblage had a Weathering Stage of 0 or
1. The first Stage 0 accounts for all bones that have not been affected by the elements or
are unweathered. Stage 1 is the category of bones that have some longitudinally cracking
or cracking along the grain of the bone. Nineteen bones (4%) were classified as Stage 2,
13
having light surface flaking with deeper more angular cracks. Finally, one bone was
associated with a Weathering Stage of 3. This bone’s surface was rough with a fibrous
texture with deep cracks with rounded edges. The high proportion of unweathered or
lightly weathered specimens means that most of the assemblage was buried fairly quickly
and not left exposed on the surface.
Root etching or the presence of grooves made from the rootlets of plants is
another taphonomic feature. A high proportion of 87% of bones were recorded as not
having root etching or Stage 0. A total of 36 specimens (8%) were recorded as having
slight root etching where the etching on the bone covers less than a quarter of the bone
(Stage 1). Heavy grooving where the bone is 25% to 50% covered in etching, or Stage 2,
accounted for 24 bones (5%). Finally, one bone was recorded as still having a rootlet in
or clinging to the specimen but no presence of etching. The low proportion of root etched
specimens means that most of the assemblage was buried fairly deeply, below the typical
depth of rootlets in the site sediment.
Among the 457 examined faunal remains, 92 were identifiable to taxon
representing a 20% identification rate. Identified taxa include birds (21, chicken,
pheasant, and chicken family), carnivores (39, dog and cat), and artiodactyls (32, pig,
cattle, and deer/sheep/pronghorn/goat). The majority of the specimens (298, 65%) were
identified only to mammal size class. The remaining taxa included 6 (1%) mammal
unknown size class, 29 (6%) unidentified bird, and 32 (7%) not identifiable to either class
or taxon (Table 3). By any measure, mammals dominated the assemblage, accounting for
88% of the total NISP.
14
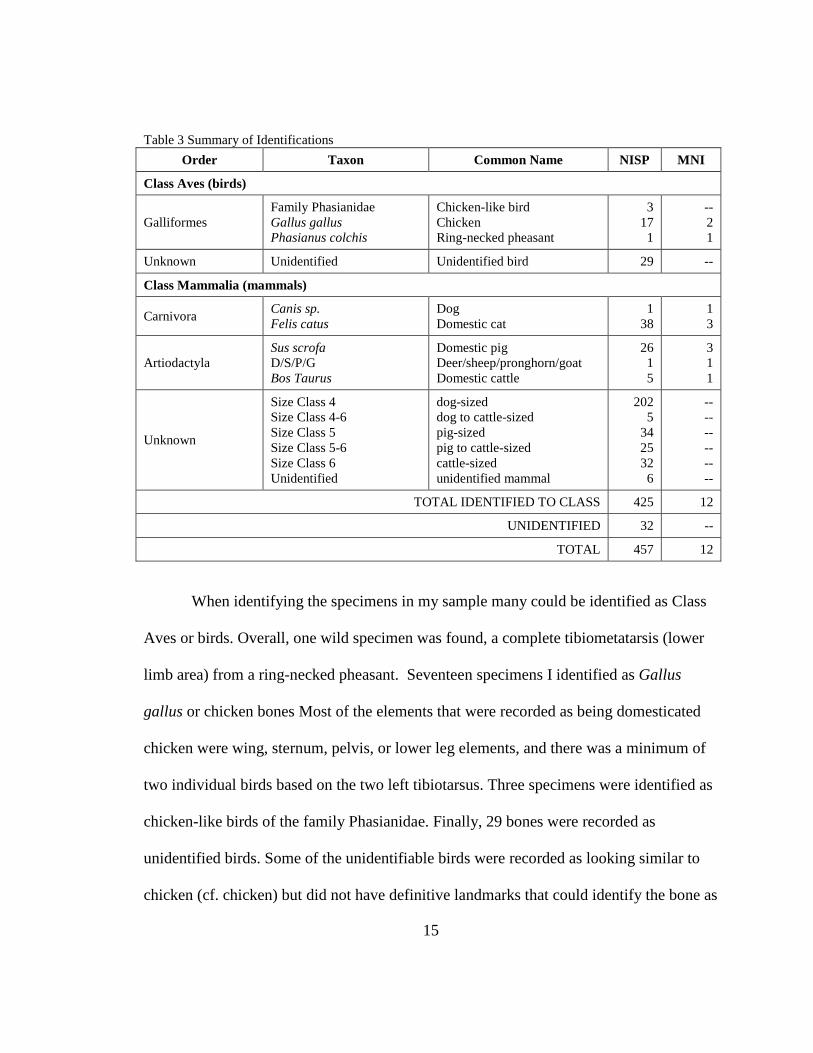
Table 3 Summary of Identifications Order Taxon Common Name NISP MNI
Class Aves (birds)
Galliformes Family Phasianidae Gallus gallus Phasianus colchis
Chicken-like bird Chicken Ring-necked pheasant
3 17 1
-- 2 1
Unknown Unidentified Unidentified bird 29 --
Class Mammalia (mammals)
Carnivora Canis sp. Felis catus
Dog Domestic cat
1 38
1 3
Artiodactyla Sus scrofa D/S/P/G Bos Taurus
Domestic pig Deer/sheep/pronghorn/goat Domestic cattle
26 1 5
3 1 1
Unknown
Size Class 4 Size Class 4-6 Size Class 5 Size Class 5-6 Size Class 6 Unidentified
dog-sized dog to cattle-sized pig-sized pig to cattle-sized cattle-sized unidentified mammal
202 5
34 25 32 6
-- -- -- -- -- --
TOTAL IDENTIFIED TO CLASS 425 12
UNIDENTIFIED 32 --
TOTAL 457 12
When identifying the specimens in my sample many could be identified as Class
Aves or birds. Overall, one wild specimen was found, a complete tibiometatarsis (lower
limb area) from a ring-necked pheasant. Seventeen specimens I identified as Gallus
gallus or chicken bones Most of the elements that were recorded as being domesticated
chicken were wing, sternum, pelvis, or lower leg elements, and there was a minimum of
two individual birds based on the two left tibiotarsus. Three specimens were identified as
chicken-like birds of the family Phasianidae. Finally, 29 bones were recorded as
unidentified birds. Some of the unidentifiable birds were recorded as looking similar to
chicken (cf. chicken) but did not have definitive landmarks that could identify the bone as
15
being a chicken. These types of specimens accounted for about 16 of the unidentifiable
birds.
The highest number of identified specimens in my assemblage could be identified
as carnivores (39/92; 42%). A majority of these identifications (38) were domesticated
cats (Felis catus). There were at least 3 individual cats recorded in the identified pieces,
based on the occurrence of three left mandibles with three 1st molars. The remaining
specimen was recorded as a dog specimen (Canis sp.). An additional 202 specimens were
recorded as Size Class 4, which accounts for animals in the weight range of 5-25 kg, and
may well include cat and dog elements which could not be identified to species. In
saying this, many of these specimens are assumed to be domesticated cats because they
are around the same size, look similar, and were found with other definitely identified cat
specimens. There is a wide variety of elements in Size Class 4, including ribs, vertebrae,
long bones, cranial elements and more. About 173 of these Size Class 4 specimens were
recorded as cf. cat/kitten.
In the order Artiodactyla three main taxa were identified. These included DSPG
(deer/sheep/pronghorn/goat), Bos taurus (domesticated cow), and Sus scrofa
(domesticated pig). Only one specimen was recorded as being DSPG, this was a
metacarpal cannonbone. A total of five bones were recorded as being domesticated cattle
specimens: unciform, lumbar vertebra, and three thoracic vertebrae. It was concluded that
the MNI of Bos taurus was one. An additional 32 Size Class 6 specimens are almost
certainly cow as well, including ribs, long bones, and vertebral pieces. A total of six of
these specimens were recorded as cf. Bos.
16
Sus Scrofa was the most abundant type of artiodactyl, making up 26 of the total
32 NISP. A sum of 3 individual domesticated pigs was recorded, on the basis of three left
fibula shafts that visually overlapped. Most of the specimens that could be identified as
domesticated pig were lower leg, foot, or vertebral elements. A total of 34 additional
specimens were identified as Size Class 5 animals. Since pigs are within the weight range
of this Size Class (25-200 kg) a high number of these specimens (18/34) were noted as
being cf. Sus. Size Class 5 specimens included ribs, vertebral pieces, long bones, and
more.
Specimens placed in mammal Size Class 456 and 56 may be derived from several
different species. Size Class 456 accounted for 5 specimens; most of the elements were
unidentifiable with one being cranial. This size class could include elements from dog,
cats, pigs, cattle, or other unidentified species. The size class between 5 and 6 or Size
Class 56 had a total of 25 bones within it, most of which were vertebral. This size range
could include pig and cattle or other similar-size animals. Finally, 32 specimens were
unidentifiable to any taxon or class.
DISCUSSION
The fauna examined from the City Block 24 assemblage was dominated by four
identified species: cat, pig, cattle, and chicken. The cat specimens composed much of the
skeleton and may represent one or more pet burials. The pig and cattle were mostly saw
cut and clearly represent food waste that might be connected with particular known
butchery cuts. The chicken was not cut, but was dominated by wing and lower leg
17
elements and is likely food debris. Overall, when comparing these facts to Simmons
(2007) previous research on Operation 6 of 45KT808, my results were quite different.
Differences between the results are discussed with each taxonomic group below.
Felis catus
Domesticated cat specimens were found in four excavation units, three adjacent
squares (1-13, 1-14, 1-15), and one widely spaced unit (2-1) while none were found in
Simmons’ (2007) sample. Although cats can be associated with a Chinese diet (Freeman
1977), based on the high number of unbroken specimens and paired elements found
within the four proveniences it is my assumption that this site has evidence of pet burials.
As Terry O’Conner (2000) states in the book The Archaeology of Animal Bones, it is not
uncommon to find the remains of companion animals such as dogs and cats that lived
with inhabitants with food debris. The fact that the bones were complete with no human
modifications supports this interpretation. Because the MNI was three, there were likely
two cat burials in 2-1 and another in 1-13/14/15.
Cat age could be estimated from mandible tooth eruption and longbone fusion.
All of the five mandible specimens show that the individuals were at least 20-24 weeks
old based on their teeth. Three of the mandibles contained a permanent molar (M1), while
the other two contained the M1 socket, which shows these cats would be at least 20-24
weeks old since this is the age at which the M1 erupts (Bellows 2011). See Figure 7 for
example cat mandibles.
18
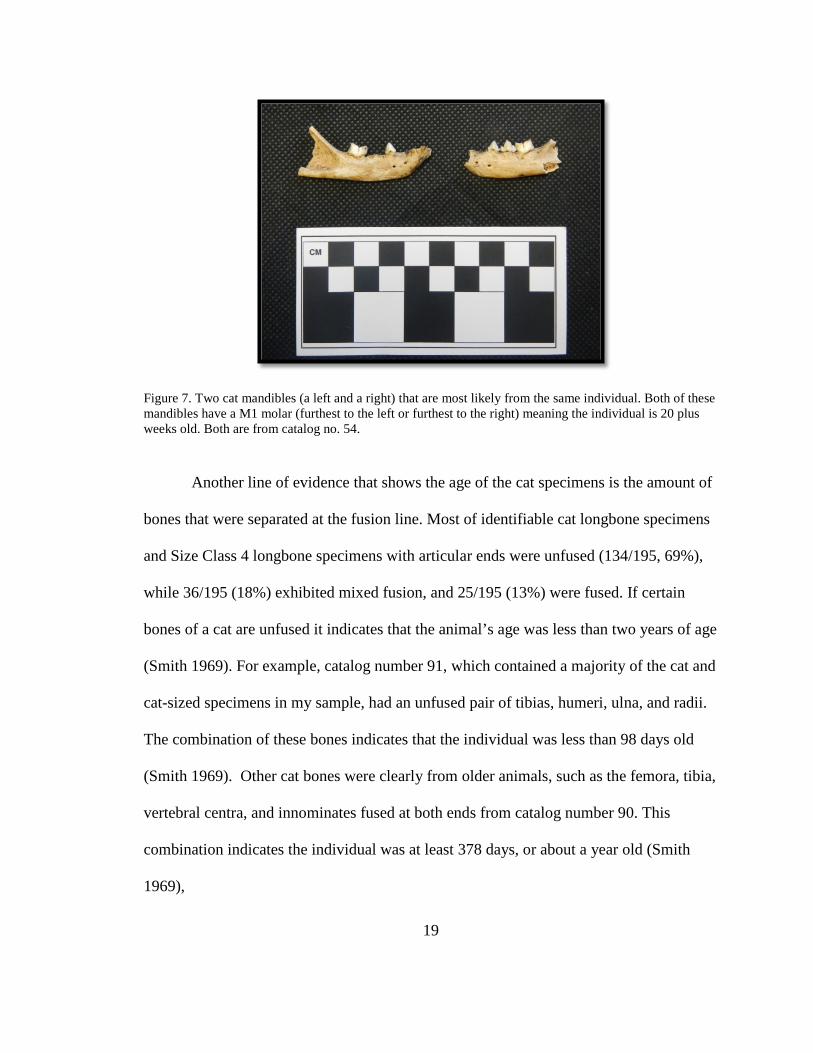
Figure 7. Two cat mandibles (a left and a right) that are most likely from the same individual. Both of these mandibles have a M1 molar (furthest to the left or furthest to the right) meaning the individual is 20 plus weeks old. Both are from catalog no. 54.
Another line of evidence that shows the age of the cat specimens is the amount of
bones that were separated at the fusion line. Most of identifiable cat longbone specimens
and Size Class 4 longbone specimens with articular ends were unfused (134/195, 69%),
while 36/195 (18%) exhibited mixed fusion, and 25/195 (13%) were fused. If certain
bones of a cat are unfused it indicates that the animal’s age was less than two years of age
(Smith 1969). For example, catalog number 91, which contained a majority of the cat and
cat-sized specimens in my sample, had an unfused pair of tibias, humeri, ulna, and radii.
The combination of these bones indicates that the individual was less than 98 days old
(Smith 1969). Other cat bones were clearly from older animals, such as the femora, tibia,
vertebral centra, and innominates fused at both ends from catalog number 90. This
combination indicates the individual was at least 378 days, or about a year old (Smith
1969),
19
Sus scrofa
If cat bones are excluded, Sus scrofa or domestic pig made up the majority of the
identifiable specimens in the sample. This finding is consistent with the idea that the
faunal remains are from the Chinese occupation of Ellensburg, and considering that the
Chinese had a known preference for pork instead of beef which were a less desirable food
choice because for many Chinese cows were sacred and rarely consumed. (Simoons
1991). In her previous research on the site, Simmons (2007) predicted that pork would be
prominent in the sample. While this was not true for Simmons’ smaller sample of 172
total NISP from Operation 6, Lot 6A, Level 1 it was true for my sample of 457 total NISP
from Operations 1 and 2. Simmons’ sample contained only 17 identified pig specimens,
or 19% (17/91) of specimens identified to family level or better, whereas my sample
contained 26 pig specimens, or 28% (26/92) of specimens identified to family level or
better. Pig had the highest identification rate of all specimens most likely used for food
consumption in my sample. That is, pig was less abundant than cat, but outnumbered
chicken, cattle, sheep.
It is surprising that this was the result of the analysis because according to the
census records for the livestock in the Kittitas County area, pig had the lowest population
making up only 4% of the livestock in the county in the 1880 territorial census
(Washington Territorial Census 1880) and also the 1907 county tax roll (Kittitas County
Auditor 1907). Pork meat was also 1.748 times more expensive than cattle meat in 1910
according to the U.S. Department of Agriculture (Simmons 2007). With the low
availability and high cost of pork one would expect that it would make up a lower
20
percentage of the sample, however this is obviously not the case with the number of
specimens identified as pig or pig-sized making up more than chicken or cattle.
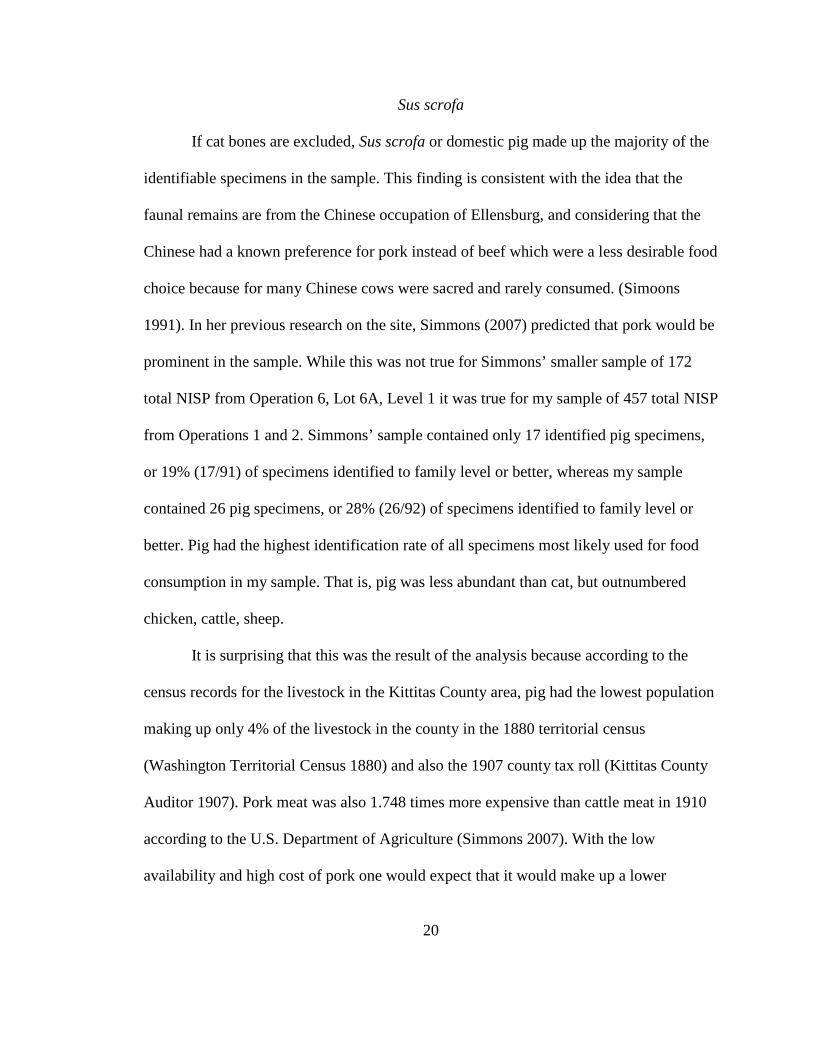
The elements of the lower leg and vertebral column dominated the identified pig
and pig-sized animals (see Figure 8). Portions of the hock and foot composed 20/47
(43%) of bone specimens that could be assigned to a cut (see Figure 9). Another
prominent meat cut was the rough back, which includes cuts like pork chops (see Figure
10), and made up 13/47 (28%). Assuming that pig meat is sold similarly to cattle meat,
foot elements of consumable animals are the least desirable and cost less because of the
lack of meat they contain, while rough back would be a more expensive meat cut because
it has a high amount of meat (Schultz and Gust 1983). A total of 52% of the pig and pig-
sized animal bones were saw cut.
Figure 8. Pig butchering units found in the sample. Units defined by Eakins (1924) used here, with the addition of hock. Graphic modified from Jackson Frozen Food Locker (2014). Red numbers indicate the NISP count of each type of butchery unit in the sample.
21
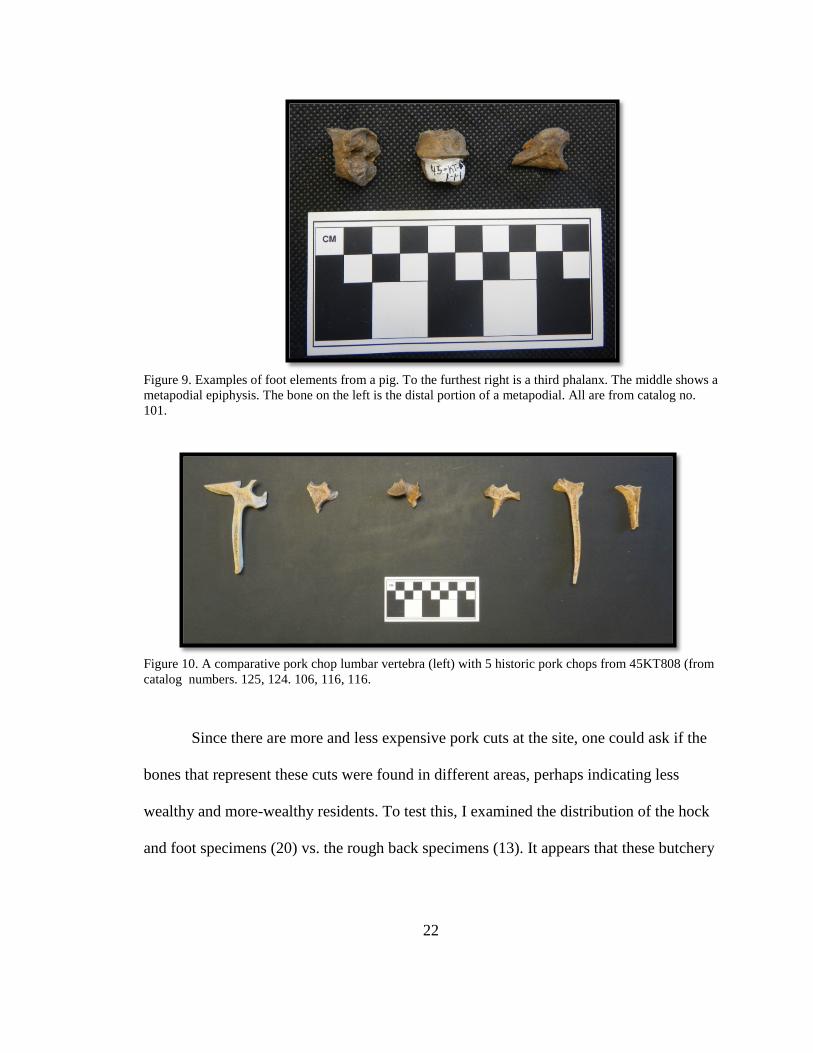
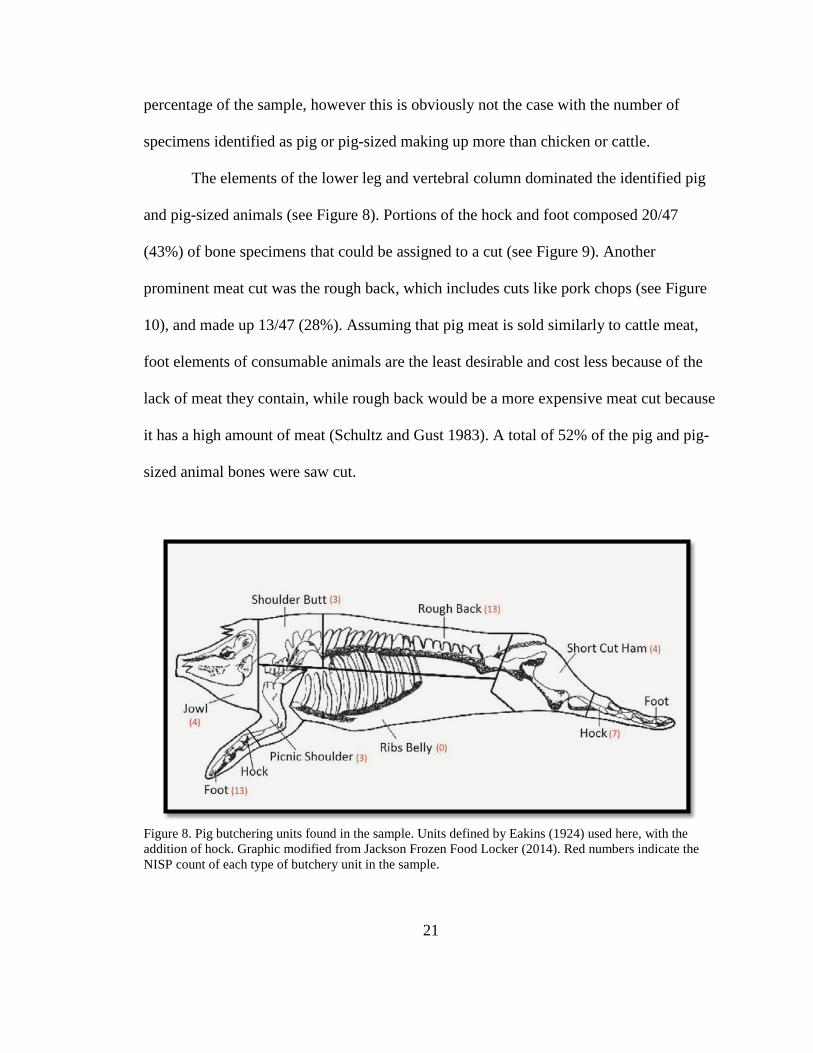
Figure 9. Examples of foot elements from a pig. To the furthest right is a third phalanx. The middle shows a metapodial epiphysis. The bone on the left is the distal portion of a metapodial. All are from catalog no. 101.
Figure 10. A comparative pork chop lumbar vertebra (left) with 5 historic pork chops from 45KT808 (from catalog numbers. 125, 124. 106, 116, 116.
Since there are more and less expensive pork cuts at the site, one could ask if the
bones that represent these cuts were found in different areas, perhaps indicating less
wealthy and more-wealthy residents. To test this, I examined the distribution of the hock
and foot specimens (20) vs. the rough back specimens (13). It appears that these butchery
22
units were distributed randomly throughout Operation 1 and Operation 2, meaning that
there is no evidence for price differential areas within the site.
Bos taurus
Cattle made up a very small percentage of the identifiable specimens in the
sample (5). However, when adding the animals in the same size range (Size Class 6) to
this category, it made up 37 of the total 457 specimens (8%). This is unlike the previous
analysis of the faunal remains from this site by Simmons (2007). Of her 172 specimens,
73 (42%) were identified to cow or cow-sized animals.
One would expect to find the majority of animals related to food consumption
from the site to be cattle, based on the fact that cattle made up the largest percentage of
livestock in Washington in 1880 and the second largest percentage in Kittitas County in
1907. In the 1880 Washington Territorial Census, cattle made up 69% of the livestock
(Washington Territorial Census 1880). In the 1907 Kittitas County Personal Property Tax
Roll, cattle made up 16% of the livestock while sheep and goats made up 77% (Kittitas
County Assessor 1907). Based on these percentages you would think that cattle, sheep,
and goats would make up the highest proportion identifiable food consumption animals in
the site. However, my sample shows that these two groups of animals made up a very
small percentage.
A total of 92% of the cattle remains had saw cut modifications. I placed all cattle
and cattle-size (Size Class 6) specimens into Eakins’ butchering units as I did for the pig
specimens (Figure 11). Elements of the Ribs/Chuck and Loin dominate; meaning most of
the specimens came from the vertebral column (see Figures 11 and 12). According to 23
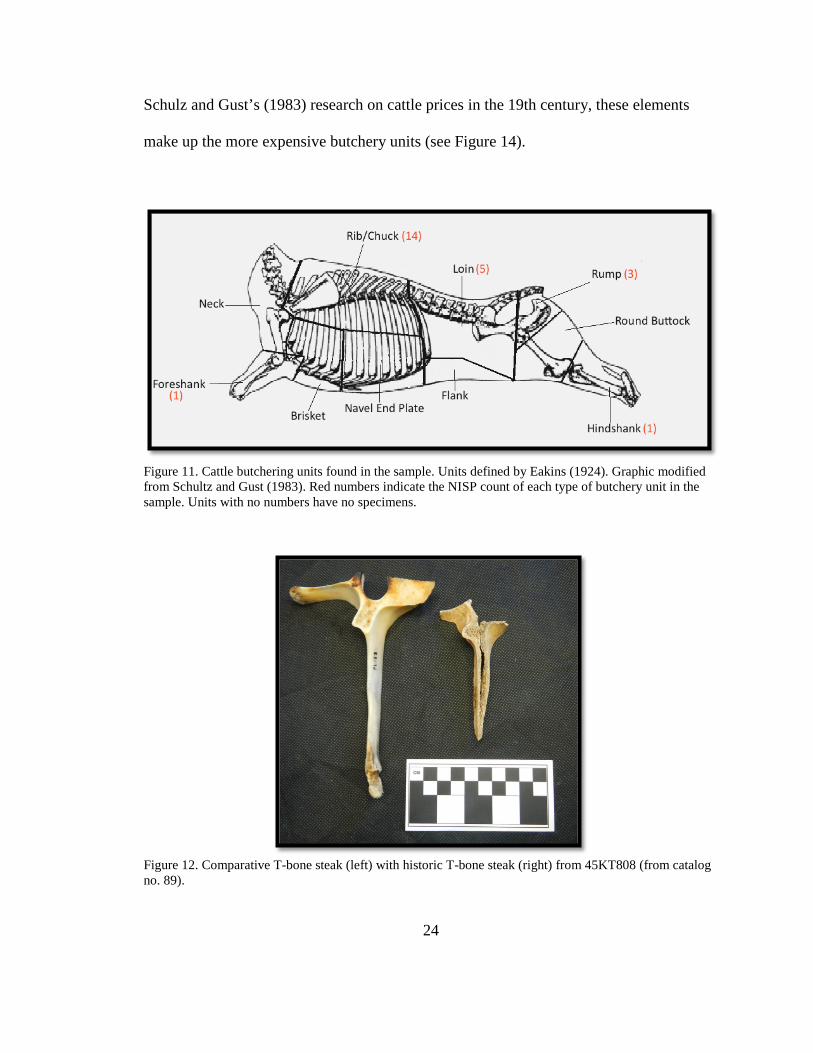
Schulz and Gust’s (1983) research on cattle prices in the 19th century, these elements
make up the more expensive butchery units (see Figure 14).
Figure 11. Cattle butchering units found in the sample. Units defined by Eakins (1924). Graphic modified from Schultz and Gust (1983). Red numbers indicate the NISP count of each type of butchery unit in the sample. Units with no numbers have no specimens.
Figure 12. Comparative T-bone steak (left) with historic T-bone steak (right) from 45KT808 (from catalog no. 89).
24
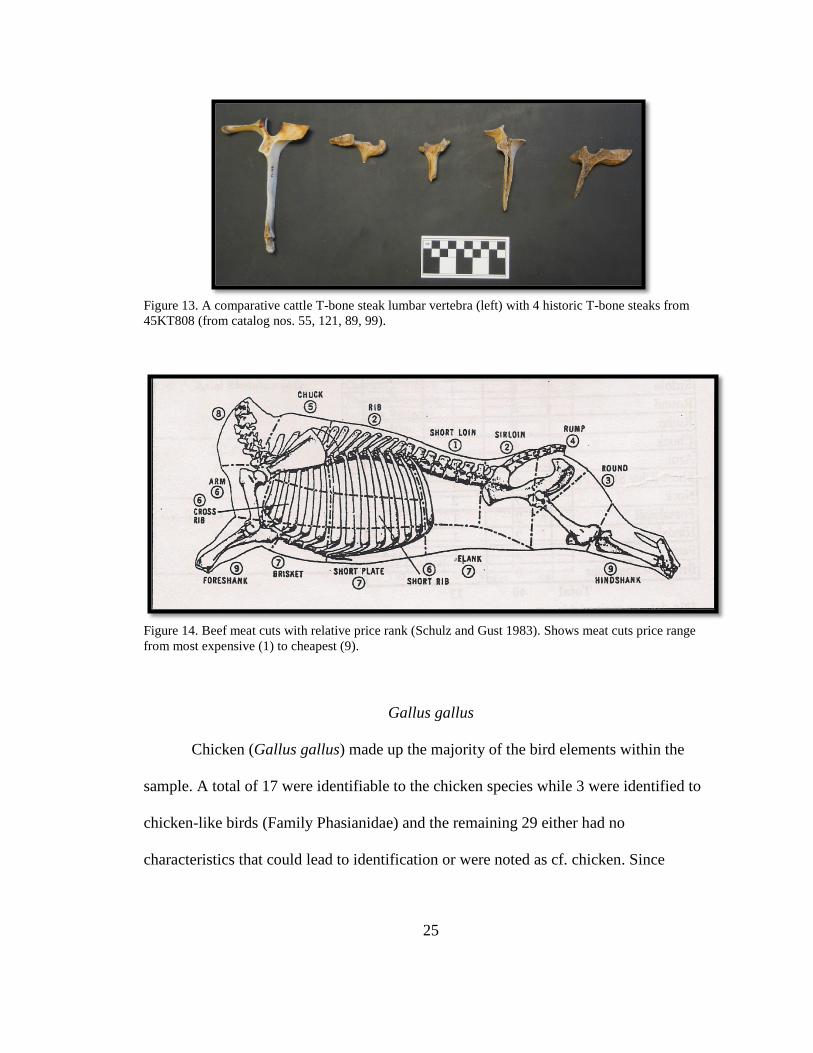
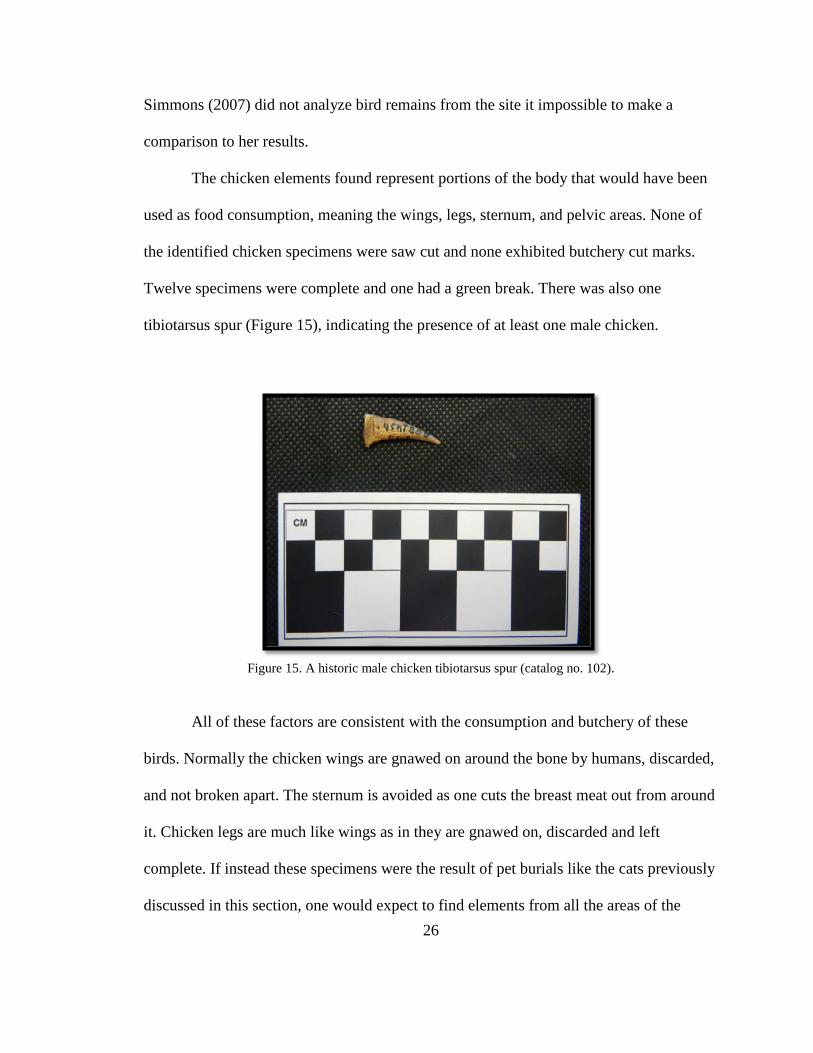
Figure 13. A comparative cattle T-bone steak lumbar vertebra (left) with 4 historic T-bone steaks from 45KT808 (from catalog nos. 55, 121, 89, 99).
Figure 14. Beef meat cuts with relative price rank (Schulz and Gust 1983). Shows meat cuts price range from most expensive (1) to cheapest (9).
Gallus gallus
Chicken (Gallus gallus) made up the majority of the bird elements within the
sample. A total of 17 were identifiable to the chicken species while 3 were identified to
chicken-like birds (Family Phasianidae) and the remaining 29 either had no
characteristics that could lead to identification or were noted as cf. chicken. Since
25
Simmons (2007) did not analyze bird remains from the site it impossible to make a
comparison to her results.
The chicken elements found represent portions of the body that would have been
used as food consumption, meaning the wings, legs, sternum, and pelvic areas. None of
the identified chicken specimens were saw cut and none exhibited butchery cut marks.
Twelve specimens were complete and one had a green break. There was also one
tibiotarsus spur (Figure 15), indicating the presence of at least one male chicken.
Figure 15. A historic male chicken tibiotarsus spur (catalog no. 102).
All of these factors are consistent with the consumption and butchery of these
birds. Normally the chicken wings are gnawed on around the bone by humans, discarded,
and not broken apart. The sternum is avoided as one cuts the breast meat out from around
it. Chicken legs are much like wings as in they are gnawed on, discarded and left
complete. If instead these specimens were the result of pet burials like the cats previously
discussed in this section, one would expect to find elements from all the areas of the 26
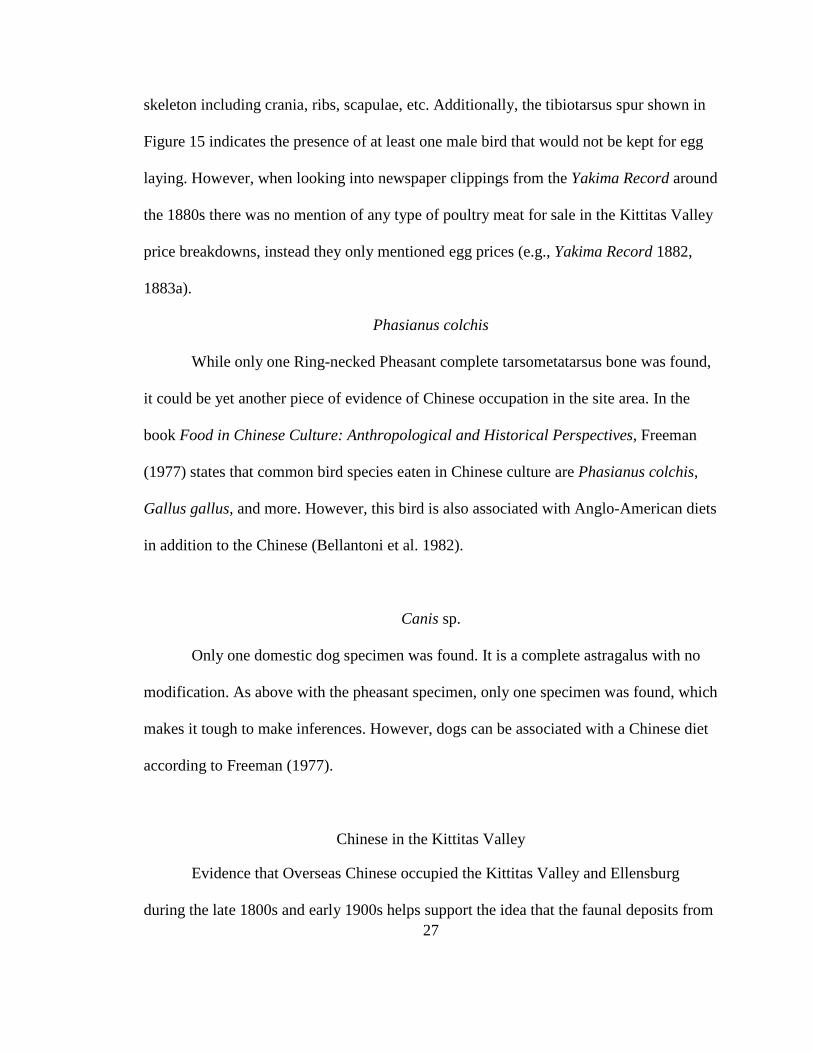
skeleton including crania, ribs, scapulae, etc. Additionally, the tibiotarsus spur shown in
Figure 15 indicates the presence of at least one male bird that would not be kept for egg
laying. However, when looking into newspaper clippings from the Yakima Record around
the 1880s there was no mention of any type of poultry meat for sale in the Kittitas Valley
price breakdowns, instead they only mentioned egg prices (e.g., Yakima Record 1882,
1883a).
Phasianus colchis
While only one Ring-necked Pheasant complete tarsometatarsus bone was found,
it could be yet another piece of evidence of Chinese occupation in the site area. In the
book Food in Chinese Culture: Anthropological and Historical Perspectives, Freeman
(1977) states that common bird species eaten in Chinese culture are Phasianus colchis,
Gallus gallus, and more. However, this bird is also associated with Anglo-American diets
in addition to the Chinese (Bellantoni et al. 1982).
Canis sp.
Only one domestic dog specimen was found. It is a complete astragalus with no
modification. As above with the pheasant specimen, only one specimen was found, which
makes it tough to make inferences. However, dogs can be associated with a Chinese diet
according to Freeman (1977).
Chinese in the Kittitas Valley
Evidence that Overseas Chinese occupied the Kittitas Valley and Ellensburg
during the late 1800s and early 1900s helps support the idea that the faunal deposits from 27
my sample could have been deposited by this population. In Simmons’ (2007) report she
performed an in-depth historic document analysis to demonstrate the presence of this
population in the area. According to her findings in various newspapers, city directories,
and the Sanborn Fire Insurance maps it was clear Overseas Chinese did have a presence
in Ellensburg. As I did some follow up research I found the same information she had
found.
Various Ellensburg City Directories contain entries of Chinese named residents
and businesses (e.g., Polk Directories 1888, 1889, 1904, 1907, 1911, 1915, 1919, 1929).
Contemporary newspapers mention Chinese men coming to work in the mines in the
Swauk area north of Ellensburg (e.g., Yakima Record 1880). There is also a lot of
evidence for Euroamerican hostility towards the Chinese at this time in the Kittitas
Valley area. There was one article that spoke of a Chinaman being murdered down by his
workplace and left in a cabin by the river (Yakima Record 1883b). Another spoke of a
Chinaman named “Ayone You” marrying a girl from Victoria and it stated “The bride is
not a bad looking girl; in fact, she looks like she should know better” (Ellensburg Capital
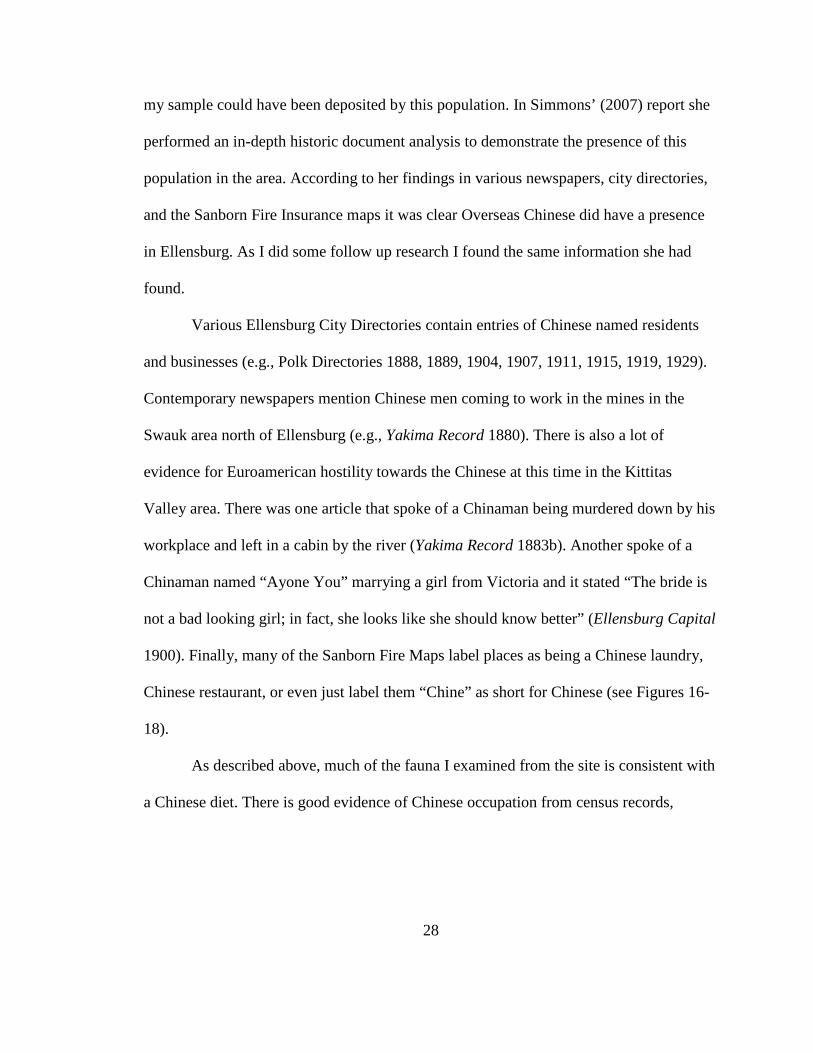
1900). Finally, many of the Sanborn Fire Maps label places as being a Chinese laundry,
Chinese restaurant, or even just label them “Chine” as short for Chinese (see Figures 16-
18).
As described above, much of the fauna I examined from the site is consistent with
a Chinese diet. There is good evidence of Chinese occupation from census records,
28
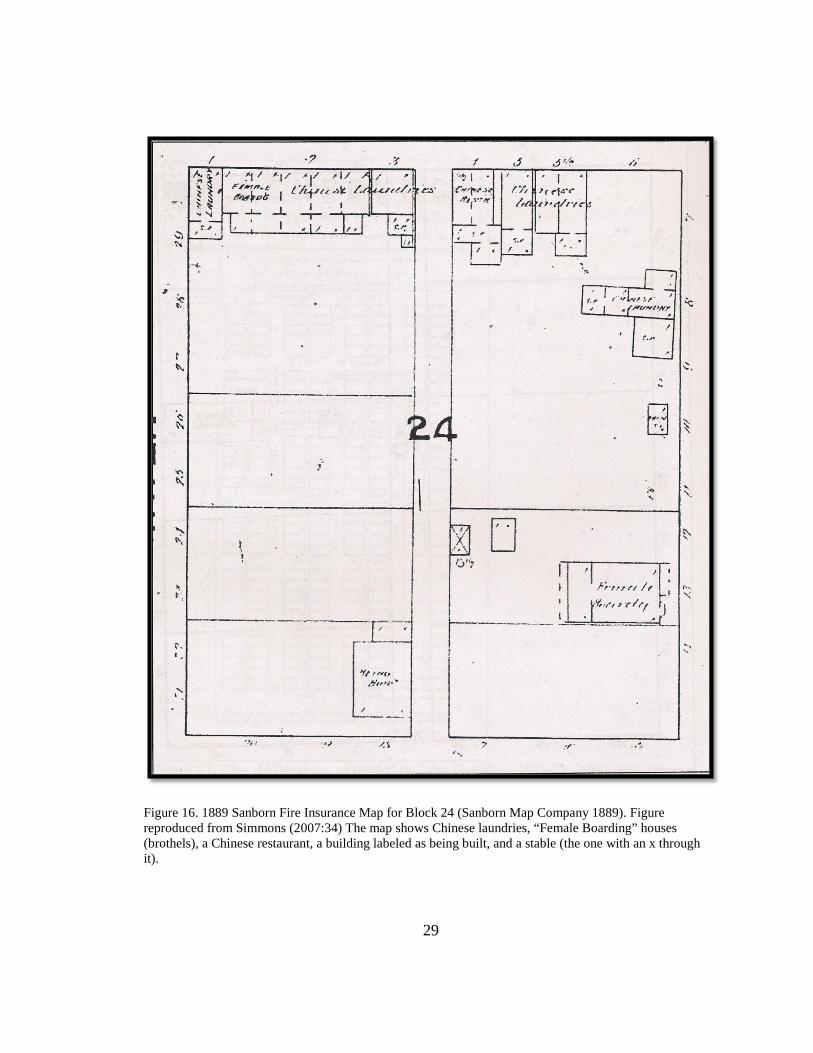
Figure 16. 1889 Sanborn Fire Insurance Map for Block 24 (Sanborn Map Company 1889). Figure reproduced from Simmons (2007:34) The map shows Chinese laundries, “Female Boarding” houses (brothels), a Chinese restaurant, a building labeled as being built, and a stable (the one with an x through it).
29
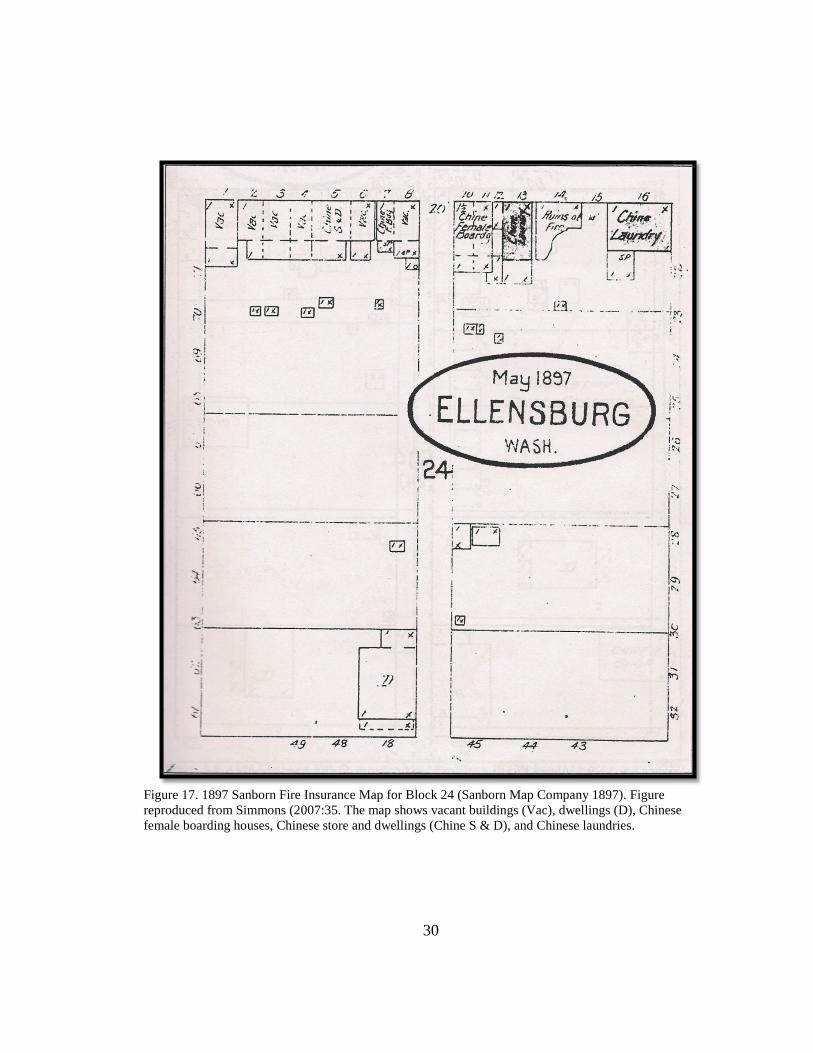
Figure 17. 1897 Sanborn Fire Insurance Map for Block 24 (Sanborn Map Company 1897). Figure reproduced from Simmons (2007:35. The map shows vacant buildings (Vac), dwellings (D), Chinese female boarding houses, Chinese store and dwellings (Chine S & D), and Chinese laundries.
30
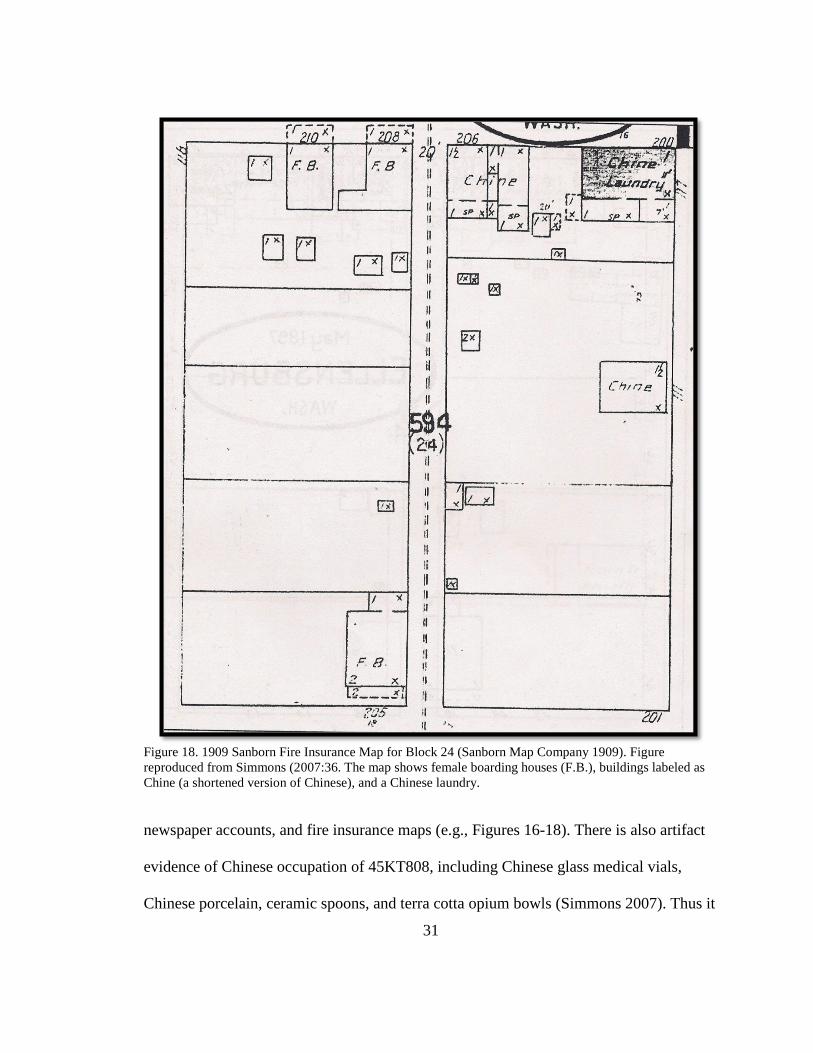
Figure 18. 1909 Sanborn Fire Insurance Map for Block 24 (Sanborn Map Company 1909). Figure reproduced from Simmons (2007:36. The map shows female boarding houses (F.B.), buildings labeled as Chine (a shortened version of Chinese), and a Chinese laundry.
newspaper accounts, and fire insurance maps (e.g., Figures 16-18). There is also artifact
evidence of Chinese occupation of 45KT808, including Chinese glass medical vials,
Chinese porcelain, ceramic spoons, and terra cotta opium bowls (Simmons 2007). Thus it
31
is reasonable to suppose that some portion of the examined faunal assemblage may be
Chinese. However, it is not certain what proportion may be Chinese and what proportion
is Anglo-American, especially since the exact age of the faunal remains is unknown.
CONCLUSION
The results of this project were a surprise considering the results of the prior
faunal sample from the site by Simons (2007). The fact that the most abundant faunal
specimens used for food consumption in my sample were pig is completely different than
Simmons’ previous project done on a different portion of the site. My results showed that
there was an obvious preference for pig as a food choice since it made up the largest
percentage of identifiable remains (aside from cat remains) and had a high percentage of
saw cut specimens. Chicken was also a high preference for the inhabitants of City Block
24. Cattle specimens made up a lower percentage of the identifiable specimens used for
consumption and small hoofed mammals had the lowest percentage.
When looking at the type of butchery units for the pig, lower limb specimens like
feet and hock units dominated. This may be interpreted if we assume that the economic
ranking of pig meat cuts is similar to the ranking of cattle meat cuts reported by (Shultz
and Gust 1983). Lower cost meat cuts such as feet were found to be the most abundant,
while the most expensive meat cut (rough back) was the second most abundant pig cut.
With this difference displayed in the results I decided to determine whether or not these
differently priced butchery units were concentrated in one area of the site. The butchery
32
units were distributed randomly throughout the site, possibly due to the high amount of
disturbance observed on the surface (Tracy 1989).
In the cattle category vertebral elements dominated, which according to Schultz
and Gust (1983) was the most expensive type of cattle meat cut. As many as three cats
were found in the sample. Their bones are believed to be the result of animal burials
rather than food debris.
Based on historic documents and artifacts found at the site, one can assume there
was a presence of Oversea Chinese in the City Block 24 area. My faunal results are
consistent with Chinese occupation, including a diet preference for swine and chicken.
The fact that pigs were more expensive than cattle in the late 1800s and early 1900s
shows that the residents were not hurting for money.
Although this study has expanded our knowledge of early Ellensburg inhabitant
food preferences, more research can be done to further our knowledge. More historical
documentation research should be conducted in order to find a good reference for pig
meat unit prices and chicken prices. This research would help to show more of the social
hierarchy of the site within the whole community. Additionally, since the faunal analysis
results of both my own project and Simmons’ project were unrelated, it may be helpful to
perform another small analysis to see if the results from the larger sample are consistent
with the whole site. Finally, a comparison of results to another Ellensburg faunal
collection from another contemporaneous site could be useful to show the differentiation
between different areas of Ellensburg.
33
REFERENCES CITED
Alsoszatai-Petheo, Jeanie 1989 Book 1: Inventory of Operation 1. Manuscript on file, Anthropology Department,
Central Washington University, Ellensburg. Behrensmeyer, Anna K. 1978 Taphonomic and Ecologic Information from Bone Weathering. Paleobiology
4(2):150-162 Bellantoni, Nicholas, Robert Gradie III, and David Poirier 1982 Zooarchaeoloy and Social History of the Butler-McCook Homestead, Hartford,
Connecticut. Northeast Historical Archaeology 11(1):1-8. Bellows, Jan 2011 Tooth Eruption and Exfoliation in Dogs and Cats. DVM360 Magazine. Electronic
document, http://veterinarynews.dvm360.com/dvm/Dentistry/Tooth-eruption-and-exfoliation-in-dogs-and-cats/ArticleStandard/Article/detail/701974, accessed March 11, 2013.
Cooper, Daniel G. 1988 Ellensburg History: A Block in Time and History: A History of J.A. Shoudy’s
Original Town Block #24. Paper submitted to W.H. Adams for Anthropology 498: Historical Archaeology. Manuscript on file, Anthropology Department, Central Washington University, Ellensburg.
Ellensburg Capital 1900 Untitled. 30 June. Ellensburg, Washington. Freeman, Michael. 1977 Han China. In Food in Chinese Culture: Anthropological and Historical
Perspectives,edited by K.C. Chang, pp. 55-82. Yale University Press, New Haven, Connecticut.
Gust, Sherri M. 1993 Animal Bones from Historic Urban Chinese Sites: A Comparison of Sacramento,
Woodland, Tucson, Ventura, and Lovelock. In Hidden Heritage: Historical Archaeology of the Overseas Chinese, edited by Priscilla Wegars, pp. 177-214. Baywood Publishing Company, Amityville, New York.
Hueslbeck, David R. 1991 Faunal Remains and Consumer Behavior: What is Being Measured? Historical
Archaeology 25(2):62-76.
34
Kittitas County Assessor 1907 Personal Property Tax Roll. File MS-7547 on file at Washington State Archives,
Central Branch, Ellensburg. Kittitas County Centennial Committee 1989 A History of Kittitas County Washington, volume I. Taylor Publishing Company,
Dallas, Texas. Lyman, R. Lee 1994 Vertebrate Taphonomy. Cambridge Manuals in Archaeology. Cambridge
University, Cambridge. 1979 Available Meat From Faunal Remains: A Consideration of Techniques. American
Antiquity 44(3):536-546. Lyman, W. D. 1919 History of the Yakima Valley Washington: Comprising Yakima, Kittitas, and
Benton Counties, Vol. 1. S. J. Clarke Publishing Company, Chicago Illinois. Olsen, Stanley J. 1979 Osteology for the Archaeologist. The Peabody Museum, Cambridge,
Massachusetts Payne, Sebastian 1975 Partial Recovery and Sample Bias. In Archaeozoological Studies, edited by A.T.
Clason, pp. 7-17. American Elsevier, New York. Polk, R.L. and Company 1888 R.L. Polk & Co.'s Puget Sound directory, 1888, Vol. II. R.L. Polk and Co.,
Portland, Oregon. 1890 R.L. Polk & Co.’s Directory of Ellensburg and North Yakima, Vol. I. R.L. Polk
and Co., Portland, Oregon. 1904 R.L. Polk & Co.’s Directory of Ellensburg and Kittitas County, Vol. I. R.L. Polk
and Co. Publishers, Seattle. 1907 R.L. Polk & Co.’s Directory of Ellensburg and Kittitas County, Vol. II. R.L.Polk
and Co. Publishers, Seattle. 1911 R.L. Polk & Co.’s Directory of Ellensburg and Kittitas County, Vol. III. R.L. Polk
and Co. Publishers, Seattle. 1913 R.L. Polk & Co.’s Directory of Ellensburg and Kittitas County, Vol. IV. R.L. Polk
and Co. Publishers, Seattle. 1915 R.L. Polk & Co.’s Directory of Ellensburg and Kittitas County, Vol. V. R.L. Polk
and Co. Publishers, Seattle, Washington. 1919 R.L. Polk & Co.’s Directory of Ellensburg and Kittitas County, Vol. VII. R.L.
Polk and Co. Publishers, Seattle, Washington.
35
1929 R.L. Polk & Co.’s Directory of Ellensburg and Kittitas County, Vol. IIX. R.L. Polk and Co. Publishers, Seattle, Washington.
Sanborn Map Company 1888 City of Ellensburg Sanborn Fire Insurance Maps. Microform on file, Brooks
Library, Central Washington University, Ellensburg, Microform MM-892 Reel 4. 1889 City of Ellensburg. Sanborn Fire Insurance Maps. Microform on file, Brooks
Library: Central Washington University, Ellensburg. Microform MM-892 Reel 4. 1897 City of Ellensburg. Sanborn Fire Insurance Maps. Microform on file, Brooks
Library: Central Washington University, Ellensburg. Microform MM-892 Reel 4. 1909 City of Ellensburg. Sanborn Fire Insurance Maps. Microform on file, Brooks
Library: Central Washington University, Ellensburg. Microform MM-892 Reel 4. 1928 City of Ellensburg. Sanborn Fire Insurance Maps. Microform on file, Brooks
Library: Central Washington University, Ellensburg. Microform MM-892 Reel 4. 1944 City of Ellensburg. Sanborn Fire Insurance Maps. Microform on file, Brooks
Library: Central Washington University, Ellensburg. Microform MM-892 Reel 4. Schmid, Elisabeth 1972 Atlas of Animal Bones for Prehistorians, Archaeologists, and Quaternary
Geologists. Elsevier Publishing Company, New York. Schulz, Peter D., and Sherri M. Gust 1983 Relative Beef Cut Prices in the Late Nineteenth Century; A Note for Historic Site
Faunal Analysts. Pacific Coast Archaeological Society Quarterly 19(1):12-18. Simmons, Stephanie C. 2007 Historical Archaeology of the Overseas Chinese of City Block 24. Unpublished
Senior Honors thesis, Department of Anthropology, Central Washington University, Ellensburg.
Simoons, Frederick J. 1991 Food in China: A Cultural and Historical Inquiry. CRC Press, Boston,
Massachusetts. Smith, R. N. 1969 Fusion of Ossification Centers in the Cat. Journal of Small Animal Practice 10(9):
523. Staski, Edward. 1993 The Overseas Chinese in El Paso: Changing Goals, Changing Realities. In Hidden
Heritage: Historical Archaeology of the Overseas Chinese, edited by Priscilla Wegars, pp. 125-150. Baywood Publishing Company, Amityville, New York.
36
Thomas, David Hurst 1969 Great Basin Hunting Patterns: A Quantitative Method for Treating Faunal Remains.
American Antiquity 34(4):392-401. Tracy, Ray 1989 Original unpublished field notes from 45KT808. Manuscript on file, Department
of Anthropology, Central Washington University. Ellensburg, Washington. United States Department of Agriculture 1921 Yearbook 1920. U.S. Government Printing Office, Washington D.C. 1926 Yearbook 1925. U.S. Government Printing Office, Washington D.C. 1935 Yearbook of Agriculture 1935. U.S. Government Printing Office, Washington D.C. United States Department of Commerce Bureau of the Census. 1913 Census of the U.S. Agriculture 1910. U.S. Government Printing Office,
Washington D.C. Washington Territorial Census 1880 Production of Agriculture in Lower Yakima, in the County of Yakima. Manuscript
on file at Washington State Archives, Central Branch, Ellensburg, Washington. File MS 7547.
Wegars, Priscilla (Editor) 1993 Hidden Heritage: Historical Archaeology of the Overseas Chinese. Baywood
Publishing Company, Amityville, New York. White, Theodore E. 1953 A Method of Calculating the Dietary Percentage of Various Food Animals
Utilized by Aboriginal Peoples. American Antiquity 18(4):396-398. Yakima Record 1880 Kittitas Valley Notes. 4 Sept. Yakima, Washington Territory. Electronic
document, http://www.rootsweb.ancestry.com/~wakcgs/yak_rec_09041880.html, accessed May 5, 2014.
1882 “Market Prices in Ellensburg,” 30 December. Yakima, Washington Territory. 1883a “Market Prices in Ellensburg,” 3 March. Yakima, Washington Territory. 1883b “Whites Run Off Chinamen,” 28 April. Yakima, Washington Territory.
37
Copyright © 2022 FDOKUMEN