Phytoliths as quantitative indicators for the reconstruction of past environmental conditions in...
14
Quaternary Science Reviews 26 (2007) 759–772 Phytoliths as quantitative indicators for the reconstruction of past environmental conditions in China II: palaeoenvironmental reconstruction in the Loess Plateau Hou-Yuan Lu a, , Nai-Qin Wu a , Kam-Biu Liu b , Hui Jiang c , Tung-Sheng Liu a a Institute of Geology and Geophysics, Chinese Academy of Sciences, Beijing 100029, China b Department of Geography and Anthropology, Louisiana State University, Baton Rouge, LA 70803, USA c State Key Laboratory of Estuarine and Coastal Research, East China Normal University, Shanghai 200062, China Received 29 April 2006; received in revised form 22 September 2006; accepted 13 October 2006 Abstract Quantitative reconstruction of the climatic history of the Chinese Loess Plateau is important for understanding present and past environment and climate changes in the Northern Hemisphere. Here, we reconstructed mean annual temperature (MAT) and mean annual precipitation (MAP) trends during the last 136 ka based on the analysis of phytoliths from the Weinan loess section (34124 0 N, 109130 0 E) near the southern part of the Loess Plateau in northern China. The reconstructions have been carried out using a Chinese phytolith–climate calibration model based on weighted averaging partial least-squares regression. A series of cold and dry events, as indicated by the reconstructed MAT and MAP, are documented in the loess during the last glacial periods, which can be temporally correlated with the North Atlantic Heinrich events. Our MAT and MAP estimations show that the coldest and/or driest period occurred at the upper part of L2 unit (Late MIS 6), where MAT dropped to ca 4.4 1C and MAP to ca 100 mm. Two other prominent cold-dry periods occurred at lower Ll-5 (ca 77–62 ka) and L1-1 (ca 23–10.5 ka) where the MAT and MAP decreased to about 6.1–6.5 1C and 150–370 mm, respectively, ca 6.6–6.2 1C and 400–200 mm lower than today. However, the highest MAT (average 14.6 1C, max. 18.1 1C) and MAP (average 757 mm, max. 1000 mm) occurred at Sl interval (MIS 5). During the interstadial of L1-4–L1-2 (MIS 3) and during the Holocene warm-wet period, the MAT was about 1–2 1C and MAP 100–150 mm higher than today in the Weinan region. The well-dated MAT and MAP reconstructions from the Chinese Loess Plateau presented in this paper are the first quantitatively reconstructed proxy record of climatic changes at the glacial–interglacial timescale that is based on phytolith data. This study also reveals a causal link between climatic instability in the Atlantic Ocean and climate variability in the Chinese Loess Plateau. r 2006 Elsevier Ltd. All rights reserved. 1. Introduction Understanding long-term climatic change requires con- sideration of spatial as well as temporal aspects of climate dynamics (Cheddadi et al., 1998; Rousseau and Kukla, 2000; Ding et al., 2002). Therefore, accurate reconstruc- tions of regional temperature and precipitation patterns are needed in order to trace the response of regional environment to climatic changes and to assess global circulation models on a regional scale (COHMAP Members, 1988; Seppa¨ et al., 2004). The loess–palaeosol record in northern China is one of the most significant natural archives of environmental changes in the continental warm temperate and semi- humid areas. The loess section is more than 300 m thick in some places, consisting of a sequence of loess and palaeosol layers that records climate variations over the last 2.6 Ma (Heller and Liu, 1982; Liu, 1985; Kukla and An, 1989; An et al., 1990, 1991; Rutter, 1992; Ding et al., 1994, 1995, 2002; Xiao et al., 1995; Guo et al., 1996, 1998; An and Porter, 1997; Sun et al., 1997; Liu and Ding, 1998; Rousseau et al., 2000; Porter, 2001). Reconstructions of palaeoclimate in the Loess Plateau have long been based ARTICLE IN PRESS 0277-3791/$ - see front matter r 2006 Elsevier Ltd. All rights reserved. doi:10.1016/j.quascirev.2006.10.006 Corresponding author. Tel.: +086 10 62008125; fax: +086 10 62032495. E-mail address: [email protected] (H.-Y. Lu).
Transcript of Phytoliths as quantitative indicators for the reconstruction of past environmental conditions in...
ARTICLE IN PRESS
0277-3791/$ - se
doi:10.1016/j.qu
�Correspondfax: +086 10 62
E-mail addr
Quaternary Science Reviews 26 (2007) 759–772
Phytoliths as quantitative indicators for the reconstruction of pastenvironmental conditions in China II: palaeoenvironmental
reconstruction in the Loess Plateau
Hou-Yuan Lua,�, Nai-Qin Wua, Kam-Biu Liub, Hui Jiangc, Tung-Sheng Liua
aInstitute of Geology and Geophysics, Chinese Academy of Sciences, Beijing 100029, ChinabDepartment of Geography and Anthropology, Louisiana State University, Baton Rouge, LA 70803, USA
cState Key Laboratory of Estuarine and Coastal Research, East China Normal University, Shanghai 200062, China
Received 29 April 2006; received in revised form 22 September 2006; accepted 13 October 2006
Abstract
Quantitative reconstruction of the climatic history of the Chinese Loess Plateau is important for understanding present and past
environment and climate changes in the Northern Hemisphere. Here, we reconstructed mean annual temperature (MAT) and mean
annual precipitation (MAP) trends during the last 136 ka based on the analysis of phytoliths from the Weinan loess section (341240N,
1091300E) near the southern part of the Loess Plateau in northern China. The reconstructions have been carried out using a Chinese
phytolith–climate calibration model based on weighted averaging partial least-squares regression. A series of cold and dry events, as
indicated by the reconstructed MAT and MAP, are documented in the loess during the last glacial periods, which can be temporally
correlated with the North Atlantic Heinrich events. Our MAT and MAP estimations show that the coldest and/or driest period occurred
at the upper part of L2 unit (Late MIS 6), where MAT dropped to ca 4.4 1C and MAP to ca 100mm. Two other prominent cold-dry
periods occurred at lower Ll-5 (ca 77–62 ka) and L1-1 (ca 23–10.5 ka) where the MAT and MAP decreased to about 6.1–6.5 1C and
150–370mm, respectively, ca 6.6–6.2 1C and 400–200mm lower than today. However, the highest MAT (average 14.6 1C, max. 18.1 1C)
and MAP (average 757mm, max. 1000mm) occurred at Sl interval (MIS 5). During the interstadial of L1-4–L1-2 (MIS 3) and during the
Holocene warm-wet period, the MAT was about 1–2 1C and MAP 100–150mm higher than today in the Weinan region. The well-dated
MAT and MAP reconstructions from the Chinese Loess Plateau presented in this paper are the first quantitatively reconstructed proxy
record of climatic changes at the glacial–interglacial timescale that is based on phytolith data. This study also reveals a causal link
between climatic instability in the Atlantic Ocean and climate variability in the Chinese Loess Plateau.
r 2006 Elsevier Ltd. All rights reserved.
1. Introduction
Understanding long-term climatic change requires con-sideration of spatial as well as temporal aspects of climatedynamics (Cheddadi et al., 1998; Rousseau and Kukla,2000; Ding et al., 2002). Therefore, accurate reconstruc-tions of regional temperature and precipitation patterns areneeded in order to trace the response of regionalenvironment to climatic changes and to assess global
e front matter r 2006 Elsevier Ltd. All rights reserved.
ascirev.2006.10.006
ing author. Tel.: +086 10 62008125;
032495.
ess: [email protected] (H.-Y. Lu).
circulation models on a regional scale (COHMAPMembers,1988; Seppa et al., 2004).The loess–palaeosol record in northern China is one of
the most significant natural archives of environmentalchanges in the continental warm temperate and semi-humid areas. The loess section is more than 300m thick insome places, consisting of a sequence of loess and palaeosollayers that records climate variations over the last 2.6Ma(Heller and Liu, 1982; Liu, 1985; Kukla and An, 1989; Anet al., 1990, 1991; Rutter, 1992; Ding et al., 1994, 1995,2002; Xiao et al., 1995; Guo et al., 1996, 1998; An andPorter, 1997; Sun et al., 1997; Liu and Ding, 1998;Rousseau et al., 2000; Porter, 2001). Reconstructions ofpalaeoclimate in the Loess Plateau have long been based
ARTICLE IN PRESSH.-Y. Lu et al. / Quaternary Science Reviews 26 (2007) 759–772760
primarily on traditional physical and geochemical methodssuch as magnetic susceptibility (MS) (Heller and Liu, 1982;An et al., 1991; Lu et al., 1994; Liu et al., 1995b; Maher andThompson, 1995), grain size (Ding et al., 1994, 1995, 2002),isotopes (Gu et al., 1996, 2003; Ding and Yang, 2000; Jianget al., 2002; Vidic and Montanez, 2004), and weatheringindex (Guo et al., 1996, 2001b).
In order to quantitatively reconstruct past temperatureand precipitation patterns, several researchers have at-tempted to extend the use of magnetic measurements as aquantitative proxy for reconstructing palaeoprecipitation(e.g. Lu et al., 1994; Maher et al., 1994; Liu et al., 1995b;Maher and Thompson, 1995; Porter et al., 2001). Suchreconstruction is based on observations of statisticallysignificant relationships between magnetic properties,principally MS, of modern Loess Plateau soils and modernclimatic parameters. There is a broad agreement amongvarious magnetic-based palaeoprecipitation estimates forthe last glacial–interglacial cycle in the central part of theLoess Plateau (Evans and Heller, 2001). However, severalworkers have reported inconsistencies between the magni-tude of coeval MS peaks at sites in the northern part (witha drier modern climate) and the southern part (morehumid) of the Loess Plateau (Guo et al., 2001a; Bloemen-dal and Liu, 2005). In addition, Lu et al. (1994) and Hanet al. (1996) noted distinctly non-linear relationshipsbetween climatic parameters and MS signals in a large setof modern Chinese soils.
Pollen-analytical results are commonly interpreted in amore qualitative and descriptive way. Recently, severalnumerical inference models have been developed thatenable quantitative climate reconstructions from fossilpollen assemblages (e.g. Overpeck et al., 1985; Guiotet al., 1993; Davis, et al., 2003; Seppa et al., 2004; Rousseauet al., 2006). However, because of the difficulty ofextracting sufficient numbers of pollen grains from loessdeposits, palynology has contributed very little to thequantitative reconstruction of the vegetation and climatehistory of the Loess Plateau (Sun et al., 1997).
However, the accuracy of precipitation and temperaturereconstructions using other quantitative proxies still needsto be tested for the last glacial–interglacial cycle in theLoess Plateau. Here, we demonstrate the usefulness ofphytoliths as such a palaeoclimatic proxy. Phytoliths aremicroscopic silica bodies that are produced in the tissue ofgrasses and some other plants (Piperno, 1988, 2006;Mulholland, 1989; Wang and Lu, 1993; Alexandre et al.,1997; Fredlund and Tieszen, 1997; Runge, 1999; Pearsall,2000), and they occur abundantly in loess–palaeosolsediments as relicts of previous vegetation communities(Liu et al., 1996; Lu et al., 1996; Madella, 1997; Blinnikovet al., 2002). Among the many proxy indicators ofloess–palaeosol environments, sedimentary remains ofphytolith are emerging as a promising source of informa-tion to quantify past climate changes (Wu et al., 1995b; Luet al., 1996). The aim of the present study is to reconstructtemperature and precipitation variations at the glacial–
interglacial timescale using quantitative phytoliths infer-ence models (Lu et al., 2006) and to document the climaticoscillations during the last 136,000 years in the south-eastern part of the Loess Plateau.
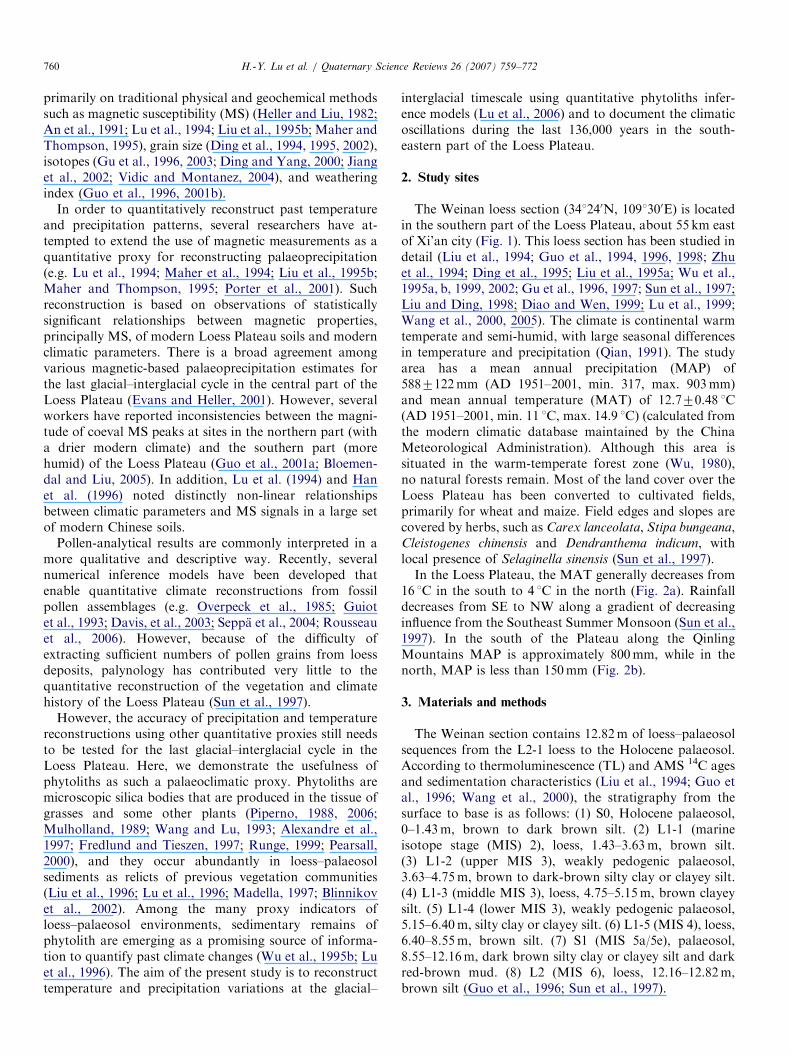
2. Study sites
The Weinan loess section (341240N, 1091300E) is locatedin the southern part of the Loess Plateau, about 55 km eastof Xi’an city (Fig. 1). This loess section has been studied indetail (Liu et al., 1994; Guo et al., 1994, 1996, 1998; Zhuet al., 1994; Ding et al., 1995; Liu et al., 1995a; Wu et al.,1995a, b, 1999, 2002; Gu et al., 1996, 1997; Sun et al., 1997;Liu and Ding, 1998; Diao and Wen, 1999; Lu et al., 1999;Wang et al., 2000, 2005). The climate is continental warmtemperate and semi-humid, with large seasonal differencesin temperature and precipitation (Qian, 1991). The studyarea has a mean annual precipitation (MAP) of5887122mm (AD 1951–2001, min. 317, max. 903mm)and mean annual temperature (MAT) of 12.770.48 1C(AD 1951–2001, min. 11 1C, max. 14.9 1C) (calculated fromthe modern climatic database maintained by the ChinaMeteorological Administration). Although this area issituated in the warm-temperate forest zone (Wu, 1980),no natural forests remain. Most of the land cover over theLoess Plateau has been converted to cultivated fields,primarily for wheat and maize. Field edges and slopes arecovered by herbs, such as Carex lanceolata, Stipa bungeana,Cleistogenes chinensis and Dendranthema indicum, withlocal presence of Selaginella sinensis (Sun et al., 1997).In the Loess Plateau, the MAT generally decreases from
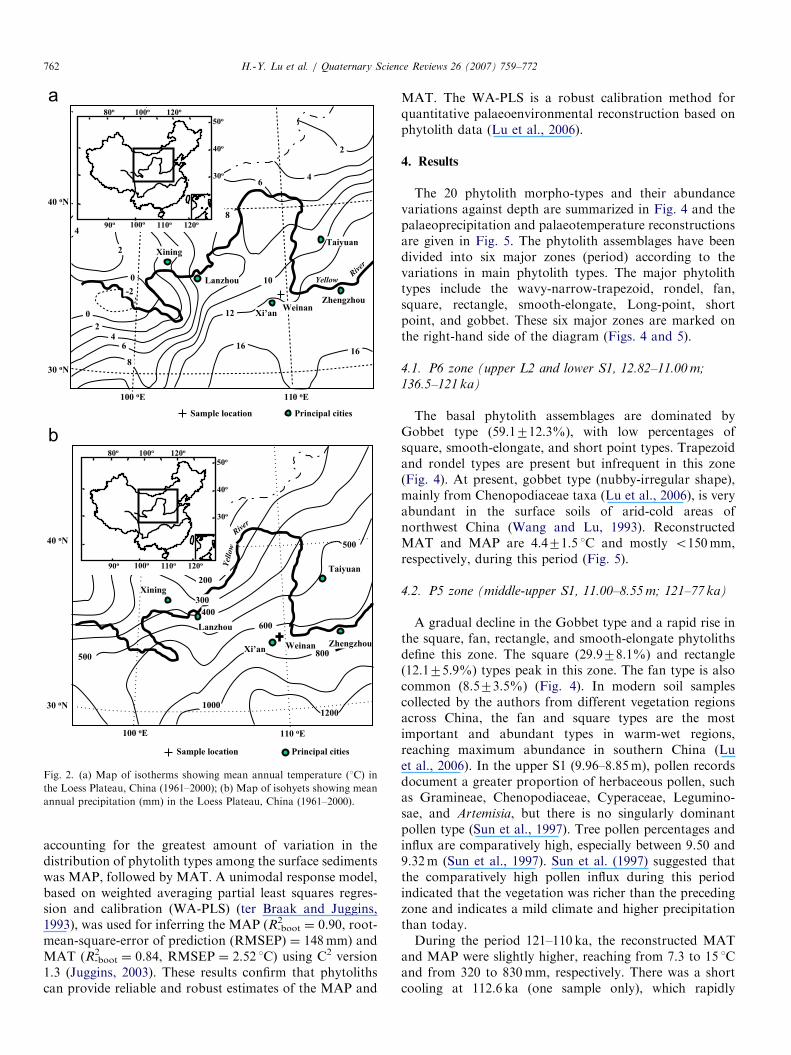
16 1C in the south to 4 1C in the north (Fig. 2a). Rainfalldecreases from SE to NW along a gradient of decreasinginfluence from the Southeast Summer Monsoon (Sun et al.,1997). In the south of the Plateau along the QinlingMountains MAP is approximately 800mm, while in thenorth, MAP is less than 150mm (Fig. 2b).
3. Materials and methods
The Weinan section contains 12.82m of loess–palaeosolsequences from the L2-1 loess to the Holocene palaeosol.According to thermoluminescence (TL) and AMS 14C agesand sedimentation characteristics (Liu et al., 1994; Guo etal., 1996; Wang et al., 2000), the stratigraphy from thesurface to base is as follows: (1) S0, Holocene palaeosol,0–1.43m, brown to dark brown silt. (2) L1-1 (marineisotope stage (MIS) 2), loess, 1.43–3.63m, brown silt.(3) L1-2 (upper MIS 3), weakly pedogenic palaeosol,3.63–4.75m, brown to dark-brown silty clay or clayey silt.(4) L1-3 (middle MIS 3), loess, 4.75–5.15m, brown clayeysilt. (5) L1-4 (lower MIS 3), weakly pedogenic palaeosol,5.15–6.40m, silty clay or clayey silt. (6) L1-5 (MIS 4), loess,6.40–8.55m, brown silt. (7) S1 (MIS 5a/5e), palaeosol,8.55–12.16m, dark brown silty clay or clayey silt and darkred-brown mud. (8) L2 (MIS 6), loess, 12.16–12.82m,brown silt (Guo et al., 1996; Sun et al., 1997).

ARTICLE IN PRESS
Xi’an WeinanZhengzhou
100oE 110oE
100oE 110oE
40oN
35oN 35oN
Lanzhou
Beijing
Taiyuan
Luochuan
Xining
Yellow River
Yel
low
Riv
erLOESS PLATEAU
MU US
Desert
Major Loess Plateau Desert Sample location Principal cities
90o 100o 110o 120o
30o
40o
50o
120o100o80o
Fig. 1. Sketch map showing the Loess Plateau and location of the Weinan section.
H.-Y. Lu et al. / Quaternary Science Reviews 26 (2007) 759–772 761
A total of 159 samples, each weighing about 5 g, werecollected for phytolith analysis from a depth of 34 cm to adepth of 1282 cm. The sequence was cleaned before thesampling to prevent any pollution. No samples were takenfrom the top 34 cm due to disturbances from humanactivity. The upper loess–palaeosol unit from 34 to 200 cmwas sampled at 4 cm intervals, and the lower loess–palaeo-sol unit from 200 to 1282 cm was sampled at 10 cmintervals. An age model was developed using polynomialregression on the absolute dating results (Guo et al., 1996),using both TL and AMS 14C ages. According to thesedimentation rate calculated from the age model, thetime resolution was approximately 224775 years persample during the Holocene and about 8497450 yearsper sample during the 10–136 ka interval.
The samples were prepared by a procedure slightlymodified from Piperno (1988) and Runge (1999). It consistsof sodium pyrophosphate (Na4P2O7) deflocculation, treat-ment with 30% hydrogen peroxide (H2O2) and cold 15%hydrochloric acid (HCl), zinc bromide (ZnBr2, density2.35 g/cm3) heavy liquid separation, and mounting on aslide with Canada Balsam. Phytolith counting andidentification were performed using a Leica microscopewith phase-contrast at 400� magnification. More than 350
phytolith grains were counted in each sample. Phytolithabundance was expressed as percentages of all phytolithscounted. Identification was aided by the use of referencematerials (Lu, 1998; Lu and Liu, 2003a, b, 2005; Lu et al.,2006) and published keys (Piperno, 1988; Mulholland andRapp, 1992; Kondo et al., 1994; Piperno and Pearsall,1998; Runge, 1999; Pearsall, 2000).In this study, phytoliths were divided into 21 types,
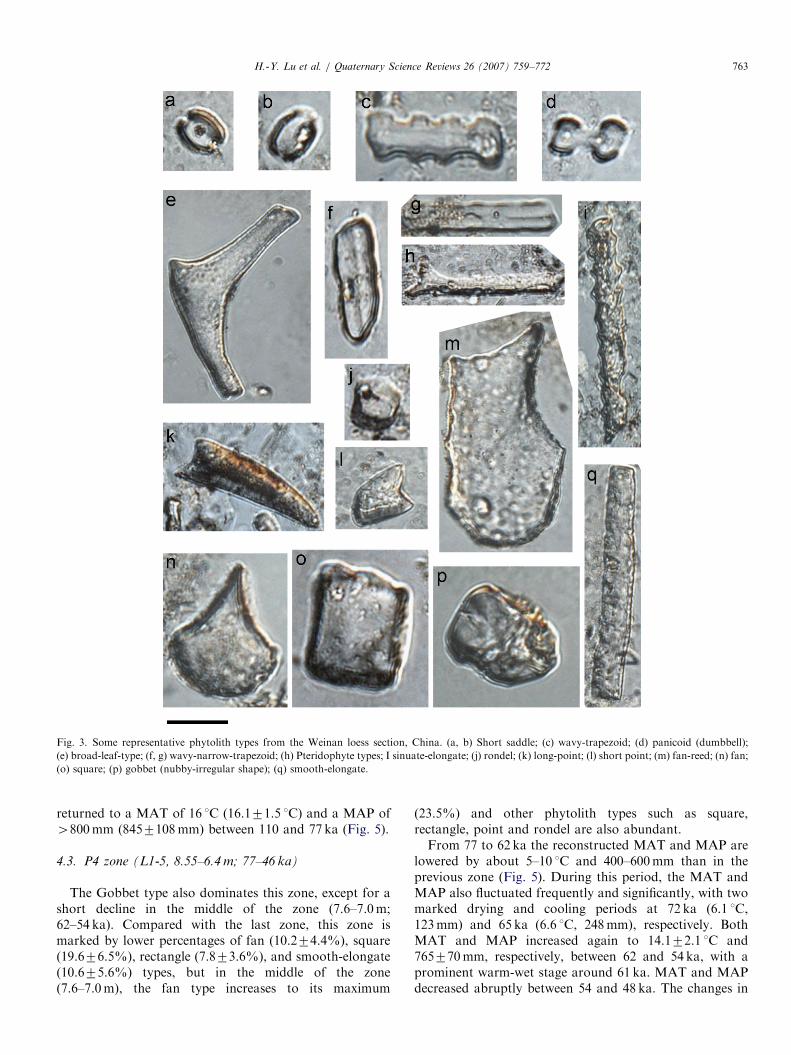
according to the classification systems of Lu et al. (2006)which are modified from the classification of Twiss et al.(1969), Wang and Lu (1993) and Kondo et al. (1994),as follows: (1) Pteridophyte types; (2) Gymnosperm types;(3) broad-leaf-type; (4) palmaceae phytolith; (5) panicoid(dumbbell and cross); (6) long saddle; (7) short saddle; (8)wavy-trapezoid; (9) wavy-narrow-trapezoid; (10) rondel;(11) fan-bamb; (12) fan-reed; (13) fan; (14) square; (15)rectangle; (16) board-elongate; (17) sinuate-elongate; (18)smooth-elongate; (19) long-point; (20) short point; (21)gobbet (nubby-irregular shape) (Fig. 3) (Lu et al., 2006,Fig. 3).Quantitative inferences of temperature and precipitation
were based on a surface sediment calibration set of 243 sitesdistributed along broad ecological and climatic gradientsover China (Lu et al., 2006). The environmental variable
ARTICLE IN PRESS
40 oN
30 oN
100 oE 110 oE
YellowRiv
er
Xining
Lanzhou
Xi’anWeinan
Zhengzhou
Taiyuan
Sample location Principal cities
4
2
6
8
8
10
12
1616
8
64
2
0
-2
0
2
490o 100o 110o 120o
30o
40o
50o
120o100o80o
50
100
200
300
400
500
500
600
800
10001200
ZhengzhouWeinanXi’an
Taiyuan
Lanzhou
Xining
110 oE100 oE
40 oN
30 oN
Sample location Principal cities
90o 100o 110o 120o
30o
40o
50o
120o100o80o
Yell
ow
Riv
er
b
Fig. 2. (a) Map of isotherms showing mean annual temperature (1C) in
the Loess Plateau, China (1961–2000); (b) Map of isohyets showing mean
annual precipitation (mm) in the Loess Plateau, China (1961–2000).
H.-Y. Lu et al. / Quaternary Science Reviews 26 (2007) 759–772762
accounting for the greatest amount of variation in thedistribution of phytolith types among the surface sedimentswas MAP, followed by MAT. A unimodal response model,based on weighted averaging partial least squares regres-sion and calibration (WA-PLS) (ter Braak and Juggins,1993), was used for inferring the MAP (R-boot
2¼ 0.90, root-
mean-square-error of prediction (RMSEP) ¼ 148mm) andMAT (R-boot
2¼ 0.84, RMSEP ¼ 2.52 1C) using C2 version
1.3 (Juggins, 2003). These results confirm that phytolithscan provide reliable and robust estimates of the MAP and
MAT. The WA-PLS is a robust calibration method forquantitative palaeoenvironmental reconstruction based onphytolith data (Lu et al., 2006).
4. Results
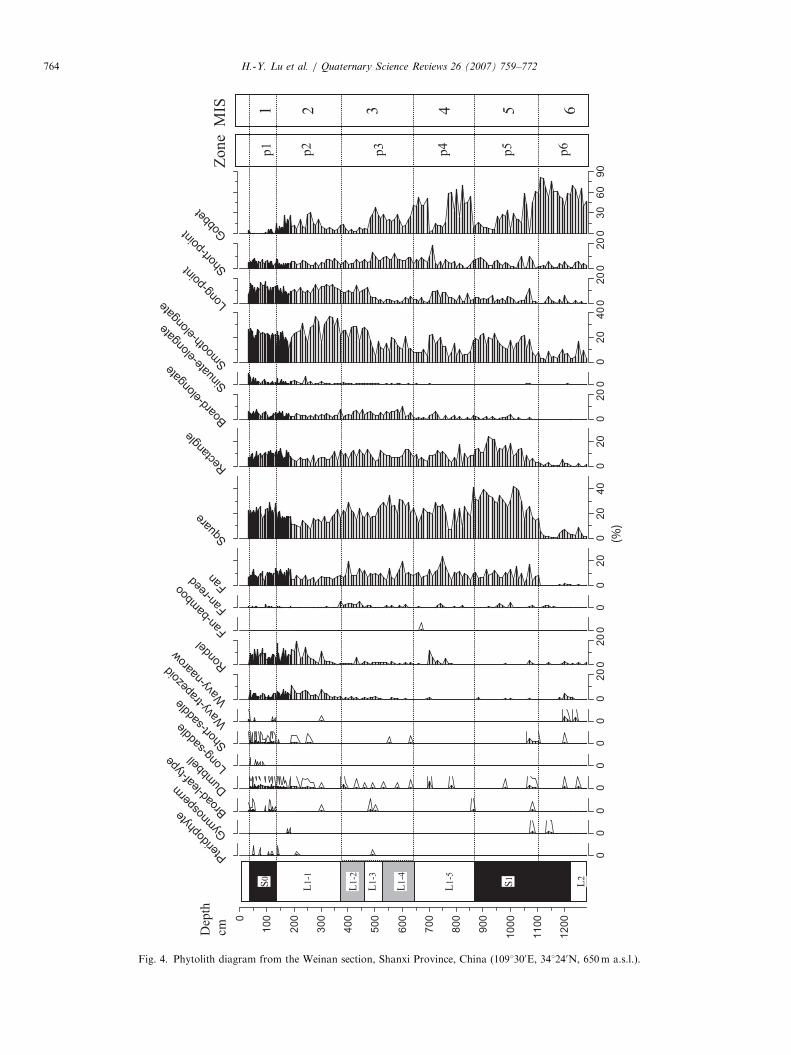
The 20 phytolith morpho-types and their abundancevariations against depth are summarized in Fig. 4 and thepalaeoprecipitation and palaeotemperature reconstructionsare given in Fig. 5. The phytolith assemblages have beendivided into six major zones (period) according to thevariations in main phytolith types. The major phytolithtypes include the wavy-narrow-trapezoid, rondel, fan,square, rectangle, smooth-elongate, Long-point, shortpoint, and gobbet. These six major zones are marked onthe right-hand side of the diagram (Figs. 4 and 5).
4.1. P6 zone (upper L2 and lower S1, 12.82–11.00 m;
136.5–121 ka)
The basal phytolith assemblages are dominated byGobbet type (59.1712.3%), with low percentages ofsquare, smooth-elongate, and short point types. Trapezoidand rondel types are present but infrequent in this zone(Fig. 4). At present, gobbet type (nubby-irregular shape),mainly from Chenopodiaceae taxa (Lu et al., 2006), is veryabundant in the surface soils of arid-cold areas ofnorthwest China (Wang and Lu, 1993). ReconstructedMAT and MAP are 4.471.5 1C and mostly o150mm,respectively, during this period (Fig. 5).
4.2. P5 zone (middle-upper S1, 11.00–8.55 m; 121–77 ka)
A gradual decline in the Gobbet type and a rapid rise inthe square, fan, rectangle, and smooth-elongate phytolithsdefine this zone. The square (29.978.1%) and rectangle(12.175.9%) types peak in this zone. The fan type is alsocommon (8.573.5%) (Fig. 4). In modern soil samplescollected by the authors from different vegetation regionsacross China, the fan and square types are the mostimportant and abundant types in warm-wet regions,reaching maximum abundance in southern China (Luet al., 2006). In the upper S1 (9.96–8.85m), pollen recordsdocument a greater proportion of herbaceous pollen, suchas Gramineae, Chenopodiaceae, Cyperaceae, Legumino-sae, and Artemisia, but there is no singularly dominantpollen type (Sun et al., 1997). Tree pollen percentages andinflux are comparatively high, especially between 9.50 and9.32m (Sun et al., 1997). Sun et al. (1997) suggested thatthe comparatively high pollen influx during this periodindicated that the vegetation was richer than the precedingzone and indicates a mild climate and higher precipitationthan today.During the period 121–110 ka, the reconstructed MAT
and MAP were slightly higher, reaching from 7.3 to 15 1Cand from 320 to 830mm, respectively. There was a shortcooling at 112.6 ka (one sample only), which rapidly
ARTICLE IN PRESS
Fig. 3. Some representative phytolith types from the Weinan loess section, China. (a, b) Short saddle; (c) wavy-trapezoid; (d) panicoid (dumbbell);
(e) broad-leaf-type; (f, g) wavy-narrow-trapezoid; (h) Pteridophyte types; I sinuate-elongate; (j) rondel; (k) long-point; (l) short point; (m) fan-reed; (n) fan;
(o) square; (p) gobbet (nubby-irregular shape); (q) smooth-elongate.
H.-Y. Lu et al. / Quaternary Science Reviews 26 (2007) 759–772 763
returned to a MAT of 16 1C (16.171.5 1C) and a MAP of4800mm (8457108mm) between 110 and 77 ka (Fig. 5).
4.3. P4 zone (L1-5, 8.55–6.4 m; 77–46 ka)
The Gobbet type also dominates this zone, except for ashort decline in the middle of the zone (7.6–7.0m;62–54 ka). Compared with the last zone, this zone ismarked by lower percentages of fan (10.274.4%), square(19.676.5%), rectangle (7.873.6%), and smooth-elongate(10.675.6%) types, but in the middle of the zone(7.6–7.0m), the fan type increases to its maximum
(23.5%) and other phytolith types such as square,rectangle, point and rondel are also abundant.From 77 to 62 ka the reconstructed MAT and MAP are
lowered by about 5–10 1C and 400–600mm than in theprevious zone (Fig. 5). During this period, the MAT andMAP also fluctuated frequently and significantly, with twomarked drying and cooling periods at 72 ka (6.1 1C,123mm) and 65 ka (6.6 1C, 248mm), respectively. BothMAT and MAP increased again to 14.172.1 1C and765770mm, respectively, between 62 and 54 ka, with aprominent warm-wet stage around 61 ka. MAT and MAPdecreased abruptly between 54 and 48 ka. The changes in
ARTICLE IN PRESS
0
10
0
20
0
30
0
40
0
50
0
60
0
70
0
80
0
90
0
10
00
11
00
12
00
0Pte
ridop
hyte
0Gym
nosp
erm
0Bro
ad-le
af-ty
pe
0Dum
bbel
l
0Long
-sad
dle
0Sho
rt-sa
ddle
0Wav
y-tra
pezo
id
02
0
Wav
y-na
arow
02
0
Ron
del
0Fan-b
ambo
o0Fan
-reed 0
20
Fan
02
04
0
Squ
are
02
0
Rec
tang
le
02
0
Boa
rd-e
long
ate
0Sin
uate
-elo
ngat
e
02
04
0
Sm
ooth
-elo
ngat
e 02
0
Long
-poi
nt 02
0
Sho
rt-po
int 0
30
60
90
Gob
bet
S0
L1
-1
L1
-2
L1
-3
L1
-4
L1
-5
L2
S1
Dep
th
cmZ
on
eM
IS
p1
p2
p3
p4
p5
p6
1 2 3 4 5 6
(%)
Fig. 4. Phytolith diagram from the Weinan section, Shanxi Province, China (1091300E, 341240N, 650m a.s.l.).
H.-Y. Lu et al. / Quaternary Science Reviews 26 (2007) 759–772764
ARTICLE IN PRESS
0
10
20
30
40
50
60
70
80
90
100
110
120
130
400 800 1200
MAP
0 4 8 12 16 20
MATAge
ka Zone
p1
p2
p3
p4
p5
p6
mm oC
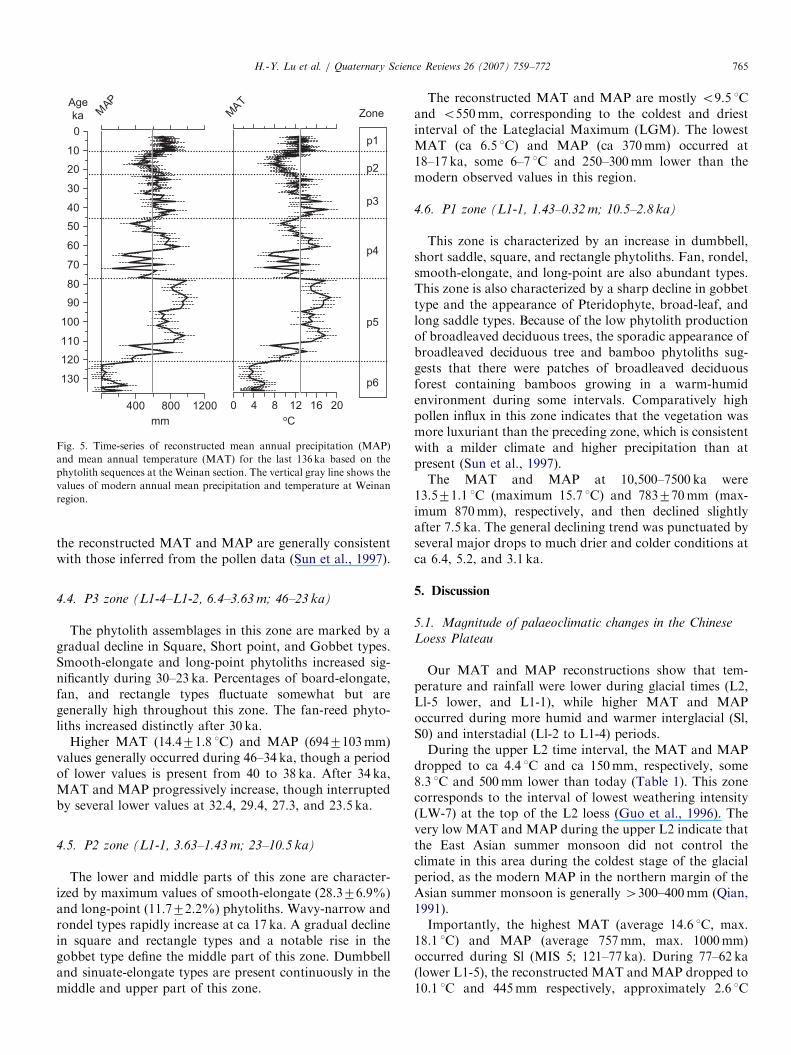
Fig. 5. Time-series of reconstructed mean annual precipitation (MAP)
and mean annual temperature (MAT) for the last 136 ka based on the
phytolith sequences at the Weinan section. The vertical gray line shows the
values of modern annual mean precipitation and temperature at Weinan
region.
H.-Y. Lu et al. / Quaternary Science Reviews 26 (2007) 759–772 765
the reconstructed MAT and MAP are generally consistentwith those inferred from the pollen data (Sun et al., 1997).
4.4. P3 zone (L1-4–L1-2, 6.4–3.63 m; 46–23 ka)
The phytolith assemblages in this zone are marked by agradual decline in Square, Short point, and Gobbet types.Smooth-elongate and long-point phytoliths increased sig-nificantly during 30–23 ka. Percentages of board-elongate,fan, and rectangle types fluctuate somewhat but aregenerally high throughout this zone. The fan-reed phyto-liths increased distinctly after 30 ka.
Higher MAT (14.471.8 1C) and MAP (6947103mm)values generally occurred during 46–34 ka, though a periodof lower values is present from 40 to 38 ka. After 34 ka,MAT and MAP progressively increase, though interruptedby several lower values at 32.4, 29.4, 27.3, and 23.5 ka.
4.5. P2 zone (L1-1, 3.63–1.43 m; 23–10.5 ka)
The lower and middle parts of this zone are character-ized by maximum values of smooth-elongate (28.376.9%)and long-point (11.772.2%) phytoliths. Wavy-narrow androndel types rapidly increase at ca 17 ka. A gradual declinein square and rectangle types and a notable rise in thegobbet type define the middle part of this zone. Dumbbelland sinuate-elongate types are present continuously in themiddle and upper part of this zone.
The reconstructed MAT and MAP are mostly o9.5 1Cand o550mm, corresponding to the coldest and driestinterval of the Lateglacial Maximum (LGM). The lowestMAT (ca 6.5 1C) and MAP (ca 370mm) occurred at18–17 ka, some 6–7 1C and 250–300mm lower than themodern observed values in this region.
4.6. P1 zone (L1-1, 1.43–0.32 m; 10.5–2.8 ka)
This zone is characterized by an increase in dumbbell,short saddle, square, and rectangle phytoliths. Fan, rondel,smooth-elongate, and long-point are also abundant types.This zone is also characterized by a sharp decline in gobbettype and the appearance of Pteridophyte, broad-leaf, andlong saddle types. Because of the low phytolith productionof broadleaved deciduous trees, the sporadic appearance ofbroadleaved deciduous tree and bamboo phytoliths sug-gests that there were patches of broadleaved deciduousforest containing bamboos growing in a warm-humidenvironment during some intervals. Comparatively highpollen influx in this zone indicates that the vegetation wasmore luxuriant than the preceding zone, which is consistentwith a milder climate and higher precipitation than atpresent (Sun et al., 1997).The MAT and MAP at 10,500–7500 ka were
13.571.1 1C (maximum 15.7 1C) and 783770mm (max-imum 870mm), respectively, and then declined slightlyafter 7.5 ka. The general declining trend was punctuated byseveral major drops to much drier and colder conditions atca 6.4, 5.2, and 3.1 ka.
5. Discussion
5.1. Magnitude of palaeoclimatic changes in the Chinese
Loess Plateau
Our MAT and MAP reconstructions show that tem-perature and rainfall were lower during glacial times (L2,Ll-5 lower, and L1-1), while higher MAT and MAPoccurred during more humid and warmer interglacial (Sl,S0) and interstadial (Ll-2 to L1-4) periods.During the upper L2 time interval, the MAT and MAP
dropped to ca 4.4 1C and ca 150mm, respectively, some8.3 1C and 500mm lower than today (Table 1). This zonecorresponds to the interval of lowest weathering intensity(LW-7) at the top of the L2 loess (Guo et al., 1996). Thevery low MAT and MAP during the upper L2 indicate thatthe East Asian summer monsoon did not control theclimate in this area during the coldest stage of the glacialperiod, as the modern MAP in the northern margin of theAsian summer monsoon is generally 4300–400mm (Qian,1991).Importantly, the highest MAT (average 14.6 1C, max.
18.1 1C) and MAP (average 757mm, max. 1000mm)occurred during Sl (MIS 5; 121–77 ka). During 77–62 ka(lower L1-5), the reconstructed MAT and MAP dropped to10.1 1C and 445mm respectively, approximately 2.6 1C

ARTICLE IN PRESS
Table 1
Reconstructed values of mean annual temperature (MAT) and mean annual precipitation (MAP) from Weinan in the Loess Plateau, China
Stratigraphy Age (ka) MAT (1C) MAP (mm) Phytolith zone
Min. Max. Average7SD Min. Max. Average7SD
S0 2.8–10.5 9.7 15.8 12.671.2 590 870 745765 P1
L1 10.5–23 6.5 13.9 9.571.8 370 740 550790 P2
L1-2/L1-4 23–46 10.3 17.5 13.271.8 475 860 650798 P3
L1-5 upper 46–62 9.1 16.6 12.772.1 342 900 6427157 P4 upper
L1-5 lower 62–77 6.1 14.7 10.173.1 123 741 4457205 P4 lower
S1 77–121 7.3 18.1 14.673.1 324 1003 7577206 P5
L2 121–136 3.1 6.1 4.471.5 20 298 96760 P6
Modern 1951–2001 (A.D.)
11.0 14.9 12.770.48 312 903 5887122
H.-Y. Lu et al. / Quaternary Science Reviews 26 (2007) 759–772766
(max. 6.6 1C) and 140mm (max. 460mm) lower than atpresent at the Weinan site. These values are comparablewith results from other proxies including pollen (Sun et al.,1997), weathering intensity (Guo et al., 1996), grain size(Xiao et al., 1995; Ding et al., 1995, 2002), and 10Be (Guet al., 1997) obtained from other loess–palaeosol sequences,indicating that major changes in palaeoclimate occurred inthis part of the Chinese Loess Plateau.
The variations in MAT and MAP during the period of62–23 ka (upper L1-5 to L1-2) consist of two cycles. Thefirst cycle is marked by a rapid increase around 62 kafollowed by a gradual decline towards a minimum around49 ka, with a prominent warm-wet stage around 61 ka (ca16 1C, ca 900mm). The second cycle started with anotherrapid increase around 49 ka rising to a maximum around42 ka (ca 17 1C, ca 850mm), followed by a progressivedecline towards the Last Glacial Maximum (Fig. 5, Table 1).These results suggest that MAT and MAP in thewarmest and wettest intervals during the interstadial ofL1-4 to L1-2 (MIS 3) were about ca 1–2 1C and ca100–150mm higher than those values occurring evenduring the Holocene optimum period in this region. Theseepisodically high temperature and precipitation recordswithin L1-2 and L1-4 (corresponding to marine d18O stage3) are therefore consistent with an intensification ofsummer monsoon, which was recorded almost across theentire Tibetan Plateau (Shi et al., 2001). In addition, therecords from large lakes at the same time in the Tenggerand Badain Jaran Deserts showed higher precipitation andgreatly enhanced summer monsoon, which greatly ex-ceeded the temperature and precipitation conditions of midHolocene (Shi et al., 2001; Zhang et al., 2002). The ice corefrom the Tibetan Plateau also indicated that the climateduring this period was 2–4 1C higher than the present (Yaoet al., 1994; Shi et al., 2001). All lines of the evidenceconsistently suggest that an exceedingly strong summermonsoon climate existed over this region, and in turnindicate that Indian summer monsoon, bringing moisturefrom the low-latitude ocean to the plateau, was highlyenhanced during this period (Shi et al., 2001; Clemens andPrell, 2003).
During the LGM between 23 and 10.5 ka, the recon-structed MAT and MAP decreased to about 6.5 1C(average 9.5 1C) and 370mm (average 550mm), respec-tively, about ca 6.2 1C and ca 200mm lower than today.The MAT and MAP increased again to 412.6 1C (max.15.8 1C) and 4745mm (max. 870mm) during the Holo-cene period, with a short cooling at around 6.5–6.1 ka and4.5–4.3 ka. Wu et al. (2002) made quantitative estimates ofthe MAT and MAP for the LGM at Weinan using molluscrecords. Their results suggest that this region during theLGM was at least 3–5 1C colder and precipitation about100–300mm lower than today, which are generallyconsistent with our phytolith estimates. The relatively highMAT and MAP during the LGM compared with thepenultimate glacial period (L2) indicate that the East Asiansummer monsoon did affect this area even in the coldeststage of the last glacial period. Rather than beinguniformly cold or dry as previously thought, there wereperiodic warm-humid air incursions to the Loess Plateau inthe LGM period. Our results are consistent with pollendata for this period obtained from the same sequence,which indicate a moist meadow environment composed ofmany types of Compositae, Gramineae, and Polygonum(Sun et al., 1997).
5.2. Correlation of the Loess Plateau palaeoclimatic record
with Heinrich events
During the last 100 ka, the Heinrich events (H events)were the dominant signal of past climate variability overGreenland and the North Atlantic as well as other areas inthe world (Guo et al., 1996; Rousseau et al., 2006).Understanding the impact of the Heinrich events outsidethe main belt of ice rafting is crucial for recognizing theunderlying causes of these abrupt climatic events.To reveal the impact of the H events on the Chinese
Loess Plateau, we focused our study on the palaeo-climaticvariability in the Weinan loess–palaeosol sequences fromthe upper L2 loess to the Holocene palaeosol (Fig. 6). Thereconstructed MAT and MAP records during the glacialperiod are characterized by large variabilities with abrupt
ARTICLE IN PRESS
Weinan Heinrich
Events**
0 20 40 60 80
130
120
110
100
90
80
70
60
50
40
30
20
10
0
-44 -40 -36 -32
130
120
110
100
90
80
70
60
50
40
30
20
10
0MAP MAT
Age k
a
H1
H2
H3
H4
H5aH5b?
H6
H7?H8?
(%)
IRD
(mm) (oC)
0 400 800
130
120
110
100
90
80
70
60
50
40
30
20
10
0
0 4 8 12 16
GRIP18O
(‰ vs. PDS)
GIK23415-9 *
cb da
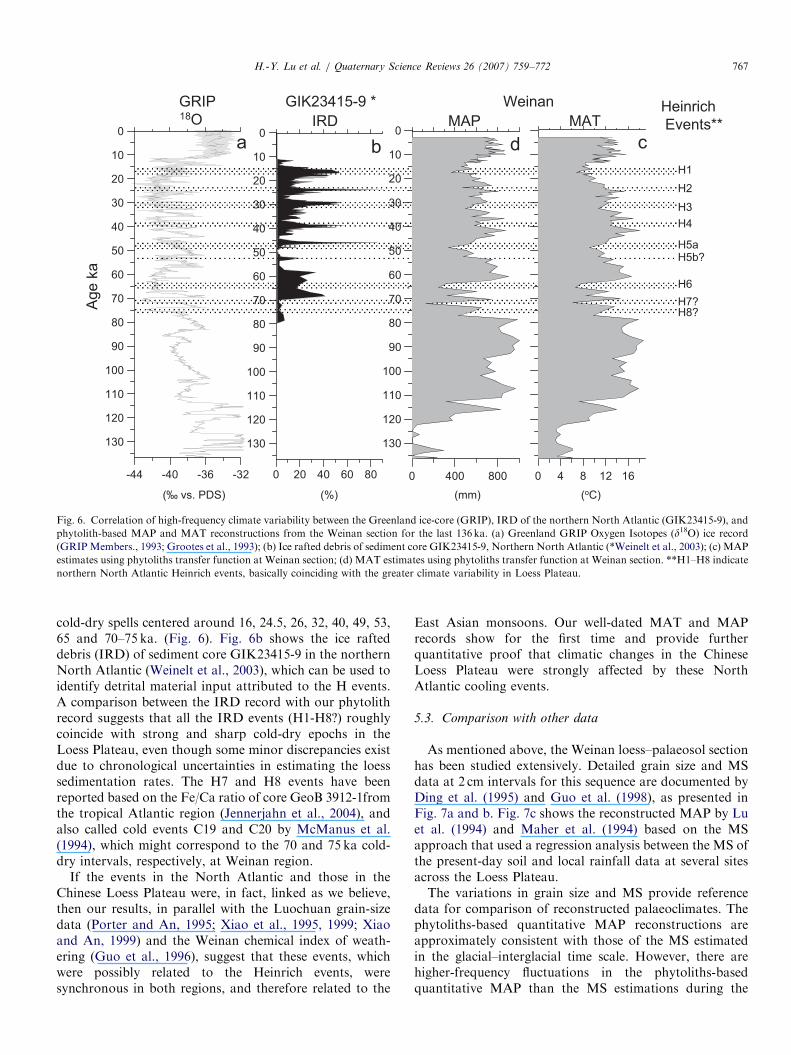
Fig. 6. Correlation of high-frequency climate variability between the Greenland ice-core (GRIP), IRD of the northern North Atlantic (GIK23415-9), and
phytolith-based MAP and MAT reconstructions from the Weinan section for the last 136 ka. (a) Greenland GRIP Oxygen Isotopes (d18O) ice record
(GRIPMembers., 1993; Grootes et al., 1993); (b) Ice rafted debris of sediment core GIK23415-9, Northern North Atlantic (*Weinelt et al., 2003); (c) MAP
estimates using phytoliths transfer function at Weinan section; (d) MAT estimates using phytoliths transfer function at Weinan section. **H1–H8 indicate
northern North Atlantic Heinrich events, basically coinciding with the greater climate variability in Loess Plateau.
H.-Y. Lu et al. / Quaternary Science Reviews 26 (2007) 759–772 767
cold-dry spells centered around 16, 24.5, 26, 32, 40, 49, 53,65 and 70–75 ka. (Fig. 6). Fig. 6b shows the ice rafteddebris (IRD) of sediment core GIK23415-9 in the northernNorth Atlantic (Weinelt et al., 2003), which can be used toidentify detrital material input attributed to the H events.A comparison between the IRD record with our phytolithrecord suggests that all the IRD events (H1-H8?) roughlycoincide with strong and sharp cold-dry epochs in theLoess Plateau, even though some minor discrepancies existdue to chronological uncertainties in estimating the loesssedimentation rates. The H7 and H8 events have beenreported based on the Fe/Ca ratio of core GeoB 3912-1fromthe tropical Atlantic region (Jennerjahn et al., 2004), andalso called cold events C19 and C20 by McManus et al.(1994), which might correspond to the 70 and 75 ka cold-dry intervals, respectively, at Weinan region.
If the events in the North Atlantic and those in theChinese Loess Plateau were, in fact, linked as we believe,then our results, in parallel with the Luochuan grain-sizedata (Porter and An, 1995; Xiao et al., 1995, 1999; Xiaoand An, 1999) and the Weinan chemical index of weath-ering (Guo et al., 1996), suggest that these events, whichwere possibly related to the Heinrich events, weresynchronous in both regions, and therefore related to the
East Asian monsoons. Our well-dated MAT and MAPrecords show for the first time and provide furtherquantitative proof that climatic changes in the ChineseLoess Plateau were strongly affected by these NorthAtlantic cooling events.
5.3. Comparison with other data
As mentioned above, the Weinan loess–palaeosol sectionhas been studied extensively. Detailed grain size and MSdata at 2 cm intervals for this sequence are documented byDing et al. (1995) and Guo et al. (1998), as presented inFig. 7a and b. Fig. 7c shows the reconstructed MAP by Luet al. (1994) and Maher et al. (1994) based on the MSapproach that used a regression analysis between the MS ofthe present-day soil and local rainfall data at several sitesacross the Loess Plateau.The variations in grain size and MS provide reference
data for comparison of reconstructed palaeoclimates. Thephytoliths-based quantitative MAP reconstructions areapproximately consistent with those of the MS estimatedin the glacial–interglacial time scale. However, there arehigher-frequency fluctuations in the phytoliths-basedquantitative MAP than the MS estimations during the

ARTICLE IN PRESS
Phytoliths
zone
p1
p2
p3
p4
p5
p6
S0
L1-2
L1-1
L1-4
L1-5
S1
L2
L1-3
Depth
(m)
0
10
20
30
40
50
60
70
80
90
100
110
120
130
Age
ka
0 200 4001 2
12
11
10
9
8
7
6
5
4
3
2
1
0
0 400 800 0400 800 16 14 12 10 8 6
12
11
10
9
8
7
6
5
4
3
2
1
0
Luochuan
QMD
(µm)
PhytolithsMAP(mm)
MSMAP(mm)
Depth
(m)
Grainsize
(<2/>10
Magneticsusceptibility
(SI units)
Weinan
2
1
a b c d e
µm)
Fig. 7. Comparison between the grain sizes, MS (magnetic susceptibility), MAP reconstructions records from the Weinan section, and quartz grain sizes
record from the Luochuan section: (a) grain sizes; (b) MS (magnetic susceptibility); (c) MAP reconstructions records, (1) by climofunction of Lu et al.
(1994) and Han et al. (1996), (2) by climofunction of Maher et al. (1994), vertical gray shard line shows the values of modern mean annual precipitation at
Weinan region; (d) MAP estimates from phytoliths transfer function using the weighted averaging partial least-squares regression, vertical gray shard line
shows the values of modern mean annual precipitation at Weinan region; (e) the median grain size values of monomineralic quartz (QMD) from the
loess—paleosol section at Luochuan in the central Loess Plateau (Xiao et al., 1995, 1999; Porter and An, 1995).
H.-Y. Lu et al. / Quaternary Science Reviews 26 (2007) 759–772768
past 136 ka. Most notably, the MAP values obtained fromphytolith estimates are lower than those of the MSestimates for MIS 6, the early part of MIS 4, and MIS 2(Fig. 7). This discrepancy may be caused by the differentsensitivities of different proxies to various environmentalparameters (Feng et al., 2004). The reconstructed MAPbased on the MS may reflect the mean values during alonger time due to the fact that the MS are only anapproximate index of the Asian monsoon strength, becauseit takes a long time for weathering processes to producepedogenic clay and new magnetic minerals to a certaindepth in the loess and palaeosols (Xiao et al., 1995; Feng etal., 2004). On the other hand, the phytolith-based MAPreconstructions are more sensitive to short episodes ofclimatic change (Lu et al., 2006), because vegetationcommunities respond to climatic changes more quicklythan do weathering processes, and phytoliths (generallybetween 420–200 mm) do not translocate within the soilprofiles.
The quartz component of loess and palaeosols is largelyunaffected by weathering processes and therefore consti-tutes a more reliable proxy index of monsoon windstrength than MS signals (Xiao et al., 1995, 1999; Xiaoand An, 1999). Xiao et al. (1995, 1999) and Porter and An(1995) presented the median grain size values of mono-mineralic quartz (QMD) from the loess–palaeosol section
at Luochuan in the central Loess Plateau. Our phytolith-based MAP reconstructions in the Weinan section,characterized by high-frequency and high-amplitude varia-tions, is more comparable with the QMD record (Fig. 7)than the MS record, which implies rapid and significantchanges in palaeoclimatic conditions that affect dusttransport and vegetation changes.It is noteworthy that the lower boundary of the S1
palaeosol (ca 12.16m depth), which was traced andidentified based on the preserved characteristics observedin the field, is inconsistent with the prominent changes inthe entire proxy index including grain size, MS, andphytoliths (Fig. 7). Several authors (Bronger and Heinkele,1989; Guo and Liu, 1993; Kemp, 1995; Kemp et al., 1995,1997; Guo et al., 1996; Feng et al., 2004) have recognizedthe unusual characteristics of the soil forming processes ofthe last interglacial S1 palaeosol in the Chinese LoessPlateau. They suggested that the lower-portion of the S1was developed on the underlying older and coarser loess L2so that it inherited the physical and chemical properties ofthe parent materials.On the other hand, the use of phytolith data also has
problems and weaknesses that may limit their useness as apalaeoclimatological proxy. For example, (a) As reviewedby Piperno (1988), the biases that affect phytolith assem-blages are mainly the result of differential production,
ARTICLE IN PRESSH.-Y. Lu et al. / Quaternary Science Reviews 26 (2007) 759–772 769
transport, and preservation. Both wind and water transportare likely to lead to sorting of phytoliths of differing size,shape, and specific gravity, which may impact vegetationinference. (b) Similarly, taphonomic response of differentphytolith morphologies to the chemical and mechanical soilenvironment can affect the phytolith record (Bartoli andWilding, 1980). Very fragile and small phytolith morpho-types, such as silicified mesophyll fragments, which aboundin modern plant reference samples, are generally absentfrom loess assemblages, even from soil assemblages (Piper-no, 1988). (c) Although all assemblages were diverse,containing elements of most of the major phytolithcategories in our loess records, it should be noted thatwhen the extremity dry–cold epochs (upper L2), certainassemblages only have a few of phytolith types. (d) Thedifferences in preservation of diagnostic features may lead toan underestimation or overestimation of certain morpho-types. The existence of these taphonomic filters will there-fore widen the range of climatic tolerances, blur the optimaof critical phytolith taxa, and increase potential biases in theinference model. Further study of the physical–chemicalproperties and reactivity of phytoliths of different originsshould improve our knowledge of the dissolution of siliconin various terrestrial environments.
6. Conclusions
This study is the first to quantitatively reconstruct LateQuaternary climatic changes using phytolith analysis inconjunction with transfer function techniques on aglacial–interglacial timescale. Our phytolith-based recon-structions from Weinan have produced MAT and MAPvalues for the southern part of the Chinese Loess Plateaucomparable with those derived from MS, grain sizes,pollen, and locally based environmental inferences at theglacial–interglacial timescale, but our estimates showhigher-frequency fluctuations on a millennium time scale,suggesting that phytoliths are a more sensitive proxy forquantitative palaeoclimatic reconstructions than MS andother pedogenesis-related proxies.
A series of cold and/or dry events were indicated by thereconstructed MAT and MAP as documented in the loessand palaeosol sequence of the last glacial period, which canbe temporally correlated with the North Atlantic Heinrichevents. This correlation has also been reported by Porterand An (1995) based on the quartz grain-size data from theLuochuan loess section and the chemical weathering indexfrom the Weinan loess section (Guo et al., 1996, 1998),suggesting that the Heinrich events are synchronous inboth regions and are therefore climatically related to theEast Asian monsoons. Our well dated and quantitativelyderived MAT and MAP records, for the first time, providefurther proof that the Chinese Loess Plateau was stronglyaffected by these North Atlantic cooling events.
Our MAT and MAP reconstructions show that tem-perature and rainfall decreased during glacial times (L2,lower Ll-5, and L1-1). The coldest and driest period
occurred during the interval of the upper L2 (Late MIS 6),when the MAT and MAP dropped to ca 4.4 1C and ca150mm, respectively. Two other prominent cold-dryperiods, occurred during the intervals of lower Ll-5(77–62 ka) and L1-1 (23–10.5 ka). During these periodsthe reconstructed MAT and MAP were about 6.1–6.5 1Cand 150–370mm, respectively, about 6.6–6.2 1C and400–200mm lower than today. On the other hand, higherMAT and MAP occurred during the interglacial (Sl, S0)and interstadial (Ll-2, L1-4) periods. The highest MAT(average 14.6 1C, max. 18.1 1C) and MAP (average 757mm,max. 1000mm) occurred in the interglacial of Sl (MIS 5)and in the interstadial of L1-4 to L1-2 (MIS 3), being ca1–2 1C and ca 100–150mm higher than the presentinterglacial including even the Holocene optimum in theregion.
Acknowledgments
We are grateful to Dr. Freea Itzstein-Davey for hervaluable comments on an earlier version of this manu-script. We greatly appreciate the valuable comments fromtwo anonymous reviewers. We are also indebted to LiuJiaqi and Chen Tiemei for providing the chronologicalcontrols, and to Prof. Sun Xiangjun, Song Changqing,Ding Zhongli, Guo Zhengtang, and Yang Xiangdong fortheir helpful discussion. This work was supported by theNational Natural Science Foundation of China (Nos.40325002, 40021202, and 40231001), key project (KZCX3-SW-139), and National Basic Research program of China(Grant nos. 2005CB42002-2; 2004CB720203).
References
Alexandre, A., Meunier, J.-D., Lezine, A.-M., Vincens, A., Schwartz, D.,
1997. Phytoliths: indicators of grassland dynamics during the Late
Holocene in intertropical Africa. Palaeogeography, Palaeoclimatology,
Palaeoecology 136, 213–219.
An, Z.S., Porter, S.C., 1997. Millennial-scale climatic oscillations during
the Last Interglaciation in Central China. Geology 25, 603–606.
An, Z.S., Kukla, G., Porter, S.C., Xiao, J.L., 1991. Magnetic susceptibility
evidence of monsoon variation on the Loess Plateau of Central China
during the last 130,000 years. Quaternary Research 36, 29–36.
An, Z.S., Liu, T.S., Lou, Y.C., Porter, S.C., Kukla, G.J., Wu, X.H., Hua,
Y.M., 1990. The long-term paleomonsoon variation recorded by the
loess–paleosol sequence in central China. Quaternary International
7/8, 91–95.
Bartoli, F., Wilding, L.P., 1980. Dissolution of biogenic opal as a function
of its physical and chemical properties. Soil Science Society of
America, Proceedings 44, 873–878.
Blinnikov, M., Busacca, A., Whitlock, C., 2002. Reconstruction of the
Late Pleistocene grassland of the Columbia Basin, Washington, USA,
based on phytolith records in loess. Palaeogeography, Palaeoclimatol-
ogy, Palaeoecology 177, 77–101.
Bloemendal, J., Liu, X.M., 2005. Rock magnetism and geochemistry of
two Plio–Pleistocene Chinese loess–palaeosol sequences—implications
for quantitative palaeoprecipitation reconstruction. Palaeogeography,
Palaeoclimatology, Palaeoecology 226, 149–166.
Bronger, A., Heinkele, T., 1989. Micromorphology and genesis of
paleosols in the Luochuan loess section, China: pedostratigraphic
and environmental implications. Geoderma 45, 123–143.
ARTICLE IN PRESSH.-Y. Lu et al. / Quaternary Science Reviews 26 (2007) 759–772770
Cheddadi, R., Lamb, H.F., Guiot, J., van der Kaars, S., 1998. Holocene
climatic change in Morocco: a quantitative reconstruction from pollen
data. Climate Dynamics 14, 883–890.
Clemens, S.C., Prell, W.L., 2003. A 350,000 year summer–monsoon multi-
proxy stack from the Owen Ridge, Northern Arabian Sea. Marine
Geology 201, 35–51.
COHMAP Members, 1988. Climatic changes of the last 18,000 years:
observation and model simulations. Science 241, 1043–1052.
Davis, B.A.S., Brewer, S., Stevenson, A.C., Guiot, J., 2003. The
temperature of Europe during the Holocene reconstructed from pollen
data. Quaternary Science Reviews 22, 1701–1716.
Diao, G.Y., Wen, Q.Z., 1999. Mobility sequence of chemical elements
during Loess weathering–pedogenesis, Weinan, Shanxi Province,
China. Chinese Journal of Geochemistry 18 (4), 327–332.
Ding, Z.L., Yang, S.L., 2000. C3/C4 vegetation evolution over the last
7.0Myr in the Chinese Loess Plateau: evidence from pedogenic
carbonate d13C. Palaeogeography, Palaeoclimatology, Palaeoecology
160, 291–299.
Ding, Z.L., Yu, Z.W., Rutter, N.W., Liu, T.S., 1994. Towards an orbital
time scale for Chinese loess deposits. Quaternary Science Reviews 13,
39–70.
Ding, Z.L., Liu, T.S., Rutter, N.W., Yu, Z.W., Guo, Z.T., Zhu, R.Q.,
1995. Ice-volume forcing of East Asian winter monsoon variation in
the past 800,000 years. Quaternary Research 44, 149–159.
Ding, Z.L., Derbyshire, E., Yang, S.L., Yu, Z.W., Xiong, S.F., Liu, T.S.,
2002. Stacked 2.6-Ma grain size record from the Chinese loess based
on five sections and correlation with the deep-sea d18O record.
Paleoceanography 17 (3), 1033.
Evans, M.E., Heller, F., 2001. Magnetism of loess/palaeosol sequences:
recent developments. Earth Science Reviews 54, 129–144.
Feng, Z.-D., Wang, H.B., Olson, C., Pope, G.A., Chen, F.H., Zhang,
J.W., An, C.B., 2004. Chronological discord between the last
interglacial paleosol (S1) and its parent material in the Chinese Loess
Plateau. Quaternary International 117, 17–26.
Fredlund, G.G., Tieszen, L.L., 1997. Calibrating grass phytolith
assemblages in climatic terms: application to Late Pleistocene
assemblages from Kansas and Nebraska. Palaeogeography, Palaeo-
climatology, Palaeoecology 136, 199–211.
GRIP Members, 1993. Climate instability during the last interglacial
period recorded in the GRIP ice core. Nature 364, 203–207.
Grootes, P.M., Stuiver, M., White, J.W.C., Johnsen, S.J., Jouzel, J., 1993.
Comparison of oxygen isotope records from the GISP2 and GRIP
Greenland ice cores. Nature 366, 552–554.
Gu, Z.Y., Lal, D., Liu, T.S., Southon, J., Caffee, M.W., Guo, Z.T., Chen,
M.Y., 1996. Five million year 10Be record in Chinese Loess and red-
clay: climate and weathering relationships. Earth and Planetary
Science Letters 144, 273–287.
Gu, Z.Y., Lal, D., Liu, T.S., Guo, Z.T., Southon, J., Caffee, M.W., 1997.
Weathering histories of Chinese loess deposits based on U–Th series
nuclides and cosmogenic 10Be. Geochimica et Cosmochimica Acta 61,
5221–5231.
Gu, Z.Y., Liu, Q., Xu, B., Han, J.M., Yang, S.L., Ding, Z.L., Liu, T.S.,
2003. Climate as the dominant control on C3 and C4 plant abundance
in the Loess Plateau: evidence of organic carbon isotope records from
the last glacial–interglacial loess–paleosol sequences. Chinese Science
Bulletin 48, 1271–1276.
Guiot, J., Harrison, S.P., Prentice, I.C., 1993. Reconstruction of Holocene
precipitation patterns in Europe using pollen and lake-level data.
Quaternary Research 40, 139–149.
Guo, Z.T., Liu, T.S., 1993. Paleosols as evidence of difference of climates
between Holocene and the Last Interglacial. Quaternary Sciences 1,
41–55 (in Chinese with English abstract).
Guo, Z.T., Liu, T.S., An, Z.S., 1994. Paleosols of the last 0.15Ma in the
Weinan loess section and their paleoclimate significance. Quaternary
Sciences 14 (3), 256–269 (in Chinese with English abstract).
Guo, Z.T., Liu, T.S., Guiot, J., Wu, N.Q., Lu, H.Y., Han, J.M., Liu, J.Q.,
Gu, Z.Y., 1996. High frequency pulses of East Asian monsoon climate
in the last two glaciations: link with the North Atlantic. Climate
Dynamics 12, 701–709.
Guo, Z.T., Liu, T.S., Fedoroff, N., Wei, L.Y., Ding, Z.L., Wu, N.Q., Lu,
H.Y., Jiang, W.Y., An, Z.S., 1998. Climate extremes in Loess of China
coupled with the strength of deep-water formation in the North
Atlantic. Global and Planetary Change 18, 113–128.
Guo, B., Zhu, R.X., Roberts, A.P., Florindo, F., 2001a. Lack of
correlation between paleoprecipitation and magnetic susceptibility of
Chinese loess/paleosol sequences. Geophysical Research Letters 28,
4259–4262.
Guo, Z.T., Biscayse, T., Wei, L.Y., Chen, X.H., Peng, S.Z., Liu, T.S.,
2001b. Summer monsoon variations over the last 1.2Ma from the
weathering of loess–soil sequences in China. Geophysical Research
Letters 27, 1751–1754.
Han, J.M., Lu, H.Y., Wu, N.Q., Guo, Z.T., 1996. The magnetic
susceptibility of modern soils in China and its use for paleoclimate
reconstruction. Studia geoph.et grod 40, 262–275.
Heller, F., Liu, T.S., 1982. Magnetostratigraphical dating of loess deposits
in China. Nature 300, 431–433.
Jennerjahn, T.C., Ittekkot, V., Arz, H.W., Behling, H., Patzold, J., Wefer,
G., 2004. Asynchronous terrestrial and marine signals of climate
change during heinrich events. Science 306, 2236–2239.
Jiang, W.Y., Peng, S.Z., Hao, Q.Z., Liu, T.S., 2002. Carbon isotopic
records in paleosols over the Pliocene in Northern China: implication
on vegetation development and Tibetan uplift. Chinese Science
Bulletin 47 (8), 687–690.
Juggins, S., 2003. User Guide: C2, Software for ecological and
palaeoecological data analysis and visualization. User Guide Version
1.3. Department of Geography University of Newcastle Newcastle
upon Tyne, pp. 1–69.
Kemp, R.A., 1995. Distribution and genesis of calcitic pedofeatures within
a rapidly aggrading loess–paleosol sequence in China. Geoderma 65,
303–316.
Kemp, R.A., Derbyshire, E., Meng, X.M., Chen, F.H., Pan, B.T., 1995.
Pedosendimentary reconstruction of a thick loess–paleosol sequence
near Lanzhou in north-central China. Quaternary Research 43, 30–45.
Kemp, R.A., Derbyshire, E., Meng, X.M., 1997. Micromorphological
variations of the S1 paleosol across northwest China. Catena 31,
77–90.
Kondo, R., Childs, C., Atkinson, I., 1994. Opal Phytoliths of New
Zealand. Manaaki Whenua Press, Canterbury, 85pp.
Kukla, G., An, Z.S., 1989. Loess stratigraphy in Central China.
Palaeogeography, Palaeoclimatology, Palaeoecology 72, 203–225.
Liu, T.S., 1985. Loess and the Environment. China Ocean Press, Beijing,
pp. 1–251 (in Chinese).
Liu, T.S., Ding, Z.L., 1998. Chinese loess and the paleomonsoon. Annual
Review of Earth and Planetary Sciences 26, 111–145.
Liu, J.Q., Chen, T.M., Nie, G.Z., Song, C.Y., Guo, Z.T., Li, K., Gao, S.J.,
Qiao, Y.L., Ma, Z.B., 1994. Datings and reconstruction of the high
resolution time series in the Weinan loess section of the last 150 000
years. Quaternary Sciences 14 (3), 193–202 (in Chinese with English
abstract).
Liu, T.S., Guo, Z.T., Liu, J.Q., Han, J.M., Ding, Z.L., Gu, Z.Y., Wu,
N.Q., 1995a. Variations of eastern Asian monsoon over the last
140,000 years. Bulletin de la Societe Geologique de France 166,
221–229.
Liu, X.M., Rolph, T., Bloemendal, J., Shaw, J., Liu, T.S., 1995b.
Quantitative estimates of palaeoprecipitation at Xifeng area, in the
Loess Plateau of China. Palaeogeography, Palaeoclimatology, Palaeo-
ecology 113, 243–248.
Liu, T.S., Gu, Z.T., Wu, N.Q., Lu, H.Y., 1996. Prehistoric vegetation on
the Loess Plateau: steppe or forest? Journal of Southeast Asian Earth
Sciences 13 (3–5), 341–346.
Lu, H.Y., 1998. Quaternary environmental changes recorded by magnetic
susceptibility and plant fossils: quantitative estimates of paleoclimates.
Ph.D. Thesis, Institute of Geology, Chinese Academy of Sciences,
China (in Chinese with English Abstract).
ARTICLE IN PRESSH.-Y. Lu et al. / Quaternary Science Reviews 26 (2007) 759–772 771
Lu, H.Y., Liu, K.B., 2003a. Morphological variations of lobate phytoliths
from grasses in China and the southeastern USA. Diversity and
Distributions 9 (1), 73–87.
Lu, H.Y., Liu, K.B., 2003b. Phytoliths of common grasses in the coastal
environments of southeastern USA. Estuarine, Coastal and Shelf
Science 58, 587–600.
Lu, H.Y., Liu, K.B., 2005. Phytolith assemblages as indicators of coastal
environmental changes and hurricane overwash deposition. The
Holocene 15 (7), 965–972.
Lu, H.Y., Han, J.M., Wu, N.Q., Guo, Z.T., 1994. Magnetic susceptibility
of the modern soils in China and paleoclimatic significance. Science in
China (Series B) 24, 1290–1297 (in Chinese).
Lu, H.Y., Wu, N.Q., Liu, D.S., Han, J.M., Qin, X.G., Sun, X.J., Wang,
Y.J., 1996. Seasonal climatic variation recorded by phytolith
assemblages from the Baoji loess sequence in central China over the
last 150,000 a. Science in China (Series D) 39, 629–639.
Lu, H.Y., Liu, T.S., Wu, N.Q., Han, J.M., Guo, Z.T., 1999. Phytolith
record of vegetation succession in the southern Loess Plateau since
Late Pleistocene. Quaternary Sciences 4, 348–354 (in Chinese with
English abstract).
Lu, H.Y., Wu, N.Q., Yang, X.D., Jiang, H., Liu, K.B., Liu, T.S., 2006.
Phytoliths as quantitative indicators for the reconstruction of past
environmental conditions in China I: phytolith-based transfer func-
tion. Quaternary Science Reviews 25, 945–959.
Madella, M., 1997. Phytoliths from a Central Asia loess–paleosol
sequence and modern soils: their taphonomical and palaeoecological
implication. In: Pinilla, A. (Ed.), The State of the Art of Phytoliths in
Plants and Soils. Monografias del Centro de Ciencias Medambioen-
tales, Madrid, pp. 49–58.
Maher, B.A., Thompson, R., 1995. Palaeorainfall reconstructions from
pedogenic magnetic susceptibility variations in the Chinese loess and
palaeosols. Quaternary Research 44, 383–391.
Maher, B.A., Thompson, R., Zhou, L.P., 1994. Spatial and temporal
reconstructions of changes in the Asian palaeomonsoon: a new mineral
magnetic approach. Earth and Planetary Science Letters 125,
461–471.
McManus, J.F., Bond, G.C., Broecker, W.S., Johnsen, S., Labeyrie, L.,
Higgins, S., 1994. High-resolution climate records from the North
Atlantic during the last interglacial. Nature 371, 326–329.
Mulholland, S.C., 1989. Phytolith shape frequencies in North Dakota
grasses: a comparison to General patterns. Journal of Archaeological
Science 16, 489–511.
Mulholland, S.C., Rapp Jr., G., 1992. A morphological classification of
grass silica-bodies. In: Rapp, Jr. G., Mulholland, S.C. (Eds.), Phytolith
systematics: Advances in Archaeological and Museum Science, New
York, pp. 65–89.
Overpeck, J.T., Webb III, T., Prentice, I.C., 1985. Quantitative
interpretation of fossil pollen spectra: dissimilarity coefficients and
the method of modern analogs. Quaternary Research 23, 87–108.
Pearsall, D.M., 2000. Paleoethnobotany: A Handbook of Procedures,
second ed. Academic Press, San Diego, 700pp.
Piperno, D.R., 1988. Phytolith Analysis. An Archaeological and
Geological Perspective. Academic Press, San Diego, 280pp.
Piperno, D.R., 2006. Phytoliths: A Comprehensive Guide for Archae-
ologists and Paleoecologists. Alta Mira Press, Oxford, UK, 238pp.
Piperno, D.R., Pearsall, D.M., 1998. The silica bodies of tropical
American grasses: morphology, taxonomy, and implications for grass
systematics and fossil phytolith identification. Annals of the Smith-
sonian Institution 85, 1–40.
Porter, S.C., 2001. Chinese loess record of monsoon climate during the last
glacial–interglacial cycle. Earth Science Reviews 54, 115–128.
Porter, S.C., An, Z.S., 1995. Correlation between climate events in
the North Atlantic and China during the last glaciation. Nature 375,
305–308.
Porter, S.C., Hallet, B., Wu, X.H., An, Z.S., 2001. Dependence of near-
surface magnetic susceptibility on dust accumulation rate and
precipitation on the Chinese Loess plateau. Quaternary Research 55,
271–283.
Qian, L.Q., 1991. Climate of the Loess Plateau. Meteorological Press,
Beijing, 369pp. (in Chinese).
Rousseau, D.D., Kukla, G., 2000. Abrupt retreat of summer monsoon at
the S1/L1 boundary in China. Global and Planetary Change 26,
189–198.
Rousseau, D.D., Wu, N.Q., Guo, Z.T., 2000. The terrestrial mollusks as
new indices of the Asian paleomonsoons in the Chinese Loess Plateau.
Global and Planetary Change 26, 199–206.
Rousseau, D.D., Hatte, C., Guiot, J., Duzer, D., Schevin, P., Kukla, G.,
2006. Reconstruction of the Grande Pile Eemian using inverse
modeling of biomes and d13C. Quaternary Science Reviews, in press.
Runge, F., 1999. The opal phytolith inventory of soils in central Africa—
quantities, shapes, classification, and spectra. Review of Palaeobotany
and Palynology 107, 23–53.
Rutter, N., 1992. Chinese loess and global change, XIII Inqua Congress
1991, Presidential Address. Quaternary Science Reviews 11, 275–281.
Seppa, H., Birks, H.J.B., Odland, A., Poska, A., Veski, S., 2004. A
modern pollen–climate calibration set from northern Europe: devel-
oping and testing a tool for palaeoclimatological reconstructions.
Journal of Biogeography 31, 251–267.
Shi, Y.F., Yu, G., Liu, X.D., Li, B.Y., Yao, T.D., 2001. Reconstruction of
the 30–40 ka BP enhanced India monsoon climate based on geological
records from the Tibetan Plateau. Palaeogeography, Palaeoclimatol-
ogy, Palaeoecology 169, 69–83.
Sun, X.J., Song, C.Q., Wang, F.Y., Sun, M., 1997. Vegetation history of
the loess plateau of China during the last 100,000 years based on pollen
data. Quaternary International 37, 25–36.
ter Braak, C.J.F., Juggins, S., 1993. Weighted averaging partial least
squares regression (WA-PLS): an improved method for reconstructing
environmental variables from species assemblages. Hydrobiologia
269/270, 485–502.
Twiss, P.C., Suess, E., Smith, R.M., 1969. Division S-5—soil genesis,
morphology, and classification (morphological classification of grass
phytoliths). Soil Science Society of America, Proceedings 33, 109–115.
Vidic, N.J., Montanez, I.P., 2004. Climatically driven glacial–interglacial
variations in C3 and C4 plant proportions on the Chinese Loess
Plateau. Geology 32 (4), 337–340.
Wang, W.Y., Liu, J.Q., Pan, M., Liu, D.S., 2000. Reconstruction of the
high resolution timescale in the Weinan loess section of the Late
Quaternary. Earth Science—Journal of China University of Geo-
sciences 25 (1), 98–102 (in Chinese with English abstract).
Wang, X., Peng, P.A., Ding, Z.L., 2005. Black carbon records in Chinese
Loess Plateau over the last two glacial cycles and implications for
paleofires. Palaeogeography, Palaeoclimatology, Palaeoecology 223,
9–19.
Wang, Y.J., Lu, H.Y., 1993. The Study of Phytolith and its Application.
China Ocean Press, Beijing, 228pp. (in Chinese).
Weinelt, M., Rosell-Mele, A., Pflaumann, U., Sarnthein, M., Kiefer, T.,
2003. The role of productivity in the Northeast Atlantic on abrupt
climate change over the last 80,000 years. Zeitschrift der Deutschen
Geologischen Gesellschaft 154/1, 47–66.
Wu, N.Q., Lu, H.Y., Chen, D., Gao, F., 1995a. Late glaciation
paleoenvironment in Weinan, Shaanxi: evidence based on snail fossils.
Quaternary Sciences 2, 147–153 (in Chinese with English abstract).
Wu, N.Q., Lu, H.Y., Sun, X.J., Guo, Z.T., Liu, J.Q., Han, J.M., 1995b.
Climatic factor transfer function from opal phytolith and its
application in paleoclimate reconstruction of China loess–paleosol
sequence. Scientia Geologica Sinica, Supplementary Issue (1), 105–114.
Wu, N.Q., Rousseau, D.D., Liu, T.S., 1999. Climatic instability recorded
by the mollusk assemblages from the Late Glacial loess deposits in
China. Chinese Science Bulletin 44, 1238–1242.
Wu, N.Q., Liu, T.S., Liu, X.P., Gu, Z.Y., 2002. Mollusk record of
millennial climate variability in the Loess Plateau during the Last
Glacial Maximum. Boreas 31, 20–27.
Wu, Z., 1980. Vegetation of China. Science Press, Beijing, 1275pp.
Xiao, J.L., An, Z.S., Liu, T.S., Inouchi, Y., Kumai, H., Yoshikawa, S.,
Kondo, Y., 1999. East Asian monsoon variation during the last

ARTICLE IN PRESSH.-Y. Lu et al. / Quaternary Science Reviews 26 (2007) 759–772772
130,000 Years: evidence from the Loess Plateau of Central China and
Lake Biwa of Japan. Quaternary Science Reviews 18 (1), 147–157.
Xiao, J.L., Porter, S.C., An, Z., Kumai, H., Yoshikawa, S., 1995. Grain
size of quartz as an indicator of winter monsoon strength on the Loess
Plateau of central China during the last 130,000 yr. Quaternary
Research 43, 22–29.
Xiao, J.L., An, Z.S., 1999. Three large shifts in east Asian monsoon
circulation indicated by loess–paleosol sequences in China and Late
Cenozoic deposits in Japan. Palaeogeography, Palaeoclimatology,
Palaeoecology 154, 179–189.
Yao, T.D., Jiao, K.Q., Zhang, X.P., 1994. Climatic and environmental
records from Guliya cap. Science in China (Series D) 24, 766–773.
Zhang, H.C., Ma, Y.Z., Peng, J.L., Li, J.J., Cao, J.X., Qi, Y.A., Chen,
G.G., Fang, H.B., Mu, D.F., Pachur, H.J., Wunnemann, B., Feng,
Z.D., 2002. Palaeolake and palaeoenvironment between 42 and 18 ka
BP in Tengger Desert, NW China. Chinese Science Bulletin 47,
1946–1956.
Zhu, R.X., Laj, C., Mazaud, A., 1994. The Matuyama–Brunhes and upper
Jaramillo transitions recorded in a loess section at Weinan, North-
Central China. Earth and Planetary Science Letters 125, 143–158.