Physical Characteristics and Physiological Attributes of Female Volleyball Players—The Need for...
11
PHYSICAL CHARACTERISTICS AND PHYSIOLOGICAL ATTRIBUTES OF FEMALE VOLLEYBALL PLAYERS—THE NEED FOR INDIVIDUAL DATA PANTELIS T. NIKOLAIDIS, 1 GAL ZIV, 2,3 MICHAL ARNON, 2 AND RONNIE LIDOR 2,3 1 Exercise Physiology Laboratory, Nikea, Attiki, Greece; 2 The Zinman College of Physical Education and Sport Sciences, Wingate Institute, Netanya, Israel; and 3 Faculty of Education, University of Haifa, Haifa, Israel ABSTRACT Nikolaidis, PT, Ziv, G, Arnon, M, and Lidor, R. Physical characteristics and physiological attributes of female volleyball players—The need for individual data. J Strength Cond Res 26(9): 2547–2557, 2012—The purpose of this study was twofold: (a) to profile physical characteristics and physiological attributes of adolescent and adult Greek female volleyball players (n = 61) who were members of the A (the best league for female volleyball players) and B (the second-best league for female volleyball players) Series clubs in Greece and (b) to examine the intraindividual variability among these players in all physical and physiological measurements that were under- taken in the study. The participants were divided into 3 age groups––under 14, 14–18, and over 18 years. They under- went a series of physical (e.g., height, body mass, and percentage of body fat) and physiological (e.g., aerobic profile, flexibility, and vertical jumping ability) tests. Three main findings emerged from the data analysis: (a) differences in physical characteristics and physiological attributes existed between the 3 age groups. For example, fat-free mass was lower in players under the age of 14 years (41.57 6 6.06 kg) compared with that in players between the ages of 14–18 years (50.24 6 6.96 kg) and players over the age of 18 years (52.03 6 3.39 kg). In addition, the relative peak power as measured in the Wingate Anaerobic Test was the highest in the over- 18 group (9.72 6 0.65 Wkg 21 ), lower in the 14–18 group (8.95 6 0.7), and the lowest in the under-14 group (8.32 6 0.78 Wkg 21 ), (b) large intraindividual variability existed in most physical characteristics and physiological attributes measured in the study, and (c) the intraindividual variability was observed in all the 3 groups. These findings emphasize the need for coaches to examine the intraindividual variability within the players on their teams and to use this information when designing training programs and strength and conditioning programs. KEY WORDS volleyball, exercise test, physical fitness, athletic performance INTRODUCTION I n a recent review composed of a series of studies (n = 31) on physical and physiological attributes of female volleyball players (16), a number of observa- tions were made, among them being (a) players of a higher skill level are taller, somewhat heavier, and have higher vertical jump (VJ) values than those of players of a lower skill level, (b) the aerobic profile of female volleyball players is similar to that of female basketball players, (c) ballistic resistance training can increase VJ values in female volleyball players, and (d) preseason conditioning should be conducted to prevent fatigue and diminished performance at the beginning of the season. Similar observations were reported in another recent review summarizing 32 observa- tional and experimental studies on VJ in female and male volleyball players (25). In the abovementioned reviews, and in other studies on female volleyball players (e.g. [1,2]), only means and SDs of the physical and physiological tests given to the players were provided. This is to say that the intraindividual variability among the players was not discussed. It is true that means and SDs are the most common values used when profiling physical achievements and physiological attributes of players, and when comparing them among different groups of players such as players of different ages, players of varied skill levels, or players with different years of experience. However, it may also be important to examine the intraindividual variability that exists among these players, because this information can be used effectively by coaches and strength and conditioning coaches to plan better training programs reflecting the specific needs of the player in his or her team. Only a few attempts have been made to examine intraindividual differences in athletes. One study of 5 elite air-pistol shooters revealed that the relationships between Address correspondence to Dr. Ronnie Lidor, [email protected]. 26(9)/2547–2557 Journal of Strength and Conditioning Research Ó 2012 National Strength and Conditioning Association VOLUME 26 | NUMBER 9 | SEPTEMBER 2012 | 2547 Copyright © National Strength and Conditioning Association Unauthorized reproduction of this article is prohibited.
-
Upload
independent -
Category
Documents
-
view
0 -
download
0
Transcript of Physical Characteristics and Physiological Attributes of Female Volleyball Players—The Need for...

PHYSICAL CHARACTERISTICS AND PHYSIOLOGICAL
ATTRIBUTES OF FEMALE VOLLEYBALL
PLAYERS—THE NEED FOR INDIVIDUAL DATA
PANTELIS T. NIKOLAIDIS,1 GAL ZIV,2,3 MICHAL ARNON,2 AND RONNIE LIDOR2,3
1Exercise Physiology Laboratory, Nikea, Attiki, Greece; 2The Zinman College of Physical Education and Sport Sciences,Wingate Institute, Netanya, Israel; and 3Faculty of Education, University of Haifa, Haifa, Israel
ABSTRACT
Nikolaidis, PT, Ziv, G, Arnon, M, and Lidor, R. Physical
characteristics and physiological attributes of female volleyball
players—The need for individual data. J Strength Cond Res
26(9): 2547–2557, 2012—The purpose of this study was
twofold: (a) to profile physical characteristics and physiological
attributes of adolescent and adult Greek female volleyball
players (n = 61) who were members of the A (the best league
for female volleyball players) and B (the second-best league for
female volleyball players) Series clubs in Greece and (b) to
examine the intraindividual variability among these players in all
physical and physiological measurements that were under-
taken in the study. The participants were divided into 3 age
groups––under 14, 14–18, and over 18 years. They under-
went a series of physical (e.g., height, body mass, and
percentage of body fat) and physiological (e.g., aerobic profile,
flexibility, and vertical jumping ability) tests. Three main findings
emerged from the data analysis: (a) differences in physical
characteristics and physiological attributes existed between
the 3 age groups. For example, fat-free mass was lower in
players under the age of 14 years (41.57 6 6.06 kg) compared
with that in players between the ages of 14–18 years (50.24 6
6.96 kg) and players over the age of 18 years (52.03 6
3.39 kg). In addition, the relative peak power as measured in
the Wingate Anaerobic Test was the highest in the over-
18 group (9.72 6 0.65 W�kg21), lower in the 14–18 group
(8.95 6 0.7), and the lowest in the under-14 group (8.32 6
0.78 W�kg21), (b) large intraindividual variability existed in most
physical characteristics and physiological attributes measured
in the study, and (c) the intraindividual variability was observed
in all the 3 groups. These findings emphasize the need for
coaches to examine the intraindividual variability within the
players on their teams and to use this information when
designing training programs and strength and conditioning
programs.
KEY WORDS volleyball, exercise test, physical fitness, athletic
performance
INTRODUCTION
In a recent review composed of a series of studies(n = 31) on physical and physiological attributes offemale volleyball players (16), a number of observa-tions were made, among them being (a) players of
a higher skill level are taller, somewhat heavier, and havehigher vertical jump (VJ) values than those of players ofa lower skill level, (b) the aerobic profile of female volleyballplayers is similar to that of female basketball players, (c)ballistic resistance training can increase VJ values in femalevolleyball players, and (d) preseason conditioning should beconducted to prevent fatigue and diminished performance atthe beginning of the season. Similar observations werereported in another recent review summarizing 32 observa-tional and experimental studies on VJ in female and malevolleyball players (25).
In the abovementioned reviews, and in other studies onfemale volleyball players (e.g. [1,2]), only means and SDsof the physical and physiological tests given to the playerswere provided. This is to say that the intraindividualvariability among the players was not discussed. It is truethat means and SDs are the most common values used whenprofiling physical achievements and physiological attributesof players, and when comparing them among differentgroups of players such as players of different ages, playersof varied skill levels, or players with different years ofexperience. However, it may also be important to examinethe intraindividual variability that exists among these players,because this information can be used effectively by coachesand strength and conditioning coaches to plan better trainingprograms reflecting the specific needs of the player in his orher team.
Only a few attempts have been made to examineintraindividual differences in athletes. One study of 5 eliteair-pistol shooters revealed that the relationships between
Address correspondence to Dr. Ronnie Lidor, [email protected].
26(9)/2547–2557
Journal of Strength and Conditioning Research� 2012 National Strength and Conditioning Association
VOLUME 26 | NUMBER 9 | SEPTEMBER 2012 | 2547
Copyright © National Strength and Conditioning Association Unauthorized reproduction of this article is prohibited.

body sway, aim-point fluctuation, and performance areindividual specific (5). Moreover, the strength and directionof the association among these variables vary betweenindividual shooters. In a review article on male and femalebasketball players (24), a large individual variability wasreported for various physiological attributes such as bloodlactate levels, _VO2max, and ventilatory threshold. Specifically,the authors of this review suggested that the significantindividual variations in strength values imply that an indi-vidualized training approach should be used by basketballand strength and conditioning coaches whenever possible.
In this respect, it has been argued by sport scientists that,from a practical point of view, individualization is one of thecornerstones of the methodology of training and conditioning(e.g. [6,23]). The importance of individualization stems froma number of factors, among them being the level of training,the biological and chronological ages of the athlete, andthe athlete’s recovery rate, including the individual capacityof the athlete for work and performance (6). Athletes who arecapable of giving the same performance do not necessarilyhave the same work capacity, because both are determinedby a number of biological and psychological factors.
In volleyball, 2 players playing the same position (e.g.,blockers) can perform similarly in actual games but mayexhibit different physical and physiological attributes. Forexample, one can have a tall stature but lack vertical jumpingskills, and the other can have a short stature but exhibit greatjumping ability. These 2 players are different physically andphysiologically but at the same time perform very similarly.If there are large variations of physical and physiologicalattributes among athletes (e.g., volleyball players), then moreemphasis should be placed on individual data rather thanon means and SDs. It would perhaps be more accurate toconsider a range of values for each achievement and attributeof the athlete rather than one value that represents the meanof the entire group.
An attempt was made in this study not only to describe thephysical characteristics and physiological attributes of femalevolleyball players but also to observe the intraindividualvariability of those characteristics and attributes. Morespecifically, it was our aim to profile physical characteristicsand physiological attributes of 3 different age groups of Greekfemale volleyball players and then to examine the intra-individual variability in each of the physical-physiologicaltests undertaken by the players. Our assumption was thatif intraindividual variability indeed existed between players ineach age group and between age groups, this should be takeninto account by coaches when developing training programsfor the female volleyball player.
METHODS
Experimental Approach to the Problem
In this observational study, a series of physical andphysiological tests was administered to 3 groups of femalevolleyball players (,14, 14–18, and .18 years old) to profile
their physical characteristics and physiological attributes andto assess the intraindividual variability among these players.The tests performed by the players were all related to thegame of volleyball, and measured (a) physical characteristicssuch as height, body mass, and percent body fat and (b)physiological attributions such as aerobic ability, anaerobicability, flexibility, and vertical jumping. All the assessedphysiological attributes are essential for the achievementof optimal performance in volleyball players. Our mainobjective was to examine the existence of the intraindividualvariability in players in the 3 age groups. Information obtainedfrom the analysis of the intraindividual variability amongthese players can help coaches effectively assess the physicaland physiological state of their players and subsequently planbetter training programs reflecting the actual needs of theindividual player within the team.
Subjects
Sixty-one female volleyball players participated in this study.They were divided into 3 age groups: (a) 14 and under (n = 22;mean age = 12.5 6 1.07 years), (b) between 14 and 18 (n = 30;mean age = 15.8 6 1.00 years), and (c) over 18 (n = 9; meanage = 25.9 6 5.46 years). The adolescent players, namely, allthe players who were under the age of 18 years, weremembers of the A (the best league for female volleyballplayers) and B (the second-best league for female volleyballplayers) Series clubs in Greece and competed in nonclassifiedtournaments because there were no national tournaments forthese 2 age groups. The adult players—those who were abovethe age of 18 years—were highly skilled and were partof one A Series club participating in national tournaments.Volleyball experience of the players ranged from 0.5 to7.0 years, with a mean of 2.9 6 1.8 years, and weekly trainingduration ranged from 180 to 585 min�wk21, averaging 327 6
85 min�wk21. All the subjects completed an informed consentform before participation. The parents of the players whowere under the age of 18 years approved the participationof their children in the study. In addition, the study wasapproved by an Institutional Review Board.
Procedures
On arrival at the Exercise Physiology Laboratory, theparticipants were provided with a verbal explanation of theexperimental design of the study. All testing was conductedby an experienced exercise physiologist (male, Ph.D. inexercise physiology, with experience in applied and researchprojects in exercise physiology) and took place in the lastmonth of the 2009–2010 competitive phase of the annualseason, on weekdays between 8 AM and 2 PM. The testingorder was similar in all groups: physical characteristics weremeasured first, followed by measurement of physiologicalattributes. Testing lasted about 90 minutes for each player.To prevent dehydration, ad libitum drinking was permittedfor the players after the completion of the jumping tests. Allthe subjects were given a standardized warm-up, whichincluded 10 minutes of cycling and 5 minutes of stretching.
2548 Journal of Strength and Conditioning Researchthe TM
Attributes of Female Volleyball Players
Copyright © National Strength and Conditioning Association Unauthorized reproduction of this article is prohibited.

Testing. Devices and protocols. Testing devices and protocolsare presented separately for the physical characteristicsand physiological attributes of the players, and according tothe testing order.
Physical characteristics. Height and body mass weremeasured using a stadiometer (Seca, Leicester, UnitedKingdom) and an electronic scale (HD-351, Tanita, ArlingtonHeights, IL, USA), respectively. Percent of body fat wascalculated from the sum of 10 skinfolds using a skinfold caliper(Harpenden, West Sussex, United Kingdom). Calculationswere based on the formula proposed by Parizksova (20). Bodycircumferences were measured using a measuring tape(Seca), and breadths were measured using a caliper (Lafay-ette, IN, USA). Three trials were made for each anthropo-metric measurement in rotational order, and the averagevalue was recorded. The anthropometric Heath-Cartermethod of somatotyping was employed for the quantificationof shape and composition of the human body, expressed ina 3-number rating representing endomorphy (relativefatness), mesomorphy (relative musculoskeletal robustness),and ectomorphy (relative linearity or slenderness) (10).
Physiological attributes. The participants underwent 10tests, as follows:
(a) A sit-and-reach test for measuring flexibility—The partic-ipants completed the test twice, and the best score wasrecorded. A 15-cm advantage was give to the par-ticipants, namely, that reaching the toes resulted ina score of 15 cm, reaching 5 cm further than the toesresulted in a score of 20 cm, and reaching 5 cm beforethe toes resulted in a score of 10 cm. The 15-cmadvantage was provided to assess the performances ofthose who could not reach their toes. This test wasfound to have a high test-retest reliability (intraclasscorrelation coefficient [ICC] . 0.98) (9).
(b) The YMCA 3-minute step test for measuring aerobiccapacity—The participants were required to step up toand down from a 30-cm high bench with their handson the waist to a set cadence (24 steps per minute; i.e.,right leg up, left up, right down, left down) elicited bya metronome (96 b�min21) for 3 minutes (19). Theheart rate (HR) was measured using an HR monitor(Team2, Polar, Polar Electro, Kempele, Finland) at theend of the 3-minute test and using a stethoscope duringthe first minute of recovery. A similar step test of30 steps per minute was found to be reliable (r = 0.91)(14).
(c) A PWC170 test for predicting maximal work capacity—Powerwork capacity in the HR 170 b�min21 (PWC170) wasemployed as a measure of cardiorespiratory power (4).The participants were asked to cycle on a cycleergometer (Monark Ergomedics 828, Monark, Sweden)for two 3-minute sessions against an incremental workload. The HR was recorded at the end of each session.The findings were plotted on a workload-HR graphical
display, and PWC170 was calculated based on the linearrelationships between work load and HR. The test-retest reliability of this test was found to be moderate tohigh (r = 0.76) (7).
(d) A vertical jump test for measuring explosive power forlegs—The participants completed 2 countermovementjumps, with arm swing allowed, using a contact mat(Papadopoulos and Nikolaidis, Athens, Greece). Thehighest jump was recorded. Various VJ protocols werefound to be highly reliable (r . 0.97) (3).
(e) A modified 30-second Bosco anaerobic jump test—This test wasconducted using a contact mat. The participants wereinstructed to jump as high as possible, while trying tostay on the mat as little as possible between jumps.Absolute mean power in 30 seconds (watts) andrelative mean power in 30 seconds (watts per kilogram)values were calculated (17). This test was notperformed by the over-18 group.
(f ) A force-velocity (F-v) test was performed for legs ona cycle ergometer (Monark Ergomedics 874, Monark,Sweden), and the same ergometer with modificationswas used for arms. This test employed various appliedbraking forces that elicit different pedaling velocitiesto derive maximal power (11). The players performed5 supramaximal pedal sprints, each lasting 7 seconds,against incremental braking force. The test began witha braking force of 29.4 N for the cycle ergometer and19.6 N for arm cranking. In every subsequent sprint,9.8 N was added to both ergometers. The recoveryperiod between each exercise bout was 5 minutes.During each sprint, the participants were encouragedto reach their maximal velocity as quickly as possible.The value of peak velocity was recorded in each sprintand used to estimate F-v parameters. Based on theinverse linear F-v relationship, theoretical maximalvalues of force (F0) and velocity (v0) were calculated,and maximal power (Pmax) was calculated from theequation Pmax = 0.25F0�v0.
(g) An isometric handgrip strength test—The participants wereasked to sit with the elbow of their testing arm restingon a table and bent at approximately 90�. They werethen instructed to squeeze the handle of the handgripdynamometer (Takei, Tokyo, Japan) as hard as possiblefor 5 seconds. Two trials were performed for eachhand, with a 1-minute rest between the trials. The betterof the trials was recorded as the maximal effort for eachhand (21). In one study, the test-retest reliability of thistest was found to be high (ICC = 0.98) (8).
(h) Isometric back and leg strength tests—Two tests wereperformed: In the first one (combined back-and-legtest), the chain length on the dynamometer wasadjusted so that the participants squatted over thedynamometer with their knees flexed approximately30�. In the second test (back strength test), their legswere straight and the back was flexed to allow the bar
VOLUME 26 | NUMBER 9 | SEPTEMBER 2012 | 2549
Journal of Strength and Conditioning Researchthe TM
| www.nsca.com
Copyright © National Strength and Conditioning Association Unauthorized reproduction of this article is prohibited.

to be at the level of the patella (21). A backdynamometer (Takei) was used in 2 tests. In onestudy, isometric back flexion and extension test wasfound to be reliable (ICC = 0.93–0.97) (8).
(i) The Wingate Anaerobic Test (WAnT)—From a stoppedposition, the participants were asked to pedal as hardas they could for 30 seconds on a cycle ergometer(Monark Ergomedics 874, Monark, Sweden) witha resistance equal to 7.5% of their body mass.Mechatronic hardware recorded each revolution, andspecialized software (Papadopoulos and Nikolaidis,Athens, Greece) calculated peak and mean poweroutput. This test of anaerobic power was found to beboth valid and reliable (13).
Statistical Analyses
Descriptive statistics are presented as mean 6 SD, and anAlpha level of 0.05 was set for all statistical tests. A one-wayanalysis of variance was used to examine differences betweenthe 3 age groups on all physical and physiological tests.When statistically significant differences were found, a Fisherleast significant difference (LSD) post hoc procedure wasperformed. A Levene’s test of homogeneity of variance wasused to assess whether variance differed between the groups.Coefficients of variation were also calculated for eachmeasured variable and for each age group. Z-scores for2 players from each age group were calculated based on
5 categories of tests: (a) physical characteristics—height,mass, body mass index, waist circumference, hip circumfer-ence, arm circumference, fat-free mass, and %body fat (BF),(b) aerobic—the PWC170 test and the step test, (c) anaero-bic—the WAnT (peak and mean power), force-velocitytest, Bosco test (power and duration), and the vertical jumptest, (d) strength—hand grip and back strength, and (e)flexibility—the sit-and-reach test. The 2 players who wereselected from each age group exhibited similar Z-scores;however, their category-based Z-scores were different. ACronbach’s Alpha was used to assess the reliability of all thevariables used in each category in the calculation of theZ-scores and was performed separately for each age group.
RESULTS
Statistical analyses are presented for the physical character-istics’ data, physiological attribute data, intraindividualvariability, and individual Z-score-based differences.
Physical Characteristics
Means, SDs, significance values, and coefficient of variationvalues of the physical characteristics of the under-14, 14–18,and over-18 groups are presented in Table 1. Quiteexpectedly, most of the data differed between groups. Onlythe %BF difference was not found to be significant betweenthe groups.
TABLE 1. Means, SDs, significance values, and coefficient of variation values of the physical characteristics of the under-14, 14–18, and over-18 groups.
Age groupUnder 14(n = 22)
14–18(n = 30)
Over 18(n = 9) Significance
Coefficient ofvariation
Height (cm)* 161.50 6 7.97 168.58 6 8.26 175.61 6 6.85 F(2,58) = 11.07, p , 0.001 0.05Body mass (kg)† 55.36 6 9.70 68.06 6 11.26 66.87 6 4.60 F(2,58) = 10.89, p , 0.001 0.18Body mass index‡ 21.15 6 2.84 23.84 6 2.77 21.69 6 1.15 F(2,58) = 7.21, p = 0.002 0.13%Body fat 24.42 6 4.92 25.83 6 3.45 22.10 6 3.32 F(2,58) = 3.10, p = 0.052 0.17Fat-free mass† 41.57 6 6.06 50.24 6 6.96 52.03 6 3.39 F(2,58) = 15.11, p , 0.001 0.30Fat massk 13.79 6 4.47 17.82 6 4.84 14.83 6 2.78 F(2,58) = 5.47, p = 0.007 0.17Waist circumference
(cm)k66.61 6 5.86 72.15 6 7.92 71.72 6 3.96 F(2,58) = 4.53, p = 0.015 0.16
Hip circumference(cm)†
87.71 6 7.58 96.92 6 6.53 100.11 6 2.37 F(2,58) = 17.05, p , 0.001 0.08
Arm circumference(cm)†
22.68 6 2.02 25.38 6 2.62 25.89 6 1.14 F(2,58) = 11.18, p , 0.001 0.11
Waist-to-hip ratio{ 0.76 6 0.05 0.74 6 0.05 0.72 6 0.05 F(2,58) = 3.02, p = 0.057 0.06Endomorphy 5.83 6 1.92 5.91 6 1.27 4.58 6 1.12 F(2,58) = 2.79, p , 0.070 0.27Mesomorphy‡ 4.21 6 1.15 4.86 6 1.09 3.92 6 0.87 F(2,58) = 3.70, p , 0.031 0.25Ectomorphy‡ 2.61 6 1.35 1.77 6 1.17 3.11 6 0.85 F(2,58) = 5.62, p = 0.006 0.56
*Significant differences between all groups.†Under-14 group significantly different from the other groups.‡The 14–18 group significantly different from the other groups.kUnder-14 group significantly different from the 14–18 group.{Under-14 group significantly different from the over-18 group.
2550 Journal of Strength and Conditioning Researchthe TM
Attributes of Female Volleyball Players
Copyright © National Strength and Conditioning Association Unauthorized reproduction of this article is prohibited.

TABLE 2. Means, SD, significance values, and coefficient of variation values of the power tests given to the under-14,14–18, and over-18 groups.
Age group Under 14 (n = 22) 14–18 (n = 30) Over 18 (n = 9) Significance Coefficient of variation
Modified Bosco testAbsolute power (W)* 103.36 6 18.06 137.60 6 26.72 N/A F(1,39) = 23.31, p , 0.001 0.23Relative power (W�kg21) 1.93 6 0.33 2.06 6 0.37 N/A F(1,39) = 1.40, p = 0.245 0.17
PWC170 testAbsolute power (W)* 91.91 6 17.76 121.03 6 33.22 147.91 6 34.32 F(2,57) = 13.15, p , 0.001 0.30Relative power (W�kg21)† 1.69 6 0.35 1.78 6 0.39 2.21 6 0.48 F(2,57) = 5.86, p = 0.005 0.23
Wingate Anaerobic TestPeak power (W)‡ 461.24 6 93.05 607.36 6 103.11 650.39 6 74.43 F(2,57) = 18.71, p , 0.001 0.22Relative peak power (W�kg21)* 8.32 6 0.78 8.95 6 0.77 9.72 6 0.65 F(2,57) = 10.67, p , 0.001 0.10Mean power (W) ‡ 340.45 6 77.51 430.07 6 74.72 477.24 6 36.60 F(2,56) = 14.23, p , 0.001 0.22Relative mean power (W�kg21)† 6.05 6 0.79 6.35 6 0.83 7.16 6 0.52 F(2,56) = 5.85, p = 0.005 0.13Fatigue index (%) 50.34 6 11.32 50.78 6 7.25 47.64 6 5.97 F(2,56) =0.408, p = 0.667 0.17
Force-velocity testAbsolute power (W) ‡ 607.33 6 197.03 777.71 6 193.69 930.50 6 204.74 F(2,54) = 9.06, p , 0.001 0.30Relative power (W�kg21)† 11.10 6 2.72 11.48 6 2.29 14.08 6 3.66 F(2,57) = 3.82, p = 0.028 0.24Vertical jump (cm) 27.73 6 4.99 28.54 6 5.53 29.96 6 8.7 F(2,57) = 0.462, p = 0.632 0.21
*Significant differences between all the groups.†Over-18 group significantly different from the other groups.‡Under-14 group significantly different from the other groups.
VO
LU
ME
26
|N
UM
BE
R9
|S
EP
TE
MB
ER
20
12
|2
55
1
JournalofStrengthand
Conditioning
Researchthe
TM
|w
ww
.nsca.com
Copyright © National Strength and Conditioning Association Unauthorized reproduction of this article is prohibited.

Figure 1. Box plots of selected physical characteristics. The edges of the box represent the interquartile range and the line crossing within the box represents themedian. BF = body fat, FFM = fat-free mass.
2552 Journal of Strength and Conditioning Researchthe TM
Attributes of Female Volleyball Players
Copyright © National Strength and Conditioning Association Unauthorized reproduction of this article is prohibited.

Figure 2. Box plots of selected physiological attributes. The edges of the box represent the interquartile range and the line crossing within the box represents themedian. WAnT = Wingate Anaerobic Test.
VOLUME 26 | NUMBER 9 | SEPTEMBER 2012 | 2553
Journal of Strength and Conditioning Researchthe TM
| www.nsca.com
Copyright © National Strength and Conditioning Association Unauthorized reproduction of this article is prohibited.
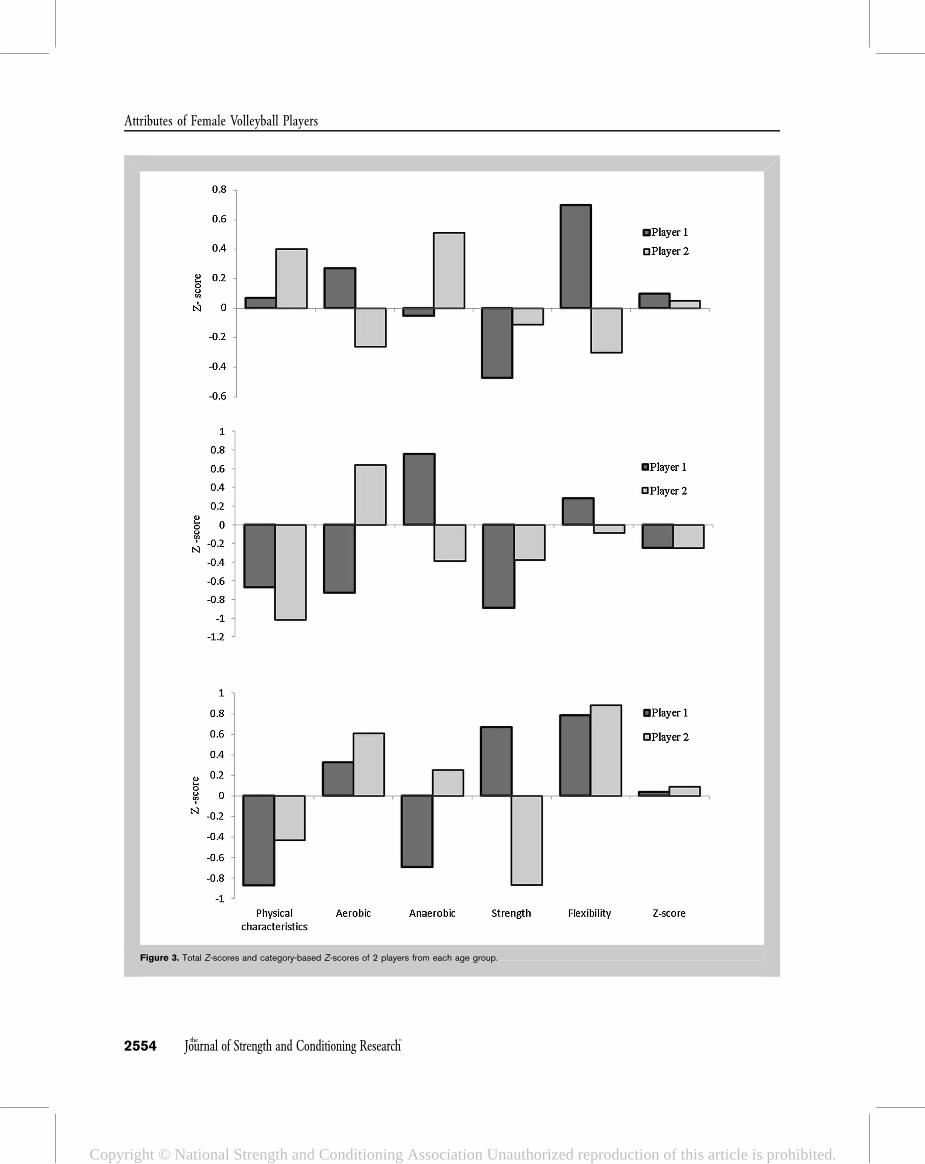
Figure 3. Total Z-scores and category-based Z-scores of 2 players from each age group.
2554 Journal of Strength and Conditioning Researchthe TM
Attributes of Female Volleyball Players
Copyright © National Strength and Conditioning Association Unauthorized reproduction of this article is prohibited.
Physiological Attributes
Data are presented separately for aerobic capacity, isometricstrength, anaerobic power, and flexibility.
Aerobic Capacity. The HR values at the end of the YMCA3-minute step test were significantly different betweenage groups, F(2,38) = 4.85, p = 0.013, h2 = 0.2, observedpower = 0.77. Post hoc analysis indicated that the HR valuesof the over-18 group (148 6 12 b�min21) were lower thanthose of the 14–18 group (157 6 10 b�min21) and theunder-14 group (162 6 12 b�min21). However, no differencesin the HR values were found after 1 minute of recovery(102 6 4, 104 6 18, and 105 6 15 b�min21 for the over-18,the 14–18, and the under-14 age groups, respectively).
Isometric Strength. Hand grip strength values were significantlydifferent between age groups, F(2,58) = 18.64, p , 0.001,h2 = 0.39, observed power = 1.0. Hand grip strength valueswere 23.46 6 4.22, 29.10 6 5.34, and 34.08 6 3.09 kg, in theunder-14 group, the 14–18 group, and the over-18 group,respectively. Back strength values were also significantlydifferent between age groups, F(2,48) = 19.93, p , 0.001,h2 = 0.45, observed power = 1.0. Back strength values were57.61 6 15.17, 83.86 6 20.19, and 105.63 6 11.34 kg, in theunder-14 group, the 14–18 group, and the over-18 group,respectively. Fisher LSD post hoc indicated that for bothstrength tests, differences were significant between all groups.
Anaerobic Power. Means, SDs, significance values, andcoefficient of variation values of the power tests given tothe under-14, 14–18, and over-18 groups are presentedin Table 2. Data for the modified Bosco test were available forthe under-14 and the 14–18 groups only. The differencesin absolute power in the modified Bosco test disappearedwhen power was divided by body mass. However, in theWAnT and in the force-velocity test, most of the differencesbetween the age groups remained significant even afterdividing the power by body mass. In addition, vertical jumpvalues did not differ between age groups.
Flexibility. No statistically significant differences between agegroups were found in the sit-and-reach test. Values for theunder-14 group, the 14–18 group, and the over-18 group were24.57 6 5.97, 27.05 6 6.00, and 27.33 6 7.57 cm, respectively.
Intraindividual Variability
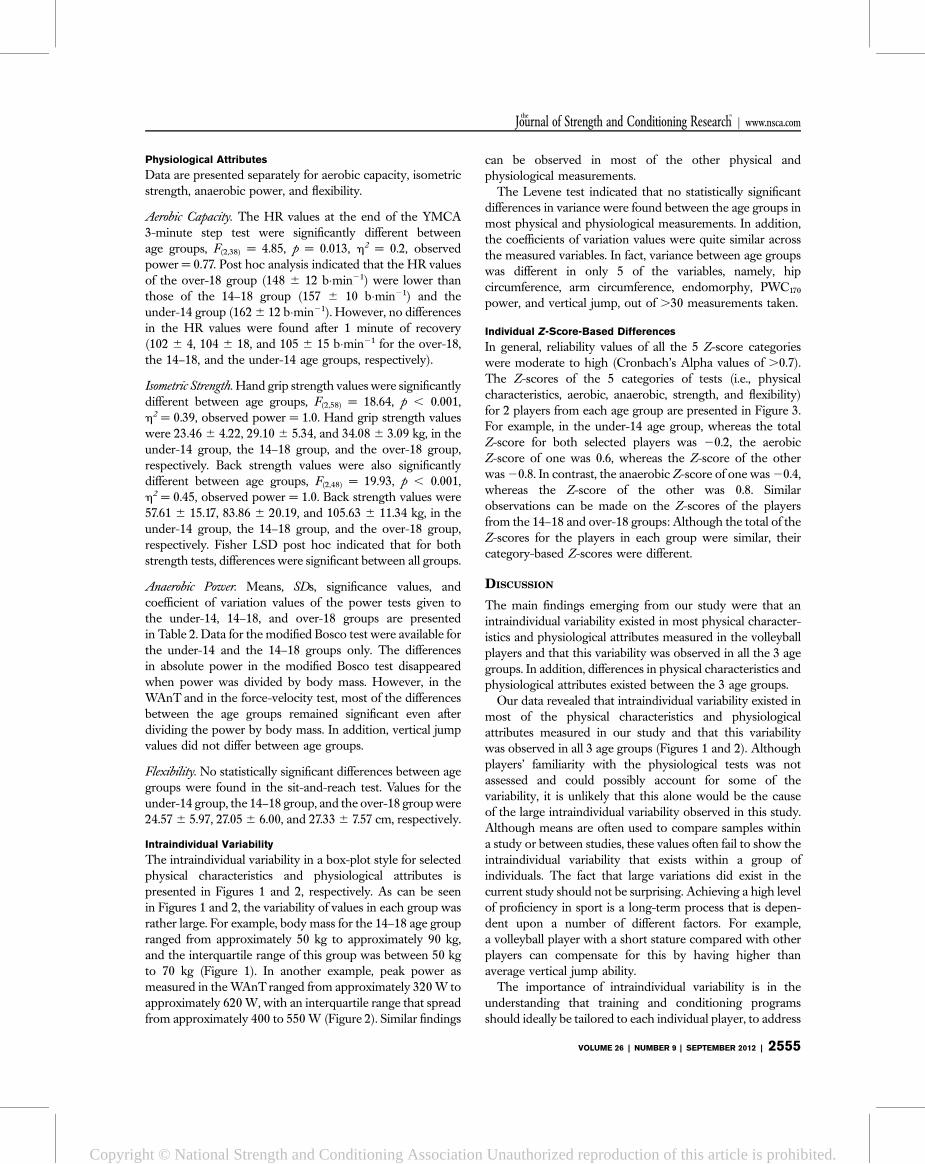
The intraindividual variability in a box-plot style for selectedphysical characteristics and physiological attributes ispresented in Figures 1 and 2, respectively. As can be seenin Figures 1 and 2, the variability of values in each group wasrather large. For example, body mass for the 14–18 age groupranged from approximately 50 kg to approximately 90 kg,and the interquartile range of this group was between 50 kgto 70 kg (Figure 1). In another example, peak power asmeasured in the WAnT ranged from approximately 320 W toapproximately 620 W, with an interquartile range that spreadfrom approximately 400 to 550 W (Figure 2). Similar findings
can be observed in most of the other physical andphysiological measurements.
The Levene test indicated that no statistically significantdifferences in variance were found between the age groups inmost physical and physiological measurements. In addition,the coefficients of variation values were quite similar acrossthe measured variables. In fact, variance between age groupswas different in only 5 of the variables, namely, hipcircumference, arm circumference, endomorphy, PWC170
power, and vertical jump, out of .30 measurements taken.
Individual Z-Score-Based Differences
In general, reliability values of all the 5 Z-score categorieswere moderate to high (Cronbach’s Alpha values of .0.7).The Z-scores of the 5 categories of tests (i.e., physicalcharacteristics, aerobic, anaerobic, strength, and flexibility)for 2 players from each age group are presented in Figure 3.For example, in the under-14 age group, whereas the totalZ-score for both selected players was 20.2, the aerobicZ-score of one was 0.6, whereas the Z-score of the otherwas 20.8. In contrast, the anaerobic Z-score of one was 20.4,whereas the Z-score of the other was 0.8. Similarobservations can be made on the Z-scores of the playersfrom the 14–18 and over-18 groups: Although the total of theZ-scores for the players in each group were similar, theircategory-based Z-scores were different.
DISCUSSION
The main findings emerging from our study were that anintraindividual variability existed in most physical character-istics and physiological attributes measured in the volleyballplayers and that this variability was observed in all the 3 agegroups. In addition, differences in physical characteristics andphysiological attributes existed between the 3 age groups.
Our data revealed that intraindividual variability existed inmost of the physical characteristics and physiologicalattributes measured in our study and that this variabilitywas observed in all 3 age groups (Figures 1 and 2). Althoughplayers’ familiarity with the physiological tests was notassessed and could possibly account for some of thevariability, it is unlikely that this alone would be the causeof the large intraindividual variability observed in this study.Although means are often used to compare samples withina study or between studies, these values often fail to show theintraindividual variability that exists within a group ofindividuals. The fact that large variations did exist in thecurrent study should not be surprising. Achieving a high levelof proficiency in sport is a long-term process that is depen-dent upon a number of different factors. For example,a volleyball player with a short stature compared with otherplayers can compensate for this by having higher thanaverage vertical jump ability.
The importance of intraindividual variability is in theunderstanding that training and conditioning programsshould ideally be tailored to each individual player, to address
VOLUME 26 | NUMBER 9 | SEPTEMBER 2012 | 2555
Journal of Strength and Conditioning Researchthe TM
| www.nsca.com
Copyright © National Strength and Conditioning Association Unauthorized reproduction of this article is prohibited.

his or her weak areas. Such an approach can help volleyballplayers to greatly improve their performance. This observa-tion is true for both the adolescent and the adult player. In thisstudy, intraindividual variability was found not only amongthe young players, as one may expect, but also among theadult players. Volleyball coaches and strength and condition-ing coaches should be aware of the variability among theirplayers, and ensure that each individual within the team isprovided with the optimal learning conditions to achieve hisor her best.
It is true that volleyball is a team sport that demands thatthe coach do his or her utmost to enhance team ability inboth the defensive and offensive aspects of the game. Indeed,during the training program a considerable amount of timeshould be devoted to drills that are aimed at improvingthe ability of the players to play together effectively as onecohesive unit. However, it is our suggestion that an individualapproach be adopted by coaches to improve the physicaland physiological attributes of the players. According to ourdata, there were differences among the players in most of thephysical and physiological measurements taken, and there-fore specific training programs should be developed toaddress the unique physical and physiological needs ofthe individual player. In essence, coaches should developsubtraining programs as part of their general training programto account for the intraindividual variability of their players.
When we compared the achievements in the testsmeasuring physical characteristics and those assessingphysical attributes of the volleyball players who participatedin our study with achievements of other competitivevolleyball players, we found that the achievements of theplayers in our study were somewhat lower than those of othersamples of players. These differences between the achieve-ments of the players who participated in our study and thoseassessed in other volleyball studies can be explained by thefact that, as opposed to in the other studies, our sample did notreach an elite level. In addition, there are a number of otherfactors that might have contributed to the observed differ-ences, among them the intensity of the training program, theexperience of the players, and their motivation to achieve.Therefore, a cautious approach should be adopted whencomparing achievements of different samples of players. Thefollowing 2 examples provide support for this observation.
First, the anaerobic power values in our study as measuredby the WAnT were similar, although somewhat lower, thanthose found in the literature. For example, absolute and relativepeak power values of Division I female basketball players were663.46 6 93.79 W and 9.50 6 1.42 W�kg21, respectively (15).In our sample, the values for the over-18 age group were650.39 6 74.43 W and 9.72 6 0.65 W�kg21, respectively. Asexpected, somewhat lower values were found in the 14–18 agegroup: 607.36 6 103.11 W and 8.95 6 0.77 W�kg21, forabsolute and relative peak power, respectively. In addition, thevalues found in this study were higher than the 90th percentileof physically active college-aged female athletes (12).
Second, the vertical jump values found in our study(between 28 and 30 cm) were lower than those reported inthe literature. For example, in a study of 29 adolescentvolleyball players between the ages 12–17 years, mean valuesof 35.5 6 6.2 cm were found (18). In another study (22),values of 43.6 6 5.6, 35.6 6 5.9, and 37.8 6 7.1 cm were foundin high-school varsity players, junior varsity players, andfreshman players in volleyball, respectively. The low valuesfound in our study cannot be readily explained, especiallybecause other power values, such as those recorded duringthe WAnT, were similar to those found in other studies, andwere above the 90th percentile for female athletes betweenthe ages of 18–28 years.
PRACTICAL APPLICATIONS
In our study of Greek female volleyball players, theintraindividual variability in physical characteristics andphysiological attributes measurements was found to berelatively large. Volleyball coaches and strength andconditioning coaches should examine the intraindividualvariability of their players and use this information whenplanning training and conditioning programs. In addition,this variability emphasizes the importance of specificity intraining and of matching a training program to theprofessional needs of each individual player. It is recom-mended that physical and physiological testing be carriedout throughout the season to assess the strengths andweaknesses of each player. The results of this periodicaltesting can then be used by strength and conditioningcoaches to assess whether the conditioning programs foreach player are effective, or whether they need to beadjusted.
ACKNOWLEDGMENTS
The authors would like to thank Dinah Olswang for hereditorial assistance during the preparation of this manuscript.No sources of funding were used to assist in the preparation ofthis review. The authors have no conflicts of interest that aredirectly relevant to the content of this review.
REFERENCES
1. Alfredson, H, Pietila, T, and Lorentzon, R. Concentric andeccentric shoulder and elbow muscle strength in femalevolleyball players and non-active females. Scand J Med SciSports 8: 265–270, 1998.
2. Amasay, T. Static block jump techniques in volleyball: Uprightversus squat starting positions. J Strength Cond Res 22: 1242–1248,2008.
3. Aragon-Vargas, LF. Evaluation of four vertical jump tests: Meth-odology, reliability, validity, and accuracy. Meas Phys Educ Exerc Sci4: 215–228, 2000.
4. Astrand, PO, Rodahl, K, Dahl, HA, and Stromme, SB. Textbook ofWork Physiology: Physiological Bases of Exercise. Champaign, IL:Human Kinetics, 2003.
5. Ball, KA, Best, RJ, and Wrigley, TV. Inter- and intra-individualanalysis in elite sport: Pistol shooting. J Appl Biomech 19: 28–38,2003.
2556 Journal of Strength and Conditioning Researchthe TM
Attributes of Female Volleyball Players
Copyright © National Strength and Conditioning Association Unauthorized reproduction of this article is prohibited.

6. Bompa, TO. Periodization: Theory and Methodology of Training.Champaign, IL: Human Kinetics, 1999.
7. Borg, G and Dahlstrom, H. The reliability and validity of a physicalwork test. Acta Physiol Scand 55: 353–361, 1962.
8. Essendrop, M, Schibye, B, and Hansen, K. Reliability of isometricmuscle strength tests for the trunk, hands and shoulders. Int J IndErgon 28: 379–387, 2001.
9. Gabbe, BJ, Bennell, KL, Wajswelner, H, and Finch, CF. Reliability ofcommon lower extremity musculoskeletal screening tests. Phys TherSport 5: 90–97, 2004.
10. Heath, BH and Carter, JEL. A modified somatotype method. Am JPhys Anthropol 27: 57–74, 1967.
11. Heller, J. Laboratory Manual for Human and Exercise Physiology.Prague, Czech Republic: The Karolinum Press, 2005.
12. Hoffman, J. Norms for Fitness, Performance, and Health. Champaign,IL: Human Kinetics, 2006.
13. Inbar, O, Bar-Or, O, and Skinner, J. The Wingate Anaerobic Test.Champaign, IL: Human Kinetics, 1996.
14. Jinzhou, Y, Yibing, F, Ruipeng, Z, Xi, L, and Gongbing, S. Thereliability and sensitivity of indices related to cardiovascular fitnessevaluation. Kinesiology 40: 138–145, 2008.
15. LaMonte, MJ, McKinney, JT, Quinn, SM, Bainbridge, CN, andEisenman, PA. Comparison of physical and physiological variablesfor female college basketball players. J Strength Cond Res 13:264–270, 1999.
16. Lidor, R and Ziv, G. Physical and physiological attributes offemale volleyball players—A review. J Strength Cond Res 24:1963–1973,2010.
17. Maud, PJ, Foster, C, and deKoning, JJ. Testing for anaerobic ability.In: Physiological Assessment of Human Fitness. P.J. Maud and C. Foster,eds. Champaign, IL: 2006. pp. 78–79.
18. Melrose, DR, Spaniol, FJ, Bohling, ME, and Bonnette, RA.Physiological and performance characteristics of adolescent clubvolleyball players. J Strength Cond Res 21: 481–486, 2007.
19. Morrow, JR, Jackson, AW, Disch, JG, and Mood, DP. Masurementand Evaluation in Human Performance. Champaign, IL: HumanKinetics, 2010.
20. Parizkova, J. Lean body mass and depot fat during autogenesis inhumans. In: Nutrition, Physical Fitness and Health: International Serieson Sport Sciences. J. Parizkova and V. Rogozkin, eds. Baltimore, MD:University Park Press, 1978. pp. 22.
21. Skinner, JS. Exercise Testing and Exercise Prescription for Special Cases:Theoretical Basis and Clinical Application. Baltimore, MD: LippincottWilliams & Wilkins, 2005.
22. Thissen-Milder, M and Mayhew, JL. Selection and classification ofhigh school volleyball players from performance tests. J Sports MedPhys Fitness 31: 380–384, 1991.
23. Zatsiorsky, VM. Science and Practice of Strength Training. Champaign,IL: Human Kinetics, 1995.
24. Ziv, G and Lidor, R. Physical attributes, physiological characteristics,on-court performances and nutritional strategies of female and malebasketball players. Sports Med 39: 547–568, 2009.
25. Ziv, G and Lidor, R. Vertical jump in female and male volleyballplayers: A review of observational and experimental studies. Scand JMed Sci Sports 20: 556–567, 2010.
VOLUME 26 | NUMBER 9 | SEPTEMBER 2012 | 2557
Journal of Strength and Conditioning Researchthe TM
| www.nsca.com
Copyright © National Strength and Conditioning Association Unauthorized reproduction of this article is prohibited.