Physical activity practice and associated factors in adolescents in Northeastern Brazil
10
Rev Saúde Pública 2012;46(3) Original Articles José Cazuza de Farias Júnior I Adair da Silva Lopes II Jorge Mota III Pedro Curi Hallal IV I Departamento de Educação Física. Centro de Ciências da Saúde. Universidade Federal da Paraíba. João Pessoa, PB, Brasil II Centro de Desportos. Universidade Federal de Santa Catarina. Florianópolis, SC, Brasil III Faculdade de Desporto. Universidade do Porto. Porto, Portugal IV Escola Superior de Educação Física. Universidade Federal de Pelotas. Pelotas, RS, Brasil Correspondence: José Cazuza de Farias Júnior Universidade Federal da Paraíba Departamento de Educação Física Campus I, Cidade Universitária 58059-900 João Pessoa, PB, Brasil E-mail: [email protected] Received: 6/17/2010 Approved: 10/9/2011 Article available from: www.scielo.br/rsp Physical activity practice and associated factors in adolescents in Northeastern Brazil ABSTRACT OBJECTIVE: To estimate the proportion of physically active adolescents and identify associated factors. METHODS: The sample was composed of 2,874 high school students (public and private schools) aged 14 to 19 years in the city of João Pessoa, Northeastern Brazil. Physical activity level was measured by means of a questionnaire and considered physically active if ≥ 300 minutes/week. Sociodemographic variables were analyzed, as well as nutritional status, sedentary behavior, self-report of health status and participation in physical education classes. The prevalence ratio was used as association measure, estimated by means of Poisson regression. RESULTS: The prevalence of physical activity was 50.2% (95%CI: 47.3;53.1). Male adolescents were more physically active than female adolescents (66.3% vs. 38.5%; p<0.001). The factors directly associated with practice of physical activity were: father’s higher level of schooling for the male sex and mother’s higher level of schooling for the female sex, positive self-reported health status, and participation in physical education classes. CONCLUSIONS: The majority of the adolescents was classified as physically active, particularly the male youths. Adolescents with parents whose level of schooling was higher, with positive health status perception, and who participated in physical education classes were more likely to be physically active. DESCRIPTORS: Adolescent. Motor Activity. Physical Education and Training. Sedentary Lifestyle. Health Behavior. Socioeconomic Factors. INTRODUCTION Physical inactivity is considered one of the most important public health prob- lems of the 21 st century. 3 Besides being an important component for a healthy lifestyle and for health promotion, physical activity plays a role in the preven- tion of chronic non-communicable diseases. 25 Adolescence is a critical period in relation to physical activity. The proportion of physically inactive adolescents is high, 16 even though this is considered the most physically active population group. The health risks associated with low levels of physical activity in adolescents are well known, as well as the benefits deriving from this practice, when it is performed in a sufficient and regular way. 11,20 The individual’s physical activity
-
Upload
independent -
Category
Documents
-
view
2 -
download
0
Transcript of Physical activity practice and associated factors in adolescents in Northeastern Brazil
Rev Saúde Pública 2012;46(3) Original Articles
José Cazuza de Farias JúniorI
Adair da Silva LopesII
Jorge MotaIII
Pedro Curi HallalIV
I Departamento de Educação Física. Centro de Ciências da Saúde. Universidade Federal da Paraíba. João Pessoa, PB, Brasil
II Centro de Desportos. Universidade Federal de Santa Catarina. Florianópolis, SC, Brasil
III Faculdade de Desporto. Universidade do Porto. Porto, Portugal
IV Escola Superior de Educação Física. Universidade Federal de Pelotas. Pelotas, RS, Brasil
Correspondence:José Cazuza de Farias JúniorUniversidade Federal da ParaíbaDepartamento de Educação FísicaCampus I, Cidade Universitária58059-900 João Pessoa, PB, BrasilE-mail: [email protected]
Received: 6/17/2010Approved: 10/9/2011
Article available from: www.scielo.br/rsp
Physical activity practice and associated factors in adolescents in Northeastern Brazil
ABSTRACT
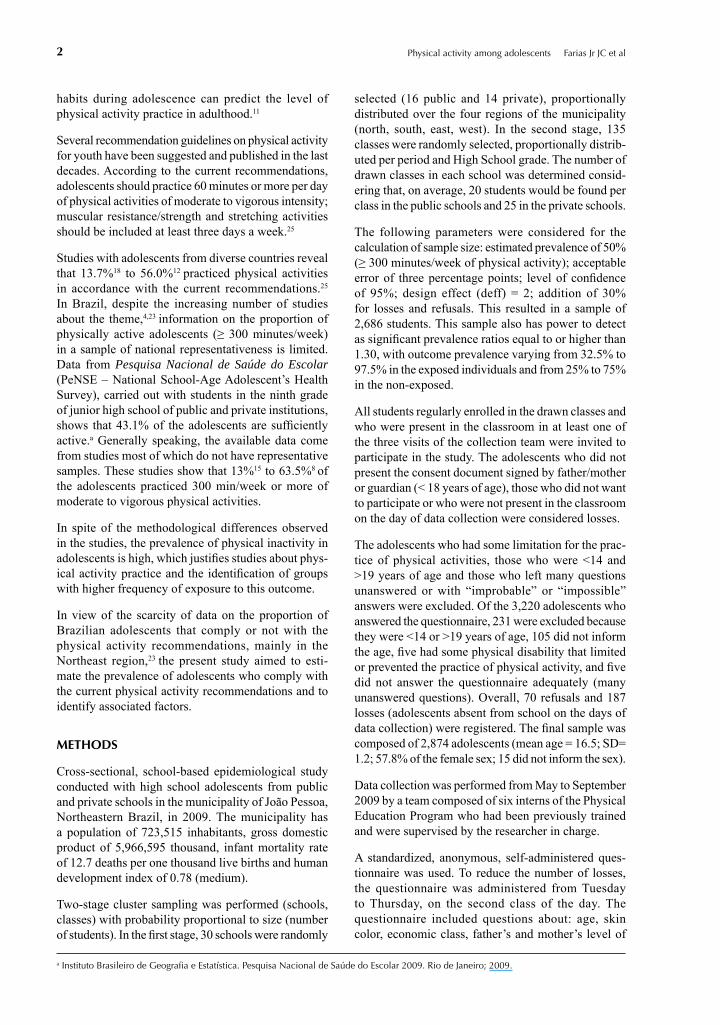
OBJECTIVE: To estimate the proportion of physically active adolescents and identify associated factors.
METHODS: The sample was composed of 2,874 high school students (public and private schools) aged 14 to 19 years in the city of João Pessoa, Northeastern Brazil. Physical activity level was measured by means of a questionnaire and considered physically active if ≥ 300 minutes/week. Sociodemographic variables were analyzed, as well as nutritional status, sedentary behavior, self-report of health status and participation in physical education classes. The prevalence ratio was used as association measure, estimated by means of Poisson regression.
RESULTS: The prevalence of physical activity was 50.2% (95%CI: 47.3;53.1). Male adolescents were more physically active than female adolescents (66.3% vs. 38.5%; p<0.001). The factors directly associated with practice of physical activity were: father’s higher level of schooling for the male sex and mother’s higher level of schooling for the female sex, positive self-reported health status, and participation in physical education classes.
CONCLUSIONS: The majority of the adolescents was classifi ed as physically active, particularly the male youths. Adolescents with parents whose level of schooling was higher, with positive health status perception, and who participated in physical education classes were more likely to be physically active.
DESCRIPTORS: Adolescent. Motor Activity. Physical Education and Training. Sedentary Lifestyle. Health Behavior. Socioeconomic Factors.
INTRODUCTION
Physical inactivity is considered one of the most important public health prob-lems of the 21st century.3 Besides being an important component for a healthy lifestyle and for health promotion, physical activity plays a role in the preven-tion of chronic non-communicable diseases.25
Adolescence is a critical period in relation to physical activity. The proportion of physically inactive adolescents is high,16 even though this is considered the most physically active population group.
The health risks associated with low levels of physical activity in adolescents are well known, as well as the benefi ts deriving from this practice, when it is performed in a suffi cient and regular way.11,20 The individual’s physical activity
2 Physical activity among adolescents Farias Jr JC et al
habits during adolescence can predict the level of physical activity practice in adulthood.11
Several recommendation guidelines on physical activity for youth have been suggested and published in the last decades. According to the current recommendations, adolescents should practice 60 minutes or more per day of physical activities of moderate to vigorous intensity; muscular resistance/strength and stretching activities should be included at least three days a week.25
Studies with adolescents from diverse countries reveal that 13.7%18 to 56.0%12 practiced physical activities in accordance with the current recommendations.25
In Brazil, despite the increasing number of studies about the theme,4,23 information on the proportion of physically active adolescents (≥ 300 minutes/week) in a sample of national representativeness is limited. Data from Pesquisa Nacional de Saúde do Escolar (PeNSE – National School-Age Adolescent’s Health Survey), carried out with students in the ninth grade of junior high school of public and private institutions, shows that 43.1% of the adolescents are suffi ciently active.a Generally speaking, the available data come from studies most of which do not have representative samples. These studies show that 13%15 to 63.5%8 of the adolescents practiced 300 min/week or more of moderate to vigorous physical activities.
In spite of the methodological differences observed in the studies, the prevalence of physical inactivity in adolescents is high, which justifi es studies about phys-ical activity practice and the identifi cation of groups with higher frequency of exposure to this outcome.
In view of the scarcity of data on the proportion of Brazilian adolescents that comply or not with the physical activity recommendations, mainly in the Northeast region,23 the present study aimed to esti-mate the prevalence of adolescents who comply with the current physical activity recommendations and to identify associated factors.
METHODS
Cross-sectional, school-based epidemiological study conducted with high school adolescents from public and private schools in the municipality of João Pessoa, Northeastern Brazil, in 2009. The municipality has a population of 723,515 inhabitants, gross domestic product of 5,966,595 thousand, infant mortality rate of 12.7 deaths per one thousand live births and human development index of 0.78 (medium).
Two-stage cluster sampling was performed (schools, classes) with probability proportional to size (number of students). In the fi rst stage, 30 schools were randomly
a Instituto Brasileiro de Geografi a e Estatística. Pesquisa Nacional de Saúde do Escolar 2009. Rio de Janeiro; 2009.
selected (16 public and 14 private), proportionally distributed over the four regions of the municipality (north, south, east, west). In the second stage, 135 classes were randomly selected, proportionally distrib-uted per period and High School grade. The number of drawn classes in each school was determined consid-ering that, on average, 20 students would be found per class in the public schools and 25 in the private schools.
The following parameters were considered for the calculation of sample size: estimated prevalence of 50% (≥ 300 minutes/week of physical activity); acceptable error of three percentage points; level of confi dence of 95%; design effect (deff) = 2; addition of 30% for losses and refusals. This resulted in a sample of 2,686 students. This sample also has power to detect as signifi cant prevalence ratios equal to or higher than 1.30, with outcome prevalence varying from 32.5% to 97.5% in the exposed individuals and from 25% to 75% in the non-exposed.
All students regularly enrolled in the drawn classes and who were present in the classroom in at least one of the three visits of the collection team were invited to participate in the study. The adolescents who did not present the consent document signed by father/mother or guardian (< 18 years of age), those who did not want to participate or who were not present in the classroom on the day of data collection were considered losses.
The adolescents who had some limitation for the prac-tice of physical activities, those who were <14 and >19 years of age and those who left many questions unanswered or with “improbable” or “impossible” answers were excluded. Of the 3,220 adolescents who answered the questionnaire, 231 were excluded because they were <14 or >19 years of age, 105 did not inform the age, fi ve had some physical disability that limited or prevented the practice of physical activity, and fi ve did not answer the questionnaire adequately (many unanswered questions). Overall, 70 refusals and 187 losses (adolescents absent from school on the days of data collection) were registered. The fi nal sample was composed of 2,874 adolescents (mean age = 16.5; SD= 1.2; 57.8% of the female sex; 15 did not inform the sex).
Data collection was performed from May to September 2009 by a team composed of six interns of the Physical Education Program who had been previously trained and were supervised by the researcher in charge.
A standardized, anonymous, self-administered ques-tionnaire was used. To reduce the number of losses, the questionnaire was administered from Tuesday to Thursday, on the second class of the day. The questionnaire included questions about: age, skin color, economic class, father’s and mother’s level of
3Rev Saúde Pública 2012;46(3)
schooling, sedentary behavior, adolescent’s nutritional status, occupational situation, health perception, and participation in physical education classes.
Skin color was determined by the adolescent, according to the categories proposed by the Instituto Brasileiro de Geografi a e Estatística (IBGE – Brazilian Institute of Geography and Statistics): mixed-ethnicity (black and white), black, white, yellow, Indian. For the analysis, they were grouped into white and non-white. The adolescents’ economic class was established according to the methodology of the Associação Brasileira de Empresas de Pesquisa (ABEP – Brazilian Association of Research Companies):b A1 (highest level), B, C, D and E (lowest level).
The father’s and mother’s level of schooling was investigated through the question “Up to which school grade did your father/mother study?” The adolescent’s occupational situation was verifi ed through the ques-tion: “Do you work?”
Sedentary behaviors were measured through pre-coded questions about TV time and time of use of computer + videogame, separately for weekdays and weekend days.
The adolescents’ nutritional status was evaluated by means of the body mass index (BMI = weight [kg] height [m2]), based on self-reported measures. Overweight was defi ned based on the criteria of Cole et al.5
Health perception was measured by means of the ques-tion “How do you rate your health status?”, and the answers were grouped into “negative health perception (poor, regular) and “positive health perception” (good, very good, excellent).
The adolescents also informed about their participation in physical education classes during a typical week.
Physical activity was measured by another question-naire. The instrument was previously adapted to the characteristics of the study’s target population and tested in a sample that did not participate in the main study (reproducibility = 0.88; 95%CI: 0.84;0.91; validity: Spearman’s rho= 0.62; p<0.001; kappa= 0.59).
The adolescents informed the frequency of practice (days/week) and the duration (hours, min/day) of the physical activities performed in the previous week based on a list of 24 activities. They could add two more activities to this list.
The dependent variable was physical activity level, which was determined based on the sum of the product of the time spent in these activities and their respec-tive frequencies of practice. The adolescents who
reported physical activity practice ≥ 300 min/week were considered “physically active”, and the others, “physically inactive”.6
The Wald test for heterogenity or linear trend was used to compare the prevalence of physical activity by categories of the independent variables. Prevalence rate (PR) was used as a measure of association, and estimated Poisson regression and the Wald test were employed to evaluate statistical signifi cance in the adjusted analysis.
The adjusted analysis followed a fi ve-level hierarchical model. In the fi rst (1), the demographic variables were introduced (age, skin color); in (2), the socioeconomic variables (economic class, father’s and mother’s level of schooling, occupational situation); (3) sedentary behaviors; (4) nutritional status; and (5) health percep-tion and participation in physical education classes. All the variables were analyzed in the adjusted model, and those with p < 0.20 remained in the model. Variables with p ≤ 0.05 were considered factors associated with physical activity.
The data were entered in duplicate into the program EpiData 3.1, with automatic check on consistency and breadth of values and utilization of the program’s tool “validate double entry”.
The statistical analyses were performed in Stata 10.1, taking into account the cluster sampling strategy (“svy”). The calculation for determination of deff (design effect) size was performed a posteriori. A deff equal to 1.90 was observed, a value that was lower than the one adopted in the determination of minimum sample size. The level of signifi cance that was adopted was 5% for two-tailed tests.
The study was approved by the Ethics Committee for Research involving Human Beings of Universidade Federal da Paraíba (Protocol no. 0062/2009). All the adolescents younger than 18 years who participated in the study had been authorized by parents or guardians.
RESULTS
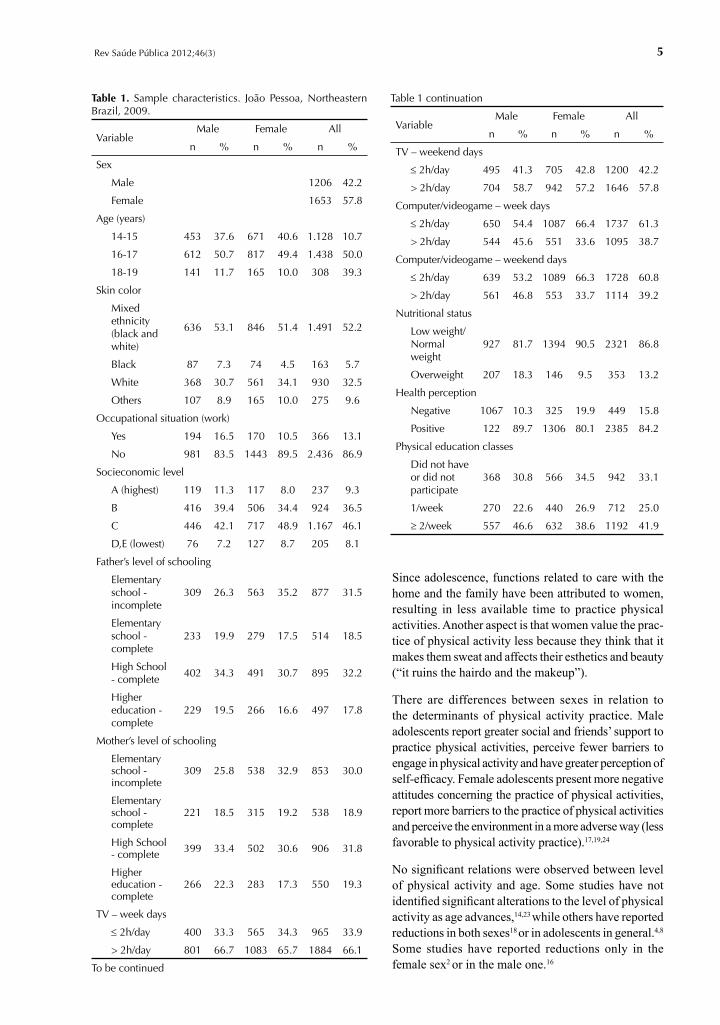
Most of the adolescents were aged 16 to 19 years (89.3%), did not work (86.9%), belonged to interme-diate (46.1%) or low (8.1%) economic levels and their parents completed at least High School (father: 50.1%, mother: 51.1%) (Table 1).
The prevalence of overweight was 13.2%; a little more than 50% of the adolescents spent >2h/day watching TV and approximately 40% spent >2h/day in the computer/videogame; 84.2% self-rated their health status in a
b Associação Brasileira de Empresas de Pesquisa. Critério de Classifi cação Econômica Brasil. São Paulo; 2009 [cited 2009 Nov 26]. Available from: http://www.abep.org/novo/Content.aspx?SectionID=84
4 Physical activity among adolescents Farias Jr JC et al
positive way and 66.9% said that did not participate in physical education classes (Table 1).
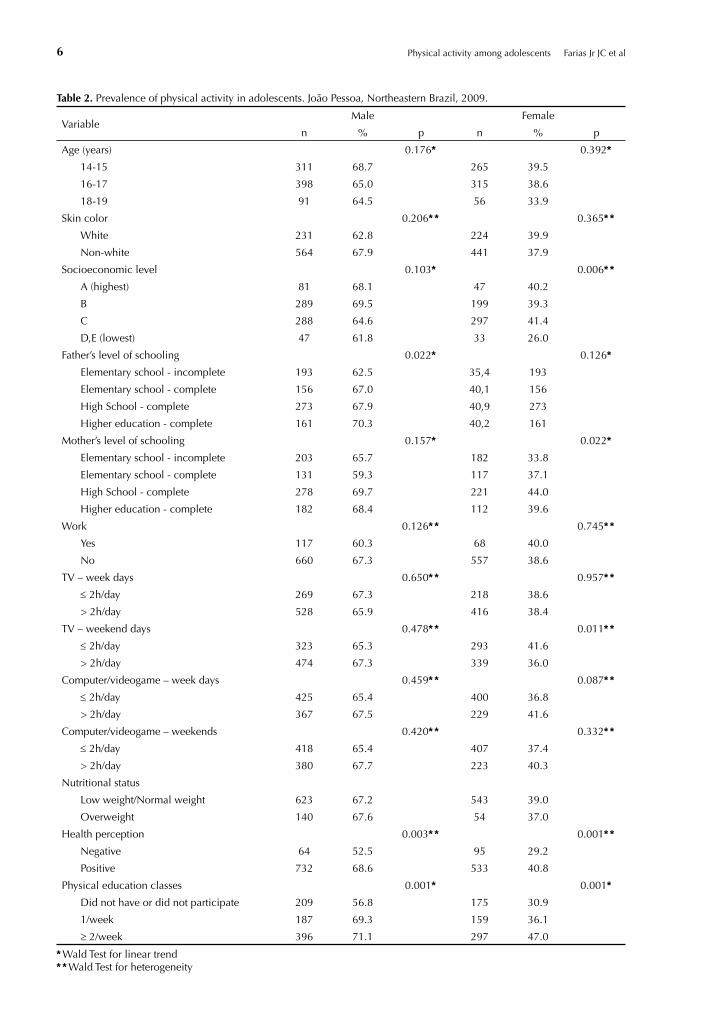
A little more than half of the adolescents (50.2% [95%CI 47.3;53.1]) were classifi ed as physically active, twice as high in the male sex compared to the female sex (66.3% vs. 38.5%, p<0.001).
The prevalence of physical activity was higher in students whose parents had higher level of schooling (the father, in the case of the male sex, and the mother, in the female sex); in middle-class female students and in female students who spent up to 2h/day watching TV on a weekend day; and in students who reported posi-tive health perception and who participated in physical education classes.
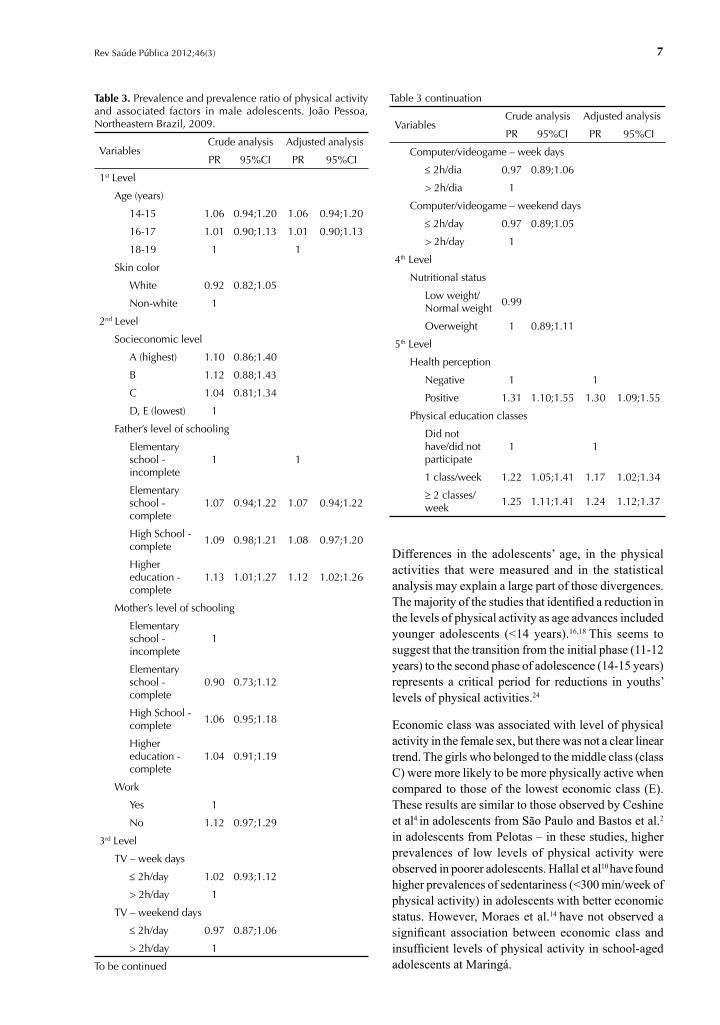
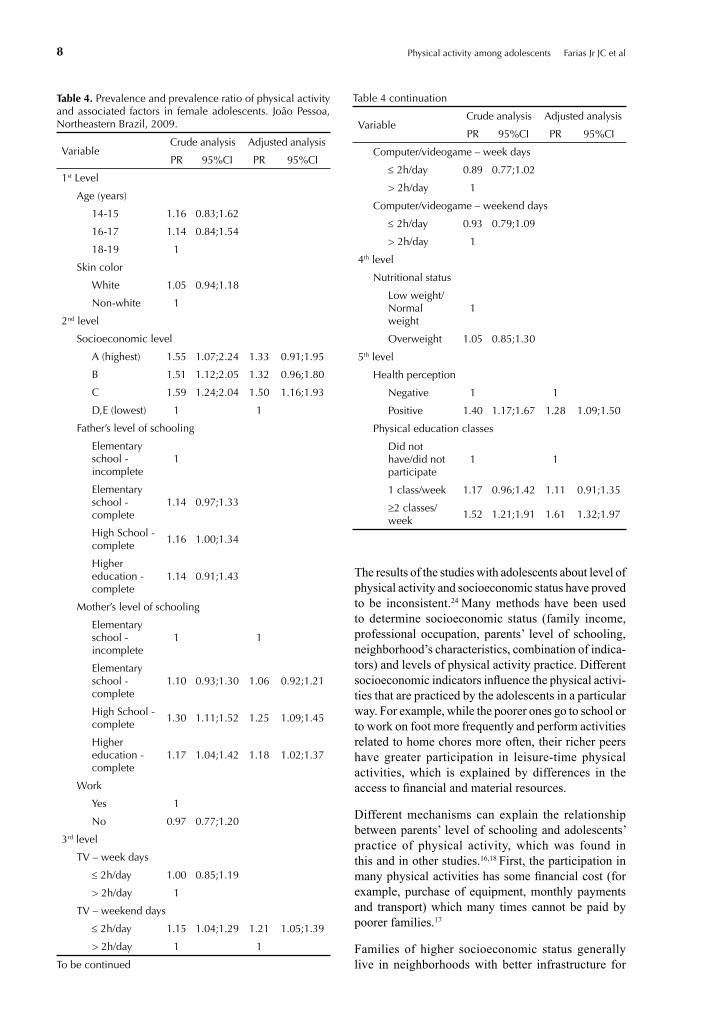
In the crude analysis, the variables associated with physical activity practice in the male sex were: father’s level of schooling, health status perception and partici-pation in physical education classes (Table 3). To the female sex (Table 4), the variables were the following: economic class, mother’s level of schooling, time spent watching TV on a weekend day, health status perception and participation in physical education classes.
In the adjusted analysis, all the variables remained associated with the physical activity levels (Tables 3 and 4). The youths who achieved the physical activity recommendations were those whose parents had higher level of schooling (the father for the male youths and the mother for the female youths), middle-class youths and those who watched TV up to 2h/day on a weekend day (female sex), those who perceived their health status in a positive way and those who participated in one or more physical education classes.
DISCUSSION
The majority of the adolescents was classified as physically active (50.2%). However, the percentage of youths who did not practice physical activities in accordance with the recommendations of 300 minutes per week was high, mainly in the female sex and among adolescents who belonged to families of lower socioeconomic level. The adolescents who reported a positive perception of their health status and who participated in physical education classes were more likely to be physically active.
The prevalence of physical activity found in this study was higher than that reported in adolescents from Australia (13.7%),18 the United States (34.7%)7 and Spain (48.8%),16 similar to that of Finnish youths (50.5%)21 and lower than that of adolescents from China (56%).12 In Brazil, the proportion of adolescents who practice physical activities according to the current recommendations are: Curitiba (southern) 14.5%;15 Pelotas (southern) 30.2%;2 Pernambuco (northeastern)
34.9%;23 São Paulo (southeastern) 37.5%;4 Maringá (southern) 43.1%;14 Santa Catarina (southern) 63,5%.8
The higher prevalence of physical activity observed in the adolescents from João Pessoa may be due to the instrument used to measure physical activity in different contexts (leisure, school, travelling); sample characteristics (adolescents from public and private schools) and possibly to the characteristics of the city, which favor the practice of physical activity (weather, level of urbanization, infrastructure, traffi c).
The elevated proportion of youths who do not practice moderate to vigorous physical activities or who prac-tice them below the recommendation has led to the consideration that the promotion of physical activity in adolescence is a priority in public health, and this goal has been included in the health agendas. Physical inactivity is among the four main risk factors for global mortality, being surpassed by high blood pressure, smoking and high blood glucose.25
As previously described in other studies, both national2,4,8,23 and international,7,16 the present study also identifi ed higher levels of physical activity in males compared to females. This association does not depend on the instrument that measures physical activity (objective vs. subjective measures), on the socioeco-nomic condition, on the cut-off point adopted to classify physical activity, nor on the adolescents’ age.24
Higher levels of physical activity in males may be explained by biological differences, sociocultural ones, body perception differences and gender attributes. Since childhood, social roles are attributed according to gender and these roles infl uence the choices concerning practice of physical activity. Already in early ages, for cultural reasons, girls are instructed to engage in light activities, justifi ed by the body’s frailty, delicacy, grace, cooperation and tenderness. In turn, boys are stimulated to participate in vigorous physical activities, justifi ed by the perception that they have strong bodies and by the image of greater virility, courage and ability.
An ethnographic study carried out with adolescents has shown that boys are raised with greater freedom than girls.9 It was also perceived that the mothers were more concerned about their daughters being restricted to the spaces of the house or neighborhood, and considered the street a male space. Being raised under these norms, the girls would be in disadvantage in relation to the boys in terms of opportunities to practice physical activity. This study also showed that, unlike the boys, the girls mentioned that they had started distinct physical activi-ties. However, they were the ones who remained less time in those activities.9 The most reported reasons for the abandonment were: less time to study and the need to help in the domestic chores.9
5Rev Saúde Pública 2012;46(3)
Since adolescence, functions related to care with the home and the family have been attributed to women, resulting in less available time to practice physical activities. Another aspect is that women value the prac-tice of physical activity less because they think that it makes them sweat and affects their esthetics and beauty (“it ruins the hairdo and the makeup”).
There are differences between sexes in relation to the determinants of physical activity practice. Male adolescents report greater social and friends’ support to practice physical activities, perceive fewer barriers to engage in physical activity and have greater perception of self-effi cacy. Female adolescents present more negative attitudes concerning the practice of physical activities, report more barriers to the practice of physical activities and perceive the environment in a more adverse way (less favorable to physical activity practice).17,19,24
No signifi cant relations were observed between level of physical activity and age. Some studies have not identifi ed signifi cant alterations to the level of physical activity as age advances,14,23 while others have reported reductions in both sexes18 or in adolescents in general.4,8
Some studies have reported reductions only in the female sex2 or in the male one.16
Table 1. Sample characteristics. João Pessoa, Northeastern Brazil, 2009.
VariableMale Female All
n % n % n %
Sex
Male 1206 42.2
Female 1653 57.8
Age (years)
14-15 453 37.6 671 40.6 1.128 10.7
16-17 612 50.7 817 49.4 1.438 50.0
18-19 141 11.7 165 10.0 308 39.3
Skin color
Mixed ethnicity (black and white)
636 53.1 846 51.4 1.491 52.2
Black 87 7.3 74 4.5 163 5.7
White 368 30.7 561 34.1 930 32.5
Others 107 8.9 165 10.0 275 9.6
Occupational situation (work)
Yes 194 16.5 170 10.5 366 13.1
No 981 83.5 1443 89.5 2.436 86.9
Socieconomic level
A (highest) 119 11.3 117 8.0 237 9.3
B 416 39.4 506 34.4 924 36.5
C 446 42.1 717 48.9 1.167 46.1
D,E (lowest) 76 7.2 127 8.7 205 8.1
Father’s level of schooling
Elementary school - incomplete
309 26.3 563 35.2 877 31.5
Elementary school - complete
233 19.9 279 17.5 514 18.5
High School - complete
402 34.3 491 30.7 895 32.2
Higher education - complete
229 19.5 266 16.6 497 17.8
Mother’s level of schooling
Elementary school - incomplete
309 25.8 538 32.9 853 30.0
Elementary school - complete
221 18.5 315 19.2 538 18.9
High School - complete 399 33.4 502 30.6 906 31.8
Higher education - complete
266 22.3 283 17.3 550 19.3
TV – week days
2h/day 400 33.3 565 34.3 965 33.9
> 2h/day 801 66.7 1083 65.7 1884 66.1
To be continued
Table 1 continuation
VariableMale Female All
n % n % n %
TV – weekend days
2h/day 495 41.3 705 42.8 1200 42.2
> 2h/day 704 58.7 942 57.2 1646 57.8
Computer/videogame – week days
2h/day 650 54.4 1087 66.4 1737 61.3
> 2h/day 544 45.6 551 33.6 1095 38.7
Computer/videogame – weekend days
2h/day 639 53.2 1089 66.3 1728 60.8
> 2h/day 561 46.8 553 33.7 1114 39.2
Nutritional status
Low weight/Normal weight
927 81.7 1394 90.5 2321 86.8
Overweight 207 18.3 146 9.5 353 13.2
Health perception
Negative 1067 10.3 325 19.9 449 15.8
Positive 122 89.7 1306 80.1 2385 84.2
Physical education classes
Did not have or did not participate
368 30.8 566 34.5 942 33.1
1/week 270 22.6 440 26.9 712 25.0
2/week 557 46.6 632 38.6 1192 41.9
6 Physical activity among adolescents Farias Jr JC et al
Table 2. Prevalence of physical activity in adolescents. João Pessoa, Northeastern Brazil, 2009.
VariableMale Female
n % p n % p
Age (years) 0.176* 0.392*14-15 311 68.7 265 39.5
16-17 398 65.0 315 38.6
18-19 91 64.5 56 33.9
Skin color 0.206** 0.365**White 231 62.8 224 39.9
Non-white 564 67.9 441 37.9
Socioeconomic level 0.103* 0.006**A (highest) 81 68.1 47 40.2
B 289 69.5 199 39.3
C 288 64.6 297 41.4
D,E (lowest) 47 61.8 33 26.0
Father’s level of schooling 0.022* 0.126*Elementary school - incomplete 193 62.5 35,4 193
Elementary school - complete 156 67.0 40,1 156
High School - complete 273 67.9 40,9 273
Higher education - complete 161 70.3 40,2 161
Mother’s level of schooling 0.157* 0.022*Elementary school - incomplete 203 65.7 182 33.8
Elementary school - complete 131 59.3 117 37.1
High School - complete 278 69.7 221 44.0
Higher education - complete 182 68.4 112 39.6
Work 0.126** 0.745**Yes 117 60.3 68 40.0
No 660 67.3 557 38.6
TV – week days 0.650** 0.957** 2h/day 269 67.3 218 38.6
> 2h/day 528 65.9 416 38.4
TV – weekend days 0.478** 0.011** 2h/day 323 65.3 293 41.6
> 2h/day 474 67.3 339 36.0
Computer/videogame – week days 0.459** 0.087** 2h/day 425 65.4 400 36.8
> 2h/day 367 67.5 229 41.6
Computer/videogame – weekends 0.420** 0.332** 2h/day 418 65.4 407 37.4
> 2h/day 380 67.7 223 40.3
Nutritional status
Low weight/Normal weight 623 67.2 543 39.0
Overweight 140 67.6 54 37.0
Health perception 0.003** 0.001**Negative 64 52.5 95 29.2
Positive 732 68.6 533 40.8
Physical education classes 0.001* 0.001*Did not have or did not participate 209 56.8 175 30.9
1/week 187 69.3 159 36.1
2/week 396 71.1 297 47.0
*Wald Test for linear trend**Wald Test for heterogeneity
7Rev Saúde Pública 2012;46(3)
Differences in the adolescents’ age, in the physical activities that were measured and in the statistical analysis may explain a large part of those divergences. The majority of the studies that identifi ed a reduction in the levels of physical activity as age advances included younger adolescents (<14 years).16,18 This seems to suggest that the transition from the initial phase (11-12 years) to the second phase of adolescence (14-15 years) represents a critical period for reductions in youths’ levels of physical activities.24
Economic class was associated with level of physical activity in the female sex, but there was not a clear linear trend. The girls who belonged to the middle class (class C) were more likely to be more physically active when compared to those of the lowest economic class (E). These results are similar to those observed by Ceshine et al4 in adolescents from São Paulo and Bastos et al.2
in adolescents from Pelotas – in these studies, higher prevalences of low levels of physical activity were observed in poorer adolescents. Hallal et al10 have found higher prevalences of sedentariness (<300 min/week of physical activity) in adolescents with better economic status. However, Moraes et al.14 have not observed a signifi cant association between economic class and insuffi cient levels of physical activity in school-aged adolescents at Maringá.
Table 3. Prevalence and prevalence ratio of physical activity and associated factors in male adolescents. João Pessoa, Northeastern Brazil, 2009.
VariablesCrude analysis Adjusted analysis
PR 95%CI PR 95%CI
1st Level
Age (years)
14-15 1.06 0.94;1.20 1.06 0.94;1.20
16-17 1.01 0.90;1.13 1.01 0.90;1.13
18-19 1 1
Skin color
White 0.92 0.82;1.05
Non-white 1
2nd Level
Socieconomic level
A (highest) 1.10 0.86;1.40
B 1.12 0.88;1.43
C 1.04 0.81;1.34
D, E (lowest) 1
Father’s level of schooling
Elementary school - incomplete
1 1
Elementary school - complete
1.07 0.94;1.22 1.07 0.94;1.22
High School - complete
1.09 0.98;1.21 1.08 0.97;1.20
Higher education - complete
1.13 1.01;1.27 1.12 1.02;1.26
Mother’s level of schooling
Elementary school - incomplete
1
Elementary school - complete
0.90 0.73;1.12
High School - complete
1.06 0.95;1.18
Higher education - complete
1.04 0.91;1.19
Work
Yes 1
No 1.12 0.97;1.29
3rd Level
TV – week days
2h/day 1.02 0.93;1.12
> 2h/day 1
TV – weekend days
2h/day 0.97 0.87;1.06
> 2h/day 1
To be continued
Table 3 continuation
VariablesCrude analysis Adjusted analysis
PR 95%CI PR 95%CI
Computer/videogame – week days
2h/dia 0.97 0.89;1.06
> 2h/dia 1
Computer/videogame – weekend days
2h/day 0.97 0.89;1.05
> 2h/day 1
4th Level
Nutritional status
Low weight/Normal weight
0.99
Overweight 1 0.89;1.11
5th Level
Health perception
Negative 1 1
Positive 1.31 1.10;1.55 1.30 1.09;1.55
Physical education classes
Did not have/did not participate
1 1
1 class/week 1.22 1.05;1.41 1.17 1.02;1.34
2 classes/week
1.25 1.11;1.41 1.24 1.12;1.37
8 Physical activity among adolescents Farias Jr JC et al
Table 4. Prevalence and prevalence ratio of physical activity and associated factors in female adolescents. João Pessoa, Northeastern Brazil, 2009.
VariableCrude analysis Adjusted analysis
PR 95%CI PR 95%CI
1st Level
Age (years)
14-15 1.16 0.83;1.62
16-17 1.14 0.84;1.54
18-19 1
Skin color
White 1.05 0.94;1.18
Non-white 1
2nd level
Socioeconomic level
A (highest) 1.55 1.07;2.24 1.33 0.91;1.95
B 1.51 1.12;2.05 1.32 0.96;1.80
C 1.59 1.24;2.04 1.50 1.16;1.93
D,E (lowest) 1 1
Father’s level of schooling
Elementary school - incomplete
1
Elementary school - complete
1.14 0.97;1.33
High School - complete
1.16 1.00;1.34
Higher education - complete
1.14 0.91;1.43
Mother’s level of schooling
Elementary school - incomplete
1 1
Elementary school - complete
1.10 0.93;1.30 1.06 0.92;1.21
High School - complete
1.30 1.11;1.52 1.25 1.09;1.45
Higher education - complete
1.17 1.04;1.42 1.18 1.02;1.37
Work
Yes 1
No 0.97 0.77;1.20
3rd level
TV – week days
2h/day 1.00 0.85;1.19
> 2h/day 1
TV – weekend days
2h/day 1.15 1.04;1.29 1.21 1.05;1.39
> 2h/day 1 1
To be continued
Table 4 continuation
VariableCrude analysis Adjusted analysis
PR 95%CI PR 95%CI
Computer/videogame – week days
2h/day 0.89 0.77;1.02
> 2h/day 1
Computer/videogame – weekend days
2h/day 0.93 0.79;1.09
> 2h/day 1
4th level
Nutritional status
Low weight/Normal weight
1
Overweight 1.05 0.85;1.30
5th level
Health perception
Negative 1 1
Positive 1.40 1.17;1.67 1.28 1.09;1.50
Physical education classes
Did not have/did not participate
1 1
1 class/week 1.17 0.96;1.42 1.11 0.91;1.35
2 classes/week
1.52 1.21;1.91 1.61 1.32;1.97
The results of the studies with adolescents about level of physical activity and socioeconomic status have proved to be inconsistent.24 Many methods have been used to determine socioeconomic status (family income, professional occupation, parents’ level of schooling, neighborhood’s characteristics, combination of indica-tors) and levels of physical activity practice. Different socioeconomic indicators infl uence the physical activi-ties that are practiced by the adolescents in a particular way. For example, while the poorer ones go to school or to work on foot more frequently and perform activities related to home chores more often, their richer peers have greater participation in leisure-time physical activities, which is explained by differences in the access to fi nancial and material resources.
Different mechanisms can explain the relationship between parents’ level of schooling and adolescents’ practice of physical activity, which was found in this and in other studies.16,18 First, the participation in many physical activities has some fi nancial cost (for example, purchase of equipment, monthly payments and transport) which many times cannot be paid by poorer families.17
Families of higher socioeconomic status generally live in neighborhoods with better infrastructure for
9Rev Saúde Pública 2012;46(3)
the practice of physical activities (presence of parks, squares, running/walking paths, bike lanes). Besides, adults with higher level of schooling present higher levels of physical activity practice, particularly in leisure time.c This would have an indirect infl uence on the adolescents’ physical activity, as parents who are more physically active tend to have children who are equally active.19 Another plausible explanation to this association is that parents who are more physically active are more likely to give greater social support to their children’s practice of physical activity.19 Social support is one of the main predictors of the levels of physical activity practice in adolescents.24
There was an inverse and significant association between higher levels of physical activity and time spent watching TV on the weekend in the female youths, which confi rms previous fi ndings,4,21 but contra-dicts others.14,23 The meta-analysis23 of studies about the relation between physical activity and sedentary behaviors has revealed a negative, signifi cant, but of low magnitude relation in adolescents. The evidences that support the hypothesis that sedentary behaviors “substitute” the practice of moderate and vigorous physical activities are weak13 and inconsistent.24 This may be explained by the fact that sedentary behavior is a construct that is different from physical activity, with specifi c “determinants” and distinct implications for people’s health. In a continuum of physical activity, sedentary behavior is not the lower extreme (“zero”).
In this study, a positive relation was observed between health perception and level of physical activity. Physically active adolescents were more likely to perceive their health status in a positive way, a fi nding that was similar to that of another study.1 This result suggests a positive effect of participation in moderate to vigorous physical activities on the adolescents’ health. In addition, moderate to vigorous physical activity practice promotes a greater sensation of wellbeing.
Adolescents who reported to participate in one or more physical education classes during a typical week were more likely to be physically active than their peers who did not participate in these classes, corroborating previous fi ndings.4,23 Physical education classes may play an important role in adolescents’ physical activity levels, both in a direct way, based on the offer of
physical activity practice during the classes, and in an indirect way, by stimulating this practice, favoring the access to knowledge and enabling positive experiences of physical activities. A systematic review of interven-tion studies (to increase physical activity levels) in the school environment has shown that the physical educa-tion classes effectively increased adolescents’ levels of physical activity practice.6
Tassitano et al22 have found that the adolescents who participated in physical education classes had higher odds of being physically active, presenting higher frequency of fruit consumption and lower frequency of consumption of soft drinks, and also higher odds of spending less time in sedentary behaviors.
One of the strong points of the present study was that it considered the sample selection procedure in the data analysis (cluster sampling procedure), which increased the accuracy of the estimates. Another positive point was the inclusion of students from the public and private networks, as the majority of the studies with Brazilian adolescents involved only students from state-run public schools and limited age groups.
This study has some limitations. As it is a school-based study, it is not possible to generalize the results to all the adolescents of João Pessoa, state of Paraíba. Some adolescents had age-school grade discrepancy, and others were outside the school system. Although the majority of the adolescents (50.2%) practice physical activity in accordance with the current recommenda-tions, the other youths were classifi ed as physically inactive, particularly those of the female sex and those adolescents who belonged to families of lower socioeconomic level (lower level of schooling). This shows that participation in physical activities presents gender and socioeconomic inequality, differences that should be considered in the development of programs of intervention in the practice of physical activity in this population group.
It is necessary to develop actions that are able to increase the adolescents’ participation in moderate and vigorous physical activities, especially female youths and adolescents who are less socioeconomically favored. In this sense, the school emerges as an impor-tant means of promotion of physical activity, mainly through the physical education classes.
c Ministério da Saúde (BR). VIGITEL Brasil 2010. Vigilância de fatores de risco e proteção para doenças crônicas por inquérito telefônico: estimativas sobre frequência e distribuição sociodemográfi ca de fatores de risco e proteção para doenças crônicas nas capitais dos 26 estados brasileiros e no Distrito Federal em 2010. Brasília (DF); 2011.
10 Physical activity among adolescents Farias Jr JC et al
1. Aarnio M, Winter T, Kujala U, Kaprio J. Associations of health related behaviour, social relationships, and health status with persistent physical activity and inactivity: a study of Finnish adolescent twins. Br J Sports Med. 2002;36(5):360-4. DOI:10.1136/bjsm.36.5.360
2. Bastos JP, Araújo CLP, Hallal PC. Prevalence of insuffi cient physical activity and associated factors in Brazilian adolescents. J Phys Act Health. 2008;5(6):777-94.
3. Blair SN. Physical inactivity: the biggest public health problem of the 21st century. Br J Sports Med. 2009;43(1):1-2.
4. Ceschini FL, Andrade DR, Oliveira LC, Araújo Júnior JF, Matsudo VK. Prevalência de inatividade física e fatores associados em estudantes do ensino médio de escolas públicas estaduais. J Pediatr (Rio J). 2009;85(4):301-6. DOI:10.1590/S0021-75572009000400006
5. Cole TJ, Bellizzi MC, Flegal KM, Dietz WH. Establishing a standard defi nition for child overweight and obesity worldwide: international survey. BMJ. 2000;320(7244):1240-3. DOI:10.1136/bmj.320.7244.1240
6. Dobbins M, De Corby K, Robeson P, Husson H, Tirilis D. School-based physical activity programs for promoting physical activity and fi tness in children and adolescents aged 6-18. Cochrane Database Systematic Rev. 2009;(1):CD007651. DOI:10.1002/14651858.CD007651
7. Eaton DK, Kann L, Kinchen S, Shanklin S, Ross J, Hawkins J, et al. Youth risk behavior surveillance — United States, 2007. MMWR Surveill Summ. 2008;57(4):1-131.
8. Farias Júnior JC, Nahas MV, Barros MVG, Loch MR, Oliveira ESA, De Bem MFL, et al. Comportamentos de risco à saúde em adolescentes no Sul do Brasil: prevalência e fatores associados. Rev Panam Salud Publica. 2009;25(4):344-52. DOI:10.1590/S1020-49892009000400009
9. Gonçalves H, Hallal PC, Amorim TC, Araújo CLP, Menezes, AMB. Fatores socioculturais e nível de atividade física no início da adolescência. Rev Panam Salud Publica. 2007;22(4):246-53. DOI:10.1590/S1020-49892007000900004
10. Hallal PC, Bertoldi AD, Gonçalves H, Victora CG. Prevalência de sedentarismo e fatores associados em adolescentes de 10-12 anos de idade. Cad Saude Publica. 2006;22(6):1277-87. DOI:10.1590/S0102-311X2006000600017
11. Hallal P, Victora CG, Azevedo MR, Wells JC. Adolescent physical activity and health: a systematic review. Sports Med. 2006;36(12):1019-30.
12. Li M, Dibley MJ, Sibbritt DW, Zhou X, Yan H. Physical activity and sedentary behavior in adolescents in Xi´an City, China. J Adolesc Health. 2007;41(1):99-101. DOI:10.1016/j.jadohealth.2007.02.005
13. Marshall SJ, Biddle SJH, Gorely T, Cameron N, Murdey I. Relationships beteween media use, body fatness and physical activity in children and youth: a meta-analysis. Int J Obes Relat Metab Disord. 2004;28(10):1238-46. DOI:10.1038/sj.ijo.0802706]
14. Moraes ACF, Fernandes CAM, Elias RGM, Nakashima ATA, Reichert FF, Falcão MC. Prevalência de inatividade física e fatores associados em adolescentes. Rev Assoc Med Bras. 2009;55(5):523-8. DOI:10.1590/S0104-42302009000500013
15. Reis RS, Hino AAF, Florindo AA, Rodriguez-Añez CR, Domingues MR. Association between physical activity in parks and perceived environment: a study with adolescents. J Phys Act Health. 2009;6(4):503-9.
16. Roman B, Majem-Serra L, Ribas-Barba L, Pérez-Rodrigo C, Aranceta J. How many children and adolescents in Spain comply with the recommendations on physical activity? J Sports Med Phys Fitness. 2008;48(3):380-7.
17. Sallis JF, Zakarian JM, Hovell MF, Hofstetter CR. Ethnic, socioeconomic, and sex differences in physical activity among adolescents. J Clin Epidemiol. 1996;49(2):125-34.
18. Scully M, Dixon H, White V, Beckmann K. Dietary, physical activity and sedentary behaviour among Australian secondary students in 2005. Health Promot Int. 2007;22(3):236-45. DOI:10.1093/heapro/dam021
19. Seabra AF, Mendonça DM, Thomis MA, Anjos LA, Maia JA. Determinantes biológicos e sócio-culturais associados à prática de atividade física de adolescentes. Cad Saude Publica. 2008;24(4):721-36. DOI:10.1590/S0102-311X2008000400002
20. Strong WB, Malina RM, Blimkie CJ, Daniels SR, Dishman RK, Gutin B, et al. Evidence based physical activity for school-age youth. J Pediatr. 2005;146(6):732-7. DOI:10.1016/j.jpeds.2005.01.055
21. Tammelin T, Ekelund U, Remes J, Näyhä S. Physical activity and sedentary behaviors among Finish youth. Med Sci Sports Exerc. 2007;39(7):1067-74. DOI:10.1249/mss.0b13e318058a60
22. Tassitano RM, Barros MVG, Tenório MCM, Bezerra J, Florindo AA, Reis RS. Enrollment in physical education is associated with health-related behavior among high school students. J Sch Health. 2010;80(3):126-33. DOI:10.1111/j.1746-1561.2009.00476.x
23. Tenório MCM, Barros MVG, Tassitano RM, Bezerra J, Tenório JM, Hallal PC. Atividade física e comportamento sedentário em adolescentes estudantes do ensino médio. Rev Bras Epidemiol. 2010;13(1):105-17. DOI:10.1590/S1415-790X2010000100010
24. Van Der Horst K, Paw MJCA, Twisk JWR, Van Mechelen W. A brief review on correlates of physical activity and sedentariness in youth. Med Sci Sports Exerc. 2007;39(8):1241-50. DOI:10.1249/mss.0b013e318059bf35
25. World Health Organization. Global recommendations on physical activity for health. Geneva; 2010.
REFERENCES
The authors declare no confl icts of interests.