Incorporating Animation in Stepwise Development of Formal Specification
Upload
eduardo-mondlaneCategory
view
0download
0
dt
Physical Activity in 22 African CountriesResults from the World Health Organization
STEPwise Approach to Chronic DiseaseRisk Factor Surveillance
Regina Guthold, MPH, Sidi A. Louazani, MD, MPH, Leanne M. Riley, MSc,Melanie J. Cowan, MPH, Pascal Bovet, MD, MPH, Albertino Damasceno, MD, PhD,
Boureima Hama Sambo, MD, MPH, Fikru Tesfaye, PhD, MD, MPH,Timothy P. Armstrong, PhD
Background: Baseline physical activity data are needed to effectively plan programs and policies toprevent noncommunicable diseases, but for many African countries these data are lacking.
Purpose: To describe and compare levels and patterns of physical activity among adults across 22African countries.
Methods: Data from57,038 individuals from22countries (11national and11subnational samples) thatparticipated in the STEPwise approach to chronic disease risk factor surveillance (2003–2009) wereanalyzed in 2010. The validated Global Physical Activity Questionnaire (GPAQ) was used to assess daysand duration of physical activity at work, for transport, and during leisure time in a typical week.
Results: Overall, 83.8% ofmen and 75.7% of womenmetWHOphysical activity recommendations(at least 150 minutes of moderate activity per week or equivalent). Country prevalence ranged from46.8% (Mali) to 96.0% (Mozambique). Physical activity, both at work and for transport, includingwalking, had large contributions to overall physical activity, while physical activity during leisuretime was rare in the analyzed countries.
Conclusions: Physical activity levels varied greatly across African countries and population sub-groups. Leisure time activity was consistently low. These data will be useful to inform policymakersand to guide interventions to promote physical activity.(Am J Prev Med 2011;41(1):52–60) © 2011 American Journal of Preventive Medicine
o
Introduction
The benefıts of being physically active include alower risk of cardiovascular disease, stroke, diabe-tes, hypertension, colon and breast cancer, and
epression.Additionally, physical activity is fundamentalo energy balance and weight control.1,2
From the Department of Chronic Diseases and Health Promotion, WHO(Guthold, Riley, Cowan, Armstrong), Geneva; the Ministry of Health, Re-public of Seychelles, and Institute of Social and Preventive Medicine, Uni-versity of Lausanne (Bovet), Lausanne, Switzerland; NoncommunicableDisease Prevention and Control, WHO Regional Offıce for Africa(Louazani, Sambo), Brazzaville, Congo; the Faculty of Medicine, EduardoMondlaneUniversity (Damasceno),Maputo,Mozambique; and the Schoolof Public Health, Addis AbabaUniversity (Tesfaye), Addis Ababa, Ethiopia
Address correspondence to: Regina Guthold,MPH,WHO,Departmentof Chronic Diseases and Health Promotion 20, Avenue Appia, 1211 Ge-neva, Switzerland. E-mail: [email protected].
p0749-3797/$17.00doi: 10.1016/j.amepre.2011.03.008
52 Am J Prev Med 2011;41(1):52–60 © 2011 Amer
The need for physical activity data to effectively planpolicies and programs to prevent chronic conditions andnoncommunicable diseases (NCDs) has been recognized,and the WHO 2008–2013 Action Plan for the GlobalStrategy for the Prevention and Control of NCDs urgescountries to strengthen surveillance systems and stan-dardized data collection on risk factors, including physi-cal inactivity, using existing WHO tools.3
For many African countries, baseline physical activity datahave been lacking. TheWHO STEPwise approach to chronicdisease risk factor surveillance (STEPS)was initiated in2000 toassist low- and middle-income countries to collect these dataalongwith informationonother risk factors.4,5
For the assessment of physical activity within STEPS,the Global Physical Activity Questionnaire (GPAQ) isused.6 Physical activity is performed in different domainsf life such as work, transport, and leisure time, and the
atterns vary across different settings and cultures. Notican Journal of Preventive Medicine • Published by Elsevier Inc.
vre
wi
stt
di
ar
Tavwic
Guthold et al / Am J Prev Med 2011;41(1):52–60 53
only leisure-time physical activity but also physical activ-ity performed in other domains provide health benefıts.7
The GPAQ therefore captures physical activity at workand in the household, for transport, and during leisuretime. The contributions of each of the domains to overallphysical activity can then be calculated and, additionally,overall physical activity levels can be computed. TheGPAQ has been tested for reliability and validity in tencountries. Reliability coeffıcients were of moderate tosubstantial strength, and criterion validity was poor tofair.8,9 The objective of this paper is to describe and com-pare physical activity levels among adults across 22 coun-tries from the WHO African Region, and to examinepatterns of physical activity in these countries.
MethodsStudy Population and Design
The analysis included 57,038 subjects aged 25–64 years from 22 Afri-can countries that conducted a cross-sectionalNCDrisk factor surveybased on the STEPS approach between 2003 and 2009. All WHOMember States are eligible to participate in STEPS; however, partici-pation is a country decision based on the perceived need of an NCDrisk factor survey, available resources, and capacity to implement thesurvey. STEPS focuses on obtaining data on eight behavioral andbiological risk factors that contribute to the major NCD burden. In-formation is collected through questionnaire (Step 1); physical exam-ination (Step 2); and biochemical measurements (Step 3).4,5
Respondents were selected randomly using multistage clustersampling with the exception of Seychelles, which drew a stratifıedrandom sample. For eleven of the 22 countries, samples werenationally representative, whereas the other samples weresubnational.Ethical approval for the surveywas obtainedwithin each country
from the corresponding country ethics committee. From each par-ticipant, informed consent was obtained. Further information onstudy population and design is available within each of the respec-tive country reports on the STEPS home page.5
Assessment of Physical Activity
Physical activity was assessed using the GPAQ.6,10 For each ofigorous and moderate work/household activities, transport-elated activities (including walking), as well as vigorous andmod-rate activities during leisure time, respondents were asked
● if they engaged in this type of activity for at least 10 continuousminutes (yes/no);
● if yes● on how many days in a typical week, and● how much time they spent in this activity on a typical day.Face-to-face interviews were conducted by local interviewersho were trained in 3-day workshops, according to the guidelinesn the STEPS Manual.11
An introductory text to the questions was read out to the partic-ipants and explained which activities to consider for each of thedifferent domains, and what was meant by vigorous- andmoderate-intensity activities.10 Country-specifıc examples for
each of the different types of activity were read out and shown onJuly 2011
how-cards to the respondents. Questionnaires were, if necessary,ranslated into the local languages and back-translated, and pilot-ested for comprehension.
Data Processing
To allow comparability across countries, the age range was re-stricted to 25–64 years for those countries that sampled awider agerange (Cameroon, Côte d’Ivoire, DRC, Eritrea, Gabon,Mali, Mau-ritania, Niger, Zambia).Before data cleaning, the sample included n�69,778 observa-
tions. Of those, 1057were dropped because ofmissing informationon gender, age, or both, and 11,683 observations were droppedbecause of inconsistent, invalid, or incomplete information onphysical activity, leaving n�57,038 valid records. Reporting a cer-tain number of days, but 0 hours and minutes for a specifıc type ofactivity, is an example for inconsistent information. Time valueshigher than 16 hours of activity during 1 day were regarded asinvalid. For all data cleaning and analysis procedures, the instruc-tions of the GPAQ Analysis Guide were followed.10
Data were weighted to adjust for the probability of selection forBotswana, Cape Verde, Malawi, and Sierra Leone. For these coun-tries as well as Swaziland, the cluster sampling design was takeninto account during analysis, while for the other countries, thisinformation was not available.Data were analyzed in 2010 using Stata SE, version 9.2. All
country results were adjusted for gender using global UN popula-tion estimates for 200512 and age using the WHO StandardPopulation.13
Definition of Physical Activity
According to the newWHOglobal standard,1meeting recommen-ations on physical activity for health (herein referred to as “meet-ng WHO recommendations”) was defıned as engaging in at least
● 150 minutes of moderate-intensity activity per week; or● 75 minutes of vigorous-intensity activity per week; or● an equivalent combination of moderate- and vigorous-intensityactivity.Additionally, for comparison purposes, results are presented
ccording to the cut-offs in the GPAQ Analysis Guide (hereineferred to as “GPAQ active”), defıned as doing at least10:
● 30 minutes of moderate-intensity activity or walking per day onat least 5 days in a typical week; or
● 20 minutes of vigorous-intensity activity per day on at least 3days in a typical week; or
● 5 days of any combination of walking and moderate- or vigor-ous-intensity activities achieving a minimum of at least 600MET-minutes per week.One MET is defıned as the energy spent when sitting quietly.aking the different intensities of the activity components intoccount, reported weekly minutes were multiplied by 8 METs forigorous activities, and by 4 METs for moderate activities andalking. Average weekly physical activity energy expenditure perndividual was obtained by adding the MET-minutes of all activityomponents.10,14
To determine the contribution of each of vigorous/moderatework activity, transport, and vigorous/moderate leisure-time activ-ity to overall activity, theMET-minutes per week per individual foreach of these types of activity were calculated fırst. The percentage
of each of those activity types of the overall weekly MET-minutes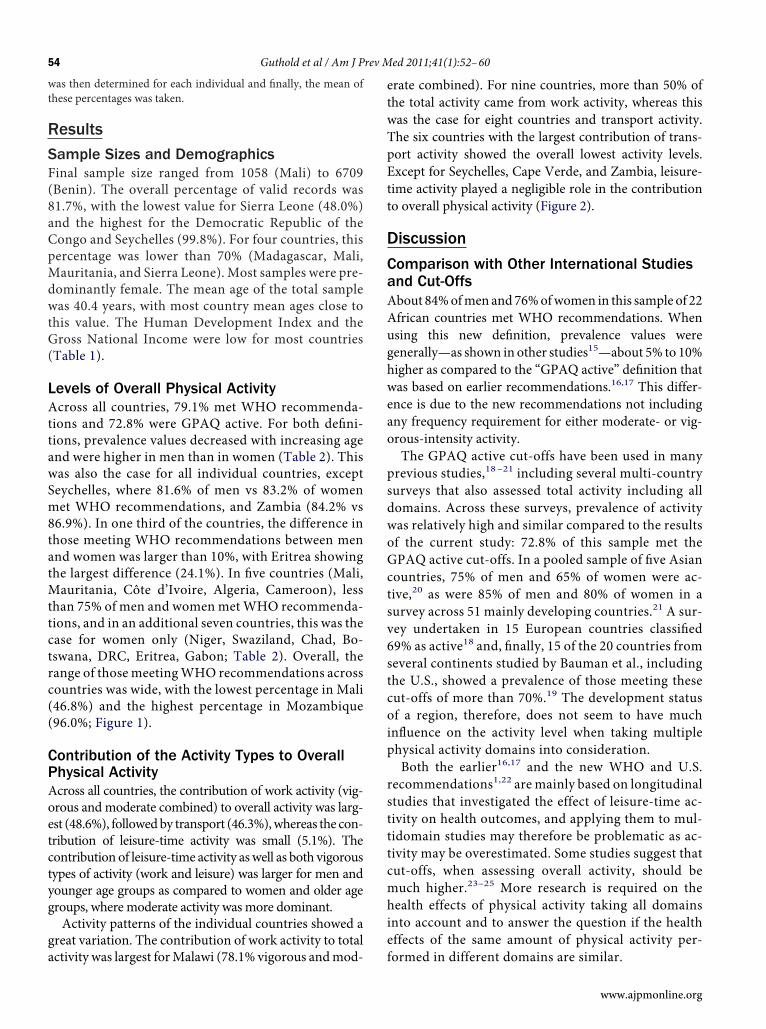
sv6
oip
stttcm
54 Guthold et al / Am J Prev Med 2011;41(1):52–60
was then determined for each individual and fınally, the mean ofthese percentages was taken.
ResultsSample Sizes and DemographicsFinal sample size ranged from 1058 (Mali) to 6709(Benin). The overall percentage of valid records was81.7%, with the lowest value for Sierra Leone (48.0%)and the highest for the Democratic Republic of theCongo and Seychelles (99.8%). For four countries, thispercentage was lower than 70% (Madagascar, Mali,Mauritania, and Sierra Leone). Most samples were pre-dominantly female. The mean age of the total samplewas 40.4 years, with most country mean ages close tothis value. The Human Development Index and theGross National Income were low for most countries(Table 1).
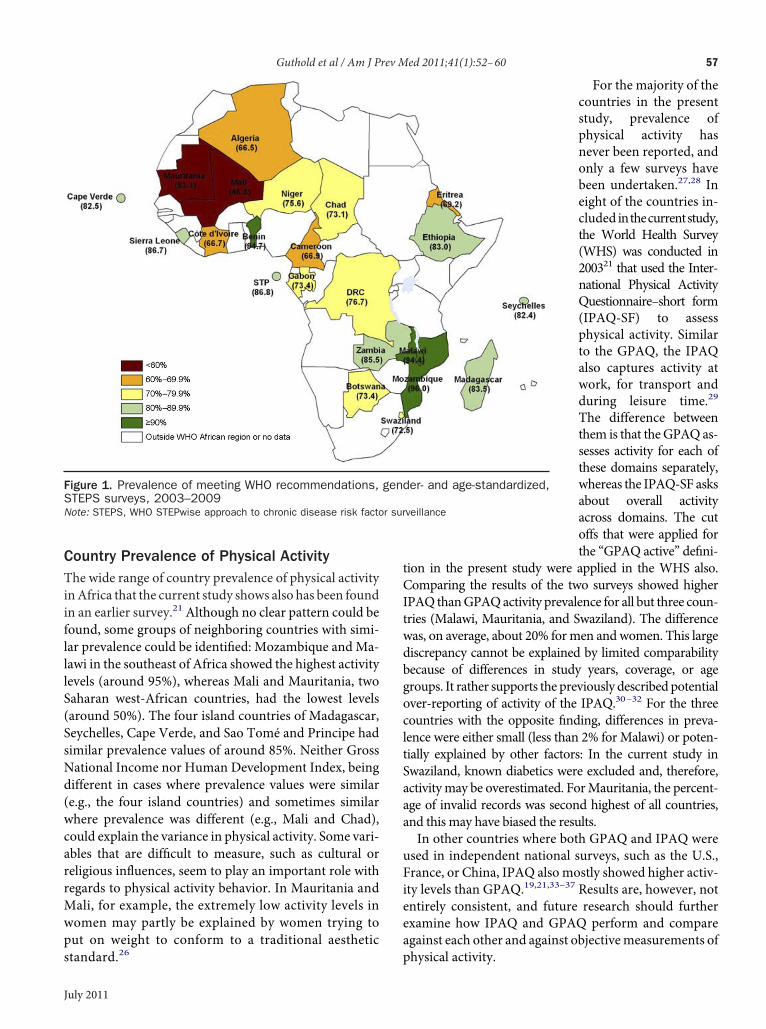
Levels of Overall Physical ActivityAcross all countries, 79.1% met WHO recommenda-tions and 72.8% were GPAQ active. For both defıni-tions, prevalence values decreased with increasing ageand were higher in men than in women (Table 2). Thiswas also the case for all individual countries, exceptSeychelles, where 81.6% of men vs 83.2% of womenmet WHO recommendations, and Zambia (84.2% vs86.9%). In one third of the countries, the difference inthose meeting WHO recommendations between menand women was larger than 10%, with Eritrea showingthe largest difference (24.1%). In fıve countries (Mali,Mauritania, Côte d’Ivoire, Algeria, Cameroon), lessthan 75% of men and women metWHO recommenda-tions, and in an additional seven countries, this was thecase for women only (Niger, Swaziland, Chad, Bo-tswana, DRC, Eritrea, Gabon; Table 2). Overall, therange of those meetingWHO recommendations acrosscountries was wide, with the lowest percentage in Mali(46.8%) and the highest percentage in Mozambique(96.0%; Figure 1).
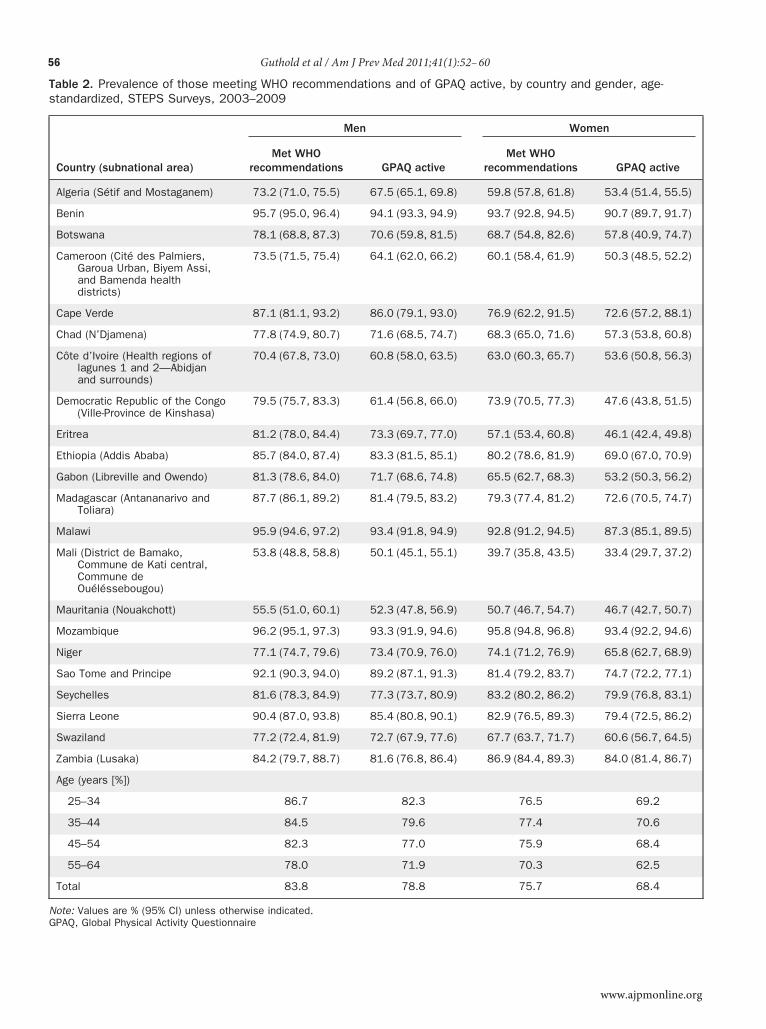
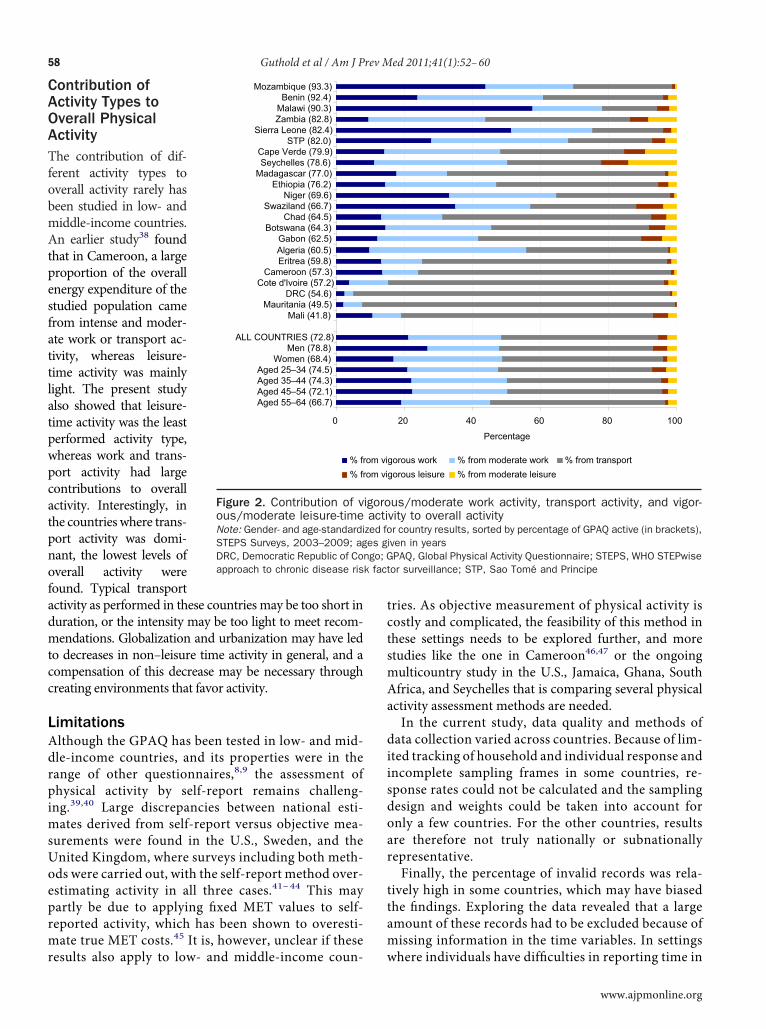
Contribution of the Activity Types to OverallPhysical ActivityAcross all countries, the contribution of work activity (vig-orous andmoderate combined) to overall activity was larg-est (48.6%), followedby transport (46.3%),whereas the con-tribution of leisure-time activity was small (5.1%). Thecontribution of leisure-time activity aswell as both vigoroustypes of activity (work and leisure) was larger for men andyounger age groups as compared to women and older agegroups, where moderate activity was more dominant.Activity patterns of the individual countries showed a
great variation. The contribution of work activity to total
activity was largest forMalawi (78.1% vigorous andmod-erate combined). For nine countries, more than 50% ofthe total activity came from work activity, whereas thiswas the case for eight countries and transport activity.The six countries with the largest contribution of trans-port activity showed the overall lowest activity levels.Except for Seychelles, Cape Verde, and Zambia, leisure-time activity played a negligible role in the contributionto overall physical activity (Figure 2).
Discussion
Comparison with Other International Studiesand Cut-OffsAbout 84%ofmen and 76%ofwomen in this sample of 22African countries met WHO recommendations. Whenusing this new defınition, prevalence values weregenerally—as shown in other studies15—about 5% to 10%higher as compared to the “GPAQ active” defınition thatwas based on earlier recommendations.16,17 This differ-ence is due to the new recommendations not includingany frequency requirement for either moderate- or vig-orous-intensity activity.The GPAQ active cut-offs have been used in many
previous studies,18–21 including several multi-countrysurveys that also assessed total activity including alldomains. Across these surveys, prevalence of activitywas relatively high and similar compared to the resultsof the current study: 72.8% of this sample met theGPAQ active cut-offs. In a pooled sample of fıve Asiancountries, 75% of men and 65% of women were ac-tive,20 as were 85% of men and 80% of women in aurvey across 51 mainly developing countries.21 A sur-ey undertaken in 15 European countries classifıed9% as active18 and, fınally, 15 of the 20 countries fromseveral continents studied by Bauman et al., includingthe U.S., showed a prevalence of those meeting thesecut-offs of more than 70%.19 The development statusf a region, therefore, does not seem to have muchnfluence on the activity level when taking multiplehysical activity domains into consideration.Both the earlier16,17 and the new WHO and U.S.
recommendations1,22 are mainly based on longitudinaltudies that investigated the effect of leisure-time ac-ivity on health outcomes, and applying them to mul-idomain studies may therefore be problematic as ac-ivity may be overestimated. Some studies suggest thatut-offs, when assessing overall activity, should beuch higher.23–25 More research is required on the
health effects of physical activity taking all domainsinto account and to answer the question if the healtheffects of the same amount of physical activity per-
formed in different domains are similar.www.ajpmonline.org
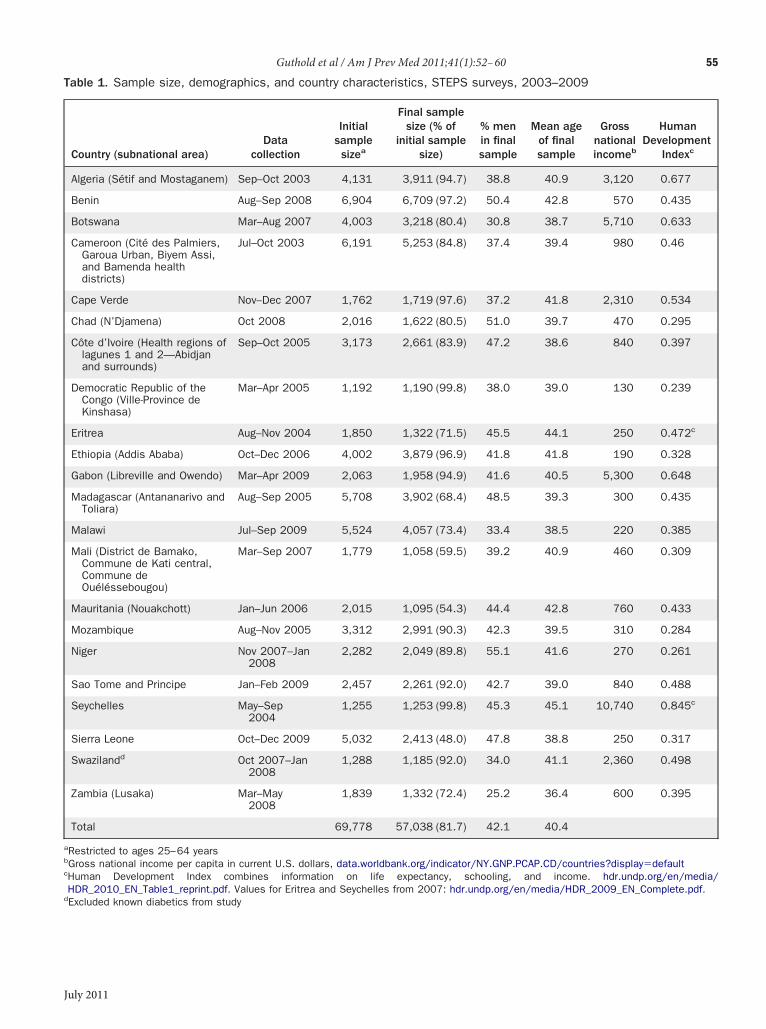
Table 1. Sample size, demographics, and country characteristics, STEPS surveys, 2003–2009
Country (subnational area)Data
collection
Initialsamplesizea
Final samplesize (% of
initial samplesize)
% menin finalsample
Mean ageof finalsample
Grossnationalincomeb
HumanDevelopment
Indexc
Algeria (Sétif and Mostaganem) Sep–Oct 2003 4,131 3,911 (94.7) 38.8 40.9 3,120 0.677
Benin Aug–Sep 2008 6,904 6,709 (97.2) 50.4 42.8 570 0.435
Botswana Mar–Aug 2007 4,003 3,218 (80.4) 30.8 38.7 5,710 0.633
Cameroon (Cité des Palmiers,Garoua Urban, Biyem Assi,and Bamenda healthdistricts)
Jul–Oct 2003 6,191 5,253 (84.8) 37.4 39.4 980 0.46
Cape Verde Nov–Dec 2007 1,762 1,719 (97.6) 37.2 41.8 2,310 0.534
Chad (N’Djamena) Oct 2008 2,016 1,622 (80.5) 51.0 39.7 470 0.295
Côte d’Ivoire (Health regions oflagunes 1 and 2—Abidjanand surrounds)
Sep–Oct 2005 3,173 2,661 (83.9) 47.2 38.6 840 0.397
Democratic Republic of theCongo (Ville-Province deKinshasa)
Mar–Apr 2005 1,192 1,190 (99.8) 38.0 39.0 130 0.239
Eritrea Aug–Nov 2004 1,850 1,322 (71.5) 45.5 44.1 250 0.472c
Ethiopia (Addis Ababa) Oct–Dec 2006 4,002 3,879 (96.9) 41.8 41.8 190 0.328
Gabon (Libreville and Owendo) Mar–Apr 2009 2,063 1,958 (94.9) 41.6 40.5 5,300 0.648
Madagascar (Antananarivo andToliara)
Aug–Sep 2005 5,708 3,902 (68.4) 48.5 39.3 300 0.435
Malawi Jul–Sep 2009 5,524 4,057 (73.4) 33.4 38.5 220 0.385
Mali (District de Bamako,Commune de Kati central,Commune deOuéléssebougou)
Mar–Sep 2007 1,779 1,058 (59.5) 39.2 40.9 460 0.309
Mauritania (Nouakchott) Jan–Jun 2006 2,015 1,095 (54.3) 44.4 42.8 760 0.433
Mozambique Aug–Nov 2005 3,312 2,991 (90.3) 42.3 39.5 310 0.284
Niger Nov 2007–Jan2008
2,282 2,049 (89.8) 55.1 41.6 270 0.261
Sao Tome and Principe Jan–Feb 2009 2,457 2,261 (92.0) 42.7 39.0 840 0.488
Seychelles May–Sep2004
1,255 1,253 (99.8) 45.3 45.1 10,740 0.845c
Sierra Leone Oct–Dec 2009 5,032 2,413 (48.0) 47.8 38.8 250 0.317
Swazilandd Oct 2007–Jan2008
1,288 1,185 (92.0) 34.0 41.1 2,360 0.498
Zambia (Lusaka) Mar–May2008
1,839 1,332 (72.4) 25.2 36.4 600 0.395
Total 69,778 57,038 (81.7) 42.1 40.4
aRestricted to ages 25–64 yearsbGross national income per capita in current U.S. dollars, data.worldbank.org/indicator/NY.GNP.PCAP.CD/countries?display�defaultcHuman Development Index combines information on life expectancy, schooling, and income. hdr.undp.org/en/media/HDR_2010_EN_Table1_reprint.pdf. Values for Eritrea and Seychelles from 2007: hdr.undp.org/en/media/HDR_2009_EN_Complete.pdf.
Guthold et al / Am J Prev Med 2011;41(1):52–60 55
dExcluded known diabetics from study
July 2011
Ts
NG
56 Guthold et al / Am J Prev Med 2011;41(1):52–60
able 2. Prevalence of those meeting WHO recommendations and of GPAQ active, by country and gender, age-tandardized, STEPS Surveys, 2003–2009
Country (subnational area)
Men Women
Met WHOrecommendations GPAQ active
Met WHOrecommendations GPAQ active
Algeria (Sétif and Mostaganem) 73.2 (71.0, 75.5) 67.5 (65.1, 69.8) 59.8 (57.8, 61.8) 53.4 (51.4, 55.5)
Benin 95.7 (95.0, 96.4) 94.1 (93.3, 94.9) 93.7 (92.8, 94.5) 90.7 (89.7, 91.7)
Botswana 78.1 (68.8, 87.3) 70.6 (59.8, 81.5) 68.7 (54.8, 82.6) 57.8 (40.9, 74.7)
Cameroon (Cité des Palmiers,Garoua Urban, Biyem Assi,and Bamenda healthdistricts)
73.5 (71.5, 75.4) 64.1 (62.0, 66.2) 60.1 (58.4, 61.9) 50.3 (48.5, 52.2)
Cape Verde 87.1 (81.1, 93.2) 86.0 (79.1, 93.0) 76.9 (62.2, 91.5) 72.6 (57.2, 88.1)
Chad (N’Djamena) 77.8 (74.9, 80.7) 71.6 (68.5, 74.7) 68.3 (65.0, 71.6) 57.3 (53.8, 60.8)
Côte d’Ivoire (Health regions oflagunes 1 and 2—Abidjanand surrounds)
70.4 (67.8, 73.0) 60.8 (58.0, 63.5) 63.0 (60.3, 65.7) 53.6 (50.8, 56.3)
Democratic Republic of the Congo(Ville-Province de Kinshasa)
79.5 (75.7, 83.3) 61.4 (56.8, 66.0) 73.9 (70.5, 77.3) 47.6 (43.8, 51.5)
Eritrea 81.2 (78.0, 84.4) 73.3 (69.7, 77.0) 57.1 (53.4, 60.8) 46.1 (42.4, 49.8)
Ethiopia (Addis Ababa) 85.7 (84.0, 87.4) 83.3 (81.5, 85.1) 80.2 (78.6, 81.9) 69.0 (67.0, 70.9)
Gabon (Libreville and Owendo) 81.3 (78.6, 84.0) 71.7 (68.6, 74.8) 65.5 (62.7, 68.3) 53.2 (50.3, 56.2)
Madagascar (Antananarivo andToliara)
87.7 (86.1, 89.2) 81.4 (79.5, 83.2) 79.3 (77.4, 81.2) 72.6 (70.5, 74.7)
Malawi 95.9 (94.6, 97.2) 93.4 (91.8, 94.9) 92.8 (91.2, 94.5) 87.3 (85.1, 89.5)
Mali (District de Bamako,Commune de Kati central,Commune deOuéléssebougou)
53.8 (48.8, 58.8) 50.1 (45.1, 55.1) 39.7 (35.8, 43.5) 33.4 (29.7, 37.2)
Mauritania (Nouakchott) 55.5 (51.0, 60.1) 52.3 (47.8, 56.9) 50.7 (46.7, 54.7) 46.7 (42.7, 50.7)
Mozambique 96.2 (95.1, 97.3) 93.3 (91.9, 94.6) 95.8 (94.8, 96.8) 93.4 (92.2, 94.6)
Niger 77.1 (74.7, 79.6) 73.4 (70.9, 76.0) 74.1 (71.2, 76.9) 65.8 (62.7, 68.9)
Sao Tome and Principe 92.1 (90.3, 94.0) 89.2 (87.1, 91.3) 81.4 (79.2, 83.7) 74.7 (72.2, 77.1)
Seychelles 81.6 (78.3, 84.9) 77.3 (73.7, 80.9) 83.2 (80.2, 86.2) 79.9 (76.8, 83.1)
Sierra Leone 90.4 (87.0, 93.8) 85.4 (80.8, 90.1) 82.9 (76.5, 89.3) 79.4 (72.5, 86.2)
Swaziland 77.2 (72.4, 81.9) 72.7 (67.9, 77.6) 67.7 (63.7, 71.7) 60.6 (56.7, 64.5)
Zambia (Lusaka) 84.2 (79.7, 88.7) 81.6 (76.8, 86.4) 86.9 (84.4, 89.3) 84.0 (81.4, 86.7)
Age (years [%])
25–34 86.7 82.3 76.5 69.2
35–44 84.5 79.6 77.4 70.6
45–54 82.3 77.0 75.9 68.4
55–64 78.0 71.9 70.3 62.5
Total 83.8 78.8 75.7 68.4
ote: Values are % (95% CI) unless otherwise indicated.
PAQ, Global Physical Activity Questionnairewww.ajpmonline.org
cltSaaa
uFi
r sur
Guthold et al / Am J Prev Med 2011;41(1):52–60 57
Country Prevalence of Physical ActivityThe wide range of country prevalence of physical activityinAfrica that the current study shows also has been foundin an earlier survey.21 Although no clear pattern could befound, some groups of neighboring countries with simi-lar prevalence could be identifıed: Mozambique andMa-lawi in the southeast of Africa showed the highest activitylevels (around 95%), whereas Mali and Mauritania, twoSaharan west-African countries, had the lowest levels(around 50%). The four island countries of Madagascar,Seychelles, Cape Verde, and Sao Tomé and Principe hadsimilar prevalence values of around 85%. Neither GrossNational Income nor Human Development Index, beingdifferent in cases where prevalence values were similar(e.g., the four island countries) and sometimes similarwhere prevalence was different (e.g., Mali and Chad),could explain the variance in physical activity. Some vari-ables that are diffıcult to measure, such as cultural orreligious influences, seem to play an important role withregards to physical activity behavior. In Mauritania andMali, for example, the extremely low activity levels inwomen may partly be explained by women trying toput on weight to conform to a traditional aesthetic
Figure 1. Prevalence of meeting WHO recommendations,STEPS surveys, 2003–2009Note: STEPS, WHO STEPwise approach to chronic disease risk facto
standard.26
July 2011
For the majority of thecountries in the presentstudy, prevalence ofphysical activity hasnever been reported, andonly a few surveys havebeen undertaken.27,28 Ineight of the countries in-cluded inthecurrentstudy,the World Health Survey(WHS) was conducted in200321 that used the Inter-national Physical ActivityQuestionnaire–short form(IPAQ-SF) to assessphysical activity. Similarto the GPAQ, the IPAQalso captures activity atwork, for transport andduring leisure time.29
The difference betweenthem is that theGPAQas-sesses activity for each ofthese domains separately,whereas the IPAQ-SF asksabout overall activityacross domains. The cutoffs that were applied forthe “GPAQ active” defıni-
tion in the present study were applied in the WHS also.Comparing the results of the two surveys showed higherIPAQ thanGPAQactivity prevalence for all but three coun-tries (Malawi, Mauritania, and Swaziland). The differencewas, on average, about 20% formen andwomen. This largediscrepancy cannot be explained by limited comparabilitybecause of differences in study years, coverage, or agegroups. It rather supports the previously describedpotentialover-reporting of activity of the IPAQ.30–32 For the threeountries with the opposite fınding, differences in preva-ence were either small (less than 2% for Malawi) or poten-ially explained by other factors: In the current study inwaziland, known diabetics were excluded and, therefore,ctivitymay be overestimated. ForMauritania, the percent-ge of invalid records was second highest of all countries,nd this may have biased the results.In other countries where both GPAQ and IPAQ weresed in independent national surveys, such as the U.S.,rance, or China, IPAQ also mostly showed higher activ-ty levels than GPAQ.19,21,33–37 Results are, however, notentirely consistent, and future research should furtherexamine how IPAQ and GPAQ perform and compareagainst each other and against objectivemeasurements of
er- and age-standardized,
veillance
gend
physical activity.
tpesfattlatpwpcatpnofadmtcc
msUoeprmr
mAa
diisdoar
ttam
k fact
58 Guthold et al / Am J Prev Med 2011;41(1):52–60
Contribution ofActivity Types toOverall PhysicalActivityThe contribution of dif-ferent activity types tooverall activity rarely hasbeen studied in low- andmiddle-income countries.An earlier study38 foundhat in Cameroon, a largeroportion of the overallnergy expenditure of thetudied population camerom intense and moder-te work or transport ac-ivity, whereas leisure-ime activity was mainlyight. The present studylso showed that leisure-ime activity was the leasterformed activity type,hereas work and trans-ort activity had largeontributions to overallctivity. Interestingly, inhe countries where trans-ort activity was domi-ant, the lowest levels ofverall activity wereound. Typical transportctivity as performed in these countries may be too short inuration, or the intensity may be too light to meet recom-endations. Globalization and urbanization may have led
o decreases in non–leisure time activity in general, and aompensation of this decrease may be necessary throughreating environments that favor activity.
LimitationsAlthough the GPAQ has been tested in low- and mid-dle-income countries, and its properties were in therange of other questionnaires,8,9 the assessment ofphysical activity by self-report remains challeng-ing.39,40 Large discrepancies between national esti-ates derived from self-report versus objective mea-urements were found in the U.S., Sweden, and thenited Kingdom, where surveys including both meth-ds were carried out, with the self-report method over-stimating activity in all three cases.41–44 This mayartly be due to applying fıxed MET values to self-eported activity, which has been shown to overesti-ate true MET costs.45 It is, however, unclear if these
0
Aged 55–64 (66.7)Aged 45–54 (72.1)Aged 35–44 (74.3)Aged 25–34 (74.5)
Women (68.4)Men (78.8)
ALL COUNTRIES (72.8)
Mali (41.8)Mauritania (49.5)
DRC (54.6)Cote d'Ivoire (57.2)
Cameroon (57.3)Eritrea (59.8)Algeria (60.5)Gabon (62.5)
Botswana (64.3)Chad (64.5)
Swaziland (66.7)Niger (69.6)
Ethiopia (76.2)Madagascar (77.0)Seychelles (78.6)
Cape Verde (79.9)STP (82.0)
Sierra Leone (82.4)Zambia (82.8)Malawi (90.3)Benin (92.4)
Mozambique (93.3)
% fr% fr
Figure 2. Contribution of vous/moderate leisure-timeNote: Gender- and age-standardiSTEPS Surveys, 2003–2009; agDRC, Democratic Republic of Coapproach to chronic disease ris
esults also apply to low- and middle-income coun- w
tries. As objective measurement of physical activity iscostly and complicated, the feasibility of this method inthese settings needs to be explored further, and morestudies like the one in Cameroon46,47 or the ongoingulticountry study in the U.S., Jamaica, Ghana, Southfrica, and Seychelles that is comparing several physicalctivity assessment methods are needed.In the current study, data quality and methods ofata collection varied across countries. Because of lim-ted tracking of household and individual response andncomplete sampling frames in some countries, re-ponse rates could not be calculated and the samplingesign and weights could be taken into account fornly a few countries. For the other countries, resultsre therefore not truly nationally or subnationallyepresentative.Finally, the percentage of invalid records was rela-
ively high in some countries, which may have biasedhe fındings. Exploring the data revealed that a largemount of these records had to be excluded because ofissing information in the time variables. In settings
20 40 60 80 100
Percentage
gorous work % from moderate work % from transportgorous leisure % from moderate leisure
us/moderate work activity, transport activity, and vigor-vity to overall activityr country results, sorted by percentage of GPAQ active (in brackets),
iven in yearsPAQ, Global Physical Activity Questionnaire; STEPS, WHO STEPwiseor surveillance; STP, Sao Tome and Principe
om viom vi
igoroacti
zed foes g
ngo; G
here individuals have diffıculties in reporting time in
www.ajpmonline.org
awmg
djbptfttl
CRDrMP(S
p
Guthold et al / Am J Prev Med 2011;41(1):52–60 59
hours and minutes, strategies should be developed tohelp respondents estimate the time spent in activity.
StrengthsFormany countries included in this survey, this is the fırsttime that physical activity levels have been reported. Ad-ditionally, for almost all of these countries, informationon activity patterns in various domains of life has neverbeen reported. The surveys and data presented here weretherefore an important fırst step toward establishing reg-ular surveillance of physical activity and other risk factorsin African countries. Through training workshops andgathering experiences in survey implementation, capac-ity has been built in the African region that can be used asa baseline for future surveillance.Even though assessing physical activity behavior
through self-report has limitations, these data show inter-nal consistency and expected patterns: as seen in manyother surveys,48 men were more active than women, andctivity decreased with increasing age. Furthermore,hen ranking the countries by physical activity level foren and women separately, the country order for bothenders was very similar.
ConclusionThis study showed a wide range of physical activity levelsand patterns across African countries, with leisure-timeactivity consistently being the least performed activitytype in all settings. Insuffıcient physical activity is a publichealth problem in some countries and population sub-groups in Africa. Unless action is taken in these settings,the low level of physical activity is likely to contribute tothe rise of NCDs in the region.27,49,50 Although the bur-en of infectious diseases remains high, NCDs are pro-ected to become the number one cause of death in Africay 2030.51 They should therefore be addressed by timelyrevention. African health policymakers should priori-ize the development and implementation of programsor the promotion of physical activity and, most impor-antly, policy and environment interventions that effec-ively enable the practice of physical activity by all popu-ation groups in all settings.52–54 Instruments and toolsfrom WHO are available to assist countries with thisimportant task.55,56
We gratefully acknowledge the work of the survey coordina-tors: Dr. Djamila Nadir-Azirou (Algeria); Prof. DismandStéphane Houinato (Benin); Dr. Heluf G. Medhin (Botswana);Prof. AlfredK.Njamnshi (Cameroon); Dr. Irenita Soares (CapeVerde); Mr. Mathias Roger Djidina (Chad); Dr. KouamelanDoua (Côte d’Ivoire); Prof. LongoMbenza (DRC); Dr. Goitom
Mebrahtu Medhani (Eritrea); Dr. Fikru Tesfaye (Ethiopia); Dr.July 2011
omlan Pearl Nsie Obame (Gabon); Dr. Henri Fidele Marieaharivohitra (Madagascar); Dr. Kelias Msyamboza (Malawi);r. Diarra Nazoum (Mali); Prof. Mohamed Lemine Ba (Mau-itania); Dr. Carla MT Da Silva Matos (Mozambique); Dr.oussa Habibou (Niger); Dr. Lazaro Sousa (Sao Tomé andrincipe); Dr. Pascal Bovet (Seychelles); Dr. Mohamed SamaiSierra Leone); Dr. Lindiwe Tsabedze (Swaziland); and Prof.eter Siziya (Zambia).No fınancial disclosures were reported by the authors of thisaper.
References1. WHO. Global recommendations on physical activity for health. Ge-
neva, Switzerland: WHO, 2010.2. Bull FC, Armstrong TP, Dixon T, Ham S, Neiman A, Pratt M. Physical
inactivity. In: Ezzati M, Lopez A, Rodgers A, & Murray C, eds. Com-parative quantifıcation of health risks: global and regional burden ofdisease attributable to selected major risk factors. Volume 1. Geneva,Switzerland: WHO, 2004:729–881.
3. WHO. 2008–2013 Action Plan for the Global Strategy for the Preven-tion andControl of Noncommunicable Diseases. Geneva, Switzerland:WHO, 2008.
4. Armstrong T, Bonita R. Capacity building for an integrated noncom-municable disease risk factor surveillance system in developing coun-tries. Ethn Dis 2003;13(S2):S13–8.
5. WHO. Chronic diseases and health promotion. STEPwise approach tosurveillance. www.who.int/chp/steps.
6. Armstrong T, Bull F. Development of the WHO Global Physical Ac-tivity Questionnaire (GPAQ). J Public Health 2006;14:66–70.
7. Arrieta A, Russell LB. Effects of leisure and non-leisure physical activ-ity on mortality in U.S. adults over two decades. Ann Epidemiol2008;18:889–95.
8. Bull FC, Maslin TS, Armstrong T. Global Physical Activity Question-naire (GPAQ): Nine Country Reliability and Validity Study. J Phys ActHealth 2009;6:790–804.
9. Trinh OT, Nguyen ND, van der Ploeg HP, Dibley MJ, Bauman A.Test–retest repeatability and relative validity of the Global PhysicalActivity Questionnaire in a developing country context. J Phys ActHealth 2009;6(S1):S46–53.
10. WHO.Chronic diseases andhealth promotion.Global physical activitysurveillance. www.who.int/chp/steps/GPAQ/en/index.html.
11. WHO. The STEPS surveillancemanual: theWHOSTEPwise approachto chronic disease risk factor surveillance. Geneva, Switzerland:WHO,2005.
12. UN, Department of Economic and Social Affairs, Population Division.World Population Prospects: The 2008 Revision, CD-Rom Edition.New York: UN, 2009.
13. Ahmad O, Boschi-Pinto C, Lopez AD, Murray CJL, Lozano R, InoueM. Age standardization of rates: a new WHO standard. Geneva, Swit-zerland: WHO, 2001.
14. Ainsworth BE, Haskell WL,Whitt MC, et al. Compendium of PhysicalActivities: an update of activity codes and MET intensities. Med SciSports Exerc 2000;32(9S):S498–504.
15. Carlson SA, Fulton JE, Schoenborn CA, Loustalot F. Trend and prev-alence estimates based on the 2008 Physical Activity Guidelines forAmericans. Am J Prev Med 2010;39(4):305–13.
16. DHHS. Healthy People 2010, 2nd edition.Washington DC: GovernmentPrinting Offıce, 2000.
17. Pate RR, Pratt M, Blair SN, et al. Physical activity and public health. Arecommendation from the CDC and the American College of Sports
Medicine. JAMA 1995;273(5):402–7.
3
3
3
3
60 Guthold et al / Am J Prev Med 2011;41(1):52–60
18. Sjöström M, Oja P, Hagströmer M, Smith BJ, Bauman A. Health-enhancing physical activity across European Union countries: the Eu-robarometer study. J Public Health 2006;14:291–300.
19. BaumanA, Bull F, Chey T, et al. The International Prevalence Study onPhysical Activity: results from 20 countries. Int J Behav Nutr Phys Act2009;6(1):21.
20. NgN,HakimiM,VanMinhH, et al. Prevalence of physical inactivity innine rural INDEPTH Health and Demographic Surveillance Systemsin fıve Asian countries. Glob Health Action 2009;2(S1):S44–53.
21. Guthold R, Ono T, Strong KL, Chatterji S, Morabia A. Worldwidevariability in physical inactivity: a 51-country survey. Am J Prev Med2008;34(6):486–94.
22. Pate RR, Yancey AK, KrausWE. The 2008 Physical Activity Guidelinesfor Americans: implications for clinical and public health practice.Am J Lifestyle Med 2010;4:209.
23. Matthews CE, Jurj AL, Shu X, et al. Influence of exercise, walking,cycling, and overall nonexercise physical activity on mortality in Chi-nese women. Am J Epidemiol 2007;165(12):1343–50.
24. Carlsson S,AnderssonT,WolkA,AhlbomA. Lowphysical activity andmortality in women: baseline lifestyle and health as alternative expla-nations. Scand J Public Health 2006;34:480–7.
25. Manini TM, Everhart JE, Patel KV. Daily activity energy expenditureand mortality among older adults. JAMA 2006;296(2):171–9.
26. STEPS report, Mauritania. www.who.int/chp/steps/STEPS_Report_Mauritania.pdf.
27. Sodjinou R, Agueh V, Fayomi B, Delisle H. Obesity and cardio-metabolic risk factors in urban adults of Benin: relationshipwith socio-economic status, urbanisation, and lifestyle patterns. BMC PublicHealth 2008;8:84.
28. Napoli N, Mottini G, Arigliani M, et al. Unexpectedly high rates ofobesity anddysglycemia among villagers inCameroon.DiabetesMetabRes Rev 2010;26(1):10–2.
29. International Physical Activity Questionnaire. www.ipaq.ki.se/ipaq.htm.
0. Ainsworth BE, Macera CA, Jones DA, et al. Comparison of the 2001BRFSS and the IPAQ physical activity questionnaires. Med Sci SportsExerc 2006;38:1584–92.
1. Ekelund U, Sepp H, Barge S, et al. Criterion-related validity of the last7-day, short form of the International Physical Activity Questionnairein Swedish adults. Public Health Nutr 2006;9:258–65.
2. Rzewnicki R, Vanden Auweele Y, de Bourdeaudhuij I. Addressingoverreporting on the International Physical Activity Questionnaire(IPAQ) telephone surveywith a population sample. PublicHealthNutr2003;6:299–305.
3. National Health and Nutrition Examination Survey. www.cdc.gov/nchs/nhanes/nhanes_products.htm.
34. Escalon H, Bossard C, Beck F, eds. Baromètre santé nutrition 2008.Saint-Denis, France: Institut national de prévention et d’éducationpour la santé 2009. www.inpes.sante.fr/CFESBases/catalogue/pdf/1270.pdf.
35. Agence française de sécurité sanitaire des aliments. Etude IndividuelleNationale des Consommations Alimentaires 2 (INCA 2) 2006–2007.Maisons-Alfort, France: AFSSA, 2009. www.afssa.fr/Documents/PASER-Ra-INCA2.pdf.
36. Unité de surveillance et d’épidemiologie nutritionnelle. Etude nation-ale nutrition santé (ENNS, 2006)—Situation nutritionnelle en Franceen 2006 selon les indicateurs d’objectif et les repères du Programmenational nutrition santé (PNNS). Saint-Maurice, France: Institut deveille sanitaire, 2007. www.invs.sante.fr/publications/2007/nutrition_
enns/RAPP_INST_ENNS_Web.pdf.37. China CDC. Report on chronic disease risk factor surveillance inChina. Beijing, China: People’s Medical Publishing House 2009 [inChinese].
38. Sobngwi E, Mbanya JCN, Unwin NC, et al. Physical activity and itsrelationshipwith obesity, hypertension and diabetes in urban and ruralCameroon. Int J Obes Relat Metab Disord 2002;26(7):1009–16.
39. Sallis JF, Saelens BE. Assessment of physical activity by self-report:status, limitations and future directions. Res Q Exerc Sport2000;71(2S):S1–14.
40. Lagerros YT, Lagiou P. Assessment of physical activity and energyexpenditure in epidemiological research of chronic disease. Eur J Epi-demiol 2007;22:353–62.
41. Troiano RP, Berrigan D, Dodd KW, Mâsse LC, Tilert T, McDowell M.Physical activity in theU.S.measured by accelerometer.Med Sci SportsExerc 2008;40(1):181–8.
42. HagströmerM,Oja P, SjöströmM.Physical activity and inactivity in anadult population assessed by accelerometry. Med Sci Sports Exerc2007;39(9):1502–8.
43. Aresu M, Bécares L, Brage S, et al. Health survey for England 2008.Physical activity and fıtness. Volume 1. In: Craig R,Mindell J, Hirani V,eds. London, UK: The Health and Social Care Information Centre,2009.
44. Slootmaker SM, Schuit AJ, ChinapawMJ, Seidell JC, vanMechelenW.Disagreement in physical activity assessed by accelerometer and self-report in subgroups of age, gender, education and weight status. Int JBehav Nutr Phys Act 2009;6:17.
45. Duncan GE, Sydeman SJ, Perri MG, et al. Can sedentary adults accu-rately recall the intensity of their physical activity? Prev Med2001;33:18–26.
46. Assah FK, Ekelund U, Brage S, Wright A, Mbanya JC, Wareham NJ.Accuracy and validity of a combined heart rate and motion sensor forthe measurement of free-living physical activity energy expenditure inadults in Cameroon. Int J Epidemiol 2011;40(1):112–20.
47. Assah FK, Ekelund U, Brage S, et al. Predicting physical activity energyexpenditure using accelerometry in adults from sub-Sahara Africa.Obesity (Silver Spring) 2009;17(8):1588–95.
48. WHO Global InfoBase. www.who.int/chp/infobase.49. Abubakari AR, LauderW, JonesMC, Kirk A, Agyemang C, Bhopal RS.
Prevalence and time trends in diabetes and physical inactivity amongadult West African populations: the epidemic has arrived. PublicHealth 2009;123(9):602–14.
50. WHO. Preventing chronic diseases: a vital investment. Geneva, Swit-zerland: WHO, 2005.
51. WHO.The global burdenof disease: 2004 update.Geneva, Switzerland:WHO, 2008.
52. De-Graft Aikins A, Unwin N, Agyemang C, Allotey P, Campbell C,Arhinful D. Tackling Africa’s chronic disease burden: from the local tothe global. Global Health 2010;6:5.
53. Kahn EB, Ramsey LT, Brownson RC, et al. The effectiveness of inter-ventions to increase physical activity. A systematic review. Am J PrevMed 2002;22(4S):73–107.
54. Müller-Riemenschneider F, Reinhold T, Nocon M, Willich SN. Long-term effectiveness of interventions promoting physical activity: a sys-tematic review. Prev Med 2008;47:354–68.
55. WHO. Global strategy on diet, physical activity and health. Physicalactivity. www.who.int/dietphysicalactivity/pa/en/index.html.
56. WHO. Chronic diseases and health promotion. www.who.int/
chp/en/index.html.www.ajpmonline.org
Copyright © 2022 FDOKUMEN